UNITED STATES
SECURITIES AND EXCHANGE COMMISSION
Washington, D.C. 20549
FORM N-CSR
CERTIFIED SHAREHOLDER REPORT OF REGISTERED
MANAGEMENT INVESTMENT COMPANIES
Investment Company Act file number 811-08243
Direxion Funds
(Exact name of registrant as specified in charter)
33 Whitehall Street, 10th Floor
New York, NY 10004(Address of principal executive offices) (Zip code)
Daniel D. O’Neill
33 Whitehall Street, 10th floor
New York, NY 10004(Name and address of agent for service)
646-572-3390Registrant’s telephone number, including area code
Date of fiscal year end: August 31, 2010
Date of reporting period: August 31, 2010
Item 1. Report to Stockholders.
ANNUAL REPORT AUGUST 31, 2010
33 Whitehall Street, 10th Floor New York, New York 10004 (800) 851-0511
| | | |
| | | |
| Bull Funds | | Bear Funds |
| |
Domestic Equity Index Funds |
| | | |
| Direxion Monthly Small Cap Bull 2X Fund (DXRLX) | | Direxion Monthly Small Cap Bear 2X Fund (DXRSX) |
| (formerly Small Cap Bull 2.5X Fund) | | (formerly Small Cap Bear 2.5X Fund) |
| |
| Fixed Income Funds |
| | | |
| Direxion Monthly 10 Year Note Bull 2X Fund (DXKLX) | | Direxion Monthly 10 Year Note Bear 2X Fund (DXKSX) |
| (formerly 10 Year Note Bull 2.5X Fund) | | (formerly 10 Year Note Bear 2.5X Fund) |
| Dynamic HY Bond Fund (PDHYX) | | HY Bear Fund (PHBRX) |
| |
| Specialty Funds |
| |
| Direxion Monthly Commodity Bull 2X Fund (DXCLX) |
| (formerly Commodity Bull 2X Fund) |
| |
International Funds |
| | | |
| Direxion Monthly Emerging Markets Bull 2X Fund (DXELX) | | Direxion Monthly Emerging Markets Bear 2X Fund (DXESX) |
| (formerly Emerging Markets Bull 2X Fund) | | (formerly Emerging Markets Bear 2X Fund) |
| Direxion Monthly Developed Markets Bull 2X Fund (DXDLX) | | Direxion Monthly Developed Markets Bear 2X Fund (DXDSX) |
| (formerly Developed Markets Bull 2X Fund) | | (formerly Developed Markets Bear 2X Fund) |
| Direxion Monthly China Bull 2X Fund (DXHLX) | | |
| (formerly China Bull 2X Fund) | | |
| |
| Money Market Funds |
| |
| U.S. Government Money Market Fund (DXMXX) |
Table of Contents
| | | | | |
| Letter to Shareholders | | | 2 | |
| | | | | |
| Performance Summary | | | 5 | |
| | | | | |
| Expense Example | | | 17 | |
| | | | | |
| Allocation of Portfolio Holdings | | | 19 | |
| | | | | |
| Schedule of Investments | | | 20 | |
| | | | | |
| Financial Statements | | | 33 | |
| | | | | |
| Financial Highlights | | | 48 | |
| | | | | |
| Notes to the Financial Statements | | | 51 | |
| | | | | |
| Report of Independent Registered Public Accounting Firm | | | 70 | |
| | | | | |
| Additional Information | | | 71 | |
| | | | | |
| Investment Advisory and Subadvisory Agreements Approvals | | | 72 | |
| | | | | |
| Information on Board of Trustees and Officers | | | 76 | |
Help Preserve the Environment – Go Green!
Go paperless with Direxion e-Delivery – a service allowing shareholders to reduce clutter with full online access to regulatory documents. Begin the preservation process with e-delivery.
With Direxion e-Delivery you can:
| | |
| | • | Receive email notifications when your most recent shareholder communications are available for review. |
| | • | Access prospectuses, annual reports and semiannual reports online. |
It’s easy to enroll:
| |
| 1. | Visit www.direxionfunds.com/edelivery |
| |
| 2. | Follow the simple enrollment instructions |
If you have questions about Direxion e-Delivery services, contact one of our shareholder representatives at 800-851-0511.
Letter to Shareholders
Dear Shareholders,
This Annual Report for the Direxion Funds covers the period from September 1, 2009 to August 31, 2010 (the “Annual Period”). During the Annual Period, the S&P 500 Index returned 4.91%, the NASDAQ-100 Index returned 9.50%, the Barclays Capital U.S. Aggregate Bond Index returned 9.18% and the Lipper High Yield Bond Fund Index (the “Lipper”) returned 19.58%.
By the beginning of the Annual Period, the markets had recovered some of the losses experienced in 2008 and early 2009 and volatility had begun to return to more normalized levels. However, despite substantial governmental stimulus and low interest rates, economic growth remained weak and the markets reflected the uncertainty of the economic picture. Equity markets were strong from the beginning of the period through the end of April but declined sharply from May through August. Fixed income markets continued to rally as fiscal concerns were pushed aside by the search for yield. The outlook for the domestic and global economies remained uncertain and job growth was very weak during the period. In Europe, the sovereign debt crisis in Greece and potential problems in Ireland and Spain left markets unsettled. Finally, China’s tightening of monetary policy and efforts to curb an overvalued real estate market raised concerns about continued growth there.
This report will account for two periods with differing investment objectives: September 1, 2009 – September 30, 2009 and October 1, 2009 – August 31, 2010. Effective September 30, 2009, all Direxion Leveraged Index Funds modified their investment objectives from daily investment objectives to calendar month investment objectives. In addition, all Funds which previously sought to achieve 250% or -250% of the performance of their index benchmark on a daily basis began to seek 200% or -200% of the performance of their index benchmark on a monthly basis.
Direxion maintains models which indicate the expected performance of each Leveraged Index Fund in light of the path of the relevant benchmark, the Fund’s expense ratios and the impact of leveraging the Fund’s portfolio. The models do not take into account the size of a Fund or any transaction fees associated with creating a Fund’s portfolio, but do take into account a Fund’s expense ratio and financing implications. A brief comparison of the actual versus expected returns for each of the Funds in this Annual Report follows.
The Small Cap Bull 2.5X Fund and the Small Cap Bear 2.5X Fund sought to provide 250% and -250% of the daily return of the Russell 2000 Index through September 30, 2009. The Small Cap Bull 2.5X Fund returned 14.13%, 10 basis points higher than its expected return of 14.03%. The Small Cap Bear 2.5X Fund returned -14.58%, 1 basis point lower than its expected return of -14.57%. The Russell 2000 Index itself returned 5.77% (September 1, 2009 – September 30, 2009).
The Direxion Monthly Small Cap Bull 2X Fund and the Direxion Monthly Small Cap Bear 2X Fund seek to provide 200% and -200% of the calendar month return of the Russell 2000 Index. The Direxion Monthly Small Cap Bull 2X Fund returned -4.43%, 106 basis points higher than its expected return of -5.49%. The Direxion Monthly Small Cap Bear 2X Fund returned -17.26%, 109 basis points lower than its expected return of -16.17%. The Russell 2000 Index itself returned 0.79% (September 30, 2009 – August 31, 2010).
The 10 Year Note Bull 2.5X Fund and the 10 Year Note Bear 2.5X Fund sought to provide 250% and -250% of the daily return of the NYSE Current 10 Year Treasury Index through September 30, 2009. The 10 Year Note Bull 2.5X Fund returned 2.23%, 31 basis points lower than its expected return of 2.54%. The 10 Year Note Bear 2.5X Fund returned -2.94%, 10 basis points higher than its expected return of -3.04%. The NYSE Current 10 Year Treasury Index itself returned 1.10% (September 1, 2009 – September 30, 2009).
The Direxion Monthly 10 Year Note Bull 2X Fund and the Direxion Monthly 10 Year Note Bear 2X Fund seek to provide 200% and -200% of the calendar month return of the NYSE Current 10 Year Treasury Index. The Direxion Monthly 10 Year Note Bull 2X Fund returned 16.81%, 204 basis points lower than its expected return of 18.85%. The Direxion Monthly 10 Year Note Bear 2X Fund returned -21.76%, 52 basis points lower than its expected return of -21.24%. The NYSE Current 10 Year Treasury Index itself returned 10.40% (September 30, 2009 – August 31, 2010).
The Commodity Bull 2X Fund sought to provide 200% of the daily return of the Morgan Stanley Commodity Related Index through September 30, 2009. The Commodity Bull 2X Fund returned 13.13%, 20 basis points higher than its expected return of 12.93%. The Morgan Stanley Commodity Related Index itself returned 6.75% (September 1, 2009 – September 30, 2009).
The performance data quoted represents past performance; past performance does not guarantee future results. The investment return and principal value of an investment will fluctuate and an investor’s shares, when redeemed, may be worth more or less than their original cost. Current performance may be higher or lower than the performance data quoted.
The Direxion Monthly Commodity Bull 2X Fund seeks to provide 200% of the calendar month return of the Morgan Stanley Commodity Related Index. The Direxion Monthly Commodity Bull 2X Fund returned 5.76%, 176 basis points higher than its expected return of 4.00%. The Morgan Stanley Commodity Related Index itself returned 6.62% (September 30, 2009 – August 31, 2010).
The Emerging Markets Bull 2X Fund and the Emerging Markets Bear 2X Fund sought to provide 200% and -200% of the daily return of the MSCI Emerging Markets Index through September 30, 2009. The Emerging Markets Bull 2X Fund returned 20.57%, 15 basis points lower than its expected return of 20.72%. The Emerging Markets Bear 2X Fund returned -18.93%, 21 basis points lower than its expected return of -18.72%. The MSCI Emerging Markets Index itself returned 10.20% (September 1, 2009 – September 30, 2009).
The Direxion Monthly Emerging Markets Bull 2X Fund and the Direxion Monthly Emerging Markets Bear 2X Fund seek to provide 200% and -200% of the calendar month return of the MSCI Emerging Markets Index. The Direxion Monthly Emerging Markets Bull 2X Fund returned 0.13%, 200 basis points lower than its expected return of 2.13%. The Direxion Monthly Emerging Markets Bear 2X Fund returned -21.98%, 67 basis points lower than its expected return of -21.31%. The MSCI Emerging Markets Index itself returned 4.52% (September 30, 2009 – August 31, 2010).
The Developed Markets Bull 2X Fund and the Developed Markets Bear 2X Fund sought to provide 200% and -200% of the daily return of the MSCI EAFE Index through September 30, 2009. The Developed Markets Bull 2X Fund returned 7.14%, 14 basis points lower than its expected return of 7.28%. The Developed Markets Bear 2X Fund returned -8.58%, 39 basis points lower than its expected return of -8.19%. The MSCI EAFE Index itself returned 3.83% (September 1, 2009 – September 30, 2009).
The Direxion Monthly Developed Markets Bull 2X Fund and the Direxion Monthly Developed Markets Bear 2X Fund seek to provide 200% and -200% of the calendar month return of the MSCI EAFE Index. The Direxion Monthly Developed Markets Bull 2X Fund returned -18.26%, 79 basis points lower than its expected return of -17.47%. The Direxion Monthly Developed Markets Bear 2X Fund returned -0.96%, 54 basis points lower than its expected return of -0.42%. The MSCI EAFE Index itself returned -6.24% (September 30, 2009 – August 31, 2010).
The China Bull 2X Fund sought to provide 200% of the daily return of the FTSE/Xinhua China 25 Index through September 30, 2009. The China Bull 2X Fund returned 7.64%, 4 basis points higher than its expected return of 7.60%. The FTSE/Xinhua China 25 Index itself returned 4.17% (September 1, 2009 – September 30, 2009).
The Direxion Monthly China Bull 2X Fund seeks to provide 200% of the calendar month return of the FTSE/Xinhua China 25 Index. The China Bull 2X Fund returned -8.89%, 55 basis points higher than its expected return of -9.44%. The FTSE/Xinhua China 25 Index itself returned -2.43% (September 30, 2009 – August 31, 2010).
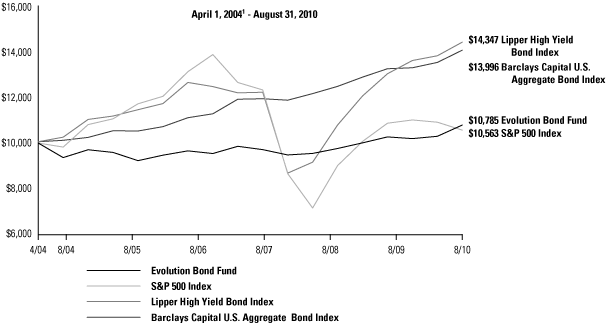
The Dynamic High Yield Bond Fund provided a total return of 8.82% for the period compared with a return of 19.58% for the Lipper. The Fund’s investment objective is to maximize total return (income plus capital appreciation) by investing primarily in debt instruments, including convertible securities, and derivatives of such instruments, with an emphasis on lower quality debt instruments. During the period, the Fund generally used the Markit CDX North America High Yield Index (“CDX”) for core exposure and sought additional exposure through a small allocation to equity futures. The CDX does not provide interest rate exposure and, as a consequence, the Dynamic HY Bond Fund benefitted from improved credit spreads and a rally in equities but did not profit from declining interest rates. The lack of interest rate exposure explains the divergence between the return of the Dynamic High Yield Bond Fund and the Lipper. For the Annual Period, the HY Bear Fund returned -15.44%. The HY Bear Fund was harmed by the improved credit picture and the equity rally as it generally held short positions in a credit derivative index and limited equity exposure.
The performance data quoted represents past performance; past performance does not guarantee future results. The investment return and principal value of an investment will fluctuate and an investor’s shares, when redeemed, may be worth more or less than their original cost. Current performance may be higher or lower than the performance data quoted.
As always, we thank you for using the Direxion Funds and we look forward to our mutual success.
Best Regards,
| | | |
 | |  |
| | | |
| Daniel O’Neill | | Patrick Rudnick |
Chief Investment Officer | | Principal Financial Officer |
The performance data quoted represents past performance; past performance does not guarantee future results. The investment return and principal value of an investment will fluctuate and an investor’s shares, when redeemed, may be worth more or less than their original cost. Current performance may be higher or lower than the performance data quoted.
To obtain performance data current to the most recent month-end, please call, toll-free, 1-800-851-0511 or visit www.direxionfunds.com.
The total annual fund operating expense ratios of the Direxion Monthly Small Cap Bull 2X Fund, Direxion Monthly Small Cap Bear 2X Fund, Direxion Monthly 10 Year Note Bull 2X Fund, Direxion Monthly 10 Year Note Bear 2X Fund, Direxion Monthly Commodity Bull 2X Fund, Direxion Monthly Emerging Markets Bull 2X Fund, Direxion Monthly Emerging Markets Bear 2X Fund, Direxion Monthly Developed Markets Bull 2X Fund, Direxion Monthly Developed Markets Bear 2X Fund and Direxion Monthly China Bull 2X Fund are 2.05%, 2.02%, 1.93%, 7.44%, 2.02%, 2.04%, 1.99%, 2.05%, 2.00% and 2.03%, respectively, net of any fee, waivers or expense reimbursements.*
The total annual fund operating expense ratios of the Dynamic HY Bond Fund and the HY Bear Fund are 2.01% and 2.04%, respectively, net of any fee, waivers or expense reimbursements.**
An investment in any of the Direxion Funds is subject to a number of risks that could affect the value of its shares. It is important that investors closely review and understand these risks before making an investment. An investor should consider the investment objectives, risks, charges and expenses of the Direxion Funds carefully before investing. The prospectus contains this and other information about the Direxion Funds. To obtain a prospectus, please call the Direxion Funds at 1 800-851-0511. The prospectus should be read carefully before investing.
Distributed by: Rafferty Capital Markets, LLC
Date of First Use: October 22, 2010
| |
| * | The total annual fund operating expense ratios include Acquired Fund Fees and Expenses, indirect fees and expenses that the Funds incur that are required to be disclosed. Without Acquired Fund Fees and Expenses, total annual fund operating expense ratios would be 1.90% for each Fund except the Direxion Monthly 10 Year Note Bear 2X Fund. The total annual fund operating expense ratio of the Direxion Monthly 10 Year Note Bear 2X Fund would be 7.28%. |
| |
| ** | The total annual fund operating expense ratios include Acquired Fund Fees and Expenses, indirect fees and expenses that the Funds incur that are required to be disclosed. Without Acquired Fund Fees and Expenses, total annual fund operating expense ratios would be 1.85% for the Dynamic HY Bond Fund and 1.90% for the HY Bear Fund. |
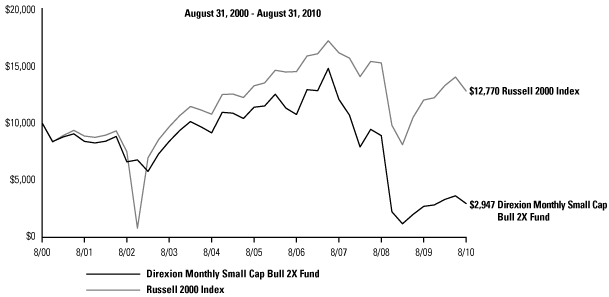
Direxion Monthly Small Cap Bull 2X Fund
August 31, 2000 - August 31, 2010 (Unaudited)
Investment Objective: Seeks monthly investment results, before fees and expenses, of 200% of the price performance of the Russell 2000 Index.
| | | | | | | | | |
| | | Average Annual Total Return1 |
| | | 1 Year | | 3 Years | | 5 Years | | 10 Years |
| |
Direxion Monthly Small Cap Bull 2X Fund | | 9.13% | | (37.45%) | | (23.65%) | | (11.50%) |
| | | | | | | | | |
Russell 2000 Index | | 6.60% | | (7.44%) | | (0.69%) | | 2.48% |
The Fund seeks calendar month leveraged investment results which should not be equated with seeking a leveraged goal for shorter than a calendar month. An investor who purchases shares on a day other than the last business day of the calendar month will generally receive more, or less, than 200% (or -200%) exposure to its index. Prior to September 30, 2009, the Fund sought daily leveraged investment results of 250% (or -250%) exposure to its index.
This chart illustrates the performance of a hypothetical $10,000 investment made on the Fund’s inception, and is not intended to imply any future performance. The returns shown do not reflect the deduction of taxes that a shareholder would pay on fund distributions of the redemption of fund shares. The performance of the Russell 2000 Index does not reflect the deduction of fees associated with a mutual fund, such as investment management fees. Investors cannot invest directly in an index, although they can invest in its underlying securities. During the period shown, Rafferty Asset Management, LLC waived and/or reimbursed fees for various expenses. Had these waivers and/or reimbursements not been in effect, performance would have been lower.
The performance data shown represents past performance and does not guarantee future results.
Market Exposure1
| | | | | |
| | | %
| |
Investment Type | | Net Assets | |
| |
Swap Contracts | | | 200.5% | |
| | | | | |
Total Exposure | | | 200.5% | |
| | | | | |
“Market Exposure” includes the value of total investments (including the contract value of any derivatives) and excludes any short-term investments and cash equivalents divided by Net Assets.
DIREXION ANNUAL REPORT 5
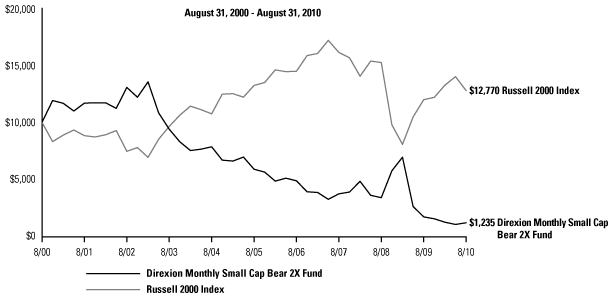
Direxion Monthly Small Cap Bear 2X Fund
August 31, 2000 - August 31, 2010 (Unaudited)
Investment Objective: Seeks monthly investment results, before fees and expenses, of 200% of the inverse of the price performance of the Russell 2000 Index.
| | | | | | | | | | | | | �� | | | | |
| | | Average Annual Total Return1 | |
| | | 1 Year | | | 3 Years | | | 5 Years | | | 10 Years | |
| |
Direxion Monthly Small Cap Bear 2X Fund | | | (29.36 | %) | | | (31.01 | %) | | | (26.88 | %) | | | (18.87 | %) |
| | | | | | | | | | | | | | | | | |
Russell 2000 Index | | | 6.60 | % | | | (7.44 | %) | | | (0.69 | %) | | | 2.48 | % |
The Fund seeks calendar month leveraged investment results which should not be equated with seeking a leveraged goal for shorter than a calendar month. An investor who purchases shares on a day other than the last business day of the calendar month will generally receive more, or less, than 200% (or -200%) exposure to its index. Prior to September 30, 2009, the Fund sought daily leveraged investment results of 250% (or -250%) exposure to its index.
This chart illustrates the performance of a hypothetical $10,000 investment made on the Fund’s inception, and is not intended to imply any future performance. The returns shown do not reflect the deduction of taxes that a shareholder would pay on fund distributions of the redemption of fund shares. The performance of the Russell 2000 Index does not reflect the deduction of fees associated with a mutual fund, such as investment management fees. Investors cannot invest directly in an index, although they can invest in its underlying securities. During the period shown, Rafferty Asset Management, LLC waived and/or reimbursed fees for various expenses. Had these waivers and/or reimbursements not been in effect, performance would have been lower.
The performance data shown represents past performance and does not guarantee future results.
Market Exposure2
| | | | | |
| | | %
| |
Investment Type | | Net Assets | |
| |
Swap Contracts | | | (200.3% | ) |
| | | | | |
Total Exposure | | | (200.3% | ) |
| | | | | |
“Market Exposure” includes the value of total investments (including the contract value of any derivatives) and excludes any short-term investments and cash equivalents divided by Net Assets.
6 DIREXION ANNUAL REPORT
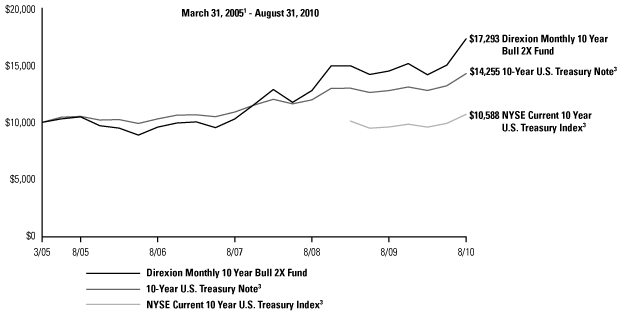
Direxion Monthly 10 Year Bull 2X Fund
March 31, 20051 - August 31, 2010 (Unaudited)
Investment Objective: The Direxion Monthly 10 Year Note Bull 2X Fund seeks monthly investment results, before fees and expenses, of 200% of the performance of the NYSE Current 10 Year U.S. Treasury Index.
| | | | | | | | | | | | | | | | | |
| | | Average Annual Total Return2 | |
| | | | | | | | | | | | Since
| |
| | | 1 Year | | | 3 Years | | | 5 Years | | | Inception | |
| |
Direxion Monthly 10 Year Bull 2X Fund | | | 19.41 | % | | | 18.86 | % | | | 10.54 | % | | | 10.64 | % |
10-Year U.S. Treasury Note3 | | | 11.58 | % | | | 9.34 | % | | | 6.25 | % | | | 6.75 | % |
NYSE Current 10 Year U.S. Treasury Index3 | | | 11.61 | % | | | N/A | | | | N/A | | | | N/A | |
The Fund seeks calendar month leveraged investment results which should not be equated with seeking a leveraged goal for shorter than a calendar month. An investor who purchases shares on a day other than the last business day of the calendar month will generally receive more, or less, than 200% (or -200%) exposure to its index. Prior to September 30, 2009, the Fund sought daily leveraged investment results of 250% (or -250%) exposure to its index.
This chart illustrates the performance of a hypothetical $10,000 investment made on the Fund’s inception, and is not intended to imply any future performance. The returns shown do not reflect the deduction of taxes that a shareholder would pay on fund distributions of the redemption of fund shares. The performance of the NYSE Current 10 Year U.S. Treasury Index does not reflect the deduction of fees associated with a mutual fund, such as investment management fees. Investors cannot invest directly in an index, although they can invest in its underlying securities. During the period shown, Rafferty Asset Management, LLC waived and/or reimbursed fees for various expenses. Had these waivers and/or reimbursements not been in effect, performance would have been lower.
The performance data shown represents past performance and does not guarantee future results.
Market Exposure2
| | | | | |
| | | %
| |
Investment Type | | Net Assets | |
| |
Swap Contracts | | | 199.9% | |
| | | | | |
Total Exposure | | | 199.9% | |
| | | | | |
“Market Exposure” includes the value of total investments (including the contract value of any derivatives) and excludes any short-term investments and cash equivalents divided by Net Assets.
| |
| 1 | Commencement of operations. |
| 2 | As of August 31, 2010. |
| 3 | On August 31, 2009, the NYSE Current 10 Year U.S. Treasury Index replaced the 10-Year U.S. Treasury Note as benchmark. The NYSE Current 10 Year U.S. Treasury Index commenced operations on April 2, 2009. The average annual return for the period from April 2, 2009 to August 31, 2010 was 4.11%. |
DIREXION ANNUAL REPORT 7
Direxion Monthly 10 Year Bear 2X Fund
May 17, 20041 - August 31, 2010 (Unaudited)
Investment Objective: The Direxion Monthly 10 Year Note Bear 2X Fund seeks monthly investment results, before fees and expenses, of 200% of the inverse of the performance of the NYSE Current 10 Year U.S. Treasury Index.
| | | | | | | | | | | | | | | | | |
| | | Average Annual Total Return2 | |
| | | | | | | | | | | | Since
| |
| | | 1 Year | | | 3 Years | | | 5 Years | | | Inception | |
| |
Direxion Monthly 10 Year Bear 2X Fund | | | (24.06 | %) | | | (21.92 | %) | | | (12.57 | %) | | | (12.41 | %) |
| 10-Year U.S. Treasury Note3 | | | 11.58 | % | | | 9.34 | % | | | 6.25 | % | | | 6.45 | % |
NYSE Current 10 Year U.S. Treasury Index3 | | | 11.61 | % | | | N/A | | | | N/A | | | | N/A | |
The Fund seeks calendar month leveraged investment results which should not be equated with seeking a leveraged goal for shorter than a calendar month. An investor who purchases shares on a day other than the last business day of the calendar month will generally receive more, or less, than 200% (or -200%) exposure to its index. Prior to September 30, 2009, the Fund sought daily leveraged investment results of 250% (or -250%) exposure to its index.
This chart illustrates the performance of a hypothetical $10,000 investment made on the Fund’s inception, and is not intended to imply any future performance. The returns shown do not reflect the deduction of taxes that a shareholder would pay on fund distributions of the redemption of fund shares. The performance of the NYSE Current 10 Year U.S. Treasury Index does not reflect the deduction of fees associated with a mutual fund, such as investment management fees. Investors cannot invest directly in an index, although they can invest in its underlying securities. During the period shown, Rafferty Asset Management, LLC waived and/or reimbursed fees for various expenses. Had these waivers and/or reimbursements not been in effect, performance would have been lower.
The performance data shown represents past performance and does not guarantee future results.
Market Exposure2
| | | | | |
| | | %
| |
Investment Type | | Net Assets | |
| |
Swap Contracts | | | (199.9% | ) |
| | | | | |
Total Exposure | | | (199.9% | ) |
| | | | | |
“Market Exposure” includes the value of total investments (including the contract value of any derivatives) and excludes any short-term investments and cash equivalents divided by Net Assets.
| |
| 1 | Commencement of operations. |
| 2 | As of August 31, 2010. |
| 3 | On August 31, 2009, the NYSE Current 10 Year U.S. Treasury Index replaced the 10-Year U.S. Treasury Note as benchmark. The NYSE Current 10 Year U.S. Treasury Index commenced operations on April 2, 2009. The average annual return for the period from April 2, 2009 to August 31, 2010 was 4.11%. |
8 DIREXION ANNUAL REPORT
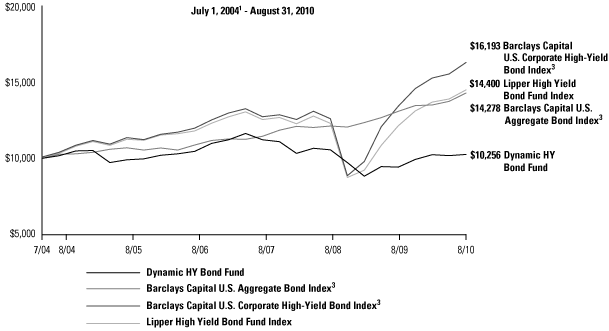
Dynamic HY Bond Fund
July 1, 20041 - August 31, 2010 (Unaudited)
Investment Objective: Seeks to maximize total return by investing primarily in high-yield debt instruments, commonly referred to as “junk bonds”, and derivatives of such instruments, including derivatives which isolate the credit component of such junk bonds.
| | | | | | | | | | | | | | | | | |
| | | Average Annual Total Return2 | |
| | | | | | | | | | | | Since
| |
| | | 1 Year | | | 3 Years | | | 5 Years | | | Inception | |
| |
Dynamic HY Bond Fund | | | 8.82 | % | | | (2.94 | %) | | | 0.70 | % | | | 0.41 | % |
Barclays Capital U.S. Aggregate Bond Index3 | | | 9.18 | % | | | 7.65 | % | | | 5.96 | % | | | 5.94 | % |
Barclays Capital U.S. Corporate High-Yield Bond Index3 | | | 21.52 | % | | | 8.61 | % | | | 7.51 | % | | | 8.12 | % |
Lipper High Yield Bond Fund Index | | | 19.58 | % | | | 4.96 | % | | | 5.23 | % | | | 6.09 | % |
This chart illustrates the performance of a hypothetical $10,000 investment made on the Fund’s inception, and is not intended to imply any future performance. The returns shown do not reflect the deduction of taxes that a shareholder would pay on fund distributions of the redemption of fund shares. The performance of the Barclays Capital U.S. Aggregate Bond Index, the Barclays Capital U.S. Corporate High-Yield Bond Index and the Lipper High Yield Bond Fund Index does not reflect the deduction of fees associated with a mutual fund, such as investment management fees. Investors cannot invest directly in an index, although they can invest in its underlying securities. During the period shown, Rafferty Asset Management, LLC waived and/or reimbursed fees for various expenses. Had these waivers and/or reimbursements not been in effect, performance would have been lower.
The performance data shown represents past performance and does not guarantee future results.
Market Exposure2
| | | | | |
| | | %
| |
Investment Type | | Net Assets | |
| |
Futures Contracts | | | 4.8% | |
Swap Contracts | | | 68.5% | |
| | | | | |
Total Exposure | | | 73.2% | |
| | | | | |
“Market Exposure” includes the value of total investments (including the contract value of any derivatives) and excludes any short-term investments and cash equivalents divided by Net Assets.
| |
| 1 | Commencement of operations. |
| 2 | As of August 31, 2010. |
| 3 | Effective December 29, 2009, the Barclays Capital U.S. Corporate High-Yield Bond Index has replaced the Barclays Capital U.S. Aggregate Bond Index as a more appropriate comparative benchmark. |
DIREXION ANNUAL REPORT 9
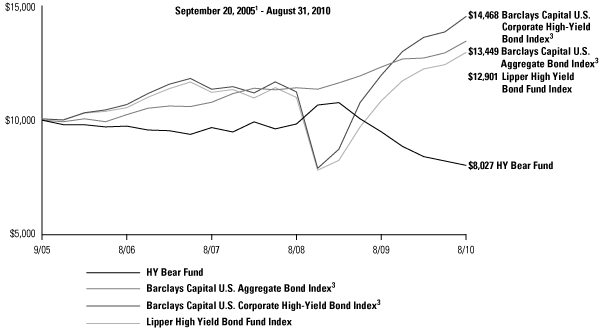
HY Bear Fund
September 20, 20051 - August 31, 2010 (Unaudited)
Investment Objective: Seeks to profit from a decline in the value of lower-quality debt instruments by creating short positions in such instruments and derivatives of such instruments.
| | | | | | | | | | | | | |
| | | Average Annual Total Return2 | |
| | | | | | | | | Since
| |
| | | 1 Year | | | 3 Years | | | Inception | |
| |
HY Bear Fund | | | (15.44 | %) | | | (6.04 | %) | | | (4.34 | %) |
Barclays Capital U.S. Aggregate Bond Index3 | | | 9.18 | % | | | 7.65 | % | | | 6.17 | % |
Barclays Capital U.S. Corporate High-Yield Bond Index3 | | | 21.52 | % | | | 8.61 | % | | | 7.75 | % |
Lipper High Yield Bond
Fund Index | | | 19.58 | % | | | 4.96 | % | | | 5.28 | % |
This chart illustrates the performance of a hypothetical $10,000 investment made on the Fund’s inception, and is not intended to imply any future performance. The returns shown do not reflect the deduction of taxes that a shareholder would pay on fund distributions of the redemption of fund shares. The performance of the Barclays Capital U.S. Aggregate Bond Index, the Barclays Capital U.S. Corporate High-Yield Bond Index and the Lipper High Yield Bond Fund Index does not reflect the deduction of fees associated with a mutual fund, such as investment management fees. Investors cannot invest directly in an index, although they can invest in its underlying securities. During the period shown, Rafferty Asset Management, LLC waived and/or reimbursed fees for various expenses. Had these waivers and/or reimbursements not been in effect, performance would have been lower.
The performance data shown represents past performance and does not guarantee future results.
Market Exposure2
| | | | | |
| | | %
| |
Investment Type | | Net Assets | |
| |
Futures Contracts | | | 9.5% | |
Swap Contracts | | | 83.2% | |
| | | | | |
Total Exposure | | | 92.7% | |
| | | | | |
“Market Exposure” includes the value of total investments (including the contract value of any derivatives) and excludes any short-term investments and cash equivalents divided by Net Assets.
| |
| 1 | Commencement of operations. |
| 2 | As of August 31, 2010. |
| 3 | Effective December 29, 2009, the Barclays Capital U.S. Corporate High-Yield Bond Index has replaced the Barclays Capital U.S. Aggregate Bond Index as a more appropriate comparative benchmark. |
10 DIREXION ANNUAL REPORT
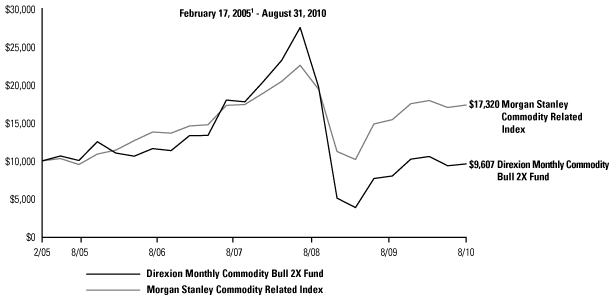
Direxion Monthly Commodity Bull 2X Fund
February 17, 20051- August 31, 2010 (Unaudited)
Investment Objective: Seeks monthly investment results, before fees and expenses, of 200% of the price performance of the Morgan Stanley Commodity Related Equity Index.
| | | | | | | | | | | | | | | | | |
| | | Average Annual Total Return2 | |
| | | | | | | | | | | | Since
| |
| | | 1 Year | | | 3 Years | | | 5 Years | | | Inception | |
| |
Direxion Monthly Commodity Bull 2X Fund | | | 19.65 | % | | | (18.49 | %) | | | (5.15 | %) | | | (0.72 | %) |
Morgan Stanley Commodity Related Index | | | 12.46 | % | | | (0.12 | %) | | | 10.02 | % | | | 10.42 | % |
The Fund seeks calendar month leveraged investment results which should not be equated with seeking a leveraged goal for shorter than a calendar month. An investor who purchases shares on a day other than the last business day of the calendar month will generally receive more, or less, than 200% (or -200%) exposure to its index. Prior to September 30, 2009, the Fund sought daily leveraged investment results of 200% (or -200%) exposure to its index.
This chart illustrates the performance of a hypothetical $10,000 investment made on the Fund’s inception, and is not intended to imply any future performance. The returns shown do not reflect the deduction of taxes that a shareholder would pay on fund distributions of the redemption of fund shares. The performance of the Morgan Stanley Commodity Related Index does not reflect the deduction of fees associated with a mutual fund, such as investment management fees. Investors cannot invest directly in an index, although they can invest in its underlying securities. During the period shown, Rafferty Asset Management, LLC waived and/or reimbursed fees for various expenses. Had these waivers and/or reimbursements not been in effect, performance would have been lower.
The performance data shown represents past performance and does not guarantee future results.
Market Exposure2
| | | | | |
| | | %
| |
Investment Type | | Net Assets | |
| |
Swap Contracts | | | 200.5% | |
| | | | | |
Total Exposure | | | 200.5% | |
| | | | | |
“Market Exposure” includes the value of total investments (including the contract value of any derivatives) and excludes any short-term investments and cash equivalents divided by Net Assets.
| |
| 1 | Commencement of operations. |
| 2 | As of August 31, 2010. |
DIREXION ANNUAL REPORT 11
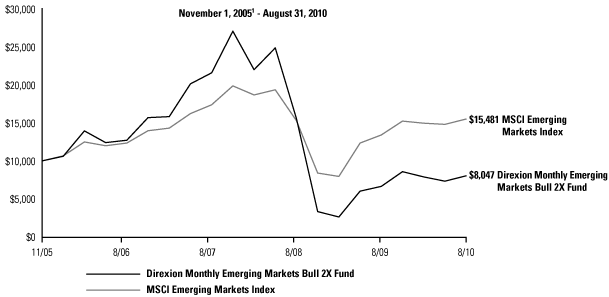
Direxion Monthly Emerging Markets Bull 2X Fund
November 1, 20051 - August 31, 2010 (Unaudited)
Investment Objective: Seeks monthly investment results, before fees and expenses, of 200% of the price performance of the MSCI Emerging Markets Index.
| | | | | | | | | | | | | |
| | | Average Annual Total Return2 | |
| | | | | | | | | Since
| |
| | | 1 Year | | | 3 Years | | | Inception | |
| |
Direxion Monthly Emerging Markets Bull 2X Fund | | | 20.73 | % | | | (27.97 | %) | | | (4.39 | %) |
| | | | | | | | | | | | | |
MSCI Emerging Markets Index | | | 15.56 | % | | | (3.72 | %) | | | 9.47 | % |
The Fund seeks calendar month leveraged investment results which should not be equated with seeking a leveraged goal for shorter than a calendar month. An investor who purchases shares on a day other than the last business day of the calendar month will generally receive more, or less, than 200% (or -200%) exposure to its index. Prior to September 30, 2009, the Fund sought daily leveraged investment results of 200% (or -200%) exposure to its index.
This chart illustrates the performance of a hypothetical $10,000 investment made on the Fund’s inception, and is not intended to imply any future performance. The returns shown do not reflect the deduction of taxes that a shareholder would pay on fund distributions of the redemption of fund shares. The performance of the MSCI Emerging Markets Index does not reflect the deduction of fees associated with a mutual fund, such as investment management fees. Investors cannot invest directly in an index, although they can invest in its underlying securities. During the period shown, Rafferty Asset Management, LLC waived and/or reimbursed fees for various expenses. Had these waivers and/or reimbursements not been in effect, performance would have been lower.
The performance data shown represents past performance and does not guarantee future results.
Market Exposure2
| | | | | |
| | | %
| |
Investment Type | | Net Assets | |
| |
Swap Contracts | | | 200.0% | |
| | | | | |
Total Exposure | | | 200.0% | |
| | | | | |
“Market Exposure” includes the value of total investments (including the contract value of any derivatives) and excludes any short-term investments and cash equivalents divided by Net Assets.
| |
| 1 | Commencement of operations. |
| 2 | As of August 31, 2010. |
12 DIREXION ANNUAL REPORT
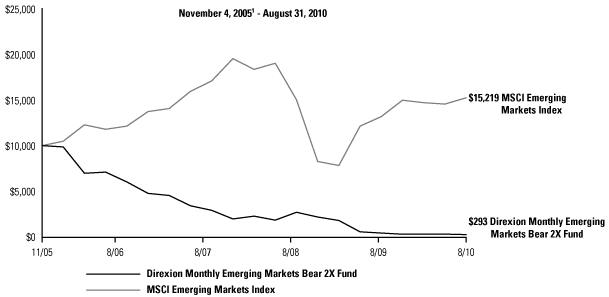
Direxion Monthly Emerging Markets Bear 2X Fund
November 4, 20051 - August 31, 2010 (Unaudited)
Investment Objective: Seeks monthly investment results, before fees and expenses, of 200% of the inverse of the price performance of the MSCI Emerging Markets Index.
| | | | | | | | | | | | | |
| | | Average Annual Total Return2 | |
| | | | | | | | | Since
| |
| | | 1 Year | | | 3 Years | | | Inception | |
| |
Direxion Monthly Emerging Markets Bear 2X Fund | | | (36.74% | ) | | | (53.68% | ) | | | (51.93% | ) |
| | | | | | | | | | | | | |
MSCI Emerging Markets Index | | | 15.56% | | | | (3.72% | ) | | | 9.09% | |
The Fund seeks calendar month leveraged investment results which should not be equated with seeking a leveraged goal for shorter than a calendar month. An investor who purchases shares on a day other than the last business day of the calendar month will generally receive more, or less, than 200% (or -200%) exposure to its index. Prior to September 30, 2009, the Fund sought daily leveraged investment results of 200% (or -200%) exposure to its index.
This chart illustrates the performance of a hypothetical $10,000 investment made on the Fund’s inception, and is not intended to imply any future performance. The returns shown do not reflect the deduction of taxes that a shareholder would pay on fund distributions of the redemption of fund shares. The performance of the MSCI Emerging Markets Index does not reflect the deduction of fees associated with a mutual fund, such as investment management fees. Investors cannot invest directly in an index, although they can invest in its underlying securities. During the period shown, Rafferty Asset Management, LLC waived and/or reimbursed fees for various expenses. Had these waivers and/or reimbursements not been in effect, performance would have been lower.
The performance data shown represents past performance and does not guarantee future results.
Market Exposure2
| | | | | |
| | | %
| |
Investment Type | | Net Assets | |
| |
Swap Contracts | | | (200.2% | ) |
| | | | | |
Total Exposure | | | (200.2% | ) |
| | | | | |
“Market Exposure” includes the value of total investments (including the contract value of any derivatives) and excludes any short-term investments and cash equivalents divided by Net Assets.
| |
| 1 | Commencement of operations. |
| 2 | As of August 31, 2010. |
DIREXION ANNUAL REPORT 13
Direxion Monthly Developed Markets Bull 2X Fund
January 25, 20061 - August 31, 2010 (Unaudited)
Investment Objective: Seeks monthly investment results, before fees and expenses, of 200% of the price performance of the MSCI EAFE Index.
| | | | | | | | | | | | | |
| | | Average Annual Total Return2 | |
| | | | | | | | | Since
| |
| | | 1 Year | | | 3 Years | | | Inception | |
| |
Direxion Monthly Developed Markets Bull 2X Fund | | | (12.42 | %) | | | (33.01 | %) | | | (16.99 | %) |
| | | | | | | | | | | | | |
MSCI EAFE Index | | | (4.89 | %) | | | (13.30 | %) | | | (4.31 | %) |
The Fund seeks calendar month leveraged investment results which should not be equated with seeking a leveraged goal for shorter than a calendar month. An investor who purchases shares on a day other than the last business day of the calendar month will generally receive more, or less, than 200% (or -200%) exposure to its index. Prior to September 30, 2009, the Fund sought daily leveraged investment results of 200% (or -200%) exposure to its index.
This chart illustrates the performance of a hypothetical $10,000 investment made on the Fund’s inception, and is not intended to imply any future performance. The returns shown do not reflect the deduction of taxes that a shareholder would pay on fund distributions of the redemption of fund shares. The performance of the MSCI EAFE Index does not reflect the deduction of fees associated with a mutual fund, such as investment management fees. Investors cannot invest directly in an index, although they can invest in its underlying securities. During the period shown, Rafferty Asset Management, LLC waived and/or reimbursed fees for various expenses. Had these waivers and/or reimbursements not been in effect, performance would have been lower.
The performance data shown represents past performance and does not guarantee future results.
Market Exposure2
| | | | | |
| | | %
| |
Investment Type | | Net Assets | |
| |
Swap Contracts | | | 200.0% | |
| | | | | |
Total Exposure | | | 200.0% | |
| | | | | |
“Market Exposure” includes the value of total investments (including the contract value of any derivatives) and excludes any short-term investments and cash equivalents divided by Net Assets.
| |
| 1 | Commencement of operations. |
| 2 | As of August 31, 2010. |
14 DIREXION ANNUAL REPORT
Direxion Monthly Developed Markets Bear 2X Fund
February 6, 20061 - August 31, 2010 (Unaudited)
Investment Objective: Seeks monthly investment results, before fees and expenses, of 200% of the inverse of the price performance of the MSCI EAFE Index.
| | | | | | | | | | | | | |
| | | Average Annual Total Return2 |
| | | | | | | Since
|
| | | 1 Year | | 3 Years | | Inception |
| |
Direxion Monthly Developed Markets Bear 2X Fund | | | (9.48 | %) | | | (14.00 | %) | | | (19.01 | %) |
| | | | | | | | | | | | | |
MSCI EAFE Index | | | (4.89 | %) | | | (13.30 | %) | | | (4.51 | %) |
The Fund seeks calendar month leveraged investment results which should not be equated with seeking a leveraged goal for shorter than a calendar month. An investor who purchases shares on a day other than the last business day of the calendar month will generally receive more, or less, than 200% (or -200%) exposure to its index. Prior to September 30, 2009, the Fund sought daily leveraged investment results of 200% (or -200%) exposure to its index.
This chart illustrates the performance of a hypothetical $10,000 investment made on the Fund’s inception, and is not intended to imply any future performance. The returns shown do not reflect the deduction of taxes that a shareholder would pay on fund distributions of the redemption of fund shares. The performance of the MSCI EAFE Index does not reflect the deduction of fees associated with a mutual fund, such as investment management fees. Investors cannot invest directly in an index, although they can invest in its underlying securities. During the period shown, Rafferty Asset Management, LLC waived and/or reimbursed fees for various expenses. Had these waivers and/or reimbursements not been in effect, performance would have been lower.
The performance data shown represents past performance and does not guarantee future results.
Market Exposure2
| | | | | |
| | | %
| |
Investment Type | | Net Assets | |
| |
Swap Contracts | | | (200.0% | ) |
| | | | | |
Total Exposure | | | (200.0% | ) |
| | | | | |
“Market Exposure” includes the value of total investments (including the contract value of any derivatives) and excludes any short-term investments and cash equivalents divided by Net Assets.
| |
| 1 | Commencement of operations. |
| 2 | As of August 31, 2010. |
DIREXION ANNUAL REPORT 15
Direxion Monthly China Bull 2X Fund
December 3, 20071 - August 31, 2010 (Unaudited)
Investment Objective: Seeks monthly investment results, before fees and expenses, of 200% of the price performance of the FTSE/Xinhua China 25 Index.
| | | | | | | | | |
| | | Average Annual Total Return2 | |
| | | | | | Since
| |
| | | 1 Year | | | Inception | |
| |
Direxion Monthly China Bull 2X Fund | | | (1.92 | %) | | | (46.61 | %) |
| | | | | | | | | |
FTSE/Xinhua China 25 Index | | | 0.17 | % | | | (14.57 | %) |
The Fund seeks calendar month leveraged investment results which should not be equated with seeking a leveraged goal for shorter than a calendar month. An investor who purchases shares on a day other than the last business day of the calendar month will generally receive more, or less, than 200% (or -200%) exposure to its index. Prior to September 30, 2009, the Fund sought daily leveraged investment results of 200% (or -200%) exposure to its index.
This chart illustrates the performance of a hypothetical $10,000 investment made on the Fund’s inception, and is not intended to imply any future performance. The returns shown do not reflect the deduction of taxes that a shareholder would pay on fund distributions of the redemption of fund shares. The performance of the FTSE/Xinhua China 25 Index does not reflect the deduction of fees associated with a mutual fund, such as investment management fees. Investors cannot invest directly in an index, although they can invest in its underlying securities. During the period shown, Rafferty Asset Management, LLC waived and/or reimbursed fees for various expenses. Had these waivers and/or reimbursements not been in effect, performance would have been lower.
The performance data shown represents past performance and does not guarantee future results.
Market Exposure2
| | | | | |
| | | %
| |
Investment Type | | Net Assets | |
| |
Swap Contracts | | | 200.0% | |
| | | | | |
Total Exposure | | | 200.0% | |
| | | | | |
“Market Exposure” includes the value of total investments (including the contract value of any derivatives) and excludes any short-term investments and cash equivalents divided by Net Assets.
| |
| 1 | Commencement of operations. |
| 2 | As of August 31, 2010. |
16 DIREXION ANNUAL REPORT
Expense Example
August 31, 2010 (Unaudited)
As a shareholder of a mutual fund, you incur two types of costs: (1) transaction costs, including sales charges (loads) on purchase payments, reinvested dividends, or other distributions; redemption fees; and exchange fees; and (2) ongoing costs, including management fees; distribution and/or service fees; and other fund expenses. This example is intended to help you understand your ongoing costs (in dollars) of investing in a fund and to compare costs with the ongoing costs of investing in other mutual funds.
The example is based on an investment of $1,000 invested at the beginning of the period and held the entire period (March 1, 2010 — August 31, 2010).
Actual Expenses
The first line of the table below provides information about actual account values and actual expenses. Although the Funds charge no sales load or transactions fees, you will be assessed fees for outgoing wire transfers, returned checks or stop payment orders at prevailing rates charged by U.S. Bancorp Fund Services, LLC, the Funds’ transfer agent. If you request a redemption be made by wire transfer, currently a $15.00 fee is charged by the Funds’ transfer agent. To the extent a Fund invests in shares of other investment companies as part of its investment strategy, you will indirectly bear your proportionate share of any fees and expenses charged by the underlying funds in which the Fund invests, in addition to the expenses of the Fund. Actual expenses of underlying funds may vary. These expenses are not included in the examples presented on the preceding page. The preceding examples include, but are not limited to, investment advisory, shareholder servicing, fund accounting, custody and transfer agent fees. However, the example does not include portfolio trading heading entitled commissions and related expenses or other extraordinary expenses as determined under generally accepted accounting principles. You may use the information in this line, together with the amount you invested, to estimate the expenses that you paid over the period. Simply divide your account value by $1,000 (for example, an $8,600 account value divided by $1,000 = 8.6), then multiply the result by the number in the first line under the “Expenses Paid During Period” to estimate the expenses you paid on your account during this period.
Hypothetical Example for Comparison Purposes
The second line of the table below provides information about hypothetical account values and hypothetical expenses based on the Funds’ actual expense ratios and an assumed rate of return of 5% per year before expenses, which is not the Funds’ actual return. The hypothetical account values and expenses may not be used to estimate the actual ending account balance or expenses you paid for the period. You may use this information to compare the ongoing costs of investing in the Funds and other funds. To do so, compare this 5% hypothetical example with the 5% hypothetical examples that appear in the shareholder reports of the other funds.
Please note that the expenses shown in the table are meant to highlight your ongoing costs only and do not reflect any transactional costs, such as wire transfers, returned checks or stop payment orders. Therefore, the second line of the table is useful in comparing ongoing costs only, and will not help you determine the relative costs of owning different funds. In addition, if these transactional costs were included, your costs would have been higher.
DIREXION ANNUAL REPORT 17
Expense Example Tables
August 31, 2010 (Unaudited)
| | | | | | | | | | | | | | | | | |
| | | | | | Beginning
| | | Ending
| | | Expenses
| |
| | | Expense
| | | Account Value
| | | Account Value
| | | Paid During
| |
| | | Ratio1 | | | March 1, 2010 | | | August 31, 2010 | | | Period2 | |
| |
Direxion Monthly Small Cap Bull 2X Fund | | | | | | | | | | | | | | | | |
| Based on actual fund return | | | 1.90 | % | | $ | 1,000.00 | | | $ | 890.90 | | | $ | 9.06 | |
| Based on hypothetical 5% return | | | 1.90 | % | | | 1,000.00 | | | | 1,015.63 | | | | 9.65 | |
Direxion Monthly Small Cap Bear 2X Fund | | | | | | | | | | | | | | | | |
| Based on actual fund return | | | 1.90 | % | | | 1,000.00 | | | | 961.70 | | | | 9.39 | |
| Based on hypothetical 5% return | | | 1.90 | % | | | 1,000.00 | | | | 1,015.63 | | | | 9.65 | |
Direxion Monthly 10 Year Note Bull 2X Fund | | | | | | | | | | | | | | | | |
| Based on actual fund return | | | 1.90 | % | | | 1,000.00 | | | | 1,222.20 | | | | 10.64 | |
| Based on hypothetical 5% return | | | 1.90 | % | | | 1,000.00 | | | | 1,015.63 | | | | 9.65 | |
Direxion Monthly 10 Year Note Bear 2X Fund3 | | | | | | | | | | | | | | | | |
| Based on actual fund return | | | 1.90 | % | | | 1,000.00 | | | | 780.90 | | | | 8.53 | |
| Based on hypothetical 5% return | | | 1.90 | % | | | 1,000.00 | | | | 1,015.63 | | | | 9.65 | |
Dynamic HY Bond Fund | | | | | | | | | | | | | | | | |
| Based on actual fund return | | | 1.85 | % | | | 1,000.00 | | | | 1,001.80 | | | | 9.33 | |
| Based on hypothetical 5% return | | | 1.85 | % | | | 1,000.00 | | | | 1,015.88 | | | | 9.40 | |
HY Bear Fund | | | | | | | | | | | | | | | | |
| Based on actual fund return | | | 1.90 | % | | | 1,000.00 | | | | 954.50 | | | | 9.36 | |
| Based on hypothetical 5% return | | | 1.90 | % | | | 1,000.00 | | | | 1,015.63 | | | | 9.65 | |
Direxion Monthly Commodity Bull 2X Fund | | | | | | | | | | | | | | | | |
| Based on actual fund return | | | 1.90 | % | | | 1,000.00 | | | | 908.30 | | | | 9.14 | |
| Based on hypothetical 5% return | | | 1.90 | % | | | 1,000.00 | | | | 1,015.63 | | | | 9.65 | |
Direxion Monthly Emerging Markets Bull 2X Fund | | | | | | | | | | | | | | | | |
| Based on actual fund return | | | 1.90 | % | | | 1,000.00 | | | | 1,017.80 | | | | 9.66 | |
| Based on hypothetical 5% return | | | 1.90 | % | | | 1,000.00 | | | | 1,015.63 | | | | 9.65 | |
Direxion Monthly Emerging Markets Bear 2X Fund | | | | | | | | | | | | | | | | |
| Based on actual fund return | | | 1.90 | % | | | 1,000.00 | | | | 840.20 | | | | 8.81 | |
| Based on hypothetical 5% return | | | 1.90 | % | | | 1,000.00 | | | | 1,015.63 | | | | 9.65 | |
Direxion Monthly Developed Markets Bull 2X Fund | | | | | | | | | | | | | | | | |
| Based on actual fund return | | | 1.90 | % | | | 1,000.00 | | | | 885.00 | | | | 9.03 | |
| Based on hypothetical 5% return | | | 1.90 | % | | | 1,000.00 | | | | 1,015.63 | | | | 9.65 | |
Direxion Monthly Developed Markets Bear 2X Fund | | | | | | | | | | | | | | | | |
| Based on actual fund return | | | 1.90 | % | | | 1,000.00 | | | | 955.70 | | | | 9.37 | |
| Based on hypothetical 5% return | | | 1.90 | % | | | 1,000.00 | | | | 1,015.63 | | | | 9.65 | |
Direxion Monthly China Bull 2X Fund | | | | | | | | | | | | | | | | |
| Based on actual fund return | | | 1.90 | % | | | 1,000.00 | | | | 985.50 | | | | 9.51 | |
| Based on hypothetical 5% return | | | 1.90 | % | | | 1,000.00 | | | | 1,015.63 | | | | 9.65 | |
U.S. Government Money Market Fund | | | | | | | | | | | | | | | | |
| Based on actual fund return | | | 0.05 | % | | | 1,000.00 | | | | 1,000.40 | | | | 0.25 | |
| Based on hypothetical 5% return | | | 0.05 | % | | | 1,000.00 | | | | 1,024.95 | | | | 0.26 | |
| | |
| 1 | | Annualized. |
| 2 | | Expenses are equal to the Fund’s annualized expense ratio, multiplied by the average account value over the period, multiplied by the number of days in the most recent fiscal half-year/period, then divided by 365. |
| 3 | | Net expenses includes interest on securities sold short. |
18 DIREXION ANNUAL REPORT
Allocation of Portfolio Holdings
August 31, 2010 (Unaudited)
| | | | | | | | | | | | | | | | | | | | | |
| | | Cash* | | | Futures | | | Swaps | | | Total | | | | |
| |
| Direxion Monthly Small Cap Bull 2X Fund | | | 116 | % | | | — | | | | (16 | %) | | | 100 | % | | | | |
| Direxion Monthly Small Cap Bear 2X Fund | | | 98 | % | | | — | | | | 2 | % | | | 100 | % | | | | |
| Direxion Monthly 10 Year Note Bull 2X Fund | | | 98 | % | | | — | | | | 2 | % | | | 100 | % | | | | |
| Direxion Monthly 10 Year Note Bear 2X Fund | | | 106 | % | | | — | | | | (6 | %) | | | 100 | % | | | | |
| Dynamic HY Bond Fund | | | 101 | % | | | 0 | %** | | | (1 | %) | | | 100 | % | | | | |
| HY Bear Fund | | | 100 | % | | | 0 | %** | | | 0 | %** | | | 100 | % | | | | |
| Direxion Monthly Commodity Bull 2X Fund | | | 117 | % | | | — | | | | (17 | %) | | | 100 | % | | | | |
| Direxion Monthly Emerging Markets Bull 2X Fund | | | 107 | % | | | — | | | | (7 | %) | | | 100 | % | | | | |
| Direxion Monthly Emerging Markets Bear 2X Fund | | | 98 | % | | | — | | | | 2 | % | | | 100 | % | | | | |
| Direxion Monthly Developed Markets Bull 2X Fund | | | 110 | % | | | — | | | | (10 | %) | | | 100 | % | | | | |
| Direxion Monthly Developed Markets Bear 2X Fund | | | 98 | % | | | — | | | | 2 | % | | | 100 | % | | | | |
| Direxion Monthly China Bull 2X Fund | | | 111 | % | | | — | | | | (11 | %) | | | 100 | % | | | | |
| U.S. Government Money Market Fund | | | 100 | % | | | — | | | | — | | | | 100 | % | | | | |
| | |
| * | | Cash, cash equivalents and other assets less liabilities. |
| ** | | Percentage is less than 0.5%. |
DIREXION ANNUAL REPORT 19
Direxion Monthly Small Cap Bull 2X Fund
Schedule of Investments
August 31, 2010
| | | | | | | | | | | |
| Shares | | | | | Value | | | |
| |
SHORT TERM INVESTMENTS - 116.2% |
MONEY MARKET FUNDS - 116.2% |
| | 970,310 | | | Fidelity Institutional Government Portfolio, 0.06% (a) | | $ | 970,310 | | | |
| | 970,310 | | | Fidelity Institutional Money Market Portfolio, 0.23% (a) | | | 970,310 | | | |
| | 970,310 | | | Goldman Sachs Financial Square Federal Fund, 0.04% (a) | | | 970,310 | | | |
| | 3,680,310 | | | Goldman Sachs Financial Square Government Fund, 0.10% (a)(b) | | | 3,680,310 | | | |
| | 970,310 | | | Morgan Stanley Institutional Liquidity Fund - Treasury Portfolio, 0.06% (a) | | | 970,310 | | | |
| | | | | | | | | | | |
| | | | | TOTAL SHORT TERM INVESTMENTS
(Cost $7,561,550) | | $ | 7,561,550 | | | |
| | | | | | | | | | | |
| | | | | TOTAL INVESTMENTS
(Cost $7,561,550) - 116.2% | | $ | 7,561,550 | | | |
| | | | | Liabilities in Excess of Other Assets - (16.2)% | | | (1,051,481 | ) | | |
| | | | | | | | | | | |
| | | | | TOTAL NET ASSETS - 100.0% | | $ | 6,510,069 | | | |
| | | | | | | | | | | |
Percentages are stated as a percent of net assets.
| |
| (a) | Represents annualized seven-day yield at August 31, 2010. |
| |
| (b) | $2,710,000 of this security is held as collateral for swap contracts. |
Direxion Monthly Small Cap Bull 2X Fund
Long Equity Swap Contracts
August 31, 2010
| | | | | | | | | | | | | | | | | | | |
| | | | | Number of
| | | Notional
| | | Termination
| | | Unrealized
| |
Counterparty | | Reference Entity | | Contracts | | | Amount | | | Date | | | Depreciation | |
| |
| Credit Suisse Capital, LLC | | Russell 2000 Index | | | 21,650 | | | $ | 14,071,520 | | | | 1/30/2012 | | | $ | (1,019,943 | ) |
| | | | | | | | | | | | | | | | | | | |
The accompanying notes are an integral part of these financial statements.
20 DIREXION ANNUAL REPORT
Direxion Monthly Small Cap Bear 2X Fund
Schedule of Investments
August 31, 2010
| | | | | | | | | | | |
| Shares | | | | | Value | | | |
| |
SHORT TERM INVESTMENTS - 99.6% |
MONEY MARKET FUNDS - 99.6% |
| | 5,374,665 | | | Fidelity Institutional Government Portfolio, 0.06% (a) | | $ | 5,374,665 | | | |
| | 5,374,665 | | | Fidelity Institutional Money Market Portfolio, 0.23% (a) | | | 5,374,665 | | | |
| | 5,374,666 | | | Goldman Sachs Financial Square Federal Fund, 0.04% (a) | | | 5,374,666 | | | |
| | 10,654,666 | | | Goldman Sachs Financial Square Government Fund, 0.10% (a)(b) | | | 10,654,666 | | | |
| | 5,374,666 | | | Morgan Stanley Institutional Liquidity Fund - Treasury Portfolio, 0.06% (a) | | | 5,374,666 | | | |
| | | | | | | | | | | |
| | | | | TOTAL SHORT TERM INVESTMENTS
(Cost $32,153,328) | | $ | 32,153,328 | | | |
| | | | | | | | | | | |
| | | | | TOTAL INVESTMENTS
(Cost $32,153,328) - 99.6% | | $ | 32,153,328 | | | |
| | | | | Other Assets in Excess of Liabilities - 0.4% | | | 143,759 | | | |
| | | | | | | | | | | |
| | | | | TOTAL NET ASSETS - 100.0% | | $ | 32,297,087 | | | |
| | | | | | | | | | | |
Percentages are stated as a percent of net assets.
| |
| (a) | Represents annualized seven-day yield at August 31, 2010. |
| |
| (b) | $5,280,000 of this security is held as collateral for swap contracts. |
Direxion Monthly Small Cap Bear 2X Fund
Short Equity Swap Contracts
August 31, 2010
| | | | | | | | | | | | | | | | | |
| | | | | Number of
| | Notional
| | | Termination
| | | Unrealized
| |
Counterparty | | Reference Entity | | Contracts | | Amount | | | Date | | | Appreciation | |
| |
| Credit Suisse Capital, LLC | | Russell 2000 Index | | 107,250 | | $ | 65,367,185 | | | | 1/9/2012 | | | $ | 671,873 | |
| | | | | | | | | | | | | | | | | |
The accompanying notes are an integral part of these financial statements.
DIREXION ANNUAL REPORT 21
Direxion Monthly 10 Year Note Bull 2X Fund
Schedule of Investments
August 31, 2010
| | | | | | | | | |
| Shares | | | | | Value | |
| |
SHORT TERM INVESTMENTS - 97.7% |
MONEY MARKET FUNDS - 97.7% |
| | 5,048,669 | | | Fidelity Institutional Government Portfolio, 0.06% (a) | | $ | 5,048,669 | |
| | 5,048,669 | | | Fidelity Institutional Money Market Portfolio, 0.23% (a) | | | 5,048,669 | |
| | 5,048,670 | | | Goldman Sachs Financial Square Federal Fund, 0.04% (a) | | | 5,048,670 | |
| | 15,418,670 | | | Goldman Sachs Financial Square Government Fund, 0.10% (a)(b) | | | 15,418,670 | |
| | 5,048,670 | | | Morgan Stanley Institutional Liquidity Fund - Treasury Portfolio, 0.06% (a) | | | 5,048,670 | |
| | | | | | | | | |
| | | | | TOTAL SHORT TERM INVESTMENTS
(Cost $35,613,348) | | $ | 35,613,348 | |
| | | | | | | | | |
| | | | | TOTAL INVESTMENTS
(Cost $35,613,348) - 97.7% | | $ | 35,613,348 | |
| | | | | Other Assets in Excess of Liabilities - 2.3% | | | 843,759 | |
| | | | | | | | | |
| | | | | TOTAL NET ASSETS - 100.0% | | $ | 36,457,107 | |
| | | | | | | | | |
Percentages are stated as a percent of net assets.
| |
| (a) | Represents annualized seven-day yield at August 31, 2010. |
| |
| (b) | $10,370,000 of this security is held as collateral for swap contracts. |
Direxion Monthly 10 Year Note Bull 2X Fund
Long Equity Swap Contracts
August 31, 2010
| | | | | | | | | | | | | | | | | |
| | | | | Number of
| | Notional
| | | Termination
| | | Unrealized
| |
Counterparty | | Reference Entity | | Contracts | | Amount | | | Date | | | Appreciation | |
| |
| Credit Suisse Capital, LLC | | NYSE Current 10 Year U.S. Treasury Index | | 66,480 | | $ | 72,261,378 | | | | 2/21/2012 | | | $ | 611,599 | |
| | | | | | | | | | | | | | | | | |
The accompanying notes are an integral part of these financial statements.
22 DIREXION ANNUAL REPORT
Direxion Monthly 10 Year Note Bear 2X Fund
Schedule of Investments
August 31, 2010
| | | | | | | | | |
| Shares | | | | | Value | |
| |
SHORT TERM INVESTMENTS - 109.0% |
MONEY MARKET FUNDS - 109.0% |
| | 2,229,523 | | | Fidelity Institutional Government Portfolio, 0.06% (a) | | $ | 2,229,523 | |
| | 2,229,523 | | | Fidelity Institutional Money Market Portfolio, 0.23% (a) | | | 2,229,523 | |
| | 2,229,523 | | | Goldman Sachs Financial Square Federal Fund, 0.04% (a) | | | 2,229,523 | |
| | 8,544,524 | | | Goldman Sachs Financial Square Government Fund, 0.10% (a)(b) | | | 8,544,524 | |
| | 2,229,524 | | | Morgan Stanley Institutional Liquidity Fund - Treasury Portfolio, 0.06% (a) | | | 2,229,524 | |
| | | | | | | | | |
| | | | | TOTAL SHORT TERM INVESTMENTS
(Cost $17,462,617) | | $ | 17,462,617 | |
| | | | | | | | | |
| | | | | TOTAL INVESTMENTS
(Cost $17,462,617) - 109.0% | | $ | 17,462,617 | |
| | | | | Other Liabilities in Excess of Assets - (9.0)% | | | (1,439,089 | ) |
| | | | | | | | | |
| | | | | TOTAL NET ASSETS - 100.0% | | $ | 16,023,528 | |
| | | | | | | | | |
Percentages are stated as a percent of net assets.
| |
| (a) | Represents annualized seven-day yield at August 31, 2010. |
| |
| (b) | $6,315,000 of this security is held as collateral for swap contracts. |
Direxion Monthly 10 Year Note Bear 2X Fund
Short Equity Swap Contracts
August 31, 2010
| | | | | | | | | | | | | | | | | |
| | | | | Number of
| | Notional
| | | Termination
| | | Unrealized
| |
Counterparty | | Reference Entity | | Contracts | | Amount | | | Date | | | Depreciation | |
| |
| Credit Suisse Capital, LLC | | NYSE Current 10 Year U.S. Treasury Index | | 29,220 | | $ | 31,120,052 | | | | 6/30/2011 | | | $ | (916,299 | ) |
| | | | | | | | | | | | | | | | | |
The accompanying notes are an integral part of these financial statements.
DIREXION ANNUAL REPORT 23
Dynamic HY Bond Fund
Schedule of Investments
August 31, 2010
| | | | | | | | | |
| Shares | | | | | Value | |
| |
SHORT TERM INVESTMENTS - 45.0% |
MONEY MARKET FUNDS - 45.0% |
| | 694,192 | | | Fidelity Institutional Government Portfolio, 0.06% (a) | | $ | 694,192 | |
| | 694,192 | | | Fidelity Institutional Money Market Portfolio, 0.23% (a) | | | 694,192 | |
| | 694,192 | | | Goldman Sachs Financial Square Federal Fund, 0.04% (a) | | | 694,192 | |
| | 694,191 | | | Goldman Sachs Financial Square Government Fund, 0.10% (a) | | | 694,191 | |
| | 694,191 | | | Morgan Stanley Institutional Liquidity Fund - Treasury Portfolio, 0.06% (a) | | | 694,191 | |
| | | | | | | | | |
| | | | | TOTAL SHORT TERM INVESTMENTS
(Cost $3,470,958) | | $ | 3,470,958 | |
| | | | | | | | | |
| | | | | TOTAL INVESTMENTS
(Cost $3,470,958) - 45.0% | | $ | 3,470,958 | |
| | | | | Other Assets in Excess of Liabilities - 55.0% | | | 4,236,771 | |
| | | | | | | | | |
| | | | | TOTAL NET ASSETS - 100.0% | | $ | 7,707,729 | |
| | | | | | | | | |
Percentages are stated as a percent of net assets.
| |
| (a) | Represents annualized seven-day yield at August 31, 2010. |
Dynamic HY Bond Fund
Futures Contracts
August 31, 2010
| | | | | | | | | |
| | | | | | Unrealized
| |
Contracts | | | | | Appreciation | |
| |
| | 7 | | | E-Mini S&P 500 Futures | | | | |
| | | | | Expiring September 2010 (Underlying Face Amount at Market Value $366,975) | | $ | 245 | |
| | | | | | | | | |
Dynamic HY Bond Fund
Credit Default Swap Contracts — Sell Protection1
August 31, 2010
| | | | | | | | | | | | | | | | | | | | | | | | | | | |
| | | | | Implied
| | | Receive
| | | | | | | | | Upfront
| | | | |
| | | | | Credit
| | | Fixed
| | | Termination
| | | Notional
| | | Payments
| | | Unrealized
| |
Counterparty | | Reference Entity | | Spread2 | | | Rate | | | Date | | | Amount3 | | | Received | | | Depreciation | |
| |
| Barclays Capital | | Markit CDX North American High Yield Index | | | 6.07 | % | | | 5.00 | % | | | 6/20/2015 | | | $ | 5,450,000 | | | $ | (122,376 | ) | | $ | (49,299 | ) |
| | | | | | | | | | | | | | | | | | | | | | | | | | | |
| |
| 1 | If the Fund is a seller of protection and a credit event occurs, i.e., bankruptcy or failure to pay, as defined under the terms of that particular swap agreement, the Fund will either (i) pay to the buyer of protection an amount equal to the notional amount of the swap and take delivery of the reference obligations or underlying securities comprising the reference index or (ii) pay a net settlement amount in the form of cash or securities equal to the notional amount of the swap less the recovery value of the reference obligation or underlying securities comprising the reference index. |
| |
| 2 | Implied credit spreads, represented in absolute terms, are utilized in determining the market value of credit default swap agreements on corporate issues or sovereign issues as of period end, and serve as an indicator of the current status of the payment/performance risk and represent the likelihood or risk of default. The implied credit spread of a particular reference entity reflects the cost of buying/selling protection and may include upfront payments required to be made to enter into the agreement. Wider credit spreads represent a deterioration of the reference entity’s credit soundness and a greater likelihood or risk of default or other credit event occurring as defined under the terms of the agreement. A credit spread identified as “Defaulted” indicates a credit event has occurred for the reference entity or obligation. |
| |
| 3 | The maximum potential amount (if, after a credit event the value of the related obligation or obligations were determined to have a value of zero) the Fund could be required to pay as seller of credit protection or entitled to as a buyer of credit protection if a credit event occurs as defined under the terms of that particular swap agreement. |
The accompanying notes are an integral part of these financial statements.
24 DIREXION ANNUAL REPORT
HY Bear Fund
Schedule of Investments
August 31, 2010
| | | | | | | | | |
| Shares | | | | | Value | |
| |
SHORT TERM INVESTMENTS - 87.3% |
MONEY MARKET FUNDS - 87.3% |
| | 7,837,858 | | | Fidelity Institutional Government Portfolio, 0.06% (a) | | $ | 7,837,858 | |
| | 7,837,858 | | | Fidelity Institutional Money Market Portfolio, 0.23% (a) | | | 7,837,858 | |
| | 7,837,858 | | | Goldman Sachs Financial Square Federal Fund, 0.04% (a) | | | 7,837,858 | |
| | 7,837,858 | | | Goldman Sachs Financial Square Government Fund, 0.10% (a) | | | 7,837,858 | |
| | 7,837,858 | | | Morgan Stanley Institutional Liquidity Fund - Treasury Portfolio, 0.06% (a) | | | 7,837,858 | |
| | | | | | | | | |
| | | | | TOTAL SHORT TERM INVESTMENTS
(Cost $39,189,290) | | $ | 39,189,290 | |
| | | | | | | | | |
| | | | | TOTAL INVESTMENTS
(Cost $39,189,290) - 87.3% | | $ | 39,189,290 | |
| | | | | Other Assets in Excess of
Liabilities - 12.7% | | | 5,707,053 | |
| | | | | | | | | |
| | | | | TOTAL NET ASSETS - 100.0% | | $ | 44,896,343 | |
| | | | | | | | | |
Percentages are stated as a percent of net assets.
| |
| (a) | Represents annualized seven-day yield at August 31, 2010. |
HY Bear Fund
Short Futures Contracts
August 31, 2010
| | | | | | | | | |
| | | | | | Unrealized
| |
Contracts | | | | | Appreciation | |
| |
| | 81 | | | E-Mini S&P 500 Futures
Expiring September 2010 (Underlying Face Amount at Market Value $4,246,425) | | $ | 52,081 | |
| | | | | | | | | |
HY Bear Fund
Credit Default Swap Contracts — Buy Protection1
August 31, 2010
| | | | | | | | | | | | | | | | | | | | | | | | | | | |
| | | | | Implied
| | | Receive
| | | | | | | | | Upfront
| | | Unrealized
| |
| | | | | Credit
| | | Fixed
| | | Termination
| | | Notional
| | | Payments
| | | Appreciation/
| |
Counterparty | | Reference Entity | | Spread2 | | | Rate | | | Date | | | Amount3 | | | Paid | | | (Depreciation) | |
| |
| Bank of America Merrill Lynch | | Markit CDX North American High Yield Index | | | 6.07 | % | | | 5.00 | % | | | 6/20/2015 | | | $ | 26,400,000 | | | $ | 805,081 | | | $ | 26,519 | |
| Barclays Capital | | Markit CDX North American High Yield Index | | | 6.07 | % | | | 5.00 | % | | | 6/20/2015 | | | | 4,200,000 | | | | 94,053 | | | | 38,247 | |
| Credit Suisse Capital, LLC | | Markit CDX North American High Yield Index | | | 6.07 | % | | | 5.00 | % | | | 6/20/2015 | | | | 5,600,000 | | | | 204,272 | | | | (27,873 | ) |
| | | | | | | | | | | | | | | | | | | | | | | | | | | |
| | | | | | | | | | | | | | | | | $ | 36,200,000 | | | $ | 1,103,406 | | | $ | 36,893 | |
| | | | | | | | | | | | | | | | | | | | | | | | | | | |
| |
| 1 | If the Fund is a buyer of protection and a credit event occurs, i.e., bankruptcy or failure to pay, as defined under the terms of that particular swap agreement, the Fund will either (i) receive from the seller of protection an amount equal to the notional amount of the swap and deliver the reference obligations or underlying securities comprising the reference index or (ii) receive a net settlement amount in the form of cash or securities equal to the notional amount of the swap less the recovery value of the reference obligation or underlying securities comprising the reference index. |
| |
| 2 | Implied credit spreads, represented in absolute terms, are utilized in determining the market value of credit default swap agreements on corporate issues or sovereign issues as of period end, and serve as an indicator of the current status of the payment/performance risk and represent the likelihood or risk of default. The implied credit spread of a particular reference entity reflects the cost of buying/selling protection and may include upfront payments required to be made to enter into the agreement. Wider credit spreads represent a deterioration of the reference entity’s credit soundness and a greater likelihood or risk of default or other credit event occurring as defined under the terms of the agreement. A credit spread identified as “Defaulted” indicates a credit event has occurred for the reference entity or obligation. |
| |
| 3 | The maximum potential amount (if, after a credit event the value of the related obligation or obligations were determined to have a value of zero) the Fund could be required to pay as seller of credit protection or entitled to as a buyer of credit protection if a credit event occurs as defined under the terms of that particular swap agreement. |
The accompanying notes are an integral part of these financial statements.
DIREXION ANNUAL REPORT 25
Direxion Monthly Commodity Bull 2X Fund
Schedule of Investments
August 31, 2010
| | | | | | | | | |
| Shares | | | | | Value | |
| |
SHORT TERM INVESTMENTS - 97.5% |
MONEY MARKET FUNDS - 97.5% |
| | 1,732,160 | | | Fidelity Institutional Government Portfolio, 0.06% (a) | | $ | 1,732,160 | |
| | 1,732,160 | | | Fidelity Institutional Money Market Portfolio, 0.23% (a) | | | 1,732,160 | |
| | 1,732,160 | | | Goldman Sachs Financial Square Federal Fund, 0.04% (a) | | | 1,732,160 | |
| | 13,505,896 | | | Goldman Sachs Financial Square Government Fund, 0.10% (a)(b) | | | 13,505,896 | |
| | 1,732,159 | | | Morgan Stanley Institutional Liquidity Fund - Treasury Portfolio, 0.06% (a) | | | 1,732,159 | |
| | | | | | | | | |
| | | | | TOTAL SHORT TERM INVESTMENTS (Cost $20,434,535) | | $ | 20,434,535 | |
| | | | | | | | | |
| | | | | TOTAL INVESTMENTS (Cost $20,434,535) - 97.5% | | $ | 20,434,535 | |
| | | | | Other Assets in Excess of Liabilities - 2.5% | | | 534,019 | |
| | | | | | | | | |
| | | | | TOTAL NET ASSETS - 100.0% | | $ | 20,968,554 | |
| | | | | | | | | |
Percentages are stated as a percent of net assets.
| |
| (a) | Represents annualized seven-day yield at August 31, 2010. |
| |
| (b) | $11,773,737 of this security is held as collateral for swap contracts. |
Direxion Monthly Commodity Bull 2X Fund
Long Equity Swap Contracts
August 31, 2010
| | | | | | | | | | | | | | | | | | | |
| | | | | | | | | | | | | | Unrealized
| |
| | | | | Number of
| | | Notional
| | | Termination
| | | Appreciation/
| |
Counterparty | | Reference Entity | | Contracts | | | Amount | | | Date | | | (Depreciation) | |
| |
| Bank of America Merrill Lynch | | Morgan Stanley Commodity Related Equity Index | | | 37,420 | | | $ | 31,153,647 | | | | 5/6/2011 | | | $ | (3,230,475 | ) |
| Bank of America Merrill Lynch | | Morgan Stanley Commodity Related Equity Index | | | 290 | | | | 241,444 | | | | 5/9/2011 | | | | (25,057 | ) |
| Bank of America Merrill Lynch | | Morgan Stanley Commodity Related Equity Index | | | 870 | | | | 726,700 | | | | 5/10/2011 | | | | (77,535 | ) |
| Bank of America Merrill Lynch | | Morgan Stanley Commodity Related Equity Index | | | 800 | | | | 650,122 | | | | 5/20/2011 | | | | (53,166 | ) |
| Bank of America Merrill Lynch | | Morgan Stanley Commodity Related Equity Index | | | 240 | | | | 198,867 | | | | 5/23/2011 | | | | (19,810 | ) |
| Bank of America Merrill Lynch | | Morgan Stanley Commodity Related Equity Index | | | 230 | | | | 190,842 | | | | 5/30/2011 | | | | (19,335 | ) |
| Bank of America Merrill Lynch | | Morgan Stanley Commodity Related Equity Index | | | 785 | | | | 639,754 | | | | 5/31/2011 | | | | (54,354 | ) |
| Bank of America Merrill Lynch | | Morgan Stanley Commodity Related Equity Index | | | 295 | | | | 232,316 | | | | 6/10/2011 | | | | (12,384 | ) |
| Bank of America Merrill Lynch | | Morgan Stanley Commodity Related Equity Index | | | 660 | | | | 471,568 | | | | 6/20/2011 | | | | 20,186 | |
| Bank of America Merrill Lynch | | Morgan Stanley Commodity Related Equity Index | | | 410 | | | | 288,517 | | | | 7/5/2011 | | | | 16,889 | |
| Bank of America Merrill Lynch | | Morgan Stanley Commodity Related Equity Index | | | 100 | | | | 73,585 | | | | 7/15/2011 | | | | 884 | |
| Bank of America Merrill Lynch | | Morgan Stanley Commodity Related Equity Index | | | 700 | | | | 489,342 | | | | 7/25/2011 | | | | 32,164 | |
| Bank of America Merrill Lynch | | Morgan Stanley Commodity Related Equity Index | | | 220 | | | | 150,708 | | | | 8/2/2011 | | | | 13,217 | |
| Bank of America Merrill Lynch | | Morgan Stanley Commodity Related Equity Index | | | 10,880 | | | | 8,122,335 | | | | 8/15/2011 | | | | (17,647 | ) |
| Bank of America Merrill Lynch | | Morgan Stanley Commodity Related Equity Index | | | 780 | | | | 604,771 | | | | 9/6/2011 | | | | (23,808 | ) |
| Bank of America Merrill Lynch | | Morgan Stanley Commodity Related Equity Index | | | 650 | | | | 504,248 | | | | 9/9/2011 | | | | (20,135 | ) |
| Bank of America Merrill Lynch | | Morgan Stanley Commodity Related Equity Index | | | 1,040 | | | | 798,859 | | | | 9/19/2011 | | | | (24,855 | ) |
| | | | | | | | | | | | | | | | | | | |
| | | | | | 56,370 | | | $ | 45,537,625 | | | | | | | $ | (3,495,221 | ) |
| | | | | | | | | | | | | | | | | | | |
The accompanying notes are an integral part of these financial statements.
26 DIREXION ANNUAL REPORT
Direxion Monthly Emerging Markets Bull 2X Fund
Schedule of Investments
August 31, 2010
| | | | | | | | | |
| Shares | | | | | Value | |
| |
SHORT TERM INVESTMENTS - 76.5% |
MONEY MARKET FUNDS - 76.5% |
| | 1,622,038 | | | Fidelity Institutional Government Portfolio, 0.06% (a) | | $ | 1,622,038 | |
| | 1,622,038 | | | Fidelity Institutional Money Market Portfolio, 0.23% (a) | | | 1,622,038 | |
| | 1,622,039 | | | Goldman Sachs Financial Square Federal Fund, 0.04% (a) | | | 1,622,039 | |
| | 16,428,570 | | | Goldman Sachs Financial Square Government Fund, 0.10% (a)(b) | | | 16,428,570 | |
| | 1,622,039 | | | Morgan Stanley Institutional Liquidity Fund - Treasury Portfolio, 0.06% (a) | | | 1,622,039 | |
| | | | | | | | | |
| | | | | TOTAL SHORT TERM INVESTMENTS (Cost $22,916,724) | | $ | 22,916,724 | |
| | | | | | | | | |
| | | | | TOTAL INVESTMENTS
(Cost $22,916,724) - 76.5% | | $ | 22,916,724 | |
| | | | | Other Assets in Excess of Liabilities - 23.5% | | | 7,024,913 | |
| | | | | | | | | |
| | | | | TOTAL NET ASSETS - 100.0% | | $ | 29,941,637 | |
| | | | | | | | | |
Percentages are stated as a percent of net assets.
| |
| (a) | Represents annualized seven-day yield at August 31, 2010. |
| |
| (b) | $14,806,532 of this security is held as collateral for swap contracts. |
Direxion Monthly Emerging Markets Bull 2X Fund
Long Equity Swap Contracts
August 31, 2010
| | | | | | | | | | | | | | | | | | | |
| | | | | | | | | | | | | | Unrealized
| |
| | | | | Number of
| | | Notional
| | | Termination
| | | Appreciation/
| |
Counterparty | | Reference Entity | | Contracts | | | Amount | | | Date | | | (Depreciation) | |
| |
| Bank of America Merrill Lynch | | iShares MSCI Emerging Market Index Fund | | | 142,200 | | | $ | 5,992,090 | | | | 9/5/2011 | | | $ | (298,627 | ) |
| Bank of America Merrill Lynch | | iShares MSCI Emerging Market Index Fund | | | 605,994 | | | | 25,623,077 | | | | 9/6/2011 | | | | (1,360,087 | ) |
| Bank of America Merrill Lynch | | iShares MSCI Emerging Market Index Fund | | | 27,500 | | | | 1,162,951 | | | | 9/9/2011 | | | | (61,826 | ) |
| Bank of America Merrill Lynch | | iShares MSCI Emerging Market Index Fund | | | 120,400 | | | | 4,861,520 | | | | 9/12/2011 | | | | (39,813 | ) |
| Bank of America Merrill Lynch | | iShares MSCI Emerging Market Index Fund | | | 340,700 | | | | 14,013,490 | | | | 9/19/2011 | | | | (366,002 | ) |
| Bank of America Merrill Lynch | | iShares MSCI Emerging Market Index Fund | | | 24,600 | | | | 974,652 | | | | 9/26/2011 | | | | 10,980 | |
| Bank of America Merrill Lynch | | iShares MSCI Emerging Market Index Fund | | | 8,800 | | | | 356,400 | | | | 9/27/2011 | | | | (3,806 | ) |
| Bank of America Merrill Lynch | | iShares MSCI Emerging Market Index Fund | | | 69,400 | | | | 2,765,449 | | | | 9/30/2011 | | | | 15,324 | |
| Bank of America Merrill Lynch | | iShares MSCI Emerging Market Index Fund | | | 155,300 | | | | 6,223,921 | | | | 10/3/2011 | | | | (1,050 | ) |
| | | | | | | | | | | | | | | | | | | |
| | | | | | 1,494,894 | | | $ | 61,973,550 | | | | | | | $ | (2,104,907 | ) |
| | | | | | | | | | | | | | | | | | | |
The accompanying notes are an integral part of these financial statements.
DIREXION ANNUAL REPORT 27
Direxion Monthly Emerging Markets Bear 2X Fund
Schedule of Investments
August 31, 2010
| | | | | | | | | |
| Shares | | | | | Value | |
| |
SHORT TERM INVESTMENTS - 98.6% |
MONEY MARKET FUNDS - 98.6% |
| | 304,590 | | | Fidelity Institutional Government Portfolio, 0.06% (a) | | $ | 304,590 | |
| | 304,590 | | | Fidelity Institutional Money Market Portfolio, 0.23% (a) | | | 304,590 | |
| | 304,590 | | | Goldman Sachs Financial Square Federal Fund, 0.04% (a) | | | 304,590 | |
| | 5,470,834 | | | Goldman Sachs Financial Square Government Fund, 0.10% (a)(b) | | | 5,470,834 | |
| | 304,589 | | | Morgan Stanley Institutional Liquidity Fund - Treasury Portfolio, 0.06% (a) | | | 304,589 | |
| | | | | | | | | |
| | | | | TOTAL SHORT TERM INVESTMENTS
(Cost $6,689,193) | | $ | 6,689,193 | |
| | | | | | | | | |
| | | | | TOTAL INVESTMENTS
(Cost $6,689,193) - 98.6% | | $ | 6,689,193 | |
| | | | | Other Assets in Excess of Liabilities - 1.4% | | | 94,001 | |
| | | | | | | | | |
| | | | | TOTAL NET ASSETS - 100.0% | | $ | 6,783,194 | |
| | | | | | | | | |
Percentages are stated as a percent of net assets.
| |
| (a) | Represents annualized seven-day yield at August 31, 2010. |
| |
| (b) | $5,166,244 of this security is held as collateral for swap contracts. |
Direxion Monthly Emerging Markets Bear 2X Fund
Short Equity Swap Contracts
August 31, 2010
| | | | | | | | | | | | | | | | | | | |
| | | | | | | | | | | | | | Unrealized
| |
| | | | | Number of
| | | Notional
| | | Termination
| | | Appreciation/
| |
Counterparty | | Reference Entity | | Contracts | | | Amount | | | Date | | | (Depreciation) | |
| |
| Bank of America Merrill Lynch | | iShares MSCI Emerging Market Index Fund | | | 131,430 | | | $ | 5,379,322 | | | | 9/19/2011 | | | $ | 112,833 | |
| Bank of America Merrill Lynch | | iShares MSCI Emerging Market Index Fund | | | 121,600 | | | | 4,846,425 | | | | 9/26/2011 | | | | (26,098 | ) |
| Bank of America Merrill Lynch | | iShares MSCI Emerging Market Index Fund | | | 61,600 | | | | 2,494,372 | | | | 9/27/2011 | | | | 26,060 | |
| Bank of America Merrill Lynch | | iShares MSCI Emerging Market Index Fund | | | 24,300 | | | | 973,701 | | | | 10/3/2011 | | | | — | |
| | | | | | | | | | | | | | | | | | | |
| | | | | | 338,930 | | | $ | 13,693,820 | | | | | | | $ | 112,795 | |
| | | | | | | | | | | | | | | | | | | |
The accompanying notes are an integral part of these financial statements.
28 DIREXION ANNUAL REPORT
Direxion Monthly Developed Markets Bull 2X Fund
Schedule of Investments
August 31, 2010
| | | | | | | | | |
| Shares | | | | | Value | |
| |
SHORT TERM INVESTMENTS - 121.7% |
MONEY MARKET FUNDS - 121.7% |
| | 393,800 | | | Fidelity Institutional Government Portfolio, 0.06% (a) | | $ | 393,800 | |
| | 393,800 | | | Fidelity Institutional Money Market Portfolio, 0.23% (a) | | | 393,800 | |
| | 393,800 | | | Goldman Sachs Financial Square Federal Fund, 0.04% (a) | | | 393,800 | |
| | 1,303,800 | | | Goldman Sachs Financial Square Government Fund, 0.10% (a)(b) | | | 1,303,800 | |
| | 393,800 | | | Morgan Stanley Institutional Liquidity Fund - Treasury Portfolio, 0.06% (a) | | | 393,800 | |
| | | | | | | | | |
| | | | | TOTAL SHORT TERM INVESTMENTS
(Cost $2,879,000) | | $ | 2,879,000 | |
| | | | | | | | | |
| | | | | TOTAL INVESTMENTS
(Cost $2,879,000) - 121.7% | | $ | 2,879,000 | |
| | | | | Other Liabilities in Excess of Assets - (21.7)% | | | (513,213 | ) |
| | | | | | | | | |
| | | | | TOTAL NET ASSETS - 100.0% | | $ | 2,365,787 | |
| | | | | | | | | |
Percentages are stated as a percent of net assets.
| |
| (a) | Represents annualized seven-day yield at August 31, 2010. |
| |
| (b) | $910,000 of this security is held as collateral for swap contracts. |
Direxion Monthly Developed Markets Bull 2X Fund
Long Equity Swap Contracts
August 31, 2010
| | | | | | | | | | | | | | | | | | | |
| | | | | Number of
| | | Notional
| | | Termination
| | | Unrealized
| |
Counterparty | | Reference Entity | | Contracts | | | Amount | | | Date | | | Depreciation | |
| |
| Credit Suisse Capital, LLC | | iShares MSCI EAFE Index Fund | | | 94,770 | | | $ | 4,969,270 | | | | 2/6/2012 | | | $ | (236,886 | ) |
| | | | | | | | | | | | | | | | | | | |
The accompanying notes are an integral part of these financial statements.
DIREXION ANNUAL REPORT 29
Direxion Monthly Developed Markets Bear 2X Fund
Schedule of Investments
August 31, 2010
| | | | | | | | | |
| Shares | | | | | Value | |
| |
SHORT TERM INVESTMENTS - 97.1% |
MONEY MARKET FUNDS - 97.1% |
| | 1,187,744 | | | Fidelity Institutional Government Portfolio, 0.06% (a) | | $ | 1,187,744 | |
| | 1,187,744 | | | Fidelity Institutional Money Market Portfolio, 0.23% (a) | | | 1,187,744 | |
| | 1,187,744 | | | Goldman Sachs Financial Square Federal Fund, 0.04% (a) | | | 1,187,744 | |
| | 2,497,743 | | | Goldman Sachs Financial Square Government Fund, 0.10% (a)(b) | | | 2,497,743 | |
| | 1,187,744 | | | Morgan Stanley Institutional Liquidity Fund - Treasury Portfolio, 0.06% (a) | | | 1,187,744 | |
| | | | | | | | | |
| | | | | TOTAL SHORT TERM INVESTMENTS (Cost $7,248,719) | | $ | 7,248,719 | |
| | | | | | | | | |
| | | | | TOTAL INVESTMENTS
(Cost $7,248,719) - 97.1% | | $ | 7,248,719 | |
| | | | | Other Assets in Excess of Liabilities - 2.9% | | | 217,381 | |
| | | | | | | | | |
| | | | | TOTAL NET ASSETS - 100.0% | | $ | 7,466,100 | |
| | | | | | | | | |
Percentages are stated as a percent of net assets.
| |
| (a) | Represents annualized seven-day yield at August 31, 2010. |
| |
| (b) | $1,310,000 of this security is held as collateral for swap contracts. |
Direxion Monthly Developed Markets Bear 2X Fund
Short Equity Swap Contracts
August 31, 2010
| | | | | | | | | | | | | | | | | | | |
| | | | | Number of
| | | Notional
| | | Termination
| | | Unrealized
| |
Counterparty | | Reference Entity | | Contracts | | | Amount | | | Date | | | Appreciation | |
| |
| Credit Suisse Capital, LLC | | iShares MSCI EAFE Index Fund | | | 299,020 | | | $ | 15,069,170 | | | | 1/3/2012 | | | $ | 133,881 | |
| | | | | | | | | | | | | | | | | | | |
The accompanying notes are an integral part of these financial statements.
30 DIREXION ANNUAL REPORT
Direxion Monthly China Bull 2X Fund
Schedule of Investments
August 31, 2010
| | | | | | | | | |
| Shares | | | | | Value | |
| |
SHORT TERM INVESTMENTS - 115.4% |
MONEY MARKET FUNDS - 115.4% |
| | 1,792,344 | | | Fidelity Institutional Government Portfolio, 0.06% (a) | | $ | 1,792,344 | |
| | 1,792,344 | | | Fidelity Institutional Money Market Portfolio, 0.23% (a) | | | 1,792,344 | |
| | 1,792,344 | | | Goldman Sachs Financial Square Federal Fund, 0.04% (a) | | | 1,792,344 | |
| | 5,742,344 | | | Goldman Sachs Financial Square Government Fund, 0.10% (a)(b) | | | 5,742,344 | |
| | 1,792,343 | | | Morgan Stanley Institutional Liquidity Fund - Treasury Portfolio, 0.06% (a) | | | 1,792,343 | |
| | | | | | | | | |
| | | | | TOTAL SHORT TERM INVESTMENTS (Cost $12,911,719) | | $ | 12,911,719 | |
| | | | | | | | | |
| | | | | TOTAL INVESTMENTS
(Cost $12,911,719) - 115.4% | | $ | 12,911,719 | |
| | | | | Liabilities in Excess of Other Assets - (15.4)% | | | (1,721,134 | ) |
| | | | | | | | | |
| | | | | TOTAL NET ASSETS - 100.0% | | $ | 11,190,585 | |
| | | | | | | | | |
Percentages are stated as a percent of net assets.
| |
| (a) | Represents annualized seven-day yield at August 31, 2010. |
| |
| (b) | $3,950,000 of this security is held as collateral for swap contracts. |
Direxion Monthly China Bull 2X Fund
Long Equity Swap Contracts
August 31, 2010
| | | | | | | | | | | | | | | | | | | |
| | | | | Number of
| | | Notional
| | | Termination
| | | Unrealized
| |
Counterparty | | Reference Entity | | Contracts | | | Amount | | | Date | | | Depreciation | |
| |
| Credit Suisse Capital, LLC | | iShares FTSE/Xinhua China 25 Index Fund | | | 569,550 | | | $ | 23,665,132 | | | | 2/6/2012 | | | $ | (1,278,765 | ) |
| | | | | | | | | | | | | | | | | | | |
The accompanying notes are an integral part of these financial statements.
DIREXION ANNUAL REPORT 31
U.S. Government Money Market Fund
Schedule of Investments
August 31, 2010
| | | | | | | | | |
| Shares | | | | | Value | |
| |
SHORT TERM INVESTMENTS - 95.9% |
MONEY MARKET FUNDS - 95.9% |
| | 11,652,504 | | | Fidelity Institutional Government Portfolio, 0.06% (a) | | $ | 11,652,504 | |
| | 11,652,504 | | | Fidelity Institutional Money Market Portfolio, 0.23% (a) | | | 11,652,504 | |
| | 11,652,504 | | | Goldman Sachs Financial Square Federal Fund, 0.04% (a) | | | 11,652,504 | |
| | 11,652,505 | | | Goldman Sachs Financial Square Government Fund, 0.10% (a) | | | 11,652,505 | |
| | 11,652,504 | | | Morgan Stanley Institutional Liquidity Fund - Treasury Portfolio, 0.06% (a) | | | 11,652,504 | |
| | | | | | | | | |
| | | | | TOTAL SHORT TERM INVESTMENTS
(Cost $58,262,521) | | $ | 58,262,521 | |
| | | | | | | | | |
| | | | | TOTAL INVESTMENTS
(Cost $58,262,521) - 95.9% | | $ | 58,262,521 | |
| | | | | Assets in Excess of Other Liabilities - 4.1% | | | 2,478,125 | |
| | | | | | | | | |
| | | | | TOTAL NET ASSETS - 100.0% | | $ | 60,740,646 | |
| | | | | | | | | |
Percentages are stated as a percent of net assets.
| |
| (a) | Represents annualized seven-day yield at August 31, 2010. |
The accompanying notes are an integral part of these financial statements.
32 DIREXION ANNUAL REPORT
Statements of Assets and Liabilities
August 31, 2010
| | | | | | | | | | | | | | | | | |
| | | Direxion Monthly
| | | Direxion Monthly
| | | Direxion Monthly
| | | Direxion Monthly
| |
| | | Small Cap Bull
| | | Small Cap Bear
| | | 10 Year Note Bull
| | | 10 Year Note Bear
| |
| | | 2X Fund | | | 2X Fund | | | 2X Fund | | | 2X Fund | |
| |
Assets: | | | | | | | | | | | | | | | | |
| Investments, at market value (Note 2) | | $ | 7,561,550 | | | $ | 32,153,328 | | | $ | 35,613,348 | | | $ | 17,462,617 | |
| Receivable for Fund shares sold | | | 203,096 | | | | 306,741 | | | | 625,642 | | | | 12,899 | |
| Unrealized appreciation on swaps | | | — | | | | 671,873 | | | | 611,599 | | | | — | |
| Dividends and interest receivable | | | 352 | | | | 1,003 | | | | 1,191 | | | | 882 | |
| | | | | | | | | | | | | | | | | |
| Total Assets | | | 7,764,998 | | | | 33,132,945 | | | | 36,851,780 | | | | 17,476,398 | |
| | | | | | | | | | | | | | | | | |
Liabilities: | | | | | | | | | | | | | | | | |
| Payable for Fund shares redeemed | | | 89,516 | | | | 74,035 | | | | 62,375 | | | | 309,481 | |
| Due to broker for swaps | | | 132,762 | | | | — | | | | — | | | | 195,307 | |
| Unrealized depreciation on swaps | | | 1,019,943 | | | | — | | | | — | | | | 916,299 | |
| Deposits from broker for swaps | | | — | | | | 710,000 | | | | 280,000 | | | | — | |
| Accrued investment advisory fees | | | 5,016 | | | | 19,564 | | | | 20,612 | | | | 12,546 | |
| Accrued operating services fees | | | 4,348 | | | | 16,956 | | | | 17,863 | | | | 10,873 | |
| Accrued distribution expenses | | | 1,672 | | | | 6,521 | | | | 6,870 | | | | 4,182 | |
| Accrued shareholder servicing fees | | | 1,672 | | | | 6,521 | | | | 6,870 | | | | 4,182 | |
| Other liabilities | | | — | | | | 2,261 | | | | 83 | | | | — | |
| | | | | | | | | | | | | | | | | |
| Total Liabilities | | | 1,254,929 | | | | 835,858 | | | | 394,673 | | | | 1,452,870 | |
| | | | | | | | | | | | | | | | | |
Net Assets | | $ | 6,510,069 | | | $ | 32,297,087 | | | $ | 36,457,107 | | | $ | 16,023,528 | |
| | | | | | | | | | | | | | | | | |
Net Assets Consist Of: | | | | | | | | | | | | | | | | |
| Capital stock | | $ | 27,885,809 | | | $ | 70,857,218 | | | $ | 34,000,785 | | | $ | 29,462,263 | |
| Undistributed net investment income | | | — | | | | — | | | | — | | | | — | |
| Undistributed (Accumulated) net realized gain (loss) | | | (20,355,797 | ) | | | (39,232,004 | ) | | | 1,844,723 | | | | (12,522,436 | ) |
| Net unrealized appreciation (depreciation): | | | | | | | | | | | | | | | | |
| Swaps | | | (1,019,943 | ) | | | 671,873 | | | | 611,599 | | | | (916,299 | ) |
| | | | | | | | | | | | | | | | | |
| Total Net Assets | | $ | 6,510,069 | | | $ | 32,297,087 | | | $ | 36,457,107 | | | $ | 16,023,528 | |
| | | | | | | | | | | | | | | | | |
Calculation of Net Asset Value Per Share - Investor Class: | | | | | | | | | | | | | | | | |
| Net assets | | $ | 6,510,069 | | | $ | 32,297,087 | | | $ | 36,457,107 | | | $ | 16,023,528 | |
Shares outstanding
(unlimited shares of beneficial interest authorized, no par value) | | | 243,102 | | | | 1,549,433 | | | | 1,154,853 | | | | 1,938,198 | |
| Net asset value, redemption price and offering price per share | | $ | 26.78 | | | $ | 20.84 | | | $ | 31.57 | | | $ | 8.27 | |
| | | | | | | | | | | | | | | | | |
| Cost of Investments | | $ | 7,561,550 | | | $ | 32,153,328 | | | $ | 35,613,348 | | | $ | 17,462,617 | |
The accompanying notes are an integral part of these financial statements.
DIREXION ANNUAL REPORT 33
Statements of Assets and Liabilities
August 31, 2010
| | | | | | | | | | | | | |
| | | | | | | | | Direxion Monthly
| |
| | | Dynamic HY
| | | HY Bear
| | | Commodity Bull
| |
| | | Bond Fund | | | Fund | | | 2X Fund | |
| |
Assets: | | | | | | | | | | | | |
| Investments, at market value (Note 2) | | $ | 3,470,958 | | | $ | 39,189,290 | | | $ | 20,434,535 | |
| Receivable for Fund shares sold | | | — | | | | 4,659,072 | | | | 10,103 | |
| Deposit at broker for futures | | | 58,544 | | | | 246,496 | | | | — | |
| Deposit at broker for swaps | | | 4,420,000 | | | | 2,410,000 | | | | 4,270,000 | |
| Due from broker for futures | | | — | | | | 95,504 | | | | — | |
| Due from broker for swaps | | | 25,556 | | | | — | | | | — | |
| Upfront payments paid for swaps | | | — | | | | 1,103,406 | | | | — | |
| Unrealized appreciation on swaps | | | — | | | | 64,766 | | | | — | |
| Variation margin receivable | | | 1,281 | | | | — | | | | — | |
| Dividends and interest receivable | | | 1,096 | | | | 605 | | | | 1,851 | |
| | | | | | | | | | | | | |
| Total Assets | | | 7,977,435 | | | | 47,769,139 | | | | 24,716,489 | |
| | | | | | | | | | | | | |
Liabilities: | | | | | | | | | | | | |
| Payable for Fund shares redeemed | | | 6,375 | | | | 2,705,814 | | | | 98,685 | |
| Due to broker for futures | | | 22,544 | | | | — | | | | | |
| Due to broker for swaps | | | 31,389 | | | | 93,333 | | | | 118,520 | |
| Upfront payments received for swaps | | | 122,376 | | | | — | | | | — | |
| Unrealized depreciation on swaps | | | 49,299 | | | | 27,873 | | | | 3,495,221 | |
| Variation margin payable | | | — | | | | 13,316 | | | | — | |
| Accrued investment advisory fees | | | 14,490 | | | | 12,813 | | | | 14,017 | |
| Accrued operating services fees | | | 11,592 | | | | 11,105 | | | | 12,148 | |
| Accrued distribution expense | | | 4,830 | | | | 4,271 | | | | 4,672 | |
| Accrued shareholder servicing fees | | | 4,830 | | | | 4,271 | | | | 4,672 | |
| Other liabilities | | | 1,981 | | | | — | | | | — | |
| | | | | | | | | | | | | |
| Total Liabilities | | | 269,706 | | | | 2,872,796 | | | | 3,747,935 | |
| | | | | | | | | | | | | |
Net Assets | | $ | 7,707,729 | | | $ | 44,896,343 | | | $ | 20,968,554 | |
| | | | | | | | | | | | | |
Net Assets Consist Of: | | | | | | | | | | | | |
| Capital stock | | $ | 8,587,616 | | | $ | 48,878,524 | | | $ | 52,029,872 | |
| Undistributed (Accumulated) net investment income (loss) | | | 455,006 | | | | (36,893 | ) | | | — | |
| Accumulated net realized loss | | | (1,285,839 | ) | | | (4,034,262 | ) | | | (27,566,097 | ) |
| Net unrealized appreciation (depreciation) on: | | | | | | | | | | | | |
| Futures | | | 245 | | | | 52,081 | | | | — | |
| Swaps | | | (49,299 | ) | | | 36,893 | | | | (3,495,221 | ) |
| | | | | | | | | | | | | |
| Total Net Assets | | $ | 7,707,729 | | | $ | 44,896,343 | | | $ | 20,968,554 | |
| | | | | | | | | | | | | |
Calculation of Net Asset Value Per Share - Investor Class: | | | | | | | | | | | | |
| Net assets | | $ | 7,707,729 | | | $ | 44,896,343 | | | $ | 20,968,554 | |
Shares outstanding
(unlimited shares of beneficial interest authorized, no par value) | | | 547,745 | | | | 2,969,394 | | | | 475,633 | |
| Net asset value, redemption price and offering price per share | | $ | 14.07 | | | $ | 15.12 | | | $ | 44.09 | |
| | | | | | | | | | | | | |
| Cost of Investments | | $ | 3,470,958 | | | $ | 39,189,290 | | | $ | 20,434,535 | |
The accompanying notes are an integral part of these financial statements.
34 DIREXION ANNUAL REPORT
Statements of Assets and Liabilities
August 31, 2010
| | | | | | | | | | | | | | | | | |
| | | Direxion Monthly
| | | Direxion Monthly
| | | Direxion Monthly
| | | Direxion Monthly
| |
| | | Emerging Markets
| | | Emerging Markets
| | | Developed Markets
| | | Developed Markets
| |
| | | Bull 2X Fund | | | Bear 2X Fund | | | Bull 2X Fund | | | Bear 2X Fund | |
| |
Assets: | | | | | | | | | | | | | | | | |
| Investments, at market value (Note 2) | | $ | 22,916,724 | | | $ | 6,689,193 | | | $ | 2,879,000 | | | $ | 7,248,719 | |
| Receivable for Fund shares sold | | | 6,895,177 | | | | 100,998 | | | | 17,500 | | | | 108,896 | |
| Deposit at broker for swaps | | | 2,690,000 | | | | — | | | | — | | | | — | |
| Due from broker for swaps | | | — | | | | 184,926 | | | | — | | | | — | |
| Unrealized appreciation on swaps | | | — | | | | 112,795 | | | | — | | | | 133,881 | |
| Dividends and interest receivable | | | 3,056 | | | | 532 | | | | 167 | | | | 145 | |
| | | | | | | | | | | | | | | | | |
| Total Assets | | | 32,504,957 | | | | 7,088,444 | | | | 2,896,667 | | | | 7,491,641 | |
| | | | | | | | | | | | | | | | | |
Liabilities: | | | | | | | | | | | | | | | | |
| Payable for Fund shares redeemed | | | 373,434 | | | | 173,192 | | | | 237,525 | | | | 18,988 | |
| Unrealized depreciation on swaps | | | 2,104,907 | | | | — | | | | 236,886 | | | | — | |
| Deposits from broker for swaps | | | — | | | | 120,000 | | | | — | | | | — | |
| Due to broker for swaps | | | 9,538 | | | | — | | | | 49,391 | | | | — | |
| Accrued investment advisory fees | | | 29,780 | | | | 4,746 | | | | 2,794 | | | | 2,587 | |
| Accrued operating services fees | | | 25,809 | | | | 4,113 | | | | 2,422 | | | | 2,242 | |
| Accrued distribution expense | | | 9,926 | | | | 1,582 | | | | 931 | | | | 862 | |
| Accrued shareholder servicing fees | | | 9,926 | | | | 1,582 | | | | 931 | | | | 862 | |
| Other liabilities | | | — | | | | 35 | | | | — | | | | — | |
| | | | | | | | | | | | | | | | | |
| Total Liabilities | | | 2,563,320 | | | | 305,250 | | | | 530,880 | | | | 25,541 | |
| | | | | | | | | | | | | | | | | |
Net Assets | | $ | 29,941,637 | | | $ | 6,783,194 | | | $ | 2,365,787 | | | $ | 7,466,100 | |
| | | | | | | | | | | | | | | | | |
Net Assets Consist Of: | | | | | | | | | | | | | | | | |
| Capital stock | | $ | 62,009,457 | | | $ | 24,872,786 | | | $ | 10,703,900 | | | $ | 12,554,687 | |
| Undistributed net investment income | | | — | | | | — | | | | — | | | | — | |
| Accumulated net realized loss | | | (29,962,913 | ) | | | (18,202,387 | ) | | | (8,101,227 | ) | | | (5,222,468 | ) |
| Net unrealized appreciation (depreciation) on: | | | | | | | | | | | | | | | | |
| Swaps | | | (2,104,907 | ) | | | 112,795 | | | | (236,886 | ) | | | 133,881 | |
| | | | | | | | | | | | | | | | | |
| Total Net Assets | | $ | 29,941,637 | | | $ | 6,783,194 | | | $ | 2,365,787 | | | $ | 7,466,100 | |
| | | | | | | | | | | | | | | | | |
Calculation of Net Asset Value Per Share - Investor Class: | | | | | | | | | | | | | | | | |
| Net assets | | $ | 29,941,637 | | | $ | 6,783,194 | | | $ | 2,365,787 | | | $ | 7,466,100 | |
Shares outstanding
(unlimited shares of beneficial interest authorized, no par value) | | | 545,666 | | | | 529,254 | | | | 75,935 | | | | 304,316 | |
| Net asset value, redemption price and offering price per share | | $ | 54.87 | | | $ | 12.82 | | | $ | 31.16 | | | $ | 24.53 | |
| | | | | | | | | | | | | | | | | |
| Cost of Investments | | $ | 22,916,724 | | | $ | 6,689,193 | | | $ | 2,879,000 | | | $ | 7,248,719 | |
The accompanying notes are an integral part of these financial statements.
DIREXION ANNUAL REPORT 35
Statements of Assets and Liabilities
August 31, 2010
| | | | | | | | | |
| | | Direxion Monthly
| | | | |
| | | China Bull
| | | U.S. Government
| |
| | | 2X Fund | | | Money Market Fund | |
| |
Assets: | | | | | | | | |
| Investments, at market value (Note 2) | | $ | 12,911,719 | | | $ | 58,262,521 | |
| Receivable for Fund shares sold | | | 55,795 | | | | 2,628,975 | |
| Receivable from Adviser | | | — | | | | 57,332 | |
| Dividends and interest receivable | | | 409 | | | | 546 | |
| | | | | | | | | |
| Total Assets | | | 12,967,923 | | | | 60,949,374 | |
| | | | | | | | | |
Liabilities: | | | | | | | | |
| Payable for Fund shares redeemed | | | 338,198 | | | | 148,889 | |
| Unrealized depreciation on swaps | | | 1,278,765 | | | | — | |
| Due to broker for swaps | | | 143,972 | | | | — | |
| Accrued investment advisory fees | | | 6,470 | | | | 24,927 | |
| Accrued operating services fees | | | 5,615 | | | | 22,434 | |
| Accrued distribution expense | | | 2,159 | | | | — | |
| Accrued shareholder servicing fees | | | 2,159 | | | | 12,459 | |
| Other liabilities | | | — | | | | 19 | |
| | | | | | | | | |
| Total Liabilities | | | 1,777,338 | | | | 208,728 | |
| | | | | | | | | |
Net Assets | | $ | 11,190,585 | | | $ | 60,740,646 | |
| | | | | | | | | |
Net Assets Consist Of: | | | | | | | | |
| Capital stock | | $ | 18,527,940 | | | $ | 60,726,132 | |
| Undistributed net investment income | | | — | | | | 15,518 | |
| Accumulated net realized loss | | | (6,058,590 | ) | | | (1,004 | ) |
| Net unrealized depreciation on: | | | | | | | | |
| Swaps | | | (1,278,765 | ) | | | — | |
| | | | | | | | | |
| Total Net Assets | | $ | 11,190,585 | | | $ | 60,740,646 | |
| | | | | | | | | |
Calculation of Net Asset Value Per Share - Investor Class: | | | | | | | | |
| Net assets | | $ | 11,190,585 | | | $ | 60,740,646 | |
Shares outstanding
(unlimited shares of beneficial interest authorized, no par value) | | | 261,145 | | | | 60,740,666 | |
| Net asset value, redemption price and offering price per share | | $ | 42.85 | | | $ | 1.00 | |
| | | | | | | | | |
| Cost of Investments | | $ | 12,911,719 | | | $ | 58,262,521 | |
The accompanying notes are an integral part of these financial statements.
36 DIREXION ANNUAL REPORT
Statements of Operations
For the Year Ended August 31, 2010
| | | | | | | | | | | | | | | | | |
| | | Direxion Monthly
| | | Direxion Monthly
| | | Direxion Monthly
| | | Direxion Monthly
| |
| | | Small Cap Bull
| | | Small Cap Bear
| | | 10 Year Note Bull
| | | 10 Year Note Bear
| |
| | | 2X Fund | | | 2X Fund | | | 2X Fund | | | 2X Fund | |
| |
Investment income: | | | | | | | | | | | | | | | | |
| Interest income | | $ | 7,915 | | | $ | 18,562 | | | $ | 60,970 | | | $ | 19,445 | |
| | | | | | | | | | | | | | | | | |
| Total investment income | | | 7,915 | | | | 18,562 | | | | 60,970 | | | | 19,445 | |
| | | | | | | | | | | | | | | | | |
Expenses: | | | | | | | | | | | | | | | | |
| Investment advisory fees | | | 57,952 | | | | 119,334 | | | | 169,944 | | | | 155,510 | |
| Operating services fees | | | 50,225 | | | | 103,422 | | | | 147,284 | | | | 134,775 | |
| Distribution expenses | | | 19,317 | | | | 39,778 | | | | 56,648 | | | | 51,837 | |
| Shareholder servicing fees | | | 19,317 | | | | 39,778 | | | | 56,648 | | | | 51,837 | |
| Excise taxes | | | — | | | | 10 | | | | — | | | | 1 | |
| | | | | | | | | | | | | | | | | |
| Total expenses before reimbursement and interest on securities sold short | | | 146,811 | | | | 302,322 | | | | 430,524 | | | | 393,960 | |
| Interest on securities sold short | | | — | | | | — | | | | — | | | | 28,429 | |
| | | | | | | | | | | | | | | | | |
| Net expenses after interest on securities sold short | | | 146,811 | | | | 302,322 | | | | 430,524 | | | | 422,389 | |
| Less: Reimbursement of expenses from Adviser | | | — | | | | (10 | ) | | | — | | | | (1 | ) |
| | | | | | | | | | | | | | | | | |
| Total expenses | | | 146,811 | | | | 302,312 | | | | 430,524 | | | | 422,388 | |
| | | | | | | | | | | | | | | | | |
Net investment loss | | | (138,896 | ) | | | (283,750 | ) | | | (369,554 | ) | | | (402,943 | ) |
| | | | | | | | | | | | | | | | | |
Realized and unrealized gain (loss) on investments: | | | | | | | | | | | | | | | | |
| Net realized gain (loss) on: | | | | | | | | | | | | | | | | |
| Investments | | | 12,267 | | | | 4,666 | | | | 649,654 | | | | — | |
| Securities sold short | | | — | | | | — | | | | — | | | | 6,250 | |
| Futures | | | — | | | | — | | | | 193,344 | | | | (130,915 | ) |
| Swaps | | | (1,050,408 | ) | | | (1,987,467 | ) | | | 4,642,968 | | | | (5,171,878 | ) |
| | | | | | | | | | | | | | | | | |
| | | | (1,038,141 | ) | | | (1,982,801 | ) | | | 5,485,966 | | | | (5,296,543 | ) |
| | | | | | | | | | | | | | | | | |
| Change in unrealized appreciation (depreciation) on: | | | | | | | | | | | | | | | | |
| Investments | | | — | | | | — | | | | (549,371 | ) | | | — | |
| Securities sold short | | | — | | | | — | | | | — | | | | (90,625 | ) |
| Futures | | | — | | | | — | | | | (87,800 | ) | | | 55,336 | |
| Swaps | | | (687,985 | ) | | | 671,873 | | | | 116,797 | | | | (795,038 | ) |
| | | | | | | | | | | | | | | | | |
| | | | (687,985 | ) | | | 671,873 | | | | (520,374 | ) | | | (830,327 | ) |
| | | | | | | | | | | | | | | | | |
| Net realized and unrealized gain (loss) on investments | | | (1,726,126 | ) | | | (1,310,928 | ) | | | 4,965,592 | | | | (6,126,870 | ) |
| | | | | | | | | | | | | | | | | |
Net increase (decrease) in net assets resulting from operations | | $ | (1,865,022 | ) | | $ | (1,594,678 | ) | | $ | 4,596,038 | | | $ | (6,529,813 | ) |
| | | | | | | | | | | | | | | | | |
The accompanying notes are an integral part of these financial statements.
DIREXION ANNUAL REPORT 37
Statements of Operations
For the Year Ended August 31, 2010
| | | | | | | | | | | | | |
| | | | | | | | | Direxion Monthly
| |
| | | Dynamic HY
| | | HY Bear
| | | Commodity Bull
| |
| | | Bond Fund | | | Fund | | | 2X Fund | |
| |
Investment income: | | | | | | | | | | | | |
| Interest income | | $ | 61,796 | | | $ | 23,064 | | | $ | 27,004 | |
| | | | | | | | | | | | | |
| Total investment income | | | 61,796 | | | | 23,064 | | | | 27,004 | |
| | | | | | | | | | | | | |
Expenses: | | | | | | | | | | | | |
| Investment advisory fees | | | 438,195 | | | | 163,993 | | | | 204,582 | |
| Operating services fees | | | 350,557 | | | | 142,127 | | | | 177,303 | |
| Distribution expenses | | | 146,065 | | | | 54,664 | | | | 68,194 | |
| Shareholder servicing fees | | | 146,065 | | | | 54,664 | | | | 68,194 | |
| | | | | | | | | | | | | |
| Total expenses | | | 1,080,882 | | | | 415,448 | | | | 518,273 | |
| | | | | | | | | | | | | |
Net investment loss | | | (1,019,086 | ) | | | (392,384 | ) | | | (491,269 | ) |
| | | | | | | | | | | | | |
Realized and unrealized gain (loss) on investments: | | | | | | | | | | | | |
| Net realized gain (loss) on: | | | | | | | | | | | | |
| Investments | | | 50 | | | | — | | | | — | |
| Futures | | | 142,972 | | | | (647,962 | ) | | | — | |
| Swaps | | | 9,810,828 | | | | (3,946,994 | ) | | | 5,824,993 | |
| | | | | | | | | | | | | |
| | | | 9,953,850 | | | | (4,594,956 | ) | | | 5,824,993 | |
| | | | | | | | | | | | | |
| Change in unrealized appreciation (depreciation) on: | | | | | | | | | | | | |
| Futures | | | (53,913 | ) | | | 72,673 | | | | — | |
| Swaps | | | (774,134 | ) | | | 184,670 | | | | (2,981,833 | ) |
| | | | | | | | | | | | | |
| | | | (828,047 | ) | | | 257,343 | | | | (2,981,833 | ) |
| | | | | | | | | | | | | |
| Net realized and unrealized gain (loss) on investments | | | 9,125,803 | | | | (4,337,613 | ) | | | 2,843,160 | |
| | | | | | | | | | | | | |
Net increase (decrease) in net assets resulting from operations | | $ | 8,106,717 | | | $ | (4,729,997 | ) | | $ | 2,351,891 | |
| | | | | | | | | | | | | |
The accompanying notes are an integral part of these financial statements.
38 DIREXION ANNUAL REPORT
Statements of Operations
For the Year Ended August 31, 2010
| | | | | | | | | | | | | | | | | |
| | | Direxion Monthly
| | | Direxion Monthly
| | | Direxion Monthly
| | | Direxion Monthly
| |
| | | Emerging Markets
| | | Emerging Markets
| | | Developed Markets
| | | Developed Markets
| |
| | | Bull 2X Fund | | | Bear 2X Fund | | | Bull 2X Fund | | | Bear 2X Fund | |
| |
Investment income: | | | | | | | | | | | | | | | | |
| Interest income | | $ | 20,991 | | | $ | 5,862 | | | $ | 3,672 | | | $ | 2,635 | |
| | | | | | | | | | | | | | | | | |
| Total investment income | | | 20,991 | | | | 5,862 | | | | 3,672 | | | | 2,635 | |
| | | | | | | | | | | | | | | | | |
Expenses: | | | | | | | | | | | | | | | | |
| Investment advisory fees | | | 227,552 | | | | 49,734 | | | | 29,680 | | | | 17,677 | |
| Operating services fees | | | 197,211 | | | | 43,104 | | | | 25,722 | | | | 15,320 | |
| Distribution expenses | | | 75,851 | | | | 16,578 | | | | 9,893 | | | | 5,892 | |
| Shareholder servicing fees | | | 75,851 | | | | 16,578 | | | | 9,893 | | | | 5,892 | |
| Excise taxes | | | — | | | | 34,208 | | | | — | | | | 19,636 | |
| | | | | | | | | | | | | | | | | |
| Total expenses before reimbursement | | | 576,465 | | | | 160,202 | | | | 75,188 | | | | 64,417 | |
| Less: Reimbursement of expenses from Adviser | | | — | | | | (34,208 | ) | | | — | | | | (19,636 | ) |
| | | | | | | | | | | | | | | | | |
| Total expenses | | | 576,465 | | | | 125,994 | | | | 75,188 | | | | 44,781 | |
| | | | | | | | | | | | | | | | | |
Net investment loss | | | (555,474 | ) | | | (120,132 | ) | | | (71,516 | ) | | | (42,146 | ) |
| | | | | | | | | | | | | | | | | |
Realized and unrealized gain (loss) on investments: | | | | | | | | | | | | | | | | |
| Net realized gain (loss) on: | | | | | | | | | | | | | | | | |
| Investments | | | 79,087 | | | | 150 | | | | — | | | | — | |
| Swaps | | | (317,699 | ) | | | (2,228,979 | ) | | | (1,517,058 | ) | | | (782,589 | ) |
| | | | | | | | | | | | | | | | | |
| | | | (238,612 | ) | | | (2,228,829 | ) | | | (1,517,058 | ) | | | (782,589 | ) |
| | | | | | | | | | | | | | | | | |
| Change in unrealized appreciation (depreciation) on: | | | | | | | | | | | | | | | | |
| Investments | | | 19,462 | | | | — | | | | — | | | | — | |
| Swaps | | | (1,667,699 | ) | | | 37,026 | | | | (258,052 | ) | | | 125,326 | |
| | | | | | | | | | | | | | | | | |
| | | | (1,648,237 | ) | | | 37,026 | | | | (258,052 | ) | | | 125,326 | |
| | | | | | | | | | | | | | | | | |
| Net realized and unrealized loss on investments | | | (1,886,849 | ) | | | (2,191,803 | ) | | | (1,775,110 | ) | | | (657,263 | ) |
| | | | | | | | | | | | | | | | | |
Net decrease in net assets resulting from operations | | $ | (2,442,323 | ) | | $ | (2,311,935 | ) | | $ | (1,846,626 | ) | | $ | (699,409 | ) |
| | | | | | | | | | | | | | | | | |
The accompanying notes are an integral part of these financial statements.
DIREXION ANNUAL REPORT 39
Statements of Operations
For the Year Ended August 31, 2010
| | | | | | | | | |
| | | Direxion Monthly
| | | | |
| | | China Bull
| | | U.S. Government
| |
| | | 2X Fund | | | Money Market Fund | |
| |
Investment income: | | | | | | | | |
| Interest income | | $ | 11,704 | | | $ | 48,641 | |
| | | | | | | | | |
| Total investment income | | | 11,704 | | | | 48,641 | |
| | | | | | | | | |
Expenses: | | | | | | | | |
| Investment advisory fees | | | 86,014 | | | | 215,442 | |
| Operating services fees | | | 74,545 | | | | 193,883 | |
| Distribution expenses | | | 28,671 | | | | — | |
| Shareholder servicing fees | | | 28,671 | | | | 107,721 | |
| Excise taxes | | | — | | | | 537 | |
| | | | | | | | | |
| Total expenses before reimbursement | | | 217,901 | | | | 517,583 | |
| Less: Reimbursement of expenses from Adviser | | | — | | | | (496,533 | ) |
| | | | | | | | | |
| Total expenses | | | 217,901 | | | | 21,050 | |
| | | | | | | | | |
Net investment income (loss) | | | (206,197 | ) | | | 27,591 | |
| | | | | | | | | |
Realized and unrealized gain (loss) on investments: | | | | | | | | |
| Net realized loss on: | | | | | | | | |
| Swaps | | | (218,352 | ) | | | — | |
| | | | | | | | | |
| | | | (218,352 | ) | | | — | |
| | | | | | | | | |
| Change in unrealized appreciation on: | | | | | | | | |
| Swaps | | | 48,749 | | | | — | |
| | | | | | | | | |
| | | | 48,749 | | | | — | |
| | | | | | | | | |
| Net realized and unrealized loss on investments | | | (169,603 | ) | | | — | |
| | | | | | | | | |
Net increase (decrease) in net assets resulting from operations | | $ | (375,800 | ) | | $ | 27,591 | |
| | | | | | | | | |
The accompanying notes are an integral part of these financial statements.
40 DIREXION ANNUAL REPORT
Statements of Changes in Net Assets
| | | | | | | | | | | | | | | | | |
| | | Direxion Monthly
| | | Direxion Monthly
| |
| | | Small Cap Bull 2X Fund | | | Small Cap Bear 2X Fund | |
| | | Year Ended
| | | Year Ended
| | | Year Ended
| | | Year Ended
| |
| | | August 31, 2010 | | | August 31, 2009 | | | August 31, 2010 | | | August 31, 2009 | |
| |
Operations: | | | | | | | | | | | | | | | | |
| Net investment loss | | $ | (138,896 | ) | | $ | (102,441 | ) | | $ | (283,750 | ) | | $ | (79,473 | ) |
| Net realized loss on investments | | | (1,038,141 | ) | | | (4,161,967 | ) | | | (1,982,801 | ) | | | (1,775,644 | ) |
| Change in unrealized appreciation (depreciation) on investments | | | (687,985 | ) | | | (366,165 | ) | | | 671,873 | | | | 260,575 | |
| | | | | | | | | | | | | | | | | |
| Net decrease in net assets resulting from operations | | | (1,865,022 | ) | | | (4,630,573 | ) | | | (1,594,678 | ) | | | (1,594,542 | ) |
| | | | | | | | | | | | | | | | | |
Distributions to shareholders: | | | | | | | | | | | | | | | | |
| Net investment income | | | — | | | | — | | | | — | | | | (251,204 | ) |
| Return of capital | | | — | | | | — | | | | — | | | | (1,871,514 | ) |
| | | | | | | | | | | | | | | | | |
| Total distributions | | | — | | | | — | | | | — | | | | (2,122,718 | ) |
| | | | | | | | | | | | | | | | | |
Capital share transactions: | | | | | | | | | | | | | | | | |
| Proceeds from shares sold | | | 90,339,689 | | | | 147,404,893 | | | | 98,089,763 | | | | 152,762,198 | |
| Proceeds from shares issued to holders in reinvestment of distributions | | | — | | | | — | | | | — | | | | 2,040,036 | |
| Cost of shares redeemed | | | (96,523,854 | ) | | | (133,867,876 | ) | | | (69,252,836 | ) | | | (159,395,399 | ) |
| | | | | | | | | | | | | | | | | |
| Net increase (decrease) in net assets resulting from capital share transactions | | | (6,184,165 | ) | | | 13,537,017 | | | | 28,836,927 | | | | (4,593,165 | ) |
| | | | | | | | | | | | | | | | | |
Total increase (decrease) in net assets | | | (8,049,187 | ) | | | 8,906,444 | | | | 27,242,249 | | | | (8,310,425 | ) |
| | | | | | | | | | | | | | | | | |
Net assets: | | | | | | | | | | | | | | | | |
| Beginning of year | | | 14,559,256 | | | | 5,652,812 | | | | 5,054,838 | | | | 13,365,263 | |
| | | | | | | | | | | | | | | | | |
| End of year | | $ | 6,510,069 | | | $ | 14,559,256 | | | $ | 32,297,087 | | | $ | 5,054,838 | |
| | | | | | | | | | | | | | | | | |
Undistributed net investment income, end of year | | $ | — | | | $ | — | | | $ | — | | | $ | — | |
| | | | | | | | | | | | | | | | | |
The accompanying notes are an integral part of these financial statements.
DIREXION ANNUAL REPORT 41
Statements of Changes in Net Assets
| | | | | | | | | | | | | | | | | |
| | | Direxion Monthly
| | | Direxion Monthly
| |
| | | 10 Year Note Bull 2X Fund | | | 10 Year Note Bear 2X Fund | |
| | | Year Ended
| | | Year Ended
| | | Year Ended
| | | Year Ended
| |
| | | August 31, 2010 | | | August 31, 2009 | | | August 31, 2010 | | | August 31, 2009 | |
| |
Operations: | | | | | | | | | | | | | | | | |
| Net investment income (loss) | | $ | (369,554 | ) | | $ | 420,164 | | | $ | (402,943 | ) | | $ | (2,414,475 | ) |
| Net realized gain (loss) on investments | | | 5,485,966 | | | | 3,525,632 | | | | (5,296,543 | ) | | | (3,065,338 | ) |
| Change in unrealized appreciation (depreciation) on investments | | | (520,374 | ) | | | 975,118 | | | | (830,327 | ) | | | 812,893 | |
| | | | | | | | | | | | | | | | | |
| Net increase (decrease) in net assets resulting from operations | | | 4,596,038 | | | | 4,920,914 | | | | (6,529,813 | ) | | | (4,666,920 | ) |
| | | | | | | | | | | | | | | | | |
Distributions to shareholders: | | | | | | | | | | | | | | | | |
| Net realized gains | | | (771,760 | ) | | | — | | | | — | | | | — | |
| | | | | | | | | | | | | | | | | |
| Total distributions | | | (771,760 | ) | | | — | | | | — | | | | — | |
| | | | | | | | | | | | | | | | | |
Capital share transactions: | | | | | | | | | | | | | | | | |
| Proceeds from shares sold | | | 163,375,381 | | | | 760,162,509 | | | | 149,540,522 | | | | 180,330,562 | |
| Proceeds from shares issued to holders in reinvestment of distributions | | | 764,077 | | | | — | | | | — | | | | — | |
| Cost of shares redeemed | | | (155,957,230 | ) | | | (769,187,630 | ) | | | (142,708,439 | ) | | | (197,413,027 | ) |
| | | | | | | | | | | | | | | | | |
| Net increase (decrease) in net assets resulting from capital share transactions | | | 8,182,228 | | | | (9,025,121 | ) | | | 6,832,083 | | | | (17,082,465 | ) |
| | | | | | | | | | | | | | | | | |
Total increase (decrease) in net assets | | | 12,006,506 | | | | (4,104,207 | ) | | | 302,270 | | | | (21,749,385 | ) |
| | | | | | | | | | | | | | | | | |
Net assets: | | | | | | | | | | | | | | | | |
| Beginning of year | | | 24,450,601 | | | | 28,554,808 | | | | 15,721,258 | | | | 37,470,643 | |
| | | | | | | | | | | | | | | | | |
| End of year | | $ | 36,457,107 | | | $ | 24,450,601 | | | $ | 16,023,528 | | | $ | 15,721,258 | |
| | | | | | | | | | | | | | | | | |
Undistributed net investment income, end of year | | $ | — | | | $ | — | | | $ | — | | | $ | — | |
| | | | | | | | | | | | | | | | | |
The accompanying notes are an integral part of these financial statements.
42 DIREXION ANNUAL REPORT
Statements of Changes in Net Assets
| | | | | | | | | | | | | | | | | |
| | | Dynamic HY Bond Fund | | | HY Bear Fund | |
| | | Year Ended
| | | Year Ended
| | | Year Ended
| | | Year Ended
| |
| | | August 31, 2010 | | | August 31, 2009 | | | August 31, 2010 | | | August 31, 2009 | |
| |
Operations: | | | | | | | | | | | | | | | | |
| Net investment loss | | $ | (1,019,086 | ) | | $ | (2,140,459 | ) | | $ | (392,384 | ) | | $ | (292,356 | ) |
| Net realized gain (loss) on investments | | | 9,953,850 | | | | (318,411 | ) | | | (4,594,956 | ) | | | 845,404 | |
| Change in unrealized appreciation (depreciation) on investments | | | (828,047 | ) | | | 721,540 | | | | 257,343 | | | | (62,390 | ) |
| | | | | | | | | | | | | | | | | |
| Net increase (decrease) in net assets resulting from operations | | | 8,106,717 | | | | (1,737,330 | ) | | | (4,729,997 | ) | | | 490,658 | |
| | | | | | | | | | | | | | | | | |
Distributions to shareholders: | | | | | | | | | | | | | | | | |
| Net investment income | | | (641,296 | ) | | | (2,836,324 | ) | | | — | | | | (175,424 | ) |
| Net realized gains | | | — | | | | — | | | | — | | | | (80,765 | ) |
| | | | | | | | | | | | | | | | | |
| Total distributions | | | (641,296 | ) | | | (2,836,324 | ) | | | — | | | | (256,189 | ) |
| | | | | | | | | | | | | | | | | |
Capital share transactions: | | | | | | | | | | | | | | | | |
| Proceeds from shares sold | | | 675,202,499 | | | | 2,471,021,748 | | | | 396,394,961 | | | | 484,184,611 | |
| Proceeds from shares issued to holders in reinvestment of distributions | | | 608,429 | | | | 2,405,081 | | | | — | | | | 154,114 | |
| Cost of shares redeemed | | | (704,774,891 | ) | | | (2,465,571,214 | ) | | | (374,199,698 | ) | | | (485,895,735 | ) |
| | | | | | | | | | | | | | | | | |
| Net increase (decrease) in net assets resulting from capital share transactions | | | (28,963,963 | ) | | | 7,855,615 | | | | 22,195,263 | | | | (1,557,010 | ) |
| | | | | | | | | | | | | | | | | |
Total increase (decrease) in net assets | | | (21,498,542 | ) | | | 3,281,961 | | | | 17,465,266 | | | | (1,322,541 | ) |
| | | | | | | | | | | | | | | | | |
Net assets: | | | | | | | | | | | | | | | | |
| Beginning of year | | | 29,206,271 | | | | 25,924,310 | | | | 27,431,077 | | | | 28,753,618 | |
| | | | | | | | | | | | | | | | | |
| End of year | | $ | 7,707,729 | | | $ | 29,206,271 | | | $ | 44,896,343 | | | $ | 27,431,077 | |
| | | | | | | | | | | | | | | | | |
Undistributed (Accumulated) net investment income (loss), end of year | | $ | 455,006 | | | $ | (300,157 | ) | | $ | (36,893 | ) | | $ | 147,777 | |
| | | | | | | | | | | | | | | | | |
The accompanying notes are an integral part of these financial statements.
DIREXION ANNUAL REPORT 43
Statements of Changes in Net Assets
| | | | | | | | | | | | | | | | | |
| | | Direxion Monthly
| | | Direxion Monthly
| |
| | | Commodity Bull 2X Fund | | | Emerging Markets Bull 2X Fund | |
| | | Year Ended
| | | Year Ended
| | | Year Ended
| | | Year Ended
| |
| | | August 31, 2010 | | | August 31, 2009 | | | August 31, 2010 | | | August 31, 2009 | |
| |
Operations: | | | | | | | | | | | | | | | | |
| Net investment loss | | $ | (491,269 | ) | | $ | (192,515 | ) | | $ | (555,474 | ) | | $ | (283,332 | ) |
| Net realized gain (loss) on investments | | | 5,824,993 | | | | (27,274,409 | ) | | | (238,612 | ) | | | (11,989,781 | ) |
| Change in unrealized appreciation (depreciation) on investments | | | (2,981,833 | ) | | | 6,909,360 | | | | (1,648,237 | ) | | | 4,974,598 | |
| | | | | | | | | | | | | | | | | |
| Net increase (decrease) in net assets resulting from operations | | | 2,351,891 | | | | (20,557,564 | ) | | | (2,442,323 | ) | | | (7,298,515 | ) |
| | | | | | | | | | | | | | | | | |
Distributions to shareholders: | | | | | | | | | | | | | | | | |
| Return of capital | | | — | | | | — | | | | — | | | | (92,518 | ) |
| | | | | | | | | | | | | | | | | |
| Total distributions | | | — | | | | — | | | | — | | | | (92,518 | ) |
| | | | | | | | | | | | | | | | | |
Capital share transactions: | | | | | | | | | | | | | | | | |
| Proceeds from shares sold | | | 78,004,550 | | | | 69,719,291 | | | | 256,081,619 | | | | 326,146,953 | |
| Proceeds from shares issued to holders in reinvestment of distributions | | | — | | | | — | | | | — | | | | 89,670 | |
| Cost of shares redeemed | | | (79,540,354 | ) | | | (72,090,106 | ) | | | (247,725,188 | ) | | | (317,107,919 | ) |
| | | | | | | | | | | | | | | | | |
| Net increase (decrease) in net assets resulting from capital share transactions | | | (1,535,804 | ) | | | (2,370,815 | ) | | | 8,356,431 | | | | 9,128,704 | |
| | | | | | | | | | | | | | | | | |
Total increase (decrease) in net assets | | | 816,087 | | | | (22,928,379 | ) | | | 5,914,108 | | | | 1,737,671 | |
| | | | | | | | | | | | | | | | | |
Net assets: | | | | | | | | | | | | | | | | |
| Beginning of year | | | 20,152,467 | | | | 43,080,846 | | | | 24,027,529 | | | | 22,289,858 | |
| | | | | | | | | | | | | | | | | |
| End of year | | $ | 20,968,554 | | | $ | 20,152,467 | | | $ | 29,941,637 | | | $ | 24,027,529 | |
| | | | | | | | | | | | | | | | | |
Undistributed net investment income, end of year | | $ | — | | | $ | — | | | $ | — | | | $ | — | |
| | | | | | | | | | | | | | | | | |
The accompanying notes are an integral part of these financial statements.
44 DIREXION ANNUAL REPORT
Statements of Changes in Net Assets
| | | | | | | | | | | | | | | | | |
| | | Direxion Monthly
| | | Direxion Monthly
| |
| | | Emerging Markets Bear 2X Fund | | | Developed Markets Bull 2X Fund | |
| | | Year Ended
| | | Year Ended
| | | Year Ended
| | | Year Ended
| |
| | | August 31, 2010 | | | August 31, 2009 | | | August 31, 2010 | | | August 31, 2009 | |
| |
Operations: | | | | | | | | | | | | | | | | |
| Net investment loss | | $ | (120,132 | ) | | $ | (58,724 | ) | | $ | (71,516 | ) | | $ | (60,768 | ) |
| Net realized loss on investments | | | (2,228,829 | ) | | | (4,652,868 | ) | | | (1,517,058 | ) | | | (3,867,179 | ) |
| Change in unrealized appreciation (depreciation) on investments | | | 37,026 | | | | 191,271 | | | | (258,052 | ) | | | (54,547 | ) |
| | | | | | | | | | | | | | | | | |
| Net increase (decrease) in net assets resulting from operations | | | (2,311,935 | ) | | | (4,520,321 | ) | | | (1,846,626 | ) | | | (3,982,494 | ) |
| | | | | | | | | | | | | | | | | |
Distributions to shareholders: | | | | | | | | | | | | | | | | |
| Net investment income | | | — | | | | — | | | | — | | | | — | |
| Return of capital | | | (1,035,024 | ) | | | (1,399,408 | ) | | | — | | | | (604,373 | ) |
| | | | | | | | | | | | | | | | | |
| Total distributions | | | (1,035,024 | ) | | | (1,399,408 | ) | | | — | | | | (604,373 | ) |
| | | | | | | | | | | | | | | | | |
Capital share transactions: | | | | | | | | | | | | | | | | |
| Proceeds from shares sold | | | 121,069,622 | | | | 216,437,946 | | | | 48,285,380 | | | | 120,984,205 | |
| Proceeds from shares issued to holders in reinvestment of distributions | | | 913,212 | | | | 1,297,334 | | | | — | | | | 586,987 | |
| Cost of shares redeemed | | | (113,438,429 | ) | | | (219,399,722 | ) | | | (47,236,598 | ) | | | (116,524,455 | ) |
| | | | | | | | | | | | | | | | | |
| Net increase (decrease) in net assets resulting from capital share transactions | | | 8,544,405 | | | | (1,664,442 | ) | | | 1,048,782 | | | | 5,046,737 | |
| | | | | | | | | | | | | | | | | |
Total increase (decrease) in net assets | | | 5,197,446 | | | | (7,584,171 | ) | | | (797,844 | ) | | | 459,870 | |
| | | | | | | | | | | | | | | | | |
Net assets: | | | | | | | | | | | | | | | | |
| Beginning of year | | | 1,585,748 | | | | 9,169,919 | | | | 3,163,631 | | | | 2,703,761 | |
| | | | | | | | | | | | | | | | | |
| End of year | | $ | 6,783,194 | | | $ | 1,585,748 | | | $ | 2,365,787 | | | $ | 3,163,631 | |
| | | | | | | | | | | | | | | | | |
Undistributed net investment income, end of year | | $ | — | | | $ | — | | | $ | — | | | $ | — | |
| | | | | | | | | | | | | | | | | |
The accompanying notes are an integral part of these financial statements.
DIREXION ANNUAL REPORT 45
Statements of Changes in Net Assets
| | | | | | | | | | | | | | | | | |
| | | Direxion Monthly
| | | Direxion Monthly
| |
| | | Developed Markets Bear 2X Fund | | | China Bull 2X Fund | |
| | | Year Ended
| | | Year Ended
| | | Year Ended
| | | Year Ended
| |
| | | August 31, 2010 | | | August 31, 2009 | | | August 31, 2010 | | | August 31, 2009 | |
| |
Operations: | | | | | | | | | | | | | | | | |
| Net investment loss | | $ | (42,146 | ) | | $ | (52,524 | ) | | $ | (206,197 | ) | | $ | (135,566 | ) |
| Net realized gain (loss) on investments | | | (782,589 | ) | | | 110,487 | | | | (218,352 | ) | | | (3,897,778 | ) |
| Change in unrealized appreciation (depreciation) on investments | | | 125,326 | | | | 369,237 | | | | 48,749 | | | | (493,628 | ) |
| | | | | | | | | | | | | | | | | |
| Net increase (decrease) in net assets resulting from operations | | | (699,409 | ) | | | 427,200 | | | | (375,800 | ) | | | (4,526,972 | ) |
| | | | | | | | | | | | | | | | | |
Distributions to shareholders: | | | | | | | | | | | | | | | | |
| Net investment income | | | — | | | | (2,165,581 | ) | | | — | | | | (17,749 | ) |
| Return of capital | | | (475,001 | ) | | | — | | | | — | | | | (2,254 | ) |
| | | | | | | | | | | | | | | | | |
| Total distributions | | | (475,001 | ) | | | (2,165,581 | ) | | | — | | | | (20,003 | ) |
| | | | | | | | | | | | | | | | | |
Capital share transactions: | | | | | | | | | | | | | | | | |
| Proceeds from shares sold | | | 39,295,119 | | | | 205,285,506 | | | | 102,403,728 | | | | 191,773,571 | |
| Proceeds from shares issued to holders in reinvestment of distributions | | | 459,789 | | | | 2,128,242 | | | | — | | | | 19,232 | |
| Cost of shares redeemed | | | (31,842,761 | ) | | | (216,080,100 | ) | | | (105,290,267 | ) | | | (179,088,213 | ) |
| | | | | | | | | | | | | | | | | |
| Net increase (decrease) in net assets resulting from capital share transactions | | | 7,912,147 | | | | (8,666,352 | ) | | | (2,886,539 | ) | | | 12,704,590 | |
| | | | | | | | | | | | | | | | | |
Total increase (decrease) in net assets | | | 6,737,737 | | | | (10,404,733 | ) | | | (3,262,339 | ) | | | 8,157,615 | |
| | | | | | | | | | | | | | | | | |
Net assets: | | | | | | | | | | | | | | | | |
| Beginning of year | | | 728,363 | | | | 11,133,096 | | | | 14,452,924 | | | | 6,295,309 | |
| | | | | | | | | | | | | | | | | |
| End of year | | $ | 7,466,100 | | | $ | 728,363 | | | $ | 11,190,585 | | | $ | 14,452,924 | |
| | | | | | | | | | | | | | | | | |
Undistributed net investment income, end of year | | $ | — | | | $ | — | | | $ | — | | | $ | — | |
| | | | | | | | | | | | | | | | | |
The accompanying notes are an integral part of these financial statements.
46 DIREXION ANNUAL REPORT
Statements of Changes in Net Assets
| | | | | | | | | |
| | | Direxion Monthly
| |
| | | U.S. Government Money Market Fund | |
| | | Year Ended
| | | Year Ended
| |
| | | August 31, 2010 | | | August 31, 2009 | |
| |
Operations: | | | | | | | | |
| Net investment income | | $ | 27,591 | | | $ | 222,692 | |
| Net realized gain (loss) on investments | | | — | | | | — | |
| Change in unrealized appreciation (depreciation) on investments | | | — | | | | — | |
| | | | | | | | | |
| Net increase in net assets resulting from operations | | | 27,591 | | | | 222,692 | |
| | | | | | | | | |
Distributions to shareholders: | | | | | | | | |
| Net investment income | | | (27,591 | ) | | | (222,692 | ) |
| | | | | | | | | |
| Total distributions | | | (27,591 | ) | | | (222,692 | ) |
| | | | | | | | | |
Capital share transactions: | | | | | | | | |
| Proceeds from shares sold | | | 409,192,807 | | | | 1,740,264,595 | |
| Proceeds from shares issued to holders in reinvestment of distributions | | | 21,168 | | | | 194,398 | |
| Cost of shares redeemed | | | (397,827,878 | ) | | | (1,782,374,855 | ) |
| | | | | | | | | |
| Net increase (decrease) in net assets resulting from capital share transactions | | | 11,386,097 | | | | (41,915,862 | ) |
| | | | | | | | | |
Total increase (decrease) in net assets | | | 11,386,097 | | | | (41,915,862 | ) |
| | | | | | | | | |
Net assets: | | | | | | | | |
| Beginning of year | | | 49,354,549 | | | | 91,270,411 | |
| | | | | | | | | |
| End of year | | $ | 60,740,646 | | | $ | 49,354,549 | |
| | | | | | | | | |
Undistributed net investment income, end of year | | $ | 15,518 | | | $ | 14,981 | |
| | | | | | | | | |
The accompanying notes are an integral part of these financial statements.
DIREXION ANNUAL REPORT 47
Financial Highlights
August 31, 2010
| | | | | | | | | | | | | | | | | | | | | | | | | | | | | | | | | | | | | | | | | | | | | | | | | | | | | | | | | | | | | | | | | | | | | | | | | | | | |
| | | | | | | | | | | | | | | | | | | | | | | | | | | | | | | | | | | RATIOS TO AVERAGE NET ASSETS | |
| | | | | | | | | | | | | | | | | | | | | | | | | | | | | | | | | | | | | | | | | | | | | | | Net
| | | | | | | | | | |
| | | | | | | | | Net Realized
| | | Net Increase
| | | | | | | | | | | | | | | | | | | | | | | | | | | | | | | | | | | Investment
| | | | | | | | | | |
| | | Net Asset
| | | Net
| | | and
| | | (Decrease)
| | | Dividends
| | | Distributions
| | | | | | | | | Net Asset
| | | | | Net Assets,
| | | | | | | | | | | | | | | Income (Loss)
| | | | | | | | | | |
| | | Value,
| | | Investment
| | | Unrealized
| | | in Net Asset
| | | from Net
| | | from
| | | Return
| | | | | | Value,
| | | | | End of
| | | Including Short Interest | | | Excluding Short Interest | | | After Expense
| | | Portfolio
| | | | | | | |
| | | Beginning
| | | Income
| | | Gain (Loss)
| | | Value Resulting
| | | Investment
| | | Realized
| | | of Capital
| | | Total
| | | End of
| | | Total
| | Year/Period
| | | Total
| | | Net
| | | Total
| | | Net
| | | Reimbursement/
| | | Turnover
| | | | | | | |
| Year/Period | | of Year/Period | | | (Loss)2 | | | on Investments3 | | | from Operations | | | Income | | | Capital Gains | | | Distribution | | | Distributions | | | Year/Period | | | Return4 | | (,000) | | | Expenses1 | | | Expenses1 | | | Expenses1 | | | Expenses1 | | | Recoupment1 | | | Rate5 | | | | | | | |
| | |
| |
Direxion Monthly Small Cap Bull 2X Fund |
| Year Ended August 31, 2010 | | $ | 24.54 | | | $ | (0.57 | ) | | $ | 2.81 | | | $ | 2.24 | | | $ | — | | | $ | — | | | $ | — | | | $ | — | | | $ | 26.78 | | | | 9.13 | % | $ | 6,510 | | | | — | | | | — | | | | 1.90 | % | | | 1.90 | % | | | (1.80 | %) | | | 0 | % | | | | | | | | |
| Year Ended August 31, 2009 | | | 80.66 | | | | (0.25 | ) | | | (55.87 | ) | | | (56.12 | ) | | | — | | | | — | | | | — | | | | — | | | | 24.54 | | | | (69.58 | %) | | 14,559 | | | | — | | | | — | | | | 2.16 | % | | | 1.89 | % | | | (1.31 | %) | | | 0 | % | | | | | | | | |
| Year ended August 31, 2008 | | | 120.08 | | | | 1.10 | | | | (31.22 | ) | | | (30.12 | ) | | | (9.30 | ) | | | — | | | | — | | | | (9.30 | ) | | | 80.66 | | | | (26.31 | %) | | 5,653 | | | | — | | | | — | | | | 2.50 | % | | | 1.75 | % | | | 1.24 | % | | | 723 | % | | | | | | | | |
| Year ended August 31, 2007 | | | 106.88 | | | | 3.60 | | | | 9.60 | | | | 13.20 | | | | — | | | | — | | | | — | | | | — | | | | 120.08 | | | | 12.33 | % | | 3,561 | | | | — | | | | — | | | | 3.19 | % | | | 1.75 | % | | | 2.76 | % | | | 535 | % | | | | | | | | |
| Year ended August 31, 2006 | | | 113.20 | | | | 2.96 | | | | (9.28 | ) | | | (6.32 | ) | | | — | | | | — | | | | — | | | | — | | | | 106.88 | | | | (5.60 | %) | | 4,418 | | | | — | | | | — | | | | 2.07 | % | | | 1.75 | % | | | 2.50 | % | | | 762 | % | | | | | | | | |
Direxion Monthly Small Cap Bear 2X Fund10 |
| Year Ended August 31, 2010 | | | 29.50 | | | | (0.35 | ) | | | (8.31 | ) | | | (8.66 | ) | | | — | | | | — | | | | — | | | | — | | | | 20.84 | | | | (29.36 | %) | | 32,297 | | | | — | | | | — | | | | 1.90 | % | | | 1.90 | % | | | (1.78 | %) | | | 0 | % | | | | | | | | |
| Year Ended August 31, 2009 | | | 102.00 | | | | (0.80 | ) | | | (2.50 | ) | | | (3.30 | ) | | | (8.20 | ) | | | — | | | | (61.00 | ) | | | (69.20 | ) | | | 29.50 | | | | (48.97 | %) | | 5,055 | | | | — | | | | — | | | | 2.20 | % | | | 1.86 | % | | | (1.18 | %) | | | 0 | % | | | | | | | | |
| Year ended August 31, 2008 | | | 116.10 | | | | 1.70 | | | | (11.60 | ) | | | (9.90 | ) | | | (4.20 | ) | | | — | | | | — | | | | (4.20 | ) | | | 102.00 | | | | (8.95 | %) | | 13,365 | | | | — | | | | — | | | | 2.27 | % | | | 1.75 | % | | | 1.39 | % | | | 0 | % | | | | | | | | |
| Year ended August 31, 2007 | | | 151.20 | | | | 3.90 | | | | (39.00 | ) | | | (35.10 | ) | | | — | | | | — | | | | — | | | | — | | | | 116.10 | | | | (23.21 | %) | | 29,669 | | | | — | | | | — | | | | 2.15 | % | | | 1.75 | % | | | 3.25 | % | | | 0 | % | | | | | | | | |
| Year ended August 31, 2006 | | | 198.80 | | | | 4.10 | | | | (37.00 | ) | | | (32.90 | ) | | | (7.50 | ) | | | — | | | | (7.20 | ) | | | (14.70 | ) | | | 151.20 | | | | (17.09 | %) | | 16,190 | | | | — | | | | — | | | | 1.75 | % | | | 1.88 | % | | | 2.23 | % | | | 0 | % | | | | | | | | |
Direxion Monthly 10 Year Note Bull 2X Fund |
| Year Ended August 31, 2010 | | | 27.36 | | | | (0.44 | ) | | | 5.57 | | | | 5.13 | | | | — | | | | (0.92 | ) | | | — | | | | (0.92 | ) | | | 31.57 | | | | 19.41 | % | | 36,457 | | | | — | | | | — | | | | 1.90 | % | | | 1.90 | % | | | (1.63 | %) | | | 1,445 | % | | | | | | | | |
| Year Ended August 31, 2009 | | | 24.14 | | | | 0.23 | | | | 2.99 | | | | 3.22 | | | | — | | | | — | | | | — | | | | — | | | | 27.36 | | | | 13.34 | % | | 24,451 | | | | — | | | | — | | | | 1.73 | % | | | 1.77 | % | | | 0.88 | % | | | 2,327 | % | | | | | | | | |
| Year ended August 31, 2008 | | | 20.12 | | | | 0.40 | | | | 4.35 | | | | 4.75 | | | | (0.11 | ) | | | (0.62 | ) | | | — | | | | (0.73 | ) | | | 24.14 | | | | 24.07 | % | | 28,555 | | | | — | | | | — | | | | 1.77 | % | | | 1.75 | % | | | 1.70 | % | | | 2,086 | % | | | | | | | | |
| Year ended August 31, 2007 | | | 18.73 | | | | 0.62 | 6 | | | 0.77 | | | | 1.39 | | | | — | | | | — | | | | — | | | | — | | | | 20.12 | | | | 7.42 | % | | 8,215 | | | | 8.80 | % | | | 7.48 | % | | | 3.07 | % | | | 1.75 | % | | | 3.20 | %7 | | | 1,083 | % | | | | | | | | |
| Year ended August 31, 2006 | | | 20.96 | | | | 0.62 | 6 | | | (2.39 | ) | | | (1.77 | ) | | | (0.33 | ) | | | — | | | | (0.13 | ) | | | (0.46 | ) | | | 18.73 | | | | (8.52 | %) | | 14,776 | | | | 8.84 | % | | | 5.84 | % | | | 4.75 | % | | | 1.75 | % | | | 3.53 | %7 | | | 889 | % | | | | | | | | |
Direxion Monthly 10 Year Note Bear 2X Fund |
| Year Ended August 31, 2010 | | | 10.89 | | | | (0.20 | )8 | | | (2.42 | ) | | | (2.62 | ) | | | — | | | | — | | | | — | | | | — | | | | 8.27 | | | | (24.06 | %) | | 16,024 | | | | 2.04 | % | | | 2.04 | % | | | 1.90 | % | | | 1.90 | % | | | (1.94 | %)9 | | | 0 | % | | | | | | | | |
| Year Ended August 31, 2009 | | | 13.82 | | | | (0.76 | )8 | | | (2.17 | ) | | | (2.93 | ) | | | — | | | | — | | | | — | | | | — | | | | 10.89 | | | | (21.20 | %) | | 15,721 | | | | 7.23 | % | | | 7.18 | % | | | 1.85 | % | | | 1.80 | % | | | (6.78 | %)9 | | | 0 | % | | | | | | | | |
| Year ended August 31, 2008 | | | 17.57 | | | | (0.31 | )8 | | | (3.26 | ) | | | (3.57 | ) | | | (0.04 | ) | | | — | | | | (0.14 | ) | | | (0.18 | ) | | | 13.82 | | | | (20.46 | %) | | 37,471 | | | | 8.02 | % | | | 7.88 | % | | | 1.89 | % | | | 1.75 | % | | | (2.09 | %)9 | | | 0 | % | | | | | | | | |
| Year ended August 31, 2007 | | | 18.87 | | | | 0.44 | 8 | | | (1.03 | ) | | | (0.59 | ) | | | (0.21 | ) | | | (0.50 | ) | | | — | | | | (0.71 | ) | | | 17.57 | | | | (3.27 | %) | | 5,794 | | | | 11.92 | % | | | 11.40 | % | | | 2.27 | % | | | 1.75 | % | | | 2.37 | %9 | | | 0 | % | | | | | | | | |
| Year ended August 31, 2006 | | | 17.02 | | | | — | 8 | | | 1.85 | | | | 1.85 | | | | — | | | | — | | | | — | | | | — | | | | 18.87 | | | | 10.87 | % | | 8,201 | | | | 10.45 | % | | | 10.45 | % | | | 1.75 | % | | | 1.75 | % | | | 0.02 | %9 | | | 0 | % | | | | | | | | |
| | |
| 1 | | Annualized |
| 2 | | Net investment income (loss) per share represents net investment income (loss) divided by the daily average shares of beneficial interest outstanding throughout each period. |
| 3 | | The amounts shown may not correlate with aggregate gains and losses of portfolio securities due to timing of subscriptions and redemptions of Fund shares. |
| 4 | | All returns reflect reinvested dividends, if any, but do not reflect the impact of taxes. |
| 5 | | Portfolio turnover is calculated without regard to short-term securities having a maturity of less than one year. Investments in options, swaps, and futures contracts and repurchase agreements are deemed short-term securities. The Fund’s aggressive investment strategy may result in significant portfolio turnover to take advantage of anticipated changes in market conditions. |
| 6 | | Net investment income (loss) before interest on short positions for the years ended August 31, 2007 and August 31, 2006 was $1.73 and $1.33, respectively. |
| 7 | | Net investment income (loss) ratio included interest on short positions. The ratio excluding interest on short positions for the year ended August 31, 2007 and 2006 was 8.93% and 7.63%, respectively. |
| 8 | | Net investment income (loss) before interest on short positions for the years ended August 31, 2010, 2009, 2008, 2007 and 2006 were $(0.18), $0.05, $0.59, $2.25 and $1.64, respectively. |
| 9 | | Net investment income (loss) ratio included interest on short positions. The ratio excluding interest on short positions for the years ended August 31, 2010, 2009, 2008, 2007 and 2006 were (1.81%), (1.40%), 4.04%, 12.02% and 8.73%, respectively. |
| 10 | | On February 16, 2010, the Direxion Monthly Small Cap Bear 2X Fund had a 10:1 reverse stock split. Per share data for all periods prior to February 16, 2010 has been adjusted to give effect to 10:1 reverse stock split. |
48 DIREXION ANNUAL REPORT
Financial Highlights
August 31, 2010
| | | | | | | | | | | | | | | | | | | | | | | | | | | | | | | | | | | | | | | | | | | | | | | | | | | | | | | | | | | | | | | | | | | | | | | | | | | | |
| | | | | | | | | | | | | | | | | | | | | | | | | | | | | | | | | | | RATIOS TO AVERAGE NET ASSETS | |
| | | | | | | | | | | | | | | | | | | | | | | | | | | | | | | | | | | | | | | | | | | | | | | Net
| | | | | | | | | | |
| | | | | | | | | Net Realized
| | | Net Increase
| | | | | | | | | | | | | | | | | | | | | | | | | | | | | | | | | | | Investment
| | | | | | | | | | |
| | | Net Asset
| | | Net
| | | and
| | | (Decrease)
| | | Dividends
| | | Distributions
| | | | | | | | | Net Asset
| | | | | Net Assets,
| | | | | | | | | | | | | | | Income (Loss)
| | | | | | | | | | |
| | | Value,
| | | Investment
| | | Unrealized
| | | in Net Asset
| | | from Net
| | | from
| | | Return
| | | | | | Value,
| | | | | End of
| | | Including Short Interest | | | Excluding Short Interest | | | After Expense
| | | Portfolio
| | | | | | | |
| | | Beginning
| | | Income
| | | Gain (Loss)
| | | Value Resulting
| | | Investment
| | | Realized
| | | of Capital
| | | Total
| | | End of
| | | Total
| | Year/Period
| | | Total
| | | Net
| | | Total
| | | Net
| | | Reimbursement/
| | | Turnover
| | | | | | | |
| Year/Period | | of Year/Period | | | (Loss)3 | | | on Investments4 | | | from Operations | | | Income | | | Capital Gains | | | Distribution | | | Distributions | | | Year/Period | | | Return5 | | (,000) | | | Expenses1 | | | Expenses1 | | | Expenses1 | | | Expenses1 | | | Recoupment1 | | | Rate6 | | | | | | | |
| | |
| |
Dynamic HY Bond Fund | | | | | | | | | | | | | | | | | | | | | | | | | | | | | | | | | | | | | | | | | | | | | | | | | | | | | | | | | | | | | | | | | | | | | | | | | | | |
| Year Ended August 31, 2010 | | $ | 13.53 | | | $ | (0.26 | ) | | $ | 1.45 | | | $ | 1.19 | | | $ | (0.65 | ) | | $ | — | | | $ | — | | | $ | (0.65 | ) | | $ | 14.07 | | | | 8.82 | % | $ | 7,708 | | | | — | | | | — | | | | 1.85 | % | | | 1.85 | % | | | (1.74 | %) | | | 0 | % | | | | | | | | |
| Year Ended August 31, 2009 | | | 16.38 | | | | (0.17 | )7 | | | (1.57 | ) | | | (1.74 | ) | | | (1.11 | ) | | | — | | | | — | | | | (1.11 | ) | | | 13.53 | | | | (10.73 | %) | | 29,206 | | | | 1.75 | % | | | 1.73 | % | | | 1.75 | % | | | 1.73 | % | | | (1.24 | %)8 | | | 889 | % | | | | | | | | |
| Year ended August 31, 2008 | | | 18.67 | | | | 0.32 | | | | (1.38 | ) | | | (1.06 | ) | | | (1.23 | ) | | | — | | | | — | | | | (1.23 | ) | | | 16.38 | | | | (5.85 | %) | | 25,924 | | | | — | | | | — | | | | 1.74 | % | | | 1.74 | % | | | 1.80 | % | | | 241 | % | | | | | | | | |
| Year ended August 31, 2007 | | | 18.16 | | | | 0.79 | | | | 0.51 | | | | 1.30 | | | | (0.79 | ) | | | — | | | | — | | | | (0.79 | ) | | | 18.67 | | | | 7.24 | % | | 76,536 | | | | — | | | | — | | | | 1.52 | % | | | 1.52 | % | | | 4.16 | % | | | 426 | % | | | | | | | | |
| Year ended August 31, 2006 | | | 19.00 | | | | 0.77 | | | | 0.23 | | | | 1.00 | | | | (1.84 | ) | | | — | | | | — | | | | (1.84 | ) | | | 18.16 | | | | 5.58 | % | | 101,987 | | | | — | | | | — | | | | 1.46 | % | | | 1.46 | % | | | 4.18 | % | | | 805 | % | | | | | | | | |
HY Bear Fund |
| Year Ended August 31, 2010 | | | 17.88 | | | | (0.28 | ) | | | (2.48 | ) | | | (2.76 | ) | | | — | | | | — | | | | — | | | | — | | | | 15.12 | | | | (15.44 | %) | | 44,896 | | | | — | | | | — | | | | 1.90 | % | | | 1.90 | % | | | (1.79 | %) | | | 0 | % | | | | | | | | |
| Year Ended August 31, 2009 | | | 18.74 | | | | (0.22 | ) | | | (0.41 | ) | | | (0.63 | ) | | | (0.16 | ) | | | (0.07 | ) | | | — | | | | (0.23 | ) | | | 17.88 | | | | (3.48 | %) | | 27,431 | | | | — | | | | — | | | | 2.04 | % | | | 1.88 | % | | | (1.15 | %) | | | 0 | % | | | | | | | | |
| Year ended August 31, 2008 | | | 19.23 | | | | 0.259 | | | | 0.06 | | | | 0.31 | | | | (0.16 | ) | | | (0.64 | ) | | | — | | | | (0.80 | ) | | | 18.74 | | | | 1.63 | % | | 28,754 | | | | 2.37 | % | | | 2.26 | % | | | 1.86 | % | | | 1.75 | % | | | 1.31 | %10 | | | 0 | % | | | | | | | | |
| Year ended August 31, 2007 | | | 19.48 | | | | 0.669 | | | | (0.79 | ) | | | (0.13 | ) | | | (0.12 | ) | | | — | | | | — | | | | (0.12 | ) | | | 19.23 | | | | (0.66 | %) | | 26,579 | | | | 3.18 | % | | | 3.22 | % | | | 1.68 | % | | | 1.72 | % | | | 3.41 | %10 | | | 0 | % | | | | | | | | |
September 30, 200511 to August 31, 2006 | | | 20.00 | | | | 0.459 | | | | (0.97 | ) | | | (0.52 | ) | | | — | | | | — | | | | — | | | | — | | | | 19.48 | | | | (2.60 | %)2 | | 9,021 | | | | 3.72 | % | | | 2.02 | % | | | 3.45 | % | | | 1.75 | % | | | 2.51 | %10 | | | 1,150 | %2 | | | | | | | | |
Direxion Monthly Commodity Bull 2X Fund |
| Year Ended August 31, 2010 | | | 36.85 | | | | (0.87 | ) | | | 8.11 | | | | 7.24 | | | | — | | | | — | | | | — | | | | — | | | | 44.09 | | | | 19.65 | % | | 20,969 | | | | — | | | | — | | | | 1.90 | % | | | 1.90 | % | | | (1.80 | %) | | | 0 | % | | | | | | | | |
| Year Ended August 31, 2009 | | | 90.21 | | | | (0.32 | ) | | | (53.04 | ) | | | (53.36 | ) | | | — | | | | — | | | | — | | | | — | | | | 36.85 | | | | (59.15 | %) | | 20,152 | | | | — | | | | — | | | | 1.96 | % | | | 1.88 | % | | | (1.07 | %) | | | 30 | % | | | | | | | | |
| Year ended August 31, 2008 | | | 96.06 | | | | 0.39 | | | | 10.68 | | | | 11.07 | | | | (16.44 | ) | | | (0.48 | ) | | | — | | | | (16.92 | ) | | | 90.21 | | | | 10.93 | % | | 43,081 | | | | — | | | | — | | | | 1.78 | % | | | 1.75 | % | | | 0.35 | % | | | 168 | % | | | | | | | | |
| Year ended August 31, 2007 | | | 61.44 | | | | 1.38 | | | | 33.24 | | | | 34.62 | | | | — | | | | — | | | | — | | | | — | | | | 96.06 | | | | 56.35 | % | | 40,736 | | | | — | | | | — | | | | 2.06 | % | | | 1.75 | % | | | 1.56 | % | | | 612 | % | | | | | | | | |
| Year ended August 31, 2006 | | | 75.09 | | | | 1.29 | | | | (8.28 | ) | | | (6.99 | ) | | | — | | | | (6.66 | ) | | | — | | | | (6.66 | ) | | | 61.44 | | | | (9.35 | %) | | 1,563 | | | | — | | | | — | | | | 2.59 | % | | | 1.75 | % | | | 1.80 | % | | | 8,528 | % | | | | | | | | |
Direxion Monthly Emerging Markets Bull 2X Fund |
| Year Ended August 31, 2010 | | | 45.45 | | | | (1.06 | ) | | | 10.48 | | | | 9.42 | | | | — | | | | — | | | | — | | | | — | | | | 54.87 | | | | 20.73 | % | | 29,942 | | | | — | | | | — | | | | 1.90 | % | | | 1.90 | % | | | (1.83 | %) | | | 241 | % | | | | | | | | |
| Year Ended August 31, 2009 | | | 106.45 | | | | (0.44 | ) | | | (60.42 | ) | | | (60.86 | ) | | | — | | | | — | | | | (0.14 | ) | | | (0.14 | ) | | | 45.45 | | | | (57.08 | %) | | 24,028 | | | | — | | | | — | | | | 1.89 | % | | | 1.89 | % | | | (1.34 | %) | | | 1,643 | % | | | | | | | | |
| Year ended August 31, 2008 | | | 194.45 | | | | 1.45 | | | | (38.75 | ) | | | (37.30 | ) | | | (1.80 | ) | | | (22.15 | ) | | | (26.75 | ) | | | (50.70 | ) | | | 106.45 | | | | (27.82 | %) | | 22,290 | | | | — | | | | — | | | | 1.75 | % | | | 1.75 | % | | | 0.85 | % | | | 2,796 | % | | | | | | | | |
| Year ended August 31, 2007 | | | 125.10 | | | | 1.55 | | | | 82.05 | | | | 83.60 | | | | (2.40 | ) | | | (11.85 | ) | | | — | | | | (14.25 | ) | | | 194.45 | | | | 69.47 | % | | 44,241 | | | | — | | | | — | | | | 2.02 | % | | | 1.75 | % | | | 0.93 | % | | | 2,617 | % | | | | | | | | |
November 1, 200511 to August 31, 2006 | | | 100.00 | | | | 1.00 | | | | 25.95 | | | | 26.95 | | | | (1.85 | ) | | | — | | | | — | | | | (1.85 | ) | | | 125.10 | | | | 27.06 | %2 | | 19,889 | | | | — | | | | — | | | | 1.55 | % | | | 1.55 | % | | | 0.92 | % | | | 954 | %2 | | | | | | | | |
| | |
| 1 | | Annualized |
| 2 | | Not annualized |
| 3 | | Net investment income (loss) per share represents net investment income (loss) divided by the daily average shares of beneficial interest outstanding throughout each period. |
| 4 | | The amounts shown may not correlate with aggregate gains and losses of portfolio securities due to timing of subscriptions and redemptions of Fund shares. |
| 5 | | All returns reflect reinvested dividends, if any, but do not reflect the impact of taxes. |
| 6 | | Portfolio turnover is calculated without regard to short-term securities having a maturity of less than one year. Investments in options, swaps, and futures contracts and repurchase agreements are deemed short-term securities. The Fund’s aggressive investment strategy may result in significant portfolio turnover to take advantage of anticipated changes in market conditions. |
| 7 | | Net investment income (loss) before interest on short positions for the year ended August 31, 2009 was $(0.17). |
| 8 | | Net investment income (loss) ratio included interest on short positions. The ratio excluding interest on short positions for the year ended August 31, 2009 was (1.24)%. |
| 9 | | Net investment income (loss) before interest on short positions for the years ended August 31, 2008, 2007 and 2006 were $0.35, $0.94 and $0.41, respectively. |
| 10 | | Net investment income (loss) ratio included interest on short positions. The ratio excluding interest on short positions for the years ended August 31, 2008, 2007 and 2006 were 1.83%, 4.96% and 2.25%, respectively. |
| 11 | | Commencement of operations. |
DIREXION ANNUAL REPORT 49
Financial Highlights
August 31, 2010
| | | | | | | | | | | | | | | | | | | | | | | | | | | | | | | | | | | | | | | | | | | | | | | | | | | | | | | | | | | | | | | | | | | | | | | | | | | | |
| | | | | | | | | | | | | | | | | | | | | | | | | | | | | | | | | | | RATIOS TO AVERAGE NET ASSETS | |
| | | | | | | | | | | | | | | | | | | | | | | | | | | | | | | | | | | | | | | | | | | | | | | Net
| | | | | | | | | | |
| | | | | | | | | Net Realized
| | | Net Increase
| | | | | | | | | | | | | | | | | | | | | | | | | | | | | | | | | | | Investment
| | | | | | | | | | |
| | | Net Asset
| | | Net
| | | and
| | | (Decrease)
| | | Dividends
| | | Distributions
| | | | | | | | | Net Asset
| | | | | Net Assets,
| | | | | | | | | | | | | | | Income (Loss)
| | | | | | | | | | |
| | | Value,
| | | Investment
| | | Unrealized
| | | in Net Asset
| | | from Net
| | | from
| | | Return
| | | | | | Value,
| | | | | End of
| | | Including Short Interest | | | Excluding Short Interest | | | After Expense
| | | Portfolio
| | | | | | | |
| | | Beginning
| | | Income
| | | Gain (Loss)
| | | Value Resulting
| | | Investment
| | | Realized
| | | of Capital
| | | Total
| | | End of
| | | Total
| | Year/Period
| | | Total
| | | Net
| | | Total
| | | Net
| | | Reimbursement/
| | | Turnover
| | | | | | | |
| Year/Period | | of Year/Period | | | (Loss)3 | | | on Investments4 | | | from Operations | | | Income | | | Capital Gains | | | Distribution | | | Distributions | | | Year/Period | | | Return5 | | (,000) | | | Expenses1 | | | Expenses1 | | | Expenses1 | | | Expenses1 | | | Recoupment1 | | | Rate6 | | | | | | | |
| | |
| |
Direxion Monthly Emerging Markets Bear 2X Fund7 |
| Year Ended August 31, 2010 | | $ | 24.30 | | | $ | (0.27 | ) | | $ | (8.42 | ) | | $ | (8.69 | ) | | $ | (2.79 | ) | | $ | — | | | $ | — | | | $ | (2.79 | ) | | $ | 12.82 | | | | (36.74 | %) | $ | 6,783 | | | | — | | | | — | | | | 2.42 | % | | | 1.90 | % | | | (1.81 | %) | | | 0 | % | | | | | | | | |
| Year Ended August 31, 2009 | | | 264.30 | | | | (0.80 | ) | | | (157.50 | ) | | | (158.30 | ) | | | — | | | | — | | | | (81.70 | ) | | | (81.70 | ) | | | 24.30 | | | | (83.00 | %) | | 1,586 | | | | — | | | | — | | | | 3.43 | % | | | 1.84 | % | | | (1.32 | %) | | | 5,062 | % | | | | | | | | |
| Year ended August 31, 2008 | | | 286.00 | | | | 0.90 | | | | (22.60 | ) | | | (21.70 | ) | | | — | | | | — | | | | — | | | | — | | | | 264.30 | | | | (7.59 | %) | | 9,170 | | | | — | | | | — | | | | 2.04 | % | | | 1.75 | % | | | 1.66 | % | | | 0 | % | | | | | | | | |
| Year ended August 31, 2007 | | | 605.00 | | | | 13.50 | | | | (320.00 | ) | | | (306.50 | ) | | | (12.50 | ) | | | — | | | | — | | | | (12.50 | ) | | | 286.00 | | | | (51.25 | %) | | 22,589 | | | | — | | | | — | | | | 2.59 | % | | | 1.75 | % | | | 3.49 | % | | | 0 | % | | | | | | | | |
November 4, 200510 to August 31, 2006 | | | 1,000.00 | | | | 17.00 | | | | (412.00 | ) | | | (395.00 | ) | | | — | | | | — | | | | — | | | | — | | | | 605.00 | | | | (39.50 | %)2 | | 2,726 | | | | — | | | | — | | | | 2.72 | % | | | 1.71 | % | | | 2.87 | % | | | 0 | %2 | | | | | | | | |
Direxion Monthly Developed Markets Bull 2X Fund |
| Year Ended August 31, 2010 | | | 35.58 | | | | (0.67 | ) | | | (3.75 | ) | | | (4.42 | ) | | | — | | | | — | | | | — | | | | — | | | | 31.16 | | | | (12.42 | %) | | 2,366 | | | | — | | | | — | | | | 1.90 | % | | | 1.90 | % | | | (1.81 | %) | | | 0 | % | | | | | | | | |
| Year Ended August 31, 2009 | | | 73.85 | | | | (0.36 | ) | | | (35.52 | ) | | | (35.88 | ) | | | — | | | | — | | | | (2.39 | ) | | | (2.39 | ) | | | 35.58 | | | | (47.42 | %) | | 3,164 | | | | — | | | | — | | | | 2.60 | % | | | 1.87 | % | | | (1.38 | %) | | | 1,300 | % | | | | | | | | |
| Year ended August 31, 2008 | | | 131.55 | | | | 0.55 | | | | (39.50 | ) | | | (38.95 | ) | | | (11.80 | ) | | | (1.50 | ) | | | (5.45 | ) | | | (18.75 | ) | | | 73.85 | | | | (34.75 | %) | | 2,704 | | | | — | | | | — | | | | 2.32 | % | | | 1.75 | % | | | 0.51 | % | | | 1,078 | % | | | | | | | | |
| Year ended August 31, 2007 | | | 111.65 | | | | 3.05 | | | | 26.15 | | | | 29.20 | | | | (7.70 | ) | | | (1.60 | ) | | | — | | | | (9.30 | ) | | | 131.55 | | | | 26.61 | % | | 10,486 | | | | — | | | | — | | | | 2.03 | % | | | 1.75 | % | | | 2.35 | % | | | 496 | % | | | | | | | | |
January 25, 200610 to August 31, 2006 | | | 100.00 | | | | (0.35 | ) | | | 12.00 | | | | 11.65 | | | | — | | | | — | | | | — | | | | — | | | | 111.65 | | | | 11.65 | %2 | | 18,695 | | | | — | | | | — | | | | 3.87 | % | | | 1.70 | % | | | (0.51 | %) | | | 251 | %2 | | | | | | | | |
Direxion Monthly Developed Markets Bear 2X Fund8 |
| Year Ended August 31, 2010 | | | 36.15 | | | | (0.49 | ) | | | (3.23 | ) | | | (3.72 | ) | | | (7.90 | ) | | | — | | | | — | | | | (7.90 | ) | | | 24.53 | | | | (9.48 | %) | | 7,466 | | | | — | | | | — | | | | 2.73 | % | | | 1.90 | % | | | (1.79 | %) | | | 0 | % | | | | | | | | |
| Year Ended August 31, 2009 | | | 77.80 | | | | (0.80 | ) | | | (26.70 | ) | | | (27.50 | ) | | | (14.15 | ) | | | — | | | | — | | | | (14.15 | ) | | | 36.15 | | | | (45.82 | %) | | 728 | | | | — | | | | — | | | | 2.77 | % | | | 1.84 | % | | | (1.03 | %) | | | 0 | % | | | | | | | | |
| Year ended August 31, 2008 | | | 59.95 | | | | 1.00 | | | | 16.85 | | | | 17.85 | | | | — | | | | — | | | | — | | | | — | | | | 77.80 | | | | 29.77 | % | | 11,133 | | | | — | | | | — | | | | 1.88 | % | | | 1.75 | % | | | 1.60 | % | | | 0 | % | | | | | | | | |
| Year ended August 31, 2007 | | | 79.50 | | | | 2.15 | | | | (21.70 | ) | | | (19.55 | ) | | | — | | | | — | | | | — | | | | — | | | | 59.95 | | | | (24.53 | %) | | 6,682 | | | | — | | | | — | | | | 6.12 | % | | | 1.75 | % | | | 3.20 | % | | | 0 | % | | | | | | | | |
February 6, 200610 to August 31, 2006 | | | 100.00 | | | | 1.55 | | | | (22.05 | ) | | | (20.50 | ) | | | — | | | | — | | | | — | | | | — | | | | 79.50 | | | | (20.50 | %)2 | | 2,787 | | | | — | | | | — | | | | 2.83 | % | | | 1.74 | % | | | 3.10 | % | | | 0 | %2 | | | | | | | | |
Direxion Monthly China Bull 2X Fund |
| Year Ended August 31, 2010 | | | 43.69 | | | | (0.88 | ) | | | 0.04 | | | | (0.84 | ) | | | — | | | | — | | | | — | | | | — | | | | 42.85 | | | | (1.92 | %) | | 11,191 | | | | — | | | | — | | | | 1.90 | % | | | 1.90 | % | | | (1.80 | %) | | | 0 | % | | | | | | | | |
| Year Ended August 31, 2009 | | | 100.92 | | | | (0.53 | ) | | | (56.60 | ) | | | (57.13 | ) | | | (0.09 | ) | | | — | | | | (0.01 | ) | | | (0.10 | ) | | | 43.69 | | | | (56.58 | %) | | 14,453 | | | | — | | | | — | | | | 2.14 | % | | | 1.90 | % | | | (1.54 | %) | | | 3,606 | % | | | | | | | | |
December 3, 200710to August 31, 2008 | | | 240.00 | | | | 0.48 | | | | (139.56 | ) | | | (139.08 | ) | | | — | | | | — | | | | — | | | | — | | | | 100.92 | | | | (57.95 | %)2 | | 6,295 | | | | — | | | | — | | | | 2.81 | % | | | 1.75 | % | | | 0.46 | % | | | 2,204 | %2 | | | | | | | | |
U.S. Government Money Market Fund |
| Year Ended August 31, 2010 | | | 1.00 | | | | — | 9 | | | — | | | | — | 9 | | | — | 9 | | | — | | | | — | | | | — | 9 | | | 1.00 | | | | 0.06 | % | | 60,741 | | | | — | | | | — | | | | 1.20 | % | | | 0.05 | % | | | 0.06 | % | | | 0 | % | | | | | | | | |
| Year Ended August 31, 2009 | | | 1.00 | | | | — | 9 | | | — | | | | — | 9 | | | — | 9 | | | — | | | | — | | | | — | 9 | | | 1.00 | | | | 0.23 | % | | 49,355 | | | | — | | | | — | | | | 1.29 | % | | | 0.64 | % | | | 0.24 | % | | | 0 | % | | | | | | | | |
| Year ended August 31, 2008 | | | 1.00 | | | | 0.02 | | | | — | | | | 0.02 | | | | (0.02 | ) | | | — | | | | — | | | | (0.02 | ) | | | 1.00 | | | | 2.23 | % | | 91,270 | | | | — | | | | — | | | | 1.10 | % | | | 0.99 | % | | | 1.91 | % | | | 0 | % | | | | | | | | |
| Year ended August 31, 2007 | | | 1.00 | | | | 0.04 | | | | — | | | | 0.04 | | | | (0.04 | ) | | | — | | | | — | | | | (0.04 | ) | | | 1.00 | | | | 4.14 | % | | 48,488 | | | | — | | | | — | | | | 1.21 | %11 | | | 1.18 | % | | | 4.06 | % | | | 0 | % | | | | | | | | |
| Year ended August 31, 2006 | | | 1.00 | | | | 0.03 | | | | — | | | | 0.03 | | | | (0.03 | ) | | | — | | | | — | | | | (0.03 | ) | | | 1.00 | | | | 3.49 | % | | 27,309 | | | | — | | | | — | | | | 1.00 | % | | | 1.09 | % | | | 3.37 | % | | | 0 | % | | | | | | | | |
| | |
| 1 | | Annualized |
| 2 | | Not annualized |
| 3 | | Net investment income (loss) per share represents net investment income (loss) divided by the daily average shares of beneficial interest outstanding throughout each period. |
| 4 | | The amounts shown may not correlate with aggregate gains and losses of portfolio securities due to timing of subscriptions and redemptions of Fund shares. |
| 5 | | All returns reflect reinvested dividends, if any, but do not reflect the impact of taxes. |
| 6 | | Portfolio turnover is calculated without regard to short-term securities having a maturity of less than one year. Investments in options, swaps, and futures contracts and repurchase agreements are deemed short-term securities. The Fund’s aggressive investment strategy may result in significant portfolio turnover to take advantage of anticipated changes in market conditions. |
| 7 | | On February 16, 2010, the Direxion Monthly Emerging Markets Bear 2X Fund had a 10:1 reverse stock split. Per share data for all periods prior to February 16, 2010 has been adjusted to give effect to 10:1 reverse stock split. |
| 8 | | On February 16, 2010, the Direxion Monthly Developed Markets Bear 2X Fund had a 5:1 reverse stock split. Per share data for all periods prior to February 16, 2010 has been adjusted to give effect to 5:1 reverse stock split. |
| 9 | | Amount is less than $0.01 per share. |
| 10 | | Commencement of operations. |
50 DIREXION ANNUAL REPORT
Direxion Funds
NOTES TO THE FINANCIAL STATEMENTS
August 31, 2010
Direxion Funds (the “Trust”) was organized as a Massachusetts Business Trust on June 6, 1997 and is registered under the Investment Company Act of 1940, as amended (the “1940 Act”), as an open-end management investment company issuing its shares in series, each series representing a distinct portfolio with its own investment objective and policies. The trust currently has 32 series of which 13 are included in this report: Direxion Monthly Small Cap Bull 2X Fund, Direxion Monthly Small Cap Bear 2X Fund, Direxion Monthly 10 Year Note Bear 2X Fund, Direxion Monthly 10 Year Note Bull 2X Fund, Dynamic HY Bond Fund, HY Bear Fund, Direxion Monthly Commodity Bull 2X Fund, Direxion Monthly Emerging Markets Bull 2X Fund, Direxion Monthly Emerging Markets Bear 2X Fund, Direxion Monthly Developed Markets Bull 2X Fund, Direxion Monthly Developed Markets Bear 2X Fund, Direxion Monthly China Bull 2X Fund, and the U.S. Government Money Market Fund (each a “Fund” and collectively, the “Funds”). Each Fund (other than the U.S. Government Money Market Fund) is a non-diversified series of the Trust pursuant to the 1940 Act. The 13 Funds included in this report offer only Investor Class of shares.
With exception of the Dynamic HY Bond Fund, HY Bear Fund and U.S. Government Money Market Fund, the Funds’ investment objectives are to seek monthly investment results, before fees and expenses, that correspond to the calendar month performance of a particular index or benchmark. The Funds with the word “Bull” in their name attempt to provide investment results that correlate positively to the return of an index or benchmark. The Funds with the word “Bear” in their name (with the exception of the HY Bear Fund) attempt to provide investment results that correlate negatively to the return of an index or benchmark.
| | | | | | | | | |
| | | | | | | Monthly
| |
Fund
| | | Index or Benchmark
| | | Target | |
Direxion Monthly Small Cap Bull 2X Fund
Direxion Monthly Small Cap Bear 2X Fund | | | Russell 2000® Index | | | | 200 | %
-200% |
| | | | | | | | | |
Direxion Monthly 10 Year Note Bull 2X Fund
Direxion Monthly 10 Year Note Bear 2X Fund | | | NYSE Current 10-Year Note Treasury Index | | | | 200 | %
-200% |
| | | | | | | | | |
| Direxion Monthly Commodity Bull 2X Fund | | | Morgan Stanley® Commodity Related Index | | | | 200 | % |
| | | | | | | | | |
Direxion Monthly Emerging Markets Bull 2X Fund
Direxion Monthly Emerging Markets Bear 2X Fund | | | MSCI Emerging Marketssm Index | | | | 200 | %
-200% |
| | | | | | | | | |
Direxion Monthly Developed Markets Bull 2X Fund
Direxion Monthly Developed Markets Bear 2X Fund | | | MSCI EAFE® Index | | | | 200 | %
-200% |
| | | | | | | | | |
| Direxion Monthly China Bull 2X Fund | | | FTSE/Xinhua China 25 Index | | | | 200 | % |
| | | | | | | | | |
Effective September 30, 2009, these funds were renamed:
| | | |
Current Fund Name | | Prior Fund Name |
| |
| Direxion Monthly Small Cap Bull 2X Fund | | Small Cap Bull 2.5X Fund |
| Direxion Monthly Small Cap Bear 2X Fund | | Small Cap Bear 2.5X Fund |
| Direxion Monthly 10 Year Note Bull 2X Fund | | 10 Year Note Bull 2.5X Fund |
| Direxion Monthly 10 Year Note Bear 2X Fund | | 10 Year Note Bear 2.5X Fund |
| Direxion Monthly Commodity Bull 2X Fund | | Commodity Bull 2X Fund |
| Direxion Monthly Emerging Markets Bull 2X Fund | | Emerging Markets Bull 2X Fund |
| Direxion Monthly Emerging Markets Bear 2X Fund | | Emerging Markets Bear 2X Fund |
| Direxion Monthly Developed Markets Bull 2X Fund | | Developed Markets Bull 2X Fund |
| Direxion Monthly Developed Markets Bear 2X Fund | | Developed Markets Bear 2X Fund |
| Direxion Monthly China Bull 2X Fund | | China Bull 2X Fund |
These name changes corresponded with the change for these funds to seek calendar month, leveraged investment results rather than daily leveraged investment results. Also all funds now seek investment results of 200% of the price performance, or the inverse of the price performance of its benchmark index.
DIREXION ANNUAL REPORT 51
The Dynamic HY Bond Fund seeks to maximize total return (income plus capital appreciation) by investing primarily in high-yield debt instruments, commonly referred to as “junk bonds”, and derivatives of such instruments, including derivatives which isolate the credit component of such junk bonds and do not provide general interest rate exposure. The HY Bear Fund seeks to profit from a decline in the value of lower-quality debt instruments, including junk bonds, by creating short positions in such instruments and derivatives of such instruments, including derivatives which isolate the credit component of such junk bonds and do not provide general interest rate exposure. The U.S. Government Money Market Fund seeks to provide security of principal, current income and liquidity.
| |
| 2. | SIGNIFICANT ACCOUNTING POLICIES |
The following is a summary of significant accounting policies consistently followed by the Funds in the preparation of their financial statements. These policies are in conformity with U.S. generally accepted accounting principles (“GAAP”).
a) Investment Valuation – The Net Asset Value (“NAV”) of each Fund is determined daily, Monday through Friday, as of the close of regular trading on the New York Stock Exchange (“NYSE”), each day the NYSE is open for business. The value of all portfolio securities and other assets held by a Fund will be determined as of the time a Fund calculates its NAV, 4:00 p.m. Eastern Time (“Valuation Time”). Equity securities and exchange-traded funds are valued at their last sales price, or if not available, at the average of the last bid and ask prices. Investments in open-end mutual funds are valued at their respective quoted net asset values on the valuation dates. Futures are valued at the settlement price established on the exchange on which they are traded, if that settlement price reflects trading prior to the Valuation Time. If the settlement price established by the exchange reflects trading after the Valuation Time, then the last sales price prior to Valuation Time will be used. Options are valued at the composite price, using the National Best Bid and Offer quotes (“NBBO”). NBBO consists of the highest bid price and lowest ask price across any of the exchanges on which an option is quoted. Specifically, composite pricing looks at the last trades on the exchanges where the options are traded. If there are no trades for the option on a given business day, the composite pricing calculates the mean of the highest bid and lowest ask price across the exchanges where the option is traded. Over-the-counter securities are valued at the average of the last bid and ask prices. Securities primarily traded on the NASDAQ National Market are valued using the NASDAQ Official Closing Price. Swaps are valued based upon prices from third party vendor models or quotations from market makers to the extent available. Short-term debt securities with a maturity of 60 days or less and money market securities are valued using the amortized cost method. Other debt securities are valued by using the mean prices provided by the Fund’s pricing service or, if such services are unavailable, by a pricing matrix method. Securities for which reliable market quotations are not readily available, the Funds’ pricing service does not provide a valuation for such securities, the Fund’s pricing service provides valuation that in the judgment of Rafferty Asset Management, LLC (the “Adviser”) does not represent fair value, or the Fund or Adviser believes the market price is stale will be fair valued as determined by the Adviser under the supervision of the Board of Trustees.
b) Repurchase Agreements – Each Fund may enter into repurchase agreements with institutions that are members of the Federal Reserve System or securities dealers who are members of a national securities exchange or are primary dealers in U.S. government securities. In connection with transactions in repurchase agreements, it is the Trust’s policy that the Fund receives, as collateral, cash and/or securities (primarily U.S. government securities) whose market value, including accrued interest, at all times will be at least equal to 100% of the amount invested by the Fund in each repurchase agreement. If the seller defaults, and the value of the collateral declines, realization of the collateral by the Fund may be delayed or limited. The Funds were not invested in repurchase agreements at August 31, 2010.
c) Swap Contracts – Each Fund, other than the U.S. Government Money Market Fund, may enter into equity swap contacts. Standard equity swap contracts are between two parties that agree to exchange the returns (or differentials in rates of return) earned or realized on particular predetermined investments or instruments. The gross amount to be exchanged is calculated with respect to a “notional amount” (i.e. the return on or increase in value of a particular dollar amount invested in a “basket” of securities representing a particular index or industry sector). The Fund’s obligations are accrued daily (offset by any amounts owed to the Fund.)
In a “long” equity swap agreement, the counterparty will generally agree to pay the Fund the amount, if any, by which the notional amount of swap contract would have increased in value if the Fund had been invested in the particular securities, plus dividends that would have been received on those securities. The Fund will agree to pay the counterparty a floating rate
52 DIREXION ANNUAL REPORT
of interest (e.g., a LIBOR based rate) on the notional amount of the swap contract plus the amount, if any, by which the notional amount would have decreased in value had it been invested in such securities plus, in certain instances, commissions or trading spreads on the notional amounts. Thus, the return on the swap contract should be the gain or loss on the notional amount plus dividends on the securities less the interest paid by the Fund on the notional amount. Payments may be made at the conclusion of the contract or periodically during its term. These swap contracts do not include the delivery of securities by the Funds to the counterparty. The net amount of the excess, if any, of the Fund’s obligations owed over its entitlement with respect to each swap is accrued on a daily basis and an amount of cash or liquid assets having an aggregate net asset value at least equal to such accrued excess is maintained in a segregated account by the Funds’ custodian. Until a swap contract is settled in cash, the gain or loss on the notional amount plus dividends on the securities less the interest paid by the Fund on the notional amount are recorded as “unrealized gains or losses on swaps” and when cash is exchanged, the gain or loss is recorded as “realized gains or losses on swaps.”
Each Fund, other than the U.S. Government Money Market Fund, may enter into swap contracts that provide the opposite return of the particular benchmark or security (“short” the index or security). The operations are similar to that of the swaps disclosed above except that the counterparty pays interest to the Fund on the notional amount outstanding and the dividends on the underlying securities reduce the return of the swap. These amounts are netted with any unrealized appreciation or depreciation to determine the value of the swap. The Funds will typically enter into equity swap agreements to obtain leverage in order to meet their objectives.
The Funds collateralize swap agreements with cash and certain securities as indicated on the Schedule of Investments of each of the Funds, respectively. Such collateral is held for the benefit of the counterparty in a segregated account at the Custodian to protect the counterparty against non-payment by the Funds. The Funds do not net collateral. In the event of a default by the counterparty, the Funds will seek return of this collateral and may incur certain costs exercising their rights with respect to the collateral. Amounts expected to be owed to the Funds are regularly collateralized either directly with the Funds or in a segregated account at the Custodian.
A Fund bears the risk of loss of the amount expected to be received under a swap agreement in the event of the default or bankruptcy of swap agreement counterparty to the extent that posted collateral is insufficient. A Fund will enter into swap agreements only with large, well-capitalized and established financial institutions. The creditworthiness of each of the firms that is a party to a swap agreement is monitored by the Adviser.
The Dynamic HY Bond Fund and HY Bear Fund may enter into credit default swaps. Credit default swaps involve one party making a stream of payments (referred to as the buyer of protection) to another party (the seller of protection) in exchange for the right to receive a specified return in the event a credit event occurs, typically a default by a corporate issuer on its debt obligation. As a seller of protection on credit default swaps, a Fund will generally receive from the buyer of protection a fixed rate of income throughout the term of the swap provided that there is no credit event. As the seller, a Fund would effectively add leverage to its portfolio because, in addition to its total assets, a Fund would be subject to investment exposure on the notional amount of the swap.
If a Fund is a seller of protection and a credit event occurs, the Fund will either (i) pay to the buyer of protection an amount equal to the notional amount of the swap and take delivery of the referenced obligation or underlying securities comprising the referenced index or (ii) pay a net settlement amount in the form of cash or securities equal to the notional amount of the swap less the recovery value of the referenced obligation or underlying securities comprising the referenced index. If a Fund is a buyer of protection and a credit event occurs, the Fund will either (i) receive from the seller of protection an amount equal to the notional amount of the swap and deliver the referenced obligation or underlying securities comprising the referenced index or (ii) receive a net settlement amount in the form of cash or securities equal to the notional amount of the swap less the recovery value of the referenced obligation or underlying securities comprising the referenced index. Recovery values are assumed by market makers considering either industry standard recovery rates or entity specific factors and considerations until a credit event occurs. If a credit event has occurred, the recovery value is determined by a facilitated auction whereby a minimum number of allowable broker bids, together with a specified valuation method, are used to calculate the settlement value.
DIREXION ANNUAL REPORT 53
Credit default swap agreements on credit indices involve one party making a stream of payments to another party in exchange for the right to receive a specified return in the event of a write-down, principal shortfall, interest shortfall or default of all or part of the referenced entities comprising the credit index. The stream of payments includes any up-front payments paid or received by the Fund and interest associated with the agreement. Up-front payments compensate for differences between the stated terms of the agreement and the prevailing market conditions and are recorded as realized gain or loss ratably over the term of the swap. The interest associated with the agreement is recognized as unrealized gain or loss until the swap is sold or expires, at which point the cumulative stream of payments is recognized as a component of realized gain or loss. A credit index consists of a basket of credit instruments or exposures designed to be representative of some part of the credit market as a whole. These indices are made up of reference credits that are judged by a poll of dealers to be the most liquid entities in the credit default swap market based on the sector of the index. Components of the indices may include, but are not limited to, investment grade securities, high yield securities, asset based securities, emerging markets, and/or various credit ratings within each sector. Credit indices are traded using credit default swaps with standardized terms including a fixed spread and standard maturity dates. An index credit default swap references all the names in the index, and if there is a default, the credit event is settled based on that name’s weight in the index. The composition of the indices changes periodically, usually every six months, and for most indices, each name has an equal weight in the index. A Fund may use credit default swaps on credit indices to hedge a portfolio of credit default swaps or bonds because entering into credit default swaps on indices is less expensive than buying many credit default swaps. Credit default swaps on indices are benchmarks for protecting investors owning bonds against defaults, and traders use them to speculate on changes in credit quality of bonds.
The maximum potential amount of future payments that the Fund as a seller of protection could be required to make under a credit default swap agreement would be an amount equal to the notional amount of the swap. Notional amount of all credit default swaps outstanding as of August 31, 2010 are disclosed in the footnotes to the Schedule of Investments. These potential amounts would be partially offset by any recovery value of respective referenced obligations, upfront payments received upon entering into the agreement, or net amounts received from the settlement of buy protection credit default swap agreements entered into by a Fund for the same referenced entity or entities.
The Dynamic HY Bond Fund has entered into swap agreements with Barclays Capital as counterparty in which the fund sold protection on a credit default swap index, the Markit CDX North America High Yield Index (the “CDX”). The HY Bear Fund has entered into swap agreements with three counterparties: Bank of America, Barclays Capital and Credit Suisse Capital, LLC in which the fund bought protection on the CDX. The aggregate value of assets posted by the funds as collateral for these swaps as of August 31, 2010 was $4,420,000 for the Dynamic HY Bond Fund and $2,410,000 for the HY Bear Fund. The CDX is a standardized credit security and is composed of 100 non-investment grade entities (“reference entities”), distributed among three sub-indices: B, BB, and HB. The composition of the CDX and each sub-index is determined by a consortium of 16 member banks. All entities are domiciled in North America. CDX indices roll every 6 months in March and September. The Dynamic HY Bond Fund, by entering into the credit default swap agreements on the CDX, is providing credit protection to the counterparties of the respective credit default swap agreements in exchange for a fixed rate payment received by the Fund from the counterparties. Therefore, there is credit risk to the Fund with respect to the reference entities of the CDX covered by these credit default swap agreements. If a credit event occurs with respect to a reference entity, the Fund will be required to make a payment to the counterparty under the respective credit default swap agreement. A credit event may include a failure to pay interest or principal or bankruptcy by any of the 100 reference entities in the CDX. The HY Bear Fund, by entering into the credit default swap agreements on the CDX, is provided credit protection from the counterparties of the respective credit default swap agreements in exchange for a fixed rate payment paid to the counterparties from the Fund. Therefore, there is no credit risk to the Fund with respect to reference entities of the CDX covered by these credit default swap agreements. The counterparties of the respective credit default swap agreements bear the credit risk. If a credit event occurs with respect to a reference entity, the counterparty will be required to make a payment to the Fund under the respective credit default swap agreement. A credit event may include a failure to pay interest or principal or bankruptcy by any of the 100 reference entities in the CDX.
The Funds have adopted authoritative standards of accounting for and disclosure of credit derivatives, including credit default swap agreements. These disclosure requirements include (i) the nature and terms of the credit derivative, reasons for entering into the credit derivative, the events or circumstances that would require the seller to perform under the credit derivative, and the current status of the payment/performance risk of the credit derivative, (ii) the maximum potential amount
54 DIREXION ANNUAL REPORT
of future payments the seller could be required to make under the credit derivative, (iii) the fair value of the credit derivative, (iv) the nature of any recourse provisions and assets held either as collateral or by third parties, and (v) the current status of the payment risk of the credit derivative.
d) Short Positions – The Direxion Monthly Small Cap Bear 2X Fund, Direxion Monthly 10 Year Note Bear 2X Fund, Dynamic HY Bond Fund, HY Bear Fund, Direxion Monthly Emerging Markets Bear 2X Fund and Direxion Monthly Developed Markets Bear 2X Fund may engage in short sale transactions. The Direxion Monthly Small Cap Bull 2X Fund can only engage in short sales “against the box”. In this instance a security can only be sold short if a long position is held on the same security. For financial statement purposes, an amount equal to the settlement amount is included in the Statement of Assets and Liabilities as an asset and an equivalent liability. The amount of the liability is subsequently marked-to-market to reflect the current value of the short position. Subsequent fluctuations in the market prices of short securities may require purchasing the securities at prices which may differ from the market value reflected on the Statement of Assets and Liabilities. The Fund is liable to the buyer for any dividends payable on securities while those securities are in a short position. As collateral for its short positions, the Fund is required under the 1940 Act to maintain assets consisting of cash, cash equivalents or liquid securities equal to the market value of the securities sold short. This collateral is required to be adjusted daily. The Funds held no securities sold short at August 31, 2010.
e) Stock Index Futures Contracts and Options on Futures Contracts – Each Fund, other than the U.S. Government Money Market Fund, may purchase and sell stock index futures contracts and options on such futures contracts. A Fund may use futures contracts to gain exposure to, or hedge against changes in the values of equities, interest rates or foreign currencies. Upon entering into a contract, the Fund deposits and maintains as collateral such initial margin as required by the exchange on which the transaction is effected. Pursuant to the contract, the Fund agrees to receive from or pay to the broker an amount of cash equal to the daily fluctuation in value of the contract. Such receipts or payments are known as “variation margin” and are recorded by the Fund as unrealized gains and losses. When the contract is closed, the Fund records a realized gain or loss equal to the difference between the value of the contract at the time it was opened and the value at the time it was closed. As collateral for futures contracts, the Fund is required under the 1940 Act to maintain assets consisting of cash, cash equivalents or liquid securities. This collateral is required to be adjusted daily to reflect the market value of the purchase obligation for long futures contracts or the market value of the instrument underlying the contract, but not less than the market price at which the futures contract was established, for short futures contracts.
f) Risks of Options, Futures Contracts, Options on Futures Contracts and Short Positions – The risks inherent in the use of options, futures contracts, options on futures contracts and short positions include 1) adverse changes in the value of such instruments; 2) imperfect correlation between the price of options and futures contracts and options thereon and movements in the price of the underlying securities, index or futures contracts; 3) the possible absence of a liquid secondary market for any particular instrument at any time; 4) the possible need to defer closing out certain positions to avoid adverse tax consequences; and 5) the possible nonperformance by the counterparty under the terms of the contract. The Funds designate cash, cash equivalents and liquid securities as collateral for written options, futures contracts, options on futures contracts and short positions. The Funds were not invested in options or options on futures contracts at August 31, 2010.
g) Risks of Investing in Foreign Securities – Investments in foreign securities involve greater risks than investing in domestic securities. As a result, the Fund’s returns and net asset values may be affected to a large degree by fluctuations in currency exchange rates, political, diplomatic or economic conditions and regulatory requirements in other countries. The laws and accounting, auditing, and financial reporting standards in foreign countries typically are not as strict as they are in the U.S., and there may be less public information available about foreign companies. Investments in foreign emerging markets present a greater risk than investing in foreign issuers in general. The risk of political or social upheaval is greater in emerging markets. In addition, there may be risks of an economy’s dependence on revenues from particular commodities, currency transfer restrictions, a limited number of potential buyers for such securities and delays and disruption in securities settlement procedures.
h) Security Transactions – Investment transactions are recorded on trade date. The Funds determine the gain or loss realized from investment transactions by comparing the identified cost, which is the same basis used for federal income tax purposes, with the net sales proceeds.
DIREXION ANNUAL REPORT 55
i) Federal Income Taxes – Each Fund intends to comply with the requirements of Subchapter M of the Internal Revenue Code necessary to qualify as a regulated investment company and to make the requisite distributions of income and capital gains to its shareholders sufficient to relieve it from all or substantially all federal income taxes and excise taxes. No provision for federal income taxes has been made.
j) Income and Expenses – Dividend income is recorded on the ex-dividend date. Interest income, including amortization of premium and discount, and dividends received from money market funds, is recognized on an accrual basis. Expenses are charged to the Funds daily. Expenses are computed based on each Fund’s respective daily net assets. For additional discussion on expenses refer to Note 6.
k) Distributions to Shareholders – Each Fund, other than the U.S. Government Money Market Fund, generally pays dividends from net investment income and distributes net realized capital gains, if any, at least annually. The U.S. Government Money Market Fund ordinarily will declare dividends from net investment income on a daily basis and distribute those dividends monthly. Income and capital gain distributions are determined in accordance with income tax regulations which may differ from GAAP. Certain Funds also utilize earnings and profits distributed to shareholders on redemptions of shares as part of the dividends paid deduction. Distributions to shareholders are recorded on the ex-dividend date.
The tax character of distributions during the years ended August 31, 2010 and August 31, 2009, were as follows:
| | | | | | | | | | | | | | | | | | | | | | | | | |
| | | Direxion Monthly
| | | Direxion Monthly
| | | Direxion Monthly
| |
| | | Small Cap Bull 2X Fund | | | Small Cap Bear 2X Fund | | | 10 Year Note Bull 2X Fund | |
| | | Year Ended
| | | Year Ended
| | | Year Ended
| | | Year Ended
| | | Year Ended
| | | Year Ended
| |
| | | August 31,
| | | August 31,
| | | August 31,
| | | August 31,
| | | August 31,
| | | August 31,
| |
| | | 2010 | | | 2009 | | | 2010 | | | 2009 | | | 2010 | | | 2009 | |
| |
| Distributions paid from: | | | | | | | | | | | | | | | | | | | | | | | | |
| Ordinary Income | | $ | — | | | $ | — | | | $ | — | | | $ | 251,204 | | | $ | 732,447 | | | $ | — | |
| Long-Term Capital Gains | | | — | | | | — | | | | — | | | | — | | | | 39,313 | | | | — | |
| Return of Capital | | | — | | | | — | | | | — | | | | 1,871,514 | | | | — | | | | — | |
| | | | | | | | | | | | | | | | | | | | | | | | | |
| Total Distributions paid | | $ | — | | | $ | — | | | $ | — | | | $ | 2,122,718 | | | $ | 771,760 | | | $ | — | |
| | | | | | | | | | | | | | | | | | | | | | | | | |
| | | | | | | | | | | | | | | | | | | | | | | | | |
| | | Direxion Monthly
| | | | | | | |
| | | 10 Year Note Bear 2X Fund | | | Dynamic HY Bond Fund | | | HY Bear Fund | |
| | | Year Ended
| | | Year Ended
| | | Year Ended
| | | Year Ended
| | | Year Ended
| | | Year Ended
| |
| | | August 31,
| | | August 31,
| | | August 31,
| | | August 31,
| | | August 31,
| | | August 31,
| |
| | | 2010 | | | 2009 | | | 2010 | | | 2009 | | | 2010 | | | 2009 | |
| |
| Distributions paid from: | | | | | | | | | | | | | | | | | | | | | | | | |
| Ordinary Income | | $ | — | | | $ | — | | | $ | 641,296 | | | $ | 2,836,324 | | | $ | — | | | $ | 256,189 | |
| Long-Term Capital Gains | | | — | | | | — | | | | — | | | | — | | | | — | | | | — | |
| Return of Capital | | | — | | | | — | | | | — | | | | — | | | | — | | | | — | |
| | | | | | | | | | | | | | | | | | | | | | | | | |
| Total Distributions paid | | $ | — | | | $ | — | | | $ | 641,296 | | | $ | 2,836,324 | | | $ | — | | | $ | 256,189 | |
| | | | | | | | | | | | | | | | | | | | | | | | | |
| | | | | | | | | | | | | | | | | | | | | | | | | |
| | | | | | Direxion Monthly
| | | Direxion Monthly
| |
| | | Direxion Monthly
| | | Emerging Markets Bull
| | | Emerging Markets Bear
| |
| | | Commodity Bull 2X Fund | | | 2X Fund | | | 2X Fund | |
| | | Year Ended
| | | Year Ended
| | | Year Ended
| | | Year Ended
| | | Year Ended
| | | Year Ended
| |
| | | August 31,
| | | August 31,
| | | August 31,
| | | August 31,
| | | August 31,
| | | August 31,
| |
| | | 2010 | | | 2009 | | | 2010 | | | 2009 | | | 2010 | | | 2009 | |
| |
| Distributions paid from: | | | | | | | | | | | | | | | | | | | | | | | | |
| Ordinary Income | | $ | — | | | $ | — | | | $ | — | | | $ | — | | | $ | — | | | $ | — | |
| Long-Term Capital Gains | | | — | | | | — | | | | — | | | | — | | | | — | | | | — | |
| Return of Capital | | | — | | | | — | | | | — | | | | 92,518 | | | | 1,035,024 | | | | 1,399,408 | |
| | | | | | | | | | | | | | | | | | | | | | | | | |
| Total Distributions paid | | $ | — | | | $ | — | | | $ | — | | | $ | 92,518 | | | $ | 1,035,024 | | | $ | 1,399,408 | |
| | | | | | | | | | | | | | | | | | | | | | | | | |
56 DIREXION ANNUAL REPORT
| | | | | | | | | | | | | | | | | |
| | | Direxion Monthly Developed Markets Bull 2X Fund | | | Direxion Monthly Developed Markets Bear 2X Fund | |
| | | Year Ended
| | | Year Ended
| | | Year Ended
| | | Year Ended
| |
| | | August 31,
| | | August 31,
| | | August 31,
| | | August 31,
| |
| | | 2010 | | | 2009 | | | 2010 | | | 2009 | |
| |
| Distributions paid from: | | | | | | | | | | | | | | | | |
| Ordinary Income | | $ | — | | | $ | — | | | $ | — | | | $ | 2,165,581 | |
| Long-Term Capital Gains | | | — | | | | — | | | | — | | | | — | |
| Return of Capital | | | — | | | | 604,373 | | | | 475,001 | | | | — | |
| | | | | | | | | | | | | | | | | |
| Total Distributions paid | | $ | — | | | $ | 604,373 | | | $ | 475,001 | | | $ | 2,165,581 | |
| | | | | | | | | | | | | | | | | |
| | | | | | | | | | | | | | | | | |
| | | Direxion Monthly
| | | U.S. Government
| |
| | | China Bull 2X Fund | | | Money Market Fund | |
| | | Year Ended
| | | Year Ended
| | | Year Ended
| | | Year Ended
| |
| | | August 31,
| | | August 31,
| | | August 31,
| | | August 31,
| |
| | | 2010 | | | 2009 | | | 2010 | | | 2009 | |
| |
| Distributions paid from: | | | | | | | | | | | | | | | | |
| Ordinary Income | | $ | — | | | $ | 17,749 | | | $ | 27,591 | | | $ | 222,692 | |
| Long-Term Capital Gains | | | — | | | | — | | | | — | | | | — | |
| Return of Capital | | | — | | | | 2,254 | | | | — | | | | — | |
| | | | | | | | | | | | | | | | | |
| Total Distributions paid | | $ | — | | | $ | 20,003 | | | $ | 27,591 | | | $ | 222,692 | |
| | | | | | | | | | | | | | | | | |
The Funds are designating as long-term capital gain dividends, pursuant to Internal Revenue Code Section 852(b)(3), the amount necessary to reduce the earnings and profits of the Funds related to net capital gain to zero for the tax year ended August 31, 2010.
As of August 31, 2010, the components of distributable earnings of the Funds on a tax basis were as follows:
| | | | | | | | | | | | | | | | | | | | | |
| | | Direxion Monthly
| | | Direxion Monthly
| | | Direxion Monthly
| | | Direxion Monthly
| | | | |
| | | Small Cap
| | | Small Cap
| | | 10 Year Note
| | | 10 Year Note
| | | Dynamic HY
| |
| | | Bull 2X Fund | | | Bear 2X Fund | | | Bull 2X Fund | | | Bear 2X Fund | | | Bond Fund | |
| |
| Tax cost of investments | | $ | 7,561,550 | | | $ | 32,153,328 | | | $ | 35,613,348 | | | $ | 17,462,617 | | | $ | 3,470,958 | |
| Gross unrealized appreciation | | | — | | | | — | | | | — | | | | — | | | | — | |
| Gross unrealized depreciation | | | — | | | | — | | | | — | | | | — | | | | — | |
| | | | | | | | | | | | | | | | | | | | | |
| Net unrealized appreciation/(depreciation) | | $ | — | | | $ | — | | | $ | — | | | $ | — | | | $ | — | |
| | | | | | | | | | | | | | | | | | | | | |
| Undistributed ordinary income | | | — | | | | — | | | | 1,824,315 | | | | — | | | | 405,707 | |
| Undistributed long-term capital gain | | | — | | | | — | | | | 41,943 | | | | — | | | | — | |
| | | | | | | | | | | | | | | | | | | | | |
| Total distributable earnings | | | — | | | | — | | | | 1,866,258 | | | | — | | | | 405,707 | |
| | | | | | | | | | | | | | | | | | | | | |
| Other accumulated gain/(loss) | | | (21,375,740 | ) | | | (38,560,131 | ) | | | 590,064 | | | | (13,438,735 | ) | | | (1,285,594 | ) |
| | | | | | | | | | | | | | | | | | | | | |
| Total accumulated earnings/(loss) | | $ | (21,375,740 | ) | | $ | (38,560,131 | ) | | $ | 2,456,322 | | | $ | (13,438,735 | ) | | $ | (879,887 | ) |
| | | | | | | | | | | | | | | | | | | | | |
DIREXION ANNUAL REPORT 57
| | | | | | | | | | | | | | | | | |
| | | | | | Direxion Monthly
| | | Direxion Monthly
| | | Direxion Monthly
| |
| | | | | | Commodity
| | | Emerging Markets
| | | Emerging Markets
| |
| | | HY Bear Fund | | | Bull 2X Fund | | | Bull 2X Fund | | | Bear 2X Fund | |
| |
| Tax cost of investments | | $ | 39,189,290 | | | $ | 20,434,535 | | | $ | 22,916,724 | | | $ | 6,689,193 | |
| Gross unrealized appreciation | | | — | | | | — | | | | — | | | | — | |
| Gross unrealized depreciation | | | — | | | | — | | | | — | | | | — | |
| | | | | | | | | | | | | | | | | |
| Net unrealized appreciation/(depreciation) | | $ | — | | | $ | — | | | $ | — | | | $ | — | |
| | | | | | | | | | | | | | | | | |
| Undistributed ordinary income | | | — | | | | — | | | | — | | | | — | |
| Undistributed long-term capital gain | | | — | | | | — | | | | — | | | | — | |
| | | | | | | | | | | | | | | | | |
| Total distributable earnings | | | — | | | | — | | | | — | | | | — | |
| | | | | | | | | | | | | | | | | |
| Other accumulated gain/(loss) | | | (3,982,181 | ) | | | (31,061,318 | ) | | | (32,067,820 | ) | | | (18,089,592 | ) |
| | | | | | | | | | | | | | | | | |
| Total accumulated earnings/(loss) | | $ | (3,982,181 | ) | | $ | (31,061,318 | ) | | $ | (32,067,820 | ) | | $ | (18,089,592 | ) |
| | | | | | | | | | | | | | | | | |
| | | | | | | | | | | | | | | | | |
| | | Direxion Monthly
| | | Direxion Monthly
| | | Direxion Monthly
| | | | |
| | | Developed Markets
| | | Developed Markets
| | | China
| | | U.S. Government
| |
| | | Bull 2X Fund | | | Bear 2X Fund | | | Bull 2X Fund | | | Money Market Fund | |
| |
| Tax cost of investments | | $ | 2,879,000 | | | $ | 7,248,719 | | | $ | 12,911,719 | | | $ | 58,262,521 | |
| Gross unrealized appreciation | | | — | | | | — | | | | — | | | | — | |
| Gross unrealized depreciation | | | — | | | | — | | | | — | | | | — | |
| | | | | | | | | | | | | | | | | |
| Net unrealized appreciation/(depreciation) | | $ | — | | | $ | — | | | $ | — | | | $ | — | |
| | | | | | | | | | | | | | | | | |
| Undistributed ordinary income | | | — | | | | — | | | | — | | | | 15,518 | |
| Undistributed long-term capital gain | | | — | | | | — | | | | — | | | | — | |
| | | | | | | | | | | | | | | | | |
| Total distributable earnings | | | — | | | | — | | | | — | | | | 15,518 | |
| | | | | | | | | | | | | | | | | |
| Other accumulated gain/(loss) | | | (8,338,113 | ) | | | (5,088,587 | ) | | | (7,337,355 | ) | | | (1,004 | ) |
| | | | | | | | | | | | | | | | | |
| Total accumulated earnings/(loss) | | $ | (8,338,113 | ) | | $ | (5,088,587 | ) | | $ | (7,337,355 | ) | | $ | 14,514 | |
| | | | | | | | | | | | | | | | | |
Other accumulated gain/ (loss) is generally comprised of capital loss carryforwards, post-October capital loss deferrals and/or unrealized gain/ (loss) on derivative positions.
On the Statement of Assets and Liabilities, the following adjustments were made for permanent tax differences between accounting for net investment income and realized gains and losses under GAAP and tax reporting:
| | | | | | | | | | | | | |
| | | Net Investment
| | | Realized
| | | Capital
| |
| | | Income (Loss) | | | Gain (Loss) | | | Stock | |
| |
| Direxion Monthly Small Cap Bull 2X Fund | | $ | 138,896 | | | $ | 1,190,085 | | | $ | (1,328,981 | ) |
| Direxion Monthly Small Cap Bear 2X Fund | | | 283,750 | | | | — | | | | (283,750 | ) |
| Direxion Monthly 10 Year Note Bull 2X Fund | | | 369,554 | | | | (2,781,683 | ) | | | 2,412,129 | |
| Direxion Monthly 10 Year Note Bear 2X Fund | | | 402,943 | | | | — | | | | (402,943 | ) |
| Dynamic HY Bond Fund | | | 2,415,545 | | | | (2,415,545 | ) | | | — | |
| HY Bear Fund | | | 207,714 | | | | 762,535 | | | | (970,249 | ) |
| Direxion Monthly Commodity Bull 2X Fund | | | 491,269 | | | | — | | | | (491,269 | ) |
| Direxion Monthly Emerging Markets Bull 2X Fund | | | 555,474 | | | | — | | | | (555,474 | ) |
| Direxion Monthly Emerging Markets Bear 2X Fund | | | 120,132 | | | | — | | | | (120,132 | ) |
| Direxion Monthly Developed Markets Bull 2X Fund | | | 71,516 | | | | — | | | | (71,516 | ) |
| Direxion Monthly Developed Markets Bear 2X Fund | | | 42,146 | | | | — | | | | (42,146 | ) |
| Direxion Monthly China Bull 2X Fund | | | 206,197 | | | | — | | | | (206,197 | ) |
| U.S. Government Money Market Fund | | | 537 | | | | 1,619 | | | | (2,156 | ) |
Net investment income and realized gains and losses for federal income tax purposes may differ from that reported on the financial statements because of permanent book-to-tax differences. GAAP requires that permanent differences in net investment income and realized gains and losses due to differences between financial reporting and tax reporting be
58 DIREXION ANNUAL REPORT
reclassified between various components of net assets. The permanent differences primarily relate to swap contract adjustments, net operating losses, and dividends on redemption adjustments with differing book and tax methods.
In order to meet certain excise tax distribution requirements, the Funds are required to measure and distribute annually, net capital gains realized during a twelve-month period ending October 31. In connection with this, the Funds are permitted for tax purposes to defer into their next fiscal year any net capital losses incurred between November 1 and the end of their fiscal year, August 31, 2010.
At August 31, 2010, the following funds deferred, on a tax basis, post-October losses of:
| | | | | | | | | |
| | | Post October
| | | Post October
| |
| | | Capital Loss Deferred | | | Currency Loss | |
| |
| Direxion Monthly Small Cap Bull 2X Fund | | $ | 950,655 | | | $ | — | |
| Direxion Monthly Small Cap Bear 2X Fund | | | — | | | | — | |
| Direxion Monthly 10 Year Note Bull 2X Fund | | | — | | | | — | |
| Direxion Monthly 10 Year Note Bear 2X Fund | | | 4,747,276 | | | | — | |
| Dynamic HY Bond Fund | | | — | | | | — | |
| HY Bear Fund | | | 2,674,091 | | | | — | |
| Direxion Monthly Commodity Bull 2X Fund | | | 906,476 | | | | — | |
| Direxion Monthly Emerging Markets Bull 2X Fund | | | 200,295 | | | | — | |
| Direxion Monthly Emerging Markets Bear 2X Fund | | | 146,580 | | | | — | |
| Direxion Monthly Developed Markets Bull 2X Fund | | | 1,326,725 | | | | — | |
| Direxion Monthly Developed Markets Bear 2X Fund | | | — | | | | — | |
| Direxion Monthly China Bull 2X Fund | | | — | | | | — | |
| U.S. Government Money Market Fund | | | — | | | | — | |
At August 31, 2010 the following funds had capital loss carryforwards on a tax basis of:
| | | | | | | | | | | | | | | | | | | | | | | | | | | | | | | | | | | | | |
| | | Expires | |
| | | 8/31/2011 | | | 8/31/2012 | | | 8/31/2013 | | | 8/31/2014 | | | 8/31/2015 | | | 8/31/2016 | | | 8/31/2017 | | | 8/31/2018 | | | Total | |
| |
| Direxion Monthly Small Cap Bull 2X Fund | | $ | 12,679,111 | | | $ | — | | | $ | — | | | $ | — | | | $ | — | | | $ | 310,769 | | | $ | — | | | $ | — | | | $ | 12,989,880 | |
| Direxion Monthly Small Cap Bear 2X Fund | | | — | | | | 8,346,591 | | | | 4,667,388 | | | | 883,969 | | | | 5,310,686 | | | | 6,570,886 | | | | — | | | | 3,873,693 | | | | 29,653,213 | |
| Direxion Monthly 10 Year Note Bull 2X Fund | | | — | | | | — | | | | — | | | | — | | | | — | | | | — | | | | — | | | | — | | | | — | |
| Direxion Monthly 10 Year Note Bear 2X Fund | | | — | | | | — | | | | — | | | | — | | | | 88,219 | | | | 1,941,340 | | | | 2,717,991 | | | | 2,615,933 | | | | 7,363,483 | |
| Dynamic HY Bond Fund | | | — | | | | — | | | | — | | | | — | | | | — | | | | — | | | | 1,285,594 | | | | — | | | | 1,285,594 | |
| HY Bear Fund | | | — | | | | — | | | | — | | | | — | | | | — | | | | — | | | | — | | | | 1,308,090 | | | | 1,308,090 | |
| Direxion Monthly Commodity Bull 2X Fund | | | — | | | | — | | | | — | | | | — | | | | — | | | | — | | | | 11,546,296 | | | | 12,676,861 | | | | 24,223,157 | |
| Direxion Monthly Emerging Markets Bull 2X Fund | | | — | | | | — | | | | — | | | | — | | | | — | | | | — | | | | 8,991,887 | | | | 1,727,140 | | | | 10,719,027 | |
| Direxion Monthly Emerging Markets Bear 2X Fund | | | — | | | | — | | | | — | | | | — | | | | — | | | | 10,754,148 | | | | — | | | | 1,854,772 | | | | 12,608,920 | |
| Direxion Monthly Developed Markets Bull 2X Fund | | | — | | | | — | | | | — | | | | — | | | | — | | | | — | | | | 1,861,196 | | | | 435,235 | | | | 2,296,431 | |
| Direxion Monthly Developed Markets Bear 2X Fund | | | — | | | | — | | | | — | | | | — | | | | — | | | | — | | | | — | | | | 3,223,821 | | | | 3,223,821 | |
| Direxion Monthly China Bull 2X Fund | | | — | | | | — | | | | — | | | | — | | | | — | | | | — | | | | 1,742,071 | | | | — | | | | 1,742,071 | |
| U.S. Government Money Market Fund | | | 377 | | | | — | | | | 189 | | | | 356 | | | | 82 | | | | — | | | | — | | | | — | | | | 1,004 | |
| | | | | | | | | | | | | | | | | | | | | | | | | | | | | | | | | | | | | |
| | | 8/31/2010 | | | | | | | | | | | | | | | | | | | | | | | | | |
Capital Loss Utilized: | | | | | | | | | | | | | | | | | | | | | | | | | | | | | | | | | | | | |
| Direxion Monthly Small Cap Bull 2X Fund | | $ | 298,081 | | | | | | | | | | | | | | | | | | | | | | | | | | | | | | | | | |
| Dynamic HY Bond Fund | | | 4,106,463 | | | | | | | | | | | | | | | | | | | | | | | | | | | | | | | | | |
| Direxion Monthly China Bull 2X Fund | | | 279,018 | | | | | | | | | | | | | | | | | | | | | | | | | | | | | | | | | |
Capital Loss Expired: | | | | | | | | | | | | | | | | | | | | | | | | | | | | | | | | | | | | |
| Direxion Monthly Small Cap Bull 2X Fund | | $ | 1,190,085 | | | | | | | | | | | | | | | | | | | | | | | | | | | | | | | | | |
| U.S. Government Money Market Fund | | | 1,619 | | | | | | | | | | | | | | | | | | | | | | | | | | | | | | | | | |
To the extent that the Funds realize future net capital gains, those gains will be offset by any unused capital loss carryover.
DIREXION ANNUAL REPORT 59
The Funds have adopted authoritative financial reporting rules regarding recognition and measurement of tax positions taken or expected to be taken on a tax return. The Funds have reviewed all open tax years and concluded that there is no effect to the Funds’ financial positions or results of operations and no tax liability resulting from unrecognized tax benefits relating to uncertain income tax position take or expected to be taken on a tax return. Open tax years are those years that are open for examination by the relevant income taxing authority. As of August 31, 2010, open Federal and state income tax years include the tax years ended August 31, 2007, August 31, 2008, August 31, 2009 and August 31, 2010. The Funds have no examination in progress. The Funds are also not aware of any tax positions for which it is reasonably possible that the total amounts of unrecognized tax expense will significantly change in twelve months.
l) Credit Facility – U.S. Bank, N.A. had made available to Direxion Monthly 10 Year Note Bull 2X Fund and Dynamic HY Bond Fund, a credit facility pursuant to a Line of Credit Agreement (“Line of Credit”) for meeting redemption requests. The Line of Credit was closed on February 15, 2010. The funds did not utilize this Line of Credit during the period September 1, 2009 through February 15, 2010.
m) Guarantees and Indemnifications – In the ordinary course of business, the Funds enter into contracts that contain a variety of indemnification provisions pursuant to which the Funds agree to indemnify third parties upon occurrence of specified events. The Fund’s maximum exposure relating to these indemnification agreements is unknown. However, the Funds have not had prior claims or losses in connection with these provisions and believe the risk of loss is remote.
n) Use of Estimates – The preparation of financial statements in conformity with GAAP requires management to make estimates and assumptions that affect the reported amounts of assets and liabilities and disclosure of contingent assets and liabilities at the date of the financial statements and the reported amounts of revenues and expenses during the reporting period. Actual results could differ from those estimates.
During the year ended August 31, 2010, shares of the Direxion Monthly Small Cap Bear 2X Fund, Direxion Monthly Emerging Markets Bear 2X Fund and the Direxion Monthly Developed Markets Bear 2X Fund were adjusted to reflect a reverse stock split. The effect of the reverse stock split was to reduce the number of shares outstanding while maintaining the Fund’s and each shareholder’s aggregate net asset value. A summary of the reverse stock splits is as follows:
| | | | | | | | | | | | | | | | | | | | | | | | | |
| | | | | | | | | Net Asset Value
| | | Net Asset Value
| | | Shares Outstanding
| | | Shares Outstanding
| |
| | | Date | | | Rate | | | Before Split | | | After Split | | | Before Split | | | After Split | |
| |
| Direxion Monthly Small Cap Bear 2X Fund | | | 2/16/2010 | | | | 10:1 | | | $ | 2.31 | | | $ | 23.10 | | | | 6,116,881 | | | | 611,688 | |
| Direxion Monthly Emerging Markets Bear 2X Fund | | | 2/16/2010 | | | | 10:1 | | | | 1.70 | | | | 17.00 | | | | 5,402,318 | | | | 540,232 | |
| Direxion Monthly Developed Markets Bear 2X Fund | | | 2/16/2010 | | | | 5:1 | | | | 6.39 | | | | 31.95 | | | | 303,937 | | | | 60,787 | |
The reverse stock splits have no impact on the net assets of the funds.
| |
| 4. | CAPITAL SHARE TRANSACTIONS |
Capital share transactions for the Funds during the years ended August 31, 2010 and August 31, 2009, were as follows:
| | | | | | | | | | | | | | | | | |
| | | Direxion Monthly
| | | Direxion Monthly
| |
| | | Small Cap Bull 2X Fund | | | Small Cap Bear 2X Fund1 | |
| | | Year Ended
| | | Year Ended
| | | Year Ended
| | | Year Ended
| |
| | | August 31,
| | | August 31,
| | | August 31,
| | | August 31,
| |
| | | 2010 | | | 2009 | | | 2010 | | | 2009 | |
| |
| Shares sold | | | 2,928,617 | | | | 7,578,267 | | | | 4,765,665 | | | | 2,863,766 | |
| Shares issued in reinvestment of distributions | | | — | | | | — | | | | — | | | | 18,901 | |
| Shares redeemed | | | (3,278,723 | ) | | | (7,055,137 | ) | | | (3,387,681 | ) | | | (2,842,313 | ) |
| | | | | | | | | | | | | | | | | |
| Total net increase (decrease) from capital share transactions | | | (350,106 | ) | | | 523,130 | | | | 1,377,984 | | | | 40,354 | |
| | | | | | | | | | | | | | | | | |
60 DIREXION ANNUAL REPORT
| | | | | | | | | | | | | | | | | |
| | | Direxion Monthly
| | | Direxion Monthly
| |
| | | 10 Year Note Bull 2X Fund | | | 10 Year Note Bear 2X Fund | |
| | | Year Ended
| | | Year Ended
| | | Year Ended
| | | Year Ended
| |
| | | August 31,
| | | August 31,
| | | August 31,
| | | August 31,
| |
| | | 2010 | | | 2009 | | | 2010 | | | 2009 | |
| |
| Shares sold | | | 5,976,353 | | | | 28,703,442 | | | | 14,725,193 | | | | 16,279,973 | |
| Shares issued in reinvestment of distributions | | | 29,019 | | | | — | | | | — | | | | — | |
| Shares redeemed | | | (5,744,274 | ) | | | (28,992,373 | ) | | | (14,230,775 | ) | | | (17,547,561 | ) |
| | | | | | | | | | | | | | | | | |
| Total net increase (decrease) from capital share transactions | | | 261,098 | | | | (288,931 | ) | | | 494,418 | | | | (1,267,588 | ) |
| | | | | | | | | | | | | | | | | |
| | | | | | | | | | | | | | | | | |
| | | Dynamic HY Bond Fund | | | HY Bear Fund | |
| | | Year Ended
| | | Year Ended
| | | Year Ended
| | | Year Ended
| |
| | | August 31,
| | | August 31,
| | | August 31,
| | | August 31,
| |
| | | 2010 | | | 2009 | | | 2010 | | | 2009 | |
| |
| Shares sold | | | 46,510,846 | | | | 179,723,478 | | | | 25,275,495 | | | | 25,107,416 | |
| Shares issued in reinvestment of distributions | | | 42,270 | | | | 173,559 | | | | — | | | | 7,969 | |
| Shares redeemed | | | (48,163,659 | ) | | | (179,321,803 | ) | | | (23,840,419 | ) | | | (25,115,027 | ) |
| | | | | | | | | | | | | | | | | |
| Total net increase (decrease) from capital share transactions | | | (1,610,543 | ) | | | 575,234 | | | | 1,435,076 | | | | 358 | |
| | | | | | | | | | | | | | | | | |
| | | | | | | | | |
| | | Direxion Monthly Commodity Bull 2X Fund | |
| | | Year Ended
| | | Year Ended
| |
| | | August 31,
| | | August 31,
| |
| | | 2010 | | | 2009 | |
| |
| Shares sold | | | 1,569,377 | | | | 2,529,403 | |
| Shares issued in reinvestment of distributions | | | — | | | | — | |
| Shares redeemed | | | (1,640,608 | ) | | | (2,460,046 | ) |
| | | | | | | | | |
| Total net increase (decrease) from capital share transactions | | | (71,231 | ) | | | 69,357 | |
| | | | | | | | | |
| | | | | | | | | | | | | | | | | |
| | | Direxion Monthly
| | | Direxion Monthly
| |
| | | Emerging Markets
| | | Emerging Markets
| |
| | | Bull 2X Fund | | | Bear 2X Fund2 | |
| | | Year Ended
| | | Year Ended
| | | Year Ended
| | | Year Ended
| |
| | | August 31,
| | | August 31,
| | | August 31,
| | | August 31,
| |
| | | 2010 | | | 2009 | | | 2010 | | | 2009 | |
| |
| Shares sold | | | 4,394,878 | | | | 11,158,401 | | | | 8,144,577 | | | | 4,415,053 | |
| Shares issued in reinvestment of distributions | | | — | | | | 3,371 | | | | 62,900 | | | | 10,930 | |
| Shares redeemed | | | (4,377,873 | ) | | | (10,842,550 | ) | | | (7,743,569 | ) | | | (4,395,334 | ) |
| | | | | | | | | | | | | | | | | |
| Total net increase (decrease) from capital share transactions | | | 17,005 | | | | 319,222 | | | | 463,908 | | | | 30,649 | |
| | | | | | | | | | | | | | | | | |
| | | | | | | | | | | | | | | | | |
| | | Direxion Monthly
| | | Direxion Monthly
| |
| | | Developed Markets
| | | Developed Markets
| |
| | | Bull 2X Fund | | | Bear 2X Fund3 | |
| | | Year Ended
| | | Year Ended
| | | Year Ended
| | | Year Ended
| |
| | | August 31,
| | | August 31,
| | | August 31,
| | | August 31,
| |
| | | 2010 | | | 2009 | | | 2010 | | | 2009 | |
| |
| Shares sold | | | 1,345,042 | | | | 4,439,115 | | | | 1,404,934 | | | | 2,857,799 | |
| Shares issued in reinvestment of distributions | | | — | | | | 22,293 | | | | 17,780 | | | | 24,979 | |
| Shares redeemed | | | (1,358,026 | ) | | | (4,409,089 | ) | | | (1,138,552 | ) | | | (3,005,700 | ) |
| | | | | | | | | | | | | | | | | |
| Total net increase (decrease) from capital share transactions | | | (12,984 | ) | | | 52,319 | | | | 284,162 | | | | (122,922 | ) |
| | | | | | | | | | | | | | | | | |
DIREXION ANNUAL REPORT 61
| | | | | | | | | | | | | | | | | |
| | | Direxion Monthly
| | | U.S. Government
| |
| | | China Bull 2X Fund | | | Money Market Fund | |
| | | Year Ended
| | | Year Ended
| | | Year Ended
| | | Year Ended
| |
| | | August 31,
| | | August 31,
| | | August 31,
| | | August 31,
| |
| | | 2010 | | | 2009 | | | 2010 | | | 2009 | |
| |
| Shares sold | | | 2,176,369 | | | | 5,814,182 | | | | 409,192,807 | | | | 1,740,264,595 | |
| Shares issued in reinvestment of distributions | | | — | | | | 583 | | | | 21,168 | | | | 194,397 | |
| Shares redeemed | | | (2,246,048 | ) | | | (5,546,355 | ) | | | (397,827,874 | ) | | | (1,782,374,846 | ) |
| | | | | | | | | | | | | | | | | |
| Total net increase (decrease) from capital share transactions | | | (69,679 | ) | | | 268,410 | | | | 11,386,101 | | | | (41,915,854 | ) |
| | | | | | | | | | | | | | | | | |
| | |
| 1 | | Capital share transactions prior to February 16, 2010 have been restated to reflect the effect of the 10:1 reverse stock split. |
| |
| 2 | | Capital share transactions prior to February 16, 2010 have been restated to reflect the effect of the 10:1 reverse stock split. |
| |
| 3 | | Capital share transactions prior to February 16, 2010 have been restated to reflect the effect of the 5:1 reverse stock split. |
| |
| 5. | INVESTMENT TRANSACTIONS |
During the year ended August 31, 2010, the aggregate purchases and sales of investments (excluding short-term investments, swaps and futures contracts) were:
| | | | | | | | | |
| | | Purchases | | | Sales | |
| |
| Direxion Monthly Small Cap Bull 2X Fund | | $ | — | | | $ | — | |
| Direxion Monthly Small Cap Bear 2X Fund | | | — | | | | — | |
| Direxion Monthly 10 Year Note Bull 2X Fund | | | — | | | | — | |
| Direxion Monthly 10 Year Note Bear 2X Fund | | | — | | | | — | |
| Dynamic HY Bond Fund | | | — | | | | — | |
| HY Bear Fund | | | — | | | | — | |
| Direxion Monthly Commodity Bull 2X Fund | | | — | | | | — | |
| Direxion Monthly Emerging Markets Bull 2X Fund | | | 471,570 | | | | 1,558,799 | |
| Direxion Monthly Emerging Markets Bear 2X Fund | | | — | | | | — | |
| Direxion Monthly Developed Markets Bull 2X Fund | | | — | | | | — | |
| Direxion Monthly Developed Markets Bear 2X Fund | | | — | | | | — | |
| Direxion Monthly China Bull 2X Fund | | | — | | | | — | |
| U.S. Government Money Market Fund | | | — | | | | — | |
The following fund had purchases and sales of long-term U.S. Government securities during the year ended August 31, 2010:
| | | | | | | | | |
| | | Purchases | | | Sales | |
| |
| Direxion Monthly 10 Year Note Bull 2X Fund | | $ | 17,363,438 | | | $ | 33,086,876 | |
| |
| 6. | INVESTMENT ADVISORY AND OTHER AGREEMENTS |
Investment Advisory Agreement: The Funds have entered into an investment advisory agreement with the Adviser. The Adviser receives a fee, computed daily and payable monthly, applied to each Fund’s average daily net assets at the annual rates presented below:
62 DIREXION ANNUAL REPORT
| | | | | |
| Direxion Monthly Small Cap Bull 2X Fund | | | 0.75% | |
| Direxion Monthly Small Cap Bear 2X Fund | | | 0.75% | |
| Direxion Monthly 10 Year Note Bull 2X Fund | | | 0.75% | |
| Direxion Monthly 10 Year Note Bear 2X Fund | | | 0.75% | |
| Dynamic HY Bond Fund | | | 0.75% | |
| HY Bear Fund | | | 0.75% | |
| Direxion Monthly Commodity Bull 2X Fund | | | 0.75% | |
| Direxion Monthly Emerging Markets Bull 2X Fund | | | 0.75% | |
| Direxion Monthly Emerging Markets Bear 2X Fund | | | 0.75% | |
| Direxion Monthly Developed Markets Bull 2X Fund | | | 0.75% | |
| Direxion Monthly Developed Markets Bear 2X Fund | | | 0.75% | |
| Direxion Monthly China Bull 2X Fund | | | 0.75% | |
| U.S. Government Money Market Fund | | | 0.50% | |
Operating Services Agreement: The Funds have entered into an Operating Services Agreement (the “Agreement”) with the Adviser. Under the Agreement, the Adviser will be responsible for all expenses of the Trust except the following: management fees, distribution and/or service fees, acquired fund fees, taxes, leverage interest, dividends or interest on short positions, other interest expenses, brokerage commission and other extraordinary expenses outside the typical day-to-day operations of the Funds.
In consideration for the services rendered pursuant to the Agreement, the Funds will pay to the Adviser, as compensation for the services provided by the Adviser under the Agreement, a monthly fee. The monthly fee is calculated on an annualized basis on the average net assets of each Fund and the below amount:
| | | | | |
| Direxion Monthly Small Cap Bull 2X Fund | | | 0.65% | |
| Direxion Monthly Small Cap Bear 2X Fund | | | 0.65% | |
| Direxion Monthly 10 Year Note Bull 2X Fund | | | 0.65% | |
| Direxion Monthly 10 Year Note Bear 2X Fund | | | 0.65% | |
| Dynamic HY Bond Fund | | | 0.60% | |
| HY Bear Fund | | | 0.65% | |
| Direxion Monthly Commodity Bull 2X Fund | | | 0.65% | |
| Direxion Monthly Emerging Markets Bull 2X Fund | | | 0.65% | |
| Direxion Monthly Emerging Markets Bear 2X Fund | | | 0.65% | |
| Direxion Monthly Developed Markets Bull 2X Fund | | | 0.65% | |
| Direxion Monthly Developed Markets Bear 2X Fund | | | 0.65% | |
| Direxion Monthly China Bull 2X Fund | | | 0.65% | |
| U.S. Government Money Market Fund | | | 0.45% | |
Under the Agreement, the Adviser may continue to waive expenses of the U.S. Government Money Market Fund in order to maintain a positive yield to its investors, which is necessitated by the overall decline of yields of the underlying securities of the U.S. Government Money Market Fund. The Advisor is able to recover these waived expenses for the three previous years if the yield provided to its investors maintains a level of 0.50%. Waived expenses of the U.S. Government Money Market Fund subject to potential recovery:
| | | | | |
Expiring in: | | Amount | |
| |
| 2012 | | $ | 96,666 | |
| 2013 | | $ | 496,533 | |
| | | | | |
| Total | | $ | 593,199 | |
| | | | | |
Distribution Expenses: Shares of the Funds, except for shares of the Dynamic HY Bond Fund, HY Bear Fund and U.S. Government Money Market Fund, are subject to an annual 12b-1 fee of up to 1.00% of a Fund’s average daily net assets. The Dynamic HY Bond Fund and HY Bear Fund are subject to an annual Rule 12b-1 fee of up to 0.40% of the Fund’s average daily
DIREXION ANNUAL REPORT 63
net assets. The U.S. Government Money Market Fund is not authorized to pay 12b-1 fees. The Funds, except the U.S. Government Money Market Fund, currently pay a 12b-1 fee of 0.25% of the Fund’s average daily net assets.
Shareholder Servicing Fees: The Board of Trustees has also authorized each Fund’s shares to pay a shareholder servicing fee of 0.25% of each Fund’s average daily net assets. The Trust, on behalf of each Fund, pays the fee to financial institutions and other persons who provide services and maintain shareholder accounts.
Rafferty Capital Markets, LLC (the “Distributor”) serves as principal underwriter of the Funds and acts as the Funds’ distributor in a continuous public offering of the Funds’ shares. The Distributor is an affiliate of the Adviser.
| |
| 7. | VALUATION MEASUREMENTS |
The Funds have adopted authoritative fair valuation accounting standards which establish an authoritative definition of fair value and set out a hierarchy for measuring fair value. These standards require additional disclosures about the various inputs and valuation techniques used to develop the measurements of fair value and a discussion in changes in valuation techniques and related inputs during the period. These inputs are summarized in the three broad levels listed below:
Level��1 – Quoted prices in active markets for identical securities
Level 2 – Evaluated price based on other significant observable inputs (including quoted prices for similar securities, interest rates, prepayment speeds, credit risk, etc.)
Level 3 – Significant unobservable inputs (including the Fund’s own assumptions in determining fair value of investments)
The inputs or methodology used for valuing securities are not an indication of the credit risk associated with investing in those securities.
The follow is a summary of the inputs used to value the Funds’ investments as of August 31, 2010:
| | | | | | | | | | | | | | | | | |
| | | Direxion Monthly Small Cap Bull 2X Fund | |
| | | Level 1 | | | Level 2 | | | Level 3 | | | Total | |
| |
Short-Term Investments | | $ | 7,561,550 | | | $ | — | | | $ | — | | | $ | 7,561,550 | |
Other Financial Instruments* | | $ | — | | | $ | (1,019,943 | ) | | $ | — | | | $ | (1,019,943 | ) |
| | | | | | | | | | | | | | | | | |
| | | Direxion Monthly Small Cap Bear 2X Fund | |
| | | Level 1 | | | Level 2 | | | Level 3 | | | Total | |
| |
Short-Term Investments | | $ | 32,153,328 | | | $ | — | | | $ | — | | | $ | 32,153,328 | |
Other Financial Instruments* | | $ | — | | | $ | 671,873 | | | $ | — | | | $ | 671,873 | |
| | | | | | | | | | | | | | | | | |
| | | Direxion Monthly 10 Year Note Bull 2X Fund | |
| | | Level 1 | | | Level 2 | | | Level 3 | | | Total | |
| |
Short-Term Investments | | $ | 35,613,348 | | | $ | — | | | $ | — | | | $ | 35,613,348 | |
Other Financial Instruments* | | $ | — | | | $ | 611,599 | | | $ | — | | | $ | 611,599 | |
| | | | | | | | | | | | | | | | | |
| | | Direxion Monthly 10 Year Note Bear 2X Fund | |
| | | Level 1 | | | Level 2 | | | Level 3 | | | Total | |
| |
Short-Term Investments | | $ | 17,462,617 | | | $ | — | | | $ | — | | | $ | 17,462,617 | |
Other Financial Instruments* | | $ | — | | | $ | (916,299 | ) | | $ | — | | | $ | (916,299 | ) |
| | | | | | | | | | | | | | | | | |
| | | Dynamic HY Bond Fund | |
| | | Level 1 | | | Level 2 | | | Level 3 | | | Total | |
| |
Short-Term Investments | | $ | 3,470,958 | | | $ | — | | | $ | — | | | $ | 3,470,958 | |
Other Financial Instruments* | | $ | 245 | | | $ | (49,299 | ) | | $ | — | | | $ | (49,054 | ) |
64 DIREXION ANNUAL REPORT
| | | | | | | | | | | | | | | | | |
| | | HY Bear Fund | |
| | | Level 1 | | | Level 2 | | | Level 3 | | | Total | |
| |
Short-Term Investments | | $ | 39,189,290 | | | $ | — | | | $ | — | | | $ | 39,189,290 | |
Other Financial Instruments* | | $ | 52,081 | | | $ | 36,893 | | | $ | — | | | $ | 88,974 | |
| | | | | | | | | | | | | | | | | |
| | | Direxion Monthly Commodity Bull 2X Fund | |
| | | Level 1 | | | Level 2 | | | Level 3 | | | Total | |
| |
Short-Term Investments | | $ | 20,434,535 | | | $ | — | | | $ | — | | | $ | 20,434,535 | |
Other Financial Instruments* | | $ | — | | | $ | (3,495,221 | ) | | $ | — | | | $ | (3,495,221 | ) |
| | | | | | | | | | | | | | | | | |
| | | Direxion Monthly Emerging Markets Bull 2X Fund | |
| | | Level 1 | | | Level 2 | | | Level 3 | | | Total | |
| |
Short-Term Investments | | $ | 22,916,724 | | | $ | — | | | $ | — | | | $ | 22,916,724 | |
Other Financial Instruments* | | $ | — | | | $ | (2,104,907 | ) | | $ | — | | | $ | (2,104,907 | ) |
| | | | | | | | | | | | | | | | | |
| | | Direxion Monthly Emerging Markets Bear 2X Fund | |
| | | Level 1 | | | Level 2 | | | Level 3 | | | Total | |
| |
Short-Term Investments | | $ | 6,689,193 | | | $ | — | | | $ | — | | | $ | 6,689,193 | |
Other Financial Instruments* | | $ | — | | | $ | 112,795 | | | $ | — | | | $ | 112,795 | |
| | | | | | | | | | | | | | | | | |
| | | Direxion Monthly Developed Markets Bull 2X Fund | |
| | | Level 1 | | | Level 2 | | | Level 3 | | | Total | |
| |
Short-Term Investments | | $ | 2,879,000 | | | $ | — | | | $ | — | | | $ | 2,879,000 | |
Other Financial Instruments* | | $ | — | | | $ | (236,886 | ) | | $ | — | | | $ | (236,886 | ) |
| | | | | | | | | | | | | | | | | |
| | | Direxion Monthly Developed Markets Bear 2X Fund | |
| | | Level 1 | | | Level 2 | | | Level 3 | | | Total | |
| |
Short-Term Investments | | $ | 7,248,719 | | | $ | — | | | $ | — | | | $ | 7,248,719 | |
Other Financial Instruments* | | $ | — | | | $ | 133,881 | | | $ | — | | | $ | 133,881 | |
| | | | | | | | | | | | | | | | | |
| | | Direxion Monthly China Bull 2X Fund | |
| | | Level 1 | | | Level 2 | | | Level 3 | | | Total | |
| |
Short-Term Investments | | $ | 12,911,719 | | | $ | — | | | $ | — | | | $ | 12,911,719 | |
Other Financial Instruments* | | $ | — | | | $ | (1,278,765 | ) | | $ | — | | | $ | (1,278,765 | ) |
| | | | | | | | | | | | | | | | | |
| | | U.S. Government Money Market Fund | |
| | | Level 1 | | | Level 2 | | | Level 3 | | | Total | |
| |
Short-Term Investments | | $ | 58,262,521 | | | $ | — | | | $ | — | | | $ | 58,262,521 | |
For further detail on each asset class, see the Schedule of Investments.
| | |
| * | | Other financial instruments are derivative instruments not reflected in the Schedule of Investments, such as futures and swap contracts.
Futures and swap contracts are valued at the unrealized appreciation (depreciation) on the instrument. |
There were no significant transfers between Level 1 and Level 2 securities during the year ended August 31, 2010.
| |
| 8. | ADDITIONAL DISCLOSURES ABOUT DERIVATIVE INSTRUMENTS |
The Funds have adopted authoritative standards of accounting for derivative instruments which establish disclosure requirement for derivative instruments. These standards improve financial reporting for derivative instruments by requiring enhanced disclosures that enables investors to understand how and why a fund uses derivatives instruments, how derivatives instruments are accounted for and how derivative instruments affect a fund’s financial position and results of operations.
DIREXION ANNUAL REPORT 65
The Funds use derivative instruments as part of their principal investment strategy to achieve their investment objective. For additional discussion on the risks associated with derivative instruments refer to Note 2. As of August 31, 2010, the Funds were invested in futures contracts, equity swap contracts and credit default swap contracts.
At August 31, 2010, the fair value of derivatives instruments were as follows:
| | | | | | | | | | | | | | | | | | | |
| Asset derivatives1 | |
| | |
| | | | | Interest rate risk | | | Credit risk | | | Equity risk | | | Total | |
| | |
| Direxion Monthly Small Cap | | Swap contracts | | $ | — | | | $ | — | | | $ | 671,873 | | | $ | 671,873 | |
| | | |
| | | |
| Bear 2X Fund | | Total | | $ | — | | | $ | — | | | $ | 671,873 | | | $ | 671,873 | |
| |
| |
| Direxion Monthly 10 Year Note | | Swap contracts | | $ | 611,599 | | | $ | — | | | $ | — | | | $ | 611,599 | |
| | | |
| | | |
| Bull 2X Fund | | Total | | $ | 611,599 | | | $ | — | | | $ | — | | | $ | 611,599 | |
| |
| |
| Dynamic HY Bond Fund | | Futures contracts* | | $ | — | | | $ | — | | | $ | 245 | | | $ | 245 | |
| | | Swap contracts | | | — | | | | — | | | | — | | | | — | |
| | | |
| | | |
| | | Total | | $ | — | | | $ | — | | | $ | 245 | | | $ | 245 | |
| |
| |
| HY Bear Fund | | Futures contracts* | | $ | — | | | $ | — | | | $ | 52,081 | | | $ | 52,081 | |
| | | Swap contracts | | | — | | | | 36,893 | | | | — | | | | 36,893 | |
| | | |
| | | |
| | | Total | | $ | — | | | $ | 36,893 | | | $ | 52,081 | | | $ | 88,974 | |
| |
| |
| Direxion Monthly Emerging | | Swap contracts | | $ | — | | | $ | — | | | $ | 112,795 | | | $ | 112,795 | |
| | | |
| | | |
| Markets Bear 2X Fund | | Total | | $ | — | | | $ | — | | | $ | 112,795 | | | $ | 112,795 | |
| |
| |
| Direxion Monthly Developed | | Swap contracts | | $ | — | | | $ | — | | | $ | 133,881 | | | $ | 133,881 | |
| | | |
| | | |
| Markets Bear 2X Fund | | Total | | $ | — | | | $ | — | | | $ | 133,881 | | | $ | 133,881 | |
| |
| |
| | |
| 1 | | Statement of Assets and Liabilities location: Unrealized appreciation on swaps and variation margin receivable. |
| * | | Cumulative appreciation (depreciation) of futures contracts as reported in the Schedule of Investments.
Only current day’s variation margin, if any, is reported within the Statement of Assets and Liabilities. |
| | | | | | | | | | | | | | | | | | | |
| Liability derivatives1 | |
| | |
| | | | | Interest rate risk | | | Credit risk | | | Equity risk | | | Total | |
| | |
| Direxion Monthly Small Cap | | Swap contracts | | $ | — | | | $ | — | | | $ | 1,019,943 | | | $ | 1,019,943 | |
| | | |
| | | |
| Bull 2X Fund | | Total | | $ | — | | | $ | — | | | $ | 1,019,943 | | | $ | 1,019,943 | |
| |
| |
| Direxion Monthly 10 Year Note | | Swap contracts | | $ | 916,299 | | | $ | — | | | $ | — | | | $ | 916,299 | |
| | | |
| | | |
| Bear 2X Fund | | Total | | $ | 916,299 | | | $ | — | | | $ | — | | | $ | 916,299 | |
| |
| |
| Dynamic HY Bond Fund | | Swap contracts | | $ | — | | | $ | 49,299 | | | $ | — | | | $ | 49,299 | |
| | | |
| | | |
| | | Total | | $ | — | | | $ | 49,299 | | | $ | — | | | $ | 49,299 | |
| |
| |
| Direxion Monthly Commodity | | Swap contracts | | $ | — | | | $ | — | | | $ | 3,495,221 | | | $ | 3,495,221 | |
| | | |
| | | |
| Bull 2X Fund | | Total | | $ | — | | | $ | — | | | $ | 3,495,221 | | | $ | 3,495,221 | |
| |
| |
| Direxion Monthly Emerging | | Swap contracts | | $ | — | | | $ | — | | | $ | 2,104,907 | | | $ | 2,104,907 | |
| | | |
| | | |
| Markets Bull 2X Fund | | Total | | $ | — | | | $ | — | | | $ | 2,104,907 | | | $ | 2,104,907 | |
| |
| |
| Direxion Monthly Developed | | Swap contracts | | $ | — | | | $ | — | | | $ | 236,886 | | | $ | 236,886 | |
| | | |
| | | |
| Markets Bull 2X Fund | | Total | | $ | — | | | $ | — | | | $ | 236,886 | | | $ | 236,886 | |
| |
| |
| Direxion Monthly China | | Swap contracts | | $ | — | | | $ | — | | | $ | 1,278,765 | | | $ | 1,278,765 | |
| | | |
| | | |
| Bull 2X Fund | | Total | | $ | — | | | $ | — | | | $ | 1,278,765 | | | $ | 1,278,765 | |
| |
| |
| | |
| 1 | | Statement of Assets and Liabilities location: Unrealized depreciation on swaps and variation margin payable. |
| | |
| * | | Cumulative appreciation (depreciation) of futures contracts as reported in the Schedule of Investments.
Only current day’s variation margin, if any, is reported within the Statement of Assets and Liabilities. |
Transactions in derivative instruments during the year ended August 31, 2010, were as follows:
| | | | | | | | | | | | | | | | | | | | | | | |
| | |
| | | | | Interest rate risk | | | Credit risk | | | Equity risk | | | Total | | | | |
| | |
| Direxion Monthly Small Cap | | Realized gain (loss)1 | | | | | | | | | | | | | | | | | | | | |
| Bull 2X Fund | | Swap contracts | | $ | — | | | $ | — | | | $ | (1,050,408 | ) | | $ | (1,050,408 | ) | | | | |
| | | |
| | | |
| | | Total realized gain (loss) | | $ | — | | | $ | — | | | $ | (1,050,408 | ) | | $ | (1,050,408 | ) | | | | |
| | | |
| | | |
| | | Change in unrealized appreciation (depreciation)2 | | | | | | | | | | | | | | | | | | | | |
| | | Swap contracts | | $ | — | | | $ | — | | | $ | (687,985 | ) | | $ | (687,985 | ) | | | | |
| | | |
| | | |
66 DIREXION ANNUAL REPORT
| | | | | | | | | | | | | | | | | | | | | | | |
| | |
| | | | | Interest rate risk | | | Credit risk | | | Equity risk | | | Total | | | | |
| | |
| | | Total change in unrealized appreciation (depreciation) | | $ | — | | | $ | — | | | $ | (687,985 | ) | | $ | (687,985 | ) | | | | |
| |
| |
| Direxion Monthly Small Cap | | Realized gain (loss)1 | | | | | | | | | | | | | | | | | | | | |
| Bear 2X Fund | | Swap contracts | | $ | — | | | $ | — | | | $ | (1,987,467 | ) | | $ | (1,987,467 | ) | | | | |
| | | |
| | | |
| | | Total realized gain (loss) | | $ | — | | | $ | — | | | $ | (1,987,467 | ) | | $ | (1,987,467 | ) | | | | |
| | | |
| | | |
| | | Change in unrealized appreciation (depreciation)2 | | | | | | | | | | | | | | | | | | | | |
| | | Swap contracts | | $ | — | | | $ | — | | | $ | 671,873 | | | $ | 671,873 | | | | | |
| | | |
| | | |
| | | Total change in unrealized appreciation (depreciation) | | $ | — | | | $ | — | | | $ | 671,873 | | | $ | 671,873 | | | | | |
| |
| |
| Direxion Monthly 10 Year Note | | Realized gain (loss)1 | | | | | | | | | | | | | | | | | | | | |
| Bull 2X Fund | | Futures contracts | | $ | 193,344 | | | $ | — | | | $ | — | | | $ | 193,344 | | | | | |
| | | Swap contracts | | | 4,642,968 | | | | — | | | | — | | | | 4,642,968 | | | | | |
| | | |
| | | |
| | | Total realized gain (loss) | | $ | 4,836,312 | | | $ | — | | | $ | — | | | $ | 4,836,312 | | | | | |
| | | |
| | | |
| | | Change in unrealized appreciation (depreciation)2 | | | | | | | | | | | | | | | | | | | | |
| | | Futures contracts | | $ | (87,800 | ) | | $ | — | | | $ | — | | | $ | (87,800 | ) | | | | |
| | | Swap contracts | | | 116,797 | | | | — | | | | — | | | | 116,797 | | | | | |
| | | |
| | | |
| | | Total change in unrealized appreciation (depreciation) | | $ | 28,997 | | | $ | — | | | $ | — | | | $ | 28,997 | | | | | |
| |
| |
| Direxion Monthly 10 Year Note | | Realized gain (loss)1 | | | | | | | | | | | | | | | | | | | | |
| Bear 2X Fund | | Futures contracts | | $ | (130,915 | ) | | $ | — | | | $ | — | | | $ | (130,915 | ) | | | | |
| | | Swap contracts | | | (5,171,878 | ) | | | — | | | | — | | | | (5,171,878 | ) | | | | |
| | | |
| | | |
| | | Total realized gain (loss) | | $ | (5,302,793 | ) | | $ | — | | | $ | — | | | $ | (5,302,793 | ) | | | | |
| | | |
| | | |
| | | Change in unrealized appreciation (depreciation)2 | | | | | | | | | | | | | | | | | | | | |
| | | Futures contracts | | $ | 55,336 | | | $ | — | | | $ | — | | | $ | 55,336 | | | | | |
| | | Swap contracts | | | (795,038 | ) | | | — | | | | — | | | | (795,038 | ) | | | | |
| | | |
| | | |
| | | Total change in unrealized appreciation (depreciation) | | $ | (739,702 | ) | | $ | — | | | $ | — | | | $ | (739,702 | ) | | | | |
| |
| |
| Dynamic HY Bond Fund | | Realized gain (loss)1 | | | | | | | | | | | | | | | | | | | | |
| | | Futures contracts | | $ | — | | | $ | — | | | $ | 142,972 | | | $ | 142,972 | | | | | |
| | | Swap contracts | | | — | | | | 9,810,828 | | | | — | | | | 9,810,828 | | | | | |
| | | |
| | | |
| | | Total realized gain (loss) | | $ | — | | | $ | 9,810,828 | | | $ | 142,972 | | | $ | 9,953,800 | | | | | |
| | | |
| | | |
| | | Change in unrealized appreciation (depreciation)2 | | | | | | | | | | | | | | | | | | | | |
| | | Futures contracts | | $ | — | | | $ | — | | | $ | (53,913 | ) | | $ | (53,913 | ) | | | | |
| | | Swap contracts | | | — | | | | (774,134 | ) | | | — | | | | (774,134 | ) | | | | |
| | | |
| | | |
| | | Total change in unrealized appreciation (depreciation) | | $ | — | | | $ | (774,134 | ) | | $ | (53,913 | ) | | $ | (828,047 | ) | | | | |
| |
| |
| HY Bear Fund | | Realized gain (loss)1 | | | | | | | | | | | | | | | | | | | | |
| | | Futures contracts | | $ | — | | | $ | — | | | $ | (647,962 | ) | | $ | (647,962 | ) | | | | |
| | | Swap contracts | | | — | | | | (3,946,994 | ) | | | — | | | | (3,946,994 | ) | | | | |
| | | |
| | | |
| | | Total realized gain (loss) | | $ | — | | | $ | (3,946,994 | ) | | $ | (647,962 | ) | | $ | (4,594,956 | ) | | | | |
| | | |
| | | |
| | | Change in unrealized appreciation (depreciation)2 | | | | | | | | | | | | | | | | | | | | |
| | | Futures contracts | | $ | — | | | $ | — | | | $ | 72,673 | | | $ | 72,673 | | | | | |
| | | Swap contracts | | | — | | | | 184,670 | | | | — | | | | 184,670 | | | | | |
| | | |
| | | |
| | | Total change in unrealized appreciation (depreciation) | | $ | — | | | $ | 184,670 | | | $ | 72,673 | | | $ | 257,343 | | | | | |
| |
| |
| Direxion Monthly Commodity | | Realized gain (loss)1 | | | | | | | | | | | | | | | | | | | | |
| Bull 2X Fund | | Swap contracts | | $ | — | | | $ | — | | | $ | 5,824,993 | | | $ | 5,824,993 | | | | | |
| | | |
| | | |
| | | Total realized gain (loss) | | $ | — | | | $ | — | | | $ | 5,824,993 | | | $ | 5,824,993 | | | | | |
| | | |
| | | |
| | | Change in unrealized appreciation (depreciation)2 | | | | | | | | | | | | | | | | | | | | |
| | | Swap contracts | | $ | — | | | $ | — | | | $ | (2,981,833 | ) | | $ | (2,981,833 | ) | | | | |
| | | |
| | | |
| | | Total change in unrealized appreciation (depreciation) | | $ | — | | | $ | — | | | $ | (2,981,833 | ) | | $ | (2,981,833 | ) | | | | |
| |
| |
DIREXION ANNUAL REPORT 67
| | | | | | | | | | | | | | | | | | | | | | | |
| | |
| | | | | Interest rate risk | | | Credit risk | | | Equity risk | | | Total | | | | |
| | |
| Direxion Monthly Emerging | | Realized gain (loss)1 | | | | | | | | | | | | | | | | | | | | |
| Markets Bull 2X Fund | | Swap contracts | | $ | — | | | $ | — | | | $ | (317,699 | ) | | $ | (317,699 | ) | | | | |
| | | |
| | | |
| | | Total realized gain (loss) | | $ | — | | | $ | — | | | $ | (317,699 | ) | | $ | (317,699 | ) | | | | |
| | | |
| | | |
| | | Change in unrealized appreciation (depreciation)2 | | | | | | | | | | | | | | | | | | | | |
| | | Swap contracts | | $ | — | | | $ | — | | | $ | (1,667,699 | ) | | $ | (1,667,699 | ) | | | | |
| | | |
| | | |
| | | Total change in unrealized appreciation (depreciation) | | $ | — | | | $ | — | | | $ | (1,667,699 | ) | | $ | (1,667,699 | ) | | | | |
| |
| |
| Direxion Monthly Emerging | | Realized gain (loss)1 | | | | | | | | | | | | | | | | | | | | |
| Markets Bear 2X Fund | | Swap contracts | | $ | — | | | $ | — | | | $ | (2,228,979 | ) | | $ | (2,228,979 | ) | | | | |
| | | |
| | | |
| | | Total realized gain (loss) | | $ | — | | | $ | — | | | $ | (2,228,979 | ) | | $ | (2,228,979 | ) | | | | |
| | | |
| | | |
| | | Change in unrealized appreciation (depreciation)2 | | | | | | | | | | | | | | | | | | | | |
| | | Swap contracts | | $ | — | | | $ | — | | | $ | 37,026 | | | $ | 37,026 | | | | | |
| | | |
| | | |
| | | Total change in unrealized appreciation (depreciation) | | $ | — | | | $ | — | | | $ | 37,026 | | | $ | 37,026 | | | | | |
| |
| |
| Developed Markets Bull 2X | | Realized gain (loss)1 | | | | | | | | | | | | | | | | | | | | |
| Fund | | Swap contracts | | $ | — | | | $ | — | | | $ | (1,517,058 | ) | | $ | (1,517,058 | ) | | | | |
| | | |
| | | |
| | | Total realized gain (loss) | | $ | — | | | $ | — | | | $ | (1,517,058 | ) | | $ | (1,517,058 | ) | | | | |
| | | |
| | | |
| | | Change in unrealized appreciation (depreciation)2 | | | | | | | | | | | | | | | | | | | | |
| | | Swap contracts | | $ | — | | | $ | — | | | $ | (258,052 | ) | | $ | (258,052 | ) | | | | |
| | | |
| | | |
| | | Total change in unrealized appreciation (depreciation) | | $ | — | | | $ | — | | | $ | (258,052 | ) | | $ | (258,052 | ) | | | | |
| |
| |
| Developed Markets Bear 2X | | Realized gain (loss)1 | | | | | | | | | | | | | | | | | | | | |
| Fund | | Swap contracts | | $ | — | | | $ | — | | | $ | (782,589 | ) | | $ | (782,589 | ) | | | | |
| | | |
| | | |
| | | Total realized gain (loss) | | $ | — | | | $ | — | | | $ | (782,589 | ) | | $ | (782,589 | ) | | | | |
| | | |
| | | |
| | | Change in unrealized appreciation (depreciation)2 | | | | | | | | | | | | | | | | | | | | |
| | | Swap contracts | | $ | — | | | $ | — | | | $ | 125,326 | | | $ | 125,326 | | | | | |
| | | |
| | | |
| | | Total change in unrealized appreciation (depreciation) | | $ | — | | | $ | — | | | $ | 125,326 | | | $ | 125,326 | | | | | |
| |
| |
| China Bull 2X Fund | | Realized gain (loss)1 | | | | | | | | | | | | | | | | | | | | |
| | | Swap contracts | | $ | — | | | $ | — | | | $ | (218,352 | ) | | $ | (218,352 | ) | | | | |
| | | |
| | | |
| | | Total realized gain (loss) | | $ | — | | | $ | — | | | $ | (218,352 | ) | | $ | (218,352 | ) | | | | |
| | | |
| | | |
| | | Change in unrealized appreciation (depreciation)2 | | | | | | | | | | | | | | | | | | | | |
| | | Swap contracts | | $ | — | | | $ | — | | | $ | 48,749 | | | $ | 48,749 | | | | | |
| | | |
| | | |
| | | Total change in unrealized appreciation (depreciation) | | $ | — | | | $ | — | | | $ | 48,749 | | | $ | 48,749 | | | | | |
| |
| |
| | |
| 1 | | Statement of Operations location: Net realized gain (loss) on futures and swaps. |
| 2 | | Statement of Operations location: Change in unrealized appreciation (depreciation) on futures and swaps. |
68 DIREXION ANNUAL REPORT
For the year ended August 31, 2010, the volume of the derivatives held by the Funds was as follows:
| | | | | | | | | | | | | | | | | | | | | | | | | |
| | | Quarterly Average Gross Notional Amounts | |
| | | | | | | | | | | | | | | Credit Default
| | | Credit Default
| |
| | | Long Futures
| | | Short Futures
| | | Long Equity
| | | Short Equity
| | | Swap Contracts
| | | Swap Contracts
| |
| | | Contracts | | | Contracts | | | Swaps Contracts | | | Swaps Contracts | | | Sell Protection | | | Buy Protection | |
| |
Direxion Monthly Small Cap Bull
2X Fund | | $ | — | | | $ | — | | | $ | 18,645,528 | | | $ | — | | | $ | — | | | $ | — | |
Direxion Monthly Small Cap
Bear 2X Fund | | | — | | | | — | | | | — | | | | 35,882,712 | | | | — | | | | — | |
| Direxion Monthly 10 Year Note Bull 2X Fund | | | 3,030,128 | | | | — | | | | 50,352,108 | | | | — | | | | — | | | | — | |
| Direxion Monthly 10 Year Note Bear 2X Fund | | | — | | | | 1,864,433 | | | | — | | | | 31,252,166 | | | | — | | | | — | |
| Dynamic HY Bond Fund | | | 4,539,917 | | | | — | | | | — | | | | — | | | | 30,645,600 | | | | — | |
| HY Bear Fund | | | — | | | | 2,969,428 | | | | — | | | | — | | | | — | | | | 27,489,000 | |
Direxion Monthly Commodity
Bull 2X Fund | | | — | | | | — | | | | 46,542,197 | | | | — | | | | — | | | | — | |
| Direxion Monthly Emerging Markets Bull 2X Fund | | | — | | | | — | | | | 54,357,450 | | | | — | | | | — | | | | — | |
| Direxion Monthly Emerging Markets Bear 2X Fund | | | — | | | | — | | | | — | | | | 14,801,830 | | | | — | | | | — | |
| Direxion Monthly Developed Markets Bull 2X Fund | | | — | | | | — | | | | 7,612,138 | | | | — | | | | — | | | | — | |
| Direxion Monthly Developed Markets Bear 2X Fund | | | — | | | | — | | | | — | | | | 5,952,200 | | | | — | | | | — | |
| Direxion Monthly China Bull 2X Fund | | | — | | | | — | | | | 23,652,406 | | | | — | | | | — | | | | — | |
The Funds, with the exception of the Dynamic HY Bond Fund and the HY Bear Fund, utilize this volume of derivatives in order to obtain leverage in order to meet the investment objectives of 200% (or -200%) calendar month performance of their respective index. The Dynamic HY Bond Fund and the HY Bear Fund utilize derivatives to obtain exposure to high-yield debt instruments.
| |
| 9. | NEW ACCOUNTING PRONOUNCEMENT |
In January 2010, the Financial Accounting Standards Board issued an update to improve disclosure about fair value measurements. This update required additional disclosures regarding fair value measurements. Specifically, the amendment requires reporting entities to disclose a) the input and valuation techniques used to measure fair value for both recurring and nonrecurring fair value measurements, for Level 2 or Level 3 positions, b) transfers between all levels (including Level 1 and Level 2) will be required to be disclosed on a gross basis (i.e. transfers out must be disclosed separately from transfers in) as well as the reason(s) for the transfers and c) purchases and sales must be shown on a gross basis in the Level 3 rollforward rather than as one net number.
The effective date of this guidance is for interim and annual periods beginning after December 15, 2009; however, the requirement to provide the Level 3 activity for purchases and sales on a gross basis will be effective for interim and annual periods beginning after December 15, 2010. The Funds have disclosed the applicable requirements of the accounting standard in their financial statements.
The Funds have adopted authoritative standards for accounting for and disclosure of events that occur after the balance sheet date but before financial statements are issued or are available to be issued. These standards require the Funds to recognize in the financial statements the effects of all recognized subsequent events that provide additional evidence about conditions that existed at the date of the balance sheet. For nonrecognized subsequent events that must be disclosed to keep the financial statements from being misleading, the Funds are required to disclose the nature of the event as well as an estimate of its financial effect, or a statement that such an estimate cannot be made. The Funds have evaluated subsequent events through the issuance of the Funds’ financial statements and have determined there is no impact to the Funds’ financial statements.
DIREXION ANNUAL REPORT 69
Direxion Funds
Report of Independent Registered Public Accounting Firm
To the Board of Trustees and Shareholders
of Direxion Funds:
We have audited the accompanying statements of assets and liabilities of the Direxion Monthly Small Cap Bull 2X Fund (formerly Small Cap Bull 2.5X Fund), Direxion Monthly Small Cap Bear 2X Fund (formerly Small Cap Bear 2.5X Fund), Direxion Monthly 10 Year Note Bull 2X Fund (formerly 10 Year Note Bull 2.5X Fund), Direxion Monthly 10 Year Note Bear 2X Fund (formerly 10 Year Note Bear 2.5X Fund), Dynamic HY Bond Fund, HY Bear Fund, Direxion Monthly Commodity Bull 2X Fund (formerly Commodity Bull 2X Fund), Direxion Monthly Emerging Markets Bull 2X Fund (formerly Emerging Markets Bull 2X Fund), Direxion Monthly Emerging Markets Bear 2X Fund (formerly Emerging Markets Bear 2X Fund), Direxion Monthly Developed Markets Bull 2X Fund (formerly Developed Markets Bull 2X Fund), Direxion Monthly Developed Markets Bear 2X Fund (formerly Developed Markets Bear 2X Fund), Direxion Monthly China Bull 2X Fund (formerly China Bull 2X Fund), and U.S. Government Money Market Fund (13 of the series of the Direxion Funds) (the “Funds”), including the schedules of investments, as of August 31, 2010, and the related statements of operations, the statements of changes in net assets, and the financial highlights for each of the periods indicated therein. These financial statements and financial highlights are the responsibility of the Funds’ management. Our responsibility is to express an opinion on these financial statements and financial highlights based on our audits.
We conducted our audits in accordance with the standards of the Public Company Accounting Oversight Board (United States). Those standards require that we plan and perform the audit to obtain reasonable assurance about whether the financial statements and financial highlights are free of material misstatement. We were not engaged to perform an audit of the Funds’ internal control over financial reporting. Our audits included consideration of internal control over financial reporting as a basis for designing audit procedures that are appropriate in the circumstances, but not for the purpose of expressing an opinion on the effectiveness of the Funds’ internal control over financial reporting. Accordingly, we express no such opinion. An audit also includes examining, on a test basis, evidence supporting the amounts and disclosures in the financial statements and financial highlights, assessing the accounting principles used and significant estimates made by management, and evaluating the overall financial statement presentation. Our procedures included confirmation of securities owned as of August 31, 2010, by correspondence with the custodian and brokers. We believe that our audits provide a reasonable basis for our opinion.
In our opinion, the financial statements and financial highlights referred to above present fairly, in all material respects, the financial position of the above mentioned 13 of the series of Direxion Funds at August 31, 2010, the results of their operations, the changes in their net assets, and the financial highlights for each of the periods indicated therein, in conformity with U.S. generally accepted accounting principles.
New York, New York
October 22, 2010
70 DIREXION ANNUAL REPORT
Additional Information
(Unaudited)
For the year ended August 31, 2010, certain dividends paid by the Funds may be subject to a maximum tax rate of 15%, as provided for by the Jobs and Growth Tax Relief Reconciliation Act of 2003. The amount of dividends declared from ordinary income designated as qualified income was 0%.
For corporate shareholders, the amount of ordinary income distributions qualifying for the corporate dividends received deduction for the year ended August 31, 2010 was 0%.
HOUSEHOLDING
In an effort to decrease costs, the Funds intend to reduce the number of duplicate prospectuses, Annual and Semi-Annual Reports, proxy statements and other similar documents you receive by sending only one copy of each to those addresses shared by two or more accounts and to shareholders we reasonably believe are from the same family or household. Householding begins once you have signed your account application. After such time, if you would like to discontinue householding for your accounts, please call toll-free at (800) 851-0511 to request individual copies of these documents. Once the Funds receive notice to stop householding, we will begin sending individual copies thirty days after receiving your request. This policy does not apply to account statements.
DIREXION ANNUAL REPORT 71
Investment Advisory and Subadvisory Agreements Approvals
Provided below is a summary of certain of the factors the Board considered at its August 18, 2010 Board meeting in renewing the Advisory Agreement between Rafferty Asset Management (“Rafferty”) and the Direxion Funds (the “Trust”), on behalf of the Direxion Monthly China Bull 2X Fund, Direxion Monthly Commodity Bull 2X Fund, Direxion Monthly Developed Markets Bull 2X Fund, Direxion Monthly Developed Markets Bear 2X Fund, Direxion Monthly Emerging Markets Bull 2X Fund, Direxion Monthly Emerging Markets Bear 2X Fund, Direxion Monthly Small Cap Bull 2X Fund, Direxion Monthly Small Cap Bear 2X Fund, Direxion Monthly 10 Year Note Bull 2X Fund, Direxion Monthly 10 Year Note Bear 2X Fund, Dynamic HY Bond Fund, HY Bear Fund and U.S. Government Money Market Fund, each a series of the Trust. Each series of the Trust is referred to herein as a “Fund” and collectively as the “Funds.” The Funds directly managed by Rafferty using a leveraged strategy are referred to as the “Leveraged-Index Funds.” The Funds directly managed by Rafferty other than the leveraged-index Funds are referred to as the “Non-Leveraged Funds.”
The Board did not identify any particular information that was most relevant to its consideration to approve the Advisory Agreement (“Agreement”) and each Trustee may have afforded different weight to the various factors. In determining whether to approve the continuance of the Agreement, the Board considered the best interests of each Fund separately. In addition, the Board noted that the Trustees have considered various reports and information provided throughout the year at their regular Board meetings and otherwise. While the Agreement for all of the Funds were considered at the same Board meeting, the Board considered each Fund’s investment advisory relationship separately.
In each instance, the Board considered, among other things, the following factors: (1) the nature and quality of the services provided; (2) the investment performance of the Fund to the extent applicable; (3) the cost to Rafferty for providing services and the profitability of the advisory business to Rafferty; (4) the extent to which economies of scale have been taken into account in setting fee schedules; (5) whether fee levels reflect these economies of scale, if any, for the benefit of Fund shareholders; (6) comparisons of services and fees with contracts entered into by Rafferty with other clients (such as pension funds and other institutional investors), if any; and (7) other benefits derived or anticipated to be derived by Rafferty from its relationship with the Funds.
Nature, Extent and Quality of Services Provided. The Board reviewed the nature, extent and quality of the services provided or to be provided under the Advisory Agreement by Rafferty. The Board noted that Rafferty has provided services to the Trusts since their inception and has developed an expertise in managing the Funds, particularly those using a leveraged strategy. The Board also noted that Rafferty trades efficiently with low commission schedules, which helps improve performance results. The Board considered Rafferty’s representation that it has the financial resources and appropriate staffing to manage the Funds and meet its expense reimbursement obligations, if any. The Board also considered that Rafferty utilizes the services of an independent compliance consulting firm and that reports from the chief compliance officer are provided to the Board at its regularly scheduled quarterly Board meetings. The Board considered that Rafferty oversees all aspects of the operation of the Funds, including oversight of the Funds’ service providers. Based on these and other considerations, the Board determined that, in the exercise of its business judgment, the nature, extent and quality of the services provided by Rafferty to the Funds under the Agreement were fair and reasonable.
Performance of the Funds. The Board considered quarterly reports throughout the year related to the performance of the Leveraged-Index Funds. In addition, the Board evaluated the performance of the Leveraged-Index Funds relative to: (1) performance models for the year-to-date period ended June 30, 2010; and (2) market indices for the year-to-date period ended June 30, 2010. The Board considered Rafferty’s explanation that the Leveraged-Index Funds’ performance is more appropriately compared to the models rather than to the market indices. The Board also considered Rafferty’s explanation that the Leveraged-Index Funds are difficult to categorize with other Lipper peer group funds because the Funds seek daily investment results that are leveraged and the Lipper peer group funds generally do not.
The Board noted Rafferty’s explanation that the performance of a Leveraged-Index Fund and its model typically will differ materially from the performance of the Fund’s benchmark index because the benchmark index’s performance does not reflect the effects of a leveraged investment strategy. In addition, the Board noted Rafferty’s representation that the underperforming Leveraged-Index Funds generally underperformed their models due to a combination of factors, most
72 DIREXION ANNUAL REPORT
notably: (1) that a Leveraged-Index Fund’s performance will be adversely affected by fund expenses and cash flows into and out of the Fund, which are not factors that impact the performance of the Funds’ models and benchmark indices; (2) tracking differences between the futures contracts held by certain of the Leveraged-Index Funds and the securities included in their benchmark indices; and (3) daily price deviations between the time when Rafferty rebalanced the Leveraged-Index Funds’ portfolios and the close of the markets. The Board noted that the Funds’ models are not affected by these daily deviations.
The Board also evaluated the performance of each Non-Leveraged Fund relative to: (1) its benchmark index for monthly and annual periods ended July 31, 2010, where applicable; and (2) the average performance of the relevant Lipper fund universe for monthly and annual periods ended June 30, 2010. Although the Board received monthly performance reports for its consideration, the Board generally assigned more weight to the longer-term performance of the Funds. In this regard, the Board for all Funds noted the challenging nature of the markets for the calendar years 2008 and 2009.
Leveraged-Index Funds:
With respect to the Direxion Monthly China Bull 2X Fund, the Board considered that the Fund outperformed its model for the relevant period ended June 30, 2010.
With respect to the Direxion Monthly Commodity Bull 2X Fund, the Board considered that the Fund outperformed its model for the relevant period ended June 30, 2010.
With respect to the Direxion Monthly Developed Markets Bull 2X Fund, the Board considered that the Fund underperformed its model for the relevant period ended June 30, 2010. The Board noted that the amount by which the Fund underperformed its model was less than the Fund’s annualized expense ratio.
With respect to the Direxion Monthly Developed Markets Bear 2X Fund, the Board considered that the Fund outperformed its model for the relevant period ended June 30, 2010.
With respect to the Direxion Monthly Emerging Markets Bull 2X Fund, the Board considered that the Fund underperformed its model for the relevant period ended June 30, 2010. The Board noted that the amount by which the Fund underperformed its model was less than the Fund’s annualized expense ratio.
With respect to the Direxion Monthly Emerging Markets Bear 2X Fund, the Board considered that the Fund underperformed its model for the relevant period ended June 30, 2010. The Board noted that the amount by which the Fund underperformed its model was less than the Fund’s annualized expense ratio.
With respect to the Direxion Monthly Small Cap Bull 2X Fund, the Board considered that the Fund outperformed its model for the relevant period ended June 30, 2010.
With respect to the Direxion Monthly Small Cap Bear 2X Fund, the Board considered that the Fund underperformed its model for the relevant period ended June 30, 2010. The Board noted that the amount by which the Fund underperformed its model was less than the Fund’s annualized expense ratio.
With respect to the Direxion Monthly 10 Year Note Bull 2X Fund, the Board considered that the Fund underperformed its model for the relevant period ended June 30, 2010. The Board noted that the amount by which the Fund underperformed its model was less than the Fund’s annualized expense ratio.
With respect to the Direxion Monthly 10 Year Note Bear 2X Fund, the Board considered that the Fund underperformed its model for the relevant period ended June 30, 2010. The Board noted that the amount by which the Fund underperformed its model was less than the Fund’s annualized expense ratio.
DIREXION ANNUAL REPORT 73
Non-Leveraged Funds:
With respect to the Dynamic HY Bond Fund, the Board considered management’s description of the performance of the Lipper universe of high current yield funds. The Board also considered that: (1) as of July 31, 2010, the Fund underperformed its benchmark index for all periods presented; and (2) as of June 30, 2010, the Fund outperformed the average of the relevant Lipper fund universe for the six-month period, and underperformed for the three-month, one- and three-year periods. The Board noted Rafferty’s representation that historically the Fund has invested in high yield debt instruments and derivatives of such instruments, including derivatives which isolate the credit component of such high yield instruments and do not provide general interest rate exposure. Rafferty noted that this lack of interest rate exposure is the single largest factor that explains the relative performance between the Fund and its peers.
With respect to the HY Bear Fund, the Board considered that, as of June 30, 2010, the Fund outperformed the median of the relevant Lipper fund universe for all periods presented.
With respect to the U.S. Government Money Market Fund, the Board considered that the Fund outperformed the median of the relevant Lipper fund universe for the three-month, six-month and one-year periods, and underperformed for the three-year period. The Board noted that the Fund’s three-and six-month performance records were ranked first in its Lipper fund universe.
Costs of Services Provided to the Funds and Profits Realized. The Board considered the overall fees paid to Rafferty on an annual basis since each Fund’s commencement of operations, including any fee waivers and recoupment of fees previously waived. With respect to the Leveraged-Index Funds, the Board also considered advisory fees charged by, and total expense ratios of, comparable fund groups. In this regard, management advised the Board that the advisory fees for each of the Leveraged-Index Funds is similar to and, in some cases lower than, the advisory fees for the comparable fund groups. The Board also considered that the total expense ratios for the Leveraged-Index Funds are generally higher than comparable funds. However, Rafferty indicated that the comparable fund groups have higher asset levels, which account in part for their lower total expense ratios. The Board also considered the fees that Rafferty charges for the services that it provides to a pooled trading vehicle for domestic hedge funds.
With respect to the Dynamic HY Bond Fund, the Board considered that the Fund’s total expenses and advisory fee rate were above the median of the relevant Lipper fund universe. In this regard, the Board noted Rafferty’s representation that the Fund’s higher expenses were in part due to the increased level of transaction costs incurred by the Fund as a result of record shareholder activity. With respect to the HY Bear Fund, the Board considered that, while the Fund’s advisory fee rate was equal to the median of the relevant Lipper fund universe and the Fund’s total expenses were higher than the median, this universe consists only of three funds, including the HY Bear Fund. With respect to the U.S. Government Money Market Fund, the Board considered that the Fund’s advisory fee rate and total expenses were higher than the median of the relevant Lipper fund universe. In this regard, the Board noted that Rafferty has agreed to voluntarily cap its investment advisory fee and/or reimburse certain expenses of the U.S. Government Money Market Fund to the extent that it becomes necessary in order to maintain a positive yield.
The Board considered that Rafferty contractually agreed to limit the total expenses for the most recent and upcoming fiscal years for each Leveraged-Index Fund and Non-Leveraged Fund via fee waivers and/or expense limitations. The Board also considered the overall profitability of Rafferty’s investment business and its representation that it does not allocate internal costs and assess profitability with respect to its services to individual Funds. Based on these considerations, the Board determined that, in the exercise of its business judgment, the costs of the services provided and the profits realized under the Advisory Agreement were fair and reasonable.
Economies of Scale. The Board considered Rafferty’s representation that it believes that asset levels at this time are not sufficient to achieve economies of scale or warrant a reduction in fee rates or the addition of breakpoints. Rafferty noted that it was continuing to work on its sales and marketing efforts to raise additional assets. Based on these and other considerations, the Board determined that, in the exercise of its business judgment, the reduction in fee rates or additions of breakpoints were not necessary at this time.
74 DIREXION ANNUAL REPORT
Other Benefits. The Board considered Rafferty’s representation that its relationship with the Funds has permitted Rafferty to attract business to its non-mutual fund account. The Board also considered that Rafferty’s overall business with brokerage firms helps to lower commission rates and provide better execution for Fund portfolio transactions. Based on these and other considerations, the Board determined that, in the exercise of its business judgment, the benefits were fair and reasonable.
Conclusion. Based on, but not limited to, the above considerations and determinations, the Board determined that the Agreement for the Funds was fair and reasonable in light of the services to be performed, fees, expenses and such other matters as the Board considered relevant in the exercise of its business judgment. On this basis, the Board unanimously voted in favor of the continuance of the Agreement.
DIREXION ANNUAL REPORT 75
Direxion Funds
TRUSTEES AND OFFICERS
The business affairs of each Fund are managed by or under the direction of the Board of Trustees. Information pertaining to the Trustees and Officers of the Funds is set forth below. The SAI includes additional information about the Funds’ Trustee and Officers and is available without charge, upon request by calling 1-800-851-0511.
Interested Trustees
| | | | | | | | | | | | | |
| | | | | | | | | # of Portfolios
| | | |
| | | | | | | | | in Direxion
| | | |
| | | Position(s)
| | Term of Office
| | | | Complex
| | | Other Trusteeships/
|
| | | Held with
| | and Length of
| | Principal Occupation(s)
| | Overseen by
| | | Directorships Held
|
Name, Address and Age | | Fund | | Time Served | | During Past Five Years | | Trustee(2) | | | by Trustee |
| |
Lawrence C. Rafferty(1) | | | | | | | | | | | | |
| Age: 68 | | Chairman of the Board of Trustees | | Lifetime of Trust until removal or resignation; Since 1997 | | Chairman and Chief Executive Officer of Rafferty, 1997-present; Chief Executive Officer of Rafferty Companies, LLC, 1996-present; Chief Executive Officer of Rafferty Capital Markets, Inc., 1995-present. | | | 135 | | | Board of Trustees, Fairfield University; Board of Directors, St. Vincent’s Services; Executive Committee, Metropolitan Golf Association |
| |
| |
Non-Interested Trustees
| | | | | | | | | | | | | |
| | | | | | | | | # of Portfolios
| | | |
| | | | | | | | | in Direxion
| | | |
| | | Position(s)
| | Term of Office
| | | | Complex
| | | Other Trusteeships/
|
| | | Held with
| | and Length of
| | Principal Occupation(s)
| | Overseen by
| | | Directorships Held
|
Name, Address and Age | | Fund | | Time Served | | During Past Five Years | | Trustee(2) | | | by Trustee |
| |
| Daniel J. Byrne | | | | | | | | | | | | |
| Age: 66 | | Trustee | | Lifetime of Trust until removal or resignation; Since 1997 | | President and Chief Executive Officer of Byrne Securities Inc., 1992-present. | | | 135 | | | Trustee, The Opening Word Program, Wyandanch, New York |
| |
| |
| Gerald E. Shanley III | | | | | | | | | | | | |
| Age: 66 | | Trustee | | Lifetime of Trust until removal or resignation; Since 1997 | | Business Consultant, 1985-present; C.P.A. 1979-present. | | | 135 | | | Trustee of Trust Under Will of Charles S. Payson |
| |
| |
| John Weisser | | | | | | | | | | | | |
| Age: 68 | | Trustee | | Lifetime of Trust until removal or resignation; Since 2007 | | Retired, Since 1995; Salomon Brothers, Inc, 1971-1995, most recently as Managing Director. | | | 135 | | | Director, MainStay VP Fund Series; Director ICAP Funds, Inc; Director, The MainStay Funds; Director, Eclipse Funds, Inc. |
| |
| |
76 DIREXION ANNUAL REPORT
Direxion Funds
TRUSTEES AND OFFICERS
Officers
| | | | | | | | | | | | | |
| | | | | | | | | # of Portfolios
| | | |
| | | | | | | | | in Direxion
| | | |
| | | Position(s)
| | Term of Office
| | | | Complex
| | | Other Trusteeships/
|
| | | Held with
| | and Length of
| | Principal Occupation(s)
| | Overseen by
| | | Directorships Held
|
Name, Address and Age | | Fund | | Time Served | | During Past Five Years | | Trustee(2) | | | by Trustee |
| |
| Daniel D. O’Neill | | | | | | | | | | | | |
| Age: 42 | | President; Chief Operating Officer and Chief Investment Officer | | One Year; Since 1999
One Year; Since 2006 | | Managing Director of Rafferty, 1999-present. | | | N/A | | | N/A |
| |
| |
| William Franca | | | | | | | | | | | | |
| Age: 53 | | Executive Vice President – Head of Distribution | | One Year; Since 2006 | | Senior Vice President – National Sales, Massachusetts Financial Services/SunLife Financial Distributors, 2002-2004; Executive Vice President, Distribution, SunLife, 2001-2002. | | | N/A | | | N/A |
| |
| |
| Christopher Lewis | | | | | | | | | | | | |
| Age: 39 | | Chief Compliance Officer | | One Year; Since 2009 | | Director, Alaric Compliance Services, LLC, 2009 – present; Partner, Thacher Proffitt & Wood LLP, 2004-2008; Partner, Simmons & Simmons, 2002-2004. | | | N/A | | | N/A |
| |
| |
| Patrick J. Rudnick 615 East Michigan Street Milwaukee, WI 53202 | | | | | | | | | | | | |
| Age: 37 | | Principal Financial Officer and Treasurer3 | | One Year;
Since 2010 | | Vice President, U.S. Bancorp Fund Services LLC, since 2006; Manager, PricewaterhouseCoopers LLP, 1999-2006. | | | N/A | | | N/A |
| |
| |
| Eric W. Falkeis 615 East Michigan Street Milwaukee, WI 53202 | | | | | | | | | | | | |
| Age: 37 | | Secretary | | One Year; Since 2004 | | Senior Vice President, U.S. Bancorp Fund Services, LLC, since September 2007; Chief Financial Officer, U.S. Bancorp Fund Services, LLC, since April 2006; Vice President, U.S. Bancorp Fund Services LLC, 1997-present; formerly, Chief Financial Officer, Quasar Distributors, LLC,
2000-2003. | | | N/A | | | N/A |
| |
| |
| | |
| (1) | | Mr. Rafferty is affiliated with Rafferty. Mr. Rafferty is the Chairman and Chief Executive Officer of Rafferty and owns a beneficial interest in Rafferty. |
| |
| (2) | | The Direxion Complex consists of the Direxion Funds which currently offers for sale to the public 32 portfolios, the Direxion Insurance Trust which currently offers for sale 1 portfolio and the Direxion ETF Trust which currently offers for sale to the public 34 of the 102 funds currently registered with the SEC. |
| |
| (3) | | Mr. Rudnick replaced Guy F Talarico as Principal Financial Officer and Treasurer effective June 1, 2010. |
| |
| | The address for all trustees and officers except Patrick J. Rudnick and Eric W. Falkeis is 33 Whitehall St., New York, NY 10004. |
DIREXION ANNUAL REPORT 77
THIS PAGE INTENTIONALLY LEFT BLANK
THIS PAGE INTENTIONALLY LEFT BLANK
THIS PAGE INTENTIONALLY LEFT BLANK
PRIVACY NOTICE
At the Direxion Funds, we are committed to protecting your privacy. To open and service your Direxion accounts, we collect and maintain certain nonpublic personal information about you, such as your address, phone number, social security number, purchases, sales, account balances, bank account information and other personal financial information. We collect this information from the following sources:
| |
| • | Account applications or other forms on which you provide information, |
| • | Mail, e-mail, the telephone and our website, and |
| • | Your transactions and account inquiries with us. |
We safeguard the personal information that you have entrusted to us in the following ways:
| |
| • | As a general policy, only those employees who maintain your account and respond to your requests for additional services have access to your account information. |
| • | We maintain physical, electronic, and procedural safeguards to insure the security of your personal information and to prevent unauthorized access to your information. |
We do not disclose any nonpublic personal information about you or our former shareholders to anyone, except as permitted or required by law. In the course of conducting business and maintaining your account we may share shareholder information, as allowed by law, with our affiliated companies and with other service providers, including financial intermediaries, custodians, transfer agents and marketing consultants. Those companies are contractually bound to use that information only for the services for which we hired them. They are not permitted to use or share our shareholders’ nonpublic personal information for any other purpose. There also may be times when we provide information to federal, state or local authorities as required by law.
In the event that you hold fund shares of Direxion through a financial intermediary, including, but not limited to, a broker-dealer, bank, or trust company, the privacy policy of your financial intermediary would govern how your nonpublic personal information would be shared with nonaffiliated third parties.
For questions about our policy, please contact us at (800) 851-0511.
This page is not a part of the annual report.
DIREXION ANNUAL REPORT PN-1
ANNUAL REPORT AUGUST 31, 2010
33 Whitehall Street, 10th Floor New York, New York 10004 (800) 851-0511
Investment Adviser
Rafferty Asset Management, LLC
33 Whitehall St. 10th Floor
New York, NY 10004
Administrator, Transfer Agent, Dividend
Paying Agent & Shareholding Servicing
Agent
U.S. Bancorp Fund Services, LLC
P.O. Box 1993
Milwaukee, WI 53201-1993
Custodian
U.S. Bank, N.A.
1555 RiverCenter Dr., Suite 302
Milwaukee, WI 53212
Independent Registered Public Accounting Firm
Ernst & Young LLP
5 Times Square
New York, NY 10036
Distributor
Rafferty Capital Markets, LLC
59 Hilton Avenue
Garden City, NY 11530
The Fund’s Proxy Voting Policies are available without charge by calling 1-800-851-0511, or by accessing the SEC’s website, at www.sec.gov.
The actual voting records relating to portfolio securities during the most recent period ended June 30 (starting with the year ended June 30, 2005) is available without charge by calling 1-800-851-0511 or by accessing the SEC’s website at www.sec.gov.
The Funds file its complete schedule of portfolio holdings with the commission for the first and third quarters of each fiscal year on Form N-Q. The Form N-Q is available without change, upon request, by calling 1-800-851-0511, or by accessing the SEC’s website, at www.sec.gov. The Funds’ Forms N-Q may be reviewed and copied at the Commission’s Public Reference Room in Washington, D.C. Information on the operation of the Public Reference Room may be obtained by calling 1-800-SEC-0330.
This report has been prepared for shareholders and may be distributed to others only if preceded or accompanied by a current prospectus.
ANNUAL REPORT AUGUST 31, 2010
Evolution Managed Bond Fund
Evolution All-Cap Equity Fund
Evolution Market Leaders Fund
Evolution Alternative Investment Fund
33 Whitehall Street, 10th Floor
New York, New York 10004
(800) 851-0511
Table of Contents
| | | | | |
| | | | | |
| Letter to Shareholders | | | 2 | |
| | | | | |
| Performance Summary | | | 3 | |
| | | | | |
| Expense Example | | | 7 | |
| | | | | |
| Allocation of Portfolio Holdings | | | 9 | |
| | | | | |
| Schedule of Investments | | | 10 | |
| | | | | |
| Financial Statements | | | 18 | |
| | | | | |
| Financial Highlights | | | 24 | |
| | | | | |
| Notes to the Financial Statements | | | 25 | |
| | | | | |
| Report of Independent Registered Public Accounting Firm | | | 36 | |
| | | | | |
| Additional Information | | | 37 | |
| | | | | |
| Investment Advisory and Subadvisory Agreement Approvals | | | 38 | |
| | | | | |
| Information on Board of Trustees and Officers | | | 40 | |
Letter to Shareholders
Dear Shareholders,
This Annual Report for the Evolution Funds covers the period from September 1, 2009 to August 31, 2010 (the “Annual Period”). This report covers the Evolution Managed Bond Fund, Evolution All-Cap Equity Fund, Evolution Market Leaders Fund and Evolution Alternative Investment Fund. Flexible Plan Investments, Ltd. serves as the sub-advisor to the Evolution Funds. During the Annual Period, the DJ Industrial Average Index returned 8.39%, the S&P 500 Index returned 4.91% and the NASDAQ-100 Index returned 9.50%.
By the beginning of the Annual Period, the markets had recovered some of the losses experienced in 2008 and early 2009 and volatility had begun to return to more normalized levels. However, despite substantial governmental stimulus and low interest rates, economic growth remained weak and the markets reflected the uncertainty of the economic picture. Equity markets were strong from the beginning of the period through the end of April but declined sharply from May through August. Fixed income markets continued to rally as fiscal concerns were pushed aside by the search for yield. The outlook for the domestic and global economies remained uncertain and job growth was very weak during the period. In Europe, the sovereign debt crisis in Greece and potential problems in Ireland and Spain left markets unsettled. Finally, China’s tightening of monetary policy and efforts to curb an overvalued real estate market raised concerns about continued growth there.
The Evolution Managed Bond Fund seeks the highest appreciation on an annual basis consistent with a high tolerance for risk. The Evolution Managed Bond Fund returned 7.78% on a total return basis during the Annual Period, compared to 9.18% for the Barclay Capital U.S. Aggregate Bond Index.
The Evolution All-Cap Equity Fund seeks the highest appreciation on an annual basis consistent with a high tolerance for risk. The Evolution All-Cap Equity Fund returned -18.81% on a total return basis during the Annual Period, compared to 4.91% for the S&P 500 Index.
The Evolution Market Leaders Fund seeks the highest appreciation on an annual basis consistent with a high tolerance for risk. The Evolution Market Leaders Fund returned 5.29% on a total return basis during the Annual Period, compared to 5.75% for the Wilshire 5000 Total Market Index.
The Evolution Alternative Investment Fund seeks high total return on an annual basis consistent with a high tolerance for risk. The Evolution Alternative Investment Fund returned -2.26% on a total return basis during the Annual Period, compared to 4.91% for the S&P Index and 9.18% for the Barclays Capital U.S. Aggregate Bond Index.
As always, we thank you for using the Direxion Funds and we look forward to our mutual success.
Best Regards,
| | | |
 | |  |
| | | |
| Daniel O’Neill | | Jerry Wagner |
| Direxion Funds | | Flexible Plan Investments, Ltd. |
The performance data quoted represents past performance; past performance does not guarantee future results. The investment return and principal value of an investment will fluctuate and an investor’s shares, when redeemed, may be worth more or less than their original cost. Current performance may be higher or lower than the performance data quoted.
The total annual fund operating expense ratios of the Evolution Managed Bond Fund, Evolution All-Cap Equity Fund, Evolution Market Leaders Fund and Evolution Alternative Investment Fund is 2.15%, 1.96%, 2.25% and 2.60% respectively, net of any fee, waivers or expense reimbursements.*
An investment in any of the Direxion Funds is subject to a number of risks that could affect the value of its shares. It is important that investors closely review and understand these risks before making an investment. An investor should consider the investment objectives, risks, charges and expenses of the Direxion Funds carefully before investing. The prospectus contains this and other information about the Direxion Funds. To obtain a prospectus, please call the Direxion Funds at 1 800-851-0511. The prospectus should be read carefully before investing.
Distributed by: Rafferty Capital Markets, LLC
Date of First Use: October 22, 2010
| |
| * | The total annual fund operating expense ratios include Acquired Fund Fees and Expenses, indirect fees and expenses that the Funds incur that are required to be disclosed. Without Acquired Fund Fees and Expenses, total annual fund operating expense ratios would be 1.90% for each Fund. |
Evolution Managed Bond Fund
April 1, 20041 - August 31, 2010 (Unaudited)
Investment Objective: Seeks the highest appreciation on an annual basis consistent with a high tolerance for risk.
| | | | | | | | | | | | | | |
| | | Average Annual Total Return2 |
| | | | | | | | | | Since
|
| | | 1 Year | | | 3 Years | | 5 Years | | Inception |
| |
Evolution Bond Fund | | | 7.78% | | | | 4.17% | | | 2.38% | | | 1.18% |
S&P 500 Index | | | 4.91% | | | | (8.66%) | | | (0.91%) | | | 0.86% |
Lipper High Yield Bond Index | | | 19.59% | | | | 4.96% | | | 5.23% | | | 5.78% |
Barclays Capital U.S. Aggregate Bond Index | | | 9.18% | | | | 7.65% | | | 10.13% | | | 5.37% |
This chart illustrates the performance of a hypothetical $10,000 investment made on the Fund’s inception, and is not intended to imply any future performance. The returns shown do not reflect the deduction of taxes that a shareholder would pay on fund distributions of the redemption of fund shares. The performance of the S&P 500 Index, Lipper High Yield Bond Index and Barclays Capital U.S. Aggregate Bond Index does not reflect the deduction of fees associated with a mutual fund, such as investment management fees. Investors cannot invest directly in an index, although they can invest in its underlying securities. During the period shown, Rafferty Asset Management, LLC waived and/or reimbursed fees for various expenses. Had these waivers and/or reimbursements not been in effect, performance would have been lower.
The performance data shown represents past performance and does not guarantee future results.
Market Exposure
| | | | | |
| | | %
| |
Investment Type | | Net Assets | |
| |
Investment Companies | | | 96.8% | |
| | | | | |
Total Exposure | | | 96.8% | |
| | | | | |
“Market Exposure” includes the value of total investments (including the contract value of any derivatives) and excludes any short-term investments and cash equivalents divided by Net Assets.
| |
| 1 | Commencement of operations. |
| 2 | As of August 31, 2010. |
DIREXION ANNUAL REPORT 3
Evolution All-Cap Equity Fund
April 1, 20041 - August 31, 2010 (Unaudited)
Investment Objective: Seeks high appreciation on an annual basis consistent with a high tolerance for risk.
| | | | | | | | | | | | | | |
| | | Average Annual Total Return2 |
| | | | | | | | | | Since
|
| | | 1 Year | | | 3 Years | | 5 Years | | Inception |
| |
Evolution All-Cap Equity Fund | | | (18.81%) | | | | (16.44%) | | | (6.28%) | | | (4.03%) |
S&P 500 Index | | | 4.91% | | | | (8.66%) | | | (0.91%) | | | 0.86% |
This chart illustrates the performance of a hypothetical $10,000 investment made on the Fund’s inception, and is not intended to imply any future performance. The returns shown do not reflect the deduction of taxes that a shareholder would pay on fund distributions of the redemption of fund shares. The performance of the S&P 500 Index does not reflect the deduction of fees associated with a mutual fund, such as investment management fees. Investors cannot invest directly in an index, although they can invest in its underlying securities. During the period shown, Rafferty Asset Management, LLC waived and/or reimbursed fees for various expenses. Had these waivers and/or reimbursements not been in effect, performance would have been lower.
The performance data shown represents past performance and does not guarantee future results.
Market Exposure
| | | | | |
| | | %
| |
Investment Type | | Net Assets | |
| |
Common Stock | | | 58.6% | |
Investment Companies | | | 11.1% | |
Futures Contracts | | | (22.1% | ) |
| | | | | |
Total Exposure | | | 47.6% | |
| | | | | |
“Market Exposure” includes the value of total investments (including the contract value of any derivatives) and excludes any short-term investments and cash equivalents divided by Net Assets.
| |
| 1 | Commencement of operations. |
| 2 | As of August 31, 2010. |
4 DIREXION ANNUAL REPORT
Evolution Market Leaders Fund
January 27, 20061 - August 31, 2010 (Unaudited)
Investment Objective: Seeks high appreciation on an annual basis consistent with a high tolerance for risk.
| | | | | | | | | | | |
| | | Average Annual Total Return2 |
| | | | | | | | Since
|
| | | 1 Year | | | 3 Years | | Inception |
| |
Evolution Market Leaders Fund | | | 5.29% | | | | (13.89%) | | | (10.44%) |
S&P 500 Index | | | 4.91% | | | | (8.66%) | | | (2.22%) |
Wilshire 5000 Total Market Index | | | 5.75% | | | | (8.13%) | | | (1.95%) |
This chart illustrates the performance of a hypothetical $10,000 investment made on the Fund’s inception, and is not intended to imply any future performance. The returns shown do not reflect the deduction of taxes that a shareholder would pay on fund distributions of the redemption of fund shares. The performance of the S&P 500 Index and the Wilshire 5000 Total Market Index does not reflect the deduction of fees associated with a mutual fund, such as investment management fees. Investors cannot invest directly in an index, although they can invest in its underlying securities. During the period shown, Rafferty Asset Management, LLC waived and/or reimbursed fees for various expenses. Had these waivers and/or reimbursements not been in effect, performance would have been lower.
The performance data shown represents past performance and does not guarantee future results.
Market Exposure
| | | | | |
| | | %
| |
Investment Type | | Net Assets | |
| |
Investment Companies | | | 98.1% | |
| | | | | |
Total Exposure | | | 98.1% | |
| | | | | |
“Market Exposure” includes the value of total investments (including the contract value of any derivatives) and excludes any short-term investments and cash equivalents divided by Net Assets.
| |
| 1 | Commencement of operations. |
| 2 | As of August 31, 2010. |
DIREXION ANNUAL REPORT 5
Evolution Alternative Investment Fund
January 26, 20061 - August 31, 2010 (Unaudited)
Investment Objective: Seeks high total return on an annual basis consistent with a high tolerance for risk.
| | | | | | | | | | | |
| | | Average Annual Total Return2 |
| | | | | | | | Since
|
| | | 1 Year | | | 3 Years | | Inception |
| |
Evolution Alternative Investment Fund | | | (2.26%) | | | | (7.19%) | | | (3.74%) |
S&P 500 Index | | | 4.91% | | | | (8.66%) | | | (2.06%) |
Barclays Capital U.S. Aggregate Bond Index | | | 9.18% | | | | 7.65% | | | 6.61% |
Credit Suisse/Tremont Hedge Fund Index | | | 8.89% | | | | 1.12% | | | 4.43% |
This chart illustrates the performance of a hypothetical $10,000 investment made on the Fund’s inception, and is not intended to imply any future performance. The returns shown do not reflect the deduction of taxes that a shareholder would pay on fund distributions of the redemption of fund shares. The performance of the S&P 500 Index, the Barclays Capital U.S. Aggregate Bond Index and the Credit Suisse/Tremont Hedge Fund Index does not reflect the deduction of fees associated with a mutual fund, such as investment management fees. Investors cannot invest directly in an index, although they can invest in its underlying securities. During the period shown, Rafferty Asset Management, LLC waived and/or reimbursed fees for various expenses. Had these waivers and/or reimbursements not been in effect, performance would have been lower.
The performance data shown represents past performance and does not guarantee future results.
Market Exposure
| | | | | |
| | | %
| |
Investment Type | | Net Assets | |
| |
Investment Companies | | | 75.8% | |
Futures Contracts | | | 8.2% | |
| | | | | |
Total Exposure | | | 84.0% | |
| | | | | |
“Market Exposure” includes the value of total investments (including the contract value of any derivatives) and excludes any short-term investments and cash equivalents divided by Net Assets.
| |
| 1 | Commencement of operations. |
6 DIREXION ANNUAL REPORT
Expense Example
August 31, 2010 (Unaudited)
As a shareholder of a mutual fund, you incur two types of costs: (1) transaction costs, including sales charges (loads) on purchase payments, reinvested dividends, or other distributions; redemption fees; and exchange fees; and (2) ongoing costs, including management fees; distribution and/or service fees; and other fund expenses. This example is intended to help you understand your ongoing costs (in dollars) of investing in a fund and to compare costs with the ongoing costs of investing in other mutual funds.
The example is based on an investment of $1,000 invested at the beginning of the period and held the entire period (March 1, 2010 — August 31, 2010).
Actual Expenses
The first line of the table below provides information about actual account values and actual expenses. Although the Funds charge no sales load or transactions fees, you will be assessed fees for outgoing wire transfers, returned checks or stop payment orders at prevailing rates charged by U.S. Bancorp Fund Services, LLC, the Funds’ transfer agent. If you request a redemption be made by wire transfer, currently a $15.00 fee is charged by the Funds’ transfer agent. To the extent a Fund invests in shares of other investment companies as part of its investment strategy, you will indirectly bear your proportionate share of any fees and expenses charged by the underlying funds in which the Fund invests, in addition to the expenses of the Fund. Actual expenses of underlying funds may vary. These expenses are not included in the examples presented on the preceding page. The preceding examples include, but are not limited to, investment advisory, shareholder servicing, fund accounting, custody and transfer agent fees. However, the example does not include portfolio trading heading entitled commissions and related expenses or other extraordinary expenses as determined under generally accepted accounting principles. You may use the information in this line, together with the amount you invested, to estimate the expenses that you paid over the period. Simply divide your account value by $1,000 (for example, an $8,600 account value divided by $1,000 = 8.6), then multiply the result by the number in the first line under the “Expenses Paid During Period” to estimate the expenses you paid on your account during this period.
Hypothetical Example for Comparison Purposes
The second line of the table below provides information about hypothetical account values and hypothetical expenses based on the Funds’ actual expense ratios and an assumed rate of return of 5% per year before expenses, which is not the Funds’ actual return. The hypothetical account values and expenses may not be used to estimate the actual ending account balance or expenses you paid for the period. You may use this information to compare the ongoing costs of investing in the Funds and other funds. To do so, compare this 5% hypothetical example with the 5% hypothetical examples that appear in the shareholder reports of the other funds.
Please note that the expenses shown in the table are meant to highlight your ongoing costs only and do not reflect any transactional costs, such as wire transfers, returned checks or stop payment orders. Therefore, the second line of the table is useful in comparing ongoing costs only, and will not help you determine the relative costs of owning different funds. In addition, if these transactional costs were included, your costs would have been higher.
DIREXION ANNUAL REPORT 7
Expense Example Tables
August 31, 2010 (Unaudited)
| | | | | | | | | | | | | | | | | |
| | | | | | Beginning
| | | Ending
| | | Expenses
| |
| | | Expense
| | | Account Value
| | | Account Value
| | | Paid During
| |
| | | Ratio1 | | | March 1, 2010 | | | August 31, 2010 | | | Period2 | |
| |
Evolution Managed Bond Fund | | | | | | | | | | | | | | | | |
| Based on actual fund return | | | 1.91 | % | | $ | 1,000.00 | | | $ | 1,058.10 | | | $ | 9.91 | |
| Based on hypothetical 5% return | | | 1.91 | % | | | 1,000.00 | | | | 1,015.58 | | | | 9.70 | |
Evolution All-Cap Equity Fund | | | | | | | | | | | | | | | | |
| Based on actual fund return | | | 1.91 | % | | | 1,000.00 | | | | 867.40 | | | | 8.99 | |
| Based on hypothetical 5% return | | | 1.91 | % | | | 1,000.00 | | | | 1,015.58 | | | | 9.70 | |
Evolution Market Leaders Fund | | | | | | | | | | | | | | | | |
| Based on actual fund return | | | 1.91 | % | | | 1,000.00 | | | | 1,004.20 | | | | 9.65 | |
| Based on hypothetical 5% return | | | 1.91 | % | | | 1,000.00 | | | | 1,015.58 | | | | 9.70 | |
Evolution Alternative Investment Fund | | | | | | | | | | | | | | | | |
| Based on actual fund return | | | 1.90 | % | | | 1,000.00 | | | | 976.20 | | | | 9.46 | |
| Based on hypothetical 5% return | | | 1.90 | % | | | 1,000.00 | | | | 1,015.63 | | | | 9.65 | |
| | |
| 1 | | Annualized. |
| 2 | | Expenses are equal to the Fund’s annualized expense ratio, multiplied by the average account value over the period, multiplied by the number of days in the most recent fiscal half-year/period, then divided by 365. |
8 DIREXION ANNUAL REPORT
Allocation of Portfolio Holdings
August 31, 2010 (Unaudited)
| | | | | | | | | | | | | | | | | | | | | | | | | |
| | | | | | | | | Investment
| | | | | | | | | | |
| | | Cash* | | | Common Stock | | | Companies | | | Futures | | | Total | | | | |
| |
| Evolution Managed Bond Fund | | | 3 | % | | | — | | | | 97 | % | | | — | | | | 100 | % | | | | |
| Evolution All-Cap Equity Fund | | | 31 | % | | | 58 | % | | | 11 | % | | | 0 | ** | | | 100 | % | | | | |
| Evolution Market Leaders Fund | | | 2 | % | | | 0 | %** | | | 98 | % | | | — | | | | 100 | % | | | | |
| Evolution Alternative Investment Fund | | | 24 | % | | | — | | | | 76 | % | | | 0 | ** | | | 100 | % | | | | |
| | |
| * | | Cash, cash equivalents and other assets less liabilities. |
| ** | | Percentage is less than 0.5%. |
DIREXION ANNUAL REPORT 9
Evolution Managed Bond Fund
Schedule of Investments
August 31, 2010
| | | | | | | | | |
| Shares | | | | | Value | |
| |
INVESTMENT COMPANIES - 96.8% |
| | 11,599 | | | AllianceBernstein Global High Income Fund | | $ | 166,098 | |
| | 14,972 | | | BlackRock Corporate High Yield Fund VI | | | 167,537 | |
| | 16,146 | | | BlackRock Credit Allocation Fund | | | 169,856 | |
| | 11,536 | | | BlackRock Floating Rate Income Strategies Fund | | | 168,541 | |
| | 3,774 | | | iShares Barclays 1-3 Year Credit Bond Fund | | | 397,100 | |
| | 26,043 | | | iShares Barclays 1-3 Year Treasury Bond Fund | | | 2,196,206 | |
| | 50,174 | | | iShares Barclays 20+ Year Treasury Bond Fund | | | 5,446,889 | |
| | 18,636 | | | iShares Barclays 3-7 Year Treasury Bond Fund | | | 2,196,439 | |
| | 76,885 | | | iShares Barclays 7-10 Year Treasury Bond Fund | | | 7,631,605 | |
| | 53,279 | | | iShares Barclays Aggregate Bond Fund | | | 5,804,214 | |
| | 12,182 | | | iShares Barclays MBS Bond Fund | | | 1,337,401 | |
| | 3,774 | | | iShares Barclays TIPS Bond Fund | | | 408,498 | |
| | 23,541 | | | iShares iBOXX $ High Yield Corporate Bond Fund | | | 2,051,598 | |
| | 41,213 | | | iShares iBOXX $ Investment Grade Corporate Bond Fund | | | 4,657,069 | |
| | 22,663 | | | MFS Charter Income Trust | | | 218,245 | |
| | 28,314 | | | MFS Government Markets Income Trust | | | 220,849 | |
| | 24,127 | | | MFS Intermediate Income Trust | | | 169,613 | |
| | 25,245 | | | Putnam Premier Income Trust | | | 171,161 | |
| | 37,193 | | | SPDR Barclays Capital International Treasury Bond Fund | | | 2,157,938 | |
| | 10,470 | | | Templeton Emerging Markets Income Fund | | | 169,405 | |
| | 174,710 | | | Vanguard Total Bond Market ETF | | | 14,481,712 | |
| | 10,967 | | | Wells Fargo Advantage Multi-Sector Income Fund | | | 167,795 | |
| | 8,898 | | | Western Asset Emerging Markets Debt Fund | | | 166,837 | |
| | 18,102 | | | Western Asset High Income Fund II | | | 168,711 | |
| | 13,598 | | | Western Asset/Claymore - Linked Opportunities & Income Fund | | | 170,655 | |
| | | | | | | | | |
| | | | | TOTAL INVESTMENT COMPANIES
(Cost $46,976,751) | | $ | 51,061,972 | |
| | | | | | | | | |
SHORT TERM INVESTMENTS - 3.0% |
MONEY MARKET FUNDS - 3.0% |
| | 315,896 | | | Fidelity Institutional Government Portfolio, 0.06%(a) | | $ | 315,896 | |
| | 315,896 | | | Fidelity Institutional Money Market Portfolio, 0.23%(a) | | | 315,896 | |
| | 315,896 | | | Goldman Sachs Financial Square Federal Fund, 0.04%(a) | | | 315,896 | |
| | 315,896 | | | Goldman Sachs Financial Square Government Fund, 0.10%(a) | | | 315,896 | |
| | 315,897 | | | Morgan Stanley Institutional Liquidity Fund - Treasury Portfolio, 0.06%(a) | | | 315,897 | |
| | | | | | | | | |
| | | | | TOTAL SHORT TERM INVESTMENTS
(Cost $1,579,481) | | $ | 1,579,481 | |
| | | | | | | | | |
| | | | | TOTAL INVESTMENTS
(Cost $48,556,232) - 99.8% | | $ | 52,641,453 | |
| | | | | Other Assets in Excess of Liabilities - 0.2% | | | 117,748 | |
| | | | | | | | | |
| | | | | TOTAL NET ASSETS - 100.0% | | $ | 52,759,201 | |
| | | | | | | | | |
Percentages are stated as a percent of net assets.
(a) Represents annualized seven-day yield at August 31, 2010.
The accompanying notes are an integral part of these financial statements.
10 DIREXION ANNUAL REPORT
Evolution All-Cap Equity Fund
Schedule of Investments
August 31, 2010
| | | | | | | | | |
| Shares | | | | | Value | |
| |
COMMON STOCKS - 58.6% |
Accommodation - 0.1% |
| | 165 | | | Home Inns & Hotels Management, Inc. ADR (China)(a) | | $ | 6,923 | |
| | | | | | | | | |
Administrative and Support Services - 1.6% |
| | 701 | | | Ctrip.com International Ltd. ADR (China)(a) | | | 28,383 | |
| | 3,707 | | | Enernoc, Inc.(a) | | | 120,774 | |
| | 991 | | | Geo Group, Inc.(a) | | | 21,901 | |
| | 1,171 | | | Volt Information Sciences, Inc.(a) | | | 7,401 | |
| | | | | | | | | |
| | | | | | | | 178,459 | |
| | | | | | | | | |
Ambulatory Health Care Services - 0.1% |
| | 241 | | | Almost Family, Inc.(a) | | | 6,090 | |
| | 299 | | | LHC Group, Inc.(a) | | | 5,983 | |
| | | | | | | | | |
| | | | | | | | 12,073 | |
| | | | | | | | | |
Apparel Manufacturing - 1.4% |
| | 4,323 | | | Under Armour, Inc. - Class A(a) | | | 155,066 | |
| | | | | | | | | |
Beverage and Tobacco Product Manufacturing - 1.0% |
| | 3,433 | | | Altria Group, Inc. | | | 76,625 | |
| | 93 | | | Coca-Cola FEMSA S.A.B. de C.V. ADR (Mexico)(a) | | | 6,982 | |
| | 260 | | | Companhia de Bebidas das Americas - Ambev ADR (Brazil) | | | 28,779 | |
| | | | | | | | | |
| | | | | | | | 112,386 | |
| | | | | | | | | |
Broadcasting (except Internet) - 0.1% |
| | 256 | | | Liberty Media Holdings Corp.(a) | | | 11,541 | |
| | | | | | | | | |
Building Material and Garden Equipment and Supplies Dealers - 0.1% |
| | 198 | | | Sherwin Williams Co. | | | 13,935 | |
| | | | | | | | | |
Chemical Manufacturing - 8.6% |
| | 205 | | | Alberto-Culver Co. | | | 6,365 | |
| | 5,879 | | | Cardiome Pharma Corp. (Canada)(a) | | | 35,391 | |
| | 347 | | | Church & Dwight, Inc. | | | 21,247 | |
| | 1,886 | | | E.I. du Pont de Nemours & Co. | | | 76,892 | |
| | 4,517 | | | Endo Pharmaceuticals Holdings, Inc.(a) | | | 122,727 | |
| | 3,468 | | | Enzon Pharmaceuticals, Inc.(a) | | | 35,582 | |
| | 364 | | | Hi-Tech Pharmacal Co., Inc.(a) | | | 6,315 | |
| | 1,181 | | | Immucor, Inc.(a) | | | 20,785 | |
| | 2,913 | | | Impax Laboratories, Inc.(a) | | | 45,647 | |
| | 1,345 | | | Johnson & Johnson | | | 76,692 | |
| | 34,124 | | | Keryx Biopharmaceuticals, Inc.(a) | | | 119,434 | |
| | 2,273 | | | Lilly Eli & Co. | | | 76,282 | |
| | 1,373 | | | Medicis Pharmaceutical Corp. | | | 37,757 | |
| | 4,814 | | | Medifast, Inc.(a) | | | 128,630 | |
| | 81 | | | Novo Nordisk A/S ADR (Denmark)(a) | | | 6,935 | |
| | 639 | | | Perrigo Co. | | | 36,417 | |
| | 1,169 | | | Polyone Corp.(a) | | | 11,398 | |
| | 3,523 | | | Questcor Pharmaceuticals Inc.(a) | | | 34,138 | |
| | 768 | | | The Scotts Miracle-Gro Co. - Class A | | | 36,273 | |
| | 1,827 | | | Targacept, Inc.(a) | | | 37,947 | |
| | 583 | | | ViroPharma, Inc.(a) | | | 7,311 | |
| | | | | | | | | |
| | | | | | | | 980,165 | |
| | | | | | | | | |
Clothing and Clothing Accessories Stores - 1.3% |
| | 2,783 | | | Ross Stores, Inc. | | | 138,120 | |
| | 1,107 | | | Talbots, Inc.(a) | | | 11,048 | |
| | | | | | | | | |
| | | | | | | | 149,168 | |
| | | | | | | | | |
Computer and Electronic Product Manufacturing - 7.0% |
| | 4,059 | | | Acme Packet, Inc.(a) | | | 136,382 | |
| | 439 | | | Apple, Inc.(a) | | | 106,839 | |
| | 304 | | | Brush Engineered Materials, Inc.(a) | | | 7,311 | |
| | 3,065 | | | Cirrus Logic, Inc.(a) | | | 46,343 | |
| | 167 | | | Cubic Corp. | | | 6,378 | |
| | 676 | | | Dolby Laboratories, Inc.(a) | | | 37,464 | |
| | 6,333 | | | Isilon Systems, Inc.(a) | | | 126,343 | |
| | 1,733 | | | Mindspeed Technologies, Inc.(a) | | | 11,091 | |
| | 534 | | | NVE Corp.(a) | | | 20,506 | |
| | 348 | | | Omnivision Technologies, Inc.(a) | | | 7,117 | |
| | 2,504 | | | Sandisk Corp.(a) | | | 83,233 | |
| | 942 | | | Silicon Laboratories, Inc.(a) | | | 35,928 | |
| | 1,109 | | | Thoratec Corp.(a) | | | 35,710 | |
| | 883 | | | TTM Technologies , Inc.(a) | | | 7,276 | |
| | 2,305 | | | Varian Medical Systems, Inc.(a) | | | 122,718 | |
| | 608 | | | Xyratex Ltd.(a) | | | 7,320 | |
| | | | | | | | | |
| | | | | | | | 797,959 | |
| | | | | | | | | |
Construction of Buildings - 2.2% |
| | 35,656 | | | Hovnanian Enterprises, Inc.(a) | | | 121,943 | |
| | 35,838 | | | Standard Pacific Corp.(a) | | | 125,075 | |
| | | | | | | | | |
| | | | | | | | 247,018 | |
| | | | | | | | | |
Credit Intermediation and Related Activities - 0.4% |
| | 1,139 | | | EZCORP, Inc.(a) | | | 20,479 | |
| | 179 | | | HDFC Bank Ltd. ADR (India) | | | 28,604 | |
| | | | | | | | | |
| | | | | | | | 49,083 | |
| | | | | | | | | |
Data Processing, Hosting and Related Services - 1.8% |
| | 310 | | | Akamai Technologies, Inc.(a) | | | 14,282 | |
| | 1,973 | | | Automatic Data Processing Inc. | | | 76,178 | |
| | 14,350 | | | Health Grades, Inc.(a) | | | 117,526 | |
| | | | | | | | | |
| | | | | | | | 207,986 | |
| | | | | | | | | |
Educational Services - 0.6% |
| | 289 | | | New Oriental Education & Tech Group, Inc. ADR (China)(a) | | | 28,493 | |
| | 2,292 | | | Universal Technical Institute, Inc. | | | 35,411 | |
| | | | | | | | | |
| | | | | | | | 63,904 | |
| | | | | | | | | |
Electrical Equipment, Appliance, and Component Manufacturing - 0.1% |
| | 431 | | | Graftech International Ltd(a) | | | 6,060 | |
| | 1,148 | | | Power One Inc.(a) | | | 11,687 | |
| | | | | | | | | |
| | | | | | | | 17,747 | |
| | | | | | | | | |
Food Manufacturing - 1.5% |
| | 526 | | | BRF Brasil Foods SA ADR (Brazil)(a) | | | 7,096 | |
| | 3,565 | | | Conagra Foods, Inc. | | | 76,968 | |
| | 218 | | | Corn Products International, Inc.(a) | | | 7,440 | |
| | 2,567 | | | Kraft Foods, Inc. | | | 76,882 | |
| | | | | | | | | |
| | | | | | | | 168,386 | |
| | | | | | | | | |
The accompanying notes are an integral part of these financial statements.
DIREXION ANNUAL REPORT 11
Evolution All-Cap Equity Fund
Schedule of Investments
August 31, 2010
| | | | | | | | | |
| Shares | | | | | Value | |
| |
Food Services and Drinking Places - 0.8% |
| | 335 | | | Chipotle Mexican Grill, Inc.(a) | | $ | 50,528 | |
| | 190 | | | McDonalds Corp. | | | 13,882 | |
| | 266 | | | Panera Bread Co.(a) | | | 21,264 | |
| | | | | | | | | |
| | | | | | | | 85,674 | |
| | | | | | | | | |
Funds, Trusts, and Other Financial Vehicles - 0.3% |
| | 967 | | | Amerigroup Corp.(a) | | | 35,682 | |
| | | | | | | | | |
Furniture and Home Furnishings Stores - 0.1% |
| | 245 | | | Williams Sonoma, Inc. | | | 6,360 | |
| | | | | | | | | |
Furniture and Related Product Manufacturing - 0.1% |
| | 2,383 | | | Furniture Brands International, Inc.(a) | | | 11,081 | |
| | | | | | | | | |
General Merchandise Stores - 0.4% |
| | 149 | | | BJ’s Wholesale Club, Inc.(a) | | | 6,252 | |
| | 319 | | | Family Dollar Stores, Inc. | | | 13,650 | |
| | 569 | | | Freds, Inc. | | | 6,270 | |
| | 289 | | | O’Reilly Automotive, Inc.(a) | | | 13,661 | |
| | | | | | | | | |
| | | | | | | | 39,833 | |
| | | | | | | | | |
Health and Personal Care Stores - 2.2% |
| | 299 | | | Express Scripts, Inc.(a) | | | 12,737 | |
| | 7,529 | | | Petmed Express, Inc. | | | 116,323 | |
| | 5,286 | | | Ulta Salon, Cosmetics & Fragrance, Inc.(a) | | | 119,728 | |
| | | | | | | | | |
| | | | | | | | 248,788 | |
| | | | | | | | | |
Leather and Allied Product Manufacturing - 0.4% |
| | 939 | | | Crocs, Inc.(a) | | | 11,737 | |
| | 782 | | | Deckers Outdoor Corp.(a) | | | 33,994 | |
| | | | | | | | | |
| | | | | | | | 45,731 | |
| | | | | | | | | |
Machinery Manufacturing - 2.8% |
| | 872 | | | Brunswick Corp. | | | 11,083 | |
| | 789 | | | Coinstar, Inc.(a) | | | 34,322 | |
| | 171 | | | Cummins, Inc. | | | 12,724 | |
| | 3,478 | | | IMAX Corp. (Canada)(a) | | | 49,144 | |
| | 4,006 | | | Pitney Bowes, Inc. | | | 77,075 | |
| | 271 | | | Robbins & Myers, Inc. | | | 6,412 | |
| | 9,682 | | | Trimas Corp.(a) | | | 124,801 | |
| | | | | | | | | |
| | | | | | | | 315,561 | |
| | | | | | | | | |
Merchant Wholesalers, Durable Goods - 2.7% |
| | 2,026 | | | LKQ Corp.(a) | | | 37,684 | |
| | 5,001 | | | MWI Veterinary Supply, Inc.(a) | | | 265,553 | |
| | 986 | | | Puda Coal, Inc.(a) | | | 7,355 | |
| | | | | | | | | |
| | | | | | | | 310,592 | |
| | | | | | | | | |
Merchant Wholesalers, Nondurable Goods - 0.1% |
| | 475 | | | Amerisourcebergen Corp. | | | 12,958 | |
| | | | | | | | | |
Mining (except Oil and Gas) - 1.1% |
| | 1,866 | | | Eldorado Gold Corp. (Canada) | | | 36,499 | |
| | 2,005 | | | Gold Fields Ltd ADR (South Africa) | | | 28,230 | |
| | 261 | | | Pan American Silver Corp. (Canada) | | | 6,465 | |
| | 75 | | | Randgold Resources Ltd ADR (United Kingdom)(a) | | | 6,937 | |
| | 1,586 | | | Silver Wheaton Corp. (Canada)(a) | | | 35,780 | |
| | 867 | | | Terra Nova Royalty Corp. (Canada)(a) | | | 6,546 | |
| | | | | | | | | |
| | | | | | | | 120,457 | |
| | | | | | | | | |
Miscellaneous Manufacturing - 3.8% |
| | 2,001 | | | Delcath Systems, Inc.(a) | | | 12,166 | |
| | 899 | | | Hasbro, Inc. | | | 36,284 | |
| | 1,903 | | | Heartware International, Inc.(a) | | | 123,238 | |
| | 134 | | | Intuitive Surgical, Inc.(a) | | | 35,514 | |
| | 3,667 | | | Mattel, Inc. | | | 76,970 | |
| | 1,171 | | | NewMarket Corp. | | | 117,721 | |
| | 824 | | | Symmetry Medical, Inc.(a) | | | 7,408 | |
| | 574 | | | WMS Industries, Inc.(a) | | | 20,285 | |
| | | | | | | | | |
| | | | | | | | 429,586 | |
| | | | | | | | | |
Nonmetallic Mineral Product Manufacturing - 0.3% |
| | 3,305 | | | Libbey, Inc.(a) | | | 37,082 | |
| | | | | | | | | |
Oil and Gas Extraction - 2.0% |
| | 544 | | | Cimarex Energy Co. | | | 35,589 | |
| | 3,310 | | | Gulfport Energy Corp.(a) | | | 37,635 | |
| | 1,945 | | | Hugoton Royalty Trust | | | 35,282 | |
| | 826 | | | Pioneer Natural Resources Co. | | | 47,759 | |
| | 974 | | | SM Energy Co. | | | 37,002 | |
| | 4,856 | | | TransGlobe Energy Corp. (Canada)(a) | | | 34,769 | |
| | | | | | | | | |
| | | | | | | | 228,036 | |
| | | | | | | | | |
Other Information Services - 0.9% |
| | 829 | | | Baidu.com, Inc. ADR (China)(a) | | | 65,019 | |
| | 726 | | | WebMD Health Corp.(a) | | | 36,982 | |
| | | | | | | | | |
| | | | | | | | 102,001 | |
| | | | | | | | | |
Paper Manufacturing - 0.7% |
| | 1,195 | | | Kimberly Clark Corp. | | | 76,958 | |
| | | | | | | | | |
Personal and Laundry Services - 0.3% |
| | 1,636 | | | Shutterfly, Inc.(a) | | | 36,368 | |
| | | | | | | | | |
Petroleum and Coal Products Manufacturing - 0.7% |
| | 1,471 | | | Conocophillips | | | 77,125 | |
| | | | | | | | | |
Pipeline Transportation - 0.1% |
| | 437 | | | Atlas Pipeline Partners LP(a) | | | 7,447 | |
| | | | | | | | | |
Professional, Scientific, and Technical Services - 2.5% |
| | 111 | | | Alexion Pharmaceuticals, Inc.(a) | | | 6,268 | |
| | 2,385 | | | Cognizant Technology Solutions Class A(a) | | | 137,388 | |
| | 1,880 | | | Ebix, Inc.(a) | | | 35,043 | |
| | 309 | | | ICON PLC ADR (Ireland)(a) | | | 6,798 | |
| | 957 | | | Incyte Corp.(a) | | | 11,982 | |
| | 178 | | | Jacobs Engineering Group, Inc.(a) | | | 6,173 | |
| | 838 | | | Perficient, Inc.(a) | | | 7,274 | |
| | 384 | | | SRA International, Inc.(a) | | | 7,392 | |
| | 204 | | | Teledyne Technologies, Inc.(a) | | | 7,381 | |
| | 337 | | | Tetra Tech, Inc.(a) | | | 6,116 | |
| | 1,597 | | | Valassis Communications, Inc.(a) | | | 46,808 | |
| | | | | | | | | |
| | | | | | | | 278,623 | |
| | | | | | | | | |
Publishing Industries (except Internet) - 3.2% |
| | 3,843 | | | LogMeIn, Inc.(a) | | | 125,935 | |
| | 1,724 | | | Rovi Corp.(a) | | | 75,011 | |
| | 4,563 | | | Smith Micro Software, Inc.(a) | | | 34,907 | |
| | 94 | | | SXC Health Solutions Corp.(a) | | | 7,313 | |
| | 8,679 | | | Tibco Software, Inc.(a) | | | 125,759 | |
| | | | | | | | | |
| | | | | | | | 368,925 | |
| | | | | | | | | |
The accompanying notes are an integral part of these financial statements.
12 DIREXION ANNUAL REPORT
Evolution All-Cap Equity Fund
Schedule of Investments
August 31, 2010
| | | | | | | | | |
| Shares | | | | | Value | |
| |
Rental and Leasing Services - 0.5% |
| | 242 | | | Dollar Thrifty Automotive Group(a) | | $ | 11,384 | |
| | 303 | | | Equity Residential | | | 13,886 | |
| | 1,320 | | | Textainer Group Holdings Ltd | | | 36,036 | |
| | | | | | | | | |
| | | | | | | | 61,306 | |
| | | | | | | | | |
Securities, Commodity Contracts, and Other Financial Investments and Related Activities - 0.3% |
| | 2,346 | | | Acacia Research Corp.(a) | | | 35,237 | |
| | | | | | | | | |
Sporting Goods, Hobby, Book, and Music Stores - 0.3% |
| | 1,446 | | | Dicks Sporting Goods, Inc.(a) | | | 35,384 | |
| | | | | | | | | |
Telecommunications - 2.7% |
| | 2,862 | | | AT&T, Inc. | | | 77,360 | |
| | 2,129 | | | Centurytel, Inc. | | | 76,985 | |
| | 420 | | | China Mobile Limited ADR (China) | | | 21,554 | |
| | 341 | | | Chunghwa Telecom Co. Ltd ADR (Taiwan)(a) | | | 7,014 | |
| | 350 | | | DIRECTV(a) | | | 13,272 | |
| | 13,604 | | | Qwest Communications International, Inc. | | | 76,863 | |
| | 1,448 | | | VimpelCom Ltd ADR (Russia)(a) | | | 21,648 | |
| | 359 | | | Virgin Media, Inc.(a) | | | 7,467 | |
| | 288 | | | Vivo Participacoes SA ADR (Brazil)(a) | | | 6,912 | |
| | | | | | | | | |
| | | | | | | | 309,075 | |
| | | | | | | | | |
Transportation Equipment Manufacturing - 0.5% |
| | 477 | | | AAR Corp.(a) | | | 7,327 | |
| | 484 | | | LMI Aerospace, Inc.(a) | | | 7,323 | |
| | 318 | | | Toyota Motor Corp. ADR (Japan) | | | 21,573 | |
| | 1,809 | | | Wabash National Corp.(a) | | | 11,089 | |
| | 642 | | | Saia, Inc.(a) | | | 7,479 | |
| | | | | | | | | |
| | | | | | | | 54,791 | |
| | | | | | | | | |
Utilities - 0.2% |
| | 222 | | | American States Water Co.(a) | | | 7,399 | |
| | 243 | | | Black Hills Corp.(a) | | | 7,395 | |
| | 254 | | | Constellation Energy Group, Inc.(a) | | | 7,450 | |
| | | | | | | | | |
| | | | | | | | 22,244 | |
| | | | | | | | | |
Waste Management and Remediation Services - 0.7% |
| | 251 | | | Republic Services, Inc.(a) | | | 7,387 | |
| | 2,321 | | | Waste Management Inc. | | | 76,802 | |
| | | | | | | | | |
| | | | | | | | 84,189 | |
| | | | | | | | | |
| | | | | TOTAL COMMON STOCKS
(Cost $6,509,753) | | $ | 6,648,893 | |
| | | | | | | | | |
INVESTMENT COMPANIES - 11.1% |
| | 2,578 | | | iShares S&P Latin America 40 Index Fund | | | 116,551 | |
| | 6,788 | | | SPDR S&P Emerging Asia Pacific ETF | | | 505,027 | |
| | 3,995 | | | TICC Capital Corp. | | | 36,594 | |
| | 2,470 | | | Vanguard Emerging Markets ETF | | | 100,727 | |
| | 11,115 | | | WisdomTree Emerging Markets Small Cap Dividend Fund | | | 505,844 | |
| | | | | | | | | |
| | | | | TOTAL INVESTMENT COMPANIES
(Cost $1,266,019) | | $ | 1,264,743 | |
| | | | | | | | | |
SHORT TERM INVESTMENTS - 30.9% |
MONEY MARKET FUNDS - 30.9% |
| | 701,115 | | | Fidelity Institutional Government Portfolio, 0.06%(b) | | $ | 701,115 | |
| | 701,114 | | | Fidelity Institutional Money Market Portfolio, 0.23%(b) | | | 701,114 | |
| | 701,114 | | | Goldman Sachs Financial Square Federal Fund, 0.04%(b) | | | 701,114 | |
| | 701,115 | | | Goldman Sachs Financial Square Government Fund, 0.10%(b) | | | 701,115 | |
| | 701,115 | | | Morgan Stanley Institutional Liquidity Fund - Treasury Portfolio, 0.06%(b) | | | 701,115 | |
| | | | | | | | | |
| | | | | TOTAL SHORT TERM INVESTMENTS
(Cost $3,505,573) | | $ | 3,505,573 | |
| | | | | | | | | |
| | | | | TOTAL INVESTMENTS
(Cost $11,281,345) - 100.6% | | $ | 11,419,209 | |
| | | | | Liabilities in Excess of Other Assets - (0.6)% | | | (64,364 | ) |
| | | | | | | | | |
| | | | | TOTAL NET ASSETS - 100.0% | | $ | 11,354,845 | |
| | | | | | | | | |
Percentages are stated as a percent of net assets.
(a) Non income producing
(b) Represents annualized seven-day yield at August 31, 2010.
The accompanying notes are an integral part of these financial statements.
DIREXION ANNUAL REPORT 13
Evolution All-Cap Equity Fund
Futures Contracts
August 31, 2010
| | | | | | | | | |
| | | | | | Unrealized
| |
Contracts | | | | | Depreciation | |
| |
| | 33 | | | E-Mini S&P 500 Futures | | | | |
| | | | | Expiring September 2010 (Underlying Face Amount at Market Value $1,730,025) | | $ | (7,977 | ) |
| | | | | | | | | |
Evolution All-Cap Equity Fund
Short Futures Contracts
August 31, 2010
| | | | | | | | | |
| | | | | | Unrealized
| |
Contracts | | | | | Appreciation | |
| |
| | 120 | | | E-Mini NASDAQ 100 Futures | | | | |
| | | | | Expiring September 2010 (Underlying Face Amount at Market Value $4,242,000) | | $ | 14,490 | |
| | | | | | | | | |
The accompanying notes are an integral part of these financial statements.
14 DIREXION ANNUAL REPORT
Evolution Market Leaders Fund
Schedule of Investments
August 31, 2010
| | | | | | | | | |
| Shares | | | | | Value | |
| |
COMMON STOCKS - 0.0% |
Chemical Manufacturing - 0.0% |
| | 1 | | | Inter Parfums, Inc. | | $ | 8 | |
| | | | | | | | | |
Miscellaneous Store Retailers - 0.0% |
| | 442 | | | Spectrum Group International, Inc.(a) | | | 906 | |
| | | | | | | | | |
| | | | | TOTAL COMMON STOCKS
(Cost $7) | | $ | 914 | |
| | | | | | | | | |
INVESTMENT COMPANIES - 98.1% |
| | 121,216 | | | First Trust Materials AlphaDEX Fund | | $ | 2,327,347 | |
| | 88,325 | | | First Trust Value Line 100 Exchange-Traded Fund(a) | | | 912,397 | |
| | 38,430 | | | iShares Cohen & Steers Realty Majors Index Fund | | | 2,301,189 | |
| | 40,219 | | | iShares Dow Jones U.S. Basic Materials Sector Index Fund | | | 2,359,649 | |
| | 45,088 | | | iShares Dow Jones U.S. Real Estate Index Fund | | | 2,298,135 | |
| | 191,143 | | | iShares Dow Jones U.S. Telecommunications Sector Index Fund | | | 3,828,594 | |
| | 14,628 | | | iShares Morningstar Small Growth Index Fund | | | 930,633 | |
| | 61,267 | | | iShares MSCI Chile Investable Market Index Fund | | | 4,144,713 | |
| | 536,008 | | | iShares MSCI Malaysia Index Fund | | | 6,903,783 | |
| | 113,851 | | | iShares MSCI Singapore Index Fund | | | 1,385,567 | |
| | 86,240 | | | iShares MSCI Thailand Investable Market Index Fund | | | 4,770,797 | |
| | 22,759 | | | iShares MSCI Turkey Investable Market Index Fund | | | 1,376,009 | |
| | 69,987 | | | iShares S&P MidCap 400 Growth Index Fund | | | 5,494,679 | |
| | 122,021 | | | iShares S&P SmallCap 600 Growth Index Fund | | | 6,835,617 | |
| | 128,504 | | | iShares S&P SmallCap 600 Index Fund | | | 6,842,838 | |
| | 45,383 | | | Market Vectors Brazil Small-Cap ETF | | | 2,337,678 | |
| | 87,754 | | | Market Vectors Indonesia Index ETF | | | 6,663,161 | |
| | 75,242 | | | Material Select Sector SPDR Fund | | | 2,332,502 | |
| | 121,476 | | | PowerShares DWA Technical Leaders Portfolio | | | 2,293,467 | |
| | 87,389 | | | PowersShares S&P 500 High Quality Portfolio(a) | | | 987,671 | |
| | 52,813 | | | Rydex S&P Midcap 400 Pure Growth ETF | | | 3,117,551 | |
| | 41,468 | | | SPDR Dow Jones REIT ETF | | | 2,295,668 | |
| | 17,766 | | | SPDR Dow Jones Small Cap Growth ETF | | | 1,462,497 | |
| | 97,495 | | | Telecom HOLDRS Trust | | | 2,438,350 | |
| | 24,824 | | | Vanguard Extended Market ETF | | | 1,060,233 | |
| | 35,779 | | | Vanguard Materials ETF | | | 2,339,052 | |
| | 52,796 | | | Vanguard Mid-Cap Growth ETF | | | 2,549,519 | |
| | 45,678 | | | Vanguard REIT ETF | | | 2,297,604 | |
| | 67,796 | | | Vanguard Small-Cap ETF | | | 3,839,966 | |
| | 3,177 | | | Vanguard Small-Cap Growth ETF | | | 186,712 | |
| | 51,123 | | | Vanguard Telecommunication Services ETF | | | 2,930,882 | |
| | | | | | | | | |
| | | | | TOTAL INVESTMENT COMPANIES
(Cost $93,843,792) | | $ | 91,844,460 | |
| | | | | | | | | |
SHORT TERM INVESTMENTS - 1.4% |
MONEY MARKET FUNDS - 1.4% |
| | 263,007 | | | Fidelity Institutional Government Portfolio, 0.06%(b) | | $ | 263,007 | |
| | 263,007 | | | Fidelity Institutional Money Market Portfolio, 0.23%(b) | | | 263,007 | |
| | 263,006 | | | Goldman Sachs Financial Square Federal Fund, 0.04%(b) | | | 263,006 | |
| | 263,006 | | | Goldman Sachs Financial Square Government Fund, 0.10%(b) | | | 263,006 | |
| | 263,006 | | | Morgan Stanley Institutional Liquidity Fund - Treasury Portfolio, 0.06%(b) | | | 263,006 | |
| | | | | | | | | |
| | | | | TOTAL SHORT TERM INVESTMENTS
(Cost $1,315,032) | | $ | 1,315,032 | |
| | | | | | | | | |
| | | | | TOTAL INVESTMENTS
(Cost $95,158,831) - 99.5% | | $ | 93,160,406 | |
| | | | | Other Assets in Excess of Liabilities - 0.5% | | | 424,898 | |
| | | | | | | | | |
| | | | | TOTAL NET ASSETS - 100.0% | | $ | 93,585,304 | |
| | | | | | | | | |
Percentages are stated as a percent of net assets.
(a) Non-income producing security.
(b) Represents annualized seven-day yield at August 31, 2010.
The accompanying notes are an integral part of these financial statements.
DIREXION ANNUAL REPORT 15
Evolution Alternative Investment Fund
Schedule of Investments
August 31, 2010
| | | | | | | | | |
| Shares | | | | | Value | |
| |
INVESTMENT COMPANIES - 75.8% |
| | 52,104 | | | Aberdeen Equity Long-Short Fund | | $ | 563,240 | |
| | 129,975 | | | Arbitrage Fund | | | 1,693,568 | |
| | 18,982 | | | Calamos Market Neutral Income Fund | | | 216,014 | |
| | 663 | | | CurrencyShares British Pound Sterling Trust | | | 101,174 | |
| | 5,247 | | | CurrencyShares Japanese Yen Trust | | | 618,254 | |
| | 8,713 | | | CurrencyShares Swiss Franc Trust | | | 852,131 | |
| | 111,689 | | | DWS Disciplined Market Neutral Fund | | | 1,057,691 | |
| | 7,784 | | | Energy Select Sector SPDR Fund | | | 241,304 | |
| | 31,749 | | | Franklin Gold and Precious Metals Fund | | | 1,487,779 | |
| | 8,628 | | | Gateway Fund | | | 212,067 | |
| | 47,894 | | | Hatteras Alpha Hedged Strategies Fund | | | 468,886 | |
| | 53,603 | | | Highland Long-Short Equity Fund | | | 571,943 | |
| | 3,332 | | | iShares Barclays 10-20 Year Treasury Bond Fund | | | 411,835 | |
| | 5,353 | | | iShares Barclays 20+ Year Treasury Bond Fund | | | 581,122 | |
| | 1,440 | | | iShares Barclays 3-7 Year Treasury Bond Fund | | | 169,718 | |
| | 2,711 | | | iShares Barclays 7-10 Year Treasury Bond Fund | | | 269,094 | |
| | 788 | | | iShares Barclays TIPS Bond Fund | | | 85,191 | |
| | 3,661 | | | iShares Dow Jones U.S. Basic Materials Sector Index Fund | | | 214,791 | |
| | 7,710 | | | iShares MSCI All Country Asia ex Japan Index Fund | | | 419,655 | |
| | 8,738 | | | iShares MSCI Australia Index Fund | | | 184,197 | |
| | 7,203 | | | iShares MSCI Chile Investable Market Index Fund | | | 487,283 | |
| | 70,861 | | | iShares MSCI Malaysia Index Fund | | | 912,690 | |
| | 1,295 | | | iShares MSCI Pacific ex-Japan Index Fund | | | 50,958 | |
| | 13,322 | | | iShares MSCI Singapore Index Fund | | | 162,129 | |
| | 3,130 | | | iShares MSCI South Africa Index Fund | | | 182,792 | |
| | 1,801 | | | iShares S&P Global Materials Sector Index Fund | | | 102,135 | |
| | 3,864 | | | iShares S&P Latin America 40 Index Fund | | | 174,691 | |
| | 92,396 | | | Managers AMG FQ Global Alternatives Fund | | | 946,137 | |
| | 1,532 | | | Market Vectors Gold Miners ETF | | | 82,192 | |
| | 355 | | | Materials Select Sector SPDR Fund | | | 18,176 | |
| | 71,929 | | | Merger Fund | | | 1,139,357 | |
| | 41,356 | | | Permanent Portfolio Fund | | | 1,695,610 | |
| | 18,054 | | | PowerShares 1-30 Laddered Treasury Portfolio Fund | | | 546,314 | |
| | 14,943 | | | PowerShares DB US Dollar Index Bullish Fund | | | 360,575 | |
| | 2,020 | | | PowerShares Dynamic Energy Exploration & Production Portfolio Fund | | | 33,875 | |
| | 4,348 | | | PowerShares Golden Dragon Halter USX China Portfolio Fund | | | 101,743 | |
| | 5,411 | | | ProShares UltraShort Financials Fund | | | 124,615 | |
| | 1,594 | | | ProShares UltraShort Oil & Gas Fund | | | 109,396 | |
| | 8,066 | | | Riversource Precious Metals & Mining Fund | | | 111,226 | |
| | 5,183 | | | Rydex Precious Metals Fund | | | 357,450 | |
| | 68,489 | | | Sierra Core Retirement Fund | | | 1,644,425 | |
| | 2,587 | | | SPDR Barclays Capital TIPS ETF | | | 138,353 | |
| | 888 | | | SPDR KBW Bank ETF | | | 19,172 | |
| | 6,058 | | | SPDR KBW Insurance ETF | | | 219,845 | |
| | 5,672 | | | SPDR S&P Emerging Asia Pacific ETF | | | 421,997 | |
| | 801 | | | SPDR S&P Emerging Middle East & Africa ETF | | | 50,511 | |
| | 4,529 | | | SPDR S&P Metals & Mining ETF | | | 219,158 | |
| | 575 | | | SPDR S&P Oil & Gas Exploration & Production ETF | | | 22,143 | |
| | 139,919 | | | TFS Market Neutral Fund | | | 2,128,163 | |
| | 8,189 | | | Vanguard Emerging Markets ETF | | | 333,947 | |
| | 799 | | | Vanguard Materials ETF | | | 52,235 | |
| | 23,419 | | | Wasatch-1st Source Long/Short Fund | | | 253,864 | |
| | 13,545 | | | WisdomTree Dreyfus Brazilian Real Fund | | | 375,061 | |
| | 3,782 | | | WisdomTree Emerging Markets Equity Income Fund | | | 193,374 | |
| | 4,150 | | | WisdomTree India Earnings Fund | | | 96,239 | |
| | 1,080 | | | WisdomTree Pacific ex-Japan Total Dividend Fund | | | 61,679 | |
| | | | | | | | | |
| | | | | TOTAL INVESTMENT COMPANIES
(Cost $23,367,593) | | $ | 24,349,164 | |
| | | | | | | | | |
SHORT TERM INVESTMENTS - 21.1% |
MONEY MARKET FUNDS - 21.1% |
| | 1,356,080 | | | Fidelity Institutional Government Portfolio, 0.06%(a) | | $ | 1,356,080 | |
| | 1,356,080 | | | Fidelity Institutional Money Market Portfolio, 0.23%(a) | | | 1,356,080 | |
| | 1,356,080 | | | Goldman Sachs Financial Square Federal Fund, 0.04%(a) | | | 1,356,080 | |
| | 1,356,080 | | | Goldman Sachs Financial Square Government Fund, 0.10%(a) | | | 1,356,080 | |
| | 1,356,080 | | | Morgan Stanley Institutional Liquidity Fund - Treasury Portfolio, 0.06%(a) | | | 1,356,080 | |
| | | | | | | | | |
| | | | | TOTAL SHORT TERM INVESTMENTS
(Cost $6,780,400) | | $ | 6,780,400 | |
| | | | | | | | | |
| | | | | TOTAL INVESTMENTS
(Cost $30,147,993) - 96.9% | | $ | 31,129,564 | |
| | | | | Other Assets in Excess of Liabilities - 3.1% | | | 995,194 | |
| | | | | | | | | |
| | | | | TOTAL NET ASSETS - 100.00% | | $ | 32,124,758 | |
| | | | | | | | | |
Percentages are stated as a percent of net assets.
(a) Represents annualized seven-day yield at August 31, 2010.
The accompanying notes are an integral part of these financial statements.
16 DIREXION ANNUAL REPORT
Evolution Alternative Investment Fund
Futures Contracts
August 31, 2010
| | | | | | | | | |
| | | | | | Unrealized
| |
Contracts | | | | | Depreciation | |
| |
| | 50 | | | E-Mini S&P 500 Futures | | | | |
| | | | | Expiring September 2010 (Underlying Face Amount at Market Value $2,621,250) | | $ | (23,025 | ) |
| | | | | | | | | |
The accompanying notes are an integral part of these financial statements.
DIREXION ANNUAL REPORT 17
Statements of Assets and Liabilities
August 31, 2010
| | | | | | | | | |
| | | Evolution
| | | Evolution
| |
| | | Managed Bond Fund | | | All-Cap Equity Fund | |
| |
Assets: | | | | | | | | |
| Investments, at market value (Note 2) | | $ | 52,641,453 | | | $ | 11,419,209 | |
| Cash | | | — | | | | 11,505 | |
| Receivable for Fund shares sold | | | 818,249 | | | | 64,014 | |
| Receivable for investments sold | | | 371,668 | | | | 445,438 | |
| Deposit at broker for futures | | | — | | | | 401,530 | |
| Due from broker for futures | | | — | | | | 3,470 | |
| Variation margin receivable | | | — | | | | 3,118 | |
| Dividends and interest receivable | | | 2,477 | | | | 7,284 | |
| Other assets | | | — | | | | 71 | |
| | | | | | | | | |
| Total Assets | | | 53,833,847 | | | | 12,355,639 | |
| | | | | | | | | |
Liabilities: | | | | | | | | |
| Payable for investments purchased | | | 953,395 | | | | 920,896 | |
| Payable for Fund shares redeemed | | | 40,131 | | | | 57,784 | |
| Accrued investment advisory expense | | | 40,785 | | | | 10,238 | |
| Accrued operating services fees | | | 20,393 | | | | 5,119 | |
| Accrued distribution expenses | | | 12,220 | | | | 4,325 | |
| Accrued shareholder servicing fees | | | 7,718 | | | | 2,432 | |
| Other liabilities | | | 4 | | | | — | |
| | | | | | | | | |
| Total Liabilities | | | 1,074,646 | | | | 1,000,794 | |
| | | | | | | | | |
Net Assets | | $ | 52,759,201 | | | $ | 11,354,845 | |
| | | | | | | | | |
Net Assets Consist Of: | | | | | | | | |
| Capital stock | | $ | 53,187,177 | | | $ | 32,157,435 | |
| Undistributed net investment income | | | 322,088 | | | | 177 | |
| Accumulated net realized loss | | | (4,835,285 | ) | | | (20,947,144 | ) |
| Net unrealized appreciation on: | | | | | | | | |
| Investments | | | 4,085,221 | | | | 137,864 | |
| Futures | | | — | | | | 6,513 | |
| | | | | | | | | |
| Total Net Assets | | $ | 52,759,201 | | | $ | 11,354,845 | |
| | | | | | | | | |
Calculation of Net Asset Value Per Share: | | | | | | | | |
| Net assets | | $ | 52,759,201 | | | $ | 11,354,845 | |
| Shares outstanding (unlimited shares of beneficial interest authorized, no par value) | | | 3,008,415 | | | | 943,248 | |
| Net asset value, redemption price and offering price per share | | $ | 17.54 | | | $ | 12.04 | |
| | | | | | | | | |
| Cost of Investments | | $ | 48,556,232 | | | $ | 11,281,345 | |
| | | | | | | | | |
The accompanying notes are an integral part of these financial statements.
18 DIREXION ANNUAL REPORT
Statements of Assets and Liabilities
August 31, 2010
| | | | | | | | | |
| | | Evolution Market
| | | Evolution Alternative
| |
| | | Leaders Fund | | | Investment Fund | |
| |
Assets: | | | | | | | | |
| Investments, at market value (Note 2) | | $ | 93,160,406 | | | $ | 31,129,564 | |
| Receivable for Fund shares sold | | | 592,425 | | | | 524,620 | |
| Receivable for investments sold | | | — | | | | 2,025,800 | |
| Deposit at broker for futures | | | — | | | | 256,313 | |
| Variation margin receivable | | | — | | | | 8,500 | |
| Dividends and interest receivable | | | 77 | | | | 58 | |
| | | | | | | | | |
| Total Assets | | | 93,752,908 | | | | 33,944,855 | |
| | | | | | | | | |
Liabilities: | | | | | | | | |
| Payable for investments purchased | | | — | | | | 1,717,374 | |
| Payable for Fund shares redeemed | | | 9,214 | | | | 16,482 | |
| Due to broker for futures | | | — | | | | 31,313 | |
| Accrued investment advisory expense | | | 81,321 | | | | 26,883 | |
| Accrued operating services fees | | | 40,579 | | | | 13,442 | |
| Accrued distribution expenses | | | 21,190 | | | | 9,427 | |
| Accrued shareholder servicing fees | | | 14,066 | | | | 4,974 | |
| Other liabilities | | | 1,234 | | | | 202 | |
| | | | | | | | | |
| Total Liabilities | | | 167,604 | | | | 1,820,097 | |
| | | | | | | | | |
Net Assets | | $ | 93,585,304 | | | $ | 32,124,758 | |
| | | | | | | | | |
Net Assets Consist Of: | | | | | | | | |
| Capital stock | | $ | 98,689,947 | | | $ | 40,830,081 | |
| Undistributed net investment income | | | — | | | | — | |
| Accumulated net realized loss | | | (3,106,218 | ) | | | (9,663,869 | ) |
| Net unrealized appreciation (depreciation) on: | | | | | | | | |
| Investments | | | (1,998,425 | ) | | | 981,571 | |
| Futures | | | — | | | | (23,025 | ) |
| | | | | | | | | |
| Total Net Assets | | $ | 93,585,304 | | | $ | 32,124,758 | |
| | | | | | | | | |
Calculation of Net Asset Value Per Share: | | | | | | | | |
| Net assets | | $ | 93,585,304 | | | $ | 32,124,758 | |
| Shares outstanding (unlimited shares of beneficial interest authorized, no par value) | | | 7,851,298 | | | | 2,120,979 | |
| Net asset value, redemption price and offering price per share | | $ | 11.92 | | | $ | 15.15 | |
| | | | | | | | | |
| Cost of Investments | | $ | 95,158,831 | | | $ | 30,147,993 | |
| | | | | | | | | |
The accompanying notes are an integral part of these financial statements.
DIREXION ANNUAL REPORT 19
Statements of Operations
For the Year Ended August 31, 2010
| | | | | | | | | |
| | | Evolution
| | | Evolution
| |
| | | Managed Bond Fund | | | All-Cap Equity Fund | |
| |
Investment income: | | | | | | | | |
| Dividend income (net of foreign withholding tax of $- and $3,380, respectively) | | $ | 1,915,153 | | | $ | 356,880 | |
| Interest income | | | 2,043 | | | | 939 | |
| | | | | | | | | |
| Total investment income | �� | | 1,917,196 | | | | 357,819 | |
| | | | | | | | | |
Expenses: | | | | | | | | |
| Investment advisory fees | | | 488,139 | | | | 286,429 | |
| Operating services fees | | | 244,070 | | | | 143,215 | |
| Distribution expenses | | | 122,035 | | | | 71,607 | |
| Shareholder servicing fees | | | 73,221 | | | | 42,964 | |
| | | | | | | | | |
| Total expenses before interest | | | 927,465 | | | | 544,215 | |
| Interest on line of credit | | | 2,509 | | | | 1,011 | |
| | | | | | | | | |
| Total expenses | | | 929,974 | | | | 545,226 | |
| | | | | | | | | |
Net investment income (loss) | | | 987,222 | | | | (187,407 | ) |
| | | | | | | | | |
Realized and unrealized gain (loss) on investments: | | | | | | | | |
| Net realized gain (loss) on: | | | | | | | | |
| Investments | | | 920,276 | | | | 4,664,578 | |
| Futures | | | — | | | | (6,269,940 | ) |
| Contributions by affiliates (Note 5) | | | — | | | | 41,500 | |
| | | | | | | | | |
| | | | 920,276 | | | | (1,563,862 | ) |
| | | | | | | | | |
| | | | | | | | | |
| Capital gain distributions from regulated investment companies | | | 33,735 | | | | — | |
| | | | | | | | | |
| Change in unrealized appreciation (depreciation) on: | | | | | | | | |
| Investments | | | 1,588,337 | | | | (2,097,498 | ) |
| Futures | | | — | | | | 149,055 | |
| | | | | | | | | |
| | | | 1,588,337 | | | | (1,948,443 | ) |
| | | | | | | | | |
| Net realized and unrealized gain (loss) on investments | | | 2,542,348 | | | | (3,512,305 | ) |
| | | | | | | | | |
Net increase (decrease) in net assets resulting from operations | | $ | 3,529,570 | | | $ | (3,699,712 | ) |
| | | | | | | | | |
The accompanying notes are an integral part of these financial statements.
20 DIREXION ANNUAL REPORT
Statements of Operations
For the Year Ended August 31, 2010
| | | | | | | | | |
| | | Evolution Market
| | | Evolution Alternative
| |
| | | Leaders Fund | | | Investment Fund | |
| |
Investment income: | | | | | | | | |
| Dividend income (net of foreign withholding tax of $- and $6, respectively) | | $ | 1,142,925 | | | $ | 309,831 | |
| Interest income | | | 7,939 | | | | 6,873 | |
| | | | | | | | | |
| Total investment income | | | 1,150,864 | | | | 316,704 | |
| | | | | | | | | |
Expenses: | | | | | | | | |
| Investment advisory fees | | | 732,804 | | | | 255,614 | |
| Operating services fees | | | 366,402 | | | | 127,807 | |
| Distribution expenses | | | 183,201 | | | | 63,904 | |
| Shareholder servicing fees | | | 109,920 | | | | 38,342 | |
| | | | | | | | | |
| Total expenses before interest | | | 1,392,327 | | | | 485,667 | |
| Interest on line of credit | | | 2,714 | | | | 202 | |
| | | | | | | | | |
| Total expenses | | | 1,395,041 | | | | 485,869 | |
| | | | | | | | | |
Net investment loss | | | (244,177 | ) | | | (169,165 | ) |
| | | | | | | | | |
Realized and unrealized gain (loss) on investments: | | | | | | | | |
| Net realized gain (loss) on: | | | | | | | | |
| Investments | | | 5,583,465 | | | | (1,063,657 | ) |
| Futures | | | — | | | | (145,232 | ) |
| | | | | | | | | |
| | | | 5,583,465 | | | | (1,208,889 | ) |
| | | | | | | | | |
| | | | | | | | | |
| Capital gain distributions from regulated investment companies | | | — | | | | 55,955 | |
| | | | | | | | | |
| Change in unrealized appreciation (depreciation) on: | | | | | | | | |
| Investments | | | (3,871,149 | ) | | | 396,723 | |
| Futures | | | — | | | | (23,025 | ) |
| | | | | | | | | |
| | | | (3,871,149 | ) | | | 373,698 | |
| | | | | | | | | |
| Net realized and unrealized gain (loss) on investments | | | 1,712,316 | | | | (779,236 | ) |
| | | | | | | | | |
Net increase (decrease) in net assets resulting from operations | | $ | 1,468,139 | | | $ | (948,401 | ) |
| | | | | | | | | |
The accompanying notes are an integral part of these financial statements.
DIREXION ANNUAL REPORT 21
Statements of Changes in Net Assets
August 31, 2010
| | | | | | | | | | | | | | | | | |
| | | Evolution Managed Bond Fund | | | Evolution All-Cap Equity Fund | |
| | | Year Ended
| | | Year Ended
| | | Year Ended
| | | Year Ended
| |
| | | August 31, 2010 | | | August 31, 2009 | | | August 31, 2010 | | | August 31, 2009 | |
| |
Operations: | | | | | | | | | | | | | | | | |
| Net investment income (loss) | | $ | 987,222 | | | $ | 792,750 | | | $ | (187,407 | ) | | $ | (220,270 | ) |
| Net realized gain (loss) on investments | | | 920,276 | | | | (1,210,027 | ) | | | (1,563,862 | ) | | | (9,293,970 | ) |
| Capital gain distributions from regulated | | | | | | | | | | | | | | | | |
| investment companies | | | 33,735 | | | | 7,553 | | | | — | | | | — | |
| Change in net unrealized appreciation (depreciation) on investments | | | 1,588,337 | | | | 2,187,303 | | | | (1,948,443 | ) | | | 1,106,715 | |
| | | | | | | | | | | | | | | | | |
| Net increase (decrease) in net assets resulting from operations | | | 3,529,570 | | | | 1,777,579 | | | | (3,699,712 | ) | | | (8,407,525 | ) |
| | | | | | | | | | | | | | | | | |
Distributions to shareholders: | | | | | | | | | | | | | | | | |
| Net investment income | | | (929,653 | ) | | | (665,397 | ) | | | — | | | | — | |
| | | | | | | | | | | | | | | | | |
| Total distributions | | | (929,653 | ) | | | (665,397 | ) | | | — | | | | — | |
| | | | | | | | | | | | | | | | | |
Capital share transactions: | | | | | | | | | | | | | | | | |
| Proceeds from shares sold | | | 86,778,757 | | | | 45,622,040 | | | | 11,555,490 | | | | 39,304,950 | |
| Proceeds from shares issued to holders in reinvestment of distributions | | | 929,653 | | | | 665,395 | | | | — | | | | — | |
| Cost of shares redeemed | | | (85,313,894 | ) | | | (25,877,073 | ) | | | (39,973,221 | ) | | | (22,562,344 | ) |
| | | | | | | | | | | | | | | | | |
| Net increase (decrease) in net assets resulting from capital share transactions | | | 2,394,516 | | | | 20,410,362 | | | | (28,417,731 | ) | | | 16,742,606 | |
| | | | | | | | | | | | | | | | | |
Total increase (decrease) in net assets | | | 4,994,433 | | | | 21,522,544 | | | | (32,117,443 | ) | | | 8,335,081 | |
| | | | | | | | | | | | | | | | | |
Net assets: | | | | | | | | | | | | | | | | |
| Beginning of year | | | 47,764,768 | | | | 26,242,224 | | | | 43,472,288 | | | | 35,137,207 | |
| | | | | | | | | | | | | | | | | |
| End of year | | $ | 52,759,201 | | | $ | 47,764,768 | | | $ | 11,354,845 | | | $ | 43,472,288 | |
| | | | | | | | | | | | | | | | | |
Undistributed net investment income, end of year | | $ | 322,088 | | | $ | 253,634 | | | $ | 177 | | | $ | 1,046 | |
| | | | | | | | | | | | | | | | | |
The accompanying notes are an integral part of these financial statements.
22 DIREXION ANNUAL REPORT
Statements of Changes in Net Assets
August 31, 2010
| | | | | | | | | | | | | | | | | |
| | | Evolution Market Leaders Fund | | | Evolution Alternative Investment Fund | |
| | | Year Ended
| | | Year Ended
| | | Year Ended
| | | Year Ended
| |
| | | August 31, 2010 | | | August 31, 2009 | | | August 31, 2010 | | | August 31, 2009 | |
| |
Operations: | | | | | | | | | | | | | | | | |
| Net investment loss | | $ | (244,177 | ) | | $ | (39,245 | ) | | $ | (169,165 | ) | | $ | (19,596 | ) |
| Net realized gain (loss) on investments | | | 5,583,465 | | | | (1,573,271 | ) | | | (1,208,889 | ) | | | (2,380,224 | ) |
| Capital gain distributions from regulated investment companies | | | — | | | | 562 | | | | 55,955 | | | | 57,971 | |
| Net unrealized appreciation (depreciation) on investments | | | (3,871,149 | ) | | | 574,464 | | | | 373,698 | | | | 250,018 | |
| | | | | | | | | | | | | | | | | |
| Net increase (decrease) in net assets resulting from operations | | | 1,468,139 | | | | (1,037,490 | ) | | | (948,401 | ) | | | (2,091,831 | ) |
| | | | | | | | | | | | | | | | | |
Distributions to shareholders: | | | | | | | | | | | | | | | | |
| Net investment income | | | — | | | | — | | | | (30,374 | ) | | | (800,714 | ) |
| Return of capital | | | (155,936 | ) | | | — | | | | (7 | ) | | | — | |
| | | | | | | | | | | | | | | | | |
| Total distributions | | | (155,936 | ) | | | — | | | | (30,381 | ) | | | (800,714 | ) |
| | | | | | | | | | | | | | | | | |
Capital share transactions: | | | | | | | | | | | | | | | | |
| Proceeds from shares sold | | | 119,914,890 | | | | 64,703,494 | | | | 36,496,354 | | | | 11,075,462 | |
| Proceeds from shares issued to holders in reinvestment of distributions | | | 155,936 | | | | — | | | | 30,381 | | | | 800,714 | |
| Cost of shares redeemed | | | (72,875,120 | ) | | | (35,886,482 | ) | | | (23,525,648 | ) | | | (13,918,262 | ) |
| | | | | | | | | | | | | | | | | |
| Net increase (decrease) in net assets resulting from capital share transactions | | | 47,195,706 | | | | 28,817,012 | | | | 13,001,087 | | | | (2,042,086 | ) |
| | | | | | | | | | | | | | | | | |
Total increase (decrease) in net assets | | | 48,507,909 | | | | 27,779,522 | | | | 12,022,305 | | | | (4,934,631 | ) |
| | | | | | | | | | | | | | | | | |
Net assets: | | | | | | | | | | | | | | | | |
| Beginning of year | | | 45,077,395 | | | | 17,297,873 | | | | 20,102,453 | | | | 25,037,084 | |
| | | | | | | | | | | | | | | | | |
| End of year | | $ | 93,585,304 | | | $ | 45,077,395 | | | $ | 32,124,758 | | | $ | 20,102,453 | |
| | | | | | | | | | | | | | | | | |
Undistributed net investment income, end of year | | $ | — | | | $ | — | | | $ | — | | | $ | 30,374 | |
| | | | | | | | | | | | | | | | | |
The accompanying notes are an integral part of these financial statements.
DIREXION ANNUAL REPORT 23
Financial Highlights
August 31, 2010
| | | | | | | | | | | | | | | | | | | | | | | | | | | | | | | | | | | | | | | | | | | | | | | | | | | | | | | | | | | | | | | | | | | | | |
| | | | | | | | | | | | | �� | | | | | | | | | | | | | | | | | | | | | | | RATIOS TO AVERAGE NET ASSETS | | | | |
| | | | | | | | | | | | | | | | | | | | | | | | | | | | | | | | | | | | | | | | | | | | | | | | Net
| | | | |
| | | | | | | | | Net Realized
| | | Net Increase
| | | | | | | | | | | | | | | | | | | | | | | | | | | | | | | | | | | | Investment
| | | | |
| | | Net Asset
| | | Net
| | | and
| | | (Decrease)
| | | Dividends
| | | Distributions
| | | | | | | | | Net Asset
| | | | | | | | | | | | | | | | | | | | | Income (Loss)
| | | | |
| | | Value,
| | | Investment
| | | Unrealized
| | | in Net Asset
| | | from Net
| | | from
| | | Return
| | | | | | Value,
| | | | | | Net Assets,
| | | Including Short Dividends | | | Excluding Short Dividends | | | After Expense
| | | Portfolio
| |
| | | Beginning
| | | Income
| | | Gain (Loss)
| | | Value Resulting
| | | Investment
| | | Realized
| | | of Capital
| | | Total
| | | End of
| | | Total
| | | End of
| | | Total
| | | Net
| | | Total
| | | Net
| | | Reimbursement/
| | | Turnover
| |
| Year/Period | | of Year/Period | | | (Loss)3 | | | on Investments | | | from Operations | | | Income | | | Capital Gains | | | Distribution | | | Distributions | | | Year/Period | | | Return4 | | | Year/Period (,000) | | | Expenses1 | | | Expenses1 | | | Expenses1 | | | Expenses1 | | | Recoupment1 | | | Rate5 | |
| | |
Evolution Managed Bond Fund |
| Year Ended August 31, 2010 | | $ | 16.57 | | | $ | 0.34 | | | $ | 0.93 | | | | 1.27 | | | $ | (0.30 | ) | | $ | — | | | $ | — | | | | (0.30 | ) | | $ | 17.54 | | | | 7.78 | % | | $ | 52,759 | | | | — | | | | — | | | | 1.91 | % | | | 1.91 | % | | | 2.02 | % | | | 390 | % |
| Year Ended August 31, 2009 | | | 16.41 | | | | 0.37 | | | | 0.12 | | | | 0.49 | | | | (0.33 | ) | | | — | | | | — | | | | (0.33 | ) | | | 16.57 | | | | 3.04 | % | | | 47,765 | | | | — | | | | — | | | | 1.88 | % | | | 1.87 | % | | | 2.32 | % | | | 425 | % |
| Year ended August 31, 2008 | | | 16.83 | | | | 0.59 | | | | (0.30 | ) | | | 0.29 | | | | (0.71 | ) | | | — | | | | — | | | | (0.71 | ) | | | 16.41 | | | | 1.78 | % | | | 26,242 | | | | — | | | | — | | | | 1.90 | % | | | 1.75 | % | | | 3.51 | % | | | 439 | % |
| Year ended August 31, 2007 | | | 17.45 | | | | 0.64 | | | | (0.51 | ) | | | 0.13 | | | | (0.75 | ) | | | — | | | | — | | | | (0.75 | ) | | | 16.83 | | | | 0.76 | % | | | 39,736 | | | | — | | | | — | | | | 1.75 | % | | | 1.75 | % | | | 3.70 | % | | | 914 | % |
| Year ended August 31, 2006 | | | 18.20 | | | | 0.466 | | | | (0.70 | ) | | | (0.24 | ) | | | (0.51 | ) | | | — | | | | — | | | | (0.51 | ) | | | 17.45 | | | | (1.26 | %) | | | 46,932 | | | | 1.86 | % | | | 1.84 | % | | | 1.81 | % | | | 1.79 | %8 | | | 2.70 | %7 | | | 1,156 | % |
Evolution All-Cap Equity Fund |
| Year Ended August 31, 2010 | | | 14.83 | | | | (0.09 | ) | | | (2.70 | ) | | | (2.79 | ) | | | — | | | | — | | | | — | | | | — | | | | 12.04 | | | | (18.81 | %)9 | | | 11,355 | | | | — | | | | — | | | | 1.90 | % | | | 1.90 | % | | | (0.65 | %) | | | 1,677 | % |
| Year Ended August 31, 2009 | | | 18.55 | | | | (0.07 | ) | | | (3.65 | ) | | | (3.72 | ) | | | — | | | | — | | | | — | | | | — | | | | 14.83 | | | | (20.05 | %) | | | 43,472 | | | | — | | | | — | | | | 1.87 | % | | | 1.85 | % | | | (0.48 | %) | | | 1,977 | % |
| Year ended August 31, 2008 | | | 24.31 | | | | (0.06 | ) | | | (1.96 | ) | | | (2.02 | ) | | | — | | | | (3.74 | ) | | | — | | | | (3.74 | ) | | | 18.55 | | | | (10.07 | %) | | | 35,137 | | | | — | | | | — | | | | 1.84 | % | | | 1.75 | % | | | (0.27 | %) | | | 1,374 | % |
| Year ended August 31, 2007 | | | 22.75 | | | | 0.03 | | | | 2.67 | | | | 2.70 | | | | (0.19 | ) | | | (0.95 | ) | | | — | | | | (1.14 | ) | | | 24.31 | | | | 12.03 | % | | | 64,247 | | | | — | | | | — | | | | 1.69 | % | | | 1.69 | % | | | 0.10 | % | | | 885 | % |
| Year ended August 31, 2006 | | | 21.24 | | | | 0.20 | | | | 2.03 | | | | 2.23 | | | | — | | | | (0.72 | ) | | | — | | | | (0.72 | ) | | | 22.75 | | | | 10.61 | % | | | 112,721 | | | | — | | | | — | | | | 1.67 | % | | | 1.69 | %8 | | | 0.88 | % | | | 1,119 | % |
Evolution Market Leaders Fund |
| Year Ended August 31, 2010 | | | 11.35 | | | | (0.04 | ) | | | 0.64 | | | | 0.60 | | | | (0.03 | ) | | | — | | | | — | | | | (0.03 | ) | | | 11.92 | | | | 5.29 | % | | | 93,585 | | | | — | | | | — | | | | 1.90 | % | | | 1.90 | % | | | (0.33 | %) | | | 1,239 | % |
| Year Ended August 31, 2009 | | | 16.68 | | | | (0.02 | ) | | | (5.31 | ) | | | (5.33 | ) | | | — | | | | — | | | | — | | | | — | | | | 11.35 | | | | (31.95 | %) | | | 45,077 | | | | — | | | | — | | | | 1.95 | % | | | 1.90 | % | | | (0.16 | %) | | | 1,697 | % |
| Year ended August 31, 2008 | | | 18.80 | | | | 0.07 | | | | (2.10 | ) | | | (2.03 | ) | | | (0.06 | ) | | | — | | | | (0.03 | ) | | | (0.09 | ) | | | 16.68 | | | | (10.86 | %) | | | 17,298 | | | | — | | | | — | | | | 1.96 | % | | | 1.75 | % | | | 0.38 | % | | | 1,191 | % |
| Year ended August 31, 2007 | | | 18.12 | | | | (0.03 | ) | | | 0.78 | | | | 0.75 | | | | (0.07 | ) | | | — | | | | — | | | | (0.07 | ) | | | 18.80 | | | | 4.06 | % | | | 31,637 | | | | — | | | | — | | | | 1.85 | % | | | 1.75 | % | | | (0.17 | %) | | | 886 | % |
January 27, 200610 to August 31, 2006 | | | 20.00 | | | | 0.06 | | | | (1.94 | ) | | | (1.88 | ) | | | — | | | | — | | | | — | | | | — | | | | 18.12 | | | | (9.40 | %)2 | | | 53,795 | | | | — | | | | — | | | | 1.84 | % | | | 1.75 | % | | | 0.50 | % | | | 864 | %2 |
Evolution Alternative Investment Fund |
| Year Ended August 31, 2010 | | | 15.52 | | | | (0.10 | ) | | | (0.25 | ) | | | (0.35 | ) | | | (0.02 | ) | | | — | | | | — | | | | (0.02 | ) | | | 15.15 | | | | (2.26 | %) | | | 32,125 | | | | — | | | | — | | | | 1.90 | % | | | 1.90 | % | | | (0.66 | %) | | | 879 | % |
| Year Ended August 31, 2009 | | | 17.63 | | | | (0.02 | ) | | | (1.47 | ) | | | (1.49 | ) | | | (0.62 | ) | | | — | | | | — | | | | (0.62 | ) | | | 15.52 | | | | (8.35 | %) | | | 20,102 | | | | — | | | | — | | | | 1.99 | % | | | 1.90 | % | | | (0.10 | %) | | | 785 | % |
| Year ended August 31, 2008 | | | 20.48 | | | | 0.45 | | | | (2.60 | ) | | | (2.15 | ) | | | (0.06 | ) | | | (0.64 | ) | | | — | | | | (0.70 | ) | | | 17.63 | | | | (10.77 | %) | | | 25,037 | | | | — | | | | — | | | | 1.89 | % | | | 1.75 | % | | | 2.32 | % | | | 777 | % |
| Year ended August 31, 2007 | | | 20.65 | | | | 0.32 | | | | (0.03 | ) | | | 0.29 | | | | (0.32 | ) | | | (0.14 | ) | | | — | | | | (0.46 | ) | | | 20.48 | | | | 1.35 | % | | | 46,115 | | | | — | | | | — | | | | 1.72 | % | | | 1.75 | % | | | 1.46 | % | | | 824 | % |
January 26, 200610 to August 31, 2006 | | | 20.00 | | | | 0.22 | | | | 0.49 | | | | 0.71 | | | | (0.06 | ) | | | — | | | | — | | | | (0.06 | ) | | | 20.65 | | | | 3.57 | %2 | | | 58,519 | | | | — | | | | — | | | | 1.82 | % | | | 1.75 | % | | | 1.88 | % | | | 642 | %2 |
| | |
| 1 | | Annualized. |
| 2 | | Not annualized. |
| 3 | | Net investment income (loss) per share represents net investment income (loss) divided by the daily average shares of beneficial interest outstanding throughout each period. |
| 4 | | All returns reflect reinvested dividends, if any, but do not reflect the impact of taxes. |
| 5 | | Portfolio turnover is calculated without regard to short-term securities having a maturity of less than one year. Investments in options, swaps, and futures contracts and repurchase agreements are deemed short-term securities. The Fund’s aggressive investment strategy may result in significant portfolio turnover to take advantage of anticipated changes in market conditions. |
| 6 | | Net investment income (loss) before dividends on short positions for the year ended August 31, 2006 was $0.47. |
| 7 | | Net investment income (loss) ratio included dividends on short positions. The ratio excluding dividends on short positions for the year ended August 31, 2006 was 2.75%. |
| 8 | | For the period September 1, 2005 to December 29, 2005 the annual cap on expenses excluding short dividends was 2.00%. |
| 9 | | The Adviser made a contribution due to a trading error. If the contribution had not been made, the total return would have been lower by 0.34%. |
| 10 | | Commencement of operations. |
24 DIREXION ANNUAL REPORT
Direxion Funds
NOTES TO THE FINANCIAL STATEMENTS
August 31, 2010
Direxion Funds (the “Trust”) was organized as a Massachusetts Business Trust on June 6, 1997 and is registered under the Investment Company Act of 1940, as amended (the “1940 Act”), as an open-end management investment company issuing its shares in series, each series representing a distinct portfolio with its own investment objective and policies. The Trust currently has 32 series in operation of which four are included in this report, the Evolution Managed Bond Fund, the Evolution All-Cap Equity Fund, the Evolution Market Leaders Fund and the Evolution Alternative Investment Fund (each a “Fund” and collectively, the “Funds”). Each Fund is a “non-diversified” series of the Trust pursuant to the 1940 Act.
The Evolution Managed Bond Fund seeks the high appreciation on an annual basis consistent with a high tolerance for risk by investing at least 80% of its assets (plus any borrowing for investment purposes) in fixed-income securities indirectly through securities that invest in or are a derivative of fixed-income securities, including exchange traded funds (ETFs), unit investment trusts (UITs) and closed-end and open-end investment companies. The Evolution All-Cap Equity Fund seeks the high appreciation on an annual basis consistent with a high tolerance for risk by investing at least 80% of its net assets (plus any borrowing for investment purposes) in equity securities either directly through individual stocks and American Depository Receipts (ADRs) or indirectly through securities that invest in or are a derivative of equity securities. The Evolution Market Leaders Fund seeks high appreciation on an annual basis consistent with a high tolerance for risk by typically investing primarily in equity securities either directly or indirectly through individual stocks and ADRs or indirectly through securities that invest in or are a derivative of equity securities. The Evolution Alternative Investment Fund seeks high total return on an annual basis with the S&P 500® Index consistent with a high tolerance for risk by investing primarily in securities, including dividend-paying equities or interest bearing fixed income securities, having a low or negative correlation with the S&P 500® Index (collectively, “alternative securities”) or indirectly through securities that invest in or are a derivative of alternative securities.
| |
| 2. | SIGNIFICANT ACCOUNTING POLICIES |
The following is a summary of significant accounting policies consistently followed by the Funds in the preparation of their financial statements. These policies are in conformity with U.S. generally accepted accounting principles (“GAAP”).
a) Investment Valuation – The Net Asset Value (“NAV”) of each Fund is determined daily, Monday through Friday, as of the close of regular trading on the New York Stock Exchange (“NYSE”), each day the NYSE is open for business. The value of all portfolio securities and other assets held by a Fund will be determined as of the time a Fund calculates its NAV, 4:00 p.m. Eastern Time (“Valuation Time”). Equity securities and ETFs are valued at their last sales price, or if not available, at the average of the last bid and ask prices. Investments in open-end mutual funds are valued at their respective quoted net asset values on the valuation dates. Futures are valued at the settlement price established on the exchange on which they are traded, if that settlement price reflects trading prior to the Valuation Time. If the settlement price established by the exchange reflects trading after the Valuation Time, then the last sales price prior to Valuation Time will be used. Options are valued at the composite price, using the National Best Bid and Offer quotes (“NBBO”). NBBO consists of the highest bid price and lowest ask price across any of the exchanges on which an option is quoted. Specifically, composite pricing looks at the last trades on the exchanges where the options are traded. If there are no trades for the option on a given business day, the composite pricing calculates the mean of the highest bid and lowest ask price across the exchanges where the option is traded. Over-the-counter securities are valued at the average of the last bid and ask prices. Securities primarily traded on the NASDAQ National Market are valued using the NASDAQ Official Closing Price. Swaps are valued based upon prices from third party vendor models or quotations from market makers to the extent available. Short-term debt securities with a maturity of 60 days or less and money market securities are valued using the amortized cost method. Other debt securities are valued by using the mean prices provided by the Fund’s pricing service or, if such services are unavailable, by a pricing matrix method. Securities for which reliable market quotations are not readily available, the Funds’ pricing service does not provide a valuation for such securities, the Fund’s pricing service provides valuation that in the judgment of Rafferty Asset Management, LLC (the “Adviser”) does not represent fair value, or the Fund or Adviser believes the market price is stale will be fair valued as determined by the Adviser under the supervision of the Board of Trustees.
DIREXION ANNUAL REPORT 25
b) Repurchase Agreements – Each Fund may enter into repurchase agreements with institutions that are members of the Federal Reserve System or securities dealers who are members of a national securities exchange or are primary dealers in U.S. government securities. In connection with transactions in repurchase agreements, it is the Trust’s policy that the Fund receives, as collateral, cash and/or securities (primarily U.S. Government securities) whose market value, including accrued interest, at all times will be at least equal to 100% of the amount invested by the Fund in each repurchase agreement. If the seller defaults, and the value of the collateral declines, realization of the collateral by the Fund may be delayed or limited. The Funds were not invested in repurchase agreements at August 31, 2010.
c) Swap Contracts – Each Fund may enter into equity swap contacts. Standard equity swap contracts are between two parties that agree to exchange the returns (or differentials in rates of return) earned or realized on particular predetermined investments or instruments. The gross amount to be exchanged is calculated with respect to a “notional amount” (i.e. the return on or increase in value of a particular dollar amount invested in a “basket” of securities representing a particular index or industry sector). The Fund’s obligations are accrued daily (offset by any amounts owed to the Fund.)
In a “long” equity swap agreement, the counterparty will generally agree to pay the Fund the amount, if any, by which the notional amount of swap contract would have increased in value if the Fund had been invested in the particular securities, plus dividends that would have been received on those securities. The Fund will agree to pay the counterparty a floating rate of interest (e.g., a LIBOR based rate) on the notional amount of the swap contract plus the amount, if any, by which the notional amount would have decreased in value had it been invested in such securities plus, in certain instances, commissions or trading spreads on the notional amounts. Thus, the return on the swap contract should be the gain or loss on the notional amount plus dividends on the securities less the interest paid by the Fund on the notional amount. Payments may be made at the conclusion of the contract or periodically during its term. These swap contracts do not include the delivery of securities by the Funds to the counterparty. The net amount of the excess, if any, of the Fund’s obligations owed over its entitlement with respect to each swap is accrued on a daily basis and an amount of cash or liquid assets having an aggregate net asset value at least equal to such accrued excess is maintained in a segregated account by the Funds’ custodian. Until a swap contract is settled in cash, the gain or loss on the notional amount plus dividends on the securities less the interest paid by the Fund on the notional amount are recorded as “unrealized gains or losses on swaps” and when cash is exchanged, the gain or loss is recorded as “realized gains or losses on swaps.”
Each Fund may enter into swap contracts that provide the opposite return of the particular benchmark or security (“short” the index or security). The operations are similar to that of the swaps disclosed above except that the counterparty pays interest to the Fund on the notional amount outstanding and the dividends on the underlying securities reduce the return of the swap. These amounts are netted with any unrealized appreciation or depreciation to determine the value of the swap. The Funds will typically enter into equity swap agreements to obtain leverage in order to meet their objectives.
The Funds collateralize swap agreements with cash and certain securities as indicated on the Schedule of Investments of each of the Funds, respectively. Such collateral is held for the benefit of the counterparty in a segregated account at the Custodian to protect the counterparty against non-payment by the Funds. The Funds do not net collateral. In the event of a default by the counterparty, the Funds will seek return of this collateral and may incur certain costs exercising their rights with respect to the collateral. Amounts expected to be owed to the Funds are regularly collateralized either directly with the Funds or in a segregated account at the Custodian.
A Fund bears the risk of loss of the amount expected to be received under a swap agreement in the event of the default or bankruptcy of swap agreement counterparty to the extent that posted collateral is insufficient. A Fund will enter into swap agreements only with large, well-capitalized and established financial institutions. The creditworthiness of each of the firms that is a party to a swap agreement is monitored by the Adviser.
The Funds were not invested in swap contracts at August 31, 2010.
d) Short Positions – Each Fund may engage in short sale transactions. For financial statement purposes, an amount equal to the settlement amount is included in the Statement of Assets and Liabilities as an asset and an equivalent liability. The amount of the liability is subsequently marked-to-market to reflect the current value of the short position. Subsequent fluctuations in the market prices of short positions may require purchasing the securities at prices which may differ from the market value reflected on the Statement of Assets and Liabilities. The Fund is liable to the buyer for any dividends payable on securities while those securities are in a short position. As collateral for its short positions, the Fund is required under the
26 DIREXION ANNUAL REPORT
1940 Act to maintain assets consisting of cash, cash equivalents or liquid securities equal to the market value of the securities sold short. This collateral is required to be adjusted daily. The Funds were not invested in short positions at August 31, 2010.
e) Stock Index Futures Contracts and Options on Futures Contracts – Each Fund may purchase and sell stock index futures contracts and options on such futures contracts. A Fund may use futures contracts to gain exposure to, or hedge against changes in the values of equities, interest rates or foreign currencies. Upon entering into a contract, the Fund deposits and maintains as collateral such initial margin as required by the exchange on which the transaction is effected. Pursuant to the contract, the Fund agrees to receive from or pay to the broker an amount of cash equal to the daily fluctuation in value of the contract. Such receipts or payments are known as “variation margin” and are recorded by the Fund as unrealized gains and losses. When the contract is closed, the Fund records a realized gain or loss equal to the difference between the value of the contract at the time it was opened and the value at the time it was closed. As collateral for futures contracts, the Fund is required under the 1940 Act to maintain assets consisting of cash, cash equivalents or liquid securities. This collateral is required to be adjusted daily to reflect the market value of the purchase obligation for long futures contracts or the market value of the instrument underlying the contract, but not less than the market price at which the futures contract was established, for short futures contracts. The Funds were not invested in options on futures contracts at August 31, 2010.
f) Risks of Options, Futures Contracts, Options on Futures Contracts and Short Positions – The risks inherent in the use of options, futures contracts, options on futures contracts and short positions include 1) adverse changes in the value of such instruments; 2) imperfect correlation between the price of options and futures contracts and options thereon and movements in the price of the underlying securities, index or futures contracts; 3) the possible absence of a liquid secondary market for any particular instrument at any time; 4) the possible need to defer closing out certain positions to avoid adverse tax consequences; and 5) the possible nonperformance by the counterparty under the terms of the contract. The Funds designate all cash, cash equivalents and liquid securities as collateral for written options, futures contracts, options on futures contracts and short positions.
g) Risks of Investing in Foreign Securities – Investments in foreign securities involve greater risks than investing in domestic securities. As a result, the Fund’s returns and net asset values may be affected to a large degree by fluctuations in currency exchange rates, political, diplomatic or economic conditions and regulatory requirements in other countries. The laws and accounting, auditing, and financial reporting standards in foreign countries typically are not as strict as they are in the U.S., and there may be less public information available about foreign companies. Investments in foreign emerging markets present a greater risk than investing in foreign issuers in general. The risk of political or social upheaval is greater in emerging markets. In addition, there may be risks of an economy’s dependence on revenues from particular commodities, currency transfer restrictions, a limited number of potential buyers for such securities and delays and disruption in securities settlement procedures.
h) Security Transactions – Investment transactions are recorded on trade date. The Funds determine the gain or loss realized from investment transactions by comparing the identified cost, which is the same basis used for federal income tax purposes, with the net sales proceeds.
i) Federal Income Taxes – Each Fund intends to comply with the requirements of Subchapter M of the Internal Revenue Code necessary to qualify as a regulated investment company and to make the requisite distributions of income and capital gains to its shareholders sufficient to relieve it from all or substantially all federal income. No provision for federal income taxes has been made.
j) Income and Expenses – Dividend income is recorded on the ex-dividend date. Interest income, including amortization of premium and discount, and dividends received from money market funds, is recognized on an accrual basis. Expenses are charged to the Funds daily. Expenses are computed based on each Fund’s respective daily net assets. For additional discussion on expenses refer to Note 5.
k) Distributions to Shareholders – Each Fund generally pays dividends from net investment income and distributes net realized capital gains, if any, at least annually. Income and capital gain distributions are determined in accordance with income tax regulations which may differ from GAAP. The Funds may utilize earnings and profits distributed to shareholders on redemption of shares as part of the dividend paid deduction. Distributions to shareholders are recorded on the ex-dividend date.
DIREXION ANNUAL REPORT 27
The tax character of distributions for the Funds during the years ended August 31, 2010 and August 31, 2009 were as follows:
| | | | | | | | | | | | | | | | | |
| | | Evolution Managed
| | | Evolution All-Cap
| |
| | | Bond Fund | | | Equity Fund | |
| | | Year Ended
| | | Year Ended
| | | Year Ended
| | | Year Ended
| |
| | | August 31,
| | | August 31,
| | | August 31,
| | | August 31,
| |
| | | 2010 | | | 2009 | | | 2010 | | | 2009 | |
| |
| Distributions paid from: | | | | | | | | | | | | | | | | |
| Ordinary Income | | $ | 929,653 | | | $ | 665,397 | | | $ | — | | | $ | — | |
| Long-Term Capital Gains | | | — | | | | — | | | | — | | | | — | |
| | | | | | | | | | | | | | | | | |
| Total Distributions paid | | $ | 929,653 | | | $ | 665,397 | | | $ | — | | | $ | — | |
| | | | | | | | | | | | | | | | | |
| | | | | | | | | | | | | | | | | |
| | | Evolution Market
| | | Evolution Alternative
| |
| | | Leaders Fund | | | Investment Fund | |
| | | Year Ended
| | | Year Ended
| | | Year Ended
| | | Year Ended
| |
| | | August 31,
| | | August 31,
| | | August 31,
| | | August 31,
| |
| | | 2010 | | | 2009 | | | 2010 | | | 2009 | |
| |
| Distributions paid from: | | | | | | | | | | | | | | | | |
| Ordinary Income | | $ | — | | | $ | — | | | $ | 30,374 | | | $ | 800,714 | |
| Long-Term Capital Gains | | | — | | | | — | | | | — | | | | — | |
| Return of Capital | | | 155,936 | | | | — | | | | 7 | | | | — | |
| | | | | | | | | | | | | | | | | |
| Total Distributions paid | | $ | 155,936 | | | $ | — | | | $ | 30,381 | | | $ | 800,714 | |
| | | | | | | | | | | | | | | | | |
The Funds are designating long-term capital gain dividends, pursuant to Internal Revenue Code Section 852(b)(3), the amount necessary to reduce the earnings and profits of the Fund related to net capital gain to zero for the tax year ended August 31, 2010.
As of August 31, 2010, the components of distributable earnings of the Funds on a tax basis were as follows:
| | | | | | | | | | | | | | | | | |
| | | Evolution
| | | Evolution
| | | Evolution
| | | Evolution
| |
| | | Managed
| | | All-Cap
| | | Market
| | | Alternative
| |
| | | Bond Fund | | | Equity Fund | | | Leaders Fund | | | Investment Fund | |
| |
| Tax cost of investments | | $ | 49,716,176 | | | $ | 11,958,196 | | | $ | 96,266,186 | | | $ | 30,720,711 | |
| Gross unrealized appreciation | | | 4,097,329 | | | | 275,279 | | | | 932,225 | | | | 1,077,405 | |
| Gross unrealized depreciation | | | (1,172,052 | ) | | | (814,266 | ) | | | (4,038,005 | ) | | | (668,552 | ) |
| | | | | | | | | | | | | | | | | |
| Net unrealized appreciation/(depreciation) | | $ | 2,925,277 | | | $ | (538,987 | ) | | $ | (3,105,780 | ) | | $ | 408,853 | |
| | | | | | | | | | | | | | | | | |
| Undistributed ordinary income | | | 322,088 | | | | — | | | | — | | | | — | |
| Undistributed long-term capital gain | | | — | | | | — | | | | — | | | | — | |
| | | | | | | | | | | | | | | | | |
| Total distributable earnings | | | 322,088 | | | | — | | | | — | | | | — | |
| | | | | | | | | | | | | | | | | |
| Other accumulated gain/(loss) | | | (3,675,341 | ) | | | (20,263,603 | ) | | | (1,998,863 | ) | | | (9,114,176 | ) |
| | | | | | | | | | | | | | | | | |
| Total accumulated earnings/(loss) | | $ | (427,976 | ) | | $ | (20,802,590 | ) | | $ | (5,104,643 | ) | | $ | (8,705,323 | ) |
| | | | | | | | | | | | | | | | | |
The difference between book cost of investments and tax cost of investments is attributable primarily to the tax deferral of losses on wash sales. Other accumulated gain/(loss) is generally comprised of capital loss carryforwards, post-October capital loss deferrals and/or unrealized gain/(loss) on derivative positions.
On the Statement of Assets and Liabilities, the following adjustments were made for permanent tax differences between accounting for net investment income and realized gains and losses under GAAP and tax reporting:
| | | | | | | | | | | | | |
| | | Net Investment
| | | Realized
| | | Capital
| |
| | | Income (Loss) | | | Gain (Loss) | | | Stock | |
| |
| Evolution Managed Bond Fund | | | 10,885 | | | | (10,885 | ) | | | — | |
| Evolution All-Cap Equity Fund | | | 186,538 | | | | (45,231 | ) | | | (141,307 | ) |
| Evolution Market Leaders Fund | | | 244,177 | | | | — | | | | (244,177 | ) |
| Evolution Alternative Investment Fund | | | 169,165 | | | | (50,796 | ) | | | (118,369 | ) |
28 DIREXION ANNUAL REPORT
Net investment income and realized gains and losses for federal income tax purposes may differ from that reported on the financial statements because of permanent book-to-tax differences. GAAP requires that permanent differences in net investment income and realized gains and losses due to differences between financial reporting and tax reporting be reclassified between various components of net assets. The permanent differences primarily relate to net operating losses and investments in partnerships and royalty trusts.
In order to meet certain excise tax distribution requirements, the Funds are required to measure and distribute annually, net capital gains realized during a twelve-month period ending October 31. In connection with this, the Funds are permitted for tax purposes to defer into their next fiscal year any net capital losses incurred between November 1 and the end of their fiscal year, August 31, 2010.
At August 31, 2010, the following funds deferred, on a tax basis, post-October losses of:
| | | | | | | | | |
| | | Post October
| | | Post October
| |
| | | Capital Loss Deferred | | | Currency Loss Deferred | |
| |
| Evolution Managed Bond Fund | | $ | — | | | $ | — | |
| Evolution All-Cap Equity Fund | | | 3,626,599 | | | | 11 | |
| Evolution Market Leaders Fund | | | — | | | | — | |
| Evolution Alternative Investment Fund | | | 716,489 | | | | — | |
At August 31, 2010, the following funds had capital loss carryforwards on a tax basis of:
| | | | | | | | | | | | | | | | | | | | | | | | | | | | | |
| | | Expires | |
| | | 8/31/2013 | | | 8/31/2014 | | | 8/31/2015 | | | 8/31/2016 | | | 8/31/2017 | | | 8/31/2018 | | | Total | |
| |
| Evolution Managed Bond Fund | | $ | 486,698 | | | $ | 596,309 | | | $ | 586,831 | | | $ | 1,226,623 | | | $ | 743,352 | | | $ | — | | | $ | 3,639,813 | |
| Evolution All-Cap Equity Fund | | | — | | | | — | | | | — | | | | 3,893,085 | | | | 8,377,957 | | | | 4,227,241 | | | | 16,498,283 | |
| Evolution Market Leaders Fund | | | — | | | | — | | | | — | | | | — | | | | 1,998,069 | | | | — | | | | 1,998,069 | |
| Evolution Alternative Investment Fund | | | — | | | | — | | | | — | | | | 1,031,582 | | | | 6,768,541 | | | | — | | | | 7,800,123 | |
| | | | | |
Capital Loss Utilized | | 8/31/2010 | |
| |
| Evolution Managed Bond Fund | | $ | 751,681 | |
| Evolution Market Leaders Fund | | | 5,977,010 | |
| Evolution Alternative Investment Fund | | | 369,345 | |
To the extent that the Funds realize future net capital gains, those gains will be offset by any unused capital loss carryover.
The Funds have adopted authoritative financial reporting rules regarding recognition and measurement of tax positions taken or expected to be taken on a tax return. The Funds have reviewed all open tax years and concluded that there is no effect to the Funds’ financial positions or results of operations and no tax liability resulting from unrecognized tax benefits relating to uncertain income tax position take or expected to be taken on a tax return. Open tax years are those years that are open for examination by the relevant income taxing authority. As of August 31, 2010, open Federal and state income tax years include the tax years ended August 31, 2007, August 31, 2008, August 31, 2009 and August 31, 2010. The Funds have no examination in progress. The Funds are also not aware of any tax positions for which it is reasonably possible that the total amounts of unrecognized tax expense will significantly change in twelve months.
l) Credit Facility – U.S. Bank, N.A. (“U.S. Bank”) had made available to Funds a credit facility pursuant to a Line of Credit Agreement (“Line of Credit”) for meeting redemption requests. The following funds utilized the Line of Credit during the year ended August 31, 2010:
DIREXION ANNUAL REPORT 29
| | | | | | | | | | | | | | | | | | | | | | | | | |
| | | | | | | | | Maximum Amount
| | | | | | | | | | |
| | | Available Borrowing
| | | Outstanding
| | | Outstanding during
| | | Average
| | | | | | | |
| | | (Lesser of 33 1/3% of
| | | Balance as of
| | | the Year Ended
| | | Daily
| | | Interest
| | | Borrowings
| |
| | | Fund’s Net Assets or) | | | August 31, 2010 | | | August 31, 2010 | | | Balance | | | Expense | | | Charged At | |
| |
| Evolution Managed Bond Fund | | $ | 4,675,000 | | | $ | — | | | $ | 4,675,000 | | | $ | 89,986 | | | $ | 2,509 | | | | Prime Rate less 1/2% | |
| Evolution All-Cap Equity Fund | | | 9,000,000 | | | | — | | | | 4,410,000 | | | | 36,247 | | | | 1,011 | | | | Prime Rate less 1/2% | |
| Evolution Market Leaders Fund | | | 5,500,000 | | | | — | | | | 5,157,000 | | | | 97,353 | | | | 2,714 | | | | Prime Rate less 1/2% | |
| Evolution Alternative Investment Fund | | | 2,650,000 | | | | — | | | | 2,650,000 | | | | 7,260 | | | | 202 | | | | Prime Rate less 1/2% | |
m) Guarantees and Indemnifications – In the ordinary course of business, the Funds enter into contracts that contain a variety of indemnification provisions pursuant to which the Funds agree to indemnify third parties upon occurrence of specified events. The Fund’s maximum exposure relating to these indemnification agreements is unknown. However, the Funds have not had prior claims or losses in connection with these provisions and believe the risk of loss is remote.
n) Use of Estimates – The preparation of financial statements in conformity with GAAP requires management to make estimates and assumptions that affect the reported amounts of assets and liabilities and disclosure of contingent assets and liabilities at the date of the financial statements and the reported amounts of revenues and expenses during the reporting period. Actual results could differ from those estimates.
| |
| 3. | CAPITAL SHARE TRANSACTIONS |
The capital share transactions for the Funds during the year ended August 31, 2010 and August 31, 2009 were as follows:
| | | | | | | | | | | | | | | | | |
| | | Evolution Managed Bond Fund | | | Evolution All-Cap Equity Fund | |
| | | Year Ended
| | | Year Ended
| | | Year Ended
| | | Year Ended
| |
| | | August 31,
| | | August 31,
| | | August 31,
| | | August 31,
| |
| | | 2010 | | | 2009 | | | 2010 | | | 2009 | |
| |
| Shares sold | | | 5,150,963 | | | | 2,851,237 | | | | 812,865 | | | | 2,525,299 | |
| Shares issued in reinvestment of distributions | | | 55,888 | | | | 40,574 | | | | — | | | | — | |
| Shares redeemed | | | (5,081,153 | ) | | | (1,608,135 | ) | | | (2,801,250 | ) | | | (1,487,693 | ) |
| | | | | | | | | | | | | | | | | |
| Total net increase (decrease) from capital share transactions | | | 125,698 | | | | 1,283,676 | | | | (1,988,385 | ) | | | 1,037,606 | |
| | | | | | | | | | | | | | | | | |
| | | | | | | | | | | | | | | | | |
| | | | | | Evolution Alternative
| |
| | | Evolution Market Leaders Fund | | | Investment Fund | |
| | | Year Ended
| | | Year Ended
| | | Year Ended
| | | Year Ended
| |
| | | August 31,
| | | August 31,
| | | August 31,
| | | August 31,
| |
| | | 2010 | | | 2009 | | | 2010 | | | 2009 | |
| |
| Shares sold | | | 9,801,573 | | | | 5,995,220 | | | | 2,335,415 | | | | 705,646 | |
| Shares issued in reinvestment of distributions | | | 12,824 | | | | — | | | | 1,912 | | | | 52,783 | |
| Shares redeemed | | | (5,935,536 | ) | | | (3,059,575 | ) | | | (1,511,777 | ) | | | (883,491 | ) |
| | | | | | | | | | | | | | | | | |
| Total net increase (decrease) from capital share transactions | | | 3,878,861 | | | | 2,935,645 | | | | 825,550 | | | | (125,062 | ) |
| | | | | | | | | | | | | | | | | |
| |
| 4. | INVESTMENT TRANSACTIONS |
During the year ended August 31, 2010, the aggregate purchases and sales of investments (excluding short-term investments, swaps and futures contracts) were:
| | | | | | | | | |
| | | Purchases | | | Sales | |
| |
| Evolution Managed Bond Fund | | $ | 188,229,560 | | | $ | 185,148,181 | |
| Evolution All-Cap Equity Fund | | | 368,779,558 | | | | 402,746,878 | |
| Evolution Market Leaders Fund | | | 880,502,083 | | | | 834,076,908 | |
| Evolution Alternative Investment Fund | | | 175,961,631 | | | | 164,699,204 | |
30 DIREXION ANNUAL REPORT
| |
| 5. | INVESTMENT ADVISORY AND OTHER AGREEMENTS |
Investment Advisory Agreement: The Funds have entered into an investment advisory agreement with the Adviser. The Adviser receives a fee, computed daily and payable monthly, applied to each Fund’s average daily net assets at the annual rates presented below:
| | | | | |
| Evolution Managed Bond Fund | | | 1.00% | |
| Evolution All-Cap Equity Fund | | | 1.00% | |
| Evolution Market Leaders Fund | | | 1.00% | |
| Evolution Alternative Investment Fund | | | 1.00% | |
In addition, the Adviser has entered into sub-advisory agreements relating to the Funds whereby the sub-advisor, Flexible Plan Investments, Ltd., will direct investment activities of the Funds. The Adviser pays, out of the management fees it receives from the Funds, a fee for these sub-advisory services.
Operating Services Agreement: The Funds have entered into an Operating Services Agreement (the “Agreement”) with the Adviser. Under the Agreement, the Adviser will be responsible for all expenses of the Trust except the following: management fees, distribution and/or service fees, acquired fund fees, taxes, leverage interest, dividends or interest on short positions, other interest expenses, brokerage commission and other extraordinary expenses outside the typical day-to-day operations of the Funds.
In consideration for the services rendered pursuant to the Agreement, the Funds will pay to the Adviser, as compensation for the services provided by the Adviser under the Agreement, a monthly fee. The monthly fee is calculated on an annualized basis on the average net assets of each Fund and the below amount:
| | | | | |
| Evolution Managed Bond Fund | | | 0.50% | |
| Evolution All-Cap Equity Fund | | | 0.50% | |
| Evolution Market Leaders Fund | | | 0.50% | |
| Evolution Alternative Investment Fund | | | 0.50% | |
Distribution Expenses: Shares of the Funds are subject to an annual Rule 12b-1 fee equal to 0.25% of the average daily net assets.
Shareholder Servicing Fees: The Board has also authorized each Fund’s shares to pay a shareholder servicing fee of 0.15% of each Fund’s average daily net assets. The Trust, on behalf of each Fund, pays the fee to financial institutions and other persons who provide services for and maintain shareholder accounts.
Rafferty Capital Markets, LLC (the “Distributor”) serves as principle underwriter of the Funds, and acts as the Funds’ distributor in a continuous public offering of the Funds’ shares. There were no Rule 12b-1 fees retained by the Distributor for the year ended August 31, 2010. The Distributor is an affiliate of the Adviser.
The Adviser reimbursed the Evolution All-Cap Equity Fund $41,500 due to a trading error. This amount is reflected on the Statement of Operations as contributions by affiliates and in the Financial Highlights.
| |
| 6. | VALUATION MEASUREMENTS |
The Funds have adopted authoritative fair valuation accounting standards which establish an authoritative definition of fair value and set out a hierarchy for measuring fair value. These standards require additional disclosures about the various inputs and valuation techniques used to develop the measurements of fair value and a discussion in changes in valuation techniques and related inputs during the period. These inputs are summarized in the three broad levels listed below:
Level 1 - Quoted prices in active markets for identical securities
Level 2 - Evaluated price based on other significant observable inputs (including quoted prices for similar securities, interest rates, prepayment speeds, credit risk, etc.)
Level 3 - Significant unobservable inputs (including the Fund’s own assumptions in determining fair value of investments)
The inputs or methodology used for valuing securities are not an indication of the credit risk associated with investing in those securities.
DIREXION ANNUAL REPORT 31
The follow is a summary of the inputs used to value the Funds’ net assets as of August 31, 2010:
| | | | | | | | | | | | | | | | | |
| | | Evolution Managed Bond Fund | |
Asset Class | | Level 1 | | | Level 2 | | | Level 3 | | | Total | |
| |
Investment Companies — Fixed income | | $ | 51,061,972 | | | $ | — | | | $ | — | | | $ | 51,061,972 | |
Short-Term Investments | | $ | 1,579,481 | | | $ | — | | | $ | — | | | $ | 1,579,481 | |
| | | | | | | | | | | | | | | | | |
| | | Evolution All-Cap Equity Fund | |
Asset Class | | Level 1 | | | Level 2 | | | Level 3 | | | Total | |
| |
Equity Securities | | $ | 6,648,893 | | | $ | — | | | $ | — | | | $ | 6,648,893 | |
Investment Companies — Equity | | $ | 1,264,743 | | | $ | — | | | $ | — | | | $ | 1,264,743 | |
Short-Term Investments | | $ | 3,505,573 | | | $ | — | | | $ | — | | | $ | 3,505,573 | |
Other Financial Instruments* | | $ | 6,513 | | | $ | — | | | $ | — | | | $ | 6,513 | |
The Equity Securities Level 1 balance consists of the market value of the associated Level 1 investments in the following economic sector:
| | | | | |
| Manufacturing | | $ | 3,279,624 | |
| Information | | | 999,528 | |
| Retail Trade | | | 579,142 | |
| Mining, Quarrying and Oil and Gas Extraction | | | 348,493 | |
| Wholesale Trade | | | 323,550 | |
| Professional, Scientific and Technical Services | | | 278,623 | |
| Administrative and Support and Waste Management and Remediation Services | | | 262,648 | |
| Construction | | | 247,018 | |
| Finance and Insurance | | | 120,002 | |
| Educational Services | | | 63,904 | |
| Real Estate and Rental and Leasing | | | 61,306 | |
| Other Services (except Public Administration) | | | 36,368 | |
| Utilities | | | 22,244 | |
| Health Care and Social Assistance | | | 12,073 | |
| Transportation and Warehousing | | | 7,447 | |
| Accommodation and Food Services | | | 6,923 | |
| | | | | |
| | | $ | 6,648,893 | |
| | | | | |
| | | | | | | | | | | | | | | | | |
| | | Evolution Market Leaders Fund | |
Asset Class | | Level 1 | | | Level 2 | | | Level 3 | | | Total | |
| |
Equity Securities | | $ | 914 | | | $ | — | | | $ | — | | | $ | 914 | |
Investment Companies — Equity | | $ | 91,844,460 | | | $ | — | | | $ | — | | | $ | 91,844,460 | |
Short-Term Investments | | $ | 1,315,032 | | | $ | — | | | $ | — | | | $ | 1,315,032 | |
The Equity Securities Level 1 balance consists of the market value of the associated Level 1 investments in the following economic sector:
| | | | | |
| Retail Trade | | $ | 906 | |
| Manufacturing | | | 8 | |
| | | | | |
| | | $ | 914 | |
| | | | | |
| | | | | | | | | | | | | | | | | |
| | | Evolution Alternative Investment Fund | |
Asset Class | | Level 1 | | | Level 2 | | | Level 3 | | | Total | |
| |
Investment Companies — Equity | | $ | 22,147,537 | | | $ | — | | | $ | — | | | $ | 22,147,537 | |
Investment Companies — Fixed Income | | $ | 2,201,627 | | | $ | — | | | $ | — | | | $ | 2,201,627 | |
Short-Term Investments | | $ | 6,780,400 | | | $ | — | | | $ | — | | | $ | 6,780,400 | |
Other Financial Instruments* | | $ | (23,025 | ) | | $ | — | | | $ | — | | | $ | (23,025 | ) |
For further detail on each asset class, see the Schedule of Investments.
| | |
| * | | Other financial instruments are derivative instruments not reflected in the Schedule of Investments, such as futures and swap contracts. Futures and swap contracts are valued at the unrealized appreciation (depreciation) on the instrument. |
There were no significant transfers between Level 1 and Level 2 securities during the year ended August 31, 2010.
32 DIREXION ANNUAL REPORT
| |
| 7. | ADDITIONAL DISCLOSURES ABOUT DERIVATIVE INSTRUMENTS |
The Funds have adopted authoritative standards of accounting for derivative instruments which establish disclosure requirement for derivative instruments. These standards improve financial reporting for derivative instruments by requiring enhanced disclosures that enables investors to understand how and why a fund uses derivatives instruments, how derivatives instruments are accounted for and how derivative instruments affect a fund’s financial position and results of operations.
The Funds use derivative instruments as part of their principal investment strategy to achieve their investment objective. For additional discussion on the risks associated with derivative instruments refer to Note 2. As of August 31, 2010, the Funds were invested in futures contracts.
At August 31, 2010, the fair value of derivatives instruments were as follows:
| | | | | | | | | | | | | | | |
| Asset derivatives1 | |
| | | | | Equity risk | | | Total | | | | |
| | |
| |
| Evolution All-Cap | | Futures contracts* | | $ | 6,513 | | | $ | 6,513 | | | | | |
| | | |
| | | |
| Equity Fund | | Total | | $ | 6,513 | | | $ | 6,513 | | | | | |
| |
| |
| | |
| 1 | | Statement of Assets and Liabilities location: Variation margin receivable. |
| * | | Cumulative appreciation (depreciation) of futures contracts as reported in the Schedule of Investments.
Only current day’s variation margin, if any, is reported within the Statement of Assets and Liabilities. |
| | | | | | | | | | | | | | | |
| Liability derivatives1 | |
| | | | | Equity risk | | | Total | | | | |
| | |
| |
| Evolution Alternative | | Futures contracts* | | $ | 23,025 | | | $ | 23,025 | | | | | |
| | | |
| | | |
| Investment Fund | | Total | | $ | 23,025 | | | $ | 23,025 | | | | | |
| |
| |
| | |
| 1 | | Statement of Assets and Liabilities location: Variation margin receivable. |
| * | | Cumulative appreciation (depreciation) of futures contracts as reported in the Schedule of Investments.
Only current day’s variation margin, if any, is reported within the Statement of Assets and Liabilities. |
Transactions in derivative instruments during the year ended August 31, 2010, were as follows:
| | | | | | | | | | | | | | | |
| | |
| | | | | Equity risk | | | Total | | | | |
| | |
| |
| Evolution All-Cap | | Realized gain (loss)1 | | | | | | | | | | | | |
| Equity Fund | | Futures contracts | | $ | (6,269,940 | ) | | $ | (6,269,940 | ) | | | | |
| | | |
| | | |
| | | Total realized gain (loss) | | $ | (6,269,940 | ) | | $ | (6,269,940 | ) | | | | |
| | | |
| | | |
| | | Change in unrealized appreciation (depreciation)2 | | | | | | | | | | | | |
| | | Futures contracts | | $ | 149,055 | | | $ | 149,055 | | | | | |
| | | |
| | | |
| | | Total change in unrealized appreciation (depreciation) | | $ | 149,055 | | | $ | 149,055 | | | | | |
| |
| |
| Evolution Alternative | | Realized gain (loss)1 | | | | | | | | | | | | |
| Investment Fund | | Futures contracts | | $ | (145,232 | ) | | $ | (145,232 | ) | | | | |
| | | |
| | | |
| | | Total realized gain (loss) | | $ | (145,232 | ) | | $ | (145,232 | ) | | | | |
| | | |
| | | |
| | | Change in unrealized appreciation (depreciation)2 | | | | | | | | | | | | |
| | | Futures contracts | | $ | (23,025 | ) | | $ | (23,025 | ) | | | | |
| | | |
| | | |
| | | Total change in unrealized appreciation (depreciation) | | $ | (23,025 | ) | | $ | (23,025 | ) | | | | |
| |
| |
| | |
| 1 | | Statement of Operations location: Net realized gain (loss) on futures. |
| 2 | | Statement of Operations location: Change in unrealized appreciation (depreciation) on futures. |
For the year ended August 31, 2010, the volume of the derivatives held by the Funds were as follows:
| | | | | | | | | |
| | | Quarterly Average Gross
| |
| | | Notional Amounts | |
| | | Long Futures
| | | Short Futures
| |
| | | Contracts | | | Contracts | |
| |
| Evolution Managed Bond Fund | | $ | — | | | $ | — | |
| Evolution All-Cap Equity Fund | | | 1,736,265 | | | | 9,618,512 | |
| Evolution Market Leaders Fund | | | — | | | | — | |
| Evolution Alternative Investment Fund | | | 1,137,392 | | | | — | |
DIREXION ANNUAL REPORT 33
The Funds utilized this volume of derivatives as a substitute for investing in comparable positions in underlying securities and/or as a means to limit exposure of a Fund’s position. During the year ended August 31, 2010, the Evolution All-Cap Equity Fund maintained a consistent volume of its investments in long futures contracts, while the volume of investments in long future contracts in the Evolution Alternative Investment Fund was more pronounced towards the end of the year. The Evolution All-Cap Equity Fund invested in short future contracts consistently throughout the year, but more heavily towards the beginning of the year.
| |
| 8. | NEW ACCOUNTING PRONOUNCEMENT |
In January 2010, the Financial Accounting Standards Board issued an update to improve disclosure about fair value measurements. This update required additional disclosures regarding fair value measurements. Specifically, the amendment requires reporting entities to disclose a) the input and valuation techniques used to measure fair value for both recurring and nonrecurring fair value measurements, for Level 2 or Level 3 positions, b) transfers between all levels (including Level 1 and Level 2) will be required to be disclosed on a gross basis (i.e. transfers out must be disclosed separately from transfers in) as well as the reason(s) for the transfers and c) purchases and sales must be shown on a gross basis in the Level 3 rollforward rather than as one net number.
The effective date of this guidance is for interim and annual periods beginning after December 15, 2009; however, the requirement to provide the Level 3 activity for purchases and sales on a gross basis will be effective for interim and annual periods beginning after December 15, 2010. The Funds have disclosed the applicable requirements of the accounting standard in their financial statements.
The Funds have adopted authoritative standards for accounting for and disclosure of events that occur after the balance sheet date but before financial statements are issued or are available to be issued. These standards require the Funds to recognize in the financial statements the effects of all recognized subsequent events that provide additional evidence about conditions that existed at the date of the balance sheet. For nonrecognized subsequent events that must be disclosed to keep the financial statements from being misleading, the Funds are required to disclose the nature of the event as well as an estimate of its financial effect, or a statement that such an estimate cannot be made. The Funds have evaluated subsequent events through the issuance of the Funds’ financial statements and have determined there is no impact to the Funds’ financial statements.
34 DIREXION ANNUAL REPORT
Direxion Funds
Report of Independent Registered Public Accounting Firm
To the Board of Trustees and Shareholders
of Direxion Funds:
We have audited the accompanying statements of assets and liabilities of the Evolution Managed Bond Fund, Evolution All-Cap Equity Fund, Evolution Market Leaders Fund, and Evolution Alternative Investment Fund (four of the series of the Direxion Funds) (the “Funds”), including the schedules of investments, as of August 31, 2010, and the related statements of operations, the statements of changes in net assets, and the financial highlights for each of the periods indicated therein. These financial statements and financial highlights are the responsibility of the Funds’ management. Our responsibility is to express an opinion on these financial statements and financial highlights based on our audits.
We conducted our audits in accordance with the standards of the Public Company Accounting Oversight Board (United States). Those standards require that we plan and perform the audit to obtain reasonable assurance about whether the financial statements and financial highlights are free of material misstatement. We were not engaged to perform an audit of the Funds’ internal control over financial reporting. Our audits included consideration of internal control over financial reporting as a basis for designing audit procedures that are appropriate in the circumstances, but not for the purpose of expressing an opinion on the effectiveness of the Funds’ internal control over financial reporting. Accordingly, we express no such opinion. An audit also includes examining, on a test basis, evidence supporting the amounts and disclosures in the financial statements and financial highlights, assessing the accounting principles used and significant estimates made by management, and evaluating the overall financial statement presentation. Our procedures included confirmation of securities owned as of August 31, 2010, by correspondence with the custodian and brokers or by other appropriate auditing procedures where replies from brokers were not received. We believe that our audits provide a reasonable basis for our opinion.
In our opinion, the financial statements and financial highlights referred to above present fairly, in all material respects, the financial position of the above mentioned four of the series of Direxion Funds at August 31, 2010, the results of their operations, the changes in their net assets, and the financial highlights for each of the periods indicated therein, in conformity with U.S. generally accepted accounting principles.
New York, New York
October 22, 2010
DIREXION ANNUAL REPORT 35
Additional Information
(Unaudited)
For the year ended August 31, 2010, certain dividends paid by the Funds may be subject to a maximum tax rate of 15%, as provided for by the Jobs and Growth Tax Relief Reconciliation Act of 2003. The percentage of dividends declared from ordinary income designated as qualified income was follows:
| | | | | |
| Evolution Managed Bond Fund | | | 100 | % |
| Evolution All-Cap Equity Fund | | | 0 | % |
| Evolution Market Leaders Fund | | | 0 | % |
| Evolution Alternative Investment Fund | | | 100 | % |
For corporate shareholders, the percent of ordinary income distributions qualifying for the corporate dividends received deduction for the year ended August 31, 2010 was as follows:
| | | | | |
| Evolution Managed Bond Fund | | | 100 | % |
| Evolution All-Cap Equity Fund | | | 0 | % |
| Evolution Market Leaders Fund | | | 0 | % |
| Evolution Alternative Investment Fund | | | 100 | % |
HOUSEHOLDING
In an effort to decrease costs, the Funds intend to reduce the number of duplicate prospectuses, Annual and Semi-Annual Reports, proxy statements and other similar documents you receive by sending only one copy of each to those addresses shared by two or more accounts and to shareholders we reasonably believe are from the same family or household. Householding begins once you have signed your account application. After such time, if you would like to discontinue householding for your accounts, please call toll-free at (800) 851-0511 to request individual copies of these documents. Once the Funds receive notice to stop householding, we will begin sending individual copies thirty days after receiving your request. This policy does not apply to account statements.
36 DIREXION ANNUAL REPORT
Investment Advisory and Subadvisory Agreements Approvals
Provided below is a summary of certain of the factors the Board considered at its August 18, 2010 Board meeting in renewing, as applicable: (1) the Advisory Agreement between Rafferty Asset Management (“Rafferty”) and the Direxion Funds (the “Trust”), on behalf of the Evolution All-Cap Equity Fund, Evolution Alternative Investment Fund, Evolution Managed Bond Fund and Evolution Market Leaders Fund (each a “Fund” and collectively, the “Funds”), each a series of the Trust; and (2) the Subadvisory Agreement between Rafferty and Flexible Plan Investments, Inc. (“Flexible”) on behalf of the Funds. The Board did not identify any particular information that was most relevant to its consideration to approve the Advisory or Subadvisory Agreement (each an “Agreement” and collectively, the “Agreements”) and each Trustee may have afforded different weight to the various factors.
In determining whether to approve the continuance of the Agreements, the Board considered the best interests of each Fund separately. In addition, the Board noted that the Trustees have considered various reports and information provided throughout the year at their regular Board meetings and otherwise. While the Agreements for all of the Funds were considered at the same Board meeting, the Board considered each Fund’s investment advisory and subadvisory relationship separately. In each instance, the Board considered, among other things, the following factors: (1) the nature and quality of the services provided; (2) the investment performance of the Fund to the extent applicable; (3) the cost to Rafferty or Flexible for providing services and the profitability of the advisory business to Rafferty or Flexible, if such information was provided; (4) the extent to which economies of scale have been taken into account in setting fee schedules; (5) whether fee levels reflect these economies of scale, if any, for the benefit of Fund shareholders; (6) comparisons of services and fees with contracts entered into by Rafferty and Flexible with other clients (such as pension funds and other institutional investors), if any; and (7) other benefits derived or anticipated to be derived by Rafferty or Flexible from its relationship with the Funds.
Nature, Extent and Quality of Services Provided. The Board reviewed the nature, extent and quality of the services provided or to be provided under the Advisory Agreements by Rafferty. The Board noted that Rafferty has provided services to the Trusts since their inception and has developed an expertise in managing the Funds. The Board also noted that Rafferty trades efficiently with low commission schedules, which helps improve performance results. The Board considered Rafferty’s representation that it has the financial resources and appropriate staffing to manage the Funds and meet its expense reimbursement obligations, if any. The Board also considered that Rafferty utilizes the services of an independent compliance consulting firm and that reports from the chief compliance officer are provided to the Board at its regularly scheduled quarterly Board meetings. The Board considered that Rafferty oversees all aspects of the operation of the Funds, including oversight of the Funds’ service providers and Flexible. Regarding the Subadvisory Agreement with Flexible, the Board noted that Flexible utilizes the Funds as the primary investments for its separate account clients. Based on these and other considerations, the Board determined that, in the exercise of its business judgment, the nature, extent and quality of the services provided by Rafferty and Flexible to the Funds under the Agreements were fair and reasonable.
Performance of the Funds. The Board evaluated the performance of each Fund relative to: (1) its benchmark index for monthly and annual periods ended July 31, 2010, where applicable; and (2) the average performance of the relevant Lipper fund universe for monthly and annual periods ended June 30, 2010. Although the Board received monthly performance reports for its consideration, the Board generally assigned more weight to the longer-term performance of the Funds. In this regard, the Board for all Funds noted the challenging nature of the markets for the calendar years 2008 and 2009.
With respect to the Evolution All-Cap Equity Fund, the Board considered management’s description of the performance of the Lipper universe of specialty diversified equity funds. The Board also considered that: (1) as of July 31, 2010, the Fund underperformed its benchmark index for all periods presented; and (2) as of June 30, 2010, the Fund underperformed the average of the relevant Lipper fund universe for all periods presented. The Board noted Flexible’s representation that the Fund’s underperformance was in part due to its defensive cash positions, as well as significant shareholder redemptions that, coupled with intraday market volatilities, detracted from the Fund’s investment performance.
With respect to the Evolution Alternative Investment Fund, the Board considered management’s description of the performance of the Lipper universe of mixed asset target allocation conservative funds. The Board also considered that: (1) as of July 31, 2010, the Fund outperformed its benchmark index for the one-month period, and underperformed for all other periods presented; and (2) as of June 30, 2010, the Fund underperformed the average of the relevant Lipper fund universe for all periods presented. The Board noted Flexible’s representation that the Fund’s underperformance was in part due to its overweight in certain underperforming sectors.
DIREXION ANNUAL REPORT 37
With respect to the Evolution Managed Bond Fund, the Board considered management’s description of the performance of the Lipper universe of general bond funds. The Board also considered that: (1) as of July 31, 2010, the Fund outperformed its benchmark index for the one-month period, and underperformed for all other periods presented; and (2) as of June 30, 2010, the Fund equaled the average of the relevant Lipper fund universe for the three-month period, and underperformed for the six-month, one- and three-year periods.
With respect to the Evolution Market Leader Fund, the Board considered management’s description of the performance of the Lipper universe of small cap core funds. The Board also considered that: (1) as of July 31, 2010, the Fund outperformed its benchmark index for the three-month period, and underperformed for all other periods presented; and (2) as of June 30, 2010, the Fund outperformed the average of the relevant Lipper fund universe for the three- and six-month periods, and underperformed for the one- and three-year periods.
Costs of Services Provided to the Funds and Profits Realized. The Board considered the overall fees paid to Rafferty on an annual basis since each Fund’s commencement of operations, including any fee waivers and recoupment of fees previously waived. The Board considered the overall profitability of Rafferty’s investment business and its representation that it does not allocate internal costs and assess profitability with respect to its services to individual Funds. Based on these considerations, the Board determined that, in the exercise of its business judgment, the costs of the services provided and the profits realized under the Advisory Agreement were fair and reasonable.
In considering the fees paid by Rafferty to Flexible, the Board considered Rafferty’s representation that the fees and expenses generally are higher than industry averages. However, Rafferty explained that the Funds help to lower the overall fees paid by Flexible’s clients and are offered to those clients in wrap programs. The Board also noted that, in some cases, Flexible uses the fees it receives from the Funds to reduce the asset-based fees it charges clients for providing investment advisory services. The Board further noted that Rafferty negotiated the lowest fee that Flexible charges for comparable client accounts. With respect to each Fund, the Board considered Flexible’s profits or losses for its subadvisory services. Based on these considerations, the Board determined that, in the exercise of its business judgment, the costs of the services provided and the profits realized under the Agreements were fair and reasonable.
Economies of Scale. The Board considered Rafferty’s representation that it believes that asset levels at this time are not sufficient to achieve economies of scale or warrant a reduction in fee rates or the addition of breakpoints. Rafferty noted that it was continuing to work on its sales and marketing efforts to raise additional assets. Based on these and other considerations, the Board determined that, in the exercise of its business judgment, the reduction in fee rates or additions of breakpoints were not necessary at this time.
Other Benefits. The Board considered Rafferty’s representation that its relationship with the Funds has permitted Rafferty to attract business to its non-mutual fund account. The Board also considered that Rafferty’s overall business with brokerage firms helps to lower commission rates and provide better execution for Fund portfolio transactions. In addition, the Board considered that Flexible has greater access to certain trust platforms due to its subadvisory services to the Funds. Based on these and other considerations, the Board determined that, in the exercise of its business judgment, the benefits were fair and reasonable.
Conclusion. Based on, but not limited to, the above considerations and determinations, the Board determined that the Agreements for the Funds were fair and reasonable in light of the services to be performed, fees, expenses and such other matters as the Board considered relevant in the exercise of its business judgment. On this basis, the Board unanimously voted in favor of the continuance of the Agreements.
38 DIREXION ANNUAL REPORT
Direxion Funds
TRUSTEES AND OFFICERS
The business affairs of each Fund are managed by or under the direction of the Board of Trustees. Information pertaining to the Trustees and Officers of the Funds is set forth below. The SAI includes additional information about the Funds’ Trustee and Officers and is available without charge, upon request by calling 1-800-851-0511.
Interested Trustees
| | | | | | | | | | | | | |
| | | | | | | | | # of Portfolios
| | | |
| | | | | | | | | in Direxion
| | | |
| | | Position(s)
| | Term of Office
| | | | Complex
| | | Other Trusteeships/
|
| | | Held with
| | and Length of
| | Principal Occupation(s)
| | Overseen by
| | | Directorships Held
|
Name, Address and Age | | Fund | | Time Served | | During Past Five Years | | Trustee(2) | | | by Trustee |
| |
Lawrence C. Rafferty(1)
Age: 68 | |
Chairman of the Board of Trustees | |
Lifetime of Trust until removal or resignation; Since 1997 | |
Chairman and Chief Executive Officer of Rafferty, 1997-present; Chief Executive Officer of Rafferty Companies, LLC, 1996-present; Chief Executive Officer of Rafferty Capital Markets, Inc., 1995-present. | | |
135 | | |
Board of Trustees, Fairfield University; Board of Directors, St. Vincent’s Services; Executive Committee, Metropolitan Golf Association |
|
Non-Interested Trustees
| | | | | | | | | | | | | |
| | | | | | | | | # of Portfolios
| | | |
| | | | | | | | | in Direxion
| | | |
| | | Position(s)
| | Term of Office
| | | | Complex
| | | Other Trusteeships/
|
| | | Held with
| | and Length of
| | Principal Occupation(s)
| | Overseen by
| | | Directorships Held
|
Name, Address and Age | | Fund | | Time Served | | During Past Five Years | | Trustee(2) | | | by Trustee |
| |
Daniel J. Byrne
Age: 66 | |
Trustee | |
Lifetime of Trust until removal or resignation; Since 1997 | |
President and Chief Executive Officer of Byrne Securities Inc., 1992-present. | | |
135 | | |
Trustee, The Opening Word Program, Wyandanch, New York |
|
Gerald E. Shanley III
Age: 66 | |
Trustee | |
Lifetime of Trust until removal or resignation; Since 1997 | |
Business Consultant, 1985-present; C.P.A. 1979-present. | | |
135 | | |
Trustee of Trust Under Will of Charles S. Payson |
|
John Weisser
Age: 68 | |
Trustee | |
Lifetime of Trust until removal or resignation; Since 2007 | |
Retired, Since 1995; Salomon Brothers, Inc, 1971-1995, most recently as Managing Director. | | |
135 | | |
Director, MainStay VP Fund Series; Director ICAP Funds, Inc; Director, The MainStay Funds; Director, Eclipse Funds, Inc. |
|
DIREXION ANNUAL REPORT 39
Direxion Funds
TRUSTEES AND OFFICERS
Officers
| | | | | | | | | | | | | |
| | | | | | | | | # of Portfolios
| | | |
| | | | | | | | | in Direxion
| | | |
| | | Position(s)
| | Term of Office
| | | | Complex
| | | Other Trusteeships/
|
| | | Held with
| | and Length of
| | Principal Occupation(s)
| | Overseen by
| | | Directorships Held
|
Name, Address and Age | | Fund | | Time Served | | During Past Five Years | | Trustee(2) | | | by Trustee |
| |
Daniel D. O’Neill
Age: 42 | |
President;
Chief Operating Officer and Chief Investment Officer | |
One Year;
Since 1999
One Year;
Since 2006 | |
Managing Director of Rafferty, 1999-present. | | |
N/A | | |
N/A |
|
William Franca
Age: 53 | |
Executive Vice President – Head of Distribution | |
One Year;
Since 2006 | |
Senior Vice President – National Sales, Massachusetts Financial Services/SunLife Financial Distributors, 2002-2004; Executive Vice President, Distribution, SunLife, 2001-2002. | | |
N/A | | |
N/A |
|
Christopher Lewis
Age: 39 | |
Chief Compliance Officer | |
One Year;
Since 2009 | |
Director, Alaric Compliance Services, LLC, 2009-present; Partner, Thacher Proffitt & Wood LLP, 2004-2008; Partner, Simmons & Simmons, 2002-2004. | | |
N/A | | |
N/A |
|
Patrick J. Rudnick
615 East Michigan Street Milwaukee, WI 53202
Age: 37 | |
Principal Financial Officer and Treasurer3 | |
One Year;
Since 2010 | |
Vice President, U.S. Bancorp Fund Services LLC, since 2006; Manager, PricewaterhouseCoopers LLP, 1999-2006. | | |
N/A | | |
N/A |
|
Eric W. Falkeis 615 East Michigan Street
Milwaukee, WI 53202
Age: 37 | |
Secretary | |
One Year;
Since 2004 | |
Senior Vice President, U.S. Bancorp Fund Services, LLC, since September 2007; Chief Financial Officer, U.S. Bancorp Fund Services, LLC, since April 2006; Vice President, U.S. Bancorp Fund Services LLC, 1997-present; formerly, Chief Financial Officer, Quasar Distributors, LLC, 2000-2003. | | |
N/A | | |
N/A |
|
| | |
| (1) | | Mr. Rafferty is affiliated with Rafferty. Mr. Rafferty is the Chairman and Chief Executive Officer of Rafferty and owns a beneficial interest in Rafferty. |
| |
| (2) | | The Direxion Complex consists of the Direxion Funds which currently offers for sale to the public 32 portfolios, the Direxion Insurance Trust which currently offers for sale 1 portfolio and the Direxion ETF Trust which currently offers for sale to the public 34 of the 102 funds currently registered with the SEC. |
| |
| (3) | | Mr. Rudnick replaced Guy F Talarico as Principal Financial Officer and Treasurer effective June 1, 2010. |
| |
| | The address for all trustees and officers except Patrick J. Rudnick and Eric W. Falkeis is 33 Whitehall St., New York, NY 10004. |
40 DIREXION ANNUAL REPORT
THIS PAGE INTENTIONALLY LEFT BLANK
THIS PAGE INTENTIONALLY LEFT BLANK
THIS PAGE INTENTIONALLY LEFT BLANK
PRIVACY NOTICE
At the Direxion Funds, we are committed to protecting your privacy. To open and service your Direxion accounts, we collect and maintain certain nonpublic personal information about you, such as your address, phone number, social security number, purchases, sales, account balances, bank account information and other personal financial information. We collect this information from the following sources:
| |
| • | Account applications or other forms on which you provide information, |
| • | Mail, e-mail, the telephone and our website, and |
| • | Your transactions and account inquiries with us. |
We safeguard the personal information that you have entrusted to us in the following ways:
| |
| • | As a general policy, only those employees who maintain your account and respond to your requests for additional services have access to your account information. |
| • | We maintain physical, electronic, and procedural safeguards to insure the security of your personal information and to prevent unauthorized access to your information. |
We do not disclose any nonpublic personal information about you or our former shareholders to anyone, except as permitted or required by law. In the course of conducting business and maintaining your account we may share shareholder information, as allowed by law, with our affiliated companies and with other service providers, including financial intermediaries, custodians, transfer agents and marketing consultants. Those companies are contractually bound to use that information only for the services for which we hired them. They are not permitted to use or share our shareholders’ nonpublic personal information for any other purpose. There also may be times when we provide information to federal, state or local authorities as required by law.
In the event that you hold fund shares of Direxion through a financial intermediary, including, but not limited to, a broker-dealer, bank, or trust company, the privacy policy of your financial intermediary would govern how your nonpublic personal information would be shared with nonaffiliated third parties.
For questions about our policy, please contact us at (800) 851-0511.
DIREXION ANNUAL REPORT PN-1
ANNUAL REPORT AUGUST 31, 2010
Adviser
Rafferty Asset Management, LLC
33 Whitehall St. 10th Floor
New York, NY 10004
Sub-Advisor
Flexible Plan Investments, Ltd.
3883 Telegraph Road
Bloomfield Hills, MI 48302
Administrator, Transfer Agent, Dividend Paying
Agent & Shareholding Servicing Agent
U.S. Bancorp Fund Services, LLC
P.O. Box 1993
Milwaukee, WI 53201-1993
Custodian
U.S. Bank, N.A.
1555 RiverCenter Dr., Suite 302
Milwaukee, WI 53212
Independent Registered Public Accounting Firm
Ernst & Young LLP
5 Times Square
New York, NY 10036
Distributor
Rafferty Capital Markets, LLC
59 Hilton Avenue
Garden City, NY 11530
The Fund’s Proxy Voting Policies are available without charge by calling 1-800-851-0511, or by accessing the SEC’s website, at www.sec.gov.
The actual voting records relating to portfolio securities during the most recent period ended June 30 (starting with the year ended June 30, 2005) is available without charge by calling 1-800-851-0511 or by accessing the SEC’s website at www.sec.gov.
The Funds file its complete schedule of portfolio holdings with the Commission for the first and third quarter of each fiscal year on Form N-Q. The Form N-Q is available without charge, upon request, by calling 1-800-851-0511, or by accessing the SEC’s website, at www.sec.gov. The Funds’ Forms N-Q may be reviewed and copied at the Commission’s Public Reference Room in Washington, D.C. Information on the operation of the Public Reference Room may be obtained by calling 1-800-SEC-0330.
This report has been prepared for shareholders and may be distributed to others only if preceded or accompanied by a current prospectus.
ANNUAL REPORT AUGUST 31, 2010
HCM Freedom Fund
33 Whitehall Street, 10th Floor
New York, New York 10004
(800) 851-0511
Dear Shareholders,
This Annual Report for the HCM Freedom Fund (the “Fund”) covers the period from September 1, 2009 to August 31, 2010 (the “Annual Period”). Horizon Capital Management, Inc. serves as the sub-advisor to the Fund. For the Annual Period, the Fund, which seeks long term capital appreciation with lower volatility than the overall market, returned 11.16% on a total return basis. During the Annual Period, the DJ Industrial Average Index returned 8.39%, the S&P 500 Index returned 4.91% and the NASDAQ-100 Index returned 9.50%.
By the beginning of the Annual Period, the markets had recovered some of the losses experienced in 2008 and early 2009 and volatility had begun to return to more normalized levels. However, despite substantial governmental stimulus and low interest rates, economic growth remained weak and the markets reflected the uncertainty of the economic picture. Equity markets were strong from the beginning of the period through the end of April but declined sharply from May through August. Fixed income markets continued to rally as fiscal concerns were pushed aside by the search for yield. The outlook for the domestic and global economies remained uncertain and job growth was very weak during the period. In Europe, the sovereign debt crisis in Greece and potential problems in Ireland and Spain left markets unsettled. Finally, China’s tightening of monetary policy and efforts to curb an overvalued real estate market raised concerns about continued growth there.
As always, we thank you for using the Direxion Funds and we look forward to our mutual success.
Best Regards,
| | | | | |
 | |  | |  |
| Daniel O’Neill | | Dexter Lyons | | Mark Thomas |
| Direxion Funds | | Horizon Capital Management, Inc. | | Horizon Capital Management, Inc. |
The performance data quoted represents past performance; past performance does not guarantee future results. The investment return and principal value of an investment will fluctuate and an investor’s shares, when redeemed, may be worth more or less than their original cost. Current performance may be higher or lower than the performance data quoted. To obtain performance data current to the most recent month-end, please call, toll-free, 1-800-851-0511 or visit www.direxionfunds.com.
The total annual fund operating expense ratio of the HCM Freedom Fund, net of any fee, waivers or expense reimbursements is 2.62%.*
An investment in any of the Direxion Funds is subject to a number of risks that could affect the value of its shares. It is important that investors closely review and understand these risks before making an investment. An investor should consider the investment objectives, risks, charges and expenses of the Direxion Funds carefully before investing. The prospectus contains this and other information about the Direxion Funds. To obtain a prospectus, please call the Direxion Funds at 1 800-851-0511. The prospectus should be read carefully before investing.
Distributed by: Rafferty Capital Markets, LLC
Date of First Use: October 22, 2010
* The total annual fund operating expense ratio includes Acquired Fund Fees and Expenses, indirect fees and expenses that the Funds incur that are required to be disclosed. Without Acquired Fund Fees and Expenses, the total annual fund operating expense ratio would be 2.35%.
ANNUAL REPORT AUGUST 31, 2010
Spectrum Select Alternative Fund
Spectrum Global Perspective Fund
Spectrum Equity Opportunity Fund
33 Whitehall Street, 10th Floor
New York, New York 10004
(800) 851-0511
Dear Shareholders,
This Annual Report for the Spectrum Funds covers the period from September 1, 2009 to August 31, 2010 (the “Annual Period”). This Report covers the Spectrum Select Alternative Fund, (the “Select Alternative Fund”), the Spectrum Global Perspective Fund (the “Global Fund”) and the Spectrum Equity Opportunity Fund (the “Equity Fund”). Hundredfold Advisors, LLC, serves as the sub-advisor to the Spectrum Funds. During the Annual Period, the DJ Industrial Average Index returned 8.39%, the S&P 500 Index returned 4.91% and the NASDAQ-100 Index returned 9.50%.
By the beginning of the Annual Period, the markets had recovered some of the losses experienced in 2008 and early 2009 and volatility had begun to return to more normalized levels. However, despite substantial governmental stimulus and low interest rates, economic growth remained weak and the markets reflected the uncertainty of the economic picture. Equity markets were strong from the beginning of the period through the end of April but declined sharply from May through August. Fixed income markets continued to rally as fiscal concerns were pushed aside by the search for yield. The outlook for the domestic and global economies remained uncertain and job growth was very weak during the period. In Europe, the sovereign debt crisis in Greece and potential problems in Ireland and Spain left markets unsettled. Finally, China’s tightening of monetary policy and efforts to curb an overvalued real estate market raised concerns about continued growth there.
The Select Alternative Fund seeks a moderate total rate of return, including income and capital appreciation on an annual basis. The Select Alternative Fund returned 13.51%, on a total return basis, during the Annual Period, compared to 4.91% for the S&P 500 Index and 9.18% for the Barclays Capital U.S. Aggregate Bond Index.
The Global Fund seeks a high total rate of return (income from short-term trading plus capital appreciation) on an annual basis. The Global Fund returned -1.55%, on a total return basis, during the Annual Period, compared to 4.91% for the S&P 500 Index and -0.44% for the MSCI World Index.
The Equity Fund seeks a high total rate of return (income from short-term trading plus capital appreciation) on an annual basis. The Equity Fund returned 1.06%, on a total return basis, during the Annual Period, compared to 4.91% for the S&P 500 Index.
As always, we thank you for using the Direxion Funds and we look forward to our mutual success.
Best Regards,
| | | |
| |  |
| Daniel O’Neill | | Ralph Doudera |
| Direxion Funds | | Hundredfold Advisors, LLC |
The performance data quoted represents past performance; past performance does not guarantee future results. The investment return and principal value of an investment will fluctuate and an investor’s shares, when redeemed, may be worth more or less than their original cost. Current performance may be higher or lower than the performance data quoted. To obtain performance data current to the most recent month-end, please call, toll-free, 1-800-851-0511 or visit www.direxionfunds.com.
The total annual fund operating expense ratios of the Spectrum Select Alternative Fund, Spectrum Global Perspective Fund and Spectrum Equity Opportunity Fund are 3.74%, 2.93%, 2.85%, respectively, net of any fee, waivers or expense reimbursements.*
An investment in any of the Direxion Funds is subject to a number of risks that could affect the value of its shares. It is important that investors closely review and understand these risks before making an investment. An investor should consider the investment objectives, risks, charges and expenses of the Direxion Funds carefully before investing. The prospectus contains this and other information about the Direxion Funds. To obtain a prospectus, please call the Direxion Funds at 1 800-851-0511. The prospectus should be read carefully before investing.
Distributed by: Rafferty Capital Markets, LLC
Date of First Use: October 22, 2010
* The total annual fund operating expense ratios include Acquired Fund Fees and Expenses, indirect fees and expenses that the Funds incur that are required to be disclosed. Without Acquired Fund Fees and Expenses, total annual fund operating expense ratios would be 2.55% for each Fund.
Table of Contents
| | | | | |
| | | | | |
| | | | | |
HCM Freedom Fund | | | | |
| | | | | |
| Performance Summary | | | 2 | |
| | | | | |
| Expense Example | | | 3 | |
| | | | | |
| Allocation of Portfolio Holdings | | | 4 | |
| | | | | |
| Schedule of Investments | | | 5 | |
| | | | | |
| Financial Statements | | | 6 | |
| | | | | |
| Financial Highlights | | | 9 | |
| | | | | |
Spectrum Funds | | | | |
| | | | | |
| Performance Summary | | | 10 | |
| | | | | |
| Expense Example | | | 13 | |
| | | | | |
| Allocation of Portfolio Holdings | | | 14 | |
| | | | | |
| Schedule of Investments | | | 15 | |
| | | | | |
| Financial Statements | | | 18 | |
| | | | | |
| Financial Highlights | | | 21 | |
| | | | | |
| Notes to the Financial Statements | | | 22 | |
| | | | | |
| Report of Independent Registered Public Accounting Firm | | | 33 | |
| | | | | |
| Additional Information | | | 34 | |
| | | | | |
| Investment Advisory and Subadvisory Agreements Approvals | | | 35 | |
| | | | | |
| Information on Board of Trustees and Officers | | | 37 | |
HCM Freedom Fund
December 7, 20041 - August 31, 2010 (Unaudited)
| | | | | | | | | | | | | | | | | |
| | | Average Annual Total Return2 | |
| | | | | | | | | | | | Since
| |
| | | 1 Year | | | 3 Year | | | 5 Year | | | Inception | |
| |
HCM Freedom Fund | | | 11.16% | | | | 2.99% | | | | 1.30% | | | | 0.15% | |
| | | | | | | | | | | | | | | | | |
S&P 500 Index | | | 4.91% | | | | (8.66% | ) | | | 0.91% | | | | 0.07% | |
This chart illustrates the performance of a hypothetical $10,000 investment made on the Fund’s inception, and is not intended to imply any future performance. The returns shown do not reflect the deduction of taxes that a shareholder would pay on fund distributions of the redemption of fund shares. The performance of the S&P 500 Index does not reflect the deduction of fees associated with a mutual fund, such as investment management fees. Investors cannot invest directly in an index, although they can invest in its underlying securities.
The performance data shown represents past performance and does not guarantee future results.
Market Exposure
| | | | | |
| | | %
| |
Investment Type | | Net Assets | |
| |
Investment Companies | | | 99.7% | |
| | | | | |
Total Exposure | | | 99.7% | |
| | | | | |
“Market Exposure” includes the value of total investments (including the contract value of any derivatives) and excludes any short-term investments and cash equivalents divided by Net Assets.
| |
| 1 | Commencement of operations. |
| 2 | As of August 31, 2010. |
2 DIREXION ANNUAL REPORT
Expense Example
August 31, 2010 (Unaudited)
As a shareholder of a mutual fund, you incur two types of costs: (1) transaction costs, including sales charges (loads) on purchase payments, reinvested dividends, or other distributions; redemption fees; and exchange fees; and (2) ongoing costs, including management fees; distribution and/or service fees; and other fund expenses. This example is intended to help you understand your ongoing costs (in dollars) of investing in a fund and to compare costs with the ongoing costs of investing in other mutual funds.
The example is based on an investment of $1,000 invested at the beginning of the period and held the entire period (March 1, 2010 — August 31, 2010).
Actual Expenses
The first line of the table below provides information about actual account values and actual expenses. Although the Funds charge no sales load or transactions fees, you will be assessed fees for outgoing wire transfers, returned checks or stop payment orders at prevailing rates charged by U.S. Bancorp Fund Services, LLC, the Funds’ transfer agent. If you request a redemption be made by wire transfer, currently a $15.00 fee is charged by the Funds’ transfer agent. To the extent a Fund invests in shares of other investment companies as part of its investment strategy, you will indirectly bear your proportionate share of any fees and expenses charged by the underlying funds in which the Fund invests, in addition to the expenses of the Fund. Actual expenses of underlying funds may vary. These expenses are not included in the examples presented on the preceding page. The preceding examples include, but are not limited to, investment advisory, shareholder servicing, fund accounting, custody and transfer agent fees. However, the example does not include portfolio trading heading entitled commissions and related expenses or other extraordinary expenses as determined under generally accepted accounting principles. You may use the information in this line, together with the amount you invested, to estimate the expenses that you paid over the period. Simply divide your account value by $1,000 (for example, an $8,600 account value divided by $1,000 = 8.6), then multiply the result by the number in the first line under the “Expenses Paid During Period” to estimate the expenses you paid on your account during this period.
Hypothetical Example for Comparison Purposes
The second line of the table below provides information about hypothetical account values and hypothetical expenses based on the Funds’ actual expense ratios and an assumed rate of return of 5% per year before expenses, which is not the Funds’ actual return. The hypothetical account values and expenses may not be used to estimate the actual ending account balance or expenses you paid for the period. You may use this information to compare the ongoing costs of investing in the Funds and other funds. To do so, compare this 5% hypothetical example with the 5% hypothetical examples that appear in the shareholder reports of the other funds.
Please note that the expenses shown in the table are meant to highlight your ongoing costs only and do not reflect any transactional costs, such as wire transfers, returned checks or stop payment orders. Therefore, the second line of the table is useful in comparing ongoing costs only, and will not help you determine the relative costs of owning different funds. In addition, if these transactional costs were included, your costs would have been higher.
DIREXION ANNUAL REPORT 3
Expense Example Tables
August 31, 2010 (Unaudited)
| | | | | | | | | | | | | | | | | |
| | | | | | Beginning
| | | Ending
| | | Expenses
| |
| | | Expense
| | | Account Value
| | | Account Value
| | | Paid During
| |
| | | Ratio1 | | | March 1, 2010 | | | August 31, 2010 | | | Period2 | |
| |
HCM Freedom Fund | | | | | | | | | | | | | | | | |
| Based on actual fund return | | | 2.35 | % | | $ | 1,000.00 | | | $ | 1,020.10 | | | $ | 11.97 | |
| Based on hypothetical 5% return | | | 2.35 | % | | | 1,000.00 | | | | 1,013.36 | | | | 11.93 | |
| | |
| 1 | | Annualized |
| 2 | | Expenses are equal to the Fund’s annualized expense ratio, multiplied by the average account value over the period, multiplied by the number of days in the most recent fiscal half-year/period, then divided by 365. |
Allocation of Portfolio Holdings
August 31, 2010 (Unaudited)
| | | | | | | | | | | | | | | | | |
| | | | | | Investment
| | | | | | | |
| | | Cash* | | | Companies | | | Total | | | | |
| |
| HCM Freedom Fund | | | 0 | %** | | | 100 | % | | | 100 | % | | | | |
| | |
| * | | Cash, cash equivalents and other assets less liabilities. |
| ** | | Percentage is less than 0.5%. |
4 DIREXION ANNUAL REPORT
HCM Freedom Fund
Schedule of Investments
August 31, 2010
| | | | | | | | | |
| Shares | | | | | Value | |
| |
INVESTMENT COMPANIES - 99.7% |
| | 337,649 | | | Nuveen High Yield Municipal Bond Fund | | $ | 5,412,508 | |
| | 530,593 | | | PIMCO Emerging Markets Bond Fund | | | 5,969,170 | |
| | 571,973 | | | PIMCO Income Fund | | | 6,308,865 | |
| | 1,269,036 | | | Putnam Diversified Income Trust | | | 10,164,975 | |
| | | | | | | | | |
| | | | | TOTAL INVESTMENT COMPANIES
(Cost $27,438,147) | | $ | 27,855,518 | |
| | | | | | | | | |
| |
SHORT TERM INVESTMENTS - 0.3% |
MONEY MARKET FUNDS - 0.3% |
| | 18,076 | | | Fidelity Institutional Government Portfolio, 0.06%(a) | | $ | 18,076 | |
| | 18,076 | | | Fidelity Institutional Money Market Portfolio, 0.23%(a) | | | 18,076 | |
| | 18,076 | | | Goldman Sachs Financial Square Federal Fund, 0.04%(a) | | | 18,076 | |
| | 18,075 | | | Goldman Sachs Financial Square Government Fund, 0.10%(a)(b) | | | 18,075 | |
| | 18,075 | | | Morgan Stanley Institutional Liquidity Fund - Treasury Portfolio, 0.06%(a) | | | 18,075 | |
| | | | | | | | | |
| | | | | TOTAL SHORT TERM INVESTMENTS
(Cost $90,378) | | $ | 90,378 | |
| | | | | | | | | |
| | | | | TOTAL INVESTMENTS
(Cost $27,528,525) - 100.0% | | $ | 27,945,896 | |
| | | | | Liabilities in Excess of Other Assets - 0% | | | (6,925 | ) |
| | | | | | | | | |
| | | | | TOTAL NET ASSETS - 100.0% | | $ | 27,938,971 | |
| | | | | | | | | |
Percentages are stated as a percent of net assets.
| |
| (a) | Represents annualized seven-day yield at August 31, 2010. |
The accompanying notes are an integral part of these financial statements.
5 DIREXION ANNUAL REPORT
Statement of Assets and Liabilities
August 31, 2010
| | | | | |
| | | HCM Freedom
| |
| | | Fund | |
| |
Assets: | | | | |
| Investments, at market value (Note 2) | | $ | 27,945,896 | |
| Dividends and interest receivable | | | 52,613 | |
| | | | | |
| Total Assets | | | 27,998,509 | |
| | | | | |
Liabilities: | | | | |
| Payable for fund shares redeemed | | | 2,500 | |
| Accrued investment advisory fees | | | 24,989 | |
| Accrued operating services fees | | | 13,057 | |
| Accrued distribution expenses | | | 18,992 | |
| | | | | |
| Total Liabilities | | | 59,538 | |
| | | | | |
Net Assets | | $ | 27,938,971 | |
| | | | | |
Net Assets Consist Of: | | | | |
| Capital stock | | $ | 46,857,659 | |
| Undistributed net investment income | | | 520,163 | |
| Accumulated net realized loss | | | (19,856,222 | ) |
| Net unrealized appreciation on: | | | | |
| Investments | | | 417,371 | |
| | | | | |
| Total Net Assets | | $ | 27,938,971 | |
| | | | | |
Calculation of Net Asset Value Per Share - Service Class: | | | | |
| Net assets | | $ | 27,938,971 | |
| Shares outstanding (unlimited shares of beneficial interest authorized, no par value) | | | 1,839,048 | |
| Net Asset Value, Redemption Price and Offering Price Per Share | | $ | 15.19 | |
| | | | | |
| Cost of Investments | | $ | 27,528,525 | |
| | | | | |
The accompanying notes are an integral part of these financial statements.
6 DIREXION ANNUAL REPORT
Statement of Operations
For the Year Ended August 31, 2010
| | | | | |
| | | HCM Freedom Fund | |
| |
Investment income: | | | | |
| Dividend income | | $ | 2,574,109 | |
| Interest income | | | 5,308 | |
| | | | | |
| Total investment income | | | 2,579,417 | |
| | | | | |
Expenses: | | | | |
| Investment advisory fees | | | 270,213 | |
| Distribution expenses | | | 216,170 | |
| Operating services fees | | | 148,617 | |
| | | | | |
| Total expenses | | | 635,000 | |
| | | | | |
Net investment income | | | 1,944,417 | |
| | | | | |
Realized and unrealized gain (loss) on investments: | | | | |
| Net realized gain (loss) on: | | | | |
| Investments | | | 2,457,170 | |
| Swaps | | | (831,275 | ) |
| Futures | | | 101,463 | |
| | | | | |
| | | | 1,727,358 | |
| | | | | |
| Change in unrealized appreciation (depreciation) on: | | | | |
| Investments | | | (849,521 | ) |
| | | | | |
| Net realized and unrealized gain (loss) on investments | | | 877,837 | |
| | | | | |
Net increase in net assets resulting from operations | | $ | 2,822,254 | |
| | | | | |
The accompanying notes are an integral part of these financial statements.
7 DIREXION ANNUAL REPORT
Statement of Changes in Net Assets
| | | | | | | | | |
| | | HCM Freedom Fund | |
| | | Year Ended
| | | Year Ended
| |
| | | August 31, 2010 | | | August 31, 2009 | |
| |
Operations: | | | | | | | | |
| Net investment income | | $ | 1,944,417 | | | $ | 10,946 | |
| Net realized gain (loss) on investments | | | 1,727,358 | | | | (555,594 | ) |
| Change in net unrealized appreciation (depreciation) on investments | | | (849,521 | ) | | | 1,266,892 | |
| | | | | | | | | |
| Net increase in net assets resulting from operations | | | 2,822,254 | | | | 722,244 | |
| | | | | | | | | |
Distributions to shareholders: | | | | | | | | |
| Net investment income | | | (1,474,611 | ) | | | (1,039,384 | ) |
| | | | | | | | | |
| Total distributions | | | (1,474,611 | ) | | | (1,039,384 | ) |
| | | | | | | | | |
Capital share transactions: | | | | | | | | |
| Proceeds from shares sold | | | 2,399,676 | | | | 2,223,837 | |
| Proceeds from shares issued to holders in reinvestment of dividends | | | 1,468,281 | | | | 1,034,802 | |
| Cost of shares redeemed | | | (2,485,748 | ) | | | (3,248,933 | ) |
| | | | | | | | | |
| Net increase in net assets resulting from capital share transactions | | | 1,382,209 | | | | 9,706 | |
| | | | | | | | | |
Total increase (decrease) in net assets | | | 2,729,852 | | | | (307,434 | ) |
| | | | | | | | | |
Net assets: | | | | | | | | |
| Beginning of year | | | 25,209,119 | | | | 25,516,553 | |
| | | | | | | | | |
| End of year | | $ | 27,938,971 | | | $ | 25,209,119 | |
| | | | | | | | | |
Undistributed net investment income, end of year | | $ | 520,163 | | | $ | 50,357 | |
| | | | | | | | | |
The accompanying notes are an integral part of these financial statements.
8 DIREXION ANNUAL REPORT
Financial Highlights
August 31, 2010
| | | | | | | | | | | | | | | | | | | | | | | | | | | | | | | | | | | | | | | | | | | | | | | | | | | | | |
| | | | | | | | | | | | | | | | | | | | | | | | | | | | | | RATIOS TO AVERAGE NET ASSETS | | | | |
| | | | | | | | | | | | | | | | | | | | | | | | | | | | | | | | | | | | Net
| | | | |
| | | | | | | | | Net Realized
| | | Net Increase
| | | | | | | | | | | | | | | | | | | | | | | | Investment
| | | | |
| | | Net Asset
| | | Net
| | | and
| | | (Decrease)
| | | Dividends
| | | | | | Net Asset
| | | | | | Net Assets,
| | | | | | | | | Income (Loss)
| | | | |
| | | Value,
| | | Investment
| | | Unrealized
| | | in Net Asset
| | | from Net
| | | | | | Value,
| | | | | | End of
| | | | | | | | | After Expense
| | | Portfolio
| |
| | | Beginning
| | | Income
| | | Gain (Loss)
| | | Value Resulting
| | | Investment
| | | Total
| | | End of
| | | Total
| | | Year/Period
| | | Total
| | | Net
| | | Reimbursement/
| | | Turnover
| |
| Year/Period | | of Year/Period | | | (Loss)2 | | | on Investments | | | from Operations | | | Income | | | Distributions | | | Year/Period | | | Return3 | | | (,000) | | | Expenses1 | | | Expenses1 | | | Recoupment1 | | | Rate4 | |
| | |
HCM Freedom Fund | | | | | | | | | | | | | | | | | | | | | | | | | | | | | | | | | | | | | | | | | | | | | | | | | | | | |
| Year ended August 31, 2010 | | $ | 14.47 | | | $ | 1.08 | | | $ | 0.50 | | | $ | 1.58 | | | $ | (0.86 | ) | | $ | (0.86 | ) | | $ | 15.19 | | | | 11.16 | % | | $ | 27,939 | | | | 2.35 | % | | | 2.35 | % | | | 7.20 | % | | | 468% | |
| Year ended August 31, 2009 | | | 14.68 | | | | 0.01 | | | | 0.40 | | | | 0.41 | | | | (0.62 | ) | | | (0.62 | ) | | | 14.47 | | | | 2.83 | % | | | 25,209 | | | | 2.42 | % | | | 2.43 | % | | | 0.05 | % | | | 1,311% | |
| Year ended August 31, 2008 | | | 17.46 | | | | 0.06 | | | | (0.70 | ) | | | (0.64 | ) | | | (2.14 | ) | | | (2.14 | ) | | | 14.68 | | | | (4.43 | %) | | | 25,517 | | | | 2.50 | % | | | 2.45 | % | | | 0.35 | % | | | 2,886% | |
| Year ended August 31, 2007 | | | 18.11 | | | | 0.34 | | | | (0.11 | ) | | | 0.23 | | | | (0.88 | ) | | | (0.88 | ) | | | 17.46 | | | | 1.32 | % | | | 28,642 | | | | 2.18 | % | | | 2.18 | % | | | 1.98 | % | | | 4,042% | |
| Year ended August 31, 2006 | | | 18.91 | | | | 0.40 | | | | (1.08 | ) | | | (0.68 | ) | | | (0.12 | ) | | | (0.12 | ) | | | 18.11 | | | | (3.61 | %) | | | 53,753 | | | | 2.22 | % | | | 2.12 | % | | | 2.14 | % | | | 3,065% | |
| | |
| 1 | | Annualized. |
| 2 | | Net investment income (loss) per share represents net investment income (loss) divided by the daily average shares of beneficial interest outstanding throughout each period. |
| 3 | | All returns reflect reinvested dividends, if any, but do not reflect the impact of taxes. |
| 4 | | Portfolio turnover is calculated without regard to short-term securities having a maturity of less than one year. Investments in options, swaps, and futures contracts and repurchase agreements are deemed short-term securities. The Fund’s aggressive investment strategy may result in significant portfolio turnover to take advantage of anticipated changes in market conditions. |
DIREXION ANNUAL REPORT 9
Spectrum Select Alternative Fund
September 1, 20041- August 31, 2010 (Unaudited)
| | | | | | | | | | | | | | | | | |
| | | Average Annual Total Return2 | |
| | | | | | | | | | | | Since
| |
| | | 1 Year | | | 3 Year | | | 5 Year | | | Inception | |
| |
Spectrum Select Alternative Fund | | | 13.51% | | | | 6.63% | | | | 6.27% | | | | 5.37% | |
| | | | | | | | | | | | | | | | | |
Barclays Capital U.S. Aggregate Bond Index | | | 9.18% | | | | 7.65% | | | | 5.96% | | | | 5.65% | |
| | | | | | | | | | | | | | | | | |
S&P 500 Index | | | 4.91% | | | | (8.66% | ) | | | (0.91% | ) | | | 1.19% | |
This chart illustrates the performance of a hypothetical $10,000 investment made on the Fund’s inception, and is not intended to imply any future performance. The returns shown do not reflect the deduction of taxes that a shareholder would pay on fund distributions of the redemption of fund shares. The performance of Barclays Capital U.S. Aggregate Bond Index and S&P 500 Index does not reflect the deduction of fees associated with a mutual fund, such as investment management fees. Investors cannot invest directly in an index, although they can invest in its underlying securities.
The performance data shown represents past performance and does not guarantee future results.
Market Exposure
| | | | | |
| | | %
| |
Investment Type | | Net Assets | |
| |
Investment Companies | | | 88.9% | |
Swap Contracts | | | 13.1% | |
| | | | | |
Total Exposure | | | 102.0% | |
| | | | | |
“Market Exposure” includes the value of total investments (including the contract value of any derivatives) and excludes any short-term investments and cash equivalents divided by Net Assets.
| |
| 1 | Commencement of operations. |
| 2 | As of August 31, 2010. |
10 DIREXION ANNUAL REPORT
Spectrum Global Perspective Fund
September 27, 20041- August 31, 2010 (Unaudited)
| | | | | | | | | | | | | | | | | |
| | | Average Annual Total Return2 | |
| | | | | | | | | | | | Since
| |
| | | 1 Year | | | 3 Year | | | 5 Year | | | Inception | |
| |
Spectrum Global Perspective Fund | | | (1.55% | ) | | | (2.80% | ) | | | 4.25% | | | | 6.62% | |
| | | | | | | | | | | | | | | | | |
S&P 500 Index | | | 4.91% | | | | (8.66% | ) | | | (0.91% | ) | | | 1.22% | |
| | | | | | | | | | | | | | | | | |
MSCI World Index | | | (0.44% | ) | | | (11.55% | ) | | | (1.99% | ) | | | 0.72% | |
This chart illustrates the performance of a hypothetical $10,000 investment made on the Fund’s inception, and is not intended to imply any future performance. The returns shown do not reflect the deduction of taxes that a shareholder would pay on fund distributions of the redemption of fund shares. The performance of S&P 500 Index and MSCI World Index does not reflect the deduction of fees associated with a mutual fund, such as investment management fees. Investors cannot invest directly in an index, although they can invest in its underlying securities.
The performance data shown represents past performance and does not guarantee future results.
Market Exposure
| | | | | |
| | | %
| |
Investment Type | | Net Assets | |
| |
Investment Companies | | | 8.4% | |
Swap Contracts | | | 8.5% | |
| | | | | |
Total Exposure | | | 16.9% | |
| | | | | |
“Market Exposure” includes the value of total investments (including the contract value of any derivatives) and excludes any short-term investments and cash equivalents divided by Net Assets.
| |
| 1 | Commencement of operations. |
| 2 | As of August 31, 2010. |
DIREXION ANNUAL REPORT 11
Spectrum Equity Opportunity Fund
October 11, 20041- August 31, 2010 (Unaudited)
| | | | | | | | | | | | | | | | | |
| | | Average Annual Total Return2 | |
| | | | | | | | | | | | Since
| |
| | | 1 Year | | | 3 Year | | | 5 Year | | | Inception | |
| |
Spectrum Equity Opportunity Fund | | | 1.06% | | | | (2.71% | ) | | | 0.44% | | | | 1.87% | |
| | | | | | | | | | | | | | | | | |
S&P 500 Index | | | 4.91% | | | | (8.66% | ) | | | (0.91% | ) | | | 0.90% | |
This chart illustrates the performance of a hypothetical $10,000 investment made on the Fund’s inception, and is not intended to imply any future performance. The returns shown do not reflect the deduction of taxes that a shareholder would pay on fund distributions of the redemption of fund shares. The performance of the S&P 500 Index does not reflect the deduction of fees associated with a mutual fund, such as investment management fees. Investors cannot invest directly in an index, although they can invest in its underlying securities.
The performance data shown represents past performance and does not guarantee future results.
Market Exposure2
| | | | | |
| | | %
| |
Investment Type | | Net Assets | |
| |
Futures Contracts | | | 20.0% | |
| | | | | |
Total Exposure | | | 20.0% | |
| | | | | |
“Market Exposure” includes the value of total investments (including the contract value of any derivatives) and excludes any short-term investments and cash equivalents divided by Net Assets.
| |
| 1 | Commencement of operations. |
| 2 | As of August 31, 2010. |
12 DIREXION ANNUAL REPORT
Expense Example
August 31, 2010 (Unaudited)
As a shareholder of a mutual fund, you incur two types of costs: (1) transaction costs, including sales charges (loads) on purchase payments, reinvested dividends, or other distributions; redemption fees; and exchange fees; and (2) ongoing costs, including management fees; distribution and/or service fees; and other fund expenses. This example is intended to help you understand your ongoing costs (in dollars) of investing in a fund and to compare costs with the ongoing costs of investing in other mutual funds.
The example is based on an investment of $1,000 invested at the beginning of the period and held the entire period (March 1, 2010 — August 31, 2010).
Actual Expenses
The first line of the table below provides information about actual account values and actual expenses. Although the Funds charge no sales load or transactions fees, you will be assessed fees for outgoing wire transfers, returned checks or stop payment orders at prevailing rates charged by U.S. Bancorp Fund Services, LLC, the Funds’ transfer agent. If you request a redemption be made by wire transfer, currently a $15.00 fee is charged by the Funds’ transfer agent. To the extent a Fund invests in shares of other investment companies as part of its investment strategy, you will indirectly bear your proportionate share of any fees and expenses charged by the underlying funds in which the Fund invests, in addition to the expenses of the Fund. Actual expenses of underlying funds may vary. These expenses are not included in the examples presented on the preceding page. The preceding examples include, but are not limited to, investment advisory, shareholder servicing, fund accounting, custody and transfer agent fees. However, the example does not include portfolio trading heading entitled commissions and related expenses or other extraordinary expenses as determined under generally accepted accounting principles. You may use the information in this line, together with the amount you invested, to estimate the expenses that you paid over the period. Simply divide your account value by $1,000 (for example, an $8,600 account value divided by $1,000 = 8.6), then multiply the result by the number in the first line under the “Expenses Paid During Period” to estimate the expenses you paid on your account during this period.
Hypothetical Example for Comparison Purposes
The second line of the table below provides information about hypothetical account values and hypothetical expenses based on the Funds’ actual expense ratios and an assumed rate of return of 5% per year before expenses, which is not the Funds’ actual return. The hypothetical account values and expenses may not be used to estimate the actual ending account balance or expenses you paid for the period. You may use this information to compare the ongoing costs of investing in the Funds and other funds. To do so, compare this 5% hypothetical example with the 5% hypothetical examples that appear in the shareholder reports of the other funds.
Please note that the expenses shown in the table are meant to highlight your ongoing costs only and do not reflect any transactional costs, such as wire transfers, returned checks or stop payment orders. Therefore, the second line of the table is useful in comparing ongoing costs only, and will not help you determine the relative costs of owning different funds. In addition, if these transactional costs were included, your costs would have been higher.
DIREXION ANNUAL REPORT 13
Expense Example Tables
August 31, 2010 (Unaudited)
| | | | | | | | | | | | | | | | | |
| | | | | | Beginning
| | | Ending
| | | Expenses
| |
| | | Expense
| | | Account Value
| | | Account Value
| | | Paid During
| |
| | | Ratio1 | | | March 1, 2010 | | | August 31, 2010 | | | Period2 | |
| |
Spectrum Select Alternative Fund | | | | | | | | | | | | | | | | |
| Based on actual fund return | | | 2.55 | % | | $ | 1,000.00 | | | $ | 1,060.80 | | | $ | 13.25 | |
| Based on hypothetical 5% return | | | 2.55 | % | | | 1,000.00 | | | | 1,012.35 | | | | 12.93 | |
Spectrum Global Perspective Fund | | | | | | | | | | | | | | | | |
| Based on actual fund return | | | 2.55 | % | | | 1,000.00 | | | | 1,023.90 | | | | 13.01 | |
| Based on hypothetical 5% return | | | 2.55 | % | | | 1,000.00 | | | | 1,012.35 | | | | 12.93 | |
Spectrum Equity Opportunity Fund | | | | | | | | | | | | | | | | |
| Based on actual fund return | | | 2.55 | % | | | 1,000.00 | | | | 999.40 | | | | 12.85 | |
| Based on hypothetical 5% return | | | 2.55 | % | | | 1,000.00 | | | | 1,012.35 | | | | 12.93 | |
| | |
| 1 | | Annualized |
| 2 | | Expenses are equal to the Fund’s annualized expense ratio, multiplied by the average account value over the period, multiplied by the number of days in the most recent fiscal half-year/period, then divided by 365. |
Allocation of Portfolio Holdings
August 31, 2010 (Unaudited)
| | | | | | | | | | | | | | | | | | | | | | | | | |
| | | | | | Investment
| | | | | | | | | | | | | |
| | | Cash* | | | Companies | | | Futures | | | Swaps | | | Total | | | | |
| |
| Spectrum Select Alternative Fund | | | 11% | | | | 89% | | | | — | | | | 0 | %** | | | 100 | % | | | | |
| Spectrum Global Perspective Fund | | | 91% | | | | 8% | | | | — | | | | 1 | % | | | 100 | % | | | | |
| Spectrum Equity Opportunity Fund | | | 101% | | | | — | | | | (1 | %) | | | — | | | | 100 | % | | | | |
| | |
| * | | Cash, cash equivalents and other assets less liabilities. |
| ** | | Percentage is less than 0.5%. |
14 DIREXION ANNUAL REPORT
Spectrum Select Alternative Fund
Schedule of Investments
August 31, 2010
| | | | | | | | | |
| Shares | | | | | Value | |
| |
INVESTMENT COMPANIES - 88.9% |
| | 247,167 | | | Absolute Opportunities Fund | | $ | 2,975,892 | |
| | 384,090 | | | Absolute Strategies Fund | | | 4,075,198 | |
| | 253,455 | | | Harbor Bond Fund | | | 3,310,116 | |
| | 188,501 | | | Managers AMG FQ Global Alternatives Fund | | | 1,935,910 | |
| | 207,821 | | | Nuveen High Yield Municipal Bond Fund | | | 3,331,373 | |
| | 189,896 | | | Nuveen Preferred Securities Fund | | | 3,161,764 | |
| | 1,031,839 | | | PIMCO High Yield Fund | | | 9,348,463 | |
| | 1,681,355 | | | SEI International Management Trust High Yield Bond | | | 11,971,250 | |
| | | | | | | | | |
| | | | | TOTAL INVESTMENT COMPANIES
(Cost $39,320,545) | | $ | 40,109,966 | |
| | | | | | | | | |
| |
SHORT TERM INVESTMENTS - 11.2% |
MONEY MARKET FUNDS - 11.2% |
| | 894,233 | | | Fidelity Institutional Government Portfolio, 0.06%(a) | | $ | 894,233 | |
| | 894,233 | | | Fidelity Institutional Money Market Portfolio, 0.23%(a) | | | 894,233 | |
| | 894,233 | | | Goldman Sachs Financial Square Federal Fund, 0.04%(a) | | | 894,233 | |
| | 1,494,233 | | | Goldman Sachs Financial Square Government Fund, 0.10%(a)(b) | | | 1,494,233 | |
| | 894,234 | | | Morgan Stanley Institutional Liquidity Fund - Treasury Portfolio, 0.06%(a) | | | 894,234 | |
| | | | | | | | | |
| | | | | TOTAL SHORT TERM INVESTMENTS
(Cost $5,071,166) | | $ | 5,071,166 | |
| | | | | | | | | |
| | | | | TOTAL INVESTMENTS
(Cost $44,391,711) - 100.1% | | $ | 45,181,132 | |
| | | | | Liabilities in Excess of Other Assets - (0.1)% | | | (31,278 | ) |
| | | | | | | | | |
| | | | | TOTAL NET ASSETS - 100.0% | | $ | 45,149,854 | |
| | | | | | | | | |
Percentages are stated as a percent of net assets.
| |
| (a) | Represents annualized seven-day yield at August 31, 2010. |
| |
| (b) | $600,000 of this security is held as collateral for swap contracts. |
Spectrum Select Alternative Fund
Long Equity Swap Contracts
August 31, 2010
| | | | | | | | | | | | | | | | | | | | |
| | | | | | | | | | | | | | Unrealized
| |
| | | | | Number of
| | | Notional
| | | Termination
| | | Appreciation/
| |
Counterparty | | Reference Entity | | Contracts | | | Amount | | | Date | | | (Depreciation) | |
| |
| Credit Suisse Capital, LLC | | iShares Barclays Treasury Inflation Protected Securities Bond Fund | | | | 21,000 | | | $ | 2,245,225 | | | | 9/6/2011 | | | $ | 24,206 | |
| Credit Suisse Capital, LLC | | iShares iBoxx $ Investment Grade Corporate Bond Fund | | | | 20,200 | | | | 2,279,727 | | | | 9/6/2011 | | | | 2,814 | |
| Credit Suisse Capital, LLC | | iShares S&P U.S. Preferred Stock Index Fund | | | | 34,200 | | | | 1,366,406 | | | | 9/6/2011 | | | | (835 | ) |
| | | | | | | | | | | | | | | | | | | | |
| | | | | | | 75,400 | | | $ | 5,891,358 | | | | | | | $ | 26,185 | |
| | | | | | | | | | | | | | | | | | | | |
The accompanying notes are an integral part of these financial statements.
DIREXION ANNUAL REPORT 15
Spectrum Global Perspective Fund
Schedule of Investments
August 31, 2010
| | | | | | | | | |
| Shares | | | | | Value | |
| |
INVESTMENT COMPANIES - 8.5% |
| | 20,000 | | | iShares MSCI Chile Investable Market Index Fund | | $ | 1,353,000 | |
| | 104,000 | | | iShares MSCI Malaysia Index Fund | | | 1,339,520 | |
| | 26,000 | | | iShares MSCI Thailand Index Fund | | | 1,438,320 | |
| | | | | | | | | |
| | | | | TOTAL INVESTMENT COMPANIES
(Cost $3,898,529) | | $ | 4,130,840 | |
| | | | | | | | | |
SHORT TERM INVESTMENTS - 91.9% |
MONEY MARKET FUNDS - 91.9% |
| | 8,935,610 | | | Fidelity Institutional Government Portfolio, 0.06%(a) | | $ | 8,935,610 | |
| | 8,935,610 | | | Fidelity Institutional Money Market Portfolio, 0.23%(a) | | | 8,935,610 | |
| | 8,935,611 | | | Goldman Sachs Financial Square Federal Fund, 0.04%(a) | | | 8,935,611 | |
| | 9,325,611 | | | Goldman Sachs Financial Square Government Fund, 0.10%(a)(b) | | | 9,325,611 | |
| | 8,935,611 | | | Morgan Stanley Institutional Liquidity Fund - Treasury Portfolio, 0.06%(a) | | | 8,935,611 | |
| | | | | | | | | |
| | | | | TOTAL SHORT TERM INVESTMENTS
(Cost $45,068,053) | | $ | 45,068,053 | |
| | | | | | | | | |
| | | | | TOTAL INVESTMENTS
(Cost $48,966,582) - 100.4% | | $ | 49,198,893 | |
| | | | | Liabilities in Excess of Other Assets - (0.4)% | | | (177,399 | ) |
| | | | | | | | | |
| | | | | TOTAL NET ASSETS - 100.0% | | $ | 49,021,494 | |
| | | | | | | | | |
Percentages are stated as a percent of net assets.
| |
| (a) | Represents annualized seven-day yield at August 31, 2010. |
| |
| (b) | $390,000 of this security is held as collateral for swap contracts. |
Spectrum Global Perspective Fund
Long Equity Swap Contracts
August 31, 2010
| | | | | | | | | | | | | | | | | | | | |
| | | | | Number of
| | | Notional
| | | Termination
| | | Unrealized
| |
Counterparty | | Reference Entity | | Contracts | | | Amount | | | Date | | | Appreciation | |
| |
| Credit Suisse Capital, LLC | | iShares MSCI Chile Investable Market Index Fund | | | | 20,300 | | | $ | 1,270,364 | | | | 9/6/2011 | | | $ | 102,209 | |
| Credit Suisse Capital, LLC | | iShares MSCI Malaysia Index Fund | | | | 105,900 | | | | 1,269,328 | | | | 9/6/2011 | | | | 93,943 | |
| Credit Suisse Capital, LLC | | iShares MSCI Thailand Index Fund | | | | 25,900 | | | | 1,270,830 | | | | 9/6/2011 | | | | 161,236 | |
| | | | | | | | | | | | | | | | | | | | |
| | | | | | | 152,100 | | | $ | 3,810,522 | | | | | | | $ | 357,388 | |
| | | | | | | | | | | | | | | | | | | | |
The accompanying notes are an integral part of these financial statements.
16 DIREXION ANNUAL REPORT
Spectrum Equity Opportunity Fund
Schedule of Investments
August 31, 2010
| | | | | | | | | |
| Shares | | | | | Value | |
| |
SHORT TERM INVESTMENTS - 98.0% |
MONEY MARKET FUNDS - 98.0% |
| | 2,733,278 | | | Fidelity Institutional Government Portfolio, 0.06%(a) | | $ | 2,733,278 | |
| | 2,733,278 | | | Fidelity Institutional Money Market Portfolio, 0.23%(a) | | | 2,733,278 | |
| | 2,733,279 | | | Goldman Sachs Financial Square Federal Fund, 0.04%(a) | | | 2,733,279 | |
| | 2,733,279 | | | Goldman Sachs Financial Square Government Fund, 0.10%(a) | | | 2,733,279 | |
| | 2,733,278 | | | Morgan Stanley Institutional Liquidity Fund - Treasury Portfolio, 0.06%(a) | | | 2,733,278 | |
| | | | | | | | | |
| | | | | TOTAL SHORT TERM INVESTMENTS
(Cost $13,666,392) | | $ | 13,666,392 | |
| | | | | | | | | |
| | | | | TOTAL INVESTMENTS
(Cost $13,666,392) - 98.0% | | $ | 13,666,392 | |
| | | | | Other Assets in Excess of Liabilities - 2.0% | | | 285,326 | |
| | | | | | | | | |
| | | | | TOTAL NET ASSETS - 100.0% | | $ | 13,951,718 | |
| | | | | | | | | |
Percentages are stated as a percent of net assets.
| |
| (a) | Represents annualized seven-day yield at August 31, 2010. |
Spectrum Equity Opportunity Fund
Futures Contracts
August 31, 2010
| | | | | | | | | |
| | | | | | Unrealized
| |
Contracts | | | | | Depreciation | |
| |
| | 79 | | | NASDAQ-100 e-Mini Futures
Expiring September 2010 (Underlying Face Amount at Market Value $2,792,650) | | $ | (102,547 | ) |
| | | | | | | | | |
The accompanying notes are an integral part of these financial statements.
DIREXION ANNUAL REPORT 17
Statements of Assets and Liabilities
August 31, 2010
| | | | | | | | | | | | | |
| | | Spectrum Select
| | | Spectrum Global
| | | Spectrum Equity
| |
| | | Alternative Fund | | | Perspective Fund | | | Opportunity Fund | |
| |
Assets: | | | | | | | | | | | | |
| Investments, at market value (Note 2) | | $ | 45,181,132 | | | $ | 49,198,893 | | | $ | 13,666,392 | |
| Receivable for investments sold | | | — | | | | 4,844,879 | | | | — | |
| Deposit at broker for futures | | | — | | | | — | | | | 424,868 | |
| Unrealized appreciation on swaps | | | 26,185 | | | | 357,388 | | | | — | �� |
| Dividends and interest receivable | | | 37,706 | | | | 469 | | | | 567 | |
| | | | | | | | | | | | | |
| Total assets | | | 45,245,023 | | | | 54,401,629 | | | | 14,091,827 | |
| | | | | | | | | | | | | |
Liabilities: | | | | | | | | | | | | |
| Payable for investments purchased | | | — | | | | 4,894,753 | | | | — | |
| Deposits from broker for swaps | | | — | | | | 380,000 | | | | — | |
| Due to broker for futures | | | — | | | | — | | | | 100,168 | |
| Variation margin payable | | | — | | | | — | | | | 2,043 | |
| Accrued investment advisory expense | | | 38,385 | | | | 42,770 | | | | 12,368 | |
| Accrued operating services expenses | | | 21,111 | | | | 23,511 | | | | 6,802 | |
| Accrued distribution expense | | | 35,631 | | | | 39,101 | | | | 18,728 | |
| Accrued expenses and other liabilities | | | 42 | | | | — | | | | — | |
| | | | | | | | | | | | | |
| Total liabilities | | | 95,169 | | | | 5,380,135 | | | | 140,109 | |
| | | | | | | | | | | | | |
Net Assets | | $ | 45,149,854 | | | $ | 49,021,494 | | | $ | 13,951,718 | |
| | | | | | | | | | | | | |
Net Assets Consist Of: | | | | | | | | | | | | |
| Capital Stock | | $ | 43,325,340 | | | $ | 69,810,018 | | | $ | 17,344,147 | |
| Undistributed net investment income | | | — | | | | — | | | | — | |
| Undistributed (Accumulated) net realized gain (loss) | | | 1,008,908 | | | | (21,378,223 | ) | | | (3,289,882 | ) |
| Net unrealized appreciation (depreciation) on: | | | | | | | | | | | | |
| Investments | | | 789,421 | | | | 232,311 | | | | — | |
| Futures | | | — | | | | — | | | | (102,547 | ) |
| Swaps | | | 26,185 | | | | 357,388 | | | | — | |
| | | | | | | | | | | | | |
| Total Net Assets | | $ | 45,149,854 | | | $ | 49,021,494 | | | $ | 13,951,718 | |
| | | | | | | | | | | | | |
Calculation of Net Assets Value Per Share: | | | | | | | | | | | | |
| Net Assets | | $ | 45,149,854 | | | $ | 49,021,494 | | | $ | 13,951,718 | |
| Shares outstanding (unlimited shares of beneficial interest authorized, no par value) | | | 2,033,661 | | | | 2,596,714 | | | | 779,841 | |
| Net asset value, redemption and offering price per share | | $ | 22.20 | | | $ | 18.88 | | | $ | 17.89 | |
| | | | | | | | | | | | | |
| Cost of Investments | | $ | 44,391,711 | | | $ | 48,966,582 | | | $ | 13,666,392 | |
| | | | | | | | | | | | | |
The accompanying notes are an integral part of these financial statements.
18 DIREXION ANNUAL REPORT
Statements of Operations
For the Year Ended August 31, 2010
| | | | | | | | | | | | | |
| | | Spectrum Select
| | | Spectrum Global
| | | Spectrum Equity
| |
| | | Alternative Fund | | | Perspective Fund | | | Opportunity Fund | |
| |
Investment income: | | | | | | | | | | | | |
| Dividend income (net of foreign withholding tax of $—, $367, $3, respectively) | | $ | 1,559,191 | | | $ | 1,278,841 | | | $ | 223,668 | |
| Interest income | | | 5,930 | | | | 26,429 | | | | 8,121 | |
| | | | | | | | | | | | | |
| Total investment income | | | 1,565,121 | | | | 1,305,270 | | | | 231,789 | |
| | | | | | | | | | | | | |
Expenses: | | | | | | | | | | | | |
| Investment advisory fees | | | 368,822 | | | | 580,214 | | | | 141,337 | |
| Operating services fees | | | 202,852 | | | | 319,117 | | | | 77,735 | |
| Distribution expenses | | | 368,822 | | | | 580,214 | | | | 141,337 | |
| | | | | | | | | | | | | |
| Total expenses | | | 940,496 | | | | 1,479,545 | | | | 360,409 | |
| | | | | | | | | | | | | |
Net investment (income) loss | | | 624,625 | | | | (174,275 | ) | | | (128,620 | ) |
| | | | | | | | | | | | | |
Realized and unrealized gain (loss) on investments: | | | | | | | | | | | | |
| Net realized (gain) loss on: | | | | | | | | | | | | |
| Investments | | | 4,673,540 | | | | 4,841,775 | | | | 956,523 | |
| Futures | | | 56,834 | | | | 1,278,331 | | | | 247,325 | |
| Swaps | | | 695,302 | | | | (2,458,595 | ) | | | 5,593 | |
| | | | | | | | | | | | | |
| | | | 5,425,676 | | | | 3,661,511 | | | | 1,209,441 | |
| | | | | | | | | | | | | |
| Capital gain distributions from regulated investment companies | | | 222,625 | | | | 2,591 | | | | — | |
| | | | | | | | | | | | | |
| Change in unrealized appreciation (depreciation) on: | | | | | | | | | | | | |
| Investments | | | (1,926,974 | ) | | | (4,316,937 | ) | | | (859,041 | ) |
| Futures | | | (5,233 | ) | | | — | | | | (139,483 | ) |
| Swaps | | | 7,061 | | | | 3,869 | | | | (7,927 | ) |
| | | | | | | | | | | | | |
| | | | (1,925,146 | ) | | | (4,313,068 | ) | | | (1,006,451 | ) |
| | | | | | | | | | | | | |
| Net realized and unrealized gain (loss) on investments | | | 3,723,155 | | | | (648,966 | ) | | | 202,990 | |
| | | | | | | | | | | | | |
Net increase (decrease) in net assets resulting from operations | | $ | 4,347,780 | | | $ | (823,241 | ) | | $ | 74,370 | |
| | | | | | | | | | | | | |
The accompanying notes are an integral part of these financial statements.
DIREXION ANNUAL REPORT 19
Statements of Changes in Net Assets
| | | | | | | | | | | | | | | | | | | | | | | | | |
| | | Spectrum Select
| | | Spectrum Global
| | | Spectrum Equity
| |
| | | Alternative Fund | | | Perspective Fund | | | Opportunity Fund | |
| | | Year ended
| | | Year Ended
| | | Year ended
| | | Year Ended
| | | Year ended
| | | Year Ended
| |
| | | August 31, 2010 | | | August 31, 2009 | | | August 31, 2010 | | | August 31, 2009 | | | August 31, 2010 | | | August 31, 2009 | |
| |
Operations: | | | | | | | | | | | | | | | | | | | | | | | | |
| Net investment income (loss) | | $ | 624,625 | | | $ | 592,308 | | | $ | (174,275 | ) | | $ | (82,002 | ) | | $ | (128,620 | ) | | $ | (10,600 | ) |
| Net realized gain (loss) on investments | | | 5,425,676 | | | | (412,268 | ) | | | 3,661,511 | | | | (6,144,481 | ) | | | 1,209,441 | | | | (1,380,740 | ) |
| Capital gain distributions from regulated investment companies | | | 222,625 | | | | 9,658 | | | | 2,591 | | | | — | | | | — | | | | — | |
| Change in unrealized appreciation (depreciation) on investments | | | (1,925,146 | ) | | | 2,768,809 | | | | (4,313,068 | ) | | | 4,830,431 | | | | (1,006,451 | ) | | | 997,947 | |
| | | | | | | | | | | | | | | | | | | | | | | | | |
| Net increase (decrease) in net assets resulting from operations | | | 4,347,780 | | | | 2,958,507 | | | | (823,241 | ) | | | (1,396,052 | ) | | | 74,370 | | | | (393,393 | ) |
| | | | | | | | | | | | | | | | | | | | | | | | | |
Distributions to shareholders: | | | | | | | | | | | | | | | | | | | | | | | | |
| Net investment income | | | (1,362,145 | ) | | | (549,091 | ) | | | — | | | | (7,154 | ) | | | — | | | | — | |
| Net realized gains | | | — | | | | — | | | | — | | | | (5,677 | ) | | | — | | | | — | |
| Return of capital | | | | | | | — | | | | (8,295 | ) | | | (40 | ) | | | (68,651 | ) | | | (1,882 | ) |
| | | | | | | | | | | | | | | | | | | | | | | | | |
| Total distributions | | | (1,362,145 | ) | | | (549,091 | ) | | | (8,295 | ) | | | (12,871 | ) | | | (68,651 | ) | | | (1,882 | ) |
| | | | | | | | | | | | | | | | | | | | | | | | | |
Capital share transactions: | | | | | | | | | | | | | | | | | | | | | | | | |
| Proceeds from shares sold | | | 18,165,741 | | | | 8,303,976 | | | | 6,279,206 | | | | 3,612,228 | | | | 2,898,842 | | | | 1,076,979 | |
| Proceeds from shares issued to holders in reinvestment of distributions | | | 1,355,569 | | | | 546,658 | | | | 8,289 | | | | 12,841 | | | | 68,651 | | | | 1,864 | |
| Cost of shares redeemed | | | (5,437,952 | ) | | | (8,168,964 | ) | | | (17,739,212 | ) | | | (20,760,271 | ) | | | (2,459,672 | ) | | | (3,626,856 | ) |
| | | | | | | | | | | | | | | | | | | | | | | | | |
| Net increase (decrease) in net assets resulting from capital share transactions | | | 14,083,358 | | | | 681,670 | | | | (11,451,717 | ) | | | (17,135,202 | ) | | | 507,821 | | | | (2,548,013 | ) |
| | | | | | | | | | | | | | | | | | | | | | | | | |
Total increase (decrease) in net assets | | | 17,068,993 | | | | 3,091,086 | | | | (12,283,253 | ) | | | (18,544,125 | ) | | | 513,540 | | | | (2,943,288 | ) |
| | | | | | | | | | | | | | | | | | | | | | | | | |
Net assets: | | | | | | | | | | | | | | | | | | | | | | | | |
| Beginning of year | | | 28,080,861 | | | | 24,989,775 | | | | 61,304,747 | | | | 79,848,872 | | | | 13,438,178 | | | | 16,381,466 | |
| | | | | | | | | | | | | | | | | | | | | | | | | |
| End of year | | $ | 45,149,854 | | | $ | 28,080,861 | | | $ | 49,021,494 | | | $ | 61,304,747 | | | $ | 13,951,718 | | | $ | 13,438,178 | |
| | | | | | | | | | | | | | | | | | | | | | | | | |
Undistributed (Accumulated) net investment income (loss), end of year | | $ | — | | | $ | 208,303 | | | $ | — | | | $ | — | | | $ | — | | | $ | (20 | ) |
| | | | | | | | | | | | | | | | | | | | | | | | | |
The accompanying notes are an integral part of these financial statements.
20 DIREXION ANNUAL REPORT
Financial Highlights
August 31, 2010
| | | | | | | | | | | | | | | | | | | | | | | | | | | | | | | | | | | | | | | | | | | | | | | | | | | | | | | | | | | | | |
| | | | | | | | | | | | | | | | | | | | | | | | | | | | | | | | | | | | RATIOS TO AVERAGE NET ASSETS | | | | |
| | | | | | | | | | | | | | | | | | | | | | | | | | | | | | | | | | | | | | | | | | Net
| | | | |
| | | | | | | | | Net Realized
| | | Net Increase
| | | | | | | | | | | | | | | | | | | | | | | | | | | | | | Investment
| | | | |
| | | Net Asset
| | | | | | and
| | | (Decrease)
| | | Dividends
| | | Distributions
| | | | | | | | | Net Asset
| | | | | | Net Assets,
| | | | | | | | | Income (Loss)
| | | | |
| | | Value,
| | | Net
| | | Unrealized
| | | in Net Asset
| | | from Net
| | | from
| | | Return
| | | | | | Value,
| | | | | | End of
| | | | | | | | | After Expense
| | | Portfolio
| |
| | | Beginning
| | | Investment
| | | Gain (Loss)
| | | Value Resulting
| | | Investment
| | | Realized
| | | of Capital
| | | Total
| | | End
| | | Total
| | | Year/Period
| | | Total
| | | Net
| | | Reimbursement/
| | | Turnover
| |
| Year/Period | | of Year/Period | | | Income(Loss)2 | | | on Investments | | | from Operations | | | Income | | | Capital Gains | | | Distribution | | | Distributions | | | of Year/Period | | | Return3 | | | (,000) | | | Expenses1 | | | Expenses1 | | | Recoupment1 | | | Rate4 | |
| | |
Spectrum Select Alternative Fund | | | | | | | | | | | | | | | | | | | | | | | | | | | | | | | | | | | | | | | | | | | | | | | | | | | | | | | | | | | | |
| Year ended August 31, 2010 | | $ | 20.36 | | | $ | 0.36 | | | $ | 2.35 | | | $ | 2.71 | | | $ | (0.87 | ) | | $ | — | | | $ | — | | | $ | (0.87 | ) | | $ | 22.20 | | | | 13.51 | % | | $ | 45,150 | | | | 2.55 | % | | | 2.55 | % | | | 1.69 | % | | | 192% | |
| Year ended August 31, 2009 | | | 18.33 | | | | 0.50 | | | | 2.00 | | | | 2.50 | | | | (0.47 | ) | | | — | | | | — | | | | (0.47 | ) | | | 20.36 | | | | 14.09 | % | | | 28,081 | | | | 2.67 | % | | | 2.59 | % | | | 2.76 | % | | | 297% | |
| Year ended August 31, 2008 | | | 20.02 | | | | 0.33 | | | | (1.58 | ) | | | (1.25 | ) | | | (0.43 | ) | | | (0.01 | ) | | | — | | | | (0.44 | ) | | | 18.33 | | | | (6.38 | %) | | | 24,990 | | | | 2.57 | % | | | 2.57 | % | | | 1.68 | % | | | 127% | |
| Year ended August 31, 2007 | | | 19.54 | | | | 0.57 | | | | 0.76 | | | | 1.33 | | | | (0.85 | ) | | | — | | | | — | | | | (0.85 | ) | | | 20.02 | | | | 6.93 | % | | | 40,757 | | | | 2.44 | % | | | 2.44 | % | | | 2.82 | % | | | 260% | |
| Year ended August 31, 2006 | | | 19.96 | | | | 0.50 | | | | 0.34 | | | | 0.84 | | | | (1.26 | ) | | | — | | | | — | | | | (1.26 | ) | | | 19.54 | | | | 4.53 | % | | | 22,725 | | | | 2.54 | % | | | 2.54 | % | | | 2.57 | % | | | 898% | |
Spectrum Global Perspective Fund | | | | | | | | | | | | | | | | | | | | | | | | | | | | | | | | | | | | | | | | | | | | | | | | | | | | | | | | | | | | |
| Year ended August 31, 2010 | | | 19.18 | | | | (0.06 | ) | | | (0.24 | ) | | | (0.30 | ) | | | — | 5 | | | — | | | | — | | | | — | 5 | | | 18.88 | | | | (1.55 | %) | | | 49,021 | | | | 2.55 | % | | | 2.55 | % | | | (0.30 | %) | | | 1,378% | |
| Year ended August 31, 2009 | | | 18.69 | | | | (0.02 | ) | | | 0.51 | | | | 0.49 | | | | — | 5 | | | — | 5 | | | — | 5 | | | — | 5 | | | 19.18 | | | | 2.65 | % | | | 61,305 | | | | 2.52 | % | | | 2.49 | % | | | (0.14 | %) | | | 1,770% | |
| Year ended August 31, 2008 | | | 24.73 | | | | (0.16 | ) | | | (1.48 | ) | | | (1.64 | ) | | | (0.84 | ) | | | (3.56 | ) | | | — | | | | (4.40 | ) | | | 18.69 | | | | (8.96 | %) | | | 79,849 | | | | 2.38 | % | | | 2.38 | % | | | (0.75 | %) | | | 2,073% | |
| Year ended August 31, 2007 | | | 25.93 | | | | (0.03 | ) | | | 2.86 | | | | 2.83 | | | | (0.34 | ) | | | (3.69 | ) | | | — | | | | (4.03 | ) | | | 24.73 | | | | 11.32 | % | | | 110,764 | | | | 2.24 | % | | | 2.24 | % | | | (0.12 | %) | | | 1,259% | |
| Year ended August 31, 2006 | | | 23.46 | | | | 0.06 | | | | 4.49 | | | | 4.55 | | | | — | | | | (2.08 | ) | | | — | | | | (2.08 | ) | | | 25.93 | | | | 20.43 | % | | | 115,420 | | | | 2.23 | % | | | 2.23 | % | | | 0.25 | % | | | 1,693% | |
Spectrum Equity Opportunity Fund | | | | | | | | | | | | | | | | | | | | | | | | | | | | | | | | | | | | | | | | | | | | | | | | | | | | | | | | | | | | |
| Year ended August 31, 2010 | | | 17.79 | | | | (0.17 | ) | | | 0.36 | | | | 0.19 | | | | (0.09 | ) | | | — | | | | — | | | | (0.09 | ) | | | 17.89 | | | | 1.06 | % | | | 13,952 | | | | 2.55 | % | | | 2.55 | % | | | (0.91 | %) | | | 1,447% | |
| Year ended August 31, 2009 | | | 17.90 | | | | (0.01 | ) | | | (0.10 | ) | | | (0.11 | ) | | | — | | | | — | | | | — | 5 | | | — | 5 | | | 17.79 | | | | (0.60 | %) | | | 13,438 | | | | 2.79 | % | | | 2.72 | % | | | (0.09 | %) | | | 1,485% | |
| Year ended August 31, 2008 | | | 21.24 | | | | (0.05 | ) | | | (1.51 | ) | | | (1.56 | ) | | | (0.60 | ) | | | (1.18 | ) | | | — | | | | (1.78 | ) | | | 17.90 | | | | (8.28 | %) | | | 16,381 | | | | 2.63 | % | | | 2.63 | % | | | (0.27 | %) | | | 1,617% | |
| Year ended August 31, 2007 | | | 21.43 | | | | (0.03 | ) | | | 1.48 | | | | 1.45 | | | | (0.31 | ) | | | (1.33 | ) | | | — | | | | (1.64 | ) | | | 21.24 | | | | 6.91 | % | | | 32,858 | | | | 2.40 | % | | | 2.40 | % | | | (0.14 | %) | | | 1,347% | |
| Year ended August 31, 2006 | | | 21.85 | | | | 0.03 | | | | 0.77 | | | | 0.80 | | | | — | | | | (1.22 | ) | | | — | | | | (1.22 | ) | | | 21.43 | | | | 3.85 | % | | | 48,875 | | | | 2.31 | % | | | 2.31 | % | | | 0.15 | % | | | 2,310% | |
| | |
| 1 | | Annualized. |
| 2 | | Net investment income (loss) per share represents net investment income (loss) divided by the daily average shares of beneficial interest outstanding throughout each period. |
| 3 | | All returns reflect reinvested dividends, if any, but do not reflect the impact of taxes. |
| 4 | | Portfolio turnover is calculated without regard to short-term securities having a maturity of less than one year. Investments in options, swaps, and futures contracts and repurchase agreements are deemed short-term securities. The Fund’s aggressive investment strategy may result in significant portfolio turnover to take advantage of anticipated changes in market conditions. |
| 5 | | Amount is less than $0.01 per share. |
DIREXION ANNUAL REPORT 21
Direxion Funds
NOTES TO THE FINANCIAL STATEMENTS
August 31, 2010
Direxion Funds (the “Trust”) was organized as a Massachusetts Business Trust on June 6, 1997 and is registered under the Investment Company Act of 1940, as amended (the “1940 Act”), as an open-end management investment company issuing its shares in series, each series representing a distinct portfolio with its own investment objective and policies. The Trust currently has 32 series of which 4 are included in this report, HCM Freedom Fund, Spectrum Select Alternative Fund, Spectrum Global Perspective Fund and Spectrum Equity Opportunity Fund (each a “Fund” and collectively, the “Funds”). Each Fund is a “non-diversified” series of the Trust pursuant to the 1940 Act. During the year ended August 31, 2010, three series of the Trust, the PSI Core Strength Fund, PSI Macro Trends Fund and PSI Total Return Fund were liquidated and terminated.
The HCM Freedom Fund’s objective is long-term capital appreciation with lower volatility than the overall market by employing a dynamic asset allocation strategy. The HCM Freedom Fund has great flexibility in deciding in what to invest and when to invest, and may invest in a broad range of equity and fixed income securities, both domestically and internationally, as well as derivative instruments of these securities.
The Spectrum Select Alternative Fund seeks a moderate total rate of return (income plus capital appreciation) on an annual basis, by investing primarily in any combination of equity and fixed-income securities based on market conditions, trends and expectations. The Spectrum Global Perspective Fund seeks a high total rate of return (income from short-term trading plus capital appreciation) on an annual basis by investing in equity securities of foreign issuers either directly or indirectly through American Depository Receipts (ADRs), exchange traded funds (ETFs), foreign currencies, other investment companies and derivative instruments. The Spectrum Equity Opportunity Fund seeks a high total rate of return (income from short-term trading plus capital appreciation) on an annual basis by investing either directly in securities of domestic and foreign issuers or indirectly through ADRs, ETFs, other investment companies and derivative instruments.
| |
| 2. | SIGNIFICANT ACCOUNTING POLICIES |
The following is a summary of significant accounting policies consistently followed by the Funds in the preparation of their financial statements. These policies are in conformity with U.S. generally accepted accounting principles (“GAAP”).
a) Investment Valuation – The Net Asset Value (“NAV”) of each Fund is determined daily, Monday through Friday, as of the close of regular trading on the New York Stock Exchange (“NYSE”), each day the NYSE is open for business. The value of all portfolio securities and other assets held by a Fund will be determined as of the time a Fund calculates its NAV, 4:00 p.m. Eastern Time (“Valuation Time”). Equity securities and ETFs are valued at their last sales price, or if not available, at the average of the last bid and ask prices. Investments in open-end mutual funds are valued at their respective quoted net asset values on the valuation dates. Futures are valued at the settlement price established on the exchange on which they are traded, if that settlement price reflects trading prior to the Valuation Time. If the settlement price established by the exchange reflects trading after the Valuation Time, then the last sales price prior to Valuation Time will be used. Options are valued at the composite price, using the National Best Bid and Offer quotes (“NBBO”). NBBO consists of the highest bid price and lowest ask price across any of the exchanges on which an option is quoted. Specifically, composite pricing looks at the last trades on the exchanges where the options are traded. If there are no trades for the option on a given business day, the composite pricing calculates the mean of the highest bid and lowest ask price across the exchanges where the option is traded. Over-the-counter securities are valued at the average of the last bid and ask prices. Securities primarily traded on the NASDAQ National Market are valued using the NASDAQ Official Closing Price. Swaps are valued based upon prices from third party vendor models or quotations from market makers to the extent available. Short-term debt securities with a maturity of 60 days or less and money market securities are valued using the amortized cost method. Other debt securities are valued by using the mean prices provided by the Fund’s pricing service or, if such services are unavailable, by a pricing matrix method. Securities for which reliable market quotations are not readily available, the Funds’ pricing service does not provide a valuation for such securities, the Fund’s pricing service provides valuation that in the judgment of Rafferty Asset
22 DIREXION ANNUAL REPORT
Management, LLC (the “Adviser”) does not represent fair value, or the Fund or Adviser believes the market price is stale will be fair valued as determined by the Adviser under the supervision of the Board of Trustees.
b) Repurchase Agreements – Each Fund may enter into repurchase agreements with institutions that are members of the Federal Reserve System or securities dealers who are members of a national securities exchange or are primary dealers in U.S. government securities. In connection with transactions in repurchase agreements, it is the Trust’s policy that the Fund receives, as collateral, cash and/or securities (primarily U.S. government securities) whose market value, including accrued interest, at all times will be at least equal to 100% of the amount invested by the Fund in each repurchase agreement. If the seller defaults, and the value of the collateral declines, realization of the collateral by the Fund may be delayed or limited. The Funds were not invested in repurchase agreements at August 31, 2010.
c) Swap Contracts – Each Fund may enter into equity swap contacts. Standard equity swap contracts are between two parties that agree to exchange the returns (or differentials in rates of return) earned or realized on particular predetermined investments or instruments. The gross amount to be exchanged is calculated with respect to a “notional amount” (i.e. the return on or increase in value of a particular dollar amount invested in a “basket” of securities representing a particular index or industry sector). The Fund’s obligations are accrued daily (offset by any amounts owed to the Fund.)
In a “long” equity swap agreement, the counterparty will generally agree to pay the Fund the amount, if any, by which the notional amount of swap contract would have increased in value if the Fund had been invested in the particular securities, plus dividends that would have been received on those securities. The Fund will agree to pay the counterparty a floating rate of interest (e.g., a LIBOR based rate) on the notional amount of the swap contract plus the amount, if any, by which the notional amount would have decreased in value had it been invested in such securities plus, in certain instances, commissions or trading spreads on the notional amounts. Thus, the return on the swap contract should be the gain or loss on the notional amount plus dividends on the securities less the interest paid by the Fund on the notional amount. Payments may be made at the conclusion of the contract or periodically during its term. These swap contracts do not include the delivery of securities by the Funds to the counterparty. The net amount of the excess, if any, of the Fund’s obligations owed over its entitlement with respect to each swap is accrued on a daily basis and an amount of cash or liquid assets having an aggregate net asset value at least equal to such accrued excess is maintained in a segregated account by the Funds’ custodian. Until a swap contract is settled in cash, the gain or loss on the notional amount plus dividends on the securities less the interest paid by the Fund on the notional amount are recorded as “unrealized gains or losses on swaps” and when cash is exchanged, the gain or loss is recorded as “realized gains or losses on swaps.”
Each Fund may enter into swap contracts that provide the opposite return of the particular benchmark or security (“short” the index or security). The operations are similar to that of the swaps disclosed above except that the counterparty pays interest to the Fund on the notional amount outstanding and the dividends on the underlying securities reduce the return of the swap. These amounts are netted with any unrealized appreciation or depreciation to determine the value of the swap. The Funds will typically enter into equity swap agreements to obtain leverage in order to meet their objectives.
The Funds collateralize swap agreements with cash and certain securities as indicated on the Schedule of Investments of each of the Funds, respectively. Such collateral is held for the benefit of the counterparty in a segregated account at the Custodian to protect the counterparty against non-payment by the Funds. The Funds do not net collateral. In the event of a default by the counterparty, the Funds will seek return of this collateral and may incur certain costs exercising their rights with respect to the collateral. Amounts expected to be owed to the Funds are regularly collateralized either directly with the Funds or in a segregated account at the Custodian.
A Fund bears the risk of loss of the amount expected to be received under a swap agreement in the event of the default or bankruptcy of swap agreement counterparty to the extent that posted collateral is insufficient. A Fund will enter into swap agreements only with large, well-capitalized and established financial institutions. The creditworthiness of each of the firms that is a party to a swap agreement is monitored by the Adviser.
The Funds may enter into credit default swaps. Credit default swaps involve one party making a stream of payments (referred to as the buyer of protection) to another party (the seller of protection) in exchange for the right to receive a specified return in the event a credit event occurs, typically a default by a corporate issuer on its debt obligation. As a seller of protection on
DIREXION ANNUAL REPORT 23
credit default swaps, a Fund will generally receive from the buyer of protection a fixed rate of income throughout the term of the swap provided that there is no credit event. As the seller, a Fund would effectively add leverage to its portfolio because, in addition to its total assets, a Fund would be subject to investment exposure on the notional amount of the swap.
If a Fund is a seller of protection and a credit event occurs, the Fund will either (i) pay to the buyer of protection an amount equal to the notional amount of the swap and take delivery of the referenced obligation or underlying securities comprising the referenced index or (ii) pay a net settlement amount in the form of cash or securities equal to the notional amount of the swap less the recovery value of the referenced obligation or underlying securities comprising the referenced index. If a Fund is a buyer of protection and a credit event occurs, the Fund will either (i) receive from the seller of protection an amount equal to the notional amount of the swap and deliver the referenced obligation or underlying securities comprising the referenced index or (ii) receive a net settlement amount in the form of cash or securities equal to the notional amount of the swap less the recovery value of the referenced obligation or underlying securities comprising the referenced index. Recovery values are assumed by market makers considering either industry standard recovery rates or entity specific factors and considerations until a credit event occurs. If a credit event has occurred, the recovery value is determined by a facilitated auction whereby a minimum number of allowable broker bids, together with a specified valuation method, are used to calculate the settlement value.
Credit default swap agreements on credit indices involve one party making a stream of payments to another party in exchange for the right to receive a specified return in the event of a write-down, principal shortfall, interest shortfall or default of all or part of the referenced entities comprising the credit index. The stream of payments includes any up-front payments paid or received by the Fund and interest associated with the agreement. Up-front payments compensate for differences between the stated terms of the agreement and the prevailing market conditions and are recorded as realized gain or loss ratably over the term of the swap. The interest associated with the agreement is recognized as unrealized gain or loss until the swap is sold or expires, at which point the cumulative stream of payments is recognized as a component of realized gain or loss. A credit index consists of a basket of credit instruments or exposures designed to be representative of some part of the credit market as a whole. These indices are made up of reference credits that are judged by a poll of dealers to be the most liquid entities in the credit default swap market based on the sector of the index. Components of the indices may include, but are not limited to, investment grade securities, high yield securities, asset based securities, emerging markets, and/or various credit ratings within each sector. Credit indices are traded using credit default swaps with standardized terms including a fixed spread and standard maturity dates. An index credit default swap references all the names in the index, and if there is a default, the credit event is settled based on that name’s weight in the index. The composition of the indices changes periodically, usually every six months, and for most indices, each name has an equal weight in the index. A Fund may use credit default swaps on credit indices to hedge a portfolio of credit default swaps or bonds because entering into credit default swaps on indices is less expensive than buying many credit default swaps. Credit default swaps on indices are benchmarks for protecting investors owning bonds against defaults, and traders use them to speculate on changes in credit quality of bonds.
The maximum potential amount of future payments that the Fund as a seller of protection could be required to make under a credit default swap agreement would be an amount equal to the notional amount of the swap. These potential amounts would be partially offset by any recovery value of respective referenced obligations, upfront payments received upon entering into the agreement, or net amounts received from the settlement of buy protection credit default swap agreements entered into by a Fund for the same referenced entity or entities. The Funds were not invested in credit default swaps at August 31, 2010.
The Funds have adopted authoritative standards of accounting for and disclosure of credit derivatives, including credit default swap agreements. These disclosure requirements include (i) the nature and terms of the credit derivative, reasons for entering into the credit derivative, the events or circumstances that would require the seller to perform under the credit derivative, and the current status of the payment/performance risk of the credit derivative, (ii) the maximum potential amount of future payments the seller could be required to make under the credit derivative, (iii) the fair value of the credit derivative, and (iv) the nature of any recourse provisions and assets held either as collateral or by third parties, and (v) the current status of the payment risk of the credit derivative.
24 DIREXION ANNUAL REPORT
d) Short Positions – Each Fund may engage in short sale transactions. For financial statement purposes, an amount equal to the settlement amount is included in the Statement of Assets and Liabilities as an asset and an equivalent liability. The amount of the liability is subsequently marked-to-market to reflect the current value of the short position. Subsequent fluctuations in the market prices of short positions may require purchasing the securities at prices which may differ from the market value reflected on the Statement of Assets and Liabilities. The Fund is liable to the buyer for any dividends payable on securities while those securities are in a short position. As collateral for its short positions, the Fund is required under the 1940 Act to maintain assets consisting of cash, cash equivalents or liquid securities equal to the market value of the securities sold short. This collateral is required to be adjusted daily. The Funds were not invested in short positions at August 31, 2010.
e) Stock Index Futures Contracts and Options on Futures Contracts – Each Fund may purchase and sell stock index futures contracts and options on such futures contracts. A Fund may use futures contracts to gain exposure to, or hedge against changes in the value of equities, interest rates or foreign countries. Upon entering into a contract, the Fund deposits and maintains as collateral such initial margin as required by the exchange on which the transaction is effected. Pursuant to the contract, the Fund agrees to receive from or pay to the broker an amount of cash equal to the daily fluctuation in value of the contract. Such receipts or payments are known as “variation margin” and are recorded by the Fund as unrealized gains and losses. When the contract is closed, the Fund records a realized gain or loss equal to the difference between the value of the contract at the time it was opened and the value at the time it was closed. As collateral for futures contracts, the Fund is required under the 1940 Act to maintain assets consisting of cash, cash equivalents or liquid securities. This collateral is required to be adjusted daily to reflect the market value of the purchase obligation for long futures contracts or the market value of the instrument underlying the contract, but not less than the market price at which the futures contract was established, for short futures contracts. The Funds were not invested in options on futures contracts at August 31, 2010.
f) Risks of Options, Futures Contracts, Options on Futures Contracts and Short Positions – The risks inherent in the use of options, futures contracts, options on futures contracts and short positions include 1) adverse changes in the value of such instruments; 2) imperfect correlation between the price of options and futures contracts and options thereon and movements in the price of the underlying securities, index or futures contracts; 3) the possible absence of a liquid secondary market for any particular instrument at any time; 4) the possible need to defer closing out certain positions to avoid adverse tax consequences; and 5) the possible nonperformance by the counterparty under the terms of the contract. The Funds designate all cash, cash equivalents and liquid securities as collateral for written options, futures contracts, options on futures contracts and short positions.
g) Risks of Investing in Foreign Securities – The Spectrum Global Perspective and the Spectrum Equity Opportunity Funds may invest in foreign securities. Investments in foreign securities involve greater risks than investing in domestic securities. As a result, the Fund’s returns and net asset values may be affected to a large degree by fluctuations in currency exchange rates, political, diplomatic or economic conditions and regulatory requirements in other countries. The laws and accounting, auditing, and financial reporting standards in foreign countries typically are not as strict as they are in the U.S., and there may be less public information available about foreign companies. Investments in foreign emerging markets present a greater risk than investing in foreign issuers in general. The risk of political or social upheaval is greater in emerging markets. In addition, there may be risks of an economy’s dependence on revenues from particular commodities, currency transfer restrictions, a limited number of potential buyers for such securities and delays and disruption in securities settlement procedures.
h) Security Transactions – Investment transactions are recorded on the trade date. The Funds determine the gain or loss realized from the investment transactions by comparing the identified cost, which is the same basis used for federal income tax purposes, with the net sales proceeds.
i) Federal Income Taxes – Each Fund intends to comply with the requirements of Subchapter M of the Internal Revenue Code necessary to qualify as a regulated investment company and to make the requisite distributions of income and capital gains to its shareholders sufficient to relieve it from all or substantially all federal income. No provision for federal income taxes has been made.
DIREXION ANNUAL REPORT 25
j) Income and Expenses – Dividend income is recorded on the ex-dividend date. Interest income, including amortization of premium and discount, and dividends received from money market funds, is recognized on an accrual basis. Expenses are charged to the Funds daily. Expenses are computed based on each Fund’s respective daily net assets. For additional discussion on expenses refer to Note 5.
k) Distributions to Shareholders – Each Fund generally pays dividends from net investment income and distributes net realized capital gains, if any, at least annually. Income and capital gain distributions are determined in accordance with income tax regulations which may differ from GAAP. The Funds may utilize earnings and profits distributed to shareholders on redemption of shares as part of the dividend paid deduction. Distributions to shareholders are recorded on the ex-dividend date.
The tax character of distributions for the Funds during the years ended August 31, 2010 and August 31, 2009 were as follows:
| | | | | | | | | |
| | | HCM Freedom Fund | |
| | | Year Ended
| | | Year Ended
| |
| | | August 31,
| | | August 31,
| |
| | | 2010 | | | 2009 | |
| |
| Distributions paid from: | | | | | | | | |
| Ordinary Income | | $ | 1,474,611 | | | $ | 1,039,384 | |
| | | | | | | | | |
| Total Distributions paid | | $ | 1,474,611 | | | $ | 1,039,384 | |
| | | | | | | | | |
| | | | | | | | | | | | | | | | | | | | | | | | | |
| | | Spectrum Select
| | | Spectrum Global
| | | Spectrum Equity
| |
| | | Alternative Fund | | | Perspective Fund | | | Opportunity Fund | |
| | | Year Ended
| | | Year Ended
| | | Year Ended
| | | Year Ended
| | | Year Ended
| | | Year Ended
| |
| | | August 31,
| | | August 31,
| | | August 31,
| | | August 31,
| | | August 31,
| | | August 31,
| |
| | | 2010 | | | 2009 | | | 2010 | | | 2009 | | | 2010 | | | 2009 | |
| |
| Distributions paid from: | | | | | | | | | | | | | | | | | | | | | | | | |
| Ordinary Income | | $ | 1,362,145 | | | $ | 549,091 | | | $ | — | | | $ | 12,567 | | | $ | — | | | $ | — | |
| Long-Term Capital Gains | | | — | | | | — | | | | — | | | | 264 | | | | — | | | | — | |
| Return of Capital | | | — | | | | — | | | | 8,295 | | | | 40 | | | | 68,651 | | | | 1,882 | |
| | | | | | | | | | | | | | | | | | | | | | | | | |
| Total Distributions paid | | $ | 1,362,145 | | | $ | 549,091 | | | $ | 8,295 | | | $ | 12,871 | | | $ | 68,651 | | | $ | 1,882 | |
| | | | | | | | | | | | | | | | | | | | | | | | | |
The Funds are designating as long-term capital gain dividends, pursuant to Internal Revenue Code Section 852(b)(3), the amount necessary to reduce the earnings and profits of the Fund related to net capital gain to zero for the tax year ended August 31, 2010.
As of August 31, 2010, the components of distributable earnings of the Funds on a tax basis were as follows:
| | | | | | | | | | | | | | | | | |
| | | HCM Freedom
| | | Spectrum Select
| | | Spectrum Global
| | | Spectrum Equity
| |
| | | Fund | | | Alternative Fund | | | Perspective Fund | | | Opportunity Fund | |
| |
| Tax cost of investments | | $ | 27,528,525 | | | $ | 44,391,711 | | | $ | 50,045,984 | | | $ | 13,666,392 | |
| Gross unrealized appreciation | | | 486,348 | | | | 866,385 | | | | 278,593 | | | | — | |
| Gross unrealized depreciation | | | (68,977 | ) | | | (76,964 | ) | | | (1,125,684 | ) | | | — | |
| | | | | | | | | | | | | | | | | |
| Net unrealized appreciation/(depreciation) | | | 417,371 | | | | 789,421 | | | | (847,091 | ) | | | — | |
| | | | | | | | | | | | | | | | | |
| Undistributed ordinary income | | | 520,163 | | | | 1,108,592 | | | | — | | | | — | |
| Undistributed long-term capital gain | | | — | | | | — | | | | — | | | | — | |
| | | | | | | | | | | | | | | | | |
| Total distributable earnings | | | 520,163 | | | | 1,108,592 | | | | — | | | | — | |
| | | | | | | | | | | | | | | | | |
| Other accumulated gain/(loss) | | | (19,856,222 | ) | | | (73,499 | ) | | | (19,941,433 | ) | | | (3,392,429 | ) |
| | | | | | | | | | | | | | | | | |
| Total accumulated earnings/(loss) | | $ | (18,918,688 | ) | | $ | 1,824,514 | | | $ | (20,788,524 | ) | | $ | (3,392,429 | ) |
| | | | | | | | | | | | | | | | | |
The difference between book cost of investments and tax cost of investments is attributable primarily to the tax deferral of losses on wash sales. Other accumulated gain/ (loss) is generally comprised of capital loss carryforwards, post-October capital loss deferrals and/or unrealized gain/ (loss) on derivative positions.
26 DIREXION ANNUAL REPORT
On the Statement of Assets and Liabilities, the following adjustments were made for permanent tax differences between accounting for net investment income and realized gains and losses under GAAP and tax reporting:
| | | | | | | | | | | | | |
| | | Net Investment
| | | Realized
| | | Capital
| |
| | | Income (Loss) | | | Gain (Loss) | | | Stock | |
| |
| HCM Freedom Fund | | $ | — | | | $ | — | | | $ | — | |
| Spectrum Select Alternative Fund | | | 529,217 | | | | (555,347 | ) | | | 26,130 | |
| Spectrum Global Perspective Fund | | | 174,275 | | | | (1,270 | ) | | | (173,005 | ) |
| Spectrum Equity Opportunity Fund | | | 128,640 | | | | 866 | | | | (129,506 | ) |
Net investment income and realized gains and losses for federal income tax purposes may differ from that reported on the financial statements because of permanent book-to-tax differences. GAAP requires that permanent differences in net investment income and realized gains and losses due to differences between financial reporting and tax reporting be reclassified between various components of net assets. The permanent differences primarily relate to swap contract adjustments, net operating losses, dividend reclasses, and dividends on redemption adjustments with differing book and tax methods.
In order to meet certain excise tax distribution requirements, the Funds are required to measure and distribute annually, net capital gains realized during a twelve-month period ending October 31. In connection with this, the Funds are permitted for tax purposes to defer into their next fiscal year any net capital losses incurred between November 1 and the end of their fiscal year, August 31, 2010.
At August 31, 2010, no funds deferred, on a tax basis, post-October losses.
At August 31, 2010, the following funds had capital loss carryforwards on a tax basis of:
| | | | | | | | | | | | | | | | | | | | | | | | | |
| | | Expires | |
| | | 8/31/2014 | | | 8/31/2015 | | | 8/31/2016 | | | 8/31/2017 | | | 8/31/2018 | | | Total | |
| |
| HCM Freedom Fund | | $ | 7,134,932 | | | $ | 5,679,579 | | | $ | 1,637,612 | | | $ | 5,404,099 | | | $ | — | | | $ | 19,856,222 | |
| Spectrum Select Alternative Fund | | | — | | | | — | | | | — | | | | — | | | | — | | | | — | |
| Spectrum Global Perspective Fund | | | — | | | | — | | | | — | | | | 14,988,713 | | | | 1,648,038 | | | | 16,636,751 | |
| Spectrum Equity Opportunity Fund | | | — | | | | — | | | | — | | | | 3,256,865 | | | | — | | | | 3,256,865 | |
| | | | | | | | | | | | | | �� | | | | | | | | | | | |
Capital Loss Utilized: | | | 8/31/2010 | | | | | | | | | | | | | | | | | | | | | |
| | | | | | | | | | | | | | | | | | | | | | | | | |
| HCM Freedom Fund | | $ | 1,707,285 | | | | | | | | | | | | | | | | | | | | | |
| Spectrum Select Alternative Fund | | | 3,209,391 | | | | | | | | | | | | | | | | | | | | | |
| Spectrum Equity Opportunity Fund | | | 1,167,325 | | | | | | | | | | | | | | | | | | | | | |
To the extent the Funds realize future net capital gains, those gains will be offset by any unused capital loss carryover.
The Funds have adopted authoritative financial reporting rules regarding recognition and measurement of tax positions taken or expected to be taken on a tax return. The Funds have reviewed all open tax years and concluded that there is no effect to the Funds’ financial positions or results of operations and no tax liability resulting from unrecognized tax benefits relating to uncertain income tax position take or expected to be taken on a tax return. Open tax years are those years that are open for examination by the relevant income taxing authority. As of August 31, 2010, open Federal and state income tax years include the tax years ended August 31, 2007, August 31, 2008, August 31, 2009 and August 31, 2010. The Funds have no examination in progress. The Funds are also not aware of any tax positions for which it is reasonably possible that the total amounts of unrecognized tax expense will significantly change in twelve months.
DIREXION ANNUAL REPORT 27
l) Credit Facility – U.S. Bank, N.A. has made available to Funds, with the exception of the HCM Freedom Fund, a credit facility pursuant to a Line of Credit Agreement (“Line of Credit”) for meeting redemption requests. The Funds did not utilize the Line of Credit during the year ended August 31, 2010:
| | | | | | | | | | | | | | | | | | | | | | | |
| | | | | | | | | Maximum Amount
| | | | | | | | | |
| | | Available Borrowing
| | | Outstanding
| | | Outstanding during the
| | | Average
| | | | | | |
| | | (Lesser of 33 1/3% of
| | | Balance as of
| | | Year Ended
| | | Daily
| | | Interest
| | | Borrowings
|
| | | Fund’s Net Assets or) | | | August 31, 2010 | | | August 31, 2010 | | | Balance | | | Expense | | | Charged At |
| |
| Spectrum Select Alternative Fund | | $ | 5,875,000 | | | $ | — | | | $ | — | | | $ | — | | | $ | — | | | Prime Rate less 1/2% |
| Spectrum Global Perspective Fund | | | 2,400,000 | | | | — | | | | — | | | | — | | | | — | | | Prime Rate less 1/2% |
| Spectrum Equity Opportunity Fund | | | 575,000 | | | | — | | | | — | | | | — | | | | — | | | Prime Rate less 1/2% |
m) Guarantees and Indemnifications – In the ordinary course of business, the Funds enter into contracts that contain a variety of indemnification provisions pursuant to which the Funds agree to indemnify third parties upon occurrence of specified events. The Fund’s maximum exposure relating to these indemnification agreements is unknown. However, the Funds have not had prior claims or losses in connection with these provisions and believe the risk of loss is remote.
n) Use of Estimates – The preparation of financial statements in conformity with U.S. generally accepted accounting principals requires management to make estimates and assumptions that affect the reported amounts of assets and liabilities and disclosure of contingent assets and liabilities at the date of the financial statements and the reported amounts of revenues and expenses during the reporting period. Actual results could differ from those estimates.
| |
| 3. | CAPITAL SHARE TRANSACTIONS |
Capital share transactions for the Funds during the years ended August 31, 2010 and August 31, 2009 were as follows:
| | | | | | | | | | | | | | | | | |
| | | HCM Freedom Fund | | | Spectrum Select Alternative Fund | |
| | | Year Ended
| | | Year Ended
| | | Year Ended
| | | Year Ended
| |
| | | August 31,
| | | August 31,
| | | August 31,
| | | August 31,
| |
| | | 2010 | | | 2009 | | | 2010 | | | 2009 | |
| |
| Shares sold | | | 161,023 | | | | 155,044 | | | | 844,076 | | | | 448,807 | |
| Shares issued in reinvestment of distributions | | | 100,636 | | | | 71,861 | | | | 63,328 | | | | 30,842 | |
| Shares redeemed | | | (164,568 | ) | | | (223,503 | ) | | | (253,230 | ) | | | (463,856 | ) |
| | | | | | | | | | | | | | | | | |
| Total net increase (decrease) from capital share transactions | | | 97,091 | | | | 3,402 | | | | 654,174 | | | | 15,793 | |
| | | | | | | | | | | | | | | | | |
| | | | | | | | | | | | | | | | | |
| | | Spectrum Global Perspective Fund | | | Spectrum Equity Opportunity Fund | |
| | | Year Ended
| | | Year Ended
| | | Year Ended
| | | Year Ended
| |
| | | August 31,
| | | August 31,
| | | August 31,
| | | August 31,
| |
| | | 2010 | | | 2009 | | | 2010 | | | 2009 | |
| |
| Shares sold | | | 318,983 | | | | 207,597 | | | | 152,667 | | | | 66,774 | |
| Shares issued in reinvestment of distributions | | | 419 | | | | 794 | | | | 3,630 | | | | 120 | |
| Shares redeemed | | | (919,677 | ) | | | (1,284,176 | ) | | | (131,967 | ) | | | (226,511 | ) |
| | | | | | | | | | | | | | | | | |
| Total net increase (decrease) from capital share transactions | | | (600,275 | ) | | | (1,075,785 | ) | | | 24,330 | | | | (159,617 | ) |
| | | | | | | | | | | | | | | | | |
| |
| 4. | INVESTMENT TRANSACTIONS |
During the year ended August 31, 2010, the aggregate purchases and sales of investments (excluding short-term investments, swaps and futures contracts) were:
| | | | | | | | | | | | | | | | | |
| | | | | | Spectrum
| | | Spectrum
| | | Spectrum
| |
| | | HCM
| | | Select
| | | Global
| | | Equity
| |
| | | Freedom
| | | Alternative
| | | Perspective
| | | Opportunity
| |
| | | Fund | | | Fund | | | Fund | | | Fund | |
| |
| Purchases | | $ | 114,738,147 | | | $ | 70,562,749 | | | $ | 434,618,735 | | | $ | 76,052,553 | |
| Sales | | $ | 110,755,962 | | | $ | 59,583,709 | | | $ | 476,269,061 | | | $ | 85,945,207 | |
28 DIREXION ANNUAL REPORT
| |
| 5. | INVESTMENT ADVISORY AND OTHER AGREEMENTS |
Investment Advisory Agreement: The Funds have entered into an investment advisory agreement with the Adviser. The Adviser receives a fee, computed daily and payable monthly, applied to each Fund’s average daily net assets at the annual rates presented below:
| | | | | |
| HCM Freedom Fund | | | 1.00% | |
| Spectrum Select Alternative Fund | | | 1.00% | |
| Spectrum Global Perspective Fund | | | 1.00% | |
| Spectrum Equity Opportunity Fund | | | 1.00% | |
In addition, the Adviser has entered into sub-advisory agreements with Horizon Capital Management, Inc. for the HCM Freedom Fund, and with Hundredfold Advisors, LLC for the Spectrum Select Alternative Fund, the Spectrum Global Perspective Fund and the Spectrum Equity Opportunity Fund whereby each sub-advisor will direct investment activities of their respective Funds. The Adviser pays, out of the management fees it receives from these funds, a fee for these sub-advisory services.
Operating Services Agreement: The Funds have entered into an Operating Services Agreement (the “Agreement”) with the Adviser. Under the Agreement, the Adviser will be responsible for all expenses of the Trust except the following: management fees, distribution and/or service fees, acquired fund fees, taxes, leverage interest, dividends or interest on short positions, other interest expenses, brokerage commission and other extraordinary expenses outside the typical day-to-day operations of the Funds.
| | | | | |
| HCM Freedom Fund | | | 0.55% | |
| Spectrum Select Alternative Fund | | | 0.55% | |
| Spectrum Global Perspective Fund | | | 0.55% | |
| Spectrum Equity Opportunity Fund | | | 0.55% | |
Distribution Expenses: Shares are subject to an annual Rule 12b-1 fee of 0.80% for the HCM Freedom Fund, and up to 1.00% of the average daily net assets for the Spectrum Select Alternative Fund, the Spectrum Global Perspective Fund and the Spectrum Equity Opportunity Fund.
Rafferty Capital Markets, LLC (the “Distributor”) serves as principal underwriter of the Funds and acts as the Funds’ distributor in a continuous public offering of the Funds’ shares. There were no Rule 12b-1 fees retained by the Distributor for the year ended August 31, 2010. The Distributor is an affiliate of the Adviser.
| |
| 6. | VALUATION MEASUREMENTS |
The Funds have adopted authoritative fair valuation accounting standards which establish an authoritative definition of fair value and set out a hierarchy for measuring fair value. These standards require additional disclosures about the various inputs and valuation techniques used to develop the measurements of fair value and a discussion in changes in valuation techniques and related inputs during the period. These inputs are summarized in the three broad levels listed below:
Level 1 – Quoted prices in active markets for identical securities
Level 2 – Evaluated price based on other significant observable inputs (including quoted prices for similar securities, interest rates, prepayment speeds, credit risk, etc.)
Level 3 – Significant unobservable inputs (including the Fund’s own assumptions in determining fair value of investments)
The inputs or methodology used for valuing securities are not an indication of the credit risk associated with investing in those securities.
DIREXION ANNUAL REPORT 29
The follow is a summary of the inputs used to value the Fund’s net assets as of August 31, 2010:
| | | | | | | | | | | | | | | | | |
| | | HCM Freedom Fund | |
Asset Class | | Level 1 | | | Level 2 | | | Level 3 | | | Total | |
| |
Investment Companies — Fixed Income | | $ | 27,855,518 | | | $ | — | | | $ | — | | | $ | 27,855,518 | |
Short-Term Investments | | $ | 90,378 | | | $ | — | | | $ | — | | | $ | 90,378 | |
| | | | | | | | | | | | | | | | | |
| | | Spectrum Select Alternative Fund | |
Asset Class | | Level 1 | | | Level 2 | | | Level 3 | | | Total | |
| |
Investment Companies — Equity | | $ | 12,148,764 | | | $ | — | | | $ | — | | | $ | 12,148,764 | |
Investment Companies — Fixed Income | | $ | 27,961,202 | | | $ | — | | | $ | — | | | $ | 27,961,202 | |
Short-Term Investments | | $ | 5,071,166 | | | $ | — | | | $ | — | | | $ | 5,071,166 | |
Other Financial Instruments* | | $ | — | | | $ | 26,185 | | | $ | — | | | $ | 26,185 | |
| | | | | | | | | | | | | | | | | |
| | | Spectrum Global Perspective Fund | |
Asset Class | | Level 1 | | | Level 2 | | | Level 3 | | | Total | |
| |
Investment Companies — Equity | | $ | 4,130,840 | | | $ | — | | | $ | — | | | $ | 4,130,840 | |
Short-Term Investments | | $ | 45,068,053 | | | $ | — | | | $ | — | | | $ | 45,068,053 | |
Other Financial Instruments* | | $ | — | | | $ | 357,388 | | | $ | — | | | $ | 357,388 | |
| | | | | | | | | | | | | | | | | |
| | | Spectrum Equity Opportunity Fund | |
Asset Class | | Level 1 | | | Level 2 | | | Level 3 | | | Total | |
| |
Short-Term Investments | | $ | 13,666,392 | | | $ | — | | | $ | — | | | $ | 13,666,392 | |
Other Financial Instruments* | | $ | (102,547 | ) | | $ | — | | | $ | — | | | $ | (102,547 | ) |
For further detail on each asset class, see Schedule of Investments.
| | |
| * | | Other financial instruments are derivative instruments not reflected in the Schedule of Investments, such as futures and swap contracts. Futures and swap contracts are valued at the unrealized appreciation (depreciation) on the instrument. |
There were no significant transfers between Level 1 and Level 2 securities during the year ended August 31, 2010.
| |
| 7. | ADDITIONAL DISCLOSURES ABOUT DERIVATIVE INSTRUMENTS |
The Funds have adopted authoritative standards of accounting for derivative instruments which establish disclosure requirement for derivative instruments. These standards improve financial reporting for derivative instruments by requiring enhanced disclosures that enables investors to understand how and why a fund uses derivatives instruments, how derivatives instruments are accounted for and how derivative instruments affect a fund’s financial position and results of operations.
The Funds use derivative instruments as part of their principal investment strategy to achieve their investment objective. For additional discussion on the risks associated with derivative instruments refer to Note 2. As of August 31, 2010, the Funds were invested in futures contracts and equity swap contracts.
At August 31, 2010, the fair value of derivatives instruments were as follows:
| | | | | | | | | | | |
| Asset derivatives1 | |
| | | | | Equity risk | | | Total | |
| | |
| |
| Spectrum Select Alternative Fund | | Swap contracts | | $ | 26,185 | | | $ | 26,185 | |
| | | |
| | | |
| | | Total | | $ | 26,185 | | | $ | 26,185 | |
| |
| |
| Spectrum Global Perspective Fund | | Swap contracts | | $ | 357,388 | | | $ | 357,388 | |
| | | |
| | | |
| | | Total | | $ | 357,388 | | | $ | 357,388 | |
| |
| |
| | |
| 1 | | Statement of Assets and Liabilities location: Unrealized appreciation on swaps. |
30 DIREXION ANNUAL REPORT
| | | | | | | | | | | |
| Liability derivatives1 | |
| | | | | Equity risk | | | Total | |
| | |
| |
| Spectrum Equity Opportunity Fund | | Futures contracts* | | $ | 102,547 | | | $ | 102,547 | |
| | | |
| | | |
| | | Total | | $ | 102,547 | | | $ | 102,547 | |
| |
| |
| | |
| 1 | | Statement of Assets and Liabilities location: Variation margin payable. |
| * | | Cumulative appreciation (depreciation) of futures contracts as reported in the Schedule of Investments. |
| | Only current day’s variation margin, if any, is reported within the Statement of Assets and Liabilities. |
Transactions in derivative instruments during the six months ended August 31, 2010, were as follows:
| | | | | | | | | | | |
| | |
| | | | | Equity risk | | | Total | |
| | |
| |
| HCM Freedom Fund | | Realized gain (loss)1 | | | | | | | | |
| | | Futures contracts | | $ | 101,463 | | | $ | 101,463 | |
| | | Swap contracts | | | (831,275 | ) | | | (831,275 | ) |
| | | |
| | | |
| | | Total realized gain (loss) | | $ | (729,812 | ) | | $ | (729,812 | ) |
| | | |
| | | |
| | | Change in unrealized appreciation (depreciation)2 | | | | | | | | |
| | | Futures contracts | | $ | — | | | $ | — | |
| | | Swap contracts | | | — | | | | — | |
| | | |
| | | |
| | | Total change in unrealized appreciation (depreciation) | | $ | — | | | $ | — | |
| |
| |
| Spectrum Select Alternative Fund | | Realized gain (loss)1 | | | | | | | | |
| | | Futures contracts | | $ | 56,324 | | | $ | 56,324 | |
| | | Swap contracts | | | 695,302 | | | | 695,302 | |
| | | |
| | | |
| | | Total realized gain (loss) | | $ | 751,626 | | | $ | 751,626 | |
| | | |
| | | |
| | | Change in unrealized appreciation (depreciation)2 | | | | | | | | |
| | | Futures contracts | | $ | (5,233 | ) | | $ | (5,233 | ) |
| | | Swap contracts | | | 7,061 | | | | 7,061 | |
| | | |
| | | |
| | | Total change in unrealized appreciation (depreciation) | | $ | 1,828 | | | $ | 1,828 | |
| |
| |
| Spectrum Global Perspective Fund | | Realized gain (loss)1 | | | | | | | | |
| | | Futures contracts | | $ | 1,278,082 | | | $ | 1,278,082 | |
| | | Swap contracts | | | (2,458,595 | ) | | | (2,458,595 | ) |
| | | |
| | | |
| | | Total realized gain (loss) | | $ | (1,180,513 | ) | | $ | (1,180,513 | ) |
| | | |
| | | |
| | | Change in unrealized appreciation (depreciation)2 | | | | | | | | |
| | | Swap contracts | | $ | 3,869 | | | $ | 3,869 | |
| | | |
| | | |
| | | Total change in unrealized appreciation (depreciation) | | $ | 3,869 | | | $ | 3,869 | |
| |
| |
| Spectrum Equity Opportunity Fund | | Realized gain (loss)1 | | | | | | | | |
| | | Futures contracts | | $ | 247,325 | | | $ | 247,325 | |
| | | Swap contracts | | | 5,593 | | | | 5,593 | |
| | | |
| | | |
| | | Total realized gain (loss) | | $ | 252,918 | | | $ | 252,918 | |
| | | |
| | | |
| | | Change in unrealized appreciation (depreciation)2 | | | | | | | | |
| | | Futures contracts | | $ | (139,483 | ) | | $ | (139,483 | ) |
| | | Swap contracts | | | (7,927 | ) | | | (7,927 | ) |
| | | |
| | | |
| | | Total change in unrealized appreciation (depreciation) | | $ | (147,410 | ) | | $ | (147,410 | ) |
| |
| |
| | |
| 1 | | Statement of Operations location: Net unrealized gain (loss) on futures and swaps. |
| 2 | | Statement of Operations location: Change in unrealized appreciation (depreciation) on futures and swaps. |
For the year ended August 31, 2010, the volume of the derivatives held by the Funds were as follows:
| | | | | | | | | | | | | | | | | |
| | | Quarterly Average Gross Notional Amounts | |
| | | Long Futures
| | | Short Futures
| | | Long Equity Swaps
| | | Short Equity Swaps
| |
| | | Contracts | | | Contracts | | | Contracts | | | Contracts | |
| |
| HCM Freedom Fund | | $ | — | | | $ | — | | | $ | — | | | $ | 100,143 | |
| Spectrum Select Alternative Fund | | | 396,145 | | | | 282,585 | | | | 5,138,780 | | | | — | |
| Spectrum Global Perspective Fund | | | 2,199,692 | | | | — | | | | 3,100,634 | | | | — | |
| Spectrum Equity Opportunity Fund | | | 4,675,913 | | | | — | | | | 264,811 | | | | — | |
DIREXION ANNUAL REPORT 31
The Funds utilized this volume of derivatives as a substitute for investing in comparable positions in underlying securities and/or as a means to limit exposure of a Fund’s position. During the year ended August 31, 2010, the HCM Freedom Fund sporadically invested in swap contracts with the majority of activity occurring in the middle part of the year. The Spectrum Select Alternative Fund maintained a consistent investment in long equity swap contracts though more pronounced towards the end of the year. The Spectrum Global Perspective Fund and the Spectrum Equity Opportunity Fund investments in long equity swap contracts occurred closer to the beginning of the year. The three Spectrum Funds maintain investments in long futures contracts throughout the year.
| |
| 8. | NEW ACCOUNTING PRONOUNCEMENT |
In January 2010, the Financial Accounting Standards Board issued an update to improve disclosure about fair value measurements. This update required additional disclosures regarding fair value measurements. Specifically, the amendment requires reporting entities to disclose a) the input and valuation techniques used to measure fair value for both recurring and nonrecurring fair value measurements, for Level 2 or Level 3 positions, b) transfers between all levels (including Level 1 and Level 2) will be required to be disclosed on a gross basis (i.e. transfers out must be disclosed separately from transfers in) as well as the reason(s) for the transfers and c) purchases and sales must be shown on a gross basis in the Level 3 rollforward rather than as one net number.
The effective date of this guidance is for interim and annual periods beginning after December 15, 2009; however, the requirement to provide the Level 3 activity for purchases and sales on a gross basis will be effective for interim and annual periods beginning after December 15, 2010. The Funds have disclosed the applicable requirements of the accounting standard in their financial statements.
The Funds have adopted authoritative standards for accounting for and disclosure of events that occur after the balance sheet date but before financial statements are issued or are available to be issued. These standards require the Funds to recognize in the financial statements the effects of all recognized subsequent events that provide additional evidence about conditions that existed at the date of the balance sheet. For nonrecognized subsequent events that must be disclosed to keep the financial statements from being misleading, the Funds are required to disclose the nature of the event as well as an estimate of its financial effect, or a statement that such an estimate cannot be made. The Funds have evaluated subsequent events through the issuance of the Funds’ financial statements and have determined there is no impact to the Funds’ financial statements.
32 DIREXION ANNUAL REPORT
Direxion Funds
Report of Independent Registered Public Accounting Firm
To the Shareholders and
Board of Trustees of the Direxion Funds:
We have audited the accompanying statements of assets and liabilities of the HCM Freedom Fund, Spectrum Select Alternative Fund, Spectrum Global Perspective Fund, and Spectrum Equity Opportunity Fund, (four of the series of the Direxion Funds) (the “Funds”), including the schedules of investments, as of August 31, 2010, and the related statements of operations for the year then ended, the statements of changes in net assets for each of the two years in the period then ended, and the financial highlights for each of the five years in the period then ended. These financial statements and financial highlights are the responsibility of the Funds’ management. Our responsibility is to express an opinion on these financial statements and financial highlights based on our audits.
We conducted our audits in accordance with the standards of the Public Company Accounting Oversight Board (United States). Those standards require that we plan and perform the audit to obtain reasonable assurance about whether the financial statements and financial highlights are free of material misstatement. We were not engaged to perform an audit of the Funds’ internal control over financial reporting. Our audits included consideration of internal control over financial reporting as a basis for designing audit procedures that are appropriate in the circumstances, but not for the purpose of expressing an opinion on the effectiveness of the Funds’ internal control over financial reporting. Accordingly, we express no such opinion. An audit also includes examining, on a test basis, evidence supporting the amounts and disclosures in the financial statements and financial highlights, assessing the accounting principles used and significant estimates made by management, and evaluating the overall financial statement presentation. Our procedures included confirmation of securities owned as of August 31, 2010, by correspondence with the custodian and brokers or by other appropriate auditing procedures where replies from brokers were not received. We believe that our audits provide a reasonable basis for our opinion.
In our opinion, the financial statements and financial highlights referred to above present fairly, in all material respects, the financial position of the above mentioned four series of Direxion Funds at August 31, 2010, the results of their operations for the year then ended, the changes in their net assets for each of the two years in the period then ended, and the financial highlights for each of the five years in the period then ended, in conformity with U.S. generally accepted accounting principles.
New York, New York
October 22, 2010
DIREXION ANNUAL REPORT 33
Additional Information
(Unaudited)
For the year ended August 31, 2010, certain dividends paid by the Funds may be subject to a maximum tax rate of 15%, as provided for by the Jobs and Growth Tax Relief Reconciliation Act of 2003. The percentage of dividends declared from ordinary income designated as qualified income was follows:
| | | | | |
| HCM Freedom Fund | | | 100 | % |
| Spectrum Select Alternative Fund | | | 70.7 | % |
| Spectrum Global Perspective Fund | | | 0 | % |
| Spectrum Equity Opportunity Fund | | | 0 | % |
For corporate shareholders, the percent of ordinary income distributions qualifying for the corporate dividends received deduction for the year ended August 31, 2010 was as follows:
| | | | | |
| HCM Freedom Fund | | | 100 | % |
| Spectrum Select Alternative Fund | | | 70.7 | % |
| Spectrum Global Perspective Fund | | | 0 | % |
| Spectrum Equity Opportunity Fund | | | 0 | % |
HOUSEHOLDING
In an effort to decrease costs, the Funds intend to reduce the number of duplicate prospectuses, Annual and Semi-Annual Reports, proxy statements and other similar documents you receive by sending only one copy of each to those addresses shared by two or more accounts and to shareholders we reasonably believe are from the same family or household. Householding begins once you have signed your account application. After such time, if you would like to discontinue householding for your accounts, please call toll-free at (800) 851-0511 to request individual copies of these documents. Once the Funds receive notice to stop householding, we will begin sending individual copies thirty days after receiving your request. This policy does not apply to account statements.
34 DIREXION ANNUAL REPORT
Investment Advisory and Subadvisory Agreements Approvals
Provided below is a summary of certain of the factors the Board considered at its August 18, 2010 Board meeting in renewing, as applicable: (1) the Advisory Agreement between Rafferty Asset Management (“Rafferty”) and the Direxion Funds (the “Trust”), on behalf of the HCM Freedom Fund, Spectrum Equity Opportunity Fund, Spectrum Global Perspective Fund and Spectrum Select Alternative Fund, each a series of the Trust; (2) the Subadvisory Agreement between Rafferty and Horizon Capital Management, Inc. (“Horizon”) on behalf of the HCM Freedom Fund; and (3) the Subadvisory Agreement between Rafferty and Hundredfold Advisors, LLC (“Hundredfold”) on behalf of the Spectrum Equity Opportunity Fund, Spectrum Global Perspective Fund and Spectrum Select Alternative Fund. Each Fund listed above is referred to herein as each “Fund” and collectively, the “Funds.”
The Board did not identify any particular information that was most relevant to its consideration to approve each Advisory or Subadvisory Agreement (each an “Agreement” and collectively, the “Agreements”) and each Trustee may have afforded different weight to the various factors. In determining whether to approve the continuance of the Agreements, the Board considered the best interests of each Fund separately. In addition, the Board noted that the Trustees have considered various reports and information provided throughout the year at their regular Board meetings and otherwise. While the Agreements for all of the Funds were considered at the same Board meeting, the Board considered each Fund’s investment advisory and subadvisory relationship separately. In each instance, the Board considered, among other things, the following factors: (1) the nature and quality of the services provided; (2) the investment performance of the Fund to the extent applicable; (3) the cost to Rafferty or a subadviser for providing services and the profitability of the advisory business to Rafferty or a subadviser, if such information was provided; (4) the extent to which economies of scale have been taken into account in setting fee schedules; (5) whether fee levels reflect these economies of scale, if any, for the benefit of Fund shareholders; (6) comparisons of services and fees with contracts entered into by Rafferty and, in certain cases, a subadviser with other clients (such as pension funds and other institutional investors), if any; and (7) other benefits derived or anticipated to be derived by Rafferty or a subadviser from its relationship with the Funds.
Nature, Extent and Quality of Services Provided. The Board reviewed the nature, extent and quality of the services provided or to be provided under the Advisory Agreements by Rafferty. The Board noted that Rafferty has provided services to the Trusts since their inception and has developed an expertise in managing the Funds. The Board also noted that Rafferty trades efficiently with low commission schedules, which helps improve performance results. The Board considered Rafferty’s representation that it has the financial resources and appropriate staffing to manage the Funds and meet its expense reimbursement obligations, if any. The Board also considered that Rafferty utilizes the services of an independent compliance consulting firm and that reports from the chief compliance officer are provided to the Board at its regularly scheduled quarterly Board meetings. The Board considered that Rafferty oversees all aspects of the operation of the Funds, including oversight of the Funds’ service providers and subadvisers. Regarding the Subadvisory Agreements with Horizon and Hundredfold, the Board noted that each subadviser utilizes those Funds it subadvises as the primary investments for its separate account clients. Based on these and other considerations, the Board determined that, in the exercise of its business judgment, the nature, extent and quality of the services provided by Rafferty to the Funds under the Agreements and each subadviser under the applicable Subadvisory Agreement were fair and reasonable.
Performance of the Funds. The Board evaluated the performance of each Fund relative to: (1) its benchmark index for monthly and annual periods ended July 31, 2010, where applicable; and (2) the average performance of the relevant Lipper fund universe for monthly and annual periods ended June 30, 2010. Although the Board received monthly performance reports for its consideration, the Board generally assigned more weight to the longer-term performance of the Funds. In this regard, the Board for all Funds noted the challenging nature of the markets for the calendar years 2008 and 2009.
With respect to the HCM Freedom Fund, the Board considered management’s description of the performance of the Lipper universe of flexible portfolio funds. The Board also considered that: (1) as of July 31, 2010, the Fund outperformed its benchmark index for the three-month, year-to-date, three- and five-year periods, and underperformed for the one-, six-, nine-month and one-year periods; and (2) as of June 30, 2010, the Fund outperformed the average of the relevant Lipper fund universe for all periods presented. The Board noted that the Fund’s six-month and three-year performance records were ranked first in its Lipper fund universe.
With respect to the Spectrum Equity Opportunity Fund, the Board considered management’s description of the performance of the Lipper universe of specialty diversified equity funds. The Board also considered that: (1) as of July 31, 2010, the Fund
DIREXION ANNUAL REPORT 35
outperformed its benchmark index for the three-month, year-to date and three year-periods, and underperformed for all other periods presented; and (2) as of June 30, 2010, the Fund outperformed the average of the relevant Lipper fund universe for all periods presented with the exception of the six-month and one-year periods, during which it underperformed.
With respect to the Spectrum Global Perspective Fund, the Board considered management’s description of the performance of the Lipper universe of global flexible funds. The Board also considered that: (1) as of July 31, 2010, the Fund outperformed its benchmark index for the three-month, three- and five-year periods, and underperformed for all other periods presented; and (2) as of June 30, 2010, the Fund outperformed the average of the relevant Lipper fund universe for the three-month period, and underperformed for the six-month, one- and three-year periods. The Board noted Hundredfold’s representation that the Fund in part underperformed due to its reduced market exposure during periods of market volatility.
With respect to the Spectrum Select Alternative Fund, the Board considered management’s description of the performance of the Lipper universe of high current yield funds. The Board also considered that: (1) as of July 31, 2010, the Fund outperformed its benchmark index for the one-, six- and nine-month, and one- and five-year periods, and underperformed for the three-month, year-to-date and three-year periods; and (2) as of June 30, 2010, the Fund underperformed the average of the relevant Lipper fund universe for all periods presented. The Board noted Hundredfold’s representation that, within the last 12-month period, the Fund took defensive positions, including large positions in cash, that detracted from its investment performance.
Costs of Services Provided to the Funds and Profits Realized. The Board considered the overall fees paid to Rafferty on an annual basis since each Fund’s commencement of operations, including any fee waivers and recoupment of fees previously waived. The Board considered the overall profitability of Rafferty’s investment business and its representation that it does not allocate internal costs and assess profitability with respect to its services to individual Funds. Based on these considerations, the Board determined that, in the exercise of its business judgment, the costs of the services provided and the profits realized under the Advisory Agreement were fair and reasonable.
In considering the fees paid by Rafferty to the subadvisers of the Funds, the Board considered Rafferty’s representation that the fees and expenses generally are higher than industry averages. However, Rafferty explained that, in certain cases, the Funds help to lower the overall fees paid by the clients of the subadvisers. The Board considered the representation that the current expense ratio of each Fund is lower compared to the total cost of investing when the Funds were part of the subadvisers’ wrap account advisory programs. The Board noted the subadvisers’ representations that the Funds pay the lowest fee rate that a subadvisor charges for comparable client accounts. With respect to each Fund, the Board considered each subadviser’s profits or losses for its services, to the extent such information was provided. In this regard, the Board noted Hundredfold’s representation that it donated to charity all of the profits it earned with respect to the services it provided to the Spectrum Funds and Horizon’s pre-tax profits with respect to the services it provided to the HCM Freedom Fund. Based on these considerations, the Board determined that, in the exercise of its business judgment, the costs of the services provided and the profits realized under the Agreements were fair and reasonable.
Economies of Scale. The Board considered Rafferty’s representation that it believes that asset levels at this time are not sufficient to achieve economies of scale or warrant a reduction in fee rates or the addition of breakpoints. Rafferty noted that it was continuing to work on its sales and marketing efforts to raise additional assets. Based on these and other considerations, the Board determined that, in the exercise of its business judgment, the reduction in fee rates or additions of breakpoints were not necessary at this time.
Other Benefits. The Board considered Rafferty’s representation that its relationship with the Funds has permitted Rafferty to attract business to its non-mutual fund account. The Board also considered that Rafferty’s overall business with brokerage firms helps to lower commission rates and provide better execution for Fund portfolio transactions. The subadvisers represented that they realized no benefits other than their direct compensation. Based on these and other considerations, the Board determined that, in the exercise of its business judgment, the benefits were fair and reasonable.
Conclusion. Based on, but not limited to, the above considerations and determinations, the Board determined that the Agreements for the Funds were fair and reasonable in light of the services to be performed, fees, expenses and such other matters as the Board considered relevant in the exercise of its business judgment. On this basis, the Board unanimously voted in favor of the continuance of the Agreements.
36 DIREXION ANNUAL REPORT
Direxion Funds
TRUSTEES AND OFFICERS
The business affairs of each Fund are managed by or under the direction of the Board of Trustees. Information pertaining to the Trustees and Officers of the Funds is set forth below. The SAI includes additional information about the Funds’ Trustee and Officers and is available without charge, upon request by calling 1-800-851-0511.
Interested Trustees
| | | | | | | | | | | | | |
| | | | | | | | | # of Portfolios
| | | |
| | | | | | | | | in Direxion
| | | |
| | | Position(s)
| | Term of Office
| | | | Complex
| | | Other Trusteeships/
|
| | | Held with
| | and Length of
| | Principal Occupation(s)
| | Overseen by
| | | Directorships Held
|
Name, Address and Age | | Fund | | Time Served | | During Past Five Years | | Trustee(2) | | | by Trustee |
Lawrence C. Rafferty(1) | | | | | | | | | | | | |
| Age: 68 | | Chairman of the Board of Trustees | | Lifetime of Trust until removal or resignation; Since 1997 | | Chairman and Chief Executive Officer of Rafferty, 1997-present; Chief Executive Officer of Rafferty Companies, LLC, 1996-present; Chief Executive Officer of Rafferty Capital Markets, Inc., 1995-present. | | | 135 | | | Board of Trustees, Fairfield University; Board of Directors, St. Vincent’s Services; Executive Committee, Metropolitan Golf Association |
| | | | | | | | | | | | | |
Non-Interested Trustees
| | | | | | | | | | | | | |
| | | | | | | | | # of Portfolios
| | | |
| | | | | | | | | in Direxion
| | | |
| | | Position(s)
| | Term of Office
| | | | Complex
| | | Other Trusteeships/
|
| | | Held with
| | and Length of
| | Principal Occupation(s)
| | Overseen by
| | | Directorships Held
|
Name, Address and Age | | Fund | | Time Served | | During Past Five Years | | Trustee(2) | | | by Trustee |
| Daniel J. Byrne | | | | | | | | | | | | |
| Age: 66 | | Trustee | | Lifetime of Trust until removal or resignation; Since 1997 | | President and Chief Executive Officer of Byrne Securities Inc., 1992-present. | | | 135 | | | Trustee, The Opening Word Program, Wyandanch, New York |
| | | | | | | | | | | | | |
| Gerald E. Shanley III | | | | | | | | | | | | |
| Age: 66 | | Trustee | | Lifetime of Trust until removal or resignation; Since 1997 | | Business Consultant, 1985-present; C.P.A. 1979-present. | | | 135 | | | Trustee of Trust Under Will of Charles S. Payson |
| | | | | | | | | | | | | |
| John Weisser | | | | | | | | | | | | |
| Age: 68 | | Trustee | | Lifetime of Trust until removal or resignation; Since 2007 | | Retired, Since 1995; Salomon Brothers, Inc, 1971-1995, most recently as Managing Director. | | | 135 | | | Director, MainStay VP Fund Series; Director ICAP Funds, Inc; Director, The MainStay Funds; Director, Eclipse Funds, Inc. |
| | | | | | | | | | | | | |
DIREXION ANNUAL REPORT 37
Direxion Funds
TRUSTEES AND OFFICERS
Officers
| | | | | | | | | | | | | |
| | | | | | | | | # of Portfolios
| | | |
| | | | | | | | | in Direxion
| | | |
| | | Position(s)
| | Term of Office
| | | | Complex
| | | Other Trusteeships/
|
| | | Held with
| | and Length of
| | Principal Occupation(s)
| | Overseen by
| | | Directorships Held
|
Name, Address and Age | | Fund | | Time Served | | During Past Five Years | | Trustee(2) | | | by Trustee |
| Daniel D. O’Neill | | | | | | | | | | | | |
| Age: 42 | | President; Chief Operating Officer and Chief Investment Officer | | One Year; Since 1999
One Year; Since 2006 | | Managing Director of Rafferty,
1999-present. | | | N/A | | | N/A |
| | | | | | | | | | | | | |
| William Franca | | | | | | | | | | | | |
| Age: 53 | | Executive Vice President – Head of Distribution | | One Year; Since 2006 | | Senior Vice President – National Sales, Massachusetts Financial Services/SunLife Financial Distributors, 2002-2004; Executive Vice President, Distribution, SunLife, 2001-2002. | | | N/A | | | N/A |
| | | | | | | | | | | | | |
| Christopher Lewis | | | | | | | | | | | | |
| Age: 39 | | Chief Compliance Officer | | One Year; Since 2009 | | Director, Alaric Compliance Services, LLC, 2009 – present; Partner, Thacher Proffitt & Wood LLP, 2004-2008; Partner, Simmons & Simmons, 2002-2004. | | | N/A | | | N/A |
| | | | | | | | | | | | | |
Patrick J. Rudnick
615 East
Michigan Street
Milwaukee, WI 53202 | | | | | | | | | | | | |
| Age: 37 | | Principal Financial Officer and Treasurer(3) | | One Year; Since 2010 | | Vice President, U.S. Bancorp Fund Services LLC, since 2006; Manager, PricewaterhouseCoopers LLP, 1999-2006. | | | N/A | | | N/A |
| | | | | | | | | | | | | |
| Eric W. Falkeis 615 East Michigan Street Milwaukee, WI 53202 | | | | | | | | | | | | |
| Age: 37 | | Secretary | | One Year; Since 2004 | | Senior Vice President, U.S. Bancorp Fund Services, LLC, since September 2007; Chief Financial Officer, U.S. Bancorp Fund Services, LLC, since April 2006; Vice President, U.S. Bancorp Fund Services LLC, 1997-present; formerly, Chief Financial Officer, Quasar Distributors, LLC, 2000-2003. | | | N/A | | | N/A |
| | | | | | | | | | | | | |
| | |
| (1) | | Mr. Rafferty is affiliated with Rafferty. Mr. Rafferty is the Chairman and Chief Executive Officer of Rafferty and owns a beneficial interest in Rafferty. |
| |
| (2) | | The Direxion Complex consists of the Direxion Funds which currently offers for sale to the public 32 portfolios, the Direxion Insurance Trust which currently offers for sale 1 portfolio and the Direxion ETF Trust which currently offers for sale to the public 34 of the 102 funds currently registered with the SEC. |
| |
| (3) | | Mr. Rudnick replaced Guy F Talarico as Principal Financial Officer and Treasurer effective June 1, 2010. |
| |
| | The address for all trustees and officers except Patrick J. Rudnick and Eric W. Falkeis is 33 Whitehall St., New York, NY 10004. |
38 DIREXION ANNUAL REPORT
THIS PAGE INTENTIONALLY LEFT BLANK
THIS PAGE INTENTIONALLY LEFT BLANK
PRIVACY NOTICE
At the Direxion Funds, we are committed to protecting your privacy. To open and service your Direxion accounts, we collect and maintain certain nonpublic personal information about you, such as your address, phone number, social security number, purchases, sales, account balances, bank account information and other personal financial information. We collect this information from the following sources:
| |
| • | Account applications or other forms on which you provide information, |
| • | Mail, e-mail, the telephone and our website, and |
| • | Your transactions and account inquiries with us. |
We safeguard the personal information that you have entrusted to us in the following ways:
| |
| • | As a general policy, only those employees who maintain your account and respond to your requests for additional services have access to your account information. |
| • | We maintain physical, electronic, and procedural safeguards to insure the security of your personal information and to prevent unauthorized access to your information. |
We do not disclose any nonpublic personal information about you or our former shareholders to anyone, except as permitted or required by law. In the course of conducting business and maintaining your account we may share shareholder information, as allowed by law, with our affiliated companies and with other service providers, including financial intermediaries, custodians, transfer agents and marketing consultants. Those companies are contractually bound to use that information only for the services for which we hired them. They are not permitted to use or share our shareholders’ nonpublic personal information for any other purpose. There also may be times when we provide information to federal, state or local authorities as required by law.
In the event that you hold fund shares of Direxion through a financial intermediary, including, but not limited to, a broker-dealer, bank, or trust company, the privacy policy of your financial intermediary would govern how your nonpublic personal information would be shared with nonaffiliated third parties.
For questions about our policy, please contact us at (800) 851-0511.
ANNUAL REPORT
Adviser
Rafferty Asset Management, LLC
33 Whitehall St. 10th Floor
New York, NY 10004
Sub-Advisor
HCM Sub-Advisor
Horizon Capital Management, Inc.
141 Ridgeway Drive
Lafayette, LA 70503
Administrator, Transfer Agent, Dividend Paying
Agent & Shareholding Servicing Agent
U.S. Bancorp Fund Services, LLC
P.O. Box 1993
Milwaukee, WI 53201-1993
Custodian
U.S. Bank, N.A.
1555 RiverCenter Dr., Suite 302
Milwaukee, WI 53212
Independent Registered Public Accounting Firm
Ernst & Young LLP
5 Times Square
New York, NY 10036
Distributor
Rafferty Capital Markets, LLC
59 Hilton Avenue
Garden City, NY 11530
The Fund’s Proxy Voting Policies are available without charge by calling 1-800-851-0511, or by accessing the SEC’s website, at www.sec.gov.
The actual voting records relating to portfolio securities during the most recent period ended June 30 (starting with the year ended June 30, 2005) is available without charge by calling 1-800-851-0511 or by accessing the SEC’s website at www.sec.gov.
The Funds file its complete schedule of portfolio holdings with the Commission for the first and third quarters of each fiscal year on Form N-Q. The Form N-Q is available without charge, upon request, by calling 1-800-851-0511, or by accessing the SEC’s website, at www.sec.gov. The Funds’ Forms N-Q may be reviewed and copied at the Commission’s Public Reference Room in Washington, D.C. Information or the operation of the Public Reference Room may be obtained by calling 1-800-SEC-0330.
This report has been prepared for shareholders and may be distributed to others only if preceded or accompanied by a current prospectus.
ANNUAL REPORT
Adviser
Rafferty Asset Management, LLC
33 Whitehall St. 10th Floor
New York, NY 10004
Sub-Advisor
Spectrum Funds Sub-Advisor
Hundredfold Advisors, LLC
2940 N. Lynnhaven Road
Virginia Beach, VA 23452
Administrator, Transfer Agent, Dividend Paying
Agent & Shareholding Servicing Agent
U.S. Bancorp Fund Services, LLC
P.O. Box 1993
Milwaukee, WI 53201-1993
Custodian
U.S. Bank, N.A.
1555 RiverCenter Dr., Suite 302
Milwaukee, WI 53212
Independent Registered Public Accounting Firm
Ernst & Young LLP
5 Times Square
New York, NY 10036
Distributor
Rafferty Capital Markets, LLC
59 Hilton Avenue
Garden City, NY 11530
The Fund’s Proxy Voting Policies are available without charge by calling 1-800-851-0511, or by accessing the SEC’s website, at www.sec.gov.
The actual voting records relating to portfolio securities during the most recent period ended June 30 (starting with the year ended June 30, 2005) is available without charge by calling 1-800-851-0511 or by accessing the SEC’s website at www.sec.gov.
The Funds file its complete schedule of portfolio holdings with the Commission for the first and third quarters of each fiscal year on Form N-Q. The Form N-Q is available without charge, upon request, by calling 1-800-851-0511, or by accessing the SEC’s website, at www.sec.gov. The Funds’ Forms N-Q may be reviewed and copied at the Commission’s Public Reference Room in Washington, D.C. Information or the operation of the Public Reference Room may be obtained by calling 1-800-SEC-0330.
This report has been prepared for shareholders and may be distributed to others only if preceded or accompanied by a current prospectus.
Item 2. Code of Ethics.
The registrant has adopted a code of ethics that applies to the registrant’s principal executive officer and principal financial officer. The registrant has not made any amendments to its code of ethics during the period covered by this report. The registrant has not granted any waivers from any provisions of the code of ethics during the period covered by this report. A copy of the registrant’s Code of Ethics is filed herewith.
Item 3. Audit Committee Financial Expert.
The registrant’s board of trustees has determined that there is at least one audit committee financial expert serving on its audit committee. Gerald E. Shanley III is the “audit committee financial expert” and is considered to be “independent” as each term is defined in Item 3 of Form N-CSR.
Item 4. Principal Accountant Fees and Services.
The registrant has engaged its principal accountant to perform audit services, audit-related services, tax services and other services during the past fiscal year. “Audit services” refer to performing an audit of the registrant’s annual financial statements or services that are normally provided by the accountant in connection with statutory and regulatory filings or engagements for the fiscal year. “Audit-related services” refer to the assurance and related services by the principal accountant that are reasonably related to the performance of the audit. “Tax services” refer to professional services rendered by the principal accountant for tax compliance, tax advice, and tax planning, including assessment of FIN 48 for the Funds and additional tax research. There were no “Other services” provided by the principal accountant. The following table details the aggregate fees billed or expected to be billed for each of the last fiscal year for audit fees, audit-related fees, tax fees and other fees by the principal accountant. The table presents aggregate fees billed to the registrant and reflected in the financial statements of the report to shareholders.
| | | | | | | | | |
| | | FYE 8/31/2010 | | FYE 8/31/2009 |
| |
| Audit Fees | | $ | 457,800 | | | $ | 462,670 | |
| Audit-Related Fees | | | — | | | | — | |
| Tax Fees | | $ | 120,000 | | | $ | 97,160 | |
| All Other Fees | | | — | | | | — | |
The audit committee has adopted pre-approval policies and procedures that require the audit committee to pre-approve all audit and non-audit services of the registrant, including services provided to any entity affiliated with the registrant.
The percentages of fees billed by Ernst & Young LLP applicable to non-audit services pursuant to waiver of pre-approval requirement were as follows:
| | | | | | | | | |
| | | FYE 8/31/2010 | | FYE 8/31/2009 |
| |
| Audit-Related Fees | | | 0 | % | | | 0 | % |
| Tax Fees | | | 0 | % | | | 0 | % |
| All Other Fees | | | 0 | % | | | 0 | % |
All of the principal accountant’s hours spent on auditing the registrant’s financial statements were attributed to work performed by full-time permanent employees of the principal accountant. (If more than 50 percent of the accountant’s hours were spent to audit the registrant’s financial statements for the fiscal year, state how many hours were attributed to work performed by persons other than the principal accountant’s full-time, permanent employees.)
The following table indicates the non-audit fees billed or expected to be billed by the registrant’s accountant for services to the registrant and to the registrant’s investment adviser (and any other controlling entity, etc.—not sub-adviser) for the last year. The audit committee of the board of trustees has considered whether the provision of non-audit services that were rendered to the registrant’s investment adviser is compatible with maintaining the principal accountant’s independence and has concluded that the provision of such non-audit services by the accountant has not compromised the accountant’s independence.
| | | | | | | | | |
| Non-Audit Related Fees | | FYE 8/31/2010 | | FYE 8/31/2009 |
| |
| Registrant | | None | | None |
| Registrant’s Investment Adviser | | None | | None |
Item 5. Audit Committee of Listed Registrants.
Not applicable to registrants who are not listed issuers (as defined in Rule 10A-3 under the Securities Exchange Act of 1934).
Item 6. Schedule of Investments.
Schedule of Investments is included as part of the report to shareholders filed under Item 1 of this Form.
Item 7. Disclosure of Proxy Voting Policies and Procedures for Closed-End Management Investment Companies.
Not applicable to open-end investment companies.
Item 8. Portfolio Managers of Closed-End Management Investment Companies.
Not applicable to open-end investment companies.
Item 9. Purchases of Equity Securities by Closed-End Management Investment Company and Affiliated Purchasers.
Not applicable to open-end investment companies.
Item 10. Submission of Matters to a Vote of Security Holders.
There have been no material changes to the procedures by which shareholders may recommend nominees to the registrant’s board of directors/trustees.
Item 11. Controls and Procedures.
| (a) | | The Registrant’s President and Principal Financial Officer have reviewed the Registrant’s disclosure controls and procedures (as defined in Rule 30a-3(c) under the Investment Company Act of 1940 (the “Act”)) as of a date within 90 days of the filing of this report, as required by Rule 30a-3(b) under the Act and Rules 13a-15(b) or 15d-15(b) under the Securities Exchange Act of 1934. Based on their review, such officers have concluded that the disclosure controls and procedures are effective in ensuring that information required to be disclosed in this report is appropriately recorded, processed, summarized and reported and made known to them by others within the Registrant and by the Registrant’s service provider. |
| |
| (b) | | There were no changes in the Registrant’s internal control over financial reporting (as defined in Rule 30a-3(d) under the Act) that occurred during the second fiscal quarter of the period covered by this report that has materially affected, or is reasonably likely to materially affect, the Registrant’s internal control over financial reporting. |
Item 12. Exhibits.
| (a) | | (1) Any code of ethics or amendment thereto, that is subject of the disclosure required by Item 2, to the extent that the registrant intends to satisfy Item 2 requirements through filing an exhibit. Filed herewith. |
| |
| | (2) Certifications pursuant to Section 302 of the Sarbanes-Oxley Act of 2002. Filed herewith. |
| |
| | (3) Any written solicitation to purchase securities under Rule 23c-1 under the Act sent or given during the period covered by the report by or on behalf of the registrant to 10 or more persons. Not applicable to open-end investment companies. |
| (b) | | Certification pursuant to Section 906 of the Sarbanes-Oxley Act of 2002. Furnished herewith. |
SIGNATURES
Pursuant to the requirements of the Securities Exchange Act of 1934 and the Investment Company Act of 1940, the registrant has duly caused this report to be signed on its behalf by the undersigned, thereunto duly authorized.
| | | | | | | |
|
| | | (Registrant) | | Direxion Funds | | |
| | | | | | | |
|
| | | By (Signature and Title)* | | /s/ Daniel D. O’Neill Daniel D. O’Neill, President | | |
| | | | | | | |
| | | Date 10/25/2010 | | | | |
Pursuant to the requirements of the Securities Exchange Act of 1934 and the Investment Company Act of 1940, this report has been signed below by the following persons on behalf of the registrant and in the capacities and on the dates indicated.
| | | | | | | |
|
| | | By (Signature and Title)* | | /s/ Daniel D. O’Neill Daniel D. O’Neill, President | | |
| | | | | | | |
| | | Date 10/25/2010 | | | | |
| | | | | | | |
|
| | | By (Signature and Title)* | | /s/ Patrick J. Rudnick Patrick J. Rudnick, Principal Financial Officer | | |
| | | | | | | |
| | | Date 10/25/2010 | | | | |
| | |
| * | | Print the name and title of each signing officer under his or her signature. |