UNITED STATES
SECURITIES AND EXCHANGE COMMISSION
Washington, D.C. 20549
FORM N-CSR
CERTIFIED SHAREHOLDER REPORT OF REGISTERED
MANAGEMENT INVESTMENT COMPANIES
Investment Company Act file number | 811-08243 |
|
Direxion Funds |
(Exact name of registrant as specified in charter) |
|
1301 Avenue of the Americas (6th Ave.), 28th Floor New York, NY | | 10019 |
(Address of principal executive offices) | | (Zip code) |
|
1301 Avenue of the Americas (6th Ave.), 28th Floor New York, NY 10019 |
(Name and address of agent for service) |
|
Registrant’s telephone number, including area code: | 1-800-851-0511 | |
|
Date of fiscal year end: | August 31, 2017 | |
|
Date of reporting period: | August 31, 2017 | |
| | | | | | | | |
Item 1. Report to Stockholders.

ANNUAL REPORT AUGUST 31, 2017
1301 Avenue of the Americas (6th Ave.), 28th Floor New York, New York 10019 www.direxioninvestments.com
1.2X BULL FUND
Direxion Monthly High Yield Bull 1.2X Fund (DXHYX)
| 1.25X BULL FUND | | 1.25X BEAR FUND | |
| Direxion Monthly NASDAQ-100® Bull 1.25X Fund (DXNLX) | | Direxion Monthly NASDAQ-100® Bear 1.25X Fund (DXNSX) | |
| 1.35X BULL FUND | | 1.35X BEAR FUND | |
| Direxion Monthly 25+ Year Treasury Bull 1.35X Fund (DXLTX) | | Direxion Monthly 25+ Year Treasury Bear 1.35X Fund (DXSTX) | |
| (Formerly Direxion Monthly 25+ Year Treasury Bull 1.2X Fund) | | (Formerly Direxion Monthly 25+ Year Treasury Bear 1X Fund) | |
| 2X BULL FUNDS | | 2X BEAR FUNDS | |
| Direxion Monthly NASDAQ-100® Bull 2X Fund (DXQLX) | | | | | |
| Direxion Monthly S&P 500® Bull 2X Fund (DXSLX) | | Direxion Monthly S&P 500® Bear 2X Fund (DXSSX) | |
| Direxion Monthly Small Cap Bull 2X Fund (DXRLX) | | Direxion Monthly Small Cap Bear 2X Fund (DXRSX) | |
| Direxion Monthly 7-10 Year Treasury Bull 2X Fund (DXKLX) | | Direxion Monthly 7-10 Year Treasury Bear 2X Fund (DXKSX) | |
| Direxion Monthly Emerging Markets Bull 2X Fund (DXELX) | | | | | |
Letter to Shareholders (Unaudited) | | | 4 | | |
Performance Summary (Unaudited) | | | 11 | | |
| Expense Example (Unaudited) | | | 24 | | |
| Allocation of Portfolio Holdings (Unaudited) | | | 26 | | |
| Schedules of Investments | | | 27 | | |
| Statements of Assets and Liabilities | | | 40 | | |
| Statements of Operations | | | 44 | | |
| Statements of Changes in Net Assets | | | 48 | | |
| Financial Highlights | | | 55 | | |
| Notes to the Financial Statements | | | 57 | | |
Report of Independent Registered
Public Accounting Firm | | | 74 | | |
| Supplemental Information (Unaudited) | | | 75 | | |
Investment Advisory Agreement
Approval (Unaudited) | | | 76 | | |
| Trustees and Officers | | | 79 | | |
Help Preserve the Environment – Go Green!
Go paperless with Direxion e-Delivery – a service allowing shareholders to reduce clutter with full online access to regulatory documents. Begin the preservation process with e-delivery.
With Direxion e-Delivery you can:
• Receive email notifications when your most recent shareholder communications are available for review.
• Access prospectuses, annual reports and semi-annual reports online.
It's easy to enroll:
1. Visit www.direxioninvestments.com/edelivery
2. Follow the simple enrollment instructions
If you have questions about Direxion e-Delivery services, contact one of our shareholder representatives at 800-851-0511.


Letter to Shareholders (Unaudited)
Dear Shareholders,
This Annual Report for the Direxion Funds (the "Funds") covers the period from September 1, 2016 to August 31, 2017 (the "Annual Period").
Fund Operational Review:
The Funds are leveraged and seek to provide a calendar month return of 120%, 125%, 135%, 200%, -125%, -135% or -200% of the calendar month performance of a particular benchmark. The term "calendar month" refers to the period from the close of the markets on the last business day of a given calendar month, until the close of the markets on the last business day of the subsequent calendar month. The Funds seek calendar month leveraged investment results which should not be equated with seeking a leveraged goal for shorter than a calendar month. An investor who purchases shares on a day other than the last business day of a calendar month will generally receive more, or less, than the target exposure to the index, depending on the performance of the target index. If a Fund's shares are held through the end of a calendar month or months, the Fund's performance is likely to deviate from the multiple of the benchmark performance for the longer period. Similarly, the return for investors investing for periods less than a calendar month, or for a period different than the calendar month, will likely deviate from the multiple of the benchmark performance for such shorter periods. The Funds are not suitable for all investors and should be utilized only by sophisticated investors who understand leverage risk, consequences of seeking calendar month leverage investment results and intend to actively monitor and manage their investments.
The Funds with the word "Bull" in their name attempt to provide investment results that correlate to 120%, 125%, 135% or 200% of the return of an index or benchmark, meaning the Bull Funds attempt to move in the same direction as the target index or benchmark. The Funds with the word "Bear" in their name attempt to provide investment results that correlate to -125%, -135% or -200% of the return of an index or benchmark, meaning that Bear Funds attempt to move in the opposite or inverse direction of the target index or benchmark.
In seeking to achieve each Fund's calendar month investment objective, Rafferty Asset Management ("Rafferty" or the "Adviser") uses statistical and quantitative analysis to determine the investments each Fund makes and the techniques it employs. Rafferty relies upon a pre-determined model to generate orders resulting in repositioning each Fund's investments in accordance with its calendar month investment objective. Using this approach, Rafferty determines the type, quantity and mix of investment positions it believes in combination should produce calendar month returns consistent with a Fund's objective. As a consequence, if a Fund is performing as designed, the return of the index or benchmark will dictate the return for that Fund. Each Fund pursues its investment objective regardless of market conditions and does not take defensive positions.
Each Fund has a clearly articulated goal which requires the Fund to seek economic exposure in excess of its net assets. To meet its objectives, each Fund invests in some combination of financial instruments so it generates economic exposure consistent with the Fund's investment objective. Financial instruments may include exchange traded funds ("ETFs"), stock index futures contracts, options on securities and stock indices and swap agreements. Each Fund invests significantly in swap agreements. Rafferty uses these types of investments to produce economically "leveraged" investment results. Leveraging allows Rafferty to generate a greater positive or negative return than what would be generated on the invested capital without leverage, thus changing small market movements into larger changes in the value of the investments of a Fund.
The Funds may use certain investment techniques, including investments in derivatives, which may be considered aggressive. Investments in derivatives in general are subject to market risks that may cause their prices to fluctuate over time. Additionally, such instruments may experience potentially dramatic price changes (losses) and imperfect correlations between the price of the contract and the underlying security or index which will increase the volatility of the Funds and may involve a small investment of cash relative to the magnitude of the risk assumed. The use of derivatives may expose the Funds to
DIREXION ANNUAL REPORT
4
additional risks that they would not be subject to if they invested directly in the securities underlying those derivatives. The use of derivatives may result in larger losses or smaller gains than otherwise would be the case.
The discussion below relates to the performance of the Funds for their respective period. The Funds seek to provide calendar month returns which are a multiple – positive or negative – of the calendar month performance of a particular benchmark. The performance of the Funds for their respective period is important for understanding whether these Funds meet their investment goals. A Fund meeting its calendar month investment objective should have performance for the period similar to the performance indicated by models based on the calendar month returns of the relevant benchmark for the period. Direxion maintains models indicating the expected performance of each Fund in light of the path of the relevant benchmark. The models, and a description of how they work, are available on the Direxion website (www.direxioninvestments.com) under Tools/Exposure Level. The models do not take into account the size of a Fund, the Fund's expense ratio or any transaction fees associated with creating a Fund's portfolio. A brief comparison of the actual returns versus the expected returns for each of the Funds in this Annual Report follows.
Fund Performance Review:
The Direxion Monthly High Yield Bull 1.2X Fund seeks to provide 120% of the calendar month return of the Solactive High Yield Beta Index. The Solactive High Yield Beta Index is a rules-based, systematic strategy index that provides exposure to an equal-weighted portfolio of three high-yield ETFs. The allocation to each U.S. High Yield Corporate Bond ETF is adjusted on a monthly basis. The index is calculated and distributed by Solactive AG and is calculated and published in U.S. Dollars. For the Annual Period, the Solactive High Yield Beta Index returned 8.12%. Given the calendar month investment objectives of the Fund and the path dependency of returns for longer periods, the return of the index alone should not generate expectations of annual performance of the Fund. Direxion Monthly High Yield Bull 1.2X Fund returned 8.08%, while the model indicated an expected return of 9.81%.
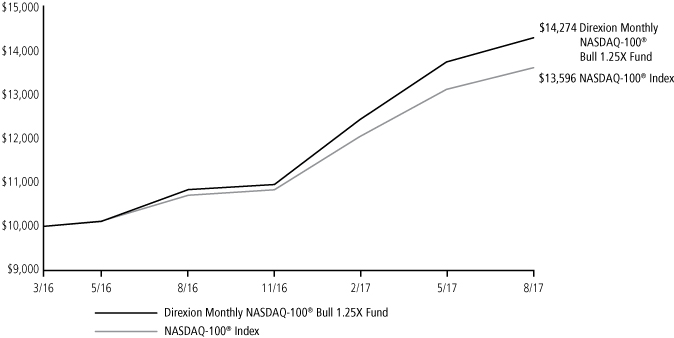
The Direxion Monthly NASDAQ-100® Bull 1.25X Fund and the Direxion Monthly NASDAQ-100® Bear 1.25X Fund seek to provide 125% and -125% of the calendar month return of the NASDAQ-100® Index, respectively. The NASDAQ-100® Index includes 100 of the largest domestic and international non-financial companies listed on the NASDAQ Stock Market® based on market capitalization. All companies listed on the index have an average daily trading volume of at least 200,000 shares. For the Annual Period, the NASDAQ-100® Index returned 27.00%. Given the calendar month investment objectives of the Funds and the path dependency of returns for longer periods, the return of the index alone should not generate expectations of performance of the Funds. The Direxion Monthly NASDAQ-100® Bull 1.25X Fund returned 31.77%, while the model indicated an expected return of 34.58%. The Direxion Monthly NASDAQ-100® Bear 1.25X Fund returned -26.91%, while the model indicated an expected return of -26.95%.
From September 1, 2016 through November 30, 2016, the Direxion Monthly 25+ Year Treasury Bull 1.2X Fund and the Direxion Monthly 25+ Year Treasury Bear 1X Fund sought to provide 120% and -100% of the calendar month return of the NYSE 25 Year Plus Treasury Bond Index, respectively. The NYSE 25 Year Plus Treasury Bond Index (AXTWFV) is a multi-security fixed income index that attempts to track U.S. Treasury bonds with a maturity of 25 years or greater. Bonds eligible for inclusion must: be issued by the U.S. Treasury; have a maturity of 25 years or greater at issuance; be denominated in U.S. Dollars; be an either callable or non-callable issue; and have a fixed, non-zero coupon. The Index rebalances monthly, after the close of trading on the last business day of each month. The weighting of the bonds in the Index is reset during the rebalance to represent each issue's market value which is based on the issue's float-adjusted amount outstanding. For the stated period, the NYSE 25 Year Plus Treasury Bond Index returned -14.05%. Given the calendar month investment objectives of the Funds and the path dependency of returns for longer periods, the return of the index alone should not generate expectations of performance of the Funds. The Direxion Monthly 25+ Year Treasury Bull 1.2X Fund returned -17.13%, while the model indicated an expected return of -16.73%. The Direxion Monthly 25+ Year Treasury Bear 1X Fund returned 14.89%, while the model indicated an expected return of 15.24%.
From December 1, 2016 through August 31, 2017, the Direxion Monthly 25+ Year Treasury Bull 1.35X Fund and the Direxion Monthly 25+ Year Treasury Bear 1.35X Fund sought to provide 135% and -135% of the calendar month return of the
DIREXION ANNUAL REPORT
5
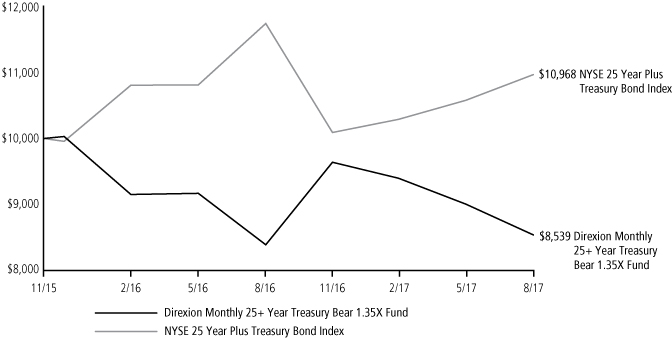
NYSE 25 Year Plus Treasury Bond Index, respectively. The NYSE 25 Year Plus Treasury Bond Index (AXTWFV) is a multi-security fixed income index that attempts to track U.S. Treasury bonds with a maturity of 25 years or greater. Bonds eligible for inclusion must: be issued by the U.S. Treasury; have a maturity of 25 years or greater at issuance; be denominated in U.S. Dollars; be an either callable or non-callable issue; and have a fixed, non-zero coupon. The Index rebalances monthly, after the close of trading on the last business day of each month. The weighting of the bonds in the Index is reset during the rebalance to represent each issue's market value which is based on the issue's float-adjusted amount outstanding. For the stated period, the NYSE 25 Year Plus Treasury Bond Index returned 8.69%. Given the calendar month investment objectives of the Funds and the path dependency of returns for longer periods, the return of the index alone should not generate expectations of performance of the Funds. The Direxion Monthly 25+ Year Treasury Bull 1.35X Fund returned 9.78%, while the model indicated an expected return of 11.84%. The Direxion Monthly 25+ Year Treasury Bear 1.35X Fund returned -11.42%, while the model indicated an expected return of -10.98%.
The Direxion Monthly NASDAQ-100® Bull 2X Fund seeks to provide 200% of the calendar month return of the NASDAQ-100® Index. The NASDAQ-100® Index includes 100 of the largest domestic and international non-financial companies listed on the NASDAQ Stock Market® based on market capitalization. All companies listed on the index have an average daily trading volume of at least 200,000 shares. For the Annual Period, the NASDAQ-100® Index returned 27.00%. Given the calendar month investment objectives of the Fund and the path dependency of returns for longer periods, the return of the index alone should not generate expectations of performance of the Fund. The Direxion Monthly NASDAQ-100® Bull 2X Fund returned 54.55%, while the model indicated an expected return of 59.60%.
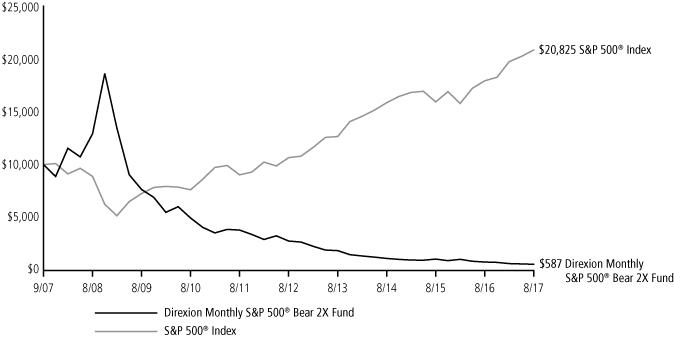
The Direxion Monthly S&P 500® Bull 2X Fund and the Direxion Monthly S&P 500® Bear 2X Fund seek to provide 200% and -200% of the calendar month return of the S&P 500® Index, respectively. The S&P 500® Index is a capitalization-weighted index composed of 500 domestic common stocks. Standard & Poor's® selects the stocks comprising the S&P 500® Index on the basis of market capitalization, financial viability of the company and the public float, liquidity and price of a company's shares outstanding. The index is a float-adjusted, market capitalization-weighted index. For the Annual Period, the S&P 500® Index returned 16.23%. Given the calendar month investment objectives of the Funds and the path dependency of returns for longer periods, the return of the index alone should not generate expectations of performance of the Funds. The Direxion Monthly S&P 500® Bull 2X Fund returned 30.33%, while the model indicated an expected return of 34.44%. The Direxion Monthly S&P 500® Bear 2X Fund returned -26.54%, while the model indicated an expected return of -27.03%.
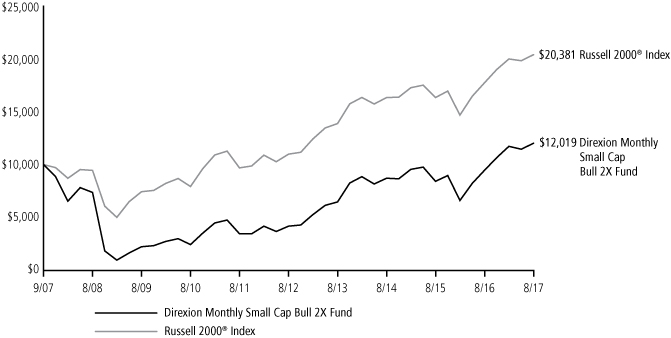
The Direxion Monthly Small Cap Bull 2X Fund and the Direxion Monthly Small Cap Bear 2X Fund seek to provide 200% and -200% of the calendar month return of the Russell 2000® Index, respectively. The Russell 2000® Index measures the performance of approximately 2,000 small-capitalization companies in the Russell 3000® Index, based on a combination of their market capitalization and current index membership. For the Annual Period, the Russell 2000® Index returned 14.91%. Given the calendar month investment objectives of the Funds and the path dependency of returns for longer periods, the return of the index alone should not generate expectations of annual performance of the Funds. The Direxion Monthly Small Cap Bull 2X Fund returned 26.88%, while the model indicated an expected return of 29.92%. The Direxion Monthly Small Cap Bear 2X Fund returned -29.44%, while the model indicated an expected return of -28.44%.
The Direxion Monthly 7-10 Year Treasury Bull 2X Fund and the Direxion Monthly 7-10 Year Treasury Bear 2X Fund seek to provide 200% and -200% of the calendar month return of the ICE U.S. Treasury 7-10 Year Bond Index, respectively. The ICE U.S. Treasury 7-10 Year Bond Index is a market value weighted index that includes publicly issued U.S. Treasury securities that have a remaining maturity of greater than seven years and less than or equal to ten years. Eligible securities must be fixed rate, denominated in U.S. dollars, and have $300 million or more of outstanding face value, excluding amounts held by the Federal Reserve. Securities excluded from the index are zero-coupon STRIPS, inflation linked securities, floating rate notes, cash management and Treasury bills, and any government agency debt issued with or without a government guarantee. For Annual Period, the ICE U.S. Treasury 7-10 Year Bond Index returned -1.52%. Given the calendar month investment objectives of the Funds and the path dependency of returns for longer periods, the return of the index alone should not generate expectations of performance of the Funds. The Direxion Monthly 7-10 Year Treasury Bull 2X Fund returned -5.66%, while the model indicated an expected return of -3.26%. The Direxion Monthly 7-10 Year Treasury Bear 2X Fund returned 1.25%, while the model indicated an expected return of 2.40%.
DIREXION ANNUAL REPORT
6
The Direxion Monthly Emerging Markets Bull 2X Fund seeks to provide 200% of the calendar month return of the MSCI Emerging Markets IndexSM. The MSCI Emerging Market IndexSM is a free float-adjusted market capitalization index that is designed to measure equity market performance in the global emerging markets. For the Annual Period, the MSCI Emerging Markets IndexSM returned 24.53%. Given the calendar month investment objectives of the Fund and the path dependency of returns for longer periods, the return of the index alone should not generate expectations of performance of the Fund. The Direxion Monthly Emerging Markets Bull 2X Fund returned 49.73%, while the model indicated an expected return of 53.46%.
Factors Affecting Direxion Fund Performance:
Benchmark Performance: The calendar month performance of each Fund's benchmark index, and the factors and market conditions implicitly affecting that index, are the primary factors driving Fund performance. Given the calendar month goals, the series of calendar month index returns are most important. The market conditions affecting the benchmark indexes during the past year are described below.
Leverage: Each Fund seeks calendar month investment results (before fees and expenses) of either 120%, 125%, 135% or 200% (for the Bull Funds) or -125%, -135% or -200% (for the Bear Funds) of the performance of its respective underlying index. The use of leverage magnifies a Fund's gains or losses and increases the investment's risk and volatility.
Volatility and Compounding: The goal of leveraged funds is to provide a multiple of the calendar month returns of an underlying index. Over periods longer or shorter than a calendar month, a Fund should not be expected to provide its respective multiple of the return of the underlying index. Due to the effects of compounding – a universal mathematical concept applying to all investments – returns of the Funds over longer periods will differ from the Fund's calendar month stated goal. Periods of high-volatility lacking a clear trend hurt a Fund's performance, while trending low-volatility markets enhance a Fund's performance.
Cost of Financing: In order to attain leveraged exposure, a Bull Fund incurs a cost of LIBOR1 plus or minus a spread, and a Bear Fund receives LIBOR plus or minus a spread as applied to the borrowed portion of the Fund's exposure. Financing costs create a drag on a Bull Fund's performance. Because LIBOR is very low, a Bear Fund receives a negligible amount of financing, or in the case of hard-to-borrow shares, might pay to finance its short position.
Equity Dividends: A Bull Fund's performance is positively impacted by equity and index dividends, as the Funds receive those payments. A Bear Fund's performance is negatively impacted, as they are obligated to pay the dividends.
Fees, Expenses, and Transaction Costs: Fees and expenses are listed in each Fund's prospectus and may be larger than many traditional index funds' fees, causing a greater negative impact on Fund performance. Transactions costs are not included in the expense ratio of the Funds. Transaction costs can be higher due to the Fund's use of leverage, significant purchase and redemption activity by Fund shareholders; or trading securities that are comparatively less liquid.
Market Conditions Affecting Index and Fund Performance:
The unexpected election of Donald Trump as the 45th President of the United States was a dominant theme during the Annual Period. Post-election clarification of the policies of the incoming administration proved to be a global boost to equity markets that would persist largely unimpeded through the end of the Annual Period. Spurred by policies friendly to banks, financial stocks were leaders of the S&P 500® Index into the end of 2016. United States tailwinds led to an improving outlook for global growth, boosting stock performance in Europe and Asia, while the Federal Reserve's move to increase interest rates weighed on some of their currencies as compared to the U.S. Dollar. Into 2017, United States equity markets rallied on positive economic data and a hopeful outlook on topics such as deregulation, infrastructure spending and tax cuts. Favorable monetary policy by global central banks proved a continued boon to global equities during Q1 of 2017.
1 London Inter-Bank Offer Rate. The interest rate that the banks charge each other for loans (usually in Eurodollars). This rate is applicable to the short-term international interbank market, and applies to very large loans borrowed for anywhere from one day to five years.
DIREXION ANNUAL REPORT
7
Through March and April, realization that the U.S. Administration's policy changes would not be instituted as swiftly as originally thought proved to have a sobering effect on equity markets. Investors treated the pullback as a buying opportunity with the prevailing sentiment reverting to speculation that global growth could withstand the political unrest. August 2017 proved to be the opposite of what is typically seen as a quiet month for the market; volatility spiked on the threat of United States war with North Korea, and European stocks were caught in the verbal crossfire, suffering their worst week since November 2016.
The Annual Period saw three Federal Fund rate hikes – December, March and June. The shift away from a zero interest rate policy accelerated as the United States economy continued to show strength. U.S. government bonds saw negative returns during the Annual Period due to a combination of the aforementioned Federal Reserve's monetary tightening and possible fiscal stimulus in the form of infrastructure spending and tax cuts. High Yield bonds did well despite a continued slump in energy names, as the S&P Oil & Gas Exploration and Production Select Industry Index was down significantly for the Annual Period.
Market Volatility Affecting Index and Fund Performance:
During the Annual Period, volatility hit a high on November 4, 2016 and a low July 21, 2017. There were a few small spikes in volatility in September and October 2016 on high trading volume as the results of the Brexit vote and the ensuing uncertainty of its economic implications resonated across the globe. Volatility continued to increase on October 28, 2016 when the FBI sent a letter to congress stating a previously closed Clinton email probe would be reopened. As volatility continued to increase, the November 5, 2016 high can be credited to the final results of the Brexit vote, where the United Kingdom electorate voted to leave the European Union. The subsequent United States presidential election results on November 8, 2016 furthered the short period of heightened volatility. A return to normalcy prevailed into the end of the 2016 year as fear of a Brexit contagion abated, witnessing the largest weekly decline in the history of the VIX Index. A level of lower volatility remained consistent from mid-November through mid-July, where the VIX Index set a record low. April saw a spike in previously protracted lows in volatility on geopolitical concerns and a softening of economic data in the United States. Mid-May saw a pullback in United States equities, and a corresponding jump in volatility, as turmoil from the removal of James Comey as FBI Director spilled over into the markets. Volatility would stay near record lows until August, when President Trump made threatening comments to North Korea. The volatility of each index used as a benchmark for the Funds is below:
| Benchmark | | One-Year Return
Period Ended
August 31, 2017 | | Annualized Volatility | |
NYSE 25 Year Plus Treasury Bond Index1 | | | -14.05 | % | | | 14.27 | % | |
NYSE 25 Year Plus Treasury Bond Index2 | | | 8.69 | % | | | 9.70 | % | |
Solactive High Yield Beta Index | | | 8.12 | % | | | 5.05 | % | |
NASDAQ-100® Index | | | 27.00 | % | | | 11.36 | % | |
S&P 500® Index | | | 16.23 | % | | | 8.34 | % | |
Russell 2000® Index | | | 14.91 | % | | | 14.15 | % | |
ICE U.S. Treasury 7-10 Year Bond Index | | | -1.52 | % | | | 4.69 | % | |
MSCI Emerging Markets IndexSM | | | 24.53 | % | | | 15.65 | % | |
1 September 1, 2016 through November 30, 2016
2 December 1, 2016 through August 31, 2017
DIREXION ANNUAL REPORT
8
As always, we thank you for using the Direxion Funds and we look forward to our mutual success.
Regards,

| | 
| |
Eric W. Falkeis | | Patrick Rudnick | |
Principal Executive Officer | | Principal Financial Officer | |
The performance data quoted represents past performance; past performance does not guarantee future results. The investment return and principal value of an investment will fluctuate and an investor's shares, when redeemed, may be worth more or less than their original cost. Current performance may be higher or lower than the performance data quoted. To obtain performance data current to the most recent month-end, please call toll-free, 1.800.851.0511, or visit www.direxioninvestments.com.
An investment in the Funds involves risk, including the possible loss of principal. The Funds are non-diversified and include risks associated with concentration risk which results from the Funds' investments in a particular industry or sector and can increase volatility over time. Active and frequent trading associated with a regular rebalance of the fund can cause the price to fluctuate, therefore impacting its performance compared to other investment vehicles. The Funds are leveraged and include risks associated with being leveraged which include the potential to create a greater negative return had the Fund not employed leverage. For other risks including correlation, compounding, market volatility and specific risks regarding each sector, please read the prospectus. An investment in any of the Direxion Funds is subject to a number of risks that could affect the value of its shares. It is important that investors closely review and understand these risks before making an investment.
An investor should consider the investment objectives, risks, charges and expenses of the Direxion Funds carefully before investing. The prospectus contains this and other information about the Direxion Funds. To obtain a prospectus, please call the Direxion Funds at 1.800.851.0511 or visit www.direxioninvestments.com. The prospectus should be read carefully before investing.
There is no guarantee the Funds will achieve their objective. Investing in funds that track an index may be more volatile than investing in broadly diversified funds. The use of leverage by a Fund means the Funds are riskier than alternatives which do not use leverage.
The views in this report were those of the Adviser as of August 31, 2017 and may not reflect their views on the date this report is first published or anytime thereafter. These views are intended to assist shareholders of the Fund in understanding their investments in the Fund and do not constitute investment advice.
The total annual fund operating expense ratios of the Direxion Monthly 25+ Year Treasury Bull 1.35X Fund, Direxion Monthly 25+ Year Treasury Bear 1.35X Fund, Direxion Monthly High Yield Bull 1.2X Fund, Direxion Monthly NASDAQ-100® Bull 1.25X Fund, Direxion Monthly NASDAQ-100® Bear 1.25X Fund, Direxion Monthly NASDAQ-100® Bull 2X Fund, Direxion Monthly S&P 500® Bull 2X Fund, Direxion Monthly S&P 500® Bear 2X Fund, Direxion Monthly Small Cap Bull 2X Fund, Direxion Monthly Small Cap Bear 2X Fund, Direxion Monthly 7-10 Year Treasury Bull 2X Fund, Direxion Monthly 7-10 Year Treasury Bear 2X and Direxion Monthly Emerging Markets
DIREXION ANNUAL REPORT
9
Bull 2X Fund are 1.24%, 1.23%, 1.76%, 1.32%, 1.28%, 1.50%, 1.49%, 1.51%, 1.51%, 1.52%, 1.51%, 1.50% and 1.50%, respectively.*
Distributed by: Rafferty Capital Markets, LLC
* The total annual fund operating expense ratios of the Direxion Monthly 25+ Year Treasury Bull 1.35X Fund, Direxion Monthly 25+ Year Treasury Bear 1.35X Fund, Direxion Monthly High Yield Bull 1.2X Fund, Direxion Monthly NASDAQ-100® Bull 1.25X Fund, Direxion Monthly NASDAQ-100® Bear 1.25X Fund, Direxion Monthly NASDAQ-100® Bull 2X Fund, Direxion Monthly S&P 500® Bull 2X Fund, Direxion Monthly S&P 500® Bear 2X Fund, Direxion Monthly Small Cap Bull 2X Fund, Direxion Monthly Small Cap Bear 2X Fund, Direxion Monthly 7-10 Year Treasury Bull 2X Fund, Direxion Monthly 7-10 Year Treasury Bear 2X and Direxion Monthly Emerging Markets Bull 2X Fund includes Acquired Fund Fees and Expenses, indirect fees and expenses that the Fund incurs that are required to be disclosed. Without Acquired Fund Fees and Expenses, total annual fund operating expense ratios of the Direxion Monthly 25+ Year Treasury Bull 1.35X Fund and Direxion Monthly 25+ Year Treasury Bear 1.35X Fund, would be 1.10%, respectively. Total annual fund operating expense ratios of the Direxion Monthly NASDAQ-100® Bull 1.25X Fund and Direxion Monthly NASDAQ-100® Bear 1.25X Fund, would be 1.15%, respectively. The total annual fund operating expenses ratios of all other Funds would be 1.35%, respectively.
DIREXION ANNUAL REPORT
10
Direxion Monthly High Yield Bull 1.2X Fund
Performance Summary (Unaudited)
February 17, 20161 - August 31, 2017
Investment Objective: Seeks monthly investment results, before fees and expenses, of 120% of the price performance of the Solactive High Yield Beta Index.

| | | Average Annual Total Return2 | |
| | | 1 Year | | Since Inception | |
Direxion Monthly
High Yield Bull 1.2X Fund | | | 8.08 | % | | | 17.34 | % | |
Solactive High Yield Beta Index | | | 8.12 | % | | | 15.70 | % | |
The Fund seeks calendar month leveraged investment results, which should not be equated with seeking a leveraged goal for shorter than a calendar month. An investor who purchases shares on a day other than the last business day of the calendar month will generally receive more, or less, than 120% exposure to its index. Other factors such as fees and expenses, high portfolio turnover, transaction costs, significant purchases and redemption activity by Fund shareholders and/or a temporary lack of liquidity in the markets for the securities held by the Fund may also cause the Fund's investment results to vary from its stated objective.
This chart illustrates the performance of a hypothetical $10,000 investment made on the Fund's inception, and is not intended to imply any future performance. The returns shown do not reflect the deduction of taxes that a shareholder would pay on fund distributions or the redemption of fund shares. The performance of the Solactive High Yield Beta Index does not reflect the deduction of fees associated with a mutual fund, such as investment management fees. Investors cannot invest directly in an index, although they can invest in its underlying securities.
The performance data shown represents past performance and does not guarantee future results.
Market Exposure2
Investment Type | | Percent of
Net Assets | |
Investment Companies | | | 79.6 | % | |
Swap Contracts | | | 39.8 | % | |
Total Exposure | | | 119.4 | % | |
"Market Exposure" includes the value of total investments (including the contract value of any derivatives) and excludes any short-term investments and cash equivalents divided by Net Assets.
1 Commencement of operations.
2 As of August 31, 2017.
DIREXION ANNUAL REPORT
11
Direxion Monthly NASDAQ-100® Bull 1.25X Fund
Performance Summary (Unaudited)
March 31, 20161 - August 31, 2017
Investment Objective: Seeks monthly investment results, before fees and expenses, of 125% of the price performance of the NASDAQ-100® Index.
| | | Average Annual Total Return2 | |
| | | 1 Year | | Since Inception | |
Direxion Monthly NASDAQ-100®
Bull 1.25X Fund | | | 31.77 | % | | | 28.50 | % | |
NASDAQ-100® Index | | | 27.00 | % | | | 24.16 | % | |
The Fund seeks calendar month leveraged investment results, which should not be equated with seeking a leveraged goal for shorter than a calendar month. An investor who purchases shares on a day other than the last business day of a calendar month will generally receive more, or less, than 125% exposure to the target index. Other factors such as fees and expenses, high portfolio turnover, transaction costs, significant purchases and redemption activity by Fund shareholders and/or a temporary lack of liquidity in the markets for the securities held by the Fund may also cause the Fund's investment results to vary from its stated objective.
This chart illustrates the performance of a hypothetical $10,000 investment made at the Fund's inception, and is not intended to imply any future performance. The returns shown do not reflect the deduction of taxes that a shareholder would pay on fund distributions or the redemption of fund shares. The performance of the NASDAQ-100® Index does not reflect the deduction of fees associated with a mutual fund, such as investment management fees. Investors cannot invest directly in an index, although they can invest in its underlying securities. During the period shown, Rafferty Asset Management, LLC waived and/or reimbursed fees for various expenses. Had these waivers and/or reimbursements not been in effect, performance would have been lower.
The performance data shown represents past performance and does not guarantee future results.
Market Exposure2
Investment Type | | Percent of
Net Assets | |
Swap Contracts | | | 124.7 | % | |
Total Exposure | | | 124.7 | % | |
"Market Exposure" includes the value of total investments (including the contract value of any derivatives) and excludes any short-term investments and cash equivalents divided by Net Assets.
1 Commencement of operations.
2 As of August 31, 2017.
DIREXION ANNUAL REPORT
12
Direxion Monthly NASDAQ-100® Bear 1.25X Fund
Performance Summary (Unaudited)
March 31, 20161 - August 31, 2017
Investment Objective: Seeks monthly investment results, before fees and expenses, of 125% of the inverse of the price performance of the NASDAQ-100® Index.

| | | Average Annual Total Return2 | |
| | | 1 Year | | Since Inception | |
Direxion Monthly NASDAQ-100®
Bear 1.25X Fund | | | (26.91 | )% | | | (25.32 | )% | |
NASDAQ-100® Index | | | 27.00 | % | | | 24.16 | % | |
The Fund seeks calendar month leveraged investment results, which should not be equated with seeking a leveraged goal for shorter than a calendar month. An investor who purchases shares on a day other than the last business day of a calendar month will generally receive more, or less, than -125% exposure to the target index. Other factors such as fees and expenses, high portfolio turnover, transaction costs, significant purchases and redemption activity by Fund shareholders and/or a temporary lack of liquidity in the markets for the securities held by the Fund may also cause the Fund's investment results to vary from its stated objective.
This chart illustrates the performance of a hypothetical $10,000 investment made at the Fund's inception, and is not intended to imply any future performance. The returns shown do not reflect the deduction of taxes that a shareholder would pay on fund distributions or the redemption of fund shares. The performance of the NASDAQ-100® Index does not reflect the deduction of fees associated with a mutual fund, such as investment management fees. Investors cannot invest directly in an index, although they can invest in its underlying securities.
The performance data shown represents past performance and does not guarantee future results.
Market Exposure2
Investment Type | | Percent of
Net Assets | |
Swap Contracts | | | (126.2 | )% | |
Total Exposure | | | (126.2 | )% | |
"Market Exposure" includes the value of total investments (including the contract value of any derivatives) and excludes any short-term investments and cash equivalents divided by Net Assets.
1 Commencement of operations.
2 As of August 31, 2017.
DIREXION ANNUAL REPORT
13
Direxion Monthly 25+ Year Treasury Bull 1.35X Fund
Performance Summary (Unaudited)
November 2, 20151 - August 31, 2017
Investment Objective: Seeks monthly investment results, before fees and expenses, of 135% of the price performance of the NYSE 25 Year Plus Treasury Bond Index.

| | | Average Annual Total Return2 | |
| | | 1 Year | | Since Inception | |
Direxion Monthly 25+ Year Treasury
Bull 1.35X Fund | | | (9.03 | )% | | | 4.27 | % | |
NYSE 25 Year Plus Treasury Bond Index | | | (6.59 | )% | | | 5.18 | % | |
The Fund seeks calendar month leveraged investment results, which should not be equated with seeking a leveraged goal for shorter than a calendar month. An investor who purchases shares on a day other than the last business day of the calendar month will generally receive more, or less, than 135% exposure to its index. Other factors such as fees and expenses, high portfolio turnover, transaction costs, significant purchases and redemption activity by Fund shareholders and/or a temporary lack of liquidity in the markets for the securities held by the Fund may also cause the Fund's investment results to vary from its stated objective.
This chart illustrates the performance of a hypothetical $10,000 investment made on the Fund's inception, and is not intended to imply any future performance. The returns shown do not reflect the deduction of taxes that a shareholder would pay on fund distributions or the redemption of fund shares. The performance of the NYSE 25 Year Plus Treasury Bond Index does not reflect the deduction of fees associated with a mutual fund, such as investment management fees. Investors cannot invest directly in an index, although they can invest in its underlying securities. During the period shown, Rafferty Asset Management, LLC waived and/or reimbursed fees for various expenses. Had these waivers and/or reimbursements not been in effect, performance would have been lower.
The performance data shown represents past performance and does not guarantee future results.
Market Exposure2
Investment Type | | Percent of
Net Assets | |
Swap Contracts | | | 99.2 | % | |
Futures Contracts | | | 35.8 | % | |
Total Exposure | | | 135.0 | % | |
"Market Exposure" includes the value of total investments (including the contract value of any derivatives) and excludes any short-term investments and cash equivalents divided by Net Assets.
1 Commencement of operations.
2 As of August 31, 2017.
DIREXION ANNUAL REPORT
14
Direxion Monthly 25+ Year Treasury Bear 1.35X Fund
Performance Summary (Unaudited)
November 2, 20151 - August 31, 2017
Investment Objective: Seeks monthly investment results, before fees and expenses, of 135% of the inverse of the price performance of the NYSE 25 Year Plus Treasury Bond Index.
| | | Average Annual Total Return2 | |
| | | 1 Year | | Since Inception | |
Direxion Monthly 25+ Year Treasury
Bear 1.35X Fund | | | 1.77 | % | | | (8.27 | )% | |
NYSE 25 Year Plus Treasury Bond Index | | | (6.59 | )% | | | 5.18 | % | |
The Fund seeks calendar month leveraged investment results, which should not be equated with seeking a leveraged goal for shorter than a calendar month. An investor who purchases shares on a day other than the last business day of the calendar month will generally receive more, or less, than -135% exposure to its index. Other factors such as fees and expenses, high portfolio turnover, transaction costs, significant purchases and redemption activity by Fund shareholders and/or a temporary lack of liquidity in the markets for the securities held by the Fund may also cause the Fund's investment results to vary from its stated objective.
This chart illustrates the performance of a hypothetical $10,000 investment made on the Fund's inception, and is not intended to imply any future performance. The returns shown do not reflect the deduction of taxes that a shareholder would pay on fund distributions or the redemption of fund shares. The performance of the NYSE 25 Year Plus Treasury Bond Index does not reflect the deduction of fees associated with a mutual fund, such as investment management fees. Investors cannot invest directly in an index, although they can invest in its underlying securities. During the period shown, Rafferty Asset Management, LLC waived and/or reimbursed fees for various expenses. Had these waivers and/or reimbursements not been in effect, performance would have been lower.
The performance data shown represents past performance and does not guarantee future results.
Market Exposure2
Investment Type | | Percent of
Net Assets | |
Swap Contracts | | | (135.1 | )% | |
Total Exposure | | | (135.1 | )% | |
"Market Exposure" includes the value of total investments (including the contract value of any derivatives) and excludes any short-term investments and cash equivalents divided by Net Assets.
1 Commencement of operations.
2 As of August 31, 2017.
DIREXION ANNUAL REPORT
15
Direxion Monthly NASDAQ-100® Bull 2X Fund
Performance Summary (Unaudited)
September 1, 2007 - August 31, 2017
Investment Objective: Seeks monthly investment results, before fees and expenses, of 200% of the price performance of the NASDAQ-100® Index.

| | | Average Annual Total Return1 | |
| | | 1 Year | | 3 Year | | 5 Year | | 10 Year | |
Direxion Monthly NASDAQ-100®
Bull 2X Fund | | | 54.55 | % | | | 26.24 | % | | | 33.96 | % | | | 14.43 | % | |
NASDAQ-100® Index | | | 27.00 | % | | | 15.02 | % | | | 18.18 | % | | | 12.82 | % | |
The Fund seeks calendar month leveraged investment results, which should not be equated with seeking a leveraged goal for shorter than a calendar month. An investor who purchases shares on a day other than the last business day of a calendar month will generally receive more, or less, than 200% exposure to the target index, depending on the performance of the target index. Other factors such as fees and expenses, high portfolio turnover, transaction costs, significant purchases and redemption activity by Fund shareholders and/or a temporary lack of liquidity in the markets for the securities held by the Fund may also cause the Fund's investment results to vary from its stated objective.
This chart illustrates the performance of a hypothetical $10,000 investment made ten years ago, and is not intended to imply any future performance. The returns shown do not reflect the deduction of taxes that a shareholder would pay on fund distributions or the redemption of fund shares. The performance of the NASDAQ-100® Index does not reflect the deduction of fees associated with a mutual fund, such as investment management fees. Investors cannot invest directly in an index, although they can invest in its underlying securities.
The performance data shown represents past performance and does not guarantee future results.
Market Exposure1
Investment Type | | Percent of
Net Assets | |
Swap Contracts | | | 200.0 | % | |
Total Exposure | | | 200.0 | % | |
"Market Exposure" includes the value of total investments (including the contract value of any derivatives) and excludes any short-term investments and cash equivalents divided by Net Assets.
1 As of August 31, 2017.
DIREXION ANNUAL REPORT
16
Direxion Monthly S&P 500® Bull 2X Fund
Performance Summary (Unaudited)
September 1, 2007 - August 31, 2017
Investment Objective: Seeks monthly investment results, before fees and expenses, of 200% of the price performance of the S&P 500® Index.

| | | Average Annual Total Return1 | |
| | | 1 Year | | 3 Year | | 5 Year | | 10 Year | |
Direxion Monthly S&P 500®
Bull 2X Fund | | | 30.33 | % | | | 15.59 | % | | | 26.22 | % | | | 4.02 | % | |
S&P 500® Index | | | 16.23 | % | | | 9.54 | % | | | 14.34 | % | | | 7.61 | % | |
The Fund seeks calendar month leveraged investment results, which should not be equated with seeking a leveraged goal for shorter than a calendar month. An investor who purchases shares on a day other than the last business day of a calendar month will generally receive more, or less, than 200% exposure to the target index, depending on the performance of the target index. Other factors such as fees and expenses, high portfolio turnover, transaction costs, significant purchases and redemption activity by Fund shareholders and/or a temporary lack of liquidity in the markets for the securities held by the Fund may also cause the Fund's investment results to vary from its stated objective.
This chart illustrates the performance of a hypothetical $10,000 investment made ten years ago, and is not intended to imply any future performance. The returns shown do not reflect the deduction of taxes that a shareholder would pay on fund distributions or the redemption of fund shares. The performance of the S&P 500® Index does not reflect the deduction of fees associated with a mutual fund, such as investment management fee. Investors cannot invest directly in an index, although they can invest in its underlying securities.
The performance data shown represents past performance and does not guarantee future results.
Market Exposure1
Investment Type | | Percent of
Net Assets | |
Swap Contracts | | | 200.0 | % | |
Total Exposure | | | 200.0 | % | |
"Market Exposure" includes the value of total investments (including the contract value of any derivatives) and excludes any short-term investments and cash equivalents divided by Net Assets.
1 As of August 31, 2017.
DIREXION ANNUAL REPORT
17
Direxion Monthly S&P 500® Bear 2X Fund
Performance Summary (Unaudited)
September 1, 2007 - August 31, 2017
Investment Objective: Seeks monthly investment results, before fees and expenses, of 200% of the inverse of the price performance of the S&P 500® Index.
| | | Average Annual Total Return1 | |
| | | 1 Year | | 3 Year | | 5 Year | | 10 Year | |
Direxion Monthly S&P 500®
Bear 2X Fund | | | (26.54 | )% | | | (19.83 | )% | | | (26.72 | )% | | | (24.68 | )% | |
S&P 500® Index | | | 16.23 | % | | | 9.54 | % | | | 14.34 | % | | | 7.61 | % | |
The Fund seeks calendar month leveraged investment results, which should not be equated with seeking a leveraged goal for shorter than a calendar month. An investor who purchases shares on a day other than the last business day of a calendar month will generally receive more, or less, than -200% exposure to the target index, depending on the performance of the target index. Other factors such as fees and expenses, high portfolio turnover, transaction costs, significant purchases and redemption activity by Fund shareholders and/or a temporary lack of liquidity in the markets for the securities held by the Fund may also cause the Fund's investment results to vary from its stated objective.
This chart illustrates the performance of a hypothetical $10,000 investment made ten years ago, and is not intended to imply any future performance. The returns shown do not reflect the deduction of taxes that a shareholder would pay on fund distributions or the redemption of fund shares. The performance of the S&P 500® Index does not reflect the deduction of fees associated with a mutual fund, such as investment management fees. Investors cannot invest directly in an index, although they can invest in its underlying securities.
The performance data shown represents past performance and does not guarantee future results.
Market Exposure1
Investment Type | | Percent of
Net Assets | |
Swap Contracts | | | (200.3 | )% | |
Total Exposure | | | (200.3 | )% | |
"Market Exposure" includes the value of total investments (including the contract value of any derivatives) and excludes any short-term investments and cash equivalents divided by Net Assets.
1 As of August 31, 2017.
DIREXION ANNUAL REPORT
18
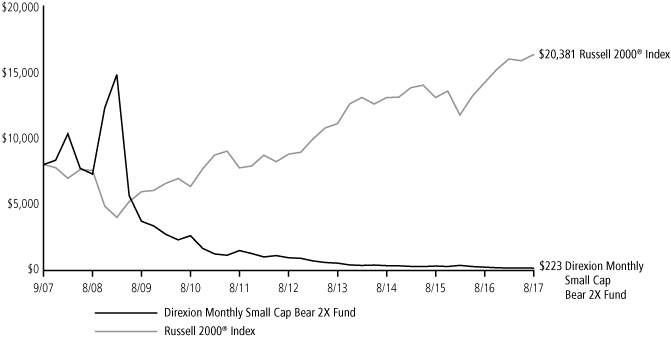
Direxion Monthly Small Cap Bull 2X Fund
Performance Summary (Unaudited)
September 1, 2007 - August 31, 2017
Investment Objective: Seeks monthly investment results, before fees and expenses, of 200% of the price performance of the Russell 2000® Index.
| | | Average Annual Total Return1 | |
| | | 1 Year | | 3 Year | | 5 Year | | 10 Year | |
Direxion Monthly Small Cap
Bull 2X Fund | | | 26.88 | % | | | 11.32 | % | | | 23.48 | % | | | 1.86 | % | |
Russell 2000® Index | | | 14.91 | % | | | 7.67 | % | | | 13.15 | % | | | 7.38 | % | |
The Fund seeks calendar month leveraged investment results, which should not be equated with seeking a leveraged goal for shorter than a calendar month. An investor who purchases shares on a day other than the last business day of the calendar month will generally receive more, or less, than 200% exposure to its index. Other factors such as fees and expenses, high portfolio turnover, transaction costs, significant purchases and redemption activity by Fund shareholders and/or a temporary lack of liquidity in the markets for the securities held by the Fund may also cause the Fund's investment results to vary from its stated objective.
This chart illustrates the performance of a hypothetical $10,000 investment made ten years ago, and is not intended to imply any future performance. The returns shown do not reflect the deduction of taxes that a shareholder would pay on fund distributions or the redemption of fund shares. The performance of the Russell 2000® Index does not reflect the deduction of fees associated with a mutual fund, such as investment management fees. Investors cannot invest directly in an index, although they can invest in its underlying securities.
The performance data shown represents past performance and does not guarantee future results.
Market Exposure1
Investment Type | | Percent of
Net Assets | |
Swap Contracts | | | 202.9 | % | |
Total Exposure | | | 202.9 | % | |
"Market Exposure" includes the value of total investments (including the contract value of any derivatives) and excludes any short-term investments and cash equivalents divided by Net Assets.
1 As of August 31, 2017.
DIREXION ANNUAL REPORT
19
Direxion Monthly Small Cap Bear 2X Fund
Performance Summary (Unaudited)
September 1, 2007 - August 31, 2017
Investment Objective: Seeks monthly investment results, before fees and expenses, of 200% of the inverse of the price performance of the Russell 2000® Index.
| | | Average Annual Total Return1 | |
| | | 1 Year | | 3 Year | | 5 Year | | 10 Year | |
Direxion Monthly Small Cap
Bear 2X Fund | | | (29.44 | )% | | | (21.29 | )% | | | (28.62 | )% | | | (31.63 | )% | |
Russell 2000® Index | | | 14.91 | % | | | 7.67 | % | | | 13.15 | % | | | 7.38 | % | |
The Fund seeks calendar month leveraged investment results, which should not be equated with seeking a leveraged goal for shorter than a calendar month. An investor who purchases shares on a day other than the last business day of the calendar month will generally receive more, or less, than -200% exposure to its index. Other factors such as fees and expenses, high portfolio turnover, transaction costs, significant purchases and redemption activity by Fund shareholders and/or a temporary lack of liquidity in the markets for the securities held by the Fund may also cause the Fund's investment results to vary from its stated objective.
This chart illustrates the performance of a hypothetical $10,000 investment made ten years ago, and is not intended to imply any future performance. The returns shown do not reflect the deduction of taxes that a shareholder would pay on fund distributions or the redemption of fund shares. The performance of the Russell 2000® Index does not reflect the deduction of fees associated with a mutual fund, such as investment management fees. Investors cannot invest directly in an index, although they can invest in its underlying securities.
The performance data shown represents past performance and does not guarantee future results.
Market Exposure1
Investment Type | | Percent of
Net Assets | |
Swap Contracts | | | (200.1 | )% | |
Total Exposure | | | (200.1 | )% | |
"Market Exposure" includes the value of total investments (including the contract value of any derivatives) and excludes any short-term investments and cash equivalents divided by Net Assets.
1 As of August 31, 2017.
DIREXION ANNUAL REPORT
20
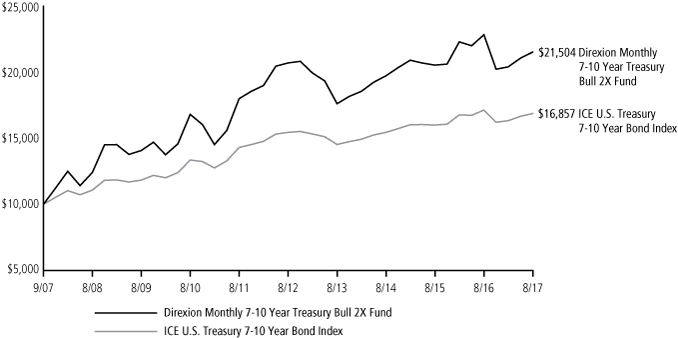
Direxion Monthly 7-10 Year Treasury Bull 2X Fund
Performance Summary (Unaudited)
September 1, 2007 - August 31, 2017
Investment Objective: The Direxion Monthly 7-10 Year Treasury Bull 2X Fund seeks monthly investment results, before fees and expenses, of 200% of the calendar month performance of the ICE U.S. Treasury 7-10 Year Bond Index.
| | | Average Annual Total Return1 | |
| | | 1 Year | | 3 Year | | 5 Year | | 10 Year | |
Direxion Monthly 7-10 Year Treasury Bull 2X Fund | | | (5.66 | )% | | | 2.95 | % | | | 0.79 | % | | | 7.96 | % | |
ICE U.S. Treasury 7-10 Year Bond Index | | | (1.52 | )% | | | 2.98 | % | | | 1.78 | % | | | 5.36 | % | |
The Fund seeks calendar month leveraged investment results, which should not be equated with seeking a leveraged goal for shorter than a calendar month. An investor who purchases shares on a day other than the last business day of the calendar month will generally receive more, or less, than 200% exposure to its index. Other factors such as fees and expenses, high portfolio turnover, transaction costs, significant purchases and redemption activity by Fund shareholders and/or a temporary lack of liquidity in the markets for the securities held by the Fund may also cause the Fund's investment results to vary from its stated objective.
This chart illustrates the performance of a hypothetical $10,000 investment made ten years ago, and is not intended to imply any future performance. The returns shown do not reflect the deduction of taxes that a shareholder would pay on fund distributions or the redemption of fund shares. The performance of the ICE U.S. Treasury 7-10 Year Bond Index does not reflect the deduction of fees associated with a mutual fund, such as investment management fees. Investors cannot invest directly in an index, although they can invest in its underlying securities.
The performance data shown represents past performance and does not guarantee future results.
Market Exposure1
Investment Type | | Percent of
Net Assets | |
Swap Contracts | | | 200.0 | % | |
Total Exposure | | | 200.0 | % | |
"Market Exposure" includes the value of total investments (including the contract value of any derivatives) and excludes any short-term investments and cash equivalents divided by Net Assets.
1 As of August 31, 2017.
DIREXION ANNUAL REPORT
21
Direxion Monthly 7-10 Year Treasury Bear 2X Fund
Performance Summary (Unaudited)
September 1, 2007 - August 31, 2017
Investment Objective: The Direxion Monthly 7-10 Year Treasury Bear 2X Fund seeks monthly investment results, before fees and expenses, of 200% of the inverse of the calendar month performance of the ICE U.S. Treasury 7-10 Year Bond Index.

| | | Average Annual Total Return1 | |
| | | 1 Year | | 3 Year | | 5 Year | | 10 Year | |
Direxion Monthly 7-10 Year Treasury Bear 2X Fund | | | 1.25 | % | | | (8.22 | )% | | | (6.18 | )% | | | (13.56 | )% | |
ICE U.S. Treasury 7-10 Year Bond Index | | | (1.52 | )% | | | 2.98 | % | | | 1.78 | % | | | 5.36 | % | |
The Fund seeks calendar month leveraged investment results, which should not be equated with seeking a leveraged goal for shorter than a calendar month. An investor who purchases shares on a day other than the last business day of the calendar month will generally receive more, or less, than -200% exposure to its index. Other factors such as fees and expenses, high portfolio turnover, transaction costs, significant purchases and redemption activity by Fund shareholders and/or a temporary lack of liquidity in the markets for the securities held by the Fund may also cause the Fund's investment results to vary from its stated objective.
This chart illustrates the performance of a hypothetical $10,000 investment made ten years ago, and is not intended to imply any future performance. The returns shown do not reflect the deduction of taxes that a shareholder would pay on fund distributions or the redemption of fund shares. The performance of the ICE U.S. Treasury 7-10 Year Bond Index does not reflect the deduction of fees associated with a mutual fund, such as investment management fees. Investors cannot invest directly in an index, although they can invest in its underlying securities.
The performance data shown represents past performance and does not guarantee future results.
Market Exposure1
| | | Percent of | |
Investment Type | | Net Assets | |
Swap Contracts | | | (200.3 | )% | |
Total Exposure | | | (200.3 | )% | |
"Market Exposure" includes the value of total investments (including the contract value of any derivatives) and excludes any short-term investments and cash equivalents divided by Net Assets.
1 As of August 31, 2017.
DIREXION ANNUAL REPORT
22
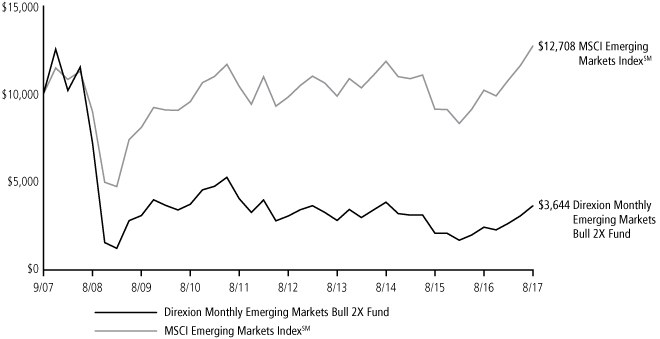
Direxion Monthly Emerging Markets Bull 2X Fund
Performance Summary (Unaudited)
September 1, 2007 - August 31, 2017
Investment Objective: Seeks monthly investment results, before fees and expenses, of 200% of the price performance of the MSCI Emerging Markets Index.
| | | Average Annual Total Return1 | |
| | | 1 Year | | 3 Year | | 5 Year | | 10 Year | |
Direxion Monthly Emerging
Markets Bull 2X Fund | | | 49.73 | % | | | (1.83 | )% | | | 3.50 | % | | | (9.60 | )% | |
MSCI Emerging Markets IndexSM | | | 24.53 | % | | | 2.38 | % | | | 5.30 | % | | | 2.43 | % | |
The Fund seeks calendar month leveraged investment results, which should not be equated with seeking a leveraged goal for shorter than a calendar month. An investor who purchases shares on a day other than the last business day of the calendar month will generally receive more, or less, than 200% exposure to its index. Other factors such as fees and expenses, high portfolio turnover, transaction costs, significant purchases and redemption activity by Fund shareholders and/or a temporary lack of liquidity in the markets for the securities held by the Fund may also cause the Fund's investment results to vary from its stated objective.
This chart illustrates the performance of a hypothetical $10,000 investment made ten years ago, and is not intended to imply any future performance. The returns shown do not reflect the deduction of taxes that a shareholder would pay on fund distributions or the redemption of fund shares. The performance of the MSCI Emerging Markets IndexSM does not reflect the deduction of fees associated with a mutual fund, such as investment management fees. Investors cannot invest directly in an index, although they can invest in its underlying securities.
The performance data shown represents past performance and does not guarantee future results.
Market Exposure1
Investment Type | | Percent of
Net Assets | |
Swap Contracts | | | 201.8 | % | |
Total Exposure | | | 201.8 | % | |
"Market Exposure" includes the value of total investments (including the contract value of any derivatives) and excludes any short-term investments and cash equivalents divided by Net Assets.
1 As of August 31, 2017.
DIREXION ANNUAL REPORT
23
Expense Example (Unaudited)
August 31, 2017
As a shareholder of a mutual fund, you incur two types of costs: (1) transaction costs, including sales charges (loads) on purchase payments, reinvested dividends, or other distributions; redemption fees and exchange fees; and (2) ongoing costs, including management fees; distribution and/or service fees; and other fund expenses. This example is intended to help you understand your ongoing costs (in dollars) of investing in a fund and to compare costs with the ongoing costs of investing in other mutual funds.
The example is based on an investment of $1,000 invested at the beginning of the period and held the entire period (March 1, 2017 – August 31, 2017).
Actual Expenses
The first line under each Fund in the following table provides information about actual account values and actual expenses. You may use the information in this line, together with the amount you invested, to estimate the expenses that you paid over the period. Simply divide your account value by $1,000 (for example, an $8,600 account value divided by $1,000 = 8.6), then multiply the result by the number in the first line for your Fund under the heading entitled "Expenses Paid During Period" to estimate the expenses you paid on your account during this period.
Hypothetical Example for Comparison Purposes
The second line under each Fund in the following table provides information about hypothetical account values and hypothetical expenses based on each Fund's actual expense ratio and an assumed rate of return of 5% per year before expenses, which is not the Fund's actual return. The hypothetical account values and expenses may not be used to estimate the actual ending account balance or expenses you paid for the period. You may use this information to compare the ongoing costs of investing in your Fund and other funds. To do so, compare this 5% hypothetical example with the 5% hypothetical examples that appear in the shareholder reports of the other Funds.
Please note that the expenses shown in the table are meant to highlight your ongoing costs only and do not reflect any transactional costs, such as wire transfers, returned checks or stop payment orders. Therefore, the second line under each Fund in the table is useful in comparing ongoing Fund costs only, and will not help you determine the relative costs of owning different funds. In addition, if these transactional costs were included, your costs would have been higher.
DIREXION ANNUAL REPORT
24
Expense Example (Unaudited)
August 31, 2017
| | | Annualized
Expense
Ratio | | Beginning
Account Value
March 1, 2017 | | Ending
Account Value
August 31, 2017 | | Expenses
Paid During
Period* | |
Direxion Monthly High Yield Bull 1.2X Fund | |
Based on actual fund return | | | 1.35 | % | | $ | 1,000.00 | | | $ | 1,026.50 | | | $ | 6.90 | | |
Based on hypothetical 5% return | | | 1.35 | % | | | 1,000.00 | | | | 1,018.40 | | | | 6.87 | | |
Direxion Monthly NASDAQ-100® Bull 1.25X Fund | |
Based on actual fund return | | | 1.15 | % | | | 1,000.00 | | | | 1,149.90 | | | | 6.23 | | |
Based on hypothetical 5% return | | | 1.15 | % | | | 1,000.00 | | | | 1,019.41 | | | | 5.85 | | |
Direxion Monthly NASDAQ-100® Bear 1.25X Fund | |
Based on actual fund return | | | 1.15 | % | | | 1,000.00 | | | | 854.90 | | | | 5.38 | | |
Based on hypothetical 5% return | | | 1.15 | % | | | 1,000.00 | | | | 1,019.41 | | | | 5.85 | | |
Direxion Monthly 25+ Year Treasury Bull 1.35X Fund | |
Based on actual fund return | | | 1.08 | % | | | 1,000.00 | | | | 1,071.70 | | | | 5.64 | | |
Based on hypothetical 5% return | | | 1.08 | % | | | 1,000.00 | | | | 1,019.76 | | | | 5.50 | | |
Direxion Monthly 25+ Year Treasury Bear 1.35X Fund | |
Based on actual fund return | | | 1.10 | % | | | 1,000.00 | | | | 908.60 | | | | 5.29 | | |
Based on hypothetical 5% return | | | 1.10 | % | | | 1,000.00 | | | | 1,019.66 | | | | 5.60 | | |
Direxion Monthly NASDAQ-100® Bull 2X Fund | |
Based on actual fund return | | | 1.35 | % | | | 1,000.00 | | | | 1,247.40 | | | | 7.65 | | |
Based on hypothetical 5% return | | | 1.35 | % | | | 1,000.00 | | | | 1,018.40 | | | | 6.87 | | |
Direxion Monthly S&P 500® Bull 2X Fund | |
Based on actual fund return | | | 1.35 | % | | | 1,000.00 | | | | 1,095.90 | | | | 7.13 | | |
Based on hypothetical 5% return | | | 1.35 | % | | | 1,000.00 | | | | 1,018.40 | | | | 6.87 | | |
Direxion Monthly S&P 500® Bear 2X Fund | |
Based on actual fund return | | | 1.35 | % | | | 1,000.00 | | | | 900.60 | | | | 6.47 | | |
Based on hypothetical 5% return | | | 1.35 | % | | | 1,000.00 | | | | 1,018.40 | | | | 6.87 | | |
Direxion Monthly Small Cap Bull 2X Fund | |
Based on actual fund return | | | 1.35 | % | | | 1,000.00 | | | | 1,025.20 | | | | 6.89 | | |
Based on hypothetical 5% return | | | 1.35 | % | | | 1,000.00 | | | | 1,018.40 | | | | 6.87 | | |
Direxion Monthly Small Cap Bear 2X Fund | |
Based on actual fund return | | | 1.35 | % | | | 1,000.00 | | | | 953.40 | | | | 6.65 | | |
Based on hypothetical 5% return | | | 1.35 | % | | | 1,000.00 | | | | 1,018.40 | | | | 6.87 | | |
Direxion Monthly 7-10 Year Treasury Bull 2X Fund | |
Based on actual fund return | | | 1.35 | % | | | 1,000.00 | | | | 1,055.10 | | | | 6.99 | | |
Based on hypothetical 5% return | | | 1.35 | % | | | 1,000.00 | | | | 1,018.40 | | | | 6.87 | | |
Direxion Monthly 7-10 Year Treasury Bear 2X Fund | |
Based on actual fund return | | | 1.35 | % | | | 1,000.00 | | | | 932.90 | | | | 6.58 | | |
Based on hypothetical 5% return | | | 1.35 | % | | | 1,000.00 | | | | 1,018.40 | | | | 6.87 | | |
Direxion Monthly Emerging Markets Bull 2X Fund | |
Based on actual fund return | | | 1.35 | % | | | 1,000.00 | | | | 1,377.10 | | | | 8.09 | | |
Based on hypothetical 5% return | | | 1.35 | % | | | 1,000.00 | | | | 1,018.40 | | | | 6.87 | | |
* Expenses are equal to the Fund's annualized expense ratio, multiplied by the average account value over the period, multiplied by 184 days (the number of days in the period of March 1, 2017 to August 31, 2017), then divided by 365.
DIREXION ANNUAL REPORT
25
Allocation of Portfolio Holdings (Unaudited)
August 31, 2017
| | | Cash* | | Investment
Companies | | Futures | | Swaps | | Total | |
Direxion Monthly High Yield Bull 1.2X Fund | | | 20 | % | | | 80 | % | | | — | | | | 0 | %** | | | 100 | % | |
Direxion Monthly NASDAQ-100® Bull 1.25X Fund | | | 98 | % | | | — | | | | — | | | | 2 | % | | | 100 | % | |
Direxion Monthly NASDAQ-100® Bear 1.25X Fund | | | 104 | % | | | — | | | | — | | | | (4 | )% | | | 100 | % | |
Direxion Monthly 25+ Year Treasury Bull 1.35X Fund | | | 98 | % | | | — | | | | 0 | %** | | | 2 | % | | | 100 | % | |
Direxion Monthly 25+ Year Treasury Bear 1.35X Fund | | | 103 | % | | | — | | | | — | | | | (3 | )% | | | 100 | % | |
Direxion Monthly NASDAQ-100® Bull 2X Fund | | | 94 | % | | | — | | | | — | | | | 6 | % | | | 100 | % | |
Direxion Monthly S&P 500® Bull 2X Fund | | | 98 | % | | | — | | | | — | | | | 2 | % | | | 100 | % | |
Direxion Monthly S&P 500® Bear 2X Fund | | | 105 | % | | | — | | | | — | | | | (5 | )% | | | 100 | % | |
Direxion Monthly Small Cap Bull 2X Fund | | | 100 | % | | | — | | | | — | | | | 0 | %** | | | 100 | % | |
Direxion Monthly Small Cap Bear 2X Fund | | | 102 | % | | | — | | | | — | | | | (2 | )% | | | 100 | % | |
Direxion Monthly 7-10 Year Treasury Bull 2X Fund | | | 98 | % | | | — | | | | — | | | | 2 | % | | | 100 | % | |
Direxion Monthly 7-10 Year Treasury Bear 2X Fund | | | 102 | % | | | — | | | | — | | | | (2 | )% | | | 100 | % | |
Direxion Monthly Emerging Markets Bull 2X Fund | | | 98 | % | | | — | | | | — | | | | 2 | % | | | 100 | % | |
Allocation of Portfolio Holdings reflects percentages of net assets.
* Cash and other assets less liabilities.
** Percentage is less than 0.5%.
DIREXION ANNUAL REPORT
26
Direxion Monthly High Yield Bull 1.2X Fund
Schedule of Investments
August 31, 2017
Shares | | | | Fair Value | |
INVESTMENT COMPANIES - 79.6% | | | |
| | 1,212,277 | | | iShares iBoxx $ High Yield
Corporate Bond ETF | | $ | 107,407,742 | | |
| | 704,973 | | | PIMCO 0-5 Year High Yield
Corporate Bond Index ETF | | | 71,674,605 | | |
| | 2,883,403 | | | SPDR® Barclays High Yield
Bond ETF | | | 107,435,596 | | |
| | | | | TOTAL INVESTMENT COMPANIES
(Cost $279,709,910) | | $ | 286,517,943 | | |
SHORT TERM INVESTMENTS - 4.4% | | | |
Money Market Funds - 4.4% | | | |
| | 15,710,000 | | | Fidelity Investments Money
Market Government
Portfolio, 0.93% (a)(b) | | $ | 15,710,000 | | |
| | | | | TOTAL SHORT TERM
INVESTMENTS
(Cost $15,710,000) | | $ | 15,710,000 | | |
| | | | | TOTAL INVESTMENTS
(Cost $295,419,910) - 84.0% | | $ | 302,227,943 | | |
| | | | | Other Assets in Excess of
Liabilities - 16.0% | | | 57,448,748 | | |
| | | | | TOTAL NET ASSETS - 100.0% | | $ | 359,676,691 | | |
Percentages are stated as a percent of net assets.
(a) Represents annualized seven-day yield at August 31, 2017.
(b) All or a portion of this security has been segregated as collateral for swap contracts. Total value of amount segregated is $15,710,000.
Long Total Return Swap Contracts
August 31, 2017
Terms of Payments
to be Received at
Termination | | Terms of Payments
to be Paid (Received) at
Termination | | Counterparty | | Termination
Date | | Contracts | | Notional
Amount | | Unrealized
Appreciation
(Depreciation) | |
Total return of iShares
iBoxx $ High Yield
Corporate Bond ETF | | (0.2217)% representing
1 month LIBOR rate + spread | | Credit Suisse
International | | 9/21/2018 | | | 404,094 | | | $ | 35,635,065 | | | $ | 193,313 | | |
Total return of PIMCO
0-5 Year High Yield
Corporate Bond Index ETF | | 1.6783% representing
1 month LIBOR rate + spread | | Credit Suisse
International | | 9/21/2018 | | | 704,973 | | | | 71,396,446 | | | | 255,889 | | |
Total return of SPDR®
Barclays High Yield
Bond ETF | | 0.9383% representing
1 month LIBOR rate + spread | | Credit Suisse
International | | 9/21/2018 | | | 961,167 | | | | 35,657,546 | | | | 160,027 | | |
| | | | | | | | | | | $ | 142,689,057 | | | $ | 609,229 | | |
The accompanying notes are an integral part of these financial statements.
DIREXION ANNUAL REPORT
27
Direxion Monthly NASDAQ-100® Bull 1.25X Fund
Schedule of Investments
August 31, 2017
Shares | | | | Fair Value | |
SHORT TERM INVESTMENTS - 25.3% | |
Money Market Funds - 25.3% | |
| | 8,640,000 | | | Fidelity Investments Money
Market Government
Portfolio, 0.93% (a)(b) | | $ | 8,640,000 | | |
| | | TOTAL SHORT TERM
INVESTMENTS
(Cost $8,640,000) | | $ | 8,640,000 | | |
| | | TOTAL INVESTMENTS
(Cost $8,640,000) - 25.3% | | $ | 8,640,000 | | |
| | | Other Assets in Excess of
Liabilities - 74.7% | | | 25,552,731 | | |
| | | TOTAL NET ASSETS - 100.0% | | $ | 34,192,731 | | |
Percentages are stated as a percent of net assets.
(a) Represents annualized seven-day yield at August 31, 2017.
(b) All or a portion of this security has been segregated as collateral for swap contracts. Total value of amount segregated is $8,640,000.
Long Total Return Swap Contracts
August 31, 2017
Terms of Payments
to be Received at
Termination | | Terms of Payments
to be Paid at
Termination | | Counterparty | | Termination
Date | | Contracts | | Notional
Amount | | Unrealized
Appreciation
(Depreciation) | |
Total return of
NASDAQ-100® Index | | 1.6306% - 1.6389% representing
1 month LIBOR rate + spread | | Bank of America
Merrill Lynch | | 9/25/2018 | | | 5,899 | | | $ | 34,549,701 | | | $ | 770,459 | | |
Total return of
NASDAQ-100® Index | | 1.6317% representing
1 month LIBOR rate + spread | | Bank of America
Merrill Lynch | | 10/26/2018 | | | 45 | | | | 267,007 | | | | 2,468 | | |
Total return of
NASDAQ-100® Index | | 1.6317% representing
1 month LIBOR rate + spread | | Bank of America
Merrill Lynch | | 10/26/2018 | | | 1,178 | | | | 7,055,281 | | | | (706 | ) | |
| | | | | | | | | | | $ | 41,871,989 | | | $ | 772,221 | | |
The accompanying notes are an integral part of these financial statements.
DIREXION ANNUAL REPORT
28
Direxion Monthly NASDAQ-100® Bear 1.25X Fund
Schedule of Investments
August 31, 2017
| | | | | Fair Value | |
No reportable investments. | |
| | | | | TOTAL INVESTMENTS
(Cost $—) - 0.0% | | $ | — | | |
| | | Other Assets in Excess of
Liabilities - 100.0% | | | 175,695 | | |
| | | TOTAL NET ASSETS - 100.0% | | $ | 175,695 | | |
Percentages are stated as a percent of net assets.
Short Total Return Swap Contracts
August 31, 2017
Terms of Payments
to be Received at
Termination | | Terms of Payments
to be Paid at
Termination | | Counterparty | | Termination
Date | | Contracts | | Notional
Amount | | Unrealized
Appreciation
(Depreciation) | |
1.0806% representing
1 month LIBOR rate + spread | | Total return of
NASDAQ-100® Index | | Bank of America
Merrill Lynch | | 8/28/2018 | | | 24 | | | $ | 138,262 | | | $ | (5,542 | ) | |
1.0806% representing
1 month LIBOR rate + spread | | Total return of
NASDAQ-100® Index | | Bank of America
Merrill Lynch | | 9/25/2018 | | | 10 | | | | 58,970 | | | | (949 | ) | |
1.0806% representing
1 month LIBOR rate + spread | | Total return of
NASDAQ-100® Index | | Bank of America
Merrill Lynch | | 10/26/2018 | | | 3 | | | | 17,585 | | | | (380 | ) | |
| | | | | | | | | | | | | $ | 214,817 | | | $ | (6,871 | ) | |
The accompanying notes are an integral part of these financial statements.
DIREXION ANNUAL REPORT
29
Direxion Monthly 25+ Year Treasury Bull 1.35X Fund
Schedule of Investments
August 31, 2017
Shares | | | | Fair Value | |
SHORT TERM INVESTMENTS - 15.1% | |
Money Market Funds - 15.1% | |
| | 2,990,000 | | | Fidelity Investments
Money Market
Government
Portfolio, 0.93% (a)(b) | | $ | 2,990,000 | | |
| | | TOTAL SHORT TERM
INVESTMENTS
(Cost $2,990,000) | | $ | 2,990,000 | | |
| | | TOTAL INVESTMENTS
(Cost $2,990,000) - 15.1% | | $ | 2,990,000 | | |
| | | Other Assets in Excess of
Liabilities - 84.9% | | | 16,849,141 | | |
| | | TOTAL NET ASSETS - 100.0% | | $ | 19,839,141 | | |
Percentages are stated as a percent of net assets.
(a) Represents annualized seven-day yield at August 31, 2017.
(b) All or a portion of this security has been segregated as collateral for swap contracts. Total value of amount segregated is $2,990,000.
Long Futures Contracts
August 31, 2017
| Reference Entity | | Expiration
Date | | Number of
Contracts | | Notional
Amount | | Value | | Unrealized
Appreciation
(Depreciation) | |
Ultra U.S. Treasury Bond | | 12/19/2017 | | | 42 | | | $ | 7,100,625 | | | $ | — | | | $ | (158 | ) | |
Long Total Return Swap Contracts
August 31, 2017
Terms of Payments
to be Received at
Termination | | Terms of Payments
to be Paid at
Termination | | Counterparty | | Termination
Date | | Contracts | | Notional
Amount | | Unrealized
Appreciation
(Depreciation) | |
Total return of
iShares 20+ Year
Treasury Bond ETF | | 0.8483% representing
1 month LIBOR rate + spread | | Credit Suisse
International | | 1/9/2018 | | | 40,000 | | | $ | 5,058,106 | | | $ | 60,422 | | |
Total return of
NYSE 25 Year Plus
Treasury Bond Index | | 1.6783% representing
1 month LIBOR rate + spread | | Credit Suisse
International | | 11/5/2018 | | | 6,699 | | | | 14,294,118 | | | | 259,069 | | |
| | | | | | | | | | | $ | 19,352,224 | | | $ | 319,491 | | |
The accompanying notes are an integral part of these financial statements.
DIREXION ANNUAL REPORT
30
Direxion Monthly 25+ Year Treasury Bear 1.35X Fund
Schedule of Investments
August 31, 2017
Shares | | | | Fair Value | |
SHORT TERM INVESTMENTS - 50.1% | |
Money Market Funds - 50.1% | |
| | 270,000 | | | Fidelity Investments
Money Market
Government
Portfolio, 0.93% (a)(b) | | $ | 270,000 | | |
| | | TOTAL SHORT TERM
INVESTMENTS
(Cost $270,000) | | $ | 270,000 | | |
| | | TOTAL INVESTMENTS
(Cost $270,000) - 50.1% | | $ | 270,000 | | |
| | | Other Assets in Excess of
Liabilities - 49.9% | | | 269,063 | | |
| | | TOTAL NET ASSETS - 100.0% | | $ | 539,063 | | |
Percentages are stated as a percent of net assets.
(a) Represents annualized seven-day yield at August 31, 2017.
(b) All or a portion of this security has been segregated as collateral for swap contracts. Total value of amount segregated is $270,000.
Short Total Return Swap Contracts
August 31, 2017
Terms of Payments
to be Received at
Termination | | Terms of Payments
to be Paid at
Termination | | Counterparty | | Termination
Date | | Contracts | | Notional
Amount | | Unrealized
Appreciation
(Depreciation) | |
0.3783% representing
1 month LIBOR rate + spread
| | Total return of
NYSE 25 Year Plus
Treasury Bond Index | | Credit Suisse
International | | 11/5/2018 | | | 335 | | | $ | 713,008 | | | $ | (15,232 | ) | |
The accompanying notes are an integral part of these financial statements.
DIREXION ANNUAL REPORT
31
Direxion Monthly NASDAQ-100® Bull 2X Fund
Schedule of Investments
August 31, 2017
Shares | | | | Fair Value | |
SHORT TERM INVESTMENTS - 44.8% | |
Money Market Funds - 44.8% | |
| | 73,470,000 | | | Fidelity Investments Money
Market Government
Portfolio, 0.93% (a)(b) | | $ | 73,470,000 | | |
| | | TOTAL SHORT TERM
INVESTMENTS
(Cost $73,470,000) | | $ | 73,470,000 | | |
| | | TOTAL INVESTMENTS
(Cost $73,470,000) - 44.8% | | $ | 73,470,000 | | |
| | | Other Assets in Excess of
Liabilities - 55.2% | | | 90,626,700 | | |
| | | TOTAL NET ASSETS - 100.0% | | $ | 164,096,700 | | |
Percentages are stated as a percent of net assets.
(a) Represents annualized seven-day yield at August 31, 2017.
(b) All or a portion of this security has been segregated as collateral for swap contracts. Total value of amount segregated is $73,470,000.
Long Total Return Swap Contracts
August 31, 2017
Terms of Payments
to be Received at
Termination | | Terms of Payments
to be Paid at
Termination | | Counterparty | | Termination
Date | | Contracts | | Notional
Amount | | Unrealized
Appreciation
(Depreciation) | |
Total return of
NASDAQ-100® Index | | 1.6310% representing
1 month LIBOR rate + spread | | Bank of America
Merrill Lynch | | 12/4/2017 | | | 3,325 | | | $ | 19,339,903 | | | $ | 548,399 | | |
Total return of
NASDAQ-100® Index | | 1.6310% representing
1 month LIBOR rate + spread | | Bank of America
Merrill Lynch | | 7/26/2018 | | | 18,358 | | | | 106,558,435 | | | | 3,298,784 | | |
Total return of
NASDAQ-100® Index | | 1.6310% representing
1 month LIBOR rate + spread | | Bank of America
Merrill Lynch | | 8/28/2018 | | | 16,821 | | | | 97,641,418 | | | | 3,082,230 | | |
Total return of
NASDAQ-100® Index | | 1.6310% - 1.6361% representing
1 month LIBOR rate + spread | | Bank of America
Merrill Lynch | | 9/25/2018 | | | 8,228 | | | | 48,201,425 | | | | 1,081,949 | | |
Total return of
NASDAQ-100® Index | | 1.6783% representing
1 month LIBOR rate + spread | | Credit Suisse
International | | 9/28/2018 | | | 8,100 | | | | 47,347,683 | | | | 1,154,699 | | |
| | | | | | | | | | | $ | 319,088,864 | | | $ | 9,166,061 | | |
The accompanying notes are an integral part of these financial statements.
DIREXION ANNUAL REPORT
32
Direxion Monthly S&P 500® Bull 2X Fund
Schedule of Investments
August 31, 2017
Shares | | | | Fair Value | |
SHORT TERM INVESTMENTS - 19.8% | |
Money Market Funds - 19.8% | |
| | 14,410,000 | | | Fidelity Investments Money
Market Government
Portfolio, 0.93% (a)(b) | | $ | 14,410,000 | | |
| | | TOTAL SHORT TERM
INVESTMENTS
(Cost $14,410,000) | | $ | 14,410,000 | | |
| | | TOTAL INVESTMENTS
(Cost $14,410,000) - 19.8% | | $ | 14,410,000 | | |
| | | Other Assets in Excess of
Liabilities - 80.2% | | | 58,190,702 | | |
| | | TOTAL NET ASSETS - 100.0% | | $ | 72,600,702 | | |
Percentages are stated as a percent of net assets.
(a) Represents annualized seven-day yield at August 31, 2017.
(b) All or a portion of this security has been segregated as collateral for swap contracts. Total value of amount segregated is $14,410,000.
The accompanying notes are an integral part of these financial statements.
Long Total Return Swap Contracts
August 31, 2017
Terms of Payments
to be Received at
Termination | | Terms of Payments
to be Paid at
Termination | | Counterparty | | Termination
Date | | Contracts | | Notional
Amount | | Unrealized
Appreciation
(Depreciation) | |
Total return of
S&P 500® Index | | 1.5483% representing
1 month LIBOR rate + spread | | Credit Suisse
International | | 12/1/2017 | | | 58,744 | | | $ | 143,577,770 | | | $ | 1,656,861 | | |
DIREXION ANNUAL REPORT
33
Direxion Monthly S&P 500® Bear 2X Fund
Schedule of Investments
August 31, 2017
Shares | | | | Fair Value | |
SHORT TERM INVESTMENTS - 23.6% | |
Money Market Funds - 23.6% | |
| | 4,910,000 | | | Fidelity Institutional Money
Market Funds -
Government
Portfolio, 0.93% (a)(b) | | $ | 4,910,000 | | |
| | | TOTAL SHORT TERM
INVESTMENTS
(Cost $4,910,000) | | $ | 4,910,000 | | |
| | | TOTAL INVESTMENTS
(Cost $4,910,000) - 23.6% | | $ | 4,910,000 | | |
| | | Other Assets in Excess of
Liabilities - 76.4% | | | 15,922,140 | | |
| | | TOTAL NET ASSETS - 100.0% | | $ | 20,832,140 | | |
Percentages are stated as a percent of net assets.
(a) Represents annualized seven-day yield at August 31, 2017.
(b) All or a portion of this security has been segregated as collateral for swap contracts. Total value of amount segregated is $4,910,000.
Short Total Return Swap Contracts
August 31, 2017
Terms of Payments
to be Received at
Termination | | Terms of Payments
to be Paid at
Termination | | Counterparty | | Termination
Date | | Contracts | | Notional
Amount | | Unrealized
Appreciation
(Depreciation) | |
1.3783% representing
1 month LIBOR rate + spread | | Total return of
S&P 500® Index | | Credit Suisse
International | | 12/4/2017 | | | 16,858 | | | $ | 40,676,829 | | | $ | (1,048,859 | ) | |
The accompanying notes are an integral part of these financial statements.
DIREXION ANNUAL REPORT
34
Direxion Monthly Small Cap Bull 2X Fund
Schedule of Investments
August 31, 2017
Shares | | | | Fair Value | |
SHORT TERM INVESTMENTS - 20.4% | |
Money Market Funds - 20.4% | |
| | 3,330,000 | | | Fidelity Investments Money
Market Government
Portfolio, 0.93% (a)(b) | | $ | 3,330,000 | | |
| | | TOTAL SHORT TERM
INVESTMENTS
(Cost $3,330,000) | | $ | 3,330,000 | | |
| | | TOTAL INVESTMENTS
(Cost $3,330,000) - 20.4% | | $ | 3,330,000 | | |
| | | Other Assets in Excess of
Liabilities - 79.6% | | | 12,986,223 | | |
| | | TOTAL NET ASSETS - 100.0% | | $ | 16,316,223 | | |
Percentages are stated as a percent of net assets.
(a) Represents annualized seven-day yield at August 31, 2017.
(b) All or a portion of this security has been segregated as collateral for swap contracts. Total value of amount segregated is $3,330,000.
Long Total Return Swap Contracts
August 31, 2017
Terms of Payments
to be Received at
Termination | | Terms of Payments
to be Paid at
Termination | | Counterparty | | Termination
Date | | Contracts | | Notional
Amount | | Unrealized
Appreciation
(Depreciation) | |
Total return of
Russell 2000® Index | | 1.1483% representing
1 month LIBOR rate + spread | | Credit Suisse
International | | 3/7/2018 | | | 23,559 | | | $ | 33,106,992 | | | $ | 4,691 | | |
The accompanying notes are an integral part of these financial statements.
DIREXION ANNUAL REPORT
35
Direxion Monthly Small Cap Bear 2X Fund
Schedule of Investments
August 31, 2017
Shares | | | | Fair Value | |
SHORT TERM INVESTMENTS - 19.1% | |
Money Market Funds - 19.1% | |
| | 1,100,000 | | | Fidelity Institutional Money
Market Funds - Government
Portfolio, 0.93% (a)(b) | | $ | 1,100,000 | | |
| | | TOTAL SHORT TERM INVESTMENTS
(Cost $1,100,000) | | $ | 1,100,000 | | |
| | | TOTAL INVESTMENTS
(Cost $1,100,000) - 19.1% | | $ | 1,100,000 | | |
| | | Other Assets in Excess of
Liabilities - 80.9% | | | 4,672,455 | | |
| | | TOTAL NET ASSETS - 100.0% | | $ | 5,772,455 | | |
Percentages are stated as a percent of net assets.
(a) Represents annualized seven-day yield at August 31, 2017.
(b) All or a portion of this security has been segregated as collateral for swap contracts. Total value of amount segregated is $1,100,000.
Short Total Return Swap Contracts
August 31, 2017
Terms of Payments
to be Received at
Termination | | Terms of Payments
to be Paid at
Termination | | Counterparty | | Termination
Date | | Contracts | | Notional
Amount | | Unrealized
Appreciation
(Depreciation) | |
0.9383% representing
1 month LIBOR rate + spread | | Total return of
Russell 2000® Index | | Credit Suisse
International | | 4/23/2018 | | | 8,216 | | | $ | 11,417,462 | | | $ | (131,725 | ) | |
The accompanying notes are an integral part of these financial statements.
DIREXION ANNUAL REPORT
36
Direxion Monthly 7-10 Year Treasury Bull 2X Fund
Schedule of Investments
August 31, 2017
Shares | | | | Fair Value | |
SHORT TERM INVESTMENTS - 29.5% | |
Money Market Funds - 29.5% | |
| | 4,460,000 | | | Fidelity Investments Money
Market Government
Portfolio, 0.93% (a)(b) | | $ | 4,460,000 | | |
| | | TOTAL SHORT TERM
INVESTMENTS
(Cost $4,460,000) | | $ | 4,460,000 | | |
| | | TOTAL INVESTMENTS
(Cost $4,460,000) - 29.5% | | $ | 4,460,000 | | |
| | | Other Assets in Excess of
Liabilities - 70.5% | | | 10,682,152 | | |
| | | TOTAL NET ASSETS - 100.0% | | $ | 15,142,152 | | |
Percentages are stated as a percent of net assets.
(a) Represents annualized seven-day yield at August 31, 2017.
(b) All or a portion of this security has been segregated as collateral for swap contracts. Total value of amount segregated is $4,460,000.
Long Total Return Swap Contracts
August 31, 2017
Terms of Payments
to be Received at
Termination | | Terms of Payments
to be Paid at
Termination | | Counterparty | | Termination
Date | | Contracts | | Notional
Amount | | Unrealized
Appreciation
(Depreciation) | |
Total return of
iShares 7-10 Year
Treasury Bond ETF | | 0.5983% representing
1 month LIBOR rate + spread | | Credit Suisse
International | | 12/4/2017 | | | 279,830 | | | $ | 29,963,088 | | | $ | 314,932 | | |
The accompanying notes are an integral part of these financial statements.
DIREXION ANNUAL REPORT
37
Direxion Monthly 7-10 Year Treasury Bear 2X Fund
Schedule of Investments
August 31, 2017
Shares | | | | Fair Value | |
SHORT TERM INVESTMENTS - 30.3% | |
Money Market Funds - 30.3% | |
| | 1,550,000 | | | Fidelity Investments Money
Market Government
Portfolio, 0.93% (a)(b) | | $ | 1,550,000 | | |
| | | TOTAL SHORT TERM INVESTMENTS
(Cost $1,550,000) | | $ | 1,550,000 | | |
| | | TOTAL INVESTMENTS
(Cost $1,550,000) - 30.3% | | $ | 1,550,000 | | |
| | | Other Assets in Excess of
Liabilities - 69.7% | | | 3,570,232 | | |
| | | TOTAL NET ASSETS - 100.0% | | $ | 5,120,232 | | |
Percentages are stated as a percent of net assets.
(a) Represents annualized seven-day yield at August 31, 2017.
(b) All or a portion of this security has been segregated as collateral for swap contracts. Total value of amount segregated is $1,550,000.
Short Total Return Swap Contracts
August 31, 2017
Terms of Payments
to be Received at
Termination | | Terms of Payments
to be Paid at
Termination | | Counterparty | | Termination
Date | | Contracts | | Notional
Amount | | Unrealized
Appreciation
(Depreciation) | |
0.3383% representing
1 month LIBOR rate + spread | | Total return of
iShares 7-10 Year
Treasury Bond ETF | | Credit Suisse
International | | 1/19/2018 | | | 94,646 | | | $ | 10,131,347 | | | $ | (122,159 | ) | |
The accompanying notes are an integral part of these financial statements.
DIREXION ANNUAL REPORT
38
Direxion Monthly Emerging Markets Bull 2X Fund
Schedule of Investments
August 31, 2017
Shares | | | | Fair Value | |
SHORT TERM INVESTMENTS - 37.8% | |
Money Market Funds - 37.8% | |
| | 3,740,000 | | | Fidelity Investments Money
Market Government
Portfolio, 0.93% (a)(b) | | $ | 3,740,000 | | |
| | | TOTAL SHORT TERM INVESTMENTS
(Cost $3,740,000) | | $ | 3,740,000 | | |
| | | TOTAL INVESTMENTS
(Cost $3,740,000) - 37.8% | | $ | 3,740,000 | | |
| | | Other Assets in Excess of
Liabilities - 62.2% | | | 6,159,941 | | |
| | | TOTAL NET ASSETS - 100.0% | | $ | 9,899,941 | | |
Percentages are stated as a percent of net assets.
(a) Represents annualized seven-day yield at August 31, 2017.
(b) All or a portion of this security has been segregated as collateral for swap contracts. Total value of amount segregated is $3,740,000.
Long Total Return Swap Contracts
August 31, 2017
Terms of Payments
to be Received at
Termination | | Terms of Payments
to be Paid at
Termination | | Counterparty | | Termination
Date | | Contracts | | Notional
Amount | | Unrealized
Appreciation
(Depreciation) | |
Total return of iShares
MSCI Emerging
Markets ETF | | 0.9983% representing
1 month LIBOR rate + spread | | Credit Suisse
International | | 12/4/2017 | | | 445,933 | | | $ | 19,804,401 | | | $ | 178,239 | | |
The accompanying notes are an integral part of these financial statements.
DIREXION ANNUAL REPORT
39
Statements of Assets & Liabilities
August 31, 2017
| | | Direxion Monthly
High Yield Bull
1.2X Fund | | Direxion Monthly
NASDAQ-100®
Bull 1.25X Fund | | Direxion Monthly
NASDAQ-100®
Bear 1.25X Fund | |
Assets: | |
Investments, at fair value (Note 2) | | $ | 302,227,943 | | | $ | 8,640,000 | | | $ | — | | |
Cash | | | 36,502,743 | | | | 18,963,257 | | | | 180,941 | | |
Receivable for Fund shares sold | | | 97,416,454 | | | | 6,097,570 | | | | 2,003 | | |
Unrealized appreciation on swap contracts | | | 609,229 | | | | 772,927 | | | | — | | |
Dividends and interest receivable | | | 55,372 | | | | 14,187 | | | | 155 | | |
Total Assets | | | 436,811,741 | | | | 34,487,941 | | | | 183,099 | | |
Liabilities: | |
Payable for Fund shares redeemed | | | 241,033 | | | | 276,237 | | | | — | | |
Investment securities purchased | | | 76,063,073 | | | | — | | | | — | | |
Due to broker for swap contracts | | | 440,000 | | | | — | | | | 341 | | |
Unrealized depreciation on swap contracts | | | — | | | | 706 | | | | 6,871 | | |
Accrued investment advisory fees | | | 217,191 | | | | 11,863 | | | | 125 | | |
Accrued operating services fees | | | 101,356 | | | | 2,373 | | | | 25 | | |
Accrued distribution expenses | | | 72,397 | | | | 3,954 | | | | 42 | | |
Other liabilities | | | — | | | | 77 | | | | — | | |
Total Liabilities | | | 77,135,050 | | | | 295,210 | | | | 7,404 | | |
Net Assets | | $ | 359,676,691 | | | $ | 34,192,731 | | | $ | 175,695 | | |
Net Assets Consist of: | |
Capital stock | | $ | 355,314,943 | | | $ | 33,308,644 | | | $ | 400,810 | | |
Accumulated net investment loss | | | — | | | | — | | | | (233 | ) | |
Undistributed (Accumulated) net realized gain (loss) | | | (3,055,514 | ) | | | 111,866 | | | | (218,011 | ) | |
Net unrealized appreciation (depreciation) on: | |
Investments | | | 6,808,033 | | | | — | | | | — | | |
Swap contracts | | | 609,229 | | | | 772,221 | | | | (6,871 | ) | |
Total Net Assets | | $ | 359,676,691 | | | $ | 34,192,731 | | | $ | 175,695 | | |
Calculation of Net Asset Value Per Share: | |
Net assets | | $ | 359,676,691 | | | $ | 34,192,731 | | | $ | 175,695 | | |
Shares outstanding (unlimited shares of beneficial
interest authorized, no par value) | | | 14,895,850 | | | | 1,197,739 | | | | 13,296 | | |
Net asset value, redemption price and offering
price per share | | $ | 24.1461 | | | $ | 28.5477 | | | $ | 13.2141 | | |
Cost of Investments | | $ | 295,419,910 | | | $ | 8,640,000 | | | $ | — | | |
The accompanying notes are an integral part of these financial statements.
DIREXION ANNUAL REPORT
40
Statements of Assets & Liabilities
August 31, 2017
| | | Direxion Monthly
25+ Year Treasury
Bull 1.35X Fund | | Direxion Monthly
25+ Year Treasury
Bear 1.35X Fund | | Direxion Monthly
NASDAQ-100®
Bull 2X Fund | |
Assets: | |
Investments, at fair value (Note 2) | | $ | 2,990,000 | | | $ | 270,000 | | | $ | 73,470,000 | | |
Cash | | | 11,618,915 | | | | 268,459 | | | | 91,068,286 | | |
Receivable for Fund shares sold | | | 5,164,073 | | | | 17,550 | | | | 440,721 | | |
Due from broker for swap contracts | | | — | | | | — | | | | 257,320 | | |
Unrealized appreciation on swap contracts | | | 319,491 | | | | — | | | | 9,166,061 | | |
Dividends and interest receivable | | | 46,870 | | | | 1,454 | | | | 133,971 | | |
Total Assets | | | 20,139,349 | | | | 557,463 | | | | 174,536,359 | | |
Liabilities: | |
Payable for Fund shares redeemed | | | 5,017 | | | | — | | | | 7,207,717 | | |
Due to broker for swap contracts | | | 239,783 | | | | 1,394 | | | | 3,030,000 | | |
Unrealized depreciation on swap contracts | | | — | | | | 15,232 | | | | — | | |
Due to broker for futures contracts | | | 158 | | | | — | | | | — | | |
Accrued investment advisory fees | | | 36,999 | | | | 1,210 | | | | 110,363 | | |
Accrued operating services fees | | | 5,215 | | | | 161 | | | | 51,503 | | |
Accrued distribution expenses | | | 13,036 | | | | 403 | | | | 36,788 | | |
Other liabilities | | | — | | | | — | | | | 3,288 | | |
Total Liabilities | | | 300,208 | | | | 18,400 | | | | 10,439,659 | | |
Net Assets | | $ | 19,839,141 | | | $ | 539,063 | | | $ | 164,096,700 | | |
Net Assets Consist of: | |
Capital stock | | $ | 19,843,069 | | | $ | 3,731,478 | | | $ | 148,989,158 | | |
Accumulated net investment loss | | | — | | | | (96,590 | ) | | | — | | |
Undistributed (Accumulated) net realized gain (loss) | | | (323,261 | ) | | | (3,080,593 | ) | | | 5,941,481 | | |
Net unrealized appreciation (depreciation) on: | |
Futures contracts | | | (158 | ) | | | — | | | | — | | |
Swap contracts | | | 319,491 | | | | (15,232 | ) | | | 9,166,061 | | |
Total Net Assets | | $ | 19,839,141 | | | $ | 539,063 | | | $ | 164,096,700 | | |
Calculation of Net Asset Value Per Share: | |
Net assets | | $ | 19,839,141 | | | $ | 539,063 | | | $ | 164,096,700 | | |
Shares outstanding (unlimited shares of beneficial
interest authorized, no par value) | | | 918,810 | | | | 31,565 | | | | 1,647,203 | | |
Net asset value, redemption price and offering
price per share | | $ | 21.5922 | | | $ | 17.0779 | | | $ | 99.62 | | |
Cost of Investments | | $ | 2,990,000 | | | $ | 270,000 | | | $ | 73,470,000 | | |
The accompanying notes are an integral part of these financial statements.
DIREXION ANNUAL REPORT
41
Statements of Assets & Liabilities
August 31, 2017
| | | Direxion Monthly
S&P 500® Bull
2X Fund | | Direxion Monthly
S&P 500® Bear
2X Fund | | Direxion Monthly
Small Cap Bull
2X Fund | | Direxion Monthly
Small Cap Bear
2X Fund | |
Assets: | |
Investments, at fair value (Note 2) | | $ | 14,410,000 | | | $ | 4,910,000 | | | $ | 3,330,000 | | | $ | 1,100,000 | | |
Cash | | | 57,398,586 | | | | 17,142,635 | | | | 12,313,554 | | | | 4,808,783 | | |
Receivable for Fund shares sold | | | 429,937 | | | | 152,532 | | | | 300,303 | | | | 163,620 | | |
Due from broker for swap contracts | | | 5,194 | | | | — | | | | 840,119 | | | | 2,259 | | |
Unrealized appreciation on swap
contracts | | | 1,656,861 | | | | — | | | | 4,691 | | | | — | | |
Dividends and interest receivable | | | 56,452 | | | | 10,693 | | | | 14,356 | | | | 4,558 | | |
Other assets | | | — | | | | — | | | | 408 | | | | — | | |
Total Assets | | | 73,957,030 | | | | 22,215,860 | | | | 16,803,431 | | | | 6,079,220 | | |
Liabilities: | |
Payable for Fund shares redeemed | | | 433,487 | | | | 295,693 | | | | 465,797 | | | | 168,078 | | |
Due to broker for swap contracts | | | 840,000 | | | | 23,665 | | | | — | | | | — | | |
Unrealized depreciation on swap
contracts | | | — | | | | 1,048,859 | | | | — | | | | 131,725 | | |
Accrued investment advisory fees | | | 45,868 | | | | 8,613 | | | | 11,884 | | | | 3,778 | | |
Accrued operating services fees | | | 21,402 | | | | 4,019 | | | | 5,546 | | | | 1,763 | | |
Accrued distribution expenses | | | 15,289 | | | | 2,871 | | | | 3,961 | | | | 1,259 | | |
Other liabilities | | | 282 | | | | — | | | | 20 | | | | 162 | | |
Total Liabilities | | | 1,356,328 | | | | 1,383,720 | | | | 487,208 | | | | 306,765 | | |
Net Assets | | $ | 72,600,702 | | | $ | 20,832,140 | | | $ | 16,316,223 | | | $ | 5,772,455 | | |
Net Assets Consist of: | |
Capital stock | | $ | 67,631,579 | | | $ | 69,234,682 | | | $ | 16,311,532 | | | $ | 55,894,475 | | |
Accumulated net investment loss | | | — | | | | (39,778 | ) | | | — | | | | (28,824 | ) | |
Undistributed (Accumulated)
net realized gain (loss) | | | 3,312,262 | | | | (47,313,905 | ) | | | — | | | | (49,961,471 | ) | |
Net unrealized appreciation
(depreciation) on: | |
Swap contracts | | | 1,656,861 | | | | (1,048,859 | ) | | | 4,691 | | | | (131,725 | ) | |
Total Net Assets | | $ | 72,600,702 | | | $ | 20,832,140 | | | $ | 16,316,223 | | | $ | 5,772,455 | | |
Calculation of Net Asset Value Per
Share: | |
Net assets | | $ | 72,600,702 | | | $ | 20,832,140 | | | $ | 16,316,223 | | | $ | 5,772,455 | | |
Shares outstanding (unlimited shares
of beneficial interest authorized,
no par value) | | | 582,201 | | | | 1,235,951 | | | | 251,927 | | | | 313,629 | | |
Net asset value, redemption price
and offering price per share | | $ | 124.70 | | | $ | 16.86 | | | $ | 64.77 | | | $ | 18.41 | | |
Cost of Investments | | $ | 14,410,000 | | | $ | 4,910,000 | | | $ | 3,330,000 | | | $ | 1,100,000 | | |
The accompanying notes are an integral part of these financial statements.
DIREXION ANNUAL REPORT
42
Statements of Assets & Liabilities
August 31, 2017
| | | Direxion Monthly
7-10 Year Treasury
Bull 2X Fund | | Direxion Monthly
7-10 Year Treasury
Bear 2X Fund | | Direxion Monthly
Emerging Markets
Bull 2X Fund | |
Assets: | |
Investments, at fair value (Note 2) | | $ | 4,460,000 | | | $ | 1,550,000 | | | $ | 3,740,000 | | |
Cash | | | 10,917,757 | | | | 3,693,934 | | | | 5,739,648 | | |
Receivable for Fund shares sold | | | 1,936 | | | | 4,800 | | | | 320,991 | | |
Unrealized appreciation on swap contracts | | | 314,932 | | | | — | | | | 178,239 | | |
Dividends and interest receivable | | | 10,666 | | | | 4,203 | | | | 7,236 | | |
Total Assets | | | 15,705,291 | | | | 5,252,937 | | | | 9,986,114 | | |
Liabilities: | |
Payable for Fund shares redeemed | | | 248,263 | | | | 2,000 | | | | 75,455 | | |
Due to broker for swap contracts | | | 299,111 | | | | 2,446 | | | | — | | |
Unrealized depreciation on swap contracts | | | — | | | | 122,159 | | | | — | | |
Accrued investment advisory fees | | | 8,759 | | | | 3,389 | | | | 5,896 | | |
Accrued operating services fees | | | 4,087 | | | | 1,581 | | | | 2,751 | | |
Accrued distribution expenses | | | 2,919 | | | | 1,130 | | | | 1,965 | | |
Other liabilities | | | — | | | | — | | | | 106 | | |
Total Liabilities | | | 563,139 | | | | 132,705 | | | | 86,173 | | |
Net Assets | | $ | 15,142,152 | | | $ | 5,120,232 | | | $ | 9,899,941 | | |
Net Assets Consist of: | |
Capital stock | | $ | 17,065,080 | | | $ | 27,468,074 | | | $ | 54,986,359 | | |
Accumulated net investment loss | | | (62,568 | ) | | | (23,443 | ) | | | (26,026 | ) | |
Accumulated net realized loss | | | (2,175,292 | ) | | | (22,202,240 | ) | | | (45,238,631 | ) | |
Net unrealized appreciation (depreciation) on: | |
Swap contracts | | | 314,932 | | | | (122,159 | ) | | | 178,239 | | |
Total Net Assets | | $ | 15,142,152 | | | $ | 5,120,232 | | | $ | 9,899,941 | | |
Calculation of Net Asset Value Per Share: | |
Net assets | | $ | 15,142,152 | | | $ | 5,120,232 | | | $ | 9,899,941 | | |
Shares outstanding (unlimited shares of beneficial
interest authorized, no par value) | | | 420,401 | | | | 180,681 | | | | 185,046 | | |
Net asset value, redemption price and offering
price per share | | $ | 36.02 | | | $ | 28.34 | | | $ | 53.50 | | |
Cost of Investments | | $ | 4,460,000 | | | $ | 1,550,000 | | | $ | 3,740,000 | | |
The accompanying notes are an integral part of these financial statements.
DIREXION ANNUAL REPORT
43
Statements of Operations
For the Year Ended August 31, 2017
| | | Direxion Monthly
High Yield Bull
1.2X Fund | | Direxion Monthly
NASDAQ-100®
Bull 1.25X Fund | | Direxion Monthly
NASDAQ-100®
Bear 1.25X Fund | |
Investment Income: | |
Dividend income | | $ | 11,844,642 | | | $ | — | | | $ | — | | |
Interest income | | | 316,550 | | | | 72,722 | | | | 519 | | |
Total investment income | | | 12,161,192 | | | | 72,722 | | | | 519 | | |
Expenses: | |
Investment advisory fees | | | 2,052,879 | | | | 95,244 | | | | 567 | | |
Operating services fees | | | 958,010 | | | | 19,049 | | | | 113 | | |
Distribution expenses | | | 684,293 | | | | 31,748 | | | | 189 | | |
Total expenses | | | 3,695,182 | | | | 146,041 | | | | 869 | | |
Less: Reimbursement of expenses from Adviser (Note 4) | | | — | | | | (2,380 | ) | | | — | | |
Net expenses | | | 3,695,182 | | | | 143,661 | | | | 869 | | |
Net investment income (loss) | | | 8,466,010 | | | | (70,939 | ) | | | (350 | ) | |
Realized and unrealized gain (loss) on investments: | |
Net realized gain (loss) on: | |
Investments | | | (2,174,359 | ) | | | — | | | | — | | |
Swap contracts | | | 7,020,687 | | | | 6,217,560 | | | | (13,338 | ) | |
| | | | 4,846,328 | | | | 6,217,560 | | | | (13,338 | ) | |
Change in net unrealized appreciation (depreciation) on: | |
Investments | | | 4,477,402 | | | | — | | | | — | | |
Swap contracts | | | (581,601 | ) | | | 772,634 | | | | (6,526 | ) | |
| | | | 3,895,801 | | | | 772,634 | | | | (6,526 | ) | |
Net realized and unrealized gain (loss) on investments | | | 8,742,129 | | | | 6,990,194 | | | | (19,864 | ) | |
Net increase (decrease) in net assets resulting
from operations | | $ | 17,208,139 | | | $ | 6,919,255 | | | $ | (20,214 | ) | |
The accompanying notes are an integral part of these financial statements.
DIREXION ANNUAL REPORT
44
Statements of Operations
For the Year Ended August 31, 2017
| | | Direxion Monthly
25+ Year Treasury
Bull 1.35X Fund | | Direxion Monthly
25+ Year Treasury
Bear 1.35X Fund | | Direxion Monthly
NASDAQ-100®
Bull 2X Fund | |
Investment Income: | |
Interest income | | $ | 132,071 | | | $ | 102,340 | | | $ | 851,556 | | |
Total investment income | | | 132,071 | | | | 102,340 | | | | 851,556 | | |
Expenses: | |
Investment advisory fees | | | 161,902 | | | | 169,800 | | | | 1,106,671 | | |
Operating services fees | | | 21,587 | | | | 22,640 | | | | 516,447 | | |
Distribution expenses | | | 53,968 | | | | 56,600 | | | | 368,890 | | |
Total expenses | | | 237,457 | | | | 249,040 | | | | 1,992,008 | | |
Less: Reimbursement of expenses from Adviser (Note 4) | | | (8,218 | ) | | | (24,848 | ) | | | — | | |
Net expenses | | | 229,239 | | | | 224,192 | | | | 1,992,008 | | |
Net investment loss | | | (97,168 | ) | | | (121,852 | ) | | | (1,140,452 | ) | |
Realized and unrealized gain (loss) on investments: | |
Net realized gain (loss) on: | |
Futures contracts | | | 1,082,288 | | | | (1,255,922 | ) | | | — | | |
Swap contracts | | | 215,122 | | | | (908,858 | ) | | | 51,996,714 | | |
| | | | 1,297,410 | | | | (2,164,780 | ) | | | 51,996,714 | | |
Change in net unrealized appreciation (depreciation) on: | |
Futures contracts | | | (158 | ) | | | 98,792 | | | | — | | |
Swap contracts | | | 316,960 | | | | 5,168 | | | | 9,405,316 | | |
| | | | 316,802 | | | | 103,960 | | | | 9,405,316 | | |
Net realized and unrealized gain (loss) on investments | | | 1,614,212 | | | | (2,060,820 | ) | | | 61,402,030 | | |
Net increase (decrease) in net assets resulting
from operations | | $ | 1,517,044 | | | $ | (2,182,672 | ) | | $ | 60,261,578 | | |
The accompanying notes are an integral part of these financial statements.
DIREXION ANNUAL REPORT
45
Statements of Operations
For the Year Ended August 31, 2017
| | | Direxion Monthly
S&P 500® Bull
2X Fund | | Direxion Monthly
S&P 500® Bear
2X Fund | | Direxion Monthly
Small Cap Bull
2X Fund | | Direxion Monthly
Small Cap Bear
2X Fund | |
Investment Income: | |
Interest income | | $ | 334,119 | | | $ | 56,290 | | | $ | 114,005 | | | $ | 36,276 | | |
Total investment income | | | 334,119 | | | | 56,290 | | | | 114,005 | | | | 36,276 | | |
Expenses: | |
Investment advisory fees | | | 441,902 | | | | 73,341 | | | | 156,062 | | | | 49,815 | | |
Operating services fees | | | 206,221 | | | | 34,226 | | | | 72,829 | | | | 23,247 | | |
Distribution expenses | | | 147,300 | | | | 24,447 | | | | 52,020 | | | | 16,605 | | |
Excise taxes | | | — | | | | — | | | | — | | | | 10 | | |
Total expenses | | | 795,423 | | | | 132,014 | | | | 280,911 | | | | 89,677 | | |
Net investment loss | | | (461,304 | ) | | | (75,724 | ) | | | (166,906 | ) | | | (53,401 | ) | |
Realized and unrealized gain
(loss) on investments: | |
Net realized gain (loss) on: | |
Swap contracts | | | 14,982,272 | | | | (2,633,504 | ) | | | 4,224,658 | | | | (3,470,251 | ) | |
| | | | 14,982,272 | | | | (2,633,504 | ) | | | 4,224,658 | | | | (3,470,251 | ) | |
Change in net unrealized
appreciation (depreciation) on: | |
Swap contracts | | | (49,100 | ) | | | (524,538 | ) | | | 19,490 | | | | 613,381 | | |
Net realized and unrealized
gain (loss) on investments | | | 14,933,172 | | | | (3,158,042 | ) | | | 4,244,148 | | | | (2,856,870 | ) | |
Net increase (decrease) in net
assets resulting from operations | | $ | 14,471,868 | | | $ | (3,233,766 | ) | | $ | 4,077,242 | | | $ | (2,910,271 | ) | |
The accompanying notes are an integral part of these financial statements.
DIREXION ANNUAL REPORT
46
Statements of Operations
For the Year Ended August 31, 2017
| | | Direxion Monthly
7-10 Year Treasury
Bull 2X Fund | | Direxion Monthly
7-10 Year Treasury
Bear 2X Fund | | Direxion Monthly
Emerging Markets
Bull 2X Fund | |
Investment Income: | |
Interest income | | $ | 86,968 | | | $ | 29,349 | | | $ | 36,162 | | |
Total investment income | | | 86,968 | | | | 29,349 | | | | 36,162 | | |
Expenses: | |
Investment advisory fees | | | 123,881 | | | | 40,119 | | | | 47,141 | | |
Operating services fees | | | 57,812 | | | | 18,722 | | | | 21,999 | | |
Distribution expenses | | | 41,294 | | | | 13,373 | | | | 15,714 | | |
Excise taxes | | | — | | | | 1 | | | | — | | |
Total expenses | | | 222,987 | | | | 72,215 | | | | 84,854 | | |
Net investment loss | | | (136,019 | ) | | | (42,866 | ) | | | (48,692 | ) | |
Realized and unrealized gain (loss) on investments: | |
Net realized gain (loss) on: | |
Swap contracts | | | (2,101,841 | ) | | | 205,751 | | | | 1,557,244 | | |
| | | | (2,101,841 | ) | | | 205,751 | | | | 1,557,244 | | |
Change in net unrealized appreciation (depreciation) on: | |
Swap contracts | | | 319,434 | | | | (139,312 | ) | | | 710,963 | | |
Net realized and unrealized gain (loss) on investments | | | (1,782,407 | ) | | | 66,439 | | | | 2,268,207 | | |
Net increase (decrease) in net assets resulting
from operations | | $ | (1,918,426 | ) | | $ | 23,573 | | | $ | 2,219,515 | | |
The accompanying notes are an integral part of these financial statements.
DIREXION ANNUAL REPORT
47
Statements of Changes in Net Assets
| | | Direxion Monthly
High Yield Bull 1.2X Fund | | Direxion Monthly
NASDAQ-100® Bull 1.25X Fund | |
| | | Year Ended
August 31, 2017 | | February 17, 20161
through
August 31, 2016 | | Year Ended
August 31, 2017 | | March 31, 20161
through
August 31, 2016 | |
Increase (Decrease) in net assets from: | |
Operations: | |
Net investment income (loss) | | $ | 8,466,010 | | | $ | 2,518,523 | | | $ | (70,939 | ) | | $ | (14,506 | ) | |
Net realized gain (loss) on investments | | | 4,846,328 | | | | 13,423,485 | | | | 6,217,560 | | | | (3,429,873 | ) | |
Change in net unrealized appreciation
(depreciation) of investments | | | 3,895,801 | | | | 3,521,461 | | | | 772,634 | | | | (413 | ) | |
Net increase (decrease) in net assets
resulting from operations | | | 17,208,139 | | | | 19,463,469 | | | | 6,919,255 | | | | (3,444,792 | ) | |
Distributions to shareholders: | |
Net investment income | | | (8,639,069 | ) | | | (2,760,767 | ) | | | — | | | | — | | |
Net realized gains | | | (2,375,195 | ) | | | — | | | | — | | | | — | | |
Total distributions to shareholders | | | (11,014,264 | ) | | | (2,760,767 | ) | | | — | | | | — | | |
Capital share transactions: | |
Net increase in net assets resulting from
net change capital share transactions(a) | | | 129,019,198 | | | | 207,760,916 | | | | 27,215,958 | | | | 3,502,310 | | |
Total increase in net assets | | | 135,213,073 | | | | 224,463,618 | | | | 34,135,213 | | | | 57,518 | | |
Net assets: | |
Beginning of year/period | | | 224,463,618 | | | | — | | | | 57,518 | | | | — | | |
End of year/period | | $ | 359,676,691 | | | $ | 224,463,618 | | | $ | 34,192,731 | | | $ | 57,518 | | |
Accumulated net investment loss,
end of year/period | | $ | — | | | $ | — | | | $ | — | | | $ | — | | |
(a) Summary of capital share transactions is as follows:
| | | Direxion Monthly High Yield Bull 1.2X Fund | |
| | | Year Ended
August 31, 2017 | | February 17, 20161
through
August 31, 2016 | |
| | | Shares | | Value | | Shares | | Value | |
Shares sold | | | 51,601,855 | | | $ | 1,233,433,511 | | | | 21,340,214 | | | $ | 463,738,240 | | |
Shares issued in reinvestment of distributions | | | 458,675 | | | | 10,776,702 | | | | 124,601 | | | | 2,760,641 | | |
Shares redeemed | | | (46,791,834 | ) | | | (1,115,191,015 | ) | | | (11,837,661 | ) | | | (258,737,965 | ) | |
Net increase | | | 5,268,696 | | | $ | 129,019,198 | | | | 9,627,154 | | | $ | 207,760,916 | | |
| | | Direxion Monthly NASDAQ-100® Bull 1.25X Fund | |
| | | Year Ended
August 31, 2017 | | March 31, 20161
through
August 31, 2016 | |
| | | Shares | | Value | | Shares | | Value | |
Shares sold | | | 15,428,662 | | | $ | 374,263,986 | | | | 11,258,427 | | | $ | 227,359,414 | | |
Shares redeemed | | | (14,233,578 | ) | | | (347,048,028 | ) | | | (11,255,772 | ) | | | (223,857,104 | ) | |
Net increase | | | 1,195,084 | | | $ | 27,215,958 | | | | 2,655 | | | $ | 3,502,310 | | |
1 Commencement of investment operations.
The accompanying notes are an integral part of these financial statements.
DIREXION ANNUAL REPORT
48
Statements of Changes in Net Assets
| | | Direxion Monthly
NASDAQ-100® Bear 1.25X Fund | | Direxion Monthly
25+ Year Treasury Bull 1.35X Fund | |
| | | March 31, 20161
Year Ended
August 31, 2017 | | through
August 31, 2016 | | November 2, 20151
Year Ended
August 31, 2017 | | through
August 31, 2016 | |
Increase (Decrease) in net assets from: | |
Operations: | |
Net investment loss | | $ | (350 | ) | | $ | (1,169 | ) | | $ | (97,168 | ) | | $ | (17,604 | ) | |
Net realized gain (loss) on investments | | | (13,338 | ) | | | (204,673 | ) | | | 1,297,410 | | | | 431,984 | | |
Change in net unrealized appreciation
(depreciation) of investments | | | (6,526 | ) | | | (345 | ) | | | 316,802 | | | | 2,531 | | |
Net increase (decrease) in net assets
resulting from operations | | | (20,214 | ) | | | (206,187 | ) | | | 1,517,044 | | | | 416,911 | | |
Capital share transactions: | |
Net increase in net assets resulting from
net change capital share transactions(a) | | | 148,383 | | | | 253,713 | | | | 15,872,586 | | | | 2,032,600 | | |
Total increase in net assets | | | 128,169 | | | | 47,526 | | | | 17,389,630 | | | | 2,449,511 | | |
Net assets: | |
Beginning of year/period | | | 47,526 | | | | — | | | | 2,449,511 | | | | — | | |
End of year/period | | $ | 175,695 | | | $ | 47,526 | | | $ | 19,839,141 | | | $ | 2,449,511 | | |
Accumulated net investment loss,
end of year/period | | $ | (233 | ) | | $ | — | | | $ | — | | | $ | — | | |
(a) Summary of capital share transactions is as follows:
| | | Direxion Monthly NASDAQ-100® Bear 1.25X Fund | |
| | | Year Ended
August 31, 2017 | | March 31, 20161
through
August 31, 2016 | |
| | | Shares | | Value | | Shares | | Value | |
Shares sold | | | 44,706 | | | $ | 663,233 | | | | 204,249 | | | $ | 4,146,018 | | |
Shares redeemed | | | (34,039 | ) | | | (514,850 | ) | | | (201,620 | ) | | | (3,892,305 | ) | |
Net increase | | | 10,667 | | | $ | 148,383 | | | | 2,629 | | | $ | 253,713 | | |
| | | Direxion Monthly 25+ Year Treasury Bull 1.35X Fund | |
| | | Year Ended
August 31, 2017 | | November 2, 20151
through
August 31, 2016 | |
| | | Shares | | Value | | Shares | | Value | |
Shares sold | | | 99,020,683 | | | $ | 1,993,686,832 | | | | 9,953,866 | | | $ | 218,909,105 | | |
Shares redeemed | | | (98,205,076 | ) | | | (1,977,814,246 | ) | | | (9,850,663 | ) | | | (216,876,505 | ) | |
Net increase | | | 815,607 | | | $ | 15,872,586 | | | | 103,203 | | | $ | 2,032,600 | | |
1 Commencement of investment operations.
The accompanying notes are an integral part of these financial statements.
DIREXION ANNUAL REPORT
49
Statements of Changes in Net Assets
| | | Direxion Monthly
25+ Year Treasury Bear 1.35X Fund | | Direxion Monthly
NASDAQ-100® Bull 2X Fund | |
| | | Year Ended
August 31, 2017 | | November 2, 20151
through
August 31, 2016 | | Year Ended
August 31, 2017 | | Year Ended
August 31, 2016 | |
Increase (Decrease) in net assets from: | |
Operations: | |
Net investment loss | | $ | (121,852 | ) | | $ | (48,875 | ) | | $ | (1,140,452 | ) | | $ | (1,315,650 | ) | |
Net realized gain (loss) on investments | | | (2,164,780 | ) | | | (915,813 | ) | | | 51,996,714 | | | | (189,296 | ) | |
Change in net unrealized appreciation
(depreciation) of investments | | | 103,960 | | | | (119,192 | ) | | | 9,405,316 | | | | (239,255 | ) | |
Net increase (decrease) in net assets
resulting from operations | | | (2,182,672 | ) | | | (1,083,880 | ) | | | 60,261,578 | | | | (1,744,201 | ) | |
Distributions to shareholders: | |
Net realized gains | | | — | | | | — | | | | — | | | | (4,252,174 | ) | |
Total distributions to shareholders | | | — | | | | — | | | | — | | | | (4,252,174 | ) | |
Capital share transactions: | |
Net increase (decrease) in net assets
resulting from net change capital
share transactions(a) | | | (11,962,905 | ) | | | 15,768,520 | | | | (22,364,888 | ) | | | 16,024,080 | | |
Total increase (decrease) in net assets | | | (14,145,577 | ) | | | 14,684,640 | | | | 37,896,690 | | | | 10,027,705 | | |
Net assets: | |
Beginning of year/period | | | 14,684,640 | | | | — | | | | 126,200,010 | | | | 116,172,305 | | |
End of year/period | | $ | 539,063 | | | $ | 14,684,640 | | | $ | 164,096,700 | | | $ | 126,200,010 | | |
Accumulated net investment loss,
end of year/period | | $ | (96,590 | ) | | $ | (37,411 | ) | | $ | — | | | $ | (734,169 | ) | |
(a) Summary of capital share transactions is as follows:
| | | Direxion Monthly 25+ Year Treasury Bear 1.35X Fund | |
| | | November 2, 20151
Year Ended
August 31, 2017 | | through
August 31, 2016 | |
| | | Shares | | Value | | Shares | | Value | |
Shares sold | | | 99,846,865 | | | $ | 1,893,326,388 | | | | 15,641,571 | | | $ | 285,759,136 | | |
Shares redeemed | | | (100,690,399 | ) | | | (1,905,289,293 | ) | | | (14,766,472 | ) | | �� | (269,990,616 | ) | |
Net increase (decrease) | | | (843,534 | ) | | $ | (11,962,905 | ) | | | 875,099 | | | $ | 15,768,520 | | |
| | | Direxion Monthly NASDAQ-100® Bull 2X Fund | |
| | | Year Ended
August 31, 2017 | | Year Ended
August 31, 2016 | |
| | | Shares | | Value | | Shares | | Value | |
Shares sold | | | 6,062,860 | | | $ | 477,405,003 | | | | 7,531,273 | | | $ | 456,046,118 | | |
Shares issued in reinvestment of distributions | | | — | | | | — | | | | 69,238 | | | | 4,220,055 | | |
Shares redeemed | | | (6,373,345 | ) | | | (499,769,891 | ) | | | (7,770,843 | ) | | | (444,242,093 | ) | |
Net increase (decrease) | | | (310,485 | ) | | $ | (22,364,888 | ) | | | (170,332 | ) | | $ | 16,024,080 | | |
1 Commencement of investment operations.
The accompanying notes are an integral part of these financial statements.
DIREXION ANNUAL REPORT
50
Statements of Changes in Net Assets
| | | Direxion Monthly
S&P 500® Bull 2X Fund | | Direxion Monthly
S&P 500® Bear 2X Fund | |
| | | Year Ended
August 31, 2017 | | Year Ended
August 31, 2016 | | Year Ended
August 31, 2017 | | Year Ended
August 31, 2016 | |
Increase (Decrease) in net assets from: | |
Operations: | |
Net investment loss | | $ | (461,304 | ) | | $ | (742,450 | ) | | $ | (75,724 | ) | | $ | (141,458 | ) | |
Net realized gain (loss) on investments | | | 14,982,272 | | | | 7,637,778 | | | | (2,633,504 | ) | | | (5,663,776 | ) | |
Change in net unrealized appreciation
(depreciation) of investments | | | (49,100 | ) | | | 1,705,961 | | | | (524,538 | ) | | | 33,043 | | |
Net increase (decrease) in net assets
resulting from operations | | | 14,471,868 | | | | 8,601,289 | | | | (3,233,766 | ) | | | (5,772,191 | ) | |
Distributions to shareholders: | |
Net realized gains | | | — | | | | (3,505,442 | ) | | | — | | | | — | | |
Total distributions to shareholders | | | — | | | | (3,505,442 | ) | | | — | | | | — | | |
Capital share transactions: | |
Net increase (decrease) in net assets
resulting from net change capital
share transactions(a) | | | (5,472,827 | ) | | | 15,176,569 | | | | 13,985,014 | | | | 6,787,377 | | |
Total increase in net assets | | | 8,999,041 | | | | 20,272,416 | | | | 10,751,248 | | | | 1,015,186 | | |
Net assets: | |
Beginning of year | | | 63,601,661 | | | | 43,329,245 | | | | 10,080,892 | | | | 9,065,706 | | |
End of year | | $ | 72,600,702 | | | $ | 63,601,661 | | | $ | 20,832,140 | | | $ | 10,080,892 | | |
Accumulated net investment loss,
end of year | | $ | — | | | $ | — | | | $ | (39,778 | ) | | $ | (87,744 | ) | |
(a) Summary of capital share transactions is as follows:
| | | Direxion Monthly S&P 500® Bull 2X Fund | |
| | | Year Ended
August 31, 2017 | | Year Ended
August 31, 2016 | |
| | | Shares | | Value | | Shares | | Value | |
Shares sold | | | 1,919,130 | | | $ | 207,974,974 | | | | 4,075,239 | | | $ | 344,557,157 | | |
Shares issued in reinvestment of distributions | | | — | | | | — | | | | 41,061 | | | | 3,470,046 | | |
Shares redeemed | | | (2,001,667 | ) | | | (213,447,801 | ) | | | (3,974,554 | ) | | | (332,850,634 | ) | |
Net increase (decrease) | | | (82,537 | ) | | $ | (5,472,827 | ) | | | 141,746 | | | $ | 15,176,569 | | |
| | | Direxion Monthly S&P 500® Bear 2X Fund | |
| | | Year Ended
August 31, 2017 | | Year Ended
August 31, 2016 | |
| | | Shares | | Value | | Shares | | Value | |
Shares sold | | | 2,489,293 | | | $ | 48,474,275 | | | | 4,633,890 | | | $ | 136,699,868 | | |
Shares redeemed | | | (1,692,569 | ) | | | (34,489,261 | ) | | | (4,487,970 | ) | | | (129,912,491 | ) | |
Net increase | | | 796,724 | | | $ | 13,985,014 | | | | 145,920 | | | $ | 6,787,377 | | |
The accompanying notes are an integral part of these financial statements.
DIREXION ANNUAL REPORT
51
Statements of Changes in Net Assets
| | | Direxion Monthly
Small Cap Bull 2X Fund | | Direxion Monthly
Small Cap Bear 2X Fund | |
| | | Year Ended
August 31, 2017 | | Year Ended
August 31, 2016 | | Year Ended
August 31, 2017 | | Year Ended
August 31, 2016 | |
Increase (Decrease) in net assets from: | |
Operations: | |
Net investment loss | | $ | (166,906 | ) | | $ | (172,392 | ) | | $ | (53,401 | ) | | $ | (97,346 | ) | |
Net realized gain (loss) on investments | | | 4,224,658 | | | | 1,195,296 | | | | (3,470,251 | ) | | | (1,984,482 | ) | |
Change in net unrealized appreciation
(depreciation) of investments | | | 19,490 | | | | 1,241,938 | | | | 613,381 | | | | (105,617 | ) | |
Net increase (decrease) in net assets
resulting from operations | | | 4,077,242 | | | | 2,264,842 | | | | (2,910,271 | ) | | | (2,187,445 | ) | |
Capital share transactions: | |
Net increase (decrease) in net assets
resulting from net change capital
share transactions(a) | | | (976,984 | ) | | | (4,373,401 | ) | | | 1,567,925 | | | | 1,726,641 | | |
Total increase (decrease) in net assets | | | 3,100,258 | | | | (2,108,559 | ) | | | (1,342,346 | ) | | | (460,804 | ) | |
Net assets: | |
Beginning of year | | | 13,215,965 | | | | 15,324,524 | | | | 7,114,801 | | | | 7,575,605 | | |
End of year | | $ | 16,316,223 | | | $ | 13,215,965 | | | $ | 5,772,455 | | | $ | 7,114,801 | | |
Accumulated net investment loss,
end of year | | $ | — | | | $ | (123,887 | ) | | $ | (28,824 | ) | | $ | (61,358 | ) | |
(a) Summary of capital share transactions is as follows:
| | | Direxion Monthly Small Cap Bull 2X Fund | |
| | | Year Ended
August 31, 2017 | | Year Ended
August 31, 2016 | |
| | | Shares | | Value | | Shares | | Value | |
Shares sold | | | 2,360,592 | | | $ | 137,599,334 | | | | 3,531,071 | | | $ | 149,977,319 | | |
Shares redeemed | | | (2,367,529 | ) | | | (138,576,318 | ) | | | (3,609,930 | ) | | | (154,350,720 | ) | |
Net decrease | | | (6,937 | ) | | $ | (976,984 | ) | | | (78,859 | ) | | $ | (4,373,401 | ) | |
| | | Direxion Monthly Small Cap Bear 2X Fund | |
| | | Year Ended
August 31, 2017 | | Year Ended
August 31, 2016 | |
| | | Shares | | Value | | Shares | | Value | |
Shares sold | | | 2,590,933 | | | $ | 53,603,013 | | | | 1,643,817 | | | $ | 56,948,409 | | |
Shares redeemed | | | (2,550,042 | ) | | | (52,035,088 | ) | | | (1,590,868 | ) | | | (55,221,768 | ) | |
Net increase | | | 40,891 | | | $ | 1,567,925 | | | | 52,949 | | | $ | 1,726,641 | | |
The accompanying notes are an integral part of these financial statements.
DIREXION ANNUAL REPORT
52
Statements of Changes in Net Assets
| | | Direxion Monthly
7-10 Year Treasury Bull 2X Fund | | Direxion Monthly
7-10 Year Treasury Bear 2X Fund | |
| | | Year Ended
August 31, 2017 | | Year Ended
August 31, 2016 | | Year Ended
August 31, 2017 | | Year Ended
August 31, 2016 | |
Increase (Decrease) in net assets from: | |
Operations: | |
Net investment loss | | $ | (136,019 | ) | | $ | (753,970 | ) | | $ | (42,866 | ) | | $ | (110,959 | ) | |
Net realized gain (loss) on investments | | | (2,101,841 | ) | | | 13,773,756 | | | | 205,751 | | | | (1,927,165 | ) | |
Change in net unrealized appreciation
(depreciation) of investments | | | 319,434 | | | | 221,950 | | | | (139,312 | ) | | | 447,009 | | |
Net increase (decrease) in net assets
resulting from operations | | | (1,918,426 | ) | | | 13,241,736 | | | | 23,573 | | | | (1,591,115 | ) | |
Capital share transactions: | |
Net increase (decrease) in net assets
resulting from net change capital
share transactions(a) | | | (5,439,371 | ) | | | (60,591,555 | ) | | | 277,936 | | | | (13,525,299 | ) | |
Total increase (decrease) in net assets | | | (7,357,797 | ) | | | (47,349,819 | ) | | | 301,509 | | | | (15,116,414 | ) | |
Net assets: | |
Beginning of year | | | 22,499,949 | | | | 69,849,768 | | | | 4,818,723 | | | | 19,935,137 | | |
End of year | | $ | 15,142,152 | | | $ | 22,499,949 | | | $ | 5,120,232 | | | $ | 4,818,723 | | |
Accumulated net investment loss,
end of year | | $ | (62,568 | ) | | $ | — | | | $ | (23,443 | ) | | $ | (52,952 | ) | |
(a) Summary of capital share transactions is as follows:
| | | Direxion Monthly 7-10 Year Treasury Bull 2X Fund | |
| | | Year Ended
August 31, 2017 | | Year Ended
August 31, 2016 | |
| | | Shares | | Value | | Shares | | Value | |
Shares sold | | | 1,464,568 | | | $ | 51,709,957 | | | | 11,593,740 | | | $ | 413,619,499 | | |
Shares redeemed | | | (1,633,439 | ) | | | (57,149,328 | ) | | | (13,037,478 | ) | | | (474,211,054 | ) | |
Net decrease | | | (168,871 | ) | | $ | (5,439,371 | ) | | | (1,443,738 | ) | | $ | (60,591,555 | ) | |
| | | Direxion Monthly 7-10 Year Treasury Bear 2X Fund | |
| | | Year Ended
August 31, 2017 | | Year Ended
August 31, 2016 | |
| | | Shares | | Value | | Shares | | Value | |
Shares sold | | | 1,314,661 | | | $ | 38,625,864 | | | | 2,099,791 | | | $ | 63,541,491 | | |
Shares redeemed | | | (1,306,130 | ) | | | (38,347,928 | ) | | | (2,531,482 | ) | | | (77,066,790 | ) | |
Net increase (decrease) | | | 8,531 | | | $ | 277,936 | | | | (431,691 | ) | | $ | (13,525,299 | ) | |
The accompanying notes are an integral part of these financial statements.
DIREXION ANNUAL REPORT
53
Statements of Changes in Net Assets
| | | Direxion Monthly
Emerging Markets Bull 2X Fund | |
| | | Year Ended
August 31, 2017 | | Year Ended
August 31, 2016 | |
Increase (Decrease) in net assets from: | |
Operations: | |
Net investment loss | | $ | (48,692 | ) | | $ | (38,608 | ) | |
Net realized gain on investments | | | 1,557,244 | | | | 490,151 | | |
Change in net unrealized appreciation of investments | | | 710,963 | | | | 25,661 | | |
Net increase in net assets resulting from operations | | | 2,219,515 | | | | 477,204 | | |
Capital share transactions: | |
Net increase (decrease) in net assets resulting from
net change capital share transactions(a) | | | (1,436,237 | ) | | | 5,862,856 | | |
Total increase in net assets | | | 783,278 | | | | 6,340,060 | | |
Net assets: | |
Beginning of year | | | 9,116,663 | | | | 2,776,603 | | |
End of year | | $ | 9,899,941 | | | $ | 9,116,663 | | |
Accumulated net investment loss, end of year | | $ | (26,026 | ) | | $ | (26,607 | ) | |
(a) Summary of capital share transactions is as follows:
| | | Direxion Monthly Emerging Markets Bull 2X Fund | |
| | | Year Ended
August 31, 2017 | | Year Ended
August 31, 2016 | |
| | | Shares | | Value | | Shares | | Value | |
Shares sold | | | 1,984,748 | | | $ | 85,494,282 | | | | 1,158,700 | | | $ | 35,506,132 | | |
Shares redeemed | | | (2,054,869 | ) | | | (86,930,519 | ) | | | (993,716 | ) | | | (29,643,276 | ) | |
Net increase (decrease) | | | (70,121 | ) | | $ | (1,436,237 | ) | | | 164,984 | | | $ | 5,862,856 | | |
The accompanying notes are an integral part of these financial statements.
DIREXION ANNUAL REPORT
54
Financial Highlights
August 31, 2017
| | | | | RATIOS TO AVERAGE NET ASSETS3 | | | |
| | | Net Asset
Value,
Beginning
of Year/
Period | | Net
Investment
Income
(Loss)1 | | Net Realized
and Unrealized
Gain (Loss)
on Investments | | Net Increase
(Decrease) in
Net Asset
Value Resulting
from Operations | | Dividends
from Net
Investment
Income | | Distributions
from
Realized
Capital Gains | | Return of
Capital
Distribution | | Total
Distributions | | Net
Asset
Value,
End of
Year/
Period | | Total
Return2 | | Net
Assets,
End of
Year/
Period
(,000) | | Total
Expenses | | Net
Expenses4 | | Net Investment
Income (Loss)
after Expense
Reimbursement/
Recoupment | | Portfolio
Turnover
Rate5 | |
Direxion Monthly High Yield Bull 1.2X Fund | |
Year ended August 31, 2017 | | $ | 23.3157 | | | $ | 0.7368 | | | $ | 1.0980 | | | $ | 1.8348 | | | $ | (0.7613 | ) | | $ | (0.2431 | ) | | $ | — | | | $ | (1.0044 | ) | | $ | 24.1461 | | | | 8.08 | % | | $ | 359,677 | | | | 1.35 | % | | | 1.35 | % | | | 3.09 | % | | | 362 | % | |
February 17, 20166 to August 31, 2016 | | | 20.0000 | | | | 0.3135 | | | | 3.3260 | | | | 3.6395 | | | | (0.3238 | ) | | | — | | | | — | | | | (0.3238 | ) | | | 23.3157 | | | | 18.29 | % | | | 224,464 | | | | 1.35 | % | | | 1.34 | % | | | 2.65 | %7 | | | 165 | % | |
Direxion Monthly NASDAQ-100® Bull 1.25X Fund | |
Year ended August 31, 2017 | | | 21.6640 | | | | (0.1380 | ) | | | 7.0217 | | | | 6.8837 | | | | — | | | | — | | | | — | | | | — | | | | 28.5477 | | | | 31.77 | % | | | 34,193 | | | | 1.15 | % | | | 1.13 | % | | | (0.56 | )%8 | | | 0 | % | |
March 31, 20166 to August 31, 2016 | | | 20.0000 | | | | (0.0091 | ) | | | 1.6731 | | | | 1.6640 | | | | — | | | | — | | | | — | | | | — | | | | 21.6640 | | | | 8.32 | % | | | 58 | | | | 1.15 | % | | | 1.13 | % | | | (0.11 | )%8 | | | 0 | % | |
Direxion Monthly NASDAQ-100® Bear 1.25X Fund | |
Year ended August 31, 2017 | | | 18.0798 | | | | (0.0683 | ) | | | (4.7974 | ) | | | (4.8657 | ) | | | — | | | | — | | | | — | | | | — | | | | 13.2141 | | | | (26.91 | )% | | | 176 | | | | 1.15 | % | | | 1.15 | % | | | (0.46 | )% | | | 0 | % | |
March 31, 20166 to August 31, 2016 | | | 20.0000 | | | | (0.0671 | ) | | | (1.8531 | ) | | | (1.9202 | ) | | | — | | | | — | | | | — | | | | — | | | | 18.0798 | | | | (9.60 | )% | | | 48 | | | | 1.15 | % | | | 1.08 | % | | | (0.81 | )%9 | | | 0 | % | |
Direxion Monthly 25+ Year Treasury Bull 1.35X Fund | |
Year ended August 31, 2017 | | | 23.7349 | | | | (0.0879 | ) | | | (2.0548 | ) | | | (2.1427 | ) | | | — | | | | — | | | | — | | | | — | | | | 21.5922 | | | | (9.03 | )% | | | 19,839 | | | | 1.10 | % | | | 1.06 | % | | | (0.45 | )%10 | | | 0 | % | |
November 2, 20156 to August 31, 2016 | | | 20.0000 | | | | (0.1101 | ) | | | 3.8450 | | | | 3.7349 | | | | — | | | | — | | | | — | | | | — | | | | 23.7349 | | | | 18.67 | % | | | 2,450 | | | | 1.10 | % | | | 0.88 | % | | | (0.65 | )%10 | | | 0 | % | |
Direxion Monthly 25+ Year Treasury Bear 1.35X Fund | |
Year ended August 31, 2017 | | | 16.7805 | | | | (0.1069 | ) | | | 0.4043 | | | | 0.2974 | | | | — | | | | — | | | | — | | | | — | | | | 17.0779 | | | | 1.77 | % | | | 539 | | | | 1.10 | % | | | 0.99 | % | | | (0.54 | )%11 | | | 0 | % | |
November 2, 20156 to August 31, 2016 | | | 20.0000 | | | | (0.1119 | ) | | | (3.1076 | ) | | | (3.2195 | ) | | | — | | | | — | | | | — | | | | — | | | | 16.7805 | | | | (16.10 | )% | | | 14,685 | | | | 1.10 | % | | | 0.97 | % | | | (0.75 | )%11 | | | 0 | % | |
Direxion Monthly NASDAQ-100® Bull 2X Fund | |
Year ended August 31, 2017 | | | 64.46 | | | | (0.62 | ) | | | 35.78 | | | | 35.16 | | | | — | | | | — | | | | — | | | | — | | | | 99.62 | | | | 54.55 | % | | | 164,097 | | | | 1.35 | % | | | 1.35 | % | | | (0.77 | )% | | | 0 | % | |
Year ended August 31, 2016 | | | 54.59 | | | | (0.68 | ) | | | 12.01 | | | | 11.33 | | | | — | | | | (1.46 | ) | | | — | | | | (1.46 | ) | | | 64.46 | | | | 20.90 | % | | | 126,200 | | | | 1.35 | % | | | 1.35 | % | | | (1.17 | )% | | | 0 | % | |
Year ended August 31, 2015 | | | 51.33 | | | | (0.74 | ) | | | 4.63 | | | | 3.89 | | | | — | | | | (0.63 | ) | | | — | | | | (0.63 | ) | | | 54.59 | | | | 7.68 | % | | | 116,172 | | | | 1.35 | % | | | 1.35 | % | | | (1.33 | )% | | | 0 | % | |
Year ended August 31, 2014 | | | 29.33 | | | | (0.56 | ) | | | 22.56 | | | | 22.00 | | | | — | | | | — | | | | — | | | | — | | | | 51.33 | | | | 74.98 | % | | | 289,359 | | | | 1.35 | % | | | 1.35 | % | | | (1.33 | )% | | | 0 | % | |
Year ended August 31, 2013 | | | 23.93 | | | | (0.46 | ) | | | 5.86 | | | | 5.40 | | | | — | | | | — | | | | — | | | | — | | | | 29.33 | | | | 22.56 | % | | | 24,514 | | | | 1.90 | % | | | 1.90 | % | | | (1.85 | )% | | | 0 | % | |
Direxion Monthly S&P 500® Bull 2X Fund | |
Year ended August 31, 2017 | | | 95.68 | | | | (0.86 | ) | | | 29.88 | | | | 29.02 | | | | — | | | | — | | | | — | | | | — | | | | 124.70 | | | | 30.33 | % | | | 72,601 | | | | 1.35 | % | | | 1.35 | % | | | (0.78 | )% | | | 0 | % | |
Year ended August 31, 2016 | | | 82.85 | | | | (1.18 | ) | | | 18.36 | | | | 17.18 | | | | — | | | | (4.35 | ) | | | — | | | | (4.35 | ) | | | 95.68 | | | | 21.43 | % | | | 63,602 | | | | 1.54 | % | | | 1.54 | % | | | (1.37 | )%12 | | | 0 | % | |
Year ended August 31, 2015 | | | 88.65 | | | | (1.22 | ) | | | (0.92 | ) | | | (2.14 | ) | | | — | | | | (3.66 | ) | | | — | | | | (3.66 | ) | | | 82.85 | | | | (2.40 | )% | | | 43,329 | | | | 1.35 | % | | | 1.35 | % | | | (1.34 | )% | | | 0 | % | |
Year ended August 31, 2014 | | | 61.43 | | | | (1.02 | ) | | | 32.15 | | | | 31.13 | | | | — | | | | (3.91 | ) | | | — | | | | (3.91 | ) | | | 88.65 | | | | 52.45 | % | | | 39,820 | | | | 1.35 | % | | | 1.35 | % | | | (1.33 | )% | | | 0 | % | |
Year ended August 31, 2013 | | | 46.79 | | | | (1.01 | ) | | | 17.38 | | | | 16.37 | | | | — | | | | (1.73 | ) | | | — | | | | (1.73 | ) | | | 61.43 | | | | 36.05 | % | | | 32,007 | | | | 1.90 | % | | | 1.90 | % | | | (1.85 | )% | | | 0 | % | |
Direxion Monthly S&P 500® Bear 2X Fund | |
Year ended August 31, 2017 | | | 22.95 | | | | (0.15 | ) | | | (5.94 | ) | | | (6.09 | ) | | | — | | | | — | | | | — | | | | — | | | | 16.86 | | | | (26.54 | )% | | | 20,832 | | | | 1.35 | % | | | 1.35 | % | | | (0.77 | )% | | | 0 | % | |
Year ended August 31, 2016 | | | 30.91 | | | | (0.32 | ) | | | (7.64 | ) | | | (7.96 | ) | | | — | | | | — | | | | — | | | | — | | | | 22.95 | | | | (25.75 | )% | | | 10,081 | | | | 1.35 | % | | | 1.35 | % | | | (1.16 | )% | | | 0 | % | |
Year ended August 31, 2015 | | | 32.72 | | | | (0.39 | ) | | | (1.42 | ) | | | (1.81 | ) | | | — | | | | — | | | | — | | | | — | | | | 30.91 | | | | (5.53 | )% | | | 9,066 | | | | 1.35 | % | | | 1.35 | % | | | (1.34 | )% | | | 0 | % | |
Year ended August 31, 2014 | | | 53.84 | | | | (0.53 | ) | | | (20.59 | ) | | | (21.12 | ) | | | — | | | | — | | | | — | | | | — | | | | 32.72 | | | | (39.23 | )% | | | 6,464 | | | | 1.35 | % | | | 1.35 | % | | | (1.33 | )% | | | 0 | % | |
Year ended August 31, 2013 | | | 79.76 | | | | (1.20 | ) | | | (24.72 | ) | | | (25.92 | ) | | | — | | | | — | | | | — | | | | — | | | | 53.84 | | | | (32.50 | )% | | | 7,855 | | | | 1.90 | % | | | 1.90 | % | | | (1.84 | )% | | | 0 | % | |
Direxion Monthly Small Cap Bull 2X Fund | |
Year ended August 31, 2017 | | | 51.05 | | | | (0.48 | ) | | | 14.20 | | | | 13.72 | | | | — | | | | — | | | | — | | | | — | | | | 64.77 | | | | 26.88 | % | | | 16,316 | | | | 1.35 | % | | | 1.35 | % | | | (0.80 | )% | | | 0 | % | |
Year ended August 31, 2016 | | | 45.38 | | | | (0.49 | ) | | | 6.16 | | | | 5.67 | | | | — | | | | — | | | | — | | | | — | | | | 51.05 | | | | 12.49 | % | | | 13,216 | | | | 1.35 | % | | | 1.34 | % | | | (1.14 | )%13 | | | 0 | % | |
Year ended August 31, 2015 | | | 46.95 | | | | (0.67 | ) | | | (0.90 | ) | | | (1.57 | ) | | | — | | | | (0.00 | )14 | | | — | | | | (0.00 | )14 | | | 45.38 | | | | (3.34 | )% | | | 15,325 | | | | 1.35 | % | | | 1.35 | % | | | (1.34 | )% | | | 0 | % | |
Year ended August 31, 2014 | | | 35.43 | | | | (0.59 | ) | | | 12.76 | | | | 12.17 | | | | — | | | | (0.65 | ) | | | — | | | | (0.65 | ) | | | 46.95 | | | | 34.56 | % | | | 25,266 | | | | 1.35 | % | | | 1.35 | % | | | (1.33 | )% | | | 0 | % | |
Year ended August 31, 2013 | | | 22.91 | | | | (0.56 | ) | | | 13.08 | | | | 12.52 | | | | — | | | | — | | | | — | | | | — | | | | 35.43 | | | | 54.63 | % | | | 15,347 | | | | 1.90 | % | | | 1.90 | % | | | (1.86 | )% | | | 0 | % | |
Direxion Monthly Small Cap Bear 2X Fund | |
Year ended August 31, 2017 | | | 26.09 | | | | (0.17 | ) | | | (7.51 | ) | | | (7.68 | ) | | | — | | | | — | | | | — | | | | — | | | | 18.41 | | | | (29.44 | )% | | | 5,772 | | | | 1.35 | % | | | 1.35 | % | | | (0.80 | )% | | | 0 | % | |
Year ended August 31, 2016 | | | 34.47 | | | | (0.38 | ) | | | (8.00 | ) | | | (8.38 | ) | | | — | | | | — | | | | — | | | | — | | | | 26.09 | | | | (24.31 | )% | | | 7,115 | | | | 1.35 | % | | | 1.35 | % | | | (1.15 | )% | | | 0 | % | |
Year ended August 31, 2015 | | | 37.75 | | | | (0.46 | ) | | | (2.82 | ) | | | (3.28 | ) | | | — | | | | — | | | | — | | | | — | | | | 34.47 | | | | (8.69 | )% | | | 7,576 | | | | 1.35 | % | | | 1.35 | % | | | (1.33 | )% | | | 0 | % | |
Year ended August 31, 2014 | | | 57.20 | | | | (0.58 | ) | | | (18.87 | ) | | | (19.45 | ) | | | — | | | | — | | | | — | | | | — | | | | 37.75 | | | | (34.00 | )% | | | 15,540 | | | | 1.35 | % | | | 1.35 | % | | | (1.33 | )% | | | 0 | % | |
Year ended August 31, 2013 | | | 99.32 | | | | (1.43 | ) | | | (40.69 | ) | | | (42.12 | ) | | | — | | | | — | | | | — | | | | — | | | | 57.20 | | | | (42.41 | )% | | | 17,587 | | | | 1.90 | % | | | 1.90 | % | | | (1.84 | )% | | | 0 | % | |
The accompanying notes are an integral part of these financial statements.
DIREXION ANNUAL REPORT
55
Financial Highlights
August 31, 2017
| | | | | RATIOS TO AVERAGE NET ASSETS3 | | | |
| | | Net Asset
Value,
Beginning
of Year/
Period | | Net
Investment
Income
(Loss)1 | | Net Realized
and Unrealized
Gain (Loss)
on Investments | | Net Increase
(Decrease) in
Net Asset
Value Resulting
from Operations | | Dividends
from Net
Investment
Income | | Distributions
from
Realized
Capital Gains | | Return of
Capital
Distribution | | Total
Distributions | | Net
Asset
Value,
End of
Year/
Period | | Total
Return2 | | Net
Assets,
End of
Year/
Period
(,000) | | Total
Expenses | | Net
Expenses4 | | Net Investment
Income (Loss)
after Expense
Reimbursement/
Recoupment | | Portfolio
Turnover
Rate5 | |
Direxion Monthly 7-10 Year Treasury Bull 2X Fund | |
Year ended August 31, 2017 | | $ | 38.18 | | | $ | (0.29 | ) | | $ | (1.87 | ) | | $ | (2.16 | ) | | $ | — | | | $ | — | | | $ | — | | | $ | — | | | $ | 36.02 | | | | (5.66 | )% | | $ | 15,142 | | | | 1.35 | % | | | 1.35 | % | | | (0.82 | )% | | | 0 | % | |
Year ended August 31, 2016 | | | 34.36 | | | | (0.42 | ) | | | 4.24 | | | | 3.82 | | | | — | | | | — | | | | — | | | | — | | | | 38.18 | | | | 11.12 | % | | | 22,500 | | | | 1.35 | % | | | 1.35 | % | | | (1.17 | )% | | | 0 | % | |
Year ended August 31, 2015 | | | 33.01 | | | | (0.46 | ) | | | 1.81 | | | | 1.35 | | | | — | | | | — | | | | — | | | | — | | | | 34.36 | | | | 4.09 | % | | | 69,850 | | | | 1.35 | % | | | 1.31 | % | | | (1.30 | )%15 | | | 0 | % | |
Year ended August 31, 2014 | | | 29.48 | | | | (0.41 | ) | | | 3.94 | | | | 3.53 | | | | — | | | | — | | | | — | | | | — | | | | 33.01 | | | | 11.97 | % | | | 22,235 | | | | 1.35 | % | | | 1.35 | % | | | (1.33 | )% | | | 0 | % | |
Year ended August 31, 2013 | | | 35.97 | | | | (0.41 | ) | | | (4.79 | ) | | | (5.20 | ) | | | — | | | | (1.29 | ) | | | — | | | | (1.29 | ) | | | 29.48 | | | | (14.89 | )% | | | 23,537 | | | | 1.90 | % | | | 1.83 | % | | | (1.24 | )%15 | | | 1,286 | % | |
Direxion Monthly 7-10 Year Treasury Bear 2X Fund | |
Year ended August 31, 2017 | | | 27.99 | | | | (0.24 | ) | | | 0.59 | | | | 0.35 | | | | — | | | | — | | | | — | | | | — | | | | 28.34 | | | | 1.25 | % | | | 5,120 | | | | 1.35 | % | | | 1.35 | % | | | (0.80 | )% | | | 0 | % | |
Year ended August 31, 2016 | | | 33.01 | | | | (0.37 | ) | | | (4.65 | ) | | | (5.02 | ) | | | — | | | | — | | | | — | | | | — | | | | 27.99 | | | | (15.21 | )% | | | 4,819 | | | | 1.35 | % | | | 1.35 | % | | | (1.19 | )% | | | 0 | % | |
Year ended August 31, 2015 | | | 36.66 | | | | (0.46 | ) | | | (3.19 | ) | | | (3.65 | ) | | | — | | | | — | | | | — | | | | — | | | | 33.01 | | | | (9.96 | )% | | | 19,935 | | | | 1.35 | % | | | 1.35 | % | | | (1.34 | )% | | | 0 | % | |
Year ended August 31, 2014 | | | 43.12 | | | | (0.53 | ) | | | (5.93 | ) | | | (6.46 | ) | | | — | | | | — | | | | — | | | | — | | | | 36.66 | | | | (14.98 | )% | | | 8,010 | | | | 1.35 | % | | | 1.35 | % | | | (1.33 | )% | | | 0 | % | |
Year ended August 31, 2013 | | | 38.92 | | | | (0.77 | ) | | | 4.97 | | | | 4.20 | | | | — | | | | — | | | | — | | | | — | | | | 43.12 | | | | 10.79 | % | | | 10,029 | | | | 1.90 | % | | | 1.90 | % | | | (1.85 | )% | | | 0 | % | |
Direxion Monthly Emerging Markets Bull 2X Fund | |
Year ended August 31, 2017 | | | 35.73 | | | | (0.32 | ) | | | 18.09 | | | | 17.77 | | | | — | | | | — | | | | — | | | | — | | | | 53.50 | | | | 49.73 | % | | | 9,900 | | | | 1.35 | % | | | 1.35 | % | | | (0.77 | )% | | | 0 | % | |
Year ended August 31, 2016 | | | 30.79 | | | | (0.35 | ) | | | 5.29 | | | | 4.94 | | | | — | | | | — | | | | — | | | | — | | | | 35.73 | | | | 16.04 | % | | | 9,117 | | | | 1.35 | % | | | 1.35 | % | | | (1.14 | )% | | | 0 | % | |
Year ended August 31, 2015 | | | 56.54 | | | | (0.64 | ) | | | (25.11 | ) | | | (25.75 | ) | | | — | | | | — | | | | — | | | | — | | | | 30.79 | | | | (45.54 | )% | | | 2,777 | | | | 1.35 | % | | | 1.35 | % | | | (1.33 | )% | | | 0 | % | |
Year ended August 31, 2014 | | | 41.36 | | | | (0.67 | ) | | | 15.85 | | | | 15.18 | | | | — | | | | — | | | | — | | | | — | | | | 56.54 | | | | 36.70 | % | | | 32,357 | | | | 1.35 | % | | | 1.35 | % | | | (1.33 | )% | | | 0 | % | |
Year ended August 31, 2013 | | | 45.04 | | | | (0.97 | ) | | | (2.71 | ) | | | (3.68 | ) | | | — | | | | — | | | | — | | | | — | | | | 41.36 | | | | (8.17 | )% | | | 5,229 | | | | 1.90 | % | | | 1.89 | % | | | (1.84 | )%16 | | | 0 | % | |
1 Net investment income (loss) per share represents net investment income (loss) divided by the daily average shares of beneficial interest outstanding throughout each period.
2 All returns reflect reinvested dividends, if any, but do not reflect the impact of taxes. Total return calculated for a period of less than one year is not annualized.
3 For periods less than one year, these ratios are annualized.
4 Net expenses include effects of any reimbursement or recoupment.
5 Portfolio turnover is not annualized and does not include effects of turnover of the swap or future contracts portfolio. Short-term securities with maturities less than or equal to 365 days are also excluded from portfolio turnover calculation.
6 Commencement of operations.
7 Net investment income (loss) ratio before expense reimbursement/recoupment for the period ended August 31, 2016 was 2.64%.
8 Net investment income (loss) ratios before expense reimbursement/recoupment for the year ended August 31, 2017 and period ended August 31, 2016 were (0.58)% and (0.13)%, respectively.
9 Net investment income (loss) ratio before expense reimbursement/recoupment for the period ended August 31, 2016 was (0.88)%.
10 Net investment income (loss) ratios before expense reimbursement/recoupment for the year ended August 31, 2017 and period ended August 31, 2016 were (0.49)% and (0.87)%, respectively.
11 Net investment income (loss) ratios before expense reimbursement/recoupment for the year ended August 31, 2017 and period ended August 31, 2016 were (0.65)% and (0.88)%, respectively.
12 Net investment income (loss) ratio before expense reimbursement/recoupment for the year ended August 31, 2016 was (1.37)%.
13 Net investment income (loss) ratio before expense reimbursement/recoupment for the year ended August 31, 2016 was (1.15)%.
14 Amount is less than $0.01 per share.
15 Net investment income (loss) ratios before expense reimbursement/recoupment for the years ended August 31, 2015 and August 31, 2013 were (1.34)% and (1.31)%, respectively.
16 Net investment income (loss) ratio before expense reimbursement/recoupment for the year ended August 31, 2013 was (1.85)%.
The accompanying notes are an integral part of these financial statements.
DIREXION ANNUAL REPORT
56
Direxion Funds
Notes to the Financial Statements
August 31, 2017
1. ORGANIZATION
Direxion Funds (the "Trust") was organized as a Massachusetts Business Trust on June 6, 1997, and is registered under the Investment Company Act of 1940, as amended (the "1940 Act"), as an open-end management investment company issuing its shares in series, each series representing a distinct portfolio with its own investment objective and policies. The Trust currently has 17 series, of which 13 are included in this report: Direxion Monthly High Yield Bull 1.2X Fund, Direxion Monthly NASDAQ-100® Bull 1.25X Fund, Direxion Monthly NASDAQ-100® Bear 1.25X Fund, Direxion Monthly 25+ Year Treasury Bull 1.35X Fund, Direxion Monthly 25+ Year Treasury Bear 1.35X Fund, Direxion Monthly NASDAQ-100® Bull 2X Fund, Direxion Monthly S&P 500® Bull 2X Fund, Direxion Monthly S&P 500® Bear 2X Fund, Direxion Monthly Small Cap Bull 2X Fund, Direxion Monthly Small Cap Bear 2X Fund, Direxion Monthly 7-10 Year Treasury Bull 2X Fund, Direxion Monthly 7-10 Year Treasury Bear 2X Fund, and Direxion Monthly Emerging Markets Bull 2X Fund (each a "Fund" and collectively, the "Funds"). Each Fund is a non-diversified series of the Trust pursuant to the 1940 Act. The 13 Funds included in this report offer only Investor Class shares.
Rafferty Asset Management, LLC (the "Adviser") has registered as a commodity pool operator ("CPO") and the Funds are considered commodity pools under the Commodity Exchange Act (the "CEA"). Accordingly, the Advisor is subject to registration and regulation as a CPO under the CEA and must comply with various regulatory requirements under the CEA and the rules and regulations of the Commodity Futures Trading Commission and the National Futures Association, including investor protection requirements, antifraud provisions, disclosure requirements and reporting and recordkeeping requirements.
The Funds' investment objectives are to seek monthly investment results, before fees and expenses that correspond to the calendar month performance of a particular index or benchmark. The Funds with the word "Bull" in their name attempt to provide investment results that correlate positively to the return of an index or benchmark. The Funds with the word "Bear" in their name attempt to provide investment results that correlate negatively to the return of an index or benchmark.
Fund | | Index or Benchmark | | Monthly Target | |
Direxion Monthly High Yield Bull 1.2X Fund | | Solactive High Yield Beta Index | | | 120 | % | |
Direxion Monthly NASDAQ-100® Bull 1.25X Fund | | NASDAQ-100® Index | | | 125 | % | |
Direxion Monthly NASDAQ-100® Bear 1.25X Fund | | | | | -125 | % | |
Direxion Monthly 25+ Year Treasury Bull 1.35X Fund* | | NYSE 25 Year Plus Treasury Bond Index | | | 135 | % | |
Direxion Monthly 25+ Year Treasury Bear 1.35X Fund* | | | | | -135 | % | |
Direxion Monthly NASDAQ-100® Bull 2X Fund | | NASDAQ-100® Index | | | 200 | % | |
Direxion Monthly S&P 500® Bull 2X Fund | | S&P 500® Index | | | 200 | % | |
Direxion Monthly S&P 500® Bear 2X Fund | | | | | -200 | % | |
Direxion Monthly Small Cap Bull 2X Fund | | Russell 2000® Index | | | 200 | % | |
Direxion Monthly Small Cap Bear 2X Fund | | | | | -200 | % | |
Direxion Monthly 7-10 Year Treasury Bull 2X Fund | | ICE U.S. Treasury 7-10 Year Bond Index | | | 200 | % | |
Direxion Monthly 7-10 Year Treasury Bear 2X Fund | | | | | -200 | % | |
Direxion Monthly Emerging Markets Bull 2X Fund | | MSCI Emerging Markets IndexSM | | | 200 | % | |
* Effective December 1, 2016, the Direxion Monthly 25+ Year Treasury Bull 1.2X Fund and Direxion Monthly 25+ Year Treasury Bear 1X Fund changed their names to Direxion Monthly 25+ Year Treasury Bull 1.35X Fund and Direxion Monthly 25+ Year Treasury Bear 1.35X Fund, respectively.
The Trust has evaluated the structure, objective and activities of the Funds and determined that they meet the characteristics of an investment company. As such, these financial statements have applied the guidance as set forth in the Accounting Standards Codifications ("ASC") 946, Financial Services Investment Companies.
DIREXION ANNUAL REPORT
57
2. SIGNIFICANT ACCOUNTING POLICIES
The following is a summary of significant accounting policies consistently followed by the Funds in the preparation of their financial statements. These policies are in conformity with U.S. generally accepted accounting principles ("GAAP").
a) Investment Valuation – The Net Asset Value ("NAV") of each Fund is determined daily, Monday through Friday, as of the close of regular trading on the New York Stock Exchange ("NYSE"), each day the NYSE is open for business. The value of all portfolio securities and other assets held by a Fund will be determined as of the time a Fund calculates its NAV, 4:00 p.m. Eastern Time ("Valuation Time"). On days that the Securities Industry and Financial Markets Association ("SIFMA") recommends that the bond markets close all day, the Direxion High Yield Bull 1.2X Fund, Direxion Monthly 25+ Year Treasury Bull 1.35X Fund, Direxion Monthly 25+ Year Treasury Bear 1.35X Fund, Direxion Monthly 7-10 Year Treasury Bull 2X Fund and the Direxion Monthly 7-10 Year Treasury Bear 2X Fund (the "Fixed Income Funds") do not calculate their NAVs even if the NYSE is open for business. Similarly, on days that SIFMA recommends that the bond markets close early, each of the Fixed Income Funds calculates its NAV as of the time of the recommended close, usually 2:00 p.m. Eastern Time, rather than the close of regular trading on the NYSE. Equity securities, exchange-traded funds ("ETFs") and over-the-counter securities are valued at their last sales price or, if not available, at the average of the last bid and ask prices. Securities primarily traded on the NASDAQ National Market are valued using the NASDAQ Official Closing Price. Investments in open-end mutual funds, including money market funds, are valued at their respective quoted NAV on the valuation date. Futures contracts are valued at the settlement price established on the exchange on which they are traded, if that settlement price reflects trading prior to the Valuation Time. If the settlement price established by the exchange reflects trading after the Valuation Time, then the last sales price prior to Valuation Time will be used. Swap contracts are valued using the closing price of the underlying reference entity or the closing value of the underlying reference index. Short-term debt securities with an original maturity of 60 days or less are valued using the amortized cost method.
Other debt securities are valued by using the mean prices provided by the Funds' pricing service or, if such prices are unavailable, by a matrix pricing method. Securities for which reliable market quotations are not readily available, the Funds' pricing service does not provide a valuation for such securities, the Funds' pricing service provides valuation that in the judgment of the Adviser does not represent fair value, or the Fund or Adviser believes the market price is stale, are fair valued as determined by the Adviser under the supervision of the Board of Trustees. Additionally, the Adviser will monitor developments in the marketplace for significant events that may affect the value of those securities whose closing prices were established before the Valuation Time.
b) Swap Contracts – Each Fund may enter into equity swap contacts. Standard equity swap contracts are between two parties that agree to exchange the returns (or differentials in rates of return) earned or realized on particular predetermined investments or instruments. The gross amount to be exchanged is calculated with respect to a "notional amount" (i.e. the return on or increase in value of a particular dollar amount invested in a "basket" of securities representing a particular index or industry sector). A Fund enters into master netting agreements with the counterparty. These agreements calculate the obligations of the parties on a "net basis". Consequently, a Fund's current obligations under a swap agreement generally will be equal to the net amount to be paid or received under the agreement based on the relative value of the positions held by each party. A Fund's obligations are accrued daily and offset by any amounts owed to the Fund. However, a Fund does not offset the fair value amounts of the swap contract and the related collateral on the Statement of Assets and Liabilities arising from swap contracts executed with the same counterparty under such master netting agreements.
In a "long" equity swap agreement, the counterparty will generally agree to pay the Fund the amount, if any, by which the notional amount of the swap contract would have increased in value if the Fund had been invested in the particular securities, plus dividends that would have been received on those securities. The Fund will agree to pay the counterparty a floating rate of interest on the notional amount of the swap contract plus the amount, if any, by which the notional amount would have decreased in value had it been invested in such securities plus, in certain instances, commissions or trading spreads on the notional amounts. Thus, the return on the swap contract should be the gain or loss on the notional amount plus dividends on the securities less the interest paid by the Fund on the notional amount. In certain instances, market factors such as the interest rate environment and the demand to borrow the securities underlying the swap agreement can cause a scenario in which the counterparty will pay the Fund interest. Payments may be made at the conclusion of the contract or periodically during its term. Swap contracts do not include the delivery of securities. The net amount of the excess, if any, of the Fund's obligations over its entitlement with respect to each swap is accrued on a daily basis and an amount of cash or liquid assets, having an aggregate net asset value at least equal to such accrued excess is maintained in a segregated account. Until a swap contract is settled in cash, the gain or loss on the notional amount plus dividends on the securities
DIREXION ANNUAL REPORT
58
less the interest paid by the Fund on the notional amount are recorded as "unrealized appreciation or depreciation on swaps" and when cash is exchanged, the gain or loss is recorded as "realized gains or losses on swaps."
Accounting Standards Update No. 2013-01 "Disclosures about Offsetting Assets and Liabilities" ("ASU 2013-01"), requires entities to disclose (i) gross and net information about both instruments and transactions eligible for offset in the financial statements, and (ii) instruments and transactions subject to an agreement similar to a master netting agreement. ASU 2013-01 is limited in scope to the following financial instruments, to the extent they are offset in the financial statements or subject to an enforceable master netting arrangement or similar agreement: (i) recognized derivative instruments accounted for under ASC 815 (Derivatives and Hedging).
In order to better define its contractual rights and to secure rights that will help a Fund mitigate its counterparty risk , a Fund may enter into an International Swaps and Derivatives Association, Inc. Master Agreement ("ISDA Master Agreement") or similar agreement with its counterparties. An ISDA Master Agreement is a bilateral agreement between a Fund and a counterparty that governs over-the-counter derivatives ("OTC"), including swap contracts, and typically contains, among other things, collateral posting terms, netting and rights of set-off provisions in the event of a default and/or termination event. Under an ISDA Master Agreement, a Fund may, under certain circumstances, offset with the counterparty certain derivative financial instruments' payables and receivables to create a single net payment. The provisions of the ISDA Master Agreement typically permit a single net payment in the event of a default (close-out netting) or similar event, including the bankruptcy or insolvency of the counterparty.
Collateral requirements generally differ by type of derivative. Collateral terms are contract specific for OTC derivatives (e.g. swaps). Generally, for transactions traded under an ISDA Master Agreement, the collateral requirements are calculated by netting the marked-to-market amount for each transaction under such agreement and comparing that amount to the value of any collateral currently pledged by a Fund and the counterparty. Generally, the amount of collateral due from or to the counterparty must exceed a minimum transfer amount threshold before a transfer is required to be made. To the extent amounts due to a Fund from its derivatives counterparties are not fully collateralized, contractually or otherwise, the Fund bears the risk of loss from counterparty non-performance.
For financial reporting purposes, the Funds elect to not offset assets and liabilities subject to an ISDA Master Agreement, if any, in the Statements of Assets and Liabilities. Therefore, all qualifying transactions are presented on a gross basis in the Statements of Assets and Liabilities. As of August 31, 2017, the impact of netting of assets and liabilities and the offsetting of collateral pledged or received based on contractual netting/set-off provisions in the ISDA Master Agreement are detailed in the following pages.
In the event of the counterparty's default, bankruptcy or any other event for which the counterparty cannot meet its obligations, a Fund bears the risk of loss equal to the amount of the daily appreciation owed to the Fund. This obligation represents the daily gain accrued to the Fund from the close of business day prior to this event to the day on which this event occurs and the counterparty can no longer meet its obligations. A Fund will enter into swap agreements only with large, well-capitalized and established financial institutions. The creditworthiness of each of the firms that is a party to a swap agreement is monitored by the Adviser. Shareholders may obtain swap counterparty financial statements at www.sec.gov. Swap contracts are subject to credit risk. Credit risk occurs when the financial condition of an issuer of a security or instrument may cause it to default or become unable to pay interest or principal due on the security. The counterparty to a swap contract might default on its obligations. In addition, the Funds have agreements with certain counterparties with which it trades swap contracts that contain credit risk-related contingent features that could be triggered subject to certain circumstances. Such circumstances include agreed upon net asset value and performance-based thresholds. The maximum exposure to the Funds in regard to potential counterparty default and credit-risk related contingent features at August 31, 2017 is detailed in the following table. If such credit risk-related contingencies were triggered the counterparties would have the option to terminate any positions open under the master netting agreement.
DIREXION ANNUAL REPORT
59
Description: Swap Contract
Counterparty: Bank of America Merrill Lynch
| | | Assets:
Gross Amounts not
offset in the Statement
of Asset and Liabilities | | Liabilities:
Gross Amounts not
offset in the Statement
of Asset and Liabilities | |
Fund Name | | Gross
Amounts of
Recognized
Assets | | Financial
Instruments | | Collateral
Received | | Net Amount2 | | Gross
Amounts of
Recognized
Liabilities | | Financial
Instruments | | Collateral
Pledged | | Net Amount | |
Direxion Monthly
NASDAQ-100®
Bull 1.25X
Fund | | $ | 772,927 | | | $ | 706 | | | $ | — | | | $ | 772,221 | | | $ | 706 | | | $ | — | | | $ | 7061 | | | $ | — | | |
Direxion Monthly
NASDAQ-100®
Bear 1.25X
Fund | | | — | | | | — | | | | — | | | | — | | | | 6,871 | | | | — | | | | — | | | | 6,871 | | |
Direxion Monthly
NASDAQ-100®
Bull 2X Fund | | | 8,011,362 | | | | — | | | | 2,130,000 | | | | 5,881,362 | | | | — | | | | — | | | | — | | | | — | | |
1 The amount of collateral shown has been limited such that the net amount cannot be less than zero.
2 The amount shown is the maximum credit exposure of the Fund for the corresponding counterparty.
Description: Swap Contract
Counterparty: Credit Suisse International
| | | Assets:
Gross Amounts not
offset in the Statement
of Asset and Liabilities | | Liabilities:
Gross Amounts not
offset in the Statement
of Asset and Liabilities | |
Fund Name | | Gross
Amounts of
Recognized
Assets | | Financial
Instruments | | Collateral
Received | | Net Amount2 | | Gross
Amounts of
Recognized
Liabilities | | Financial
Instruments | | Collateral
Pledged | | Net Amount | |
Direxion Monthly
High Yield Bull
1.2X Fund | | $ | 609,229 | | | $ | — | | | $ | 440,000 | | | $ | 169,229 | | | $ | — | | | $ | — | | | $ | — | | | $ | — | | |
Direxion Monthly
25+ Year
Treasury Bull
1.35X Fund | | | 319,491 | | | | — | | | | 240,000 | | | | 79,491 | | | | — | | | | — | | | | — | | | | — | | |
Direxion Monthly
25+ Year
Treasury Bear
1.35X Fund | | | — | | | | — | | | | — | | | | — | | | | 15,232 | | | | — | | | | 15,2321 | | | | — | | |
Direxion Monthly
NASDAQ-100®
Bull 2X Fund | | | 1,154,699 | | | | — | | | | 900,000 | | | | 254,699 | | | | — | | | | — | | | | — | | | | — | | |
Direxion Monthly
S&P 500® Bull
2X Fund | | | 1,656,861 | | | | — | | | | 840,000 | | | | 816,861 | | | | — | | | | — | | | | — | | | | — | | |
Direxion Monthy
S&P 500® Bear
2X Fund | | | — | | | | — | | | | — | | | | — | | | | 1,048,859 | | | | — | | | | 1,048,8591 | | | | — | | |
Direxion Monthly
Small Cap Bull
2X Fund | | | 4,691 | | | | — | | | | — | | | | 4,691 | | | | — | | | | — | | | | — | | | | — | | |
Direxion Monthly
Small Cap Bear
2X Fund | | | — | | | | — | | | | — | | | | — | | | | 131,725 | | | | — | | | | 131,7251 | | | | — | | |
DIREXION ANNUAL REPORT
60
| | | Assets:
Gross Amounts not
offset in the Statement
of Asset and Liabilities | | Liabilities:
Gross Amounts not
offset in the Statement
of Asset and Liabilities | |
Fund Name | | Gross
Amounts of
Recognized
Assets | | Financial
Instruments | | Collateral
Received | | Net Amount2 | | Gross
Amounts of
Recognized
Liabilities | | Financial
Instruments | | Collateral
Pledged | | Net Amount | |
Direxion Monthly
7-10 Year
Treasury Bull
2X Fund | | $ | 314,932 | | | $ | — | | | $ | 300,000 | | | $ | 14,932 | | | $ | — | | | $ | — | | | $ | — | | | $ | — | | |
Direxion Monthly
7-10 Year
Treasury Bear
2X Fund | | | — | | | | — | | | | — | | | | — | | | | 122,159 | | | | — | | | | 122,1591 | | | | — | | |
Direxion Monthly
Emerging
Markets Bull
2X Fund | | | 178,239 | | | | — | | | | — | | | | 178,239 | | | | — | | | | — | | | | — | | | | — | | |
1 The amount of collateral shown has been limited such that the net amount cannot be less than zero.
2 The amount shown is the maximum credit exposure of the Fund for the corresponding counterparty.
c) Futures Contracts and Options on Futures Contracts – Each Fund may purchase and sell futures contracts and options on such futures contracts. A Fund may use futures contracts to gain exposure to, or hedge against changes in the values of equities, interest rates or foreign currencies. Upon entering into a contract, the Fund deposits and maintains as collateral such initial margin as required by the exchange on which the transaction is effected. Pursuant to the contract, the Fund agrees to receive from or pay to the broker an amount of cash equal to the daily fluctuation in value of the contract. Such receipts or payments are known as "variation margin" and are recorded by the Fund as unrealized gains and losses. When the contract is closed, the Fund records a realized gain or loss equal to the difference between the value of the contract at the time it was opened and the value at the time it was closed. As collateral for futures contracts, the Fund is required under the 1940 Act to maintain assets consisting of cash, cash equivalents or liquid securities. This collateral is required to be adjusted daily to reflect the market value of the purchase obligation for long futures contracts or the market value of the instrument underlying the contract, but not less than the market price at which the futures contract was established, for short futures contracts. Direxion Monthly 25+ Year Treasury Bull 1.35X Fund was invested in futures contracts during the year ended August 31, 2017.
d) Risks of Futures Contracts and Options on Futures Contracts – The risks inherent in the use of futures contracts and options on futures contracts include 1) adverse changes in the value of such instruments; 2) imperfect correlation between the price of futures contracts and options thereon and movements in the price of the underlying securities, index or futures contracts; 3) the possible absence of a liquid secondary market for any particular instrument at any time; 4) the possible need to defer closing out certain positions to avoid adverse tax consequences; and 5) the possible nonperformance by the counterparty under the terms of the contract. The Funds designate cash, cash equivalents and liquid securities as collateral for futures contracts and options on futures contracts. The Funds were not invested in any options on futures contracts during the year ended August 31, 2017.
e) Risks of Investing in Foreign Securities – Investments in foreign securities involve greater risks than investing in domestic securities. As a result, a Fund's returns and net asset values may be affected to a large degree by fluctuations in currency exchange rates, political, diplomatic or economic conditions and regulatory requirements in other countries. The laws and accounting, auditing, and financial reporting standards in foreign countries may require less disclosure as required in the U.S., and there may be less public information available about foreign companies. Investments in foreign emerging markets present a greater risk than investing in foreign issuers in general. The risk of political or social upheaval is greater in emerging markets. In addition, there may be risks of an economy's dependence on revenues from particular commodities, currency transfer restrictions, a limited number of buyers for such securities and delays and disruptions in securities settlement procedures.
DIREXION ANNUAL REPORT
61
f) Investment Transactions – Investment transactions are recorded on trade date. The Funds determine the gain or loss realized from investment transactions by comparing the identified cost, which is the same basis used for federal income tax purposes, with the net sales proceeds.
g) Investments in Other Investment Companies – A Fund may invest in another ETF or mutual fund collectively defined as "investment companies". As a result, Fund shareholders indirectly bear the Fund's proportionate share of fees and expenses paid by shareholders of the other investment company, in addition to the fees and expenses Fund shareholders bear in connection with the Fund's own operations. These costs are disclosed in the Fund's prospectus as Acquired Fund Fees and Expenses. Shareholders may obtain the financial statements of these investment companies at www.sec.gov.
h) Federal Income Taxes – Each Fund intends to comply with the requirements of Subchapter M of the Internal Revenue Code of 1986, as amended, necessary to qualify as a regulated investment company and to make the requisite distributions of income and capital gains to its shareholders sufficient to relieve it from all or substantially all Federal income taxes and excise taxes. No provision for Federal income taxes has been made in the Funds' financial statements.
i) Income and Expenses – Dividend income is recorded on the ex-dividend date. Interest income, including amortization of premium and discount, is recognized on an accrual basis. Expenses are charged to the Funds daily. Expenses are computed based on each Fund's respective average daily net assets. For additional discussion on expenses, refer to Note 4.
j) Distributions to Shareholders – Each Fund pays dividends from net investment income and distributes net realized capital gains, if any, at least annually. Income and capital gain distributions are determined in accordance with income tax regulations, which may differ from GAAP. Certain Funds also utilize earnings and profits distributed to shareholders on redemptions of shares as part of the dividends paid deduction. Distributions to shareholders are recorded on the ex-dividend date.
The tax character of distributions during the years ended August 31, 2017 and August 31, 2016, were as follows:
| | | Direxion Monthly
High Yield Bull 1.2X Fund | | Direxion Monthly
NASDAQ-100® Bull 1.25X Fund | | Direxion Monthly
NASDAQ-100® Bear 1.25X Fund | |
| | | Year Ended
August 31, 2017 | | Period of
February 17,
20161
to August 31,
2016 | | Year Ended
August 31, 2017 | | Period of
March 31,
20161
to August 31,
2016 | | Year Ended
August 31, 2017 | | Period of
March 31,
20161
to August 31,
2016 | |
Distributions
paid from: | |
Ordinary Income | | $ | 11,014,264 | | | $ | 2,760,767 | | | $ | — | | | $ | — | | | $ | — | | | $ | — | | |
Long-Term
Capital Gains | | | — | | | | — | | | | — | | | | — | | | | — | | | | |
Return of Capital | | | — | | | | — | | | | — | | | | — | | | | — | | | | — | | |
Total Distributions
paid | | $ | 11,014,264 | | | $ | 2,760,767 | | | $ | — | | | $ | — | | | $ | — | | | $ | — | | |
| | | Direxion Monthly
25+ Year Treasury Bull 1.35X Fund | | Direxion Monthly
25+ Year Treasury Bear 1.35X Fund | | Direxion Monthly
NASDAQ-100® Bull 2X Fund | |
| | | Year Ended
August 31, 2017 | | Period of
November 2,
20151
to August 31,
2016 | | Year Ended
August 31, 2017 | | Period of
November 2,
20151
to August 31,
2016 | | Year Ended
August 31, 2017 | | Year Ended
August 31, 2016 | |
Distributions
paid from: | |
Ordinary Income | | $ | — | | | $ | — | | | $ | — | | | $ | — | | | $ | — | | | $ | 4,252,174 | | |
Long-Term
Capital Gains | | | — | | | | — | | | | — | | | | — | | | | — | | | | — | | |
Return of Capital | | | — | | | | — | | | | — | | | | — | | | | — | | | | — | | |
Total Distributions
paid | | $ | — | | | $ | — | | | $ | — | | | $ | — | | | $ | — | | | $ | 4,252,174 | | |
DIREXION ANNUAL REPORT
62
| | | Direxion Monthly
S&P 500® Bull 2X Fund | | Direxion Monthly
S&P 500® Bear 2X Fund | | Direxion Monthly
Small Cap Bull 2X Fund | |
| | | Year Ended
August 31, 2017 | | Year Ended
August 31, 2016 | | Year Ended
August 31, 2017 | | Year Ended
August 31, 2016 | | Year Ended
August 31, 2017 | | Year Ended
August 31, 2016 | |
Distributions
paid from: | |
Ordinary Income | | $ | — | | | $ | 3,505,442 | | | $ | — | | | $ | — | | | $ | — | | | $ | — | | |
Long-Term
Capital Gains | | | — | | | | — | | | | — | | | | — | | | | — | | | | — | | |
Return of Capital | | | — | | | | — | | | | — | | | | — | | | | — | | | | — | | |
Total Distributions
paid | | $ | — | | | $ | 3,505,442 | | | $ | — | | | $ | — | | | $ | — | | | $ | — | | |
| | | Direxion Monthly
Small Cap Bear 2X Fund | | Direxion Monthly
7-10 Year Treasury Bull 2X Fund | | Direxion Monthly
7-10 Year Treasury Bear 2X Fund | |
| | | Year Ended
August 31, 2017 | | Year Ended
August 31, 2016 | | Year Ended
August 31, 2017 | | Year Ended
August 31, 2016 | | Year Ended
August 31, 2017 | | Year Ended
August 31, 2016 | |
Distributions
paid from: | |
Ordinary Income | | $ | — | | | $ | — | | | $ | — | | | $ | — | | | $ | — | | | $ | — | | |
Long-Term
Capital Gains | | | — | | | | — | | | | — | | | | — | | | | — | | | | — | | |
Return of Capital | | | — | | | | — | | | | — | | | | — | | | | — | | | | — | | |
Total Distributions
paid | | $ | — | | | $ | — | | | $ | — | | | $ | — | | | $ | — | | | $ | — | | |
| | | Direxion Monthly
Emerging Markets Bull 2X Fund | | | | | |
| | | Year Ended
August 31, 2017 | | Year Ended
August 31, 2016 | | | | | | | | | |
Distributions
paid from: | |
Ordinary Income | | $ | — | | | $ | — | | | | | | | | | | |
Long-Term
Capital Gains | | | — | | | | — | | | | | | | | | | |
Return of Capital | | | — | | | | — | | | | | | | | | | |
Total Distributions
paid | | $ | — | | | $ | — | | | | | | | | | | |
1 Commencement of operations.
The Funds are designating as long-term capital gain dividends, pursuant to Internal Revenue Code Section 852(b)(3), the amount necessary to reduce the earnings and profits of the Funds related to net capital gain to zero for the tax year ended August 31, 2017. To the extent necessary to fully distribute such capital gain, the Funds also designate earnings and profits distributed to shareholders on the redemption of shares.
DIREXION ANNUAL REPORT
63
As of August 31, 2017, the components of accumulated earnings/losses of the Funds on a tax basis were as follows:
| | Direxion Monthly
High Yield
Bull 1.2X Fund | | Direxion Monthly
NASDAQ-100®
Bull 1.25X Fund | | Direxion Monthly
NASDAQ-100®
Bear 1.25X Fund | | Direxion Monthly
25+ Year Treasury
Bull 1.35X Fund | |
Tax cost of investments | | $ | 298,475,424 | | | $ | 8,746,547 | | | $ | 3,727 | | | $ | 3,443,428 | | |
Gross unrealized appreciation | | | 7,427,060 | | | | 772,221 | | | | — | | | | 319,491 | | |
Gross unrealized depreciation | | | (3,065,312 | ) | | | (106,547 | ) | | | (10,598 | ) | | | (453,586 | ) | |
Net unrealized appreciation/(depreciation) | | $ | 4,361,748 | | | $ | 665,674 | | | $ | (10,598 | ) | | $ | (134,095 | ) | |
Undistributed ordinary income (loss) | | | — | | | | 3,647,251 | | | | — | | | | 130,167 | | |
Undistributed capital gain (loss) | | | — | | | | — | | | | — | | | | — | | |
Total distributable earnings (losses) | | | — | | | | 3,647,251 | | | | — | | | | 130,167 | | |
Other accumulated earnings (losses) | | | — | | | | (3,428,838 | ) | | | (214,517 | ) | | | — | | |
Total accumulated earnings (losses) | | $ | 4,361,748 | | | $ | 884,087 | | | $ | (225,115 | ) | | $ | (3,928 | ) | |
| | Direxion Monthly
25+ Year Treasury
Bear 1.35X Fund | | Direxion Monthly
NASDAQ-100®
Bull 2X Fund | | Direxion Monthly
S&P 500®
Bull 2X Fund | | Direxion Monthly
S&P 500®
Bear 2X Fund | |
Tax cost of investments | | $ | 456,578 | | | $ | 77,750,783 | | | $ | 14,410,353 | | | $ | 11,209,828 | | |
Gross unrealized appreciation | | | — | | | | 9,166,061 | | | | 1,656,861 | | | | — | | |
Gross unrealized depreciation | | | (201,810 | ) | | | (4,280,783 | ) | | | (353 | ) | | | (7,348,687 | ) | |
Net unrealized appreciation/(depreciation) | | $ | (201,810 | ) | | $ | 4,885,278 | | | $ | 1,656,508 | | | $ | (7,348,687 | ) | |
Undistributed ordinary income (loss) | | | — | | | | 10,222,264 | | | | 3,312,615 | | | | — | | |
Undistributed capital gain (loss) | | | — | | | | — | | | | — | | | | — | | |
Total distributable earnings (losses) | | | — | | | | 10,222,264 | | | | 3,312,615 | | | | — | | |
Other accumulated earnings (losses) | | | (2,990,605 | ) | | | — | | | | — | | | | (41,053,855 | ) | |
Total accumulated earnings (losses) | | $ | (3,192,415 | ) | | $ | 15,107,542 | �� | | $ | 4,969,123 | | | $ | (48,402,542 | ) | |
| | Direxion Monthly
Small Cap
Bull 2X Fund | | Direxion Monthly
Small Cap
Bear 2X Fund | | Direxion Monthly
7-10 Year Treasury
Bull 2X Fund | | Direxion Monthly
7-10 Year Treasury
Bear 2X Fund | |
Tax cost of investments | | $ | 3,330,000 | | | $ | 1,882,153 | | | $ | 4,545,514 | | | $ | 1,907,381 | | |
Gross unrealized appreciation | | | 4,691 | | | | — | | | | 314,932 | | | | — | | |
Gross unrealized depreciation | | | — | | | | (913,878 | ) | | | (85,514 | ) | | | (479,540 | ) | |
Net unrealized appreciation/(depreciation) | | $ | 4,691 | | | $ | (913,878 | ) | | $ | 229,418 | | | $ | (479,540 | ) | |
Undistributed ordinary income (loss) | | | — | | | | — | | | | — | | | | — | | |
Undistributed capital gain (loss) | | | — | | | | — | | | | — | | | | — | | |
Total distributable earnings (losses) | | | — | | | | — | | | | — | | | | — | | |
Other accumulated earnings (losses) | | | — | | | | (49,208,142 | ) | | | (2,152,346 | ) | | | (21,868,302 | ) | |
Total accumulated earnings (losses) | | $ | 4,691 | | | $ | (50,122,020 | ) | | $ | (1,922,928 | ) | | $ | (22,347,842 | ) | |
| | Direxion Monthly
Emerging Markets
Bull 2X Fund | |
Tax cost of investments | | $ | 3,740,538 | | |
Gross unrealized appreciation | | | 178,239 | | |
Gross unrealized depreciation | | | (538 | ) | |
Net unrealized appreciation/(depreciation) | | $ | 177,701 | | |
Undistributed ordinary income (loss) | | | — | | |
Undistributed capital gain (loss) | | | — | | |
Total distributable earnings (losses) | | | — | | |
Other accumulated earnings (losses) | | | (45,264,119 | ) | |
Total accumulated earnings (losses) | | $ | (45,086,418 | ) | |
DIREXION ANNUAL REPORT
64
The difference between book cost of investments and tax cost of investments is attributable primarily to the tax deferral of losses on wash sales. Other accumulated gain/(loss) is generally comprised of capital loss carryforwards and qualified late year loss deferrals.
On the Statements of Assets and Liabilities, the following adjustments were made for permanent tax differences between accounting for net investment income/(loss) and realized gains and losses under GAAP and tax reporting:
| | Net Investment
Income/(Loss) | | Net Realized
Gain (Loss) | | Capital Stock | |
Direxion Monthly High Yield Bull 1.2X Fund | | $ | 173,059 | | | $ | (6,913,236 | ) | | $ | 6,740,177 | | |
Direxion Monthly NASDAQ-100® Bull 1.25X Fund | | | 70,939 | | | | (2,675,821 | ) | | | 2,604,882 | | |
Direxion Monthly NASDAQ-100® Bear 1.25X Fund | | | 117 | | | | — | | | | (117 | ) | |
Direxion Monthly 25+ Year Treasury Bull 1.35X Fund | | | 97,168 | | | | (1,645,157 | ) | | | 1,547,989 | | |
Direxion Monthly 25+ Year Treasury Bear 1.35X Fund | | | 62,673 | | | | — | | | | (62,673 | ) | |
Direxion Monthly NASDAQ-100® Bull 2X Fund | | | 1,874,621 | | | | (37,303,383 | ) | | | 35,428,762 | | |
Direxion Monthly S&P 500® Bull 2X Fund | | | 461,304 | | | | (11,145,477 | ) | | | 10,684,173 | | |
Direxion Monthly S&P 500® Bear 2X Fund | | | 123,690 | | | | 18,781,801 | | | | (18,905,491 | ) | |
Direxion Monthly Small Cap Bull 2X Fund | | | 290,793 | | | | (3,147,537 | ) | | | 2,856,744 | | |
Direxion Monthly Small Cap Bear 2X Fund | | | 85,935 | | | | — | | | | (85,935 | ) | |
Direxion Monthly 7-10 Year Treasury Bull 2X Fund | | | 73,451 | | | | (73,451 | ) | | | — | | |
Direxion Monthly 7-10 Year Treasury Bear 2X Fund | | | 72,375 | | | | 2,717,991 | | | | (2,790,366 | ) | |
Direxion Monthly Emerging Markets Bull 2X Fund | | | 49,273 | | | | 6,688,903 | | | | (6,738,176 | ) | |
Net investment income/(loss) and realized gains and losses for federal income tax purposes may differ from those reported on the financial statements because of permanent book-to-tax differences. GAAP requires that permanent differences in net investment income/(loss) and realized gains and losses due to differences between financial reporting and tax reporting be reclassified between various components of net assets. The permanent differences primarily relate to net operating losses, expired capital loss carryforwards, nondeductible excise taxes, distribution reclasses, and utilization of earnings and profits distributed to shareholders on redemption of shares.
In order to meet certain excise tax distribution requirements, the Funds are required to measure and distribute annually net capital gains realized during a twelve month period ending October 31 and net investment income earned during a twelve month period ending December 31. In connection with this, the Funds are permitted for tax purpose to defer into their next fiscal year qualified late year losses. Qualified late year capital losses are any net capital losses incurred between November 1 and the end of the fiscal year, August 31, 2017. Qualified late year ordinary losses are generally losses incurred between January 1 and the end of their fiscal year, August 31, 2017.
At August 31, 2017, the following Funds deferred, on a tax basis, qualified late year losses of:
| | Late Year
Ordinary Losses | | Post-October
Capital Losses | |
Direxion Monthly High Yield Bull 1.2X Fund | | $ | — | | | $ | — | | |
Direxion Monthly NASDAQ-100® Bull 1.25X Fund | | | — | | | | — | | |
Direxion Monthly NASDAQ-100® Bear 1.25X Fund | | | 233 | | | | — | | |
Direxion Monthly 25+ Year Treasury Bull 1.35X Fund | | | — | | | | — | | |
Direxion Monthly 25+ Year Treasury Bear 1.35X Fund | | | 96,590 | | | | — | | |
Direxion Monthly NASDAQ-100® Bull 2X Fund | | | — | | | | — | | |
Direxion Monthly S&P 500® Bull 2X Fund | | | — | | | | — | | |
Direxion Monthly S&P 500® Bear 2X Fund | | | 39,778 | | | | — | | |
Direxion Monthly Small Cap Bull 2X Fund | | | — | | | | — | | |
Direxion Monthly Small Cap Bear 2X Fund | | | 28,824 | | | | — | | |
Direxion Monthly 7-10 Year Treasury Bull 2X Fund | | | 62,568 | | | | 2,089,778 | | |
Direxion Monthly 7-10 Year Treasury Bear 2X Fund | | | 23,443 | | | | — | | |
Direxion Monthly Emerging Markets Bull 2X Fund | | | 26,026 | | | | — | | |
Under the Regulated Investment Company Modernization Act of 2010, net capital losses recognized for tax years beginning after December 22, 2010 may be carried forward indefinitely, and their character is retained as short-term and/or long-term. Previous law limited the carry forward of capital losses to the eight tax years following the year the capital loss was
DIREXION ANNUAL REPORT
65
realized. If a Fund has capital losses that are subject to current law and also has capital losses subject to prior law, the losses realized under current law will be utilized to offset capital gains before any of the losses governed by prior law can be used. As a result of these ordering rules, capital losses realized under previous law may be more likely to expire unused. Capital losses realized under current law will carry forward retaining their classification as long-term or short-term losses; as compared to under prior law in which all capital losses were carried forward as short-term capital losses.
At August 31, 2017, the following Funds had capital loss carryforwards on a tax basis of:
| | | 8/31/2018 | | 8/31/2019 | | Unlimited ST | | Unlimited LT | | Annual
Limitation | |
Direxion Monthly High Yield Bull 1.2X Fund | | $ | — | | | $ | — | | | $ | — | | | $ | — | | | $ | — | | |
Direxion Monthly NASDAQ-100® Bull 1.25X Fund | | | — | | | | — | | | | (3,428,838 | ) | | | — | | | | 926 | | |
Direxion Monthly NASDAQ-100® Bear 1.25X Fund | | | — | | | | — | | | | (214,284 | ) | | | — | | | | 2,231 | | |
Direxion Monthly 25+ Year Treasury Bull 1.35X Fund | | | — | | | | — | | | | — | | | | — | | | | — | | |
Direxion Monthly 25+ Year Treasury Bear 1.35X Fund | | | — | | | | — | | | | (1,762,389 | ) | | | (1,131,626 | ) | | | — | | |
Direxion Monthly NASDAQ-100® Bull 2X Fund | | | — | | | | — | | | | — | | | | — | | | | — | | |
Direxion Monthly S&P 500® Bull 2X Fund | | | — | | | | — | | | | — | | | | — | | | | — | | |
Direxion Monthly S&P 500® Bear 2X Fund | | | (4,649,215 | ) | | | — | | | | (36,364,862 | ) | | | — | | | | — | | |
Direxion Monthly Small Cap Bull 2X Fund | | | — | | | | — | | | | — | | | | — | | | | — | | |
Direxion Monthly Small Cap Bear 2X Fund | | | (3,873,693 | ) | | | (5,087,146 | ) | | | (40,218,479 | ) | | | — | | | | — | | |
Direxion Monthly 7-10 Year Treasury Bull 2X Fund | | | — | | | | — | | | | — | | | | — | | | | — | | |
Direxion Monthly 7-10 Year Treasury Bear 2X Fund | | | (1,976,123 | ) | | | — | | | | (19,868,736 | ) | | | — | | | | — | | |
Direxion Monthly Emerging Markets Bull 2X Fund | | | (1,727,140 | ) | | | — | | | | (16,875,150 | ) | | | (26,635,803 | ) | | | — | | |
The Direxion Monthly NASDAQ-100® Bull 1.25X Fund and the Direxion Monthly Emerging Markets Bull 2X Fund utilized $895 and $1,557,782 of capital loss carryforward, respectively.
The Direxion Monthly 7-10 Year Treasury Bear 2X Fund, Direxion Monthly Emerging Markets Bull 2X Fund and Direxion Monthly S&P 500® Bear 2X Fund had $2,717,991, $6,688,903 and $18,781,801 of capital losses, respectively, expire on August 31, 2017.
In accordance with Sections 381-384 of the Internal Revenue Code, a portion of certain Fund's losses have been subjected to an annual limitation.
To the extent that the Funds realize future net capital gains, those gains will be offset by any unused capital loss carryover.
The Funds follow authoritative financial reporting rules regarding recognition and measurement of tax positions taken or expected to be taken on a tax return. The Funds have reviewed all open tax years and concluded that there is no effect to the Funds' financial positions or results of operations and no tax liability resulting from unrecognized tax benefits relating to uncertain income tax positions taken or expected to be taken on a tax return. The Funds recognize interest and penalties, if any, related to unrecognized tax benefits as income tax expense in the Statement of Operations. During this period, the Funds did not incur any interest or penalties. Open tax years are those years that are open for examination by the relevant income taxing authority. As of August 31, 2017, open Federal and state income tax years include the tax years ended August 31, 2014 through August 31, 2017. The Funds have no examination in progress. The Funds are also not aware of any tax positions for which it is reasonably possible that the total amounts of unrecognized tax expense will significantly change in the next twelve months.
k) Guarantees and Indemnifications – In the ordinary course of business, the Funds enter into contracts that contain a variety of indemnification provisions pursuant to which the Funds agree to indemnify third parties upon occurrence of specified events. The Funds' maximum exposure relating to these indemnification agreements is unknown. However, the Funds have not had prior claims or losses in connection with these provisions and believe the risk of loss is remote.
l) Use of Estimates – The preparation of financial statements in conformity with GAAP requires management to make estimates and assumptions that affect the reported amounts of assets and liabilities and disclosure of contingent assets and liabilities at the date of the financial statements and the reported amounts of revenues and expenses during the reporting period. Actual results could differ from those estimates.
DIREXION ANNUAL REPORT
66
3. INVESTMENT TRANSACTIONS
During the year ended August 31, 2017, the aggregate purchases and sales of investments (excluding short-term investments, swaps and futures contracts) in the Direxion Monthly High Yield Bull 1.2X Fund were $916,701,935 and $812,065,819, respectively. There were no purchases and sales as defined above in any of the other Funds.
There were no purchases or sales of long-term U.S. Government securities in the Funds during the year ended August 31, 2017.
4. INVESTMENT ADVISORY AND OTHER AGREEMENTS
Investment Advisory Agreement: The Funds have entered into an investment advisory agreement with the Adviser. The Adviser earns a fee, computed daily and payable monthly, applied to each Fund's average daily net assets at the annual rate of 0.75%.
Operating Services Agreement: The Funds have entered into an Operating Services Agreement (the "Agreement") with the Adviser. Under the Agreement, the Adviser will be responsible for all expenses of the Trust except the following: management fees, distribution and/or service fees, acquired fund fees, taxes, leverage interest, dividends or interest on short positions, other interest expenses, brokerage commission and other extraordinary expenses outside the typical day-to-day operations of the Funds through September 1, 2019.
In consideration for the services rendered pursuant to the Agreement, the Funds pay to the Adviser, as compensation for the services provided by the Adviser under the Agreement, a monthly fee. The monthly fee is calculated on an annualized basis on the daily average net assets of each Fund and the below amount:
Direxion Monthly High Yield Bull 1.2X Fund | | | 0.35 | % | |
Direxion Monthly NASDAQ-100® Bull 1.25X Fund | | | 0.15 | % | |
Direxion Monthly NASDAQ-100® Bear 1.25X Fund | | | 0.15 | % | |
Direxion Monthly 25+ Year Treasury Bull 1.35X Fund | | | 0.10 | % | |
Direxion Monthly 25+ Year Treasury Bear 1.35X Fund | | | 0.10 | % | |
Direxion Monthly NASDAQ-100® Bull 2X Fund | | | 0.35 | % | |
Direxion Monthly S&P 500® Bull 2X Fund | | | 0.35 | % | |
Direxion Monthly S&P 500® Bear 2X Fund | | | 0.35 | % | |
Direxion Monthly Small Cap Bull 2X Fund | | | 0.35 | % | |
Direxion Monthly Small Cap Bear 2X Fund | | | 0.35 | % | |
Direxion Monthly 7-10 Year Treasury Bull 2X Fund | | | 0.35 | % | |
Direxion Monthly 7-10 Year Treasury Bear 2X Fund | | | 0.35 | % | |
Direxion Monthly Emerging Markets Bull 2X Fund | | | 0.35 | % | |
Distribution Expenses: Shares of the Funds are subject to an annual 12b-1 fee of up to 1.00% of a Fund's average daily net assets. Each Fund currently pays a 12b-1 fee of 0.25% of the respective Fund's average daily net assets.
Rafferty Capital Markets, LLC (the "Distributor") serves as principal underwriter of the Funds and acts as the Funds' distributor in a continuous public offering of the Funds' shares. The Distributor is an affiliate of the Adviser.
The Adviser voluntarily reimbursed expenses in the following Funds:
Fund | | Expenses
Reimbursed | |
Direxion Monthly NASDAQ-100® Bull 1.25X Fund | | $ | 2,380 | | |
Direxion Monthly 25+ Year Treasury Bull 1.35X Fund | | | 8,218 | | |
Direxion Monthly 25+ Year Treasury Bear 1.35X Fund | | | 24,848 | | |
These voluntarily reimbursements were made so that the Funds could more closely track the performance of their respective benchmarks. These reimbursements are reflected on the Statements of Operations as Reimbursement of expenses from Adviser and the effect of these reimbursements are presented on the Financial Highlights.
DIREXION ANNUAL REPORT
67
5. VALUATION MEASUREMENTS
The Funds follow authoritative fair valuation accounting standards, which establish an authoritative definition of fair value and set out a hierarchy for measuring fair value. These standards require additional disclosures about the various inputs and valuation techniques used to develop the measurements of fair value and a discussion in changes in valuation techniques and related inputs during the period. These inputs are summarized in the three broad levels below:
Level 1 – Quoted prices in active markets for identical securities
Level 2 – Evaluated price based on other significant observable inputs (including quoted prices for similar securities, interest rates, prepayment speeds, credit risk, etc.)
Level 3 – Significant unobservable inputs (including the Fund's own assumptions in determining fair value of investments)
The inputs or methodology used for valuing securities are not an indication of the credit risk associated with investing in those securities.
The follow is a summary of the inputs used to value the Funds' securities as of August 31, 2017.
| | | Direxion Monthly High Yield Bull 1.2X Fund | |
Asset Class | | Level 1 | | Level 2 | | Level 3 | | Total | |
Investment Companies – Fixed Income | | $ | 286,517,943 | | | $ | — | | | $ | — | | | $ | 286,517,943 | | |
Short Term Investments | | | 15,710,000 | | | | — | | | | — | | | | 15,710,000 | | |
Other Financial Instruments* | | | — | | | | 609,229 | | | | — | | | | 609,229 | | |
| | | Direxion Monthly NASDAQ-100® Bull 1.25X Fund | |
Asset Class | | Level 1 | | Level 2 | | Level 3 | | Total | |
Short Term Investments | | $ | 8,640,000 | | | $ | — | | | $ | — | | | $ | 8,640,000 | | |
Other Financial Instruments* | | | — | | | | 772,221 | | | | — | | | | 772,221 | | |
| | | Direxion Monthly NASDAQ-100® Bear 1.25X Fund | |
Asset Class | | Level 1 | | Level 2 | | Level 3 | | Total | |
Short Term Investments | | $ | — | | | $ | — | | | $ | — | | | $ | — | | |
Other Financial Instruments* | | | — | | | | (6,871 | ) | | | — | | | | (6,871 | ) | |
| | | Direxion Monthly 25+ Year Treasury Bull 1.35X Fund | |
Asset Class | | Level 1 | | Level 2 | | Level 3 | | Total | |
Short Term Investments | | $ | 2,990,000 | | | $ | — | | | $ | — | | | $ | 2,990,000 | | |
Other Financial Instruments* | | | (158 | ) | | | 319,491 | | | | — | | | | 319,333 | | |
| | | Direxion Monthly 25+ Year Treasury Bear 1.35X Fund | |
Asset Class | | Level 1 | | Level 2 | | Level 3 | | Total | |
Short Term Investments | | $ | 270,000 | | | $ | — | | | $ | — | | | $ | 270,000 | | |
Other Financial Instruments* | | | — | | | | (15,232 | ) | | | — | | | | (15,232 | ) | |
| | | Direxion Monthly NASDAQ-100® Bull 2X Fund | |
Asset Class | | Level 1 | | Level 2 | | Level 3 | | Total | |
Short Term Investments | | $ | 73,470,000 | | | $ | — | | | $ | — | | | $ | 73,470,000 | | |
Other Financial Instruments* | | | — | | | | 9,166,061 | | | | — | | | | 9,166,061 | | |
| | | Direxion Monthly S&P 500® Bull 2X Fund | |
Asset Class | | Level 1 | | Level 2 | | Level 3 | | Total | |
Short Term Investments | | $ | 14,410,000 | | | $ | — | | | $ | — | | | $ | 14,410,000 | | |
Other Financial Instruments* | | | — | | | | 1,656,861 | | | | — | | | | 1,656,861 | | |
| | | Direxion Monthly S&P 500® Bear 2X Fund | |
Asset Class | | Level 1 | | Level 2 | | Level 3 | | Total | |
Short Term Investments | | $ | 4,910,000 | | | $ | — | | | $ | — | | | $ | 4,910,000 | | |
Other Financial Instruments* | | | — | | | | (1,048,859 | ) | | | — | | | | (1,048,859 | ) | |
DIREXION ANNUAL REPORT
68
| | | Direxion Monthly Small Cap Bull 2X Fund | |
Asset Class | | Level 1 | | Level 2 | | Level 3 | | Total | |
Short Term Investments | | $ | 3,330,000 | | | $ | — | | | $ | — | | | $ | 3,330,000 | | |
Other Financial Instruments* | | | — | | | | 4,691 | | | | — | | | | 4,691 | | |
| | | Direxion Monthly Small Cap Bear 2X Fund | |
Asset Class | | Level 1 | | Level 2 | | Level 3 | | Total | |
Short Term Investments | | $ | 1,100,000 | | | $ | — | | | $ | — | | | $ | 1,100,000 | | |
Other Financial Instruments* | | | — | | | | (131,725 | ) | | | — | | | | (131,725 | ) | |
| | | Direxion Monthly 7-10 Year Treasury Bull 2X Fund | |
Asset Class | | Level 1 | | Level 2 | | Level 3 | | Total | |
Short Term Investments | | $ | 4,460,000 | | | $ | — | | | $ | — | | | $ | 4,460,000 | | |
Other Financial Instruments* | | | — | | | | 314,932 | | | | — | | | | 314,932 | | |
| | | Direxion Monthly 7-10 Year Treasury Bear 2X Fund | |
Asset Class | | Level 1 | | Level 2 | | Level 3 | | Total | |
Short Term Investments | | $ | 1,550,000 | | | $ | — | | | $ | — | | | $ | 1,550,000 | | |
Other Financial Instruments* | | | — | | | | (122,159 | ) | | | — | | | | (122,159 | ) | |
| | | Direxion Monthly Emerging Markets Bull 2X Fund | |
Asset Class | | Level 1 | | Level 2 | | Level 3 | | Total | |
Short Term Investments | | $ | 3,740,000 | | | $ | — | | | $ | — | | | $ | 3,740,000 | | |
Other Financial Instruments* | | | — | | | | 178,239 | | | | — | | | | 178,239 | | |
For further detail on each asset class, see each Fund's Schedule of Investments.
* Other financial instruments are derivative instruments not reflected in the Schedules of Investments, such as futures and swap contracts. Futures contracts and swap contracts are valued at the unrealized appreciation (depreciation) on the instrument.
The Funds also follow authoritative accounting standards, which require additional disclosure regarding fair value measurements. Specifically, these standards require reporting entities to disclose a) the input and valuation techniques used to measure fair value for both recurring and nonrecurring fair value measurements, for Level 2 or Level 3 positions, b) transfers between all levels (including Level 1 and Level 2) on a gross basis (i.e. transfers out must be disclosed separately from transfers in) as well as the reason(s) for the transfers, and c) purchases and sales on a gross basis in the Level 3 rollforward rather than as one net number. Additionally, reporting entities are required to disclose quantitative information about unobservable inputs used in the fair value measurements categorized within Level 3 of the fair value hierarchy.
There were no transfers between Level 1 and Level 2 securities during the year ended August 31, 2017. There were no Level 3 securities held by the Funds during the year ended August 31, 2017. It is the Funds' policy to recognize transfers into Level 3 at the value as of the beginning of the period, if applicable.
6. ADDITIONAL DISCLOSURES ABOUT DERIVATIVE INSTRUMENTS
The Funds follow authoritative standards of accounting for derivative instruments, which establish disclosure requirements for derivative instruments. These standards improve financial reporting for derivative instruments by requiring enhanced disclosures that enables investors to understand how and why a fund uses derivatives instruments, how a fund accounts for derivative instruments and how derivative instruments affect a fund's financial position and results of operations.
The Funds use derivative instruments as part of their principal investment strategy to achieve their investment objective. For additional discussion on the risks associated with derivative instruments refer to Note 2. As of August 31, 2017, the Funds were invested in futures and swap contracts.
DIREXION ANNUAL REPORT
69
At August 31, 2017, the fair value of derivatives instruments, by primary risk, were as follows:
Asset Derivatives1 | |
| | | | | Interest Rate Risk | | Equity Risk | | Credit Risk | | Total | |
Direxion Monthly High Yield
Bull 1.2X Fund | | Swap contracts | | $ | — | | | $ | — | | | $ | 609,229 | | | $ | 609,229 | | |
Direxion Monthly NASDAQ-100®
Bull 1.25X Fund | | Swap contracts | | | — | | | | 772,927 | | | | — | | | | 772,927 | | |
Direxion Monthly 25+ Year Treasury
Bull 1.35X Fund | | Swap contracts | | | 319,491 | | | | — | | | | — | | | | 319,491 | | |
Direxion Monthly NASDAQ-100® Bull
2X Fund | | Swap contracts | | | — | | | | 9,166,061 | | | | — | | | | 9,166,061 | | |
Direxion Monthly S&P 500® Bull 2X Fund | | Swap contracts | | | — | | | | 1,656,861 | | | | — | | | | 1,656,861 | | |
Direxion Monthly Small Cap Bull 2X Fund | | Swap contracts | | | — | | | | 4,691 | | | | — | | | | 4,691 | | |
Direxion Monthly 7-10 Year Treasury
Bull 2X Fund | | Swap contracts | | | 314,932 | | | | — | | | | — | | | | 314,932 | | |
Direxion Monthly Emerging Markets
Bull 2X Fund | | Swap contracts | | | — | | | | 178,239 | | | | — | | | | 178,239 | | |
Liability Derivatives2 | |
| | | | | Interest Rate Risk | | Equity Risk | | Credit Risk | | Total | |
Direxion Monthly NASDAQ-100®
Bull 1.25X Fund | | Swap contracts | | $ | — | | | $ | 706 | | | $ | — | | | $ | 706 | | |
Direxion Monthly NASDAQ-100®
Bear 1.25X Fund | | Swap contracts | | | — | | | | 6,871 | | | | — | | | | 6,871 | | |
Direxion Monthly 25+ Year Treasury
Bull 1.35X Fund | | Futures contracts* | | | 158 | | | | — | | | | — | | | | 158 | | |
Direxion Monthly 25+ Year Treasury
Bear 1.35X Fund | | Swap contracts | | | 15,232 | | | | — | | | | — | | | | 15,232 | | |
Direxion Monthly S&P 500® Bear 2X Fund | | Swap contracts | | | — | | | | 1,048,859 | | | | — | | | | 1,048,859 | | |
Direxion Monthly Small Cap Bear 2X Fund | | Swap contracts | | | — | | | | 131,725 | | | | — | | | | 131,725 | | |
Direxion Monthly 7-10 Year Treasury
Bear 2X Fund | | Swap contracts | | | 122,159 | | | | | | — | | | | 122,159 | | |
1 Statements of Assets and Liabilities location: Unrealized appreciation on swaps, variation margin.
2 Statements of Assets and Liabilities location: Unrealized depreciation on swaps, variation margin.
* Cumulative appreciation (depreciation) of futures contracts as reported in the Schedules of Investments. Only current day's variation margin, if any, is reported within the Statements of Assets and Liabilities.
Transactions in derivative instruments during the period ended August 31, 2017, by primary risk, were as follows:
| | | | | Interest Rate Risk | | Equity Risk | | Credit Risk | | Total | |
Direxion Monthly
High Yield Bull 1.2X Fund | | Net Realized gain (loss)1
Swap contracts | | $ | — | | | $ | — | | | $ | 7,020,687 | | | $ | 7,020,687 | | |
| | | Change in net unrealized
appreciation (depreciation)2
Swap contracts | | | — | | | | — | | | | (581,601 | ) | | | (581,601 | ) | |
DIREXION ANNUAL REPORT
70
| | | | | Interest Rate Risk | | Equity Risk | | Credit Risk | | Total | |
Direxion Monthly
NASDAQ-100® | | Net Realized gain (loss)1 | | | | | | | | | |
Bull 1.25X Fund | | Swap contracts | | $ | — | | | $ | 6,217,560 | | | $ | — | | | $ | 6,217,560 | | |
| | | Change in net unrealized
appreciation (depreciation)2
Swap contracts | | | — | | | | 772,634 | | | | — | | | | 772,634 | | |
Direxion Monthly
NASDAQ-100®
Bear 1.25X Fund | | Net Realized gain (loss)1
Swap contracts | | | — | | | | (13,338 | ) | | | — | | | | (13,338 | ) | |
| | | Change in net unrealized
appreciation (depreciation)2
Swap contracts | | | — | | | | (6,526 | ) | | | — | | | | (6,526 | ) | |
Direxion Monthly
25+ Year Treasury
Bull 1.35X Fund | | Net Realized gain (loss)1
Futures contracts | | | 1,082,288 | | | | — | | | | — | | | | 1,082,288 | | |
| | | Swap contracts | | | 215,122 | | | | — | | | | — | | | | 215,122 | | |
| | | Change in net unrealized
appreciation (depreciation)2
Futures contracts | | | (158 | ) | | | — | | | | — | | | | (158 | ) | |
| | | Swap contracts | | | 316,960 | | | | — | | | | — | | | | 316,960 | | |
Direxion Monthly
25+ Year Treasury
Bear 1.35X Fund | | Net Realized gain (loss)1
Futures contracts | | | (1,255,922 | ) | | | — | | | | — | | | | (1,255,922 | ) | |
| | | Swap contracts | | | (908,858 | ) | | | — | | | | — | | | | (908,858 | ) | |
| | | Change in net unrealized
appreciation (depreciation)2
Futures contracts | | | 98,792 | | | | — | | | | — | | | | 98,792 | | |
| | | Swap contracts | | | 5,168 | | | | — | | | | — | | | | 5,168 | | |
Direxion Monthly
NASDAQ-100®
Bull 2X Fund | | Net Realized gain (loss)1
Swap contracts | | | — | | | | 51,996,714 | | | | — | | | | 51,996,714 | | |
| | | Change in net unrealized
appreciation (depreciation)2
Swap contracts | | | — | | | | 9,405,316 | | | | — | | | | 9,405,316 | | |
Direxion Monthly
S&P 500® Bull 2X Fund | | Net Realized gain (loss)1
Swap contracts | | | — | | | | 14,982,272 | | | | — | | | | 14,982,272 | | |
| | | Change in net unrealized
appreciation (depreciation)2
Swap contracts | | | — | | | | (49,100 | ) | | | — | | | | (49,100 | ) | |
Direxion Monthly
S&P 500® Bear 2X Fund | | Net Realized gain (loss)1
Swap contracts | | | — | | | | (2,633,504 | ) | | | — | | | | (2,633,504 | ) | |
| | | Change in net unrealized
appreciation (depreciation)2
Swap contracts | | | — | | | | (524,538 | ) | | | — | | | | (524,538 | ) | |
Direxion Monthly
Small Cap Bull 2X Fund | | Net Realized gain (loss)1
Swap contracts | | | — | | | | 4,224,658 | | | | — | | | | 4,224,658 | | |
| | | Change in net unrealized
appreciation (depreciation)2
Swap contracts | | | — | | | | 19,490 | | | | — | | | | 19,490 | | |
DIREXION ANNUAL REPORT
71
| | | | | Interest Rate Risk | | Equity Risk | | Credit Risk | | Total | |
Direxion Monthly
Small Cap Bear 2X Fund | | Net Realized gain (loss)1
Swap contracts | | $ | — | | | $ | (3,470,251 | ) | | $ | — | | | $ | (3,470,251 | ) | |
| | | Change in net unrealized
appreciation (depreciation)2
Swap contracts | | | — | | | | 613,381 | | | | — | | | | 613,381 | | |
Direxion Monthly
7-10 Year Treasury
Bull 2X Fund | | Net Realized gain (loss)1
Swap contracts | | | (2,101,841 | ) | | | — | | | | — | | | | (2,101,841 | ) | |
| | | Change in net unrealized
appreciation (depreciation)2
Swap contracts | | | 319,434 | | | | — | | | | — | | | | 319,434 | | |
Direxion Monthly
7-10 Year Treasury
Bear 2X Fund | | Net Realized gain (loss)1
Swap contracts | | | 205,751 | | | | — | | | | — | | | | 205,751 | | |
| | | Change in net unrealized
appreciation (depreciation)2
Swap contracts | | | (139,312 | ) | | | — | | | | — | | | | (139,312 | ) | |
Direxion Monthly
Emerging Markets
Bull 2X Fund | | Net Realized gain (loss)1
Swap contracts | | | — | | | | 1,557,244 | | | | — | | | | 1,557,244 | | |
| | | Change in net unrealized
appreciation (depreciation)2
Swap contracts | | | — | | | | 710,963 | | | | — | | | | 710,963 | | |
1 Statements of Operations location: Net realized gain (loss) on futures and swaps.
2 Statements of Operations location: Change in net unrealized appreciation (depreciation) on futures and swaps.
For the year ended August 31, 2017, the average quarterly volume of the derivatives held by each of the Funds was as follows:
| | | Quarterly Average Gross Notional Amounts | |
| | | Long Equity Swap
Contracts | | Short Equity Swap
Contracts | | Long Futures
Contracts | | Short Futures
Contracts | |
Direxion Monthly High Yield Bull 1.2X Fund | | $ | 108,566,074 | | | $ | — | | | $ | — | | | $ | — | | |
Direxion Monthly NASDAQ-100® Bull 1.25X Fund | | | 20,360,734 | | | | — | | | | — | | | | — | | |
Direxion Monthly NASDAQ-100® Bear 1.25X Fund | | | — | | | | 90,346 | | | | — | | | | — | | |
Direxion Monthly 25+ Year Treasury Bull 1.35X Fund | | | 6,072,908 | | | | — | | | | 4,103,425 | | | | — | | |
Direxion Monthly 25+ Year Treasury Bear 1.35X Fund | | | — | | | | 18,135,944 | | | | — | | | | 40,803,118 | | |
Direxion Monthly NASDAQ-100® Bull 2X Fund | | | 292,803,052 | | | | — | | | | — | | | | — | | |
Direxion Monthly S&P 500® Bull 2X Fund | | | 116,635,518 | | | | — | | | | — | | | | — | | |
Direxion Monthly S&P 500® Bear 2X Fund | | | — | | | | 22,130,963 | | | | — | | | | — | | |
Direxion Monthly Small Cap Bull 2X Fund | | | 38,517,037 | | | | — | | | | — | | | | — | | |
Direxion Monthly Small Cap Bear 2X Fund | | | — | | | | 12,379,768 | | | | — | | | | — | | |
Direxion Monthly 7-10 Year Treasury Bull 2X Fund | | | 34,797,213 | | | | — | | | | — | | | | — | | |
Direxion Monthly 7-10 Year Treasury Bear 2X Fund | | | — | | | | 10,429,272 | | | | — | | | | — | | |
Direxion Monthly Emerging Markets Bull 2X Fund | | | 15,291,436 | | | | — | | | | — | | | | — | | |
The Funds utilize this volume of derivatives to obtain leverage in order to meet the investment objectives of 120%, 125%, -125%, 135%, -135% 200%, and -200% calendar month performance of their respective indices.
DIREXION ANNUAL REPORT
72
7. SUBSEQUENT EVENTS
Effective September 1, 2017, the Board of Trustees of the Trust approved a change in the expense structure for the Funds. The Funds' current Operating Services Agreement has been terminated and replaced with an Operating Expense Limitation Agreement under which the Adviser has contractually agreed to cap all or a portion of the expenses for each Fund based on the annual rates listed below applied to each Fund's average daily net assets.
Direxion Monthly High Yield Bull 1.2X Fund | | | 1.35 | % | |
Direxion Monthly NASDAQ-100® Bull 1.25X Fund | | | 1.15 | % | |
Direxion Monthly NASDAQ-100® Bear 1.25X Fund | | | 1.15 | % | |
Direxion Monthly 25+ Year Treasury Bull 1.35X Fund | | | 1.10 | % | |
Direxion Monthly 25+ Year Treasury Bear 1.35X Fund | | | 1.10 | % | |
Direxion Monthly NASDAQ-100® Bull 2X Fund | | | 1.35 | % | |
Direxion Monthly S&P 500® Bull 2X Fund | | | 1.35 | % | |
Direxion Monthly S&P 500® Bear 2X Fund | | | 1.35 | % | |
Direxion Monthly Small Cap Bull 2X Fund | | | 1.35 | % | |
Direxion Monthly Small Cap Bear 2X Fund | | | 1.35 | % | |
Direxion Monthly 7-10 Year Treasury Bull 2X Fund | | | 1.35 | % | |
Direxion Monthly 7-10 Year Treasury Bear 2X Fund | | | 1.35 | % | |
Direxion Monthly Emerging Markets Bull 2X Fund | | | 1.35 | % | |
Any expense cap is subject to reimbursement by the Fund within the following three years only if overall expenses fall below the lesser of this percentage limitation and any percentage limitation in place at the time. This agreement may be terminated or revised at any time with the consent of the Board of Trustees.
8. RECENT ACCOUNTING PRONOUNCEMENT
In October 2016, the U.S. Securities and Exchange Commission adopted new rules and amended existing rules (together, "final rules") intended to modernize the reporting and disclosure of information by registered investment companies. In part, the final rules amend Regulation S-X and require standardized, enhanced disclosure about derivatives in investment company financial statements, as well as other amendments. The updates to Regulation S-X are effective August 1, 2017 and may result in additional disclosure relating to the presentation of derivatives and certain other financial instruments. These updates have been incorporated in the Funds' financial statements and have no impact on each of the Fund's net assets or results of operations.
DIREXION ANNUAL REPORT
73
Direxion Funds
Report of Independent Registered Public Accounting Firm
The Board of Trustees and Shareholders of Direxion Funds
We have audited the accompanying statements of assets and liabilities, including the schedules of investments, of Direxion Monthly High Yield Bull 1.2X Fund, Direxion Monthly NASDAQ-100® Bull 1.25X Fund, Direxion Monthly NASDAQ-100® Bear 1.25X Fund, Direxion Monthly 25+ Year Treasury Bull 1.35X Fund (formerly Direxion Monthly 25+ Year Treasury Bull 1.2X Fund), Direxion Monthly 25+ Year Treasury Bear 1.35X Fund (formerly Direxion Monthly 25+ Year Treasury Bear 1X Fund), Direxion Monthly NASDAQ-100® Bull 2X Fund, Direxion Monthly S&P 500® Bull 2X Fund, Direxion Monthly S&P 500® Bear 2X Fund, Direxion Monthly Small Cap Bull 2X Fund, Direxion Monthly Small Cap Bear 2X Fund, Direxion Monthly 7-10 Year Treasury Bull 2X Fund, Direxion Monthly 7-10 Year Treasury Bear 2X Fund, and Direxion Monthly Emerging Markets Bull 2X Fund (thirteen of the series of Direxion Funds) (the "Funds") as of August 31, 2017, and the related statements of operations for the year then ended, and the statements of changes in net assets and the financial highlights for each of the periods indicated therein. These financial statements and financial highlights are the responsibility of the Funds' management. Our responsibility is to express an opinion on these financial statements and financial highlights based on our audits.
We conducted our audits in accordance with the standards of the Public Company Accounting Oversight Board (United States). Those standards require that we plan and perform the audit to obtain reasonable assurance about whether the financial statements and financial highlights are free of material misstatement. We were not engaged to perform an audit of the Funds' internal control over financial reporting. Our audits included consideration of internal control over financial reporting as a basis for designing audit procedures that are appropriate in the circumstances, but not for the purpose of expressing an opinion on the effectiveness of the Funds' internal control over financial reporting. Accordingly, we express no such opinion. An audit also includes examining, on a test basis, evidence supporting the amounts and disclosures in the financial statements and financial highlights, assessing the accounting principles used and significant estimates made by management, and evaluating the overall financial statement presentation. Our procedures included confirmation of securities owned as of August 31, 2017, by correspondence with the custodian and brokers. We believe that our audits provide a reasonable basis for our opinion.
In our opinion, the financial statements and financial highlights referred to above present fairly, in all material respects, the financial position of each of the respective Funds constituting the Direxion Funds at August 31, 2017, the results of their operations for the year then ended, and the changes in their net assets and the financial highlights for each of the periods indicated therein, in conformity with U.S. generally accepted accounting principles.
Minneapolis, Minnesota
October 27, 2017
DIREXION ANNUAL REPORT
74
Direxion Funds
Supplemental Information (Unaudited)
For the year ended August 31, 2017, certain dividends paid by the Funds may be subject to a maximum rate of 15%, as provided for by the Jobs and Growth Tax Relief Reconciliation Act of 2003. The amount of dividends declared from ordinary income designated as qualified income was 0% for each of the Funds.
The Funds are designating as long-term capital gain dividends, pursuant to Internal Revenue Code Section 852(b)(3), the amount necessary to reduce the earnings and profits of the Funds related to net capital gain to zero for the tax year ending October 31, 2017. To the extent necessary to fully distribute such capital gain, the Funds also designate earnings and profits distributed to shareholders on the redemption of shares.
For corporate shareholders, the amount of ordinary income distributions qualifying for the corporate dividends received deduction for the year ended August 31, 2017 was 0% for each of the Funds.
Householding
In an effort to decrease costs, the Funds intend to reduce the number of duplicate prospectuses, Annual and Semi-Annual Reports, proxy statements and other similar documents you receive by sending only one copy of each to those addresses shared by two or more accounts and to shareholders we reasonably believe are from the same family or household. Householding begins once you have signed your account application. After such time, if you would like to discontinue householding for your accounts, please call toll-free at (800) 851-0511 to request individual copies of these documents. Once the Funds receive notice to stop householding, we will begin sending individual copies thirty days after receiving your request. This policy does not apply to account statements.
DIREXION ANNUAL REPORT
75
Direxion Funds
Investment Advisory Agreement Approval (Unaudited)
Consistent with the Investment Company Act of 1940, as amended (the "1940 Act"), the Board of Trustees (the "Board") of the Direxion Funds (the "Trust") annually considers the renewal of the Investment Advisory Agreement (the "Agreement") between Rafferty Asset Management, LLC (the "Advisor") and the Trust, on behalf of the Direxion Monthly S&P 500® Bull 2X Fund, Direxion Monthly S&P 500® Bear 2X Fund, Direxion Monthly NASDAQ-100® Bull 2X Fund, Direxion Monthly Small Cap Bull 2X Fund, Direxion Monthly Small Cap Bear 2X Fund, Direxion Monthly Emerging Markets Bull 2X Fund, Direxion Monthly 7-10 Year Treasury Bull 2X Fund, Direxion Monthly 7-10 Year Treasury Bear 2X Fund, Direxion Monthly 25+ Year Treasury Bull 1.35X Fund, Direxion Monthly 25+ Year Treasury Bear 1.35X Fund, Direxion Monthly NASDAQ-100® Bull 1.25X Fund, Direxion Monthly NASDAQ-100® Bear 1.25X Fund, and the Direxion Monthly High Yield Bull 1.2X Fund, each a series of the Trust. Each series of the Trust is referred to herein as a "Fund" and collectively as the "Funds."
At an in-person meeting held on August 24, 2017, following such consideration, the Board, including the trustees who are not "interested persons" as defined in the 1940 Act (the "Independent Trustees"), unanimously approved the renewal of the Agreement, on behalf of the Funds. The Independent Trustees had previously considered information pertaining to the renewal of the Agreement outside the presence of the Advisor's representatives and Fund management in an executive session held on August 8, 2017. The Board, including the Independent Trustees, determined that the terms of the Agreement for the Funds were fair and reasonable and in the best interests of shareholders.
In considering whether to renew the Agreement, the Board requested, and the Advisor provided, information that the Board and Advisor believed to be reasonably necessary to evaluate the Agreement. Among other information, the Board obtained and reviewed the following:
• Detailed information regarding the advisory services provided by the Advisor for each Fund;
• The investment objectives of the Funds, which require monthly rebalancing and the utilization of complex financial instruments that are not typical of traditional index tracking mutual funds;
• The level of attention required by the Advisor due to the frequent and large trading activity in the various Funds;
• The Advisor's Form ADV;
• Biographies of employees primarily responsible for providing investment advisory services;
• Information regarding each component of the contractual fee rates for the prior fiscal year;
• Information regarding advisory fees earned and waivers made by the Advisor in connection with providing services to the Funds;
• Performance information for prior periods;
• Comparative industry fee data;
• Information regarding the financial condition of the Advisor; and
• Information regarding how the Advisor monitors the Funds' compliance with regulatory requirements and Trust procedures.
The Board considered that, with respect to each Fund, they had also received information relevant to their consideration since the Fund's inception and, most recently, throughout the past year at regular Board meetings in connection with their oversight of the Funds, including information bearing on the Funds' service provider arrangements and performance results. In addition, the Board received a memorandum from counsel regarding the responsibilities of the Board with respect to the approval of the Agreement and participated in a question and answer session with representatives of the Advisor. The Board carefully evaluated the relevant information and the Independent Trustees were advised by legal counsel with respect to their deliberations.
The Board did not identify any particular information that was most relevant to its consideration to approve the Agreement and each Trustee may have afforded different weight to the various factors. The Board considered, among others, the following factors to the extent applicable: (1) the nature, extent, and quality of the services provided; (2) the investment performance of each Fund; (3) the profitability, if any, of each Fund and of the advisory business to the Advisor; (4) the extent to which economies of scale might be realized as the Funds grow; (5) whether fee levels reflect these economies of scale, if any, for the benefit of any Fund's shareholders; (6) comparisons of services and fees with contracts entered into by
DIREXION ANNUAL REPORT
76
Direxion Funds
Investment Advisory Agreement Approval (Unaudited)
the Advisor with other clients (such as other institutional investors), if any; and (7) other benefits derived or anticipated to be derived and identified by the Advisor from its relationship with the Funds.
Nature, Extent and Quality of Services Provided. The Board reviewed, among other things, the Advisor's business, assets under management, financial resources and capitalization, quality and quantity of personnel, experience, the variety and complexity of its investment strategies, brokerage practices, and the adequacy of its compliance systems and process. The Board reviewed the scope of services to be provided by the Advisor under the Agreement and noted there would be no significant differences between the scope of services provided by the Advisor in the past year and those to be provided in the upcoming year. The Board also considered the Advisor's representation to the Board that it would continue to provide investment and related services that are of materially the same quality as the services that have been provided to the Funds in the past and whether those services remain appropriate in scope and extent in light of the Funds' operations, the competitive landscape of the investment company business and investor needs. The Board focused on the quality of the Advisor's personnel and operations and the systems and processes required to manage the Funds effectively, and noted that these systems and processes may not be present at other investment advisers. In particular the Board considered: (1) the Advisor's success in achieving each Fund's monthly leveraged investment objective; (2) differences between managing leveraged and non-leveraged portfolios, which include developing index optimization and representative sampling investment strategies as well as specialized skills for trading complex financial instruments; (3) information regarding the Advisor's management of derivatives trading activities on behalf of the Funds, including the selection of swap counterparties and the negotiation of favorable derivatives contract terms; (4) the Advisor's ability to manage the Funds in a tax efficient manner, which is more challenging for leveraged than non-leveraged funds; and (5) the size, professional experience and skills of the Advisor's portfolio management staff. The Board considered that the Advisor oversees all aspects of the operation of the Funds, including oversight of the Funds' service providers, and provides compliance services to the Funds.
Based on the Board's deliberations at the meeting, the Board, including the Independent Trustees, unanimously concluded that the nature, extent and quality of services to be provided under the Agreement could benefit shareholders.
Comparison of Advisory Services and Fees. The Board considered the fairness and reasonableness of the investment advisory fee rate payable to the Advisor by the Funds in light of the investment advisory services provided by the Advisor. In this regard, the Board also considered the ability of investors to achieve independently the investment objective of any of the Funds and the costs to investors of seeking to do so. The Board concluded that it would be difficult for an investor to implement independently any Fund's investment strategy and that attempting to do so would likely be cost-prohibitive.
The Board further considered the fairness and reasonableness of the investment advisory fee rate payable to the Advisor by the Funds in light of fee rates paid by other investment companies offering strategies similar in nature to the Funds. In this regard, the Board reviewed information prepared by the Advisor, using data provided by Morningstar, Inc., to compare the Funds' actual advisory fees, past operating service fees and future management service fees, and gross and net total expenses with those of other funds with common key characteristics, such as asset size, investment objective or industry focus ("Peer Group"). The Board noted the difficulty in compiling the Peer Group because, by design, each Fund is unique and, therefore, few (if any) fund complexes have funds with substantially similar investment objectives and operations. The Board considered, however, that to establish the Peer Group, the Advisor used the same methodology as in 2015 and 2016 and that this methodology was reviewed and recommended by an independent consultant retained by the Board in 2015 to review and advise it on Peer Group construction.
The comparison reports provided to the Board included the advisory fee and net and gross total expense ratios, less any Rule 12b-1 fees and shareholder services fees for each Fund and each Peer Group fund. The Board considered that the Advisor had agreed to limit the total expenses of the Funds (subject to certain exclusions) for the next fiscal year by contractually agreeing to pay certain expenses of the Funds under a new Operating Expense Limitation Agreement.
Based on its review, the Board determined that the proposed advisory fee rates for each Fund under the Agreement were reasonable in light of all factors considered.
Performance of the Funds. The Board focused on the correlation of each Fund's return to the model performance return information for the periods ending June 30, 2017 and June 30, 2016 or since inception if a Fund did not have two full years of operations. The Board also reviewed the total return of each Fund for one-year or since inception period ended
DIREXION ANNUAL REPORT
77
Direxion Funds
Investment Advisory Agreement Approval (Unaudited)
June 30, 2017. The Board utilized performance reports provided to the Board in anticipation of the meeting, as well as performance reports provided at regular Board meetings throughout the year. The Board noted that the correlation of returns for each Fund to each Fund's underlying index return was generally within expected ranges during the applicable periods. The Board noted that, given the investment objectives of the Funds, the correlation of each Fund's performance with the model performance of its underlying index was a more meaningful factor than a Fund's total return.
Costs of Services Provided to the Funds and Profits Realized by the Advisor. The Board reviewed information about the profitability of the Advisor based on the fee rates payable under the Agreement. This included a review of information regarding the direct revenue received by the Advisor and ancillary revenue, if any, received by the Advisor and/or its affiliates in connection with the services provided to the Funds by the Advisor. The Board considered information regarding the Advisor's profit margin as reflected in the Advisor's profitability analysis, as well as information provided by the Advisor concerning the methodology used to allocate various expenses. The Board also considered the significant drivers of cost for the Advisor including, but not limited to, intellectual capital, monthly portfolio rebalancing of the Funds, regulatory compliance, and entrepreneurial risk and considered the costs that investors would likely incur if they independently sought to achieve the investment objectives of the Funds. The Advisor also provided the Board a report on other investment advisors' profitability, which was compiled using publicly available information. However, the Board recognized that it is difficult to compare profitability among investment advisory contracts because the most useful comparative information generally is not publicly available. To the extent such information is available, it is affected by numerous factors, including the nature of a fund's shareholder base, the structure of the particular advisor, the types of funds it manages, its business mix, assumptions regarding allocations and the fact that publicly traded fund managers' operating profits and net income are typically reported net of distribution and marketing expenses.
Based on its review, the Board, including the Independent Trustees, determined that the profit to the Advisor under the Agreement was not excessive in light of all factors considered.
Economies of Scale. The Board considered the absence of breakpoints in the Advisor's fee schedule and reviewed information regarding the extent to which economies of scale or other efficiencies may result from increases in the Funds' net assets. In light of the relatively small size of many of the Funds and the fact that the size of individual Funds in the complex often increase and decrease significantly due to the unlimited trading that is permitted by the Funds, the Board concluded that the Funds have not yet achieved sufficient asset levels to realize meaningful economies of scale. Based on these and other considerations, the Board determined that, in the exercise of its business judgment, breakpoints were not necessary at this time. The Board noted that it will continue to monitor fees and expenses as the Funds grow in size and assess whether fee breakpoints may be warranted.
Other Benefits. The Board considered any indirect or "fall-out" benefits that the Advisor or its affiliates may derive from their relationship to the Funds. Such benefits include the Advisor's ability to leverage its investment management personnel or infrastructure to manage other accounts. In this regard, the Board noted that the Funds, immediately following their fiscal year end, would transition from an operating services arrangement into a management services arrangement with an operating expense limitation agreement, in which the Advisor would provide, and receive fees for providing, certain services historically provided by U.S. Bancorp Fund Services. The Board considered that, as a result of this transition the Funds would pay approximately the same amount in service fees, but the Advisor would retain a larger percentage of such service fees. Based on these and other considerations, the Board determined that, in the exercise of its business judgment, the benefits to the Advisor were fair and reasonable.
Conclusion. Based on, but not limited to, the above considerations and determinations, the Board, including the Independent Trustees, determined that the Agreement for the Funds was fair and reasonable in light of the nature, extent and quality of the services to be performed, the fee rates to be paid, the Advisor's expenses and such other matters as the Board considered relevant in the exercise of its business judgment and that the continuation of the Agreement was in the best interests of the shareholders of the Funds. On this basis, the Board unanimously voted in favor of the continuance of the Agreement.
DIREXION ANNUAL REPORT
78
Direxion Funds
Trustees and Officers
The business affairs of the Funds are managed by or under the direction of the Board of Trustees. Information pertaining to the Trustees and Officers of the Funds is set below. The report includes additional information about the Funds' Trustees and Officers and is available without charge, upon request by calling 1-800-851-0511.
Interested Trustees
Name, Address and
Age | | Position(s)
Held with
Fund | | Term of Office
and Length of
Time Served | | Principal Occupation(s)
During Past Five Years | | # of Portfolios
in Direxion
Family of
Investment
Companies
Overseen
by Trustee(3) | | Other Trusteeships/
Directorships Held by
Trustee During Past
Five Years | |
Daniel D. O'Neill(1)
Age: 49 | |
Chairman of the Board of Trustees | |
Lifetime of Trust until removal or resignation; Since 2014 | |
Managing Director of Rafferty, 1999 – present. | | |
148 | | |
None. | |
Eric W. Falkeis(2)
Age: 43 | |
Trustee | |
Lifetime of Trust until removal or resignation; Since 2014 | |
Chief Operating Officer, since April 2014, Rafferty Asset Management, LLC; formerly, President Rafferty Asset Management, LLC, March 2013 – April 2014; formerly, Senior Vice President, USBFS, September 2007 – March 2013; Chief Financial Officer, USBFS, April 2006 – March 2013; Vice President, USBFS, 1997-2007; formerly, Chief Financial Officer, Quasar Distributors, LLC (2000-2003). | | |
148 | | |
Trustee, Professionally Managed Portfolios
(31 Funds). | |
Independent Trustees
Name, Address and
Age | | Position(s)
Held with
Fund | | Term of Office
and Length of
Time Served | | Principal Occupation(s)
During Past Five Years | | # of Portfolios
in Direxion
Family of
Investment
Companies
Overseen
by Trustee(3) | | Other Trusteeships/
Directorships Held by
Trustee During Past
Five Years | |
Gerald E. Shanley III
Age: 73 | |
Trustee | |
Lifetime of Trust until removal or resignation; Since 1997 | |
Retired, Since 2002; Business Consultant, 1985 – present; Trustee of Trust Under Will of Charles S. Payson, 1987 – present; C.P.A., 1979 – present. | | |
148 | | |
None. | |
(1) Mr. O'Neill is affiliated with Rafferty. Mr. O'Neill is the Managing Director of Rafferty and owns a beneficial interest in Rafferty.
(2) Mr. Falkeis is affiliated with Rafferty. Mr. Falkeis is the Chief Operating Officer of Rafferty.
(3) The Direxion Family of Investment Companies consists of the Direxion Shares ETF Trust which, as of the date of this report, offers for sale to the public 87 of the 125 funds registered with the SEC, the Direxion Funds which, as of the date of this report, offers for sale to the public 17 of the 23 funds registered with the SEC and the Direxion Insurance Trust which, as of the date of this report, does not have any funds registered with the SEC.
DIREXION ANNUAL REPORT
79
Direxion Funds
Trustees and Officers
Name, Address and
Age | | Position(s)
Held with
Fund | | Term of Office
and Length of
Time Served | | Principal Occupation(s)
During Past Five Years | | # of Portfolios
in Direxion
Family of
Investment
Companies
Overseen
by Trustee(3) | | Other Trusteeships/
Directorships Held by
Trustee During Past
Five Years | |
John A. Weisser
Age: 75 | |
Trustee | |
Lifetime of Trust until removal or resignation; Since 2007 | |
Retired, Since 1995; Salomon Brothers, Inc., 1971 – 1995, most recently as Managing Director. | |
148 | |
Director until December 2016, The MainStay Funds Trust, The MainStay Funds, MainStay VP Fund Series, Mainstay Defined Term Municipal Opportunities Fund; Private Advisors Alternative Strategy Fund; Private Advisors Alternative Strategies Master Fund. | |
David L. Driscoll
Age: 48 | |
Trustee | |
Lifetime of Trust until removal or resignation; Since 2014 | |
Partner, King Associates, LLP, since 2004; Board Advisor, University Common Real Estate, since 2012; Principal, Grey Oaks LLP since 2003; Member, Kendrick LLC, since 2006. | |
148 | |
None. | |
Jacob C. Gaffey
Age: 69 | |
Trustee | |
Lifetime of Trust until removal or resignation; Since 2014 | |
Managing Director of Loomis & Co. since 2012; Partner, Bay Capital Advisors, LLC 2008 – 2012. | |
148 | |
None. | |
(1) Mr. O'Neill is affiliated with Rafferty. Mr. O'Neill is the Managing Director of Rafferty and owns a beneficial interest in Rafferty.
(2) Mr. Falkeis is affiliated with Rafferty. Mr. Falkeis is the Chief Operating Officer of Rafferty.
(3) The Direxion Family of Investment Companies consists of the Direxion Shares ETF Trust which, as of the date of this report, offers for sale to the public 87 of the 125 funds registered with the SEC, the Direxion Funds which, as of the date of this report, offers for sale to the public 17 of the 23 funds registered with the SEC and the Direxion Insurance Trust which, as of the date of this report, does not have any funds registered with the SEC.
DIREXION ANNUAL REPORT
80
Direxion Funds
Trustees and Officers
Principal Officers of the Trust
The officers of the Trust conduct and supervise its daily business. Unless otherwise noted, an individual's business address is 1301 Avenue of the Americas, 28th Floor, New York, New York 10019. As of the date of this report, the officers of the Trust, their ages, their business address and their principal occupations during the past five years are as follows:
Name, Address and
Age | | Position(s)
Held with
Fund | | Term of Office
and Length of
Time Served | | Principal Occupation(s)
During Past Five Years | | # of Portfolios
in Direxion
Family of
Investment
Companies
Overseen
by Trustee(3) | | Other Trusteeships/
Directorships Held by
Trustee During Past
Five Years | |
Daniel D. O'Neill(1)
Age: 49 | |
Chief Executive Officer and Chief Investment Officer | |
One Year; Since 2006 | |
Managing Director of Rafferty, 1999 – present. | |
148 | |
N/A | |
Eric W. Falkeis(2)
Age: 43 | |
Principal Executive Officer | |
One Year; Since 2014 | |
Chief Operating Officer, since April 2014, Rafferty Asset Management, LLC; formerly, President, Rafferty Asset Management, LLC, March 2013 – April 2014; formerly, Senior Vice President, USBFS, September 2007 – March 2013; Chief Financial Officer, USBFS, April 2006 – March 2013; Vice President, USBFS, 1997-2007; formerly, Chief Financial Officer, Quasar Distributors, LLC (2000 – 2003). | |
148 | |
Trustee, Professionally Managed Portfolios (31 Funds). | |
Patrick J. Rudnick
Age: 44 | |
Principal Financial Officer and Assistant Secretary | |
One Year; Since 2010 | |
Senior Vice President and Principal Financial Officer, Rafferty Asset Management, LLC, since March 2013; formerly Vice President, USBFS (2006 – 2013); formerly, Manager, PricewaterhouseCoopers LLP (1999 – 2006). | |
N/A | |
N/A | |
Angela Brickl
Age: 41 | |
Secretary | |
One Year; Since 2011 | |
General Counsel, Rafferty Asset Management, LLC, since October 2010; formerly Chief Compliance Officer, Rafferty Asset Management, LLC (2012 – 2016). | |
N/A | |
N/A | |
DIREXION ANNUAL REPORT
81
Direxion Funds
Trustees and Officers
Name, Address and
Age | | Position(s)
Held with
Fund | | Term of Office
and Length of
Time Served | | Principal Occupation(s)
During Past Five Years | | # of Portfolios
in Direxion
Family of
Investment
Companies
Overseen
by Trustee(3) | | Other Trusteeships/
Directorships Held by
Trustee During Past
Five Years | |
Kent Barnes
Age: 48 | |
Chief Compliance Officer | |
One Year; Since 2016 | |
Director of Compliance, since April 2016, Rafferty Asset Management, LLC; formerly, General Counsel – Alternative Investments, USBFS (2006 – 2016) | |
N/A | |
N/A | |
(1) Mr. O'Neill is affiliated with Rafferty. Mr. O'Neill is the Managing Director of Rafferty and owns a beneficial interest in Rafferty.
(2) Mr. Falkeis is affiliated with Rafferty. Mr. Falkeis is the Chief Operating Officer of Rafferty.
(3) The Direxion Family of Investment Companies consists of the Direxion Shares ETF Trust which, as of the date of this report, offers for sale to the public 87 of the 125 funds registered with the SEC, the Direxion Funds which, as of the date of this report, offers for sale to the public 17 of the 23 funds registered with the SEC and the Direxion Insurance Trust which, as of the date of this report, does not have any funds registered with the SEC.
DIREXION ANNUAL REPORT
82
At the Direxion Funds, we are committed to protecting your privacy. To open and service your Direxion accounts, we collect and maintain certain nonpublic personal information about you, such as your address, phone number, social security number, purchases, sales, account balances, bank account information and other personal financial information. We collect this information from the following sources:
• Account applications or other forms on which you provide information,
• Mail, e-mail, the telephone and our website, and
• Your transactions and account inquiries with us.
We safeguard the personal information that you have entrusted to us in the following ways:
• As a general policy, only those employees who maintain your account and respond to your requests for additional services have access to your account information.
• We maintain physical, electronic, and procedural safeguards to insure the security of your personal information and to prevent unauthorized access to your information.
We do not disclose any nonpublic personal information about you or our former shareholders to anyone, except as permitted or required by law. In the course of conducting business and maintaining your account we may share shareholder information, as allowed by law, with our affiliated companies and with other service providers, including financial intermediaries, custodians, transfer agents and marketing consultants. Those companies are contractually bound to use that information only for the services for which we hired them. They are not permitted to use or share our shareholders' nonpublic personal information for any other purpose. There also may be times when we provide information to federal, state or local authorities as required by law.
In the event that you hold fund shares of Direxion through a financial intermediary, including, but not limited to, a broker-dealer, bank, or trust company, the privacy policy of your financial intermediary would govern how your nonpublic personal information would be shared with nonaffiliated third parties.
For questions about our policy, please contact us at (800) 851-0511.
This page is not a part of the Annual Report.
DIREXION ANNUAL REPORT

ANNUAL REPORT AUGUST 31, 2017
1301 Avenue of the Americas (6th Ave.), 28th Floor New York, New York 10019 (800) 851-0511 www.direxioninvestments.com
Investment Adviser
Rafferty Asset Management, LLC
1301 Avenue of the Americas (6th Ave.), 28th Floor
New York, NY 10019
Administrator, Transfer Agent, Dividend Paying Agent & Shareholding Servicing Agent
U.S. Bancorp Fund Services, LLC
P.O. Box 1993
Milwaukee, WI 53201-1993
Custodian
U.S. Bank, N.A.
1555 RiverCenter Dr., Suite 302
Milwaukee, WI 53212
Independent Registered Public Accounting Firm
Ernst & Young LLP
220 South Sixth Street
Minneapolis, MN 55402
Distributor
Rafferty Capital Markets, LLC
1010 Franklin Ave., 3rd Floor
Garden City, NY 11530
The Trust's Proxy Voting Policies are available without charge by calling 1-800-851-0511, or by accessing the SEC's website, at www.sec.gov.
The actual voting records relating to portfolio securities during the most recent period ended June 30 is available without charge by calling 1-800-851-0511 or by accessing the SEC's website at www.sec.gov.
The Trust files complete schedules of portfolio holdings with the SEC on Form N-Q. The Form N-Q is available without change, upon request, by calling 1-800-851-0511, or by accessing the SEC's website, at www.sec.gov.
This report has been prepared for shareholders and may be distributed to others only if preceded or accompanied by a current prospectus.

Annual
Report
Direxion Hilton
Tactical Income Fund
AUGUST 31, 2017
TICKERS:
CLASS A - HCYAX | INSTITUTIONAL CLASS - HCYIX | CLASS C - HCYCX


1301 Avenue of the Americas (6th Avenue), 28th Floor | New York, New York 10019 | (800) 851-0511
www.direxioninvestments.com
Letter to Shareholders (Unaudited) | | | 4 | | |
Performance Summary (Unaudited) | | | 8 | | |
Expense Example (Unaudited) | | | 9 | | |
Allocation of Portfolio Holdings (Unaudited) | | | 10 | | |
Schedule of Investments | | | 11 | | |
Statement of Assets and Liabilities | | | 13 | | |
Statement of Operations | | | 14 | | |
Statements of Changes in Net Assets | | | 15 | | |
Financial Highlights | | | 16 | | |
Notes to the Financial Statements | | | 17 | | |
Report of Independent Registered Public
Accounting Firm | | | 24 | | |
| Supplemental Information (Unaudited) | | | 25 | | |
Investment Advisory and Subadvisory
Agreement Approvals (Unaudited) | | | 26 | | |
| Trustees and Officers | | | 29 | | |
Help Preserve the Environment – Go Green!
Go paperless with Direxion e-Delivery – a service allowing shareholders to reduce clutter with full online access to regulatory documents. Begin the preservation process with e-delivery.
With Direxion e-Delivery you can:
• Receive email notifications when your most recent shareholder communications are available for review.
• Access prospectuses, annual reports and semi-annual reports online.
It's easy to enroll:
1. Visit www.direxioninvestments.com/edelivery
2. Follow the simple enrollment instructions
If you have questions about Direxion e-Delivery services, contact one of our shareholder representatives at 800-851-0511.


LETTER TO SHAREHOLDERS (UNAUDITED)
Dear Shareholders,
This Annual Report is for the Direxion Hilton Tactical Income Fund (the "Fund"), and covers the period from September 1, 2016 to August 31, 2017 (the "Annual Period"). Rafferty Asset Management, LLC serves as Adviser to the Fund and Hilton Capital Management, LLC serves as the Fund's Subadviser (the "Subadviser"). The Fund offers an Institutional Class, Class A and Class C shares.
Fund & Market Commentary:
The Institutional Class posted a return of 6.39%, the Class A 6.14% and the Class C 5.38% during the Annual Period. The Fund's benchmark, a blend of 60% Barclays U.S. Intermediate Government/Credit Index and 40% S&P 500® Total Return Index, returned 6.79% for the Annual Period.
The Fund's 30-day SEC Yield at August 31, 2017 was 2.95%, 2.55% and 1.96% for the Institutional Class, Class A and Class C, respectively.
During the Annual Period, the Fund decreased its cash position from 9% to 4%, decreased exposure to fixed income from 59% to 52%, and increased equity exposure from 32% to 44%.
Within the equity portfolio of the Fund, the top overall contributor to performance was exposure to Financials. The top individual contributor to the overall portfolio was Republic Services Group. Republic Services Group represented 2.05% of the overall portfolio's holdings at the end of the Annual Period.
Exposure to Consumer Discretionary equity holdings was the largest detractor to overall Fund performance.
The Subadviser currently holds a moderately aggressive stance in the portfolio. This positioning reflects the Subadviser's view towards future rate hikes, as well as accelerated growth prospects due to the post-Presidential Election political environment
Principal Investment Strategy:
The Fund pursues its investment objective by utilizing an investment strategy that employs a disciplined approach to balancing fixed income investments with historically higher income producing equity securities, with a focus on minimizing absolute risk and volatility. The Subadviser attempts to mitigate portfolio risk and volatility by creating a diversified portfolio of income producing securities that also offer the potential for capital appreciation. These securities may include common and preferred stocks of any capitalization, master limited partnerships ("MLPs"), real estate investment trusts ("REITs"), and a variety of debt instruments of any maturity, including corporate bonds, exchange-traded notes ("ETNs"), municipal bonds, and securities issued, backed or otherwise guaranteed by the U.S. government, or its agencies, including securities issued by U.S. government sponsored entities.
MLPs are publicly traded partnerships primarily engaged in the transportation, storage, processing, refining, marketing, exploration, production, and mining of minerals and natural resources. MLPs trade on national securities exchanges exactly like the shares of a corporation, without entity level taxation. MLPs typically distribute income quarterly and have the potential for capital appreciation to the extent that they experience growth in cash flow or earnings or increases in valuations. The Fund intends to continue to qualify as a regulated investment company under Subchapter M of the Internal Revenue Code of 1986, as amended. Consistent with that intention, the Fund shall invest no more than 25% of its total assets in securities of MLPs.
REITs are corporations or trusts that invest primarily in fee or leasehold ownership of real estate, mortgages or shares issued by other REITs, and that receive favorable tax treatment provided they meet certain conditions, including the requirement that they distribute at least 90% of their taxable income.
DIREXION ANNUAL REPORT
4
ETNs are debt obligations of investment banks, which are traded on exchanges and whose returns are linked to the performance of market indices.
The Subadviser's investment process begins by looking at various global macro-economic factors such as fiscal/monetary policy, interest rates, geo-political risks, inflation, commodity pricing, government policies and general business conditions. The Subadviser scans a broad array of possible income-producing opportunities across the capital structure and then analyzes company-specific fundamental research to understand a company's dividend policy, relative value and balance sheet. Investments are selected for the Fund's portfolio that demonstrate stable and consistent cash flow, strong underlying asset value, competitive advantages and management teams with demonstrable positive track records.
The Subadviser has a two tier approach to managing the Fund's fixed income portfolio. First, it considers a long-term strategic investment view. Second, it buys and sells fixed income securities opportunistically in response to short-term market, economic, political, or other developments. The objective of the Subadviser's fixed income portfolio strategy is to generate higher income than would be expected from traditional intermediate term fixed income investments such as U.S. government bonds. As a result, the Fund may invest up to 30% in high yield debt or "junk bonds" (higher-risk, lower-rated fixed income securities such as those rated lower than BBB- by Standard & Poor's Rating Service, Inc. or lower than Baa3 by Moody's Investors Service, Inc. or, if unrated, determined by the Subadviser to be of comparable quality). The Fund invests in fixed income securities of any duration. Duration measures the sensitivity of the price of a fixed income investment to a 1% change in interest rates. For example, a five-year duration means the investment will decrease in value by 5% if interest rates rise 1%.
In addition, the Fund may invest in other investment companies, including exchange-traded funds ("ETFs"), to the extent permitted by the Investment Company Act of 1940.
The Subadviser's investment team has the flexibility to change the Fund's asset allocation to reflect its outlook on market conditions and may reallocate the Fund's investments between asset classes in an attempt to improve the Fund's total return and reduce volatility. Volatility in the markets provides the Subadviser with the opportunity to benefit from perceived pricing dislocations that may occur during periods of market distress. The Fund's portfolio managers make asset allocation adjustments based on a combination of bottom-up/top-down fundamental analysis and relative value analysis among capital market instruments within the target asset classes.
At the discretion of the Subadviser, the Fund may invest its assets in cash, cash equivalents, and high-quality, short-term debt securities and money market instruments for (i) temporary defensive purposes in response to adverse market, economic or political conditions and (ii) to retain flexibility in meeting redemptions and paying expenses. Such investments may result in the Fund not achieving its investment objective.
As always, we thank you for using the Direxion Funds and we look forward to our mutual success.
Regards,

| | 
| | 
| |
William J. Garvey | | Craig O'Neill | | Alex Oxenham | |
Hilton Capital Management, LLC | | Hilton Capital Management, LLC | | Hilton Capital Management, LLC | |
DIREXION ANNUAL REPORT
5
The performance data quoted represents past performance; past performance does not guarantee future results. The investment return and principal value of an investment will fluctuate and an investor's shares, when redeemed, may be worth more or less than their original cost. Current performance may be higher or lower than the performance data quoted. For most recent month-end performance information please visit direxioninvestments.com or call 1.800.851.0511.
An investor should consider the investment objectives, risks, charges, and expenses of the Direxion Funds carefully before investing. The prospectus and summary prospectus contain this and other information about Direxion Funds. To obtain a prospectus or summary prospectus, please contact Direxion Investments at 1.800.851.0511 or visit www.direxioninvestments.com. The prospectus or summary prospectus should be read carefully before investing.
Mutual fund investing involves risk. Principal loss is possible. The Fund's strategy of investing in dividend-paying stocks involves the risk that such stocks may fall out of favor with investors and underperform the market. In addition, there is the possibility that such companies could reduce or eliminate the payment of dividends in the future or the anticipated acceleration of dividends could not occur. The Fund may invest in foreign securities and American Depositary Receipts which involve political, economic and currency risks, greater volatility and differences in accounting methods. Medium- and small-capitalization companies tend to have limited liquidity and greater price volatility than large-capitalization companies. Investments in REIT securities involve risks such as declines in the value of real estate and increased susceptibility to adverse economic regulatory expenses. The Fund may invest in MLPs which can be negatively influenced when interest rates rise. These investments also entail many of the general tax risks of investing in a partnership.
There is always the risk that an MLP will fail to qualify for favorable tax treatments. Investments in debt securities typically decrease in value when interest rates rise. This risk is usually greater for longer-term debt securities. Investment by the Fund in lower-rated and nonrated securities presents a greater risk of loss to principal and interest than higher-rated securities. Income from municipal securities may be subject to state and local taxes and a portion of income may be subject to the federal alternative minimum tax for certain investors. Federal income tax rules will apply to any capital gains distributions. Because the funds invest in ETFs and ETNs, they are subject to additional risks that do not apply to conventional mutual funds. ETF risk includes the risks that the market price of the shares may trade at a discount to its net asset value ("NAV"), an active secondary trading market may not develop or be maintained, or trading may be halted by the exchange in which they trade, which may impact a Fund's ability to sell its shares. ETN risk includes the risks that the value of an ETN may be influenced by time to maturity, level of supply and demand for the ETN, volatility and lack of liquidity in the underlying securities markets, changes in the applicable interest rates, changes in the issuer's credit rating and economic, legal, political or geographic events that affect the referenced index. In addition, ETNs are unsecured debt of the issuer and would lose value if the issuer goes bankrupt.
The total annual fund operating expense ratio of the Direxion Hilton Tactical Income Fund Class A Shares is 1.52%, which includes Acquired Fund Fees and Expenses, indirect fees and expenses that the Fund incurs that are required to be disclosed. Without Acquired Fund Fees and Expenses, the total annual fund operating expense ratio would be 1.30%.*
* Rafferty Asset Management, LLC has entered into an Operating Expense Limitation Agreement with the Fund. Under this Operating Expense Limitation Agreement, Rafferty has contractually agreed to cap all or a portion of its management fee and/or reimburse the Fund for Other Expenses, as long as Rafferty is the Adviser for the Fund, to the extent that the Fund's Total Annual Fund Operating Expenses exceed 1.30% for Class A Shares, 1.05% for Institutional Class Shares and 2.05% for Class C Shares of the Fund's average daily net assets (excluding, as applicable, among other expenses, taxes, swap financing and related costs, acquired fund fees and expenses, dividends or interest on short positions, other interest expenses, brokerage commissions, and extraordinary expenses).
DIREXION ANNUAL REPORT
6
Barclay's U.S. Intermediate Government/Credit Index is a market value weighted performance benchmark for government and corporate fixed-rate debt issues (rated Baa/BBB or higher) with maturities between one and ten years.
The S&P 500® Index is one of the most commonly used benchmarks for the overall U.S. Stock Market. It is a market value weighted index and each stock's weight is proportionate to its market value.
Please note that you cannot invest directly in an index, although you may invest in the underlying securities represented in the index. Index returns are adjusted to reflect the reinvestment of dividends on securities in the index but do not reflect the expenses of the Fund.
Distributed by: Rafferty Capital Markets, LLC
DIREXION ANNUAL REPORT
7
Direxion Hilton Tactical Income Fund
Performance Summary (Unaudited)
Investment Objective: Primarily seeks income with a secondary investment objective of capital appreciation consistent with the preservation of capital.
Class A3
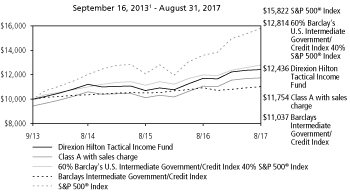
Institutional Class
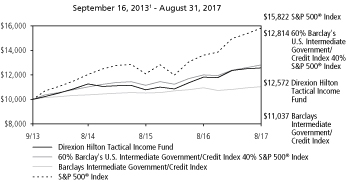
Class C

These charts illustrate the performance of a hypothetical $10,000 investment made on the inception date of each Fund class, and is not intended to imply any future performance. The returns shown do not reflect the deduction or taxes that a shareholder would pay on fund distributions or the redemption of fund shares. The performance of the Barclay's U.S. Intermediate Government/Credit and S&P 500® Index, the Fund's benchmark, does not reflect the deduction of fees associated with a mutual fund, such as investment management fees. Investors cannot invest directly in an index, although they can invest in its underlying securities.
An up-front sales charge of 5.50% is associated with the purchase of Class A shares of the Fund effective June 1, 2015.
The Fund may impose a 1.00% redemption fee on Class A and Institutional Class shares redeemed (through sales or exchanges) within 30 days of the date of purchase. Performance data does not reflect the redemption fee. If reflected, total returns would be reduced.
The Fund imposes a 1.00% contingent deferred sales charge of the net amount of the redemption of Class C shares if redeemed within 12 months of purchase.
The performance data shown represents past performance and does not guarantee future results.
| | | Average Annual Total Return2 | |
| | | 1 Year | | 3 Years | | Since Inception | |
Direxion Hilton Tactical Income
Fund – Class A3 | | | 6.14 | % | | | 3.47 | % | | | 5.66 | % | |
Direxion Hilton Tactical Income
Fund – Class A
(with sales charge)3 | | | 0.28 | % | | | 1.53 | % | | | 4.17 | % | |
60% Barclay's U.S. Intermediate
Government/Credit Index 40%
S&P 500® Index4 | | | 6.79 | % | | | 5.17 | % | | | 6.47 | % | |
Barclays Intermediate
Government/Credit Index | | | 0.82 | % | | | 2.11 | % | | | 2.52 | % | |
S&P 500® Index | | | 16.23 | % | | | 9.54 | % | | | 12.30 | % | |
| | | Average Annual Total Return2 | |
| | | 1 Year | | 3 Years | | Since Inception | |
Direxion Hilton Tactical Income
Fund – Institutional Class | | | 6.39 | % | | | 3.74 | % | | | 5.96 | % | |
60% Barclay's U.S. Intermediate
Government/Credit Index 40%
S&P 500® Index4 | | | 6.79 | % | | | 5.17 | % | | | 6.47 | % | |
Barclays Government/Credit Index | | | 0.82 | % | | | 2.11 | % | | | 2.52 | % | |
S&P 500® Index | | | 16.23 | % | | | 9.54 | % | | | 12.30 | % | |
| | | Average Annual Total Return2 | |
| | | 1 Year | | Since Inception | |
Direxion Hilton Tactical
Income Fund – Class C5 | | | 5.38 | % | | | 4.49 | % | |
60% Barclay's U.S. Intermediate
Government/Credit Index 40%
S&P 500® Index4 | | | 6.79 | % | | | 5.29 | % | |
Barclays Government/Credit Index | | | 0.82 | % | | | 2.25 | % | |
S&P 500® Index | | | 16.23 | % | | | 9.62 | % | |
1 Commencement of operations.
2 As of August 31, 2017.
3 On June 1, 2015, the Class A shares converted from Investor Class shares. Effective on June 1, 2015, purchases of Class A shares are charged an up-front sales charge of 5.50%. Prior to June 1, 2015, this up-front sales charge was not charged.
4 The 60% Barclay's U.S. Intermediate Government/Credit Index 40% S&P 500® Index is a blended benchmark consisting of 60% of the Barclay's U.S. Intermediate Government/Credit Index and 40% of the S&P 500® Index.
5 This return does not include the contingent deferred sales charge. Had this sales charge been included, the one year total return would be 4.32%.
DIREXION ANNUAL REPORT
8
Expense Example (Unaudited)
As a shareholder of a mutual fund, you incur two types of costs: (1) transaction costs, including sales charges (loads) on purchase payments, reinvested dividends, or other distributions; redemption fees and exchange fees; and (2) ongoing costs, including management fees; distribution and/or service fees; and other fund expenses. This example is intended to help you understand your ongoing costs (in dollars) of investing in a fund and to compare costs with the ongoing costs of investing in other mutual funds.
The example is based on an investment of $1,000 invested at the beginning of the period and held for the entire period (March 1, 2017 – August 31, 2017).
Actual expenses
The first line of the table below provides information about actual account values and actual expenses. You may use the information in this line, together with the amount you invested, to estimate the expense that you paid over the period. Simply divide your account value by $1,000 (for example, an $8,600 account value divided by $1,000 = 8.6), then multiply the result by the number in the first line under the heading entitled "Expenses Paid During Period" to estimate the expenses you paid on your account during this period.
Hypothetical example for comparison purposes
The second line of the table below provides information about hypothetical account values and hypothetical expenses based on the Fund's actual expense ratio and an assumed rate of return of 5% per year before expenses, which is not the Fund's actual return. The hypothetical account values and expenses may not be used to estimate the actual ending account balance or expenses you paid for the period. You may use this information to compare the ongoing costs of investing in the Fund and other funds. To do so, compare this 5% hypothetical example with the 5% hypothetical examples that appear in the shareholder reports of the other funds.
Please note that the expenses shown in the table are meant to highlight your ongoing costs only and do not reflect any transactional costs, such as wire transfers, returned checks or stop payment orders. Therefore, the second line of the table is useful in comparing ongoing costs only, and will not help you determine the relative costs of owning different funds. In addition, if these transactional costs were included, your costs would have been higher.
Expense Example Table (Unaudited)
August 31, 2017
| | | Annualized
Expense
Ratio | | Beginning
Account Value
March 1, 2017 | | Ending
Account Value
August 31, 2017 | | Expenses
Paid During
Period* | |
Direxion Hilton Tactical Income Fund Class A | |
Based on actual fund return | | | 1.30 | % | | $ | 1,000.00 | | | $ | 1,015.70 | | | $ | 6.60 | | |
Based on hypothetical 5% return | | | 1.30 | % | | | 1,000.00 | | | | 1,018.65 | | | | 6.61 | | |
Direxion Hilton Tactical Income Fund Institutional Class | |
Based on actual fund return | | | 1.05 | % | | | 1,000.00 | | | | 1,016.90 | | | | 5.34 | | |
Based on hypothetical 5% return | | | 1.05 | % | | | 1,000.00 | | | | 1,019.91 | | | | 5.35 | | |
Direxion Hilton Tactical Income Fund Class C | |
Based on actual fund return | | | 2.05 | % | | | 1,000.00 | | | | 1,012.00 | | | | 10.40 | | |
Based on hypothetical 5% return | | | 2.05 | % | | | 1,000.00 | | | | 1,014.87 | | | | 10.41 | | |
* Expenses are equal to the Fund's annualized expense ratio, multiplied by the average account value over the period, multiplied by 184 days (the number of days in the period of March 1, 2017 to August 31, 2017), then divided by 365.
DIREXION ANNUAL REPORT
9
Allocation of Portfolio Holdings (Unaudited)
| | | Common
Stock | | Preferred
Stock | | Corporate
Bonds | | Closed-End
Funds | | Master
Limited
Partnerships | | Convertible
Bonds | | Foreign
Government
Bonds | | Cash* | | Total | |
Direxion Hilton Tactical
Income Fund | | | 39 | % | | | 24 | % | | | 13 | % | | | 11 | % | | | 5 | % | | | 3 | % | | | 1 | % | | | 4 | % | | | 100 | % | |
Allocation of Portfolio Holdings reflects percentages of net assets.
* Cash and other assets less liabilities.
DIREXION ANNUAL REPORT
10
Direxion Hilton Tactical Income Fund
Shares | | | | Fair Value | |
COMMON STOCKS - 39.2% | | | |
Consumer Discretionary - 1.9% | | | |
| | 36,300 | | | Starbucks Corp. | | $ | 1,991,418 | | |
Consumer Staples - 1.8% | | | |
| | 12,320 | | | Costco Wholesale Corp. | | | 1,931,037 | | |
Energy - 1.3% | | | |
| | 204,300 | | | San Juan Basin Royalty Trust | | | 1,409,670 | | |
Financials - 19.0% | | | |
| | 10,985 | | | CME Group, Inc. | | | 1,381,913 | | |
| | 62,460 | | | Four Corners Property
Trust, Inc. - REIT | | | 1,587,109 | | |
| | 77,420 | | | Gramercy Property Trust - REIT | | | 2,358,213 | | |
| | 30,025 | | | JPMorgan Chase & Co. | | | 2,728,972 | | |
| | 118,780 | | | KeyCorp | | | 2,044,204 | | |
| | 64,465 | | | MainSource Financial Group, Inc. | | | 2,109,939 | | |
| | 151,995 | | | Redwood Trust, Inc. - REIT | | | 2,535,277 | | |
| | 100,645 | | | The Bank of N.T. Butterfield &
Son Ltd. | | | 3,309,208 | | |
| | 9,050 | | | The Goldman Sachs Group Inc. | | | 2,024,847 | | |
| | | | 20,079,682 | | |
Health Care - 1.0% | | | |
| | 8,260 | | | Johnson & Johnson | | | 1,093,376 | | |
Industrials - 7.3% | | | |
| | 40,470 | | | A.O. Smith Corp. | | | 2,253,774 | | |
| | 8,590 | | | Lennox International, Inc. | | | 1,423,621 | | |
| | 75,100 | | | Rentokil Initial PLC - ADR
(United Kingdom) | | | 1,511,012 | | |
| | 39,090 | | | Republic Services, Inc. | | | 2,550,232 | | |
| | | | 7,738,639 | | |
Information Technology - 4.9% | | | |
| | 35,620 | | | Broadridge Financial Solutions, Inc. | | | 2,782,990 | | |
| | 19,530 | | | Harris Corp. | | | 2,400,237 | | |
| | | | 5,183,227 | | |
Real Estate - 2.0% | | | |
| | 166,925 | | | NorthStar Realty Europe Corp. | | | 2,074,878 | | |
| | | | | TOTAL COMMON STOCKS
(Cost $36,830,727) | | $ | 41,501,927 | | |
PREFERRED STOCKS - 23.5% | | | |
Consumer Discretionary - 1.1% | | | |
| | | | | M/I Homes, Inc. | | | | | |
| | 45,200 | | | 9.75%, 10/27/2017 | | $ | 1,161,640 | | |
Financials - 22.4% | | | |
| | | | | AG Mortgage Investment
Trust, Inc. | | | | | |
| | 50,000 | | | 8.00%, 10/13/2017 | | | 1,255,500 | | |
| | | | | Apollo Commercial Real
Estate Finance, Inc. | | | | | |
| | 48,500 | | | 8.00%, 10/13/2017 | | | 1,242,570 | | |
| | | | | B. Riley Financial, Inc. | | | | | |
| | 48,605 | | | 7.50%, 10/31/2021 | | | 1,249,149 | | |
| | | | | BGC Partners, Inc. | | | | | |
| | 39,650 | | | 8.125%, 06/15/2042 | | | 1,029,711 | | |
Shares | | | | Fair Value | |
| | | | | Bluerock Residential
Growth, Inc. Class A - REIT | | | | | |
| | 64,000 | | | 8.25%, 10/21/2020 | | $ | 1,695,360 | | |
| | | | | Brookfield DTLA Fund Office
Trust Investor, Inc. - REIT (a) | | | | | |
| | 85,225 | | | 7.625%, 10/16/2017 | | | 2,318,120 | | |
| | | | | Capitala Finance Corp. | | | | | |
| | 46,000 | | | 6.00%, 05/31/2022 | | | 1,165,180 | | |
| | | | | Cherry Hill Mortgage
Investment Corp. (a) | | | | | |
| | 5,000 | | | 8.20%, 08/17/2022 | | | 126,450 | | |
| | | | | Chimera Investment Corp. | | | | | |
| | 44,315 | | | 8.00%, 03/30/2024 | | | 1,145,099 | | |
| | | | | Chimera Investment Corp. | | | | | |
| | 40,000 | | | 8.00%, 10/30/2021 | | | 1,031,200 | | |
| | | | | Compass Diversified Holdings (a) | | | | | |
| | 25,240 | | | 7.25%, 07/30/2022 | | | 633,019 | | |
| | | | | Customers Bancorp, Inc. | | | | | |
| | 25,000 | | | 7.00%, 06/15/2020 | | | 669,625 | | |
| | | | | Dynex Capital, Inc. | | | | | |
| | 25,000 | | | 7.625%, 04/30/2018 | | | 615,000 | | |
| | | | | Hercules Capital, Inc. | | | | | |
| | 85,225 | | | 6.25%, 07/30/2024 | | | 2,161,306 | | |
| | | | | Iberiabank Corp. | | | | | |
| | 56,000 | | | 6.625%, 08/01/2025 | | | 1,582,000 | | |
| | | | | PrivateBancorp, Inc. | | | | | |
| | 39,788 | | | 7.125%, 10/30/2042 | | | 1,022,066 | | |
| | | | | Stellus Capital Investment Corp. | | | | | |
| | 5,000 | | | 3.75%, 09/15/2022 | | | 125,450 | | |
| | | | | TICC Capital Corp. (a) | | | | | |
| | 82,065 | | | 6.50%, 03/30/2024 | | | 2,143,538 | | |
| | | | | TriplePoint Venture Growth
BDC Corp. (a) | | | | | |
| | 48,500 | | | 5.75%, 07/15/2022 | | | 1,222,200 | | |
| | | | | Two Harbors Investment Corp. (a) | | | | | |
| | 45,000 | | | 8.125%, 04/27/2027 | | | 1,212,750 | | |
| | | | 23,645,293 | | |
| | | | | TOTAL PREFERRED STOCKS
(Cost $23,797,490) | | $ | 24,806,933 | | |
CORPORATE BONDS - 12.6% | | | |
Consumer Discretionary - 1.9% | | | |
| | | | | Amazon.com, Inc. | | | | | |
| | 900,000 | | | 3.80%, 12/05/2024 | | $ | 971,094 | | |
| | | | | AutoZone, Inc. | | | | | |
| | 1,000,000 | | | 1.63%, 04/21/2019 | | | 996,163 | | |
| | | | 1,967,257 | | |
Consumer Staples - 1.4% | | | |
| | | | | Coca-Cola European Partners PLC | | | | | |
| | 1,000,000 | | | 3.25%, 08/19/2021 | | | 1,031,775 | | |
| | | | | Molson Coors Brewing Co. | | | | | |
| | 430,000 | | | 1.45%, 07/15/2019 | | | 426,534 | | |
| | | | 1,458,309 | | |
Financials - 1.1% | | | |
| | | | | Customers Bancorp, Inc. | | | | | |
| | 46,000 | | | 6.38%, 07/31/2018 | | | 1,209,340 | | |
The accompanying notes are an integral part of these financial statements.
DIREXION ANNUAL REPORT
11
Direxion Hilton Tactical Income Fund
Shares | | | | Fair Value | |
Health Care - 3.0% | | | |
| | | | | AbbVie, Inc. | | | | | |
| | 2,100,000 | | | 2.90%, 11/06/2022 | | $ | 2,132,958 | | |
| | | | | Howard Hughes Medical Institute | | | | | |
| | 1,000,000 | | | 3.50%, 09/01/2023 | | | 1,061,863 | | |
| | | | 3,194,821 | | |
Information Technology - 5.2% | | | |
| | | | | Alphabet, Inc. | | | | | |
| | 800,000 | | | 3.38%, 02/25/2024 | | | 848,573 | | |
| | | | | Apple, Inc. | | | | | |
| | 1,000,000 | | | 3.20%, 05/13/2025 | | | 1,035,348 | | |
| | | | | International Business
Machines Corp. | | | | | |
| | 650,000 | | | 1.90%, 01/27/2020 | | | 653,646 | | |
| | | | | Microsoft Corp. | | | | | |
| | 1,400,000 | | | 2.38%, 02/12/2022 | | | 1,420,174 | | |
| | | | | Oracle Corp. | | | | | |
| | 1,565,000 | | | 2.50%, 10/15/2022 | | | 1,585,902 | | |
| | | | 5,543,643 | | |
| | | | | TOTAL CORPORATE BONDS
(Cost $13,106,674) | | $ | 13,373,370 | | |
CLOSED-END FUNDS - 10.8% | | | |
| | 390,630 | | | Fifth Street Finance Corp. | | $ | 2,109,402 | | |
| | 229,500 | | | Invesco Dynamic Credit
Opportunities Fund | | | 2,701,215 | | |
| | 255,000 | | | Nuveen Credit Strategies
Income Fund | | | 2,157,300 | | |
| | 84,380 | | | Nuveen Mortgage Opportunity
Term Fund | | | 2,166,878 | | |
| | 100,250 | | | PIMCO Dynamic Credit and
Mortgage Income Fund | | | 2,268,657 | | |
| | | | | TOTAL CLOSED-END FUNDS
(Cost $11,143,055) | | $ | 11,403,452 | | |
Shares | | | | Fair Value | |
MASTER LIMITED PARTNERSHIPS - 5.2% | | | |
Energy - 3.2% | | | |
| | 67,350 | | | Enterprise Products
Partners L.P. | | $ | 1,755,814 | | |
| | 23,635 | | | Magellan Midstream
Partners L.P. | | | 1,592,763 | | |
| | | | 3,348,577 | | |
Financials - 2.0% | | | |
| | 79,400 | | | Ares Management L.P. | | | 2,158,092 | | |
| | | | | TOTAL MASTER LIMITED
PARTNERSHIPS
(Cost $5,111,288) | | $ | 5,506,669 | | |
CONVERTIBLE BONDS - 2.9% | | | |
Financials - 2.9% | | | |
| | | | | Colony Northstar, Inc. | | | | | |
| | 875,000 | | | 3.88%, 01/15/2021 | | $ | 878,828 | | |
| | | | | HCI Group, Inc. | | | | | |
| | 2,250,000 | | | 3.88%, 03/15/2019 | | | 2,197,969 | | |
| | | | | TOTAL CONVERTIBLE BONDS
(Cost $3,053,511) | | $ | 3,076,797 | | |
FOREIGN GOVERNMENT BONDS - 1.1% | | | |
Republic of Argentina | | | |
| | 1,050,000 | | | 6.88%, 04/22/2021 (a) | | $ | 1,143,319 | | |
| | | | | TOTAL FOREIGN GOVERNMENT
BONDS (Cost $1,107,545) | | $ | 1,143,319 | | |
| | | | | TOTAL INVESTMENTS - 95.3%
(Cost $94,150,290) | | $ | 100,812,467 | | |
| | | | | Other Assets in Excess of
Liabilities - 4.7% | | | 4,995,798 | | |
| | | | | TOTAL NET ASSETS - 100.0% | | $ | 105,808,265 | | |
Percentages are stated as a percent of net assets.
The geographic location of all investments is United States unless otherwise indicated.
(a) Non-income producing security.
ADR - American Depositary Receipt
REIT - Real Estate Investment Trust
The Global Industry Classification Standard (GICS®) was developed by and/or is the exclusive property of MSCI, Inc. and Standard & Poor's Financial Services LLP ("S&P"). GICS is a service mark of MSCI and S&P and has been licensed for use by U.S. Bancorp Fund Services, LLC.
The accompanying notes are an integral part of these financial statements.
DIREXION ANNUAL REPORT
12
Statement of Assets & Liabilities
| | | Direxion Hilton
Tactical Income
Fund | |
Assets: | |
Investments, at fair value (Note 2) | | $ | 100,812,467 | | |
Cash | | | 7,390,567 | | |
Receivable for Fund shares sold | | | 669,756 | | |
Investment securities sold | | | 98,396 | | |
Dividends, interest and reclaims receivable | | | 395,692 | | |
Total Assets | | | 109,366,878 | | |
Liabilities: | |
Fund shares redeemed | | | 3,020,125 | | |
Payable for investment securities purchased | | | 440,993 | | |
Accrued investment advisory fees | | | 82,120 | | |
Accrued distribution expenses | | | 1,688 | | |
Accrued operating services fees | | | 13,687 | | |
Total Liabilities | | | 3,558,613 | | |
Net Assets | | $ | 105,808,265 | | |
Net Assets Consist of: | |
Capital stock | | $ | 101,864,199 | | |
Accumulated net investment loss | | | (577,506 | ) | |
Accumulated net realized loss | | | (2,140,697 | ) | |
Net unrealized appreciation (depreciation) on: | |
Investments | | | 6,662,177 | | |
Foreign receivables | | | 92 | | |
Net Assets | | $ | 105,808,265 | | |
Cost of Investments | | $ | 94,150,290 | | |
Calculation of Net Asset Value Per Share: | |
Class A Shares: | |
Net assets | | $ | 5,015,926 | | |
Shares outstanding (unlimited shares of beneficial interest authorized, par value) | | | 309,648 | | |
Net asset value, redemption price and offering price per share | | $ | 16.20 | | |
Institutional Class Shares: | |
Net assets | | $ | 98,451,230 | | |
Shares outstanding (unlimited shares of beneficial interest authorized, par value) | | | 6,069,287 | | |
Net asset value, redemption price and offering price per share | | $ | 16.22 | | |
Class C Shares: | |
Net assets | | $ | 2,341,109 | | |
Shares outstanding (unlimited shares of beneficial interest authorized, par value) | | | 144,627 | | |
Net asset value, redemption price and offering price per share | | $ | 16.19 | | |
The accompanying notes are an integral part of these financial statements.
DIREXION ANNUAL REPORT
13
For the Year Ended August 31, 2017
| | | Direxion Hilton
Tactical Income
Fund | |
Investment Income: | |
Dividend income (net of withholding tax of $1,755) | | $ | 2,995,152 | | |
Interest income | | | 482,849 | | |
Total investment income | | | 3,478,001 | | |
Expenses: | |
Investment advisory fees | | | 802,314 | | |
Operating service fees | | | 133,719 | | |
Distribution and Shareholder Service Fees – Class A | | | 9,735 | | |
Distribution and Shareholder Service Fees – Class C | | | 23,759 | | |
Total expenses | | | 969,527 | | |
Net investment income | | | 2,508,474 | | |
Realized and unrealized gain (loss) on investments: | |
Net realized gain (loss) on: | |
Investments | | | 192,594 | | |
Foreign currency | | | 13 | | |
Written options | | | 25,016 | | |
| | | | 217,623 | | |
Capital gain distributions from regulated investment companies | | | 18,436 | | |
Change in net unrealized appreciation (depreciation) on: | |
Investments | | | 2,765,418 | | |
Foreign receivables | | | 92 | | |
Written options | | | (20,135 | ) | |
| | | | 2,745,375 | | |
Net realized and unrealized gain on investments | | | 2,981,434 | | |
Net increase in net assets resulting from operations | | $ | 5,489,908 | | |
The accompanying notes are an integral part of these financial statements.
DIREXION ANNUAL REPORT
14
Statements of Changes in Net Assets
| | | Direxion Hilton Tactical Income Fund | |
| | | Year Ended
August 31, 2017 | | Year Ended
August 31, 2016 | |
Increase (decrease) in net assets from: | |
Operations: | |
Net investment income | | $ | 2,508,474 | | | $ | 1,640,547 | | |
Net realized gain (loss) on investments and written options | | | 217,623 | | | | (1,548,489 | ) | |
Capital gain distributions from regulated investment companies | | | 18,436 | | | | 74,250 | | |
Change in net unrealized appreciation on investments and written options | | | 2,745,375 | | | | 5,252,115 | | |
Net increase in net assets resulting from operations | | | 5,489,908 | | | | 5,418,423 | | |
Distributions to shareholders: | |
Net investment income: | |
Class A Shares | | | (105,809 | ) | | | (68,557 | ) | |
Institutional Class Shares | | | (2,481,574 | ) | | | (1,740,922 | ) | |
Class C Shares | | | (51,889 | ) | | | (45,587 | ) | |
Return of capital | |
Class A Shares | | | (5,868 | ) | | | (30,953 | ) | |
Institutional Class Shares | | | (137,897 | ) | | | (785,529 | ) | |
Class C Shares | | | (2,934 | ) | | | (20,077 | ) | |
Total distributions to shareholders | | | (2,785,971 | ) | | | (2,691,625 | ) | |
Capital share transactions: | |
Total increase in net assets from net change in capital share transactions(a) | | | 39,027,136 | | | | 867,295 | | |
Total increase in net assets | | | 41,731,073 | | | | 3,594,093 | | |
Net assets: | |
Beginning of year | | | 64,077,192 | | | | 60,483,099 | | |
End of year | | $ | 105,808,265 | | | $ | 64,077,192 | | |
Accumulated net investment loss, end of year | | $ | (577,506 | ) | | $ | (312,908 | ) | |
(a) Summary of capital share transactions is as follows:
| | | Direxion Hilton Tactical Income Fund | |
| | | Year Ended
August 31, 2017 | | Year Ended
August 31, 2016 | |
| | | Shares | | Value | | Shares | | Value | |
Shares sold | |
Class A Shares | | | 228,158 | | | $ | 3,623,927 | | | | 48,068 | | | $ | 718,077 | | |
Institutional Class Shares | | | 3,338,114 | | | | 53,405,852 | | | | 1,105,205 | | | | 16,698,632 | | |
Class C Shares | | | 32,259 | | | | 516,096 | | | | 89,266 | | | | 1,346,741 | | |
Shares issued in reinvestment of distributions | |
Class A Shares | | | 6,081 | | | | 97,470 | | | | 5,165 | | | | 77,559 | | |
Institutional Class Shares | | | 135,031 | | | | 2,161,074 | | | | 131,363 | | | | 1,979,392 | | |
Class C Shares | | | 2,482 | | | | 39,483 | | | | 3,296 | | | | 49,743 | | |
Shares redeemed | |
Class A Shares | | | (38,387 | ) | | | (615,383 | ) | | | (174,229 | ) | | | (2,618,397 | ) | |
Institutional Class Shares | | | (1,199,513 | ) | | | (19,402,868 | ) | | | (1,153,988 | ) | | | (17,179,795 | ) | |
Class C Shares | | | (50,165 | ) | | | (798,515 | ) | | | (13,238 | ) | | | (204,657 | ) | |
Net increase | | | 2,454,060 | | | $ | 39,027,136 | | | | 40,908 | | | $ | 867,295 | | |
The accompanying notes are an integral part of these financial statements.
DIREXION ANNUAL REPORT
15
| | | | | RATIOS TO AVERAGE NET ASSETS3 | | | |
| | | Net Asset
Value,
Beginning
of Year/
Period | | Net
Investment
Income1 | | Net Realized
and Unrealized
Gain (Loss)
on Investments | | Net Increase
(Decrease) in
Net Asset
Value Resulting
from Operations | | Dividends
from Net
Investment
Income | | Distributions
from
Realized
Capital Gains | | Return
of Capital
Distribution | | Total
Distributions | | Redemption
Fees Paid to
Fund | | Net
Asset
Value,
End of
Year/
Period | | Total
Return2 | | Net
Assets,
End of
Year/
Period
(,000) | | Total
Expenses | | Net
Expenses | | Net Investment
Income | | Portfolio
Turnover
Rate4 | |
Direxion Hilton Tactical Income Fund | |
Class A Shares | |
Year ended August 31, 2017 | | $ | 15.73 | | | $ | 0.42 | | | $ | 0.53 | | | $ | 0.95 | | | $ | (0.45 | ) | | $ | — | | | $ | (0.03 | ) | | $ | (0.48 | ) | | $ | —7 | | | $ | 16.20 | | | | 6.14 | % | | $ | 5,016 | | | | 1.30 | % | | | 1.30 | % | | | 2.60 | % | | | 61 | % | |
Year ended August 31, 2016 | | | 15.00 | | | | 0.37 | | | | 0.99 | | | | 1.36 | | | | (0.43 | ) | | | — | | | | (0.20 | ) | | | (0.63 | ) | | | — | | | | 15.73 | | | | 9.32 | % | | | 1,790 | | | | 1.30 | % | | | 1.30 | % | | | 2.45 | % | | | 84 | % | |
June 1, 20159 to August 31, 2015 | | | 15.68 | | | | 0.10 | | | | (0.62 | ) | | | (0.52 | ) | | | (0.10 | ) | | | — | | | | (0.06 | ) | | | (0.16 | ) | | | — | | | | 15.00 | | | | (3.31 | %) | | | 3,521 | | | | 1.30 | % | | | 1.30 | % | | | 2.47 | % | | | 35 | %8 | |
Investor Class Shares | |
September 1, 2014 to May 31, 201510 | | | 16.47 | | | | 0.40 | | | | (0.62 | ) | | | (0.22 | ) | | | (0.35 | ) | | | (0.13 | ) | | | (0.09 | ) | | | (0.57 | ) | | | — | | | | 15.68 | | | | (1.26 | %) | | | 3,075 | | | | 1.46 | % | | | 1.37 | % | | | 3.40 | %5 | | | 35 | %8 | |
September 16, 20139 to August 31, 2014 | | | 15.00 | | | | 0.32 | | | | 1.50 | | | | 1.82 | | | | (0.32 | ) | | | (0.03 | ) | | | — | | | | (0.35 | ) | | | — | | | | 16.47 | | | | 12.26 | % | | | 1,223 | | | | 2.72 | % | | | 1.60 | % | | | 2.27 | %5 | | | 58 | % | |
Institutional Class Shares | |
Year ended August 31, 2017 | | | 15.75 | | | | 0.46 | | | | 0.53 | | | | 0.99 | | | | (0.49 | ) | | | — | | | | (0.03 | ) | | | (0.52 | ) | | | —7 | | | | 16.22 | | | | 6.39 | % | | | 98,451 | | | | 1.05 | % | | | 1.05 | % | | | 2.85 | % | | | 61 | % | |
Year ended August 31, 2016 | | | 15.02 | | | | 0.41 | | | | 0.99 | | | | 1.40 | | | | (0.46 | ) | | | — | | | | (0.21 | ) | | | (0.67 | ) | | | —7 | | | | 15.75 | | | | 9.60 | % | | | 59,771 | | | | 1.05 | % | | | 1.05 | % | | | 2.70 | % | | | 84 | % | |
Year ended August 31, 2015 | | | 16.49 | | | | 0.52 | | | | (1.21 | ) | | | (0.69 | ) | | | (0.50 | ) | | | (0.13 | ) | | | (0.15 | ) | | | (0.78 | ) | | | —7 | | | | 15.02 | | | | (4.25 | %) | | | 55,752 | | | | 1.17 | % | | | 1.09 | % | | | 3.29 | %6 | | | 35 | %8 | |
September 16, 20139 to August 31, 2014 | | | 15.00 | | | | 0.37 | | | | 1.50 | | | | 1.87 | | | | (0.35 | ) | | | (0.03 | ) | | | — | | | | (0.38 | ) | | | —7 | | | | 16.49 | | | | 12.61 | % | | | 34,483 | | | | 2.52 | % | | | 1.25 | % | | | 2.63 | %6 | | | 58 | % | |
Class C Shares | |
Year ended August 31, 2017 | | | 15.72 | | | | 0.30 | | | | 0.54 | | | | 0.84 | | | | (0.35 | ) | | | — | | | | (0.02 | ) | | | (0.37 | ) | | | — | | | | 16.19 | | | | 5.38 | % | | | 2,341 | | | | 2.05 | % | | | 2.05 | % | | | 1.86 | % | | | 61 | % | |
Year ended August 31, 2016 | | | 14.99 | | | | 0.25 | | | | 0.99 | | | | 1.24 | | | | (0.35 | ) | | | — | | | | (0.16 | ) | | | (0.51 | ) | | | — | | | | 15.72 | | | | 8.50 | % | | | 2,516 | | | | 2.05 | % | | | 2.05 | % | | | 1.66 | % | | | 84 | % | |
June 2, 20159 to August 31, 2015 | | | 15.62 | | | | 0.08 | | | | (0.62 | ) | | | (0.54 | ) | | | (0.05 | ) | | | — | | | | (0.04 | ) | | | (0.09 | ) | | | — | | | | 14.99 | | | | (3.46 | %) | | | 1,210 | | | | 2.05 | % | | | 2.05 | % | | | 2.17 | % | | | 35 | % | |
1 Net investment income per share represents net investment income divided by the daily average shares of beneficial interest outstanding throughout each period.
2 All returns reflect reinvested dividends, if any, but do not reflect the impact of taxes. Total return for a period of less than one year is not annualized.
3 For periods of less than one year, these ratios are annualized.
4 Portfolio turnover is not annualized and is calculated without regard to short-term securities having a maturity of less than one year. Investments in options, swaps, forward contracts, futures contracts and repurchase agreements are deemed short-term securities.
5 Net investment income ratio is after expense reimbursement. After the reorganization on December 5, 2014, neither the Adviser nor Hilton waives and/or reimburses expenses of the Fund. Net investment income ratio before expense reimbursement for the period ended September 1, 2014 to May 31, 2015 and the period from September 16, 2013 to August 31, 2014 were 3.31% and 1.15%, respectively.
6 Net investment income ratio is after expense reimbursement. After the reorganization on December 5, 2014, neither the Adviser nor Hilton waives and/or reimburses expenses of the Fund. Net investment income ratio before expense reimbursement for the year ended August 31, 2015 and the period from September 16, 2013 to August 31, 2014 were 3.21% and 1.36%, respectively.
7 Amount is less than $0.005.
8 Portfolio turnover excludes the purchase and sales of the Hilton Yield Plus Fund prior to the reorganization on December 5, 2014. If these transactions were included, portfolio turnover would have been higher.
9 Commencement of operations.
10 The Investor Class Shares were converted to Class A shares on June 1, 2015.
The accompanying notes are an integral part of these financial statements.
DIREXION ANNUAL REPORT
16
NOTES TO THE FINANCIAL STATEMENTS
1. ORGANIZATION
Direxion Funds (the "Trust") was organized as a Massachusetts Business Trust on June 6, 1997, and is registered under the Investment Company Act of 1940, as amended (the "1940 Act"), as an open-end management investment company issuing its shares in series, each series representing a distinct portfolio with its own investment objective and policies. The Trust currently has 17 series, of which one is included in this report: the Direxion Hilton Tactical Income Fund (the "Fund"). The Fund is a diversified series of the Trust pursuant to the 1940 Act. The Fund was formerly known as the Hilton Yield Plus Fund (the "Predecessor Fund") and was formerly a series of the Managed Portfolio Series Trust, which commenced operations on September 16, 2013. On December 5, 2014, substantially all of the assets of the Predecessor Fund, were transferred to the Fund in a tax-free reorganization, which was approved by shareholders of the Predecessor Fund (the "Reorganization"). Hilton Capital Management, LLC ("Hilton") previously served as the investment adviser to the Predecessor Fund. After the Reorganization, Rafferty Asset Management, LLC serves as the Fund's investment adviser ("Rafferty" or "Adviser") and Hilton serves as the Fund's subadviser ("Subadviser"). The Fund currently offers Class A, Institutional, and Class C shares. On June 1, 2015, the Fund converted all outstanding Investor Class shares to Class A shares. On June 2, 2015, the Fund began selling Class C shares. Class A and Class C shares are made available through registered investment advisers, financial planners, broker-dealer or other financial intermediaries. Institutional Class shares are made available through investment advisers, banks, trust companies or authorized representatives without a sales charge.
The Fund primarily seeks income with a secondary investment objective of capital appreciation consistent with the preservation of capital. The Fund pursues its investment objective by utilizing an investment strategy that employs a disciplined approach to balancing fixed income investments with historically higher income producing equity securities, with a focus on minimizing absolute risk and volatility. The Subadviser attempts to mitigate portfolio risk and volatility by creating a diversified portfolio of income producing securities that also offer the potential for capital appreciation. These securities may include common and preferred stocks of any capitalization, master limited partnerships ("MLPs"), real estate investment trusts ("REITS"), and a variety of debt instruments of any maturity, including corporate bonds, exchange-traded notes, municipal bonds, and securities issued, backed or otherwise guaranteed by the U.S. Government or its agencies.
The Trust has evaluated the structure, objective and activities of the Fund and determined that it meets the characteristics of an investment company. As such, these financial statements have applied the guidance as set forth in the Accounting Standards Codifications ("ASC") 946, Financial Services Investment Companies.
2. SIGNIFICANT ACCOUNTING POLICIES
The following is a summary of significant accounting policies consistently followed by the Fund in the preparation of its financial statements. These policies are in conformity with U.S. generally accepted accounting principles ("GAAP").
a) Investment Valuation – The Net Asset Value ("NAV") of the Fund is determined daily, Monday through Friday, as of the close of regular trading on the New York Stock Exchange ("NYSE"), each day the NYSE is open for business. The value of all portfolio securities and other assets held by the Fund will be determined as of the time the Fund calculates its NAV, 4:00 p.m. Eastern Time ("Valuation Time"). Equity securities, including common stocks, preferred stocks, exchange-traded funds, closed-end funds, MLPs and REITs and over-the-counter securities are valued at their last sales price or, if not available, at the average of the last bid and ask prices. Securities primarily traded on the NASDAQ National Market are valued using the NASDAQ Official Closing Price. Investments in open-end mutual funds, including money market funds, are valued at their respective quoted NAV on the valuation date. Asset-backed securities, convertible bonds and corporate bonds are valued using the mean between the closing bid and ask price furnished by an independent pricing service. Exchange traded options are valued at the composite price, using the National Best Bid and Offer quotes ("NBBO"). NBBO consists of the highest bid price and lowest ask price across any of the exchanges on which an option is quoted, thus providing a view across the entire U.S. options marketplace. Composite pricing looks at the last trades on the exchanges where the options are traded. If there are no trades for an option on a given business day, the composite option pricing calculates the mean of the highest bid price and lowest ask price across the exchanges where the option is traded. Securities for which reliable market quotations are not readily available, the Fund's pricing service does not provide a valuation for such securities, the
DIREXION ANNUAL REPORT
17
Fund's pricing service provides valuation that in the judgment of the Adviser does not represent fair value, or the Fund or Adviser believes the market price is stale, are fair valued as determined by the Adviser under the supervision of the Board of Trustees. Additionally, the Adviser will monitor developments in the marketplace for significant events that may affect the value of those securities whose closing prices were established before the Valuation Time.
b) Written Options Contracts – The Fund may write options to manage exposure to certain changes in the market. When the Fund writes an option, an amount equal to the premium received by the Fund is recorded as a liability, which is marked-to-market daily to reflect the current market value of the option written. If the option expires, the Fund realizes a gain from investments equal to the amount of the premium received. When a written call option is exercised, the difference between the premium and the amount for effecting a closing purchase transaction, including brokerage commission, is also treated as a realized gain or loss. When a written put option is exercised, the amount of the premium received reduces the cost of the security purchased by the Fund.
A risk in writing a covered call option is that the Fund may forego the opportunity of profit if the market price of the underlying security increases and the option is exercised. The risk in writing a put option is that the Fund may incur a loss if the market price of the underlying security decreases and the option is exercised.
In addition, there is the risk that the Fund may not be able to enter into a closing transaction because of an illiquid secondary market.
c) Investment Transactions – Investment transactions are recorded on trade date. The Fund determines the gain or loss realized from investment transactions by comparing the identified cost, which is the same basis used for federal income tax purposes, with the net sales proceeds.
d) Federal Income Taxes – The Fund intends to comply with the requirements of Subchapter M of the Internal Revenue Code of 1986, as amended, necessary to qualify as a regulated investment company and to make the requisite distributions of income and capital gains to its shareholders sufficient to relieve it from all or substantially all Federal income taxes and excise taxes. No provision for Federal income taxes has been made.
e) Income and Expenses – Dividend income is recorded on the ex-dividend date. Interest income, including amortization of premium and discount, and dividends received from money market funds, is recognized on an accrual basis. Discounts and premiums on securities purchased are amortized over the expected life of the respective securities. Distributions received from investments in MLPs generally are comprised of ordinary income, capital gains and return of capital from the MLPs. For financial statement purposes, the Fund uses return of capital and income estimates to allocate the dividend income received. Such estimates are based on historical information available from each MLP. These estimates may subsequently be revised based on information received from the MLPs after their respective tax reporting periods are concluded, as the actual character of these distributions is not known until after the fiscal year end. The Fund estimates the allocation of investment income and return of capital for the distributions received from MLPs within the Statement of Operations. For the year ended August 31, 2017, the Fund has estimated approximately 100% of the distributions from MLPs to be return of capital. Expenses are computed based on the Fund's respective average daily net assets. Other than class specific expenses, income and expenses are allocated to each class of shares based upon relative net assets. For an additional discussion on expenses, refer to Note 4.
f) Foreign Currency – Certain assets, such as receivables for foreign dividends and foreign tax reclaims, denominated in foreign currencies are translated into U.S. Dollar amounts at the date of valuation. Foreign dividend income denominated in foreign currencies is translated into U.S. Dollar amounts on the respective dates of such transactions. Realized gains or losses on foreign currency exchange are presented on the Statement of Operations as realized gain or loss on foreign currency and arise from the difference between the amounts of foreign dividends recorded on the Fund's books, and the U.S. dollar equivalent of the amounts actually received. Net unrealized foreign currency exchange gains and losses are presented on the Statement of Operations as unrealized appreciation or deprecation on foreign receivables and arise from changes in the value of foreign tax reclaim receivables resulting from changes in the exchange rate.
g) Risks of Investing in Foreign Securities – Investment in foreign securities involve greater risk than investing in domestic securities. As a result, a Fund's returns and net asset values may be affected to a large degree by fluctuations in currency exchange rates, political, diplomatic or economic conditions and regulatory requirements in other countries. The laws and accounting, auditing, and financial reporting standards in foreign countries may require less disclosure than required in the
DIREXION ANNUAL REPORT
18
U.S., and there may be less public information available about foreign companies. Investments in foreign emerging markets present a greater risk than investing in foreign issuers in general. The risk of political or social upheaval is greater in emerging markets. In addition, there may be risks of an economy's dependence on revenues from particular commodities, currency transfer restrictions, a limited number of buyers for such securities and delays and disruptions in securities settlement procedures.
h) Distributions to Shareholders – The Fund will make distributions of net investment income, if any, monthly. The Fund will also distribute net realized capital gains, if any, annually. Income and capital gain distributions are determined in accordance with income tax regulations, which may differ from GAAP. Distributions to shareholders are recorded on the ex-dividend date.
The tax character of distributions during the years ended August 31, 2017 and August 31, 2016, were as follows:
| | | Direxion Hilton Tactical Income Fund | |
| | | Year Ended
August 31, 2017 | | Year Ended
August 31, 2016 | |
Distributions paid from: | |
Ordinary Income | | $ | 2,639,272 | | | $ | 1,855,066 | | |
Long-Term Capital Gains | | | — | | | | — | | |
Return of Capital | | | 146,699 | | | | 836,559 | | |
Total Distributions paid | | $ | 2,785,971 | | | $ | 2,691,625 | | |
The Fund is designating as long-term capital gain dividends, pursuant to Internal Revenue Code 852(b)(3), the amount necessary to reduce the earnings and profits of the Fund related to net capital gain to zero for the tax year ended August 31, 2017. To the extent necessary to fully distribute such capital gains, the Fund is also designating earnings and profits distributed to shareholders on the redemption of shares.
As of August 31, 2017, the components of accumulated earnings/losses of the Fund on a tax basis were as follows:
| | | Direxion Hilton
Tactical Income
Fund | |
Tax cost of investments | | $ | 94,641,498 | | |
Gross unrealized appreciation | | | 7,811,718 | | |
Gross unrealized depreciation | | | (1,640,749 | ) | |
Net unrealized appreciation/(depreciation) | | $ | 6,170,969 | | |
Undistributed ordinary income | | | — | | |
Undistributed long-term capital gain | | | — | | |
Total distributable earnings | | | — | | |
Other accumulated gain/(loss) | | | (2,226,903 | ) | |
Total accumulated earnings/(losses) | | $ | 3,944,066 | | |
The difference between book cost of investments and tax cost of investments is attributable primarily to the tax deferral of losses on wash sales adjustments, return of capital on securities and publicly traded partnership investments.
On the Statement of Assets and Liabilities, the following adjustments were made for permanent tax differences between accounting for net investment income and realized gain and losses under GAAP and tax reporting:
Net Investment
Income/(Loss) | | Realized Gain (Loss) | | Capital Stock | |
$ | (133,800 | ) | | $ | 122,353 | | | $ | 11,447 | | |
Net investment income and realized gains and losses for federal income tax purposes may differ from that reported on the financial statements because of permanent book-to-tax differences. GAAP requires that permanent differences in net investment income and realized gains and losses due to differences between financial reporting and tax reporting be
DIREXION ANNUAL REPORT
19
reclassified between various components of net assets. The permanent differences primarily relate to publicly traded partnership adjustments.
In order to meet certain excise tax distribution requirements, the Fund is required to measure and distribute annually net capital gains realized during a twelve-month period ending October 31 and net investment income earned during a twelve month period ending December 31. In connection with this, the Fund is permitted for tax purposes to defer into its next fiscal year qualified late year losses. Qualified late year capital losses are any net capital losses incurred between November 1 and the end of its fiscal year, August 31, 2017. Qualified late year ordinary losses are generally losses incurred between January 1 and the end of its fiscal year, August 31, 2017. For the year ended August 31, 2017, the Fund did not defer any qualified late year losses.
Under the Regulated Investment Company Modernization Act of 2010, net capital losses recognized for tax years beginning after December 22, 2010 may be carried forward indefinitely, and their character is retained as short-term and/or long-term. As of August 31, 2017, the Fund had unlimited short-term and long-term capital loss carryforwards on a tax basis of $2,226,903. There were no long-term capital loss carryforwards at August 31, 2017. The Fund utilized $254,920 of prior year capital losses in the current year.
The Fund follows authoritative financial reporting rules regarding recognition and measurement of tax positions taken or expected to be taken on a tax return. The Fund has reviewed all open tax years and concluded that there is no effect to the Fund's financial positions or results of operations and no tax liability resulting from unrecognized tax benefits relating to uncertain income tax position taken or expected to be taken on a tax return. The Fund recognizes interest and penalties, if any, related to unrecognized tax benefits as income tax expense in the Statement of Operations. During this period, the Fund did not incur any interest or penalties. Open tax years are those years that are open for examination by the relevant income taxing authority. As of August 31, 2017 open Federal and state income tax years include the tax years ended August 31, 2014 through August 31, 2017. The Fund has no examination in progress. The Fund is also not aware of any tax positions for which it is reasonably possible that the total amounts of unrecognized tax expense will significantly change in the next twelve months.
i) Use of Estimates – The preparation of financial statements in conformity with GAAP requires management to make estimates and assumptions that affect the reported amounts of assets and liabilities and disclosure of contingent assets and liabilities at the date of the financial statements and the reported amounts of revenues and expenses during the reporting period. Actual results could differ from those estimates.
3. INVESTMENT TRANSACTIONS
During the year ended August 31, 2017, the aggregate purchases and sales of investments (excluding short-term investments) in the Fund were $89,185,108 and $49,438,324, respectively. There were no investments in long-term U.S. Government securities at August 31, 2017.
4. INVESTMENT ADVISORY FEE AND OTHER AGREEMENTS
Investment Advisory Agreement: The Fund has entered into an investment advisory agreement with the Adviser. The Adviser earns a fee, computed daily and payable monthly, applied to the Fund's average daily net assets at an annual rate of 0.90%.
In addition, the Adviser has entered into a sub-advisory agreement with Hilton, whereby the Subadviser will provide investment management and asset allocation advice to the Fund. The Adviser pays, out of the management fees it receives from the Fund, a fee for these sub-advisory services.
Operating Services Agreement: The Fund has entered into an Operating Services Agreement (the "Agreement") with the Adviser. Under this Agreement, the Adviser has contractually agreed, in exchange for an annualized fee of 0.15% of the average daily net assets of each class of the Fund, to pay all expenses of the Fund as long as Rafferty is the adviser of the Fund, other than the following: management fees, distribution and/or service fees, acquired fund fees and expenses, taxes, leverage interest, dividends or interest on short positions, other interest expenses, brokerage commissions, expenses incurred
DIREXION ANNUAL REPORT
20
in connection with any merger or reorganization and extraordinary expenses such as litigation or other expenses outside the typical day-to-day operations of the Fund at least through September 1, 2019.
Distribution Expenses: Shares of the Fund are subject to an annual 12b-1 fee of up to 1.00% of the Fund's average daily net assets. The Class A shares of the Fund currently pays 0.25% of its average daily net assets. The Class C shares of the Fund currently pay a 12b-1 fee of 1.00% of the Fund's Class C average daily net assets. The Institutional Class shares of the Fund do not pay a 12b-1 fee. The Fund does not charge a shareholder service fee.
Rafferty Capital Markets, LLC (the "Distributor") serves as principal underwriter of the Fund and acts as the Fund's distributor in a continuous public offering of the Fund's shares. The Distributor is an affiliate of the Adviser.
5. VALUATION MEASUREMENTS
The Fund follows authoritative fair valuation accounting standards, which establish an authoritative definition of fair value and set out a hierarchy for measuring fair value. These standards require additional disclosures about the various inputs and valuation techniques used to develop the measurements of fair value and a discussion of changes in valuation techniques and related inputs during the period. These inputs are summarized in the three broad levels listed below:
Level 1 – Quoted prices in active markets for identical securities
Level 2 – Evaluated price based on other significant observable inputs (including quoted prices for similar securities, interest rates, prepayment speeds, credit risk, etc.)
Level 3 – Significant unobservable inputs including the Fund's own assumptions about the assumptions in determining fair value of investments
To the extent that equity securities are actively traded and valuation adjustments are not applied, they are categorized in Level 1 of the fair value hierarchy. If the market for a particular security is not active, and the mean price is used, these securities are categorized in Level 2 of the fair value hierarchy. Asset-backed securities, convertible bonds and corporate bonds are generally categorized in Level 2 of the fair value hierarchy. Investments in other mutual funds are categorized as Level 1 in the hierarchy.
The inputs or methodology used for valuing securities are not an indication of the risk associated with investing in those financial instruments.
The following is a summary of the inputs used to value the Fund's securities as of August 31, 2017:
| | | Level 1 | | Level 2 | | Level 3 | | Total | |
Common Stocks | | $ | 41,501,927 | | | $ | — | | | $ | — | | | $ | 41,501,927 | | |
Preferred Stocks | | | 22,623,227 | | | | 2,183,706 | | | | — | | | | 24,806,933 | | |
Corporate Bonds | | | — | | | | 13,373,370 | | | | — | | | | 13,373,370 | | |
Closed-End Funds | | | 11,403,452 | | | | — | | | | — | | | | 11,403,452 | | |
Master Limited Partnerships | | | 5,506,669 | | | | — | | | | — | | | | 5,506,669 | | |
Convertible Bonds | | | — | | | | 3,076,797 | | | | — | | | | 3,076,797 | | |
Foreign Government Bonds | | | — | | | | 1,143,319 | | | | — | | | | 1,143,319 | | |
For further detail on each asset class, see Schedule of Investments.
The Fund follows authoritative accounting standards, which require additional disclosure regarding fair value measurements. Specifically, these standards require reporting entities to disclose a) the input and valuation techniques used to measure fair value for both recurring and nonrecurring fair value measurements, for Level 2 or Level 3 positions, b) transfers between all levels (including Level 1 and Level 2) on a gross basis (i.e. transfers out must be disclosed separately from transfers in) as well as the reasons(s) for the transfers, and c) purchases and sales on a gross basis in the Level 3 rollforward rather than as one net number. Additionally, reporting entities are required to disclose quantitative information about unobservable inputs used in the fair value measurements categorized within Level 3 of the fair value hierarchy.
DIREXION ANNUAL REPORT
21
There were no transfers between Level 1 and Level 2 securities. There were no Level 3 securities held by the Fund during the year ended August 31, 2017. It is the Fund's policy to recognize transfers into Level 3 at the value as of the beginning of the period, if applicable.
6. ADDITIONAL DISCLOSURES ABOUT DERIVATIVE INSTRUMENTS
The Fund follows authoritative standards for the accounting of derivative instruments, which establish disclosure requirements for derivative instruments. These standards improve financial reporting for derivative instruments by requiring enhanced disclosures that enable investors to understand how and why a fund uses derivatives instruments, how a fund accounts for derivative instruments and how derivative instruments affect a fund's financial position and results of operations.
The Fund uses derivative instruments as part of its principal investment strategy to achieve its investment objective. For additional discussion on the risks associated with derivative instruments refer to Note 2. As of August 31, 2017, the Fund was not invested in written option contracts.
Transactions in derivative instruments during the year ended August 31, 2017, whose primary underlying risk exposure is equity risk, were as follows:
| | | | Liability Derivatives | |
Written options | | Net realized gain (loss)1 | | $ | 25,016 | | |
| | | Change in net unrealized
appreciation (depreciation)2 | | $ | (20,135 | ) | |
1 Statements of Operations location: Net realized gain (loss) on written options.
2 Statements of Operations location: Change in net unrealized appreciation (depreciation) on written options.
For the year ended August 31, 2017, the quarterly average gross notional amount of derivatives held by the Fund was $5,143, representing holdings in written options. The Fund utilizes these written options as a substitute for a comparable market position in the respective underlying security of the written options.
7. SUBSEQUENT EVENTS
The Fund paid an income distribution to Class A in the amount of $0.0387 per share, to the Institutional Class in the amount of $0.042 per share, and to Class C in the amount of $0.029 per share, with a record date of August 31, 2017 and ex-date and payable date of September 1, 2017.
The Fund paid an income distribution to Class A in the amount of $0.0387 per share, to the Institutional Class in the amount of $0.042 per share, and to Class C in the amount of $0.029 per share, with a record date of September 29, 2017 and ex-date and payable date of October 2, 2017.
Effective September 1, 2017, the Board of Trustees of the Trust approved a change in the expense structure for the Fund. The Fund's current Operating Services Agreement has been terminated and replaced with an Operating Expense Limitation Agreement under which the Adviser has contractually agreed to cap all or a portion of the expenses for the Fund based on an annual rate of 1.30% for Class A shares, 1.05% for Institutional Class shares and 2.05% for Class C Shares applied to the Fund's average daily net assets.
Any expense cap is subject to reimbursement by the Fund within the following three years only if overall expenses fall below the lesser of this percentage limitation and any percentage limitation in place at the time. This agreement may be terminated or revised at any time with the consent of the Board of Trustees.
DIREXION ANNUAL REPORT
22
8. RECENT ACCOUNTING PRONOUNCEMENT
In October 2016, the U.S. Securities and Exchange Commission adopted new rules and amended existing rules (together, "final rules") intended to modernize the reporting and disclosure of information by registered investment companies. In part, the final rules amend Regulation S-X and require standardized, enhanced disclosure about derivatives in investment company financial statements, as well as other amendments. The updates to Regulation S-X are effective August 1, 2017 and may result in additional disclosure relating to the presentation of derivatives and certain other financial instruments. These updates have been incorporated in the Funds' financial statements and have no impact on each of the Fund's net assets or results of operations.
DIREXION ANNUAL REPORT
23
Report of Independent Registered Public Accounting Firm
The Board of Trustees and Shareholders of Direxion Hilton Tactical Income Fund
We have audited the accompanying statement of assets and liabilities, including the schedule of investments, of Direxion Hilton Tactical Income Fund ((one of the series of the Direxion Funds) (the "Fund")) as of August 31, 2017, and the related statement of operations for the year then ended, the statements of changes in net assets for each of the two years in the period then ended and the financial highlights for each of the periods indicated therein. These financial statements and financial highlights are the responsibility of the Fund's management. Our responsibility is to express an opinion on these financial statements and financial highlights based on our audits.
We conducted our audits in accordance with the standards of the Public Company Accounting Oversight Board (United States). Those standards require that we plan and perform the audit to obtain reasonable assurance about whether the financial statements and financial highlights are free of material misstatement. We were not engaged to perform an audit of the Fund's internal control over financial reporting. Our audits included consideration of internal control over financial reporting as a basis for designing audit procedures that are appropriate in the circumstances, but not for the purpose of expressing an opinion on the effectiveness of the Fund's internal control over financial reporting. Accordingly, we express no such opinion. An audit also includes examining, on a test basis, evidence supporting the amounts and disclosures in the financial statements and financial highlights, assessing the accounting principles used and significant estimates made by management, and evaluating the overall financial statement presentation. Our procedures included confirmation of securities owned as of August 31, 2017, by correspondence with the custodian and brokers. We believe that our audits provide a reasonable basis for our opinion.
In our opinion, the financial statements and financial highlights referred to above present fairly, in all material respects, the financial position of Direxion Hilton Tactical Income Fund (one of the series of the Direxion Funds) at August 31, 2017, the results of its operations for the year then ended, the changes in its net assets for each of the two years in the period then ended and the financial highlights for each of the periods indicated therein, in conformity with U.S. generally accepted accounting principles.
Minneapolis, Minnesota
October 27, 2017
DIREXION ANNUAL REPORT
24
Supplemental Information (Unaudited)
For the year ended August 31, 2017, certain dividends paid by the Funds may be subject to a maximum rate of 15%, as provided for by the Jobs and Growth Tax Relief Reconciliation Act of 2003. The amount of dividends declared from ordinary income designated as qualified income was 68.79% for the Fund.
For corporate shareholders, the amount of ordinary income distributions qualifying for the corporate dividends received deduction for the year ended August 31, 2017 was 66.00% for the Fund.
The percentage of taxable ordinary income distributions that are designated as short-term capital gain distributions under Internal Revenue Section 871(k)(2)(C) was 0.00% for the Fund.
Householding
In an effort to decrease costs, the Funds intend to reduce the number of duplicate prospectuses, Annual and Semi-Annual Reports, proxy statements and other similar documents you receive by sending only one copy of each to those addresses shared by two or more accounts and to shareholders we reasonably believe are from the same family or household. Householding begins once you have signed your account application. After such time, if you would like to discontinue householding for your accounts, please call toll-free at (800) 851-0511 to request individual copies of these documents. Once the Funds receive notice to stop householding, we will begin sending individual copies thirty days after receiving your request. This policy does not apply to account statements.
DIREXION ANNUAL REPORT
25
Investment Advisory and Subadvisory Agreement Approvals (Unaudited)
Consistent with the Investment Company Act of 1940, as amended (the "1940 Act"), the Board of Trustees (the "Board") of the Direxion Funds (the "Trust") annually considers the renewal of the Investment Advisory Agreement (the "Advisory Agreement") between Rafferty Asset Management, LLC (the "Advisor") and the Trust and the Subadvisory Agreement (the "Subadvisory Agreement," and collectively, the "Agreements") between the Advisor and Hilton Capital Management, LLC (the "Subadvisor") on behalf of the Direxion Hilton Tactical Income Fund (the "Fund"), a series of the Trust.
At an in-person meeting held on August 24, 2017, following such consideration, the Board, including the trustees who are not "interested persons" as defined in the 1940 Act (the "Independent Trustees"), unanimously approved the renewal of the Advisory Agreement between the Trust and the Advisor and the Subadvisory Agreement between the Advisor and the Subadvisor, on behalf of the Fund. The Independent Trustees had previously considered information pertaining to the renewal of the Agreements outside the presence of the Advisor's representatives and Fund management in an executive session held on August 8, 2017. The Board, including the Independent Trustees, determined that the terms of the Agreements for the Fund were fair and reasonable and in the best interests of shareholders.
In considering whether to renew the Agreements, the Board requested, and the Advisor and Subadvisor provided, information that the Board, Advisor, and Subadvisor believed to be reasonably necessary to evaluate the Agreements. Among other information, the Board obtained and reviewed the following:
• Detailed information regarding the advisory services provided by the Advisor and Subadvisor for the Fund;
• The Advisor's and Subadvisor's Form ADV;
• Biographies of employees primarily responsible for providing investment advisory services;
• Information regarding each component of the contractual fee rates for the prior fiscal year;
• Information regarding advisory fees earned and waivers made by the Advisor in connection with providing services to the Fund;
• Performance information for prior periods;
• Comparative industry fee and performance data;
• Information regarding the financial condition of the Advisor and Subadvisor; and
• Information regarding how the Advisor monitors the Fund's compliance with regulatory requirements and Trust procedures.
The Board considered that they had also received information relevant to their consideration since the Fund's inception and, most recently, throughout the past year at regular Board meetings in connection with their oversight of the Fund, including information bearing on the Fund's service provider arrangements and performance results. In addition, the Board received a memorandum from counsel regarding the responsibilities of the Board with respect to the approval of the Agreements and participated in a question and answer session with representatives of the Advisor. The Board carefully evaluated the relevant information and the Independent Trustees were advised by legal counsel with respect to their deliberations.
The Board did not identify any particular information that was most relevant to its consideration to approve the Agreements and each Trustee may have afforded different weight to the various factors. The Board considered, among others, the following factors to the extent applicable: (1) the nature, extent, and quality of the services provided; (2) the investment performance of the Fund; (3) the profitability of the advisory business to the Advisor, and the profitability of the advisory business to the Subadvisor; (4) the extent to which economies of scale might be realized as the Fund grows; (5) whether fee levels reflect these economies of scale, if any, for the benefit of Fund shareholders; (6) comparisons of services and fees with contracts entered into by the Advisor and by the Subadvisor, with other clients (such as other institutional investors), if any; and (7) other benefits derived or anticipated to be derived and identified by the Advisor or Subadvisor from its relationship with the Fund.
Nature, Extent and Quality of Services Provided. The Board reviewed, among other things, the Advisor's and the Subadvisor's business, assets under management, financial resources and capitalization, quality and quantity of personnel,
DIREXION ANNUAL REPORT
26
Investment Advisory and Subadvisory Agreement Approvals (Unaudited)
experience, the variety and complexity of their investment strategies, brokerage practices, and the adequacy of their compliance systems and process. The Board reviewed the scope of services to be provided by the Advisor and Subadvisor under the Agreements and noted there would be no significant differences between the scope of services provided by the Advisor and the Subadvisor in the past year and those to be provided in the upcoming year. The Board also considered the Advisor's representations that it would continue to provide investment and related services that are of materially the same quality as the services that have been provided to the Fund in the past, and whether those services remain appropriate in scope and extent in light of the Fund's operations, the competitive landscape of the investment company business and investor needs. The Board focused on the quality of the Advisor's and Subadvisor's personnel and operations and the systems and processes required to manage the Fund effectively, and noted that these systems and processes may not be present at other investment advisers. In particular, the Board considered: (1) the Advisor's and Subadvisor's success in achieving the Fund's investment objective; (2) the size and experience of the Advisor's and Subadvisor's portfolio management staff; and (3) the portfolio management staff's credentials and expertise specific to the Fund's investment objective and strategies. The Board considered that the Advisor oversees all aspects of the operation of the Fund, including oversight of the Fund's service providers and Subadvisor, and provides compliance services to the Fund.
In considering the nature, extent and quality of the services to be provided under the Subadvisory Agreement by the Subadvisor, the Board noted that such services will include, but are not limited to, the following: (1) investing the Fund's assets consistent with the Fund's investment objective and policies; (2) determining the portfolio securities to be purchased, sold or otherwise disposed of and the timing of such transactions; (3) maintaining the required books and records for transactions affected by Subadvisor on behalf of the Fund; and (4) selecting broker-dealers to execute orders on behalf of the Fund. The Board also considered the Subadvisor's affiliation with the Advisor.
The Board considered that the Advisor oversees the operation of the Fund, including oversight of the Subadvisor and the Fund's other service providers, and provides compliance services to the Fund. With regard to compliance services in particular, the Board noted that it annually reviews each of the Advisor's and Subadvisor's compliance program as it pertains to the Fund. In addition, the Board noted that the Advisor conducts annual due diligence reviews of the Subadvisor's compliance program and reviews of the Fund's holdings and other operations.
Based on the Board's deliberations at the meeting, the Board, including the Independent Trustees, unanimously concluded that the nature, extent and quality of services provided by the Advisor and Subadvisor under the Agreements could benefit shareholders.
Comparison of Advisory Services and Fees. The Board considered the fairness and reasonableness of the investment advisory fee rate payable to the Advisor by the Fund and the subadvisory fee rate payable to the Subadvisor by the Advisor in light of the investment advisory services provided by both the Advisor and the Subadvisor. The Board reviewed information prepared the Advisor, using data provided by Morningstar, Inc. to compare the Fund's actual advisory fees, past operating service fees and future management service fees and expense limitation levels,, and gross and net total expenses with those of other funds with common key characteristics, such as asset size, investment objective or industry focus ("Peer Group"). The Board noted that to establish the Peer Group, the Advisor used the same methodology as in 2015 and 2016 and that this methodology was reviewed and recommended by an independent consultant retained by the Board in 2015to review and advise it on Peer Group construction.
The comparison reports provided to the Board included the advisory fee and net and gross total expense ratios, less any Rule 12b-1 fees and shareholder services fees for the Fund and each Peer Group fund. The Board considered that the Advisor had agreed to limit the total expenses of the Fund (subject to certain exclusions) for the next fiscal year by contractually agreeing to pay certain expenses of the Fund under a new Operating Expense Limitation Agreement. The Board noted that the Fund's Advisory fee rate and the net expense ratio less Rule 12b-1 fees was less than the Peer Group median and average for the same categories.
Based on its review, the Board determined that the proposed advisory fee rate under the Agreements was reasonable in light of all factors considered.
DIREXION ANNUAL REPORT
27
Investment Advisory and Subadvisory Agreement Approvals (Unaudited)
Performance of the Fund. The Board considered the performance information for the Fund and compared it to the returns of funds included in a peer summary and focused on the year-to-date and one-year performance of the Fund and the Peer Group. The Board utilized performance reports provided to the Board in anticipation of the meeting, as well as performance reports provided at regular Board meetings throughout the year. The Board evaluated the performance of the Fund relative to: (1) returns of its benchmark index for the year-to-date, one-year and three-year periods ended June 30, 2017; and (2) returns of the Peer Group for the year-to-date, one-year and three-year periods ended June 30, 2017. The Board noted the Fund's Class A shares outperformed the Peer Group median and average return for both the three-year period ended June 30, 2017. The Fund's Class A shares also outperformed the Fund's benchmark for the three-year period ended June 30, 2017. The Board noted that the same Peer Group was used to evaluate both performance and the advisory fees paid by the Fund.
Costs of Services Provided to the Fund and Profits Realized by the Advisor. The Board reviewed information about the profitability of the Advisor and Subadvisor based on the fee rates payable under the Agreements. This included a review of information regarding the direct revenue received by the Advisor and Subadvisor and ancillary revenue, if any, received by the Advisor, Subadvisor and/or their affiliates in connection with the services provided to the Fund by the Advisor and Subadvisor. The Board considered information regarding the Advisor's and Subadvisor's profit margin as reflected in profitability analyses, as well as information provided by the Advisor concerning the methodology used to allocate various expenses. The Board also considered the significant drivers of cost for the Advisor including, but not limited to, intellectual capital, regulatory compliance, and entrepreneurial risk and considered the costs that investors would likely incur if they independently sought to achieve the investment objective of the Fund. The Advisor also provided the Board a report on other investment advisors' profitability, which was compiled using publicly available information. However, the Board recognized that it is difficult to compare profitability among investment advisory contracts because the most useful comparative information generally is not publicly available. To the extent such information is available, it is affected by numerous factors, including the nature of a fund's shareholder base, the structure of the particular advisor, the types of funds it manages, its business mix, assumptions regarding allocations and the fact that publicly traded fund managers' operating profits and net income are typically reported net of distribution and marketing expenses.
Based on its review, the Board, including the Independent Trustees, determined that the profit to the Advisor and Subadvisor under the Agreements was not excessive in light of all factors considered.
Economies of Scale. The Board considered the absence of breakpoints in the Advisor's fee schedule and reviewed information regarding the extent to which economies of scale or other efficiencies may result from increases in the Fund's net assets. In light of the relatively small size of the Fund, the Board concluded that the Fund has not yet achieved sufficient asset levels to realize meaningful economies of scale. Based on these and other considerations, the Board determined that, in the exercise of its business judgment, breakpoints were not necessary at this time. The Board noted that it will continue to monitor fees and expenses as the Fund grows in size and assess whether fee breakpoints may be warranted.
Other Benefits. The Board considered any indirect or "fall-out" benefits that the Advisor or its affiliates may derive from their relationship to the Fund. Such benefits include the Advisor's ability to leverage its investment management personnel or infrastructure to manage other accounts. In addition, the Board considered that the Subadvisor benefits from increased recognition in the marketplace due to the co-branded Fund. In this regard, the Board noted that the Funds, immediately following their fiscal year end, would transition away from an operating services arrangement into a management services arrangement with an operating expense limitation arrangement, in which the Advisor would provide, and receive fees for providing, certain services historically provided by U.S. Bancorp Fund Services. The Board considered that, as a result of this transition the Funds would pay approximately the same amount in service fees, but the Advisor would retain a larger percentage of such service fees. Based on these and other considerations, the Board determined that, in the exercise of its business judgment, the benefits to the Advisor and Subadvisor were fair and reasonable.
Conclusion. Based on, but not limited to, the above considerations and determinations, the Board, including the Independent Trustees, determined that the Agreements for the Fund were fair and reasonable in light of the nature, extent and quality of the services to be performed, the fee rate to be paid, the Advisor's and Subadvisor's expenses and such other matters as the Board considered relevant in the exercise of its business judgment and that the continuation of the Agreements was in the best interests of the shareholders of the Fund. On this basis, the Board unanimously voted in favor of the continuance of the Agreements.
DIREXION ANNUAL REPORT
28
The business affairs of the Fund are managed by or under the direction of the Board of Trustees. Information pertaining to the Trustees and Officers of the Fund is set below. The report includes additional information about the Fund's Trustees and Officers and is available without charge, upon request by calling 1-800-851-0511.
Interested Trustees
Name, Address and
Age | | Position(s)
Held with
Fund | | Term of Office
and Length of
Time Served | | Principal Occupation(s)
During Past Five Years | | # of Portfolios
in Direxion
Family of
Investment
Companies
Overseen
by Trustee(3) | | Other Trusteeships/
Directorships Held by
Trustee During Past
Five Years | |
Daniel D. O'Neill(1)
Age: 49 | |
Chairman of the Board of Trustees | |
Lifetime of Trust until removal or resignation; Since 2014 | |
Managing Director of Rafferty, 1999-present. | | |
148 | | |
None. | |
Eric W. Falkeis(2)
Age: 43 | |
Trustee | |
Lifetime of Trust until removal or resignation; Since 2014 | |
Chief Operating Officer, since April 2014, Rafferty Asset Management, LLC; formerly, President Rafferty Asset Management, LLC, March 2013 – April 2014; formerly, Senior Vice President, USBFS, September 2007 – March 2013; Chief Financial Officer, USBFS, April 2006 – March 2013; Vice President, USBFS, 1997-2007; formerly, Chief Financial Officer, Quasar Distributors, LLC (2000-2003). | | |
148 | | |
Trustee,
Professionally
Managed Portfolios
(31 Funds). | |
Independent Trustees
Name, Address and
Age | | Position(s)
Held with
Fund | | Term of Office
and Length of
Time Served | | Principal Occupation(s)
During Past Five Years | | # of Portfolios
in Direxion
Family of
Investment
Companies
Overseen
by Trustee(3) | | Other Trusteeships/
Directorships Held by
Trustee During Past
Five Years | |
Gerald E. Shanley III
Age: 73 | |
Trustee | |
Lifetime of Trust until removal or resignation; Since 1997 | |
Retired, Since 2002; Business Consultant, 1985-present; Trustee of Trust Under Will of Charles S. Payson, 1987-present; C.P.A., 1979-present. | | |
148 | | |
None. | |
(1) Mr. O'Neill is affiliated with Rafferty. Mr. O'Neill is the Managing Director of Rafferty and owns a beneficial interest in Rafferty.
(2) Mr. Falkeis is affiliated with Rafferty. Mr. Falkeis is the Chief Operating Officer of Rafferty.
(3) The Direxion Family of Investment Companies consists of the Direxion Shares ETF Trust which, as of the date of this report, offers for sale to the public 87 of the 125 funds registered with the SEC, the Direxion Funds which, as of the date of this report, offers for sale to the public 17 of the 23 funds registered with the SEC and the Direxion Insurance Trust which, as of the date of this report, does not have any funds registered with the SEC.
DIREXION ANNUAL REPORT
29
Name, Address and
Age | | Position(s)
Held with
Fund | | Term of Office
and Length of
Time Served | | Principal Occupation(s)
During Past Five Years | | # of Portfolios
in Direxion
Family of
Investment
Companies
Overseen
by Trustee(1) | | Other Trusteeships/
Directorships Held by
Trustee During Past
Five Years | |
John A. Weisser
Age: 75 | |
Trustee | |
Lifetime of Trust until removal or resignation; Since 2007 | |
Retired, Since 1995; Salomon Brothers, Inc., 1971-1995, most recently as Managing Director. | |
148 | |
Director until December 2016, The MainStay Funds Trust, The MainStay Funds, MainStay VP Fund Series, Mainstay Defined Term Municipal Opportunities Fund; Private Advisors Alternative Strategy Fund; Private Advisors Alternative Strategies Master Fund. | |
David L. Driscoll
Age: 48 | |
Trustee | |
Lifetime of Trust until removal or resignation; Since 2014 | |
Partner, King Associates, LLP, since 2004; Board Advisor, University Common Real Estate, since 2012; Principal, Grey Oaks LLP since 2003; Member, Kendrick LLC, since 2006. | |
148 | |
None. | |
Jacob C. Gaffey
Age: 69 | |
Trustee | |
Lifetime of Trust until removal or resignation; Since 2014 | |
Managing Director of Loomis & Co. since 2012; Partner, Bay Capital Advisors, LLC 2008-2012. | |
148 | |
None. | |
(1) The Direxion Family of Investment Companies consists of the Direxion Shares ETF Trust which, as of the date of this report, offers for sale to the public 87 of the 125 funds registered with the SEC, the Direxion Funds which, as of the date of this report, offers for sale to the public 17 of the 23 funds registered with the SEC and the Direxion Insurance Trust which, as of the date of this report, does not have any funds registered with the SEC.
DIREXION ANNUAL REPORT
30
The officers of the Trust conduct and supervise its daily business. Unless otherwise noted, an individual's business address is 1301 Avenue of the Americas, 28th Floor, New York, New York 10019. As of the date of this report, the officers of the Trust, their ages, their business address and their principal occupations during the past five years are as follows:
Principal Officers of the Trust
Name, Address and
Age | | Position(s)
Held with
Fund | | Term of Office
and Length of
Time Served | | Principal Occupation(s)
During Past Five Years | | # of Portfolios
in Direxion
Family of
Investment
Companies
Overseen
by Trustee(3) | | Other Trusteeships/
Directorships Held by
Trustee During Past
Five Years | |
Daniel D. O'Neill(1)
Age: 49 | |
Chief Executive Officer and Chief Investment Officer | |
One Year; Since 2006 | |
Managing Director of Rafferty, 1999-present. | |
148 | |
N/A | |
Eric W. Falkeis(2)
Age: 43 | |
Principal Executive Officer | |
One Year; Since 2014 | |
Chief Operating Officer, since April 2014, Rafferty Asset Management, LLC; formerly, President, Rafferty Asset Management, LLC, March 2013 – April 2014; formerly, Senior Vice President, USBFS, September 2007 – March 2013; Chief Financial Officer, USBFS, April 2006 – March 2013; Vice President, USBFS, 1997-2007; formerly, Chief Financial Officer, Quasar Distributors, LLC (2000-2003). | |
148 | |
Trustee,
Professionally
Managed Portfolios
(31 Funds). | |
Patrick J. Rudnick
Age: 44 | |
Principal Financial Officer and Assistant Secretary | |
One Year; Since 2010 | |
Senior Vice President and Principal Financial Officer, Rafferty Asset Management, LLC, since March 2013; formerly Vice President, USBFS (2006-2013); formerly, Manager, PricewaterhouseCoopers LLP (1999-2006). | |
N/A | |
N/A | |
(1) Mr. O'Neill is affiliated with Rafferty. Mr. O'Neill is the Managing Director of Rafferty and owns a beneficial interest in Rafferty.
(2) Mr. Falkeis is affiliated with Rafferty. Mr. Falkeis is the Chief Operating Officer of Rafferty.
(3) The Direxion Family of Investment Companies consists of the Direxion Shares ETF Trust which, as of the date of this report, offers for sale to the public 87 of the 125 funds registered with the SEC, the Direxion Funds which, as of the date of this report, offers for sale to the public 17 of the 23 funds registered with the SEC and the Direxion Insurance Trust which, as of the date of this report, does not have any funds registered with the SEC.
DIREXION ANNUAL REPORT
31
Name, Address and
Age | | Position(s)
Held with
Fund | | Term of Office
and Length of
Time Served | | Principal Occupation(s)
During Past Five Years | | # of Portfolios
in Direxion
Family of
Investment
Companies
Overseen
by Trustee(1) | | Other Trusteeships/
Directorships Held by
Trustee During Past
Five Years | |
Angela Brickl
Age: 41 | |
Secretary | |
One Year;
Since 2011 | |
General Counsel, Rafferty Asset Management, LLC, since October 2010; formerly Chief Compliance Officer, Rafferty Asset Management, LLC (2012-2016). | |
N/A | |
N/A | |
Kent Barnes
Age: 48 | |
Chief Compliance Officer | |
One Year;
Since 2016 | |
Director of Compliance, since April 2016, Rafferty Asset Management, LLC; formerly, General Counsel – Alternative Investments, USBFS (2006-2016) | |
N/A | |
N/A | |
(1) The Direxion Family of Investment Companies consists of the Direxion Shares ETF Trust which, as of the date of this report, offers for sale to the public 87 of the 125 funds registered with the SEC, the Direxion Funds which, as of the date of this report, offers for sale to the public 17 of the 23 funds registered with the SEC and the Direxion Insurance Trust which, as of the date of this report, does not have any funds registered with the SEC.
DIREXION ANNUAL REPORT
32
THIS PAGE INTENTIONALLY LEFT BLANK
33
THIS PAGE INTENTIONALLY LEFT BLANK
34
At the Direxion Funds, we are committed to protecting your privacy. To open and service your Direxion accounts, we collect and maintain certain nonpublic personal information about you, such as your address, phone number, social security number, purchases, sales, account balances, bank account information and other personal financial information. We collect this information from the following sources:
• Account applications or other forms on which you provide information,
• Mail, e-mail, the telephone and our website, and
• Your transactions and account inquiries with us.
We safeguard the personal information that you have entrusted to us in the following ways:
• As a general policy, only those employees who maintain your account and respond to your requests for additional services have access to your account information.
• We maintain physical, electronic, and procedural safeguards to insure the security of your personal information and to prevent unauthorized access to your information.
We do not disclose any nonpublic personal information about you or our former shareholders to anyone, except as permitted or required by law. In the course of conducting business and maintaining your account we may share shareholder information, as allowed by law, with our affiliated companies and with other service providers, including financial intermediaries, custodians, transfer agents and marketing consultants. Those companies are contractually bound to use that information only for the services for which we hired them. They are not permitted to use or share our shareholders' nonpublic personal information for any other purpose. There also may be times when we provide information to federal, state or local authorities as required by law.
In the event that you hold fund shares of Direxion through a financial intermediary, including, but not limited to, a broker-dealer, bank, or trust company, the privacy policy of your financial intermediary would govern how your nonpublic personal information would be shared with nonaffiliated third parties.
For questions about our policy, please contact us at (800) 851-0511.
This page is not a part of the Annual Report.
DIREXION ANNUAL REPORT
Investment Advisor
Rafferty Asset Management, LLC
1301 Avenue of the Americas
28th Floor
New York, NY 10019
Sub-Advisor
Hilton Capital Management, LLC
1010 Franklin Avenue
Garden City, NY 11530
Administrator, Transfer Agent, Dividend Paying
Agent & Shareholding Servicing Agent
U.S. Bancorp Fund Services, LLC
P.O. Box 1993
Milwaukee, WI 53201-1993
Custodian
U.S. Bank, N.A.
1555 RiverCenter Dr., Suite 302
Milwaukee, WI 53212
Independent Registered Public Accounting Firm
Ernst & Young LLP
220 South Sixth Street
Minneapolis, MN 55402
Distributor
Rafferty Capital Markets, LLC
1010 Franklin Ave., 3rd Floor
Garden City, NY 11530
The Trust's Proxy Voting Policies are available without charge by calling 1-800-850-0511, or by accessing the SEC's website at www.sec.gov.
The actual voting records relating to portfolio securities during the most recent period ended June 30 is available without charge by calling 1-800-850-0511, or by accessing the SEC's website at www.sec.gov.
The Trust files complete schedules of portfolio holdings with SEC on Form N-Q. The Form N-Q is available without charge by calling 1-800-850-0511, or by accessing the SEC's website at www.sec.gov.
This report has been prepared for shareholders and may be distributed to others only if preceded or accompanied by a current prospectus.

1301 Avenue of the Americas (6th Avenue), 28th Floor | New York, New York 10019 | (800) 851-0511
www.direxioninvestments.com
Item 2. Code of Ethics.
The registrant has adopted a code of ethics that applies to the registrant’s principal executive officer and principal financial officer. The registrant has not made any amendments to its code of ethics during the period covered by this report. The registrant has not granted any waivers from any provisions of the code of ethics during the period covered by this report. A copy of the registrant’s Code of Ethics is filed herewith.
Item 3. Audit Committee Financial Expert.
The registrant’s board of trustees has determined that there is at least one audit committee financial expert serving on its audit committee. Gerald E. Shanley III is the “audit committee financial expert” and is considered to be “independent” as each term is defined in Item 3 of Form N-CSR.
Item 4. Principal Accountant Fees and Services.
The registrant has engaged its principal accountant to perform audit services, audit-related services, tax services and other services during the past fiscal year. “Audit services” refer to performing an audit of the registrant’s annual financial statements or services that are normally provided by the accountant in connection with statutory and regulatory filings or engagements for the fiscal year. “Audit-related services” refer to the assurance and related services by the principal accountant that are reasonably related to the performance of the audit. “Tax services” refer to professional services rendered by the principal accountant for tax compliance, tax advice, and tax planning, including assessment of ASC 740 for the Funds and additional tax research. There were no “Other services” provided by the principal accountant. The following table details the aggregate fees billed or expected to be billed for each of the last fiscal year for audit fees, audit-related fees, tax fees and other fees by the principal accountant. The table presents aggregate fees billed to the registrant and reflected in the financial statements of the report to shareholders.
| | FYE 8/31/2017 | | FYE 8/31/2016 | |
Audit Fees | | $ | 318,319 | | $ | 300,285 | |
Audit-Related Fees | | — | | — | |
Tax Fees | | $ | 83,625 | | $ | 90,610 | |
All Other Fees | | — | | — | |
The audit committee has adopted pre-approval policies and procedures that require the audit committee to pre-approve all audit and non-audit services of the registrant, including services provided to any entity affiliated with the registrant.
The percentages of fees billed by Ernst & Young LLP applicable to non-audit services pursuant to waiver of pre-approval requirement were as follows:
| | FYE 8/31/2017 | | FYE 8/31/2016 | |
Audit-Related Fees | | 0 | % | 0 | % |
Tax Fees | | 0 | % | 0 | % |
All Other Fees | | 0 | % | 0 | % |
All of the principal accountant’s hours spent on auditing the registrant’s financial statements were attributed to work performed by full-time permanent employees of the principal accountant. (If more than 50 percent of the accountant’s hours were spent to audit the registrant’s financial statements for the fiscal year, state how many hours were attributed to work performed by persons other than the principal accountant’s full-time, permanent employees.)
The following table indicates the non-audit fees, other than the tax services as noted above, billed or expected to be billed by the registrant’s accountant for services to the registrant and to the registrant’s investment adviser (and any other controlling entity, etc.—not sub-adviser) for the last year. The audit committee of the board of trustees has considered whether the provision of non-audit services that were rendered to the registrant’s investment adviser is compatible with maintaining the principal accountant’s independence and has concluded that the provision of such non-audit services by the accountant has not compromised the accountant’s independence.
Non-Audit Related Fees | | FYE 8/31/2017 | | FYE 8/31/2016 | |
Registrant | | None | | None | |
Registrant’s Investment Adviser | | None | | None | |
Item 5. Audit Committee of Listed Registrants.
Not applicable to registrants who are not listed issuers (as defined in Rule 10A-3 under the Securities Exchange Act of 1934).
Item 6. Schedule of Investments.
Schedule of Investments is included as part of the report to shareholders filed under Item 1 of this Form.
Item 7. Disclosure of Proxy Voting Policies and Procedures for Closed-End Management Investment Companies.
Not applicable to open-end investment companies.
Item 8. Portfolio Managers of Closed-End Management Investment Companies.
Not applicable to open-end investment companies.
Item 9. Purchases of Equity Securities by Closed-End Management Investment Company and Affiliated Purchasers.
Not applicable to open-end investment companies.
Item 10. Submission of Matters to a Vote of Security Holders.
There have been no material changes to the procedures by which shareholders may recommend nominees to the registrant’s board of directors/trustees.
Item 11. Controls and Procedures.
(a) The Registrant’s Principal Executive Officer and Principal Financial Officer have reviewed the Registrant’s disclosure controls and procedures (as defined in Rule 30a-3(c) under the
Investment Company Act of 1940 (the “Act”)) as of a date within 90 days of the filing of this report, as required by Rule 30a-3(b) under the Act and Rules 13a-15(b) or 15d-15(b) under the Securities Exchange Act of 1934. Based on their review, such officers have concluded that the disclosure controls and procedures are effective in ensuring that information required to be disclosed in this report is appropriately recorded, processed, summarized and reported and made known to them by others within the Registrant and by the Registrant’s service provider.
(b) There were no changes in the Registrant’s internal control over financial reporting (as defined in Rule 30a-3(d) under the Act) that occurred during the second fiscal quarter of the period covered by this report that has materially affected, or is reasonably likely to materially affect, the Registrant’s internal control over financial reporting.
Item 12. Exhibits.
(a) (1) Any code of ethics or amendment thereto, that is subject of the disclosure required by Item 2, to the extent that the registrant intends to satisfy Item 2 requirements through filing an exhibit. Filed herewith.
(2) Certifications pursuant to Section 302 of the Sarbanes-Oxley Act of 2002. Filed herewith.
(3) Any written solicitation to purchase securities under Rule 23c-1 under the Act sent or given during the period covered by the report by or on behalf of the registrant to 10 or more persons. Not applicable to open-end investment companies.
(b) Certification pursuant to Section 906 of the Sarbanes-Oxley Act of 2002. Furnished herewith.
SIGNATURES
Pursuant to the requirements of the Securities Exchange Act of 1934 and the Investment Company Act of 1940, the registrant has duly caused this report to be signed on its behalf by the undersigned, thereunto duly authorized.
(Registrant) | Direxion Funds |
| |
By (Signature and Title) | /s/ Eric W. Falkeis |
| Eric W. Falkeis, Principal Executive Officer |
| |
Date | November 1, 2017 |
| | | | | |
Pursuant to the requirements of the Securities Exchange Act of 1934 and the Investment Company Act of 1940, this report has been signed below by the following persons on behalf of the registrant and in the capacities and on the dates indicated.
By (Signature and Title) | /s/ Eric W. Falkeis |
| Eric W. Falkeis, Principal Executive Officer |
| |
Date | November 1, 2017 |
| |
By (Signature and Title) | /s/ Patrick J. Rudnick |
| Patrick J. Rudnick, Principal Financial Officer |
| |
Date | November 1, 2017 |
| | | | |

