Exhibit 13
Financial Highlights(a)
| | | | | | | | | | | | | | | | | | | |
Years Ended December 31 | | 2006 | | | 2005 | | | 2004 | | 2003 | | | 2002 | |
| (In thousands, except per share and employee data) | | | | | | | | | | | | | | |
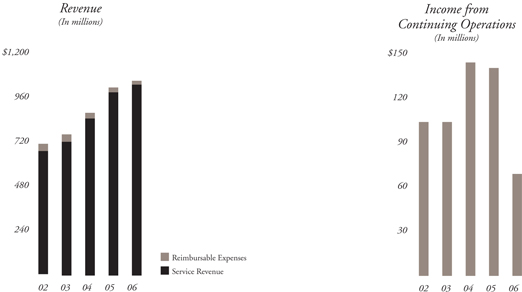
Service revenue | | $ | 1,032,114 | | | $ | 985,702 | | | $ | 847,258 | | $ | 720,657 | | | $ | 669,246 | |
Reimbursable expenses | | | 22,878 | | | | 28,056 | | | | 34,280 | | | 45,395 | | | | 38,520 | |
| | | | | | | | | | | | | | | | | | | |
Total revenue | | | 1,054,992 | | | | 1,013,758 | | | | 881,538 | | | 766,052 | | | | 707,766 | |
Operating income(b) | | | 128,316 | | | | 235,339 | | | | 235,085 | | | 172,157 | | | | 176,533 | |
Stock option expense included in operating income above | | | (15,401 | ) | | | — | | | | — | | | — | | | | — | |
Other charges included in operating income above(b) | | | (123,035 | ) | | | (28,773 | ) | | | — | | | (30,942 | ) | | | (7,342 | ) |
Income from continuing operations | | | 68,775 | | | | 139,524 | | | | 143,809 | | | 104,164 | | | | 103,982 | |
EPS from continuing operations, diluted | | | .81 | | | | 1.52 | | | | 1.58 | | | 1.16 | | | | 1.17 | |
Total assets | | | 1,346,092 | | | | 1,462,976 | | | | 1,287,476 | | | 1,021,284 | | | | 979,010 | |
Debt | | | 415,039 | | | | 130,057 | | | | 50,100 | | | 52,029 | | | | 182,446 | |
Total shareholders’ equity | | | 666,987 | | | | 1,020,874 | | | | 983,659 | | | 790,495 | | | | 622,607 | |
Employees (full-time equivalents) | | | 5,100 | | | | 5,000 | | | | 4,600 | | | 3,700 | | | | 4,400 | |
| | | | | | | | | | | | | | | | | | | |
| (a) | All financial information reflects the stock split paid in the form of a stock dividend effective June 6, 2002 and excludes the following discontinued operations: |
| | 1. | CP Commercial Specialists, sold on February 28, 2003, |
| | 2. | Priority Data Systems, sold on September 29, 2006, |
| | 3. | Bode Labs, EquiSearch and certain businesses in the Financial and Professional Services segment, all of which were held for sale and qualify as discontinued operations at December 31, 2006. |
| (b) | Operating income includes other charges that management excludes in its assessments of operating results. These charges for 2006 consist of approximately $117.6 million recorded for asset impairment charges, expenses related to the fraudulent data access, and severance and lease abandonment charges associated with the centralization of functions and consolidation of certain technology platforms. In addition, other charges include approximately $5.5 million of accelerated depreciation expense. |
ChoicePoint was formed in 1997 as a publicly-held company whose core business was providing support to the insurance industry. Since that time, we have grown steadily by extending the fundamental operating model of our insurance business into other markets. We employ more than 5,100 associates in five business segments: Insurance Services, Screening & Authentication Services, Financial and Professional Services, Government Services and Marketing Services. ChoicePoint is headquartered in the Atlanta suburb of Alpharetta, and its common stock trades on the New York Stock Exchange under the symbol CPS.
FORWARD-LOOKING STATEMENTS
This Annual Report to Shareholders contains forward-looking statements, and actual results could differ materially. Words or phrases such as “we expect,” “we anticipate,” or similar expressions are intended to identify forward-looking statements. Risks that could cause actual results to differ are set forth in the “Risk Factors” section and throughout ChoicePoint’s Annual Report on Form 10-K for the year ended December 31, 2006.
| | | | | | |
| CONTENTS | | | | | | |
Business Segment Overview | | Foldout | | Building Trust Through Transparency | | 17 |
To Our Fellow Shareholders | | 3 | | Board of Directors and Elected Officers | | 20 |
Growth: Building From Within | | 9 | | 2006 Financial Review | | 21 |
Capital Ideas for Shareholder Value | | 13 | | Shareholder Information | | 67 |
Board of Directors and Elected Officers
CHOICEPOINT 2006 ANNUAL REPORT

Left to right: Kenneth G. Langone, John B. McCoy, Dr. John J. Hamre, E. Renae Conley, Ray M. Robinson, Doug C. Curling, Derek V. Smith, M. Anne Szostak, Terrence Murray and Charles I. Story.
| | | | | | |
| Board of Directors | | | | | | |
| Derek V. Smith1* | | Kenneth G. Langone1, 5* | | Charles I. Story1, 2 |
| Chairman and Chief Executive Officer | | Chairman, President, and | | President |
| ChoicePoint Inc. | | Chief Executive Officer | | ECS Group, Inc. |
| Director Since 1997 | | Invemed Associates LLC | | Director Since 1997 |
| | Director Since 2000 | | |
| Doug C. Curling3 | | | | M. Anne Szostak4, 5 |
| President and Chief Operating Officer | | John B. McCoy2*, 4, 5 | | President and Chief Executive Officer |
| ChoicePoint Inc. | | Retired Chairman | | Szostak Partners, LLC |
| Director Since 2000 | | Bank One Corporation | | Director Since 2005 |
| | Director Since 2003 | | | | |
| E. Renae Conley2 | | | | | | |
| President and Chief Executive Officer | | Terrence Murray1, 4*, 5 | | | | |
| Entergy Louisiana, LLC | | Retired Chairman | | Board Committees |
| President and Chief Executive Officer | | FleetBoston | | 1. | | Executive Committee |
| Entergy Gulf States, Inc. – Louisiana | | Financial Corporation | | 2. | | Audit Committee |
| Director Since 2006 | | Director Since 2002 | | 3. | | Privacy & Public |
| | | | | | Responsibility Committee |
| Dr. John J. Hamre3*, 5 | | Ray M. Robinson3 | | 4. | | Management Compensation & |
| President and Chief Executive Officer | | Vice Chairman | | | | Benefits Committee |
| Center for Strategic and | | East Lake Community Foundation | | 5. | | Corporate Governance & |
| International Studies | | President Emeritus | | | | Nominating Committee |
| Director Since 2002 | | East Lake Golf Club | | *Denotes Committee Chairperson |
| | Director Since 2004 | | | | |
| Elected Officers | | | | | | |
| Derek V. Smith | | Steven W. Surbaugh | | Jeffery J. Glazer |
| Chairman and | | Chief Administrative Officer | | Senior Vice President |
| Chief Executive Officer | | Joined Company 2002 | | Joined Company 1997* |
| Joined Company 1997* | | | | | | |
| | David E. Trine | | David W. Davis |
| Doug C. Curling | | Chief Financial Officer | | Corporate Secretary and |
| President and Chief Operating Officer | | Joined Company 1997* | | Senior Vice President – |
| Joined Company 1997* | | | | Government Affairs |
| | Carol A. DiBattiste | | Joined Company 2003 |
| David T. Lee | | General Counsel and Chief Privacy Officer | | |
| Chief Business Officer | | Joined Company 2005 | | John M. Mongelli |
| Joined Company 1997* | | | | Treasurer and Vice President – |
| | | | Investor Relations |
| | | | Joined Company 2000 |
| | |
| | | | * Also member of the ChoicePoint senior management team prior to the Spinoff in 1997. |
20 CHOICEPOINT 2006 ANNUAL REPORT
ChoicePoint 2006 Annual Report
| | |
|
| Management’s Discussion and Analysis 22 |
|
| Management’s Report on Internal Control Over Financial Reporting 36 |
|
| Report of Independent Registered Public Accounting Firm on Internal Control Over Financial Reporting 37 |
|
| Report of Independent Registered Public Accounting Firm 38 |
|
| Consolidated Statements of Income 39 |
|
| Consolidated Balance Sheets 40 |
|
| Consolidated Statements of Shareholders’ Equity 41 |
|
| Consolidated Statements of Cash Flows 42 |
|
| Notes to Consolidated Financial Statements 43 |
| |
| Shareholder Information 67 | | |
ChoicePoint is committed to full disclosure of its accounting policies. Shareholders who have any questions or concerns about corporate policies, governance and/or disclosure are encouraged to contact the Company’s Investor Relations office. ChoicePoint has established a toll-free telephone number to receive complaints about accounting, internal accounting controls, auditing or other legitimate concerns anonymously. The whistleblower hotline number is 800-762-0056.
CHOICEPOINT 2006 ANNUAL REPORT21
Management’s Discussion and Analysis
CHOICEPOINT 2006 ANNUAL REPORT
Overview
During the past nine years, ChoicePoint Inc. (“ChoicePoint,” “we,” “our,” “us” or “the Company”) has transformed from a predominantly manually-driven and customer-focused asset base into the diversified, technology-driven, data-intensive business it is today. This transformation, coupled with focused execution, has enabled the Company to deliver strong growth in revenue, earnings and cash flows. Given our unique data, analytical and distribution capabilities, ChoicePoint is a leading provider of identification and credential verification services for making smarter decisions in a world challenged by increased risks. Serving the needs of business, government, non-profit organizations and individuals, ChoicePoint works to create a safer and more secure society through the responsible use of information while working diligently to protect personal privacy. For more information, visit the Company’s Web site at www.choicepoint.com.
Across our markets, we compete on data, analytics and distribution. A significant majority of our revenue streams are transaction-based, earning revenue each time our databases are accessed and further promoting the scalability of our products and services. The fundamentals that drive revenues are numerous and varied across and within our business segments. Generally, the Company’s primary growth drivers are new customers, increased penetration of new products, expansion into new markets and acquisitions.
On July 10, 2006, the Company announced its intent to divest various businesses, including its forensic DNA (“Bode”) and shareholder services businesses (“EquiSearch”), as a result of a company-wide strategic review. Additionally, on September 29, 2006, the Company announced the sale of Priority Data Systems, a comparative rating software solutions business (“Priority Data”), to the parent company of AMS Services. On October 24, 2006, the Company announced its intent to sell additional non-strategic businesses, later disclosed to be part of its public records operations, specifically the businesses that collect bankruptcy, lien and judgment (“BLJ”) records and provide them on a wholesale, bulk basis. For all periods presented, these businesses are presented as discontinued operations consistent with the Company’s decision to sell these businesses. Consequently, the results of these discontinued operations for such completed fiscal years are reflected in the Company’s Consolidated Statements of Income as discontinued operations. Cash flows related to discontinued operations are stated separately from cash flows related to continuing operations by category in the Consolidated Statements of Cash Flows. The results of Bode, EquiSearch, BLJ and Priority Data in all prior periods presented has been reclassified to conform to the 2006 classification. As a result, and unless specifically stated, all discussions regarding the years ended December 31, 2006, 2005, and 2004 reflect results only from continuing operations.
| | | | | | | | | | | | | | | |
(In thousands) | | 2006 | | Change | | | 2005 | | Change | | | 2004 |
Service revenue | | $ | 1,032,114 | | 5 | % | | $ | 985,702 | | 16 | % | | $ | 847,258 |
Reimbursable expenses per EITF 01-14 | | | 22,878 | | | | | | 28,056 | | | | | | 34,280 |
| | | | | | | | | | | | | | | |
Total revenue | | $ | 1,054,992 | | 4 | % | | $ | 1,013,758 | | 15 | % | | $ | 881,538 |
| | | | | | | | | | | | | | | |
22 CHOICEPOINT 2006 ANNUAL REPORT
Management’s Discussion and Analysis
CHOICEPOINT 2006 ANNUAL REPORT
Comparison of 2006 with 2005 Consolidated Results
Revenue
Total revenue grew 4%, or $41.2 million, to $1.1 billion in 2006. Service revenue, which excludes revenue from reimbursable expenses per EITF 01-14, (see Note 3 to the accompanying consolidated financial statements for the year ended December 31, 2006 (the “Consolidated Financial Statements”)), grew 5%, or $46.4 million, to $1.0 billion in 2006. Revenue growth in 2006 was driven by consistent growth in our Insurance Services products; strong performances in our background screening and vital records businesses in our Screening and Authentication Services segment; and improvements in our market penetration in the Government Services segment. Revenue growth is also attributable to six 2006 acquisitions and the full year impact of three 2005 acquisitions. This revenue growth was offset slightly by declines in our online public filings and real estate-related services in our Financial and Professional Services segment and the lower spending by larger clients in the mortgage industry in our Marketing Services segment. Internal revenue (which excludes $11.9 million of revenue from acquisitions) increased 4% from 2005 to 2006.
Cost of Service Revenue
In 2006, cost of service revenue was $541.9 million, or 53% of service revenue, as compared to $505.9 million, or 51% of service revenue in 2005. The increase in cost of service revenue as a percentage of service revenue is primarily due to the recognition of stock option expense of $4.3 million during 2006 as a result of the adoption of Statement of Financial Accounting Standards (“SFAS”) No. 123(R), Share-Based Payment (“SFAS 123(R)”), on January 1, 2006, and $5.5 million of accelerated depreciation expense recorded in the first quarter of 2006 in connection with the consolidation of certain technology platforms.
Selling, General and Administrative Expenses
Selling, general and administrative expenses (“SG&A”) increased to $244.3 million, or 24% of service revenue in 2006, from $215.6 million, or 22% of service revenue, in 2005. The increase in SG&A expenses as a percentage of service revenue is primarily due to the recognition of $11.1 million of additional stock option expense as a result of the adoption of SFAS 123(R) on January 1, 2006.
Other Operating Charges
Other operating charges include the following:
| | | | | | | | | |
| | | Year Ended December 31, |
(In thousands) | | 2006 | | 2005 | | 2004 |
Net Marketing Services segment impairment | | $ | 99,400 | | $ | — | | $ | — |
Other asset impairments | | | 10,720 | | | — | | | — |
Lease abandonment and severance | | | 3,943 | | | 1,472 | | | — |
Fraudulent data access related expense | | | 3,509 | | | 27,301 | | | — |
| | | | | | | | | |
Total other operating charges | | $ | 117,572 | | $ | 28,773 | | $ | — |
| | | | | | | | | |
Of total other operating charges recorded in 2006, $99.4 million represents the asset impairment charge related to the Company’s Marketing Services segment. In addition, as part of the previously announced strategic review, the Company recorded additional asset impairment, lease abandonment and severance charges totaling $14.7 million primarily related to the centralization of functions and consolidation of certain technology platforms. Also, an additional $3.5 million was recorded for legal fees and other professional fees associated with the fraudulent data access previously disclosed in the Company’s filings with the Securities and Exchange Commission (the “SEC”).
During 2005, the Company recorded other operating charges of $28.8 million that included a pre-tax charge of $8.0 million for the settlement reached with the Federal Trade Commission (“FTC”) in January 2006, $19.3 million for specific legal expenses and other professional fees related to the fraudulent data access and $1.5 million for lease abandonment charges related to the consolidation of two facilities. The terms of the settlement agreement with the FTC required a non-tax deductible civil penalty of $10 million, the establishment of a $5 million fund to be administered by the FTC for consumer redress initiatives, completion of certain one-time and ongoing customer credentialing activities, such as additional site visits, and undertaking additional obligations relating to information security. The settlement also requires ChoicePoint to obtain, every two years for the next 20 years, an assessment from a qualified, independent, third-party professional to ensure that its information security program meets the standards of the order.
The $8.0 million charge for the FTC settlement consisted of the $10.0 million civil penalty, the $5.0 million fund for consumer redress initiatives, a $4.0 million charge for additional obligations under the order, offset by the
CHOICEPOINT 2006 ANNUAL REPORT23
Management’s Discussion and Analysis
CHOICEPOINT 2006 ANNUAL REPORT
$11.0 million recovery of these fees received from the Company’s insurance carrier during the first quarter of 2006. A total of $28.7 million, which includes the $19.0 million for the FTC settlement, was recorded as an other current liability in the December 31, 2005 Consolidated Balance Sheet. The $11.0 million insurance receivable related to the FTC settlement was included in other current assets in the December 31, 2005 Consolidated Balance Sheet.
The Company’s management excludes other operating charges in its assessments of operating results.
Operating Income
Operating income decreased 45%, or $107.0 million, from $235.3 million in 2005 to $128.3 million in 2006. The decrease in operating income from 2005 to 2006 is primarily a result of the following:
| | • | | $ 88.8 million increase in other operating charges. See the discussion above in “Other Operating Charges” for additional information on these charges. |
| | • | | $ 15.4 million of stock option expense recognized as a result of the adoption of SFAS 123(R) on January 1, 2006. Of this amount, $4.3 million was recorded as cost of revenue and $11.1 million was recorded as SG&A. |
| | • | | $ 5.5 million of accelerated depreciation recorded in the first quarter of 2006. |
Operating income excluding these charges would have increased 1%. Operating income in our Insurance Services segment improved primarily due to increased revenues and product mix. The improvements in operating income in our Insurance Services segment were offset by decreases in operating income in the Financial and Professional Services segment, Government Services segment and Marketing Services segment. The Company continues to see margin pressures in commodity products in the Financial and Professional Services segment and the Government Services segment. Operating income in our Marketing Services segment decreased as a result of the decrease in revenue. Operating income in the Company’s Screening and Authentication Services segment remained relatively flat as strong margins in the smaller screening businesses were offset by weakened operating leverage in our Workplace Solutions business.
Interest Expense, Net
Interest expense increased $11.4 million to $15.9 million in 2006 from $4.5 million in 2005 due to higher average debt outstanding, primarily associated with the Company’s share buyback program and higher interest rates. Interest payments totaling $15.6 million were made in 2006. Future interest payments will depend on future levels of borrowings.
Income Taxes
ChoicePoint’s 2006 effective tax rate for continuing operations was 38.8%, a decrease from 39.6% in 2005. The higher effective tax rate in 2005 was primarily due to the previously discussed settlement with the FTC. The $10.0 million civil penalty paid to the FTC was non-deductible for federal income tax purposes. Tax payments totaling $75.2 million ($74.1 million net of refunds) were made in 2006. Future tax payments will depend on future operating results.
Discontinued Operations
As previously indicated, ChoicePoint announced plans to divest the Bode Labs, EquiSearch and BLJ businesses as a result of its company-wide strategic review. These businesses are reported as discontinued operations – removing Bode from the Government Services segment and EquiSearch and BLJ from the Financial and Professional Services segment. Additionally, on September 29, 2006, the Company sold Priority Data to the parent company of AMS Services. Consequently, the results of these discontinued operations are reflected in the Company’s Consolidated Statements of Income as discontinued operations. The results of these discontinued operations in prior years have been reclassified to conform to the 2006 classification. The following amounts have been segregated from continuing operations and are reflected as discontinued operations for the years ended December 31, 2006, 2005, and 2004, respectively:
| | | | | | | | | | | | |
(In thousands) | | 2006 | | | 2005 | | | 2004 | |
Total revenue | | $ | 38,183 | | | $ | 44,156 | | | $ | 37,175 | |
| | | |
Income (loss) from discontinued operations before income taxes | | $ | (74,791 | ) | | $ | 1,803 | | | $ | 6,693 | |
Income tax (provision) benefit | | | 22,938 | | | | (671 | ) | | | (2,547 | ) |
| | | | | | | | | | | | |
Income (loss) from discontinued operations, net of tax | | $ | (51,853 | ) | | $ | 1,132 | | | $ | 4,146 | |
| | | | | | | | | | | | |
24 CHOICEPOINT 2006 ANNUAL REPORT
Management’s Discussion and Analysis
CHOICEPOINT 2006 ANNUAL REPORT
During 2006, the Company recorded a non-cash charge of $67.5 million ($47.2 million after tax benefit) in discontinued operations to reduce the carrying value of goodwill and other assets related to these businesses in order to reflect the estimated net proceeds to be realized from selling these three businesses based on indicative bids received to date. Of this amount, $47.0 million related to the BLJ businesses, $10.6 million related to the Bode business and $9.9 million related to the EquiSearch business. Actual proceeds may vary from the estimated net proceeds. In addition, the Company recorded a $5.0 million ($3.1 million net of tax benefit) loss on the sale of Priority Data.
At December 31, 2006, the Company has classified certain assets and liabilities associated with the discontinued operations as assets of businesses held for sale and liabilities of businesses held for sale in the Consolidated Balance Sheets in accordance with the guidance in SFAS No. 144,Accounting for the Impairment or Disposal of Long-Lived Assets(“SFAS No.144”). A total of $31.5 million of assets have been classified as assets of businesses held for sale and $3.2 million of liabilities have been classified as liabilities of businesses held for sale on the December 31, 2006 Consolidated Balance Sheet.
Comparison of 2005 with 2004 Consolidated Results
Revenue
Total revenue grew 15%, or $132.2 million, to $1.0 billion in 2005. Service revenue, which excludes revenue from reimbursable expenses per EITF 01-14 (see Note 3 to the Consolidated Financial Statements), grew 16%, or $138.4 million, to $1.0 billion in 2005. Revenue growth in 2005 was driven by consistent growth in our Insurance Services products and strong performances in our background screening and vital records businesses in our Screening and Authentication Services segment. Revenue growth was also attributable to three 2005 acquisitions and the full year impact of the ten 2004 acquisitions. Internal revenue (which excludes $80.0 million of revenue from acquisitions) increased 6.9% from 2004 to 2005.
Cost of Revenue
In 2005, cost of revenue was $505.9 million, or 51% of service revenue, as compared to $437.1 million, or 52% of service revenue in 2004.
Selling, General and Administrative Expenses
SG&A increased to $215.6 million, or 22% of service revenue, from $175.1 million, or 21% of total revenue, in 2005.
Other Operating Charges
During 2005, the Company recorded other operating charges of $28.8 million. See the “Comparison of 2006 with 2005 Consolidated Results – Other Operating Charges” section for a detailed discussion of these charges. No other operating charges were recorded in 2004.
Operating Income
Operating income increased from $235.1 million in 2004 to $235.3 million in 2005. Included in 2005 operating income are other operating charges totaling $28.8 million related to the fraudulent data access and lease abandonment costs. Excluding these charges, operating income increased 12%. Operating income in our Insurance Services segment and Screening and Authentication Services segment improved primarily due to increased revenues and product mix. These increases were partially offset by decreases in the Financial and Professional Services segment and the Marketing Services segment. The decrease in operating income in the Financial and Professional Services segment was the result of the decision to discontinue the sale of certain of its public filing products in 2005. Marketing Services’ operating income declined as a result of revenue decreases and the change in product mix. Although revenues in Government Services grew as a result of the early 2005 acquisition of i2 Limited (“i2”), a Cambridge, U.K.-based international provider of visualization and link analysis software for intelligence, law enforcement, military and large commercial applications, operating income in Government Services remained relatively flat due to the continued integration efforts in this segment and revenue mix.
Interest Expense, net
Interest expense, net increased $1.6 million to $4.5 million in 2005 from $2.9 million in 2004 due to higher average debt outstanding and higher interest rates.
Income Taxes
ChoicePoint’s 2005 effective tax rate for continuing operations was 39.6%, an increase from 38.0% in 2004. This increase is due to additional tax expense in connection with a settlement with the FTC discussed above in “Other Operating Charges,” partially offset by a $700,000 benefit from a favorable outcome from the completion of a state tax audit during the second quarter of 2005. The additional tax expense associated with the fraudulent data access is a result of the non-deductibility of the $10.0 million civil penalty for federal income tax purposes.
CHOICEPOINT 2006 ANNUAL REPORT25
Management’s Discussion and Analysis
CHOICEPOINT 2006 ANNUAL REPORT
Financial Results by Segment
| | | | | | | | | | | | | | | | | | | | | |
| | | Year Ended December 31, 2006 | | | Year Ended December 31, 2005 | | | Year Ended
December 31, 2004 | |
(In thousands) | | Revenue | | Operating
Income | | | Revenue | | Operating
Income | | | Revenue | | Operating
Income | |
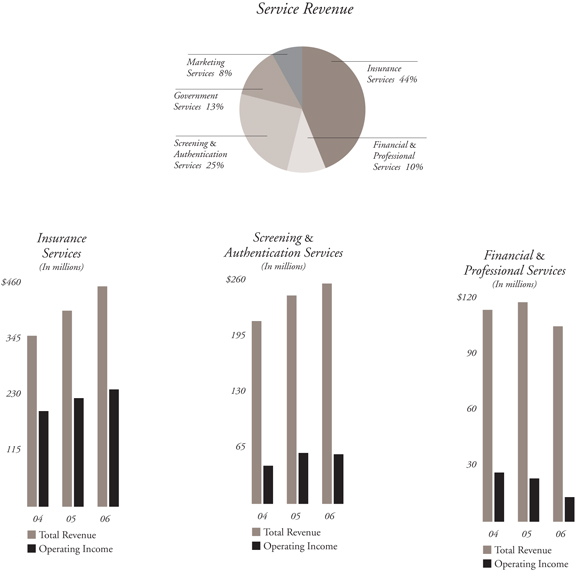
Insurance Services | | $ | 454,458 | | $ | 239,843 | | | $ | 402,853 | | $ | 221,670 | | | $ | 352,368 | | $ | 195,851 | |
Screening & Authentication Services | | | 257,088 | | | 57,096 | | | | 242,054 | | | 58,980 | | | | 212,706 | | | 43,715 | |
Financial & Professional Services | | | 105,041 | | | 12,998 | | | | 117,510 | | | 22,738 | | | | 113,768 | | | 26,338 | |
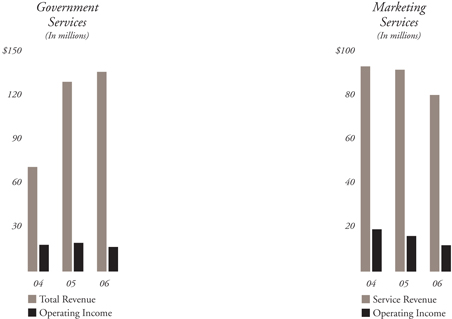
Government Services | | | 135,813 | | | 15,656 | | | | 129,358 | | | 19,326 | | | | 70,523 | | | 18,020 | |
Marketing Services | | | | | | | | | | | | | | | | | | | | | |
Marketing Services service revenue | | | 79,714 | | | 12,446 | | | | 91,529 | | | 15,899 | | | | 93,389 | | | 18,651 | |
Reimbursable expenses | | | 22,878 | | | — | | | | 28,056 | | | — | | | | 34,280 | | | — | |
| | | | | | | | | | | | | | | | | | | | | |
Marketing Services | | | 102,592 | | | 12,446 | | | | 119,585 | | | 15,899 | | | | 127,669 | | | 18,651 | |
Royalty | | | — | | | — | | | | 2,398 | | | 1,722 | | | | 4,504 | | | 2,062 | |
Corporate and shared | | | — | | | (71,287 | ) | | | — | | | (76,223 | ) | | | — | | | (69,552 | ) |
Accelerated depreciation | | | — | | | (5,463 | ) | | | — | | | — | | | | — | | | — | |
Stock option expense | | | — | | | (15,401 | ) | | | — | | | — | | | | — | | | — | |
Other operating charges | | | — | | | (117,572 | ) | | | — | | | (28,773 | ) | | | — | | | — | |
| | | | | | | | | | | | | | | | | | | | | |
Totals from continuing operations | | $ | 1,054,992 | | $ | 128,316 | | | $ | 1,013,758 | | $ | 235,339 | | | $ | 881,538 | | $ | 235,085 | |
| | | | | | | | | | | | | | | | | | | | | |
26 CHOICEPOINT 2006 ANNUAL REPORT
Management’s Discussion and Analysis
CHOICEPOINT 2006 ANNUAL REPORT
Insurance Services
Our Insurance Services segment, which provides data, analytics, software and business outsourcing services to property and casualty (“P&C”) insurance carriers, posted strong annual results, achieving 13% total revenue growth over 2005. For the past nine consecutive years, Insurance Services has provided the Company with double-digit revenue growth. In 2006, internal revenue growth, excluding $8.8 million of incremental acquisition revenue, was 11%, as we continued to grow our already strong base personal lines and underwriting business with recent product offerings such as Current Carrier® and motor vehicle record activity files, further addressing the needs of our customers by providing analytics to enhance their ability to underwrite policies and mitigate risk. Our claims products also produced strong growth, as we benefited from customer wins and the increased revenue from new product offerings. Our Insurity operations also had a strong year, as we continued to expand our service offerings and to help our customers solve complex business challenges and better focus on managing their businesses around their core competencies with industry-leading software solutions and business process outsourcing services offerings. Revenue growth at Insurity was led by a combination of customer wins and increased penetration of our outsourcing services. Operating income for Insurance Services in 2006 increased $18.2 million, or 8%, from 2005 due to increased revenue, offset slightly by the continued high level of investments in new product initiatives. Operating margins remained strong at 52.8% for 2006 compared to 55.0% for 2005.
Screening & Authentication Services
During 2006, the Screening & Authentication Services segment experienced growth in its background screenings and vital records businesses. This growth was diluted by the relatively flat revenue in our tenant screening and drug testing business. The segment delivered 6% total revenue growth and 5% internal revenue growth for the year ended December 31, 2006, compared to the year ended December 31, 2005, which excludes $1.9 million of incremental revenue from 2006 acquisitions and the full year impact of 2005 acquisitions. Businesses in this segment facilitated more than ten million screenings for our customers, including over half of the largest U.S.-based employers, identifying over 750,000 individuals with criminal records. These background screenings include approximately 1.5 million ChoicePoint-subsidized transactions for many of our nation’s leading non-profit organizations under our VolunteerSelectSM screening product. In addition to the WorkPlace Solutions business, the VitalChek® business delivered strong growth driven by the demand from businesses and not-for-profit organizations for authenticated birth certificates, the implementation of new database software services and a favorable travel environment. Screening & Authentication Services’ 2006 operating income decreased $1.9 million, or 3%, from 2005 due to certain fixed costs incurred by our Workplace Solutions business in order to service anticipated customer hiring activity that failed to materialize. Operating margins declined to 22.2% for 2006, compared to 24.4% for 2005 due to lower revenue growth in our higher margin automated products and lower retail hiring levels than anticipated late in 2006.
CHOICEPOINT 2006 ANNUAL REPORT27
Management’s Discussion and Analysis
CHOICEPOINT 2006 ANNUAL REPORT
Financial & Professional Services
The Financial & Professional Services segment, which provides public information to the banking, mortgage and professional services markets, posted a revenue decline of $12.5 million from $117.5 million in 2005 to $105.0 million in 2006. Total revenue and internal revenue decreased 11% from 2005. The decline in revenue is primarily attributable to the downturn in the mortgage services market and the impact of our 2005 decision to exit certain revenue markets to reduce our risk and strengthen the level of protection around the data we hold. Financial & Professional Services’ 2006 operating income decreased $9.7 million, primarily as a result of this decision. Operating margins decreased to 12.4% for 2006, compared to 19.3% for 2005, primarily due to revenue declines in our higher-margin products.
Government Services
In 2006, Government Services’ total revenue grew 5% from 2005 as the strong performance of our U.S. and international software business was tempered by a decline in our data business. Our early 2005 acquisition of i2, together with the 2005 acquisition of EzGov, Inc. and the 2004 acquisitions of The Templar Corporation and iMapData.com, Inc. (“iMap”), complements our strategy to grow this business to better serve our base law enforcement and government customers and to fuel future growth in new markets. The combination of our public filings data, iMap’s infrastructure data and mapping software and i2’s analytic platform enables us to offer end-to-end solutions to meet our customers’ needs. Excluding the 2006 incremental impact from 2005 acquisitions, which contributed $1.2 million of revenue in 2006, our internal revenue for Government Services increased 4% from 2005. Operating income decreased $3.7 million, or 19%, from 2005 to 2006 and operating margins decreased to 11.5% for 2006, compared to 14.9% for 2005, in each case primarily due to margin pressures in our data products and investments in new product initiatives.
Marketing Services
Marketing Services saw a continuation of negative revenue trends in 2006. In July 2006, we announced that we intended to divest the Marketing Services business and reclassified the results of the business as discontinued operations in the third quarter of 2006. After thoroughly evaluating our strategic opportunities, we decided to retain Marketing Services and reclassified its results as continuing operations in the fourth quarter of 2006. We continue to face a tough discretionary spending environment, particularly with some of our larger mortgage and consumer finance customers. For 2006, Marketing Services’ service revenue declined 13% from 2005 and total revenue (service revenue plus reimbursable expenses) declined 14% from the prior year. Due to the high fixed costs in the marketing business, full year operating income decreased $3.5 million, or 22%, from 2005 to 2006. Operating margin (as a percentage of service revenue) also declined to 15.6% for 2006 compared to 17.4% for 2005 (12.1% and 13.3% of total revenue, respectively) as a result of the aforementioned revenue decrease and high fixed costs.
Royalty
Royalty revenue from laser technology patents held by the Company was $2.4 million in 2005. There was no royalty revenue in 2006 due to the expiration of the patents underlying this revenue in May 2005.
Corporate Costs
Corporate and shared expenses totaled $71.3 million, or 6.9% of service revenue, for the year ended December 31, 2006, compared to $76.2 million, or 7.7% of service revenue in 2005. Corporate and shared expenses in 2005 included an expense of approximately $2.4 million for a specific litigation matter. The decrease in corporate costs as a percentage of service revenue in 2006 over 2005 is a result of lower incentive accruals and cost controls.
Cash Flow and Liquidity Review
Liquidity and Capital Resources
The Company’s sources of capital include, but are not limited to, cash and cash equivalents, cash from continuing operations, amounts available under the Credit Facility and the Receivables Facility (see Note 6 to the Consolidated Financial Statements), the issuance of equity securities and other external sources of funds. ChoicePoint’s short-term and long-term liquidity depends primarily upon its level of net income, working capital management (accounts receivable, accounts payable and accrued expenses) and bank borrowings. We believe that available short-term and long-term capital resources are sufficient to fund capital expenditures, working capital requirements, share repurchases under our stock buyback program (see Note 9 to the Consolidated Financial Statements), scheduled debt payments, and interest and tax obligations for the next twelve months. We currently estimate 2007 capital expenditures will be approximately $55 – $65 million for continuing operations. Any material variance of operating results could require us to obtain additional equity or debt financing. In addition, investments in business, products, or technologies could require us to obtain additional equity or debt financing. There can be no assurance that such financing will be available to us on favorable terms.
The Company uses cash generated to invest in growing the business, to fund acquisitions and operations, and to repurchase its common stock (See Note 9 to the Consolidated Financial Statements). Therefore, no cash dividends
28 CHOICEPOINT 2006 ANNUAL REPORT
Management’s Discussion and Analysis
CHOICEPOINT 2006 ANNUAL REPORT

have been paid, and we do not anticipate paying any cash dividends on our common stock in the near future. The Company may desire to obtain additional long-term financing for other strategic reasons. We anticipate no difficulty in obtaining long-term financing based on favorable experiences in the debt market in the recent past and the Company’s consistent high level of cash flow. ChoicePoint may also utilize an existing line of credit for overnight borrowings; however, no such borrowings were outstanding at either December 31, 2006 or 2005.
Net free cash flow (net cash provided by operating activities of continuing operations of $234.5 million less capital expenditures of $58.4 million) was $176.1 million for the year ended December 31, 2006. Excluding cash paid during 2006 related to the fraudulent data access of $10.2 million, net free cash flow would have been $186.3 million for the year ended December 31, 2006. Net free cash flow is not defined under generally accepted accounting principles in the United States (“GAAP”). Therefore, it should not be considered a substitute for income or cash flow data prepared in accordance with GAAP and may not be comparable to similarly titled measures used by other companies. It should not be inferred that the entire net free cash flow amount is available for discretionary expenditures. The Company believes net free cash flow is a useful measure of performance and its ability to generate cash.
On October 25, 2006, the Company entered into a $600 million unsecured credit facility (the “Credit Facility”) with a group of banks, which is expandable to $750 million, to refinance its existing facility, fund share repurchases and for general corporate purposes. At December 31, 2006, there was $315.0 million outstanding under the Credit Facility. In addition, approximately $10.0 million of the remaining availability under the Credit Facility was utilized for outstanding letters of credit. The average interest rate based on the terms of the Credit Facility was 5.8% at December 31, 2006. The Company had a $400.0 million unsecured multicurrency revolving credit facility (the “Former Credit Facility”) with a group of banks that was terminated effective October 25, 2006.
The Credit Facility contains covenants customary for facilities of this type. Such covenants include limitations, in certain circumstances, on the ability of the Company and its subsidiaries to (i) effect a change of control of the Company, (ii) incur certain types of liens, and (iii) transfer or sell assets. The Credit Facility also requires compliance with financial covenants, including (i) maximum funded debt to EBITDA and (ii) minimum interest coverage. We have maintained compliance with these financial covenants.
At December 31, 2005, there was $80.0 million outstanding under the Former Credit Facility.
In July 2001, to obtain an additional source of financing, the Company and certain of its subsidiaries entered into an agreement (the “Receivables Facility”) with a financial institution whereby it may sell on a continuous basis an undivided interest in all eligible trade accounts receivable subject to limitations up to $100 million. On December 1, 2006, the Receivables Facility was amended to increase the available borrowing capacity to $125.0 million. Net proceeds from the Receivables Facility were $100.0 million at December 31, 2006, and $50.0 million at December 31, 2005. The average interest rate based on the terms of the Receivables Facility was 5.6% at December 31, 2006.
At December 31, 2006, we had $300.0 million of available capacity under the above facilities.
Net debt (total debt of $415.0 million less cash of $26.6 million) was $388.4 million at December 31, 2006. Net debt to total capitalization (net debt of $388.4 million
CHOICEPOINT 2006 ANNUAL REPORT29
Management’s Discussion and Analysis
CHOICEPOINT 2006 ANNUAL REPORT
plus total shareholders’ equity of $667.0 million) was 36.8% at December 31, 2006. Net debt is not defined under GAAP. Management believes that net debt provides useful information regarding the level of the Company’s indebtedness by reflecting cash and investments that could be used to repay debt. It should not be considered a substitute for total debt data prepared in accordance with GAAP and may not be comparable to similarly titled measures used by other companies.
Contractual Obligations and the Related Future Payments
| | | | | | | | | | | | | | | |
| | | Payments Due During Period |
(In thousands) | | Total | | 2007 | | 2008–2009 | | 2010–2011 | | 2012 & after |
Long-term debt obligations | | $ | 415,000 | | $ | 100,000 | | $ | — | | $ | 315,000 | | $ | — |
Capital lease obligations | | | 39 | | | 11 | | | 28 | | | — | | | — |
Purchase obligations | | | 42,240 | | | 13,050 | | | 15,220 | | | 13,970 | | | — |
Postretirement benefit obligations(a) | | | 23,396 | | | 2,578 | | | 4,928 | | | 4,812 | | | 11,078 |
Operating lease obligations | | | 91,459 | | | 18,736 | | | 32,855 | | | 27,921 | | | 11,947 |
| | | | | | | | | | | | | | | |
Total contractual cash obligations | | $ | 572,134 | | $ | 134,375 | | $ | 53,031 | | $ | 361,703 | | $ | 23,025 |
| | | | | | | | | | | | | | | |
(a) | We made postretirement benefit payments of $2.2 million in 2006. For additional information regarding our postretirement benefit obligations, see Note 10 to the Consolidated Financial Statements. |
We have not included obligations under our deferred compensation plan in the contractual obligations table. Our deferred compensation plan is not required to be funded in advance, but rather is generally funded as benefits become payable to participants. We made deferred compensation payments of $1.0 million in 2006.
Off-Balance Sheet Arrangements
Synthetic Leases
During the second quarter of 2006, the Company entered into a $12.5 million synthetic lease agreement for a new property. Under this synthetic lease agreement, a third-party lessor purchased the property and paid for the build-out of the property completed in December 2006. The $12.5 million synthetic lease expires in 2012. On December 8, 2006, the Company entered into a $25.2 million synthetic lease agreement for our headquarters building and a $46.2 million synthetic lease agreement for our data center facility. These agreements replaced the existing agreements that were due to expire in 2007 and 2008. The new lease agreements expire in 2012, at which time we have the following options for each lease: renew the lease for an additional five years, purchase the building for the original cost or sell the property ourselves (remarket). If we elect to remarket the property, ChoicePoint must guarantee the lessor 80% to 85% of the original cost.
The Company has accounted for the synthetic leases as operating leases and has recorded rent expense. If the Company had elected to purchase the properties instead of entering into the synthetic leases, total assets and debt would have increased by $83.5 million at December 31, 2006 and $71.0 million at December 31, 2005 and we would have recorded additional depreciation expense related to the synthetic leases of approximately $2.7 million ($1.7 million after tax) for 2006, $2.4 million ($1.5 million after tax) for 2005, and $2.2 million ($1.4 million after tax) for 2004.
Derivatives
Derivative financial instruments at December 31, 2006 consist of four interest rate swap agreements entered into to reduce the impact of changes in a benchmark interest rate (LIBOR) on the Company’s LIBOR-based payments on the Company’s synthetic leases. These swap agreements, with a total notional amount of $67 million at December 31, 2006, involve the receipt of a variable rate and payment by ChoicePoint of fixed rates between 4.0% and 6.5%. ChoicePoint has designated all of these swaps as cash flow hedges of the variability in expected future interest payments on $67 million of the Company’s LIBOR-based payments under the synthetic leases discussed previously. Amounts currently due to or from interest rate swap counterparties are recorded as expense in the period in which they accrue. The Company does not enter into derivative financial instruments for trading or speculative purposes. As of December 31, 2006, the fair value of the outstanding interest rate swap agreements was an asset of $0.4 million, which has been recorded net of taxes in accumulated other comprehensive (loss) in accordance with SFAS No. 133,Accounting for Derivative Instruments and Hedging Activities, as amended by SFAS No. 138 (see Notes 3 and 6 to the Consolidated Financial Statements).
Interest Rate Risk Management
The Company is exposed to market risk from changes in interest rates. The information below summarizes the Company’s market risk associated with its debt obligations as of December 31, 2006. The information below should
30 CHOICEPOINT 2006 ANNUAL REPORT
Management’s Discussion and Analysis
CHOICEPOINT 2006 ANNUAL REPORT
be read in conjunction with Note 6 to the Consolidated Financial Statements.
At December 31, 2006, borrowings outstanding under the Credit Facility were $315.0 million and borrowings outstanding under the Receivables Facility were $100.0 million. These facilities bear interest at variable rates based on LIBOR plus applicable margins. At December 31, 2006, the Company’s interest rate was 5.8% under the Credit Facility and 5.6% under the Receivables Facility. At December 31, 2006, $83.5 million was outstanding under the Company’s synthetic lease agreements. The previously discussed swap agreements involve the exchange of variable rates for fixed rate payments and effectively fix the Company’s benchmark interest rate on $67 million of its synthetic leases at approximately 5.4% through August 2007, the expiration date of the swap agreements.
Based on the Company’s overall interest rate exposure at December 31, 2006, a one percent change in interest rates would result in a change in annual pretax interest expense of approximately $4.3 million based on the Company’s current level of borrowings.
Foreign Currency Exchange Rate Risk
The majority of the Company’s revenue, expense and capital expenditure activities are transacted in U.S. dollars. However, the Company does transact business in other currencies, primarily the British pound. The Company’s operations in the United Kingdom and other foreign countries represented an aggregate of approximately 4% of its consolidated revenues from continuing operations during the year ended December 31, 2006, and approximately 9% of consolidated long-lived assets at December 31, 2006.
The Company is required to translate, or express in U.S. dollars, the assets and liabilities of its foreign subsidiaries that are denominated or measured in foreign currencies at the applicable year-end rate of exchange on the Company’s Consolidated Balance Sheets. The Company records the resulting translation adjustment, and gains and losses resulting from the translation of intercompany balances of a long-term investment nature, as components of its shareholders’ equity. Other immaterial foreign currency transaction gains and losses are recorded in the Company’s Consolidated Statements of Income. The Company has not hedged translational foreign currency exposure.
For the year ended December 31, 2006, a 10% fluctuation in the exchange rate between the U.S. dollar and the British pound would result in a change in revenues of $3.2 million, and a change in net income of $0.7 million.
Summary of Cash Activities
Net cash provided by operating activities of continuing operations for the year ended December 31, was $234.6 million for 2006, $247.6 million for 2005 and $240.2 million for 2004. Net cash used in investing activities of continuing operations for the year ended December 31, was $99.4 million for 2006, $184.6 million for 2005 and $281.0 million for 2004. Net cash used in financing activities of continuing operations for the year ended December 31, was $123.8 million for 2006 and $36.3 million for 2005 and net cash provided by financing activities of continuing operations for the year ended December 31, 2004 was $21.4 million.
2006 vs. 2005
The net change in operating assets and liabilities was a decrease of $62.5 million for the year ended December 31, 2006, as compared to the impact for the year ended December 31, 2005, primarily as a result of increases in deferred taxes offset partially by increased accounts receivable in 2006 as compared to 2005. Our accounts receivable increased by $24.7 million from December 31, 2005 to December 31, 2006, while total revenue increased 4%, from the year ended December 31, 2005 to the year ended December 31, 2006. Net cash provided by operating activities for the year ended December 31, 2005 includes the $15.9 million tax benefit of stock options exercised. Effective January 1, 2006, the tax benefit of stock options exercised is included in financing activities under SFAS 123(R). Net cash provided by operating activities of discontinued operations was $3.9 million and $4.3 million for the years ended December 31, 2006 and 2005, respectively.
Net cash used in investing activities of $99.4 million in 2006 and $184.6 million in 2005 includes the acquisition of six entities in 2006 and the acquisition of three entities and a minority investment in 2005 to further capitalize on investment opportunities to build our business model, to expand our offerings to new markets and to develop new products (see Note 4 to the Consolidated Financial Statements). Cash used for investing activities included capital expenditures of $58.4 million and $61.2 million for the years ended December 31, 2006 and 2005, respectively. Net cash used in investing activities by the discontinued operations totaled $10.7 million and $10.5 million for the years ended December 31, 2006 and 2005, respectively. Net cash used in financing activities includes $427.2 million and $125.6 million of share repurchases under the stock buyback program (see Note 9 to the Consolidated Financial Statements) during the years ended December 31, 2006 and 2005, respectively. Net cash used in financing activities also includes $285.0 million
CHOICEPOINT 2006 ANNUAL REPORT31
Management’s Discussion and Analysis
CHOICEPOINT 2006 ANNUAL REPORT
and $80.0 million of net borrowings to fund the share repurchases and aforementioned acquisitions during the years ended December 31, 2006 and 2005, respectively. Net cash used in financing activities for the year ended December 31, 2006, includes $3.2 million of cash provided from the tax benefit from stock options exercised. For 2005, the tax benefit from stock option exercises is classified as a cash flow from operating activities in the Consolidated Statements of Cash Flows.
2005 vs. 2004
The net change in operating assets and liabilities was a decrease of $5.9 million in 2005, as compared to the impact for the year ended December 31, 2004, primarily as a result of increases in our current liabilities, offset partially by increased accounts receivable in 2005 as compared to 2004. Our increase in current liabilities was due primarily to the settlement with the FTC (see Note 12 to the Consolidated Financial Statements) and related costs, additional reserves on specific litigation matters, increased operational costs related to increased revenues and changes in income taxes payable due to timing of estimated tax payments. Our accounts receivable increased by $9.7 million, from December 31, 2004 to December 31, 2005, while revenue increased $132.2 million, or 15%, from the year ended December 31, 2004 to the year ended December 31, 2005.
Net cash provided by operating activities of discontinued operations was $4.3 million and $8.4 million for the years ended December 31, 2005 and 2004, respectively. Net cash used in investing activities by the discontinued operations totaled $10.5 million and $10.8 million for the years ended December 31, 2005 and 2004, respectively.
Net cash used in investing activities of $184.6 million in 2005 and $281.0 million in 2004 includes the acquisition of three entities and a minority investment in 2005 and ten entities in 2004. Cash used for investing activities included capital expenditures of $61.2 million and $55.3 million for the years ended December 31, 2005 and 2004, respectively. Net cash used in investing activities for the year ended December 31, 2004 includes $3.5 million of proceeds from the sale of CPCS.
Net cash used in financing activities for the year ended December 31, 2005, includes $125.6 million of share repurchases under the stock buyback program (see Note 9 to the Consolidated Financial Statements). Net cash used in financing activities in 2005 also includes $80.0 million of net borrowings to fund the share repurchases and aforementioned acquisitions.
New Accounting Pronouncements
The Company adopted SFAS 123(R) effective January 1, 2006 using the modified prospective transition method. Under this transition method, compensation cost was recognized after adoption for all share-based payments granted prior to, but not yet vested as of January 1, 2006, and all share-based payments granted subsequent to January 1, 2006. As a result of adopting SFAS 123(R), the Company’s income before income taxes and net income (loss) for the year ended December 31, 2006, were $15.4 million and $12.3 million lower, respectively, than if the Company had continued to account for share-based compensation under Accounting Principles Board Opinion No. 25. SFAS 123(R) also requires that the benefits of tax deductions in excess of recognized compensation cost be reported as a financing cash flow, rather than as an operating cash flow as required under prior guidance. This requirement reduced net operating cash flows in the amount of $3.2 million for the year ended December 31, 2006. See Note 8 to the Consolidated Financial Statements for additional information on the adoption of SFAS 123(R).
In September 2006, the Financial Accounting Standards Board (“FASB”) issued SFAS No. 158, “Employers’ Accounting for Defined Benefit Pension and Other Postretirement Plans, an amendment of FASB Statements No. 87, 88, 106 and 132(R)” (“SFAS 158”), which requires recognition in the Statements of Financial Position of the over- or under-funded status of defined pension and other postretirement plans, measured as the difference between the fair value of plan assets and the accumulated benefit obligation for other postretirement benefit plans, with a corresponding adjustment to accumulated other comprehensive income, net of tax. The Company adopted the recognition and disclosure provisions of SFAS 158 as of December 31, 2006. The adjustment to accumulated other comprehensive income at adoption of $5.5 million ($3.4 million net of tax) represents the net unrecognized actuarial gains and unrecognized prior service credit. There was no impact on results of operations or cash flows. In addition, SFAS 158 did not have an effect on the Company’s consolidated financial condition at December 31, 2005 or 2004. See Note 10 to the Consolidated Financial Statements for additional information on the adoption of SFAS 158.
In September 2006, the SEC issued Staff Accounting Bulletin No. 108,Considering the Effects of Prior Year Misstatements when Quantifying Misstatements in Current Year Financial Statements (“SAB 108”). SAB 108 provides interpretive guidance on how the effects of the carryover or reversal of prior year misstatements should be considered in quantifying a current year misstatement.
32 CHOICEPOINT 2006 ANNUAL REPORT
Management’s Discussion and Analysis
CHOICEPOINT 2006 ANNUAL REPORT
The SEC staff believes that registrants should quantify errors using both the balance sheet and income statement approach when quantifying a misstatement. The guidance provides for a one-time cumulative effect adjustment to correct for misstatements for errors that were not deemed material under a company’s prior approach but are material under the SAB 108 approach. SAB 108 is effective for the Company’s fiscal year ending December 31, 2006. The adoption of SAB 108 had no effect on the results of operations or financial position of the Company.
In July 2006, the FASB issued FASB Interpretation No. 48,Accounting for Uncertainty in Income Taxes (“FIN 48”). The interpretation clarifies the accounting for uncertainty in income taxes recognized in a company’s financial statements in accordance with SFAS No. 109,Accounting for Income Taxes. Specifically, the pronouncement prescribes a recognition threshold and a measurement attribute for the financial statement recognition and measurement of a tax position taken or expected to be taken in a tax return. The interpretation also provides guidance on the related derecognition, classification, interest and penalties, accounting for interim periods, disclosure and transition of uncertain tax positions. This interpretation was effective for the Company on January 1, 2007. The Company is currently evaluating the impact this new standard will have on its future results of operations and financial position.
In September 2006, the FASB issued SFAS No. 157,Fair Value Measurements (“SFAS 157”), which defines fair value, establishes a framework for measuring fair value in accordance with GAAP, and expands disclosures about fair value measurements. SFAS 157 applies where other accounting pronouncements require or permit fair value measurements; it does not require any new fair value measurements under GAAP. SFAS 157 is effective for the Company on January 1, 2007. The effects of adoption will be determined by the types of instruments carried at fair value in the Company’s financial statements at the time of adoption as well as the method utilized to determine their fair values prior to adoption. Based on the Company’s current use of fair value measurements, SFAS 157 is not expected to have a material effect on the results of operations or financial position of the Company.
Critical Accounting Policies
The Consolidated Financial Statements are prepared in accordance with GAAP, which require the Company to make estimates and assumptions which may be revised over time as new information and regulations become available. The Company believes that of its significant accounting policies (see Note 3 to the Consolidated Financial Statements), the following may involve a higher degree of judgment and complexity:
Purchase Price Allocation
Over its history, the Company’s growth has been partly driven by acquisitions. The application of the purchase method of accounting requires companies to assign values to acquired assets and liabilities, including intangible assets acquired based on their fair value. The determination of fair value for acquired assets, particularly intangible assets, requires a high degree of judgment, and estimates often involve significant subjectivity due to the lack of transparent market data or listed market prices. The Company generally uses internal evaluations in determining the fair value of assets acquired and liabilities assumed; however, the use of different valuation models or assumptions could result in different amounts of goodwill and other acquisition intangible assets and different lives for amortizable intangible assets. As of December 31, 2006, certain of our 2006 purchase price allocations were based on preliminary estimates which may be revised in future periods as estimates and assumptions are finalized (see Note 4 to the Consolidated Financial Statements). The Company does not anticipate that these revisions would be significant to the financial statements taken as a whole.
Impairment Charges
SFAS No. 142,Goodwill and Other Intangible Assets, requires the testing of intangible assets with indefinite lives and goodwill for impairment at least annually (see Note 3 to the Consolidated Financial Statements). In assessing the recoverability of these intangible assets, the Company must make assumptions regarding the estimated discounted future cash flows to determine the estimated fair value of the respective assets. These assumptions may change in the future due to economic conditions or in connection with the sale or integration of the Company’s business units, at which time ChoicePoint may be required to record impairment charges for these assets. The Company completed its last annual goodwill impairment review as of October 31, 2006 and no additional impairment was indicated as a result of this review. Assuming a 10% reduction in estimated annual cash flows in the 2006 annual impairment tests, the Company would have recorded impairment charges of approximately $6 million.
The Company is required to asses the other acquired intangible assets, such as purchased software, customer relationships and non-compete agreements, and tangible long-lived assets, such as property, plant and equipment, for impairment whenever indicators of impairment exist in accordance with SFAS No. 144. Management uses
CHOICEPOINT 2006 ANNUAL REPORT33
Management’s Discussion and Analysis
CHOICEPOINT 2006 ANNUAL REPORT
measurable operating performance criteria as well as qualitative measures to determine whether an indicator of impairment exists. If an indicator of impairment exists, the Company reviews and reevaluates the assumptions used, which are primarily identified from the Company’s budget and longer-term strategic plan, for assessing the recoverability of such assets. If the carrying amount of an asset is not recoverable, based upon the expected undiscounted future cash flows of the asset, an impairment loss equal to the excess of the carrying amount over the estimated fair value of the asset is recorded. Also, in connection with selling and integrating certain business operations, the Company has historically recorded asset impairment charges for property, equipment, data and software assets that will no longer be used. Inherent in the assumptions used in impairment analyses are certain significant management judgments and estimates, such as future revenue growth, future operating margins, and future undiscounted cash flows. The Company periodically reviews and reevaluates these assumptions and adjusts them as necessary.
In 2006, the Company recorded other operating charges of $110.1 million ($66.7 million net of taxes) to recognize asset impairments related to continuing operations (see Note 12 to the Consolidated Financial Statements). The Company recorded other operating charges of $67.5 million ($47.2 million net of taxes) related to discontinued operations (see Note 5 to the Consolidated Financial Statements) to reduce the carrying value of goodwill and other assets to reflect the estimated net proceeds which may be realized from selling these businesses.
Software and Databases Developed for Internal Use
As discussed in Note 3 to the Consolidated Financial Statements, the Company capitalizes certain direct costs incurred in the development of internal use software and databases. Amortization of such costs as cost of service revenue is computed on a straight-line basis generally over three to five years. The Company evaluates the recoverability of capitalized costs periodically or as changes in circumstances suggest a possible impairment may exist in accordance with SFAS No. 144. Primarily in connection with the centralization of functions and consolidation of certain technology platforms, capitalized costs, including data purchases, were written down by $8.2 million in 2006 and are included in the impairment charges of $110.1 million in 2006 discussed above. Amortization of capitalized software and database costs, including hardware and data purchases, amounted to $17.8 million in 2006, $13.9 million in 2005, and $14.1 million in 2004.
Postretirement Benefit Obligations
In connection with developing the Company’s projected liabilities for postretirement benefits, management is required to make estimates and assumptions that affect the reported amounts of the liability as of the date of the financial statements and the amount of expense recognized during the period. The liability is developed based on currently available information, estimates of future trends and actuarial assumptions including a discount rate of 5.71% and 5.50% and an initial health care cost trend rate of approximately 9.33% and 10.33% as of December 31, 2006 and 2005, respectively. A 0.25% decrease or increase in the discount rate (to 5.46% or 5.96%) would result in a change in the liability of approximately $400,000. Actual results could differ from these estimates. See Note 10 to the Consolidated Financial Statements for a discussion of the impact of changes in health care cost trend rates.
Revenue Recognition
Certain of the Company’s revenues are accounted for under the percentage of completion method and some of its software revenues are allocated to each element of a transaction based upon its fair value as determined by vendor specific objective evidence. The Company estimates the percentage of completion on contracts and determines the software revenue allocation method based on assumptions and estimates that require judgment. Changes in estimates to complete and revisions to the fair value used in the allocation of software revenue elements could result in a change in the timing of revenue recognition. Management believes its method and related assumptions, which have been consistently applied, to be reasonable (see Note 3 to the Consolidated Financial Statements).
Stock-Based Compensation
Effective January 1, 2006, the Company adopted SFAS 123(R)’s fair value method of measurement for all share-based payment transactions with employees using its modified prospective transition method. Under this transition method, compensation cost was recognized after adoption for all share-based payments granted prior to, but not yet vested as of January 1, 2006, and all share-based payments granted subsequent to January 1, 2006. As a result of adopting SFAS 123(R) on January 1, 2006, the Company’s income before income taxes and net income (loss) for the
34 CHOICEPOINT 2006 ANNUAL REPORT
Management’s Discussion and Analysis
CHOICEPOINT 2006 ANNUAL REPORT
year ended December 31, 2006, were $15.4 million and $12.3 million lower, respectively, than if the Company had continued to account for share-based compensation under Accounting Principles Board Opinion No. 25. Basic and diluted earnings per share from continuing operations for the year ended December 31, 2006 would have been $0.35 and $0.34, respectively, if the Company had not adopted SFAS 123(R), compared to reported basic and diluted earnings per share from continuing operations of $0.21 and $0.20, respectively. As of December 31, 2006, there was approximately $6.7 million in total unrecognized compensation cost related to nonvested stock, $9.2 million related to deferred shares, and $2.1 million related to share equivalent units. That cost is expected to be recognized over a weighted average period of 2.0 years for nonvested stock, 3.3 years for deferred shares, and 1.8 years for share equivalent units. SFAS 123(R) also requires that the benefits of tax deductions in excess of recognized compensation cost be reported as a financing cash flow, rather than as an operating cash flow as required under prior guidance. This requirement reduced net operating cash flows in the amount of $3.2 million for the year ended December 31, 2006. Management judgments and assumptions related to volatility, the expected term and the forfeiture rate are made in connection with the calculation of stock compensation expense. The Company periodically reviews all assumptions used in its stock option pricing model. Changes in these assumptions for future grants could have a significant impact on the amount of stock-based compensation expense.
Forward-Looking Statements
Certain written and oral statements made by or on behalf of the Company may constitute “forward-looking statements” as defined under the Private Securities Litigation Reform Act of 1995. Words or phrases such as “should result,” “are expected to,” “we anticipate,” “we estimate,” “we project,” or similar expressions are intended to identify forward-looking statements. These statements are subject to certain risks and uncertainties that could cause actual results to differ materially from those expressed in any forward-looking statements. These risks and uncertainties include, but are not limited to, the following important factors: the results of our ongoing review of fraudulent data access and other events, the impact of our decision to discontinue certain services, the results of our re-credentialing of customer accounts, the results of any litigation or government proceedings, the implementation of plans to divest various businesses resulting from our company-wide strategic review including unanticipated losses realized in connection with any such sales, demand for the Company’s services, product development, maintaining acceptable margins, maintaining our data supply, maintaining secure systems including personal privacy systems, ability to minimize system interruptions, ability to control costs, the impact of federal, state and local regulatory requirements on the Company’s business, specifically the direct marketing and public filings markets, privacy matters and any federal or state legislative responses to identify theft concerns, the impact of competition and customer consolidations, ability to continue our long-term business strategy including growth through acquisition, ability to attract and retain qualified personnel, and the uncertainty of economic conditions in general. Additional information concerning these and other risks and uncertainties is contained in the Company’s filings with the Securities and Exchange Commission, including the Company’s Annual Report on Form 10-K. Readers are cautioned not to place undue reliance on forward-looking statements, since the statements speak only as of the date that they are made, and the Company undertakes no obligation to publicly update these statements based on events that may occur after the date of this report.
CHOICEPOINT 2006 ANNUAL REPORT35
Management’s Report on Internal Control Over Financial Reporting
CHOICEPOINT 2006 ANNUAL REPORT
The management of ChoicePoint Inc. (the “Company”) is responsible for establishing and maintaining adequate internal control over financial reporting. Internal control over financial reporting is a process designed under the supervision of the Company’s principal executive and principal financial officers to provide reasonable assurance regarding the reliability of financial reporting and the preparation of the Company’s financial statements for external reporting purposes in accordance with generally accepted accounting principles. Our internal control over financial reporting is supported by written policies and guidelines, a program of internal audits, a written Code of Conduct applicable to all Company directors and all officers and employees of the Company, and quarterly written representations obtained from business unit leaders and key financial associates.
Because of the inherent limitations of internal control over financial reporting, material misstatements due to error or fraud may not be prevented or detected on a timely basis. Also, projections of any evaluation of the effectiveness of the internal control over financial reporting to future periods are subject to the risk that the controls may become inadequate because of changes in conditions, or that the degree of compliance with the policies or procedures may deteriorate.
The Company’s management assessed the effectiveness of the Company’s internal control over financial reporting as of December 31, 2006. In making this assessment, the Company’s management used the criteria set forth by the Committee of Sponsoring Organizations of the Treadway Commission (“COSO”) inInternal Control – Integrated Framework. Based on this assessment, management believes that, as of December 31, 2006, the Company’s internal control over financial reporting is effective.
The Company’s independent registered public accounting firm has audited management’s assessment of the effectiveness of the Company’s internal control over financial reporting as of December 31, 2006, as stated in their report, which expresses unqualified opinions on management’s assessment and on the effectiveness of the Company’s internal control over financial reporting as of December 31, 2006.

|
Derek V. Smith |
| Chief Executive Officer |

|
Steven W. Surbaugh |
Chief Administrative Officer |

|
Doug C. Curling |
| Chief Operating Officer |

|
David E. Trine |
| Chief Financial Officer |
36 CHOICEPOINT 2006 ANNUAL REPORT
Report of Independent Registered Public Accounting Firm on Internal Control Over Financial Reporting
CHOICEPOINT 2006 ANNUAL REPORT
To the Board of Directors and Shareholders of ChoicePoint Inc.:
We have audited management’s assessment, included in the accompanying Management’s Report on Internal Control over Financial Reporting, that ChoicePoint Inc. and subsidiaries (the “Company”) maintained effective internal control over financial reporting as of December 31, 2006, based on criteria established inInternal Control – Integrated Framework issued by the Committee of Sponsoring Organizations of the Treadway Commission. The Company’s management is responsible for maintaining effective internal control over financial reporting and for its assessment of the effectiveness of internal control over financial reporting. Our responsibility is to express an opinion on management’s assessment and an opinion on the effectiveness of the Company’s internal control over financial reporting based on our audit.
We conducted our audit in accordance with the standards of the Public Company Accounting Oversight Board (United States). Those standards require that we plan and perform the audit to obtain reasonable assurance about whether effective internal control over financial reporting was maintained in all material respects. Our audit included obtaining an understanding of internal control over financial reporting, evaluating management’s assessment, testing and evaluating the design and operating effectiveness of internal control, and performing such other procedures as we considered necessary in the circumstances. We believe that our audit provides a reasonable basis for our opinions.
A company’s internal control over financial reporting is a process designed by, or under the supervision of, the company’s principal executive and principal financial officers, or persons performing similar functions, and effected by the company’s board of directors, management, and other personnel to provide reasonable assurance regarding the reliability of financial reporting and the preparation of financial statements for external purposes in accordance with generally accepted accounting principles. A company’s internal control over financial reporting includes those policies and procedures that (1) pertain to the maintenance of records that, in reasonable detail, accurately and fairly reflect the transactions and dispositions of the assets of the company; (2) provide reasonable assurance that transactions are recorded as necessary to permit preparation of financial statements in accordance with generally accepted accounting principles, and that receipts and expenditures of the company are being made only in accordance with authorizations of management and directors of the company; and (3) provide reasonable assurance regarding prevention or timely detection of unauthorized acquisition, use, or disposition of the company’s assets that could have a material effect on the financial statements.
Because of the inherent limitations of internal control over financial reporting, including the possibility of collusion or improper management override of controls, material misstatements due to error or fraud may not be prevented or detected on a timely basis. Also, projections of any evaluation of the effectiveness of the internal control over financial reporting to future periods are subject to the risk that the controls may become inadequate because of changes in conditions, or that the degree of compliance with the policies or procedures may deteriorate.
In our opinion, management’s assessment that the Company maintained effective internal control over financial reporting as of December 31, 2006, is fairly stated, in all material respects, based on the criteria established inInternal Control – Integrated Framework issued by the Committee of Sponsoring Organizations of the Treadway Commission. Also in our opinion, the Company maintained, in all material respects, effective internal control over financial reporting as of December 31, 2006, based on the criteria established inInternal Control – Integrated Framework issued by the Committee of Sponsoring Organizations of the Treadway Commission.
We have also audited, in accordance with the standards of the Public Company Accounting Oversight Board (United States), the consolidated financial statements as of and for the year ended December 31, 2006 of the Company and our report dated February 27, 2007 expressed an unqualified opinion on those financial statements and included an explanatory paragraph regarding the Company’s changes in methods of accounting for share based payments to conform to Statement of Financial Accounting Standards (“SFAS”) No. 123R “Share Based Payment” and the funded status of its benefit plans to conform to SFAS No. 158 “Employer Accounting for Defined Pension and Other Post Retirement Plans,” which were adopted by the Company as of January 1 and December 31, 2006, respectively.

Atlanta, Georgia
February 27, 2007
CHOICEPOINT 2006 ANNUAL REPORT37
Report of Independent Registered Public Accounting Firm
CHOICEPOINT 2006 ANNUAL REPORT
To the Board of Directors and Shareholders of ChoicePoint Inc.:
We have audited the accompanying consolidated balance sheets of ChoicePoint Inc. and subsidiaries (the “Company”) as of December 31, 2006 and 2005 and the related consolidated statements of income, shareholders’ equity, and cash flows for each of the three years in the period ended December 31, 2006. These financial statements are the responsibility of the Company’s management. Our responsibility is to express an opinion on the financial statements based on our audits.
We conducted our audits in accordance with the standards of the Public Company Accounting Oversight Board (United States). Those standards require that we plan and perform the audit to obtain reasonable assurance about whether the financial statements are free of material misstatement. An audit includes examining, on a test basis, evidence supporting the amounts and disclosures in the financial statements. An audit also includes assessing the accounting principles used and significant estimates made by management, as well as evaluating the overall financial statement presentation. We believe that our audits provide a reasonable basis for our opinion.
In our opinion, such consolidated financial statements present fairly, in all material respects, the financial position of ChoicePoint Inc. and subsidiaries as of December 31, 2006 and 2005, and the results of their operations and their cash flows for each of the three years in the period ended December 31, 2006, in conformity with accounting principles generally accepted in the United States of America.
As discussed in Note 1 to the consolidated financial statements, effective January 1, 2006, the Company changed its method of accounting for share based payments to conform to Statement of Financial Accounting Standards (“SFAS”) No. 123R “Share Based Payment” and effective December 31, 2006, the Company changed its method of accounting for the funded status of its benefit plans to conform to SFAS No. 158 “Employer Accounting for Defined Pension and Other Post Retirement Plans.”
We have also audited, in accordance with the standards of the Public Company Accounting Oversight Board (United States), the effectiveness of the Company’s internal control over financial reporting as of December 31, 2006, based on the criteria established inInternal Control – Integrated Framework issued by the Committee of Sponsoring Organizations of the Treadway Commission and our report dated February 27, 2007 expressed an unqualified opinion on management’s assessment of the effectiveness of the Company’s internal control over financial reporting and an unqualified opinion on the effectiveness of the Company’s internal control over financial reporting.
Atlanta, Georgia
February 27, 2007
38 CHOICEPOINT 2006 ANNUAL REPORT
Consolidated Statements of Income
CHOICEPOINT 2006 ANNUAL REPORT
| | | | | | | | | | |
| | | Year Ended December 31, |
| (In thousands, except per share data) | | 2006 | | | 2005 | | 2004 |
Service revenue | | $ | 1,032,114 | | | $ | 985,702 | | $ | 847,258 |
Reimbursable expenses (Note 3) | | | 22,878 | | | | 28,056 | | | 34,280 |
| | | | | | | | | | |
Total revenue | | | 1,054,992 | | | | 1,013,758 | | | 881,538 |
| | | | | | | | | | |
Costs and expenses: | | | | | | | | | | |
Cost of service revenue | | | 541,935 | | | | 505,944 | | | 437,107 |
Reimbursable expenses | | | 22,878 | | | | 28,056 | | | 34,280 |
Selling, general, and administrative | | | 244,291 | | | | 215,646 | | | 175,066 |
Other operating charges (Note 12) | | | 117,572 | | | | 28,773 | | | — |
| | | | | | | | | | |
Total costs and expenses | | | 926,676 | | | | 778,419 | | | 646,453 |
| | | | | | | | | | |
Operating income | | | 128,316 | | | | 235,339 | | | 235,085 |
Interest expense, net | | | 15,920 | | | | 4,513 | | | 2,948 |
| | | | | | | | | | |
Income from continuing operations before income taxes | | | 112,396 | | | | 230,826 | | | 232,137 |
Provision for income taxes | | | 43,621 | | | | 91,302 | | | 88,328 |
| | | | | | | | | | |
Income from continuing operations | | | 68,775 | | | | 139,524 | | | 143,809 |
Income (loss) from discontinued operations, net of tax (Note 5) | | | (48,712 | ) | | | 1,132 | | | 4,146 |
Loss on sale of discontinued operations, net of tax (Note 5) | | | (3,141 | ) | | | — | | | — |
| | | | | | | | | | |
Net income | | $ | 16,922 | | | $ | 140,656 | | $ | 147,955 |
| | | | | | | | | | |
Earnings per share (Note 8) | | | | | | | | | | |
Basic: | | | | | | | | | | |
Income from continuing operations | | $ | 0.83 | | | $ | 1.57 | | $ | 1.64 |
Income (loss) from discontinued operations | | | (0.59 | ) | | | 0.01 | | | 0.05 |
Loss on sale of discontinued operations | | | (0.04 | ) | | | — | | | — |
| | | | | | | | | | |
Net income | | $ | 0.21 | | | $ | 1.59 | | $ | 1.69 |
| | | | | | | | | | |
Diluted: | | | | | | | | | | |
Income from continuing operations | | $ | 0.81 | | | $ | 1.52 | | $ | 1.58 |
Income (loss) from discontinued operations | | | (0.57 | ) | | | 0.01 | | | 0.05 |
Loss on sale of discontinued operations | | | (0.04 | ) | | | — | | | — |
| | | | | | | | | | |
Net income | | $ | 0.20 | | | $ | 1.53 | | $ | 1.62 |
| | | | | | | | | | |
Weighted average shares – basic | | | 82,521 | | | | 88,727 | | | 87,502 |
Dilutive effect of stock-based compensation | | | 2,465 | | | | 2,968 | | | 3,803 |
| | | | | | | | | | |
Weighted average shares – diluted | | | 84,986 | | | | 91,695 | | | 91,305 |
| | | | | | | | | | |
The accompanying notes are an integral part of these consolidated financial statements.
CHOICEPOINT 2006 ANNUAL REPORT39
Consolidated Balance Sheets
CHOICEPOINT 2006 ANNUAL REPORT
| | | | | | | | |
| | | December 31, | |
| (In thousands, except par values) | | 2006 | | | 2005 | |
Assets | | | | | | | | |
Current assets: | | | | | | | | |
Cash and cash equivalents | | $ | 26,612 | | | $ | 21,337 | |
Accounts receivable, net of allowance for doubtful accounts of $6,484 in 2006 and $5,749 in 2005 | | | 222,856 | | | | 203,289 | |
Other current assets | | | 36,538 | | | | 47,612 | |
Assets of businesses held for sale (Note 5) | | | 31,513 | | | | — | |
| | | | | | | | |
Total current assets | | | 317,519 | | | | 272,238 | |
Property and equipment, net | | | 68,167 | | | | 73,518 | |
Goodwill | | | 798,463 | | | | 917,858 | |
Other acquisition intangible assets, net | | | 81,930 | | | | 102,283 | |
Deferred tax assets | | | 8,560 | | | | — | |
Other assets, net | | | 71,453 | | | | 97,079 | |
| | | | | | | | |
Total assets | | $ | 1,346,092 | | | $ | 1,462,976 | |
| | | | | | | | |
Liabilities and Shareholders’ Equity | | | | | | | | |
Current liabilities: | | | | | | | | |
Short-term debt and current maturities of long-term debt | | $ | 100,011 | | | $ | 50,022 | |
Accounts payable | | | 60,913 | | | | 45,212 | |
Accrued salaries and bonuses | | | 24,811 | | | | 31,349 | |
Income taxes payable | | | 5,833 | | | | 6,861 | |
Deferred income taxes | | | 391 | | | | 1,723 | |
Other current liabilities | | | 114,807 | | | | 135,417 | |
Liabilities of businesses held for sale (Note 5) | | | 3,231 | | | | — | |
| | | | | | | | |
Total current liabilities | | | 309,997 | | | | 270,584 | |
Long-term debt, less current maturities | | | 315,028 | | | | 80,035 | |
Postretirement benefit obligations | | | 20,818 | | | | 24,929 | |
Deferred income taxes | | | 1,050 | | | | 43,617 | |
Other long-term liabilities | | | 32,212 | | | | 22,937 | |
| | | | | | | | |
Total liabilities | | | 679,105 | | | | 442,102 | |
| | | | | | | | |
Commitments and contingencies (Note 11) | | | | | | | | |
Shareholders’ equity: | | | | | | | | |
Preferred stock, $0.01 par value; 10,000 shares authorized, no shares issued or outstanding | | | — | | | | — | |
Common stock, $0.10 par value; shares authorized – 400,000; issued – 91,778 in 2006 and 90,967 in 2005 | | | 9,178 | | | | 9,097 | |
Paid-in capital | | | 500,859 | | | | 458,132 | |
Retained earnings | | | 735,312 | | | | 718,390 | |
Accumulated other comprehensive income (loss), net | | | 4,601 | | | | (9,784 | ) |
Treasury stock, at cost, 15,731 shares in 2006 and 4,340 shares in 2005 | | | (582,963 | ) | | | (154,961 | ) |
| | | | | | | | |
Total shareholders’ equity | | | 666,987 | | | | 1,020,874 | |
| | | | | | | | |
Total liabilities and shareholders’ equity | | $ | 1,346,092 | | | $ | 1,462,976 | |
| | | | | | | | |
The accompanying notes are an integral part of these consolidated financial statements.
40 CHOICEPOINT 2006 ANNUAL REPORT
Consolidated Statements of Shareholders’ Equity
CHOICEPOINT 2006 ANNUAL REPORT
| | | | | | | | | | | | | | | | | | | | | | | | | | |
(In thousands) | | Comprehensive
Income | | | Common
Stock | | | Paid-in
Capital | | Retained
Earnings | | Accumulated
Other
Comprehensive
Income (loss), Net | | | Treasury
Stock | | | Total | |
Balance, December 31, 2003 | | | | | | $ | 8,775 | | | $ | 374,929 | | $ | 429,779 | | $ | (2,589 | ) | | $ | (20,399 | ) | | $ | 790,495 | |
Net income | | $ | 147,955 | | | | — | | | | — | | | 147,955 | | | — | | | | — | | | | 147,955 | |
Change in fair value of derivatives, net of deferred taxes of $ 823 | | | 1,235 | | | | — | | | | — | | | — | | | 1,235 | | | | — | | | | 1,235 | |
Other | | | 37 | | | | — | | | | — | | | — | | | 37 | | | | — | | | | 37 | |
| | | | | | | | | | | | | | | | | | | | | | | | | | |
Comprehensive income | | $ | 149,227 | | | | | | | | | | | | | | | | | | | | | | | |
| | | | | | | | | | | | | | | | | | | | | | | | | | |
Restricted and other stock plans, net | | | | | | | 6 | | | | 4,891 | | | — | | | — | | | | — | | | | 4,897 | |
Stock options exercised | | | | | | | 162 | | | | 23,271 | | | — | | | — | | | | — | | | | 23,433 | |
Common stock redeemed | | | | | | | — | | | | — | | | — | | | — | | | | (151 | ) | | | (151 | ) |
Stock distributed by employee benefit trusts | | | | | | | — | | | | — | | | — | | | — | | | | 76 | | | | 76 | |
Tax benefit of stock options exercised | | | | | | | — | | | | 15,682 | | | — | | | — | | | | — | | | | 15,682 | |
| | | | | | | | | | | | | | | | | | | | | | | | | | |
Balance, December 31, 2004 | | | | | | | 8,943 | | | | 418,773 | | | 577,734 | | | (1,317 | ) | | | (20,474 | ) | | | 983,659 | |
Net income | | $ | 140,656 | | | | — | | | | — | | | 140,656 | | | — | | | | — | | | | 140,656 | |
Change in fair value of derivatives, net of deferred taxes of $ 930 | | | 1,396 | | | | — | | | | — | | | — | | | 1,396 | | | | — | | | | 1,396 | |
Change in cumulative foreign currency translation adjustment | | | (9,863 | ) | | | — | | | | — | | | — | | | (9,863 | ) | | | — | | | | (9,863 | ) |
| | | | | | | | | | | | | | | | | | | | | | | | | | |
Comprehensive income | | $ | 132,189 | | | | | | | | | | | | | | | | | | | | | | | |
| | | | | | | | | | | | | | | | | | | | | | | | | | |
Restricted and other stock plans, net | | | | | | | 9 | | | | 5,304 | | | — | | | — | | | | — | | | | 5,313 | |
Stock options exercised | | | | | | | 145 | | | | 18,093 | | | — | | | — | | | | — | | | | 18,238 | |
Common stock repurchased | | | | | | | — | | | | — | | | — | | | — | | | | (125,592 | ) | | | (125,592 | ) |
Stock purchased for employee benefit trusts | | | | | | | — | | | | — | | | — | | | — | | | | (8,895 | ) | | | (8,895 | ) |
Tax benefit of stock options exercised | | | | | | | — | | | | 15,962 | | | — | | | — | | | | — | | | | 15,962 | |
| | | | | | | | | | | | | | | | | | | | | | | | | | |
Balance, December 31, 2005 | | | | | | $ | 9,097 | | | $ | 458,132 | | $ | 718,390 | | $ | (9,784 | ) | | $ | (154,961 | ) | | $ | 1,020,874 | |
Net income | | $ | 16,922 | | | | — | | | | — | | | 16,922 | | | — | | | | — | | | | 16,922 | |
Change in fair value of derivatives, net of deferred taxes of $ 141 | | | 212 | | | | — | | | | — | | | — | | | 212 | | | | — | | | | 212 | |
Change in cumulative foreign currency translation adjustment | | | 10,790 | | | | | | | | — | | | — | | | 10,790 | | | | — | | | | 10,790 | |
| | | | | | | | | | | | | | | | | | | | | | | | | | |
Comprehensive income | | $ | 27,924 | | | | | | | | | | | | | | | | | | | | | | | |
| | | | | | | | | | | | | | | | | | | | | | | | | | |
Adoption of SFAS No. 158, net of deferred taxes of $ 2,073 | | | | | | | — | | | | — | | | — | | | 3,383 | | | | — | | | | 3,383 | |
Restricted and other stock plans, net | | | | | | | 13 | | | | 7,761 | | | — | | | — | | | | (426 | ) | | | 7,348 | |
Stock options exercised | | | | | | | 69 | | | | 16,255 | | | — | | | — | | | | — | | | | 16,324 | |
Common stock repurchased | | | | | | | — | | | | — | | | — | | | — | | | | (427,248 | ) | | | (427,248 | ) |
Common stock redeemed | | | | | | | (1 | ) | | | — | | | — | | | — | | | | (439 | ) | | | (440 | ) |
Stock distributed from employee benefit trusts | | | | | | | — | | | | — | | | — | | | — | | | | 111 | | | | 111 | |
Stock based compensation expense | | | | | | | — | | | | 15,535 | | | — | | | — | | | | — | | | | 15,535 | |
Tax benefit of stock options exercised | | | | | | | — | | | | 3,176 | | | — | | | — | | | | — | | | | 3,176 | |
| | | | | | | | | | | | | | | | | | | | | | | | | | |
Balance, December 31, 2006 | | | | | | $ | 9,178 | | | $ | 500,859 | | $ | 735,312 | | $ | 4,601 | | | $ | (582,963 | ) | | $ | 666,987 | |
| | | | | | | | | | | | | | | | | | | | | | | | | | |
The accompanying notes are an integral part of these consolidated financial statements.
CHOICEPOINT 2006 ANNUAL REPORT41
Consolidated Statements of Cash Flows
CHOICEPOINT 2006 ANNUAL REPORT
| | | | | | | | | | | | |
| | | Year Ended December 31, | |
| (In thousands) | | 2006 | | | 2005 | | | 2004 | |
Cash flows from operating activities: | | | | | | | | | | | | |
Net income | | $ | 16,922 | | | $ | 140,656 | | | $ | 147,955 | |
Loss (income) from discontinued operations, net of taxes | | | 51,853 | | | | (1,132 | ) | | | (4,146 | ) |
| | | | | | | | | | | | |
Income from continuing operations | | | 68,775 | | | | 139,524 | | | | 143,809 | |
Adjustments to reconcile income from continuing operations to net cash provided by continuing operations: | | | | | | | | | | | | |
Depreciation and amortization | | | 78,124 | | | | 69,594 | | | | 56,731 | |
Non-cash components of other operating charges | | | 110,120 | | | | — | | | | — | |
Compensation recognized under stock-based compensation plans | | | 22,749 | | | | 5,314 | | | | 4,897 | |
Tax benefit of stock options exercised | | | — | | | | 15,937 | | | | 15,682 | |
Gain on sale of minority investment | | | — | | | | — | | | | (4,049 | ) |
Changes in assets and liabilities, excluding effects of acquisitions and divestitures: | | | | | | | | | | | | |
Accounts receivable, net | | | (24,662 | ) | | | (9,684 | ) | | | (22,556 | ) |
Other current assets, excluding income taxes | | | 8,182 | | | | (15,862 | ) | | | (9,227 | ) |
Deferred income taxes | | | (32,207 | ) | | | 13,760 | | | | 30,030 | |
Estimated income taxes | | | 438 | | | | 12,296 | | | | 11,717 | |
Current liabilities, excluding debt and income taxes | | | (58 | ) | | | 20,555 | | | | 7,648 | |
Other long-term liabilities, excluding debt | | | 3,089 | | | | (3,800 | ) | | | 5,541 | |
| | | | | | | | | | | | |
Net cash provided by operating activities – continuing operations | | | 234,550 | | | | 247,634 | | | | 240,223 | |
Net cash provided by operating activities – discontinued operations | | | 3,939 | | | | 4,304 | | | | 8,397 | |
| | | |
Cash flows from investing activities: | | | | | | | | | | | | |
Acquisitions and investment, net of cash acquired | | | (59,441 | ) | | | (123,380 | ) | | | (229,314 | ) |
Cash proceeds from sale of discontinued operations, businesses, and minority investments | | | 18,500 | | | | — | | | | 3,549 | |
Additions to property and equipment, net | | | (25,491 | ) | | | (25,454 | ) | | | (25,775 | ) |
Additions to other assets, net | | | (32,926 | ) | | | (35,722 | ) | | | (29,502 | ) |
| | | | | | | | | | | | |
Net cash used in investing activities – continuing operations | | | (99,358 | ) | | | (184,556 | ) | | | (281,042 | ) |
Net cash used in investing activities – discontinued operations | | | (10,660 | ) | | | (10,532 | ) | | | (10,761 | ) |
| | | |
Cash flows from financing activities: | | | | | | | | | | | | |
Payments on Credit Facilities | | | (30,000 | ) | | | (95,000 | ) | | | (70,000 | ) |
Borrowings under Credit Facilities | | | 265,000 | | | | 175,000 | | | | 70,000 | |
Payments on Receivables Facility | | | (110,000 | ) | | | — | | | | (70,000 | ) |
Borrowings under Receivables Facility | | | 160,000 | | | | — | | | | 70,000 | |
Payments on other debt | | | (18 | ) | | | (43 | ) | | | (2,008 | ) |
Debt issuance costs | | | (658 | ) | | | — | | | | — | |
Changes in stock held by employee benefit trusts, net | | | 111 | | | | (8,895 | ) | | | 76 | |
Repurchase of common stock | | | (427,248 | ) | | | (125,592 | ) | | | — | |
Redemption of common stock | | | (440 | ) | | | (1 | ) | | | (151 | ) |
Tax benefit of stock options exercised | | | 3,176 | | | | — | | | | — | |
Proceeds from exercise of stock options | | | 16,324 | | | | 18,238 | | | | 23,433 | |
| | | | | | | | | | | | |
Net cash (used in) provided by financing activities – continuing operations | | | (123,753 | ) | | | (36,293 | ) | | | 21,350 | |
| | | | | | | | | | | | |
Effect of foreign currency exchange rates on cash and cash equivalents | | | 557 | | | | (797 | ) | | | — | |
Net increase (decrease) in cash and cash equivalents | | | 5,275 | | | | 19,760 | | | | (21,833 | ) |
Cash and cash equivalents, beginning of year | | | 21,337 | | | | 1,577 | | | | 23,410 | |
| | | | | | | | | | | | |
Cash and cash equivalents, end of year | | $ | 26,612 | | | $ | 21,337 | | | $ | 1,577 | |
| | | | | | | | | | | | |
The accompanying notes are an integral part of these consolidated financial statements.
42 CHOICEPOINT 2006 ANNUAL REPORT
Notes to Consolidated Financial Statements
CHOICEPOINT 2006 ANNUAL REPORT
1Nature of Operations
ChoicePoint Inc. (NYSE: CPS), a Georgia corporation (“ChoicePoint,” “we,” “our,” “us” or “the Company”), is a leading provider of identification and credential verifica-tion services for making smarter decisions in a world challenged by increased risks. Serving the needs of business, government, non-profit organizations and individuals, ChoicePoint works to create a safer and more secure society through the responsible use of information while working diligently to protect personal privacy.
On July 10, 2006, the Company announced its intent to divest various businesses, including its forensic DNA (“Bode”) and shareholder services businesses (“EquiSearch”), as a result of a company-wide strategic review. Additionally, on September 29, 2006, the Company announced the sale of Priority Data Systems, a comparative rating software solutions business, to the parent company of AMS Services. On October 24, 2006, the Company announced its intent to sell additional non-strategic businesses, later disclosed to be part of its public records operations, specifically the businesses that collect bankruptcy, lien and judgment (“BLJ”) records and provide them on a wholesale, bulk basis. These businesses are presented as discontinued operations consistent with the Company’s decision to sell these businesses. Historical information in the following discussions and tables has been reclassified to conform to the current presentation. See Note 5 for additional discussion of these businesses.
To reflect how the Company is operating under its new strategic focus, the Company revised the segments in which it reports its financial results. See further discussion in Note 14. ChoicePoint’s continuing operations are focused on five primary markets – Insurance Services, Screening and Authentication Services, Financial and Professional Services, Government Services and Marketing Services.
The Insurance Services group, ChoicePoint’s largest core business, provides data, analytics, software and business information services to property and casualty (“P&C”) personal and commercial insurance carriers. Our information solutions help insurers effectively assess risks in the underwriting process to ensure that their customers receive appropriate policy pricing. In personal lines, our C.L.U.E.® (Comprehensive Loss Underwriting Exchange) database is the industry’s most complete source of historical claims. Other tools include Current Carrier, which identifies the existence of current or previous insurance, as well as any possible lapses in coverage. Our Insurity business unit provides software, data and analytics to P&C commercial and personal lines carriers to improve risk acceptance and loss mitigation. Insurity offers policy administration, claims administration, compliance management, regulatory
reporting, reinsurance, billing, business processing and maintenance service to carriers, brokers, agents and third party administrators.
The Screening and Authentication Services group focuses on employment screenings, tenant screening, vital records and customer enrollment businesses. WorkPlace Solutions background screening products include instant on-line solutions, as well as comprehensive employment and background checks, drug testing, and tenant screening. Many customers utilize ChoicePoint’s National Criminal File, a comprehensive database of criminal files that includes criminal conviction records across all 50 states. Formed in 2006, this segment now offers vendor screening, a one-stop solution that helps organizations manage risk and compliance requirements with third-party vendors. Other businesses in this segment include VitalChek, an on-line service that enables consumers to order vital records, such as birth certificates, marriage licenses and death certificates over the Internet or telephone using credit cards, a service otherwise not available through most government agencies.
The Financial and Professional Services group provides public information solutions primarily to retail and commercial banking, mortgage lending, and legal industries. Services to these areas help companies with risk management, enhanced due diligence, verification and business credentialing. These services allow companies to better mitigate financial and reputational risk and improve their processes and productivity.
The Government Services group provides information, analytics, mapping and distribution solutions that support the missions of federal, state and local government and international law enforcement agencies. By combining these proven solutions, Government Services is uniquely capable of overcoming information sharing issues that can threaten public safety. Products include a visual platform for geospatial mapping, and the leading global visual investigative analysis software.
The Marketing Services group is a leading provider of direct marketing and database solutions to the insurance and financial services industries. These solutions help businesses acquire and grow customer relationships through the integration of data, data management, analytics and marketing technologies.
2 Basis of Presentation
ChoicePoint Inc. was established through the combination of the businesses that comprised the Insurance Services Group of Equifax Inc. (“Equifax”) within a separate company and the subsequent spinoff on August 8, 1997 (the “Spinoff”) of the Company’s outstanding stock by
43 CHOICEPOINT 2006 ANNUAL REPORT
Notes to Consolidated Financial Statements
CHOICEPOINT 2006 ANNUAL REPORT
Equifax as a stock dividend to the shareholders of Equifax.
The consolidated financial statements include the accounts of ChoicePoint and its subsidiaries. All material transactions and balances between entities included in the consolidated financial statements have been eliminated.
3 Significant Accounting Policies
Use of Estimates– The preparation of financial statements in conformity with accounting principles generally accepted in the United States (“GAAP”) requires management to make estimates and assumptions. These estimates and assumptions affect the reported amounts of assets and liabilities and disclosure of contingent assets and liabilities at the date of the financial statements as well as reported amounts of revenues and expenses during the reporting period. In 2006, such estimates and assumptions include those used to determine the amounts recognized as impairment charges included in other operating charges and discontinued operations. See Notes 5 and 12 for additional discussion of these charges. Actual results could differ from these estimates.
Foreign Currency Translation – The net assets of the Company’s foreign operations, which are located primarily in the United Kingdom, are translated into U.S. dollars using current exchange rates and the results of operations of the Company’s foreign operations are translated into U.S. dollars using average exchange rates during the period. The resulting translation adjustment, as well as exchange gains and losses on intercompany balances of a long-term investment nature, are included in the cumulative foreign currency translation adjustment (“CTA”) in accumulated other comprehensive income (loss), net. The functional currency of the Company’s foreign operations is the local currency of those operations.
Revenue – ChoicePoint recognizes revenue when it is realized or realizable and earned. The Company considers revenue realized or realizable and earned when it has persuasive evidence that an agreement exists, prices are fixed or determinable, services and products are provided to the customer, and collectibility is reasonably assured. The Company reduces revenue for estimated volume discounts and other allowances. The Company also records deferred revenue primarily related to payments received in advance of revenue being earned under software licensing, maintenance and support and other contractual agreements. Deferred revenue included in other current liabilities totaled $45.5 million as of December 31, 2006 and $44.0 million as of December 31, 2005. In addition to the general policy discussed above, the following are the specific revenue recognition policies for our major business lines and for multiple-element arrangements:
Information Services – Revenue for the P&C personal lines, public filing searches, employment background screening and drug testing, vital records and other services in the Screening and Authentication Services and the Financial and Professional Services segments is generally earned on a transactional basis and recognized as the services are delivered. Revenue from non-transaction-based arrangements such as subscription licenses and fixed fee arrangements is recognized over the period in which the customer is using the service. Provisions for bad debts and volume discounts are recognized during the period in which they are estimable and applicable, respectively.
Marketing Services – Revenues in our teleservices, print and data fulfillment services are recognized when projects are completed and delivered (typically within one month) in accordance with contractual terms. Certain database management services in our Marketing Services segment represent hosting arrangements. The contracts for these services are in essence a periodic service agreement to provide database services to a specific customer. The revenues and certain up-front costs related to these hosting arrangements are recognized ratably over the term of the agreement in accordance with Staff Accounting Bulletin 104, “Revenue Recognition in Financial Statements,” and Emerging Issues Task Force (“EITF”) Issue No. 00-3, “Application of AICPA Statement of Position 97-2 to Arrangements That Include the Right to Use Software Stored on Another Entity’s Hardware.”
Software Services – Certain software revenues are generated primarily by transactions that include multiple-element arrangements encompassing licensing software systems (consisting of software and maintenance support) and providing professional services. ChoicePoint allocates revenue to each element of a transaction based upon its fair value as determined by vendor specific objective evidence (“VSOE”). VSOE of fair value for all elements of an arrangement is based upon the normal pricing and discounting practices for those products and services when sold separately and, for maintenance and support services, is additionally measured by the renewal rate offered to the customer. The Company defers revenue for any undelivered elements, and recognizes revenue when the product is delivered or over the period in which the service is performed, in accordance with its revenue recognition
44 CHOICEPOINT 2006 ANNUAL REPORT
Notes to Consolidated Financial Statements
CHOICEPOINT 2006 ANNUAL REPORT
policy for such elements. If the fair value of any undelivered element included in bundled software and service arrangements cannot be objectively determined, revenue is deferred until all elements are delivered and services have been performed, or until fair value can objectively be determined for any remaining undelivered elements. When the fair value of a delivered element has not been established, the residual method is used to record revenue if the fair value of all undelivered elements is determinable. Under the residual method, the fair value of the undelivered elements is deferred and the remaining portion of the arrangement fee is allocated to the delivered elements and is recognized as revenue.
In some instances, perpetual software license arrangements require significant customization. These arrangements are accounted for under the percentage of completion method based on estimates of the extent of progress toward completion. The Company estimates the percentage of completion on contracts on a monthly basis utilizing estimated remaining hours to complete as a percentage of total estimated hours to complete the project. Changes in estimates to complete and revisions in overall profit estimates are recognized in the period in which they are determined.
Government Contracts – Certain of the Company’s government contracts may have cancellation or pricing provisions or renewal clauses that are required by law, such as those dependent upon fiscal funding outside of a governmental unit’s control, so that the contract can be cancelled if deemed in the taxpayer’s best interest and the contract may be subject to limitations under statutes. ChoicePoint considers multiple factors, including the history with the customer in similar transactions, the “essential use” of the service and the planning, budgeting and approval processes undertaken by the governmental entity. If the Company determines that the likelihood of non-acceptance in these arrangements is remote, revenue is recognized once all of the criteria described above have been met. If such a determination cannot be made, revenue is recognized upon the earlier of cash receipt or approval of the applicable funding provision by the governmental entity.
Pass-Through Expense – The Company records certain revenue on a net basis since it has in essence “earned a commission or fee” for arranging the delivery of a service ordered by a customer from a specified vendor and is not the primary obligor under the provisions of EITF Issue No. 99-19, “Reporting Revenue Gross as a Principal versus Net as an Agent.” Motor vehicle records registry revenue (the fee charged by states for motor vehicle records) and other fixed costs that are passed on by ChoicePoint to its customers (“pass-through expense”) are excluded from revenue and recorded as a reduction to cost of revenue in the Consolidated Financial Statements. The incidental fee charged by ChoicePoint to provide this delivery service is reported as revenue. For the twelve months ended December 31, pass-through expense was $800.4 million in 2006, $733.2 million in 2005 and $644.7 million in 2004.
Reimbursable Expenses – In accordance with EITF Issue No. 01-14, “Income Statement Characterization of Reimbursements Received for ‘Out-of-Pocket’ Expenses Incurred” (“EITF 01-14”), the Company presents certain reimbursed out-of-pocket expenses on a gross basis as revenues and expenses. The application of EITF 01-14 has no impact on operating income, net income or earnings per share. Reimbursed materials, shipping and postage charges in the Company’s Marketing Services segment for the year ended December 31 totaled $22.9 million in 2006, $28.1 million in 2005 and $34.3 million in 2004 and have been presented as revenues and expenses in the corresponding Consolidated Statements of Income.
Other – During 2004, the Company sold its minority investment in a small document management technology company that it invested in several years ago and recorded a pre-tax gain of approximately $4.0 million related to the sale. This gain was substantially offset by an increase in litigation expense accruals on an outstanding legal action and costs related to the closure of certain operating facilities.
Other Current Assets – Other current assets at December 31, 2006 and 2005 consisted of the following:
| | | | | | |
(In thousands) | | 2006 | | 2005 |
Prepaid expenses | | $ | 27,792 | | $ | 26,829 |
Receivable from insurance carrier on FTC Settlement | | | — | | | 11,000 |
Other receivable from insurance carrier | | | — | | | 4,000 |
Other | | | 8,746 | | | 5,783 |
| | | | | | |
| | $ | 36,538 | | $ | 47,612 |
| | | | | | |
Property and Equipment – Property and equipment at December 31, 2006 and 2005 consisted of the following:
| | | | | | | | |
(In thousands) | | 2006 | | | 2005 | |
Land, buildings, and improvements | | $ | 27,570 | | | $ | 27,106 | |
Data processing equipment and furniture | | | 179,941 | | | | 178,234 | |
Less accumulated depreciation | | | (139,344 | ) | | | (131,822 | ) |
| | | | | | | | |
| | $ | 68,167 | | | $ | 73,518 | |
| | | | | | | | |
CHOICEPOINT 2006 ANNUAL REPORT45
Notes to Consolidated Financial Statements
CHOICEPOINT 2006 ANNUAL REPORT
The cost of property and equipment is depreciated primarily on the straight-line basis over estimated asset lives of 40 years for buildings; 15 years for land improvements; useful lives, not to exceed lease terms, for leasehold improvements; three to five years for data processing equipment and eight years for furniture.
For the year ended December 31, 2006, approximately $2.4 million of property and equipment related to our Financial and Professional Services segment was written down to fair value and recognized as other operating charges (Note 12).
Goodwill – The Company accounts for acquisitions using the purchase method of accounting. As a result, goodwill and other acquisition intangibles are recorded at the time of purchase based on internal evaluations that are subject to change based on the final resolutions of acquired asset valuations. The Company completed its annual goodwill impairment tests as required under SFAS No. 142, “Goodwill and Other Intangible Assets,” as of October 31, 2006, 2005 and 2004. In connection with the Company’s decision to divest various businesses, additional impairment tests were performed in accordance with SFAS No. 142. Impairment charges of $99.4 million were recorded in continuing operations during the year ended December 31, 2006 as a result of these tests. Additionally, impairment charges of $67.5 million were recorded in discontinued operations during 2006. See Note 5 for additional information on the discontinued operations charges. No impairment charges were recorded as a result of these tests during the years ended December 31, 2005 or 2004.
A summary of the change in goodwill during the years ended December 31, 2006 and 2005, by business segment, is as follows:
| | | | | | | | | | | | | | | | | | |
(In thousands) | | Goodwill at
December 31, 2005 | | Acquisitions
and Adjustments | | | Transfer to Assets
Held for Sale | | | Other
Charges | | | Goodwill at
December 31, 2006 |
Insurance Services | | $ | 83,145 | | $ | 26,779 | | | $ | — | | | $ | (22,743 | )(a) | | $ | 87,181 |
Screening and Authentication Services | | | 301,338 | | | 12,096 | | | | — | | | | — | | | | 313,434 |
Financial and Professional Services | | | 177,279 | | | (63 | ) | | | (35,202 | ) | | | — | | | | 142,014 |
Government Services | | | 157,076 | | | (53 | ) | | | (9,084 | ) | | | 8,273 | (b) | | | 156,212 |
Marketing Services | | | 199,020 | | | 2 | | | | — | | | | (99,400 | )(c) | | | 99,622 |
| | | | | | | | | | | | | | | | | | |
Total | | $ | 917,858 | | $ | 38,761 | | | $ | (44,286 | )(d) | | $ | (113,870 | ) | | $ | 798,463 |
| | | | | | | | | | | | | | | | | | |
| (a) | Goodwill disposed of in connection with the sale of Priority Data discussed in Note 5. |
| (b) | Effect of foreign currency translation on goodwill. |
| (c) | Impairment charge discussed in Note 12 and above. |
| (d) | Approximately $38.3 million of this amount was subsequently written off as part of the Company’s $67.5 million charge included in discontinued operations discussed in Note 5. |
| | | | | | | | | | |
(In thousands) | | Goodwill at
December 31, 2004 | | Acquisitions
and Adjustments | | | Goodwill at
December 31, 2005 |
Insurance Services | | $ | 74,822 | | $ | 8,323 | | | $ | 83,145 |
Screening and Authentication Services | | | 301,065 | | | 273 | | | | 301,338 |
Financial and Professional Services | | | 177,507 | | | (228 | ) | | | 177,279 |
Government Services | | | 80,605 | | | 76,471 | | | | 157,076 |
Marketing Services | | | 190,905 | | | 8,115 | | | | 199,020 |
| | | | | | | | | | |
Total | | $ | 824,904 | | $ | 92,954 | | | $ | 917,858 |
| | | | | | | | | | |
Other Acquisition Intangible Assets – Other acquisition intangibles, excluding trademarks/trade names, are being amortized on a straight-line basis over three to twenty years for customer relationships, three to twenty years for purchased data files, three to five years for software, four to seven years for non-compete agreements and three to eleven years for other intangible assets. Amortization
expense was $19.5 million for 2006, $18.8 million for 2005 and $12.6 million for 2004. Estimated amortization expense for the next five years is $16.7 million for 2007, $13.8 million for 2008, $10.5 million for 2009, $6.1 million for 2010 and $3.6 million for 2011. Other Acquisition Intangible Assets at December 31, 2006 and 2005 consisted of the following:
46 CHOICEPOINT 2006 ANNUAL REPORT
Notes to Consolidated Financial Statements
CHOICEPOINT 2006 ANNUAL REPORT
| | | | | | | | | | | | | | | | | | | | |
(In thousands) | | Gross | | 2006
Accumulated
Amortization | | | Net | | Gross | | 2005
Accumulated
Amortization | | | Net |
Customer relationships | | $ | 54,571 | | $ | (32,124 | ) | | $ | 22,447 | | $ | 56,782 | | $ | (24,809 | ) | | $ | 31,973 |
Purchased data files | | | 16,320 | | | (3,995 | ) | | | 12,325 | | | 35,499 | | | (6,250 | ) | | | 29,249 |
Software | | | 47,103 | | | (22,513 | ) | | | 24,590 | | | 31,188 | | | (15,581 | ) | | | 15,607 |
Non-compete agreements | | | 14,207 | | | (8,481 | ) | | | 5,726 | | | 15,007 | | | (6,691 | ) | | | 8,316 |
Trademarks/trade names | | | 16,076 | | | — | | | | 16,076 | | | 15,531 | | | — | | | | 15,531 |
Other intangible assets | | | 9,713 | | | (8,947 | ) | | | 766 | | | 10,913 | | | (9,306 | ) | | | 1,607 |
| | | | | | | | | | | | | | | | | | | | |
Total | | $ | 157,990 | | $ | (76,060 | ) | | $ | 81,930 | | $ | 164,920 | | $ | (62,637 | ) | | $ | 102,283 |
| | | | | | | | | | | | | | | | | | | | |
Other Assets, Net – Other assets, net at December 31, 2006 and 2005 consisted of the following:
| | | | | | |
(In thousands) | | 2006 | | 2005 |
Software and databases developed for internal use, net | | $ | 42,486 | | $ | 67,089 |
Purchased software, net | | | 20,425 | | | 21,807 |
Other | | | 8,542 | | | 8,183 |
| | | | | | |
| | $ | 71,453 | | $ | 97,079 |
| | | | | | |
For the years ended December 31, costs of software and databases developed for internal use of approximately $18.8 million in 2006, $28.6 million in 2005, and $25.6 million in 2004 were capitalized and are included in Software and databases developed for internal use, net. The amounts capitalized include certain direct costs, including independent contractor and payroll costs in accordance with Statement of Position (“SOP”) 98-1, “Accounting for the Costs of Computer Software Developed or Obtained for Internal Use.” Other assets are being amortized on a straight-line basis primarily over three to five years. Accumulated amortization was $99.7 million as of December 31, 2006 and $96.8 million as of December 31, 2005.
The Company regularly evaluates whether events and circumstances have occurred that indicate the carrying amount of other long-lived assets may warrant revision or may not be recoverable. When factors indicate that other assets should be evaluated for possible impairment, the Company uses an estimate of the future undiscounted net cash flows of the related business over the remaining life of the other assets in measuring whether those assets are recoverable. If the carrying amount exceeds undiscounted cash flows, an impairment loss would be recognized for the difference between the carrying amount and its estimated fair value on a discounted cash flow methodology. For the year ended December 31, 2006, approximately $8.2 million of other long-lived assets in our Financial and Professional Services segment were written down to fair value and recognized as other operating charges (Note 12).
Other Current Liabilities – Other current liabilities at December 31, 2006 and 2005 consisted of the following:
| | | | | | |
(In thousands) | | 2006 | | 2005 |
Unearned income and deferred revenue | | $ | 45,459 | | $ | 43,980 |
FTC settlement accrual and related costs | | | 429 | | | 19,000 |
Acquisition earnout settlement accrual | | | — | | | 7,500 |
Other | | | 68,919 | | | 64,937 |
| | | | | | |
| | $ | 114,807 | | $ | 135,417 |
| | | | | | |
See Note 11 for discussion of the Federal Trade Commission (“FTC”) settlement accrual and related costs. See Note 4 for discussion of acquisition earnout settlement accrual.
Depreciation and Amortization Expense – Depreciation and amortization expense from continuing operations for 2006, 2005 and 2004 consisted of the following:
| | | | | | | | | |
| | | Year Ended December 31, |
(In thousands) | | 2006 | | 2005 | | 2004 |
Property and equipment | | $ | 28,406 | | $ | 25,993 | | $ | 20,619 |
Other acquisition intangibles | | | 19,516 | | | 18,801 | | | 12,563 |
Software and databases developed for internal use | | | 17,800 | | | 13,856 | | | 14,130 |
Purchased software | | | 12,100 | | | 10,652 | | | 7,343 |
Other assets | | | 302 | | | 292 | | | 2,076 |
| | | | | | | | | |
Total | | $ | 78,124 | | $ | 69,594 | | $ | 56,731 |
| | | | | | | | | |
Comprehensive Income – Comprehensive income and its components are presented in the Consolidated Statements of Shareholders’ Equity. Accumulated other comprehensive (loss) consisted of the following at December 31:
| | | | | | | |
(In thousands) | | 2006 | | 2005 | |
Cumulative foreign currency translation adjustment | | $ | 927 | | $ | (9,863 | ) |
Cash flow hedges | | | 212 | | | (1 | ) |
Other | | | 79 | | | 80 | |
| | | | | | | |
| | | 1,218 | | | (9,784 | ) |
| | | | | | | |
Adoption of SFAS No. 158 | | | 3,383 | | | — | |
| | | | | | | |
Total | | $ | 4,601 | | $ | (9,784 | ) |
| | | | | | | |
CHOICEPOINT 2006 ANNUAL REPORT47
Notes to Consolidated Financial Statements
CHOICEPOINT 2006 ANNUAL REPORT
Consolidated Statements of Cash Flows – The Company considers short-term cash investments with original maturities of three months or less to be cash equivalents.
The tax payments made by ChoicePoint were approximately $75.2 million in 2006 ($74.1 million net of refunds, $52.9 million in 2005 ($51.9 million net of refunds), and $36.7 million in 2004 ($32.4 million net of refunds). Interest paid on debt totaled $15.6 million in 2006, $4.4 million in 2005 and $2.9 million in 2004.
In 2006, 2005 and 2004, the Company acquired various businesses that were accounted for as purchases and made an equity investment (Note 4). In conjunction with these transactions, liabilities were assumed as follows:
| | | | | | | | | | | | |
| | | Year Ended December 31, | |
(In thousands) | | 2006 | | | 2005 | | | 2004 | |
Fair value of assets acquired | | $ | 58,575 | | | $ | 166,310 | | | $ | 274,034 | |
Less cash paid for acquisitions and investment | | | (51,952 | ) | | | (138,675 | ) | | | (242,219 | ) |
| | | | | | | | | | | | |
Liabilities assumed | | $ | 6,623 | | | $ | 27,635 | | | $ | 31,815 | |
| | | | | | | | | | | | |
Financial Instruments and Derivatives– The Company’s financial instruments recorded on the balance sheet consist primarily of cash and cash equivalents, accounts receivable, accounts payable and debt. The carrying amounts approximate their fair values because of the short maturity of these instruments or, in the case of debt, because it bears interest at current market rates.
The Company’s derivative financial instruments are accounted for under the provisions of SFAS No. 133, “Accounting for Derivative Instruments and Hedging Activities,” as amended by SFAS No. 138. Such derivatives at December 31, 2006 and 2005 consist of interest rate swap agreements (Note 6) entered into to limit the effect of changes in LIBOR (a benchmark interest rate) on the Company’s LIBOR-based payments, including the synthetic leases. Amounts currently due to or from interest rate swap counterparties are recorded in expense in the period in which they accrue. The Company measures all derivatives at fair value and recognizes them in the Consolidated Balance Sheet as an asset or liability, depending on ChoicePoint’s rights or obligations under the applicable derivative contract. ChoicePoint’s only derivative instruments are swap agreements which have been designated as cash flow hedges to hedge the variability in expected future interest payments on a portion of the Company’s LIBOR-based payments and, as such, the effective portions of changes in fair value are reported in cumulative other comprehensive income and are subsequently reclassified into earnings when the hedged item affects earnings. The Company formally documents all relationships between hedging instruments and hedged items, as well as its risk management objectives and strategies for undertaking various hedge transactions. The Company assesses, on an ongoing basis, whether the derivatives that are used in hedging transactions are highly effective in offsetting changes in fair value or cash flows of hedged items. Should it be determined that a derivative is not highly effective as a hedge, the Company will discontinue hedge accounting treatment. The Company does not enter into derivative financial instruments for trading or speculative purposes. The fair value of the interest rate swap agreements was an asset of approximately $0.4 million as of December 31, 2006 and an immaterial liability at December 31, 2005, which has been recorded net of taxes in accumulated other comprehensive income in the Consolidated Financial Statements. There was no impact on earnings related to swap agreements in 2004, 2005 or 2006.
Allowance for Doubtful Accounts – Management judgments and estimates are made in connection with establishing the allowance for doubtful accounts. Specifically, we analyze the aging of accounts receivable balances, historical bad debts, customer credit worthiness, industry, and changes in current economic trends. Significant changes in customer concentration, deterioration of customer credit worthiness, or weakening in economic trends could have a significant impact on the collectibility of receivables and our operating results. Generally, we do not require collateral or other security to support receivables.
New Accounting Pronouncements – The Company adopted SFAS No. 123 (revised 2004), “Share-Based Payment” (“SFAS 123(R)”) beginning January 1, 2006 using the modified prospective transition method. Under this transition method, compensation cost was recognized after adoption for all share-based payments granted prior to, but not yet vested as of January 1, 2006, and all share-based payments granted subsequent to January 1, 2006. As a result of adopting SFAS 123(R), the Company’s income before income taxes and net income (loss) for the year ended December 31, 2006, were $15.4 million and $12.3 million lower, respectively, than if the Company had continued to account for share-based compensation under Accounting Principles Board Opinion No. 25. SFAS 123(R) also requires that the benefits of tax deductions in excess of recognized compensation cost be reported as a financing cash flow, rather than as an operating cash flow as required under prior guidance. This requirement reduced net operating cash flows in the amount of $3.2 million for the year ended December 31, 2006. See Note 8 for additional information on the adoption of SFAS 123(R).
48 CHOICEPOINT 2006 ANNUAL REPORT
Notes to Consolidated Financial Statements
CHOICEPOINT 2006 ANNUAL REPORT
In September 2006, the FASB issued SFAS No. 158, “Employers’ Accounting for Defined Benefit Pension and Other Postretirement Plans, an amendment of FASB Statements No. 87, 88, 106 and 132(R)” (“SFAS 158”), which requires recognition in the Statements of Financial Position of the over- or under-funded status of defined pension and other postretirement plans, measured as the difference between the fair value of plan assets and the accumulated benefit obligation for other postretirement benefit plans (such as the ChoicePoint plan), with a corresponding adjustment to accumulated other comprehensive income, net of tax. The Company adopted the recognition and disclosure provisions of SFAS 158 as of December 31, 2006. The adjustment to accumulated other comprehensive income at adoption of $5.5 million ($3.4 million net of tax) represents the net unrecognized actuarial gains and unrecognized prior service credit. There was no impact on results of operations or cash flows. In addition, SFAS 158 did not have an effect on the Company’s consolidated financial condition at December 31, 2005 or 2004. See Note 10 for additional information on the adoption of SFAS 158.
In September 2006, the Securities and Exchange Commission (“SEC”) issued Staff Accounting Bulletin No. 108, “Considering the Effects of Prior Year Misstatements when Quantifying Misstatements in Current Year Financial Statements” (“SAB 108”). SAB 108 provides interpretive guidance on how the effects of the carryover or reversal of prior year misstatements should be considered in quantifying a current year misstatement. The SEC staff believes that registrants should quantify errors using both the balance sheet and income statement approach when quantifying a misstatement. The guidance provides for a one-time cumulative effect adjustment to correct for misstatements for errors that were not deemed material under a company’s prior approach but are material under the SAB 108 approach. SAB 108 is effective for the Company’s fiscal year ending December 31, 2006. The adoption of SAB 108 did not have a material impact on the results of operations or financial position.
In July 2006, the FASB issued FASB Interpretation No. 48, “Accounting for Uncertainty in Income Taxes” (“FIN 48”). The interpretation clarifies the accounting for uncertainty in income taxes recognized in a company’s financial statements in accordance with SFAS No. 109, “Accounting for Income Taxes.” Specifically, the pronouncement prescribes a recognition threshold and a measurement attribute for the financial statement recognition and measurement of a tax position taken or expected to be taken in a tax return. The interpretation also provides guidance on the related derecognition, classification, interest and penalties, accounting for interim periods, disclosure and transition of uncertain tax positions. This interpretation will be effective for the Company on January 1, 2007. The Company is currently evaluating the impact this new standard will have on its future results of operations and financial position.
In September 2006, the FASB issued SFAS No. 157, “Fair Value Measurements” (“SFAS 157”), which defines fair value, establishes a framework for measuring fair value in accordance with GAAP, and expands disclosures about fair value measurements. SFAS 157 applies where other accounting pronouncements require or permit fair value measurements; it does not require any new fair value measurements under GAAP. SFAS 157 is effective for the Company on January 1, 2007. The effects of adoption will be determined by the types of instruments carried at fair value in the Company’s financial statements at the time of adoption as well as the method utilized to determine their fair values prior to adoption. Based on the Company’s current use of fair value measurements, SFAS 157 is not expected to have a material effect on the results of operations or financial position of the Company.
4 Acquisitions and Investment
Acquisitions – During 2006, 2005 and 2004, the Company acquired either stock or assets of the following businesses:
| | | | |
Business | | Date Acquired | | Segment |
Steel Card, LLC | | July 2006 | | Insurance Services |
Insuratec, Inc. | | July 2006 | | Insurance Services |
USCerts | | June 2006 | | Screening and Authentication Services |
ePolicy, Inc. | | June 2006 | | Insurance Services |
ShortStop, LLC | | February 2006 | | Screening and Authentication Services |
ELIOS, Inc. | | January 2006 | | Insurance Services |
EzGov, Inc. | | May 2005 | | Government Services |
Magnify, Inc. | | April 2005 | | Insurance Services |
i2 Limited | | January 2005 | | Government Services |
USAHire, LLC | | December 2004 | | Screening and Authentication Services |
Priority Data Systems, Inc. | | December 2004 | | Insurance Services |
InsurQuote, Inc. | | October 2004 | | Insurance Services |
AIG Technologies, Inc. | | August 2004 | | Insurance Services |
Investigation Technologies, LLC d/b/a Rapsheets | | May 2004 | | Screening and Authentication Services |
Service Abstract Corp. | | April 2004 | | Financial and Professional Services |
ADREM Profiles, Inc., Government Business Services, LLC and Advance Information Resources Corporation | | April 2004 | | Screening and Authentication Services |
Charles Jones, LLC and Superior Information Services, LLC | | April 2004 | | Financial and Professional Services |
iMapData.com, Inc. | | February 2004 | | Government Services |
Templar Corporation | | February 2004 | | Government Services |
CHOICEPOINT 2006 ANNUAL REPORT49
Notes to Consolidated Financial Statements
CHOICEPOINT 2006 ANNUAL REPORT
The acquisitions above were accounted for as purchases, and the results of operations from these acquisitions are included in ChoicePoint’s consolidated results from the date acquired.
In 2006, the Company acquired either the stock or assets of the following companies: ELIOS, Inc., located in San Ramon, California, a loss payee notification company for the property and casualty insurance industry; ShortStop, LLC, which maintains a network of drug and health testing clinics; USCerts, located in Memphis, Tennessee, which provides technology and data management services to facilitate the remote ordering of vital records; ePolicy, Inc., which provides a comprehensive set of administration solutions for commercial insurance carriers; Insuratec, Inc., located in Danville, California, a provider of lien holder and mortgagee notification services to the property and casualty insurance industry; and Steel Card, LLC, based in California, a provider of browser-based personal lines software that provides rating, underwriting, product con-figuration, rules management and policy administration for carriers. These acquisitions extend ChoicePoint’s current product and service offerings in Insurance Services and Screening and Authentication Services segments. The total purchase price of the acquisitions, which were accounted for using the purchase method of accounting, was cash paid of approximately $52.0 million. Goodwill of $26.8 million was allocated to the Insurance Services segment and $12.1 million to the Screening and Authentication Services segment, of which approximately $30.8 million is fully deductible for tax purposes, and $16.1 million to other acquisition intangible assets as follows:
| | | | | |
(In thousands) | | Amount | | Weighted Average Amortization Period |
| | |
Customer relationships | | $ | 1,949 | | 5 years |
Software | | | 13,873 | | 5 years |
Noncompete agreements | | | 300 | | 7 years |
| | | | | |
Total | | $ | 16,122 | | |
| | | | | |
On January 4, 2005, the Company acquired the stock of i2 Limited (“i2”), which is based in Cambridge, United Kingdom. i2 is a provider of visualization and link analysis software for intelligence, law enforcement, military and large commercial applications. The acquisition enhanced ChoicePoint’s analytics and distribution offerings and government market presence and is reported in our Government Services segment.
The net purchase price was approximately $96 million ($108 million paid in cash at acquisition, $3 million paid related to earnout provisions discussed below, net of $15 million of cash included in i2’s opening balance sheet), which the Company financed with $100 million of borrowings under its unsecured revolving credit facility (see Note 6). The purchase of i2 included earnout provisions that were fully settled in 2005, and the Company recorded additional purchase price of $3 million during 2005 related to these provisions. The following table summarizes the fair values of assets acquired and liabilities assumed (in thousands):
| | | | |
Current assets | | $ | 13,459 | |
| Property and equipment, net | | | 2,376 | |
| Goodwill | | | 78,245 | |
| Other acquisition intangible assets | | | 24,900 | |
| Other assets | | | 216 | |
| | | | |
Total assets acquired | | | 119,196 | |
| | | | |
| Current liabilities | | | (15,144 | ) |
| Other long-term liabilities | | | (590 | ) |
| Long-term deferred tax liability | | | (7,470 | ) |
| | | | |
Total liabilities assumed | | | (23,204 | ) |
| | | | |
Net assets acquired | | $ | 95,992 | |
| | | | |
The results of operations from the date of acquisition for i2 are included in the Consolidated Statements of Income. Goodwill of $78.2 million was allocated to Government Services, none of which is deductible for tax purposes. Of the $24.9 million of acquired intangible assets, $16.5 million was assigned to software that has a useful life of 5 years, $4.4 million was assigned to trademark/trade name that has an indefinite life, and $4.0 million was assigned to customer relationships that have a useful life of 20 years.
Also in 2005, the Company acquired Magnify, Inc., a Chicago-based leading provider of fraud prediction software solutions to the property and casualty insurance carrier markets, and the Americas and Caribbean operations of EzGov, Inc., an Atlanta-based software and services company that enables the automation of government processes. These acquisitions extend ChoicePoint’s current product and services offerings in Insurance Services and Government Services. The total purchase price of the acquisitions, which were accounted for using the purchase method of accounting, was approximately $13.3 million in cash. Goodwill of $9.9 million was recorded, of which $4.5 million is expected to be fully deductible for tax purposes, and $3.3 million was allocated to other intangible assets as follows:
| | | | | |
(In thousands) | | Amount | | Weighted Average Amortization Period |
| | |
Software | | $ | 2,296 | | 5 years |
Trademark/trade name | | | 1,000 | | indefinite life asset |
| | | | | |
Total | | $ | 3,296 | | |
| | | | | |
50 CHOICEPOINT 2006 ANNUAL REPORT
Notes to Consolidated Financial Statements
CHOICEPOINT 2006 ANNUAL REPORT
In 2004, the Company acquired either the stock or assets of the following companies: the Templar Corporation, a provider of advanced and secure information technology solutions, based in Alexandria, Virginia; iMapData.com, Inc., an information and analytics company with powerful data visualization capabilities, based in McLean, Virginia; Superior Information Services, LLC, located in Trenton, New Jersey, and Service Abstract Corp., located in Nanuet, New York, both of which are providers of public filings information including liens and judgments in the Northeast U.S.; Charles Jones, LLC, a leading supplier of New Jersey title and property lien searches, located in Trenton, New Jersey; ADREM Pro-files, Inc., Government Business Services, LLC and Advance Information Resources Corporation, pre-employment screening services companies, located in Tampa, Florida; Investigation Technologies, LLC, d/b/a Rapsheets, an electronic criminal records provider, located in Memphis, Tennessee; AIG Technologies, Inc., a software and software maintenance provider, located in Livingston, New Jersey; InsurQuote, Inc., a leading provider of insurance rating solutions to the property and casualty carrier markets, located in Orem, Utah; Priority Data Systems, Inc, a provider of comparative rating software solutions to the independent insurance agency market, located in Omaha, Nebraska; and USAHire, LLC, an applicant screening software provider, located in Charlotte, North Carolina. These acquisitions extend ChoicePoint’s current product and service offerings in Insurance Services, Financial and Professional Services, Screening and Authentication Services and Government Services.
2004 acquisitions had an aggregate purchase price of $242.2 million that was paid in cash, $179.7 million was allocated to goodwill, of which approximately $82.4 million is fully deductible for tax purposes, and $58.8 million to other acquisition intangible assets as follows:
| | | | | |
(In thousands) | | Amount | | Weighted Average Amortization Period |
| | |
Purchased data files | | $ | 33,390 | | 13 years |
Customer relationships | | | 8,448 | | 5 years |
Software | | | 2,750 | | 3 years |
Technology | | | 2,225 | | 2 years |
Trademark/trade name | | | 7,100 | | indefinite life asset |
Noncompete agreements | | | 4,916 | | 6 years |
| | | | | |
Total | | $ | 58,829 | | |
| | | | | |
The allocation of purchase price to the assets and liabilities of certain acquisitions is preliminary and subject to change based on the resolutions of pre-acquisition contingencies. The remaining accrual of $1.2 million as of December 31, 2006 for transaction costs related to the above acquisitions relates primarily to future payments under lease terminations, related office closure expenses and legal fees.
One of these acquisitions is subject to a contingent payment agreement based on revenue and operating profit goals. The Company will record goodwill related to these contingent payment agreements if goals are met and payments are reasonably estimable and probable. In January of 2006, $7.5 million was paid by the Company related to the settlement of an earnout provision for a prior acquisition. This amount was recorded as additional purchase price in the fourth quarter of 2005.
The pro forma effect of 2006, 2005 and 2004 purchased acquisitions is not material individually or in the aggregate to the consolidated financial statements.
Investment – In the third quarter of 2005, the Company made a $10.0 million equity investment in XDimensional Technologies, Inc., a leading provider of a comprehensive agency management Internet service for the insurance industry.
5 Discontinued Operations
As discussed in Note 1, ChoicePoint announced its intent to divest the Bode Labs, EquiSearch and BLJ businesses during 2006. These businesses slated for divestiture are reported as discontinued operations – removing Bode from the Government Services segment and EquiSearch and BLJ from the Financial & Professional Services segment. Additionally, in September 2006, the Company sold its Priority Data Systems business, a comparative rating software solutions business in the Insurance Services segment, to the parent company of AMS Services. Consequently, the results of these discontinued operations are reflected in the Company’s Consolidated Statements of Income as discontinued operations. The results of these discontinued operations in prior years have been reclassified to conform to the 2006 classification. The following amounts have been segregated from continuing operations and are reflected as discontinued operations for the years ended December 31, 2006, 2005, and 2004, respectively:
| | | | | | | | | | | | |
| | | Year Ended December 31, | |
(In thousands) | | 2006 | | | 2005 | | | 2004 | |
Total revenue | | $ | 38,183 | | | $ | 44,156 | | | $ | 37,175 | |
| | | |
Income (loss) from discontinued operations before income taxes | | | (74,791 | ) | | | 1,803 | | | | 6,693 | |
Income tax (provision) benefit | | | 22,938 | | | | (671 | ) | | | (2,547 | ) |
| | | | | | | | | | | | |
Income (loss) from discontinued operations, net of tax | | $ | (51,853 | ) | | $ | 1,132 | | | $ | 4,146 | |
| | | | | | | | | | | | |
CHOICEPOINT 2006 ANNUAL REPORT51
Notes to Consolidated Financial Statements
CHOICEPOINT 2006 ANNUAL REPORT
During 2006, the Company recorded a non-cash charge of $67.5 million ($47.2 million after tax benefit) in discontinued operations to reduce the carrying value of goodwill and other assets related to these businesses in order to reflect the estimated net proceeds to be realized from selling these three businesses based on indicative bids received to date. Of this amount, $47.0 million related to the BLJ businesses, $10.6 million related to the Bode business and $9.9 million related to the EquiSearch business. Actual proceeds may vary from the estimated net proceeds. In addition, included in the loss from discontinued operations in 2006 is a $5.0 million ($3.1 million net of tax benefit) loss on the sale of Priority Data.
At December 31, 2006, the Company has classified certain assets and liabilities associated with the discontinued operations as assets of businesses held for sale and liabilities of businesses held for sale in the Consolidated Balance Sheets in accordance with the guidance in SFAS 144. The following table details the components of the assets and liabilities of businesses held for sale at December 31, 2006 (in thousands):
| | | |
Accounts receivable, net of allowance for doubtful accounts of $ 506 | | $ | 8,890 |
Other current assets | | | 2,402 |
Property and equipment, net | | | 2,370 |
Goodwill | | | 6,033 |
Other acquisition intangible assets, net | | | 2,615 |
Other assets, net | | | 9,203 |
| | | |
Total assets of businesses held for sale | | | 31,513 |
Accounts payable | | | 1,556 |
Other current liabilities | | | 1,675 |
| | | |
Total liabilities of businesses held for sale | | | 3,231 |
Total net assets of businesses held for sale | | $ | 28,282 |
| | | |
Subsequent Events– On January 31, 2007 the Company sold its shareholder services business, EquiSearch. Completion of the divestiture did not have a material impact on the Company’s financial results.
On February 9, 2007 the Company sold the BLJ businesses. In connection with the sale, ChoicePoint and the buyer also entered into a data access agreement that gives ChoicePoint the right to include BLJ information in its other products for a long-term period. Other than the previously discussed writedown of goodwill and other assets, completion of the divestiture did not have a material impact on the Company’s financial results.
6 Debt and Other Financing
Long-term debt at December 31, 2006 and 2005 was as follows:
| | | | | | | | |
| | | December 31, | |
(In thousands) | | 2006 | | | 2005 | |
Credit Facility | | $ | 315,000 | | | $ | 80,000 | |
Receivables Facility | | | 100,000 | | | | 50,000 | |
Capital leases | | | 39 | | | | 57 | |
| | | | | | | | |
| | | 415,039 | | | | 130,057 | |
Less current maturities | | | (100,011 | ) | | | (50,022 | ) |
| | | | | | | | |
| | $ | 315,028 | | | $ | 80,035 | |
| | | | | | | | |
On October 25, 2006, ChoicePoint, through one of its wholly owned subsidiaries, entered into a $600 million unsecured credit facility (the “Credit Facility”) with a group of banks, which is expandable to $750 million, to refinance its existing facility, fund share repurchases and for general corporate purposes. At December 31, 2006, there was $315 million outstanding under the Credit Facility. The Credit Facility bears interest at either a base rate as defined in the Credit Facility or LIBOR plus an applicable margin. The applicable margins range from 0.28% to 0.60% per annum based on ChoicePoint’s funded debt to Earnings Before Interest, Taxes, Depreciation and Amortization (“EBITDA”) ratio. The average interest rate based on the terms of the Credit Facility was 5.8% at December 31, 2006. Within the Credit Facility, the Company has a $50 million line of credit with a participating bank at either a base rate as defined in the Credit Facility or LIBOR plus an applicable margin. The Credit Facility, including the line of credit, expires on October 25, 2011. From December 29, 2004 to October 25, 2006, the Company had a $400 million unsecured multicurrency revolving credit facility (the “Former Credit Facility”) with a group of banks. At December 31, 2005, there was $80.0 million outstanding under the Former Credit Facility.
The Credit Facility contains covenants customary for facilities of this type. Such covenants include limitations, in certain circumstances, on the ability of the Company and its subsidiaries to (i) effect a change of control of the Company, (ii) incur certain types of liens, and (iii) transfer or sell assets. The Credit Facility also requires compliance with financial covenants, including (i) maximum funded debt to EBITDA and (ii) minimum interest coverage.
In 2001, the Company and certain of its subsidiaries entered into an agreement (the “Receivables Facility”) with a financial institution whereby it may sell on a continuous basis, an undivided interest in all eligible trade accounts
52 CHOICEPOINT 2006 ANNUAL REPORT
Notes to Consolidated Financial Statements
CHOICEPOINT 2006 ANNUAL REPORT
receivable subject to limitations. The Company will maintain the balance in the designated pool of accounts receivable sold by selling undivided interests in new receivables as existing receivables are collected. Prior to December 1, 2006, the Receivables Facility permitted the advance of up to $100 million on the sale of accounts receivable. On December 1, 2006, the Receivables Facility was amended to increase the available borrowing capacity to $125 million. Currently, the Receivables Facility is payable in December 2007, but may be extended in one-year terms. Due to certain contractual removal-of-accounts provisions, the Receivables Facility has been recorded as an on-balance sheet financing transaction in accordance with SFAS No. 140, “Accounting for Transfers and Servicing of Financial Assets and Extinguishments of Liabilities.” The Company believes the Receivables Facility provides a low cost of financing and is an additional source of debt capital with diversification from other alternatives. Net proceeds from the Receivables Facility were $100.0 million at December 31, 2006, and $50.0 million at December 31, 2005. The average interest rate based on the terms of the Receivables Facility was 5.6% at December 31, 2006.
During the second quarter of 2006, the Company entered into a $12.5 million synthetic lease agreement for a new property. Under this synthetic lease agreement, a third-party lessor purchased the property in June 2006 and paid for the build-out of the property completed in December 2006. The $12.5 million synthetic lease expires in 2012. On December 8, 2006, the Company entered into a $25.2 million synthetic lease agreement for the headquarters building and a $46.2 million synthetic lease agreement for the data center facility. These agreements replaced the existing agreements that were due to expire in 2007 and 2008. The new lease agreement expires in January 2012, at which time the Company has the following options for each lease: renew the lease for an additional five years, purchase the building for the original cost, or sell the property (remarket) itself. If the Company elects to remarket the property, it must guarantee the lessor 80% to 85% of the original cost.
The Company has accounted for the synthetic leases as operating leases and has recorded rent expense. If the Company had elected to purchase the properties instead of entering into the synthetic leases, total assets and debt would have increased by $83.5 million at December 31, 2006 and $71.0 million at December 31, 2005 and the Company would have recorded additional depreciation expense related to the synthetic leases of approximately $2.7 million ($1.7 million after tax) for 2006, $2.4 million ($1.5 million after tax) for 2005, and $2.2 million ($1.4 million after tax) for 2004.
As of December 31, 2006, ChoicePoint had four interest rate swap agreements (the “Swap Agreements”) outstanding that reduce the impact of changes in the benchmark interest rate (LIBOR) on its LIBOR-based payments on the synthetic leases. One interest rate swap agreement has a notional amount of $25 million and matures in August 2007. The other three interest rate swap agreements have a total notional amount of $42 million, became effective May 2003 and mature in August 2007. These Swap Agreements involve the receipt of a variable rate and payment by ChoicePoint of fixed rates between 4.0% and 6.5%. ChoicePoint has designated all of these swaps as cash flow hedges of the variability in expected future interest payments on $67 million of the Company’s LIBOR-based payments. The Company is exposed to credit loss in the event of nonperformance by the other parties to the Swap Agreements. However, the Company does not anticipate nonperformance by the counterparties.
At December 31, 2006, the Company had $300.0 million of available capacity under the above facilities. Scheduled maturities of long-term debt subsequent to December 31, 2006 are as follows: $100.0 million in 2007 and $315.0 million in 2011.
7 Income Taxes
The Company records deferred income taxes using enacted tax laws and rates for the years in which the taxes are expected to be paid. Deferred income tax assets and liabilities are recorded based on the differences between the financial reporting and income tax bases of assets and liabilities.
The provision (benefit) for income taxes from continuing operations consists of the following:
| | | | | | | | | | |
| | | Year Ended December 31, |
(In thousands) | | 2006 | | | 2005 | | 2004 |
Current: | | | | | | | | | | |
Federal | | $ | 68,574 | | | $ | 66,584 | | $ | 51,608 |
State | | | 8,156 | | | | 8,779 | | | 5,792 |
Foreign | | | 3,176 | | | | — | | | — |
| | | | | | | | | | |
Total current | | | 79,906 | | | | 75,363 | | | 57,400 |
| | | | | | | | | | |
Deferred: | | | | | | | | | | |
Federal | | | (31,415 | ) | | | 12,332 | | | 26,721 |
State | | | (3,785 | ) | | | 3,270 | | | 4,207 |
Foreign | | | (1,085 | ) | | | 337 | | | — |
| | | | | | | | | | |
Total deferred | | | (36,285 | ) | | | 15,939 | | | 30,928 |
| | | | | | | | | | |
Total | | $ | 43,621 | | | $ | 91,302 | | $ | 88,328 |
| | | | | | | | | | |
CHOICEPOINT 2006 ANNUAL REPORT53
Notes to Consolidated Financial Statements
CHOICEPOINT 2006 ANNUAL REPORT
The provision for income taxes from continuing operations is reconciled with the federal statutory rate, as follows:
| | | | | | | | | |
| | | Year Ended
December 31, | |
| | | 2006 | | | 2005 | | | 2004 | |
Federal statutory rate | | 35.0 | % | | 35.0 | % | | 35.0 | % |
State and local taxes, net of federal tax benefit | | 2.5 | | | 3.4 | | | 2.8 | |
Non-deductible stock option expense | | 2.1 | | | — | | | — | |
Non-deductible penalties | | — | | | 1.5 | | | — | |
Other | | (0.8 | ) | | (0.3 | ) | | 0.2 | |
| | | | | | | | | |
Effective rate for continuing operations | | 38.8 | % | | 39.6 | % | | 38.0 | % |
ChoicePoint’s 2006 effective tax rate for continuing operations was 38.8%, a decrease from 39.6% in 2005. The higher overall effective rate in 2005 is primarily due to additional tax expense in connection with a settlement with the Federal Trade Commission (the “FTC”) (see Note 12), partially offset by a $700,000 benefit from a favorable outcome from the completion of a state tax audit during the second quarter of 2005. The additional tax expense associated with the FTC settlement in 2005 is a result of the non-deductibility of the $10.0 million civil penalty for federal income tax purposes.
Components of the Company’s deferred income tax assets and liabilities at December 31, 2006 and 2005 are as follows:
| | | | | | | | |
| | | December 31, | |
(In thousands) | | 2006 | | | 2005 | |
Deferred income tax assets: | | | | | | | | |
Employee compensation programs | | $ | 18,971 | | | $ | 13,323 | |
Postretirement benefits | | | 7,874 | | | | 10,477 | |
Goodwill | | | 4,814 | | | | — | |
Reserves and accrued expenses | | | 4,236 | | | | 2,789 | |
Other | | | 5,795 | | | | 5,131 | |
| | | | | | | | |
Total deferred income tax assets | | | 41,690 | | | | 31,720 | |
| | | | | | | | |
Deferred income tax liabilities: | | | | | | | | |
Purchased software, data files, technology, and other assets | | | (17,363 | ) | | | (29,868 | ) |
Goodwill | | | — | | | | (25,867 | ) |
Depreciation | | | (12,588 | ) | | | (16,569 | ) |
Deferred expenses | | | (4,581 | ) | | | (4,431 | ) |
Other | | | (39 | ) | | | (325 | ) |
| | | | | | | | |
Total deferred income tax liabilities | | | (34,571 | ) | | | (77,060 | ) |
| | | | | | | | |
Net deferred income tax assets (liabilities) | | $ | 7,119 | | | $ | (45,340 | ) |
| | | | | | | | |
A valuation allowance is provided when it is more likely than not that some portion or all of a deferred tax asset will not be realized. At December 31, 2006, the Company has certain deferred tax assets of $7.7 million for which a valuation allowance of approximately $7.6 million has been provided due to uncertainty of future realization of these deferred tax assets. At December 31, 2005, the Company had certain deferred tax assets of $12.5 million for which a valuation allowance of approximately $8.1 million had been provided due to uncertainty of future realization of these deferred tax assets.
The Company accounts for any income tax contingencies in accordance with SFAS No. 5, “Accounting for Contingencies.” As of December 31, 2006 and 2005, the Company had approximately $8.0 million recorded for contingencies which is included in current liabilities on the Consolidated Balance Sheet.
At December 31, 2006, the Company had U.S. federal net operating loss carryforwards of approximately $3.0 million, which expire at varying dates through 2024. At December 31, 2006, the Company had state net operating loss carryforwards of approximately $123 million, which expire between 2007 and 2026.
8 Shareholders’ Equity
Earnings Per Share – The Company has computed basic and diluted earnings per share using the treasury stock method. For the years ended December 31, 2006, 2005, and 2004 options outstanding to purchase approximately 3.5 million, 2.1 million, and 716,000 shares of common stock respectively, were not included in the computation of diluted earnings per share because the exercise prices of the options were greater than the average market price of the Company’s common stock during the applicable year, and the effect of including them in such computation would be anti-dilutive.
Stock Options – On April 25, 2006, the shareholders of the Company approved the ChoicePoint Inc. 2006 Omnibus Incentive Plan (the “2006 Omnibus Plan”). Under the 2006 Omnibus Plan, up to 1,500,000 shares of the Company’s common stock may be issued pursuant to awards granted thereunder, with limitations on specific kinds of awards that may be issued or transferred, or in payment of dividend equivalents paid with respect to such awards. A variety of discretionary awards for officers, directors and full-time employees of ChoicePoint, and others who render significant services are authorized under the 2006 Omnibus Plan, including incentive and non-qualified stock options, restricted stock, deferred stock, share equivalent units, tandem appreciation rights and/or free-standing appreciation rights, performance shares and performance units. The vesting of such awards may be conditioned upon either a specified period of service or the attainment of certain performance goals as determined by
54 CHOICEPOINT 2006 ANNUAL REPORT
Notes to Consolidated Financial Statements
CHOICEPOINT 2006 ANNUAL REPORT
the Management Compensation and Benefits Committee of the Company’s Board of Directors. Option exercise prices are set at the closing price of ChoicePoint’s common stock on the New York Stock Exchange on the date of grant, and option terms do not exceed seven years.
The Company adopted a second amendment to its 1997 Omnibus Stock Incentive Plan (the “1997 Plan”) on April 25, 2006, pursuant to which the aggregate number of shares of the Company’s common stock available for grants of all awards pursuant to the 1997 Plan was reduced to 500,000. The 1997 Plan was also amended to provide that no outstanding options may be amended to reduce the exercise price thereof.
In addition, on March 13, 2006, the Company amended and restated its 2003 Omnibus Incentive Plan (the “2003 Omnibus Plan”) to make its terms consistent with those of the 2006 Omnibus Plan, including adding limitations on the number of performance shares, performance units, share equivalent units or other awards, to the extent they are distributable in shares, and limiting the period during which future option rights or free-standing appreciation rights may be exercised to seven years.
During 2006, options to purchase an aggregate of approximately 1.3 million shares of the Company’s common stock were granted under the above plans, having an exercise price equal to the fair market value of the underlying stock. Such options had a weighted average exercise price of $45.69. The fair value of the options granted during 2006 and 2005 was calculated using an actuarial binomial model. The fair value of options granted prior to 2005 was calculated using the Black-Scholes Option Pricing Model. The following assumptions were used in the calculation of stock-based compensation expense:
| | | | | | | | | | | | |
| | | Year Ended December 31, | |
| | | 2006 | | | 2005 | | | 2004 | |
Dividend yield | | | 0 | % | | | 0 | % | | | 0 | % |
Expected volatility | | | 25 | % | | | 28 | % | | | 32 | % |
Risk-free interest rate | | | 5.0 | % | | | 3.7 | % | | | 2.8 | % |
Expected life in years | | | 4.54 | | | | 4.85 | | | | 3.82 | |
Weighted average fair value of options granted | | $ | 13.84 | | | $ | 14.01 | | | $ | 11.50 | |
A summary of all outstanding options and the weighted average exercise price per share, as of December 31, 2006, 2005 and 2004 and changes during the years then ended is as follows (shares in thousands):
| | | | | | | | | | | | | | | | | | |
| | | December 31, |
| | | 2006 | | 2005 | | 2004 |
| | | Shares | | | Avg. Price | | Shares | | | Avg. Price | | Shares | | | Avg. Price |
| | | | | | |
Balance outstanding, beginning of year | | 11,309 | | | $ | 29.83 | | 11,609 | | | $ | 25.83 | | 12,121 | | | $ | 23.17 |
Granted | | 1,320 | | | | 45.69 | | 1,593 | | | | 45.86 | | 1,358 | | | | 38.84 |
Canceled/forfeited | | (408 | ) | | | 42.32 | | (335 | ) | | | 40.25 | | (233 | ) | | | 35.50 |
Exercised | | (675 | ) | | | 24.55 | | (1,558 | ) | | | 14.18 | | (1,637 | ) | | | 15.28 |
| | | | | | | | | | | | | | | | | | |
Balance outstanding, end of year | | 11,546 | | | $ | 31.51 | | 11,309 | | | $ | 29.83 | | 11,609 | | | $ | 25.83 |
| | | | | | | | | | | | | | | | | | |
Exercisable at end of year | | 6,557 | | | $ | 23.45 | | 6,277 | | | $ | 21.54 | | 6,728 | | | $ | 17.29 |
| | | | | | | | | | | | | | | | | | |
A summary of outstanding options, the weighted average exercise price per share, the weighted average remaining contractual term, and the aggregate intrinsic value as of December 31, 2006 is as follows (shares and aggregate intrinsic value in thousands):
| | | | | | | | | | |
| | | Shares | | Weighted Average
Exercise Price | | Weighted Average
Remaining Contractual
Term in Years | | Aggregate
Intrinsic Value |
Outstanding, December 31, 2006 | | 11,546 | | $ | 31.51 | | 4.7 | | $ | 110,289 |
Vested and expected to vest, December 31, 2006 | | 11,317 | | $ | 31.23 | | 4.8 | | $ | 110,291 |
Exercisable, December 31, 2006 | | 6,557 | | $ | 23.45 | | 3.3 | | $ | 105,866 |
CHOICEPOINT 2006 ANNUAL REPORT55
Notes to Consolidated Financial Statements
CHOICEPOINT 2006 ANNUAL REPORT
The following table summarizes information about stock options outstanding and exercisable at December 31, 2006 (shares in thousands):
| | | | | | | | | | | | |
| | | Options Outstanding | | Options Exercisable |
Range of Exercise Prices | | Shares | | Weighted Average
Remaining Contractual
Life in Years | | Weighted Average
Exercise Price | | Shares | | Weighted Average
Exercise Price |
$9.224 – $ 13.836 | | 1,493 | | 0.9 | | $ | 10.24 | | 1,493 | | $ | 10.24 |
$13.837 – $ 18.448 | | 960 | | 2.1 | | | 13.97 | | 960 | | | 13.97 |
$18.449 – $ 23.060 | | 772 | | 3.0 | | | 19.09 | | 772 | | | 19.09 |
$23.061 – $ 27.672 | | 1,250 | | 3.9 | | | 26.00 | | 1,250 | | | 26.00 |
$27.673 – $ 32.284 | | 175 | | 3.0 | | | 29.52 | | 128 | | | 29.35 |
$32.285 – $ 36.896 | | 1,134 | | 6.0 | | | 33.54 | | 632 | | | 33.59 |
$36.897 – $ 40.356 | | 2,236 | | 5.9 | | | 38.64 | | 930 | | | 38.70 |
$40.357 – $ 46.120 | | 3,526 | | 6.7 | | | 44.89 | | 392 | | | 43.06 |
| | | | | | | | | | | | |
| | 11,546 | | | | $ | 31.51 | | 6,557 | | $ | 23.45 |
The intrinsic value of options exercised during the year ended December 31 was $10.2 million in 2006, $43.5 million in 2005, and $39.5 million in 2004.
Other Stock-Based Awards – On a periodic basis, certain key officers, employees, and directors of the Company are granted shares of nonvested stock under the above plans. During 2006, 138,400 shares were awarded with a weighted average market value at the date of grant of $45.65 per share. During 2005 and 2004, 103,375 and 61,000 shares were awarded with a weighted average market value per share of $45.26 and $38.54 respectively. Also on a periodic basis, certain key officers are awarded deferred shares under the above plans. During 2006, 2005 and 2004, 75,000 deferred shares were granted each year at a weighted average market price of $45.75, $46.12 and $38.50 respectively. Upon initial election to the board of directors, and then annually, each non-employee director of the Company receives an award of share equivalent units. During 2006, 56,286 share equivalent units were granted to non-employee directors and certain key employees at market value on the date of grant of $41.22 per unit. During 2005 and 2004, 26,470 and 20,931 units were granted at an average market value at the date of the awards of $39.29 and $43.71 respectively. The market value of the restricted stock, deferred shares and share equivalent units is being charged to expense over the vesting periods through April 2010. The pre-tax compensation cost charged against income for these awards was $7.3 million ($4.6 million net of tax) in 2006, $5.5 million ($3.4 million net of tax) in 2005 and $6.6 million ($4.1 million net of tax) in 2004.
A summary of the beginning and ending balance of the Company’s nonvested shares, deferred shares, and share equivalent units as of December 31, 2006, and changes during the year then ended is presented below:
| | | | | | |
| | | Shares/Units | | | Weighted Average Grant-Date Fair Value |
| | |
| | |
Balance at December 31, 2005 | | 579,659 | | | $ | 40.00 |
Granted | | 269,686 | | | | 44.75 |
Vested | | (61,549 | ) | | | 36.30 |
Forfeited | | (9,600 | ) | | | 44.47 |
| | | | | | |
Balance at December 31, 2006 | | 778,196 | | | $ | 41.88 |
The fair value of shares vested during the year ended December 31 was $2.5 million in 2006, $1.1 million in 2005, and $9.0 million in 2004.
The Company adopted SFAS 123(R), effective January 1, 2006. SFAS 123(R) requires companies to apply a fair value method of measurement for all share-based payment transactions with employees, including stock options, and to recognize these transactions in the financial statements. The Company adopted SFAS 123(R) using the modified prospective application, which applies to all grants after the effective date and to any unvested portion of grants issued prior to the effective date or implementation date. The Company used an actuarial binomial model to value its 2005 and 2006 stock option grants and a Black-Scholes model to value awards prior to 2005. The related compensation cost is expensed over the vesting period using the straight-line method for awards with cliff vesting or using the accelerated attribution method for awards with graded vesting.
56 CHOICEPOINT 2006 ANNUAL REPORT
Notes to Consolidated Financial Statements
CHOICEPOINT 2006 ANNUAL REPORT
The fair value of stock options granted was determined on the grant date using assumptions for the expected term, expected volatility, dividend yield, and the risk-free interest rate. The term assumption is primarily based on the contractual term of seven years for options granted in 2006, and ten years for options granted in 2005 and 2004, and historical data related to exercise and post-vesting cancellation history experienced by the Company, which is expected to be similar to future results. The Company’s anticipated volatility level is based on the combination of implied market volatility and ChoicePoint’s long-term historical volatility. The Company’s model includes a zero dividend yield assumption, as the Company has not historically paid nor does it anticipate paying dividends on its common stock. The Company’s model does not include a discount for post-vesting restrictions, as the Company has not issued awards with such restrictions. The risk free interest rate is based on U.S. Treasury zero-coupon yield curve over the expected term of the option. The periodic expense is then determined based on the valuation of the options, and at that time an estimated forfeiture rate is used to reduce the expense recorded. The Company’s estimate of pre-vesting forfeitures is primarily based on the historical experience of the Company and is adjusted to reflect actual forfeitures as the options vest.
The modified prospective approach requires that the Company expense over the remaining vesting period the value it previously calculated under the fair value method for stock options granted prior to the adoption of SFAS 123(R). As of December 31, 2006, there was approximately $18.4 million in total unrecognized compensation cost related to unvested options, which is expected to be recognized over a weighted average period of 2.4 years.
The Company’s stock-based compensation charge was $15.5 million for the year ended December 31, 2006, of which approximately $134,000 was capitalized. Of the $15.4 million compensation expense for 2006, $4.3 million was included in cost of revenue and $11.1 million was included in selling, general and administrative expenses. The total income tax benefit recognized for stock option compensation arrangements was $3.1 million for 2006.
As of December 31, 2006, there was approximately $6.7 million in total unrecognized compensation cost related to nonvested stock, $9.2 million related to deferred shares, and $2.1 million related to share equivalent units. That cost is expected to be recognized over a weighted average period of 2.0 years for nonvested stock, 3.3 years for deferred shares, and 1.8 years for share equivalent units.
The following table outlines the effect of the adoption of SFAS 123(R) on the following financial metrics for the year ended December 31, 2006 (in thousands, except per share information):
| | | | | | | | | | | |
| | | As Reported | | | Effect of the
Adoption of
SFAS 123(R) | | Excluding
the Effect of
SFAS 123(R) | |
Operating income | | $ | 128,316 | | | $ | 15,401 | | $ | 143,717 | |
Income from continuing operations before income taxes | | | 112,396 | | | | 15,401 | | | 127,797 | |
Income from continuing operations | | | 68,775 | | | | 12,295 | | | 81,070 | |
Loss from discontinued operations, net of tax | | | (51,853 | ) | | | — | | | (51,853 | ) |
| | | | | | | | | | | |
Net income | | $ | 16,922 | | | $ | 12,295 | | $ | 29,217 | |
| | | | | | | | | | | |
Earnings per share | | | | | | | | | | | |
Basic: | | | | | | | | | | | |
Income from continuing operations | | $ | 0.83 | | | $ | 0.15 | | $ | 0.98 | |
Loss from discontinued operations | | | (0.63 | ) | | | — | | | (0.63 | ) |
| | | | | | | | | | | |
Net income | | $ | 0.21 | | | $ | 0.15 | | $ | 0.35 | |
| | | | | | | | | | | |
Diluted: | | | | | | | | | | | |
Income from continuing operations | | $ | 0.81 | | | $ | 0.14 | | $ | 0.95 | |
Loss from discontinued operations | | | (0.61 | ) | | | — | | | (0.61 | ) |
| | | | | | | | | | | |
Net income | | $ | 0.20 | | | $ | 0.14 | | $ | 0.34 | |
| | | | | | | | | | | |
| Note: | Per share amounts may not sum due to rounding |
Prior to adoption of SFAS 123(R), the Company presented all tax benefits of deductions resulting from the exercise of stock options as operating cash flows in the Consolidated Statements of Cash Flows. SFAS 123(R) requires the cash flows resulting from tax deductions in excess of the compensation cost recognized for those options (excess tax benefits) to be classified as financing cash flows. The $3.2 million excess tax benefit classified as a financing cash inflow for the year ended December 31, 2006 would have been classified as an operating cash inflow if the Company had not adopted SFAS 123(R).
In periods prior to January 1, 2006, the Company elected to follow Accounting Principles Board Opinion No. 25,“Accounting for Stock Issued to Employees” and related interpretations (“APB 25”) in accounting for its employee stock options. Under APB 25, because the exercise price of the Company’s employee stock options equaled the market price of the underlying stock on the date of the grant, no compensation expense was recognized. In accordance with APB 25, the compensation recorded for employee stock grants was equal to the fair
57 CHOICEPOINT 2006 ANNUAL REPORT
Notes to Consolidated Financial Statements
CHOICEPOINT 2006 ANNUAL REPORT
value of the grant on the measurement date (the date of the grant), as determined by the closing price of the Company’s common stock on that date. Some employee stock grants vested in future periods based on a requirement of continued service to the Company. For these stock grants the fair value of the stock grant was recorded as deferred compensation in the equity section of the Company’s Consolidated Balance Sheets, and was expensed on a straight-line basis over the vesting period.
The following disclosure shows what the Company’s net income and basic and diluted earnings per share would have been using the fair value model under SFAS 123 for the years ended December 31, 2005 and 2004 (in thousands, except per share data):
| | | | | | | | |
| | | Year Ended December 31, | |
| | | 2005 | | | 2004 | |
Net income, as reported | | $ | 140,656 | | | $ | 147,955 | |
Add: Stock-based employee compensation expense included in reported net income, net of related tax effects | | | 3,455 | | | | 4,199 | |
Deduct: Total stock-based employee compensation expense determined under fair value based method for all awards, net of related tax effects | | | (15,572 | ) | | | (12,655 | ) |
| | | | | | | | |
Pro forma net income | | $ | 128,539 | | | $ | 139,499 | |
| | | | | | | | |
Basic EPS – as reported | | $ | 1.59 | | | $ | 1.69 | |
Basic EPS – pro forma | | $ | 1.45 | | | $ | 1.59 | |
Diluted EPS – as reported | | $ | 1.53 | | | $ | 1.62 | |
Diluted EPS – pro forma | | $ | 1.40 | | | $ | 1.53 | |
Grantor Trusts – ChoicePoint has established two grantor trusts which are used to purchase ChoicePoint common stock in the open market as previously approved by the Board of Directors for distribution under its various compensation and benefit plans. Funds from the grantor trusts totaling $26.0 million representing 1.3 million shares in 2006, and $26.1 million representing 1.3 million shares of ChoicePoint common stock in 2005 are reflected as treasury stock, at cost, in the December 31 consolidated balance sheets. Cash remaining in the grantor trusts of approximately $675,000 at December 31, 2006 and $650,000 at December 31, 2005 are included in cash and cash equivalents in the accompanying consolidated balance sheets.
Treasury Stock – In addition to the common stock held in the grantor trusts and shares repurchased as noted above, in accordance with the terms of the awards, ChoicePoint redeemed 20,000 shares of common stock at market price in consideration of the minimum tax obligations for nonvested stock vestings, or for the cancellation of nonvested stock at a total cost of $865,000 in 2006. No additional shares were redeemed in 2005. In 2004, in consideration of the minimum tax obligations for restricted stock vestings, 3,900 shares of common stock were redeemed at market price at a total cost of $151,000.
9 Capital Transactions
On July 26, 2005, ChoicePoint’s Board of Directors approved a stock buyback program for the repurchase of up to $250 million of Company stock. On several occasions during 2006, the Company’s Board of Directors approved increases to the value of the buyback program up to the currently authorized total of $725 million. The Company may repurchase stock under the program from time to time through August 18, 2007.
The following table details activity under the repurchase program since inception (in thousands except per share amounts):
| | | | | | | | |
| | | Total number of shares repurchased | | Average cost per share | | Total cost for shares |
| | | |
| | | |
Year ended | | | | | | | | |
December 31, 2005 | | 2,946.7 | | $ | 42.62 | | $ | 125,592 |
Year ended | | | | | | | | |
December 31, 2006 | | 11,375.0 | | | 37.56 | | | 427,248 |
| | | | | | | | |
Inception of buyback program through | | | | | | | | |
December 31, 2006 | | 14,321.7 | | $ | 38.60 | | | 552,840 |
| | | | | | | | |
Remaining amount authorized as of | | | | | | | | |
December 31, 2006 | | | | | | | | 172,160 |
| | | | | | | | |
Total amount authorized | | | | | $ | 725,000 |
| | | | | | | | |
10 Employee Benefits
401(k) Profit Sharing Plan – ChoicePoint adopted a 401(k) profit sharing plan, under which eligible Company employees may contribute up to 75% of their compensation. ChoicePoint intends to make matching contributions in the form of ChoicePoint common stock equal to a minimum of 25% of an employee’s contributions up to the first 6% of the employee’s salary. The match made on eligible employee contributions was 27% for 2006, 38% for 2005 and 58% for 2004. Employee contributions will be invested in one of the available investment funds, as selected by the employee. Matching contributions will be invested in the ChoicePoint stock fund. ChoicePoint may make additional contributions based on achievement of targeted performance levels. The expense for the 401(k) profit sharing plan was $2.4 million in 2006, $3.5 million in 2005 and $4.0 million in 2004.
58 CHOICEPOINT 2006 ANNUAL REPORT
Notes to Consolidated Financial Statements
CHOICEPOINT 2006 ANNUAL REPORT
As a result of the Spinoff, ChoicePoint agreed to contribute to a defined contribution plan for certain ChoicePoint employees. The additional benefits are intended to offset the adverse impact of transitioning out of a defined benefit pension plan and represent the present value of the estimated future contributions. The expense recognized and amounts contributed to the 401(k) profit sharing plan to offset the adverse impact of transitioning out of the defined benefit plan was $1.7 million in 2006, $1.5 million in 2005 and $1.4 million in 2004.
Deferred Compensation Plan – ChoicePoint offers deferred compensation plans to directors and certain officers of the Company. Under these plans, amounts earned by an officer or director may be deferred and credited with gains and losses based upon four different investment alternatives, including ChoicePoint common stock. The corresponding deferred compensation liability is recorded at the current fair value of the individual’s investment elections and any changes are recorded as expense in the period incurred. As of December 31, 2006 and 2005, related to these plans, the Company has recorded an other long-term liability of $22.0 million and $20.8 million, respectively.
Postretirement Benefits – As a result of the Spinoff, the Company agreed to provide certain retiree health care and life insurance benefits for a defined group of eligible employees. No additional members have been added to this group since the Spinoff. Health care and life insurance benefits are provided through a trust. The Company accrues the cost of providing postretirement benefits for medical and life insurance coverage over the active service period of each employee, net of the estimated amount of participant contributions. These postretirement benefit plans are unfunded. The accounting for the health care plans anticipates future cost-sharing changes to the written plans that are consistent with the Company’s expressed intent to increase retiree contributions equal to a percentage of health care cost increases. ChoicePoint uses December 31 as the measurement date for these plans.
The following table presents a reconciliation of the changes in the plan’s benefit obligations and fair value of assets at December 31, 2006 and 2005:
| | | | | | | | |
| | | December 31, | |
(In thousands) | | 2006 | | | 2005 | |
Change in benefit obligation: | | | | | | | | |
Obligation at beginning of year | | $ | 25,960 | | | $ | 31,215 | |
Service cost | | | 54 | | | | 56 | |
Interest cost | | | 1,349 | | | | 1,682 | |
Actuarial loss (gain) | | | (1,773 | ) | | | 1,875 | |
Medicare subsidies accrued | | | 876 | | | | — | |
Anticipated future Medicare subsidies | | | — | | | | (3,504 | ) |
Benefit payments, net of participant contributions of $2,450 in 2006 and $2,186 in 2005 | | | (3,070 | ) | | | (5,364 | ) |
| | | | | | | | |
Obligation at end of year | | | 23,396 | | | | 25,960 | |
| | | | | | | | |
Change in plan assets: | | | | | | | | |
Fair value of plan assets at beginning of year | | | — | | | | — | |
Employer contributions | | | 2,194 | | | | 5,364 | |
Benefit payments | | | (2,194 | ) | | | (5,364 | ) |
| | | | | | | | |
Fair value of plan assets at end of year | | | — | | | | — | |
| | | | | | | | |
On December 31, 2006, the Company adopted the recognition and disclosure provisions of SFAS 158. SFAS 158 required the Company to recognize the funded status (i.e., the difference between the fair value of plan assets and the projected benefit obligations) of its benefit plans in the December 31, 2006 Consolidated Balance Sheet, with a corresponding adjustment to accumulated other comprehensive income, net of tax. The adjustment to accumulated other comprehensive income at adoption of $5.5 million ($3.4 million net of tax) represents the net unrecognized actuarial gains and unrecognized prior service credit.
The following table shows the calculation of the accrued postretirement benefit cost recognized in “Postretirement benefit obligations” on the Company’s Consolidated Balance Sheet at December 31, 2006 and 2005:
| | | | | | | |
(In thousands) | | 2006 | | | 2005 |
Funded status | | $ | 23,396 | | | $ | 25,960 |
Unrecognized prior service credit | | | 234 | | | | 446 |
Unrecognized actuarial gain | | | 5,222 | | | | 3,523 |
Accumulated other comprehensive income | | | (5,456 | ) | | | — |
| | | | | | | |
Net amount recognized on consolidated balance sheet | | | 23,396 | | | | 29,929 |
Current portion | | | 2,578 | | | | 5,000 |
| | | | | | | |
Accrued benefit cost | | $ | 20,818 | | | $ | 24,929 |
| | | | | | | |
CHOICEPOINT 2006 ANNUAL REPORT59
Notes to Consolidated Financial Statements
CHOICEPOINT 2006 ANNUAL REPORT
The current portion is included in other current liabilities in the accompanying consolidated balance sheets. Net periodic postretirement benefit expense includes the following components:
| | | | | | | | | | | | |
| | | Year Ended December 31, | |
(In thousands) | | 2006 | | | 2005 | | | 2004 | |
Service cost | | $ | 54 | | | $ | 56 | | | $ | 100 | |
Interest cost on accumulated benefit obligation | | | 1,349 | | | | 1,682 | | | | 1,801 | |
Amortization of net gain | | | (74 | ) | | | — | | | | — | |
Amortization of prior service cost | | | (212 | ) | | | (295 | ) | | | (375 | ) |
| | | | | | | | | | | | |
Net periodic postretirement benefit expense | | $ | 1,117 | | | $ | 1,443 | | | $ | 1,526 | |
| | | | | | | | | | | | |
The following are weighted average assumptions used in the computation of postretirement benefit expense and the related obligation:
| | | | | | | | | |
| | | Year Ended December 31, | |
| | | 2006 | | | 2005 | | | 2004 | |
Discount rate used to determine accumulated postretirement benefit obligation at December 31 | | 5.71 | % | | 5.50 | % | | 5.75 | % |
Discount rate used to determine net periodic postretirement benefit expense | | 5.50 | % | | 5.75 | % | | 5.75 | % |
Initial health care cost trend rate | | 9.33 | % | | 10.33 | % | | 11.33 | % |
Ultimate health care cost trend rate | | 5.25 | % | | 5.25 | % | | 5.25 | % |
Year ultimate health care cost trend rate reached | | 2013 | | | 2013 | | | 2013 | |
| | | | | | | | | |
Assumed health care trend rates have a significant effect on the amounts reported for health care plans. If the health care cost trend rate were changed by 1% for all future years, the accumulated postretirement benefit obligation (“APBO”) as of December 31, 2006 would have been impacted as follows:
| | | | | | | |
(In thousands) | | 1-Percentage Point Increase | | 1-Percentage Point Decrease | |
| | |
Effect on total APBO | | $ | 305 | | $ | (284 | ) |
Effect on total service cost plus interest cost | | $ | 16 | | $ | (15 | ) |
The Company expects the following net benefits to be paid from the postretirement benefit plan:
| | | | | | |
| | | Projected Benefit Payments |
(In thousands) | | Before
Medicare
Subsidy | | After
Medicare
Subsidy |
2007 | | $ | 3,343 | | $ | 2,578 |
2008 | | | 3,131 | | | 2,305 |
2009 | | | 2,910 | | | 2,623 |
2010 | | | 2,723 | | | 2,439 |
2011 | | | 2,649 | | | 2,373 |
2012 – 2016 | | | 10,551 | | | 10,551 |
The Company continues to evaluate ways in which it can better manage these benefits and control its costs. Any changes in the plan, revisions to assumptions or changes in the Medicare program that affect the amount of expected future benefits may have a significant effect on the amount of the reported obligation and future annual expense.
11 Commitments and Contingencies
Leases – The Company’s operating leases involve principally office space and office equipment. Rental expense relating to these leases was $21.1 million in 2006, $19.0 million in 2005 and $16.4 million in 2004. Included in the operating leases are three synthetic lease agreements (Note 6). The Company has accounted for these synthetic leases as operating leases and has recorded rent expense. If the Company had elected to purchase the property instead of entering into the synthetic leases, assets and debt would have increased by $83.5 million at December 31, 2006 and the Company would have recorded additional depreciation expense of $2.7 million in 2006, $2.4 million in 2005 and $2.2 million in 2004. Future minimum payment obligations for noncancelable operating leases exceeding one year, net of subleases and assuming the utilization of the full notional amount under the synthetic leases, are as follows as of December 31, 2006:
| | | |
| (In thousands) | | |
Year | | Amount |
2007 | | $ | 18,736 |
2008 | | | 16,884 |
2009 | | | 15,971 |
2010 | | | 14,734 |
2011 | | | 13,187 |
Thereafter | | | 11,947 |
| | | |
| | $ | 91,459 |
| | | |
60CHOICEPOINT 2006 ANNUAL REPORT
Notes to Consolidated Financial Statements
CHOICEPOINT 2006 ANNUAL REPORT
Change in Control Provisions in Employment Agreements– The Company has entered into employment agreements with certain officers to provide severance pay and benefits in the event of a “change in control” of ChoicePoint. At December 31, 2006, the maximum contingent liability under the agreements or plans was approximately $32.1 million. In addition, the Company’s stock-based compensation plans provide that all outstanding grants shall become fully vested in the event of a change in control.
Litigation and Fraudulent Data Access – Below is a description of the Company’s material pending legal proceedings. While the ultimate resolution of the matters discussed below cannot presently be determined, an unfavorable outcome in these cases could have a material adverse effect on the Company’s financial condition or results of operations.
Class Action Litigation– A class action lawsuit against the Company was filed in the United States District Court for the Southern District of Florida on August 11, 2003 (Fresco, et al. v. Automotive Directions Inc., et al.) alleging that the Company obtained, disclosed and used information obtained from the Florida Department of Highway Safety and Motor Vehicles (“Florida DHSMV”) in violation of the federal Driver’s Privacy Protection Act (“DPPA”). The plaintiffs seek to represent classes of individuals whose personal information from Florida DHSMV records has been obtained, disclosed and used for marketing purposes or other allegedly impermissible uses by ChoicePoint without the express written consent of the individual. A number of the Company’s competitors have also been sued in the same or similar litigation in Florida. This complaint seeks certification as a class action, compensatory damages, attorneys’ fees and costs, and injunctive and other relief. ChoicePoint has joined with the other defendants in a motion for judgment on the pleadings as to the plaintiffs’ “obtaining” claim. To date, the Court has not ruled on the pending motion. After vigorously defending against the action, the defendants engaged in court ordered mediation beginning in February 2006. A proposed settlement agreement was filed with the court on December 20, 2006, and the settling parties await the scheduling of a hearing for preliminary approval of the settlement. The Company believes that any additional liability which may result from the resolution of this action in excess of the amounts provided will not have a material effect on the financial condition, results of operations, or cash flows of the Company.
On January 5, 2007, a purported class action lawsuit was filed against the Company and certain of its competitors in the United States District Court for the Eastern District of Texas (Taylor v. Acxiom Corporation), on behalf of each and every individual in the State of Texas whose name, address, driver identification number, and certain other identifiers are contained in motor vehicle records obtained by the defendants from the Texas Department of Public Safety without the express consent of the individual during the period from June 1, 2000 through the date of judgment. The plaintiff also filed pleadings seeking to intervene in theFresco litigation and objecting to the proposed settlement agreement for such litigation. A Motion to Stay Proceedings in theFresco litigation pending the outcome of the Texas Court’s class certification determination inTaylor was also filed by such plaintiff. On February 8, 2007, the Company filed a motion to dismiss theTaylor litigation based on the fact thatFresco was first-filed, the nationwide class inFresco encompasses the Texas class, and reasons of judicial economy and fundamental fairness dictate against duplicative class actions in federal courts.
Fraudulent Data Access – ChoicePoint’s review of the fraudulent data access described in the Company’s public filings and other similar incidents is ongoing. The Company believes that the number of consumers to which it will send notice of potential fraudulent data access could increase from the number of consumers it has notified to date, but the Company does not anticipate that any such increase would be significant.
The Company is involved in several legal proceedings or investigations that relate to these matters. ChoicePoint is unable at this time to predict the outcome of these actions. The ultimate resolution of these matters could have a material adverse impact on the Company’s financial results, financial condition, and liquidity and on the trading price of the Company’s common stock. Regardless of the merits and ultimate outcome of these lawsuits and other proceedings, litigation and proceedings of this type are expensive and will require that substantial Company resources and executive time be devoted to defend these proceedings.
ChoicePoint has entered into a settlement with the FTC regarding its investigation into the Company’s compliance with federal laws governing consumer information security and related issues, including the fraudulent data access which occurred last year. The terms of the settlement called for a non-tax deductible civil penalty of $10 million, the establishment of a $5 million fund to be administered by the FTC for consumer redress initiatives, completion of certain one-time and on-going customer credentialing activities such as additional site visits, and undertaking additional obligations relating to information security. The settlement also requires ChoicePoint to obtain, every two years for the next 20 years, an assessment from a qualified, independent, third-party professional to ensure that its information security program meets the standards of the order. As part of this settlement, ChoicePoint did not admit to the truth of, or liability for, any
61 CHOICEPOINT 2006 ANNUAL REPORT
Notes to Consolidated Financial Statements
CHOICEPOINT 2006 ANNUAL REPORT
of the matters alleged by the FTC. In the fourth quarter of 2005, the Company recorded a pre-tax charge of $8.0 million
($8.8 million net of taxes) for the FTC settlement that represents the $10.0 million civil penalty, the $5.0 million fund for consumer redress initiatives, and a $4.0 million charge for additional obligations under the order offset by $11.0 million of insurance proceeds. The insurance proceeds were received by the Company in the first quarter of 2006.
The Company has received a variety of inquiries and requests from state Attorneys General as a result of the fraudulent data access. Generally, these state Attorneys General are requiring that all affected individuals in each of their respective states receive appropriate notice. The Company has mailed notices to the potentially affected consumers identified to date. In addition, certain state Attorneys General have requested, including by use of subpoena, information and documents to determine whether ChoicePoint has violated any laws regarding consumer protection and related matters. The Company is cooperating with the state Attorneys General in connection with these inquiries.
ChoicePoint received notice from the SEC on May 12, 2005 that it is conducting an investigation into the circumstances surrounding any possible identity theft, trading in ChoicePoint stock by its Chief Executive Officer and Chief Operating Officer and related matters. The Company cooperated with the SEC and provided the requested information and documents.
The Company is a defendant in a purported class action lawsuit that resulted from the consolidation of four previously filed class actions in the U.S. District Court for the Central District of California.Harrington, et al. v ChoicePoint, CV05-1294. The plaintiffs’ First Amended Consolidated Class Action Complaint against ChoicePoint Inc. and three subsidiaries alleges violations of the federal Fair Credit Reporting Act (“FCRA”) and certain California statutes. The six named plaintiffs purport to bring the lawsuit on behalf of a national class of persons about whom ChoicePoint provided a consumer report as defined in the FCRA to rogue customers, as well as five California classes of affected persons. Plaintiffs seek actual, statutory and exemplary damages and injunctive relief, attorneys’ fees and costs. On July 10, 2006, the U.S. District Court consolidated theHarrington case with theWilson case, described below. The cases remain separate but are being handled as one case under the same judge.
On June 15, 2005, a similar purported class action lawsuit was filed against ChoicePoint Inc. in the United States District Court for the Northern District of Georgia, Atlanta Division,Wilson v. ChoicePoint Inc., 1-05-CV-1604. The plaintiffs allege violations of the FCRA, the DPPA, and Georgia’s Uniform Deceptive Trade Practices Act (“DTPA”), and the three named plaintiffs purport to represent a national class of persons whose consumer credit reports as defined in the FCRA or personal or highly restricted personal information as defined in the DPPA was disclosed to third parties as a result of acts or omissions by ChoicePoint. Plaintiffs seek actual, statutory, and punitive damages, injunctive relief and fees and costs. On February 28, 2006, the Court granted ChoicePoint’s motion to transfer theWilson case to the U.S. District Court, Central District of California. The Company filed a motion for partial summary judgment on August 10, 2006. The court granted that motion on October 12, 2006, with respect to the claims of six of the nine plaintiffs. The Company intends to defend the remaining claims vigorously.
On March 4, 2005, a purchaser of the Company’s securities filed a lawsuit against the Company and certain of its officers in the United States District Court for the Central District of California. The complaint alleges that the defendants violated federal securities laws by issuing false or misleading information in connection with the fraudulent data access. Additional complaints alleging substantially similar claims have been filed by other purchasers of the Company’s securities in the Central District of California on March 10, 2005 and in the Northern District of Georgia on March 11, 2005, March 22, 2005 and March 24, 2005. By court order the cases pending in the Central District of California have been transferred to the Northern District of Georgia. By order dated August 5, 2005, the court consolidated each of the pending cases into a single consolidated action,In re ChoicePoint Inc. Securities Litigation, 1:05-CV-00686. A Consolidated Amended Complaint was filed on January 13, 2006, and seeks certification as a class action and unspecified compensatory damages, attorneys’ fees, costs, and other relief. On March 14, 2006, the defendants filed a motion to dismiss the Consolidated Amended Complaint, which remains pending before the court. On November 21, 2006, the court entered an Order denying the defendants’ motion to dismiss. Thereafter, defendants moved the court to certify its Order for immediate review. The court granted that motion on January 10, 2007. On January 25, 2007 the defendants filed a petition asking the 11th Circuit Court of Appeals to allow them to appeal on an interlocutory basis. Plaintiff’s response was filed on February 16, 2007. If the 11th Circuit grants defendants’ petition, then the 11th Circuit will set a briefing schedule for defendants’ appeal of the November 21st Order. The district court has administratively closed the case pending the resolution of the interlocutory appeal. As a result, all proceedings in the district court are currently stayed. The Company intends to defend this lawsuit vigorously.
62 CHOICEPOINT 2006 ANNUAL REPORT
Notes to Consolidated Financial Statements
CHOICEPOINT 2006 ANNUAL REPORT
On May 20, 2005, a purported class action lawsuit was filed in the United States District Court for the Northern District of Georgia against ChoicePoint and certain individuals who are alleged to be fiduciaries under the ChoicePoint Inc. 401(k) Profit Sharing Plan (the “Plan”),Curtis R. Mellott v. ChoicePoint Inc.,et al., 1:05-CV-1340. The suit alleges violations of ERISA fiduciary rules through the acquisition and retention of ChoicePoint stock by the Plan on and after November 24, 2004. Plaintiffs seek compensatory damages, injunctive and equitable relief, attorneys’ fees and costs. On April 14, 2006, the defendants filed a motion to dismiss, which remains pending before the court. The Company intends to defend this lawsuit vigorously.
On June 27, 2005, the Company was served with a shareholder derivative lawsuit. The initial lawsuit was filed in the Superior Court of Gwinnett County, Georgia, and alleges that some of the Company’s officers breached their fiduciary duties by engaging in insider trading and requests unspecified compensatory damages, attorneys’ fees, costs and other relief. On July 6, 2005, a second shareholder derivative lawsuit was filed in the Superior Court of Fulton County, Georgia alleging that some of the Company’s officers engaged in insider trading and that all of the board members breached their fiduciary duties by failing to adequately oversee the Company’s operations. The Gwinnett County action was subsequently transferred to Fulton County, and the Superior Court of Fulton County has consolidated both cases into a single action,In re ChoicePoint Inc. Derivative Litigation, 2005-CV-103219. Plaintiffs seek unspecified compensatory and exemplary damages, attorneys’ fees, costs and other relief. On January 12, 2006, the Company moved to dismiss and answered the Consolidated Amended Complaint. The court granted the Company’s motion to dismiss and dismissed the complaint on June 8, 2006. On June 28, 2006, the plaintiffs appealed the dismissal of their Complaint to the Georgia Court of Appeals. Plaintiffs’ appeal has been fully briefed and remains pending before the Georgia Court of Appeals.
The Company is continuing to strengthen its customer credentialing procedures and is recredentialing components of its customer base, particularly customers that have access to products that are regulated by the Fair Credit Reporting Act. Further, the Company continues to review and investigate other matters related to credentialing and customer use. The Company’s investigations as well as those of law enforcement continue. The Company believes that there could be other instances that may result in notification to consumers. As previously stated, the Company intends for consumers to be notified, irrespective of current state law requirements, if it is determined that their sensitive personally identifiable information has been acquired by unauthorized parties. The Company does not believe that the impact from notifying affected consumers will be material to the financial position, results of operations or cash flows of the Company.
Other Litigation – The Company also is involved in other litigation from time to time in the ordinary course of its business. The Company provides for estimated legal fees and settlements relating to pending lawsuits when they are probable and reasonably estimable. The Company does not believe that the outcome of any such pending or threatened litigation in the ordinary course of business will have a material adverse effect on the financial position or results of operations of ChoicePoint. However, as is inherent in legal proceedings where issues may be decided by finders of fact, there is a risk that unpredictable decisions adverse to the Company could be reached.
12Other Operating Charges
Other operating charges include the following:
| | | | | | | | | |
(In thousands) | | Year Ended December 31, |
| | | 2006 | | 2005 | | 2004 |
Marketing Services segment impairment | | $ | 99,400 | | $ | — | | $ | — |
Other asset impairments | | | 10,720 | | | — | | | — |
Lease abandonment and severance | | | 3,943 | | | 1,472 | | | — |
Fraudulent data access related expense | | | 3,509 | | | 27,301 | | | — |
| | | | | | | | | |
Total other operating charges | | $ | 117,572 | | $ | 28,773 | | $ | — |
| | | | | | | | | |
A breakdown of other operating charges by segment for the year ended December 31, 2006 is as follows:
| | | | | | | | | | | | | | | | | | | | | |
(In thousands) | | Insurance
Services | | Screening and
Authentication
Services | | Financial and
Professional
Services | | Government
Services | | Marketing
Services | | Other | | Total |
2006 | | | | | | | | | | | | | | | | | | | | | |
Asset impairments | | $ | — | | $ | — | | $ | 10,720 | | $ | — | | $ | 99,400 | | $ | — | | $ | 110,120 |
Lease abandonment and severance | | | 331 | | | 31 | | | 3,330 | | | 110 | | | 87 | | | 54 | | | 3,943 |
Fraudulent data access related expense | | | — | | | — | | | — | | | — | | | — | | | 3,509 | | | 3,509 |
| | | | | | | | | | | | | | | | | | | | | |
Total other operating charges | | $ | 331 | | $ | 31 | | $ | 14,050 | | $ | 110 | | $ | 99,487 | | $ | 3,563 | | $ | 117,572 |
| | | | | | | | | | | | | | | | | | | | | |
CHOICEPOINT 2006 ANNUAL REPORT63
Notes to Consolidated Financial Statements
CHOICEPOINT 2006 ANNUAL REPORT
Of total other operating charges recorded in 2006, $99.4 million represents the net impairment charge on the Company’s Marketing Services segment. This net charge consists of a $110.0 million charge recorded in the third quarter of 2006, offset by the reversal of anticipated selling costs of $10.6 million recorded in the fourth quarter of 2006. The Company announced its intent to divest the Marketing Service segment in the second quarter of 2006 as part of a strategic review. Based on indicative bids received, the Company recorded the $110.0 million charge to reduce the carrying value of this business to reflect the estimated net proceeds expected to be realized. The $10.6 million reversal of anticipated selling costs was recognized during the fourth quarter of 2006 after the Company announced its intent to retain the Marketing Services segment. In addition, as part of the strategic review, the Company recorded additional impairment, lease abandonment and severance charges totaling $14.7 million primarily related to the centralization of functions and consolidation of certain technology platforms. Also, an additional $3.5 million was recorded for legal fees and other professional fees associated with the fraudulent data access previously disclosed in the Company’s SEC filings. At December 31, 2006, $9.6 million was accrued for obligations related to the above charges incurred to date that includes $7.1 million for legal and other fees associated with the fraudulent data access, and $2.5 million related to severance and lease abandonment costs.
During 2005, the Company recorded other operating charges of $28.8 million that included a pre-tax charge of $8.0 million ($8.8 million net of taxes) for the settlement reached with the Federal Trade Commission (“FTC”) in January 2006, $19.3 million ($11.9 million net of taxes) for specific legal expenses and other professional fees related to the fraudulent data access and $1.5 million ($0.9 million net of taxes) for lease abandonment charges related to the consolidation of two facilities. The terms of the settlement agreement with the FTC call for a non-tax deductible civil penalty of $10 million, the establishment of a $5 million fund to be administered by the FTC for consumer redress initiatives, completion of certain onetime and ongoing customer credentialing activities, such as additional site visits, and undertaking additional obligations relating to information security. The settlement also requires ChoicePoint to obtain, every two years for the next 20 years, an assessment from a qualified, independent, third-party professional to ensure that its information security program meets the standards of the order.
The $8.0 million charge for the FTC settlement consisted of the $10.0 million civil penalty, the $5.0 million fund for consumer redress initiatives, a $4.0 million charge for additional obligations under the order, offset by the $11.0 million recovery of these fees received from the Company’s insurance carrier during the first quarter of 2006. A total of $28.7 million, which includes the $19.0 million for the FTC settlement, was recorded as an other current liability in the December 31, 2005 Consolidated Balance Sheet. The $11.0 million insurance receivable related to the FTC settlement was included in other current assets in the December 31, 2005 Consolidated Balance Sheet.
13Related Party Transactions
During 2006 and 2005, one director of ChoicePoint served as a director of The Home Depot, Inc. The Company performed services for The Home Depot, Inc. totaling approximately $18.5 million ($13.6 million net of pass-through expenses) in 2006 and approximately $21.5 million ($20.3 million net of pass-through expenses) in 2005. These services were the result of arm’s-length negotiations in the ordinary course of business.
Until April 2005, one director of ChoicePoint served as a director of General Electric Company. During 2005, the Company performed business outsourcing, software solutions, marketing services, public records and background screening services for General Electric Company and its subsidiaries totaling approximately $12.5 million. These services were the result of arm’s-length negotiations in the ordinary course of business.
One director of ChoicePoint served as Vice Chairman of Wal-Mart Stores, Inc. until his retirement in January 2005 and as a director of Wal-Mart until March 2005. In 2005, the Company performed services for Wal-Mart totaling approximately $2.8 million. These services were the result of arm’s-length negotiations in the ordinary course of business. The director resigned from the ChoicePoint Board of Directors in October 2005.
14Segment Disclosures
As previously indicated, the Company announced plans to divest the Bode Labs, EquiSearch and BLJ businesses as a result of its company-wide strategic review, as discussed in Note 5. To reflect how the Company is operating under its new strategic focus, the Company revised the segments in which it reports its financial results. The Business Services
64 CHOICEPOINT 2006 ANNUAL REPORT
Notes to Consolidated Financial Statements
CHOICEPOINT 2006 ANNUAL REPORT
segment has been divided into two segments: the Screening and Authentication Services segment, and the Financial and Professional Services segment. Historical information in the discussions and tables included herein has been reclassified to conform to the current presentation. ChoicePoint’s continuing operations are focused on five primary markets – Insurance Services, Screening and Authentication Services, Financial and Professional Services, Government Services, and Marketing Services that constitute its five reportable segments. Management evaluates the performance of its segments exclusive of other operating charges (Note 12). Sales and transfers between segments are generally accounted for at cost plus a reasonable profit; the effects of inter-segment sales are immaterial to the computation of segment profit. See Note 1 for a description of each reportable segment.
In January 2005, ChoicePoint acquired i2 Ltd., with a location in Cambridge, United Kingdom, which generates a significant amount of its revenue from outside of the United States. For the years ended December 31, 2006, 2005, and 2004, less than 5% of the Company’s total revenue was generated outside of the United States. No one customer represents more than 10% of total revenue.
| | | | | | | | | | | | | | | | | | | | | |
| | | December 31, 2006 | | | December 31, 2005 | | | December 31, 2004 | |
(In thousands) | | Revenue | | Operating Income | | | Revenue | | Operating Income | | | Revenue | | Operating Income | |
Insurance Services | | $ | 454,458 | | $ | 239,843 | | | $ | 402,853 | | $ | 221,670 | | | $ | 352,368 | | $ | 195,851 | |
Screening and Authentication Services | | | 257,088 | | | 57,096 | | | | 242,054 | | | 58,980 | | | | 212,706 | | | 43,715 | |
Financial and Professional Services(a) | | | 105,041 | | | 12,998 | | | | 117,510 | | | 22,738 | | | | 113,768 | | | 26,338 | |
Government Services | | | 135,813 | | | 15,656 | | | | 129,358 | | | 19,326 | | | | 70,523 | | | 18,020 | |
Marketing Services | | | | | | | | | | | | | | | | | | | | | |
Marketing Services service revenue | | | 79,714 | | | 12,446 | | | | 91,529 | | | 15,899 | | | | 93,389 | | | 18,651 | |
Reimbursable expenses | | | 22,878 | | | — | | | | 28,056 | | | — | | | | 34,280 | | | — | |
| | | | | | | | | | | | | | | | | | | | | |
Marketing Services | | | 102,592 | | | 12,446 | | | | 119,585 | | | 15,899 | | | | 127,669 | | | 18,651 | |
Royalty | | | — | | | — | | | | 2,398 | | | 1,722 | | | | 4,504 | | | 2,062 | |
Corporate and shared(b) | | | — | | | (71,287 | ) | | | — | | | (76,223 | ) | | | — | | | (69,552 | ) |
Accelerated depreciation | | | — | | | (5,463 | ) | | | — | | | — | | | | — | | | — | |
Stock option expense | | | — | | | (15,401 | ) | | | — | | | — | | | | — | | | — | |
Other operating charges (Note 12) | | | — | | | (117,572 | ) | | | — | | | (28,773 | ) | | | — | | | — | |
| | | | | | | | | | | | | | | | | | | | | |
Total from continuing operations | | $ | 1,054,992 | | $ | 128,316 | | | $ | 1,013,758 | | $ | 235,339 | | | $ | 881,538 | | $ | 235,085 | |
| | | | | | | | | | | | | | | | | | | | | |
| | | | | | | | | | | | | | | | | | |
| | | Assets December 31, | | Depreciation and Amortization December 31, |
(In thousands) | | 2006 | | 2005 | | 2004 | | 2006 | | 2005 | | 2004 |
Insurance Services | | $ | 274,029 | | $ | 243,124 | | $ | 214,033 | | $ | 14,296 | | $ | 10,433 | | $ | 8,179 |
Screening and Authentication | | | | | | | | | | | | | | | | | | |
Services | | | 368,732 | | | 382,914 | | | 384,852 | | | 13,303 | | | 12,169 | | | 11,850 |
Financial and Professional Services | | | 223,783 | | | 294,096 | | | 284,921 | | | 12,646 | | | 13,728 | | | 9,841 |
Government Services | | | 239,537 | | | 254,368 | | | 140,775 | | | 16,171 | | | 16,797 | | | 9,705 |
Marketing Services | | | 137,079 | | | 232,334 | | | 228,057 | | | 6,590 | | | 6,440 | | | 6,763 |
Royalty | | | — | | | — | | | 347 | | | — | | | — | | | 1,356 |
Unallocated and Other(c) | | | 71,419 | | | 56,140 | | | 34,491 | | | 9,655 | | | 10,027 | | | 9,037 |
Assets Held for Sale (Note 5) | | | 31,513 | | | — | | | — | | | — | | | — | | | — |
Accelerated Depreciation | | | — | | | — | | | — | | | 5,463 | | | — | | | — |
| | | | | | | | | | | | | | | | | | |
Total | | $ | 1,346,092 | | $ | 1,462,976 | | $ | 1,287,476 | | $ | 78,124 | | $ | 69,594 | | $ | 56,731 |
| | | | | | | | | | | | | | | | | | |
| (a) | As announced on March 4, 2005, the Company discontinued the sale of certain information services offered by its Business Services Segment. |
| (b) | Corporate and shared expenses represent costs of support functions, research and development initiatives, incentives and profit sharing that benefit all segments. |
| (c) | Unallocated and Other includes certain corporate items that are not allocated to the segments. |
CHOICEPOINT 2006 ANNUAL REPORT65
Notes to Consolidated Financial Statements
CHOICEPOINT 2006 ANNUAL REPORT
The Company owned a 62.5% interest in laser patent revenue relating to certain patents involving laser technology that expired in November 2004 and May 2005. In 2004 and 2005, revenue from these patents is included in Royalty above. Upon the expiration of the applicable patents, the Company lost its right to exclude others from exploiting the inventions claimed therein, and accordingly, the obligation of third parties to make royalty payments ceased.
15 Quarterly Financial Summary (Unaudited)
Following is a summary of the unaudited interim results of operations for each quarter in the years ended December 31, 2006 and 2005:
| | | | | | | | | | | | | | | | |
| | | Year Ended December 31, 2006 |
(In thousands, except per share data) | | First Quarter | | Second Quarter | | Third Quarter | | | Fourth Quarter | | Total |
| | | | | |
Service revenue | | $ | 253,383 | | $ | 255,549 | | $ | 262,692 | | | $ | 260,490 | | $ | 1,032,114 |
Reimbursable expenses | | | 6,726 | | | 5,084 | | | 4,934 | | | | 6,134 | | | 22,878 |
| | | | | | | | | | | | | | | | |
Total revenue | | | 260,109 | | | 260,633 | | | 267,626 | | | | 266,624 | | | 1,054,992 |
Cost of service revenue | | | 135,095 | | | 131,344 | | | 137,459 | | | | 138,037 | | | 541,935 |
Reimbursable expenses | | | 6,726 | | | 5,084 | | | 4,934 | | | | 6,134 | | | 22,878 |
| | | | | | | | | | | | | | | | |
Gross profit | | | 118,288 | | | 124,205 | | | 125,233 | | | | 122,453 | | | 490,179 |
Operating income (loss)(a) | | | 53,832 | | | 61,371 | | | (50,558 | ) | | | 63,671 | | | 128,316 |
Net income (loss) | | | 30,610 | | | 34,861 | | | (72,216 | ) | | | 23,667 | | | 16,922 |
EPS, basic | | | 0.36 | | | 0.41 | | | (0.89 | ) | | | 0.30 | | | 0.21 |
EPS, diluted | | | 0.34 | | | 0.40 | | | (0.86 | ) | | | 0.30 | | | 0.20 |
| | | | | | | | | | | | | | | |
| | | Year Ended December 31, 2006 |
(In thousands, except per share data) | | First Quarter | | Second Quarter | | Third Quarter | | Fourth Quarter | | Total |
| | | | | |
Service revenue | | $ | 242,151 | | $ | 246,100 | | $ | 256,843 | | $ | 240,608 | | $ | 985,702 |
Reimbursable expenses | | | 6,543 | | | 6,623 | | | 7,479 | | | 7,411 | | | 28,056 |
| | | | | | | | | | | | | | | |
Total revenue | | | 248,694 | | | 252,723 | | | 264,322 | | | 248,019 | | | 1,013,758 |
Cost of service revenue | | | 123,872 | | | 129,908 | | | 130,632 | | | 121,532 | | | 505,944 |
Reimbursable expenses | | | 6,543 | | | 6,623 | | | 7,479 | | | 7,411 | | | 28,056 |
| | | | | | | | | | | | | | | |
Gross profit | | | 118,279 | | | 116,192 | | | 126,211 | | | 119,076 | | | 479,758 |
Operating income(b) | | | 59,966 | | | 57,578 | | | 65,598 | | | 52,197 | | | 235,339 |
Net income | | | 36,970 | | | 36,418 | | | 39,584 | | | 27,684 | | | 140,656 |
EPS, basic | | | 0.42 | | | 0.41 | | | 0.44 | | | 0.31 | | | 1.59 |
EPS, diluted | | | 0.40 | | | 0.40 | | | 0.43 | | | 0.30 | | | 1.53 |
The unaudited quarterly financial information reflects all adjustments that are, in the opinion of management, necessary for a fair presentation of the results for the interim periods presented.
| (a) | The Company recorded $5.5 million of accelerated depreciation as a result of the centralization of functions and consolidation of technology platforms during the first quarter of 2006. The Company recorded $3.5 million of stock-based compensation expense during the first quarter of 2006, $3.4 million in the second quarter of 2006, $4.3 million in the third quarter of 2006 and $4.2 million in the fourth quarter of 2006 as a result of the adoption of SFAS 123(R). Additionally, the Company recorded other operating charges of $6.0 million, $2.7 million, $116.1 million and a benefit of $7.2 million in the first, second, third, and fourth quarters of 2006, respectively. Of these charges, $3.5 million relates to specific expenses of the fraudulent data access, $3.9 million related to the abandonment of certain leases and severance related to the consolidation of facilities, and $110.1 million relates to asset impairments recorded for the Company’s decision to divest certain businesses as a part of the company-wide strategic review discussed in Note 5, net of the reversal of anticipated selling costs of $10.6 million recorded as a result of the Company’s decision to retain the Marketing Services segment. |
| (b) | The Company recorded other operating charges of $5.4 million, $6.0 million, $4.0 million and $11.8 million in the first, second, third and fourth quarters of 2005 respectively related to specific expenses of the fraudulent data access that is discussed in Note 11. Additionally, in the fourth quarter of 2005, the Company recorded $1.5 million related to the abandonment of certain leases related to the consolidation of facilities. The effect of these items on net income was $3.3 million or $0.04 per share in the first quarter of 2005, $3.8 million or $0.04 per share in the second quarter of 2005, $2.5 million or $0.03 per share in the third quarter of 2005 and $12.1 million or $0.14 per share in the fourth quarter of 2005. |
66 CHOICEPOINT 2006 ANNUAL REPORT
Shareholder Information
C H O I C E P O I N T 2 0 0 6 A N N U A L R E P O R T
Annual Meeting
The Annual Meeting of Shareholders will be held on May 1, 2007 in Memphis, TN. Shareholders are encouraged to attend the meeting, which will begin at 10:00 a.m. local time.
Market Information
ChoicePoint common stock trades on the New York Stock Exchange (“NYSE”), under the symbol CPS. Shareholders will find volume and pricing information in leading financial publications as well as the Investor Relations section of ChoicePoint’s Web site,www.choicepoint.com.
As of February 21, 2007, there were 76.6 million common shares outstanding and ChoicePoint common stock was held by 3,103 shareholders of record.
Management’s Certifications
The certifications of the Company’s Chief Executive Officer and Chief Financial Officer required by the Sarbanes-Oxley Act have been included as Exhibits 31 and 32 in the Company’s Form 10-K. In addition, in 2006, the Company’s Chief Executive Officer provided to the NYSE an unqualified certification as to the Company’s compliance with the NYSE’s corporate governance listing standards during 2005 as required by the NYSE listing standards.
Quarterly Stock Performance
ChoicePoint common stock first traded on August 8, 1997 at a price of $8.94 – adjusted for a two-for-one stock split effective November 24, 1999, a three-for-two split effective March 7, 2001 and a four-for-three split effective June 6, 2002. Shown below, on that adjusted basis, are high and low sale prices for each quarter of 2005 and 2006.
| | | | | | |
| | | High | | Low |
First Quarter 2005 | | $ | 47.95 | | $ | 36.35 |
Second Quarter 2005 | | | 41.75 | | | 36.64 |
Third Quarter 2005 | | | 43.89 | | | 39.42 |
Fourth Quarter 2005 | | | 44.65 | | | 40.55 |
| | |
First Quarter 2006 | | $ | 46.85 | | $ | 40.98 |
Second Quarter 2006 | | | 45.98 | | | 40.80 |
Third Quarter 2006 | | | 41.92 | | | 30.50 |
Fourth Quarter 2006 | | | 40.05 | | | 34.09 |
ChoicePoint Stock Performance Graph
The following graph compares the cumulative total return from December 31, 2001 through December 31, 2006 on ChoicePoint common stock with the S&P Midcap 400 Index and the S&P 400 Diversified Commercial Services Index assuming an original $100 investment and reinvestment of any dividends.
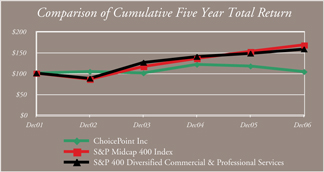
Analyst Coverage
A number of leading Sell Side financial analysts and investment advisory services produce investment research on ChoicePoint. For a current list, see the Investor Relations section of the ChoicePoint Web site,www.choicepoint.com.
Dividend Policy
ChoicePoint has not paid any dividends since it became a public company, and it does not anticipate paying any in the near future.
Investor Information
The Investor Relations section of ChoicePoint’s corporate Web site, www.choicepoint.com, contains a wealth of valuable information, ranging from financial news releases and filings to archived (audio) copies of investor conference calls.
For additional information, or to obtain copies of ChoicePoint’s Annual Report on Form 10-K for the year ended December 31, 2006 (which will be provided free of charge with a copy of the financial statements and schedules), Quarterly Reports on Form 10-Q, or other materials, please contact:
Carey Skinner
Assistant Vice President, Investor Relations
1000 Alderman Drive
Alpharetta, GA 30005
Email: investor.relations@choicepoint.com
Phone: 770-752-3369
Financial reports can also be obtained from ChoicePoint’s Web site.
Conference Calls
ChoicePoint conducts quarterly conference calls to discuss financial performance and other issues of importance to investors. To learn about scheduled calls, hear archived copies of previous calls, and to listen in to live Webcasts, visit the Web site at www.choicepoint.com.
Transfer Agent and Registrar
Shareholders with questions concerning the transfer of shares, lost certificates, changes of address, or other issues should contact ChoicePoint’s transfer agent and registrar:
Computershare Investor Services, LLC
P.O. Box 43078
Providence, RI 02940-3078
Phone: (800) 568-3476
Web site: www.computershare.com
Independent Registered Public Accounting Firm
Deloitte & Touche LLP Atlanta, GA
Trademarks
ChoicePoint, the ChoicePoint logo, Current Carrier, VitalChek, i2, and C.L.U.E. are registered trademarks; VendorScreen, InsurView and VolunteerSelectare service marks or trademarks of ChoicePoint Asset Company.
© 2007 ChoicePoint Asset Company. All rights reserved.