


Fixed Income Wrap Government/Corporate
Intermediate Sub-Advisory Composite
ANNUAL DISCLOSURE PRESENTATION
Intermediate Sub-Advisory Composite
ANNUAL DISCLOSURE PRESENTATION
| Year End | Total Firm Assets (millions) | Composite Assets | Annual Performance Results | ||||
| USD (millions) | Number of Accounts | Composite Gross | Composite Net | Index | Composite Dispersion | ||
| 2008 2007 2006 2005 2004 2003 2002 2001 2000 1999 1998 1997 1996 1995 1994 1993 | 5,497 | 1,970 | 4,360 | 7.55% | 6.23% | 5.07% | 0.6% |
| 7,273 | 2,008 | 4,660 | 8.22% | 6.90% | 7.40% | 0.1% | |
| 8,102 | 2,282 | 5,337 | 4.31% | 3.02% | 4.08% | 0.09% | |
| 9,022 | 2,774 | 6,571 | 1.65% | 0.39% | 1.57% | 0.1% | |
| 8,813 | 3,087 | 7,149 | 1.88% | 0.62% | 3.04% | 0.2% | |
| 7,419 | 3,010 | 6,458 | 3.42% | 2.14% | 4.30% | 0.3% | |
| 6,272 | 2,822 | 5,554 | 7.97% | 6.65% | 9.82% | 0.7% | |
| 5,526 | 2,260 | 4,058 | 8.63% | 7.31% | 8.98% | 0.6% | |
| 4,584 | 1,748 | 2,876 | 9.67% | 8.34% | 10.10% | 0.3% | |
| 3,956 | 1,312 | 2,324 | 0.56% | (0.69%) | 0.39% | 0.2% | |
| 3,682 | 1,059 | 1,736 | 8.90% | 7.57% | 8.42% | 0.2% | |
| 3,122 | 761 | 1,228 | 7.90% | 6.58% | 7.87% | 0.2% | |
| 2,641 | 531 | 1,073 | 3.90% | 2.62% | 4.06% | 0.2% | |
| 2,265 | 421 | 905 | 15.05% | 13.66% | 15.31% | 0.3% | |
| 1,833 | 261 | 717 | (0.58%) | (1.82%) | (1.93%) | 0.2% | |
| 1,696 | 167 | 450 | 7.16% | 5.85% | 8.78% | 0.6% | |
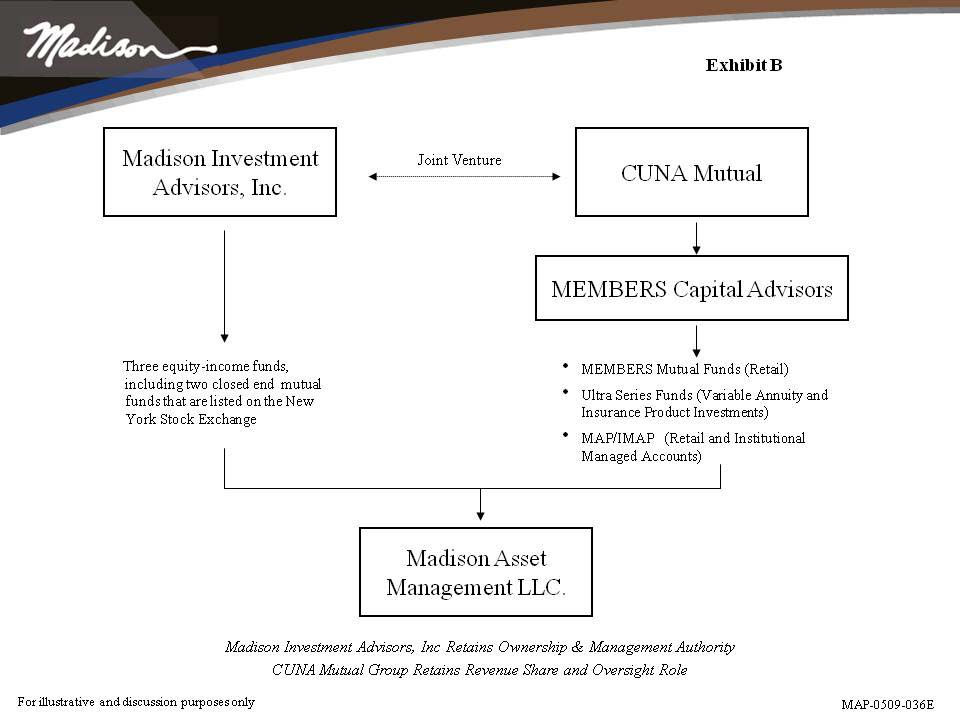
Fixed Income Wrap Government/Corporate Intermediate Sub-Advisory Composite contains fully discretionary sub-advised fixed income government/corporate intermediate wrap fee accounts. For comparison purposes the composite is measured against the Barclays Capital U.S. Intermediate Government/Credit Index (Index). Madison Investment Advisors, Inc. has prepared and presented this report in compliance with the Global Investment Performance Standards (GIPS®). Madison Investment Advisors, Inc. is a registered investment adviser. The firm maintains a complete list and description of composites, which is available upon request by calling Lydia Kiebzak at 608.274.0300. Results are based on fully discretionary accounts under management, including those accounts no longer with the firm. Past performance is not indicative of future results. The U.S. Dollar is the currency used to express performance. Returns are presented gross and net of fees and include the reinvestment of all income. Gross returns are shown as supplemental information and are stated gross of all fees and transaction costs; net returns are reduced by the highest all-inclusive wrap fee of 1.25%. Wrap accounts make up 100% of the composite for all periods shown. Wrap fees include Madison’s portfolio management fee, as well as all charges for trading costs, custody, and other administrative fees. The annual composite dispersion presented is an equal-weighted standard deviation calculated for the accounts in the composite the entire year. Additional information regarding policies for calculating and reporting returns is available upon request. Madison’s management fee schedule is as follows: 0.50% annually on the first $5 million; 0.40% annually on the next $15 million; 0.35% annually on the next $15 million. Wrap fee schedules are provided by independent wrap sponsors and are available upon request from the respective wrap sponsor. Actual investment advisory fees incurred by clients may vary. The Fixed Income Wrap Government/Corporate Intermediate Sub-Advisory Composite was created January 1, 2002. Madison Investment Advisors Inc.’s compliance with the GIPS standards has been verified for the period January 1, 1991 through September 30, 2008 by Ashland Partners & Company LLP. A copy of the verification report is available upon request.
MAP-0509-036E
MADISON INVESTMENT ADVISORS, INC.
FIXED INCOME WRAP CORPORATE ONLY
INTERMEDIATE SUB-ADVISORY COMPOSITE
ANNUAL DISCLOSURE PRESENTATION
| Year End | Total Firm Assets (millions) | Composite Assets | Annual Performance Results | ||||
| USD (millions) | Number of Accounts | Composite Gross | Composite Net | Index | Composite Dispersion | ||
| 2008 | 5,497 | 90 | 360 | 2.61% | 1.34% | -2.75% | 0.6% |
| 2007 | 7,273 | 91 | 356 | 6.52% | 5.21% | 5.62% | 0.2% |
| 2006 | 7,782 | 102 | 392 | 4.82% | 3.53% | 4.50% | 0.1% |
| 2005 | 8,793 | 100 | 392 | 1.58% | 0.32% | 1.42% | 0.2% |
| 2004 | 8,813 | 105 | 380 | 2.67% | 1.40% | 4.08% | 0.2% |
| 2003 | 7,419 | 78 | 305 | 4.42% | 3.13% | 6.91% | 0.5% |
| 2002 | 6,272 | 43 | 133 | 8.50% | 7.18% | 10.14% | 1.3% |
| 2001 | 5,526 | 1,481 | 4,058 | 8.76% | 7.44% | 9.77% | 0.6% |
| 2000 | 4,584 | 1,114 | 2,876 | 9.54% | 8.20% | 9.26% | 0.3% |
| 1999 | 3,956 | 750 | 2,324 | 0.02% | (1.23%) | 0.16% | 0.2% |
| 1998 | 3,682 | 595 | 1,736 | 9.28% | 7.95% | 8.29% | 0.2% |
| 1997 | 3,122 | 307 | 1,228 | 9.88% | 8.55% | 8.36% | 0.2% |
| 1996 | 2,641 | 164 | 1,073 | 3.76% | 2.48% | 3.97% | 0.2% |
| 1995 | 2,265 | 133 | 905 | 20.74% | 19.31% | 18.99% | 0.3% |
| 1994 | 1,833 | 86 | 717 | (3.53%) | (4.74%) | (2.66%) | 0.2% |
| 1993 | 1,696 | 52 | 450 | 9.72% | 8.39% | 11.13% | 0.6% |
Fixed Income Wrap Corporate Only Intermediate Sub-Advisory Composite contains fully discretionary sub-advised fixed income corporate-only intermediate wrap fee accounts. For comparison purposes the composite is measured against the Barclays Capital U.S. Intermediate Credit Index (Index). Madison Investment Advisors, Inc. has prepared and presented this report in compliance with the Global Investment Performance Standards (GIPS®). Madison Investment Advisors, Inc. is a registered investment adviser. The firm maintains a complete list and description of composites, which is available upon request by calling Lydia Kiebzak at 608-274-0300. Results are based on fully discretionary accounts under management, including those accounts no longer with the firm. Past performance is not indicative of future results. The U.S. Dollar is the currency used to express performance. Gross returns are shown as supplemental information and are stated gross of all fees and transaction costs; net returns are reduced by the highest all-inclusive wrap fee of 1.25%. Wrap accounts make up 100% of the composite for all periods shown. Wrap fees include Madison’s portfolio management fee, as well as all charges for trading costs, custody, and other administrative fees. The annual composite dispersion presented is an equal-weighted standard deviation calculated for the accounts in the composite the entire year. Prior to January 1, 2002 this dispersion was calculated using the total return of accounts in the Fixed Income Wrap Government/Corporate Intermediate Sub-Advisory Composite for the entire year. Additional information regarding policies for calculating and reporting returns is available upon request. Madison’s management fee schedule is as follows: 0.50% annually on the first $5 million; 0.40% annually on the next $15 million; 0.35% annually on the next $15 million. Wrap fee schedules are provided by independent wrap sponsors and are available upon request from the respective wrap sponsor. Actual investment advisory fees incurred by clients may vary. Prior to January 1, 2002, balanced portfolio segments were included in this composite and performance reflects required total segment plus cash returns using a pro rata cash allocation. Prior to January 1, 2002, the Fixed Income Wrap Corporate Only Intermediate Sub-Advisory Composite consisted of corporate segments of the Fixed Income Wrap Government/Corporate Intermediate Sub-Advisory Composite and during this period the membership between the two composites was identical. The Fixed Income Wrap Corporate Only Intermediate Sub-Advisory Composite was created January 1, 2002. Madison Investment Advisors, Inc.’s compliance with the GIPS standards has been verified for the period January 1, 1991 through September 30, 2008 by Ashland Partners & Company LLP. A copy of the verification report is available upon request.
MAP-0509-036E
MADISON INVESTMENT ADVISORS, INC.
INSTITUTIONAL STRATEGIC CORE FIXED INCOME COMPOSITE
ANNUAL DISCLOSURE PRESENTATION
| Year End | Total Firm Assets (millions) | Composite Assets | Annual Performance Results | ||||
| USD (millions) | Number of Accounts | Composite Gross | Composite Net | Index | Composite Dispersion | ||
| 2008 2007 | 5,497 | 75 | 1 | 8.01% | 7.48% | 5.24% | N/A |
| 7,273 | 67.5 | 1 | 7.75% | 7.22% | 7.02% | N/A | |
Institutional Strategic Core Fixed Income Composite contains fully discretionary institutional fixed income government/corporate accounts. For comparison purposes the composite is measured against the Barclays Capital U.S. Aggregate Index (Index).
Madison Investment Advisors, Inc. has prepared and presented this report in compliance with the Global Investment Performance Standards (GIPS®).
Madison Investment Advisors, Inc. is a registered investment adviser. The firm maintains a complete list and description of composites, which is available upon request by calling Lydia Kiebzak at 608-274-0300.
The U.S. Dollar is the currency used to express performance. Returns are presented gross and net of management fees and include the reinvestment of all income. Net returns are reduced by the highest applicable annual management fee of 0.50%. The collection of fees produces a compounding effect on the total rate of return net of management fees. The annual composite dispersion presented is an equal-weighted standard deviation calculated for the accounts in the composite the entire year. Additional information regarding policies for calculating and reporting returns is available upon request.
Madison’s management fee schedule is as follows: 0.50% annually on the first $5 million; 0.40% annually on the next $15 million; 0.35% annually on the next $15 million. Actual investment advisory fees incurred by clients may vary.
The Institutional Strategic Core Fixed Income Composite was created January 1, 2007. Madison Investment Advisors, Inc.’s compliance with the GIPS standards has been verified for the period January 1, 1991 through September 30, 2008 by Ashland Partners & Company LLP. A copy of the verification report is available upon request.
MAP-0509-036E
Madison Investment Advisors, Inc.
LARGE CAP EQUITY WRAP COMPOSITE
Annual Disclosure Presentation
| Year End | Total Firm Assets (millions) | Composite Assets | Annual Performance Results | ||||
| USD (millions) | Number of Accounts | Composite Gross | Composite Net | S&P 500 | Composite Dispersion | ||
| 2008 2007 2006 2005 2004 2003 2002 2001 2000 1999 1998 1997 1996 1995 1994 1993 1992 | 5,497 | 623 | 3,845 | (31.61%) | (33.85%) | (37.00%) | 0.6% |
| 7,273 | 1,331 | 5,717 | 0.88% | -(2.11%) | 5.49% | 0.4% | |
| 8,102 | 2,153 | 8,342 | 17.22% | 13.88% | 15.79% | 0.3% | |
| 9,022 | 2,384 | 10,597 | (2.05%) | (4.97%) | 4.91% | 0.2% | |
| 8,813 | 2,319 | 9,925 | 13.06% | 9.80% | 10.88% | 0.3% | |
| 7,419 | 1,453 | 7,029 | 23.03% | 19.55% | 28.69% | 0.6% | |
| 6,272 | 728 | 4,828 | (15.60%) | (18.22%) | (22.10%) | 0.4% | |
| 5,526 | 214 | 1,231 | (1.16%) | (4.11%) | (11.88%) | 0.5% | |
| 4,584 | 28 | 130 | 12.64% | 9.39% | (9.11%) | 0.6% | |
| 3,956 | 21 | 83 | 6.23% | 3.12% | 21.04% | 0.5% | |
| 3,682 | 10 | 35 | 20.18% | 16.75% | 28.58% | 1.0% | |
| 3,122 | 6 | 22 | 36.86% | 33.09% | 33.36% | N.A. | |
| 2,641 | 2 | 6 | 33.25% | 29.57% | 22.96% | 0.6% | |
| 2,265 | 2 | 7 | 50.76% | 46.72% | 37.58% | 5.4% | |
| 1,833 | 2 | 7 | (0.34%) | (3.31%) | 1.32% | N.A. | |
| 1,696 | 1 | Five or fewer | (0.81%) | (3.76%) | 10.08% | N.A. | |
| 1,194 | 1 | Five or fewer | 11.76% | 8.53% | 7.62% | N.A. | |
Large Cap Equity Wrap Composite contains fully discretionary large cap equity wrap fee accounts. For comparison purposes the composite is measured against the S&P 500 Index. Madison Investment Advisors, Inc. has prepared and presented this report in compliance with the Global Investment Performance Standards (GIPS®). Prior to July 1, 2006, the composite was named the Core Large Cap Equity Wrap Composite. Madison Investment Advisors, Inc. is a registered investment adviser. The firm maintains a complete list and description of composites, which is available upon request by calling Lydia Kiebzak at 608.274.0300. Results are based on fully discretionary accounts under management, including those accounts no longer with the firm. Composite policy requires the temporary removal of any portfolio incurring a client-initiated significant cash inflow or outflow of greater than 75% of portfolio assets. The temporary removal of such an account occurs at the beginning of the month in which the significant cash flow occurs and the account re-enters the composite the first full month after the cash flow. Additional information regarding the treatment of significant cash flows is available upon request. Past performance is not indicative of future results. The U.S. Dollar is the currency used to express performance. Returns are presented gross and net of fees and include the reinvestment of all income. Gross returns are shown as supplemental information and are stated gross of all fees and have not been reduced by transaction costs; net performance was calculated using the highest annual all-inclusive wrap fee of 3.00% applied quarterly. Wrap accounts make up 100% of the composite for all periods shown. Wrap fees include Madison’s portfolio management, as well as all charges for trading costs, custody, and other administrative fees. The annual composite dispersion presented is an equal-weighted standard deviation calculated for the accounts in the composite the entire year. Additional information regarding policies for calculating and reporting returns is available upon request. Madison’s fee schedule is as follows: 0.80% annually on the first $5 million; 0.60% annually on the balance. Wrap fee schedules are provided by independent wrap sponsors and are available upon request from the respective wrap sponsor. Actual investment advisory fees incurred by clients may vary. Prior to January 1, 1997, balanced portfolio segments were included in this composite and performance reflects required total segment plus cash returns using a predetermined cash allocation percentage. The Large Cap Equity Wrap Composite was created January 1, 2003. Madison Investment Advisors, Inc.’s compliance with GIPS standards has been verified for the period January 1, 1991 through September 30, 2008 by Ashland Partners & Company, LLP. A copy of the verification report is available upon request.
MAP-0509-036E
Madison Investment Advisors, Inc.
Mid Cap Equity Wrap Composite
Annual Disclosure Presentation
| Year End | Total Firm Assets (millions) | Wrap Composite Assets | Annual Performance Results | ||||
| USD (millions) | Number of Accounts | Composite Gross | Composite Net | Russell Midcap | Composite Dispersion | ||
| 2008 2007 2006 2005 2004 | 5,497 | 251 | 1,597 | -35.25% | -37.39% | -41.46% | 0.7% |
| 7,273 | 519 | 2,049 | 10.41% | 7.22% | 5.60% | 0.3% | |
| 8,102 | 488 | 1,850 | 17.73% | 14.37% | 15.26% | 0.4% | |
| 9,022 | 352 | 1,531 | 1.94% | (1.07%) | 12.65% | 0.4% | |
| 8,813 | 77 | 283 | |||||
| Year End | Total Firm Assets (millions) | Non-Wrap Composite Assets | Annual Performance Results | ||||
| USD (thousands) | Number of Accounts | Composite Gross | Composite Net | Russell Midcap | Composite Dispersion | ||
| 2003 | 7,419 | 5,830 | Five or fewer | 32.47% | 28.79% | 40.06% | N.A. |
| 2002 | 6,272 | 660 | Five or fewer | (14.16%) | (16.81)% | (16.19%) | N.A. |
| 2001 | 5,526 | 798 | Five or fewer | 16.28% | 12.94% | (5.63%) | N.A. |
| 2000 | 4,584 | 722 | Five or fewer | 20.35% | 16.94% | 8.25% | N.A. |
| 1999 | 3,956 | 7,689 | 9 | 13.57% | 10.29% | 18.23% | 1.2% |
| 1998 | 3,682 | 6,735 | 10 | 7.54% | 4.39% | 10.10% | 0.9% |
| 1997 | 3,122 | 7,578 | 12 | 20.88% | 17.45% | 29.01% | 2.2% |
| 1996 | 2,641 | 7,188 | 13 | ||||
| N.A. - Information is not statistically meaningful due to an insufficient number of portfolios in the composite for the entire year. |
Mid Cap Equity Wrap Composite contains fully discretionary mid cap equity wrap fee accounts. For comparison purposes the composite is measured against the Russell Midcap Index. Results prior to 3/1/04 are that of the Mid-Cap Equity Non-Wrap composite. Madison Investment Advisors, Inc. has prepared and presented this report in compliance with the Global Investment Performance Standards (GIPS®). Madison Investment Advisors, Inc. is a registered investment adviser. The firm maintains a complete list and description of composites, which is available upon request by calling Lydia Kiebzak at 608.274.0300. Results are based on fully discretionary accounts under management, including those accounts no longer with the firm. Composite policy requires the temporary removal of any portfolio incurring a client-initiated significant cash inflow or outflow of greater than 75% of portfolio assets. The temporary removal of such an account occurs at the beginning of the month in which the significant cash flow occurs and the account re-enters the composite the first full month after the cash flow. Additional information regarding the treatment of significant cash flows is available upon request. Past performance is not indicative of future results. The U.S. Dollar is the currency used to express performance. Returns are presented gross and net of fees and include the reinvestment of all income. Gross returns are shown as supplemental information and are stated gross of all fees and have not been reduced by transaction costs; net performance was calculated using the highest annual all-inclusive wrap fee of 3.00% applied quarterly. Wrap fees include Madison’s portfolio management, as well as all charges for trading costs, custody, and other administrative fees. The annual composite dispersion presented is an equal-weighted standard deviation calculated for the accounts in the composite the entire year. Additional information regarding policies for calculating and reporting returns is available upon request. Madison’s management fee schedule is as follows: 0.80% annually on the first $5 million; 0.60% annually on the balance. Wrap fee schedules are provided by independent wrap sponsors and are available upon request from the respective wrap sponsor. Actual investment advisory fees incurred by clients may vary. The Mid Cap Equity Wrap Composite was created February 29, 2004. Beginning 3/1/04, wrap accounts make up 100% of the composite. Madison Investment Advisors, Inc.’s compliance with the GIPS standards has been verified for the period January 1, 1991 through September 30, 2008 by Ashland Partners & Company LLP. A copy of the verification report is available upon request.
MAP-0509-036E