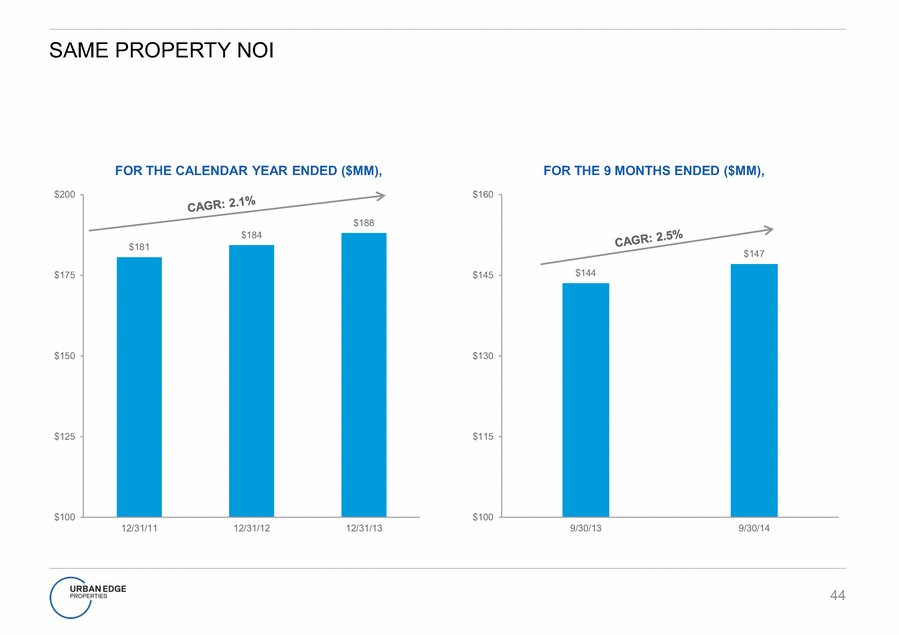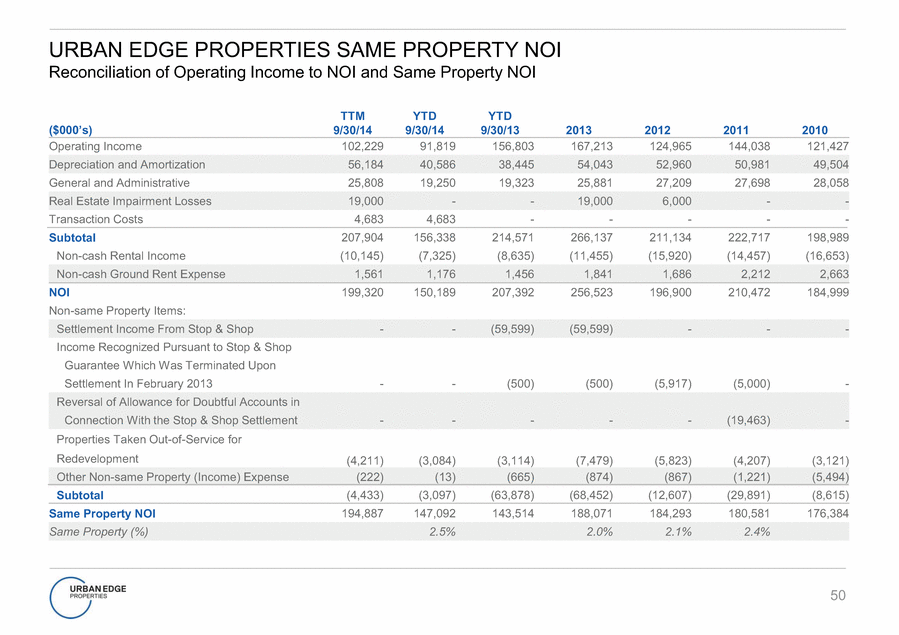
| 50 TTM 9/30/14 YTD 9/30/14 YTD 9/30/13 2013 2012 2011 2010 Operating Income 102,229 91,819 156,803 167,213 124,965 144,038 121,427 Depreciation and Amortization 56,184 40,586 38,445 54,043 52,960 50,981 49,504 General and Administrative 25,808 19,250 19,323 25,881 27,209 27,698 28,058 Real Estate Impairment Losses 19,000 - - 19,000 6,000 - - Transaction Costs 4,683 4,683 - - - - - Subtotal 207,904 156,338 214,571 266,137 211,134 222,717 198,989 Non-cash Rental Income (10,145) (7,325) (8,635) (11,455) (15,920) (14,457) (16,653) Non-cash Ground Rent Expense 1,561 1,176 1,456 1,841 1,686 2,212 2,663 NOI 199,320 150,189 207,392 256,523 196,900 210,472 184,999 Non-same Property Items: Settlement Income From Stop & Shop - - (59,599) (59,599) - - - Income Recognized Pursuant to Stop & Shop Guarantee Which Was Terminated Upon Settlement In February 2013 - - (500) (500) (5,917) (5,000) - Reversal of Allowance for Doubtful Accounts in Connection With the Stop & Shop Settlement - - - - - (19,463) - Properties Taken Out-of-Service for Redevelopment (4,211) (3,084) (3,114) (7,479) (5,823) (4,207) (3,121) Other Non-same Property (Income) Expense (222) (13) (665) (874) (867) (1,221) (5,494) Subtotal (4,433) (3,097) (63,878) (68,452) (12,607) (29,891) (8,615) Same Property NOI 194,887 147,092 143,514 188,071 184,293 180,581 176,384 Same Property (%) 2.5% 2.0% 2.1% 2.4% URBAN EDGE PROPERTIES SAME PROPERTY NOI Reconciliation of Operating Income to NOI and Same Property NOI |

