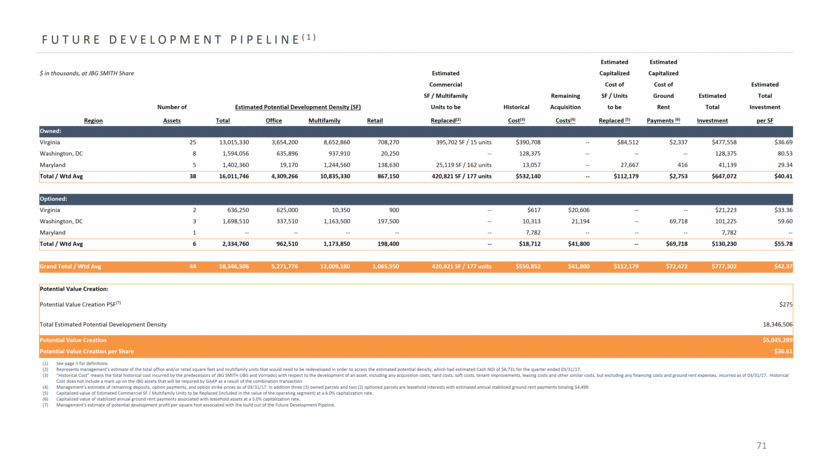
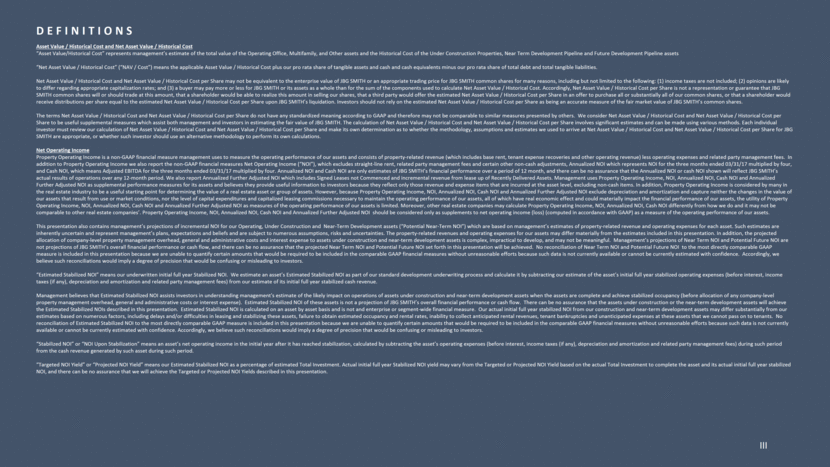
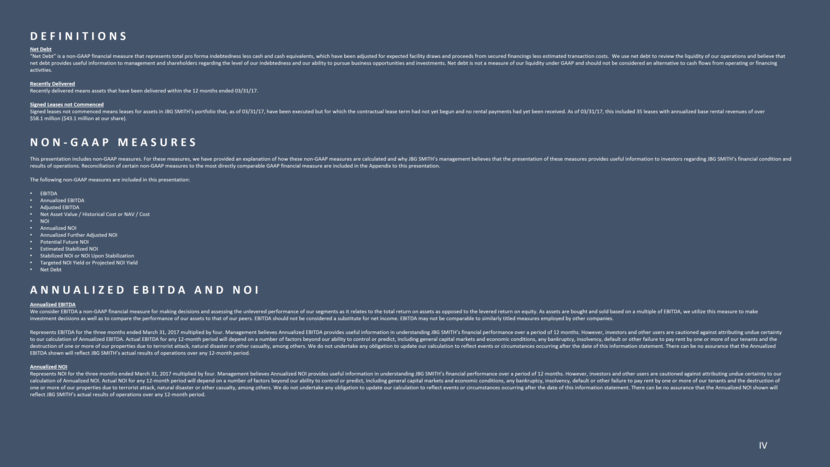
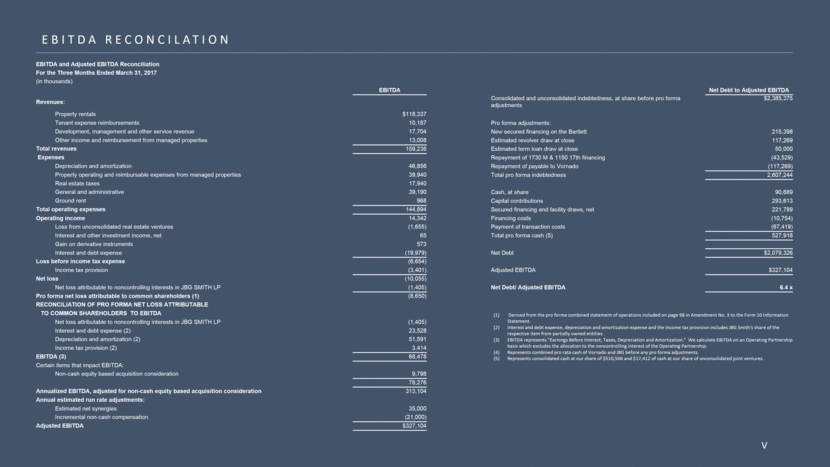
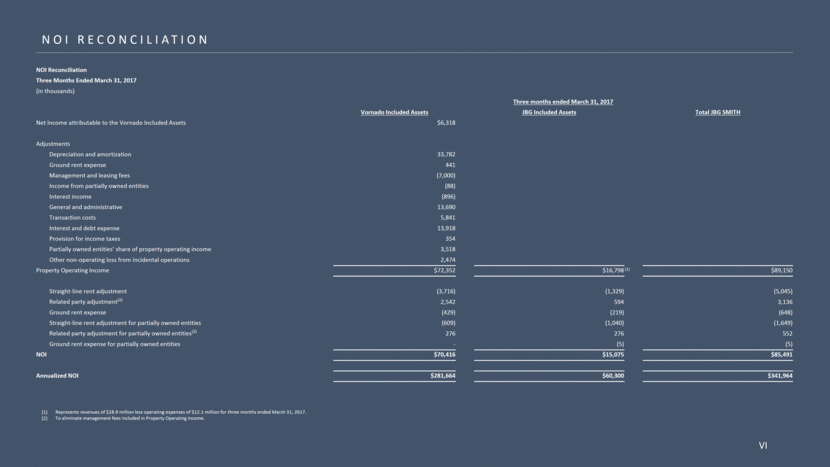
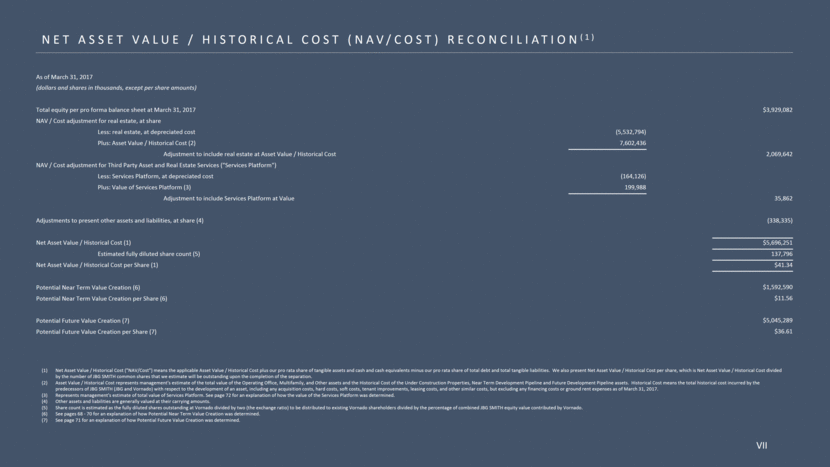
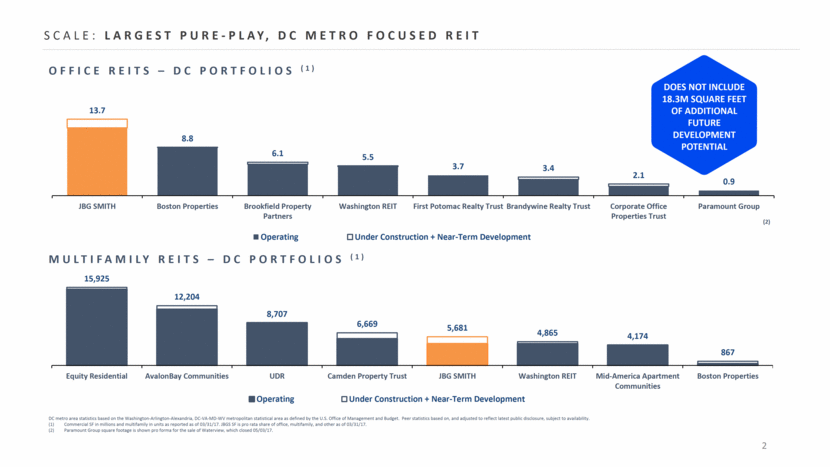
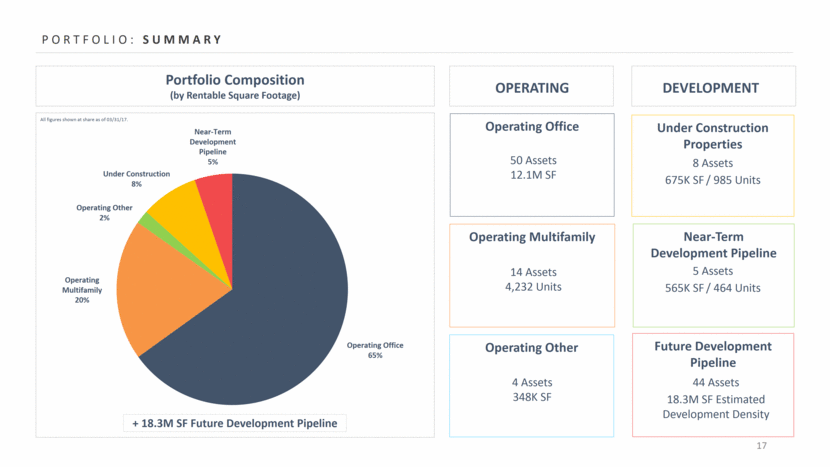
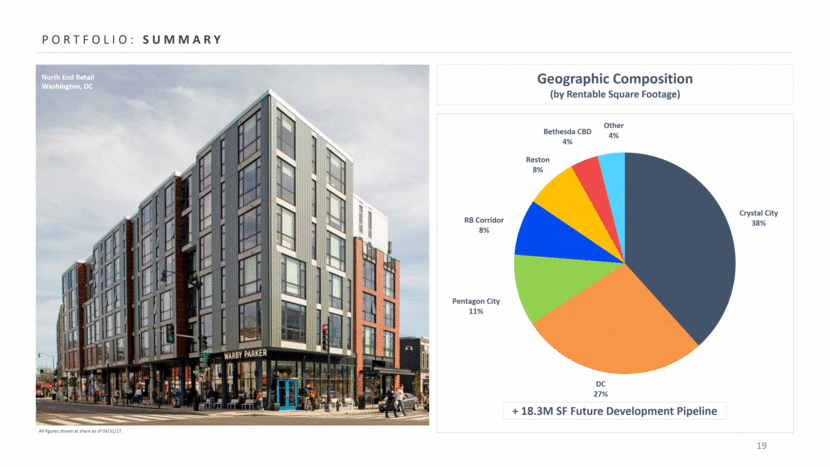
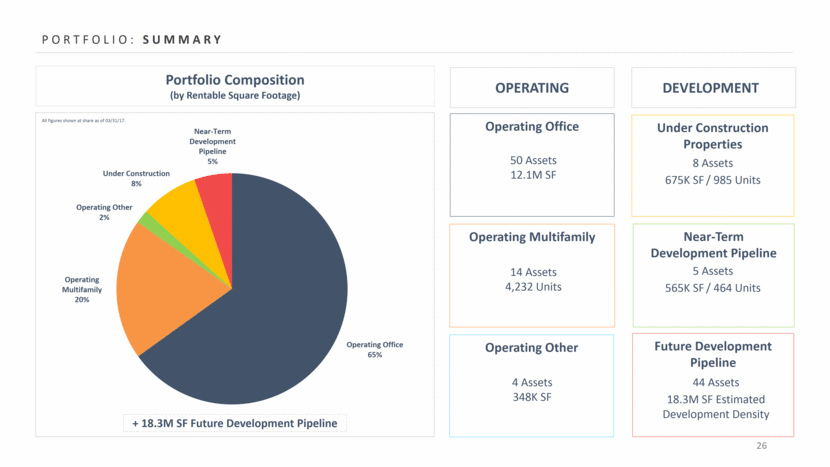
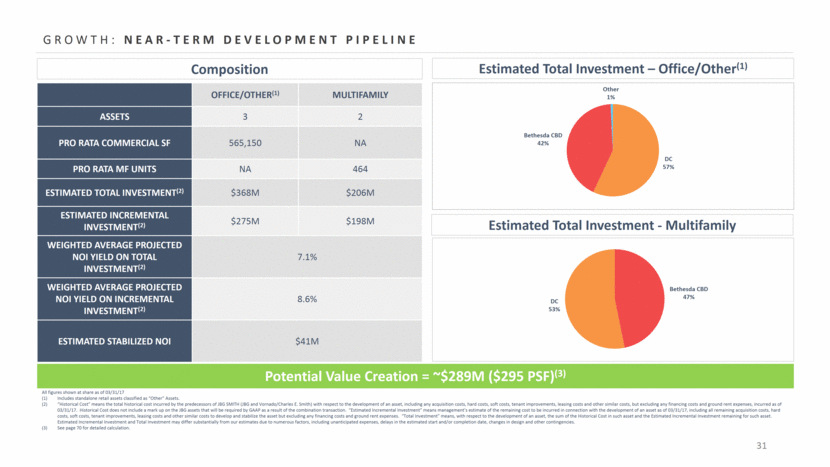
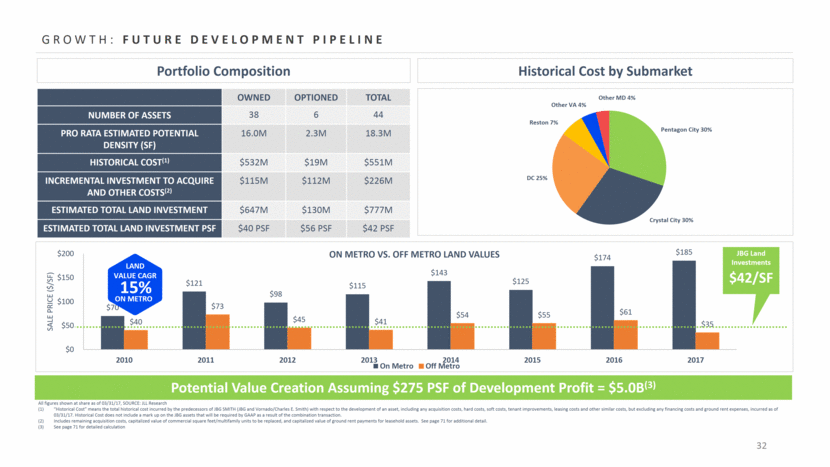
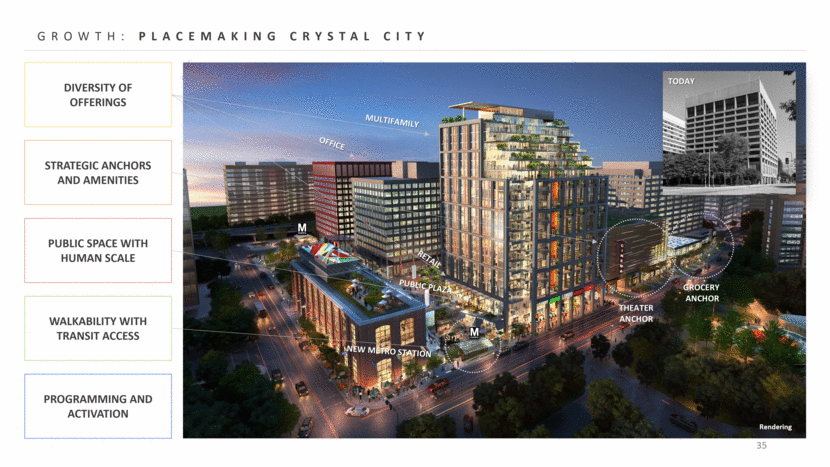
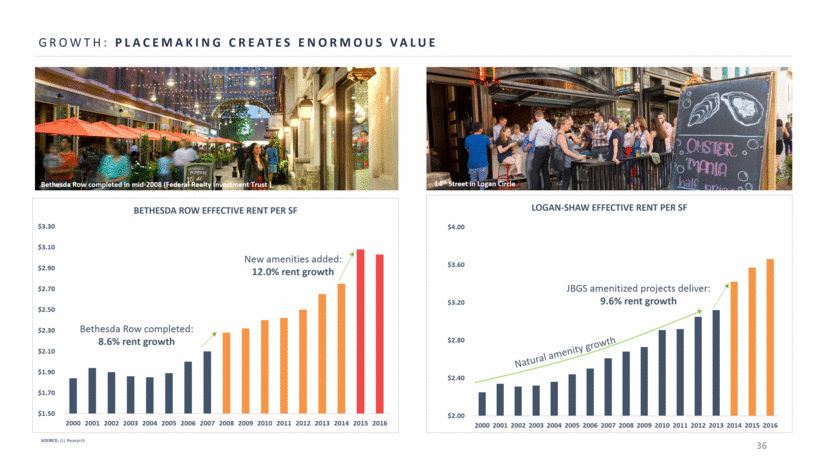
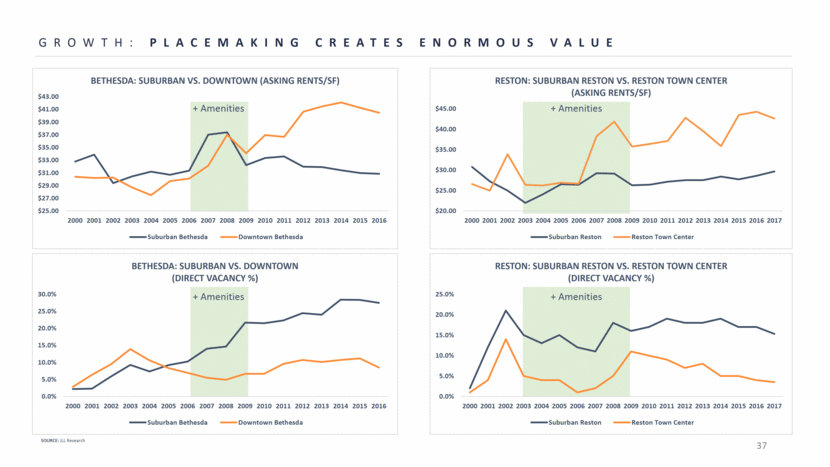
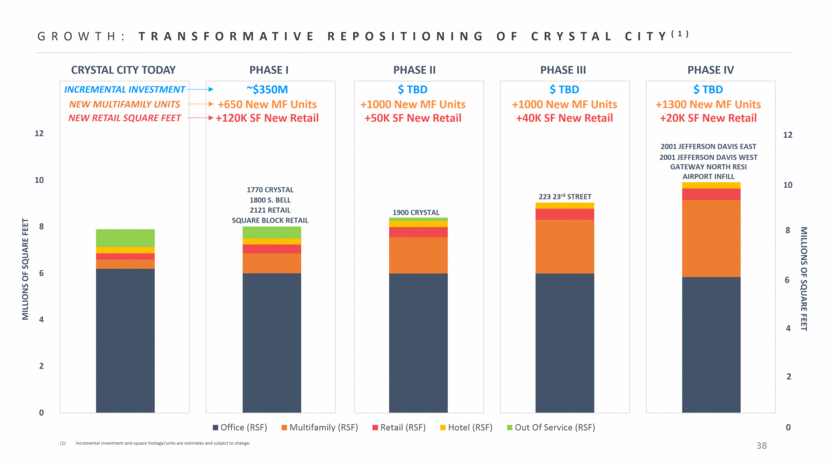
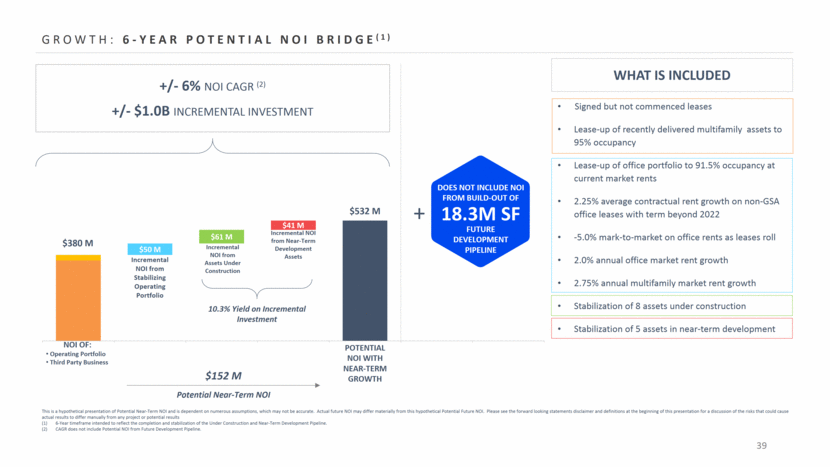
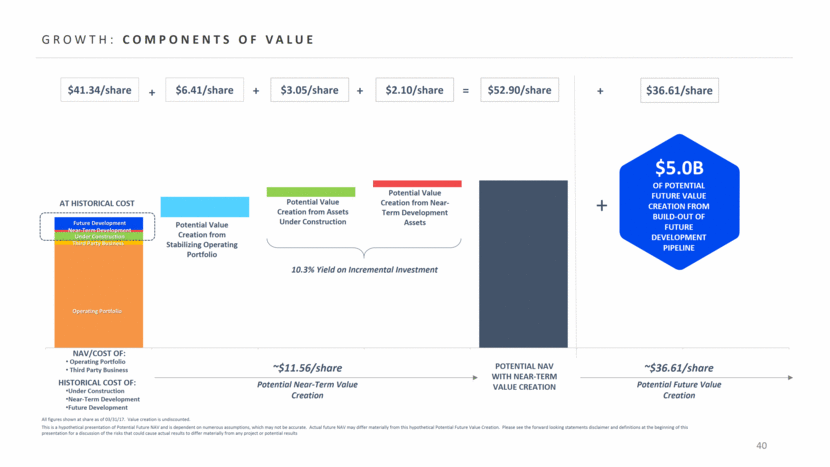
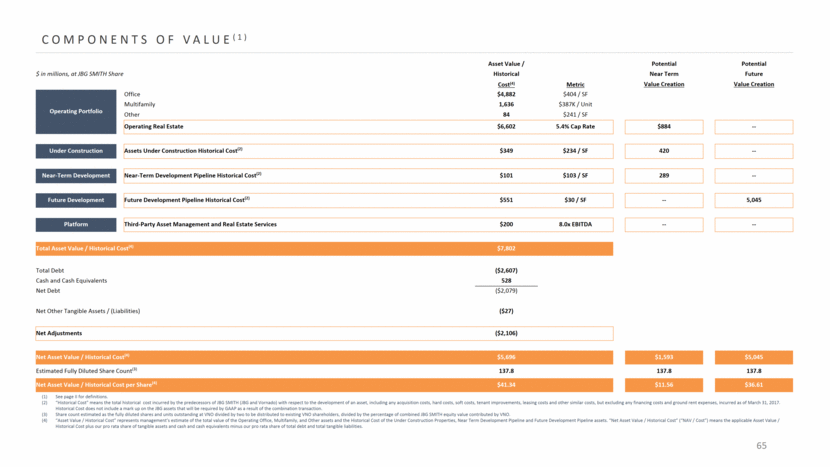
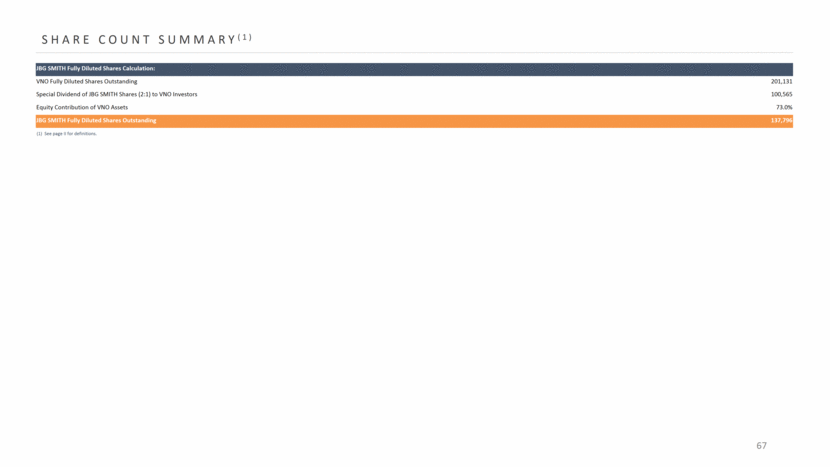
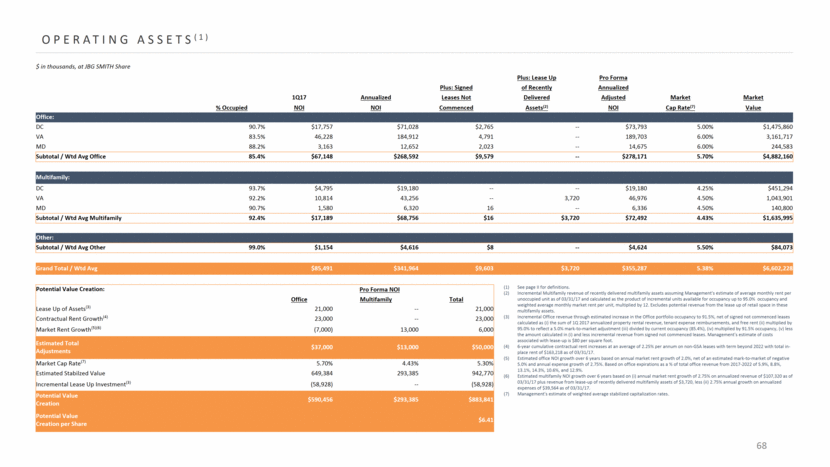
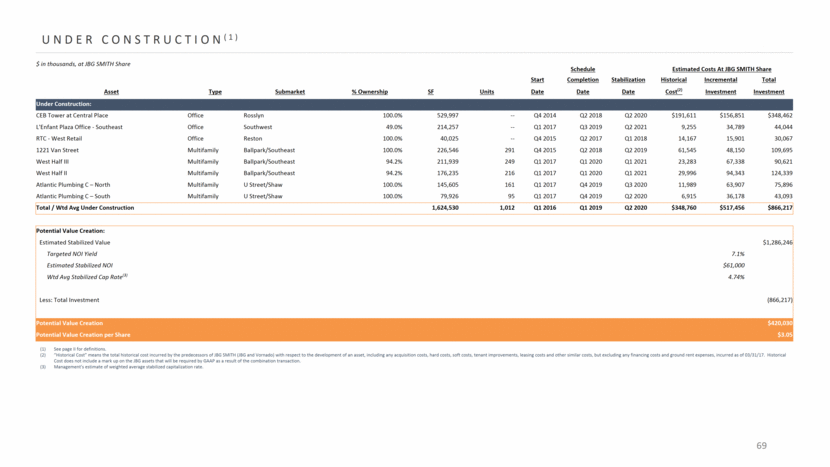
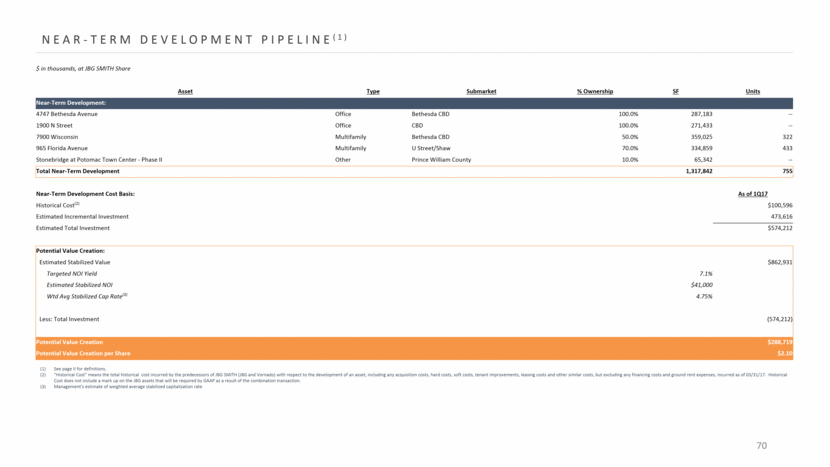
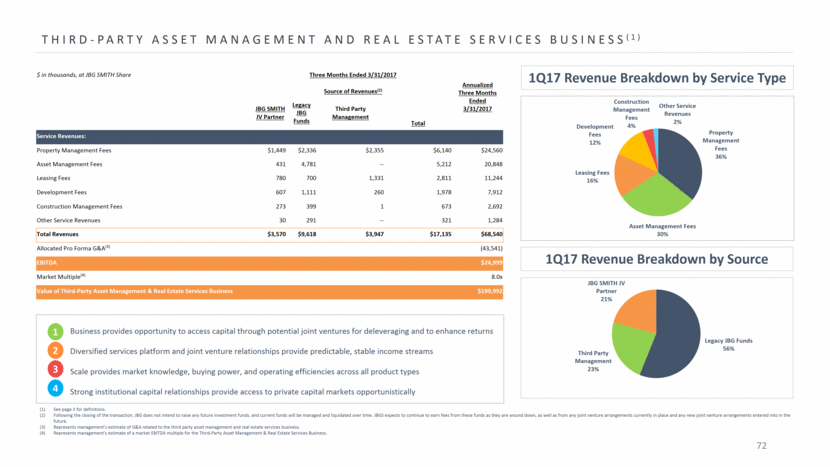
FUTURE DEVELOPMENT PIPELINE(1) See page II for definitions. Represents management's estimate of the total office and/or retail square feet and multifamily units that would need to be redeveloped in order to access the estimated potential density, which had estimated Cash NOI of $6,731 for the quarter ended 03/31/17. “Historical Cost” means the total historical cost incurred by the predecessors of JBG SMITH (JBG and Vornado) with respect to the development of an asset, including any acquisition costs, hard costs, soft costs, tenant improvements, leasing costs and other similar costs, but excluding any financing costs and ground rent expenses, incurred as of 03/31/17. Historical Cost does not include a mark up on the JBG assets that will be required by GAAP as a result of the combination transaction. Management's estimate of remaining deposits, option payments, and option strike prices as of 03/31/17. In addition three (3) owned parcels and two (2) optioned parcels are leasehold interests with estimated annual stabilized ground rent payments totaling $4,499. Capitalized value of Estimated Commercial SF / Multifamily Units to be Replaced (included in the value of the operating segment) at a 6.0% capitalization rate. Capitalized value of stabilized annual ground rent payments associated with leasehold assets at a 5.0% capitalization rate. Management's estimate of potential development profit per square foot associated with the build out of the Future Development Pipeline. 71 Estimated Estimated $ in thousands, at JBG SMITH Share Estimated Capitalized Capitalized Commercial Cost of Cost of Estimated SF / Multifamily Remaining SF / Units Ground Estimated Total Number of Estimated Potential Development Density (SF) Units to be Historical Acquisition to be Rent Total Investment Region Assets Total Office Multifamily Retail Replaced(2) Cost(3) Costs(4) Replaced (5) Payments (6) Investment per SF Owned: Virginia 25 13,015,330 3,654,200 8,652,860 708,270 395,702 SF / 15 units $390,708 -- $84,512 $2,337 $477,558 $36.69 Washington, DC 8 1,594,056 635,896 937,910 20,250 -- 128,375 -- -- -- 128,375 80.53 Maryland 5 1,402,360 19,170 1,244,560 138,630 25,119 SF / 162 units 13,057 -- 27,667 416 41,139 29.34 Total / Wtd Avg 38 16,011,746 4,309,266 10,835,330 867,150 420,821 SF / 177 units $532,140 -- $112,179 $2,753 $647,072 $40.41 Optioned: Virginia 2 636,250 625,000 10,350 900 -- $617 $20,606 -- -- $21,223 $33.36 Washington, DC 3 1,698,510 337,510 1,163,500 197,500 -- 10,313 21,194 -- 69,718 101,225 59.60 Maryland 1 -- -- -- -- -- 7,782 -- -- -- 7,782 -- Total / Wtd Avg 6 2,334,760 962,510 1,173,850 198,400 -- $18,712 $41,800 -- $69,718 $130,230 $55.78 Grand Total / Wtd Avg 44 18,346,506 5,271,776 12,009,180 1,065,550 420,821 SF / 177 units $550,852 $41,800 $112,179 $72,472 $777,302 $42.37 Potential Value Creation: Potential Value Creation PSF(7) $275 Total Estimated Potential Development Density 18,346,506 Potential Value Creation $5,045,289 Potential Value Creation per Share $36.61
