 | ||
 | ||
 | ||
SL Green Realty Corp. is a self-managed real estate investment trust, or REIT, with in-house capabilities in property management, acquisitions and dispositions, financing, development, redevelopment, construction and leasing.
As of March 31, 2020, the Company held interests in 102 buildings totaling 49.4 million square feet. This included ownership interests in 28.8 million square feet in Manhattan buildings and 19.6 million square feet securing debt and preferred equity investments.
| • | SL Green’s common stock is listed on the New York Stock Exchange and trades under the symbol SLG. |
| • | SL Green maintains a website at https://slgreen.com where key investor relations data can be found. This supplemental financial package is available through the Company’s website. |
| • | This data is furnished to supplement audited and unaudited regulatory filings of the Company and should be read in conjunction with those filings. The financial data herein is unaudited and is provided to assist readers of quarterly and annual financial filings and should not be read in replacement of, or superior to, such financial filings. As such, data otherwise contained in future regulatory filings covering the same period may restate the data presented herein. |
Questions pertaining to the information contained herein should be referred to Investor Relations at investor.relations@slgreen.com or at 212-594-2700.
Ratings
Ratings are not recommendations to buy, sell or hold the Company’s securities.
Forward-looking Statements
This supplemental reporting package includes certain statements that may be deemed to be "forward-looking statements" within the meaning of the Private Securities Litigation Reform Act of 1995 and are intended to be covered by the safe harbor provisions thereof. All statements, other than statements of historical facts, included in this press release that address activities, events or developments that we expect, believe or anticipate will or may occur in the future, are forward-looking statements, including the statements herein under the section entitled "Guidance". These forward-looking statements are based on certain assumptions and analyses made by us in light of our experience and our perception of historical trends, current conditions, expected future developments and other factors we believe are appropriate. Forward-looking statements are not guarantees of future performance and actual results or developments may differ materially, and we caution you not to place undue reliance on such statements. Forward-looking statements are generally identifiable by the use of the words "may," "will," "should," "expect," "anticipate," "estimate," "believe," "intend," "project," "continue," or the negative of these words, or other similar words or terms.
Forward-looking statements contained in this press release are subject to a number of risks and uncertainties, many of which are beyond our control, that may cause our actual results, performance or achievements to be materially different from future results, performance or achievements expressed or implied by forward-looking statements made by us. Factors and risks to our business that could cause actual results to differ from those contained in the forward-looking statements include risks and uncertainties related to the on-going COVID-19 pandemic and the impact it will have on our business and the industry as a whole and the other risks and uncertainties described in our filings with the Securities and Exchange Commission. We undertake no obligation to publicly update or revise any forward-looking statements, whether as a result of future events, new information or otherwise.
The following discussion related to the consolidated financial statements of the Company should be read in conjunction with the financial statements for the year ended March 31, 2020 that will be released on Form 10-Q to be filed on or before May 11, 2020.
| Supplemental Information | 2 | First Quarter 2020 |
| ||
TABLE OF CONTENTS | | |
| ||
| Supplemental Definitions | |||
| Highlights | - | ||
| Comparative Balance Sheets | |||
| Comparative Statements of Operations | |||
| Comparative Computation of FFO and FAD | |||
| Consolidated Statement of Equity | |||
| Joint Venture Statements | - | ||
| Selected Financial Data | - | ||
| Debt Summary Schedule | - | ||
| Lease Liability Schedule | |||
| Debt and Preferred Equity Investments | - | ||
| Selected Property Data | |||
| Composition of Property Portfolio | - | ||
| Largest Tenants | |||
| Tenant Diversification | |||
| Leasing Activity Summary | - | ||
| Annual Lease Expirations | - | ||
| Summary of Real Estate Acquisition/Disposition Activity | - | ||
| Corporate Information | |||
| Non-GAAP Disclosures and Reconciliations | |||
| Analyst Coverage | |||
| Supplemental Information | 3 | First Quarter 2020 |
| ||
SUPPLEMENTAL DEFINITIONS | | |
| ||
Annualized cash rent - Monthly base rent and escalations per the lease, as of the last day of the quarter, multiplied by 12.
Capitalized Interest - The total of i) interest cost for project specific debt on properties that are under development or redevelopment plus ii) an imputed interest cost for properties that are under development or redevelopment, which is calculated based on the Company’s equity investment in those properties multiplied by the Company’s weighted average corporate borrowing rate. Capitalized Interest is a component of the book basis in a development or redevelopment property.
Debt service coverage - Operating Income adding back income taxes, loan loss reserves and our share of joint venture depreciation and amortization, divided by total interest and principal payments.
Earnings Before Interest, Taxes, Depreciation and Amortization for Real Estate (EBITDAre) - EBITDAre is a non-GAAP financial measure. The Company computes EBITDAre in accordance with standards established by the National Association of Real Estate Investment Trusts, or NAREIT, which may not be comparable to EBITDAre reported by other REITs that do not compute EBITDAre in accordance with the NAREIT definition, or that interpret the NAREIT definition differently than the Company does. The White Paper on EBITDAre approved by the Board of Governors of NAREIT in September 2017 defines EBITDAre as net income (loss) (computed in accordance with Generally Accepted Accounting Principles, or GAAP), plus interest expense, plus income tax expense, plus depreciation and amortization, plus (minus) losses and gains on the disposition of depreciated property, plus impairment write-downs of depreciated property and investments in unconsolidated joint ventures, plus adjustments to reflect the entity's share of EBITDAre of unconsolidated joint ventures.
First generation TIs and LCs - Tenant improvements (TIs), leasing commissions (LCs), and other leasing costs that were taken into consideration when underwriting the acquisition of a property, which are generally incurred during the first 4-5 years following acquisition.
Fixed charge - Total payments for interest, loan principal amortization, ground rent and preferred stock dividends.
Fixed charge coverage - Operating Income adding back income taxes, loan loss reserves and our share of joint venture depreciation and amortization, divided by Fixed Charge.
Funds Available for Distribution (FAD) - FAD is a non-GAAP financial measure that is calculated as FFO plus non-real estate depreciation, allowance for straight line credit loss, adjustment for straight line operating lease rent, non-cash deferred compensation, and a pro-rata adjustment for FAD from SLG’s unconsolidated JVs, less straight line rental income, free rent net of amortization, second cycle tenant improvement and leasing costs, and recurring building improvements.
Funds from Operations (FFO) - FFO is a widely recognized non-GAAP financial measure of REIT performance. The Company computes FFO in accordance with standards established by NAREIT, which may not be comparable to FFO reported by other REITs that do not compute FFO in accordance with the NAREIT definition, or that interpret the NAREIT definition differently than the Company does. The revised White Paper on FFO approved by the Board of Governors of NAREIT in April 2002, and subsequently amended, defines FFO as net income (loss) (computed in accordance with GAAP), excluding gains (or losses) from sales of properties, and real estate related impairment charges, plus real estate related depreciation and amortization and after adjustments for unconsolidated partnerships and joint ventures.
Junior Mortgage Participations - Subordinate interests in first mortgages.
Mezzanine Debt - Loans secured by ownership interests in real estate.
Net Operating Income (NOI) and Cash NOI - NOI is a non-GAAP financial measure that is calculated as operating income before transaction related costs, gains/losses on early extinguishment of debt, marketing general and administrative expenses and non-real estate revenue. Cash NOI is also a non-GAAP financial measure that is calculated by subtracting free rent (net of amortization), straight-line rent, and the amortization of acquired above and below-market leases from NOI, while adding operating lease straight-line adjustment and the allowance for straight-line tenant credit loss.
Preferred Equity Investments - Equity investments that are senior to common equity and are entitled to preferential returns.
Recurring capital expenditures - Building improvements and leasing costs required to maintain current revenues. Recurring capital expenditures do not include building improvements that were taken into consideration when underwriting the purchase of a building or which are incurred to bring a building up to “operating standards.”
Redevelopment costs - Non-recurring capital expenditures incurred to improve buildings to SLG’s “operating standards.”
Right of Use Assets / Lease Liabilities - Represents the right to control the use of leased property and the corresponding obligation, both measured, at inception, as the present value of the lease payments. The asset and related liability are classified as either operating or financing based on the length and cost of the lease and whether the lease contains a purchase option or a transfer of ownership. Operating leases are expensed through operating lease rent while financing leases are expensed through amortization and interest expense. On our balance sheets, financing leases include the amounts previously captioned "Properties under capital lease."
Same-Store Properties (Same-Store) - Properties owned in the same manner during both the current and prior year, excluding development properties that are not stabilized for both the current and prior year. Changes to Same-Store properties in 2019 are as follows:
| Added to Same-Store in 2020: | Removed from Same-Store in 2020: |
| 2 Herald Square | One Madison Avenue (redevelopment) |
| 719 Seventh Avenue | 625 Madison Avenue (redevelopment) |
| 650 Fifth Avenue | 315 West 34th Street "The Olivia" (disposed) |
| 762 Madison Avenue (redevelopment) | |
Second generation TIs and LCs - Tenant improvements, leasing commissions, and other leasing costs that do not meet the definition of first generation TIs and LCs.
SLG Interest - 'SLG Share' or 'Share of JV' is computed by multiplying the referenced line item by the Company's percentage ownership in the respective joint ventures and may not accurately depict the legal and economic implications of holding a non-controlling interest in the joint ventures.
Total square feet owned - The total square footage of properties either owned directly by SLG or in which SLG has a joint venture interest.
| Supplemental Information | 4 | First Quarter 2020 |
| ||
FIRST QUARTER 2020 HIGHLIGHTS Unaudited | | |
| ||
New York, NY, April 22, 2020 - SL Green Realty Corp. (the "Company") (NYSE: SLG) today reported net income attributable to common stockholders for the quarter ended March 31, 2020 of $114.8 million, or $1.47 per share, as compared to net income attributable to common stockholders of $43.8 million, or $0.52 per share, for the same quarter in 2019. Net income attributable to common stockholders for the first quarter of 2020 includes $72.3 million, or $0.88 per share, of net gains recognized from the sale of The Olivia.
The Company reported FFO for the quarter ended March 31, 2020 of $172.0 million, or $2.08 per share, which includes the recognition of $37.7 million, or $0.46 per share, of incremental income from Credit Suisse at 1 Madison Avenue representing rent through December 31, 2020, offset by $11.2 million, or $0.14 per share, of reserves against the Company’s debt and preferred equity portfolio related to the potential sale of certain investments and implementation of the new Current Expected Credit Loss, or CECL, regulation. FFO for the same period in 2019 was $147.5 million, or $1.68 per share.
All per share amounts are presented on a diluted basis.
Operating and Leasing Activity
For the quarter ended March 31, 2020, the Company reported consolidated revenues and operating income of $314.3 million and $162.8 million, respectively, compared to $304.3 million and $160.3 million, respectively, for the same period in 2019.
Same-store cash NOI, including our share of same-store cash NOI from unconsolidated joint ventures increased by 0.7% for the first quarter, excluding lease termination income and free rent to Viacom at 1515 Broadway.
During the first quarter, the Company signed 30 office leases in its Manhattan portfolio totaling 316,154 square feet. Twenty-one leases comprising 181,600 square feet, representing office leases on space that had been occupied within the prior twelve months, are considered replacement leases on which mark-to-market is calculated. Those replacement leases had average starting rents of $70.68 per rentable square foot, representing a 12.6% increase over the previous fully escalated rents on the same office spaces. The average lease term on the Manhattan office leases signed in the first quarter was 10.1 years and average tenant concessions were 2.0 months of free rent with a tenant improvement allowance of $28.54 per rentable square foot.
Occupancy in the Company's Manhattan same-store portfolio was 95.5% as of March 31, 2020, inclusive of 404,018 square feet of leases signed but not yet commenced, as compared to 95.4% as of March 31, 2019.
Significant leases that were signed in the first quarter included:
| • | Renewal and expansion with Hudson Yards Construction LLC for 75,704 square feet at 410 10th Avenue, for 21.1 years; |
| • | New lease with Memorial Hospital for Cancer and Allied Diseases for 54,199 square feet at 485 Lexington Avenue, for 10.0 years; |
| • | New lease with City Garage for 44,201 square feet at 810 Seventh Avenue, for 10.0 years; and |
| • | New lease with KCP Holdco, Inc. for 37,169 square feet at 707 Eleventh Avenue, for 10.0 years. |
Investment Activity
To date in 2020, the Company has repurchased a combined 2.6 million shares of common stock and common units of its Operating Partnership, or OP units, under the previously announced $3.0 billion share repurchase plan, at an average price of $83.25 per share/unit. Since inception of the program, the Company has repurchased a total of 25.3 million shares of its common stock under the program and redeemed 0.4 million OP units, allowing the Company to save approximately $91.2 million of common dividends and distributions on an annualized basis. The average price of total share repurchases and OP Unit redemptions to date is $94.46 per share/unit. The Company has curtailed its share repurchase program until additional sources of liquidity from asset sales or internal free cash flow are established.
In March, the Company closed on the sale of 315 West 33rd Street, known as The Olivia, and an adjacent, undeveloped parcel of land for a sale price of $446.5 million, or approximately $906 per square foot. The Company acquired the 36-story, 492,987-square-foot building in 2013. The mixed-use property includes 333 residential units with occupancy over 96 percent and 270,132 square feet of commercial space, which is 100 percent occupied. Commercial tenants include AMC Theater, Music Choice and Landmark Education. The transaction included a $100 million preferred equity investment by the Company, which was part of the original contract terms, and generated net cash proceeds to the Company of $95.7 million and a gain of $72.3 million.
In March, the Company announced that the previously contracted sale of 220 East 42nd Street, also known as The News Building, which was expected to close in the first quarter, did not move forward due to the buyer’s inability to execute the transaction. The Company has taken action to collect the $35.0 million contract deposit. Collection of the deposit is not reflected in the Company’s revised guidance. The property remains a high-quality asset within the Manhattan office portfolio, is currently 97.0 percent leased and the Company is considering financing alternatives for the property.
In March, the Company entered into a 99-year ground lease of 126-132 Nassau Street, located at the corner of Nassau and Beekman Streets. The Company intends to develop a new, as-of-right, 215,000-square-foot building on the site and has secured a user for a long term net ground lease condominium of the building. The existing 98,412-square-foot office building will be demolished to make way for the new tower.
In January, the Company closed on the acquisition of the remaining 10% interest in 762 Madison Avenue from our joint venture partner at a gross asset valuation of $29.3 million. The Company now owns 100% of the asset.
Debt and Preferred Equity Investment Activity
The carrying value of the Company’s debt and preferred equity investment portfolio increased to $1.85 billion at March 31, 2020, including $1.78 billion of investments at a weighted average current yield of 8.2% that are classified in the debt and preferred equity line item on the balance sheet, and mortgage investments aggregating $0.03 billion at a weighted average current yield of 6.5% that are included in other balance sheet line items for accounting purposes.
During the first quarter, the Company originated mortgages, subordinate debt, and preferred equity investments totaling $511.1 million, all of which was retained and $463.9 million was funded, at a weighted average yield of 8.3%.
| Supplemental Information | 5 | First Quarter 2020 |
| ||
FIRST QUARTER 2020 HIGHLIGHTS Unaudited | | |
| ||
During the first quarter, the Company implemented the Current Expected Credit Loss, or CECL, model for recognizing credit losses. Evaluation of the Company’s debt and preferred equity portfolio under this new standard resulted in the Company recording reserves totaling $43.5 million in the first quarter, $39.2 million of which was recorded as a cumulative-effect adjustment to equity and $4.3 million, of which, or $0.05 per share, was recognized through earnings. In addition, the Company recorded $6.9 million of reserves, or $0.09 per share, through earnings against debt and preferred equity investments that may be sold.
Financing Activity
In February, the Company, along with its joint venture partner, closed on the refinancing of 10 East 53rd Street. The new $220.0 million mortgage, all of which was funded at closing, has a 5-year term, bears interest at a floating rate of 1.35% over LIBOR and replaces the previous $170.0 million of indebtedness on the property that bore interest at a floating rate of 2.25% over LIBOR.
In April, the Company entered into $350.0 million of fixed rate interest swaps against our corporate unsecured debt at a rate of 0.54375% through August 2021.
Guidance
While the ongoing global COVID-19 pandemic did not have a significant impact on our first quarter results, we expect that the Company, and our industry as a whole, will experience a greater impact going forward. Some of the more significant trends we could face during the coming months include: (i) a slowdown in leasing activity and a reduction in market rents; (ii) reduced collections in our owned properties or our debt & preferred equity portfolio; (iii) delays and local restrictions around our development and redevelopment activities; and (iv) increased expenditures related to enhanced safety policies and procedures for our employees and tenants. As a result of these potential trends, the Company is revising its earnings guidance ranges for the year ending December 31, 2020 to net income per share of $1.83 to $2.33 and FFO per share of $6.60 to $7.10 per share.
The following table reconciles the revisions to the Company's guidance ranges for net income per share (diluted) and FFO per share (diluted) for the year ending December 31, 2020:
| Net income per share | Funds From Operations per share | ||||||||||||
| Initial Guidance | $ | 7.43 | $ | 7.53 | $ | 7.25 | $ | 7.35 | |||||
| Real Estate GAAP NOI | 0.03 | 0.16 | 0.03 | 0.16 | |||||||||
| Debt & Preferred Equity Income | (0.34 | ) | (0.29 | ) | (0.34 | ) | (0.29 | ) | |||||
| Debt & Preferred Equity Reserves | (0.29 | ) | (0.22 | ) | (0.29 | ) | (0.22 | ) | |||||
| Other Income, Net | (0.09 | ) | (0.06 | ) | (0.09 | ) | (0.06 | ) | |||||
| Interest Expense & Preferred Dividends | (0.05 | ) | 0.05 | (0.05 | ) | 0.05 | |||||||
| General & Administrative Expense | 0.09 | 0.11 | 0.09 | 0.11 | |||||||||
| Gain on sale of real estate, net | (4.34 | ) | (4.34 | ) | |||||||||
| Depreciation and Amortization | (0.61 | ) | (0.61 | ) | |||||||||
| Revised Guidance | $ | 1.83 | $ | 2.33 | $ | 6.60 | $ | 7.10 | |||||
Dividends
In the first quarter of 2020, the Company declared:
| • | A dividend on its outstanding common stock of $0.295 per share of common stock, which was paid on April 15, 2020 to shareholders of record on the close of business on March 31, 2020; and |
| • | quarterly dividends on its outstanding 6.50% Series I Cumulative Redeemable Preferred Stock of $0.40625 per share for the period January 15, 2020 through and including April 14, 2020, which was paid on April 15, 2020 to shareholders of record on the close of business on March 31, 2020, and reflects the regular quarterly dividend, which is the equivalent of an annualized dividend of $1.625 per share. |
Conference Call and Audio Webcast
The Company's executive management team, led by Marc Holliday, Chairman and Chief Executive Officer, will host a conference call and audio webcast on Thursday, April 23, 2020 at 2:00 pm ET to discuss the financial results.
The supplemental data will be available prior to the quarterly conference call in the Investors section of the SL Green Realty Corp. website at https://slgreen.com/ under “Financial Reports.”
The live conference call will be webcast in listen-only mode in the Investors section of the SL Green Realty Corp. website at https://slgreen.com/ under “Presentations & Webcasts”. The conference may also be accessed by dialing toll-free (877) 312-8765 or international (419) 386-0002, and using passcode 5789867.
A replay of the call will be available 7 days after the call by dialing (855) 859-2056 using passcode 5789867. A webcast replay will also be available in the Investors section of the SL Green Realty Corp. website at https://slgreen.com/ under “Presentations & Webcasts”.
| Supplemental Information | 6 | First Quarter 2020 |
| ||
KEY FINANCIAL DATA Unaudited (Dollars in Thousands Except Per Share) | | |
| ||
| As of or for the three months ended | |||||||||||||||||||
| 3/31/2020 | 12/31/2019 | 9/30/2019 | 6/30/2019 | 3/31/2019 | |||||||||||||||
| Earnings Per Share | |||||||||||||||||||
| Net income available to common stockholders - diluted | $ | 1.47 | $ | 0.22 | $ | 0.40 | $ | 1.94 | $ | 0.52 | |||||||||
| Funds from operations (FFO) available to common stockholders - diluted | $ | 2.08 | $ | 1.75 | $ | 1.75 | $ | 1.82 | $ | 1.68 | |||||||||
| Common Share Price & Dividends | |||||||||||||||||||
| Closing price at the end of the period | $ | 43.10 | $ | 91.88 | $ | 81.75 | $ | 80.37 | $ | 89.92 | |||||||||
| Closing high price during period | $ | 95.77 | $ | 92.90 | $ | 83.38 | $ | 92.60 | $ | 93.47 | |||||||||
| Closing low price during period | $ | 41.14 | $ | 78.50 | $ | 76.79 | $ | 79.59 | $ | 77.46 | |||||||||
| Common dividend per share | $ | 0.2950 | (1) | $ | 0.8850 | $ | 0.8500 | $ | 0.8500 | $ | 0.8500 | ||||||||
| FFO payout ratio (trailing 12 months) | 46.9 | % | 49.1 | % | 49.6 | % | 49.7% | 50.1% | |||||||||||
| Funds available for distribution (FAD) payout ratio (trailing 12 months) | 73.6 | % | 72.9 | % | 92.5 | % | 87.3% | 83.9% | |||||||||||
| Common Shares & Units | |||||||||||||||||||
| Common shares outstanding | 76,535 | 79,202 | 81,515 | 82,409 | 83,272 | ||||||||||||||
| Units outstanding | 4,145 | 4,196 | 4,258 | 4,259 | 4,261 | ||||||||||||||
| Total common shares and units outstanding | 80,680 | 83,398 | 85,773 | 86,668 | 87,533 | ||||||||||||||
| Weighted average common shares and units outstanding - basic | 82,335 | 83,767 | 86,550 | 87,231 | 87,646 | ||||||||||||||
| Weighted average common shares and units outstanding - diluted | 82,567 | 84,320 | 86,714 | 87,398 | 87,810 | ||||||||||||||
| Market Capitalization | |||||||||||||||||||
| Market value of common equity | $ | 3,477,308 | $ | 7,662,608 | $ | 7,011,943 | $ | 6,965,507 | $ | 7,870,967 | |||||||||
| Liquidation value of preferred equity/units | 496,020 | 513,285 | 516,285 | 516,285 | 515,285 | ||||||||||||||
| Consolidated debt | 6,162,819 | 5,554,720 | 5,892,756 | 6,140,212 | 5,940,440 | ||||||||||||||
| Consolidated market capitalization | $ | 10,136,147 | $ | 13,730,613 | $ | 13,420,984 | $ | 13,622,004 | $ | 14,326,692 | |||||||||
| SLG share of unconsolidated JV debt | 4,132,083 | 4,028,136 | 3,930,470 | 3,799,897 | 3,815,230 | ||||||||||||||
| Market capitalization including SLG share of unconsolidated JVs | $ | 14,268,230 | $ | 17,758,749 | $ | 17,351,454 | $ | 17,421,901 | $ | 18,141,922 | |||||||||
| Consolidated debt service coverage (trailing 12 months) | 3.39x | 3.37x | 3.26x | 3.20x | 3.10x | ||||||||||||||
| Consolidated fixed charge coverage (trailing 12 months) | 2.77x | 2.74x | 2.68x | 2.63x | 2.57x | ||||||||||||||
| Debt service coverage, including SLG share of unconsolidated JVs (trailing 12 months) | 2.41x | 2.39x | 2.35x | 2.34x | 2.30x | ||||||||||||||
| Fixed charge coverage, including SLG share of unconsolidated JVs (trailing 12 months) | 2.08x | 2.06x | 2.03x | 2.03x | 2.00x | ||||||||||||||
| (1) In March 2020 the Company modified its dividend policy from quarterly payments to monthly payments to allow better matching of its distributions to the operating cash flow it recognizes in the current market environment | |||||||||||||||||||
| Supplemental Information | 7 | First Quarter 2020 |
| ||
KEY FINANCIAL DATA Unaudited (Dollars in Thousands Except Per Share) | | |
| ||
| As of or for the three months ended | |||||||||||||||||||
| 3/31/2020 | 12/31/2019 | 9/30/2019 | 6/30/2019 | 3/31/2019 | |||||||||||||||
| Selected Balance Sheet Data | |||||||||||||||||||
| Real estate assets before depreciation | $ | 9,061,831 | $ | 9,222,796 | $ | 9,560,878 | $ | 9,550,222 | $ | 8,936,493 | |||||||||
| Investments in unconsolidated joint ventures | $ | 2,848,363 | $ | 2,912,842 | $ | 2,923,595 | $ | 2,937,153 | $ | 3,055,368 | |||||||||
| Debt and preferred equity investments | $ | 1,783,336 | $ | 1,580,306 | $ | 1,954,556 | $ | 2,228,912 | $ | 2,272,241 | |||||||||
| Cash and cash equivalents | $ | 554,195 | $ | 166,070 | $ | 121,751 | $ | 148,978 | $ | 144,323 | |||||||||
| Investment in marketable securities | $ | 25,353 | $ | 29,887 | $ | 30,208 | $ | 29,978 | $ | 29,406 | |||||||||
| Total assets | $ | 13,220,607 | $ | 12,766,320 | $ | 13,294,984 | $ | 13,629,941 | $ | 13,385,774 | |||||||||
| Fixed rate & hedged debt | $ | 3,032,513 | $ | 3,536,286 | $ | 3,538,829 | $ | 3,540,487 | $ | 3,542,126 | |||||||||
| Variable rate debt | 3,130,306 | (1) | 2,018,434 | 2,353,927 | 2,599,725 | 2,398,314 | |||||||||||||
| Total consolidated debt | $ | 6,162,819 | $ | 5,554,720 | $ | 5,892,756 | $ | 6,140,212 | $ | 5,940,440 | |||||||||
| Deferred financing costs, net of amortization | (39,553 | ) | (46,583 | ) | (56,988 | ) | (57,423 | ) | (50,376 | ) | |||||||||
| Total consolidated debt, net | $ | 6,123,266 | $ | 5,508,137 | $ | 5,835,768 | $ | 6,082,789 | $ | 5,890,064 | |||||||||
| Total liabilities | $ | 7,251,728 | $ | 6,555,975 | $ | 6,843,536 | $ | 7,062,331 | $ | 6,843,805 | |||||||||
| Fixed rate & hedged debt, including SLG share of unconsolidated JV debt | $ | 5,265,219 | $ | 5,771,749 | $ | 5,777,022 | $ | 5,781,333 | $ | 5,880,322 | |||||||||
| Variable rate debt, including SLG share of unconsolidated JV debt | 5,029,683 | (1) | 3,811,107 | 4,046,204 | 4,158,776 | 3,875,348 | |||||||||||||
| Total debt, including SLG share of unconsolidated JV debt | $ | 10,294,902 | $ | 9,582,856 | $ | 9,823,226 | $ | 9,940,109 | $ | 9,755,670 | |||||||||
| Selected Operating Data | |||||||||||||||||||
| Property operating revenues | $ | 222,631 | $ | 250,452 | $ | 248,028 | $ | 244,959 | $ | 240,118 | |||||||||
| Property operating expenses | (107,855 | ) | (114,867 | ) | (117,768 | ) | (113,309 | ) | (112,684 | ) | |||||||||
| Property NOI | $ | 114,776 | $ | 135,585 | $ | 130,260 | $ | 131,650 | $ | 127,434 | |||||||||
| SLG share of unconsolidated JV Property NOI | 73,992 | 72,123 | 75,442 | 78,472 | 80,635 | ||||||||||||||
| Property NOI, including SLG share of unconsolidated JV Property NOI | $ | 188,768 | $ | 207,708 | $ | 205,702 | $ | 210,122 | $ | 208,069 | |||||||||
| Investment income | 38,533 | 42,423 | 51,518 | 51,618 | 50,031 | ||||||||||||||
| Other income | 53,139 | 15,207 | 14,088 | 16,447 | 14,106 | ||||||||||||||
| Marketing general & administrative expenses | (19,570 | ) | (25,575 | ) | (23,841 | ) | (25,480 | ) | (25,979 | ) | |||||||||
| SLG share of investment income and other income from unconsolidated JVs | 1,918 | 1,736 | 1,437 | 2,141 | 3,291 | ||||||||||||||
| Income taxes | 1,134 | 1,027 | (995 | ) | 680 | 770 | |||||||||||||
| Transaction costs, including SLG share of unconsolidated JVs | (65 | ) | (369 | ) | (44 | ) | (261 | ) | (55 | ) | |||||||||
| Loan loss and other investment reserves, net of recoveries | (11,248 | ) | — | — | — | — | |||||||||||||
| EBITDAre | $ | 252,609 | $ | 242,157 | $ | 247,865 | $ | 255,267 | $ | 250,233 | |||||||||
| (1) Does not reflect $0.8 billion of floating rate debt and preferred equity investments that provide a hedge against floating rate debt. | |||||||||||||||||||
| Supplemental Information | 8 | First Quarter 2020 |
| ||
KEY FINANCIAL DATA Manhattan Properties (1) Unaudited (Dollars in Thousands Except Per Share) | | |
| ||
| As of or for the three months ended | |||||||||||||||||||
| 3/31/2020 | 12/31/2019 | 9/30/2019 | 6/30/2019 | 3/31/2019 | |||||||||||||||
| Selected Operating Data | |||||||||||||||||||
| Property operating revenues | $ | 214,373 | $ | 233,500 | $ | 230,443 | $ | 227,427 | $ | 222,780 | |||||||||
| Property operating expenses | 97,312 | 100,672 | 101,871 | 97,927 | 98,198 | ||||||||||||||
| Property NOI | $ | 117,061 | $ | 132,828 | $ | 128,572 | $ | 129,500 | $ | 124,582 | |||||||||
| Other income - consolidated | $ | 45,348 | $ | 3,128 | $ | 6,210 | $ | 4,493 | $ | 4,572 | |||||||||
| SLG share of property NOI from unconsolidated JVs | $ | 73,992 | $ | 72,111 | $ | 76,552 | $ | 78,979 | $ | 80,636 | |||||||||
| Portfolio Statistics | |||||||||||||||||||
| Consolidated office buildings in service | 18 | 20 | 20 | 20 | 20 | ||||||||||||||
| Unconsolidated office buildings in service | 10 | 10 | 10 | 10 | 11 | ||||||||||||||
| 28 | 30 | 30 | 30 | 31 | |||||||||||||||
| Consolidated office buildings in service - square footage | 10,647,191 | 12,387,091 | 12,387,091 | 12,387,091 | 12,387,091 | ||||||||||||||
| Unconsolidated office buildings in service - square footage | 11,216,183 | 11,216,183 | 11,216,183 | 11,216,183 | 11,676,183 | ||||||||||||||
| 21,863,374 | 23,603,274 | 23,603,274 | 23,603,274 | 24,063,274 | |||||||||||||||
| Same-Store office occupancy inclusive of leases signed not yet commenced | 95.5% | 96.0% | 95.0% | 94.8% | 95.4% | ||||||||||||||
| Office Leasing Statistics | |||||||||||||||||||
| New leases commenced | 27 | 19 | 27 | 25 | 25 | ||||||||||||||
| Renewal leases commenced | 5 | 19 | 9 | 7 | 10 | ||||||||||||||
| Total office leases commenced | 32 | 38 | 36 | 32 | 35 | ||||||||||||||
| Commenced office square footage filling vacancy | 29,938 | 122,564 | 170,062 | 74,425 | 132,241 | ||||||||||||||
Commenced office square footage on previously occupied space (M-T-M leasing) (2) | 136,523 | 415,750 | 181,226 | 279,649 | 270,602 | ||||||||||||||
| Total office square footage commenced | 166,461 | 538,314 | 351,288 | 354,074 | 402,843 | ||||||||||||||
| Average starting cash rent psf - office leases commenced | $68.33 | $64.95 | $77.09 | $70.53 | $69.38 | ||||||||||||||
Previous escalated cash rent psf - office leases commenced (3) | $73.52 | $48.03 | $73.39 | $62.82 | $67.90 | ||||||||||||||
Increase in new cash rent over previously escalated cash rent (2) (3) | (7.1)% | 35.2% | 5.0% | 12.3% | 2.2% | ||||||||||||||
| Average lease term | 11.3 | 7.4 | 16.1 | 11.5 | 11.0 | ||||||||||||||
| Tenant concession packages psf | $60.30 | $37.38 | $77.97 | $79.94 | $67.08 | ||||||||||||||
| Free rent months | 6.0 | 4.4 | 4.4 | 7.1 | 5.7 | ||||||||||||||
| (1) Property data includes operating office, retail, residential, development, and redevelopment properties. | |||||||||||||||||||
| (2) Calculated on space that was occupied within the previous 12 months. | |||||||||||||||||||
| (3) Escalated cash rent includes base rent plus all additional amounts paid by the tenant in the form of real estate taxes, operating expenses, porters wage or a consumer price index (CPI) adjustment. | |||||||||||||||||||
| Supplemental Information | 9 | First Quarter 2020 |
| ||
COMPARATIVE BALANCE SHEETS Unaudited (Dollars in Thousands) | | |
| ||
| As of | |||||||||||||||||||
| 3/31/2020 | 12/31/2019 | 9/30/2019 | 6/30/2019 | 3/31/2019 | |||||||||||||||
| Assets | |||||||||||||||||||
| Commercial real estate properties, at cost: | |||||||||||||||||||
| Land and land interests | $ | 1,662,840 | $ | 1,751,544 | $ | 1,860,922 | $ | 1,929,496 | $ | 1,775,006 | |||||||||
| Building and improvements | 5,417,965 | 5,154,990 | 5,352,144 | 5,749,261 | 5,294,612 | ||||||||||||||
| Building leasehold and improvements | 1,435,811 | 1,433,793 | 1,431,183 | 1,427,225 | 1,423,282 | ||||||||||||||
| Right of use asset - financing leases | 163,960 | 47,445 | 47,445 | 47,445 | 47,445 | ||||||||||||||
| Right of use asset - operating leases | 381,255 | 396,795 | 396,795 | 396,795 | 396,148 | ||||||||||||||
| 9,061,831 | 8,784,567 | 9,088,489 | 9,550,222 | 8,936,493 | |||||||||||||||
| Less: accumulated depreciation | (2,130,033 | ) | (2,060,560 | ) | (2,147,395 | ) | (2,217,013 | ) | (2,154,075 | ) | |||||||||
| Net real estate | 6,931,798 | 6,724,007 | 6,941,094 | 7,333,209 | 6,782,418 | ||||||||||||||
| Other real estate investments: | |||||||||||||||||||
| Investment in unconsolidated joint ventures | 2,848,363 | 2,912,842 | 2,923,595 | 2,937,153 | 3,055,368 | ||||||||||||||
| Debt and preferred equity investments, net | 1,783,336 | (1) | 1,580,306 | 1,954,556 | 2,228,912 | 2,272,241 | |||||||||||||
| Assets held for sale, net | — | 391,664 | 403,488 | — | — | ||||||||||||||
| Cash and cash equivalents | 554,195 | 166,070 | 121,751 | 148,978 | 144,323 | ||||||||||||||
| Restricted cash | 66,827 | 75,360 | 94,793 | 92,169 | 151,388 | ||||||||||||||
| Investment in marketable securities | 25,353 | 29,887 | 30,208 | 29,978 | 29,406 | ||||||||||||||
| Tenant and other receivables, net of allowance of $11,876 at 3/31/2020 | 88,587 | 43,968 | 44,950 | 38,270 | 47,829 | ||||||||||||||
| Related party receivables | 26,092 | 21,121 | 20,030 | 23,686 | 29,458 | ||||||||||||||
| Deferred rents receivable, net of allowance of $11,711 at 3/31/2020 | 310,138 | 283,011 | 306,431 | 341,659 | 337,099 | ||||||||||||||
| Deferred costs, net | 232,274 | 205,283 | 182,621 | 220,572 | 211,615 | ||||||||||||||
| Other assets | 353,644 | 332,801 | 271,467 | 235,355 | 324,629 | ||||||||||||||
| Total Assets | $ | 13,220,607 | $ | 12,766,320 | $ | 13,294,984 | $ | 13,629,941 | $ | 13,385,774 | |||||||||
| (1) Excludes debt and preferred equity investments totaling $34.8 million with a weighted average current yield of 6.53% that are included in other balance sheet line items. | |||||||||||||||||||
| Supplemental Information | 10 | First Quarter 2020 |
| ||
COMPARATIVE BALANCE SHEETS Unaudited (Dollars in Thousands) | | |
| ||
| As of | |||||||||||||||||||
| 3/31/2020 | 12/31/2019 | 9/30/2019 | 6/30/2019 | 3/31/2019 | |||||||||||||||
| Liabilities | |||||||||||||||||||
| Mortgages and other loans payable | $ | 2,010,217 | $ | 2,211,883 | $ | 2,454,684 | $ | 2,366,907 | $ | 2,046,906 | |||||||||
| Unsecured term loans | 1,500,000 | 1,500,000 | 1,500,000 | 1,500,000 | 1,500,000 | ||||||||||||||
| Unsecured notes | 1,252,602 | 1,502,837 | 1,503,072 | 1,503,305 | 1,503,534 | ||||||||||||||
| Revolving credit facility | 1,300,000 | 240,000 | 335,000 | 670,000 | 790,000 | ||||||||||||||
| Deferred financing costs | (39,553 | ) | (46,583 | ) | (56,988 | ) | (57,423 | ) | (50,376 | ) | |||||||||
| Total debt, net of deferred financing costs | 6,023,266 | 5,408,137 | 5,735,768 | 5,982,789 | 5,790,064 | ||||||||||||||
| Accrued interest | 26,377 | 22,148 | 27,568 | 25,564 | 28,930 | ||||||||||||||
| Accounts payable and accrued expenses | 158,750 | 166,905 | 143,361 | 133,473 | 111,899 | ||||||||||||||
| Deferred revenue | 116,197 | 114,052 | 126,321 | 122,941 | 102,598 | ||||||||||||||
| Lease liability - financing leases | 162,299 | 44,448 | 44,251 | 44,034 | 43,823 | ||||||||||||||
| Lease liability - operating leases | 363,990 | 381,671 | 384,661 | 387,602 | 389,857 | ||||||||||||||
| Dividends and distributions payable | 26,563 | 79,282 | 78,541 | 79,272 | 80,047 | ||||||||||||||
| Security deposits | 59,318 | 62,252 | 62,166 | 62,735 | 61,139 | ||||||||||||||
| Liabilities related to assets held for sale | — | — | — | — | — | ||||||||||||||
| Junior subordinated deferrable interest debentures | 100,000 | 100,000 | 100,000 | 100,000 | 100,000 | ||||||||||||||
| Other liabilities | 214,968 | 177,080 | 140,899 | 123,921 | 135,448 | ||||||||||||||
| Total liabilities | 7,251,728 | 6,555,975 | 6,843,536 | 7,062,331 | 6,843,805 | ||||||||||||||
| Noncontrolling interest in operating partnership | |||||||||||||||||||
| (4,145 units outstanding) at 3/31/2020 | 358,895 | 409,862 | 401,863 | 401,824 | 412,361 | ||||||||||||||
| Preferred units | 266,019 | 283,285 | 286,285 | 286,285 | 285,285 | ||||||||||||||
| Equity | |||||||||||||||||||
| Stockholders' Equity: | |||||||||||||||||||
| Series I Perpetual Preferred Shares | 221,932 | 221,932 | 221,932 | 221,932 | 221,932 | ||||||||||||||
| Common stock, $0.01 par value, 160,000 shares authorized, 77,590 | |||||||||||||||||||
| issued and outstanding at 3/31/2020, including 1,055 shares held in treasury | 776 | 803 | 826 | 835 | 843 | ||||||||||||||
| Additional paid–in capital | 4,146,306 | 4,286,395 | 4,407,667 | 4,451,209 | 4,492,581 | ||||||||||||||
| Treasury stock | (124,049 | ) | (124,049 | ) | (124,049 | ) | (124,049 | ) | (124,049 | ) | |||||||||
| Accumulated other comprehensive loss | (80,868 | ) | (28,485 | ) | (40,132 | ) | (28,395 | ) | (4,005 | ) | |||||||||
| Retained earnings | 1,099,369 | 1,084,719 | 1,225,904 | 1,288,390 | 1,210,497 | ||||||||||||||
| Total SL Green Realty Corp. stockholders' equity | 5,263,466 | 5,441,315 | 5,692,148 | 5,809,922 | 5,797,799 | ||||||||||||||
| Noncontrolling interest in other partnerships | 80,499 | 75,883 | 71,152 | 69,579 | 46,524 | ||||||||||||||
| Total equity | 5,343,965 | 5,517,198 | 5,763,300 | 5,879,501 | 5,844,323 | ||||||||||||||
| Total Liabilities and Equity | $ | 13,220,607 | $ | 12,766,320 | $ | 13,294,984 | $ | 13,629,941 | $ | 13,385,774 | |||||||||
| Supplemental Information | 11 | First Quarter 2020 |
| ||
COMPARATIVE STATEMENT OF OPERATIONS Unaudited (Dollars in Thousands Except Per Share) | | |
| ||
| Three Months Ended | |||||||||||||||
| March 31, | March 31, | December 31, | September 30, | ||||||||||||
| 2020 | 2019 | 2019 | 2019 | ||||||||||||
| Revenues | |||||||||||||||
| Rental revenue, net | $ | 195,463 | $ | 212,639 | $ | 218,495 | $ | 215,447 | |||||||
| Escalation and reimbursement revenues | 27,168 | 27,479 | 31,957 | 32,581 | |||||||||||
| Investment income | 38,533 | 50,031 | 42,423 | 51,518 | |||||||||||
| Other income | 53,139 | 14,106 | 15,207 | 14,088 | |||||||||||
| Total Revenues, net | 314,303 | 304,255 | 308,082 | 313,634 | |||||||||||
| Equity in net loss from unconsolidated joint ventures | (12,814 | ) | (5,234 | ) | (11,874 | ) | (9,864 | ) | |||||||
| Expenses | |||||||||||||||
| Operating expenses | 53,866 | 57,698 | 58,814 | 59,847 | |||||||||||
| Operating lease rent | 7,367 | 8,298 | 8,297 | 8,295 | |||||||||||
| Real estate taxes | 46,622 | 46,688 | 47,756 | 49,626 | |||||||||||
| Loan loss and other investment reserves, net of recoveries | 11,248 | — | — | — | |||||||||||
| Transaction related costs | 65 | 55 | 369 | 44 | |||||||||||
| Marketing, general and administrative | 19,570 | 25,979 | 25,575 | 23,841 | |||||||||||
| Total Operating Expenses | 138,738 | 138,718 | 140,811 | 141,653 | |||||||||||
| Operating Income | 162,751 | 160,303 | 155,397 | 162,117 | |||||||||||
| Interest expense, net of interest income | 37,494 | 50,525 | 44,724 | 48,112 | |||||||||||
| Amortization of deferred financing costs | 2,500 | 2,742 | 3,087 | 3,112 | |||||||||||
| Depreciation and amortization | 68,279 | 68,343 | 64,090 | 70,464 | |||||||||||
Income from Continuing Operations (1) | 54,478 | 38,693 | 43,496 | 40,429 | |||||||||||
| Gain (loss) on sale of real estate | 72,636 | (1,049 | ) | (19,241 | ) | 3,541 | |||||||||
| Equity in net gain on sale of joint venture interest / real estate | — | 17,166 | — | — | |||||||||||
| Purchase price and other fair value adjustments | — | (2,041 | ) | — | 3,799 | ||||||||||
| Depreciable real estate reserves | — | — | — | (7,047 | ) | ||||||||||
| Net Income | 127,114 | 52,769 | 24,255 | 40,722 | |||||||||||
| Net income attributable to noncontrolling interests | (5,909 | ) | (2,515 | ) | (360 | ) | (1,095 | ) | |||||||
| Dividends on preferred units | (2,666 | ) | (2,724 | ) | (2,726 | ) | (2,732 | ) | |||||||
| Net Income Attributable to SL Green Realty Corp | 118,539 | 47,530 | 21,169 | 36,895 | |||||||||||
| Dividends on perpetual preferred shares | (3,738 | ) | (3,738 | ) | (3,737 | ) | (3,738 | ) | |||||||
| Net Income Attributable to Common Stockholders | $ | 114,801 | $ | 43,792 | $ | 17,432 | $ | 33,157 | |||||||
Earnings per share - Net income per share (basic) | $ | 1.47 | $ | 0.52 | $ | 0.21 | $ | 0.40 | |||||||
Earnings per share - Net income per share (diluted) | $ | 1.47 | $ | 0.52 | $ | 0.21 | $ | 0.40 | |||||||
| (1) Before gains on sale and equity in net gains and depreciable real estate reserves shown below. | |||||||||||||||
| Supplemental Information | 12 | First Quarter 2020 |
| ||
COMPARATIVE COMPUTATION OF FFO AND FAD Unaudited (Dollars in Thousands Except Per Share) | | |
| ||
| Three Months Ended | |||||||||||||||||
| March 31, | March 31, | December 31, | September 30, | ||||||||||||||
| 2020 | 2019 | 2019 | 2019 | ||||||||||||||
| Funds from Operations | |||||||||||||||||
| Net Income Attributable to Common Stockholders | $ | 114,801 | $ | 43,792 | $ | 17,432 | $ | 33,157 | |||||||||
| Depreciation and amortization | 68,279 | 68,343 | 64,090 | 70,464 | |||||||||||||
| Unconsolidated JV depreciation and noncontrolling interests adjustments | 56,318 | 47,625 | 47,224 | 47,674 | |||||||||||||
| Net income attributable to noncontrolling interests | 5,909 | 2,515 | 360 | 1,095 | |||||||||||||
| (Gain) loss on sale of real estate | (72,636 | ) | 1,049 | 19,241 | (3,541 | ) | |||||||||||
| Equity in net gain on sale of joint venture property / real estate | — | �� | (17,166 | ) | — | — | |||||||||||
| Purchase price and other fair value adjustments | — | 2,041 | — | (3,799 | ) | ||||||||||||
| Depreciable real estate reserves | — | — | — | 7,047 | |||||||||||||
| Non-real estate depreciation and amortization | (650 | ) | (707 | ) | (742 | ) | (740 | ) | |||||||||
| Funds From Operations | $ | 172,021 | $ | 147,492 | $ | 147,605 | $ | 151,357 | |||||||||
| Funds From Operations - Basic per Share | $ | 2.09 | $ | 1.68 | $ | 1.76 | $ | 1.75 | |||||||||
| Funds From Operations - Diluted per Share | $ | 2.08 | $ | 1.68 | $ | 1.75 | $ | 1.75 | |||||||||
| Funds Available for Distribution | |||||||||||||||||
| FFO | $ | 172,021 | $ | 147,492 | $ | 147,605 | $ | 151,357 | |||||||||
| Non real estate depreciation and amortization | 650 | 707 | 742 | 740 | |||||||||||||
| Amortization of deferred financing costs | 2,500 | 2,742 | 3,087 | 3,112 | |||||||||||||
| Non-cash deferred compensation | 16,865 | 12,816 | 17,056 | 6,953 | |||||||||||||
| FAD adjustment for joint ventures | (13,219 | ) | (22,765 | ) | (17,558 | ) | (29,706 | ) | |||||||||
| Straight-line rental income and other non cash adjustments | (47,359 | ) | (4,595 | ) | (1,497 | ) | (8,403 | ) | |||||||||
| Second cycle tenant improvements | (18,637 | ) | (8,421 | ) | (9,701 | ) | (22,832 | ) | |||||||||
| Second cycle leasing commissions | (3,044 | ) | (7,010 | ) | (10,614 | ) | (5,718 | ) | |||||||||
| Revenue enhancing recurring CAPEX | (184 | ) | (333 | ) | (6,264 | ) | (558 | ) | |||||||||
| Non-revenue enhancing recurring CAPEX | (3,609 | ) | (8,384 | ) | (113 | ) | (13,626 | ) | |||||||||
| Reported Funds Available for Distribution | $ | 105,984 | $ | 112,249 | $ | 122,743 | $ | 81,319 | |||||||||
| First cycle tenant improvements | $ | 4,395 | $ | 360 | $ | 11,833 | $ | 750 | |||||||||
| First cycle leasing commissions | $ | 1,741 | $ | 5,069 | $ | 16,904 | $ | — | |||||||||
| Development costs | $ | 22,478 | $ | 4,655 | $ | 9,939 | $ | 8,850 | |||||||||
| Redevelopment costs | $ | 35,885 | $ | 6,113 | $ | 54,476 | $ | 21,613 | |||||||||
| Capitalized interest | $ | 20,483 | $ | 10,509 | $ | 14,808 | $ | 15,699 | |||||||||
| Supplemental Information | 13 | First Quarter 2020 |
| ||
CONSOLIDATED STATEMENT OF EQUITY Unaudited (Dollars in Thousands) | | |
| ||
| Accumulated | ||||||||||||||||||||||||||||||||||
| Series I | Other | |||||||||||||||||||||||||||||||||
| Preferred | Common | Additional | Treasury | Retained | Noncontrolling | Comprehensive | ||||||||||||||||||||||||||||
| Stock | Stock | Paid-In Capital | Stock | Earnings | Interests | Loss | TOTAL | |||||||||||||||||||||||||||
| Balance at December 31, 2019 | $ | 221,932 | $ | 803 | $ | 4,286,395 | $ | (124,049 | ) | $ | 1,084,719 | $ | 75,883 | $ | (28,485 | ) | $ | 5,517,198 | ||||||||||||||||
| Cumulative adjustment upon adoption of ASC 326 | (39,184 | ) | (39,184 | ) | ||||||||||||||||||||||||||||||
| Balance at January 1, 2020 | $ | 221,932 | $ | 803 | $ | 4,286,395 | $ | (124,049 | ) | $ | 1,045,535 | $ | 75,883 | $ | (28,485 | ) | $ | 5,478,014 | ||||||||||||||||
| Net income | 118,539 | (293 | ) | 118,246 | ||||||||||||||||||||||||||||||
| Acquisition of subsidiary interest from noncontrolling interest | (3,123 | ) | 1,587 | (1,536 | ) | |||||||||||||||||||||||||||||
| Preferred dividends | (3,738 | ) | (3,738 | ) | ||||||||||||||||||||||||||||||
| Cash distributions declared ($0.295 per common share) | (22,665 | ) | (22,665 | ) | ||||||||||||||||||||||||||||||
| Cash distributions to noncontrolling interests | (492 | ) | (492 | ) | ||||||||||||||||||||||||||||||
| Other comprehensive loss - unrealized loss on derivative instruments | (42,041 | ) | (42,041 | ) | ||||||||||||||||||||||||||||||
| Other comprehensive loss - SLG share of unconsolidated joint venture net unrealized loss on derivative instruments | (6,036 | ) | (6,036 | ) | ||||||||||||||||||||||||||||||
| Other comprehensive loss - unrealized loss on marketable securities | (4,306 | ) | (4,306 | ) | ||||||||||||||||||||||||||||||
| DRSPP proceeds | 166 | 166 | ||||||||||||||||||||||||||||||||
| Repurchases of common stock | (26 | ) | (142,719 | ) | (76,831 | ) | (219,576 | ) | ||||||||||||||||||||||||||
| Conversion of units of the Operating Partnership to common stock | 84 | 84 | ||||||||||||||||||||||||||||||||
| Contributions to consolidated joint ventures | 3,814 | 3,814 | ||||||||||||||||||||||||||||||||
| Reallocation of noncontrolling interests in the Operating Partnership | 38,529 | 38,529 | ||||||||||||||||||||||||||||||||
| Deferred compensation plan and stock awards, net | (1 | ) | 5,503 | 5,502 | ||||||||||||||||||||||||||||||
| Balance at March 31, 2020 | $ | 221,932 | $ | 776 | $ | 4,146,306 | $ | (124,049 | ) | $ | 1,099,369 | $ | 80,499 | $ | (80,868 | ) | $ | 5,343,965 | ||||||||||||||||
| RECONCILIATION OF SHARES AND UNITS OUTSTANDING, AND DILUTION COMPUTATION | ||||||||||||||||||||||||||||||||||
| Common Stock | OP Units | Stock-Based Compensation | Diluted Shares | |||||||||||||||||||||||||||||||
| Share Count at December 31, 2019 | 79,202,322 | 4,195,875 | — | 83,398,197 | ||||||||||||||||||||||||||||||
| YTD share activity | (2,666,889 | ) | (51,320 | ) | — | (2,718,209 | ) | |||||||||||||||||||||||||||
| Share Count at March 31, 2020 | 76,535,433 | 4,144,555 | — | 80,679,988 | ||||||||||||||||||||||||||||||
| Weighting factor | 1,579,186 | 75,428 | 231,987 | 1,886,601 | ||||||||||||||||||||||||||||||
| Weighted Average Share Count at March 31, 2020 - Diluted | 78,114,619 | 4,219,983 | 231,987 | 82,566,589 | ||||||||||||||||||||||||||||||
| Supplemental Information | 14 | First Quarter 2020 |
| ||
JOINT VENTURE STATEMENTS Balance Sheet for Unconsolidated Joint Ventures Unaudited (Dollars in Thousands) | | |
| ||
| March 31, 2020 | December 31, 2019 | September 30, 2019 | |||||||||||||||||||||
| Total | SLG Share | Total | SLG Share | Total | SLG Share | ||||||||||||||||||
| Assets | |||||||||||||||||||||||
| Commercial real estate properties, at cost: | |||||||||||||||||||||||
| Land and land interests | $ | 3,902,348 | $ | 1,886,192 | $ | 3,902,348 | $ | 1,886,192 | $ | 3,903,665 | $ | 1,886,617 | |||||||||||
| Building and improvements | 10,477,826 | 5,252,112 | 10,362,434 | 5,173,363 | 10,255,247 | 5,086,802 | |||||||||||||||||
| Building leasehold and improvements | 394,503 | 200,176 | 394,503 | 200,176 | 416,668 | 211,258 | |||||||||||||||||
| Right of use asset - financing leases | 634,822 | 321,864 | 634,822 | 321,864 | 634,822 | 321,864 | |||||||||||||||||
| Right of use asset - operating leases | 242,852 | 119,543 | 236,519 | 116,376 | 236,519 | 116,376 | |||||||||||||||||
| 15,652,351 | 7,779,887 | 15,530,626 | 7,697,971 | 15,446,921 | 7,622,917 | ||||||||||||||||||
| Less: accumulated depreciation | (1,259,444 | ) | (565,902 | ) | (1,180,998 | ) | (529,232 | ) | (1,166,763 | ) | (516,005 | ) | |||||||||||
| Net real estate | 14,392,907 | 7,213,985 | 14,349,628 | 7,168,739 | 14,280,158 | 7,106,912 | |||||||||||||||||
| Cash and cash equivalents | 232,926 | 112,724 | 260,476 | 131,549 | 226,208 | 112,547 | |||||||||||||||||
| Restricted cash | 96,279 | 46,959 | 75,713 | 34,779 | 73,491 | 34,600 | |||||||||||||||||
| Tenant and other receivables, net of allowance of $7,096 at 3/31/2020, of which $3,780 is SLG share | 13,812 | 3,335 | 49,259 | 20,835 | 44,472 | 17,418 | |||||||||||||||||
| Deferred rents receivable, net of allowance of $3,204 at 3/31/2020, of which $1,719 is SLG share | 333,025 | 160,502 | 321,806 | 154,330 | 315,922 | 151,590 | |||||||||||||||||
| Deferred costs, net | 211,180 | 118,303 | 209,806 | 117,029 | 189,627 | 105,152 | |||||||||||||||||
| Other assets | 1,786,373 | 794,221 | 1,829,623 | 811,189 | 1,894,794 | 844,474 | |||||||||||||||||
| Total Assets | $ | 17,066,502 | $ | 8,450,029 | $ | 17,096,311 | $ | 8,438,450 | $ | 17,024,672 | $ | 8,372,693 | |||||||||||
| Liabilities and Equity | |||||||||||||||||||||||
| Mortgage and other loans payable, net of deferred financing costs of $85,928 at 3/31/2020, of which $40,691 is SLG share | $ | 9,116,172 | $ | 4,091,392 | $ | 8,951,869 | $ | 3,984,521 | $ | 8,799,015 | $ | 3,883,638 | |||||||||||
| Accrued interest | 25,188 | 10,852 | 27,078 | 11,645 | 26,911 | 11,393 | |||||||||||||||||
| Accounts payable and accrued expenses | 209,750 | 109,103 | 242,918 | 125,895 | 233,823 | 122,393 | |||||||||||||||||
| Deferred revenue | 1,459,796 | 648,860 | 1,501,616 | 668,791 | 1,535,067 | 684,525 | |||||||||||||||||
| Lease liability - financing leases | 637,274 | 323,056 | 637,290 | 323,071 | 637,314 | 323,089 | |||||||||||||||||
| Lease liability - operating leases | 264,887 | 129,789 | 260,090 | 127,405 | 261,682 | 128,215 | |||||||||||||||||
| Security deposits | 28,751 | 11,387 | 28,859 | 11,333 | 26,960 | 9,966 | |||||||||||||||||
| Other liabilities | 20,675 | 11,701 | 9,449 | 4,842 | 12,882 | 7,547 | |||||||||||||||||
| Equity | 5,304,009 | 3,113,889 | 5,437,142 | 3,180,947 | 5,491,018 | 3,201,927 | |||||||||||||||||
| Total Liabilities and Equity | $ | 17,066,502 | $ | 8,450,029 | $ | 17,096,311 | $ | 8,438,450 | $ | 17,024,672 | $ | 8,372,693 | |||||||||||
| Supplemental Information | 15 | First Quarter 2020 |
| ||
JOINT VENTURE STATEMENTS Statement of Operations for Unconsolidated Joint Ventures Unaudited (Dollars in Thousands) | | |
| ||
| Three Months Ended | Three Months Ended | Three Months Ended | |||||||||||||||||||||
| March 31, 2020 | December 31, 2019 | March 31, 2019 | |||||||||||||||||||||
| Total | SLG Share | Total | SLG Share | Total | SLG Share | ||||||||||||||||||
| Revenues | |||||||||||||||||||||||
| Rental revenue, net | $ | 238,412 | $ | 105,304 | $ | 235,003 | $ | 102,682 | $ | 257,892 | $ | 111,732 | |||||||||||
| Escalation and reimbursement revenues | 39,651 | 18,192 | 39,278 | 18,134 | 39,044 | 18,258 | |||||||||||||||||
| Investment income | 1,237 | 307 | 1,265 | 314 | 7,651 | 2,227 | |||||||||||||||||
| Other income | 3,220 | 1,611 | 4,011 | 1,422 | 2,932 | 1,064 | |||||||||||||||||
| Total Revenues, net | $ | 282,520 | $ | 125,414 | $ | 279,557 | $ | 122,552 | $ | 307,519 | $ | 133,281 | |||||||||||
| Expenses | |||||||||||||||||||||||
| Operating expenses | $ | 51,590 | $ | 22,479 | $ | 49,484 | $ | 22,216 | $ | 54,124 | $ | 22,856 | |||||||||||
| Operating lease rent | 6,361 | 3,090 | 5,968 | 2,894 | 5,901 | 2,860 | |||||||||||||||||
| Real estate taxes | 53,372 | 23,935 | 52,811 | 23,583 | 54,236 | 23,639 | |||||||||||||||||
| Total Operating Expenses | $ | 111,323 | $ | 49,504 | $ | 108,263 | $ | 48,693 | $ | 114,261 | $ | 49,355 | |||||||||||
| Operating Income | $ | 171,197 | $ | 75,910 | $ | 171,294 | $ | 73,859 | $ | 193,258 | $ | 83,926 | |||||||||||
| Interest expense, net of interest income | $ | 86,324 | $ | 35,777 | $ | 89,491 | $ | 37,168 | $ | 96,623 | $ | 39,407 | |||||||||||
| Amortization of deferred financing costs | 4,814 | 1,687 | 4,902 | 1,751 | 5,216 | 1,568 | |||||||||||||||||
| Depreciation and amortization | 98,584 | 45,874 | 98,949 | 46,429 | 104,331 | 48,128 | |||||||||||||||||
| Net loss | $ | (18,525 | ) | $ | (7,428 | ) | $ | (22,048 | ) | $ | (11,489 | ) | $ | (12,912 | ) | $ | (5,177 | ) | |||||
| Real estate depreciation | 98,296 | 45,817 | 98,662 | 46,373 | 104,042 | 48,071 | |||||||||||||||||
| FFO Contribution | $ | 79,771 | $ | 38,389 | $ | 76,614 | $ | 34,884 | $ | 91,130 | $ | 42,894 | |||||||||||
| FAD Adjustments: | |||||||||||||||||||||||
| Non real estate depreciation and amortization | $ | 288 | $ | 57 | $ | 287 | $ | 56 | $ | 289 | $ | 57 | |||||||||||
| Amortization of deferred financing costs | 4,814 | 1,687 | 4,902 | 1,751 | 5,216 | 1,568 | |||||||||||||||||
| Straight-line rental income and other non-cash adjustments | (17,177 | ) | (9,949 | ) | (12,751 | ) | (7,002 | ) | (41,466 | ) | (22,026 | ) | |||||||||||
| Second cycle tenant improvement | (4,664 | ) | (2,032 | ) | (2,297 | ) | (904 | ) | (2,290 | ) | (882 | ) | |||||||||||
| Second cycle leasing commissions | (3,728 | ) | (1,867 | ) | (11,332 | ) | (6,448 | ) | (1,597 | ) | (724 | ) | |||||||||||
| Revenue enhancing recurring CAPEX | (555 | ) | (57 | ) | (4,551 | ) | (2,224 | ) | (232 | ) | (95 | ) | |||||||||||
| Non-revenue enhancing recurring CAPEX | (1,092 | ) | (1,058 | ) | (3,658 | ) | (2,787 | ) | (1,978 | ) | (663 | ) | |||||||||||
| Total FAD Adjustments | $ | (22,114 | ) | $ | (13,219 | ) | $ | (29,400 | ) | $ | (17,558 | ) | $ | (42,058 | ) | $ | (22,765 | ) | |||||
| First cycle tenant improvement | $ | 7,412 | $ | 3,647 | $ | 4,387 | $ | 2,340 | $ | 5,864 | $ | 1,979 | |||||||||||
| First cycle leasing commissions | $ | 252 | $ | 112 | $ | 6,483 | $ | 2,478 | $ | 245 | $ | 125 | |||||||||||
| Development costs | $ | 100,728 | $ | 71,527 | $ | 122,910 | $ | 87,279 | $ | 149,049 | $ | 105,840 | |||||||||||
| Redevelopment costs | $ | 1,251 | $ | 648 | $ | 15,048 | $ | 5,826 | $ | (776 | ) | $ | (624 | ) | |||||||||
| Capitalized interest | $ | 8,729 | $ | 6,198 | $ | 8,510 | $ | 6,043 | $ | 4,929 | $ | 3,500 | |||||||||||
| Supplemental Information | 16 | First Quarter 2020 |
| ||
SELECTED FINANCIAL DATA Net Operating Income Unaudited (Dollars in Thousands) | | |
| ||
| Three Months Ended | |||||||||||||||||
| March 31, | March 31, | December 31, | September 30, | ||||||||||||||
| 2020 | 2019 | 2019 | 2019 | ||||||||||||||
Net Operating Income (1) | $ | 120,619 | $ | 135,506 | $ | 145,930 | $ | 135,744 | |||||||||
| SLG share of property NOI from unconsolidated JVs | 75,067 | 81,706 | 73,256 | 76,552 | |||||||||||||
| NOI including SLG share of unconsolidated JVs | $ | 195,686 | $ | 217,212 | $ | 219,186 | $ | 212,296 | |||||||||
| Partners' share of NOI - consolidated JVs | (675 | ) | (764 | ) | (520 | ) | (536 | ) | |||||||||
| NOI - SLG share | $ | 195,011 | $ | 216,448 | $ | 218,666 | $ | 211,760 | |||||||||
| NOI, including SLG share of unconsolidated JVs | $ | 195,686 | $ | 217,212 | $ | 219,186 | $ | 212,296 | |||||||||
| Free rent (net of amortization) | (3,804 | ) | (16,448 | ) | (6,044 | ) | (16,729 | ) | |||||||||
| Amortization of acquired above and below-market leases, net | (5,060 | ) | (5,609 | ) | (5,229 | ) | (5,281 | ) | |||||||||
| Straight-line revenue adjustment | (5,031 | ) | (5,056 | ) | (853 | ) | (5,822 | ) | |||||||||
| Straight-line tenant credit loss | 494 | 2,737 | 168 | 848 | |||||||||||||
| Operating lease straight-line adjustment | 903 | 972 | 872 | 888 | |||||||||||||
| Cash NOI, including SLG share of unconsolidated JVs | $ | 183,188 | $ | 193,808 | $ | 208,100 | $ | 186,200 | |||||||||
| Partners' share of cash NOI - consolidated JVs | (612 | ) | (703 | ) | (608 | ) | (564 | ) | |||||||||
| Cash NOI - SLG share | $ | 182,576 | $ | 193,105 | $ | 207,492 | $ | 185,636 | |||||||||
| (1) Includes SL Green Management Corp. and Emerge 212. Excludes lease termination income. | |||||||||||||||||
NOI Summary by Portfolio (1) - SLG Share | |||||||||
Three Months Ended March 31, 2020 | |||||||||
| NOI | Cash NOI | ||||||||
| Manhattan Operating Properties | $ | 159,540 | $ | 146,584 | |||||
| Retail Operating Properties | 12,841 | 11,589 | |||||||
| Residential Operating Properties | 3,709 | 3,738 | |||||||
| Suburban Operating Properties | 2,543 | 2,841 | |||||||
| Development/Redevelopment | 12,034 | 13,419 | |||||||
| Total Operating and Development | 190,667 | 178,171 | |||||||
| Property Dispositions | 3,870 | 3,807 | |||||||
Other (2) | 474 | 598 | |||||||
| Total | $ | 195,011 | $ | 182,576 | |||||
(1) Portfolio composition consistent with the Selected Property Data tables | |||||||||
(2) Includes SL Green Management Corp., Emerge 212, Belmont Insurance Company and Ticonderoga Insurance Company | |||||||||
| Supplemental Information | 17 | First Quarter 2020 |
| ||
SELECTED FINANCIAL DATA 2020 Same Store Net Operating Income - Wholly Owned and Consolidated JVs Unaudited (Dollars in Thousands) | | |
| ||
| Three Months Ended | ||||||||||||||||||||
| March 31, | March 31, | December 31, | September 30, | |||||||||||||||||
| 2020 | 2019 | % | 2019 | 2019 | ||||||||||||||||
| Revenues | ||||||||||||||||||||
| Rental revenue, net | $ | 169,526 | $ | 167,091 | 1.5 | % | $ | 171,855 | $ | 168,523 | ||||||||||
| Escalation & reimbursement revenues | 24,623 | 22,711 | 8.4 | % | 26,681 | 26,505 | ||||||||||||||
| Other income | 370 | 474 | (21.9 | )% | 1,981 | 6,209 | ||||||||||||||
| Total Revenues | $ | 194,519 | $ | 190,276 | 2.2 | % | $ | 200,517 | $ | 201,237 | ||||||||||
| Expenses | ||||||||||||||||||||
| Operating expenses | $ | 43,901 | $ | 44,326 | (1.0 | )% | $ | 45,551 | $ | 44,843 | ||||||||||
| Operating lease rent | 6,939 | 7,145 | (2.9 | )% | 7,144 | 7,142 | ||||||||||||||
| Real estate taxes | 40,508 | 38,130 | 6.2 | % | 38,967 | 40,610 | ||||||||||||||
| $ | 91,348 | $ | 89,601 | 1.9 | % | $ | 91,662 | $ | 92,595 | |||||||||||
| Operating Income | $ | 103,171 | $ | 100,675 | 2.5 | % | $ | 108,855 | $ | 108,642 | ||||||||||
| Interest expense & amortization of financing costs | $ | 14,199 | $ | 14,111 | 0.6 | % | $ | 14,263 | $ | 14,320 | ||||||||||
| Depreciation & amortization | 57,944 | 49,572 | 16.9 | % | 45,916 | 50,858 | ||||||||||||||
| Income before noncontrolling interest | $ | 31,028 | $ | 36,992 | (16.1 | )% | $ | 48,676 | $ | 43,464 | ||||||||||
| Plus: | Real estate depreciation & amortization | 57,925 | 49,552 | 16.9 | % | 45,897 | 50,838 | |||||||||||||
| FFO Contribution | $ | 88,953 | $ | 86,544 | 2.8 | % | $ | 94,573 | $ | 94,302 | ||||||||||
| Less: | Non–building revenue | 329 | 24 | 1,270.8 | % | 623 | 2,659 | |||||||||||||
| Plus: | Interest expense & amortization of financing costs | 14,199 | 14,111 | 0.6 | % | 14,263 | 14,320 | |||||||||||||
| Non-real estate depreciation | 19 | 20 | (5.0 | )% | 19 | 20 | ||||||||||||||
| NOI | $ | 102,842 | $ | 100,651 | 2.2 | % | $ | 108,232 | $ | 105,983 | ||||||||||
| Cash Adjustments | ||||||||||||||||||||
| Less: | Free rent (net of amortization) | $ | 2,570 | $ | 5,099 | (49.6 | )% | $ | 2,751 | $ | 3,595 | |||||||||
| Straight-line revenue adjustment | (886 | ) | 431 | (305.6 | )% | 1,930 | 1,266 | |||||||||||||
| Amortization of acquired above and below-market leases, net | 2,376 | 1,237 | 92.1 | % | 1,193 | 1,194 | ||||||||||||||
| Plus: | Operating lease straight-line adjustment | 429 | 514 | (16.5 | )% | 497 | 514 | |||||||||||||
| Straight-line tenant credit loss | 12 | 772 | (98.4 | )% | 170 | 796 | ||||||||||||||
| Cash NOI | $ | 99,223 | $ | 95,170 | 4.3 | % | $ | 103,025 | $ | 101,238 | ||||||||||
| Operating Margins | ||||||||||||||||||||
| NOI to real estate revenue, net | 53.0 | % | 52.9 | % | 54.1 | % | 53.4 | % | ||||||||||||
| Cash NOI to real estate revenue, net | 51.1 | % | 50.0 | % | 51.5 | % | 51.0 | % | ||||||||||||
| NOI before operating lease rent/real estate revenue, net | 56.5 | % | 56.7 | % | 57.7 | % | 57.0 | % | ||||||||||||
| Cash NOI before operating lease rent/real estate revenue, net | 54.4 | % | 53.5 | % | 54.9 | % | 54.3 | % | ||||||||||||
| Supplemental Information | 18 | First Quarter 2020 |
| ||
SELECTED FINANCIAL DATA 2020 Same Store Net Operating Income - Unconsolidated JVs Unaudited (Dollars in Thousands, SLG Share) | | |
| ||
| Three Months Ended | ||||||||||||||||||||
| March 31, | March 31, | December 31, | September 30, | |||||||||||||||||
| 2020 | 2019 | % | 2019 | 2019 | ||||||||||||||||
| Revenues | ||||||||||||||||||||
| Rental revenue, net | $ | 105,832 | $ | 107,972 | (2.0 | )% | $ | 103,288 | $ | 105,966 | ||||||||||
| Escalation & reimbursement revenues | 18,542 | 18,099 | 2.4 | % | 18,478 | 20,176 | ||||||||||||||
| Other income | 965 | 566 | 70.5 | % | 784 | 567 | ||||||||||||||
| Total Revenues | $ | 125,339 | $ | 126,637 | (1.0 | )% | $ | 122,550 | $ | 126,709 | ||||||||||
| Expenses | ||||||||||||||||||||
| Operating expenses | $ | 22,116 | $ | 21,418 | 3.3 | % | $ | 21,774 | $ | 22,043 | ||||||||||
| Operating lease rent | 2,904 | 2,740 | — | % | 2,708 | 3,084 | ||||||||||||||
| Real estate taxes | 24,067 | 22,743 | 5.8 | % | 23,713 | 24,054 | ||||||||||||||
| $ | 49,087 | $ | 46,901 | 4.7 | % | $ | 48,195 | $ | 49,181 | |||||||||||
| Operating Income | $ | 76,252 | $ | 79,736 | (4.4 | )% | $ | 74,355 | $ | 77,528 | ||||||||||
| Interest expense & amortization of financing costs | $ | 38,013 | $ | 40,946 | (7.2 | )% | $ | 39,439 | $ | 40,589 | ||||||||||
| Depreciation & amortization | 44,050 | 44,709 | (1.5 | )% | 45,253 | 44,126 | ||||||||||||||
| Loss before noncontrolling interest | $ | (5,811 | ) | $ | (5,919 | ) | (1.8 | )% | $ | (10,337 | ) | $ | (7,187 | ) | ||||||
| Plus: | Real estate depreciation & amortization | 43,993 | 44,653 | (1.5 | )% | 45,197 | 44,070 | |||||||||||||
| FFO Contribution | $ | 38,182 | $ | 38,734 | (1.4 | )% | $ | 34,860 | $ | 36,883 | ||||||||||
| Less: | Non–building revenue | 947 | 207 | 357.5 | % | 650 | 233 | |||||||||||||
| Plus: | Interest expense & amortization of financing costs | 38,013 | 40,946 | (7.2 | )% | 39,439 | 40,589 | |||||||||||||
| Non-real estate depreciation | 57 | 56 | — | % | 56 | 56 | ||||||||||||||
| NOI | $ | 75,305 | $ | 79,529 | (5.3 | )% | $ | 73,705 | $ | 77,295 | ||||||||||
| Cash Adjustments | ||||||||||||||||||||
| Less: | Free rent (net of amortization) | $ | 1,090 | $ | 10,510 | (89.6 | )% | $ | 1,636 | $ | 11,178 | |||||||||
| Straight-line revenue adjustment | 5,183 | 6,383 | (18.8 | )% | 664 | 5,893 | ||||||||||||||
| Amortization of acquired above and below-market leases, net | 3,827 | 4,262 | (10.2 | )% | 4,321 | 4,122 | ||||||||||||||
| Plus: | Operating lease straight-line adjustment | 342 | 393 | — | % | 243 | 242 | |||||||||||||
| Straight-line tenant credit loss | 471 | 298 | — | % | — | — | ||||||||||||||
| Cash NOI | $ | 66,018 | $ | 59,065 | 11.8 | % | $ | 67,327 | $ | 56,344 | ||||||||||
| Operating Margins | ||||||||||||||||||||
| NOI to real estate revenue, net | 60.5 | % | 62.9 | % | 60.5 | % | 61.1 | % | ||||||||||||
| Cash NOI to real estate revenue, net | 53.1 | % | 46.7 | % | 55.2 | % | 44.5 | % | ||||||||||||
| NOI before operating lease rent/real estate revenue, net | 62.9 | % | 65.1 | % | 62.7 | % | 63.6 | % | ||||||||||||
| Cash NOI before operating lease rent/real estate revenue, net | 55.1 | % | 48.6 | % | 57.3 | % | 46.8 | % | ||||||||||||
| Supplemental Information | 19 | First Quarter 2020 |
| ||
SELECTED FINANCIAL DATA 2020 Same Store Net Operating Income Unaudited (Dollars in Thousands) | | |
| ||
| Three Months Ended | ||||||||||||||||||||
| March 31, | March 31, | December 31, | September 30, | |||||||||||||||||
| 2020 | 2019 | % | 2019 | 2019 | ||||||||||||||||
| Revenues | ||||||||||||||||||||
| Rental revenue, net | $ | 169,526 | $ | 167,091 | 1.5 | % | $ | 171,855 | $ | 168,523 | ||||||||||
| Escalation & reimbursement revenues | 24,623 | 22,711 | 8.4 | % | 26,681 | 26,505 | ||||||||||||||
| Other income | 370 | 474 | (21.9 | )% | 1,981 | 6,209 | ||||||||||||||
| Total Revenues | $ | 194,519 | $ | 190,276 | 2.2 | % | $ | 200,517 | $ | 201,237 | ||||||||||
Equity in Net Loss from Unconsolidated Joint Ventures (1) | $ | (5,811 | ) | $ | (5,919 | ) | (1.8 | )% | $ | (10,337 | ) | $ | (7,187 | ) | ||||||
| Expenses | ||||||||||||||||||||
| Operating expenses | $ | 43,901 | $ | 44,326 | (1.0 | )% | $ | 45,551 | $ | 44,843 | ||||||||||
| Operating lease rent | 6,939 | 7,145 | (2.9 | )% | 7,144 | 7,142 | ||||||||||||||
| Real estate taxes | 40,508 | 38,130 | 6.2 | % | 38,967 | 40,610 | ||||||||||||||
| $ | 91,348 | $ | 89,601 | 1.9 | % | $ | 91,662 | $ | 92,595 | |||||||||||
| Operating Income | $ | 97,360 | $ | 94,756 | 2.7 | % | $ | 98,518 | $ | 101,455 | ||||||||||
| Interest expense & amortization of financing costs | $ | 14,199 | $ | 14,111 | 0.6 | % | $ | 14,263 | $ | 14,320 | ||||||||||
| Depreciation & amortization | 57,944 | 49,572 | 16.9 | % | 45,916 | 50,858 | ||||||||||||||
| Income before noncontrolling interest | $ | 25,217 | $ | 31,073 | (18.8 | )% | $ | 38,339 | $ | 36,277 | ||||||||||
| Plus: | Real estate depreciation & amortization | 57,925 | 49,552 | 16.9 | % | 45,897 | 50,838 | |||||||||||||
Joint Ventures Real estate depreciation & amortization (1) | 43,993 | 44,653 | (1.5 | )% | 45,197 | 44,070 | ||||||||||||||
| FFO Contribution | $ | 127,135 | $ | 125,278 | 1.5 | % | $ | 129,433 | $ | 131,185 | ||||||||||
| Less: | Non–building revenue | $ | 329 | $ | 24 | 1,270.8 | % | $ | 623 | $ | 2,659 | |||||||||
Joint Ventures Non–building revenue (1) | 947 | 207 | 357.5 | % | 650 | 233 | ||||||||||||||
| Plus: | Interest expense & amortization of financing costs | 14,199 | 14,111 | 0.6 | % | 14,263 | 14,320 | |||||||||||||
Joint Ventures Interest expense & amortization of financing costs (1) | 38,013 | 40,946 | (7.2 | )% | 39,439 | 40,589 | ||||||||||||||
| Non-real estate depreciation | 19 | 20 | (5.0 | )% | 19 | 20 | ||||||||||||||
Joint Ventures Non-real estate depreciation (1) | 57 | 56 | 1.8 | % | 56 | 56 | ||||||||||||||
| NOI | $ | 178,147 | $ | 180,180 | (1.1 | )% | $ | 181,937 | $ | 183,278 | ||||||||||
| Cash Adjustments | ||||||||||||||||||||
| Non-cash adjustments | $ | (3,619 | ) | $ | (5,481 | ) | (34.0 | )% | $ | (5,207 | ) | $ | (4,745 | ) | ||||||
Joint Venture non-cash adjustments (1) | (9,287 | ) | (20,464 | ) | (54.6 | )% | (6,378 | ) | (20,951 | ) | ||||||||||
| Cash NOI | $ | 165,241 | $ | 154,235 | 7.1 | % | $ | 170,352 | $ | 157,582 | ||||||||||
| Operating Margins | ||||||||||||||||||||
| NOI to real estate revenue, net | 55.9 | % | 56.9 | % | 56.5 | % | 56.4 | % | ||||||||||||
| Cash NOI to real estate revenue, net | 51.9 | % | 48.7 | % | 52.9 | % | 48.5 | % | ||||||||||||
| NOI before operating lease rent/real estate revenue, net | 59.0 | % | 60.0 | % | 59.6 | % | 59.5 | % | ||||||||||||
| Cash NOI before operating lease rent/real estate revenue, net | 54.7 | % | 51.5 | % | 55.8 | % | 51.4 | % | ||||||||||||
(1) The amount represents the Company's share of same-store unconsolidated joint venture activity. The Company does not control investments in unconsolidated joint ventures. | ||||||||||||||||||||
| Supplemental Information | 20 | First Quarter 2020 |
| ||
DEBT SUMMARY SCHEDULE Consolidated Unaudited (Dollars in Thousands) | | |
| ||
| Principal | 2020 | Initial | Principal | As-Of | Final | ||||||||||||||||||||||
| Ownership | Outstanding | Principal | Maturity | Due at | Right | Maturity | Earliest | ||||||||||||||||||||
| Fixed rate debt | Interest (%) | 3/31/2020 | Coupon (1) | Amortization | Date | Maturity | Extension | Date (2) | Prepayment (3) | ||||||||||||||||||
| Secured fixed rate debt | |||||||||||||||||||||||||||
| 100 Church Street | 100.0 | $ | 208,197 | 4.68% | $ | 4,421 | Jul-22 | $ | 197,784 | — | Jul-22 | Apr-22 | |||||||||||||||
| 420 Lexington Avenue | 100.0 | 297,885 | 3.99% | 5,130 | Oct-24 | 272,749 | — | Oct-40 | Jul-24 | ||||||||||||||||||
| 400 East 58th Street | 90.0 | 38,881 | 3.00% | 863 | Nov-26 | 33,840 | — | Nov-26 | Open | ||||||||||||||||||
| Landmark Square | 100.0 | 100,000 | 4.90% | — | Jan-27 | 100,000 | — | Jan-27 | Oct-26 | ||||||||||||||||||
| 485 Lexington Avenue | 100.0 | 450,000 | 4.25% | — | Feb-27 | 450,000 | — | Feb-27 | Oct-26 | ||||||||||||||||||
| 1080 Amsterdam | 92.5 | 34,947 | 3.59% | 705 | Feb-27 | 29,527 | — | Feb-27 | Open | ||||||||||||||||||
| $ | 1,129,910 | 4.25% | $ | 11,119 | $ | 1,083,900 | |||||||||||||||||||||
| Unsecured fixed rate debt | |||||||||||||||||||||||||||
| Unsecured notes | $ | 499,722 | 3.25% | $ | — | Oct-22 | $ | 500,000 | — | Oct-22 | Open | ||||||||||||||||
| Unsecured notes | 302,881 | 4.50% | — | Dec-22 | 300,000 | — | Dec-22 | Open | |||||||||||||||||||
| Term loan (swapped) | 1,000,000 | 3.19% | (4) | — | Mar-23 | (3) | 1,000,000 | — | Mar-23 | Open | |||||||||||||||||
| Unsecured notes | 100,000 | 4.27% | — | Dec-25 | 100,000 | — | Dec-25 | Open | |||||||||||||||||||
| $ | 1,902,603 | 3.47% | $ | — | $ | 1,900,000 | |||||||||||||||||||||
| Total Fixed Rate Debt | $ | 3,032,513 | 3.76% | $ | 11,119 | $ | 2,983,900 | ||||||||||||||||||||
| Floating rate debt | |||||||||||||||||||||||||||
| Secured floating rate debt | |||||||||||||||||||||||||||
| FHLB Facility (LIBOR + 17 bps) | $ | 14,500 | 1.16% | $ | — | Jun-20 | $ | 14,500 | — | Jun-20 | Open | ||||||||||||||||
| Debt & preferred equity facility (LIBOR + 209 bps) | 137,473 | 3.07% | (5) | — | Jun-20 | 137,473 | Jun-22 | Jun-22 | Open | ||||||||||||||||||
| FHLB Facility (LIBOR + 16.5 bps) | 10,000 | 1.15% | — | Jul-20 | 10,000 | — | Jul-20 | Open | |||||||||||||||||||
| 133 Greene Street (LIBOR + 200 bps) | 100.0 | 15,523 | 2.99% | — | Aug-20 | 15,523 | — | Aug-21 | Open | ||||||||||||||||||
| FHLB Facility (LIBOR + 26 bps) | 15,000 | 1.25% | — | Aug-20 | 15,000 | — | Aug-20 | Open | |||||||||||||||||||
| 106 Spring Street (LIBOR + 250 bps) | 100.0 | 38,025 | 3.49% | — | Jan-21 | 38,025 | — | Jan-22 | Open | ||||||||||||||||||
| FHLB Facility (LIBOR + 18 bps) | 35,000 | 1.17% | — | Jan-21 | 35,000 | — | Jan-21 | Open | |||||||||||||||||||
| 609 Fifth Avenue (LIBOR + 240 bps) | 100.0 | 55,416 | 3.39% | — | Mar-21 | 55,416 | Mar-22 | Mar-24 | Open | ||||||||||||||||||
| 185 Broadway (LIBOR + 285 bps) | 100.0 | 130,791 | 3.84% | — | Nov-21 | 130,791 | — | Nov-23 | Open | ||||||||||||||||||
| 712 Madison Avenue (LIBOR + 185 bps) | 100.0 | 28,000 | 2.84% | — | Dec-21 | 28,000 | — | Dec-22 | Open | ||||||||||||||||||
| 410 Tenth Avenue (LIBOR + 222.5 bps) | 70.9 | 350,578 | 3.21% | — | May-22 | 350,579 | — | May-24 | Open | ||||||||||||||||||
| 719 Seventh Avenue (LIBOR + 120 bps) | 75.0 | 50,000 | 2.19% | — | Sep-23 | 50,000 | — | Sep-23 | Open | ||||||||||||||||||
| $ | 880,306 | 3.06% | $ | — | $ | 880,307 | |||||||||||||||||||||
| Unsecured floating rate debt | |||||||||||||||||||||||||||
| Unsecured notes (3mo. LIBOR + 98 bps) | $ | 350,000 | 2.41% | (6) | $ | — | Aug-21 | $ | 350,000 | — | Aug-21 | Open | |||||||||||||||
| Revolving credit facility (LIBOR + 100 bps) | 1,300,000 | 1.99% | — | Mar-22 | 1,300,000 | Mar-23 | Mar-23 | Open | |||||||||||||||||||
| Term loan (LIBOR + 110 bps) | 300,000 | 2.09% | — | Mar-23 | 300,000 | — | Mar-23 | Open | |||||||||||||||||||
| Term loan (LIBOR + 100 bps) | 200,000 | 1.99% | — | Nov-24 | 200,000 | — | Nov-24 | Open | |||||||||||||||||||
| Junior subordinated deferrable interest debentures (3mo. LIBOR + 125 bps) | 100,000 | 2.68% | — | Jul-35 | 100,000 | — | Jul-35 | Open | |||||||||||||||||||
| $ | 2,250,000 | 2.10% | $ | — | $ | 2,250,000 | |||||||||||||||||||||
| Total Floating Rate Debt | $ | 3,130,306 | 2.37% | $ | — | $ | 3,130,307 | ||||||||||||||||||||
| Total Debt - Consolidated | $ | 6,162,819 | 3.05% | $ | 11,119 | $ | 6,114,207 | ||||||||||||||||||||
| Deferred financing costs | (39,553 | ) | |||||||||||||||||||||||||
| Total Debt - Consolidated, net | $ | 6,123,266 | 3.05% | ||||||||||||||||||||||||
| Total Debt - Joint Venture, net | $ | 4,091,392 | 3.56% | ||||||||||||||||||||||||
| Total Debt including SLG share of unconsolidated JV Debt | $ | 10,294,902 | 3.26% | ||||||||||||||||||||||||
| Weighted Average Balance & Interest Rate for the quarter, including SLG share of JV Debt | $ | 10,150,266 | 3.70% | ||||||||||||||||||||||||
| (1) Coupon for floating rate debt determined using the effective 1-month LIBOR rate at the end of the quarter of 0.98% or the 3-month LIBOR rate at the end of the quarter of 1.43%. Coupon for loans that are subject to LIBOR floors were determined using the LIBOR floors. | |||||||||||||||||||||||||||
| (2) Reflects exercise of all available extension options. | |||||||||||||||||||||||||||
| (3) Loans noted as "open" may be subject to certain fees, premiums or penalties on early repayment. | |||||||||||||||||||||||||||
| (4) Represents a blended fixed rate inclusive of the effect of the following swaps: $200 million @ 1.93% maturing November 2020, $200 million @ 1.13% and $100 million @ 1.16% maturing July 2023, $150 million @ 2.70% maturing January 2024, $200 million @ 2.74% and $150 million @ 2.72% maturing January 2026. | |||||||||||||||||||||||||||
| (5) The debt and preferred equity facility bears interest on a floating rate basis at a spread to 1-month LIBOR based on the pledged collateral and advance rate. | |||||||||||||||||||||||||||
| (6) In April 2020, we entered into an interest rate swap at a fixed rate of 0.54%, resulting in a coupon of 1.52%. | |||||||||||||||||||||||||||
| Supplemental Information | 21 | First Quarter 2020 |
| ||
DEBT SUMMARY SCHEDULE Unconsolidated JVs Unaudited (Dollars in Thousands) | | |
| ||
| Principal Outstanding | 2020 | Initial | Principal | As-Of | Final | |||||||||||||||||||||||||
| Ownership | 3/31/20 | Principal Amortization | Maturity | Due at Maturity | Right | Maturity | Earliest | |||||||||||||||||||||||
| Fixed rate debt | Interest (%) | Gross Principal | SLG Share | Coupon (1) | (SLG Share) | Date | (SLG Share) | Extension | Date (2) | Prepayment (3) | ||||||||||||||||||||
| 717 Fifth Avenue (mortgage) | 10.9 | $ | 300,000 | $ | 32,748 | 4.45% | $ | — | Jul-22 | $ | 32,748 | — | Jul-22 | Open | ||||||||||||||||
| 717 Fifth Avenue (mezzanine) | 10.9 | 355,328 | 38,788 | 5.50% | — | Jul-22 | 38,788 | — | Jul-22 | Mar-22 | ||||||||||||||||||||
| 650 Fifth Avenue (mortgage) | 50.0 | 210,000 | 105,000 | 4.46% | — | Oct-22 | 105,000 | — | Oct-22 | Open | ||||||||||||||||||||
| 650 Fifth Avenue (mezzanine) | 50.0 | 65,000 | 32,500 | 5.45% | — | Oct-22 | 32,500 | — | Oct-22 | Open | ||||||||||||||||||||
| 21 East 66th Street | 32.3 | 12,000 | 3,874 | 3.60% | — | Apr-23 | 3,874 | — | Apr-28 | Open | ||||||||||||||||||||
| 919 Third Avenue | 51.0 | 500,000 | 255,000 | 5.12% | — | Jun-23 | 255,000 | — | Jun-23 | Feb-23 | ||||||||||||||||||||
| 1515 Broadway | 56.9 | 834,084 | 474,334 | 3.93% | 10,202 | Mar-25 | 419,372 | — | Mar-25 | Sep-24 | ||||||||||||||||||||
| 11 Madison Avenue | 60.0 | 1,400,000 | 840,000 | 3.84% | — | Sep-25 | 840,000 | — | Sep-25 | Mar-25 | ||||||||||||||||||||
| 800 Third Avenue (swapped) | 60.5 | 177,000 | 107,120 | 3.37% | — | Feb-26 | 107,120 | — | Feb-26 | Open | ||||||||||||||||||||
| 400 East 57th Street | 41.0 | 97,202 | 39,853 | 3.00% | 884 | Nov-26 | 35,889 | — | Nov-26 | Open | ||||||||||||||||||||
| Worldwide Plaza | 24.4 | 1,200,000 | 292,200 | 3.98% | — | Nov-27 | 292,200 | — | Nov-27 | Jul-27 | ||||||||||||||||||||
| Stonehenge Portfolio | Various | 196,112 | (4) | 11,289 | 3.50% | 94 | Various | (4) | 10,114 | — | Various | Open | ||||||||||||||||||
| Total Fixed Rate Debt | $ | 5,346,726 | $ | 2,232,706 | 4.07% | (5) | $ | 11,180 | $ | 2,172,605 | ||||||||||||||||||||
| Floating rate debt | ||||||||||||||||||||||||||||||
| 280 Park Avenue (LIBOR + 173 bps) | 50.0 | $ | 1,200,000 | $ | 600,000 | 2.72% | $ | — | Sep-20 | $ | 600,000 | Sep-24 | Sep-24 | Open | ||||||||||||||||
| 1552 Broadway (LIBOR + 265 bps) | 50.0 | 195,000 | 97,500 | 3.64% | — | Oct-20 | 97,500 | — | Oct-22 | Open | ||||||||||||||||||||
| 121 Greene Street (LIBOR + 150 bps) | 50.0 | 15,000 | 7,500 | 2.49% | — | Nov-20 | 7,500 | — | Nov-21 | Open | ||||||||||||||||||||
| 11 West 34th Street (LIBOR + 145 bps) | 30.0 | 23,000 | 6,900 | 2.44% | — | Jan-21 | 6,900 | Jan-23 | Jan-23 | Open | ||||||||||||||||||||
| 100 Park Avenue (LIBOR + 175 bps) | 49.9 | 356,027 | 177,657 | 2.74% | 1,934 | Feb-21 | 175,858 | — | Feb-21 | Open | ||||||||||||||||||||
| One Vanderbilt (LIBOR + 250 bps) | 71.0 | 838,936 | 595,728 | 3.49% | — | Sep-21 | 595,728 | — | Sep-23 | Open | ||||||||||||||||||||
| 2 Herald Square (LIBOR + 145 bps) | 51.0 | 198,629 | 101,301 | 2.44% | — | Nov-21 | 101,301 | — | Nov-23 | Open | ||||||||||||||||||||
| 55 West 46th Street - Tower 46 (LIBOR + 125 bps) | 25.0 | 192,524 | 48,131 | 2.24% | — | Aug-22 | 48,131 | — | Aug-24 | Open | ||||||||||||||||||||
| 115 Spring Street (LIBOR + 340 bps) | 51.0 | 65,550 | 33,431 | 4.39% | — | Sep-23 | 33,431 | — | Sep-23 | Open | ||||||||||||||||||||
| 10 East 53rd Street (LIBOR + 135 bps) | 55.0 | 220,000 | 121,000 | 2.34% | Feb-25 | 121,000 | — | Feb-25 | Open | |||||||||||||||||||||
| 605 West 42nd Street - Sky (LIBOR + 144 bps) | 20.0 | 550,000 | 110,000 | 2.43% | — | Aug-27 | 110,000 | — | Aug-27 | Open | ||||||||||||||||||||
| 21 East 66th Street (T 12 mos + 275 bps) | 32.3 | 708 | 229 | 2.92% | 14 | Jun-33 | 2 | — | Jun-33 | Open | ||||||||||||||||||||
| Total Floating Rate Debt | $ | 3,855,374 | $ | 1,899,377 | 2.96% | (5) | $ | 1,948 | $ | 1,897,351 | ||||||||||||||||||||
| Total unconsolidated JV Debt | $ | 9,202,100 | $ | 4,132,083 | 3.56% | (5) | $ | 13,128 | $ | 4,069,956 | ||||||||||||||||||||
| Deferred financing costs | (85,928 | ) | (40,691 | ) | ||||||||||||||||||||||||||
| Total unconsolidated JV Debt, net | $ | 9,116,172 | $ | 4,091,392 | 3.56% | |||||||||||||||||||||||||
| (1) Coupon for floating rate debt determined using the effective 1-month LIBOR rate at the end of the quarter of 0.98%. Coupon for loans that are subject to LIBOR floors were determined using the LIBOR floors. | ||||||||||||||||||||||||||||||
| (2) Reflects exercise of all available extension options. | ||||||||||||||||||||||||||||||
| (3) Loans noted as "open" may be subject to certain fees, premiums or penalties on early repayment. | ||||||||||||||||||||||||||||||
| (4) Amount is comprised of three mortgages totaling $132.6 million that mature in April 2028 and two mortgages totaling $63.5 million that mature in July 2029. | ||||||||||||||||||||||||||||||
| (5) The weighted average coupon is calculated based on SL Green's share of the outstanding debt. | ||||||||||||||||||||||||||||||
| SL GREEN REALTY CORP. | Composition of Debt | |||||||||||||||||||||||||||||
| Revolving Credit Facility Covenants | Fixed Rate Debt | |||||||||||||||||||||||||||||
| Actual | Required | Consolidated | $ | 3,032,513 | ||||||||||||||||||||||||||
| Total Debt / Total Assets | 42.8% | Less than 60% | SLG Share of JV | 2,232,706 | ||||||||||||||||||||||||||
| Fixed Charge Coverage | 2.66 | Greater than 1.4x | Total Fixed Rate Debt | $ | 5,265,219 | 51.1% | ||||||||||||||||||||||||
| Maximum Secured Indebtedness | 14.7% | Less than 50% | ||||||||||||||||||||||||||||
| Maximum Unencumbered Leverage Ratio | 56.0% | Less than 60% | Floating Rate Debt | |||||||||||||||||||||||||||
| Consolidated | $ | 3,130,306 | ||||||||||||||||||||||||||||
| Unsecured Notes Covenants | SLG Share of JV | 1,899,377 | ||||||||||||||||||||||||||||
| Actual | Required | 5,029,683 | 48.9% | |||||||||||||||||||||||||||
| Total Debt / Total Assets | 42.8% | Less than 60% | Debt & Preferred Equity and Other Investments | (823,603 | ) | (8.0)% | ||||||||||||||||||||||||
| Secured Debt / Total Assets | 19.7% | Less than 40% | Total Floating Rate Debt | $ | 4,206,080 | 40.9% | ||||||||||||||||||||||||
| Debt Service Coverage | 2.95x | Greater than 1.5x | ||||||||||||||||||||||||||||
| Unencumbered Assets / Unsecured Debt | 261.7% | Greater than 150% | Total Debt | $ | 10,294,902 | |||||||||||||||||||||||||
| Supplemental Information | 22 | First Quarter 2020 |
| ||
SUMMARY OF GROUND LEASE ARRANGEMENTS Unaudited (Dollars in Thousands) | | |
| ||
| 2020 Scheduled | 2021 Scheduled | 2022 Scheduled | 2023 Scheduled | Lease | Year of Final | ||||||||||||||||||||||||
| Property | Cash Payment | Cash Payment | Cash Payment | Cash Payment | Liabilities (1) | Expiration (2) | |||||||||||||||||||||||
| Consolidated Ground Lease Arrangements | |||||||||||||||||||||||||||||
| Operating Leases | |||||||||||||||||||||||||||||
| 1185 Avenue of the Americas | $ | 6,909 | $ | 6,909 | $ | 6,909 | $ | 6,909 | $ | 95,153 | 2043 | ||||||||||||||||||
| 625 Madison Avenue | 4,613 | 4,613 | 2,306 | (3) | — | (3) | 9,930 | 2054 | |||||||||||||||||||||
| 420 Lexington Avenue | 11,174 | 11,199 | 11,199 | 11,199 | 180,714 | 2080 | |||||||||||||||||||||||
| 711 Third Avenue | 5,500 | 5,500 | 5,500 | 5,500 | 54,815 | 2083 | (4) | ||||||||||||||||||||||
| 1055 Washington Blvd, Stamford | 615 | 615 | 615 | 615 | 10,088 | 2090 | |||||||||||||||||||||||
| 1080 Amsterdam Avenue | 314 | 314 | 314 | 314 | 7,306 | 2111 | |||||||||||||||||||||||
| 30 East 40th Street | 212 | 229 | 229 | 229 | 5,372 | 2114 | |||||||||||||||||||||||
| Other | 71 | 73 | 76 | 78 | 612 | Various | |||||||||||||||||||||||
| Total | $ | 29,408 | $ | 29,452 | $ | 27,148 | $ | 24,844 | $ | 363,990 | |||||||||||||||||||
| Financing Leases | |||||||||||||||||||||||||||||
| 461 Fifth Avenue | $ | 2,100 | $ | 2,250 | $ | 2,400 | $ | 2,400 | $ | 29,174 | 2084 | (5) | |||||||||||||||||
| 1080 Amsterdam Avenue | 436 | 436 | 436 | 436 | 22,376 | 2111 | |||||||||||||||||||||||
| 30 East 40th Street | 2,183 | 2,358 | 2,358 | 2,358 | 22,262 | 2114 | |||||||||||||||||||||||
| 126 Nassau Street | 2,758 | 3,041 | 3,087 | 3,133 | 88,487 | 2119 | (5) | ||||||||||||||||||||||
| Total | $ | 7,477 | $ | 8,085 | $ | 8,281 | $ | 8,327 | $ | 162,299 | |||||||||||||||||||
| Unconsolidated Joint Venture Ground Lease Arrangements (SLG Share) | |||||||||||||||||||||||||||||
| Operating Leases | |||||||||||||||||||||||||||||
| 650 Fifth Avenue (Floors 4-6) | $ | 1,645 | $ | 1,659 | $ | 1,790 | $ | 1,790 | $ | 18,388 | 2053 | ||||||||||||||||||
| 650 Fifth Avenue (Floors b-3) | 1,428 | 1,428 | 1,441 | 1,458 | 30,720 | 2062 | |||||||||||||||||||||||
| 1560 Broadway | 6,811 | 6,861 | 6,861 | 6,935 | 75,374 | 2114 | |||||||||||||||||||||||
| 333 East 22nd Street | 217 | 222 | 238 | 238 | 5,307 | 2115 | |||||||||||||||||||||||
| Total | $ | 10,101 | $ | 10,170 | $ | 10,330 | $ | 10,421 | $ | 129,789 | |||||||||||||||||||
| Financing Leases | |||||||||||||||||||||||||||||
| 650 Fifth Avenue (Floors b-3) | $ | 6,695 | $ | 6,695 | $ | 6,695 | $ | 6,786 | $ | 97,674 | 2062 | ||||||||||||||||||
| 2 Herald Square | 6,934 | 7,107 | 7,285 | 7,467 | 225,382 | 2077 | (5) | ||||||||||||||||||||||
| Total | $ | 13,629 | $ | 13,802 | $ | 13,980 | $ | 14,253 | $ | 323,056 | |||||||||||||||||||
| (1) Per the balance sheet at March 31, 2020. | |||||||||||||||||||||||||||||
| (2) Reflects exercise of all available renewal options. | |||||||||||||||||||||||||||||
| (3) Reflects known cash payments through ground rent reset date. | |||||||||||||||||||||||||||||
| (4) Reflects 50% of the annual ground rent payment as the Company owns 50% of the fee interest. | |||||||||||||||||||||||||||||
| (5) The Company has an option to purchase the ground lease for a fixed price on a specific date. Scheduled cash payments do not reflect the exercise of the purchase option. | |||||||||||||||||||||||||||||
| Supplemental Information | 23 | First Quarter 2020 |
| ||
DEBT AND PREFERRED EQUITY INVESTMENTS Unaudited (Dollars in Thousands) | | |
| ||
| Weighted Average Book | Weighted Average | Weighted Average Yield | ||||||||||||||||||
Book Value (1) | Value During Quarter | Yield During Quarter (2) | At End Of Quarter (3) | |||||||||||||||||
| 3/31/2019 | $ | 2,272,241 | $ | 2,239,180 | 8.76% | 8.78% | ||||||||||||||
Debt investment originations/fundings/accretion(4) | 98,878 | |||||||||||||||||||
Preferred Equity investment originations/accretion(4) | 3,807 | |||||||||||||||||||
| Redemptions/Sales/Syndications/Amortization | (146,014 | ) | ||||||||||||||||||
| 6/30/2019 | $ | 2,228,912 | $ | 2,216,132 | 8.99% | 9.05% | ||||||||||||||
Debt investment originations/fundings/accretion(4) | 33,009 | |||||||||||||||||||
Preferred Equity investment originations/accretion(4) | 3,746 | |||||||||||||||||||
| Redemptions/Sales/Syndications/Amortization | (311,111 | ) | ||||||||||||||||||
| 9/30/2019 | $ | 1,954,556 | $ | 2,115,865 | 9.05% | 8.96% | ||||||||||||||
Debt investment originations/fundings/accretion(4) | 92,927 | |||||||||||||||||||
Preferred Equity investment originations/accretion(4) | 3,767 | |||||||||||||||||||
| Redemptions/Sales/Syndications/Amortization | (470,944 | ) | ||||||||||||||||||
| 12/31/2019 | $ | 1,580,306 | $ | 1,818,175 | 8.48% | 8.60% | ||||||||||||||
Debt investment originations/fundings/accretion(4) | 246,075 | |||||||||||||||||||
Preferred Equity investment originations/accretion(4) | 154,710 | |||||||||||||||||||
| Redemptions/Sales/Syndications/Amortization | (159,798 | ) | ||||||||||||||||||
| Reserves | (37,957 | ) | ||||||||||||||||||
| 3/31/2020 | $ | 1,783,336 | (5) | $ | 1,771,416 | 8.29% | 8.20% | |||||||||||||
| (1) Net of unamortized fees, discounts, and premiums. | ||||||||||||||||||||
| (2) Excludes accelerated fee income resulting from early repayment and loan loss reserves | ||||||||||||||||||||
| (3) Calculated based on GAAP income, which includes cash interest, paid-in-kind interest, fee accrual and amortization of discounts, recognized in the last month of the quarter, excluding accelerated fee income resulting from early repayment and loan loss reserves. | ||||||||||||||||||||
| (4) Includes funded future funding obligations, amortization of fees and discounts and paid-in-kind investment income. | ||||||||||||||||||||
| (5) Excludes debt and preferred equity investments totaling $34.8 million with a weighted average current yield of 6.53% that are included in other balance sheet line items. | ||||||||||||||||||||
| Supplemental Information | 24 | First Quarter 2020 |
| ||
DEBT AND PREFERRED EQUITY INVESTMENTS Unaudited (Dollars in Thousands, Except Per Square Foot Amounts) | | |
| ||
| Book Value | Senior | Weighted Average | Weighted Average | Weighted Average Yield | ||||||||||||||||||||||||||||
| Type of Investment | Floating rate | Fixed rate | Total | Financing | Exposure PSF | Yield During Quarter (1) | At End Of Quarter (1)(2) | |||||||||||||||||||||||||
| Senior Mortgage Debt | $ | 372,547 | $ | 100,202 | $ | 472,749 | $ | — | $ | 381 | 6.62% | 6.28% | ||||||||||||||||||||
| Junior Mortgage Participation | 83,004 | — | 83,004 | 438,138 | $ | 2,586 | 8.76% | 8.72% | ||||||||||||||||||||||||
| Mezzanine Debt | 368,053 | 491,838 | 859,891 | 5,169,422 | $ | 797 | 8.61% | 8.65% | ||||||||||||||||||||||||
| Preferred Equity | — | 367,692 | 367,692 | 522,000 | $ | 829 | 9.67% | 9.87% | ||||||||||||||||||||||||
| Balance as of 3/31/20 | $ | 823,604 | $ | 959,732 | $ | 1,783,336 | (3) | $ | 6,129,560 | $ | 784 | 8.29% | 8.20% | |||||||||||||||||||
| (1) Excludes accelerated fee income resulting from early repayment and loan loss reserves. | ||||||||||||||||||||||||||||||||
| (2) Calculated based on GAAP income, which includes cash interest, paid-in-kind interest, fee accrual and amortization of discounts, recognized in the last month of the quarter, excluding accelerated fee income resulting from early repayment and loan loss reserves. | ||||||||||||||||||||||||||||||||
| (3) Net of unamortized fees, discounts, and premiums. Excludes debt and preferred equity investments totaling $34.8 million with a weighted average current yield of 6.53% that are included in other balance sheet line items. | ||||||||||||||||||||||||||||||||
Debt and Preferred Equity Maturity Profile (1) | |||||||||||||
| 2020 | 2021 | 2022 | 2023 | 2024 & Thereafter | |||||||||
| Floating Rate | 314,920 | 254,378 | 196,957 | 57,349 | — | ||||||||
| Fixed Rate | 173,217 | 102,610 | 212,416 | 259,764 | 211,725 | ||||||||
| Sub-total | 488,137 | 356,988 | 409,373 | 317,113 | 211,725 | ||||||||
| (1) The weighted average maturity of the outstanding balance is 2.16 years. Approximately 59.8% of our portfolio of investments have extension options, some of which may be subject to certain conditions for extension. The weighted average fully extended maturity of the outstanding balance is 2.85 years. | |||||||||||||
| Supplemental Information | 25 | First Quarter 2020 |
| ||
10 LARGEST DEBT AND PREFERRED EQUITY INVESTMENTS Unaudited (Dollars in Thousands, Except Per Square Foot Amounts) | | |
| ||
Book Value (1) | Property | Senior | Yield At End | ||||||||||||||||||
| Investment Type | 3/31/2020 | Type | Location | Financing | Last $ PSF (2) | Of Quarter (3) | |||||||||||||||
| Mezzanine Loan | $ | 220,420 | Fee | Manhattan | $ | 330,204 | $ | 944 | 8.58% | ||||||||||||
| Mezzanine Loan and Preferred Equity | 205,523 | Office | Manhattan | 1,768,000 | $ | 1,077 | 10.98% | ||||||||||||||
| Preferred Equity | 133,050 | Office | Manhattan | 272,000 | $ | 638 | 7.10% | ||||||||||||||
| Mezzanine Loan | 123,419 | Office | Manhattan | 1,115,000 | $ | 1,065 | 10.61% | ||||||||||||||
| Senior Mortgage Loan | 118,378 | Office | Manhattan | — | $ | 389 | 4.87% | ||||||||||||||
| Preferred Equity | 100,000 | Multi-Family Rental | Manhattan | 250,000 | $ | 710 | —% | ||||||||||||||
| Mortgage Loan | 99,110 | Office Leasehold | Manhattan | — | $ | 88 | 8.14% | ||||||||||||||
| Mortgage and Mezzanine Loans | 96,880 | Residential | Manhattan | — | $ | 828 | 6.37% | ||||||||||||||
| Mortgage and Mezzanine Loans | 71,964 | Residential | Manhattan | — | $ | 822 | 7.03% | ||||||||||||||
| Mortgage and Mezzanine Loans | 70,000 | Multi-Family Rental | Brooklyn | — | $ | 115 | 7.37% | ||||||||||||||
| Total | $ | 1,238,744 | $ | 3,735,204 | 8.28% | ||||||||||||||||
| (1) Net of unamortized fees, discounts, and premiums excluding loan loss reserves. | |||||||||||||||||||||
| (2) Reflects the last dollar of exposure to the Company's most junior position. | |||||||||||||||||||||
| (3) Calculated based on GAAP income, which includes cash interest, paid-in-kind interest, fee accrual and amortization of discounts, recognized in the last month of the quarter excluding loan loss reserves. | |||||||||||||||||||||
| Supplemental Information | 26 | First Quarter 2020 |
| ||
SELECTED PROPERTY DATA Manhattan Operating Properties Unaudited (Dollars in Thousands) | | |
| ||
| Ownership | # of | Usable | % of Total | Occupancy (%) | Annualized Contractual Cash Rent ($'s) | Annualized Contractual Cash Rent | Total Tenants | ||||||||||||||||||||||||||
| Properties | Interest (%) | SubMarket | Ownership | Bldgs | Sq. Feet | Sq. Feet | Mar-20 | Dec-19 | Sep-19 | Jun-19 | Mar-19 | 100% | SLG% | ||||||||||||||||||||
| CONSOLIDATED PROPERTIES | |||||||||||||||||||||||||||||||||
| "Same Store" | |||||||||||||||||||||||||||||||||
| 30 East 40th Street | 60.0 | Grand Central South | Leasehold Interest | 1 | 69,446 | 0.3 | 93.5 | 93.5 | 93.9 | 93.9 | 94.9 | $5,228 | 0.3 | 54 | |||||||||||||||||||
| 100 Church Street | 100.0 | Downtown | Fee Interest | 1 | 1,047,500 | 4.8 | 99.3 | 99.3 | 99.3 | 99.3 | 99.6 | 49,220 | 7.0 | 4.4 | 19 | ||||||||||||||||||
| 110 East 42nd Street | 100.0 | Grand Central | Fee Interest | 1 | 215,400 | 1.0 | 82.6 | 83.0 | 84.9 | 84.0 | 85.4 | 10,821 | 1.5 | 1.0 | 24 | ||||||||||||||||||
| 110 Greene Street | 100.0 | Soho | Fee Interest | 1 | 223,600 | 1.0 | 91.3 | 94.3 | 93.1 | 93.3 | 90.3 | 15,366 | 2.2 | 1.4 | 60 | ||||||||||||||||||
| 125 Park Avenue | 100.0 | Grand Central | Fee Interest | 1 | 604,245 | 2.8 | 99.5 | 95.0 | 95.6 | 95.5 | 94.5 | 45,989 | 6.6 | 4.1 | 26 | ||||||||||||||||||
| 220 East 42nd Street | 100.0 | Grand Central | Fee Interest | 1 | 1,135,000 | 5.2 | 97.0 | 97.0 | 97.0 | 90.9 | 90.9 | 69,008 | 9.9 | 6.2 | 37 | ||||||||||||||||||
| 304 Park Avenue South | 100.0 | Midtown South | Fee Interest | 1 | 215,000 | 1.0 | 74.9 | 95.9 | 96.1 | 100.0 | 97.8 | 13,160 | 1.9 | 1.2 | 6 | ||||||||||||||||||
| 420 Lexington Ave (Graybar) | 100.0 | Grand Central North | Leasehold Interest | 1 | 1,188,000 | 5.4 | 90.4 | 92.0 | 91.2 | 93.0 | 93.1 | 83,200 | 11.9 | 7.5 | 192 | ||||||||||||||||||
| 461 Fifth Avenue | 100.0 | Midtown | Leasehold Interest (1) | 1 | 200,000 | 0.9 | 87.3 | 87.3 | 90.6 | 82.2 | 79.0 | 16,750 | 2.4 | 1.5 | 12 | ||||||||||||||||||
| 485 Lexington Avenue | 100.0 | Grand Central North | Fee Interest | 1 | 921,000 | 4.2 | 90.4 | 90.4 | 84.2 | 84.2 | 84.2 | 58,624 | 8.4 | 5.3 | 30 | ||||||||||||||||||
| 555 West 57th Street | 100.0 | Midtown West | Fee Interest | 1 | 941,000 | 4.3 | 99.9 | 99.9 | 99.9 | 99.9 | 99.9 | 47,074 | 6.7 | 4.2 | 8 | ||||||||||||||||||
| 635 Sixth Avenue | 100.0 | Midtown South | Fee Interest | 1 | 104,000 | 0.5 | 100.0 | 100.0 | 100.0 | 100.0 | 100.0 | 10,500 | 1.5 | 0.9 | 2 | ||||||||||||||||||
| 641 Sixth Avenue | 100.0 | Midtown South | Fee Interest | 1 | 163,000 | 0.7 | 100.0 | 100.0 | 100.0 | 100.0 | 100.0 | 15,535 | 2.2 | 1.4 | 6 | ||||||||||||||||||
| 711 Third Avenue | 100.0 (2) | Grand Central North | Leasehold Interest (2) | 1 | 524,000 | 2.4 | 91.3 | 97.0 | 97.0 | 97.0 | 97.0 | 34,810 | 5.0 | 3.1 | 22 | ||||||||||||||||||
| 750 Third Avenue | 100.0 | Grand Central North | Fee Interest | 1 | 780,000 | 3.6 | 91.2 | 91.2 | 92.7 | 92.7 | 93.3 | 46,067 | 6.6 | 4.1 | 27 | ||||||||||||||||||
| 810 Seventh Avenue | 100.0 | Times Square | Fee Interest | 1 | 692,000 | 3.2 | 94.1 | 93.0 | 94.1 | 93.8 | 97.6 | 48,499 | 6.9 | 4.3 | 48 | ||||||||||||||||||
| 1185 Avenue of the Americas | 100.0 | Rockefeller Center | Leasehold Interest | 1 | 1,062,000 | 4.9 | 92.7 | 92.7 | 92.7 | 92.7 | 85.6 | 95,277 | 13.6 | 8.5 | 14 | ||||||||||||||||||
| 1350 Avenue of the Americas | 100.0 | Rockefeller Center | Fee Interest | 1 | 562,000 | 2.6 | 87.6 | 91.7 | 91.0 | 91.2 | 89.5 | 40,607 | 5.8 | 3.6 | 43 | ||||||||||||||||||
| Subtotal / Weighted Average | 18 | 10,647,191 | 48.7 | % | 93.5 | % | 94.4 | % | 94.0 | % | 93.4 | % | 92.8 | % | $705,736 | 100.0% | 63.1% | 630 | |||||||||||||||
| Total / Weighted Average Consolidated Properties | 18 | 10,647,191 | 48.7 | % | 93.5 | % | 94.4 | % | 94.0 | % | 93.4 | % | 92.8 | % | $705,736 | 100.0% | 63.1% | 630 | |||||||||||||||
| UNCONSOLIDATED PROPERTIES | |||||||||||||||||||||||||||||||||
| "Same Store" | |||||||||||||||||||||||||||||||||
| 10 East 53rd Street | 55.0 | Plaza District | Fee Interest | 1 | 354,300 | 1.6 | 95.1 | 97.1 | 94.3 | 95.4 | 95.4 | $32,611 | 1.6 | 38 | |||||||||||||||||||
| 11 Madison Avenue | 60.0 | Park Avenue South | Fee Interest | 1 | 2,314,000 | 10.6 | 95.8 | 95.8 | 95.7 | 95.7 | 100.0 | 154,335 | 8.3 | 9 | |||||||||||||||||||
| 55 West 46th Street - Tower 46 | 25.0 | Midtown | Fee Interest | 1 | 347,000 | 1.6 | 91.9 | 90.3 | 86.5 | 86.5 | 73.5 | 26,730 | 0.6 | 15 | |||||||||||||||||||
| 100 Park Avenue | 50.0 | Grand Central South | Fee Interest | 1 | 834,000 | 3.8 | 84.8 | 84.9 | 81.3 | 78.6 | 79.0 | 59,879 | 2.7 | 35 | |||||||||||||||||||
| 280 Park Avenue | 50.0 | Park Avenue | Fee Interest | 1 | 1,219,158 | 5.6 | 89.5 | 89.5 | 88.0 | 91.1 | 89.5 | 120,422 | 5.4 | 36 | |||||||||||||||||||
| 800 Third Avenue | 60.5 | Grand Central North | Fee Interest | 1 | 526,000 | 2.4 | 92.4 | 96.2 | 96.5 | 91.9 | 93.1 | 37,572 | 2.0 | 42 | |||||||||||||||||||
| 919 Third Avenue | 51.0 | Grand Central North | Fee Interest | 1 | 1,454,000 | 6.7 | 100.0 | 100.0 | 100.0 | 100.0 | 100.0 | 101,285 | 4.6 | 9 | |||||||||||||||||||
| 1515 Broadway | 57.0 | Times Square | Fee Interest | 1 | 1,750,000 | 8.0 | 94.9 | 94.9 | 94.9 | 94.9 | 98.5 | 133,341 | 6.8 | 12 | |||||||||||||||||||
| Worldwide Plaza | 24.4 | Westside | Fee Interest | 1 | 2,048,725 | 9.4 | 94.7 | 94.7 | 96.8 | 96.8 | 96.9 | 141,104 | 3.1 | 24 | |||||||||||||||||||
| Added to Same Store in 2020 | |||||||||||||||||||||||||||||||||
| 2 Herald Square | 51.0 | Herald Square | Leasehold Interest | 1 | 369,000 | 1.7 | 88.2 | 81.9 | 81.9 | 73.6 | 73.6 | 38,463 | 1.8 | 5 | |||||||||||||||||||
| Subtotal / Weighted Average | 10 | 11,216,183 | 51.3 | % | 93.9 | % | 93.9 | % | 93.7 | % | 93.4 | % | 94.3 | % | $845,742 | 36.9% | 225 | ||||||||||||||||
| Total / Weighted Average Unconsolidated Properties | 10 | 11,216,183 | 51.3 | % | 93.9 | % | 93.9 | % | 93.7 | % | 93.4 | % | 94.3 | % | $845,742 | 36.9% | 225 | ||||||||||||||||
| Manhattan Operating Properties Grand Total / Weighted Average | 28 | 21,863,374 | 100.0 | % | 93.7 | % | 94.1 | % | 93.8 | % | 93.4 | % | 93.6 | % | $1,551,478 | 855 | |||||||||||||||||
| Manhattan Operating Properties Grand Total - SLG share of Annualized Rent | $1,115,381 | 100.0% | |||||||||||||||||||||||||||||||
| Manhattan Operating Properties Same Store Occupancy % | 21,863,374 | 100.0 | % | 93.7 | % | 94.1 | % | 93.8 | % | 93.4 | % | 93.6 | % | ||||||||||||||||||||
| Manhattan Operating Properties Same Store Leased Occupancy % | 95.5 | % | 96.0 | % | 95.0 | % | 94.8 | % | 95.4 | % | |||||||||||||||||||||||
| (1) The Company has an option to acquire the fee interest for a fixed price on a specific date. | |||||||||||||||||||||||||||||||||
| (2) The Company owns 50% of the fee interest. | |||||||||||||||||||||||||||||||||
| Supplemental Information | 27 | First Quarter 2020 |
| ||
SELECTED PROPERTY DATA Retail, Residential and Suburban Operating Properties Unaudited (Dollars in Thousands) | | |
| ||
| Ownership | # of | Usable | % of Total | Occupancy (%) | Annualized Contractual Cash Rent ($'s) | Annualized Contractual Cash Rent (SLG%) | Total Tenants | ||||||||||||||||||||||||||
| Properties | Interest (%) | SubMarket | Ownership | Bldgs | Sq. Feet | Sq. Feet | Mar-20 | Dec-19 | Sep-19 | Jun-19 | Mar-19 | ||||||||||||||||||||||
| "Same Store" Retail | |||||||||||||||||||||||||||||||||
| 11 West 34th Street | 30.0 | Herald Square/Penn Station | Fee Interest | 1 | 17,150 | 4.5 | 100.0 | 100.0 | 100.0 | 100.0 | 100.0 | $3,013 | 1.4 | 1 | |||||||||||||||||||
| 21 East 66th Street | 32.3 | Plaza District | Fee Interest | 1 | 13,069 | 3.4 | 100.0 | 100.0 | 100.0 | 100.0 | 100.0 | 3,831 | 1.9 | 1 | |||||||||||||||||||
| 121 Greene Street | 50.0 | Soho | Fee Interest | 1 | 7,131 | 1.9 | 100.0 | 100.0 | 100.0 | 100.0 | 100.0 | 1,718 | 1.3 | 2 | |||||||||||||||||||
| 650 Fifth Avenue | 50.0 | Plaza District | Leasehold Interest | 1 | 69,214 | 18.0 | 100.0 | 100.0 | 100.0 | 100.0 | 100.0 | 35,241 | 26.7 | 1 | |||||||||||||||||||
| 717 Fifth Avenue | 10.9 | Midtown/Plaza District | Fee Interest | 1 | 119,550 | 31.0 | 100.0 | 100.0 | 100.0 | 100.0 | 100.0 | 53,873 | 8.9 | 6 | |||||||||||||||||||
| 719 Seventh Avenue | 75.0 | Times Square | Fee Interest | 1 | 10,040 | 2.6 | 100.0 | 100.0 | 100.0 | 100.0 | 100.0 | 4,128 | 4.7 | 1 | |||||||||||||||||||
| 760 Madison Avenue | 100.0 | Plaza District | Fee Interest | 1 | 21,124 | 5.5 | 100.0 | 100.0 | 100.0 | 100.0 | 100.0 | 16,318 | 24.7 | 1 | |||||||||||||||||||
| Williamsburg Terrace | 100.0 | Brooklyn, New York | Fee Interest | 1 | 52,000 | 13.5 | 100.0 | 100.0 | 100.0 | 100.0 | 100.0 | 1,736 | 2.6 | 3 | |||||||||||||||||||
| 1552-1560 Broadway | 50.0 | Times Square | Fee Interest | 2 | 57,718 | 15.0 | 88.3 | 88.3 | 88.3 | 88.3 | 88.3 | 29,521 | 22.4 | 3 | |||||||||||||||||||
| Subtotal/Weighted Average | 10 | 366,996 | 95.3 | % | 98.2 | % | 98.2 | % | 98.2 | % | 98.2 | % | 98.2 | % | $149,379 | 94.6 | % | 19 | |||||||||||||||
| "Non Same Store" Retail | |||||||||||||||||||||||||||||||||
| 115 Spring Street | 51.0 | Soho | Fee Interest | 1 | 5,218 | 1.4 | 100.0 | 100.0 | 100.0 | 100.0 | 100.0 | $3,610 | 2.8 | 1 | |||||||||||||||||||
| 133 Greene Street | 100.0 | Soho | Fee Interest | 1 | 6,425 | 1.7 | 100.0 | 100.0 | 100.0 | 100.0 | 100.0 | 690 | 1.0 | 2 | |||||||||||||||||||
| 712 Madison Avenue | 100.0 | Plaza District | Fee Interest | 1 | 6,600 | 1.7 | 100.0 | 100.0 | 100.0 | 100.0 | 100.0 | 1,000 | 1.5 | 1 | |||||||||||||||||||
| Subtotal/Weighted Average | 3 | 18,243 | 4.7 | % | 100.0 | % | 100.0 | % | 100.0 | % | 100.0 | % | 100.0 | % | $5,300 | 5.4 | % | 4 | |||||||||||||||
| Total / Weighted Average Retail Properties | 13 | 385,239 | 100.0 | % | 98.2 | % | 98.2 | % | 98.2 | % | 98.2 | % | 98.2 | % | $154,679 | 100.0 | % | 23 | |||||||||||||||
| Residential Properties | |||||||||||||||||||||||||||||||||
| Ownership | # of | Usable | Total | Occupancy (%) | Average Monthly Rent Per Unit ($'s) (1) | Annualized Contractual Cash Rent ($'s) | Annualized Contractual Cash Rent (SLG %) | ||||||||||||||||||||||||||
| Properties | Interest (%) | SubMarket | Ownership | Bldgs | Sq. Feet | Units | Mar-20 | Dec-19 | Sep-19 | Jun-19 | Mar-19 | ||||||||||||||||||||||
| "Same Store" Residential | |||||||||||||||||||||||||||||||||
| 400 East 57th Street | 41.0 | Upper East Side | Fee Interest | 1 | 290,482 | 263 | 97.3 | 95.1 | 92.4 | 95.8 | 95.4 | $3,850 | $13,372 | 20.1 | |||||||||||||||||||
| 400 East 58th Street | 90.0 | Upper East Side | Fee Interest | 1 | 140,000 | 126 | 96.0 | 96.0 | 93.7 | 93.7 | 96.8 | 3,726 | 5,961 | 19.7 | |||||||||||||||||||
| 1080 Amsterdam | 92.5 | Upper West Side | Leasehold Interest | 1 | 82,250 | 97 | 97.9 | 100.0 | 100.0 | 92.7 | 90.6 | 4,216 | 5,091 | 17.3 | |||||||||||||||||||
| Stonehenge Portfolio | Various | Fee Interest | 6 | 445,934 | 538 | 97.0 | 94.8 | 95.9 | 96.1 | 94.8 | 3,940 | 27,719 | 2.6 | ||||||||||||||||||||
| 605 West 42nd Street - Sky | 20.0 | Westside | Fee Interest | 1 | 927,358 | 1,175 | 96.4 | 95.9 | 94.3 | 93.5 | 90.9 | 3,596 | 54,829 | 40.3 | |||||||||||||||||||
| Subtotal/Weighted Average | 10 | 1,886,024 | 2,199 | 96.7 | % | 95.7 | % | 94.7 | % | 94.4 | % | 92.7 | % | $3,746 | $106,972 | 100.0 | % | ||||||||||||||||
| Total / Weighted Average Residential Properties | 10 | 1,886,024 | 2,199 | 96.7 | % | 95.7 | % | 94.7 | % | 94.4 | % | 92.7 | % | $3,746 | $106,972 | ||||||||||||||||||
| Suburban Properties | |||||||||||||||||||||||||||||||||
| Ownership | # of | Usable | % of Total | Occupancy (%) | Annualized Contractual Cash Rent ($'s) | Annualized Contractual Cash Rent (SLG %) | Total Tenants | ||||||||||||||||||||||||||
| Properties | Interest (%) | SubMarket | Ownership | Bldgs | Sq. Feet | Sq. Feet | Mar-20 | Dec-19 | Sep-19 | Jun-19 | Mar-19 | ||||||||||||||||||||||
| "Same Store" | |||||||||||||||||||||||||||||||||
| Landmark Square | 100.0 | Stamford, Connecticut | Fee Interest | 7 | 862,800 | 82.6 | 84.9 | 85.1 | 85.0 | 85.2 | 85.7 | $21,854 | 77.9 | 114 | |||||||||||||||||||
| 1055 Washington Boulevard | 100.0 | Stamford, Connecticut | Leasehold Interest | 1 | 182,000 | 17.4 | 88.5 | 88.5 | 88.5 | 88.5 | 85.5 | 6,197 | 22.1 | 25 | |||||||||||||||||||
| Subtotal/Weighted Average | 8 | 1,044,800 | 100.0 | % | 85.5 | % | 85.7 | % | 85.6 | % | 85.8 | % | 85.7 | % | $28,051 | 100.0 | % | 139 | |||||||||||||||
| Total / Weighted Average Suburban Properties | 8 | 1,044,800 | 100.0 | % | 85.5 | % | 85.7 | % | 85.6 | % | 85.8 | % | 85.7 | % | $28,051 | 100.0 | % | 139 | |||||||||||||||
| (1) Calculated based on occupied units. Amounts in dollars. | |||||||||||||||||||||||||||||||||
| Supplemental Information | 28 | First Quarter 2020 |
| ||
SELECTED PROPERTY DATA Development / Redevelopment and Construction in Progress Unaudited (Dollars in Thousands) | | |
| ||
| Ownership | # of | Usable | % of Total | Occupancy (%) | Annualized Contractual Cash Rent ($'s) | Annualized Contractual Cash Rent (SLG%) | Gross R/E Book Value | Total Tenants | ||||||||||||||||||||||||||||
| Properties | Interest (%) | SubMarket | Ownership | Bldgs | Sq. Feet | Sq. Feet | Mar-20 | Dec-19 | Sep-19 | Jun-19 | Mar-19 | |||||||||||||||||||||||||
| Development / Redevelopment | ||||||||||||||||||||||||||||||||||||
| 1 Madison Avenue | 100.0 | Park Avenue South | Fee Interest | 1 | 1,176,900 | 53.5 | 9.3 | 100.0 | 100.0 | 100.0 | 100.0 | $9,383 | 13.8 | $884,794 | 3 | |||||||||||||||||||||
| 19-21 East 65th Street | 100.0 | Plaza District | Fee Interest | 2 | 23,610 | 1.1 | 3.6 | 3.6 | 3.6 | 3.6 | 3.6 | 31 | — | 13,280 | 1 | |||||||||||||||||||||
| 106 Spring Street | 100.0 | Soho | Fee Interest | 1 | 5,928 | 0.3 | — | — | — | — | N/A | — | — | 80,601 | — | |||||||||||||||||||||
| 126 Nassau Street | 100.0 | Lower Manhattan | Leasehold Interest | 1 | 98,412 | 4.5 | 87.3 | N/A | N/A | N/A | N/A | 3,162 | 4.7 | 3,704 | 38 | |||||||||||||||||||||
| 609 Fifth Avenue | 100.0 | Rockefeller Center | Fee Interest | 1 | 160,000 | 7.3 | 100.0 | 100.0 | 100.0 | 96.0 | 96.0 | 21,119 | 31.2 | 280,173 | 3 | |||||||||||||||||||||
| 625 Madison Avenue | 100.0 | Plaza District | Leasehold Interest | 1 | 563,000 | 25.7 | 33.5 | 98.1 | 97.1 | 97.1 | 98.0 | 28,376 | 41.9 | 269,018 | 25 | |||||||||||||||||||||
| 707 Eleventh Avenue | 100.0 | Midtown West | Fee Interest | 1 | 159,720 | 7.3 | 54.3 | N/A | N/A | N/A | N/A | 5,015 | 7.4 | 93,383 | 1 | |||||||||||||||||||||
| 762 Madison Avenue | 100.0 | Plaza District | Fee Interest | 1 | 6,109 | 0.3 | 55.1 | 55.1 | 100.0 | 100.0 | 100.0 | 665 | 1.0 | 16,689 | 3 | |||||||||||||||||||||
| Total / Weighted Average Development / Redevelopment Properties | 9 | 2,193,679 | 100.0 | % | 28.9 | % | 97.8 | % | 97.7 | % | 97.3 | % | 97.9 | % | $67,751 | 100.0 | % | $1,641,642 | 74 | |||||||||||||||||
| Construction in Progress | |||||||||||||||||||
| Future Equity | |||||||||||||||||||
| Equity Contributed | Contributions | Financing | Total | ||||||||||||||||
| Building | Usable | Ownership | Estimated | Percentage | Development | ||||||||||||||
| Address | Sq. Feet | �� | Interest (%) | TCO (1) | Leased | Company | Partners | Company | Partners | Drawn | Available | Budget | |||||||
| One Vanderbilt | 1,657,198 | 71.0 | Q3 2020 | 65.0 | $1,108,153 | (2) | $452,513 | — | — | $838,936 | $911,064 | $3,310,666 | |||||||
| 185 Broadway | 198,488 | 100.0 | Q2 2021 | — | 53,954 | — | 30,721 | — | 130,791 | 94,209 | 309,675 | ||||||||
| 410 Tenth Avenue | 636,044 | 70.9 | Q2 2021 | 98.6 | 68,057 | 28,035 | 64,837 | 26,565 | 350,578 | 114,422 | 652,494 | ||||||||
| Total Construction In Progress | $1,230,164 | $480,548 | $95,558 | $26,565 | $1,320,305 | $1,119,695 | $4,272,835 | ||||||||||||
| (1) Temporary Certificate of Occupancy | |||||||||||||||||||
| (2) Reflects land contributed to the project at a value of $567,436, inclusive of a market value adjustment of $235,946 | |||||||||||||||||||
| Supplemental Information | 29 | First Quarter 2020 |
| ||
SELECTED PROPERTY DATA Retail Within Operating and Development / Redevelopment Properties Unaudited (Dollars in Thousands) | | |
| ||
| Ownership | # of | Usable | % of Total | Occupancy (%) | Annualized Contractual Retail Cash Rent ($'s) | Annualized Contractual Retail Cash Rent | Total Tenants | ||||||||||||||||||||||||||||
| Properties | Interest (%) | SubMarket | Ownership | Bldgs | Sq. Feet | Sq. Feet | Mar-20 | Dec-19 | Sep-19 | Jun-19 | Mar-19 | 100% | SLG | ||||||||||||||||||||||
| HIGH STREET RETAIL - Consolidated Properties | |||||||||||||||||||||||||||||||||||
106 Spring Street (1) | 100.0 | Soho | Fee Interest | 1 | 5,928 | 0.4 | — | — | — | — | N/A | $— | — | — | — | ||||||||||||||||||||
| 133 Greene Street | 100.0 | Soho | Fee Interest | 1 | 6,425 | 0.4 | 100.0 | 100.0 | 100.0 | 100.0 | 100.0 | 690 | 0.2 | 0.3 | 2 | ||||||||||||||||||||
| 712 Madison Avenue | 100.0 | Plaza District | Fee Interest | 1 | 6,600 | 0.4 | 100.0 | 100.0 | 100.0 | 100.0 | 100.0 | 1,000 | 0.3 | 0.5 | 1 | ||||||||||||||||||||
| 719 Seventh Avenue | 75.0 | Times Square | Fee Interest | 1 | 10,040 | 0.6 | 100.0 | 100.0 | 100.0 | 100.0 | 100.0 | 4,128 | 1.3 | 1.6 | 1 | ||||||||||||||||||||
| 760 Madison Avenue | 100.0 | Plaza District | Fee Interest | 1 | 21,124 | 1.4 | 100.0 | 100.0 | 100.0 | 100.0 | 100.0 | 16,318 | 5.0 | 8.2 | 1 | ||||||||||||||||||||
762 Madison Avenue(1) | 100.0 | Plaza District | Fee Interest | 1 | 6,109 | 0.4 | 55.1 | 55.1 | 100.0 | 100.0 | 100.0 | 665 | 0.2 | 0.3 | 3 | ||||||||||||||||||||
| Williamsburg Terrace | 100.0 | Brooklyn, New York | Fee Interest | 1 | 52,000 | 3.4 | 100.0 | 100.0 | 100.0 | 100.0 | 100.0 | 1,736 | 0.5 | 0.9 | 3 | ||||||||||||||||||||
| Subtotal / Weighted Average | 7 | 108,226 | 7.0 | % | 92.0 | % | 92.0 | % | 94.5 | % | 94.5 | % | 94.5 | % | $24,537 | 7.5 | % | 11.8 | % | 11 | |||||||||||||||
| HIGH STREET RETAIL - Unconsolidated Properties | |||||||||||||||||||||||||||||||||||
| 11 West 34th Street | 30.0 | Herald Square/Penn Station | Fee Interest | 1 | 17,150 | 1.1 | 100.0 | 100.0 | 100.0 | 100.0 | 100.0 | $3,013 | 0.9 | 0.5 | 1 | ||||||||||||||||||||
| 21 East 66th Street | 32.3 | Plaza District | Fee Interest | 1 | 13,069 | 0.8 | 100.0 | 100.0 | 100.0 | 100.0 | 100.0 | 3,831 | 1.2 | 0.6 | 1 | ||||||||||||||||||||
| 115 Spring Street | 51.0 | Soho | Fee Interest | 1 | 5,218 | 0.3 | 100.0 | 100.0 | 100.0 | 100.0 | 100.0 | 3,610 | 1.1 | 0.9 | 1 | ||||||||||||||||||||
| 121 Greene Street | 50.0 | Soho | Fee Interest | 1 | 7,131 | 0.5 | 100.0 | 100.0 | 100.0 | 100.0 | 100.0 | 1,718 | 0.5 | 0.4 | 2 | ||||||||||||||||||||
| 650 Fifth Avenue | 50.0 | Plaza District | Leasehold Interest | 1 | 69,214 | 4.5 | 100.0 | 100.0 | 100.0 | 100.0 | 100.0 | 35,241 | 10.8 | 8.9 | 1 | ||||||||||||||||||||
| 717 Fifth Avenue | 10.9 | Midtown/Plaza District | Fee Interest | 1 | 119,550 | 7.7 | 100.0 | 100.0 | 100.0 | 100.0 | 100.0 | 53,873 | 16.6 | 3.0 | 6 | ||||||||||||||||||||
| 1552-1560 Broadway | 50.0 | Times Square | Fee Interest | 2 | 57,718 | 3.7 | 88.3 | 88.3 | 88.3 | 88.3 | 88.3 | 29,521 | 9.1 | 7.4 | 3 | ||||||||||||||||||||
| Subtotal / Weighted Average | 8 | 289,050 | 18.6 | % | 97.7 | % | 97.7 | % | 97.7 | % | 97.7 | % | 97.7 | % | $130,807 | 40.2 | % | 21.7 | % | 15 | |||||||||||||||
| Total / Weighted Average Prime Retail | 15 | 397,276 | 25.7 | % | 96.1 | % | 96.1 | % | 96.8 | % | 96.8 | % | 98.3 | % | $155,344 | 47.8 | % | 33.5 | % | 26 | |||||||||||||||
| OTHER RETAIL - Consolidated Properties | |||||||||||||||||||||||||||||||||||
| 30 East 40th Street | 60.0 | Grand Central South | Leasehold Interest | 1 | 4,461 | 0.3 | 100.0 | 100.0 | 81.1 | 81.1 | 81.1 | $522 | 0.2 | 0.2 | 4 | ||||||||||||||||||||
| 100 Church Street | 100.0 | Downtown | Fee Interest | 1 | 61,708 | 4.0 | 100.0 | 100.0 | 100.0 | 100.0 | 100.0 | 3,599 | 1.1 | 1.8 | 9 | ||||||||||||||||||||
| 110 Greene Street | 100.0 | Soho | Fee Interest | 1 | 16,121 | 1.0 | 86.8 | 86.8 | 86.8 | 86.8 | 86.8 | 2,722 | 0.8 | 1.4 | 4 | ||||||||||||||||||||
| 125 Park Avenue | 100.0 | Grand Central | Fee Interest | 1 | 32,124 | 2.1 | 100.0 | 100.0 | 100.0 | 100.0 | 79.9 | 4,970 | 1.5 | 2.5 | 7 | ||||||||||||||||||||
| 220 East 42nd Street | 100.0 | Grand Central | Fee Interest | 1 | 35,332 | 2.3 | 85.6 | 85.6 | 85.6 | 85.6 | 85.6 | 2,967 | 0.9 | 1.5 | 5 | ||||||||||||||||||||
| 304 Park Avenue South | 100.0 | Midtown South | Fee Interest | 1 | 25,330 | 1.6 | 100.0 | 66.3 | 66.9 | 100.0 | 100.0 | 3,487 | 1.1 | 1.8 | 5 | ||||||||||||||||||||
| 400 East 58th Street | 90.0 | Upper East Side | Fee Interest | 1 | 3,156 | 0.2 | 100.0 | 100.0 | 100.0 | 100.0 | 100.0 | 595 | 0.2 | 0.3 | 5 | ||||||||||||||||||||
410 Tenth Avenue (1) | 70.9 | Hudson Yards | Fee Interest | 1 | 20,850 | 1.3 | 20.9 | 54.4 | 71.2 | 100.0 | N/A | 168 | 0.1 | 0.1 | 3 | ||||||||||||||||||||
| 420 Lexington Ave (Graybar) | 100.0 | Grand Central North | Leasehold Interest | 1 | 45,263 | 2.9 | 90.3 | 90.3 | 90.3 | 90.3 | 100.0 | 4,947 | 1.5 | 2.5 | 5 | ||||||||||||||||||||
| 461 Fifth Avenue | 100.0 | Midtown | Leasehold Interest | 1 | 16,248 | 1.1 | 100.0 | 100.0 | 100.0 | 100.0 | 100.0 | 2,446 | 0.8 | 1.2 | 2 | ||||||||||||||||||||
| 485 Lexington Avenue | 100.0 | Grand Central North | Fee Interest | 1 | 41,701 | 2.7 | 100.0 | 100.0 | 100.0 | 100.0 | 100.0 | 5,978 | 1.8 | 3.0 | 8 | ||||||||||||||||||||
| 555 West 57th Street | 100.0 | Midtown West | Fee Interest | 1 | 60,389 | 3.9 | 100.0 | 100.0 | 100.0 | 100.0 | 100.0 | 2,158 | 0.7 | 1.1 | 2 | ||||||||||||||||||||
609 Fifth Avenue (1) | 100.0 | Rockefeller Center | Fee Interest | 1 | 26,811 | 1.7 | 100.0 | 100.0 | 100.0 | 100.0 | 89.2 | 9,895 | 3.0 | 5.0 | 2 | ||||||||||||||||||||
625 Madison Avenue (1) | 100.0 | Plaza District | Leasehold Interest | 1 | 74,937 | 4.8 | 100.0 | 100.0 | 91.3 | 91.3 | 100.0 | 19,455 | 6.0 | 9.8 | 19 | ||||||||||||||||||||
| 635 Sixth Avenue | 100.0 | Midtown South | Fee Interest | 1 | 23,250 | 1.5 | 100.0 | 100.0 | 100.0 | 100.0 | 100.0 | 3,496 | 1.1 | 1.8 | 1 | ||||||||||||||||||||
| 641 Sixth Avenue | 100.0 | Midtown South | Fee Interest | 1 | 28,500 | 1.8 | 100.0 | 100.0 | 100.0 | 100.0 | 100.0 | 3,838 | 1.2 | 1.9 | 2 | ||||||||||||||||||||
| 711 Third Avenue | 100.0 | Grand Central North | Leasehold Interest | 1 | 25,639 | 1.7 | 100.0 | 100.0 | 100.0 | 100.0 | 100.0 | 3,180 | 1.0 | 1.6 | 3 | ||||||||||||||||||||
| 750 Third Avenue | 100.0 | Grand Central North | Fee Interest | 1 | 24,827 | 1.6 | 72.3 | 72.3 | 72.3 | 72.3 | 72.3 | 2,682 | 0.8 | 1.4 | 6 | ||||||||||||||||||||
| 810 Seventh Avenue | 100.0 | Times Square | Fee Interest | 1 | 18,207 | 1.2 | 100.0 | 100.0 | 100.0 | 100.0 | 100.0 | 4,352 | 1.3 | 2.2 | 4 | ||||||||||||||||||||
| 1080 Amsterdam | 92.5 | Upper West Side | Leasehold Interest | 1 | 1,800 | 0.1 | 100.0 | 100.0 | 100.0 | 100.0 | 100.0 | 301 | 0.1 | 0.1 | 1 | ||||||||||||||||||||
| 1185 Avenue of the Americas | 100.0 | Rockefeller Center | Leasehold Interest | 1 | 37,326 | 2.4 | 100.0 | 100.0 | 100.0 | 100.0 | 100.0 | 6,910 | 2.1 | 3.5 | 5 | ||||||||||||||||||||
| 1350 Avenue of the Americas | 100.0 | Rockefeller Center | Fee Interest | 1 | 17,797 | 1.2 | 62.6 | 62.6 | 62.6 | 100.0 | 100.0 | 2,327 | 0.7 | 1.2 | 5 | ||||||||||||||||||||
| Subtotal / Weighted Average | 22 | 641,777 | 41.5 | % | 93.5 | % | 93.3 | % | 92.7 | % | 96.0 | % | 96.1 | % | $90,995 | 28.0 | % | 45.7 | % | 107 | |||||||||||||||
| (1) Development / Redevelopment properties. | |||||||||||||||||||||||||||||||||||
| Supplemental Information | 30 | First Quarter 2020 |
| ||
SELECTED PROPERTY DATA - CONTINUED Retail Within Operating and Development / Redevelopment Properties Unaudited (Dollars in Thousands) | | |
| ||
| Ownership | # of | Usable | % of Total | Occupancy (%) | Annualized Contractual Retail Cash Rent ($'s) | Annualized Contractual Retail Cash Rent | Total Tenants | ||||||||||||||||||||||||||||
| Properties | Interest (%) | SubMarket | Ownership | Bldgs | Sq. Feet | Sq. Feet | Mar-20 | Dec-19 | Sep-19 | Jun-19 | Mar-19 | 100% | SLG | ||||||||||||||||||||||
| OTHER RETAIL - Unconsolidated Properties | |||||||||||||||||||||||||||||||||||
| 2 Herald Square | 51.0 | Herald Square | Leasehold Interest | 1 | 94,531 | 6.1 | 83.2 | 60.6 | 60.6 | 60.6 | 60.6 | $20,994 | 6.5 | 5.4 | 3 | ||||||||||||||||||||
| 10 East 53rd Street | 55.0 | Plaza District | Fee Interest | 1 | 39,340 | 2.5 | 100.0 | 100.0 | 100.0 | 100.0 | 100.0 | 3,604 | 1.1 | 1.0 | 3 | ||||||||||||||||||||
| 11 Madison Avenue | 60.0 | Park Avenue South | Fee Interest | 1 | 38,800 | 2.5 | 97.6 | 100.0 | 100.0 | 98.7 | 98.7 | 3,822 | 1.2 | 1.2 | 5 | ||||||||||||||||||||
| 55 West 46th Street | 25.0 | Midtown | Leasehold Interest | 1 | 1,191 | 0.1 | 100.0 | 100.0 | 100.0 | 100.0 | 100.0 | 210 | 0.1 | — | 1 | ||||||||||||||||||||
| 100 Park Avenue | 50.0 | Grand Central South | Fee Interest | 1 | 40,022 | 2.6 | 100.0 | 100.0 | 100.0 | 100.0 | 100.0 | 3,906 | 1.2 | 1.0 | 9 | ||||||||||||||||||||
| 280 Park Avenue | 50.0 | Park Avenue | Fee Interest | 1 | 27,896 | 1.8 | 100.0 | 100.0 | 13.1 | 100.0 | 100.0 | 2,191 | 0.7 | 0.6 | 3 | ||||||||||||||||||||
| 400 East 57th Street | 41.0 | Upper East Side | Fee Interest | 1 | 9,717 | 0.6 | 66.6 | 66.6 | 66.6 | 66.6 | 75.4 | 1,592 | 0.5 | 0.3 | 8 | ||||||||||||||||||||
| 800 Third Avenue | 60.5 | Grand Central North | Fee Interest | 1 | 9,900 | 0.6 | 100.0 | 100.0 | 100.0 | 100.0 | 100.0 | 1,911 | 0.6 | 0.6 | 2 | ||||||||||||||||||||
| 919 Third Avenue | 51.0 | Grand Central North | Fee Interest | 1 | 31,004 | 2.0 | 100.0 | 100.0 | 100.0 | 100.0 | 100.0 | 3,635 | 1.1 | 0.9 | 5 | ||||||||||||||||||||
| 1515 Broadway | 57.0 | Times Square | Fee Interest | 1 | 185,956 | 12.0 | 100.0 | 100.0 | 100.0 | 100.0 | 100.0 | 33,612 | 10.3 | 9.6 | 9 | ||||||||||||||||||||
| World Wide Plaza | 24.35 | Westside | Fee Interest | 1 | 10,592 | (2) | 0.7 | 100.0 | 100.0 | 100.0 | 100.0 | 97.2 | 1,461 | 0.4 | 0.2 | 8 | |||||||||||||||||||
| Stonehenge Portfolio | Various | Fee Interest | 2 | 19,231 | 1.2 | 76.8 | 76.8 | 87.0 | 87.0 | 88.9 | 2,010 | 0.6 | 0.0 | 7 | |||||||||||||||||||||
| Subtotal / Weighted Average | 13 | 508,180 | 32.8 | % | 95.2 | % | 91.2 | % | 86.8 | % | 91.4 | % | 91.6 | % | $78,949 | 24.3 | % | 20.8 | % | 63 | |||||||||||||||
| Total / Weighted Average Other Retail | 35 | 1,149,957 | 74.3 | % | 94.2 | % | 92.3 | % | 90.1 | % | 94.0 | % | 94.1 | % | $169,944 | 52.2 | % | 66.5 | % | 170 | |||||||||||||||
| Retail Grand Total / Weighted Average | 50 | 1,547,233 | 100.0 | % | 94.7 | % | 93.3 | % | 91.8 | % | 94.7 | % | 95.2 | % | $325,288 | 100.0 | % | 196 | |||||||||||||||||
| Retail Grand Total - SLG share of Annualized Rent | $198,585 | 100.0 | % | ||||||||||||||||||||||||||||||||
| (1) Development / Redevelopment properties. | |||||||||||||||||||||||||||||||||||
| (2) Excludes the theater, parking garage, fitness gym and other amenity space totaling 241,371 square feet. | |||||||||||||||||||||||||||||||||||
| Supplemental Information | 31 | First Quarter 2020 |
| ||
LARGEST TENANTS BY SLG SHARE OF ANNUALIZED CASH RENT Manhattan, Suburban, Retail, Residential and Development / Redevelopment Properties Unaudited (Dollars in Thousands Except Per SF) | | |
| ||
| Ownership Interest % | Lease Expiration | Total Rentable Square Feet | Annualized Contractual Cash Rent ($) | SLG Share of Annualized Contractual Cash Rent ($) | % of SLG Share of Annualized Contractual Cash Rent (2) | Annualized Contractual Rent PSF | Credit Rating (1) | |||||||||
| Tenant Name | Property | |||||||||||||||
| Viacom CBS, Inc. | 1515 Broadway | 57.0 | Jun 2031 | 1,470,289 | $94,158 | $53,670 | 4.1% | $64.04 | ||||||||
| 1515 Broadway | 57.0 | Mar 2028 | 9,106 | 1,976 | 1,126 | 0.1% | $216.98 | |||||||||
| 555 West 57th Street | 100.0 | Dec 2023 | 338,527 | 16,750 | 16,750 | 1.3% | $49.48 | |||||||||
| Worldwide Plaza | 24.35 | Jan 2027 | 32,598 | 2,226 | 542 | —% | $68.28 | |||||||||
| 1,850,520 | $115,110 | $72,088 | 5.5% | $62.20 | BBB | |||||||||||
| Credit Suisse Securities (USA), Inc. | 11 Madison Avenue | 60.0 | May 2037 | 1,265,841 | $79,826 | $47,895 | 3.7% | $63.06 | ||||||||
| 1055 Washington Blvd | 100.0 | Jan 2022 | 2,525 | 100 | 100 | —% | 39.60 | |||||||||
| 1,268,366 | $79,926 | $47,995 | 3.7% | $63.01 | A+ | |||||||||||
| Sony Corporation | 11 Madison Avenue | 60.0 | Jan 2031 | 578,791 | $44,605 | $26,763 | 2.1% | $77.07 | A- | |||||||
| Debevoise & Plimpton, LLP | 919 Third Avenue | 51.0 | Jun 2022 | 577,438 | $47,518 | $24,234 | 1.9% | $82.29 | ||||||||
| King & Spalding | 1185 Avenue of the Americas | 100.0 | Oct 2025 | 218,275 | $20,821 | $20,821 | 1.6% | $95.39 | ||||||||
| The City of New York | 100 Church Street | 100.0 | Mar 2034 | 510,007 | $20,518 | $20,518 | 1.6% | $40.23 | ||||||||
| 420 Lexington Avenue | 100.0 | Oct 2030 | 4,077 | 287 | 287 | 0.1% | 70.32 | |||||||||
| 514,084 | 20,805 | 20,805 | 1.7% | $40.47 | Aa1 | |||||||||||
| Metro-North Commuter Railroad Company | 420 Lexington Avenue | 100.0 | Nov 2034 | 334,654 | $19,395 | $19,395 | 1.5% | $57.96 | ||||||||
| 110 East 42nd Street | 100.0 | Oct 2021 | 1,840 | 121 | 121 | —% | 65.63 | |||||||||
| 336,494 | 19,516 | 19,516 | 1.5% | $58.00 | Aaa | |||||||||||
| Giorgio Armani Corporation | 752-760 Madison Avenue | 100.0 | Dec 2024 | 21,124 | $16,324 | $16,324 | 1.3% | $772.77 | ||||||||
| 717 Fifth Avenue | 10.9 | Mar 2023 | 46,940 | 24,042 | 2,621 | 0.2% | $512.18 | |||||||||
| 762 Madison Avenue | 90.0 | Dec 2024 | 1,264 | 261 | 235 | —% | $206.32 | |||||||||
| 69,328 | $40,627 | $19,180 | 1.5% | $586.00 | ||||||||||||
| Visiting Nurse Service of New York | 220 East 42nd Street | 100.0 | Sep 2048 | 308,115 | $19,039 | $19,039 | 1.5% | $61.79 | ||||||||
| Advance Magazine Group, Fairchild Publications | 750 Third Avenue | 100.0 | Feb 2021 | 286,622 | $15,160 | $15,160 | 1.2% | $52.89 | ||||||||
| 485 Lexington Avenue | 100.0 | Feb 2021 | 52,573 | 3,707 | 3,707 | 0.3% | 70.51 | |||||||||
| 339,195 | $18,867 | $18,867 | 1.5% | $55.62 | ||||||||||||
| News America Incorporated | 1185 Avenue of the Americas | 100.0 | Nov 2020 | 165,086 | $18,104 | $18,104 | 1.4% | $109.66 | A | |||||||
| Nike Retail Services, Inc. | 650 Fifth Avenue | 50.0 | Jan 2033 | 69,214 | $35,511 | $17,756 | 1.4% | $513.06 | AA- | |||||||
| Bloomberg L.P. | 919 Third Avenue | 51.0 | Feb 2029 | 557,208 | $33,532 | $17,101 | 1.3% | $60.18 | ||||||||
| Cravath, Swaine & Moore LLP | Worldwide Plaza | 24.35 | Aug 2024 | 617,135 | $67,045 | $16,325 | 1.3% | $108.64 | ||||||||
| WeWork | 609 Fifth Avenue | 100.0 | Apr 2035 | 138,563 | $11,224 | $11,224 | 0.9% | $81.00 | ||||||||
| 2 Herald Sqaure | 51.0 | Feb 2036 | 153,061 | 9,005 | 4,593 | 0.4% | 58.83 | |||||||||
| 291,624 | $20,229 | $15,817 | 1.3% | $69.37 | ||||||||||||
| Omnicom Group, Inc., Cardinia Real Estate | 220 East 42nd Street | 100.0 | Apr 2032 | 231,114 | $14,897 | $14,897 | 1.1% | $64.46 | ||||||||
| 1055 Washington Blvd. | 100.0 | Oct 2028 | 23,800 | 887 | 887 | 0.1% | 37.28 | |||||||||
| 254,914 | $15,784 | $15,784 | 1.2% | $61.92 | BBB+ | |||||||||||
| National Hockey League | 1185 Avenue of the Americas | 100.0 | Nov 2022 | 148,217 | $15,651 | $15,651 | 1.2% | $105.60 | ||||||||
| Amerada Hess Corp. | 1185 Avenue of the Americas | 100.0 | Dec 2027 | 167,169 | $15,393 | $15,393 | 1.2% | $92.08 | BBB- | |||||||
| WME IMG, LLC | 304 Park Avenue | 100.0 | Apr 2028 | 137,992 | $9,673 | $9,673 | 0.7% | $70.10 | ||||||||
| 11 Madison Avenue | 60.0 | Sep 2030 | 104,618 | 9,267 | 5,560 | 0.4% | 88.58 | |||||||||
| 242,610 | $18,940 | $15,233 | 1.1% | $78.07 | ||||||||||||
| Infor (US) Inc. | 635 Sixth Avenue | 100.0 | Feb 2025 | 71,048 | $7,004 | $7,004 | 0.5% | $98.58 | ||||||||
| 641 Sixth Avenue | 100.0 | Jul 2022 | 43,000 | 2,977 | 2,977 | 0.2% | 69.23 | |||||||||
| 641 Sixth Avenue | 100.0 | Jun 2026 | 21,981 | 1,965 | 1,965 | 0.2% | 89.40 | |||||||||
| 641 Sixth Avenue | 100.0 | Dec 2027 | 13,090 | 1,377 | 1,377 | 0.1% | 105.21 | |||||||||
| 149,119 | $13,323 | $13,323 | 1.0% | $89.35 | ||||||||||||
| Total | 8,722,902 | $680,346 | $449,795 | 34.9% | $78.00 | |||||||||||
| (1) Corporate or bond rating from S&P or Moody's. | ||||||||||||||||
| (2) SLG Share of Annualized Cash Rent includes Manhattan, Suburban, Retail, Residential, and Development / Redevelopment properties. | ||||||||||||||||
| Supplemental Information | 32 | First Quarter 2020 |
| ||
TENANT DIVERSIFICATION Manhattan Operating, Retail and Development/Redevelopment Properties Unaudited | | |
| ||
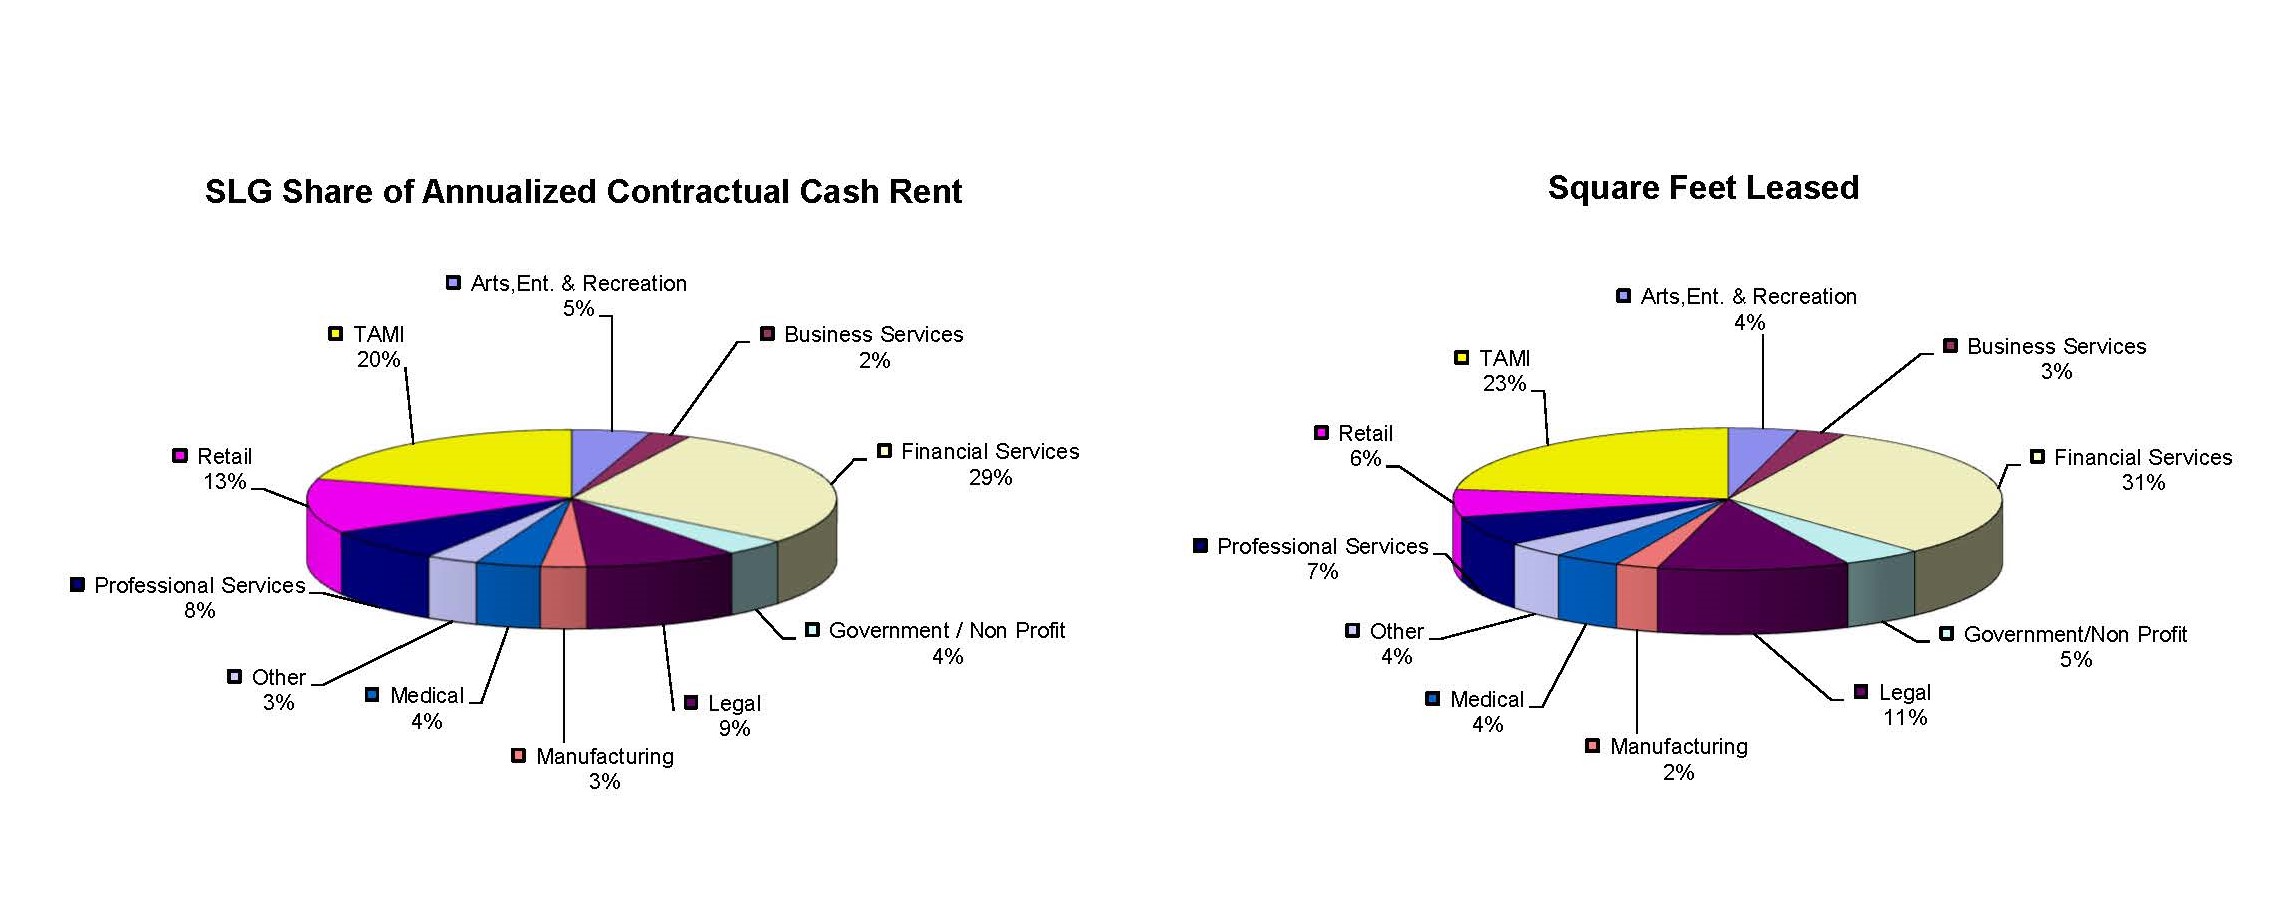
| Supplemental Information | 33 | First Quarter 2020 |
| ||
LEASING ACTIVITY - MANHATTAN OPERATING PROPERTIES Available Space Unaudited | | |
| ||
| Activity | Building Address | # of Leases | Usable SF | Rentable SF | Escalated Rent/Rentable SF ($'s)(1) | ||||||
| Available Space at 12/31/19 | 1,306,757 | ||||||||||
| Less: Properties in redevelopment | 1 Madison Avenue | (10,695 | ) | ||||||||
| 625 Madison Avenue | |||||||||||
| Space which became available during the Quarter (2): | |||||||||||
| Office | |||||||||||
| 10 East 53rd Street | 2 | 10,787 | 12,202 | $85.27 | |||||||
| 30 East 40th Street | 1 | 930 | 930 | 72.76 | |||||||
| 100 Park Avenue | 1 | 5,251 | 5,751 | 73.00 | |||||||
| 110 East 42nd Street | 1 | 982 | 1,009 | 65.99 | |||||||
| 110 Greene Street | 7 | 25,738 | 23,092 | 83.63 | |||||||
| 220 East 42nd Street | 1 | 2,676 | 2,657 | 69.39 | |||||||
| 304 Park Avenue South | 3 | 55,364 | 54,734 | 66.45 | |||||||
| 420 Lexington Avenue | 8 | 33,816 | 42,990 | 58.28 | |||||||
| 711 Third Avenue | 1 | 29,967 | 32,826 | 49.71 | |||||||
| 800 Third Avenue | 2 | 40,143 | 44,814 | 58.63 | |||||||
| 810 Seventh Avenue | 1 | 7,598 | 8,502 | 66.35 | |||||||
| 1350 Avenue of the Americas | 2 | 30,714 | 31,556 | 96.27 | |||||||
| 2 Herald Square | 1 | 28,078 | 27,500 | 90.54 | |||||||
| Total/Weighted Average | 31 | 272,044 | 288,563 | $70.02 | |||||||
| Retail | |||||||||||
| 100 Park Avenue | 1 | 7,424 | 8,597 | $52.76 | |||||||
| 1515 Broadway | 1 | 43,787 | 44,721 | 57.37 | |||||||
| Total/Weighted Average | 2 | 51,211 | 53,318 | $56.63 | |||||||
| Storage | |||||||||||
| 110 Greene Street | 1 | 422 | 422 | $56.87 | |||||||
| 800 Third Avenue | 1 | 1,000 | 1,500 | 20.00 | |||||||
| Total/Weighted Average | 2 | 1,422 | 1,922 | $28.10 | |||||||
| Total Space which became available during the quarter | |||||||||||
| Office | 31 | 272,044 | 288,563 | $70.02 | |||||||
| Retail | 2 | 51,211 | 53,318 | $56.63 | |||||||
| Storage | 2 | 1,422 | 1,922 | $28.10 | |||||||
| 35 | 324,677 | 343,803 | $67.70 | ||||||||
| Total Available Space | 1,620,739 | ||||||||||
| (1) Escalated rent includes base rent plus all additional amounts paid by the tenant in the form of real estate taxes, operating expenses, porters wage or a consumer price index (CPI) adjustment. | |||||||||||
| (2) Includes expiring space, relocating tenants and move-outs where tenants vacated. Excludes lease expirations where tenants heldover. | |||||||||||
| Supplemental Information | 34 | First Quarter 2020 |
| ||
LEASING ACTIVITY - MANHATTAN OPERATING PROPERTIES Commenced Leasing Unaudited | | |
| ||
| Activity | Building Address | # of Leases | Term (Yrs) | Usable SF | Rentable SF | New Cash Rent / Rentable SF(1) | Prev. Escalated Rent/ Rentable SF(2) | TI / Rentable SF | Free Rent # of Months | ||||||||||||||||||
| Available Space | 1,620,739 | ||||||||||||||||||||||||||
| Office | |||||||||||||||||||||||||||
| 10 East 53rd Street | 1 | 2.0 | 3,618 | 4,109 | $105.00 | $98.77 | $— | — | |||||||||||||||||||
| 30 East 40th Street | 1 | 7.0 | 930 | 1,143 | 65.00 | 59.20 | — | — | |||||||||||||||||||
| 55 West 46th Street - Tower 46 | 1 | 2.8 | 5,385 | 5,385 | 74.00 | — | 2.79 | 3.5 | |||||||||||||||||||
| 100 Park Avenue | 2 | 10.3 | 4,713 | 4,727 | 88.00 | 86.11 | 127.10 | 2.7 | |||||||||||||||||||
| 110 Greene Street | 7 | 4.5 | 18,982 | 18,035 | 79.14 | 79.80 | 34.81 | 2.3 | |||||||||||||||||||
| 125 Park Avenue | 2 | 19.9 | 27,384 | 30,169 | 64.87 | 63.75 | 78.80 | 10.7 | |||||||||||||||||||
| 220 East 42nd Street | 1 | 0.5 | 2,676 | 2,657 | 69.39 | 69.39 | — | — | |||||||||||||||||||
| 304 Park Avenue South | 1 | 8.2 | 2,909 | 2,757 | 70.00 | 67.03 | 16.42 | 7.0 | |||||||||||||||||||
| 420 Lexington Avenue | 7 | 6.6 | 15,341 | 16,862 | 65.41 | 68.21 | 33.48 | 1.1 | |||||||||||||||||||
| 800 Third Avenue | 2 | 9.7 | 21,194 | 23,012 | 57.22 | 57.08 | — | 3.7 | |||||||||||||||||||
| 810 Seventh Avenue | 1 | 12.0 | 15,500 | 17,320 | 71.00 | 79.53 | 116.71 | 6.0 | |||||||||||||||||||
| 1350 Avenue of the Americas | 3 | 5.9 | 7,556 | 8,136 | 81.32 | — | 115.05 | 3.1 | |||||||||||||||||||
| 2 Herald Square | 1 | 17.0 | 28,478 | 29,388 | 66.00 | 85.93 | 95.00 | 12.0 | |||||||||||||||||||
| Total/Weighted Average | 30 | 11.5 | 154,666 | 163,700 | $69.23 | $73.68 | $60.97 | 6.1 | |||||||||||||||||||
| Retail | |||||||||||||||||||||||||||
| 100 Park Avenue | 1 | 7.5 | 7,424 | 7,808 | $63.00 | $58.09 | $44.83 | 6.0 | |||||||||||||||||||
| 304 Park Avenue South | 1 | 10.4 | 7,240 | 8,548 | 169.63 | 166.41 | 99.44 | 5.0 | |||||||||||||||||||
| 1515 Broadway | 1 | 20.0 | 43,787 | 39,436 | 73.54 | 65.06 | — | 14.0 | |||||||||||||||||||
| 2 Herald Square | 1 | 10.1 | 22,927 | 21,706 | 306.37 | — | 253.39 | 7.0 | |||||||||||||||||||
| Total/Weighted Average | 4 | 14.9 | 81,378 | 77,498 | $148.29 | $79.61 | $86.46 | 10.2 | |||||||||||||||||||
| Storage | |||||||||||||||||||||||||||
| 110 Greene Street | 1 | 1.0 | 422 | 422 | $58.58 | $56.87 | $— | — | |||||||||||||||||||
| Total/Weighted Average | 1 | 1.0 | 422 | 422 | $58.58 | $56.87 | $— | — | |||||||||||||||||||
| Leased Space | |||||||||||||||||||||||||||
| Office (3) | 30 | 11.5 | 154,666 | 163,700 | $69.23 | $73.68 | $60.97 | 6.1 | |||||||||||||||||||
| Retail | 4 | 14.9 | 81,378 | 77,498 | $148.29 | $79.61 | $86.46 | 10.2 | |||||||||||||||||||
| Storage | 1 | 1.0 | 422 | 422 | $58.58 | $56.87 | $— | — | |||||||||||||||||||
| Total | 35 | 12.5 | 236,466 | 241,620 | $94.57 | $75.38 | $69.04 | 7.4 | |||||||||||||||||||
| Total Available Space as of 3/31/20 | 1,384,273 | ||||||||||||||||||||||||||
| Early Renewals | |||||||||||||||||||||||||||
| Office | |||||||||||||||||||||||||||
| 110 East 42nd Street | 1 | 1.0 | 1,242 | 1,276 | $66.00 | $66.83 | $— | — | |||||||||||||||||||
| 420 Lexington Avenue | 1 | 5.1 | 1,220 | 1,485 | 65.00 | 65.25 | 38.53 | 38.5 | |||||||||||||||||||
| Total/Weighted Average | 2 | 3.2 | 2,462 | 2,761 | $65.46 | $65.98 | $20.72 | 20.7 | |||||||||||||||||||
| Retail | |||||||||||||||||||||||||||
| 110 Greene Street | 1 | 1.0 | 2,812 | 2,740 | $121.84 | $125.53 | $— | — | |||||||||||||||||||
| Total/Weighted Average | 1 | 1.0 | 2,812 | 2,740 | $121.84 | $125.53 | $— | — | |||||||||||||||||||
| Storage | |||||||||||||||||||||||||||
| 750 Third Avenue | 1 | 12.6 | 2,280 | 2,434 | $35.00 | $46.71 | $— | 4.0 | |||||||||||||||||||
| Total/Weighted Average | 1 | 12.6 | 2,280 | 2,434 | $35.00 | $46.71 | $— | 4.0 | |||||||||||||||||||
| Renewals | |||||||||||||||||||||||||||
| Early Renewals Office | 2 | 3.2 | 2,462 | 2,761 | $65.46 | $65.98 | $20.72 | 20.7 | |||||||||||||||||||
| Early Renewals Retail | 1 | 1.0 | 2,812 | 2,740 | $121.84 | $125.53 | $— | — | |||||||||||||||||||
| Early Renewals Storage | 1 | 12.6 | 2,280 | 2,434 | $35.00 | $46.71 | $— | 4.0 | |||||||||||||||||||
| Total | 4 | 5.3 | 7,554 | 7,935 | $75.59 | $80.63 | $7.21 | 1.4 | |||||||||||||||||||
| (1) Annual initial base rent. | |||||||||||||||||||||||||||
| (2) Escalated cash rent includes base rent plus all additional amounts paid by the tenant in the form of real estate taxes, operating expenses, porters wage or a consumer price index (CPI) adjustment. | |||||||||||||||||||||||||||
| (3) Average starting office rent excluding new tenants replacing vacancies is $68.39/rsf for 133,762 rentable SF. Average starting office rent for office space (leased and early renewals, excluding new tenants replacing vacancies) is $68.33/rsf for 136,523 rentable SF. | |||||||||||||||||||||||||||
| Supplemental Information | 35 | First Quarter 2020 |
| ||
ANNUAL LEASE EXPIRATIONS - MANHATTAN OPERATING PROPERTIES Office, Retail and Storage Leases Unaudited | | |
| ||
| Consolidated Properties | Joint Venture Properties | ||||||||||||||||||||||||||||||||||
| Year of Lease Expiration | Number of Expiring Leases (2) | Rentable Square Footage of Expiring Leases | Percentage of Total Sq. Ft. | Annualized Contractual Cash Rent of Expiring Leases | Annualized Contractual Cash Rent Per Square Foot of Expiring Leases $/psf (3) | Current Weighted Average Asking Rent $/psf (4) | Number of Expiring Leases (2) | Rentable Square Footage of Expiring Leases | Percentage of Total Sq. Ft. | Annualized Contractual Cash Rent of Expiring Leases | Annualized Contractual Cash Rent Per Square Foot of Expiring Leases $/psf (3) | Current Weighted Average Asking Rent $/psf (4) | |||||||||||||||||||||||
1st Quarter 2020 (1) | 9 | 47,130 | 0.45 | % | $2,912,968 | $61.81 | $60.19 | 3 | 45,008 | 0.42 | % | $2,944,223 | $65.42 | $70.49 | |||||||||||||||||||||
| 2nd Quarter 2020 | 11 | 39,200 | 0.37 | % | 2,898,620 | 73.94 | 68.59 | 4 | 53,078 | 0.49 | % | 4,042,643 | 76.16 | 73.27 | |||||||||||||||||||||
| 3rd Quarter 2020 | 19 | 202,055 | 1.92 | % | 13,914,891 | 68.87 | 63.55 | 4 | 30,098 | 0.28 | % | 2,199,565 | 73.08 | 70.90 | |||||||||||||||||||||
| 4th Quarter 2020 | 24 | 283,998 | 2.70 | % | 25,334,702 | 89.21 | 68.75 | 5 | 30,276 | 0.28 | % | 3,037,296 | 100.32 | 81.73 | |||||||||||||||||||||
| Total 2020 | 63 | 572,383 | 5.44 | % | $45,061,181 | $78.73 | $66.20 | 16 | 158,460 | 1.47 | % | $12,223,727 | $77.14 | $73.65 | |||||||||||||||||||||
| 2021 | 112 | 1,174,907 | 11.18 | % | $72,096,077 | $61.36 | $62.59 | 27 | 291,807 | 2.70 | % | $22,204,219 | $76.09 | $75.82 | |||||||||||||||||||||
| 2022 | 92 | 770,000 | 7.33 | % | 59,954,294 | 77.86 | 71.83 | 32 | 902,632 | 8.36 | % | 84,158,958 | 93.24 | 91.76 | |||||||||||||||||||||
| 2023 | 72 | 835,699 | 7.95 | % | 51,322,914 | 61.41 | 60.69 | 16 | 438,826 | 4.07 | % | 38,351,957 | 87.40 | 74.99 | |||||||||||||||||||||
| 2024 | 57 | 388,503 | 3.70 | % | 26,653,136 | 68.60 | 65.94 | 22 | 986,490 | 9.14 | % | 106,113,695 | 107.57 | 83.84 | |||||||||||||||||||||
| 2025 | 50 | 587,667 | 5.59 | % | 50,445,924 | 85.84 | 70.55 | 13 | 430,336 | 3.99 | % | 35,448,944 | 82.38 | 77.07 | |||||||||||||||||||||
| 2026 | 29 | 736,789 | 7.01 | % | 51,651,214 | 70.10 | 65.32 | 20 | 499,312 | 4.63 | % | 50,892,964 | 101.93 | 94.47 | |||||||||||||||||||||
| 2027 | 34 | 610,630 | 5.81 | % | 47,329,899 | 77.51 | 65.48 | 18 | 383,505 | 3.55 | % | 34,201,170 | 89.18 | 87.41 | |||||||||||||||||||||
| 2028 | 34 | 565,350 | 5.38 | % | 41,773,577 | 73.89 | 69.26 | 18 | 206,956 | 1.92 | % | 21,792,843 | 105.30 | 106.76 | |||||||||||||||||||||
| 2029 | 19 | 398,493 | 3.79 | % | 25,595,117 | 64.23 | 61.32 | 13 | 724,710 | 6.72 | % | 48,845,072 | 67.40 | 77.39 | |||||||||||||||||||||
| Thereafter | 71 | 3,869,780 | 36.82 | % | 227,679,657 | 58.84 | 61.39 | 35 | 5,767,707 | 53.45 | % | 391,508,279 | 67.88 | 80.45 | |||||||||||||||||||||
| 633 | 10,510,201 | 100.00 | % | $699,562,990 | $66.56 | $64.11 | 230 | 10,790,741 | 100.00 | % | $845,741,828 | $78.38 | $82.32 | ||||||||||||||||||||||
| NOTE: Data excludes space currently occupied by SL Green's corporate offices | |||||||||||||||||||||||||||||||||||
| (1) Includes month to month holdover tenants that expired prior to March 31, 2020. | |||||||||||||||||||||||||||||||||||
| (2) Tenants may have multiple leases. | |||||||||||||||||||||||||||||||||||
| (3) Represents in place annualized contractual cash rent allocated by year of expiration. | |||||||||||||||||||||||||||||||||||
| (4) Management's estimate of current average asking rents for currently occupied space as of March 31, 2020. Taking rents are typically lower than asking rents and may vary from property to property. | |||||||||||||||||||||||||||||||||||
| Supplemental Information | 36 | First Quarter 2020 |
| ||
ANNUAL LEASE EXPIRATIONS Retail Within Operating and Development / Redevelopment Leases Unaudited | | |
| ||
| Consolidated Properties | Joint Venture Properties | ||||||||||||||||||||||||||||||||||
| Year of Lease Expiration | Number of Expiring Leases (2) | Rentable Square Footage of Expiring Leases | Percentage of Total Sq. Ft. | Annualized Contractual Cash Rent of Expiring Leases | Annualized Contractual Cash Rent Per Square Foot of Expiring Leases $/psf (3) | Current Weighted Average Asking Rent $/psf (4) | Number of Expiring Leases (2) | Rentable Square Footage of Expiring Leases | Percentage of Total Sq. Ft. | Annualized Contractual Cash Rent of Expiring Leases | Annualized Contractual Cash Rent Per Square Foot of Expiring Leases $/psf (3) | Current Weighted Average Asking Rent $/psf (4) | |||||||||||||||||||||||
| High Street Retail | |||||||||||||||||||||||||||||||||||
2020 (1) | 3 | 9,901 | 9.92 | % | $1,463,630 | $147.83 | $156.51 | 1 | 3,600 | 1.33 | % | $257,200 | $71.44 | $85.00 | |||||||||||||||||||||
| 2021 | — | — | — | % | — | — | — | 3 | 15,335 | 5.66 | % | 4,434,095 | 289.15 | 73.49 | |||||||||||||||||||||
| 2022 | 1 | 1,165 | 1.17 | % | 223,652 | 191.98 | 96.15 | 1 | 3,868 | 1.43 | % | 3,654,761 | 944.87 | 801.45 | |||||||||||||||||||||
| 2023 | — | — | — | % | — | — | — | 3 | 54,071 | 19.95 | % | 25,759,773 | 476.41 | 268.19 | |||||||||||||||||||||
| 2024 | 3 | 25,507 | 25.54 | % | 16,678,603 | 653.88 | 541.70 | 1 | 7,793 | 2.87 | % | 5,731,176 | 735.43 | 1,026.56 | |||||||||||||||||||||
| 2025 | 1 | 30,139 | 30.18 | % | 150,000 | 4.98 | 24.88 | — | — | — | % | — | — | — | |||||||||||||||||||||
| 2026 | — | — | — | % | — | — | — | 4 | 74,424 | 27.46 | % | 31,180,707 | 418.96 | 282.98 | |||||||||||||||||||||
| 2027 | — | — | — | % | — | — | — | 1 | 3,655 | 1.35 | % | 757,884 | 207.36 | 102.98 | |||||||||||||||||||||
| 2028 | 1 | 10,040 | 10.05 | % | 4,128,216 | 411.18 | 323.80 | — | — | — | % | — | — | — | |||||||||||||||||||||
| 2029 | — | — | — | % | — | — | — | 1 | 31,174 | 11.50 | % | 21,754,800 | 697.85 | 449.09 | |||||||||||||||||||||
| Thereafter | 2 | 23,100 | 23.14 | % | 1,893,384 | 81.96 | 108.20 | 2 | 77,154 | 28.46 | % | 37,276,368 | 483.14 | 488.27 | |||||||||||||||||||||
| 11 | 99,852 | 100.00 | % | $24,537,485 | $245.74 | $220.12 | 17 | 271,074 | 100.01 | % | $130,806,764 | $482.55 | $369.43 | ||||||||||||||||||||||
Vacancy (5) | 8,819 | 604.26 | — | — | |||||||||||||||||||||||||||||||
| 108,671 | $251.29 | 271,074 | $369.43 | ||||||||||||||||||||||||||||||||
| Other Retail | |||||||||||||||||||||||||||||||||||
2020 (1) | 4 | 7,238 | 1.18 | % | $1,727,477 | $238.67 | $202.56 | 2 | 6,263 | 1.31 | % | $663,768 | $105.98 | $72.81 | |||||||||||||||||||||
| 2021 | 11 | 23,119 | 3.78 | % | 3,062,090 | 132.45 | 100.80 | 5 | 5,995 | 1.25 | % | 592,271 | 98.79 | 85.37 | |||||||||||||||||||||
| 2022 | 11 | 65,902 | 10.77 | % | 13,124,278 | 199.15 | 184.48 | 9 | 81,972 | 17.09 | % | 20,531,683 | 250.47 | 256.25 | |||||||||||||||||||||
| 2023 | 10 | 36,669 | 5.99 | % | 5,630,675 | 153.55 | 111.73 | 4 | 23,463 | 4.89 | % | 3,057,216 | 130.30 | 97.88 | |||||||||||||||||||||
| 2024 | 5 | 22,420 | 3.66 | % | 4,279,803 | 190.89 | 134.80 | 5 | 7,232 | 1.51 | % | 3,060,916 | 423.25 | 300.37 | |||||||||||||||||||||
| 2025 | 8 | 28,753 | 4.70 | % | 7,747,553 | 269.45 | 173.04 | 2 | 946 | 0.20 | % | 230,638 | 243.80 | 136.63 | |||||||||||||||||||||
| 2026 | 6 | 15,877 | 2.59 | % | 1,745,479 | 109.94 | 128.56 | 5 | 21,373 | 4.46 | % | 9,732,819 | 455.38 | 324.39 | |||||||||||||||||||||
| 2027 | 6 | 31,961 | 5.22 | % | 4,318,014 | 135.10 | 96.36 | 7 | 26,316 | 5.49 | % | 11,225,990 | 426.58 | 413.59 | |||||||||||||||||||||
| 2028 | 8 | 34,041 | 5.56 | % | 4,797,147 | 140.92 | 114.00 | 6 | 17,759 | 3.70 | % | 3,786,402 | 213.21 | 354.69 | |||||||||||||||||||||
| 2029 | 6 | 28,001 | 4.58 | % | 1,729,627 | 61.77 | 72.36 | 8 | 69,902 | 14.57 | % | 6,020,928 | 86.13 | 79.92 | |||||||||||||||||||||
| Thereafter | 32 | 318,007 | 51.97 | % | 42,832,812 | 134.69 | 121.86 | 10 | 218,491 | 45.53 | % | 20,046,005 | 91.75 | 88.10 | |||||||||||||||||||||
| 107 | 611,988 | 100.00 | % | $90,994,955 | $148.69 | $127.18 | 63 | 479,712 | 100.00 | % | $78,948,636 | $164.58 | $157.44 | ||||||||||||||||||||||
Vacancy (5) | 30,612 | 231.91 | 23,138 | 118.26 | |||||||||||||||||||||||||||||||
| 642,600 | $132.17 | 502,850 | $155.63 | ||||||||||||||||||||||||||||||||
| (1) Includes month to month holdover tenants that expired prior to March 31, 2020. | |||||||||||||||||||||||||||||||||||
| (2) Tenants may have multiple leases. | |||||||||||||||||||||||||||||||||||
| (3) Represents in place annualized contractual cash rent allocated by year of expiration. | |||||||||||||||||||||||||||||||||||
| (4) Management's estimate of average asking rents for currently occupied space as of March 31, 2020. Taking rents are typically lower than asking rents and may vary from property to property. | |||||||||||||||||||||||||||||||||||
| (5) Includes square footage of leases signed but not yet commenced. | |||||||||||||||||||||||||||||||||||
| Supplemental Information | 37 | First Quarter 2020 |
| ||
SUMMARY OF REAL ESTATE ACQUISITION ACTIVITY Manhattan Unaudited (Dollars in Thousands) | | |
| ||
| Gross Asset | Occupancy (%) | ||||||||||||||||
| Property | Submarket | Interest Acquired | Type of Ownership | Net Rentable SF | Valuation ($'s) (1) | at acquisition | 3/31/2020 | ||||||||||
| 1998 - 2018 Acquisitions | |||||||||||||||||
| Mar-98 | 420 Lexington Avenue | Grand Central | 100.0% | Operating Sublease | 1,188,000 | $ | 78,000 | 83.0 | 90.4 | ||||||||
| May-98 | 711 3rd Avenue | Grand Central | 100.0 | Operating Sublease | 524,000 | 65,600 | 79.0 | 91.3 | |||||||||
| Jun-98 | 440 9th Avenue | Penn Station | 100.0 | Fee Interest | 339,000 | 32,000 | 76.0 | N/A | |||||||||
| Jan-99 | 420 Lexington Leasehold | Grand Central | 100.0 | Sub-leasehold | — | 27,300 | — | — | |||||||||
| Jan-99 | 555 West 57th Street | Midtown West | 65.0 | Fee Interest | 941,000 | 66,700 | 100.0 | 99.9 | |||||||||
| Aug-99 | 1250 Broadway | Penn Station | 50.0 | Fee Interest | 670,000 | 93,000 | 96.5 | N/A | |||||||||
| Nov-99 | 555 West 57th Street | Midtown West | 35.0 | Fee Interest | — | 34,100 | 99.9 | ||||||||||
| Feb-00 | 100 Park Avenue | Grand Central | 50.0 | Fee Interest | 834,000 | 192,000 | 96.5 | 84.8 | |||||||||
| Jun-01 | 317 Madison Avenue | Grand Central | 100.0 | Fee Interest | 450,000 | 105,600 | 95.0 | N/A | |||||||||
| Sep-01 | 1250 Broadway | Penn Station | 49.9 | Fee Interest | 670,000 | 126,500 | 97.7 | N/A | |||||||||
| May-02 | 1515 Broadway | Times Square | 55.0 | Fee Interest | 1,750,000 | 483,500 | 98.0 | 94.9 | |||||||||
| Feb-03 | 220 East 42nd Street | Grand Central | 100.0 | Fee Interest | 1,135,000 | 265,000 | 91.9 | 97.0 | |||||||||
| Mar-03 | 125 Broad Street | Downtown | 100.0 | Fee Interest | 525,000 | 92,000 | 100.0 | N/A | |||||||||
| Oct-03 | 461 Fifth Avenue | Midtown | 100.0 | Leasehold Interest | 200,000 | 60,900 | 93.9 | 87.3 | |||||||||
| Dec-03 | 1221 Avenue of the Americas | Rockefeller Center | 45.0 | Fee Interest | 2,550,000 | 1,000,000 | 98.8 | N/A | |||||||||
| Mar-04 | 19 West 44th Street | Midtown | 35.0 | Fee Interest | 292,000 | 67,000 | 86.0 | N/A | |||||||||
| Jul-04 | 750 Third Avenue | Grand Central | 100.0 | Fee Interest | 779,000 | 255,000 | 100.0 | 91.2 | |||||||||
| Jul-04 | 485 Lexington Avenue | Grand Central | 30.0 | Fee Interest | 921,000 | 225,000 | 100.0 | 90.4 | |||||||||
| Oct-04 | 625 Madison Avenue | Plaza District | 100.0 | Leasehold Interest | 563,000 | 231,500 | 68.0 | 33.5 | |||||||||
| Feb-05 | 28 West 44th Street | Midtown | 100.0 | Fee Interest | 359,000 | 105,000 | 87.0 | N/A | |||||||||
| Apr-05 | 1 Madison Avenue | Park Avenue South | 55.0 | Fee Interest | 1,177,000 | 803,000 | 96.0 | 9.3 | |||||||||
| Apr-05 | 5 Madison Avenue Clock Tower | Park Avenue South | 100.0 | Fee Interest | 267,000 | 115,000 | N/A | N/A | |||||||||
| Jun-05 | 19 West 44th Street | Midtown | 65.0 | Fee Interest | — | 91,200 | N/A | ||||||||||
| Mar-06 | 521 Fifth Avenue | Midtown | 100.0 | Leasehold Interest | 460,000 | 210,000 | 97.0 | N/A | |||||||||
| Jun-06 | 609 Fifth Avenue | Midtown | 100.0 | Fee Interest | 160,000 | 182,000 | 98.5 | 100.0 | |||||||||
| Dec-06 | 485 Lexington Avenue | Grand Central | 70.0 | Fee Interest | — | 578,000 | 90.4 | ||||||||||
| Dec-06 | 800 Third Avenue | Grand Central North | 43.0 | Fee Interest | 526,000 | 285,000 | 96.9 | 92.4 | |||||||||
| Jan-07 | Reckson - NYC Portfolio | Various | 100.0 | Fee Interests / Leasehold Interest | 5,612,000 | 3,679,530 | 98.3 | 95.0 | |||||||||
| Apr-07 | 331 Madison Avenue | Grand Central | 100.0 | Fee Interest | 114,900 | 73,000 | 97.6 | N/A | |||||||||
| Apr-07 | 1745 Broadway | Midtown | 32.3 | Leasehold Interest | 674,000 | 520,000 | 100.0 | N/A | |||||||||
| Jun-07 | 333 West 34th Street | Penn Station | 100.0 | Fee Interest | 345,400 | 183,000 | 100.0 | N/A | |||||||||
| Aug-07 | 1 Madison Avenue | Park Avenue South | 45.0 | Fee Interest | 1,177,000 | 1,000,000 | 99.8 | 9.3 | |||||||||
| Dec-07 | 388 & 390 Greenwich Street | Downtown | 50.6 | Fee Interest | 2,635,000 | 1,575,000 | 100.0 | N/A | |||||||||
| Jan-10 | 100 Church Street | Downtown | 100.0 | Fee Interest | 1,047,500 | 181,600 | 41.3 | 99.3 | |||||||||
| May-10 | 600 Lexington Avenue | Grand Central North | 55.0 | Fee Interest | 303,515 | 193,000 | 93.6 | N/A | |||||||||
| Aug-10 | 125 Park Avenue | Grand Central | 100.0 | Fee Interest | 604,245 | 330,000 | 99.1 | 99.5 | |||||||||
| Jan-11 | 521 Fifth Avenue | Midtown | 49.9 | Leasehold Interest | 460,000 | 245,700 | 80.7 | N/A | |||||||||
| Apr-11 | 1515 Broadway | Times Square | 45.0 | Fee Interest | 1,750,000 | 1,210,000 | 98.5 | 94.9 | |||||||||
| May-11 | 110 East 42nd Street | Grand Central | 100.0 | Fee Interest | 205,000 | 85,570 | 72.6 | 82.6 | |||||||||
| May-11 | 280 Park Avenue | Park Avenue | 49.5 | Fee Interest | 1,219,158 | 1,110,000 | 78.2 | 89.5 | |||||||||
| Nov-11 | 180 Maiden Lane | Financial East | 49.9 | Fee Interest | 1,090,000 | 425,680 | 97.7 | N/A | |||||||||
| Nov-11 | 51 East 42nd Street | Grand Central | 100.0 | Fee Interest | 142,000 | 80,000 | 95.5 | N/A | |||||||||
| Feb-12 | 10 East 53rd Street | Plaza District | 55.0 | Fee Interest | 354,300 | 252,500 | 91.9 | 95.1 | |||||||||
| Jun-12 | 304 Park Avenue South | Midtown South | 100.0 | Fee Interest | 215,000 | 135,000 | 95.8 | 74.9 | |||||||||
| Sep-12 | 641 Sixth Avenue | Midtown South | 100.0 | Fee Interest | 163,000 | 90,000 | 92.1 | 100.0 | |||||||||
| Dec-12 | 315 West 36th Street | Times Square South | 35.5 | Fee Interest | 147,619 | 46,000 | 99.2 | N/A | |||||||||
| May-14 | 388 & 390 Greenwich Street | Downtown | 49.4 | Fee Interest | 2,635,000 | 1,585,000 | 100.0 | N/A | |||||||||
| Jul-15 | 110 Greene Street | Soho | 90.0 | Fee Interest | 223,600 | 255,000 | 84.0 | 91.3 | |||||||||
| Aug-15 | 30 East 40th Street | Grand Central South | 60.0 | Leasehold Interest | 69,446 | 4,650 | 100.0 | 93.5 | |||||||||
| Aug-15 | 11 Madison Avenue | Park Avenue South | 100.0 | Fee Interest | 2,314,000 | 2,285,000 | 71.6 | 95.8 | |||||||||
| Dec-15 | 600 Lexington Avenue | Grand Central North | 45.0 | Fee Interest | 303,515 | 284,000 | 95.5 | N/A | |||||||||
| Oct-17 | Worldwide Plaza | Westside | 24.4 | Fee Interest | 2,048,725 | 1,725,000 | 100.0 | 94.7 | |||||||||
| May-18 | 2 Herald Square | Herald Square | 100.0 | Leasehold Interest | 369,000 | 266,000 | 81.6 | 88.2 | |||||||||
| 43,502,923 | $ | 23,690,130 | |||||||||||||||
| 2019 Acquisitions | |||||||||||||||||
| May-19 | 110 Greene Street | Soho | 10.0% | Leasehold Interest | 223,600 | $ | 256,500 | 93.3 | 91.3 | ||||||||
| 223,600 | $ | 256,500 | |||||||||||||||
| (1) Acquisition price represents purchase price for consolidated acquisitions and purchase price or imputed value for joint venture properties. | |||||||||||||||||
| Supplemental Information | 38 | First Quarter 2020 |
| ||
SUMMARY OF REAL ESTATE SALES ACTIVITY Manhattan Unaudited (Dollars in Thousands) | | |
| ||
| Gross Asset Valuation | ||||||||||||||||||||||
| Property | Submarket | Interest Sold | Type of Ownership | Net Rentable SF | ($'s) | ($'s/SF) | ||||||||||||||||
| 2000 - 2018 Sales | ||||||||||||||||||||||
| Feb-00 | 29 West 35th Street | Penn Station | 100.0% | Fee Interest | 78,000 | $ | 11,700 | $ | 150 | |||||||||||||
| Mar-00 | 36 West 44th Street | Grand Central | 100.0 | Fee Interest | 178,000 | 31,500 | 177 | |||||||||||||||
| May-00 | 321 West 44th Street | Times Square | 35.0 | Fee Interest | 203,000 | 28,400 | 140 | |||||||||||||||
| Nov-00 | 90 Broad Street | Financial | 100.0 | Fee Interest | 339,000 | 60,000 | 177 | |||||||||||||||
| Dec-00 | 17 Battery South | Financial | 100.0 | Fee Interest | 392,000 | 53,000 | 135 | |||||||||||||||
| Jan-01 | 633 Third Ave | Grand Central North | 100.0 | Fee Interest | 40,623 | 13,250 | 326 | |||||||||||||||
| May-01 | 1 Park Ave | Grand Central South | 45.0 | Fee Interest | 913,000 | 233,900 | 256 | |||||||||||||||
| Jun-01 | 1412 Broadway | Times Square South | 100.0 | Fee Interest | 389,000 | 90,700 | 233 | |||||||||||||||
| Jul-01 | 110 East 42nd Street | Grand Central | 100.0 | Fee Interest | 69,700 | 14,500 | 208 | |||||||||||||||
| Sep-01 | 1250 Broadway | Penn Station | 45.0 | Fee Interest | 670,000 | 126,500 | 189 | |||||||||||||||
| Jun-02 | 469 Seventh Avenue | Penn Station | 100.0 | Fee Interest | 253,000 | 53,100 | 210 | |||||||||||||||
| Mar-03 | 50 West 23rd Street | Chelsea | 100.0 | Fee Interest | 333,000 | 66,000 | 198 | |||||||||||||||
| Jul-03 | 1370 Broadway | Times Square South | 100.0 | Fee Interest | 255,000 | 58,500 | 229 | |||||||||||||||
| Dec-03 | 321 West 44th Street | Times Square | 100.0 | Fee Interest | 203,000 | 35,000 | 172 | |||||||||||||||
| May-04 | 1 Park Avenue | Grand Central South | 75.0 | Fee Interest | 913,000 | 318,500 | 349 | |||||||||||||||
| Oct-04 | 17 Battery Place North | Financial | 100.0 | Fee Interest | 419,000 | 70,000 | 167 | |||||||||||||||
| Nov-04 | 1466 Broadway | Times Square | 100.0 | Fee Interest | 289,000 | 160,000 | 554 | |||||||||||||||
| Apr-05 | 1414 Avenue of the Americas | Plaza District | 100.0 | Fee Interest | 111,000 | 60,500 | 545 | |||||||||||||||
| Aug-05 | 180 Madison Avenue | Grand Central | 100.0 | Fee Interest | 265,000 | 92,700 | 350 | |||||||||||||||
| Jul-06 | 286 & 290 Madison Avenue | Grand Central | 100.0 | Fee Interest | 149,000 | 63,000 | 423 | |||||||||||||||
| Aug-06 | 1140 Avenue of the Americas | Rockefeller Center | 100.0 | Leasehold Interest | 191,000 | 97,500 | 510 | |||||||||||||||
| Dec-06 | 521 Fifth Avenue | Midtown | 50.0 | Leasehold Interest | 460,000 | 240,000 | 522 | |||||||||||||||
| Mar-07 | 1 Park Avenue | Grand Central South | 100.0 | Fee Interest | 913,000 | 550,000 | 602 | |||||||||||||||
| Mar-07 | 70 West 36th Street | Garment | 100.0 | Fee Interest | 151,000 | 61,500 | 407 | |||||||||||||||
| Jun-07 | 110 East 42nd Street | Grand Central North | 100.0 | Fee Interest | 181,000 | 111,500 | 616 | |||||||||||||||
| Jun-07 | 125 Broad Street | Downtown | 100.0 | Fee Interest | 525,000 | 273,000 | 520 | |||||||||||||||
| Jun-07 | 5 Madison Clock Tower | Park Avenue South | 100.0 | Fee Interest | 267,000 | 200,000 | 749 | |||||||||||||||
| Jul-07 | 292 Madison Avenue | Grand Central South | 100.0 | Fee Interest | 187,000 | 140,000 | 749 | |||||||||||||||
| Jul-07 | 1372 Broadway | Penn Station/Garment | 85.0 | Fee Interest | 508,000 | 335,000 | 659 | |||||||||||||||
| Nov-07 | 470 Park Avenue South | Park Avenue South/Flatiron | 100.0 | Fee Interest | 260,000 | 157,000 | 604 | |||||||||||||||
| Jan-08 | 440 Ninth Avenue | Penn Station | 100.0 | Fee Interest | 339,000 | 160,000 | 472 | |||||||||||||||
| May-08 | 1250 Broadway | Penn Station | 100.0 | Fee Interest | 670,000 | 310,000 | 463 | |||||||||||||||
| Oct-08 | 1372 Broadway | Penn Station/Garment | 15.0 | Fee Interest | 508,000 | 274,000 | 539 | |||||||||||||||
| May-10 | 1221 Avenue of the Americas | Rockefeller Center | 45.0 | Fee Interest | 2,550,000 | 1,280,000 | 502 | |||||||||||||||
| Sep-10 | 19 West 44th Street | Midtown | 100.0 | Fee Interest | 292,000 | 123,150 | 422 | |||||||||||||||
| May-11 | 28 West 44th Street | Midtown | 100.0 | Fee Interest | 359,000 | 161,000 | 448 | |||||||||||||||
| Aug-13 | 333 West 34th Street | Penn Station | 100.0 | Fee Interest | 345,400 | 220,250 | 638 | |||||||||||||||
| May-14 | 673 First Avenue | Grand Central South | 100.0 | Leasehold Interest | 422,000 | 145,000 | 344 | |||||||||||||||
| Sep-15 | 120 West 45th Street | Midtown | 100.0 | Fee Interest | 440,000 | 365,000 | 830 | |||||||||||||||
| Sep-15 | 315 West 36th Street | Times Square South | 100.0 | Fee Interest | 148,000 | 115,000 | 777 | |||||||||||||||
| Jun-16 | 388 & 390 Greenwich Street | Downtown | 1.0 | Fee Interest | 2,635,000 | 2,000,000 | 759 | |||||||||||||||
| Aug-16 | 11 Madison Avenue | Park Avenue South | 0.4 | Fee Interest | 2,314,000 | 2,600,000 | 1,124 | |||||||||||||||
| Nov-17 | 1515 Broadway | Times Square | 0.3 | Fee Interest | 1,750,000 | 1,950,000 | 1,114 | |||||||||||||||
| Jan-18 | 600 Lexington Avenue | Grand Central North | 1.0 | Fee Interest | 303,515 | 305,000 | 1,005 | |||||||||||||||
| Feb-18 | 1515 Broadway | Times Square | 13.0 | Fee Interest | 1,750,000 | 1,950,000 | 1,114 | |||||||||||||||
| May-18 | 1745 Broadway | Midtown | 56.9 | Leasehold Interest | 674,000 | 633,000 | 939 | |||||||||||||||
| Nov-18 | 3 Columbus Circle | Columbus Circle | 48.9 | Fee Interest | 530,981 | 851,000 | 1,603 | |||||||||||||||
| Nov-18 | 2 Herald Square | Herald Square | 49.0 | Leasehold Interest | 369,000 | 265,000 | 718 | |||||||||||||||
| 26,505,219 | $ | 17,513,650 | $ | 661 | ||||||||||||||||||
| 2019 Sales | ||||||||||||||||||||||
| May-19 | 521 Fifth Avenue | Grand Central | 50.5% | Fee Interest | 460,000 | $ | 381,000 | $ | 828 | |||||||||||||
| 460,000 | $ | 381,000 | $ | 828 | ||||||||||||||||||
| Supplemental Information | 39 | First Quarter 2020 |
| ||
SUMMARY OF REAL ESTATE ACQUISITION ACTIVITY Suburban Unaudited (Dollars in Thousands) | | |
| ||
| Gross Asset | Occupancy (%) | |||||||||||||||
| Property | Submarket | Interest Acquired | Type of Ownership | Net Rentable SF | Valuation ($'s) (1) | at acquisition | 3/31/2020 | |||||||||
| 2007 - 2016 Acquisitions | ||||||||||||||||
| Jan-07 | 300 Main Street | Stamford, Connecticut | 100.0% | Fee Interest | 130,000 | $ | 15,000 | 92.5 | N/A | |||||||
| Jan-07 | 399 Knollwood Road | White Plains, New York | 100.0 | Fee Interest | 145,000 | 31,600 | 96.6 | N/A | ||||||||
| Jan-07 | Reckson - Connecticut Portfolio | Stamford, Connecticut | 100.0 | Fee Interests / Leasehold Interest | 1,369,800 | 490,750 | 88.9 | N/A | ||||||||
| Jan-07 | Reckson - Westchester Portfolio | Westchester | 100.0 | Fee Interests / Leasehold Interest | 2,346,100 | 570,190 | 90.6 | N/A | ||||||||
| Apr-07 | Jericho Plazas | Jericho, New York | 20.3 | Fee Interest | 640,000 | 210,000 | 98.4 | N/A | ||||||||
| Jun-07 | 1010 Washington Boulevard | Stamford, Connecticut | 100.0 | Fee Interest | 143,400 | 38,000 | 95.6 | N/A | ||||||||
| Jun-07 | 500 West Putnam Avenue | Greenwich, Connecticut | 100.0 | Fee Interest | 121,500 | 56,000 | 94.4 | N/A | ||||||||
| Jul-07 | 16 Court Street | Brooklyn, New York | 35.0 | Fee Interest | 317,600 | 107,500 | 80.6 | N/A | ||||||||
| Aug-07 | 150 Grand Street | White Plains, New York | 100.0 | Fee Interest | 85,000 | 6,700 | 52.9 | N/A | ||||||||
| Sep-07 | The Meadows | Rutherford, New Jersey | 25.0 | Fee Interest | 582,100 | 111,500 | 81.3 | N/A | ||||||||
| Apr-13 | 16 Court Street | Brooklyn, New York | 49.0 | Fee Interest | 317,600 | 96,200 | 84.9 | N/A | ||||||||
| 6,198,100 | $ | 1,733,440 | ||||||||||||||
| ||||||||||||||||||||||
SUMMARY OF REAL ESTATE SALES ACTIVITY Suburban Unaudited (Dollars in Thousands) | ||||||||||||||||||||||
| ||||||||||||||||||||||
| Property | Submarket | Interest Sold | Type of Ownership | Net Rentable SF | Gross Asset Valuation ($'s) | Price ($'s/SF) | ||||||||||||||||
| 2008 - 2018 Sales | ||||||||||||||||||||||
| Oct-08 | 100 & 120 White Plains Road | Tarrytown, New York | 100.0% | Fee Interest | 211,000 | $ | 48,000 | $ | 227 | |||||||||||||
| Jan-09 | 55 Corporate Drive | Bridgewater, New Jersey | 100.0 | Fee Interest | 670,000 | 230,000 | 343 | |||||||||||||||
| Aug-09 | 399 Knollwood Road | White Plains, New York | 100.0 | Fee Interest | 145,000 | 20,767 | 143 | |||||||||||||||
| Jul-12 | One Court Square | Long Island City, New York | 100.0 | Fee Interest | 1,402,000 | 481,100 | 343 | |||||||||||||||
| Sep-13 | 300 Main Street | Stamford, Connecticut | 100.0 | Fee Interest | 130,000 | 13,500 | 104 | |||||||||||||||
| Aug-15 | The Meadows | Rutherford, New Jersey | 100.0 | Fee Interest | 582,100 | 121,100 | 208 | |||||||||||||||
| Dec-15 | 140 Grand Street | White Plains, New York | 100.0 | Fee Interest | 130,100 | 22,400 | 172 | |||||||||||||||
| Dec-15 | 150 Grand Street | White Plains, New York | 100.0 | Fee Interest | 85,000 | 9,600 | 113 | |||||||||||||||
| Mar-16 | 7 Renaissance Square | White Plains, New York | 100.0 | Fee Interest | 65,641 | 21,000 | 320 | |||||||||||||||
| Jul-16 | 500 West Putnam Avenue | Greenwich, Connecticut | 100.0 | Fee Interest | 121,500 | 41,000 | 337 | |||||||||||||||
| Apr-17 | 520 White Plains Road | Tarrytown, New York | 100.0 | Fee Interest | 180,000 | 21,000 | 117 | |||||||||||||||
| Jul-17 | 680 Washington Avenue | Stamford, Connecticut | 51.0 | Fee Interest | 133,000 | 42,011 | 316 | |||||||||||||||
| Jul-17 | 750 Washington Avenue | Stamford, Connecticut | 51.0 | Fee Interest | 192,000 | 53,745 | 280 | |||||||||||||||
| Oct-17 | 16 Court Street | Brooklyn, New York | 100.0 | Fee Interest | 317,600 | 171,000 | 538 | |||||||||||||||
| Oct-17 | 125 Chubb Way | Lyndhurst, New Jersey | 100.0 | Fee Interest | 278,000 | 29,500 | 106 | |||||||||||||||
| May-18 | 115-117 Stevens Avenue | Valhalla, New York | 100.0 | Fee Interest | 178,000 | 12,000 | 67 | |||||||||||||||
| Jun-18 | Jericho Plaza | Jericho, New York | 11.67 | Fee Interest | 640,000 | 117,400 | 183 | |||||||||||||||
| Jul-18 | 1-6 International Drive | Rye Brook, New York | 100.0 | Fee Interest | 540,000 | 55,000 | 102 | |||||||||||||||
| 6,000,941 | $ | 1,510,123 | $ | 252 | ||||||||||||||||||
| 2019 Sales | ||||||||||||||||||||||
| Nov-19 | 1010 Washington Boulevard | Stamford, Connecticut | 100.0% | Fee Interest | 143,400 | $ | 23,100 | $ | 161 | |||||||||||||
| Dec-19 | 100 Summit Lake Drive | Valhalla, New York | 100.0 | Fee Interest | 250,000 | 41,581 | 166 | |||||||||||||||
| Dec-19 | 200 Summit Lake Drive | Valhalla, New York | 100.0 | Fee Interest | 245,000 | 37,943 | 155 | |||||||||||||||
| Dec-19 | 500 Summit Lake Drive | Valhalla, New York | 100.0 | Fee Interest | 228,000 | 34,185 | 150 | |||||||||||||||
| Dec-19 | 360 Hamilton Avenue | White Plains, New York | 100.0 | Fee Interest | 384,000 | 115,452 | 301 | |||||||||||||||
| 1,250,400 | $ | 252,261 | $ | 202 | ||||||||||||||||||
| (1) Acquisition price represents purchase price for consolidated acquisitions and purchase price or imputed value for joint venture properties. | ||||||||||||||||||||||
| Supplemental Information | 40 | First Quarter 2020 |
| ||
SUMMARY OF REAL ESTATE ACQUISITION ACTIVITY Retail, Residential, and Development / Redevelopment Unaudited (Dollars in Thousands) | | |
| ||
| Gross Asset | Occupancy (%) | ||||||||||||||||
| Property | Submarket | Interest Acquired | Type of Ownership | Net Rentable SF | Valuation ($'s) (1) | at acquisition | 3/31/2020 | ||||||||||
| 2005 - 2018 Acquisitions | |||||||||||||||||
| Jul-05 | 1551-1555 Broadway | Times Square | 10.0% | Fee Interest | 25,600 | $ | 85,000 | N/A | N/A | ||||||||
| Jul-05 | 21 West 34th Street | Herald Square | 50.0 | Fee Interest | 30,100 | 17,500 | N/A | N/A | |||||||||
| Sep-05 | 141 Fifth Avenue | Flatiron | 50.0 | Fee Interest | 21,500 | 13,250 | N/A | N/A | |||||||||
| Nov-05 | 1604 Broadway | Times Square | 63.0 | Leasehold Interest | 29,876 | 4,400 | 17.2 | N/A | |||||||||
| Dec-05 | 379 West Broadway | Cast Iron/Soho | 45.0 | Leasehold Interest | 62,006 | 19,750 | 100.0 | N/A | |||||||||
| Jan-06 | 25-29 West 34th Street | Herald Square/Penn Station | 50.0 | Fee Interest | 41,000 | 30,000 | 55.8 | N/A | |||||||||
| Sep-06 | 717 Fifth Avenue | Midtown/Plaza District | 32.8 | Fee Interest | 119,550 | 251,900 | 63.1 | 100.0 | |||||||||
| Aug-07 | 180 Broadway | Lower Manhattan | 50.0 | Fee Interest | 24,300 | 13,600 | 85.2 | N/A | |||||||||
| Apr-07 | Two Herald Square | Herald Square | 55.0 | Fee Interest | N/A | 225,000 | N/A | N/A | |||||||||
| Jul-07 | 885 Third Avenue | Midtown / Plaza District | 55.0 | Fee Interest | N/A | 317,000 | N/A | N/A | |||||||||
| Jan-08 | 125 Chubb Way | Lyndhurst, New Jersey | 100.0 | Fee Interest | 278,000 | 29,364 | — | N/A | |||||||||
| Feb-08 | 182 Broadway | Lower Manhattan | 50.0 | Fee Interest | 46,280 | 30,000 | 83.8 | N/A | |||||||||
| Nov-10 | Williamsburg Terrace | Brooklyn, New York | 100.0 | Fee Interest | 52,000 | 18,000 | 100.0 | 100.0 | |||||||||
| Dec-10 | 11 West 34th Street | Herald Square/Penn Station | 30.0 | Fee Interest | 17,150 | 10,800 | 100.0 | 100.0 | |||||||||
| Dec-10 | 7 Renaissance Square | White Plains, New York | 50.0 | Fee Interest | 65,641 | 4,000 | — | N/A | |||||||||
| Dec-10 | 2 Herald Square (2) | Herald Square | 45.0 | Fee Interest | 354,400 | 247,500 | 100.0 | N/A | |||||||||
| Dec-10 | 885 Third Avenue (2) | Midtown / Plaza District | 45.0 | Fee Interest | 607,000 | 352,000 | 100.0 | N/A | |||||||||
| Dec-10 | 292 Madison Avenue | Grand Central South | 100.0 | Fee Interest | 203,800 | 78,300 | N/A | N/A | |||||||||
| Jan-11 | 3 Columbus Circle | Columbus Circle | 48.9 | Fee Interest | 741,500 | 500,000 | 20.1 | N/A | |||||||||
| Aug-11 | 1552-1560 Broadway | Times Square | 50.0 | Fee Interest | 35,897 | 136,550 | 59.7 | 88.3 | |||||||||
| Sep-11 | 747 Madison Avenue | Plaza District | 33.3 | Fee Interest | 10,000 | 66,250 | 100.0 | N/A | |||||||||
| Jan-12 | DFR Residential and Retail Portfolio | Plaza District, Upper East Side | 80.0 | Fee Interests / Leasehold Interest | 489,882 | 193,000 | 95.1 | 91.9 | |||||||||
| Jan-12 | 724 Fifth Avenue | Plaza District | 50.0 | Fee Interest | 65,010 | 223,000 | 92.9 | N/A | |||||||||
| Jul-12 | West Coast Office Portfolio | 27.6 | Fee Interest | 4,473,603 | 880,104 | 76.3 | N/A | ||||||||||
| Aug-12 | 33 Beekman Street | Downtown | 45.9 | Fee Interest | 163,500 | 31,160 | — | N/A | |||||||||
| Sep-12 | 635 Sixth Avenue | Midtown South | 100.0 | Fee Interest | 104,000 | 83,000 | — | 100.0 | |||||||||
| Oct-12 | 1080 Amsterdam | Upper West Side | 87.5 | Leasehold Interest | 82,250 | — | 2.2 | 97.9 | |||||||||
| Dec-12 | 21 East 66th Street | Plaza District | 32.3 | Fee Interest | 16,736 | 75,000 | 100.0 | 100.0 | |||||||||
| Dec-12 | 985-987 Third Avenue | Upper East Side | 100.0 | Fee Interest | 13,678 | 18,000 | — | N/A | |||||||||
| Dec-12 | 131-137 Spring Street | Soho | 100.0 | Fee Interest | 68,342 | 122,300 | 100.0 | N/A | |||||||||
| Mar-13 | 248-252 Bedford Avenue | Brooklyn, New York | 90.0 | Fee Interest | 66,611 | 54,900 | — | N/A | |||||||||
| Nov-13 | 650 Fifth Avenue | Plaza District | 50.0 | Leasehold Interest | 32,324 | — | 63.6 | 100.0 | |||||||||
| Nov-13 | 315 West 33rd Street - The Olivia | Penn Station | 100.0 | Fee Interest | 492,987 | 386,775 | 96.6 | N/A | |||||||||
| Nov-13 | 562, 570 & 574 Fifth Avenue | Plaza District | 100.0 | Fee Interest | 66,962 | 146,222 | 74.6 | N/A | |||||||||
| Jul-14 | 719 Seventh Avenue | Times Square | 75.0 | Fee Interest | 6,000 | 41,149 | 100.0 | 100.0 | |||||||||
| Jul-14 | 115 Spring Street | Soho | 100.0 | Fee Interest | 5,218 | 52,000 | 100.0 | 100.0 | |||||||||
| Jul-14 | 752-760 Madison Avenue | Plaza District | 100.0 | Fee Interest | 21,124 | 282,415 | 100.0 | 100.0 | |||||||||
| Sep-14 | 121 Greene Street | Soho | 50.0 | Fee Interest | 7,131 | 27,400 | 100.0 | 100.0 | |||||||||
| Sep-14 | 635 Madison Avenue (2) | Plaza District | 100.0 | Fee Interest | 176,530 | 145,000 | 100.0 | N/A | |||||||||
| Oct-14 | 102 Greene Street | Soho | 100.0 | Fee Interest | 9,200 | 32,250 | 100.0 | N/A | |||||||||
| Oct-14 | 175-225 Third Street | Brooklyn, New York | 95.0 | Fee Interest | — | 72,500 | — | N/A | |||||||||
| Nov-14 | 55 West 46th Street - Tower 46 | Midtown | 100.0 | Fee Interest | 347,000 | 295,000 | — | 91.9 | |||||||||
| Feb-15 | Stonehenge Portfolio | 100.0 | Fee Interest | 2,589,184 | 40,000 | 96.5 | 97.0 | ||||||||||
| Mar-15 | 1640 Flatbush Avenue | Brooklyn, New York | 100.0 | Fee Interest | 1,000 | 6,799 | 100.0 | N/A | |||||||||
| Jun-15 | Upper East Side Residential | Upper East Side Residential | 90.0 | Fee Interest | 27,000 | 50,074 | 96.4 | N/A | |||||||||
| Aug-15 | 187 Broadway & 5-7 Dey Street | Lower Manhattan | 100.0 | Fee Interest | 73,600 | 63,690 | 90.5 | — | |||||||||
| Mar-16 | 183 Broadway | Lower Manhattan | 100.0 | Fee Interest | 9,100 | 28,500 | 58.3 | — | |||||||||
| Apr-16 | 605 West 42nd Street - Sky | Midtown West | 20.0 | Fee Interest | 927,358 | 759,046 | — | 96.4 | |||||||||
| Jul-18 | 1231 Third Avenue | Upper East Side | 100.0 | Fee Interest | 38,992 | 55,355 | 100.0 | N/A | |||||||||
| Oct-18 | 133 Greene Street | Soho | 100.0 | Fee Interest | 6,425 | 30,999 | 100.0 | 100.0 | |||||||||
| Dec-18 | 712 Madison Avenue | Plaza District | 100.0 | Fee Interest | 6,600 | 57,996 | 100.0 | 100.0 | |||||||||
| 13,152,947 | $ | 6,703,798 | |||||||||||||||
| 2019 Acquisitions | |||||||||||||||||
| Apr-19 | 106 Spring Street | Soho | 100.0% | Fee Interest | 5,928 | $ | 80,150 | — | — | ||||||||
| May-19 | 410 Tenth Avenue | Hudson Yards | 70.9 | Fee Interest | 638,000 | 440,000 | 76.3 | 45.4 | |||||||||
| 643,928 | $ | 520,150 | |||||||||||||||
| 2020 Acquisitions | |||||||||||||||||
| Jan-20 | 762 Madison Avenue | Plaza District | 10.0% | Fee Interest | 6,109 | $ | 29,250 | 55.1 | 55.1 | ||||||||
| Jan-20 | 707 Eleventh Avenue | Midtown West | 100.0 | Fee Interest | 159,720 | 90,000 | 54.3 | 54.3 | |||||||||
| Jan-20 | 126 Nassau Street | Lower Manhattan | 100.0 | Leasehold Interest | 98,412 | — | 87.3 | 87.3 | |||||||||
| 264,241 | $ | 119,250 | |||||||||||||||
| (1) Acquisition price represents purchase price for consolidated acquisitions and purchase price or imputed value for joint venture properties. | |||||||||||||||||
| (2) Subject to long-term, third party net operating leases. | |||||||||||||||||
| Supplemental Information | 41 | First Quarter 2020 |
| ||
SUMMARY OF REAL ESTATE SALES ACTIVITY Retail, Residential, and Development / Redevelopment Unaudited (Dollars in Thousands) | | |
| ||
| Gross Asset Valuation | ||||||||||||||||||||||
| Property | Submarket | Interest Sold | Type of Ownership | Net Rentable SF | ($'s) | ($'s/SF) | ||||||||||||||||
| 2011 - 2015 Sales | ||||||||||||||||||||||
| Sep-11 | 1551-1555 Broadway | Times Square | 10.0% | Fee Interest | 25,600 | $ | 276,757 | $ | 10,811 | |||||||||||||
| Feb-12 | 141 Fifth Avenue (1) | Flatiron | 100.0 | Fee Interest | 13,000 | 46,000 | 3,538 | |||||||||||||||
| Feb-12 | 292 Madison Avenue | Grand Central South | 100.0 | Fee Interest | 203,800 | 85,000 | 417 | |||||||||||||||
| Apr-12 | 379 West Broadway | Lower Manhattan | 100.0 | Leasehold Interest | 62,006 | 48,500 | 782 | |||||||||||||||
| Jun-12 | 717 Fifth Avenue | Midtown/Plaza District | 50.0 | Fee Interest | 119,550 | 617,584 | 5,166 | |||||||||||||||
| Sep-12 | 3 Columbus Circle | Columbus Circle | 29.0 | Fee Interest | 214,372 | 143,600 | 670 | |||||||||||||||
| Feb-13 | 44 West 55th Street | Plaza District | 100.0 | Fee Interest | 8,557 | 6,250 | 730 | |||||||||||||||
| Jun-13 | West Coast Office Portfolio | Los Angeles, California | 100.0 | Fee Interest | 406,740 | 111,925 | 275 | |||||||||||||||
| Aug-13 | West Coast Office Portfolio | Fountain Valley, California | 100.0 | Fee Interest | 302,037 | 66,994 | 222 | |||||||||||||||
| Sep-13 | West Coast Office Portfolio | San Diego, California | 100.0 | Fee Interest | 110,511 | 45,400 | 411 | |||||||||||||||
| Dec-13 | 27-29 West 34th Street | Herald Square/Penn Station | 100.0 | Fee Interest | 15,600 | 70,052 | 4,491 | |||||||||||||||
| Jan-14 | 21-25 West 34th Street | Herald Square/Penn Station | 100.0 | Fee Interest | 30,100 | 114,948 | 3,819 | |||||||||||||||
| Mar-14 | West Coast Office Portfolio | 100.0 | Fee Interest | 3,654,315 | 756,000 | 207 | ||||||||||||||||
| May-14 | 747 Madison Avenue | Plaza District | 100.0 | Fee Interest | 10,000 | 160,000 | 16,000 | |||||||||||||||
| Jul-14 | 985-987 Third Avenue | Upper East Side | 100.0 | Fee Interest | 13,678 | 68,700 | 5,023 | |||||||||||||||
| Sep-14 | 180-182 Broadway | Lower Manhattan | 100.0 | Fee Interest | 156,086 | 222,500 | 1,425 | |||||||||||||||
| Nov-14 | 2 Herald Square | Herald Square/Penn Station | 100.0 | Fee Interest | 354,400 | 365,000 | 1,030 | |||||||||||||||
| Nov-14 | 55 West 46th Street - Tower 46 | Midtown | 75.0 | Fee Interest | 347,000 | 295,000 | 850 | |||||||||||||||
| Jan-15 | 180 Maiden Lane | Financial East | 100.0 | Fee Interest | 1,090,000 | 470,000 | 431 | |||||||||||||||
| Aug-15 | 131-137 Spring Street | Soho | 80.0 | Fee Interest | 68,342 | 277,750 | 4,064 | |||||||||||||||
| Dec-15 | 570 & 574 Fifth Avenue | Plaza District | 100.0 | Fee Interest | 24,327 | 125,400 | 5,155 | |||||||||||||||
| 7,230,021 | $ | 4,373,360 | $ | 605 | ||||||||||||||||||
| 2016 Sales | ||||||||||||||||||||||
| Feb-16 | 248-252 Bedford Avenue | Brooklyn, New York | 90.0% | Fee Interest | 66,611 | $ | 55,000 | $ | 826 | |||||||||||||
| Feb-16 | 885 Third Avenue | Midtown / Plaza District | 100.0 | Fee Interest | 607,000 | 453,000 | 746 | |||||||||||||||
| May-16 | 33 Beekman Street | Downtown | 100.0 | Fee Interest | 163,500 | 196,000 | 1,199 | |||||||||||||||
| Oct-16 | 400 East 57th Street | Upper East Side | 49.0 | Fee Interest | 290,482 | 170,000 | 585 | |||||||||||||||
| 1,127,593 | $ | 874,000 | $ | 775 | ||||||||||||||||||
| 2017 Sales | ||||||||||||||||||||||
| Apr-17 | 102 Greene Street | Soho | 90.0% | Fee Interest | 9,200 | $ | 43,500 | $ | 4,728 | |||||||||||||
| Sep-17 | 102 Greene Street | Soho | 10.0 | Fee Interest | 9,200 | 43,500 | 4,728 | |||||||||||||||
| 18,400 | $ | 87,000 | $ | 4,728 | ||||||||||||||||||
| 2018 Sales | ||||||||||||||||||||||
| Apr-18 | 175-225 Third Street | Brooklyn, New York | 95.0% | Fee Interest | — | $ | 115,000 | $ | — | |||||||||||||
| Jun-18 | 635 Madison Avenue | Plaza District | 100.0 | Fee Interest | 176,530 | 153,000 | 867 | |||||||||||||||
| Jul-18 | 724 Fifth Avenue | Plaza District | 50.0 | Fee Interest | 65,010 | 365,000 | 5,615 | |||||||||||||||
| Oct-18 | 72nd Street Assemblage & 1231 Third Avenue | Upper East Side | Various | Fee Interest | — | 143,800 | — | |||||||||||||||
| 241,540 | $ | 776,800 | $ | 3,216 | ||||||||||||||||||
| 2019 Sales | ||||||||||||||||||||||
| Jan-19 | 131-137 Spring Street | Soho | 20.0% | Fee Interest | 68,342 | $ | 216,000 | $ | 3,161 | |||||||||||||
| Aug-19 | 115 Spring Street | Soho | 49.0 | Fee Interest | 5,218 | 66,050 | 12,658 | |||||||||||||||
| Dec-19 | 562 Fifth Avenue | Plaza District | 100.0 | Fee Interest | 42,635 | 52,393 | 1,229 | |||||||||||||||
| Dec-19 | 1640 Flatbush Avenue | Brooklyn, New York | 100.0 | Fee Interest | 1,000 | 16,150 | 16,150 | |||||||||||||||
| 117,195 | $ | 350,593 | $ | 2,992 | ||||||||||||||||||
| 2020 Sales | ||||||||||||||||||||||
| Mar-20 | 315 West 33rd Street - The Olivia | Penn Station | 100.0% | Fee Interest | 492,987 | $ | 446,500 | $ | 906 | |||||||||||||
| 492.987 | $ | 446,500 | $ | 906 | ||||||||||||||||||
| (1) Inclusive of the fee position which was acquired simultaneously with the sale pursuant to an option. | ||||||||||||||||||||||
| Supplemental Information | 42 | First Quarter 2020 |
| ||
EXECUTIVE MANAGEMENT | | |
| ||
| Marc Holliday | Edward V. Piccinich |
| Chairman and Chief Executive Officer | Chief Operating Officer |
| Andrew Mathias | Neil H. Kessner |
| President | Executive Vice President, General |
| Counsel - Real Property | |
| Matthew J. DiLiberto | |
| Chief Financial Officer | David M. Schonbraun |
| Co-Chief Investment Officer | |
| Andrew S. Levine | |
| Chief Legal Officer | Isaac Zion |
| Co-Chief Investment Officer | |
| Steven M. Durels | |
| Executive Vice President, Director of | Maggie Hui |
| Leasing and Real Property | Chief Accounting Officer |
| Supplemental Information | 43 | First Quarter 2020 |
| ||
Non-GAAP Disclosures and Reconciliations Unaudited (Dollars in Thousands, except per share data) | | |
| ||
Funds Available for Distribution (FAD)
FAD is a non-GAAP financial measure that is calculated as FFO plus non-real estate depreciation, allowance for straight line credit loss, adjustment for straight line operating lease rent, non-cash deferred compensation, and a pro-rata adjustment for FAD from SLG’s unconsolidated JVs, less straight line rental income, free rent net of amortization, second cycle tenant improvement and leasing costs, and recurring building improvements.
FAD is not intended to represent cash flow for the period and is not indicative of cash flow provided by operating activities as determined in accordance with GAAP. FAD is presented solely as a supplemental disclosure with respect to liquidity because the Company believes it provides useful information regarding the Company’s ability to fund its dividends. Because all companies do not calculate FAD the same way, the presentation of FAD may not be comparable to similarly titled measures of other companies. FAD does not represent cash flow from operating, investing and finance activities in accordance with GAAP and should not be considered as an alternative to net income (determined in accordance with GAAP), as an indication of the Company’s financial performance, as an alternative to net cash flows from operating activities (determined in accordance with GAAP), or as a measure of the Company’s liquidity.
Earnings Before Interest, Taxes, Depreciation and Amortization (EBITDAre)
EBITDAre is a non-GAAP financial measure. The Company computes EBITDAre in accordance with standards established by the National Association of Real Estate Investment Trusts, or NAREIT, which may not be comparable to EBITDAre reported by other REITs that do not compute EBITDAre in accordance with the NAREIT definition, or that interpret the NAREIT definition differently than the Company does. The White Paper on EBITDAre approved by the Board of Governors of NAREIT in September 2017 defines EBITDAre as net income (loss) (computed in accordance with Generally Accepted Accounting Principles, or GAAP), plus interest expense, plus income tax expense, plus depreciation and amortization, plus (minus) losses and gains on the disposition of depreciated property, plus impairment write-downs of depreciated property and investments in unconsolidated joint ventures, plus adjustments to reflect the entity's share of EBITDAre of unconsolidated joint ventures.
The Company presents EBITDAre because the Company believes that EBITDAre, along with cash flow from operating activities, investing activities and financing activities, provides investors with an additional indicator of the Company’s ability to incur and service debt. EBITDAre should not be considered as an alternative to net income (determined in accordance with GAAP), as an indication of the Company’s financial performance, as an alternative to net cash flows from operating activities (determined in accordance with GAAP), or as a measure of the Company’s liquidity.
Net Operating Income (NOI) and Cash NOI
NOI is a non-GAAP financial measure that is calculated as operating income before transaction related costs, gains/losses on early extinguishment of debt, marketing general and administrative expenses and non-real estate revenue. Cash NOI is also a non-GAAP financial measure that is calculated by subtracting free rent (net of amortization), straight-line rent, and the amortization of acquired above and below-market leases from NOI, while adding operating lease straight-line adjustment and the allowance for straight-line tenant credit loss.
The Company presents NOI and Cash NOI because the Company believes that these measures, when taken together with the corresponding GAAP financial measures and our reconciliations, provide investors with meaningful information regarding the operating performance of properties. When operating performance is compared across multiple periods, the investor is provided with information not immediately apparent from net income that is determined in accordance with GAAP. NOI and Cash NOI provide information on trends in the revenue generated and expenses incurred in operating our properties, unaffected by the cost of leverage, straight-line adjustments, depreciation, amortization, and other net income components. The Company uses these metrics internally as performance measures. None of these measures is an alternative to net income (determined in accordance with GAAP) and same-store performance should not be considered an alternative to GAAP net income performance.
Coverage Ratios
The Company presents fixed charge and debt service coverage ratios to provide a measure of the Company’s financial flexibility to service current debt amortization, interest expense and operating lease rent from current cash net operating income. These coverage ratios represent a common measure of the Company’s ability to service fixed cash payments; however, these ratios are not used as an alternative to cash flow from operating, financing and investing activities (determined in accordance with GAAP).
| Supplemental Information | 44 | First Quarter 2020 |
| ||
Non-GAAP Disclosures and Reconciliations Unaudited (Dollars in Thousands, except per share data) | | |
| ||
RECONCILIATION OF NON-GAAP FINANCIAL MEASURES
Funds From Operations (FFO) Reconciliation
| Three Months Ended | |||||||
| March 31, | |||||||
| 2020 | 2019 | ||||||
| Net income (loss) attributable to SL Green common stockholders | $ | 114,801 | $ | 43,792 | |||
| Add: | |||||||
| Depreciation and amortization | 68,279 | 68,343 | |||||
| Joint venture depreciation and noncontrolling interest adjustments | 56,318 | 47,625 | |||||
| Net income (loss) attributable to noncontrolling interests | 5,909 | 2,515 | |||||
| Less: | |||||||
| Loss on sale of real estate, net | 72,636 | (1,049 | ) | ||||
| Equity in net gain on sale of interest in unconsolidated joint venture/real estate | — | 17,166 | |||||
| Purchase price and other fair value adjustment | — | (2,041 | ) | ||||
| Depreciation on non-rental real estate assets | 650 | 707 | |||||
| FFO attributable to SL Green common stockholders and noncontrolling interests | $ | 172,021 | $ | 147,492 | |||
Earnings Before Interest, Taxes, Depreciation and Amortization for Real Estate (EBITDAre)
| As of or for the three months ended | |||||||||||||||||||
| 3/31/2020 | 12/31/2019 | 9/30/2019 | 6/30/2019 | 3/31/2019 | |||||||||||||||
| Net income (loss) | $ | 127,114 | 24,255 | 40,722 | $ | 173,741 | $ | 52,769 | |||||||||||
| Interest expense, net of interest income | 37,494 | 44,724 | 48,112 | 47,160 | 50,525 | ||||||||||||||
| Amortization of deferred financing costs | 2,500 | 3,087 | 3,112 | 2,712 | 2,742 | ||||||||||||||
| Income taxes | 1,134 | 1,027 | (995 | ) | 680 | 770 | |||||||||||||
| Depreciation and amortization | 68,279 | 64,090 | 70,464 | 69,461 | 68,343 | ||||||||||||||
| Loss (gain) on sale of real estate | (72,636 | ) | 19,241 | (3,541 | ) | — | 1,049 | ||||||||||||
| Equity in net gain on sale of interest in unconsolidated joint venture/real estate | — | — | — | (59,015 | ) | (17,166 | ) | ||||||||||||
| Purchase price and other fair value adjustments | — | — | (3,799 | ) | (67,631 | ) | 2,041 | ||||||||||||
| Depreciable real estate reserves | — | — | 7,047 | — | — | ||||||||||||||
| Adjustments to reflect the entity’s share of EBITDAre of unconsolidated affiliates | 88,724 | 85,733 | 86,743 | 88,159 | 89,160 | ||||||||||||||
| EBITDAre | $ | 252,609 | $ | 242,157 | $ | 247,865 | $ | 255,267 | $ | 250,233 | |||||||||
| Supplemental Information | 45 | First Quarter 2020 |
| ||
Non-GAAP Disclosures and Reconciliations Unaudited (Dollars in Thousands, except per share data) | | |
| ||
RECONCILIATION OF NON-GAAP FINANCIAL MEASURES - Operating income and Same-store NOI Reconciliation
| Three Months Ended | |||||||
| March 31, | |||||||
| 2020 | 2019 | ||||||
| Net income (loss) | $ | 127,114 | $ | 52,769 | |||
| Equity in net gain on sale of interest in unconsolidated joint venture/real estate | — | (17,166 | ) | ||||
| Purchase price and other fair value adjustments | — | 2,041 | |||||
| Loss on sale of real estate, net | (72,636 | ) | 1,049 | ||||
| Depreciable real estate reserves | — | — | |||||
| Depreciation and amortization | 68,279 | 68,343 | |||||
| Interest expense, net of interest income | 37,494 | 50,525 | |||||
| Amortization of deferred financing costs | 2,500 | 2,742 | |||||
| Operating income | 162,751 | 160,303 | |||||
| Equity in net loss (income) from unconsolidated joint ventures | 12,814 | 5,234 | |||||
| Marketing, general and administrative expense | 19,570 | 25,979 | |||||
| Transaction related costs, net | 65 | 55 | |||||
| Investment income | (38,533 | ) | (50,031 | ) | |||
| Loan loss and other investment reserves, net of recoveries | 11,248 | — | |||||
| Non-building revenue | (3,790 | ) | (9,144 | ) | |||
| Loss on early extinguishment of debt | — | — | |||||
| Net operating income (NOI) | 164,125 | 132,396 | |||||
| Equity in net (loss) income from unconsolidated joint ventures | (12,814 | ) | (5,234 | ) | |||
| SLG share of unconsolidated JV depreciation and amortization | 45,874 | 48,128 | |||||
| SLG share of unconsolidated JV interest expense, net of interest income | 35,777 | 39,407 | |||||
| SLG share of unconsolidated JV amortization of deferred financing costs | 1,687 | 1,568 | |||||
| SLG share of unconsolidated JV loss on early extinguishment of debt | — | — | |||||
| SLG share of unconsolidated JV investment income | (307 | ) | (2,227 | ) | |||
| SLG share of unconsolidated JV non-building revenue | (1,599 | ) | (711 | ) | |||
| NOI including SLG share of unconsolidated JVs | 232,743 | 213,327 | |||||
| NOI from other properties/affiliates | (54,596 | ) | (33,147 | ) | |||
| Same-Store NOI | 178,147 | 180,180 | |||||
| Operating lease straight-line adjustment | 429 | 514 | |||||
| Joint Venture operating lease straight-line adjustment | 342 | 393 | |||||
| Straight-line and free rent | (1,672 | ) | (4,758 | ) | |||
| Amortization of acquired above and below-market leases, net | (2,376 | ) | (1,237 | ) | |||
| Joint Venture straight-line and free rent | (5,802 | ) | (16,595 | ) | |||
| Joint Venture amortization of acquired above and below-market leases, net | (3,827 | ) | (4,262 | ) | |||
| Same-store cash NOI | $ | 165,241 | $ | 154,235 | |||
| Supplemental Information | 46 | First Quarter 2020 |
| ||
SELL-SIDE ANALYST COVERAGE | | |
| ||
| EQUITY COVERAGE | |||
| Firm | Analyst | Phone | |
| Bank of America - Merrill Lynch | James C. Feldman | (646) 855-5808 | james.feldman@baml.com |
| BMO Capital Markets Corp. | John P. Kim | (212) 885-4115 | jp.kim@bmo.com |
| BTIG | James Sullivan | (212) 738-6139 | jsullivan@btig.com |
| Citigroup | Michael Bilerman | (212) 816-1383 | michael.bilerman@citigroup.com |
| Deutsche Bank | Derek Johnston | (904) 520-4973 | derek.johnston@db.com |
| Goldman Sachs & Co. | Richard Skidmore | (801) 741-5459 | richard.skidmore@gs.com |
| Green Street Advisors | Daniel Ismail | (949) 640-8780 | dismail@greenstreetadvisors.com |
| Evercore ISI | Steve Sakwa | (212) 446-9462 | ssakwa@isigrp.com |
| Jefferies & Company | Jonathan Peterson | (212) 284-2300 | jpeterson@jefferies.com |
| JP Morgan Securities, Inc. | Anthony Paolone | (212) 622-6682 | anthony.paolone@jpmorgan.com |
| KeyBanc Capital Markets | Craig Mailman | (917) 368-2316 | cmailman@key.com |
| Morgan Stanley | Vikram Malhotra | (212) 761-7064 | vikram.malhotra@morganstanley.com |
| RW Baird | David Rodgers | (216) 737-7341 | drodgers@rwbaird.com |
| Sandler O'Neill + Partners, L.P. | Alexander D. Goldfarb | (212) 466-7937 | agoldfarb@sandleroneill.com |
| Scotiabank | Nick Yulico | (212) 225 6904 | nicholas.yulico@scotiabank.com |
| Stifel Nicolaus | John Guinee | (443) 224-1307 | jwguinee@stifel.com |
| SunTrust Robinson Humphrey | Michael Lewis | (404) 926-5000 | michael.lewis@suntrust.com |
| Wells Fargo Securities, LLC | Blaine Heck | (443) 263-6529 | blaine.heck@wellsfargo.com |
| FIXED INCOME COVERAGE | |||
| Firm | Analyst | Phone | |
| JP Morgan Securities, Inc. | Mark Streeter | (212) 834-6601 | mark.streeter@jpmorgan.com |
| Wells Fargo Securities, LLC | Thierry B. Perrein | (704) 715-8455 | thierry.perrein@wellsfargo.com |
| SL Green Realty Corp. is followed by the analysts listed above. Please note that any opinions, estimates or forecasts regarding SL Green Realty Corp.'s performance made by these analysts are theirs alone and do not represent opinions, forecasts or predictions of SL Green Realty Corp. or its management. SL Green Realty Corp. does not by its reference above or distribution imply its endorsement of or concurrence with such information, conclusions or recommendations. | ||||
| Supplemental Information | 47 | First Quarter 2020 |