Exhibit 99.2

SL Green Realty Corp. is a fully integrated, self-administered and self-managed Real Estate Investment Trust (REIT) that primarily owns, manages, leases, acquires and repositions office properties in emerging, high-growth submarkets of Manhattan.
• SL Green’s common stock and Preferred Income Equity Redeemable Shares (“PIERS” SM), are listed on the New York Stock Exchange, and trade under the symbols: SLG and SLG PrA respectively.
• SL Green maintains an internet site at www.slgreen.com at which most key investor relations data pertaining to dividend declaration, payout, current and historic share price, etc. can be found. Such information is not reiterated in this supplemental financial package. This supplemental financial package is available through the Company’s Internet site.
• This data is presented to supplement audited and unaudited regulatory filings of the Company and should be read in conjunction with those filings. The financial data herein is unaudited and is provided from the prospective of timeliness to assist readers of quarterly and annual financial filings. As such, data otherwise contained in future regulatory filings covering the same period may be restated from the data presented herein.
Questions pertaining to the information contained herein should be referred to Michael W. Reid or Thomas E. Wirth at michael.reid@slgreen.com or tom.wirth@slgreen.com or at 212-594-2700.
This report includes certain statements that may be deemed to be “forward-looking statements” within the meaning of Section 27A of the Securities Act of 1933, as amended, and Section 21E of the Securities Exchange Act of 1934, as amended. All statements, other than statements of historical facts, included in this report that address activities, events or developments that the Company expects, believes or anticipates will or may occur in the future, including such matters as future capital expenditures, dividends and acquisitions (including the amount and nature thereof), expansion and other development trends of the real estate industry, business strategies, expansion and growth of the Company’s operations and other such matters are forward-looking statements. These statements are based on certain assumptions and analyses made by the Company in light of its experience and its perception of historical trends, current conditions, expected future developments and other factors it believes are appropriate. Such statements are subject to a number of assumptions, risks and uncertainties, general economic and business conditions, the business opportunities that may be presented to and pursued by the Company, changes in laws or regulations and other factors, many of which are beyond the control of the Company. Any such statements are not guarantees of future performance and actual results or developments may differ materially from those anticipated in the forward-looking statements.
The following discussion related to the consolidated financial statements of the Company should be read in conjunction with the financial statements for the three months ended March 31, 2003 that will subsequently be released on Form 10-Q to be filed on or before May 15, 2003.
2
TABLE OF CONTENTS
3
CORPORATE PROFILE
SL Green Realty Corp. (the “Company”) was formed on August 20, 1997 to continue the commercial real estate business of S.L. Green Properties Inc. founded in 1980 by Stephen L. Green, our current Chairman and Chief Executive Officer. For more than 20 years SL Green has been engaged in the business of owning, managing, leasing, acquiring and repositioning office properties in Manhattan. The Company’s investment focus is to create value through the acquisition, redevelopment and repositioning of Manhattan office properties and releasing and managing these properties for maximum cash flow.
Looking forward, SL Green Realty Corp. will continue its opportunistic investment philosophy through three established business lines: investment in long term core properties, investment in opportunistic assets and structured finance investments. This three-legged investment strategy will allow SL Green to balance the components of its portfolio to take advantage of each stage in the business cycle.
Today, the Company is the only fully integrated, self-managed, self-administered Real Estate Investment Trust (REIT) exclusively focused on owning and operating office buildings in Manhattan. SL Green is a pure play for investors to own a piece of New York.
4
FINANCIAL HIGHLIGHTS
FIRST QUARTER 2003
UNAUDITED
FINANCIAL RESULTS
Funds From Operations (FFO) before minority interest for the first quarter 2003 totaled $30.2 million, or $0.85 per share (diluted), a 9% increase compared to the same quarter in 2002 when FFO totaled $27.0 million, or $0.78 per share (diluted).
Net income available for common shareholders for the first quarter 2003 totaled $33.9 million, or $1.01 per share (diluted), an increase of 102% as compared to the same quarter in 2002 when net income totaled $15.2 million, or $0.50 per share (diluted). The 2003 results include $0.50 per share gain on sale of 50 West 23rd Street, which had been previously classified as a discontinued operation. Excluding the gain, net income would have totaled $16.1 million, or $0.51 per share, a 2% increase over the prior year.
Funds available for distribution (FAD) for the first quarter 2003 increased to $0.68 per share (diluted) versus $0.62 per share (diluted) in the prior year, a 10% increase.
The Company’s dividend payout ratio was 54.3% of FFO and 67.6% of FAD before first cycle leasing costs.
CONSOLIDATED RESULTS
Total quarterly revenues increased 16% in the first quarter to $68.7 million compared to $59.4 million last year. The $9.3 million growth in revenue resulted from the following items:
• $5.1 million increase from 2003 acquisitions
• $3.3 million increase from the 2003 same-store portfolio
• $0.7 million increase in other income
• $0.5 million increase in non-same-store revenue
• $0.7 million decrease in preferred equity and investment income
The Company’s EBITDA increased $3.4 million to $39.3 million, however margins before ground rent decreased to 68.5% compared to 74.0% for the same period last year. The decrease in margins is due to increased operating costs, primarily insurance and seasonal fuel and steam costs that have low recovery rates. After ground rent, margins decreased in 2003 to 63.4% from 68.0% in the corresponding period 2002. The following items drove EBITDA improvements:
(1) Consolidated GAAP NOI increased $3.6 million:
• $3.0 million increase from 2003 property acquisitions of 220 East 42nd Street (February 2003) and 125 Broad Street (March 2003).
• $0.8 million increase from the equity in income from unconsolidated joint ventures (primarily due to the acquisition of 1515 Broadway (May 2002)).
• $0.4 million increase from non same-store property results, inclusive of 50 West 23rd Street and Shelton, Connecticut properties.
5
• $0.9 million decrease from the 2003 same-store properties mainly due to $4.4 million of increased operating costs resulting from (i) increased real estate taxes ($2.1 million) due to higher assessed values and tax rates, (ii) increased insurance costs ($0.7 million) due to higher premiums on the annual policy which commenced October 2002, and (iii) increased fuel and steam expense due to higher oil prices and colder winter temperatures through 2003 ($1.0 million).
The increased operating costs were partially offset by a $3.5 million increase in GAAP revenues from (i) rental revenue increases of $1.9 million as GAAP replacement rents were 31% higher than previous fully-escalated rents, (ii) higher reimbursement revenues ($1.0 million) largely due to higher real estate tax escalation income ($1.2 million) partially off-set by a reduction in other escalations, and (iii) $0.6 million increase from higher weighted-average occupancy in 2003 (96.8%) compared to 2002 (96.5%).
(2) $0.7 million decrease in investment and preferred equity income primarily due to an decrease in the weighted-average asset balance from $188.6 million to $125.2 million. The weighted average yield decreased from 12.63% to 12.38% due mainly to lower LIBOR.
(3) $0.7 million increase in other income primarily due to asset management fees earned on joint ventures ($0.4 million) and a gain on sale of mortgage recording tax credits ($0.3 million).
FFO improved $3.2 million primarily as a result of:
• $3.4 million increase in EBITDA.
• $1.5 million increase in FFO adjustment from unconsolidated joint ventures.
• $1.2 million decrease from higher interest expense.
• $0.5 million decrease from increase amortization of finance costs from the early refinancing of the Company’s unsecured revolving line of credit.
The $1.2 million increase in interest expense was primarily due to higher average debt levels associated with new investment activity ($1.6 million) and the funding of ongoing capital projects and working capital requirements ($0.1 million). These increases were partially offset by reduced loan balances due to previous disposition activity ($0.5 million) and lower interest rates ($0.1 million).
SAME-STORE RESULTS
Same-store cash NOI decreased $0.2 million to $27.7 million in 2003 due to a $4.4 million increase in operating costs, partially offset by a $4.3 million increase in cash revenue. Cash operating margins before ground rent decreased from 57.7% to 53.8%.
6
GAAP NOI decreased by $1.0 million over the prior year, and GAAP operating margins before ground rent decreased from 62.3% to 57.0%.
The $4.4 million increase in same-store operating expenses resulted from:
1. $2.1 million (30%) increase in real estate taxes due to higher property value assessments and an increase to the tax rate.
2. $1.0 million (110%) increase in steam and heating fuel costs primarily due to the colder temperatures and higher oil prices.
3. $0.7 million (267%) increase in insurance costs due to higher premiums from the Company’s insurance policy that was renewed in October 2002.
4. $0.2 million (5%) increase in repairs, maintenance and cleaning expenses (inserted bullet from press release)
5. $0.3 million (33%) increase in management, professional and advertising costs.
The $4.3 million increase in cash revenue was due to:
1. $2.5 million increase in cash rental revenue due to (i) a $1.7 million increase resulting from higher replacement rents including early renewals on approximately 59,000 rentable square feet that were 26% greater than previously fully escalated rents and (ii) $0.8 million from increased cash revenue from rent-steps and reduced free rent.
2. $1.0 million increase in escalation and reimbursement income due to the higher escalation revenue from real estate taxes.
3. $0.6 million from higher weighted-average occupancy in 2003 (96.8%) compared to 2002 (96.5%).
The electric recovery rate for the quarter was approximately 93%.
QUARTERLY LEASING HIGHLIGHTS
Vacancy at December 31, 2002 was 358,910 useable square feet net of holdover tenants. During the quarter, the Company sold 50 West 23rd Street, reducing vacancy by 9,467 useable square feet and acquired 220 East 42nd Street and 125 Broad Street, increasing vacancy by 97,309 useable square feet. During the quarter, 368,221 additional useable office square feet became available at an average escalated cash rent of $40.71 per rentable square foot. Space available before holdovers to lease during the quarter totaled 814,961 useable square feet, or 6.3% of the total portfolio.
7
During the first quarter, 55 leases were signed totaling 215,195 useable square feet. New cash rents averaged $37.65 per rentable square foot. Replacement rents were 3.5% greater than rents on previously occupied space, which had fully escalated cash rents averaging $36.39 per rentable square foot. The average lease term was 6.8 years and average tenant concessions were 4.0 months of free rent with an allowance of $20.96 per rentable square foot. Including early renewals and excluding holdover tenants, the tenant renewal rate was 13.1% based on square feet expiring. The renewal rate increases to 38% inclusive of the sub-tenants at One Park Avenue that became direct tenants. Seventeen leases have expired comprising 24,313 useable square feet that are in a holdover status. This results in 575,453 useable square feet (net of holdovers) remaining available as of March 31, 2003.
The overall average lease term on the quarterly leasing activity was 6.2 years.
The Company signed 5 office leases for 28,811 useable square feet that were for early renewals. The early renewals for space were not scheduled to become available until after the first quarter of 2004. The Company was able to renew current office tenants at an average cash rent of $29.70 per rentable square foot, representing an increase of 15.7% over the previously fully escalated rents of $25.67. The average lease term on the office early renewals was 4.4 years.
PROPERTY ACTIVITY
220 East 42nd Street
In February 2003, the Company completed the previously announced acquisition of the 1.1 million square foot office property located at 220 East 42nd Street known as The News Building, a property located in the Grand Central and United Nations marketplace, for a purchase price of $265.0 million. Prior to the acquisition, the Company held a $53.5 million preferred equity investment in the property which was paid in full at closing. In connection with the redemption of the Company’s preferred equity investment, the Company earned a premium totaling $4.4 million that is being accounted for as a reduction in basis adjusting the effective purchase price to $260.6 million. In connection with this acquisition, the Company assumed a $158.0 million mortgage, which matures in September 2004 and bears interest at LIBOR plus 1.76%, and issued approximately 376,000 units of limited partnership interest in the SL Green Operating Partnership, having an aggregate value of approximately $11.3 million. In addition, the Company’s $53.5 million preferred equity investment in The News Building was redeemed in full. The remaining $42.2 million of the purchase price was funded from borrowings under the Company’s unsecured credit facility. This included the repayment of a $28.5 million mezzanine loan on the property.
8
125 Broad Street
In March 2003, the Company acquired condominium interests in 125 Broad Street for approximately $92.0 million. The Company assumed the $76.6 million first mortgage currently encumbering this property. The mortgage matures in October 2007 and bears interest at 8.29%. In addition, the Company issued 52,000 units of limited partnership interests in the SL Green Operating Partnership, having an aggregate value of approximately $1.6 million. The property is encumbered by a ground lease that expires in 2067 that the company can acquire in the future at a fixed price.
50 West 23rd Street
In March 2003 the Company sold 50 West 23rd Street for $66.0 million or approximately $198 per square foot. The Company acquired the building at the time of its IPO in August of 1997, at a purchase price of approximately $36.6 million. Since that time the building was upgraded and repositioned, enabling the Company to realize a gain of approximately $19.2 million. The proceeds of the sale were used to pay off an existing $21.0 million first mortgage and substantially all of the balance was reinvested into the acquisitions of 220 East 42nd Street (The News Building) and 125 Broad Street to effectuate a partial 1031 tax-free exchange.
OTHER ACTIVITY
Structured Finance Activity
During January 2003, the Company originated a $15.0 million structured finance investment with an initial yield of 12.5%. Also in January 2003, the Company originated an $8.0 million preferred equity investment with an initial yield of 12.0%.
As of March 31, 2003 the par value of the Company’s structured finance and preferred equity investments totaled $114.5 million. The weighted balance outstanding over the quarter was $125.2 million. During the first quarter 2003 the weighted average yield was 12.4%. The quarter end run rate was 12.8%.
673 First Avenue Mortgage
In February 2003 the Company completed a $35.0 million first mortgage financing of the property located at 673 First Avenue. The mortgage bears interest at 5.67% and matures in February 2013. The proceeds were used to pay down the outstanding balance on the Company’s unsecured line of credit.
Line of Credit Renewal
In March 2003, the Company renewed its $300.0 million unsecured revolving credit facility with a group of 13 banks led by Fleet National Bank. The Company has an option to
9
increase the capacity under this credit facility to $375.0 million. The unsecured revolving credit facility has a term of three years and bears interest at a spread ranging from 130 basis points to 170 basis points over LIBOR, based on the Company’s leverage ratio. As of the refinancing date, the Company’s current borrowing rate decreased from 150 basis points over LIBOR to 140 basis points over LIBOR.
COMMON AND PREFERRED DIVIDENDS
On March 15, 2003 the Company declared a dividend of $0.465 per common share for the quarter ended March 31, 2003. This dividend reflects the regular quarterly dividend, which is the equivalent of an annualized dividend of $1.86 per common share.
The Company also declared a dividend of $0.50 per share of Preferred Income Equity Redeemable Stock for shareholders of record as of March 31, 2003. Both dividends were paid on April 15, 2003.
OTHER
Annually, the Company adjusts the same-store pool to include all properties owned for a minimum of twelve months (since January 1, 2002). The 2003 same-store pool includes the following wholly-owned properties:
2003 SAME-STORE
673 First Avenue | | 1140 Avenue of the Americas | | 420 Lexington Avenue |
470 Park Avenue South | | 1466 Broadway | | 70 West 36th Street |
555 West 57th Street | | 440 Ninth Avenue | | 1414 Avenue of the Americas |
711 Third Avenue | | 1372 Broadway | | 292 Madison Avenue |
286 Madison Avenue | | 290 Madison Avenue | | 17 Battery Place North |
1370 Broadway | | 110 East 42nd Street | | 317 Madison Avenue |
10
FINANCIAL HIGHLIGHTS
First Quarter
Unaudited
| | March 31, | |
| | 2003 | | 2002 | |
Operational Information | |
Total Revenues ($000's) | | $ | 68,683 | | $ | 59,372 | |
| | | | | |
Funds from Operations | | | | | |
FFO per share- diluted | | $ | 0.85 | | $ | 0.78 | |
FFO Payout | | 54.29 | % | 56.82 | % |
| | | | | |
Funds Available for Distribution | | | | | |
FAD per share- diluted | | $ | 0.68 | | $ | 0.62 | |
FAD Payout | | 67.63 | % | 71.84 | % |
| | | | | |
Net Income from Continuing Operations - Diluted | | $ | 0.49 | | $ | 0.48 | |
Net Income to Common Shareholders - Diluted | | $ | 1.01 | | $ | 0.50 | |
| | | | | |
Dividends per share | | $ | 0.465 | | $ | 0.443 | |
| | | | | |
Weighted Average Shares Outstanding - Diluted | | 38,182 | | 32,905 | |
| | | | | |
Same-Store Cash NOI | | $ | 27,682 | | $ | 27,920 | |
| | | | | |
Equity Capitalization Data | | $ | 1,018,972 | | $ | 1,085,745 | |
Total Assets | | $ | 1,755,819 | | $ | 1,367,985 | |
| | | | | |
Total Consolidated Debt | | $ | 787,290 | | $ | 460,186 | |
Minority Interest | | $ | 55,309 | | $ | 47,295 | |
Preferred Stock | | $ | 111,852 | | $ | 111,353 | |
| | | | | |
Quarter End Closing Price - SLG Common Stock | | $ | 30.56 | | $ | 33.60 | |
Total Market Capitalization | | $ | 2,317,455 | | $ | 1,920,995 | |
| | | | | |
Ratios | |
Consolidated Debt to Total Market Capitalization | | 40.98 | % | 29.20 | % |
Combined Debt Allocated | | 51.07 | % | 37.49 | % |
| | | | | |
Consolidated Fixed Charge | | 2.64 | | 2.47 | |
Combined Fixed Charge | | 2.41 | | 2.29 | |
| | | | | |
Portfolio | |
Total Buildings | | | | | |
Directly Owned | | 20 | | 19 | |
Joint Ventures | | 6 | | 6 | |
| | 26 | | 25 | |
| | | | | |
Total SF | | 12,860,000 | | 10,036,000 | |
End of Quarter Occupancy - Total | | 95.5 | % | 97.0 | % |
End of Quarter Occupancy - 2003 Same Store | | 96.8 | % | 96.5 | % |
11
COMPARATIVE BALANCE SHEETS
Unaudited
(000's omitted)
| | 3/31/2003 | | 3/31/2002 | | +/- | | 12/31/2002 | | +/- | | 9/30/2002 | | +/- | |
Assets | |
Commercial real estate properties, at cost: | | | | | | | | | | | | | | | |
Land & land interests | | 182,510 | | 138,337 | | 44,173 | | 131,078 | | 51,432 | | 131,078 | | 51,432 | |
Buildings & improvements fee interest | | 981,971 | | 699,610 | | 282,361 | | 683,165 | | 298,806 | | 675,499 | | 306,472 | |
Buildings & improvements leasehold | | 150,375 | | 145,012 | | 5,363 | | 149,326 | | 1,049 | | 147,911 | | 2,464 | |
Buildings & improvements under capital lease | | 12,208 | | 12,208 | | - | | 12,208 | | - | | 12,208 | | - | |
| | 1,327,064 | | 995,167 | | 331,897 | | 975,777 | | 351,287 | | 966,696 | | 360,368 | |
Less accumulated depreciation | | (130,675 | ) | (108,034 | ) | (22,641 | ) | (126,669 | ) | (4,006 | ) | (119,056 | ) | (11,619 | ) |
| | 1,196,389 | | 887,133 | | 309,256 | | 849,108 | | 347,281 | | 847,640 | | 348,749 | |
Other Real Estate Investments: | | | | | | | | | | | | | | | |
Investment in unconsolidated joint ventures | | 213,802 | | 124,958 | | 88,844 | | 214,644 | | (842 | ) | 217,108 | | (3,306 | ) |
Mortgage loans receivable | | 93,145 | | 127,669 | | (34,524 | ) | 78,245 | | 14,900 | | 127,293 | | (34,148 | ) |
Preferred equity investments | | 21,351 | | 61,451 | | (40,100 | ) | 67,395 | | (46,044 | ) | 67,416 | | (46,065 | ) |
| | | | | | | | | | - | | | | | |
Assets held for sale | | 16,226 | | - | | 16,226 | | 41,536 | | (25,310 | ) | 41,185 | | (24,959 | ) |
Cash and cash equivalents | | 24,619 | | 12,429 | | 12,190 | | 58,020 | | (33,401 | ) | 13,450 | | 11,169 | |
Restricted cash: | | | | | | | | | | | | | | | |
Tenant security | | 20,709 | | 18,714 | | 1,995 | | 20,656 | | 53 | | 19,115 | | 1,594 | |
Escrows & other | | 38,326 | | 18,412 | | 19,914 | | 8,426 | | 29,900 | | 13,423 | | 24,903 | |
Tenant and other receivables, net of $6,089 reserve at 3/31/03 | | 8,921 | | 7,754 | | 1,167 | | 6,587 | | 2,334 | | 8,066 | | 855 | |
Related party receivables | | 5,213 | | 3,417 | | 1,796 | | 4,868 | | 345 | | 4,832 | | 381 | |
Deferred rents receivable, net of reserve for tenant credit loss of $6,915 at 3/31/03 | | 57,223 | | 53,816 | | 3,407 | | 55,731 | | 1,492 | | 54,992 | | 2,231 | |
Investment in and advances to affiliates | | 3,733 | | 2,811 | | 922 | | 3,979 | | (246 | ) | 3,146 | | 587 | |
Deferred costs, net | | 37,251 | | 34,416 | | 2,835 | | 35,511 | | 1,740 | | 34,957 | | 2,294 | |
Other assets | | 18,911 | | 15,005 | | 3,906 | | 28,464 | | (9,553 | ) | 14,569 | | 4,342 | |
| | | | | | | | | | | | | | | |
Total Assets | | 1,755,819 | | 1,367,985 | | 387,834 | | 1,473,170 | | 282,649 | | 1,467,192 | | 288,627 | |
12
COMPARATIVE BALANCE SHEETS
Unaudited
(000's omitted)
| | 3/31/2003 | | 3/31/2002 | | +/- | | 12/31/2002 | | +/- | | 9/30/2002 | | +/- | |
Liabilities and Stockholders’ Equity | |
Mortgage notes payable | | 621,469 | | 408,186 | | 213,283 | | 367,503 | | 253,966 | | 374,800 | | 246,669 | |
Unsecured term loan | | 100,000 | | - | | 100,000 | | 100,000 | | - | | - | | 100,000 | |
Revolving credit facilities | | 51,000 | | 86,931 | | (35,931 | ) | 74,000 | | (23,000 | ) | 173,931 | | (122,931 | ) |
Derivative Instruments-fair value | | 11,553 | | 2,002 | | 9,551 | | 10,962 | | 591 | | 8,540 | | 3,013 | |
Accrued interest payable | | 2,917 | | 1,617 | | 1,300 | | 1,806 | | 1,111 | | 1,945 | | 972 | |
Accounts payable and accrued expenses | | 36,906 | | 24,386 | | 12,520 | | 41,197 | | (4,291 | ) | 33,935 | | 2,971 | |
Deferred compensation awards | | - | | 671 | | (671 | ) | 1,329 | | (1,329 | ) | 671 | | (671 | ) |
Deferred revenue | | 27,337 | | 1,676 | | 25,661 | | 3,096 | | 24,241 | | 3,777 | | 23,560 | |
Capitalized lease obligations | | 15,937 | | 15,644 | | 293 | | 15,862 | | 75 | | 15,895 | | 42 | |
Deferred land lease payable | | 14,786 | | 14,246 | | 540 | | 14,626 | | 160 | | 14,466 | | 320 | |
Dividend and distributions payable | | 17,859 | | 16,596 | | 1,263 | | 17,436 | | 423 | | 16,693 | | 1,166 | |
Liabilities related to assets held for sale | | 14,821 | | - | | 14,821 | | 21,321 | | (6,500 | ) | 21,414 | | (6,593 | ) |
Security deposits | | 20,928 | | 19,019 | | 1,909 | | 20,948 | | (20 | ) | 19,420 | | 1,508 | |
Total Liabilities | | 935,513 | | 590,974 | | 344,539 | | 690,086 | | 245,427 | | 685,487 | | 250,026 | |
| | | | | | | | | | | | | | | |
Minority interest (2,404 units outstanding) at 3/31/03 | | 55,309 | | 47,295 | | 8,014 | | 44,718 | | 10,591 | | 44,941 | | 10,368 | |
| | | | | | | | | | | | | | | |
8% Preferred Income Equity Redeemable Shares $0.01 par value, $25.00 mandatory liquidation preference, 4,600 outstanding | | 111,852 | | 111,353 | | 499 | | 111,721 | | 131 | | 111,599 | | 253 | |
| | | | | | | | | | | | | | | |
Stockholders’ Equity | |
Common stock, $.01 par value 100,000 shares authorized, 30,939 issued and outstanding at 3/31/03 | | 309 | | 301 | | 8 | | 304 | | 5 | | 303 | | 6 | |
Additional paid – in capital | | 603,907 | | 585,509 | | 18,398 | | 592,585 | | 11,322 | | 591,668 | | 12,239 | |
Deferred compensation plans & officer loans | | (9,224 | ) | (7,336 | ) | (1,888 | ) | (5,562 | ) | (3,662 | ) | (5,987 | ) | (3,237 | ) |
Accumulated other comprehensive loss | | (11,375 | ) | (1,709 | ) | (9,666 | ) | (10,740 | ) | (635 | ) | (8,279 | ) | (3,096 | ) |
Retained earnings | | 69,528 | | 41,598 | | 27,930 | | 50,058 | | 19,469 | | 47,460 | | 22,068 | |
Total Stockholders’ Equity | | 653,145 | | 618,363 | | 34,782 | | 626,645 | | 26,500 | | 625,165 | | 27,980 | |
| | | | | | | | | | | | | | | |
Total Liabilities and Stockholders’ Equity | | 1,755,819 | | 1,367,985 | | 387,834 | | 1,473,170 | | 282,649 | | 1,467,192 | | 288,627 | |
13
COMPARATIVE STATEMENTS OF OPERATIONS
Unaudited
($000's omitted)
| | Three Months Ended | | Three Months Ended | | Three Months Ended | |
| | Mar-03 | | Mar-02 | | +/- | | % | | Dec-02 | | % | | Sep-02 | | % | |
Revenues | |
Rental revenue, net | | 51,621 | | 43,805 | | 7,816 | | 18 | % | 46,791 | | 10 | % | 45,704 | | 13 | % |
| | | | | | | | | | | | | | | | | |
Free rent | | 1,385 | | 1,536 | | (151 | ) | -10 | % | 853 | | 62 | % | 1,483 | | -7 | % |
Amortization of free rent | | (758 | ) | (828 | ) | 70 | | -8 | % | (1,118 | ) | -32 | % | (793 | ) | -4 | % |
Net free rent | | 627 | | 708 | | (81 | ) | -11 | % | (265 | ) | -337 | % | 690 | | -9 | % |
| | | | | | | | | | | | | | | | | |
Straight-line rent | | 1,460 | | 1,794 | | (334 | ) | -19 | % | 1,191 | | 23 | % | 1,473 | | -1 | % |
Allowance for S/L tenant credit loss | | (428 | ) | (513 | ) | 85 | | -17 | % | (634 | ) | -33 | % | (974 | ) | -56 | % |
Escalation and reimbursement revenues | | 8,460 | | 6,506 | | 1,954 | | 30 | % | 6,694 | | 26 | % | 8,824 | | -4 | % |
Signage rent | | 325 | | 466 | | (141 | ) | -30 | % | 564 | | -42 | % | 191 | | 70 | % |
Preferred equity investment income | | 1,556 | | 1,911 | | (355 | ) | -19 | % | 1,975 | | -21 | % | 1,960 | | -21 | % |
Investment income | | 3,361 | | 3,720 | | (359 | ) | -10 | % | 3,977 | | -15 | % | 3,871 | | -13 | % |
Other income | | 1,701 | | 975 | | 727 | | 75 | % | 2,305 | | -26 | % | 1,095 | | 55 | % |
Total Revenues, net | | 68,683 | | 59,372 | | 9,311 | | 16 | % | 62,597 | | 10 | % | 62,835 | | 9 | % |
Equity in income/(loss) from affiliates | | (97 | ) | (84 | ) | (13 | ) | 15 | % | 47 | | -306 | % | 21 | | -561 | % |
Equity in income from unconsolidated joint ventures | | 4,176 | | 3,333 | | 843 | | 25 | % | 5,270 | | -21 | % | 5,784 | | -28 | % |
| | | | | | | | | | | | | | | | | |
Operating expenses | | 17,094 | | 13,323 | | 3,771 | | 28 | % | 14,523 | | 18 | % | 15,990 | | 7 | % |
Ground rent | | 3,164 | | 3,159 | | 5 | | 0 | % | 3,159 | | 0 | % | 3,159 | | 0 | % |
Real estate taxes | | 9,998 | | 7,059 | | 2,939 | | 42 | % | 7,653 | | 31 | % | 7,688 | | 30 | % |
Marketing, general and administrative | | 3,186 | | 3,202 | | (16 | ) | 0 | % | 3,563 | | -11 | % | 3,160 | | 1 | % |
Total Operating Expenses | | 33,442 | | 26,743 | | 6,699 | | 25 | % | 28,898 | | 16 | % | 29,997 | | 11 | % |
| | | | | | | | | | | | | | | | | |
EBITDA | | 39,320 | | 35,878 | | 3,442 | | 10 | % | 39,016 | | 1 | % | 38,643 | | 2 | % |
| | | | | | | | | | | | | | | | | |
Interest | | 9,652 | | 8,418 | | 1,234 | | 15 | % | 9,112 | | 6 | % | 9,069 | | 6 | % |
Depreciation and amortization | | 10,883 | | 9,267 | | 1,616 | | 17 | % | 10,330 | | 5 | % | 9,711 | | 12 | % |
| | | | | | | | | | | | | | | | | |
Income Before Minority Interest and Items | | 18,785 | | 18,193 | | 592 | | 3 | % | 19,574 | | -4 | % | 19,863 | | -5 | % |
| | | | | | | | | | | | | | | | | |
Income from Discontinued Operations | | 867 | | 553 | | 314 | | 57 | % | 758 | | 14 | % | 744 | | 17 | % |
Gain on sale of Discontinued Operations | | 17,827 | | - | | 17,827 | | 0 | % | - | | 0 | % | - | | 0 | % |
Minority interest - OP | | (1,132 | ) | (1,110 | ) | (22 | ) | 2 | % | (1,166 | ) | -3 | % | (1,171 | ) | -3 | % |
Net Income | | 36,347 | | 17,636 | | 18,710 | | 106 | % | 19,166 | | 90 | % | 19,436 | | 87 | % |
| | | | | | | | | | | | | | | | | |
Dividends on preferred shares | | 2,300 | | 2,300 | | (0 | ) | 0 | % | 2,300 | | 0 | % | 2,300 | | 0 | % |
Preferred stock accretion | | 131 | | 123 | | 8 | | 7 | % | 123 | | 7 | % | 123 | | 7 | % |
Net Income Available For Common Shares Holders | | 33,916 | | 15,213 | | 18,703 | | 123 | % | 16,743 | | 103 | % | 17,013 | | 99 | % |
| | | | | | | | | | | | | | | | | |
Ratios | |
MG&A to Real Estate Revenue, net | | 5.13 | % | 6.07 | % | | | | | 6.56 | % | | | 5.65 | % | | |
MG&A to Total Revenue, net | | 4.64 | % | 5.39 | % | | | | | 5.69 | % | | | 5.03 | % | | |
Operating Expense to Real Estate Revenue, net | | 27.54 | % | 25.25 | % | | | | | 26.73 | % | | | 28.60 | % | | |
EBITDA to Real Estate Revenue, net | | 63.35 | % | 67.99 | % | | | | | 71.80 | % | | | 69.12 | % | | |
EBITDA before Ground Rent to Real Estate Revenue, net | | 68.45 | % | 73.98 | % | | | | | 77.61 | % | | | 74.77 | % | | |
14
| | Three Months Ended | | Three Months Ended | | Three Months Ended | |
| | Mar-03 | | Mar-02 | | +/- | | % | | Dec-02 | | % | | Sep-02 | | % | |
Per share data: | |
| | | | | | | | | | | | | | | | | |
Earnings per Share | | | | | | | | | | | | | | | | | |
Net income per share (basic) | | 1.11 | | 0.51 | | 0.60 | | 118 | % | 0.55 | | 102 | % | 0.56 | | 98 | % |
Net income per share (diluted) | | 1.01 | | 0.50 | | 0.51 | | 102 | % | 0.54 | | 87 | % | 0.54 | | 87 | % |
| | | | | | | | | | | | | | | | | |
Taxable Income | | | | | | | | | | | | | | | | | |
Net Income Available For Common Shares Holders | | 33,916 | | 15,213 | | 18,703 | | 123 | % | 16,743 | | 103 | % | 17,013 | | 99 | % |
Book/Tax Depreciation Adjustment | | 2,546 | | 1,803 | | 743 | | 41 | % | 2,349 | | 8 | % | 2,045 | | 24 | % |
Book/Tax Gain Recognition Adjustment | | (12,827 | ) | - | | (12,827 | ) | 0 | % | 0 | | 0 | % | 0 | | 0 | % |
Other Operating Adjustments | | (4,100 | ) | (3,572 | ) | (528 | ) | 15 | % | (1,058 | ) | 288 | % | (1,736 | ) | 136 | % |
C-corp Earnings | | 97 | | 85 | | 12 | | 14 | % | (49 | ) | -298 | % | (21 | ) | -562 | % |
Taxable Income | | 19,632 | | 13,529 | | 6,103 | | 45 | % | 17,985 | | 9 | % | 17,301 | | 13 | % |
| | | | | | | | | | | | | | | | | |
Dividend per share | | 0.465 | | 0.4425 | | 0.02 | | 5 | % | 0.465 | | 0 | % | 0.4425 | | 5 | % |
Estimated payout of taxable income | | 84 | % | 98 | % | (0.14 | ) | -14 | % | 91 | % | 91 | % | -8 | % | | |
Basic weighted average common shares | | 30,706 | | 29,992 | | 714 | | 2 | % | 30,236 | | 2 | % | 30,357 | | 1 | % |
Diluted weighted average common shares and common share equivalents outstanding | | 38,182 | | 32,905 | | 5,277 | | 16 | % | 37,764 | | 1 | % | 37,811 | | 1 | % |
Payout of Taxable Income Analysis:
Estimated taxable income is derived from net income less straightline rent, free rent net of amortization of free rent, plus tax gain on sale of properties, credit loss, straightline ground rent and the difference between tax and GAAP depreciation. The Company has deferred the taxable gain on the sales 29 West 35th Street, 17 Battery Place South, 90 Broad Street, 50 West 23rd Street, and 1412 Broadway through 1031 exchanges.
15
JOINT VENTURE STATEMENTS
Balance sheet for unconsolidated joint ventures
Unaudited
(000's omitted)
| | March 31, 2003 | | | | March 31, 2002 | |
| | Total Property | | SLG Property Interest | | | | Total Property | | SLG Property Interest | |
Land & land interests | | 219,993 | | 117,455 | | | | 129,471 | | 65,858 | |
Buildings & improvements | | 924,818 | | 495,038 | | | | 547,525 | | 278,197 | |
| | 1,144,811 | | 612,493 | | | | 676,996 | | 344,055 | |
Less accumulated depreciation | | (35,892 | ) | (18,536 | ) | | | (22,668 | ) | (11,480 | ) |
| | | | | | | | | | | |
Net Real Estate | | 1,108,919 | | 593,957 | | | | 654,328 | | 332,575 | |
| | | | | | | | | | | |
Cash and cash equivalents | | 33,316 | | 17,334 | | | | 19,678 | | 9,747 | |
Restricted cash | | 32,330 | | 17,377 | | | | 19,122 | | 9,880 | |
Tenant receivables, net of $404 reserve | | 6,057 | | 3,280 | | | | 2,045 | | 1,072 | |
Deferred rents receivable, net of reserve for tenant credit loss of $80 at 3/31/03 | | 16,118 | | 8,418 | | | | 8,358 | | 4,200 | |
Deferred costs, net | | 13,200 | | 7,072 | | | | 9,731 | | 4,917 | |
Other assets | | 1,101 | | 632 | | | | 4,008 | | 2,005 | |
| | | | | | | | | | | |
Total Assets | | 1,211,041 | | 648,070 | | | | 717,270 | | 364,396 | |
| | | | | | | | | | | |
Mortgage loan payable | | 742,283 | | 396,192 | | references pages 20 & 23 | | 444,469 | | 225,133 | |
Derivative Instruments-fair value (1) | | (7 | ) | (4 | ) | | | (549 | ) | (302 | ) |
Accrued interest payable | | 2,166 | | 1,124 | | | | 1,767 | | 878 | |
Accounts payable and accrued expenses | | 38,793 | | 22,680 | | | | 11,106 | | 5,756 | |
Security deposits | | 5,438 | | 2,744 | | | | 5,718 | | 2,769 | |
Contributed Capital | | 422,368 | | 225,334 | | references page 12 | | 254,759 | | 130,161 | |
| | | | | | | | | | | |
Total Liabilities and Equity | | 1,211,041 | | 648,070 | | | | 717,270 | | 364,396 | |
As of March 31, 2003 the Company has six joint venture interests representing a 50% interest in 180 Madison Avenue acquired in December 2000, a 55% interest in1250 Broadway acquired in September 2001, a 50% interest in 100 Park Avenue acquired in February 2000, a 35% interest in 321 West 44th Street contributed May 2000, a 55% interest in 1 Park Avenue contributed in June 2001, and a 55% interest in 1515 Broadway acquired in May 2002. These interests are accounted for on the equity method of accounting and, therefore, are not consolidated into the company's financial statements. Additional detail is available on page 32.
(1) This analysis includes hedge instruments at fair value of $306K on 1250 Broadway and $235K on 1515 Broadway.
16
JOINT VENTURE STATEMENTS
Statements of operations for unconsolidated joint ventures
Unaudited
(000's omitted)
| | Three Months Ended March 31, 2003 | | Three Months Ended March 31, 2002 | |
| | | | SLG | | SLG | | | | SLG | | SLG | |
| | Total Property | | Property Interest | | Subsidiary | | Total Property | | Property Interest | | Subsidiary | |
Revenues | |
Rental Revenue, net | | 32,819 | | 17,406 | | | | 22,053 | | 11,223 | | | |
Free rent | | 1,352 | | 733 | | | | 689 | | 358 | | | |
Amortization of free rent | | (265 | ) | (136 | ) | | | (113 | ) | (56 | ) | | |
Net free rent | | 1,087 | | 597 | | | | 575 | | 302 | | | |
| | | | | | | | | | | | | |
Straight-line rent | | 1,947 | | 1,039 | | | | 1,074 | | 545 | | | |
Allowance for S/L tenant credit loss | | (307 | ) | (164 | ) | | | (262 | ) | (135 | ) | | |
Escalation and reimbursement revenues | | 8,576 | | 4,559 | | | | 4,509 | | 2,302 | | | |
Investment income | | 128 | | 69 | | | | 116 | | 58 | | | |
Other income | | 110 | | 60 | | | | 229 | | 119 | | | |
Total Revenues, net | | 44,360 | | 23,567 | | | | 28,295 | | 14,414 | | | |
| | | | | | | | | | | | | |
Expenses | |
Operating expenses | | 12,156 | | 6,471 | | | | 7,126 | | 3,605 | | | |
Real estate taxes | | 8,186 | | 4,345 | | | | 4,253 | | 2,161 | | | |
Total Operating Expenses | | 20,342 | | 10,816 | | | | 11,379 | | 5,766 | | | |
| | | | | | | | | | | | | |
GAAP NOI | | 24,325 | | 12,915 | | | | 17,177 | | 8,783 | | | |
Cash NOI | | 21,291 | | 11,279 | | | | 15,528 | | 7,936 | | | |
| | | | | | | | | | | | | |
Interest | | 8,862 | | 4,675 | | | | 6,376 | | 3,226 | | | |
Depreciation and amortization | | 7,335 | | 3,901 | | | | 4,120 | | 2,089 | | | |
| | | | | | | | | | | | | |
Net Income | | 7,821 | | 4,176 | | references page 14 | | 6,419 | | 3,333 | | | |
| | | | | | | | | | | | | |
Plus: Real Estate Depreciation | | 6,382 | | 3,387 | | references page 19 | | 3,701 | | 1,881 | | | |
Plus: Extraordinary Loss | | - | | - | | | | - | | - | | | |
Plus: Management & Leasing Fees | | - | | - | | 69 | | - | | - | | 74 | |
Funds From Operations | | 14,203 | | 7,563 | | | | 10,120 | | 5,214 | | | |
| | | | | | | | | | | | | |
FAD Adjustments: | |
Plus: Non Real Estate Depreciation | | 953 | | 517 | | | | 419 | | 211 | | | |
Plus: 2% Allowance for S/L Tenant Credit Loss | | 307 | | 164 | | | | 262 | | 135 | | | |
Less: Free and S/L Rent | | (3,034 | ) | (1,637 | ) | | | (1,649 | ) | (847 | ) | | |
Less: Second Cycle Tenant Improvement, | | (3,624 | ) | (1,971 | ) | | | (637 | ) | (310 | ) | | |
Less: Second Cycle Leasing Commissions | | (1,253 | ) | (684 | ) | | | | | | | | |
Less: Recurring Capex | | (62 | ) | (32 | ) | | | (76 | ) | (39 | ) | | |
FAD Adjustment | | (6,713 | ) | (3,643 | ) | | | (1,681 | ) | (850 | ) | | |
| | | | | | | | | | | | | |
Operating Expense to Real Estate Revenue, net | | 27.36 | % | 27.42 | % | | | 25.26 | % | 25.08 | % | | |
GAAP NOI to Real Estate Revenue, net | | 54.75 | % | 54.72 | % | | | 60.89 | % | 61.12 | % | | |
Cash NOI to Real Estate Revenue, net | | 47.92 | % | 47.79 | % | | | 55.04 | % | 55.22 | % | | |
17
CONDENSED CONSOLIDATED STATEMENT OF STOCKHOLDERS’ EQUITY
($000's omitted)
| | Common Stock | | Additional Paid-In Capital | | Retained Earnings | | Deferred Compensation Plan | | Accumulated Other Comprehensive Loss | | TOTAL | |
Balance at December 31, 2001 | | 300 | | 583,350 | | 39,684 | | (7,515 | ) | (2,911 | ) | 612,908 | |
| | | | | | | | | | | | | |
Net Income | | | | | | 74,331 | | | | | | 74,331 | |
Preferred Dividend and Accretion | | | | | | (9,690 | ) | | | | | (9,690 | ) |
Exercise of employee stock options | | 3 | | 6,644 | | | | | | | | 6,647 | |
Cash distributions declared ($1.7925 per common share) | | | | | | (54,267 | ) | | | | | (54,267 | ) |
Comprehensive Income - Unrealized loss of derivative instruments | | | | | | | | | | (7,829 | ) | (7,829 | ) |
Redemption of operating partnership units | | 1 | | 3,128 | | | | | | | | 3,129 | |
Deferred compensation plan | | | | (537 | ) | | | 534 | | | | (3 | ) |
Amortization of deferred compensation | | | | | | | | 1,419 | | | | 1,419 | |
Balance at December 31, 2002 | | 304 | | 592,585 | | 50,058 | | (5,562 | ) | (10,740 | ) | 626,645 | |
| | | | | | | | | | | | | |
Net Income | | | | | | 36,347 | | | | | | 36,347 | |
Preferred Dividend and Accretion | | | | | | (2,431 | ) | | | | | (2,431 | ) |
Exercise of employee stock options | | 2 | | 3,583 | | | | | | | | 3,585 | |
Cash distributions declared ($0.465 per common share) | | | | | | (14,446 | ) | | | | | (14,446 | ) |
Comprehensive Income - Unrealized loss of derivative instruments | | | | | | | | | | (635 | ) | (635 | ) |
Redemption of operating partnership units | | 1 | | 3,463 | | | | | | | | 3,464 | |
Deferred compensation plan | | 2 | | 4,276 | | | | (4,278 | ) | | | - | |
Amortization of deferred compensation | | | | | | | | 616 | | | | 616 | |
Balance at March 31, 2003 | | 309 | | 603,907 | | 69,528 | | (9,224 | ) | (11,375 | ) | 653,145 | |
RECONCILIATION OF SHARES AND UNITS OUTSTANDING, AND DILUTION COMPUTATION
| | Common Stock | | OP Units | | Stock Options | | Sub-total | | Preferred Stock | | Diluted Shares | |
Balance at December 31, 2002 | | 30,421,693 | | 2,145,190 | | - | | 32,566,883 | | 4,698,900 | | 37,265,783 | |
| | | | | | | | | | | | | |
YTD share activity | | 517,628 | | 258,876 | | 776,504 | | 776,504 | | | | | |
Balance at March 31, 2003- Basic | | 30,939,321 | | 2,404,066 | | - | | 33,343,387 | | 4,698,900 | | 38,042,287 | |
| | | | | | | | | | | | | |
Dilution Factor | | (233,555 | ) | (124,364 | ) | 496,952 | | 139,033 | | | | 139,033 | |
Balance at March 31, 2003 - Diluted | | 30,705,766 | | 2,279,702 | | 496,952 | | 33,482,420 | | 4,698,900 | | 38,181,320 | |
18
COMPARATIVE COMPUTATION OF FFO AND FAD
Unaudited
($000's omitted - except per share data)
| | | | Three Months Ended March 31, | | Three Months Ended Dec 31, | | Three Months Ended Sept 30, | |
| | | | 2003 | | 2002 | | % Change | | 2002 | | % Change | | 2002 | | % Change | |
Funds from operations | |
Net Income before Minority Interests and Items | | 18,785 | | 18,193 | | 3 | % | 19,574 | | -4 | % | 19,863 | | -5 | % |
| | | | | | | | | | | | | | | | | |
Add: | | Depreciation and Amortization | | 10,883 | | 9,267 | | 17 | % | 10,330 | | 5 | % | 9,711 | | 12 | % |
| | FFO from Discontinued Operations | | 957 | | 927 | | 3 | % | 898 | | 7 | % | 963 | | -1 | % |
| | FFO adjustment for Joint Ventures | | 3,387 | | 1,881 | | 80 | % | 3,359 | | 1 | % | 3,072 | | 10 | % |
Less: | | Dividends on Preferred Shares | | 2,300 | | 2,300 | | 0 | % | 2,300 | | 0 | % | 2,300 | | 0 | % |
| | Non Real Estate Depreciation/Amortization of Finance Costs | | 1,484 | | 983 | | 51 | % | 1,235 | | 20 | % | 1,047 | | 42 | % |
| | Funds From Operations - Basic | | 30,228 | | 26,985 | | 12 | % | 30,626 | | -1 | % | 30,262 | | 0 | % |
| | | | | | | | | | | | | | | | | |
| | Funds From Operations - Basic per Share | | 0.92 | | 0.84 | | 9 | % | 0.94 | | -3 | % | 0.93 | | -1 | % |
| | | | | | | | | | | | | | | | | |
Add: | | Dividends on Preferred Shares | | 2,300 | | 2,300 | | 0 | % | 2,300 | | 0 | % | 2,300 | | 0 | % |
| | Funds From Operations - Diluted | | 32,528 | | 29,285 | | 11 | % | 32,926 | | -1 | % | 32,562 | | 0 | % |
| | | | | | | | | | | | | | | | | |
| | Funds From Operations - Diluted per Share | | 0.85 | | 0.78 | | 9 | % | 0.87 | | -2 | % | 0.86 | | -1 | % |
| | | | | | | | | | | | | | | | | |
Funds Available for Distribution | |
FFO | | | | 32,528 | | 29,285 | | 11 | % | 32,926 | | -1 | % | 32,562 | | 0 | % |
| | | | | | | | | | | | | | | | | |
Add: | | Non Real Estate Depreciation | | 1,463 | | 987 | | 48 | % | 1,235 | | 18 | % | 1,046 | | 40 | % |
| | 2% Allowance for S/L Tenant Credit Loss | | 428 | | 516 | | -17 | % | 634 | | -33 | % | 974 | | -56 | % |
| | Straight-line Ground Rent | | 160 | | 160 | | 0 | % | 60 | | 167 | % | 60 | | 167 | % |
| | Non-cash Deferred Compensation | | 616 | | 179 | | 244 | % | 425 | | 45 | % | 178 | | 245 | % |
Less: | | FAD adjustment for Joint Ventures | | 3,441 | | 850 | | 305 | % | 1,054 | | 226 | % | 856 | | 302 | % |
| | Straight-line Rental Income | | 1,481 | | 1,821 | | -19 | % | 1,191 | | 24 | % | 1,473 | | 1 | % |
| | Free Rent - Occupied (Net of Amortization, incl. First Cycle) | | 627 | | 715 | | -12 | % | (265 | ) | -337 | % | 690 | | -9 | % |
| | Amortization of Mortgage Investment Discount | | 82 | | 95 | | -14 | % | 98 | | -16 | % | 97 | | -15 | % |
| | Second Cycle Tenant Improvements | | 1,460 | | 3,603 | | -59 | % | 3,134 | | -53 | % | 6,691 | | -78 | % |
| | Second Cycle Leasing Commissions | | 1,456 | | 848 | | 72 | % | 730 | | 99 | % | 2,711 | | -46 | % |
| | Revenue Enhancing Recurring CAPEX | | 175 | | - | | 0 | % | 5 | | 3704 | % | - | | 0 | % |
| | Non- Revenue Enhancing Recurring CAPEX | | 363 | | 88 | | 314 | % | 2,324 | | -84 | % | 232 | | 56 | % |
| | | | | | | | | | | | | | | | | |
Funds Available for Distribution | | 26,110 | | 23,107 | | 13 | % | 27,008 | | -3 | % | 22,070 | | 18 | % |
| | Diluted per Share | | 0.68 | | 0.62 | | 10 | % | 0.72 | | -5 | % | 0.58 | | 17 | % |
First Cycle Leasing Costs | | | | | | | | | | | | | | | |
| | Tenant Improvement | | - | | 78 | | -100 | % | - | | 0 | % | - | | 0 | % |
| | Leasing Commissions | | - | | 279 | | -100 | % | - | | 0 | % | - | | 0 | % |
| | | | | | | | | | | | | | | | | |
Funds Available for Distribution after First Cycle Leasing Costs | | 26,110 | | 22,750 | | 15 | % | 27,008 | | -3 | % | 22,070 | | 18 | % |
| | | | | | | | | | | | | | | | | |
Funds Available for Distribution per Diluted Weighted Average | | | | | | | | | | | | | | | |
Unit and Common Share | | 0.68 | | 0.60 | | 13 | % | 0.72 | | -4 | % | 0.58 | | 17 | % |
| | | | | | | | | | | | | | | | | |
Redevelopment Costs | | 635 | | 2,329 | | -73 | % | 3,318 | | -81 | % | 2,245 | | -72 | % |
| | | | | | | | | | | | | | | | | |
Payout Ratio of Funds From Operations | | 54.29 | % | 56.82 | % | | | 53.05 | % | | | 51.38 | % | | |
Payout Ratio of Funds Available for Distribution | | | | | | | | | | | | | | | |
Before First Cycle | | 67.63 | % | 71.84 | % | | | 64.67 | % | | | 75.81 | % | | |
19
SELECTED FINANCIAL DATA
Capitalization Analysis
Unaudited
($000's omitted)
| | March 31, | | December 31, | | September 30, | |
| | 2003 | | 2002 | | 2002 | | 2002 | |
Market Capitalization | |
Common Equity: | | | | | | | | | |
Common Shares Outstanding | | 30,939 | | 30,042 | | 30,422 | | 30,376 | |
OP Units Outstanding | | 2,404 | | 2,271 | | 2,145 | | 2,166 | |
Total Common Equity (Shares and Units) | | 33,343 | | 32,314 | | 32,567 | | 32,542 | |
Share Price (End of Period) | | 30.56 | | 33.60 | | 31.60 | | 30.74 | |
Equity Market Value | | 1,018,972 | | 1,085,745 | | 1,029,101 | | 1,000,329 | |
| | | | | | | | | |
Preferred Equity at Liquidation Value: | | 115,000 | | 115,000 | | 115,000 | | 115,000 | |
| | | | | | | | | |
Real Estate Debt | |
Property Level Mortgage Debt | | 636,290 | | 408,186 | | 388,404 | | 395,800 | |
Company's portion of Joint Venture Mortgages | | 396,194 | | 225,133 | | 396,361 | | 396,513 | |
Outstanding Balance on - Term Loan | | 100,000 | | - | | 100,000 | | - | |
Outstanding Balance on – Secured Credit Line | | - | | 34,931 | | - | | 30,931 | |
Outstanding Balance on – Unsecured Credit Line | | 51,000 | | 52,000 | | 74,000 | | 143,000 | |
Total Combined Debt | | 1,183,484 | | 720,250 | | 958,765 | | 966,244 | |
| | | | | | | | | |
Total Market Cap (Debt & Equity) | | 2,317,455 | | 1,920,995 | | 2,102,865 | | 2,081,572 | |
| | | | | | | | | |
Availability | |
Senior Unsecured Line of Credit | | | | | | | | | |
Maximum Line Available | | 300,000 | | 300,000 | | 300,000 | | 300,000 | |
Letters of Credit issued | | 5,000 | | 30,000 | | 15,000 | | 5,000 | |
Outstanding Balance | | 51,000 | | 52,000 | | 74,000 | | 143,000 | |
Net Line Availability | | 244,000 | | 218,000 | | 211,000 | | 152,000 | |
| | | | | | | | | |
Wells Fargo Term Loan | | | | | | | | | |
Maximum Available | | 150,000 | | - | | 150,000 | | - | |
Outstanding Balance | | 100,000 | | - | | 100,000 | | - | |
Net Availability | | 50,000 | | - | | 50,000 | | - | |
| | | | | | | | | |
Secured Line of Credit | | | | | | | | | |
Maximum Line Available | | 75,000 | | 75,000 | | 75,000 | | 75,000 | |
Outstanding Balance | | - | | 34,931 | | - | | 30,931 | |
Net Line Availability | | 75,000 | | 40,069 | | 75,000 | | 44,069 | |
Total Availability under Lines of Credit & Term Loan | | 369,000 | | 258,069 | | 336,000 | | 196,069 | |
| | | | | | | | | |
Ratio Analysis | |
Consolidated Basis | | | | | | | | | |
Debt to Market Cap Ratio | | 40.98 | % | 29.20 | % | 32.96 | % | 33.81 | % |
Debt to Gross Real Estate Book Ratio (1) | | 59.88 | % | 46.82 | % | 58.37 | % | 56.45 | % |
Secured Real Estate Debt to Secured Assets Gross Book (1) | | 70.87 | % | 66.04 | % | 66.18 | % | 67.68 | % |
Unsecured Debt to Unencumbered | | | | | | | | | |
Assets-Gross Book Value (1) | | 12.12 | % | 14.03 | % | 20.30 | % | 39.29 | % |
Secured Line of Credit to Structured Finance Assets (1) | | 0.00 | % | 27.36 | % | 0.00 | % | 15.89 | % |
Joint Ventures Allocated | | | | | | | | | |
Combined Debt to Market Cap Ratio | | 51.07 | % | 37.49 | % | 45.59 | % | 46.42 | % |
Debt to Gross Real Estate Book Ratio (1) | | 61.81 | % | 51.71 | % | 61.41 | % | 60.34 | % |
Secured Debt to Secured Assets Gross Book (1) | | 68.94 | % | 47.58 | % | 66.24 | % | 67.13 | % |
(1) Excludes property level capital obligations.
20
SELECTED FINANCIAL DATA
Property NOI and Coverage Ratios
Unaudited
($000's omitted)
| | | | Three Months Ended March 31, | | Three Months Ended December 31, | |
| | | | 2003 | | 2002 | | +/- | | % Change | | 2002 | | +/- | | % Change | |
Funds from operations | | 30,228 | | 26,985 | | 3,243 | | 12 | % | 30,626 | | (398 | ) | -1 | % |
| | | | | | | | | | | | | | | | | |
Less: | | Non – Building Revenue | | 9,597 | | 8,294 | | 1,303 | | 16 | % | 11,452 | | (1,855 | ) | -16 | % |
| | | | | | | | | | | | | | | | | |
Plus: | | Interest Expense (incl. Capital Lease Int.) | | 10,305 | | 9,112 | | 1,193 | | 13 | % | 9,809 | | 496 | | 5 | % |
| | Non Real Estate Depreciation | | 1,463 | | 987 | | 476 | | 48 | % | 1,235 | | 228 | | 18 | % |
| | MG&A Expense | | 3,186 | | 3,202 | | (16 | ) | 0 | % | 3,563 | | (377 | ) | -11 | % |
| | Preferred Dividend | | 2,300 | | 2,300 | | - | | 0 | % | 2,300 | | (0 | ) | 0 | % |
| | GAAP NOI | | 37,885 | | 34,292 | | 3,593 | | 10 | % | 36,080 | | 1,805 | | 5 | % |
| | | | | | | | | | | | | | | | | |
Cash adjustments | |
Less: | | Free Rent (Net of Amortization) | | 1,224 | | 1,017 | | 207 | | 20 | % | 66 | | 1,158 | | 1755 | % |
| | Straightline Revenue Adjustment | | 2,541 | | 2,366 | | 175 | | 7 | % | 1,096 | | 1,445 | | 132 | % |
| | | | | | | | | | | | | | | | | |
Plus: | | Ground Lease Straight-line Adjustment | | 160 | | 160 | | - | | 0 | % | 160 | | - | | 0 | % |
| | Cash NOI | | 34,280 | | 31,069 | | 3,211 | | 10 | % | 35,078 | | (799 | ) | -2 | % |
| | | | | | | | | | | | | | | | | |
| | Real Estate Revenue, net | | 64,514 | | 55,491 | | 9,023 | | 16 | % | 57,136 | | 7,378 | | 13 | % |
| | | | | | | | | | | | | | | | | |
Operating margins | |
| | GAAP NOI/Real Estate Revenue, net | | 58.72 | % | 61.80 | % | | | | | 63.15 | % | | | | |
| | Cash NOI/Real Estate Revenue, net | | 53.14 | % | 55.99 | % | | | | | 61.39 | % | | | | |
| | | | | | | | | | | | | | | | | |
| | GAAP NOI before Ground Rent/Real Estate Revenue, net | | 63.63 | % | 68.41 | % | | | | | 68.68 | % | | | | |
| | Cash NOI before Ground Rent/Real Estate Revenue, net | | 57.79 | % | 62.31 | % | | | | | 66.64 | % | | | | |
| | | | | | | | | | | | | | | | | |
Components of debt and fixed charges | |
| | Interest on Fixed Rate Loans | | 6,232 | | 5,628 | | 604 | | 11 | % | 5,921 | | 311 | | 5 | % |
| | Interest on Floating Rate Loans | | 4,073 | | 3,484 | | 589 | | 17 | % | 3,888 | | 185 | | 5 | % |
| | Fixed Amortization Principal Payments | | 930 | | 1,713 | | (783 | ) | -46 | % | 1,659 | | (729 | ) | -44 | % |
| | Total Debt Service | | 11,235 | | 10,825 | | 410 | | 4 | % | 11,468 | | (233 | ) | -2 | % |
| | | | | | | | | | | | | | | | | |
| | Payments under Ground Lease Arrangements | | 3,004 | | 2,999 | | 5 | | 0 | % | 2,999 | | 5 | | 0 | % |
| | Preferred Stock Dividend | | 2,300 | | 2,300 | | - | | 0 | % | 2,300 | | - | | 0 | % |
| | Total Fixed Charges | | 16,539 | | 16,124 | | 415 | | 3 | % | 16,767 | | (228 | ) | -1 | % |
| | | | | | | | | | | | | | | | | |
Adjusted EBITDA | | 43,695 | | 39,849 | | | | | | 45,967 | | | | | |
Interest Coverage Ratio | | 4.24 | | 4.37 | | | | | | 4.69 | | | | | |
Debt Service Coverage ratio | | 3.89 | | 3.68 | | | | | | 4.01 | | | | | |
Fixed Charge Coverage ratio | | 2.64 | | 2.47 | | | | | | 2.74 | | | | | |
21
SELECTED FINANCIAL DATA
2003 Same Store
Unaudited
($000's omitted)
| | | | Three Months Ended March 31, | | Three Months Ended December 31, | |
| | | | 2003 | | 2002 | | +/- | | % Change | | 2002 | | +/- | | % Change | |
Revenues | |
| | Rental Revenue | | 48,682 | | 46,321 | | 2,361 | | 5 | % | 47,796 | | 886 | | 2 | % |
| | Credit Loss | | (386 | ) | (513 | ) | 127 | | -25 | % | (434 | ) | 48 | | -11 | % |
| | Signage Rent | | 294 | | 466 | | (172 | ) | -37 | % | 564 | | (270 | ) | -48 | % |
| | Escalation & Reimbursement Revenues | 7,689 | | 6,680 | | 1,009 | | 15 | % | 7,584 | | 105 | | 1 | % |
| | Investment & Other Income | | 721 | | 415 | | 306 | | 74 | % | 1,038 | | (317 | ) | -31 | % |
| | Total Revenues | | 57,000 | | 53,369 | | 3,631 | | 7 | % | 56,548 | | 452 | | 1 | % |
Expenses | |
| | Operating Expense | | 14,918 | | 12,621 | | 2,297 | | 18 | % | 13,770 | | 1,148 | | 8 | % |
| | Ground Rent | | 3,159 | | 3,159 | | (0 | ) | 0 | % | 3,159 | | - | | 0 | % |
| | Real Estate Taxes | | 9,184 | | 7,058 | | 2,126 | | 30 | % | 7,653 | | 1,531 | | 20 | % |
| | | | 27,261 | | 22,838 | | 4,423 | | 19 | % | 24,582 | | 2,679 | | 11 | % |
| | | | | | | | | | | | | | | | | |
| | EBITDA | | 29,739 | | 30,531 | | (792 | ) | -3 | % | 31,966 | | (2,227 | ) | -7 | % |
| | | | | | | | | | | | | | | | | |
| | Interest | | 7,133 | | 7,243 | | (110 | ) | -2 | % | 7,274 | | (141 | ) | -2 | % |
| | Depreciation & Amortization | | 8,311 | | 8,178 | | 133 | | 2 | % | 9,137 | | (826 | ) | -9 | % |
| | | | - | | | | | | | | | | | | | |
| | Income Before Minority Interest | | 14,295 | | 15,110 | | (815 | ) | -5 | % | 15,555 | | (1,260 | ) | -8 | % |
Plus: | | Real Estate Depreciation & Amortization | | 8,061 | | 7,875 | | 186 | | 2 | % | 8,684 | | (623 | ) | -7 | % |
| | | | | | | | | | | | | | | | | |
| | FFO | | 22,356 | | 22,985 | | (629 | ) | -3 | % | 24,239 | | (1,883 | ) | -8 | % |
| | | | | | | | | | | | | | | | | |
Less: | | Non – Building Revenue | | 409 | | 301 | | 108 | | 36 | % | 826 | | (417 | ) | -50 | % |
| | | | | | | | | | | | | | | | | |
Plus: | | Interest Expense | | 7,133 | | 7,243 | | (110 | ) | -2 | % | 7,274 | | (141 | ) | -2 | % |
| | Non Real Estate Depreciation | | 250 | | 303 | | (53 | ) | -17 | % | 453 | | (203 | ) | -45 | % |
| | GAAP NOI | | 29,330 | | 30,230 | | (900 | ) | -3 | % | 31,140 | | (1,810 | ) | -6 | % |
| | | | | | | | | | | | | | | | | |
Cash Adjustments | |
Less: | | Free Rent (Net of Amortization) | | 479 | | 708 | | (229 | ) | -32 | % | (265 | ) | 744 | | -281 | % |
| | Straightline Revenue Adjustment | | 1,329 | | 1,762 | | (433 | ) | -25 | % | 1,159 | | 170 | | 15 | % |
| | | | | | | | | | | | | | | | | |
Plus: | | Ground Lease Straight-line Adjustment | | 160 | | 160 | | - | | 0 | % | 160 | | - | | 0 | % |
| | Cash NOI | | 27,682 | | 27,920 | | (238 | ) | -1 | % | 30,406 | | (2,724 | ) | -9 | % |
| | | | | | | | | | | | | | | | | |
Operating Margins | |
| | GAAP NOI to Real Estate Revenue, net | | 51.48 | % | 56.42 | % | | | | | 55.45 | % | | | | |
| | Cash NOI to Real Estate Revenue, net | | 48.58 | % | 52.11 | % | | | | | 54.15 | % | | | | |
| | | | | | | | | | | | | | | | | |
| | GAAP NOI before Ground Rent/Real Estate Revenue, net | | 57.02 | % | 62.32 | % | | | | | 61.08 | % | | | | |
| | Cash NOI before Ground Rent/Real Estate Revenue, net | | 53.85 | % | 57.71 | % | | | | | 59.49 | % | | | | |
22
DEBT SUMMARY SCHEDULE
Unaudited
($000's omitted)
| | | | Principal O/S Outstanding 3/31/2003 | | Coupon | | Fixed Annual Payment | | 2003 Principal Repayment | | Maturity Date | | Due at Maturity | | As-Of Right Extension | | Earliest Prepayment | |
Fixed rate debt | |
| | | | | | | | | | | | | | | | | | | |
Secured fixed Rate Debt | | | | | | | | | | | | | | | | | |
125 Broad Street | | 76,641 | | 8.29 | % | 7,058 | | 799 | | 10/11/2007 | | 72,320 | | - | | Oct-03 | |
673 First Avenue | | 35,000 | | 5.67 | % | 1,985 | | - | | 2/20/2013 | | 29,863 | | - | | Feb-06 | |
CIBC (against 1414 Ave. of Americas and 70 W. 36th St.) | | 25,591 | | 7.90 | % | 2,429 | | 363 | | 5/1/2009 | | 12,196 | | - | | Apr-03 | |
711 Third Avenue | | 48,333 | | 8.13 | % | 4,420 | | 410 | | 9/10/2005 | | 47,247 | | - | | Jun-04 | |
555 West 57th Street (Libor collar of 6.10% - 6.58% + 200bps) | | 68,085 | | 8.10 | % | 5,590 | | - | | 11/4/2004 | | 66,959 | | - | | Open | |
420 Lexington Avenue | | 122,640 | | 8.44 | % | 12,463 | | 1,771 | | 11/1/2010 | | 104,406 | | - | | Open | |
317 Madison (Libor Swap of 4.01% + 180bps) | | 65,000 | | 5.81 | % | 3,829 | | - | | 8/20/2004 | | 65,000 | | 8/20/2006 | | Open | |
875 Bridgeport Avenue, CT (1031 exchange asset) | | 14,821 | | 8.32 | % | 1,299 | | 63 | | 5/10/2025 | | 5,466 | | - | | Open | |
| | | | 456,111 | | 7.71 | % | 39,072 | | 3,406 | | | | | | | | | |
Unsecured fixed rate debt | | | | | | | | | | | | | | | | | |
Wells Fargo Unsecured Term Loan (Libor swap of 1.64% + 150bps) (1) | | 100,000 | | 3.14 | % | 3,140 | | - | | 11/5/2007 | | 100,000 | | - | | Nov-05 | |
| | | | | | | | | | | | | | | | | | | |
Total Fixed Rate Debt/Wtd Avg | | 556,111 | | 6.89 | % | 42,212 | | 3,406 | | | | | | | | | |
| | | | | | | | | | | | | | | | | | | |
Floating rate Debt | |
Secured floating rate debt | | | | | | | | | | | | | | | | | |
Structured Finance Loan (Libor + 100bp) | | 22,178 | | 2.38 | % | | | - | | 11/1/2003 | | 22,178 | | - | | Nov-03 | (4) |
220 E 42nd Street | | 158,000 | | 3.12 | % | | | - | | 9/1/2004 | | 158,000 | | - | | Sep-04 | |
Secured Line of Credit (Libor + 150bps) | | - | | 0.00 | % | | | - | | 12/22/2004 | | - | | 12/22/2005 | | Open | |
Total Floating Rate Secured Debt/Wtd Avg | | 180,178 | | 3.03 | % | | | | | | | | | | | | |
| | | | | | | | | | | | | | | | | | | |
Unsecured floating rate debt | | | | | | | | | | | | | | | | | |
Senior Unsecured Line of Credit (Libor + 150 bps) | | 51,000 | | 2.96 | % | | | - | | 3/20/2006 | | 51,000 | | - | | Open | |
Total Floating Rate Unsecured Debt/Wtd Avg | | 51,000 | | 2.96 | % | | | | | | | | | | | | |
| | | | | | | | | | | | | | | | | | | |
Total Floating Rate Debt Outstanding | | 231,178 | | 3.01 | % | | | | | | | | | | | | |
| | | | | | | | | | | | | | | | | | | |
Total Debt/Wtd Avg | | 787,290 | | 5.75 | % | | | | | | | | | | | | |
Weighted Average Balance & Interest Rate | | 653,295 | | 5.60 | % | | | | | | | | | | | | |
SUMMARY OF JOINT VENTURE DEBT
| | Principal O/S | | | | | | | | | | | | | | | |
| | Gross Principal | | SLG Share | | | | | | | | | | | | | | | |
Joint Venture Debt | | | | | | | | | | | | | | | | | | | |
180 Madison JV | | 31,650 | | 15,794 | | 7.81 | % | 2,788 | | 300 | | 12/1/2005 | | 30,778 | | - | | Open | |
1250 Broadway (Libor Swap of 4.03% + 250bp) (2) | | 85,000 | | 46,750 | | 6.53 | % | 5,551 | | - | | 10/1/2004 | | 85,000 | | 10/1/2006 | | Open | |
1515 Broadway (Libor + 191 bps) (3) | | 335,000 | | 184,250 | | 4.22 | % | - | | - | | 5/14/2004 | | 184,250 | | 5/14/2006 | | Open | |
321 W 44th JV (Libor + 250bps) | | 22,000 | | 7,700 | | 3.85 | % | - | | - | | 4/30/2003 | | 7,700 | | - | | Open | |
1 Park Avenue (Libor + 150 bps) | | 150,000 | | 82,500 | | 2.87 | % | - | | - | | 1/10/2004 | | 82,500 | | - | | Open | |
100 Park Avenue JV | | 118,636 | | 59,199 | | 8.00 | % | 10,211 | | 478 | | 9/1/2010 | | 107,488 | | - | | Open | |
| | | | | | | | | | | | | | | | | | | |
Total Joint Venture Debt/Wtd Avg | 742,285 | | 396,194 | | 4.91 | % | 18,549 | | 778 | | | | | | | | | |
| | | | | | | | | | | | | | | | | | | |
Weighted Average Balance & Interest Rate with SLG JV debt | | | | 1,054,045 | | 5.34 | % | | | | | | | | | | | | |
(1) Libor swap on debt is stepped. On Janary 4, 2004 base swap will increase to 4.06% for balance of the term. The weighted libor base is 3.56%.
(2) Swap on 1250 mortgage executed on SLG portion only through January 11, 2005.
(3) Spread on 1515 is weighted for first mortgage and mezzanine pieces. In August 2002 a swap at a Libor of 2.29% was placed on $100mm of SL Green's share of debt.
(4) Extension option exercised November 2002.
23
SUMMARY OF GROUND LEASE ARRANGEMENTS
Consolidated Statement (REIT)
($000's omitted)
Property | | 2003 Scheduled Cash Payment | | 2004 Scheduled Cash Payment | | 2005 Scheduled Cash Payment | | 2006 Scheduled Cash Payment | | Deferred Land Lease Obligations (1) | | Year of Maturity | |
Operating Leases | |
673 First Avenue | | 3,010 | | 3,010 | | 3,108 | | 3,304 | | 13,311 | | 2037 | |
1140 Avenue of Americas (2) | | 348 | | 348 | | 348 | | 348 | | - | | 2016 | (3) |
420 Lexington Avenue (2) | | 7,074 | | 7,074 | | 7,074 | | 7,074 | | - | | 2008 | (4) |
711 Third Avenue (2) (5) | | 1,550 | | 1,550 | | 1,550 | | 1,550 | | 1,475 | | 2032 | |
125 Broad Street | | 1,075 | | 1,075 | | 1,075 | | 1,075 | | - | | 2067 | (6) |
Total | | 13,057 | | 13,057 | | 13,155 | | 13,351 | | 14,786 | | | |
| | | | | | | | | | | | | |
Capitalized Lease | | | | | | | | | | | | | |
673 First Avenue | | 1,290 | | 1,290 | | 1,322 | | 1,416 | | 15,937 | | 2037 | |
(1) Per the balance sheet at March 31, 2003.
(2) These ground leases are classified as operating leases and, therefore, do not appear on the balance sheet as an obligation.
(3) The Company has a unilateral option to extend the ground lease for an additional 50 years to 2066.
(4) Subject to renewal at the Company's option through 2029.
(5) Excludes portion payable to SL Green as owner of 50% leasehold.
(6) The Company has an option to extend the ground lease for five years and six months starting January 1, 2068. The Condo Association can purchased the ground lease for $15 million.
24
STRUCTURED FINANCE
($000's omitted)
| | Assets Outstanding | | Wtd Average Assets during quarter | | Wtd Average Yield during quarter | | Current Yield | | Libor Rate | |
3/31/2002 | | 189,120 | | 188,644 | | 12.63 | % | 12.82 | % | 1.88 | % |
| | | | | | | | | | | |
Originations/Accretion | | 20,300 | | | | | | | | | |
Preferred Equity | | 6,000 | | | | | | | | | |
Redemptions | | (20,172 | ) | | | | | | | | |
6/30/2002 | | 195,248 | | 175,907 | | 12.65 | % | 12.67 | % | 1.86 | % |
| | | | | | | | | | | |
Originations/Accretion | | | | | | | | | | | |
Preferred Equity | | - | | | | | | | | | |
Redemptions | | (539 | ) | | | | | | | | |
9/30/2002 | | 194,709 | | 194,709 | | 12.45 | % | 12.40 | % | 1.82 | % |
| | | | | | | | | | | |
Originations/Accretion | | 500 | | | | | | | | | |
Preferred Equity | | - | | | | | | | | | |
Redemptions | | (49,570 | ) | | | | | | | | |
12/31/2002 | | 145,639 | | 194,693 | | 12.51 | % | 12.68 | % | 1.35 | % |
| | | | | | | | | | | |
Originations/Accretion | | 23,040 | | | | | | | | | |
Preferred Equity | | (53,500 | ) | | | | | | | | |
Redemptions | | (683 | ) | | | | | | | | |
3/31/2003 | | 114,496 | | 125,180 | | 12.38 | %(2) | 12.73 | %(3) | 1.24 | %(4) |
(1) Accretion includes original issue discounts and compounding investment income.
(2) As of March 31, 2003, net of seller financing, the weighted yield is 10.52%.
(3) As of March 31, 2003, net of seller financing, the current yield is 10.73%.
(4) At quarter end $39mm of assets have fixed index rates. The weighted average base rate is 3.20%.
25
STRUCTURED FINANCE
($000's omitted)
Type of Investment | | Quarter End Balance(1) | | Senior Financing | | Exposure Psf | | Wtd Average Yield during quarter(2) | | Current Yield(3) | |
Junior Mortgage Participation | | $ | 43,010 | | $ | 250,277 | | $ | 128 | | 13.75 | % | 14.26 | % |
| | | | | | | | | | | |
Mezzanine Debt | | $ | 50,136 | | $ | 313,600 | | $ | 184 | | 11.59 | % | 11.60 | % |
| | | | | | | | | | | |
Preferred Equity | | $ | 21,351 | | $ | 145,000 | | $ | 136 | | 13.20 | % | 13.89 | % |
| | | | | | | | | | | |
Balance as of 3/31/03 | | $ | 114,496 | | $ | 708,877 | | $ | 154 | | 12.38 | % | 12.73 | % |
| | | | | | | | | | | | | | | |
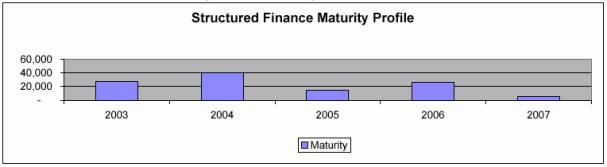
Current Maturity Profile
(1) Most investments are indexed to Libor and are prepayable at dates prior to maturity subject to certain prepayment penalties or fees.
(2) As of March 31, 2003, net of seller financing, the weighted yield is 10.52%.
(3) As of March 31, 2003, net of seller financing, the current yield is 10.73%.
26
SELECTED PROPERTY DATA
| | | | | | | | | | Leased | | | | Annualized Rent | | | |
Properties | | Submarket | | Ownership | | Rentable
Sq. Feet | | % of Total
Sq. Feet | | Mar-03 | | Dec-02 | | Sep-02 | | Jun-02 | | Mar-02 | | Annualized
Rent ($'s) | | 100% | | SLG | | Total
Tenants | |
PROPERTIES 100% OWNED | |
“Same Store” | | | | | | | | | | | | | | | | | | | | | | | | | | | |
1140 Avenue of the Americas | | Rockefeller Center | | Leasehold Interest | | 191,000 | | 1 | | 97.1 | | 97.8 | | 95.5 | | 95.5 | | 95.5 | | 7,584,213 | | 3 | | 2 | | 26 | |
110 East 42nd Street | | Grand Central | | Fee Interest | | 181,000 | | 1 | | 98.6 | | 98.6 | | 97.9 | | 97.8 | | 99.8 | | 6,109,705 | | 2 | | 2 | | 28 | |
1372 Broadway | | Times Square South | | Fee Interest | | 508,000 | | 4 | | 99.6 | | 97.9 | | 97.8 | | 97.2 | | 97.2 | | 15,242,432 | | 6 | | 5 | | 29 | |
1414 Avenue of the Americas | | Rockefeller Center | | Fee Interest | | 111,000 | | 1 | | 93.0 | | 94.3 | | 96.5 | | 97.6 | | 97.6 | | 4,020,171 | | 2 | | 1 | | 23 | |
1466 Broadway | | Times Square | | Fee Interest | | 289,000 | | 2 | | 89.3 | | 88.6 | | 86.2 | | 84.4 | | 84.9 | | 9,880,586 | | 4 | | 3 | | 96 | |
17 Battery Place - North | | World Trade/ Battery | | Fee Interest | | 419,000 | | 3 | | 100.0 | | 100.0 | | 100.0 | | 100.0 | | 100.0 | | 9,343,548 | | 4 | | 3 | | 7 | |
286 Madison Avenue | | Grand Central South | | Fee Interest | | 112,000 | | 1 | | 94.8 | | 93.0 | | 92.6 | | 94.7 | | 97.9 | | 3,304,282 | | 1 | | 1 | | 36 | |
290 Madison Avenue | | Grand Central South | | Fee Interest | | 37,000 | | 0 | | 100.0 | | 100.0 | | 100.0 | | 100.0 | | 100.0 | | 1,390,274 | | 1 | | 0 | | 4 | |
292 Madison Avenue | | Grand Central South | | Fee Interest | | 187,000 | | 1 | | 95.4 | | 99.7 | | 99.7 | | 99.7 | | 98.3 | | 7,006,463 | | 3 | | 2 | | 18 | |
317 Madison Avenue | | Grand Central | | Fee Interest | | 450,000 | | 3 | | 96.1 | | 93.4 | | 94.3 | | 94.5 | | 94.0 | | 13,987,965 | | 6 | | 4 | | 105 | |
420 Lexington Ave (Graybar) | | Grand Central North | | Operating Sublease | | 1,188,000 | | 9 | | 95.4 | | 95.0 | | 93.2 | | 95.8 | | 94.0 | | 44,027,612 | | 18 | | 13 | | 239 | |
440 Ninth Avenue | | Times Square South | | Fee Interest | | 339,000 | | 3 | | 92.5 | | 92.3 | | 97.1 | | 86.7 | | 86.7 | | 7,912,782 | | 3 | | 2 | | 13 | |
470 Park Avenue South | | Park Avenue South/ Flatiron | | Fee Interest | | 260,000 | | 2 | | 92.7 | | 99.7 | | 99.3 | | 99.3 | | 98.8 | | 7,435,463 | | 3 | | 2 | | 23 | |
555 West 57th | | Midtown West | | Fee Interest | | 941,000 | | 7 | | 100.0 | | 100.0 | | 100.0 | | 100.0 | | 100.0 | | 20,835,113 | | 8 | | 6 | | 22 | |
673 First Avenue | | Grand Central South | | Leasehold Interest | | 422,000 | | 3 | | 99.8 | | 99.8 | | 99.8 | | 99.8 | | 99.8 | | 13,363,213 | | 5 | | 4 | | 17 | |
70 West 36th Street | | Times Square South | | Fee Interest | | 151,000 | | 1 | | 90.4 | | 92.3 | | 93.1 | | 94.3 | | 99.2 | | 3,786,117 | | 2 | | 1 | | 31 | |
711 Third Avenue | | Grand Central North | | Operating Sublease (1) | | 524,000 | | 4 | | 99.8 | | 99.1 | | 100.0 | | 100.0 | | 100.0 | | 19,523,531 | | 8 | | 6 | | 19 | |
1370 Broadway | | Times Square South | | Fee Interest | | 255,000 | | 2 | | 95.1 | | 89.5 | | 92.3 | | 92.3 | | 98.0 | | 7,144,883 | | 3 | | 2 | | 26 | |
Subtotal / Weighted Average | | 6,565,000 | | 51 | | 96.8 | | 96.6 | | 96.6 | | 96.5 | | 96.5 | | 201,898,353 | | 81 | | 61 | | 762 | |
| | | | | | | | | | | | | | | | | | | | | | | | | | | |
Adjustments | | | | | | | | | | | | | | | | | | | | | | | | | | | |
| | | | | | | | | | | | | | | | | | | | | | | | | | | |
125 Broad Street | | Downtown | | Fee Interest | | 525,000 | | 4 | | 100.0 | | | | | | | | | | 15,452,628 | | 6 | | 4 | | 5 | |
220 East 42nd Street | | Grand Central East | | Fee Interest | | 1,135,000 | | 9 | | 91.9 | | | | | | | | | | 31,728,242 | | 13 | | 10 | | 44 | |
Subtotal / Weighted Average | | 1,660,000 | | 13 | | 94.5 | | | | | | | | | | 47,180,870 | | 19 | | 14 | | 49 | |
| | | | | | | | | | | | | | | | | | | | | | | | | | | |
Total/ Weighted Average Properties 100% Owned | | 8,225,000 | | 65 | | 96.3 | | 96.6 | | 96.6 | | 96.5 | | 96.6 | | 249,079,223 | | 100 | | 75 | | 811 | |
| | | | | | | | | | | | | | | | | | | | | | | | | | | |
PROPERTIES <100% OWNED | |
Unconsolidated | | | | | | | | | | | | | | | | | | | | | | | | | | | |
180 Madison Avenue - 50% | | Grand Central South | | Fee Interest | | 265,000 | | 2 | | 83.8 | | 82.0 | | 82.1 | | 87.3 | | 89.7 | | 6,982,848 | | | | 1 | | 50 | |
1 Park Avenue - 55% | | Grand Central South | | Various Interests | | 913,000 | | 7 | | 85.9 | | 98.6 | | 98.6 | | 98.4 | | 98.3 | | 24,663,185 | | | | 5 | | 17 | |
1250 Broadway -55% | | Penn Station | | Fee Interest | | 670,000 | | 5 | | 98.2 | | 98.5 | | 99.3 | | 99.3 | | 99.5 | | 21,920,853 | | | | 4 | | 26 | |
100 Park Avenue - 50% | | Grand Central South | | Fee Interest | | 834,000 | | 6 | | 98.3 | | 99.0 | | 100.0 | | 100.0 | | 100.0 | | 29,857,593 | | | | 4 | | 36 | |
1515 Broadway - 55% | | Times Square | | Fee Interest | | 1,750,000 | | 14 | | 96.7 | | 98.5 | | 98.3 | | 98.5 | | | | 63,139,398 | | | | 10 | | 18 | |
321 West 44th Street -35% | | Times Square | | Fee Interest | | 203,000 | | 2 | | 90.6 | | 90.6 | | 90.2 | | 97.7 | | 97.4 | | 4,743,694 | | | | 1 | | 27 | |
Subtotal / Weighted Average | | 4,635,000 | | 36 | | 94.1 | | 97.3 | | 97.5 | | 98.2 | | 98.1 | | 151,307,570 | | | | 25 | | 174 | |
| | | | | | | | | | | | | | | | | | | | | | | | | | | |
Grand Total/ Weighted Average | | 12,860,000 | | 100 | | 95.5 | | 96.9 | | 97.0 | | 97.2 | | 97.0 | | 400,386,793 | | | | | | 985 | |
Grand Total - SLG share of Annualized Rent | | | | | | | | | | | | | | | | 329,470,786 | | | | 100 | | | |
(1) Including Ownership of 50% in Building Fee
27
LARGEST TENANTS BY SQUARE FEET LEASED
Wholly Owned Portfolio + Allocated JV Properties
| | | | | | | | | | | | | | | | % of | |
| | | | | | Total | | | | | | % of | | SLG Share of | | SLG Share of | |
| | | | Lease | | Leased | | Annualized | | PSF | | Annualized | | Annualized | | Annualized | |
Tenant | | Property | | Expiration | | Square Feet | | Rent ($) | | Annualized | | Rent | | Rent($) | | Rent | |
Viacom International, Inc. | | 1515 Broadway | | 2004, 2006, 2008, 2009, 2013 | | 1,280,108 | | $ | 53,496,216 | | $ | 41.79 | | 13.4 | % | $ | 29,422,919 | | 8.9 | % |
Omnicom Group | | 220 East 42nd Street | | 2008, 2009, 2010, 2017 | | 419,111 | | $ | 11,705,772 | | $ | 27.93 | | 2.9 | % | $ | 11,705,772 | | 3.6 | % |
Salomon Smith Barney | | 125 Broad Street | | 2005, 2006, 2010, 2011 | | 330,900 | | $ | 9,663,636 | | $ | 29.20 | | 2.4 | % | $ | 9,663,636 | | 2.9 | % |
The City of New York | | 17 Battery Place | | 2012 | | 325,664 | | $ | 5,701,920 | | $ | 17.51 | | 1.4 | % | $ | 5,701,920 | | 1.7 | % |
Visting Nurse Services | | 1250 Broadway | | 2005, 2006 & 2011 | | 251,251 | | $ | 7,022,544 | | $ | 27.95 | | 1.8 | % | $ | 3,862,399 | | 1.2 | % |
City University of New York -CUNY | | 555 West 57th Street | | 2010, 2011, & 2015 | | 249,854 | | $ | 5,701,920 | | $ | 22.82 | | 1.4 | % | $ | 5,701,920 | | 1.7 | % |
BMW of Manhattan, Inc. | | 555 West 57th Street | | 2012 | | 227,782 | | $ | 3,330,660 | | $ | 14.62 | | 0.8 | % | $ | 3,330,660 | | 1.0 | % |
Philip Morris Managament Corp | | 100 Park Avenue | | 2007 | | 175,887 | | $ | 6,771,024 | | $ | 38.50 | | 1.7 | % | $ | 3,378,741 | | 1.0 | % |
J&W Seligman & Co., Inc. | | 100 Park Avenue | | 2009 | | 168,390 | | $ | 5,326,740 | | $ | 31.63 | | 1.3 | % | $ | 2,658,043 | | 0.8 | % |
C.B.S., Inc. | | 555 West 57th Street | | 2010 | | 165,214 | | $ | 3,756,864 | | $ | 22.74 | | 0.9 | % | $ | 3,756,864 | | 1.1 | % |
Segal Company | | 1 Park Avenue | | 2009 | | 157,944 | | $ | 5,722,068 | | $ | 36.23 | | 1.4 | % | $ | 3,147,137 | | 1.0 | % |
Metro North Commuter Railroad Co. | | 420 Lexington Avenue | | 2008 & 2016 | | 134,687 | | $ | 3,928,716 | | $ | 29.17 | | 1.0 | % | $ | 3,928,716 | | 1.2 | % |
St. Luke's Roosevelt Hospital | | 555 West 57th Street | | 2014 | | 133,700 | | $ | 3,205,656 | | $ | 23.98 | | 0.8 | % | $ | 3,205,656 | | 1.0 | % |
Tribune Newspaper | | 220 East 42nd Street | | 2010 | | 131,665 | | $ | 3,844,644 | | $ | 29.20 | | 1.0 | % | $ | 3,844,644 | | 1.2 | % |
Coty Inc. | | 1 Park Avenue | | 2015 | | 102,654 | | $ | 3,842,592 | | $ | 37.43 | | 1.0 | % | $ | 2,113,426 | | 0.6 | % |
Minskoff/Nederlander JV (1) | | 1515 Broadway | | 2024 | | 102,452 | | $ | 210,000 | | $ | 2.05 | | 0.1 | % | $ | 115,500 | | 0.0 | % |
Ross Stores | | 1372 Broadway | | 2010 | | 101,741 | | $ | 2,761,752 | | $ | 27.14 | | 0.7 | % | $ | 2,761,752 | | 0.8 | % |
Ketchum, Inc. | | 711 Third Avenue | | 2015 | | 100,876 | | $ | 4,343,568 | | $ | 43.06 | | 1.1 | % | $ | 4,343,568 | | 1.3 | % |
CHF Industries | | 1 Park Avenue | | 2005 | | 100,000 | | $ | 3,512,460 | | $ | 35.12 | | 0.9 | % | $ | 1,931,853 | | 0.6 | % |
New York Presbyterian Hospital | | 555 West 57th Street & 673 First Avenue | | 2006 & 2009 | | 99,650 | | $ | 2,862,744 | | $ | 28.73 | | 0.7 | % | $ | 2,862,744 | | 0.9 | % |
Ann Taylor Inc. | | 1372 Broadway | | 2010 | | 93,020 | | $ | 2,738,340 | | $ | 29.44 | | 0.7 | % | $ | 2,738,340 | | 0.8 | % |
United Nations Population Fund | | 220 East 42nd Street | | 2010 | | 91,021 | | $ | 3,936,840 | | $ | 43.25 | | 1.0 | % | $ | 3,936,840 | | 1.2 | % |
| | | | | | | | | | | | | | | | | |
Crain Communications Inc. | | 711 Third Avenue | | 2009 | | 90,531 | | $ | 3,439,656 | | $ | 37.99 | | 0.9 | % | $ | 3,439,656 | | 1.0 | % |
Information Builders Inc | | 1250 Broadway | | 2003 | | 88,571 | | $ | 2,171,772 | | $ | 24.52 | | 0.5 | % | $ | 1,194,475 | | 0.4 | % |
Advanstar Communications | | 1 Park Avenue | | 2010 | | 85,284 | | $ | 3,011,532 | | $ | 35.31 | | 0.8 | % | $ | 1,656,343 | | 0.5 | % |
TOTAL | | 5,207,957 | | $ | 162,009,636 | | $ | 31.11 | | 40.5 | % | $ | 120,403,523 | | 36.5 | % |
| | | | | | | | | | | | | | | | | |
Wholly Owned Portfolio + Allocated JV Properties | | 12,860,000 | | $ | 400,386,793 | | $ | 31.13 | | | | $ | 329,470,786 | | | |
(1) Minskoff/Nederlander JV pays percentage rent.
28
FIRST QUARTER 2003 - LEASING ACTIVITY
Available Space
Activity Type | | Building Address | | # of Leases | | Usable SF | | Rentable SF | | Rent/Rentable SF ($'s) | |
Vacancy at 12/31/02 | | | | | | 358,910 | | | | | |
| | | | | | | | | | | |
Acquired Vacancies | |
Office | | | | | | | | | | | |
| | 220 East 42nd Street | | | | 97,309 | | | | | |
| | | | | | | | | | | |
Sold Vacancies | |
Office | | | | | | | | | | | |
| | 50 West 23rd Street | | | | (9,479 | ) | | | | |
| | | | | | | | | | | |
Expiring Space | |
Office | | | | | | | | | | | |
| | 317 Madison Avenue | | 3 | | 3,653 | | 4,373 | | 27.52 | |
| | 1515 Broadway | | 2 | | 31,215 | | 31,215 | | 65.70 | |
| | 1 Park Avenue | | 2 | | 216,365 | | 216,365 | | 41.71 | |
| | 180 Madison Avenue | | 3 | | 3,043 | | 3,043 | | 35.08 | |
| | 100 Park Avenue | | 2 | | 7,441 | | 9,675 | | 30.87 | |
| | 1250 Broadway | | 1 | | 2,091 | | 3,072 | | 42.00 | |
| | 286 Madison | | 1 | | 1,674 | | 2,102 | | 31.51 | |
| | 292 Madison | | 1 | | 8,113 | | 10,113 | | 26.17 | |
| | 1414 Ave of Americas | | 1 | | 1,430 | | 1,850 | | 25.92 | |
| | 70 West 36th Street | | 1 | | 2,733 | | 3,789 | | 20.24 | |
| | 470 Park Avenue South | | 3 | | 18,122 | | 24,767 | | 28.92 | |
| | 1140 Sixth Avenue | | 1 | | 1,317 | | 1,870 | | 32.00 | |
| | 110 East 42nd Street | | 1 | | 594 | | 785 | | 32.48 | |
| | 321 W 44th Street | | 1 | | 3,794 | | 4,548 | | 20.00 | |
| | 1466 Broadway | | 13 | | 11,504 | | 14,455 | | 33.44 | |
| | 420 Lexington Avenue | | 12 | | 28,041 | | 30,341 | | 35.15 | |
| | | | | | | | | | | |
| | Total/Weighted Average | | 48 | | 341,130 | | 362,363 | | 40.37 | |
| | | | | | | | | | | |
Storage | | | | | | | | | | | |
| | 317 Madison | | 1 | | 51 | | 51 | | 12.00 | |
| | 1 Park Avenue | | 1 | | 2,079 | | 2,654 | | 22.00 | |
| | 1466 Broadway | | 1 | | 359 | | 359 | | 6.69 | |
| | 420 Lexington Avenue | | 1 | | 149 | | 219 | | 18.02 | |
| | | | | | | | | | | |
| | Total/Weighted Average | �� | 4 | | 2,638 | | 3,283 | | 19.90 | |
| | | | | | | | | | | |
Move Outs | |
Office | | | | | | | | | | | |
| | 317 Madison Avenue | | 1 | | 1,791 | | 2,558 | | 41.82 | |
| | 1414 Sixth Avenue | | 1 | | 1,567 | | 2,381 | | 44.02 | |
| | 1372 Broadway | | 1 | | 3,016 | | 3,016 | | 45.44 | |
| | 1466 Broadway | | 3 | | 3,203 | | 4,620 | | 30.41 | |
| | 420 Lexington Avenue | | 1 | | 81 | | 116 | | 27.32 | |
| | Total/Weighted Average | | 7 | | 9,658 | | 12,691 | | 38.81 | |
| | | | | | | | | | | |
Retail | | | | | | | | | | | |
| | 420 Lexington Avenue | | 1 | | 200 | | 200 | | 37.08 | |
| | Total/Weighted Average | | 1 | | 200 | | 200 | | 37.08 | |
| | | | | | | | | | | |
Relocating Tenants | |
Office | | | | | | | | | | | |
| | 317 Madison Avenue | | 1 | | 1,371 | | 1,535 | | 48.59 | |
| | 1466 Broadway | | 1 | | 1,649 | | 2,215 | | 41.20 | |
| | 420 Lexington Avenue | | 4 | | 11,575 | | 15,445 | | 53.92 | |
| | Total/Weighted Average | | 6 | | 14,595 | | 19,195 | | 52.02 | |
Available Space | |
Office | | | | 61 | | 365,383 | | 394,249 | | 40.89 | |
Retail | | | | 1 | | 200 | | 200 | | 37.08 | |
Storage | | | | 4 | | 2,638 | | 3,283 | | 19.90 | |
| | Total | | 66 | | 368,221 | | 397,732 | | 40.71 | |
| | | | | | | | | | | |
Available Space | | | | | | 814,961 | | | | | |
* Escalated Rent is calculated as Total Annual Income less Electric Charges.
29
FIRST QUARTER - 2003 LEASING ACTIVITY
Leased Space
Activity Type | | Building Address | | # of Leases | | Term (Yrs) | | Usable SF | | Rentable SF | | New Cash Rent / Rentable SF | | Prev. Escalated Rent/ Rentable SF | | T.I / Rentable SF | | Free Rent # of Months | |
Available Space as 3/31/03 | | | | | | | | 814,961 | | | | | | | | | | | |
Renewing Tenants | |
Office | | | | | | | | | | | | | | | | | | | |
| | 317 Madison Avenue | | 1 | | 3.2 | | 698 | | 715 | | 27.00 | | 21.00 | | - | | - | |
| | 100 Park Avenue | | 1 | | 2.4 | | 1,663 | | 2,413 | | 40.00 | | 38.00 | | - | | 2.0 | |
| | 110 East 42nd Street | | 1 | | 1.0 | | 594 | | 785 | | 32.50 | | 32.48 | | - | | - | |
| | 1466 Broadway | | 4 | | 3.0 | | 2,590 | | 3,667 | | 36.47 | | 35.91 | | 1.15 | | 4.5 | |
| | Total/Weighted Average | | 7 | | 2.6 | | 5,545 | | 7,580 | | 36.29 | | 34.82 | | 0.56 | | 1.2 | |
| | | | | | | | | | | | | | | | | | | |
Storage | | | | | | | | | | | | | | | | | | | |
| | | | | | | | | | | | | | | | | | | |
| | Total/Weighted Average | | | | | | | | | | | | | | | | | |
| | | | | | | | | | | | | | | | | | | |
Relocating Tenants | |
| | | | | | | | | | | | | | | | | | | |
Office | | | | | | | | | | | | | | | | | | | |
| | 317 Madison Avenue | | 1 | | 3.4 | | 561 | | 824 | | 42.00 | | 48.59 | | 7.92 | | - | |
| | 1466 Broadway | | 1 | | 3.9 | | 1,946 | | 2,614 | | 39.00 | | 34.91 | | 2.62 | | - | |
| | 420 Lexington Avenue | | 4 | | 5.8 | | 15,564 | | 22,235 | | 41.90 | | 30.66 | | 22.59 | | 3.1 | |
| | Total/Weighted Average | | 6 | | 5.5 | | 18,071 | | 25,673 | | 41.61 | | 31.67 | | 20.59 | | 0.7 | |
| | | | | | | | | | | | | | | | | | | |
New Tenants Replacing Old Tenants | |
| | | | | | | | | | | | | | | | | | | |
Office | | | | | | | | | | | | | | | | | | | |
| | 317 Madison Avenue | | 5 | | 3.3 | | 9,684 | | 14,219 | | 27.55 | | 24.38 | | 10.73 | | 6.0 | |
| | 1370 Broadway | | 3 | | 8.5 | | 14,329 | | 18,885 | | 23.48 | | 32.78 | | 10.31 | | 8.1 | |
| | 1 Park Avenue | | 2 | | 7.9 | | 100,490 | | 117,500 | | 41.61 | | 41.39 | | 23.22 | | 13.8 | |
| | 180 Madison Avenue | | 3 | | 4.6 | | 6,200 | | 7,816 | | 37.34 | | 21.84 | | 31.63 | | 8.0 | |
| | 286 Madison Avenue | | 1 | | 3.0 | | 2,034 | | 2,906 | | 30.00 | | 25.78 | | 5.00 | | - | |
| | 1414 Sixth Avenue | | 1 | | 5.0 | | 1,567 | | 2,382 | | 36.00 | | 44.02 | | 7.33 | | 2.0 | |
| | 1372 Broadway | | 1 | | 10.6 | | 8,749 | | 11,362 | | 28.00 | | 23.13 | | 23.71 | | 6.5 | |
| | 711 Third Avenue | | 1 | | 4.5 | | 3,417 | | 4,882 | | 43.00 | | 31.65 | | 16.00 | | 3.0 | |
| | 1466 Broadway | | 4 | | 1.5 | | 3,028 | | 4,447 | | 35.54 | | 36.34 | | 3.90 | | 3.5 | |
| | 420 Lexington Avenue | | 6 | | 5.1 | | 11,971 | | 18,969 | | 35.17 | | 39.53 | | 13.84 | | 18.1 | |
| | Total/Weighted Average | | 27 | | 7.0 | | 161,469 | | 203,368 | | 37.09 | | 36.92 | | 19.58 | | 4.6 | |
| | | | | | | | | | | | | | | | | | | |
Retail | | | | | | | | | | | | | | | | | | | |
| | 1372 Broadway | | 1 | | 5.0 | | 3,016 | | 3,016 | | 42.10 | | 45.44 | | - | | - | |
| | Total/Weighted Average | | 1 | | 5.0 | | 3,016 | | 3,016 | | 42.10 | | 45.44 | | - | | - | |
| | | | | | | | | | | | | | | | | | | |
Storage | | | | | | | | | | | | | | | | | | | |
| | | | | | | | | | | | | | | | | | | |
| | 420 Lexington Avenue | | 1 | | 1.8 | | 52 | | 74 | | 25.00 | | 12.00 | | - | | - | |
| | Total/Weighted Average | | 1 | | 1.8 | | 52 | | 74 | | 25.00 | | 12.00 | | - | | - | |
30
FIRST QUARTER - 2003 LEASING ACTIVITY
Leased Space
Activity Type | | Building Address | | # of Leases | | Term (Yrs) | | Usable SF | | Rentable SF | | New Cash Rent / Rentable SF | | Prev. Escalated Rent/ Rentable SF | | T.I / Rentable SF | | Free Rent # of Months | |
New Tenants Replacing Vacancies | |
Office | | | | | | | | | | | | | | | | | | | |
| | 317 Madison Avenue | | 2 | | 8.2 | | 7,297 | | 10,419 | | 35.41 | | - | | 43.8 | | 7.0 | |
| | 220 East 42nd Street | | 3 | | 10.2 | | 5,438 | | 7,718 | | 44.00 | | - | | 40.2 | | 3.0 | |
| | 440 Ninth Avenue | | 1 | | 7.0 | | 558 | | 797 | | 29.00 | | - | | - | | 4.0 | |
| | 1466 Broadway | | 3 | | 4.0 | | 4,038 | | 5,338 | | 35.82 | | - | | 8.67 | | 2.0 | |
| | 420 Lexington Avenue | | 3 | | 6.8 | | 9,567 | | 14,819 | | 36.11 | | - | | 36.04 | | 10.0 | |
| | Total/Weighted Average | | 12 | | 7.4 | | 26,898 | | 39,091 | | 38.05 | | - | | 34.46 | | 1.9 | |
| | | | | | | | | | | | | | | | | | | |
Storage | | | | | | | | | | | | | | | | | | | |
| | 420 Lexington | | 1 | | 4.4 | | 144 | | 205 | | 20.00 | | - | | - | | - | |
| | Total/Weighted Average | | 1 | | 6.3 | | 144 | | 205 | | 20.00 | | - | | - | | - | |
| | | | | | | | | | | | | | | | | | | |
Leased Space | |
Office | | | | 52 | | 6.8 | | 211,983 | | 275,712 | | 37.62 | | 36.28 | | 21.22 | | 4.1 | |
Retail | | | | 1 | | 5.0 | | 3,016 | | 3,016 | | 42.10 | | 45.44 | | - | | - | |
Storage | | | | 2 | | 5.1 | | 196 | | 279 | | 21.33 | | 3.18 | | - | | - | |
| | Total | | 55 | | 6.8 | | 215,195 | | 279,007 | | 37.65 | | 36.39 | | 20.96 | | 4.0 | |
| | | | | | | | | | | | | | | | | | | |
Sold Vacancies | |
| | | | | | | | | | | | | | | | | | | |
Sub-Total Available Space @ 3/31/03 | | 599,766 | | | | | | | | | | | |
| | | | | | | | | | | | | | | | | | | |
Holdover Tenants | |
| | 317 Madison | | 1 | | 0 | | 546 | | 702 | | 30.00 | | 30.00 | | - | | - | |
| | 1515 Broadway | | 1 | | 0 | | 640 | | 640 | | 20.00 | | 20.00 | | - | | - | |
| | 1 Park Avenue | | 1 | | 0 | | 2,079 | | 2,654 | | 22.00 | | 22.00 | | - | | - | |
| | 180 Madison Avenue | | 2 | | 0 | | 1,636 | | 1,636 | | 33.01 | | 33.01 | | - | | - | |
| | 286 Madison Avenue | | 1 | | 0 | | 1,674 | | 2,102 | | 31.51 | | 31.51 | | - | | - | |
| | 321 West 44th Street | | 1 | | 0 | | 3,794 | | 4,548 | | 12.93 | | 20.00 | | - | | - | |
| | 1466 Broadway | | 7 | | 0 | | 6,743 | | 8,455 | | 32.90 | | 32.90 | | - | | - | |
| | 420 Lexington Avenue | | 3 | | 0 | | 7,201 | | 8,333 | | 34.70 | | 34.70 | | - | | - | |
| | | | 17 | | 0 | | 24,313 | | 29,070 | | 28.85 | | 29.95 | | - | | - | |
| | | | | | | | | | | | | | | | | | | |
Total Available Space @ 3/31/03 | | 575,453 | | | | | | | | | | | |
31
FIRST QUARTER - 2003 LEASING ACTIVITY
Leased Space
Activity Type | | Building Address | | # of Leases | | Term (Yrs) | | Usable SF | | Rentable SF | | New Cash Rent / Rentable SF | | Prev. Escalated Rent/ Rentable SF | | T.I / Rentable SF | | Free Rent # of Months | |
Early Renewals | |
Office | | | | | | | | | | | | | | | | | | | |
| | 555 West 57th Street | | 1 | | 5.0 | | 22,214 | | 31,766 | | 29.00 | | 23.69 | | 5.00 | | - | |
| | 70 West 36th Street | | 1 | | 2.0 | | 1,105 | | 1,616 | | 24.00 | | 22.73 | | - | | - | |
| | 711 Third Avenue | | 1 | | 1.0 | | 2,727 | | 3,864 | | 31.00 | | 28.27 | | - | | - | |
| | 1466 Broadway | | 1 | | 2.8 | | 2,041 | | 2,830 | | 38.00 | | 40.83 | | 5.00 | | - | |
| | 420 Lexington | | 1 | | 5.0 | | 724 | | 945 | | 33.00 | | 41.21 | | 4.71 | | - | |
| | | | 5 | | 4.4 | | 28,811 | | 41,021 | | 29.70 | | 25.67 | | 4.33 | | - | |
| | | | | | | | | | | | | | | | | | | |
Retail | | | | | | | | | | | | | | | | | | | |
| | 70 West 36th Street | | 1 | | 7.0 | | 3,844 | | 3,844 | | 39.36 | | 61.85 | | 4.03 | | - | |
| | | | 1 | | 7.0 | | 3,844 | | 3,844 | | 39.36 | | 61.85 | | 4.03 | | - | |
| | | | | | | | | | | | | | | | | | | |
Storage | | | | | | | | | | | | | | | | | | | |
| | 70 West 36th Street | | 1 | | 7.0 | | 3,137 | | 4,514 | | 19.65 | | 9.97 | | - | | - | |
| | 555 West 57th Street | | 1 | | 5.0 | | 2,017 | | 2,915 | | 15.00 | | 15.00 | | - | | - | |
| | | | 2 | | 6.6 | | 5,154 | | 7,429 | | 23.05 | | 16.88 | | - | | - | |
| | | | | | | | | | | | | | | | | | | |
Renewals | |
| | Expired/Renewed Office | | 7 | | 2.6 | | 5,545 | | 7,580 | | 36.29 | | 34.82 | | 0.56 | | 1.2 | |
| | Early Renewals Office | | 5 | | 4.4 | | 28,811 | | 41,021 | | 29.70 | | 25.67 | | 4.33 | | - | |
| | Early Renewals Retail | | 1 | | 7.0 | | 3,844 | | 3,844 | | 39.36 | | 61.85 | | 4.03 | | - | |
| | Early Renewals Storage | | 2 | | 6.6 | | 5,154 | | 7,429 | | 23.05 | | 16.88 | | - | | - | |
| | Total | | 15 | | 4.6 | | 43,354 | | 59,874 | | 30.33 | | 28.06 | | 3.29 | | 0.4 | |
* Annual Base Rent
** Escalated Rent is calculated as Total Annual Income less Electric Charges.
32
ANNUAL LEASE EXPIRATIONS
Consolidated Properties
Year of Lease Expiration | | Number of Expiring Leases** | | Square Footage of Expiring Leases | | Percentage of Total Leased Sq. Ft. | | Annualized Rent of Expiring Leases ($'s) | | Annualized Rent Per Leased Square Foot of Expiring Leases $/psf *** | | Year 2003 Weighted Average Asking Rent $/psf | |
In 1st Quarter 2003* | | 32 | | 63,280 | | 0.79 | % | $ | 1,908,732 | | $ | 30.16 | | $ | 35.76 | |
In 2nd Quarter 2003 | | 39 | | 174,431 | | 2.17 | % | $ | 5,554,056 | | $ | 31.84 | | $ | 36.07 | |
In 3rd Quarter 2003 | | 33 | | 93,879 | | 1.17 | % | $ | 3,781,596 | | $ | 40.28 | | $ | 36.03 | |
In 4th Quarter 2003 | | 36 | | 252,498 | | 3.14 | % | $ | 6,768,984 | | $ | 26.81 | | $ | 31.98 | |
| | | | | | | | | | | | | |
Total 2003 | | 140 | | 584,088 | | 7.27 | % | $ | 18,013,368 | | $ | 30.84 | | $ | 34.26 | |
| | | | | | | | | | | | | |
2004 | | 143 | | 635,235 | | 7.91 | % | $ | 21,132,420 | | $ | 33.27 | | $ | 32.66 | |
2005 | | 132 | | 540,640 | | 6.73 | % | $ | 17,578,548 | | $ | 32.51 | | $ | 34.10 | |
2006 | | 84 | | 553,043 | | 6.88 | % | $ | 17,134,752 | | $ | 30.98 | | $ | 33.24 | |
2007 | | 87 | | 412,386 | | 5.13 | % | $ | 13,625,004 | | $ | 33.04 | | $ | 34.34 | |
2008 | | 55 | | 497,744 | | 6.19 | % | $ | 15,361,260 | | $ | 30.86 | | $ | 33.09 | |
2009 | | 40 | | 622,735 | | 7.75 | % | $ | 19,691,484 | | $ | 31.62 | | $ | 32.88 | |
2010 | | 54 | | 1,517,465 | | 18.89 | % | $ | 47,810,688 | | $ | 31.51 | | $ | 34.21 | |
2011 | | 23 | | 308,561 | | 3.84 | % | $ | 12,779,388 | | $ | 41.42 | | $ | 35.77 | |
2012 | | 26 | | 807,936 | | 10.06 | % | $ | 18,185,796 | | $ | 22.51 | | $ | 28.26 | |
Thereafter | | 50 | | 1,554,788 | | 19.35 | % | $ | 47,766,515 | | $ | 30.72 | | $ | 34.42 | |
| | | | | | | | | | | | | |
| | 834 | | 8,034,621 | | 100.00 | % | $ | 249,079,223 | | $ | 31.00 | | $ | 33.35 | |
* Includes month to month holdover tenants that expired prior to 3/31/03.
** Tenants may have multiple leases.
** Represents current in place annualized rent allocated by year of maturity.
33
ANNUAL LEASE EXPIRATIONS
Joint Venture Properties
Year of Lease Expiration | | Number of Expiring Leases** | | Square Footage of Expiring Leases | | Percentage of Total Leased Sq. Ft. | | Annualized Rent of Expiring Leases ($'s) | | Annualized Rent Per Leased Square Foot of Expiring Leases $/psf *** | | Year 2003 Weighted Average Asking Rent $/psf | |
In 1st Quarter 2003* | | 5 | | 93,501 | | 2.17 | % | $ | 2,302,056 | | $ | 24.62 | | $ | 35.13 | |
In 2nd Quarter 2003 | | 5 | | 29,272 | | 0.68 | % | $ | 1,048,980 | | $ | 35.84 | | $ | 43.57 | |
In 3rd Quarter 2003 | | 8 | | 35,685 | | 0.83 | % | $ | 1,030,440 | | $ | 28.88 | | $ | 35.59 | |
In 4th Quarter 2003 | | 9 | | 45,389 | | 1.05 | % | $ | 2,703,888 | | $ | 59.57 | | $ | 41.77 | |
| | | | | | | | | | | | | |
Total 2003 | | 27 | | 203,847 | | 4.72 | % | $ | 7,085,364 | | $ | 34.76 | | $ | 39.03 | |
| | | | | | | | | | | | | |
2004 | | 18 | | 152,999 | | 3.54 | % | $ | 6,500,796 | | $ | 42.49 | | $ | 41.01 | |
2005 | | 29 | | 405,515 | | 9.39 | % | $ | 11,514,108 | | $ | 28.39 | | $ | 40.80 | |
2006 | | 25 | | 366,612 | | 8.49 | % | $ | 10,339,968 | | $ | 28.20 | | $ | 37.14 | |
2007 | | 15 | | 286,432 | | 6.63 | % | $ | 11,455,572 | | $ | 39.99 | | $ | 41.82 | |
2008 | | 16 | | 342,212 | | 7.93 | % | $ | 11,175,600 | | $ | 32.66 | | $ | 40.77 | |
2009 | | 17 | | 524,865 | | 12.16 | % | $ | 18,254,568 | | $ | 34.78 | | $ | 40.09 | |
2010 | | 15 | | 1,329,504 | | 30.80 | % | $ | 53,809,476 | | $ | 40.47 | | $ | 44.71 | |
2011 | | 5 | | 101,393 | | 2.35 | % | $ | 4,144,284 | | $ | 40.87 | | $ | 33.41 | |
2012 | | 7 | | 202,403 | | 4.69 | % | $ | 3,738,636 | | $ | 18.47 | | $ | 36.59 | |
Thereafter | | 11 | | 401,384 | | 9.30 | % | $ | 13,289,198 | | $ | 33.03 | | $ | 40.41 | |
| | | | | | | | | | | | | |
| | 185 | | 4,317,166 | | 100.00 | % | $ | 151,307,570 | | $ | 35.05 | | $ | 41.06 | |
* Includes month to month holdover tenants that expired prior to 3/31/03
** Tenants may have multiple leases.
*** Represents in place annualized rent allocated by year of maturity.
34
SUMMARY OF REAL ESTATE ACQUISITION ACTIVITY POST 1997
| | | | | | | | | | | | | | | |
| | Property | | Type of Ownership | | Submarket | | Net Rentable s.f. | | % Leased at acquisition | | % Leased 3/31/2003 | | Acquisition Price ($'s) | |
1998 Acquisitions | |
Mar-98 | | 420 Lexington | | Operating Sublease | | Grand Central North | | 1,188,000 | | 83 | | 95 | | $78,000,000 | |
Mar-98 | | 1466 Broadway | | Fee Interest | | Times Square | | 289,000 | | 87 | | 89 | | $64,000,000 | |
Mar-98 | | 321 West 44th | | Fee Interest | | Times Square | | 203,000 | | 96 | | 91 | | $17,000,000 | |
May-98 | | 711 3rd Avenue | | Operating Sublease | | Grand Central North | | 524,000 | | 79 | | 100 | | $65,600,000 | |
Jun-98 | | 440 9th Avenue | | Fee Interest | | Garment | | 339,000 | | 76 | | 93 | | $32,000,000 | |
Aug-98 | | 1412 Broadway | | Fee Interest | | Times Square South | | 389,000 | | 90 | | N/A | | $82,000,000 | |
| | | | | | | | 2,932,000 | | | | | | $338,600,000 | |
1999 Acquisitions | |
Jan-99 | | 420 Lexington Leasehold | | Sub-leasehold | | Grand Central North | | | | | | - | | $27,300,000 | |
Jan-99 | | 555 West 57th - 65% JV | | Fee Interest | | Midtown West | | 941,000 | | 100 | | 100 | | $66,700,000 | |
May-99 | | 90 Broad Street - 35% JV | | Fee Interest | | Financial | | 339,000 | | 82 | | N/A | | $34,500,000 | |
May-99 | | The Madison Properties: | | Fee Interest | | Grand Central South | | | | | | | | $50,000,000 | |
| | 286 Madison Avenue | | | | | | 112,000 | | 99 | | 95 | | | |
| | 290 Madison Avenue | | | | | | 36,800 | | 86 | | 100 | | | |
| | 292 Madison Avenue | | | | | | 187,000 | | 97 | | 95 | | | |
Aug-99 | | 1250 Broadway - 50% JV | | Fee Interest | | Penn Station | | 670,000 | | 97 | | N/A | | $93,000,000 | |
Nov-99 | | 555 West 57th - remaining 35% | | Fee Interest | | Midtown West | | - | | | | | | $34,100,000 | |
| | | | | | | | 2,285,800 | | | | | | $305,600,000 | |
2000 Acquisitions | |
Feb-00 | | 100 Park Avenue | | Fee Interest | | Grand Central South | | 834,000 | | 97 | | 98 | | $192,000,000 | |
Dec-00 | | 180 Madison Avenue | | Fee Interest | | Grand Central South | | 265,000 | | 90 | | 84 | | $41,250,000 | |
Contribution to JV | |
May-00 | | 321 West 44th | | Fee Interest | | Times Square | | 203,000 | | 98 | | 91 | | $28,400,000 | |
| | | | | | | | 1,302,000 | | | | | | $261,650,000 | |
2001 Acquisitions | |
Jan-01 | | 1370 Broadway | | Fee Interest | | Garment | | 255,000 | | 97 | | 95 | | $50,500,000 | |
Jan-01 | | 1 Park Avenue | | Various Interests | | Grand Central South | | 913,000 | | 97 | | 86 | | $233,900,000 | |
Jan-01 | | 469 7th Avenue - 35% JV | | Fee Interest | | Penn Station | | 253,000 | | 98 | | N/A | | $45,700,000 | |
Jun-01 | | 317 Madison | | Fee Interest | | Grand Central | | 450,000 | | 95 | | 96 | | $105,600,000 | |
Acquisition of JV Interest | |
Sep-01 | | 1250 Broadway - 49.9% JV (1) | | Fee Interest | | Penn Station | | 670,000 | | 98 | | 98 | | $126,500,000 | |
| | | | | | | | 2,541,000 | | | | | | $562,200,000 | |
| | | | | | | | | | | | | | | |
2002 Acquisitions | |
May-02 | | 1515 Broadway - 55% JV | | Fee Interest | | Times Square | | 1,750,000 | | 98 | | 97 | | $483,500,000 | |
| | | | | | | | | | | | | | $483,500,000 | |
2003 Acquisitions | |
Feb-03 | | 220 East 42nd Street | | Fee Interest | | United Nations | | 1,135,000 | | 92 | | 92 | | $265,000,000 | |
Mar-03 | | 125 Broad Street | | Fee Interest | | Downtown | | 525,000 | | 100 | | 100 | | $92,000,000 | |
| | | | | | | | 1,660,000 | | | | | | $357,000,000 | |
(1) Current ownership interest is 55%. (From 9/1/01-10/31/01the company owned 99.8% of this property.)
35
SUMMARY OF REAL ESTATE SALES ACTIVITY POST 1999
| | Property | | Type of Ownership | | Submarket | | Net Rentable s.f. | | Sales Price ($'s) | | Sales Price ($'s/SF) | |
2000 Sales | |
Feb-00 | | 29 West 35th Street | | Fee Structure | | Garment | | 78,000 | | $11,700,000 | | $150 | |
Mar-00 | | 36 West 44th Street | | Fee Structure | | Grand Central | | 178,000 | | $31,500,000 | | $177 | |
May-00 | | 321 West 44th Street - 35 % JV | | Fee Structure | | Times Square | | 203,000 | | $28,400,000 | | $140 | |
Nov-00 | | 90 Broad Street | | Fee Structure | | Financial | | 339,000 | | $60,000,000 | | $177 | |
Dec-00 | | 17 Battery South | | Fee Structure | | Financial | | 392,000 | | $53,000,000 | | $135 | |
| | | | | | | | 1,190,000 | | $184,600,000 | | $156 | |
| | | | | | | | | | | | | |
2001 Sales | |
Jan-01 | | 633 Third Ave | | Fee Structure | | Grand Central North | | 40,623 | | $13,250,000 | | $326 | |
May-01 | | 1 Park Ave - 45% JV | | Fee Structure | | Times Square | | 913,000 | | $233,900,000 | | $256 | |
Jun-01 | | 1412 Broadway | | Fee Structure | | Times Square South | | 389,000 | | $90,700,000 | | $233 | |
Jul-01 | | 110 E. 42nd Street | | Fee Structure | | Grand Central North | | 69,700 | | $14,500,000 | | $208 | |
Sep-01 | | 1250 Broadway (1) | | Fee Structure | | Penn Station | | 670,000 | | $126,500,000 | | $189 | |
| | | | | | | | 2,082,323 | | $478,850,000 | | $242 | |
| | | | | | | | | | | | | |
2002 Sales | |
Jun-02 | | 469 Seventh Avenue | | Fee Structure | | Penn Station | | 253,000 | | $53,100,000 | | $210 | |
| | | | | | | | 253,000 | | $53,100,000 | | $210 | |
| | | | | | | | | | | | | |
2003 Sales | |
Mar-03 | | 50 West 23rd Street | | Fee Structure | | Chelsea | | 333,000 | | $66,000,000 | | $198 | |
| | | | | | | | 333,000 | | $66,000,000 | | $198 | |
(1) Company sold a 45% JV interest in the property at an implied $126.5mm sales price.
36
SUPPLEMENTAL DEFINITIONS
Annualized rent is calculated as monthly base rent and escalations per the lease, as of a certain date, multiplied by 12.
Debt service coverage is adjusted EBITDA divided by total interest and principal payments
Equity income/ (loss) from affiliates are generally accounted for on a cost basis and realized gains and losses are included in current earnings. For its investments in private companies, the Company periodically reviews its investments and management determines if the value of such investments have been permanently impaired. Permanent impairment losses for investments in public and private companies are included in current earnings.
Fixed charge is adjusted EBITDA divided by the total payments for ground leases and preferred stock.
Fixed charge coverage is adjusted EBITDA divided by total interest expense (including capitalized interest and debt premium amortization, but excluding finance cost amortization) plus preferred dividends and distributions.
Funds available for distribution (FAD) is defined as FFO plus non-real estate depreciation, 2% allowance for straight line credit loss, adjustment for straight line ground rent, non-cash deferred compensation, a pro-rata adjustment for FAD for SLG’s unconsolidated JV; less straight line rental income, free rent net of amortization, second cycle tenant improvement and leasing cost, and recurring building improvements.
Funds from operations (FFO) is defined as income from operations before minority interests, gains or losses from sales of real estate and extraordinary items plus real estate depreciation, an adjustment to derive SLG’s pro rata share of the FFO of unconsolidated joint ventures, and perpetual preferred stock dividends. In accordance with NAREIT White Paper on FFO, SLG includes the effects of straight-line rents in FFO.
Interest coverage is adjusted EBITDA divided by total interest expense.
Junior Mortgage Participations are subordinate interests in first mortgages.
Mezzanine Debt Loans are loans secured by ownership interests.
Operating earnings per share reflects income before minority interests and gains (losses) from dispositions of real estate and impairment reserves on assets held for sale and operating properties less minority interests’ share of income and preferred stock dividends if anti-dilutive.
Percentage leased represents the total percentage of total rentable square feet owned, which is leased, including month-to-month leases, as of the date reported. Space is considered leased when the tenant has either taken physical or economic occupancy.
Preferred Equity Investments are equity investments entitled to preferential returns that are senior to common equity.
Recurring capital expenditures represents non-incremental building improvements and leasing costs required to maintain current revenues. Recurring capital expenditures do not include immediate building improvements that were taken into consideration when underwriting the purchase of a building or which are incurred to bring a building up to “operating standard.”
Redevelopment costs are non-recurring capital expenditures incurred in order to improve buildings to SLG’s “operating standards.” These building costs are taken into consideration during the underwriting for a given property’s acquisition.
Same-store NOI growth is the change in the NOI (excluding straight-line rents) of the same-store properties from the prior year reporting period to the current year reporting period.
Same-store properties include all properties that were owned during both the current and prior year reporting periods and excludes development properties prior to being stabilized for both the current and prior reporting period.
Second generation TI’s and LC’s are tenant improvements, lease commissions, and other leasing costs incurred during leasing of second generations space. Costs incurred prior to leasing available square feet are not included until such space is leased. Second generation space excludes square footage vacant at acquisition.
SLG’s share of total debt to market capitalization is calculated as SLG’s share of total debt divided by the sum of total debt plus market equity and preferred stock equity income redeemable shares. SLG’s share of total debt includes total consolidated debt plus SLG’s pro rata share of the debt of unconsolidated joint ventures less than JV partners’ share of debt. Market equity assumes conversion of all OP units into common stock.
Total square feet owned represents 100% of the square footage of properties either owned directly by SLG or in which SLG has a controlling interest (e.g. consolidated joint ventures).
37
CORPORATE GOVERNANCE
Stephen L. Green | Thomas E. Wirth |
Chairman of the Board and CEO | Chief Financial Officer |
Marc Holliday | Gerard Nocera |
President | Executive VP, Director of Real Estate |
Michael W. Reid | Andrew S. Levine |
Chief Operating Officer | General Counsel and Secretary |
ANALYST COVERAGE
Firm | | Analyst | | Phone | | Email | |
AG Edwards | | Dave Aubuchon | | (314 955-5452) | | aubuchond@agedwards.com | |
Corinthian Partners, LLC | | Claus Hirsch | | (212 287-1565) | | cwhirsch@rcn.com | |
Credit Suisse First Boston | | Larry Raiman | | (212 538-2380) | | lawrence.raiman@csfb.com | |
Deutsche Banc Alex. Brown | | Louis W. Taylor | | (212 469-4912) | | louis.taylor@db.com | |
Goldman Sachs | | David J. Kostin | | (212 902-6781) | | david.kostin@gs.com | |
Legg Mason Wood Walker, Inc. | | David Fick | | (410 454-5018) | | dmfick@leggmason.com | |
Lehman Brothers, Inc. | | David Shulman | | (212 526-3413) | | dshulman@lehman.com | |
J.P. Morgan Securities Inc. | | Anthony Paolone | | (212 622-6682) | | anthony.paolone@jpmorgan.com | |
McDonald & Company | | Anatole Pevnev | | (216 263-4783) | | apevnev@mcdinvest.com | |
Prudential Securities | | James W. Sullivan | | (212 778-2515) | | jim_sullivan@prusec.com | |
Raymond James & Associates | | Paul Puryear | | (727 573-8607) | | ppuryear@ecm.rjf.com | |
Salomon Smith Barney | | Jonathan Litt | | (212 816-0231) | | jonathan.litt@ssmb.com | |
Wachovia Securities | | Christopher Haley | | (443 263-6773) | | christopher.haley@wachovia.com | |
 SL Green Realty Corp. is followed by the analyst(s) listed above. Please note that any opinions, estimates or forecasts regarding SL Green Realty Corp.’s performance made by these analysts are theirs alone and do not represent opinions, forecasts or predictions of SL Green Realty Corp. or its management. SL Green Realty Corp. does not by its reference above or distribution imply its endorsement of or concurrence with such information, conclusions or recommendations.
38
