Exhibit 99.2
SL Green Realty Corp. is a fully integrated, self-administered and self-managed Real Estate Investment Trust, or REIT, that primarily acquires, owns, manages, leases and repositions office properties in emerging, high-growth submarkets of Manhattan.
· SL Green’s common stock is listed on the New York Stock Exchange, and trades under the symbol SLG.
· SL Green maintains an internet site at www.slgreen.com at which most key investor relations data pertaining to dividend declaration, payout, current and historic share price, etc. can be found. Such information is not reiterated in this supplemental financial package. This supplemental financial package is available through the Company’s internet site.
· This data is presented to supplement audited and unaudited regulatory filings of the Company and should be read in conjunction with those filings. The financial data herein is unaudited and is provided from the prospective of timeliness to assist readers of quarterly and annual financial filings. As such, data otherwise contained in future regulatory filings covering the same period may be restated from the data presented herein.
Questions pertaining to the information contained herein should be referred to Investor Relations at investor.relations@slgreen.com or at 212-216-1601.
This report includes certain statements that may be deemed to be “forward-looking statements” within the meaning of Section 27A of the Securities Act of 1933, as amended, and Section 21E of the Securities Exchange Act of 1934, as amended. All statements, other than statements of historical facts, included in this report that address activities, events or developments that the Company expects, believes or anticipates will or may occur in the future, including such matters as future capital expenditures, dividends and acquisitions (including the amount and nature thereof), expansion and other development trends of the real estate industry, business strategies, expansion and growth of the Company’s operations and other such matters are forward-looking statements. These statements are based on certain assumptions and analyses made by the Company in light of its experience and its perception of historical trends, current conditions, expected future developments and other factors it believes are appropriate. Such statements are subject to a number of assumptions, risks and uncertainties, general economic and business conditions, the business opportunities that may be presented to and pursued by the Company, changes in laws or regulations and other factors, many of which are beyond the control of the Company. Any such statements are not guarantees of future performance and actual results or developments may differ materially from those anticipated in the forward-looking statements.
The following discussion related to the consolidated financial statements of the Company should be read in conjunction with the financial statements for the quarter ended June 30, 2007 that will subsequently be released on Form 10-Q to be filed on or before August 9, 2007.
2
TABLE OF CONTENTS | 
|
Highlights of Current Period Financial Performance | |
| |
Unaudited Financial Statements | |
Corporate Profile | 4 |
Financial Highlights | 5-14 |
Balance Sheets | 15-16 |
Statements of Operations | 17 |
Funds From Operations | 18 |
Statement of Stockholders’ Equity | 19 |
Taxable Income | 20 |
Joint Venture Statements | 21-24 |
| |
Selected Financial Data | 25-28 |
| |
Summary of Debt and Ground Lease Arrangements | 29-31 |
| |
Mortgage Investments and Preferred Equity | 32-33 |
| |
Property Data | |
Composition of Property Portfolio | 34-35 |
Top Tenants | 36 |
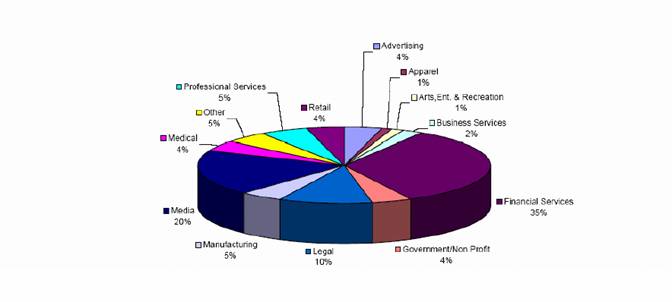
Tenant Diversification | 37 |
Leasing Activity Summary | 38-41 |
Lease Expiration Schedule | 42-43 |
| |
Summary of Acquisition/Disposition Activity | 44-46 |
Supplemental Definitions | 47 |
Corporate Information | 48 |
3
CORPORATE PROFILE |
|
SL Green Realty Corp., or the Company, is New York City’s largest commercial office landlord and is the only fully integrated, self-managed, self-administered Real Estate Investment Trust, or REIT, primarily focused on owning and operating office buildings in Manhattan.
The Company was formed on August 20, 1997 to continue the commercial real estate business of S.L. Green Properties Inc., a company that was founded in 1980 by Stephen L. Green, our current Chairman. For more than 25 years SL Green has been engaged in the business of owning, managing, leasing, acquiring and repositioning office properties in Manhattan. The Company’s investment focus is to create value through strategically acquiring, redeveloping and repositioning office properties primarily located in Manhattan, and re-leasing and managing these properties for maximum cash flow.
In 2007, SL Green acquired Reckson Associates Realty Corp. and added over 9 million square feet to its portfolio. Included in this total is over 3 million square feet of Class A office space located in Westchester, New York and Stamford, Connecticut. These suburban portfolios serve as natural extensions of SL Green’s core ownership in the Grand Central submarket of Midtown Manhattan. The Company has since made selective additions to the holdings in these areas.
Looking forward, SL Green will continue its opportunistic investment philosophy through three established business lines: investment in long-term core properties, investment in opportunistic assets, and structured finance investments. Structured finance investments include SL Green’s interest in Gramercy Capital Corp., or Gramercy, (NYSE: GKK) since 2004. SL Green owns approximately 25% of Gramercy. This three-legged investment strategy allows SL Green to balance the components of its portfolio to take advantage of each stage in the business cycle.
4
FINANCIAL HIGHLIGHTS
SECOND QUARTER 2007
UNAUDITED |
|
FINANCIAL RESULTS
Funds From Operations, or FFO, available to common stockholders totaled $79.5 million, or $1.26 per share for the second quarter ended June 30, 2007, a 3.3% increase over the same quarter in 2006 when FFO totaled $57.2 million, or $1.22 per share.
Net income available for common stockholders totaled $265.9 million, or $4.38 per share (diluted) for the second quarter ended June 30, 2007. Net income available to common stockholders totaled $29.1 million or $0.65 per share in the same quarter in 2006. Second quarter 2007 results include gains on sale of $3.98 per share compared to no gains on sale for the same periods in 2006.
Funds available for distribution, or FAD, for the second quarter 2007 increased to $0.97 per share (diluted) versus $0.94 per share (diluted) in the prior year, a 3.2% increase.
The Company’s dividend payout ratio was 55.7% of FFO and 72.1% of FAD before first cycle leasing costs.
All per share amounts are presented on a diluted basis.
CONSOLIDATED RESULTS
Total quarterly revenues increased 108.4% in the second quarter to $257.7 million compared to $123.6 million in the prior year. The $134.1 million growth in revenue resulted primarily from the following items:
· $105.5 million increase from 2007 and 2006 acquisitions, including the Reckson properties,
· $10.1 million increase from same-store properties,
· $10.1 million increase in preferred equity and investment income, and
· $8.4 million increase in other revenue, which was primarily due to incentive and asset management fees earned in 2007 ($7.1 million) as well as from fees earned from Gramercy ($3.4 million) and the Service Corporation ($0.4 million). This was partially offset by a decrease in revenue from discontinued operations ($1.2 million).
The Company’s earnings before interest, taxes, depreciation and amortization, or EBITDA, increased by $76.5 million (106.1%) to $148.6 million. The following items drove EBITDA improvements:
· $58.2 million increase from 2007 and 2006 acquisitions, including the Reckson properties,
· $6.3 million increase from same-store properties.
· $10.1 million increase in preferred equity and investment income. The weighted-average structured finance investment balance for the quarter increased to $699.6 million from $409.7 million in the prior year second quarter. The weighted-average yield for the quarter was 10.5% compared to 10.3% in the prior year.
· $1.5 million increase from increased contributions to equity in net income from unconsolidated joint ventures primarily
5
FINANCIAL HIGHLIGHTS
SECOND QUARTER 2007
UNAUDITED |
|
from Gramercy ($1.8 million), 800 Third Avenue ($0.8 million) and 2 Herald Square ($1.4 million). This was partially offset by reductions in contributions primarily from 521 Fifth Avenue, which is under redevelopment ($0.7 million), 485 Lexington Avenue which is wholly-owned since December 2006 ($0.6 million) and the Mack-Green joint venture ($0.9 million).
· $10.9 million decrease from higher MG&A expense.
· $11.3 million increase in non-real estate revenues net of expenses, primarily due to increased incentive and asset management fees earned in 2007 ($7.1 million) in addition to fee income from Gramercy ($3.4 million).
FFO before minority interests improved $22.3 million primarily as a result of:
· $76.5 million increase in EBITDA,
· $5.1 million decrease in FFO from unconsolidated joint ventures, discontinued operations and non-real estate depreciation, and
· $49.1 million decrease from higher interest expense, including a one-time expense of approximately $8.1 million for exit fees, make-whole payments and the write-off of unamortized deferred financing costs.
SAME-STORE RESULTS
Consolidated Properties
Same-store second quarter 2007 GAAP NOI increased $6.4 million (14.3%) to $51.1 million compared to the prior year. Operating margins before ground rent increased from 50.18% to 51.65%.
The $6.4 million increase in GAAP NOI was primarily due to:
· $5.9 million (7.9%) increase in rental revenue primarily due to improved leasing,
· $1.4 million (10.5%) increase in escalation and reimbursement revenue,
· $2.8 million (2,978.7%) increase in investment and other income,
· $2.9 million (13.2%) increase in operating expenses, primarily driven by increases in payroll and utility costs, but was offset by reductions in insurance costs,
· $0.4 million (7.9%) increase in ground rent expense, and
· $0.4 million (2.3%) increase in real estate taxes.
Joint Venture Properties
The Joint Venture same-store properties second quarter 2007 GAAP NOI increased $0.6 million (2.0%) to $31.8 million compared to the prior year. Operating margins before ground rent increased from 62.12% to 62.37%.
The $0.6 million increase in GAAP NOI was primarily due to:
· $1.2 million (2.8%) increase in rental revenue primarily due to improved leasing,
· $0.4 million (97.0%) decrease in investment and other income, and
6
FINANCIAL HIGHLIGHTS
SECOND QUARTER 2007
UNAUDITED |
|
· $0.2 million (1.7%) increase in operating expenses primarily driven by increases in utilities and repairs and maintenance which were partially offset by a reduction in insurance.
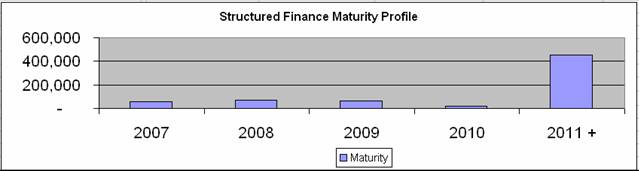
STRUCTURED FINANCE ACTIVITY
As of June 30, 2007, our structured finance and preferred equity investments totaled $661.7 million. The weighted average balance outstanding for the second quarter of 2007 was $699.6 million. During the second quarter of 2007 the weighted average yield was 10.52%.
During the second quarter 2007, the Company originated $62.7 million of structured finance investments, which yield approximately 11.45%. There were also $90.4 million of redemptions during the second quarter of 2007.
QUARTERLY LEASING HIGHLIGHTS
Manhattan vacancy at March 31, 2007 was 590,183 useable square feet net of holdover tenants. During the quarter, 292,367 additional useable office, retail and storage square feet became available at an average escalated cash rent of $46.32 per rentable square foot. The Company acquired 2,800 of available usable square feet in connection with the closing of the 48 East 43rd Street transaction. The Company sold 1,936 of available usable square feet in connection with the sale of 110 East 42nd Street. Space available to lease during the quarter totaled 883,414 useable square feet, or 3.9% of the total Manhattan portfolio.
During the second quarter, 66 Manhattan office leases, including early renewals, were signed totaling 677,807 rentable square feet. New cash rents averaged $52.96 per rentable square foot. Replacement rents were 40.5% higher than rents on previously occupied space, which had fully escalated cash rents averaging $37.70 per rentable square foot. The average lease term was 8.3 years and average tenant concessions were 1.5 months of free rent with a tenant improvement allowance of $13.62 per rentable square foot.
Suburban vacancy at March 31, 2007 was 471,321 usable square feet net of holdover tenants. During the quarter, 14,641 additional useable office square feet became available at an average escalated cash rent of $32.53 per rentable square foot. The Company acquired 27,012 of available usable square feet connection with the acquisitions of 1010 Washington Avenue, CT, 500 West Putnam Avenue, CT and 1 Jericho Plaza. Space available to lease during the quarter totaled 512,974 useable square feet, or 7.4% of the total Suburban portfolio.
During the second quarter, 19 Suburban office leases, including early renewals, were signed totaling 60,581 rentable square feet. New cash rents averaged $29.88 per rentable square foot. Replacement rents were 0.4% higher than rents on previously occupied space, which had fully escalated cash rents averaging $29.75 per rentable square foot. The average lease term was 5.3 years and average tenant concessions were 0.1 months of
7
FINANCIAL HIGHLIGHTS
SECOND QUARTER 2007
UNAUDITED |
|
free rent with a tenant improvement allowance of $22.83 per rentable square foot.
The Company also signed a total of 10 retail and storage leases, including early renewals, for 15,238 rentable square feet. The average lease term was 9.6 years and the average tenant concessions were 3.2 months of free rent with a tenant improvement allowance of $9.62 per rentable square foot.
REAL ESTATE ACTIVITY
Real estate investment transactions entered into during the past three months totaled approximately $2.8 billion and included:
- In April 2007, the Company completed the acquisition of 331 Madison Avenue and 48 East 43rd Street for a total of $73.0 million. Both 331 Madison Avenue and 48 East 43rd Street are located adjacent to 317 Madison Avenue, a property that the Company acquired in 2001. 331 Madison Avenue is an approximately 92,000-square foot, 14-story office building. The 22,850-square-foot 48 East 43rd Street property is a seven-story loft building that was later converted to office use.
- In April 2007, the Company acquired a 32.26% interest in the office condominium located at 1745 Broadway in Midtown Manhattan. The investment was made through a joint venture with SITQ Immobilier, a subsidiary of Caisse de depot et placement du Quebec, and The Witkoff Group. The interest was acquired for approximately $66.5 million, valuing the office space at approximately $520.0 million. The property encompasses approximately 674,000 square feet.
- In April 2007, the Company acquired the fee interest in 333 West 34th Street for approximately $183.0 million from Citigroup Global Markets, Inc. The property encompasses approximately 345,000 square feet. At closing, Citigroup entered into a full building triple net lease through 2009.
- In April 2007, the Company acquired a 20.26% interest in One Jericho Plaza and Two Jericho Plaza in Jericho, New York in a partnership with Onyx Equities and an affiliate of Credit Suisse Securities (USA) LLC. The interest was acquired for approximately $14.2 million, valuing the office space at approximately $210.0 million. The property encompasses approximately 640,000 square feet.
- In April 2007, the Company, along with Gramercy, together as tenants-in-common, acquired a fee interest in 2 Herald Square, a 354,400 square foot office and retail property located at 1328 Broadway in New York City. The fee interest, which is subject to a long-term operating lease, was purchased for approximately $225.0 million. The Company owns 55% of the fee and Gramercy owns the remaining 45%. The tenancy-in-common financed its acquisition with a $191.25 million, 10-year fixed rate loan provided by an affiliate of Goldman, Sachs & Co.
8
FINANCIAL HIGHLIGHTS
SECOND QUARTER 2007
UNAUDITED |
|
- In June 2007, the Company, along with its joint venture partners, acquired the second and third floors in the office tower at 717 Fifth Avenue for approximately $16.9 million, excluding closing costs. This acquisition was funded by a $17.5 million upsize to the existing loan.
- In July 2007, the Company entered into an agreement to acquire Gramercy’s 45% equity interest in the joint venture that owns One Madison Avenue for approximately $147.2 million (and the assumption of Gramercy’s proportionate share of the debt encumbering the property of approximately $305.3 million). Following the closing of the acquisition of this interest, which is expected to occur in the third quarter, the Company will own 100% of One Madison Avenue.
- In July 2007, the Company, along with Gramercy, acquired a 79% fee interest and 21% leasehold interst in the Lipstick building, a 607,000 square foot class A office building located at 885 Third Avenue in New York City for approximately $317.0 million. Simultaneously, Gramercy and SL Green entered into a 70-year leasehold/sub-leasehold arrangement for the improvements. The Company owns 55% of the investment and Gramercy owns the remaining 45%. The acquisition was financed with a $267.7 million, 10-year fixed rate loan provided by Goldman Sachs Commercial Mortgage Capital.
- In July 2007, the Company, along with The City Investment Fund, or CIF, closed on the acquisition of 16 Court Street, Brooklyn for approximately $107.5 million. SL Green will own a 35% interest in the venture. CIF will own the remaining 65% interest. The property is a 38-story, 317,625-square-foot office building.
- In June 2007, the Company closed on the acquisition of 1010 Washington Avenue, CT, a 143,400 square foot office tower. The fee interest was purchased for approximately $38.0 million.
- In June 2007, the Company acquired an office property located at 500 West Putnam Avenue in Greenwich, Connecticut. The Greenwich property, a four-story, 121,500-square-foot office building, was purchased for approximately $56.0 million.
- In June 2007, the joint venture that owned 5 Madison Avenue - The ClockTower sold it for approximately $200.0 million. The Company realized a $5.5 million incentive distribution upon the winding down of the joint venture.
- In June 2007, the Company sold its office condominium interest in floors six through eighteen at 110 East 42nd Street for approximately $111.5 million, excluding closing costs. The property encompasses approximately 181,000 square feet. The sale does not include approximately 112,000 square feet of
9
FINANCIAL HIGHLIGHTS
SECOND QUARTER 2007
UNAUDITED |
|
developable air rights, which the Company retained along with the ability to transfer these rights off-site. The Company recognized a gain on sale of approximately $84.0 million.
- In June 2007, the Company sold its condominium interests in 125 Broad Street for approximately $273.0 million, excluding closing costs. The property is approximately 525,000 square feet. The Company recognized a gain on sale of approximately $167.9 million.
- In July 2007, the Company sold its property located at 292 Madison Avenue for approximately $140.0 million, excluding closing costs. The property encompasses approximately 187,000 square feet. The Company recognized a gain on sale of approximately $99.0 million.
Investment In Gramercy Capital Corp.
At June 30, 2007, the book value of the Company’s investment in Gramercy totaled approximately $120.7 million. Fees earned from various arrangements between the Company and Gramercy totaled approximately $9.2 million for the quarter ended June 30, 2007, including an incentive fee of $3.8 million earned as a result of Gramercy’s FFO (as defined in Gramercy’s management agreement) exceeding the 9.5% annual return on equity performance threshold. The Company’s share of FFO generated from its investment in Gramercy totaled approximately $5.6 million for the quarter ended June 30, 2007, compared to $3.7 million for the same period in the prior year.
The Company’s marketing, general and administrative, or MG&A, expenses include the consolidation of the expenses of its subsidiary GKK Manager LLC, the entity which manages and advises Gramercy. For the quarter ended June 30, 2007, the Company’s MG&A includes approximately $3.4 million of costs associated with Gramercy.
Financing/ Capital Activity
In June 2007, the Company amended and restated its existing unsecured revolving credit facility with Wachovia Bank, as agent for itself and other lenders in connection with the Credit Facility. Pursuant to the amendment and restatement, the amount available under the credit facility was increased from $800.0 million to $1.25 billion. The Company has the ability to increase the capacity under the credit facility by an additional $250 million, subject to lender approval. The amendment and restatement also reduced the applicable interest rate spreads, extended the maturity date to June 28, 2011 and eased certain financial and other restrictive covenants of the credit facility. As a result of the amendment, interest rate spreads decreased from approximately 110 basis points to 80 basis points over the 30-day LIBOR.
In April 2007, the Company redeemed its $50.0 million 6.0% notes due June 2007 and $150.0 million 7.2% notes due August 2007. These notes had been assumed in connection with the merger with Reckson Associates Realty Corp. Also, in June 2007, the Company paid off and terminated its existing (i)
10
sUMMARY OF REAL ESTATE ACQUISITION ACTIVITY POST 1997 - Suburban | 
|
| | | | | | | | | | % Leased | | Acquisition | |
| | Property | | Type of Ownership | | Submarket | | Net Rentable sf | | at acquisition | | 6/30/2007 | | Price ($’s) (1) | |
2007 | | Acquisition | | | | | | | | | | | | | |
Jan-07 | | 300 Main Street | | Fee Interest | | Stamford, Connecticut | | 130,000 | | 92.5 | | 93.2 | | $ | 15,000,000 | |
Jan-07 | | 399 Knollwood Road | | Fee Interest | | White Plains, Westchester | | 145,000 | | 96.6 | | 100.0 | | $ | 31,600,000 | |
Jan-07 | | Reckson - Connecticut Portfolio | | Fee Interests / | | Stamford, Connecticut | | 1,369,800 | | 88.9 | | 86.1 | | $ | 490,750,000 | |
| | | | Leasehold Interest | | | | | | | | | | | |
Jan-07 | | Reckson - Westchester Portfolio | | Fee Interests / | | Westchester | | 2,346,100 | | 90.6 | | 91.2 | | $ | 570,190,000 | |
| | | | Leasehold Interest | | | | | | | | | | | |
Apr-07 | | Jericho Plazas | | Fee Interest | | Jericho, New York | | 640,000 | | 98.4 | | 98.4 | | $ | 210,000,000 | |
Jun-07 | | 1010 Washington Boulevard | | Fee Interest | | Stamford, Connecticut | | 143,400 | | 95.6 | | 95.6 | | $ | 38,000,000 | |
Jun-07 | | 500 West Putnam Avenue | | Fee Interest | | Greenwich, Connecticut | | 121,500 | | 94.4 | | 94.4 | | $ | 56,000,000 | |
| | | | | | | | 4,895,800 | | | | | | $ | 1,411,540,000 | |
(1) Acquisition price represents purchase price for consolidated acquisitions and purchase price or imputed value for joint venture properties.
46
SUPPLEMENTAL DEFINITIONS |
|
Annualized rent is calculated as monthly base rent and escalations per the lease, as of a certain date, multiplied by 12.
Debt service coverage is adjusted EBITDA divided by total interest and principal payments.
Equity income / (loss) from affiliates are generally accounted for on a cost basis and realized gains and losses are included in current earnings. For investments in private companies, the Company periodically reviews its investments and management determines if the value of such investments have been permanently impaired. Permanent impairment losses for investments in public and private companies are included in current earnings.
Fixed charge is the total payments for interest, principal amortization, ground leases and preferred stock dividend.
Fixed charge coverage is adjusted EBITDA divided by fixed charge.
Funds available for distribution (FAD) is defined as FFO plus non-real estate depreciation, 2% allowance for straight line credit loss, adjustment for straight line ground rent, non-cash deferred compensation, a pro-rata adjustment for FAD for SLG’s unconsolidated JV, less straight line rental income, free rent net of amortization, second cycle tenant improvement and leasing cost, and recurring building improvements.
Funds from operations (FFO) is defined under the White Paper approved by the Board of Governors of NAREIT in April 2002 as net income (loss) (computed in accordance with GAAP), excluding gains (or losses) from debt restructuring and sales of properties, plus real estate depreciation and amortization and after adjustments for unconsolidated partnerships and joint ventures.
Interest coverage is adjusted EBITDA divided by total interest expense.
Junior Mortgage Participations are subordinate interests in first mortgages.
Mezzanine Debt Loans are loans secured by ownership interests.
Percentage leased represents the percentage of leased square feet, including month-to-month leases, to total rentable square feet owned, as of the date reported. Space is considered leased when the tenant has either taken physical or economic occupancy.
Preferred Equity Investments are equity investments entitled to preferential returns that are senior to common equity.
Recurring capital expenditures represents non-incremental building improvements and leasing costs required to maintain current revenues. Recurring capital expenditures do not include immediate building improvements that were taken into consideration when underwriting the purchase of a building or which are incurred to bring a building up to “operating standard.”
Redevelopment costs are non-recurring capital expenditures incurred in order to improve buildings to SLG’s “operating standards.” These building costs are taken into consideration during the underwriting for a given property’s acquisition.
Same-store NOI growth is the change in the NOI (excluding straight-line rents) of the same-store properties from the prior year reporting period to the current year reporting period.
Same-store properties include all properties that were owned during both the current and prior year reporting periods and excludes development properties prior to being stabilized for both the current and prior reporting period.
Second generation TIs and LCs are tenant improvements, lease commissions, and other leasing costs incurred during leasing of second generation space. Costs incurred prior to leasing available square feet are not included until such space is leased. Second generation space excludes square footage vacant at acquisition.
SLG’s share of total debt to market capitalization is calculated as SLG’s share of total debt divided by the sum of total debt plus market equity and preferred stock at liquidation value. SLG’s share of total debt includes total consolidated debt plus SLG’s pro rata share of the debt of unconsolidated joint ventures less JV partners’ share of debt. Market equity assumes conversion of all OP units into common stock.
Total square feet owned represents 100% of the square footage of properties either owned directly by SLG or in which SLG has an interest (e.g. joint ventures).
47
CORPORATE GOVERNANCE |
|
Stephen L. Green
Chairman of the Board
Marc Holliday
Chief Executive Officer
Gregory F. Hughes
Chief Operating Officer and Chief Financial Officer
Andrew Mathias
President and Chief Investment Officer
Andrew S. Levine
Chief Legal Officer
Firm | | Analyst | | Phone | | Email |
AG Edwards, Inc. | | Dave Aubuchon | | (314) 955-5452 | | aubuchondl@agedwards.com |
Banc of America Securities, LLC | | Mitchell B. Germain | | (212) 847-5794 | | mitchell.b.germain@bofasecurities.com |
Citigroup Smith Barney, Inc. | | Jonathan Litt | | (212) 816-0231 | | jonathan.litt@citigroup.com |
Deutsche Bank Securities, Inc. | | Louis W. Taylor | | (212) 250-4912 | | louis.taylor@db.com |
Goldman Sachs & Co. | | Jonathan Habermann | | (917) 343-4260 | | jonathan.habermann@gs.com |
Green Street Advisors | | Michael Knott | | (949) 640-8780 | | mknott@greenstreetadvisors.com |
JP Morgan Securities, Inc. | | Anthony Paolone | | (212) 622-6682 | | anthony.paolone@jpmorgan.com |
Lehman Brothers Holdings, Inc. | | David Harris | | (212) 526-1790 | | dharris4@lehman.com |
Merrill Lynch | | Steve Sakwa | | (212) 449-4396 | | steve_sakwa@ml.com |
Raymond James Financial, Inc. | | Paul D. Puryear | | (727) 567-2253 | | paul.puryear@raymondjames.com |
Stifel Nicolaus | | John Guinee | | (410) 454-5520 | | jwguinee@stifel.com |
UBS Securities LLC | | James C. Feldman | | (212) 713 4932 | | james.feldman@ubs.com |
Wachovia Securities, LLC | | Christopher Haley | | (443) 263-6773 | | christopher.haley@wachovia.com |
SL Green Realty Corp. is followed by the analysts listed above. Please note that any opinions, estimates or forecasts regarding SL Green Realty Corp.’s performance made by these analysts are theirs alone and do not represent opinions, forecasts or predictions of SL Green Realty Corp. or its management. SL Green Realty Corp. does not by its reference above or distribution imply its endorsement of or concurrence with such information, conclusions or recommendations.
48