Exhibit 99.2
SL Green Realty Corp.
Third Quarter
Supplemental Data
September 30, 2008


SL Green Realty Corp. is a fully integrated, self-administered and self-managed Real Estate Investment Trust, or REIT, that primarily acquires, owns, manages, leases and repositions office properties in emerging, high-growth submarkets of Manhattan.
· SL Green’s common stock is listed on the New York Stock Exchange, and trades under the symbol SLG.
· SL Green maintains an internet site at www.slgreen.com at which most key investor relations data pertaining to dividend declaration, payout, current and historic share price, etc. can be found. Such information is not reiterated in this supplemental financial package. This supplemental financial package is available through the Company’s internet site.
· This data is furnished to supplement audited and unaudited regulatory filings of the Company and should be read in conjunction with those filings. The financial data herein is unaudited and is provided from the perspective of timeliness to assist readers of quarterly and annual financial filings. As such, data otherwise contained in future regulatory filings covering the same period may be restated from the data presented herein.
Questions pertaining to the information contained herein should be referred to Investor Relations at investor.relations@slgreen.com or at 212-216-1601.
This report includes certain statements that may be deemed to be “forward-looking statements” within the meaning of Section 27A of the Securities Act of 1933, as amended, and Section 21E of the Securities Exchange Act of 1934, as amended. All statements, other than statements of historical facts, included in this report that address activities, events or developments that the Company expects, believes or anticipates will or may occur in the future, including such matters as future capital expenditures, dividends and acquisitions (including the amount and nature thereof), expansion and other development trends of the real estate industry, business strategies, expansion and growth of the Company’s operations and other such matters are forward-looking statements. These statements are based on certain assumptions and analyses made by the Company in light of its experience and its perception of historical trends, current conditions, expected future developments and other factors it believes are appropriate. Such statements are subject to a number of assumptions, risks and uncertainties, general economic and business conditions, the business opportunities that may be presented to and pursued by the Company, changes in laws or regulations and other factors, many of which are beyond the control of the Company. Any such statements are not guarantees of future performance and actual results or developments may differ materially from those anticipated in the forward-looking statements.
The following discussion related to the consolidated financial statements of the Company should be read in conjunction with the financial statements for the quarter ended September 30, 2008 that will subsequently be released on Form 10-Q to be filed on or before November 10, 2008.
2
| |
TABLE OF CONTENTS | 
|
|
Highlights of Current Period Financial Performance | | |
| | |
Unaudited Financial Statements | | |
Corporate Profile | | 4 |
Financial Highlights | | 5-12 |
Balance Sheets | | 13-14 |
Statements of Operations | | 15 |
Funds From Operations | | 16 |
Statement of Stockholders’ Equity | | 17 |
Taxable Income | | 18 |
Joint Venture Statements | | 19-21 |
| | |
Selected Financial Data | | 22-25 |
| | |
Summary of Debt and Ground Lease Arrangements | | 26-28 |
| | |
Structured Finance | | 29-31 |
| | |
Property Data | | |
Composition of Property Portfolio | | 32-33 |
Top Tenants | | 34 |
Tenant Diversification | | 35 |
Leasing Activity Summary | | 36-39 |
Lease Expiration Schedule | | 40-41 |
| | |
Summary of Acquisition/Disposition Activity | | 42-44 |
Supplemental Definitions | | 45 |
Corporate Information | | 46 |
3
| |
CORPORATE PROFILE | 
|
|
SL Green Realty Corp., or the Company, is New York City’s largest commercial office landlord and is the only fully integrated, self-managed, self-administered Real Estate Investment Trust, or REIT, primarily focused on owning and operating office buildings in Manhattan.
The Company was formed on August 20, 1997 to continue the commercial real estate business of S.L. Green Properties Inc., a company that was founded in 1980 by Stephen L. Green, our current Chairman. For more than 25 years SL Green has been engaged in the business of owning, managing, leasing, acquiring and repositioning office properties in Manhattan. The Company’s investment focus is to create value through strategically acquiring, redeveloping and repositioning office properties primarily located in Manhattan, and re-leasing and managing these properties for maximum cash flow.
In 2007, SL Green acquired Reckson Associates Realty Corp. and added over 9 million square feet to its portfolio. Included in this total is over 3 million square feet of Class A office space located in Westchester, New York and Stamford, Connecticut. These suburban portfolios serve as natural extensions of SL Green’s core ownership in the Grand Central submarket of Midtown Manhattan. The Company has since made selective additions to the holdings in these areas.
Looking forward, SL Green will continue its opportunistic investment philosophy through three established business lines: investment in long-term core properties, investment in opportunistic assets, and structured finance investments. Structured finance investments include SL Green’s interest in Gramercy Capital Corp., or Gramercy, (NYSE: GKK) since 2004. As of September 30, 2008, SL Green owned approximately 15.8% of Gramercy. This three-legged investment strategy allows SL Green to balance the components of its portfolio to take advantage of each stage in the business cycle.
4
FINANCIAL HIGHLIGHTS | 
|
THIRD QUARTER 2008
UNAUDITED
|
FINANCIAL RESULTS
Funds From Operations, or FFO, available to common stockholders totaled $88.0 million, or $1.45 per share (diluted) for the third quarter ended September 30, 2008, a 16.0% increase over the same quarter in 2007 when FFO totaled $77.8 million, or $1.25 per share (diluted).
Net income available to common stockholders totaled $33.6 million, or $0.58 per share, (diluted) for the third quarter and $298.3 million, or $5.09 per share (diluted) for the nine months ended September 30, 2008, compared to $98.6 million and $511.9 million for the respective periods in 2007. The results for the three and nine months ended September 30, 2008 include gains on sale of $0.16 per share (diluted) and $3.49 per share (diluted), respectively, compared to gains on sale of $1.34 per share (diluted) and $6.69 per share (diluted) for the same periods in 2007.
Funds available for distribution, or FAD, for the third quarter of 2008 increased to $0.92 per share (diluted) versus $0.84 per share (diluted) in the prior year, a 9.5% increase.
The Company’s dividend payout ratio for the third quarter of 2008 was 54.32% of FFO and 85.46% of FAD before second cycle leasing costs.
All per share amounts are presented on a diluted basis.
CONSOLIDATED RESULTS
Total quarterly revenues totaled $268.7 million in the third quarter compared to $245.3 million in the prior year. The $23.4 million increase in revenue resulted primarily from the following items:
· $17.6 million increase from 2007 acquisitions, including the Reckson properties,
· $5.5 million increase from same-store properties,
· $1.6 million increase in preferred equity and investment income, and
· $1.3 million decrease in other income.
The Company’s earnings before interest, taxes, depreciation and amortization, or EBITDA, totaled $154.0 million compared to $139.8 million in the prior year. The following items drove the $14.2 million in EBITDA improvements:
· $14.7 million increase from 2007 acquisitions, including the Reckson properties,
· $2.8 million increase from same-store properties,
· $1.6 million increase in preferred equity and investment income primarily due to income earned on third quarter originations which was partially offset by $9.1 million in reserves recorded against structured finance investments. The weighted-average structured finance investment balance for the quarter increased to $921.7 million from $714.9 million in the prior year third quarter. The
5
FINANCIAL HIGHLIGHTS |
|
THIRD QUARTER 2008
UNAUDITED
|
weighted-average yield for the quarter was 10.43% compared to 10.54% in the prior year,
· $1.0 million increase from increased contributions to equity in net income from unconsolidated joint ventures primarily from 388 Greenwich Street ($0.4 million), 1515 Broadway ($2.8 million) 521 Fifth Avenue ($1.1 million), 800 Third Avenue ($0.4 million) and 1221 Avenue of the Americas ($0.8 million). This was partially offset by reductions in contributions primarily from 100 Park, which was under redevelopment, ($0.3 million) and Gramercy ($4.2 million),
· $4.4 million decrease from higher MG&A expense, and
· $1.5 million decrease in non-real estate revenues, net of expenses.
FFO before minority interests increased $10.2 million primarily as a result of:
· $14.2 million increase in EBITDA,
· $1.1 million decrease in FFO from unconsolidated joint ventures, discontinued operations and non-real estate depreciation, and
· $2.9 million decrease from higher interest expense.
SAME-STORE RESULTS
Consolidated Properties
Same-store third quarter 2008 GAAP NOI increased $10.6 million (10.7%) to $110.2 million compared to the prior year. Operating margins before ground rent increased from 57.3% to 57.9%.
The $10.6 million increase in GAAP NOI was primarily due to:
· $12.9 million (8.2%) increase in rental revenue primarily due to increasing rental rates,
· $2.8 million (10.0%) increase in escalation and reimbursement revenue,
· $0.6 million (67.9%) decrease in investment and other income,
· $4.4 million (8.8%) increase in operating expenses, primarily driven by increases in payroll and utility costs, but was offset by reductions in insurance costs and repairs and maintenance,
· $0.8 million (8.7%) decrease in ground rent expense, and
· $0.9 million (3.1%) increase in real estate taxes.
Joint Venture Properties
The Joint Venture same-store properties third quarter 2008 GAAP NOI increased $1.1 million (4.1%) to $28.7 million compared to the prior year. Operating margins before ground rent decreased slightly from 55.8% to 55.6%.
The $1.1 million increase in GAAP NOI was primarily due to:
· $1.9 million (4.8%) increase in rental revenue primarily due to improved leasing,
· $0.4 million (3.7%) increase in escalation and reimbursement revenues,
· $1.0 million (7.3%) increase in operating expenses, and
6
FINANCIAL HIGHLIGHTS |
|
THIRD QUARTER 2008
UNAUDITED
|
· $0.2 million (1.7%) increase in real estate taxes.
STRUCTURED FINANCE ACTIVITY
As of September 30, 2008, our structured finance and preferred equity investments totaled $926.9 million. The weighted average balance outstanding for the third quarter of 2008 was $921.7 million. During the third quarter of 2008 the weighted average yield was 10.43%.
QUARTERLY LEASING HIGHLIGHTS
Manhattan vacancy at June 30, 2008 was 786,400 useable square feet net of holdover tenants. During the quarter, 308,721 additional useable office, retail and storage square feet became available at an average escalated cash rent of $50.13 per rentable square foot. Space available to lease during the quarter totaled 1,095,121 useable square feet, or 4.6% of the total Manhattan portfolio.
During the third quarter, 39 Manhattan office leases, including early renewals, were signed totaling 359,067 rentable square feet. New cash rents averaged $66.78 per rentable square foot. Replacement rents were 55% higher than rents on previously occupied space, which had fully escalated cash rents averaging $43.09 per rentable square foot. The average lease term was 10.4 years and average tenant concessions were 6 months of free rent with a tenant improvement allowance of $32.30 per rentable square foot.
Suburban vacancy at June 30, 2008 was 645,323 usable square feet net of holdover tenants. During the quarter, 51,405 additional useable office and storage square feet became available at an average escalated cash rent of $30.05 per rentable square foot. Space available to lease during the quarter totaled 696,728 useable square feet, or 8.9% of the total Suburban portfolio.
During the third quarter, 17 Suburban office leases, including early renewals, were signed totaling 76,519 rentable square feet. New cash rents averaged $38.48 per rentable square foot. Replacement rents were 22.6% higher than rents on previously occupied space, which had fully escalated cash rents averaging $31.39 per rentable square foot. The average lease term was 3.7 years and average tenant concessions were 1.2 months of free rent with a tenant improvement allowance of $16.25 per rentable square foot.
The Company also signed a total of 16 retail and storage leases, including early renewals, for 13,828 rentable square feet. The average lease term was 10.9 years and average tenant concessions were 0.8 months of free rent with a tenant improvement allowance of $0.07 per rentable square foot.
REAL ESTATE ACTIVITY
In August 2008, the Company sold 80% of its interest in 1551/1555 Broadway to Jeff Sutton, its joint venture partner, for approximately $17.0 million and the right to future asset management, leasing and construction fees. As a result of this transaction, the Company holds a 10% interest in this joint
7
FINANCIAL HIGHLIGHTS |
|
THIRD QUARTER 2008
UNAUDITED
|
venture. The Company recognized a gain of approximately $9.5 million on this transaction which resulted in a 21.7% IRR to the Company. This return excludes certain future asset management, leasing and construction fees that may be earned by the Company.
In October 2008, the Company with its joint venture partner, closed on the sale of the 525,000 square foot office property at 1372 Broadway for $274.0 million. The Company will recognize a gain of $238.9 million in the fourth quarter of 2008, a substantial portion of which had been deferred from the Company’s sale of 85% of the property in July 2007.
Investment in Gramercy Capital Corp.
At September 30, 2008, the book value of the Company’s investment in Gramercy Capital Corp. totaled $141.5 million. Fees earned from various management arrangements between the Company and Gramercy totaled approximately $8.0 million for the quarter ended September 30, 2008. For the nine months ended September 30, 2008, the Company earned $29.4 million in management fees from Gramercy. During the quarter the Company waived its right to receive approximately $2.0 million of incentive fees and CDO collateral management fees. The Company’s share of FFO generated from its investment in Gramercy has been estimated at approximately $4.9 million and $15.3 million for the three and nine months ended September 30, 2008, respectively, compared to $5.7 million and $16.3 million for the same periods in the prior year.
The Company’s marketing, general and administrative, or MG&A, expenses include the consolidation of the expenses of its subsidiary GKK Manager LLC, the entity which manages and advises Gramercy. For the quarter ended September 30, 2008, the Company’s MG&A included approximately $5.7 million of costs associated with Gramercy compared to $3.7 million in the prior year. This increase is primarily due to personnel hired in connection with the AFR acquisition.
FINANCING/ CAPITAL ACTIVITY
The Company acquired $81.2 million of its common stock at an average share price of $67.63 since July 1, 2008 pursuant to its stock repurchase program. The Company has now completed its purchases under the previously authorized $300.0 million stock buy-back program.
In September 2008, the Company closed on a five-year $125.0 million financing at 28 West 44th Street. This interest-only loan carries an interest rate of 201 basis points over the 30-day LIBOR.
In September 2008, the joint venture that owns the retail condominium at 717 Fifth Avenue refinanced the property with a $285.0 million five-year financing. This financing carries an interest rate of 275 basis points over the 30-day LIBOR.
8
FINANCIAL HIGHLIGHTS |
|
THIRD QUARTER 2008
UNAUDITED
|
Dividends
In September 2008, the Company declared a dividend of $0.7875 per common share for the third quarter of 2008. The dividend was payable October 15, 2008 to stockholders of record on the close of business on September 30, 2008. This distribution reflects the regular quarterly dividend, which is the equivalent of an annualized distribution of $3.15 per common share.
In September 2008, the Company also approved a distribution on its Series C preferred stock for the period July 15, 2008 through and including October 14, 2008, of $0.4766 per share, payable October 15, 2008 to stockholders of record on the close of business on September 30, 2008. The distribution reflects the regular quarterly distribution, which is the equivalent of an annualized distribution of $1.90625 per Series C preferred stock.
In September 2008, the Company also approved a distribution on its Series D preferred stock for the period July 15, 2008 through and including October 14, 2008, of $0.4922 per share, payable October 15, 2008 to stockholders of record on the close of business on September 30, 2008. The distribution reflects the regular quarterly distribution, which is the equivalent of an annualized distribution of $1.96875 per Series D preferred stock.
9
| SL Green Realty Corp. | 
|
| Key Financial Data |
| September 30, 2008 |
| (Dollars in Thousands Except Per Share and Sq. Ft.) |
| | As of or for the three months ended | |
| | 9/30/2008 | | 6/30/2008 | | 3/31/2008 | | 12/31/2007 | | 9/30/2007 | |
| | | | | | | | | | | |
Earnings Per Share | | | | | | | | | | | |
Net income available to common shareholders - diluted | | $ | 0.58 | | $ | 2.37 | | $ | 2.14 | | $ | 2.16 | | $ | 1.64 | |
Funds from operations available to common shareholders - diluted | | $ | 1.45 | | $ | 2.00 | | $ | 1.44 | | $ | 1.24 | | $ | 1.25 | |
Funds available for distribution to common shareholders - diluted | | $ | 0.92 | | $ | 1.55 | | $ | 1.00 | | $ | 0.85 | | $ | 0.84 | |
| | | | | | | | | | | |
Common Share Price & Dividends | | | | | | | | | | | |
At the end of the period | | $ | 64.80 | | $ | 82.72 | | $ | 81.47 | | $ | 93.46 | | $ | 116.77 | |
High during period | | $ | 92.23 | | $ | 100.74 | | $ | 98.77 | | $ | 123.28 | | $ | 133.35 | |
Low during period | | $ | 63.65 | | $ | 82.55 | | $ | 76.78 | | $ | 89.43 | | $ | 101.61 | |
Common dividends per share | | $ | 0.7875 | | $ | 0.7875 | | $ | 0.7875 | | $ | 0.7875 | | $ | 0.70 | |
FFO Payout Ratio | | 54.32 | % | 39.40 | % | 54.82 | % | 63.40 | % | 56.14 | % |
FAD Payout Ratio | | 85.46 | % | 50.68 | % | 78.54 | % | 93.07 | % | 83.72 | % |
| | | | | | | | | | | |
Common Shares & Units | | | | | | | | | | | |
Common shares outstanding | | 57,606 | | 58,283 | | 58,284 | | 58,759 | | 59,213 | |
Units outstanding | | 2,340 | | 2,340 | | 2,340 | | 2,340 | | 2,350 | |
Total shares and units outstanding | | 59,946 | | 60,623 | | 60,624 | | 61,099 | | 61,563 | |
| | | | | | | | | | | |
Weighted average common shares and units outstanding - basic | | 60,453 | | 60,669 | | 60,822 | | 61,371 | | 61,784 | |
Weighted average common shares and units outstanding - diluted | | 60,716 | | 61,014 | | 61,221 | | 61,917 | | 62,411 | |
| | | | | | | | | | | |
Market Capitalization | | | | | | | | | | | |
Market value of common equity | | $ | 3,884,501 | | $ | 5,014,735 | | $ | 4,939,037 | | $ | 5,710,313 | | $ | 7,188,712 | |
Liquidation value of preferred equity | | 257,500 | | 257,500 | | 257,500 | | 257,500 | | 257,500 | |
Consolidated debt | | 5,875,968 | | 5,405,473 | | 5,758,220 | | 5,723,082 | | 5,329,629 | |
Consolidated market capitalization | | $ | 10,017,969 | | $ | 10,677,708 | | $ | 10,954,757 | | $ | 11,690,895 | | $ | 12,775,841 | |
SLG portion JV debt | | 1,931,923 | | 1,840,071 | | 1,593,355 | | 1,593,246 | | 1,281,344 | |
Combined market capitalization | | $ | 11,949,892 | | $ | 12,517,779 | | $ | 12,548,112 | | $ | 13,284,141 | | $ | 14,057,185 | |
| | | | | | | | | | | |
Consolidated debt to market capitalization | | 58.65 | % | 50.62 | % | 52.56 | % | 48.95 | % | 41.72 | % |
Combined debt to market capitalization | | 65.34 | % | 57.88 | % | 58.59 | % | 55.08 | % | 47.03 | % |
Unsecured credit facility debt to total assets | | 49.04 | % | 48.68 | % | 49.26 | % | 46.78 | % | 44.87 | % |
| | | | | | | | | | | |
Consolidated debt service coverage | | 2.28 | | 2.67 | | 2.23 | | 2.10 | | 2.23 | |
Consolidated fixed charge coverage | | 1.95 | | 2.29 | | 1.91 | | 1.79 | | 1.88 | |
Combined fixed charge coverage | | 1.75 | | 2.04 | | 1.74 | | 1.64 | | 1.67 | |
| | | | | | | | | | | |
Portfolio Statistics (Manhattan) | | | | | | | | | | | |
Consolidated office buildings | | 22 | | 22 | | 22 | | 23 | | 24 | |
Unconsolidated office buildings | | 8 | | 8 | | 9 | | 9 | | 7 | |
| | 30 | | 30 | | 31 | | 32 | | 31 | |
| | | | | | | | | | | |
Consolidated office buildings square footage | | 14,290,200 | | 14,290,200 | | 14,290,200 | | 14,629,200 | | 14,889,200 | |
Unconsolidated office buildings square footage | | 9,429,000 | | 9,429,000 | | 10,099,000 | | 10,099,000 | | 7,464,000 | |
| | 23,719,200 | | 23,719,200 | | 24,389,200 | | 24,728,200 | | 22,353,200 | |
| | | | | | | | | | | |
Quarter end occupancy - Manhattan portfolio | | 96.5 | % | 96.7 | % | 96.3 | % | 96.6 | % | 97.0 | % |
Quarter end occupancy- same store - wholly owned | | 97.7 | % | 97.6 | % | 97.1 | % | 96.8 | % | 97.0 | % |
Quarter end occupancy- same store - combined (wholly owned + joint venture) | | 95.6 | % | 95.7 | % | 95.4 | % | 95.6 | % | 96.5 | % |
Supplemental Package information | | Third Quarter 2008 |
10
| SL Green Realty Corp. | 
|
| Key Financial Data |
| September 30, 2008 |
| (Dollars in Thousands Except Per Share and Sq. Ft.) |
| | As of or for the three months ended | |
| | 9/30/2008 | | 6/30/2008 | | 3/31/2008 | | 12/31/2007 | | 9/30/2007 | |
| | | | | | | | | | | |
Selected Balance Sheet Data | | | | | | | | | | | |
Real estate assets before depreciation | | $ | 8,379,608 | | $ | 8,751,414 | | $ | 8,710,235 | | $ | 8,622,496 | | $ | 8,497,258 | |
Investments in unconsolidated joint ventures | | $ | 1,139,918 | | $ | 1,132,329 | | $ | 1,431,162 | | $ | 1,438,123 | | $ | 886,672 | |
Structured finance investments | | $ | 926,931 | | $ | 839,826 | | $ | 776,488 | | $ | 805,215 | | $ | 683,084 | |
| | | | | | | | | | | |
Total Assets | | $ | 11,491,229 | | $ | 11,149,587 | | $ | 11,449,034 | | $ | 11,430,078 | | $ | 10,516,189 | |
| | | | | | | | | | | |
Fixed rate & hedged debt | | $ | 4,472,951 | | $ | 4,478,908 | | $ | 4,761,420 | | $ | 4,767,144 | | $ | 4,496,670 | |
Variable rate debt | | 1,403,017 | | 926,565 | | 996,800 | | 955,938 | | 832,959 | |
Total consolidated debt | | $ | 5,875,968 | | $ | 5,405,473 | | $ | 5,758,220 | | $ | 5,723,082 | | $ | 5,329,629 | |
| | | | | | | | | | | |
Total Liabilities | | $ | 6,954,987 | | $ | 6,486,249 | | $ | 6,861,109 | | $ | 6,888,796 | | $ | 6,051,418 | |
| | | | | | | | | | | |
Fixed rate & hedged debt-including SLG portion of JV debt | | $ | 5,724,415 | | $ | 5,730,263 | | $ | 5,728,223 | | $ | 5,733,986 | | $ | 5,170,857 | |
Variable rate debt - including SLG portion of JV debt | | 2,083,476 | | 1,515,281 | | 1,623,352 | | 1,582,342 | | 1,440,116 | |
Total combined debt | | $ | 7,807,891 | | $ | 7,245,544 | | $ | 7,351,575 | | $ | 7,316,328 | | $ | 6,610,973 | |
| | | | | | | | | | | |
Selected Operating Data | | | | | | | | | | | |
Property operating revenues | | $ | 231,748 | | $ | 224,113 | | $ | 225,924 | | $ | 211,035 | | $ | 208,613 | |
Property operating expenses | | 100,389 | | 95,329 | | 94,445 | | 96,461 | | 94,497 | |
Property operating NOI | | $ | 131,359 | | $ | 128,784 | | $ | 131,479 | | $ | 114,574 | | $ | 114,116 | |
NOI from discontinued operations | | 1,059 | | 1,107 | | 978 | | 4,001 | | 5,772 | |
Total property operating NOI | | $ | 132,418 | | $ | 129,891 | | $ | 132,457 | | $ | 118,575 | | $ | 119,888 | |
| | | | | | | | | | | |
SLG share of Property NOI from JVs | | $ | 52,472 | | $ | 55,599 | | $ | 54,228 | | $ | 43,683 | | $ | 43,944 | |
SLG share of FFO from Gramercy Capital | | $ | 4,866 | | $ | 5,114 | | $ | 5,287 | | $ | 5,600 | | $ | 5,734 | |
Structured finance income | | $ | 23,420 | | $ | 18,356 | | $ | 21,252 | | $ | 20,745 | | $ | 21,848 | |
Other income | | $ | 13,505 | | $ | 55,503 | | $ | 18,415 | | $ | 23,167 | | $ | 14,790 | |
| | | | | | | | | | | |
Marketing general & administrative expenses | | $ | 26,603 | | $ | 32,407 | | $ | 27,982 | | $ | 24,444 | | $ | 22,224 | |
| | | | | | | | | | | |
Consolidated interest | | $ | 69,457 | | $ | 71,240 | | $ | 75,241 | | $ | 71,440 | | $ | 66,645 | |
Combined interest | | $ | 93,514 | | $ | 93,635 | | $ | 98,029 | | $ | 93,647 | | $ | 91,105 | |
Preferred Dividend | | $ | 4,969 | | $ | 4,969 | | $ | 4,969 | | $ | 4,969 | | $ | 4,969 | |
| | | | | | | | | | | |
Office Leasing Statistics (Manhattan) | | | | | | | | | | | |
Total office leases signed | | 39 | | 42 | | 41 | | 41 | | 53 | |
Total office square footage leased | | 359,067 | | 431,345 | | 508,960 | | 282,490 | | 340,246 | |
| | | | | | | | | | | |
Average rent psf - new leases | | $ | 66.78 | | $ | 65.89 | | $ | 62.32 | | $ | 65.68 | | $ | 61.63 | |
Previously escalated rents psf | | $ | 43.09 | | $ | 42.92 | | $ | 43.31 | | $ | 46.03 | | $ | 38.64 | |
Percentage of new rent over previously escalated rents | | 55.0 | % | 53.5 | % | 43.9 | % | 42.7 | % | 59.5 | % |
Tenant concession packages psf | | $ | 32.30 | | $ | 17.70 | | $ | 11.45 | | $ | 15.06 | | $ | 17.14 | |
Free rent months | | 6.0 | | 2.0 | | 0.9 | | 1.4 | | 1.5 | |
11
| SL Green Realty Corp. |
|
| Key Financial Data |
| September 30, 2008 |
| (Dollars in Thousands Except Per Share and Sq. Ft.) |
Suburban Properties
| | As of or for the three months ended | |
| | 9/30/2008 | | 6/30/2008 | | 3/31/2008 | | 12/31/2007 | | 9/30/2007 | |
| | | | | | | | | | | |
Selected Operating Data (Suburban) | | | | | | | | | | | |
Property operating revenues | | $ | 33,015 | | $ | 30,525 | | $ | 32,622 | | $ | 35,803 | | $ | 30,963 | |
Property operating expenses | | 14,752 | | 12,958 | | 13,982 | | 15,121 | | 13,031 | |
Property operating NOI | | $ | 18,263 | | $ | 17,567 | | $ | 18,640 | | $ | 20,682 | | $ | 17,932 | |
NOI from discontinued operations | | 554 | | 498 | | 482 | | 444 | | 467 | |
Total property operating NOI | | $ | 18,817 | | $ | 18,065 | | $ | 19,122 | | $ | 21,126 | | $ | 18,399 | |
| | | | | | | | | | | |
SLG share of Property NOI from JV | | $ | 4,020 | | $ | 3,765 | | $ | 3,887 | | $ | 3,695 | | $ | 3,625 | |
| | | | | | | | | | | |
Consolidated interest | | $ | 3,535 | | $ | 3,624 | | $ | 3,981 | | $ | 3,977 | | $ | 5,079 | |
Combined interest | | $ | 5,765 | | $ | 5,866 | | $ | 6,765 | | $ | 6,615 | | $ | 7,182 | |
| | | | | | | | | | | |
Portfolio Statistics (Suburban) | | | | | | | | | | | |
Consolidated office buildings | | 30 | | 30 | | 30 | | 30 | | 30 | |
Unconsolidated office buildings | | 6 | | 6 | | 6 | | 6 | | 6 | |
| | 36 | | 36 | | 36 | | 36 | | 36 | |
| | | | | | | | | | | |
Consolidated office buildings square footage | | 4,925,800 | | 4,925,800 | | 4,925,800 | | 4,925,800 | | 4,925,800 | |
Unconsolidated office buildings square footage | | 2,941,700 | | 2,941,700 | | 2,941,700 | | 2,941,700 | | 2,941,700 | |
| | 7,867,500 | | 7,867,500 | | 7,867,500 | | 7,867,500 | | 7,867,500 | |
| | | | | | | | | | | |
Quarter end occupancy- suburban portfolio | | 91.9 | % | 91.8 | % | 91.9 | % | 92.0 | % | 92.2 | % |
| | | | | | | | | | | |
Office Leasing Statistics (Suburban) | | | | | | | | | | | |
Total office leases signed | | 17 | | 24 | | 20 | | 27 | | 23 | |
Total office square footage leased | | 76,519 | | 75,491 | | 165,386 | | 205,791 | | 91,525 | |
| | | | | | | | | | | |
Average rent psf - new leases | | $ | 38.48 | | $ | 38.64 | | $ | 31.52 | | $ | 28.23 | | $ | 33.64 | |
Previously escalated rents psf | | $ | 31.39 | | $ | 31.24 | | $ | 26.81 | | $ | 25.85 | | $ | 29.26 | |
Percentage of new rent over previously escalated rents | | 22.6 | % | 23.7 | % | 17.6 | % | 9.2 | % | 15.0 | % |
Tenant concession packages psf | | $ | 16.25 | | $ | 12.28 | | $ | 24.23 | | $ | 11.01 | | $ | 11.06 | |
Free rent months | | 1.2 | | 0.6 | | 4.9 | | 1.2 | | 0.1 | |
12
COMPARATIVE BALANCE SHEETS Unaudited ($000’s omitted) |

|
| | 9/30/2008 | | 6/30/2008 | | 3/31/2008 | | 12/31/2007 | | 9/30/2007 | |
Assets | | | | | | | | | | | |
Commercial real estate properties, at cost: | | | | | | | | | | | |
Land & land interests | | $ | 1,400,042 | | $ | 1,483,798 | | $ | 1,454,060 | | $ | 1,436,569 | | $ | 1,447,297 | |
Buildings & improvements fee interest | | 5,590,822 | | 6,005,030 | | 5,994,846 | | 5,924,626 | | 5,799,995 | |
Buildings & improvements leasehold | | 1,251,626 | | 1,250,378 | | 1,249,121 | | 1,249,093 | | 1,237,758 | |
Buildings & improvements under capital lease | | 12,208 | | 12,208 | | 12,208 | | 12,208 | | 12,208 | |
| | $ | 8,254,698 | | $ | 8,751,414 | | $ | 8,710,235 | | $ | 8,622,496 | | $ | 8,497,258 | |
Less accumulated depreciation | | (498,885 | ) | (484,087 | ) | (432,567 | ) | (381,510 | ) | (406,958 | ) |
| | $ | 7,755,813 | | $ | 8,267,327 | | $ | 8,277,668 | | $ | 8,240,986 | | $ | 8,090,300 | |
| | | | | | | | | | | |
Other Real Estate Investments: | | | | | | | | | | | |
Investment in unconsolidated joint ventures | | 1,139,918 | | 1,132,329 | | 1,431,162 | | 1,438,123 | | 886,672 | |
Structured finance investments | | 926,931 | | 839,826 | | 776,488 | | 805,215 | | 683,084 | |
| | | | | | | | | | | |
Assets held for sale | | 120,120 | | — | | — | | 41,568 | | — | |
Cash and cash equivalents | | 711,147 | | 53,567 | | 46,793 | | 45,964 | | 98,099 | |
Restricted cash | | 105,834 | | 101,788 | | 144,127 | | 105,475 | | 119,553 | |
Tenant and other receivables, net of $15,282 reserve at 9/30/08 | | 39,054 | | 39,351 | | 45,594 | | 49,015 | | 48,815 | |
Related party receivables | | 10,556 | | 11,682 | | 12,448 | | 13,082 | | 32,950 | |
Deferred rents receivable, net of reserve for tenant credit loss of $13,533 at 9/30/08 | | 152,718 | | 158,049 | | 150,087 | | 136,595 | | 134,580 | |
Deferred costs, net | | 135,949 | | 141,285 | | 137,079 | | 134,354 | | 127,353 | |
Other assets | | 393,189 | | 404,383 | | 427,588 | | 419,701 | | 294,783 | |
| | | | | | | | | | | |
Total Assets | | $ | 11,491,229 | | $ | 11,149,587 | | $ | 11,449,034 | | $ | 11,430,078 | | $ | 10,516,189 | |
13
COMPARATIVE BALANCE SHEETS Unaudited ($000’s omitted) |

|
| | 9/30/2008 | | 6/30/2008 | | 3/31/2008 | | 12/31/2007 | | 9/30/2007 | |
Liabilities and Stockholders’ Equity | | | | | | | | | | | |
Mortgage notes payable | | $ | 2,693,275 | | $ | 2,867,305 | | $ | 2,867,593 | | $ | 2,844,644 | | $ | 2,846,529 | |
Term loans and unsecured notes | | 1,793,860 | | 1,793,668 | | 2,070,127 | | 2,069,938 | | 1,793,100 | |
Revolving credit facilities | | 1,288,833 | | 644,500 | | 720,500 | | 708,500 | | 590,000 | |
Accrued interest and other liabilities | | 33,367 | | 40,867 | | 39,695 | | 45,194 | | 50,257 | |
Accounts payable and accrued expenses | | 154,158 | | 130,897 | | 135,083 | | 180,898 | | 169,288 | |
Deferred revenue | | 462,734 | | 789,525 | | 808,262 | | 819,022 | | 385,840 | |
Capitalized lease obligations | | 16,662 | | 16,621 | | 16,581 | | 16,542 | | 16,504 | |
Deferred land lease payable | | 17,559 | | 17,468 | | 17,378 | | 16,960 | | 16,873 | |
Dividend and distributions payable | | 51,268 | | 51,803 | | 51,823 | | 52,077 | | 47,238 | |
Security deposits | | 34,105 | | 33,595 | | 34,067 | | 35,021 | | 35,789 | |
Liabilities related to assets held for sale | | 309,166 | | — | | — | | — | | — | |
Junior subordinated deferrable interest debentures | | 100,000 | | 100,000 | | 100,000 | | 100,000 | | 100,000 | |
Total Liabilities | | $ | 6,954,987 | | $ | 6,486,249 | | $ | 6,861,109 | | $ | 6,888,796 | | $ | 6,051,418 | |
| | | | | | | | | | | |
Minority interest in other partnerships | | 556,262 | | 626,903 | | 636,966 | | 632,400 | | 595,782 | |
Minority interest in operating partnership (2,340 units outstanding) at 9/30/08 | | 88,460 | | 88,931 | | 85,201 | | 82,007 | | 78,878 | |
| | | | | | | | | | | |
Stockholders’ Equity | | | | | | | | | | | |
7.625% Series C Perpetual Preferred Shares | | 151,981 | | 151,981 | | 151,981 | | 151,981 | | 151,981 | |
7.875% Series D Perpetual Preferred Shares | | 96,321 | | 96,321 | | 96,321 | | 96,321 | | 96,321 | |
Common stock, $.01 par value 160,000 shares authorized, 60,400 issued and outstanding at 9/30/08 | | 604 | | 604 | | 602 | | 601 | | 598 | |
Additional paid – in capital | | 2,970,757 | | 2,960,245 | | 2,943,610 | | 2,931,887 | | 2,918,847 | |
Treasury stock (2,794 shares) at 9/30/08 | | (267,327 | ) | (218,775 | ) | (200,630 | ) | (150,719 | ) | (94,071 | ) |
Accumulated other comprehensive income | | (13,728 | ) | (7,576 | ) | 2,143 | | 4,943 | | 6,961 | |
Retained earnings | | 952,912 | | 964,704 | | 871,731 | | 791,861 | | 709,474 | |
Total Stockholders’ Equity | | $ | 3,891,520 | | $ | 3,947,504 | | $ | 3,865,758 | | $ | 3,826,875 | | $ | 3,790,111 | |
| | | | | | | | | | | |
Total Liabilities and Stockholders’ Equity | | $ | 11,491,229 | | $ | 11,149,587 | | $ | 11,449,034 | | $ | 11,430,078 | | $ | 10,516,189 | |
14
COMPARATIVE STATEMENTS OF OPERATIONS
Unaudited
($000’s omitted) | 
|
| | Three Months Ended | | Three Months Ended | | Nine Months Ended | |
| | September 30, | | September 30, | | June 30, | | September 30, | | September 30, | |
| | 2008 | | 2007 | | 2008 | | 2008 | | 2007 | |
Revenues | | | | | | | | | | | |
Rental revenue, net | | 199,437 | | 179,248 | | 194,106 | | $ | 589,508 | | $ | 487,820 | |
Escalation and reimbursement revenues | | 32,311 | | 29,365 | | 30,007 | | 92,277 | | 83,774 | |
Investment income | | 23,420 | | 21,848 | | 18,356 | | 63,028 | | 70,990 | |
Other income | | 13,505 | | 14,790 | | 55,503 | | 87,424 | | 127,754 | |
Total Revenues, net | | 268,673 | | 245,251 | | 297,972 | | 832,237 | | 770,338 | |
| | | | | | | | | | | |
Equity in net income from unconsolidated joint ventures | | 12,292 | | 11,302 | | 17,822 | | 49,540 | | 32,715 | |
| | | | | | | | | | | |
Operating expenses | | 61,134 | | 55,428 | | 54,743 | | 169,553 | | 151,842 | |
Ground rent | | 7,709 | | 8,674 | | 7,826 | | 23,784 | | 23,705 | |
Real estate taxes | | 31,546 | | 30,395 | | 32,760 | | 96,830 | | 91,415 | |
Marketing, general and administrative | | 26,603 | | 22,224 | | 32,407 | | 86,992 | | 80,602 | |
Total Operating Expenses | | 126,992 | | 116,721 | | 127,736 | | 377,159 | | 347,564 | |
| | | | | | | | | | | |
EBITDA | | 153,973 | | 139,832 | | 188,058 | | 504,618 | | 455,489 | |
| | | | | | | | | | | |
Interest | | 69,118 | | 66,165 | | 70,782 | | 214,563 | | 186,351 | |
Amortization of deferred financing costs | | 1,604 | | 1,652 | | 1,541 | | 4,780 | | 14,195 | |
Depreciation and amortization | | 54,554 | | 47,246 | | 55,433 | | 164,137 | | 124,983 | |
| | | | | | | | | | | |
Income Before Minority Interest and Items | | 28,697 | | 24,769 | | 60,302 | | 121,138 | | 129,960 | |
| | | | | | | | | | | |
Income from discontinued operations | | 297 | | 2,547 | | (322 | ) | (1,418 | ) | 15,525 | |
Gain on sale of discontinued operations | | — | | 80,214 | | — | | 105,979 | | 367,007 | |
Equity in net gain on sale of joint venture property / real estate | | 9,533 | | — | | 93,481 | | 103,014 | | 31,509 | |
Minority interests | | 14 | | (3,993 | ) | (9,622 | ) | (15,473 | ) | (17,218 | ) |
Net Income | | 38,541 | | 103,537 | | 143,839 | | 313,240 | | 526,783 | |
| | | | | | | | | | | |
Dividends on perpetual preferred shares | | 4,969 | | 4,969 | | 4,969 | | 14,906 | | 14,907 | |
| | | | | | | | | | | |
Net Income Available For Common Shareholders | | $ | 33,572 | | $ | 98,568 | | $ | 138,870 | | $ | 298,334 | | $ | 511,876 | |
| | | | | | | | | | | |
Earnings per Share | | | | | | | | | | | |
Net income per share (basic) | | $ | 0.58 | | $ | 1.66 | | $ | 2.38 | | $ | 5.12 | | $ | 8.73 | |
Net income per share (diluted) | | $ | 0.58 | | $ | 1.64 | | $ | 2.37 | | $ | 5.09 | | $ | 8.62 | |
15
COMPARATIVE COMPUTATION OF FFO AND FAD
Unaudited ($000’s omitted - except per share data)
| 
|
| | Three Months Ended | | Three Months Ended | | Nine Months Ended | |
| | September 30, | | September 30, | | June 30, | | September 30, | | September 30, | |
| | 2008 | | 2007 | | 2008 | | 2008 | | 2007 | |
Funds from operations | | | | | | | | | | | |
Net Income before Minority Interests and Items | | $ | 28,697 | | $ | 24,769 | | $ | 60,302 | | $ | 121,138 | | $ | 129,960 | |
| | | | | | | | | | | |
Add: | Depreciation and amortization | | 54,554 | | 47,246 | | 55,433 | | 164,137 | | 124,983 | |
| FFO from discontinued operations | | 720 | | 5,242 | | 631 | | 1,690 | | 24,271 | |
| FFO adjustment for joint ventures | | 9,258 | | 5,747 | | 10,801 | | 26,564 | | 17,434 | |
Less: | Dividends on preferred shares | | 4,969 | | 4,969 | | 4,969 | | 14,906 | | 14,907 | |
| Non real estate depreciation and amortization | | 237 | | 215 | | 234 | | 693 | | 692 | |
| Funds From Operations | | $ | 88,023 | | $ | 77,820 | | $ | 121,964 | | $ | 297,930 | | $ | 281,049 | |
| | | | | | | | | | | | |
| Funds From Operations - Basic per Share | | $ | 1.46 | | $ | 1.26 | | $ | 2.01 | | $ | 4.91 | | $ | 4.60 | |
| | | | | | | | | | | | |
| Funds From Operations - Diluted per Share | | $ | 1.45 | | $ | 1.25 | | $ | 2.00 | | $ | 4.89 | | $ | 4.54 | |
| | | | | | | | | | | |
Funds Available for Distribution | | | | | | | | | | | |
FFO | | $ | 88,023 | | $ | 77,820 | | $ | 121,964 | | 297,930 | | 281,049 | |
| | | | | | | | | | | |
Add: | Non real estate depreciation and amortization | | 237 | | 215 | | 234 | | 693 | | 692 | |
| Amortization of deferred financing costs | | 1,604 | | 1,652 | | 1,541 | | 4,780 | | 14,195 | |
| Non-cash deferred compensation | | 4,727 | | 4,020 | | 4,351 | | 14,450 | | 18,128 | |
Less: | FAD adjustment for Joint Ventures | | 7,466 | | 7,777 | | 6,503 | | 20,764 | | 17,517 | |
| FAD adjustment for discontinued operations | | 105 | | 452 | | 235 | | (926 | ) | 2,564 | |
| Straight-line rental income and other non cash adjustments | | 19,510 | | 15,987 | | 15,664 | | 56,949 | | 43,250 | |
| Second cycle tenant improvements | | 4,985 | | 3,818 | | 6,223 | | 15,809 | | 8,843 | |
| Second cycle leasing commissions | | 4,162 | | 2,237 | | 3,540 | | 9,226 | | 6,589 | |
| Revenue enhancing recurring CAPEX | | 417 | | 272 | | 481 | | 1,024 | | 650 | |
| Non- revenue enhancing recurring CAPEX | | 1,998 | | 979 | | 633 | | 2,866 | | 3,223 | |
| | | | | | | | | | | |
Funds Available for Distribution | | $ | 55,948 | | $ | 52,185 | | $ | 94,811 | | $ | 212,141 | | $ | 231,429 | |
| Diluted per Share | | $ | 0.92 | | $ | 0.84 | | $ | 1.55 | | $ | 3.48 | | $ | 3.74 | |
| | | | | | | | | | | | |
First Cycle Leasing Costs | | | | | | | | | | | |
| Tenant improvements | | 4,077 | | 5,774 | | 11,753 | | 18,084 | | 8,405 | |
| Leasing commissions | | 3,051 | | 2,861 | | 5,904 | | 11,534 | | 6,225 | |
| | | | | | | | | | | |
Funds Available for Distribution after First Cycle Leasing Costs | | $ | 48,820 | | $ | 43,550 | | $ | 77,154 | | $ | 182,523 | | $ | 216,799 | |
| | | | | | | | | | | |
Funds Available for Distribution per Diluted Weighted Average Unit and Common Share | | $ | 0.80 | | $ | 0.70 | | $ | 1.26 | | $ | 2.99 | | $ | 3.50 | |
| | | | | | | | | | | |
Redevelopment Costs | | 11,000 | | 8,035 | | 13,965 | | $ | 31,155 | | $ | 19,671 | |
| | | | | | | | | | | |
Payout Ratio of Funds From Operations | | 54.32 | % | 56.14 | % | 39.40 | % | 48.36 | % | 46.26 | % |
Payout Ratio of Funds Available for Distribution Before First Cycle Leasing Costs | | 85.46 | % | 83.72 | % | 50.68 | % | 67.92 | % | 56.18 | % |
16
CONDENSED CONSOLIDATED STATEMENT OF STOCKHOLDERS’ EQUITY
Unaudited ($000’s omitted)
|
|
| | | | | | | | | | | | | | Accumulated | | | |
| | Series C | | Series D | | | | | | | | | | Other | | | |
| | Preferred | | Preferred | | Common | | Additional | | Treasury | | Retained | | Comprehensive | | | |
| | Stock | | Stock | | Stock | | Paid-In Capital | | Stock | | Earnings | | Income | | TOTAL | |
| | | | | | | | | | | | | | | | | |
Balance at December 31, 2007 | | $ | 151,981 | | $ | 96,321 | | $ | 601 | | $ | 2,931,887 | | $ | (150,719 | ) | $ | 791,861 | | $ | 4,943 | | $ | 3,826,875 | |
| | | | | | | | | | | | | | | | | |
Net Income | | | | | | | | | | | | 313,240 | | | | 313,240 | |
Preferred Dividend | | | | | | | | | | | | (14,906 | ) | | | (14,906 | ) |
Exercise of employee stock options | | | | | | 2 | | 7,057 | | | | | | | | 7,059 | |
Cash distributions declared ($2.3625 per common share) | | | | | | | | | | | | (137,283 | ) | | | (137,283 | ) |
Comprehensive Income - Unrealized loss on derivative instruments | | | | | | | | | | | | | | (1,361 | ) | (1,361 | ) |
Comprehensive Income - SLG share unrealized loss on derivative instruments of JV | | | | | | | | | | | | | | (17,310 | ) | (17,310 | ) |
Redemption of units and dividend reinvestment proceeds | | | | | | | | 233 | | | | | | | | 233 | |
Treasury stock | | | | | | | | | | (116,608 | ) | | | | | (116,608 | ) |
Deferred compensation plan | | | | | | 1 | | 472 | | | | | | | | 473 | |
Amortization of deferred compensation | | | | | | | | 31,108 | | | | | | | | 31,108 | |
Balance at September 30, 2008 | | $ | 151,981 | | $ | 96,321 | | $ | 604 | | $ | 2,970,757 | | $ | (267,327 | ) | $ | 952,912 | | $ | (13,728 | ) | $ | 3,891,520 | |
|
RECONCILIATION OF SHARES AND UNITS OUTSTANDING, AND DILUTION COMPUTATION |
|
| | Common Stock | | OP Units | | Stock-Based
Compensation | | Sub-total | | Preferred Stock | | Diluted Shares | |
| | | | | | | | | | | | | |
Share Count at December 31, 2007 | | 58,758,632 | | 2,340,359 | | — | | 61,098,991 | | — | | 61,098,991 | |
| | | | | | | | | | | | | |
YTD share activity | | (1,152,699 | ) | (506 | ) | | | (1,153,205 | ) | | | (1,153,205 | ) |
Share Count at September 30, 2008 - Basic | | 57,605,933 | | 2,339,853 | | — | | 59,945,786 | | — | | 59,945,786 | |
| | | | | | | | | | | | | |
Weighting Factor | | 701,396 | | 50 | | 338,077 | | 1,039,523 | | | | 1,039,523 | |
Weighted Average Share Count at September 30, 2008 - Diluted | | 58,307,329 | | 2,339,903 | | 338,077 | | 60,985,309 | | — | | 60,985,309 | |
17
TAXABLE INCOME
Unaudited ($000’s omitted)
| 
|
| | Nine Months Ended | |
| | September 30, | | September 30, | |
| | 2008 | | 2007 | |
| | | | | |
Net Income Available For Common Shareholders | | $ | 298,334 | | $ | 511,876 | |
Book/Tax Depreciation Adjustment | | 34,134 | | 27,939 | |
Book/Tax Gain Recognition Adjustment | | (113,236 | ) | (396,289 | ) |
Book/Tax JV Net equity adjustment | | 21,939 | | (33,804 | ) |
Other Operating Adjustments | | 14,357 | | 14,420 | |
C-corp Earnings | | (119,437 | ) | 380 | |
Taxable Income (Projected) | | $ | 136,091 | | $ | 124,522 | |
| | | | | |
Dividend per share | | $ | 2.36 | | $ | 2.10 | |
Estimated payout of taxable income | | 100 | % | 100 | % |
| | | | | |
Shares outstanding - basic | | 57,606 | | 59,213 | |
Payout of Taxable Income Analysis:
Estimated taxable income is derived from net income less straightline rent, free rent net of amortization, plus tax gain on sale of properties, credit loss, straightline ground rent and the difference between tax and GAAP depreciation. The Company has deferred the taxable gain on the sales of 286, 290 & 292 Madison Avenue, 1140 Avenue of the Americas, One Park Avenue, 70 West 36 street, 110 East 42nd Street, 125 Broad Street and 440 Ninth Avenue through 1031 exchanges. In addition, the Company has deferred substantially all of the taxable gain resulting from the sale of an interest in 1372 Broadway and 470 Park Avenue South.
18
JOINT VENTURE STATEMENTS
Balance Sheet for Unconsolidated Property Joint Ventures
Unaudited
($000’s omitted)
| 
|
| | September 30, 2008 | | September 30, 2007 | |
| | Total Property | | SLG Property Interest | | Total Property | | SLG Property Interest | |
Land & land interests | | $ | 1,505,609 | | $ | 718,873 | | $ | 1,148,792 | | $ | 552,151 | |
Buildings & improvements fee interest | | 4,838,145 | | 2,044,907 | | 3,256,086 | | 1,331,550 | |
Buildings & improvements leasehold | | 257,633 | | 127,571 | | 262,605 | | 130,073 | |
| | 6,601,387 | | 2,891,351 | | 4,667,483 | | 2,013,774 | |
Less accumulated depreciation | | (338,949 | ) | (153,763 | ) | (229,520 | ) | (111,071 | ) |
| | | | | | | | | |
Net Real Estate | | 6,262,438 | | 2,737,588 | | 4,437,963 | | 1,902,703 | |
| | | | | | | | | |
Cash and cash equivalents | | 101,042 | | 46,460 | | 88,185 | | 38,502 | |
Restricted cash | | 35,958 | | 17,429 | | 38,111 | | 17,595 | |
Tenant receivables, net of $2,296 reserve at 9/30/08 | | 12,938 | | 5,743 | | 15,706 | | 7,386 | |
Deferred rents receivable, net of reserve for tenant credit loss of $2,974 at 9/30/08 | | 120,427 | | 58,945 | | 78,432 | | 38,949 | |
Deferred costs, net | | 113,913 | | 47,633 | | 72,826 | | 33,575 | |
Other assets | | 139,359 | | 49,150 | | 28,749 | | 12,633 | |
| | | | | | | | | |
Total Assets | | $ | 6,786,075 | | $ | 2,962,948 | | $ | 4,759,972 | | $ | 2,051,343 | |
| | | | | | | | | |
Mortgage loans payable | | $ | 4,345,677 | | $ | 1,931,923 | | $ | 2,854,993 | | $ | 1,281,344 | |
Derivative Instruments-fair value | | 6,107 | | 3,143 | | 25 | | 14 | |
Accrued interest payable | | 12,755 | | 5,719 | | 1,113 | | 2,515 | |
Accounts payable and accrued expenses | | 45,064 | | 20,388 | | 131,571 | | 51,617 | |
Deferred revenue | | 161,826 | | 56,297 | | 32,297 | | 14,984 | |
Security deposits | | 9,038 | | 4,185 | | 11,027 | | 5,523 | |
Contributed Capital (1) | | 2,205,608 | | 941,293 | | 1,728,946 | | 695,346 | |
| | | | | | | | | |
Total Liabilities and Equity | | $ | 6,786,075 | | $ | 2,962,948 | | $ | 4,759,972 | | $ | 2,051,343 | |
As of September 30, 2008 the Company had twenty unconsolidated joint venture interests including a 50% interest in 100 Park Avenue, a 68.5% economic interest in 1515 Broadway increased from 55% in December 2005, a 45% interest in 1221 Avenue of the Americas, a 45% interest in 379 West Broadway, a 48% interest in the Mack - Green Joint Venture, a 50% interest in 21-25 West 34th Street, a 46.9% interest in 800 Third Avenue, a 50% interest in 521 Fifth Avenue, a 30% interest in One Court Square, a 63% economic interest in 1604-1610 Broadway, a 20.26% interest in 1&2 Jericho Plaza, a 55% interest in 2 Herald Square, a 32.25% interest in 1745 Broadway, a 55% interest in 885 Third Avenue, a 35% interest in 16 Court Street, a 25% interest in The Meadows, a 50.6% interest in 388/390 Greenwich Street, a 50% interest in 27-29 West 34th Street, a 10% interest in 1551/1555 Broadway decreased from 50% in August 2008 and a 32.75% interest in 717 Fifth Avenue. These interests are accounted for on the equity method of accounting and, therefore, are not consolidated into the company’s financial statements.
As we have been designated as the primary beneficiary under FIN 46(R), we have consolidated the accounts of the following seven joint ventures including a 50% interest in 141 Fifth Avenue, a 50% interest in 180-182 Broadway and a 51% interest in 919 Third Avenue, 100 White Plains Road, 120 White Plains Road, 680 Washington Avenue and 750 Washington Avenue.
(1) | Contributed capital includes adjustments to capital to reflect our share of capital based on implied sales prices of partially sold or contributed properties. Our investment in unconsolidated joint venture reflects our actual contributed capital base. |
19
JOINT VENTURE STATEMENTS Statements of Operations for Unconsolidated Property Joint Ventures Unaudited ($000’s omitted) |
|
| | | | | | Three Months Ended | | | | | |
| | Three Months Ended September 30, 2008 | | June 30, 2008 | | Three Months Ended September 30, 2007 | |
| | | | SLG | | SLG | | | | SLG | |
| | Total Property | | Property Interest | | Property Interest | | Total Property | | Property Interest | |
Revenues | | | | | | | | | | | |
Rental Revenue, net | | $ | 141,982 | | $ | 67,351 | | $ | 69,392 | | $ | 119,885 | | $ | 58,568 | |
Escalation and reimbursement revenues | | 20,958 | | 10,673 | | 10,821 | | 20,783 | | 10,879 | |
Investment and other income | | 1,035 | | 551 | | 609 | | 1,239 | | 661 | |
Total Revenues, net | | $ | 163,975 | | $ | 78,575 | | $ | 80,822 | | $ | 141,907 | | $ | 70,108 | |
| | | | | | | | | | | |
Expenses | | | | | | | | | | | |
Operating expenses | | $ | 33,673 | | $ | 16,139 | | $ | 15,028 | | $ | 31,155 | | $ | 15,856 | |
Ground rent | | 1,330 | | 722 | | 575 | | 1,186 | | 665 | |
Real estate taxes | | 18,844 | | 9,242 | | 9,620 | | 19,375 | | 9,643 | |
Total Operating Expenses | | $ | 53,847 | | $ | 26,103 | | $ | 25,223 | | $ | 51,716 | | $ | 26,164 | |
| | | | | | | | | | | |
GAAP NOI | | $ | 110,128 | | $ | 52,472 | | $ | 55,599 | | $ | 90,191 | | $ | 43,944 | |
Cash NOI | | $ | 97,039 | | $ | 46,162 | | $ | 49,616 | | $ | 78,008 | | $ | 37,923 | |
| | | | | | | | | | | |
Interest | | 51,236 | | 24,057 | | 22,395 | | 48,917 | | 24,460 | |
Amortization of deferred financing costs | | 4,282 | | 1,839 | | 1,521 | | 2,209 | | 990 | |
Depreciation and amortization | | 34,672 | | 15,436 | | 15,423 | | 27,348 | | 12,588 | |
| | | | | | | | | | | |
Net Income | | $ | 19,938 | | $ | 11,140 | | $ | 16,260 | | $ | 11,717 | | $ | 5,906 | |
| | | | | | | | | | | |
Plus: Real estate depreciation | | 34,672 | | 15,436 | | 15,413 | | 27,298 | | 12,578 | |
Funds From Operations | | $ | 54,610 | | $ | 26,576 | | $ | 31,673 | | $ | 39,015 | | $ | 18,484 | |
| | | | | | | | | | | |
FAD Adjustments: | | | | | | | | | | | |
Plus: | Non real estate depreciation and amortization | | $ | 4,282 | | $ | 1,839 | | $ | 1,531 | | $ | 2,259 | | $ | 1,000 | |
Less: | Straight-line rental income and other non-cash adjustments | | (12,736 | ) | (6,203 | ) | (5,878 | ) | (12,180 | ) | (6,031 | ) |
Less: | Second cycle tenant improvement | | (3,014 | ) | (1,477 | ) | (1,560 | ) | (2,098 | ) | (1,083 | ) |
Less: | Second cycle leasing commissions | | (3,487 | ) | (1,622 | ) | (538 | ) | (3,047 | ) | (1,516 | ) |
Less: | Recurring CAPEX | | (9 | ) | (3 | ) | (58 | ) | (219 | ) | (147 | ) |
FAD Adjustment | | $ | (14,964 | ) | $ | (7,466 | ) | $ | (6,503 | ) | $ | (15,285 | ) | $ | (7,777 | ) |
GKK Manager
| | Three Months Ended | | Three Months Ended | | Nine Months Ended | |
| | September 30, | | September 30, | | June 30, | | September 30, | | September 30, | |
| | 2008 | | 2007 | | 2008 | | 2008 | | 2007 | |
Base management income | | $ | 5,978 | | $ | 3,271 | | $ | 5,760 | | $ | 15,937 | | $ | 9,047 | |
Other fee income | | — | | 5,146 | | 3,911 | | 8,109 | | 13,903 | |
Marketing, general and administrative expenses | | (5,682 | ) | (3,706 | ) | (6,985 | ) | (16,189 | ) | (9,562 | ) |
Net Income before minority interest | | 296 | | 4,711 | | 2,686 | | 7,857 | | 13,388 | |
Less: minority interest | | (64 | ) | (1,609 | ) | (580 | ) | (2,313 | ) | (4,599 | ) |
SLG share of GKK Manager net income | | 232 | | 3,102 | | 2,106 | | 5,544 | | 8,789 | |
Servicing and administrative reimbursements | | 2,041 | | 1,366 | | 2,040 | | 5,353 | | 3,688 | |
Net management income and reimbursements from Gramercy | | $ | 2,273 | | $ | 4,468 | | $ | 4,146 | | $ | 10,897 | | $ | 12,477 | |
20
JOINT VENTURE STATEMENTS Statements of Operations for Unconsolidated Property Joint Ventures Unaudited ($000’s omitted) |
|
| | Nine Months Ended September 30, 2008 | | Nine Months Ended September 30, 2007 | |
| | | | SLG | | | | SLG | |
| | Total Property | | Property Interest | | Total Property | | Property Interest | |
Revenues | | | | | | | | | |
Rental Revenue, net | | $ | 428,475 | | $ | 206,416 | | $ | 338,409 | | $ | 167,679 | |
Escalation and reimbursement revenues | | 62,759 | | 31,879 | | 58,512 | | 30,855 | |
Investment and other income | | 4,001 | | 1,958 | | 5,078 | | 2,654 | |
Total Revenues, net | | $ | 495,235 | | $ | 240,253 | | $ | 401,999 | | $ | 201,188 | |
| | | | | | | | | |
Expenses | | | | | | | | | |
Operating expenses | | $ | 97,547 | | $ | 47,196 | | $ | 87,072 | | $ | 44,589 | |
Ground rent | | 3,334 | | 1,872 | | 2,761 | | 1,508 | |
Real estate taxes | | 58,457 | | 28,886 | | 58,406 | | 29,589 | |
Total Operating Expenses | | $ | 159,338 | | $ | 77,954 | | $ | 148,239 | | $ | 75,686 | |
| | | | | | | | | |
GAAP NOI | | $ | 335,897 | | $ | 162,299 | | $ | 253,760 | | $ | 125,502 | |
Cash NOI | | $ | 300,148 | | $ | 144,453 | | $ | 227,093 | | $ | 113,318 | |
| | | | | | | | | |
Interest | | 146,960 | | 69,240 | | 133,325 | | 68,213 | |
Amortization of deferred financing costs | | 10,804 | | 4,700 | | 5,600 | | 2,683 | |
Depreciation and amortization | | 103,198 | | 46,624 | | 76,339 | | 36,539 | |
| | | | | | | | | |
Net Income | | $ | 74,935 | | $ | 41,735 | | $ | 38,496 | | $ | 18,067 | |
| | | | | | | | | |
Plus: Real estate depreciation | | 103,097 | | 46,604 | | 76,249 | | 36,521 | |
Funds From Operations | | $ | 178,032 | | $ | 88,339 | | $ | 114,745 | | $ | 54,588 | |
| | | | | | | | | |
FAD Adjustments: | | | | | | | | | |
Plus: | Non real estate depreciation and amortization | | $ | 10,904 | | $ | 4,720 | | $ | 5,690 | | $ | 2,701 | |
Less: | Straight-line rental income and other non-cash adjustments | | (35,044 | ) | (17,635 | ) | (26,446 | ) | (12,726 | ) |
Less: | Second cycle tenant improvement | | (10,010 | ) | (4,475 | ) | (7,082 | ) | (3,738 | ) |
Less: | Second cycle leasing commissions | | (6,696 | ) | (3,062 | ) | (5,870 | ) | (2,988 | ) |
Less: | Recurring CAPEX | | (479 | ) | (312 | ) | (1,133 | ) | (766 | ) |
FAD Adjustment | | $ | (41,325 | ) | $ | (20,764 | ) | $ | (34,841 | ) | $ | (17,517 | ) |
21
SELECTED FINANCIAL DATA
Capitalization Analysis
Unaudited
($000’s omitted)
| 
|
| | 9/30/2008 | | 6/30/2008 | | 3/31/2008 | | 12/31/2007 | | 9/30/2007 | |
Market Capitalization | | | | | | | | | | | |
Common Equity: | | | | | | | | | | | |
Common Shares Outstanding | | 57,606 | | 58,283 | | 58,284 | | 58,759 | | 59,213 | |
OP Units Outstanding | | 2,340 | | 2,340 | | 2,340 | | 2,340 | | 2,350 | |
Total Common Equity (Shares and Units) | | 59,946 | | 60,623 | | 60,624 | | 61,099 | | 61,563 | |
Share Price (End of Period) | | $ | 64.80 | | $ | 82.72 | | $ | 81.47 | | $ | 93.46 | | $ | 116.77 | |
Equity Market Value | | $ | 3,884,501 | | $ | 5,014,735 | | $ | 4,939,037 | | $ | 5,710,313 | | $ | 7,188,712 | |
Preferred Equity at Liquidation Value: | | 257,500 | | 257,500 | | 257,500 | | 257,500 | | 257,500 | |
| | | | | | | | | | | |
Real Estate Debt | | | | | | | | | | | |
Property Level Mortgage Debt | | 2,693,275 | | 2,867,305 | | 2,867,593 | | 2,844,644 | | 2,846,529 | |
Outstanding Balance on - Term Loans | | — | | — | | 276,650 | | 276,650 | | — | |
Outstanding Balance on – Unsecured Credit Line | | 1,288,833 | | 644,500 | | 720,500 | | 708,500 | | 590,000 | |
Junior Subordinated Deferrable Interest Debentures | | 100,000 | | 100,000 | | 100,000 | | 100,000 | | 100,000 | |
Unsecured Notes | | 774,684 | | 774,676 | | 774,668 | | 774,660 | | 774,652 | |
Convertible Bonds | | 1,019,176 | | 1,018,992 | | 1,018,809 | | 1,018,628 | | 1,018,448 | |
Total Consolidated Debt | | 5,875,968 | | 5,405,473 | | 5,758,220 | | 5,723,082 | | 5,329,629 | |
Company’s Portion of Joint Venture Debt | | 1,931,923 | | 1,840,071 | | 1,593,355 | | 1,593,246 | | 1,281,344 | |
Total Combined Debt | | 7,807,891 | | 7,245,544 | | 7,351,575 | | 7,316,328 | | 6,610,973 | |
| | | | | | | | | | | |
Total Market Cap (Debt & Equity) | | $ | 11,949,892 | | $ | 12,517,779 | | $ | 12,548,112 | | $ | 13,284,141 | | $ | 14,057,185 | |
| | | | | | | | | | | |
Availability under Lines of Credit | | | | | | | | | | | |
Senior Unsecured Line of Credit | | 182,111 | (A) | 818,483 | | 741,451 | | 751,226 | | 618,374 | |
Term Loans | | — | | — | | — | | — | | — | |
Total Availability | | $ | 182,111 | | $ | 818,483 | | $ | 741,451 | | $ | 751,226 | | $ | 618,374 | |
(A) As reduced by $29,056 letters of credit.
Combined Capitalized Interest | | $ | 595 | | $ | 790 | | $ | 840 | | $ | 1,692 | | $ | 2,833 | |
| | | | | | | | | | | |
Ratio Analysis | | | | | | | | | | | |
Consolidated Basis | | | | | | | | | | | |
Debt to Market Cap Ratio | | 58.65 | % | 50.62 | % | 52.56 | % | 48.95 | % | 41.72 | % |
Debt to Gross Real Estate Book Ratio | | 70.21 | % | 61.84 | % | 66.19 | % | 65.92 | % | 54.75 | % |
Secured Real Estate Debt to Secured Assets Gross Book | | 59.20 | % | 59.49 | % | 59.06 | % | 59.39 | % | 62.07 | % |
Unsecured Debt to Unencumbered Assets-Gross Book Value | | 86.20 | % | 66.80 | % | 69.04 | % | 67.22 | % | 64.93 | % |
Joint Ventures Allocated | | | | | | | | | | | |
Combined Debt to Market Cap Ratio | | 65.34 | % | 57.88 | % | 58.59 | % | 55.08 | % | 47.03 | % |
Debt to Gross Real Estate Book Ratio | | 69.34 | % | 62.88 | % | 63.72 | % | 63.49 | % | 56.45 | % |
Secured Real Estate Debt to Secured Assets Gross Book | | 62.16 | % | 61.92 | % | 58.04 | % | 58.23 | % | 62.90 | % |
22
SELECTED FINANCIAL DATA
Property NOI and Coverage Ratios
Unaudited
($000’s omitted) |
|
| | Three Months Ended | | Three Months Ended | | Nine Months Ended | |
| | Sept 30, | | Sept 30, | | June 30, | | Sept 30, | | Sept 30, | |
| | 2008 | | 2007 | | 2008 | | 2008 | | 2007 | |
Property NOI | | | | | | | | | | | |
| | | | | | | | | | | |
Property Operating NOI | | $ | 131,359 | | $ | 114,116 | | $ | 128,784 | | $ | 391,618 | | $ | 304,632 | |
NOI from Discontinued Operations | | 1,059 | | 5,772 | | 1,107 | | 3,144 | | 27,338 | |
Total Property Operating NOI - Consolidated | | 132,418 | | 119,888 | | 129,891 | | 394,762 | | 331,970 | |
SLG share of Property NOI from JVs | | 52,472 | | 43,944 | | 55,599 | | 162,299 | | 125,502 | |
GAAP NOI | | $ | 184,890 | | $ | 163,832 | | $ | 185,490 | | $ | 557,061 | | $ | 457,472 | |
| | | | | | | | | | | |
Less: | Free Rent (Net of Amortization) | | 1,069 | | 4,193 | | 597 | | 5,499 | | 12,258 | |
| Net FAS 141 Adjustment | | 7,952 | | 1,935 | | 4,274 | | 18,062 | | 3,572 | |
| Straightline Revenue Adjustment | | 14,325 | | 15,371 | | 13,947 | | 43,653 | | 39,385 | |
| | | | | | | | | | | | |
Plus: | Allowance for S/L tenant credit loss | | 1,293 | | 1,311 | | 974 | | 3,252 | | 3,758 | |
| Ground Lease Straight-line Adjustment | | 91 | | 87 | | 91 | | 600 | | 331 | |
Cash NOI | | $ | 162,928 | | $ | 143,731 | | $ | 167,737 | | $ | 493,699 | | $ | 406,346 | |
| | | | | | | | | | | |
Components of Debt Service and Fixed Charges | | | | | | | | | | | |
| | | | | | | | | | | |
Interest Expense | | 71,191 | | 68,304 | | 72,955 | | 221,082 | | 193,750 | |
Fixed Amortization Principal Payments | | 6,150 | | 3,828 | | 6,052 | | 18,115 | | 11,264 | |
Total Consolidated Debt Service | | 77,341 | | 72,132 | | 79,007 | | 239,197 | | 205,014 | |
| | | | | | | | | | | |
Payments under Ground Lease Arrangements | | 7,800 | | 8,761 | | 7,917 | | 24,384 | | 24,036 | |
Dividend on perpetual preferred shares | | 4,969 | | 4,969 | | 4,969 | | 14,906 | | 14,907 | |
Total Consolidated Fixed Charges | | 90,110 | | 85,862 | | 91,893 | | 278,487 | | 243,957 | |
| | | | | | | | | | | |
Adjusted EBITDA | | 176,450 | | 164,296 | | 208,153 | | 568,547 | | 530,751 | |
Interest Coverage Ratio | | 2.47 | | 2.35 | | 2.89 | | 2.58 | | 2.65 | |
Debt Service Coverage Ratio | | 2.28 | | 2.23 | | 2.67 | | 2.39 | | 2.51 | |
Fixed Charge Coverage Ratio | | 1.95 | | 1.88 | | 2.29 | | 2.05 | | 2.12 | |
23
SELECTED FINANCIAL DATA
2008 Same Store - Consolidated Unaudited ($000’s omitted) |
|
| | | Three Months Ended | | Three Months Ended | | Nine Months Ended | |
| | | September 30, | | September 30, | | | | June 30, | | September 30, | | September 30, | | | |
| | | 2008 | | 2007 | | % | | 2008 | | 2008 | | 2007 (1) | | % | |
Revenues | | | | | | | | | | | | | | | |
| Rental Revenue, net | | 171,634 | | 158,698 | | 8.2 | % | 164,814 | | 502,758 | | 465,931 | | 7.9 | % |
| Escalation & Reimbursement Revenues | | 31,205 | | 28,376 | | 10.0 | % | 28,830 | | 88,821 | | 83,753 | | 6.1 | % |
| Investment Income | | 550 | | 679 | | -19.0 | % | 574 | | 1,892 | | 2,851 | | -33.6 | % |
| Other Income | | 1,265 | | 1,391 | | -9.1 | % | 4,442 | | 7,882 | | 5,929 | | 32.9 | % |
| Total Revenues | | 204,654 | | 189,144 | | 8.2 | % | 198,660 | | 601,353 | | 558,464 | | 7.7 | % |
Expenses | | | | | | | | | | | | | | | |
| Operating Expense | | 54,490 | | 50,105 | | 8.8 | % | 47,781 | | 150,682 | | 143,652 | | 4.9 | % |
| Ground Rent | | 7,922 | | 8,674 | | -8.7 | % | 7,922 | | 24,092 | | 23,690 | | 1.7 | % |
| Real Estate Taxes | | 30,502 | | 29,594 | | 3.1 | % | 31,524 | | 93,402 | | 92,916 | | 0.5 | % |
| | | 92,914 | | 88,373 | | 5.1 | % | 87,227 | | 268,176 | | 260,258 | | 3.0 | % |
| | | | | | | | | | | | | | | | |
| EBITDA | | 111,740 | | 100,771 | | 10.9 | % | 111,433 | | 333,177 | | 298,206 | | 11.7 | % |
| | | | | | | | | | | | | | | | |
| Interest Expense & Amortization of Financing costs | | 26,754 | | 27,649 | | -3.2 | % | 26,008 | | 79,398 | | 79,474 | | -0.1 | % |
| Depreciation & Amortization | | 44,582 | | 40,051 | | 11.3 | % | 44,891 | | 132,378 | | 112,696 | | 17.5 | % |
| | | | | | | | | | | | | | | | |
| Income Before Minority Interest | | 40,404 | | 33,071 | | 22.2 | % | 40,534 | | 121,401 | | 106,036 | | 14.5 | % |
Plus: | Real Estate Depreciation & Amortization | | 44,578 | | 40,043 | | 11.3 | % | 44,881 | | 132,358 | | 112,673 | | 17.5 | % |
| | | | | | | | | | | | | | | | |
| FFO | | 84,982 | | 73,114 | | 16.2 | % | 85,415 | | 253,759 | | 218,709 | | 16.0 | % |
| | | | | | | | | | | | | | | | |
Less: | Non –Building Revenue | | 1,530 | | 1,183 | | 29.3 | % | 821 | | 3,568 | | 3,949 | | -9.6 | % |
| | | | | | | | | | | | | | | | |
Plus: | Interest Expense & Amortization of Financing costs | | 26,754 | | 27,649 | | -3.2 | % | 26,008 | | 79,398 | | 79,474 | | -0.1 | % |
| Non Real Estate Depreciation | | 4 | | 8 | | -50.0 | % | 10 | | 20 | | 23 | | -13.0 | % |
| GAAP NOI | | 110,210 | | 99,588 | | 10.7 | % | 110,612 | | 329,609 | | 294,257 | | 12.0 | % |
| | | | | | | | | | | | | | | | |
Cash Adjustments | | | | | | | | | | | | | | | |
Less: | Free Rent (Net of Amortization) | | 1,051 | | 3,566 | | -70.5 | % | 804 | | 2,638 | | 9,273 | | -71.6 | % |
| Straightline Revenue Adjustment | | 6,705 | | 6,840 | | -2.0 | % | 5,740 | | 19,031 | | 22,045 | | -13.7 | % |
| Rental Income - FAS 141 | | 7,311 | | 925 | | 690.4 | % | 3,861 | | 16,899 | | 2,202 | | 667.4 | % |
Plus: | Allowance for S/L tenant credit loss | | 1,046 | | 860 | | 21.6 | % | 770 | | 2,634 | | 2,688 | | -2.0 | % |
| Ground Lease Straight-line Adjustment | | (666 | ) | 87 | | -865.5 | % | (666 | ) | (1,672 | ) | 260 | | -743.1 | % |
| Cash NOI | | 95,523 | | 89,204 | | 7.1 | % | 100,311 | | 292,003 | | 263,685 | | 10.7 | % |
| | | | | | | | | | | | | | | | |
Operating Margins | | | | | | | | | | | | | | | |
| GAAP NOI to Real Estate Revenue, net | | 53.98 | % | 52.74 | % | | | 55.69 | % | 54.90 | % | 52.81 | % | | |
| Cash NOI to Real Estate Revenue, net | | 46.79 | % | 47.24 | % | | | 50.51 | % | 48.63 | % | 47.32 | % | | |
| | | | | | | | | | | | | | | | |
| GAAP NOI before Ground Rent/Real Estate Revenue, net | | 57.86 | % | 57.34 | % | | | 59.68 | % | 58.91 | % | 57.06 | % | | |
| Cash NOI before Ground Rent/Real Estate Revenue, net | | 50.99 | % | 51.79 | % | | | 54.83 | % | 52.92 | % | 51.53 | % | | |
| | | | | | | | | | | | | | | | | | |
(1) The September 30, 2007 same store data includes the operations of the Reckson properties as if the merger closed on January 1, 2007.
24
SELECTED FINANCIAL DATA
2008 Same Store - Joint Venture Unaudited ($000’s omitted) |
|
| | Three Months Ended | | | | Nine Months Ended | | | |
| | September 30, | | September 30, | | | | September 30, | | September 30, | | | |
| | 2008 | | 2007 | | % | | 2008 | | 2007 (1) | | % | |
Revenues | | | | | | | | | | | | | |
| Rental Revenue, net | | 41,974 | | 40,039 | | 4.8 | % | 125,819 | | 120,268 | | 4.6 | % |
| Escalation & Reimbursement Revenues | | 9,940 | | 9,585 | | 3.7 | % | 28,863 | | 27,485 | | 5.0 | % |
| Investment Income | | 134 | | 402 | | -66.7 | % | 689 | | 1,247 | | -44.7 | % |
| Other Income | | 89 | | 32 | | 178.1 | % | 153 | | 618 | | -75.2 | % |
| Total Revenues | | 52,137 | | 50,058 | | 4.2 | % | 155,524 | | 149,618 | | 3.9 | % |
Expenses | | | | | | | | | | | | | |
| Operating Expense | | 14,347 | | 13,369 | | 7.3 | % | 40,043 | | 38,040 | | 5.3 | % |
| Ground Rent | | 308 | | 220 | | 40.0 | % | 630 | | 649 | | -2.9 | % |
| Real Estate Taxes | | 8,644 | | 8,502 | | 1.7 | % | 26,170 | �� | 26,309 | | -0.5 | % |
| | 23,299 | | 22,091 | | 5.5 | % | 66,843 | | 64,998 | | 2.8 | % |
| | | | | | | | | | | | | |
| EBITDA | | 28,838 | | 27,967 | | 3.1 | % | 88,681 | | 84,620 | | 4.8 | % |
| | | | | | | | | | | | | |
| Interest Expense & Amortization of Financing costs | | 10,238 | | 14,689 | | -30.3 | % | 32,837 | | 42,956 | | -23.6 | % |
| Depreciation & Amortization | | 9,284 | | 9,132 | | 1.7 | % | 27,836 | | 26,204 | | 6.2 | % |
| | | | | | | | | | | | | | |
| Income Before Minority Interest | | 9,316 | | 4,146 | | 124.7 | % | 28,008 | | 15,460 | | 81.2 | % |
Plus: | Real Estate Depreciation & Amortization | | 9,284 | | 9,132 | | 1.7 | % | 27,836 | | 26,204 | | 6.2 | % |
| | | | | | | | | | | | | | |
| FFO | | 18,600 | | 13,278 | | 40.1 | % | 55,844 | | 41,664 | | 34.0 | % |
| | | | | | | | | | | | | | |
Less: | Non – Building Revenue | | 147 | | 407 | | -63.9 | % | 732 | | 1,263 | | -42.0 | % |
| | | | | | | | | | | | | | |
Plus: | Interest Expense & Amortization of Financing costs | | 10,238 | | 14,689 | | -30.3 | % | 32,837 | | 42,956 | | -23.6 | % |
| Non Real Estate Depreciation | | — | | — | | | | — | | — | | | |
| GAAP NOI | | 28,691 | | 27,560 | | 4.1 | % | 87,949 | | 83,357 | | 5.5 | % |
| | | | | | | | | | | | | |
Cash Adjustments | | | | | | | | | | | | | |
Less: | Free Rent (Net of Amortization) | | 237 | | 156 | | 51.9 | % | 14 | | 1,175 | | -98.8 | % |
| Straightline Revenue Adjustment | | 930 | | 1,389 | | -33.0 | % | 2,833 | | 4,584 | | -38.2 | % |
| FAS 141 | | 667 | | 269 | | 148.0 | % | 1,982 | | 802 | | 147.1 | % |
Plus: | Allowance for S/L tenant credit loss | | 213 | | 162 | | 31.5 | % | 446 | | 557 | | -19.9 | % |
| Ground Lease Straight-line Adjustment | | 176 | | 40 | | 340.0 | % | 240 | | 128 | | 87.5 | % |
| Cash NOI | | 27,246 | | 25,948 | | 5.0 | % | 83,806 | | 77,481 | | 8.2 | % |
| | | | | | | | | | | | | |
Operating Margins | | | | | | | | | | | | | |
| GAAP NOI to Real Estate Revenue, net | | 54.96 | % | 55.33 | % | | | 56.65 | % | 55.98 | % | | |
| Cash NOI to Real Estate Revenue, net | | 52.19 | % | 52.09 | % | | | 53.99 | % | 52.03 | % | | |
| | | | | | | | | | | | | | |
| GAAP NOI before Ground Rent/Real Estate Revenue, net | | 55.55 | % | 55.77 | % | | | 57.06 | % | 56.41 | % | | |
| Cash NOI before Ground Rent/Real Estate Revenue, net | | 52.45 | % | 52.45 | % | | | 54.24 | % | 52.38 | % | | |
(1) The September 30, 2007 same store data includes the operations of the Reckson properties as if the merger closed on January 1, 2007.
25
DEBT SUMMARY SCHEDULE - Consolidated
Unaudited
($000’s omitted)
| 
|
| | Principal | | | | 2008 Annual | | | | | | As-Of | | | |
| | Outstanding | | | | Principal | | Maturity | | Due at | | Right | | Earliest | |
| | 9/30/2008 | | Coupon | | Repayment | | Date | | Maturity | | Extension | | Prepayment | |
Fixed rate debt | | | | | | | | | | | | | | | |
Secured fixed rate debt | | | | | | | | | | | | | | | |
300 Main Street | | 11,500 | | 5.75 | % | — | | Feb-17 | | 11,500 | | — | | Feb-10 | |
399 Knollwood | | 18,805 | | 5.75 | % | 296 | | Mar-14 | | 16,943 | | — | | Open | |
141 Fifth Avenue | | 25,000 | | 5.70 | % | — | | Jun-17 | | 26,050 | | — | | Jun-10 | |
500 West Putnam Avenue | | 25,000 | | 5.52 | % | — | | Jan-16 | | 21,849 | | — | | Open | |
673 First Avenue | | 32,578 | | 5.67 | % | 732 | | Feb-13 | | 28,984 | | — | | Open | |
55 Corporate Drive | | 95,000 | | 5.75 | % | — | | Dec-15 | | 95,000 | | — | | Open | |
625 Madison Avenue | | 98,144 | | 6.27 | % | 2,192 | | Nov-15 | | 78,595 | | — | | Open | |
609 Fifth Avenue | | 99,653 | | 5.85 | % | 1,272 | | Oct-13 | | 92,062 | | — | | Open | |
420 Lexington Avenue | | 110,718 | | 8.44 | % | 2,700 | | Nov-10 | | 104,145 | | — | | Open | |
711 Third Avenue | | 120,000 | | 4.99 | % | — | | Jun-15 | | 120,000 | | — | | Open | |
120 W 45th Street | | 170,000 | | 6.12 | % | — | | Feb-17 | | 170,000 | | — | | Jan-10 | |
220 E 42nd Street | | 203,733 | | 5.23 | % | 3,686 | | Nov-13 | | 182,342 | | — | | Open | |
919 Third Avenue | | 229,285 | | 6.87 | % | 3,612 | | Jul-11 | | 217,592 | | — | | Open | |
485 Lexington Avenue | | 450,000 | | 5.61 | % | — | | Feb-17 | | 450,000 | | — | | Jan-10 | |
1 Madison Avenue - South Building | | 665,784 | | 5.91 | % | 10,399 | | May-20 | | 222,492 | | — | | Open | |
| | 2,355,200 | | 5.97 | % | 24,889 | | | | 1,837,554 | | | | | |
Secured fixed rate debt - Other | | | | | | | | | | | | | | | |
609 Partners, LLC | | 63,891 | | 5.00 | % | — | | Jul-14 | | 63,891 | | — | | Open | |
| | 63,891 | | 5.00 | % | — | | | | 63,891 | | | | | |
Unsecured fixed rate debt | | | | | | | | | | | | | | | |
Senior Unsecured Line of Credit | | 160,000 | | 5.34 | % | — | | Jun-11 | | 160,000 | | Jun-12 | | Open | |
Junior Subordinated Deferrable Interest Debentures | | 100,000 | | 5.61 | % | — | | Jun-15 | | 100,000 | | — | | — | |
Unsecured Note | | 150,000 | | 5.15 | % | — | | Jan-11 | | 150,000 | | — | | Open | |
Unsecured Note | | 150,000 | | 5.88 | % | — | | Aug-14 | | 150,000 | | — | | Open | |
Unsecured Note | | 200,000 | | 7.75 | % | — | | Mar-09 | | 200,000 | | — | | Open | |
Unsecured Note | | 274,684 | | 6.00 | % | — | | Mar-16 | | 275,000 | | — | | Open | |
Convertible Note | | 282,397 | | 4.00 | % | — | | Jun-25 | (1) | 287,000 | | — | | Jun-10 | |
Convertible Note (net) | | 736,779 | | 3.00 | % | — | | Mar-27 | (2) | 750,000 | | — | | Apr-12 | |
| | 2,053,860 | | 4.68 | % | — | | | | 2,072,000 | | | | | |
| | | | | | | | | | | | | | | |
Total Fixed Rate Debt/Wtd Avg | | 4,472,951 | | 5.36 | % | 24,889 | | | | 3,973,445 | | | | | |
| | | | | | | | | | | | | | | |
Floating rate debt | | | | | | | | | | | | | | | |
Secured floating rate debt | | | | | | | | | | | | | | | |
180-182 Broadway (Libor + 225 bps) | | 21,184 | | 4.72 | % | — | | Feb-11 | | 21,184 | | — | | Open | |
28 W 44th St (Libor + 201 bps) | | 125,000 | | 4.54 | % | — | | Aug-13 | | 125,000 | | — | | Open | |
1 Landmark Square (Libor + 185bps) | | 128,000 | | 4.32 | % | — | | Feb-09 | | 128,000 | | Feb-12 | | Open | |
| | | | | | | | | | | | | | | |
| | 274,184 | | 4.45 | % | — | | | | 274,184 | | | | | |
| | | | | | | | | | | | | | | |
Unsecured floating rate debt | | | | | | | | | | | | | | | |
Senior Unsecured Line of Credit (Libor + 90 bps) | | 1,128,833 | | 3.46 | % | — | | Jun-11 | | 1,128,833 | | Jun-12 | | Open | |
| | 1,128,833 | | 3.46 | % | — | | | | 1,128,833 | | | | | |
| | | | | | | | | | | | | | | |
Total Floating Rate Debt/Wtd Avg | | 1,403,017 | | 3.65 | % | — | | | | 1,403,017 | | | | | |
| | | | | | | | | | | | | | | |
Total Debt/Wtd Avg - Consolidated | | 5,875,968 | | 4.95 | % | 24,889 | | | | 5,376,462 | | | | | |
| | | | | | | | | | | | | | | |
Total Debt/Wtd Avg - Joint Venture | | 1,931,923 | | 4.91 | % | | | | | | | | | | |
| | | | | | | | | | | | | | | |
Weighted Average Balance & Interest Rate with SLG JV Debt | | 7,396,715 | | 5.02 | % | | | | | | | | | | |
(1) Notes can be put to SLG, at the option of the holder, on June 15, 2010
(2) Notes can be put to SLG, at the option of the holder, on March 30, 2012
Senior Unsecured Line of Credit Covenant Ratios | |
| | Actual | | Required | |
Total Debt / Total Assets | | 49.0 | % | Less than 60% | |
Secured Debt / Total Assets | | 22.1 | % | Less than 50% | |
Line Fixed Charge Coverage | | 2.01 | | Greater than 1.50 | |
Unencumbered Assets / Unsecured Debt | | 55.6 | % | Less than 60% | |
Unencumbered Interest Coverage | | 2.63 | | Greater than 1.75 | |
Maximum FFO Payout | | 50.7 | % | Less than 95% | |
26
DEBT SUMMARY SCHEDULE - Joint Venture Unaudited ($000’s omitted) | 
|
| | | | | | | | 2008 | | | | | | As-Of | | | |
| | Principal Outstanding - 9/30/08 | | | | Principal | | Maturity | | Due at | | Right | | Earliest | |
| | Gross Principal | | SLG Share | | Coupon | | Repayment | | Date | | Maturity | | Extension | | Prepayment | |
Fixed rate debt | | | | | | | | | | | | | | | | | |
| | | | | | | | | | �� | | | | | | | |
Mack - Green Joint Venture | | 11,072 | | 5,315 | | 6.26 | % | — | | Aug-14 | | 5,315 | | — | | Open | |
800 Third Avenue | | 20,910 | | 9,802 | | 6.00 | % | — | | Jul-17 | | 9,802 | | — | | Open | |
1604-1610 Broadway | | 27,000 | | 12,150 | | 5.66 | % | — | | Apr-12 | | 11,698 | | — | | Open | |
1221 Avenue of Americas | | 65,000 | | 29,250 | | 5.51 | % | — | | Dec-10 | | 29,250 | | — | | Open | |
Jericho Plaza | | 163,750 | | 33,176 | | 5.65 | % | — | | May-17 | | 33,176 | | — | | Open | |
21-25 West 34th Street | | 100,000 | | 50,000 | | 5.75 | % | — | | Dec-16 | | 50,000 | | — | | Dec-08 | |
100 Park Avenue | | 175,000 | | 87,325 | | 6.52 | % | — | | Nov-15 | | 81,765 | | — | | Oct-08 | |
One Court Square | | 315,000 | | 94,500 | | 4.91 | % | — | | Jun-15 | | 94,500 | | — | | Open | |
2 Herald Square | | 191,250 | | 105,188 | | 5.36 | % | — | | Apr-17 | | 105,188 | | — | | Jul-09 | |
1745 Broadway | | 340,000 | | 109,650 | | 5.68 | % | — | | Jan-17 | | 109,650 | | — | | Dec-09 | |
885 Third Avenue | | 267,650 | | 147,208 | | 6.26 | % | — | | Jul-17 | | 147,208 | | — | | Oct-09 | |
388/390 Greenwich Street | | 1,122,379 | | 567,901 | | 5.19 | % | — | | Dec-17 | | 567,901 | | — | | Dec-09 | |
Total Fixed Rate Debt/Wtd Avg | | 2,799,011 | | 1,251,464 | | 5.50 | % | — | | | | 1,245,452 | | | | | |
| | | | | | | | | | | | | | | | | |
388/390 Greenwich Street (Libor + 115bps) | | 16,000 | | 8,096 | | 3.62 | % | — | | Dec-17 | | 8,096 | | — | | Dec-09 | |
379 West Broadway (Libor + 165bps) | | 20,750 | | 9,338 | | 6.73 | % | — | | Jan-10 | | 9,338 | | — | | Open | |
1551/1555 Broadway (Libor + 200 bps) | | 101,536 | | 10,154 | | 4.49 | % | — | | Oct-09 | | 10,154 | | — | | Open | |
29 West 34th Street (Libor + 200bps) | | 35,449 | | 17,725 | | 4.58 | % | — | | May-11 | | 17,725 | | — | | Open | |
Meadows (Libor + 135bps) | | 83,560 | | 20,888 | | 3.82 | % | — | | Sep-12 | | 20,000 | | — | | Open | |
16 Court St (Libor + 160 bps) | | 83,214 | | 29,125 | | 4.11 | % | — | | Oct-10 | | 29,125 | | — | | Open | |
Mack - Green Joint Venture (Libor + 275bps) | | 91,157 | | 43,755 | | 5.22 | % | — | | May-09 | | 43,755 | | — | | — | |
1221 Avenue of Americas (Libor + 75bps) | | 105,000 | | 47,250 | | 3.22 | % | — | | Dec-10 | | 47,250 | | — | | Open | |
521 Fifth Avenue (Libor + 100bps) | | 140,000 | | 70,140 | | 3.47 | % | — | | Apr-11 | | 70,140 | | — | | Open | |
717 Fifth Avenue (Libor + 275 bps) | | 245,000 | | 80,238 | | 4.99 | % | — | | Sep-11 | | 80,238 | | | | Open | |
1515 Broadway (Libor + 90 bps) | | 625,000 | | 343,750 | | 3.37 | % | — | | Nov-08 | | 343,750 | | Nov-10 | | Open | |
Total Floating Rate Debt/Wtd Avg | | 1,546,666 | | 680,459 | | 3.82 | % | — | | | | 679,571 | | | | | |
| | | | | | | | | | | | | | | | | |
Total Joint Venture Debt/Wtd Avg | | 4,345,677 | | 1,931,923 | | 4.91 | % | — | | | | 1,925,022 | | | | | |
27
SUMMARY OF GROUND LEASE ARRANGEMENTS Consolidated Statement (REIT) ($000’s omitted) | 
|
| | 2008 Scheduled | | 2009 Scheduled | | 2010 Scheduled | | 2011 Scheduled | | Deferred Land | | Year of | |
Property | | Cash Payment | | Cash Payment | | Cash Payment | | Cash Payment | | Lease Obligations (1) | | Maturity | |
| | | | | | | | | | | | | |
Operating Leases | | | | | | | | | | | | | |
673 First Avenue | | 3,010 | | 3,010 | | 3,010 | | 3,010 | | 17,067 | | 2037 | |
420 Lexington Avenue (2) | | 14,180 | | 12,006 | | 12,006 | | 12,006 | | — | | 2029 | (3) |
711 Third Avenue (2) (4) | | 1,550 | | 1,550 | | 1,550 | | 750 | | 492 | | 2032 | |
461 Fifth Avenue (2) | | 2,100 | | 2,100 | | 2,100 | | 2,100 | | — | | 2027 | (5) |
625 Madison Avenue (2) | | 4,613 | | 4,613 | | 4,613 | | 4,613 | | — | | 2022 | (6) |
1185 Avenue of the Americas (2) | | 8,674 | | 8,674 | | 8,233 | | 6,909 | | — | | 2043 | |
| | | | | | | | | | | | | |
Total | | 34,127 | | 31,953 | | 31,512 | | 29,388 | | 17,559 | | | |
| | | | | | | | | | | | | |
Capitalized Lease | | | | | | | | | | | | | |
673 First Avenue | | 1,416 | | 1,416 | | 1,451 | | 1,555 | | 16,662 | | 2037 | |
(1) Per the balance sheet at September 30, 2008
(2) These ground leases are classified as operating leases and, therefore, do not appear on the balance sheet as an obligation.
(3) Subject to renewal at the Company’s option through 2080.
(4) Excludes portion payable to SL Green as owner of 50% leasehold.
(5) The Company has an option to purchase the ground lease for a fixed price on a specific date.
(6) Subject to renewal at the Company’s option through 2054.
28
STRUCTURED FINANCE
($000’s omitted)
| 
|
| | Assets | | Wtd Average | | Wtd Average | | Current | | LIBOR | |
| | Outstanding | | Assets during quarter | | Yield during quarter | | Yield | | Rate (2) | |
| | | | | | | | | | | |
6/30/2007 | | 661,720 | | 699,566 | | 10.52 | % | 10.62 | % | 5.32 | % |
| | | | | | | | | | | |
Originations/Accretion (1) | | 45,374 | | | | | | | | | |
Preferred Equity | | 29,240 | | | | | | | | | |
Redemptions /Amortization | | (53,250 | ) | | | | | | | | |
9/30/2007 | | 683,084 | | 714,925 | | 10.54 | % | 10.50 | % | 5.12 | % |
| | | | | | | | | | | |
Originations/Accretion (1) | | 132,140 | | | | | | | | | |
Preferred Equity | | — | | | | | | | | | |
Redemptions /Amortization | | (10,009 | ) | | | | | | | | |
12/31/2007 | | 805,215 | | 734,868 | | 10.49 | % | 11.31 | % | 4.60 | % |
| | | | | | | | | | | |
Originations/Accretion (1) | | 4,787 | | | | | | | | | |
Preferred Equity | | — | | | | | | | | | |
Redemptions /Amortization/Reserves | | (33,514 | ) | | | | | | | | |
3/31/2008 | | 776,488 | | 766,598 | | 10.15 | % | 10.63 | % | 2.70 | % |
| | | | | | | | | | | |
Originations/Accretion (1) | | 72,193 | | | | | | | | | |
Preferred Equity | | — | | | | | | | | | |
Redemptions /Amortization/Reserves | | (8,855 | ) | | | | | | | | |
6/30/2008 | | 839,826 | | 823,223 | | 9.71 | % | 9.92 | % | 2.46 | % |
| | | | | | | | | | | |
Originations/Accretion (1) | | 107,690 | | | | | | | | | |
Preferred Equity | | 542 | | | | | | | | | |
Redemptions /Amortization/Reserves | | (21,127 | ) | | | | | | | | |
9/30/2008 | | 926,931 | | 921,658 | | 10.58 | % | 10.28 | % | 3.93 | % |
(1) Accretion includes original issue discounts and compounding investment income.
(2) LIBOR rate is as of quarter end.
29
STRUCTURED FINANCE
($000’s omitted)
| 
|
| | | | | | | | Wtd Average | | Current | |
Type of Investment | | Quarter End Balance (1) | | Senior Financing | | Exposure Psf | | Yield during quarter | | Yield | |
| | | | | | | | | | | |
New York City | | | | | | | | | | | |
Junior Mortgage Participation | | $ | 83,799 | | $ | 114,250 | | $ | 151 | | 10.72 | % | 10.47 | % |
| | | | | | | | | | | |
Mezzanine Debt | | $ | 595,563 | | $ | 7,637,604 | | $ | 425 | | 10.33 | % | 10.18 | % |
| | | | | | | | | | | |
Preferred Equity | | $ | 58,000 | | $ | 214,942 | | $ | 129 | | 12.15 | % | 12.13 | % |
| | | | | | | | | | | |
Other | | | | | | | | | | | |
Junior Mortgage Participation | | $ | 5,866 | | $ | 48,198 | | $ | 45 | | 6.82 | % | 6.66 | % |
| | | | | | | | | | | |
Mezzanine Debt | | $ | 133,921 | | $ | 10,731,484 | | $ | 1,674 | | 11.42 | % | 11.29 | % |
| | | | | | | | | | | |
Preferred Equity | | $ | 49,782 | | $ | 2,546,896 | | $ | 347 | | 6.85 | % | 6.67 | % |
| | | | | | | | | | | |
Balance as of 09/30/08 | | $ | 926,931 | | $ | 21,293,374 | | $ | 605 | | 10.43 | % | 10.28 | % |
Current Maturity Profile (2)
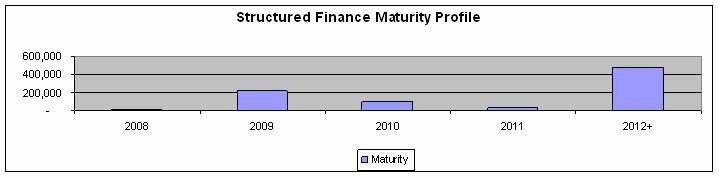
(1) Most investments are indexed to LIBOR and are prepayable at dates prior to maturity subject to certain prepayment penalties or fees.
(2) The weighted maturity is 5.1 years.
30
STRUCTURED FINANCE
10 Largest Investments
($000’s omitted)
| 
|
| | | | | | | | Senior | | | | Current | |
Investment Type | | Book Value (1) | | Location | | Collateral Type | | Financing | | Last $ PSF | | Yield | |
Mezzanine Loans | | $ | 122,505 | (2) | Manhattan | | Office | | $ | 521,370 | | $ | 600 | | 6.95 | % |
Mezzanine Loan | | 91,155 | | Manhattan | | Retail condo | | 325,000 | | $ | 5,741 | | 14.23 | % |
Mezzanine Loan | | 73,780 | | Manhattan | | Office | | 1,139,000 | | $ | 1,101 | | 10.83 | % |
Mezzanine Loan | | 68,605 | | Manhattan | | Residential | | 4,215,685 | | $ | 430 | | 8.40 | % |
Mezzanine Loan | | 58,303 | | Manhattan | | Office | | 205,000 | | $ | 379 | | 8.46 | % |
Preferred Equity | | 51,000 | | Manhattan | | Office | | 214,942 | | $ | 129 | | 12.38 | % |
Mortgage and Mezzanine | | 49,920 | | Various | | Office | | 2,354,810 | | $ | 95 | | 8.21 | % |
Mezzanine Loan | | 45,538 | | Los Angeles | | Office | | 1,060,000 | | $ | 252 | | 13.44 | % |
Mezzanine Loan | | 39,862 | | Manhattan | | Office | | 221,549 | | $ | 279 | | 9.93 | % |
Mezzanine Loan | | 38,298 | | Manhattan | | Office / Retail | | 165,000 | | $ | 1,705 | | 11.33 | % |
| | | | | | | | | | | | | |
Total | | $ | 638,966 | | | | | | $ | 10,422,356 | | | | 10.17 | % |
(1) Net of unamortized fees and discounts
(2) Represents two mezzanine positions of $94,763 and $27,742 collateralized by separate interests in the same property
31
SELECTED PROPERTY DATA
Manhattan Properties
|
|
| | | | | | # of | | Usable | | % of Total | | Occupancy (%) | | Annualized | | Annualized Rent | | Total | |
Properties | | SubMarket | | Ownership | | Bldgs | | Sq. Feet | | Sq. Feet | | Sep-08 | | Jun-08 | | Mar-08 | | Dec-07 | | Sep-07 | | Rent ($ ’s) | | 100% | | SLG | | Tenants | |
| | | | | | | | | | % | | % | | % | | % | | % | | % | | $ | | % | | % | | | |
CONSOLIDATED PROPERTIES | | | | | | | | | | | | | | | | | | | | | | | | | | | |
“Same Store” | | | | | | | | | | | | | | | | | | | | | | | | | | | |
19 West 44th Street | | Midtown | | Fee Interest | | 1 | | 292,000 | | 1 | | 99.5 | | 100.0 | | 100.0 | | 100.0 | | 97.5 | | 13,102,212 | | 2 | | 1 | | 60 | |
120 West 45th Street | | Midtown | | Fee Interest | | 1 | | 440,000 | | 1 | | 99.0 | | 98.6 | | 99.0 | | 99.0 | | 100.0 | | 24,764,244 | | 3 | | 2 | | 26 | |
220 East 42nd Street | | Grand Central | | Fee Interest | | 1 | | 1,135,000 | | 4 | | 99.7 | | 99.3 | | 99.4 | | 99.4 | | 99.3 | | 47,461,656 | | 7 | | 5 | | 32 | |
28 West 44th Street | | Midtown | | Fee Interest | | 1 | | 359,000 | | 1 | | 99.4 | | 98.1 | | 98.4 | | 96.9 | | 95.5 | | 15,295,068 | | 2 | | 1 | | 70 | |
317 Madison Avenue | | Grand Central | | Fee Interest | | 1 | | 450,000 | | 1 | | 89.6 | | 89.6 | | 90.7 | | 89.6 | | 88.8 | | 21,388,560 | | 3 | | 2 | | 89 | |
420 Lexington Ave (Graybar) | | Grand Central North | | Operating Sublease | | 1 | | 1,188,000 | | 4 | | 97.0 | | 96.6 | | 94.7 | | 93.3 | | 95.7 | | 60,778,212 | | 9 | | 6 | | 225 | |
461 Fifth Avenue (4) | | Midtown | | Leasehold Interest | | 1 | | 200,000 | | 1 | | 95.4 | | 93.6 | | 98.8 | | 98.8 | | 98.8 | | 13,604,256 | | 2 | | 1 | | 19 | |
485 Lexington Avenue | | Grand Central North | | Fee Interest | | 1 | | 921,000 | | 3 | | 100.0 | | 99.9 | | 99.1 | | 98.8 | | 98.8 | | 48,757,308 | | 7 | | 5 | | 21 | |
555 West 57th Street | | Midtown West | | Fee Interest | | 1 | | 941,000 | | 3 | | 99.3 | | 99.6 | | 99.6 | | 99.6 | | 99.6 | | 29,577,012 | | 4 | | 3 | | 15 | |
609 Fifth Avenue | | Rockefeller Center | | Fee Interest | | 1 | | 160,000 | | 1 | | 100.0 | | 100.0 | | 99.5 | | 99.5 | | 99.5 | | 13,118,484 | | 2 | | 1 | | 20 | |
625 Madison Avenue | | Plaza District | | Leasehold Interest | | 1 | | 563,000 | | 2 | | 97.6 | | 97.6 | | 97.6 | | 97.6 | | 98.8 | | 40,056,828 | | 6 | | 4 | | 30 | |
673 First Avenue | | Grand Central South | | Leasehold Interest | | 1 | | 422,000 | | 1 | | 99.7 | | 99.8 | | 99.8 | | 99.8 | | 99.8 | | 15,700,968 | | 2 | | 2 | | 9 | |
711 Third Avenue (1) | | Grand Central North | | Operating Sublease | | 1 | | 524,000 | | 2 | | 93.3 | | 93.3 | | 94.3 | | 94.3 | | 94.3 | | 23,270,532 | | 3 | | 2 | | 17 | |
750 Third Avenue | | Grand Central North | | Fee Interest | | 1 | | 780,000 | | 2 | | 95.8 | | 99.0 | | 98.4 | | 98.4 | | 98.7 | | 37,144,620 | | 5 | | 4 | | 25 | |
810 Seventh Avenue | | Times Square | | Fee Interest | | 1 | | 692,000 | | 2 | | 93.0 | | 92.1 | | 96.6 | | 96.6 | | 91.2 | | 38,126,076 | | 5 | | 4 | | 39 | |
919 Third Avenue (3) | | Grand Central North | | Fee Interest | | 1 | | 1,454,000 | | 5 | | 99.9 | | 99.9 | | 99.9 | | 99.9 | | 99.9 | | 79,510,524 | | | | 4 | | 15 | |
1185 Avenue of the Americas | | Rockefeller Center | | Leasehold Interest | | 1 | | 1,062,000 | | 3 | | 98.9 | | 97.9 | | 90.9 | | 90.9 | | 93.3 | | 65,402,412 | | 9 | | 6 | | 22 | |
1350 Avenue of the Americas | | Rockefeller Center | | Fee Interest | | 1 | | 562,000 | | 2 | | 95.1 | | 93.9 | | 93.9 | | 91.7 | | 93.0 | | 30,716,148 | | 4 | | 3 | | 41 | |
| | | | | | | | | | | | | | | | | | | | | | | | | | | |
Subtotal / Weighted Average | | | | 18 | | 12,145,000 | | 38 | | 97.7 | | 97.6 | | 97.1 | | 96.8 | | 97.0 | | $ | 617,775,120 | | 76 | | 56 | | 775 | |
| | | | | | | | | | | | | | | | | | | | | | | | | | | | | |
Adjustments | | | | | | | | | | | | | | | | | | | | | | | | | | | | | |
1372 Broadway (2) | | Garment | | Fee Interest | | 1 | | 508,000 | | 2 | | 96.6 | | 99.4 | | 96.8 | | 99.8 | | 100.0 | | 20,788,860 | | | | 0 | | 20 | |
1 Madison Avenue | | Park Avenue South | | Fee Interest | | 1 | | 1,176,900 | | 4 | | 99.8 | | 99.8 | | 99.8 | | 99.8 | | 99.8 | | 61,633,188 | | 9 | | 6 | | 3 | |
331 Madison Avenue | | Grand Central | | Fee Interest | | 1 | | 114,900 | | 0 | | 100.0 | | 100.0 | | 100.0 | | 100.0 | | 100.0 | | 4,734,024 | | 1 | | 0 | | 19 | |
333 West 34th Street | | Penn Station | | Fee Interest | | 1 | | 345,400 | | 1 | | 100.0 | | 100.0 | | 100.0 | | 100.0 | | 100.0 | | 15,081,534 | | 2 | | 1 | | 1 | |
Subtotal / Weighted Average | | 4 | | 2,145,200 | | 7 | | 99.0 | | 99.7 | | 99.1 | | 99.8 | | 99.8 | | $ | 102,237,606 | | 11 | | 7 | | 43 | |
| | | | | | | | | | | | | | | | | | | | | | | | | | | | | |
Total / Weighted Average Manhattan Consolidated Properties | | 22 | | 14,290,200 | | 46 | | 97.9 | | 97.9 | | 97.4 | | 97.3 | | 97.5 | | $ | 720,012,726 | | 87 | | 63 | | 818 | |
| | | | | | | | | | | | | | | | | | | | | | | | | | | | | |
UNCONSOLIDATED PROPERTIES | | | | | | | | | | | | | | | | | | | | | | | | | | | |
“Same Store” | | | | | | | | | | | | | | | | | | | | | | | | | | | | | |
100 Park Avenue - 50% | | Grand Central South | | Fee Interest | | 1 | | 834,000 | | 3 | | 80.4 | | 67.0 | | 69.3 | | 74.0 | | 91.7 | | 39,448,848 | | | | 2 | | 32 | |
521 Fifth Avenue - 50.1% (4) | | Grand Central | | Leasehold Interest | | 1 | | 460,000 | | 1 | | 93.1 | | 97.9 | | 96.6 | | 96.9 | | 92.8 | | 24,157,020 | | | | 1 | | 47 | |
800 Third Avenue - 46.9% | | Grand Central North | | Fee Interest | | 1 | | 526,000 | | 2 | | 98.7 | | 98.5 | | 95.8 | | 94.7 | | 96.9 | | 30,908,964 | | | | 1 | | 26 | |
1221 Avenue of the Americas - 45% | | Rockefeller Center | | Fee Interest | | 1 | | 2,550,000 | | 8 | | 92.9 | | 93.0 | | 93.2 | | 93.9 | | 93.9 | | 148,942,428 | | | | 7 | | 20 | |
1515 Broadway - 55% | | Times Square | | Fee Interest | | 1 | | 1,750,000 | | 6 | | 91.8 | | 99.0 | | 99.0 | | 99.0 | | 99.0 | | 82,358,532 | | | | 5 | | 9 | |
| | | | | | | | | | | | | | | | | | | | | | | | | | | | | |
Subtotal / Weighted Average | | 5 | | 6,120,000 | | 19 | | 91.4 | | 92.0 | | 92.2 | | 93.5 | | 95.6 | | $ | 325,815,792 | | | | 17 | | 134 | |
| | | | | | | | | | | | | | | | | | | | | | | | | | | | | |
Adjustments | | | | | | | | | | | | | | | | | | | | | | | | | | | | | |
388 & 390 Greenwich Street - 50.6% | | Downtown | | Fee Interest | | 2 | | 2,635,000 | | 8 | | 100.0 | | 100.0 | | 100.0 | | 100.0 | | — | | 99,225,000 | | | | 5 | | 1 | |
1745 Broadway - 32.3% | | Midtown | | Fee Interest | | 1 | | 674,000 | | 2 | | 100.0 | | 100.0 | | 100.0 | | 100.0 | | 100.0 | | 36,781,656 | | | | 1 | | 1 | |
Subtotal / Weighted Average | | 3 | | 3,309,000 | | 10 | | 100.0 | | 100.0 | | 100.0 | | 100.0 | | 100.0 | | $ | 136,006,656 | | | | 6 | | 2 | |
| | | | | | | | | | | | | | | | | | | | | | | | | | | | | |
Total / Weighted Average Unconsolidated Properties | | 8 | | 9,429,000 | | 30 | | 94.4 | | 94.8 | | 94.8 | | 95.6 | | 96.0 | | $ | 461,822,448 | | | | 23 | | 136 | |
| | | | | | | | | | | | | | | | | | | | | | | | | |
Manhattan Grand Total / Weighted Average | | 30 | | 23,719,200 | | 75 | | 96.5 | | 96.7 | | 96.3 | | 96.6 | | 97.0 | | $ | 1,181,835,174 | | | | | | 954 | |
Manhattan Grand Total - SLG share of Annualized Rent | | | | | | | | | | | | | | | | | | $ | 895,170,290 | | | | 86 | | | |
Manhattan Same Store Occupancy % - Combined | | | | 18,265,000 | | 77 | | 95.6 | | 95.7 | | 95.4 | | 95.6 | | 96.5 | | | | | | | | | |
| | | | | | | | | | | | | | | | | | | | | | | | | |
Portfolio Grand Total | | 66 | | 31,586,700 | | 100 | | 95.4 | | 95.4 | | 95.1 | | 95.5 | | 95.6 | | $ | 1,406,492,859 | | | | | | 1,462 | |
Portfolio Grand Total - SLG Share of Annualized Rent | | | | | | | | | | | | | | | | | | $ | 1,032,789,089 | | | | 100 | | | |
| | | | | | | | | | | | | | | | | | | | | | | | | | | | | | | |
(1) Including Ownership of 50% in Building Fee.
(2) SL Green holds a 15% interest in this consolidated joint venture asset.
(3) SL Green holds a 51% interest in this consolidated joint venture asset.
(4) SL Green holds an option to acquire the fee interest on this building.
32
SELECTED PROPERTY DATA
Suburban Properties
|
|
| | | | | | # of | | Usable | | % of Total | | Occupancy (%) | | Annualized | | Annualized Rent | | Total | |
Properties | | SubMarket | | Ownership | | Bldgs | | Sq. Feet | | Sq. Feet | | Jun-08 | | Mar-08 | | Dec-07 | | Sep-07 | | Jun-07 | | Rent ($ ’s) | | 100% | | SLG | | Tenants | |
| | | | | | | | | | % | | % | | % | | % | | % | | % | | $ | | % | | % | | | |
CONSOLIDATED PROPERTIES | | | | | | | | | | | | | | | | | | | | | | | | | | | |
“Same Store” Westchester, NY | | | | | | | | | | | | | | | | | | | | | | | | | | | |
1100 King Street | | Rye Brook, Westchester | | Fee Interest | | 6 | | 540,000 | | 8 | | 90.4 | | 90.7 | | 91.9 | | 94.6 | | 98.2 | | 13,714,274 | | 2 | | 2 | | 28 | |
100 White Plains Road (1) | | Tarrytown, Westchester | | Fee Interest | | 1 | | 6,000 | | 0 | | 100.0 | | 100.0 | | 100.0 | | 100.0 | | 100.0 | | 92,952 | | | | 0 | | 1 | |
120 White Plains Road (1) | | Tarrytown, Westchester | | Fee Interest | | 1 | | 205,000 | | 3 | | 97.6 | | 97.6 | | 97.6 | | 97.6 | | 97.6 | | 5,969,184 | | | | 0 | | 15 | |
520 White Plains Road | | Tarrytown, Westchester | | Fee Interest | | 1 | | 180,000 | | 2 | | 92.4 | | 87.1 | | 85.3 | | 85.3 | | 85.3 | | 3,892,008 | | 1 | | 0 | | 8 | |
115-117 Stevens Avenue | | Valhalla, Westchester | | Fee Interest | | 1 | | 178,000 | | 2 | | 65.9 | | 65.9 | | 54.3 | | 65.2 | | 65.2 | | 3,303,816 | | 0 | | 0 | | 14 | |
100 Summit Lake Drive | | Valhalla, Westchester | | Fee Interest | | 1 | | 250,000 | | 3 | | 78.4 | | 78.4 | | 87.4 | | 87.4 | | 87.4 | | 5,772,948 | | 1 | | 1 | | 7 | |
200 Summit Lake Drive | | Valhalla, Westchester | | Fee Interest | | 1 | | 245,000 | | 3 | | 95.7 | | 95.7 | | 95.7 | | 95.7 | | 95.7 | | 6,620,496 | | 1 | | 1 | | 9 | |
500 Summit Lake Drive | | Valhalla, Westchester | | Fee Interest | | 1 | | 228,000 | | 3 | | 81.0 | | 78.4 | | 77.1 | | 77.1 | | 77.1 | | 4,414,212 | | 1 | | 1 | | 2 | |
140 Grand Street | | White Plains, Westchester | | Fee Interest | | 1 | | 130,100 | | 2 | | 85.2 | | 80.0 | | 80.0 | | 80.0 | | 80.0 | | 3,493,404 | | 0 | | 1 | | 8 | |
360 Hamilton Avenue | | White Plains, Westchester | | Fee Interest | | 1 | | 384,000 | | 5 | | 100.0 | | 100.0 | | 100.0 | | 100.0 | | 100.0 | | 13,144,248 | | 2 | | 2 | | 14 | |
“ Same Store” Westchester, NY Subtotal/Weighted Average | | 15 | | 2,346,100 | | 31 | | 89.0 | | 88.1 | | 88.2 | | 89.7 | | 90.5 | | 60,417,542 | | 8 | | 8 | | 106 | |
| | | | | | | | | | | | | | | | | | | | | | | | | | | | | |
Adjustments - Westchester, NY | | | | | | | | | | | | | | | | | | | | | | | | | | | |
399 Knollwood Road | | White Plains, Westchester | | Fee Interest | | 1 | | 145,000 | | 2 | | 96.3 | | 96.3 | | 96.3 | | 98.9 | | 99.0 | | 3,500,064 | | 0 | | 0 | | 43 | |
Westchester, NY Subtotal/Weighted Average | | | | 16 | | 2,491,100 | | 32 | | 89.4 | | 88.6 | | 88.7 | | 90.2 | | 91.0 | | 63,917,606 | | 9 | | 8 | | 149 | |
| | | | | | | | | | | | | | | | | | | | | | | | | | | | | |
“Same Store” Connecticut | | | | | | | | | | | | | | | | | | | | | | | | | | | | | |
Landmark Square | | Stamford, Connecticut | | Fee Interest | | 6 | | 826,000 | | 10 | | 86.2 | | 86.6 | | 86.3 | | 85.2 | | 84.2 | | 18,949,650 | | 2 | | 2 | | 108 | |
680 Washington Boulevard (1) | | Stamford, Connecticut | | Fee Interest | | 1 | | 133,000 | | 2 | | 100.0 | | 100.0 | | 100.0 | | 94.7 | | 94.7 | | 5,071,500 | | | | 0 | | 5 | |
750 Washington Boulevard (1) | | Stamford, Connecticut | | Fee Interest | | 1 | | 192,000 | | 2 | | 98.5 | | 95.8 | | 95.8 | | 98.5 | | 97.1 | | 6,256,932 | | | | 0 | | 9 | |
1055 Washington Boulevard | | Stamford, Connecticut | | Leasehold Interest | | 1 | | 182,000 | | 3 | | 88.3 | | 91.1 | | 89.5 | | 89.5 | | 90.8 | | 5,525,868 | | 0 | | 1 | | 23 | |
“ Same Store” Connecticut Subtotal/Weighted Average | | 9 | | 1,333,000 | | 17 | | 89.6 | | 89.9 | | 89.5 | | 88.5 | | 87.6 | | 35,803,950 | | 2 | | 3 | | 145 | |
| | | | | | | | | | | | | | | | | | | | | | | | | | | | | |
Adjustments - Connecticut | | | | | | | | | | | | | | | | | | | | | | | | | | | | | |
7 Landmark Square | | Stamford, Connecticut | | Fee Interest | | 1 | | 36,800 | | 0 | | 10.8 | | 10.8 | | 10.8 | | 10.8 | | 10.8 | | 258,696 | | 0 | | 0 | | 1 | |
300 Main Street | | Stamford, Connecticut | | Fee Interest | | 1 | | 130,000 | | 2 | | 95.3 | | 95.3 | | 95.3 | | 95.3 | | 94.7 | | 2,025,276 | | 0 | | 0 | | 21 | |
1010 Washington Boulevard | | Stamford, Connecticut | | Fee Interest | | 1 | | 143,400 | | 2 | | 95.1 | | 94.5 | | 95.6 | | 95.6 | | 96.6 | | 3,915,648 | | 1 | | 0 | | 21 | |
500 West Putnam Avenue | | Greenwich, Connecticut | | Fee Interest | | 1 | | 121,500 | | 2 | | 88.7 | | 88.7 | | 91.7 | | 94.4 | | 94.4 | | 3,556,548 | | 0 | | 0 | | 10 | |
Adjustments - Connecticut Subtotal/Weighted Average | | 4 | | 431,700 | | 5 | | 86.2 | | 86.0 | | 87.2 | | 88.4 | | 88.9 | | 9,756,168 | | 2 | | 0 | | 534 | |
| | | | | | | | | | | | | | | | | | | | | | | | | | | | | |
Connecticut Subtotal/Weighted Average | | 13 | | 1,764,700 | | 22 | | 88.8 | | 88.9 | | 88.9 | | 88.5 | | 88.0 | | 45,560,118 | | 4 | | 3 | | 198 | |
| | | | | | | | | | | | | | | | | | | | | | | | | | | | | |
55 Corporate Drive, NJ (2) | | Bridgewater, New Jersey | | Fee Interest | | 1 | | 670,000 | | 9 | | 100.0 | | 100.0 | | 100.0 | | 100.0 | | 100.0 | | 21,812,124 | | | | 1 | | 1 | |
Total / Weighted Average Consolidated Properties | | 30 | | 4,925,800 | | 63 | | 90.6 | | 90.3 | | 90.3 | | 90.9 | | 91.1 | | $ | 131,289,848 | | 13 | | 12 | | 348 | |
| | | | | | | | | | | | | | | | | | | | | | | | | | | | | |
UNCONSOLIDATED PROPERTIES | | | | | | | | | | | | | | | | | | | | | | | | | | | |
“Same Store” | | | | | | | | | | | | | | | | | | | | | | | | | | | | | |
One Court Square - 30% | | Long Island City,
New York | | Fee Interest | | 1 | | 1,402,000 | | 18 | | 100.0 | | 100.0 | | 100.0 | | 100.0 | | 100.0 | | 51,082,644 | | | | 1 | | 1 | |
Subtotal/Weighted Average | | | | 1 | | 1,402,000 | | 18 | | 100.0 | | 100.0 | | 100.0 | | 100.0 | | 100.0 | | 51,082,644 | | | | | | | |
| | | | | | | | | | | | | | | | | | | | | | | | | | | | | |
Adjustments | | | | | | | | | | | | | | | | | | | | | | | | | | | | | |
The Meadows - 25% | | Rutherford, New Jersey | | Fee Interest | | 2 | | 582,100 | | 7 | | 85.3 | | 85.2 | | 87.0 | | 81.3 | | 81.3 | | 12,685,801 | | | | 0 | | 60 | |
16 Court Street - 35% | | Brooklyn, NY | | Fee Interest | | 1 | | 317,600 | | 4 | | 79.2 | | 82.3 | | 81.0 | | 80.8 | | 80.5 | | 8,570,628 | | | | 0 | | 62 | |
Jericho Plaza - 20.26% | | Jericho, New York | | Fee Interest | | 2 | | 640,000 | | 8 | | 96.3 | | 96.3 | | 96.4 | | 98.4 | | 98.4 | | 21,028,764 | | | | 0 | | 37 | |
Subtotal / Weighted Average | | | | 5 | | 1,539,700 | | 20 | | 88.6 | | 89.2 | | 89.7 | | 88.3 | | 88.2 | | $ | 42,285,193 | | | | 0 | | 159 | |
| | | | | | | | | | | | | | | | | | | | | | | | | | | | | |
Total / Weighted Average Unconsolidated Properties | | | | 6 | | 2,941,700 | | 37 | | 94.1 | | 94.4 | | 94.6 | | 93.9 | | 93.8 | | $ | 93,367,837 | | | | 2 | | 160 | |
| | | | | | | | | | | | | | | | | | | | | | | | | | | | |
Suburban Grand Total / Weighted Average | | | | 36 | | 7,867,500 | | 25 | | 91.9 | | 91.8 | | 91.9 | | 92.0 | | 92.2 | | $ | 224,657,685 | | | | | | 508 | |
Suburban Grand Total - SLG share of Annualized Rent | | | | | | | | | | | | | | | | | | | | $ | 137,618,799 | | | | 14 | | | |
Suburban Same Store Occupancy % - Combined | | | | | | 5,081,100 | | 65 | | 92.2 | | 91.9 | | 91.8 | | 92.2 | | 92.5 | | | | | | | | | |
(1) SL Green holds a 51% interest in this consolidated joint venture asset.
(2) SL Green holds a 50% interest through a tenancy in common ownership.
(3) SL Green holds an option to acquire the fee interest on this property.
| | | | | | | | | | | | | | | | | | | | | | | | Gross Total | | | | | |
RETAIL, DEVELOPMENT & LAND | | | | | | | | | | | | | | | | | | | | | | | | Book Value | | | | | |
125 Chubb Way | | Lyndhurst, NJ | | Fee Interest | | 1 | | 278,000 | | 36 | | — | | — | | — | | — | | — | | $ | — | | $ | 33,069,939 | | 0 | | 0 | |
150 Grand Street | | White Plains, NY | | Fee Interest | | 1 | | 85,000 | | 11 | | 17.5 | | 20.1 | | 20.1 | | 10.6 | | 52.9 | | 387,720 | | 11,932,642 | | 1 | | 3 | |
141 Fifth Avenue - 50% | | Flat Iron | | Fee Interest | | 1 | | 21,500 | | 3 | | 100.0 | | 100.0 | | 100.0 | | 100.0 | | 100.0 | | 2,018,820 | | 17,573,653 | | 4 | | 4 | |
1551-1555 Broadway - 10% | | Times Square | | Fee Interest | | 1 | | 25,600 | | 3 | | 100.0 | | 100.0 | | 100.0 | | 100.0 | | — | | N/A | | 111,281,481 | | N/A | | N/A | |
1604 Broadway - 63% | | Times Square | | Leasehold Interest | | 1 | | 29,876 | | 4 | | 100.0 | | 100.0 | | 100.0 | | 100.0 | | 100.0 | | 4,596,312 | | 7,460,170 | | 11 | | 3 | |
180-182 Broadway - 50% | | Cast Iron/Soho | | Fee Interest | | 2 | | 70,580 | | 9 | | 82.5 | | 83.8 | | 83.8 | | 81.1 | | 85.2 | | 1,328,256 | | 46,358,112 | | 2 | | 24 | |
21-25 West 34th Street - 50% | | Herald Square/Penn Station | | Fee Interest | | 1 | | 30,100 | | 4 | | 100.0 | | 100.0 | | 100.0 | | 100.0 | | 100.0 | | 5,869,680 | | 30,860,645 | | 11 | | 1 | |
27-29 West 34th Street - 50% | | Herald Square/Penn Station | | Fee Interest | | 1 | | 41,000 | | 5 | | 100.0 | | 100.0 | | 100.0 | | 100.0 | | — | | N/A | | 35,377,741 | | N/A | | N/A | |
379 West Broadway - 45% (3) | | Cast Iron/Soho | | Leasehold Interest | | 1 | | 62,006 | | 8 | | 100.0 | | 100.0 | | 100.0 | | 100.0 | | 100.0 | | 3,192,132 | | 22,010,907 | | 5 | | 6 | |
717 Fifth Avenue - 32.75% | | Midtown/Plaza District | | Fee Interest | | 1 | | 119,550 | | 16 | | 79.1 | | 87.6 | | 87.6 | | 87.6 | | 97.8 | | 19,315,272 | | 279,724,552 | | 24 | | 7 | |
2 Herald Square - 55% | | Herald Square/Penn Station | | Fee Interest | | N/A | | N/A | | N/A | | N/A | | N/A | | N/A | | N/A | | N/A | | 9,000,000 | | 225,597,988 | | 19 | | 1 | |
885 Third Avenue - 55% | | Midtown/Plaza District | | Fee Interest | | N/A | | N/A | | N/A | | N/A | | N/A | | N/A | | N/A | | N/A | | 11,095,000 | | 317,313,391 | | 23 | | 1 | |
Total / Weighted Average Retail/Development Properties | | 11 | | 763,212 | | 100 | | N/A | | N/A | | N/A | | N/A | | N/A | | $ | 56,803,192 | | $ | 1,138,561,219 | | 100 | | 50 | |
33
LARGEST TENANTS BY SQUARE FEET LEASED
Manhattan and Suburban Properties | 
|
Wholly Owned Portfolio + Allocated JV Properties
| | | | | | | | | | | | | | | | % of | | | |
| | | | | | Total | | | | | | % of | | SLG Share of | | SLG Share of | | | |
| | | | Lease | | Leased | | Annualized | | PSF | | Annualized | | Annualized | | Annualized | | Credit | |
Tenant Name | | Property | | Expiration | | Square Feet | | Rent ($) | | Annualized | | Rent | | Rent($) | | Rent | | Rating (2) | |
| | | | | | | | | | | | | | | | | | | |
Citigroup, N.A. | | 388 & 390 Greenwich Street, 485 Lexington Avenue, 750 Third Avenue, 800 Third Avenue, 333 West 34th Street, 750 Washington Blvd & Court Square | | Various | | 4,789,646 | | $ | 184,719,246 | (1) | $ | 38.57 | | 13.1 | % | 97,778,681 | | 9.5 | % | AA- | |
Viacom International, Inc. | | 1515 Broadway | | 2010, 2012, 2013, 2015 & 2020 | | 1,287,075 | | 68,879,724 | | $ | 53.52 | | 4.9 | % | 47,148,171 | | 4.6 | % | BBB | |
Credit Suisse Securities (USA), Inc. | | 1 Madison Avenue | | 2020 | | 1,138,143 | | 60,004,128 | | $ | 52.72 | | 4.3 | % | 60,004,128 | | 5.8 | % | AA- | |
Sanofi-Aventis | | 55 Corporate Drive, NJ | | 2023 | | 670,000 | | 21,812,018 | | $ | 32.56 | | 1.6 | % | 10,906,009 | | 1.1 | % | AA- | |
Morgan Stanley & Co. Inc. | | 1221 Ave.of the Americas, 2 Jericho Plaza & 4 Landmark Square | | Various | | 652,311 | | 45,836,976 | | $ | 70.27 | | 3.3 | % | 20,616,971 | | 2.0 | % | A+ | |
Random House, Inc. | | 1745 Broadway | | 2018 | | 644,598 | | 36,781,656 | | $ | 57.06 | | 2.6 | % | 11,865,762 | | 1.1 | % | BBB+ | |
Debevoise & Plimpton, LLP | | 919 Third Avenue | | 2021 | | 586,528 | | 35,627,520 | | $ | 60.74 | | 2.5 | % | 18,170,035 | | 1.8 | % | | |
Omnicom Group, Cardinia Real Estate LLC | | 220 East 42nd Street, 420 Lexington Avenue & 485 Lexington Avenue | | 2008, 2009, 2010 & 2017 | | 577,840 | | 22,699,056 | | $ | 39.28 | | 1.6 | % | 22,699,056 | | 2.2 | % | A- | |
Societe Generale | | 1221 Ave.of the Americas | | Various | | 486,663 | | 29,105,808 | | $ | 59.81 | | 2.1 | % | 13,097,614 | | 1.3 | % | AA- | |
The McGraw Hill Companies, Inc. | | 1221 Ave.of the Americas | | Various | | 420,329 | | 22,890,084 | | $ | 54.46 | | 1.6 | % | 10,300,538 | | 1.0 | % | A+ | |
Advance Magazine Group, Fairchild Publications | | 750 Third Avenue & 485 Lexington Avenue | | 2021 | | 342,720 | | 13,340,172 | | $ | 38.92 | | 0.9 | % | 13,340,172 | | 1.3 | % | | |
Verizon | | 120 West 45th Street, 1100 King Street Bldgs 1& 2, 1 Landmark Square, 2 Landmark Square & 500 Summit Lake Drive | | Various | | 315,618 | | 8,708,016 | | $ | 27.59 | | 0.6 | % | 8,708,016 | | 0.8 | % | A- | |
C.B.S. Broadcasting, Inc. | | 555 West 57th Street | | 2013 & 2017 | | 286,037 | | 9,917,352 | | $ | 34.67 | | 0.7 | % | 9,917,352 | | 1.0 | % | BBB | |
Polo Ralph Lauren Corporation | | 625 Madison Avenue | | 2019 | | 269,269 | | 15,131,688 | | $ | 56.20 | | 1.1 | % | 15,131,688 | | 1.5 | % | BBB+ | |
Schulte, Roth & Zabel LLP | | 919 Third Avenue | | 2011 & 2021 | | 263,186 | | 14,097,216 | | $ | 53.56 | | 1.0 | % | 7,189,580 | | 0.7 | % | | |
New York Presbyterian Hospital | | 555 West 57th Street & 673 First Avenue | | 2009 & 2021 | | 262,448 | | 8,491,272 | | $ | 32.35 | | 0.6 | % | 8,491,272 | | 0.8 | % | | |
The Travelers Indemnity Company | | 485 Lexington Avenue & 2 Jericho Plaza | | 2010, 2012 & 2016 | | 250,857 | | 11,880,336 | | $ | 47.36 | | 0.8 | % | 10,978,130 | | 1.1 | % | A+ | |
The City University of New York - CUNY | | 555 West 57th Street & 28 West 44th Street | | 2010, 2011, 2015 & 2016 | | 229,044 | | 8,215,908 | | $ | 35.87 | | 0.6 | % | 8,215,908 | | 0.8 | % | | |
BMW of Manhattan | | 555 West 57th Street | | 2012 | | 227,782 | | 4,765,896 | | $ | 20.92 | | 0.3 | % | 4,765,896 | | 0.5 | % | | |
Vivendi Universal US Holdings | | 800 Third Avenue | | 2010 | | 226,105 | | 11,810,292 | | $ | 52.23 | | 0.8 | % | 5,432,734 | | 0.5 | % | BBB | |
Sonnenschein, Nath & Rosenthal | | 1221 Ave.of the Americas | | Various | | 191,825 | | 12,463,380 | | $ | 64.97 | | 0.9 | % | 5,608,521 | | 0.5 | % | | |
Fuji Color Processing Inc. | | 120 White Plains Road & 200 Summit Lake Drive | | 2010 & 2013 | | 186,484 | | 5,378,148 | | $ | 28.84 | | 0.4 | % | 5,087,477 | | 0.5 | % | A-1 | |
D.E. Shaw and Company L.P. | | 120 West 45th Street | | 2011, 2015 & 2017 | | 185,231 | | 11,241,132 | | $ | 60.69 | | 0.8 | % | 11,241,132 | | 1.1 | % | | |
Amerada Hess Corp. | | 1185 Ave.of the Americas | | 2009 & 2027 | | 182,529 | | 10,623,540 | | $ | 58.20 | | 0.8 | % | 10,623,540 | | 1.0 | % | BBB- | |
| | | | | | | | | | | | | | | | | | | |
King & Spalding | | 1185 Ave.of the Americas | | 2025 | | 159,858 | | 8,915,520 | | $ | 55.77 | | 0.6 | % | 8,915,520 | | 0.9 | % | | |
Teachers Insurance & Annuity Association | | 750 Third Avenue | | 2008, 2009 & 2015 | | 147,705 | | 7,065,924 | | $ | 47.84 | | 0.5 | % | 7,065,924 | | 0.7 | % | AAA | |
New York Hospitals Center/Mount Sinai | | 625 Madison Avenue & 673 First Avenue | | 2009 & 2019 | | 146,917 | | 5,882,760 | | $ | 40.04 | | 0.4 | % | 5,882,760 | | 0.6 | % | | |
National Hockey League | | 1185 Ave.of the Americas | | 2022 | | 146,241 | | 10,733,832 | | $ | 73.40 | | 0.8 | % | 10,733,832 | | 1.0 | % | | |
Banque National De Paris | | 919 Third Avenue | | 2016 | | 145,834 | | 8,141,808 | | $ | 55.83 | | 0.6 | % | 8,141,808 | | 0.8 | % | | |
Draft Worldwide | | 919 Third Avenue | | 2013 | | 141,260 | | 7,336,560 | | $ | 51.94 | | 0.5 | % | 7,336,560 | | 0.7 | % | BBB | |
| | | | | | | | | | | | | | | | | | | |
Total | | | | 15,560,083 | | $ | 722,496,969 | (1) | $ | 46.43 | | 51.4 | % | $ | 485,394,787 | | 47.0 | % | | |
| | | | | | | | | | | | | | | | | | | |
Wholly Owned Portfolio + Allocated JV Properties | | 31,586,700 | | $ | 1,406,492,859 | (1) | $ | 44.53 | | | | $ | 1,032,789,089 | | | | | |
34
TENANT DIVERSIFICATION Manhattan and Suburban Properties | 
|
Based on SLG Share of Base Rental Revenue

Based on SLG Share of Square Feet Leased

35
Leasing Activity - Manhattan Properties Available Space |
|
Activity | | Building Address | | # of Leases | | Usable SF | | Rentable SF | | Rent/Rentable SF ($’s)(1) | |
| | | | | | | | | | | |
Vacancy at 6/30/08 | | | | | | 786,400 | | | | | |
| | | | | | | | | | | |
Space which became available during the Quarter (A): | | | | | | | | | | |
Office | | | | | | | | | | | |
| | 317 Madison Avenue | | 3 | | 8,016 | | 8,016 | | $ | 34.77 | |
| | 750 Third Avenue | | 4 | | 70,414 | | 70,414 | | $ | 48.61 | |
| | 1515 Broadway | | 1 | | 121,400 | | 121,400 | | $ | 46.88 | |
| | 461 Fifth Avenue | | 5 | | 25,306 | | 25,926 | | $ | 71.28 | |
| | 555 West 57th Street | | 1 | | 3,400 | | 3,789 | | $ | 35.67 | |
| | 673 First Avenue | | 1 | | 428 | | 428 | | $ | 96.30 | |
| | 1372 Broadway | | 3 | | 15,058 | | 18,099 | | $ | 65.39 | |
| | 19 West 44th Street | | 4 | | 3,372 | | 3,475 | | $ | 42.39 | |
| | 521 Fifth Avenue | | 3 | | 30,037 | | 30,037 | | $ | 44.73 | |
| | 810 Seventh Avenue | | 1 | | 3,917 | | 3,917 | | $ | 38.49 | |
| | 1350 Avenue of the Americas | | 1 | | 1,509 | | 1,509 | | $ | 46.77 | |
| | 420 Lexington Avenue | | 12 | | 11,816 | | 15,439 | | $ | 45.27 | |
| | Total/Weighted Average | | 39 | | 294,673 | | 302,449 | | $ | 49.63 | |
| | | | | | | | | | | |
Retail | | | | | | | | | | | |
| | 1221 Sixth Avenue | | 1 | | 1,799 | | 1,799 | | $ | 16.73 | |
| | 625 Madison Avenue | | 2 | | 5,983 | | 5,983 | | $ | 110.22 | |
| | 420 Lexington Avenue | | 1 | | 891 | | 1,017 | | $ | 57.18 | |
| | Total/Weighted Average | | 4 | | 8,673 | | 8,799 | | $ | 84.97 | |
| | | | | | | | | | | |
Storage | | | | | | | | | | | |
| | 750 Third Avenue | | 1 | | 2,491 | | 2,491 | | $ | 22.50 | |
| | 1515 Broadway | | 1 | | 1,864 | | 1,864 | | $ | 16.00 | |
| | 461 Fifth Avenue | | 1 | | 420 | | 420 | | $ | 27.58 | |
| | 100 Park Avenue | | 1 | | 545 | | 545 | | $ | 25.00 | |
| | 1372 Broadway | | 1 | | 55 | | 55 | | $ | 32.73 | |
| | Total/Weighted Average | | 5 | | 5,375 | | 5,375 | | $ | 21.00 | |
| | | | | | | | | | | |
| | Total Space became Available during the Quarter | | | | | | | | | |
| | Office | | 39 | | 294,673 | | 302,449 | | $ | 49.63 | |
| | Retail | | 4 | | 8,673 | | 8,799 | | $ | 84.97 | |
| | Storage | | 5 | | 5,375 | | 5,375 | | $ | 21.00 | |
| | | | 48 | | 308,721 | | 316,623 | | $ | 50.13 | |
| | | | | | | | | | | |
| | Total Available Space | | | | 1,095,121 | | | | | |
(1) Escalated Rent is calculated as Total Annual Income less Electric Charges
(A) - Includes expiring space, relocating tenants and move-outs where tenants vacated. Excludes lease expirations where tenants heldover.
36
Leasing Activity - Manhattan Properties Leased Space | | 
|
Activity | | Building Address | | # of Leases | | Term
(Yrs) | | Usable SF | | Rentable SF | | New Cash Rent
/ Rentable SF(1) | | Prev. Escalated
Rent/ Rentable
SF(2) | | TI / Rentable
SF | | Free Rent #
of Months | |
| | | | | | | | | | | | | | | | | | | |
Available Space as of 9/30/08 | | | | | | 1,095,121 | | | | | | | | | | | |
| | | | | | | | | | | | | | | | | | | |
Office | | | | | | | | | | | | | | | | | | | |
| | 317 Madison Avenue | | 5 | | 4.7 | | 7,682 | | 8,860 | | $ | 51.77 | | $ | 37.63 | | $ | 13.49 | | 0.7 | |
| | 485 Lexington Avenue | | 1 | | 10.0 | | 8,656 | | 12,499 | | $ | 67.10 | | $ | — | | $ | 96.00 | | — | |
| | 750 Third Avenue | | 2 | | 10.0 | | 45,998 | | 52,418 | | $ | 60.00 | | $ | 44.18 | | $ | — | | 7.4 | |
| | 220 East 42nd Street | | 1 | | 8.8 | | 5,350 | | 9,884 | | $ | 70.00 | | $ | 37.26 | | $ | 55.63 | | 4.5 | |
| | 461 Fifth Avenue | | 4 | | 6.5 | | 29,385 | | 31,176 | | $ | 94.01 | | $ | 57.96 | | $ | 9.21 | | 3.1 | |
| | 100 Park Avenue | | 2 | | 15.4 | | 107,793 | | 121,444 | | $ | 70.41 | | $ | 41.18 | | $ | 50.00 | | 12.0 | |
| | 19 West 44th Street | | 2 | | 6.2 | | 2,038 | | 2,149 | | $ | 48.95 | | $ | 36.91 | | $ | 4.08 | | — | |
| | 28 West 44th Street | | 1 | | 10.0 | | 3,343 | | 3,966 | | $ | 54.00 | | $ | 39.73 | | $ | 13.76 | | 3.0 | |
| | 521 Fifth Avenue | | 1 | | 10.3 | | 7,640 | | 10,022 | | $ | 68.00 | | $ | 38.13 | | $ | 59.87 | | 3.0 | |
| | 120 West 45th Street | | 1 | | 5.0 | | 2,086 | | 2,105 | | $ | 81.00 | | $ | 53.05 | | $ | — | | — | |
| | 810 Seventh Avenue | | 1 | | 5.7 | | 9,131 | | 11,279 | | $ | 78.00 | | $ | 45.10 | | $ | 20.00 | | 2.0 | |
| | 1350 Avenue of the Americas | | 2 | | 10.3 | | 7,151 | | 8,202 | | $ | 90.00 | | $ | — | | $ | 85.48 | | 3.5 | |
| | 1185 Avenue of the Americas | | 1 | | 10.0 | | 9,439 | | 10,558 | | $ | 36.59 | | $ | 33.25 | | $ | 71.04 | | — | |
| | 420 Lexington Avenue | | 8 | | 2.7 | | 16,087 | | 18,124 | | $ | 56.35 | | $ | 40.67 | | $ | 6.29 | | 0.5 | |
| | Total/Weighted Average | | 32 | | 11.0 | | 261,779 | | 302,686 | | $ | 68.76 | | $ | 43.13 | | $ | 35.29 | | 6.9 | |
| | | | | | | | | | | | | | | | | | | |
Retail | | | | | | | | | | | | | | | | | | | |
| | 625 Madison Avenue | | 2 | | 14.4 | | 5,983 | | 6,155 | | $ | 305.86 | | $ | 107.14 | | $ | 0.16 | | 0.5 | |
| | 420 Lexington Avenue | | 1 | | 11.6 | | 891 | | 1,017 | | $ | 65.00 | | $ | 57.18 | | $ | — | | 3.0 | |
| | Total/Weighted Average | | 3 | | 14.0 | | 6,874 | | 7,172 | | $ | 271.70 | | $ | 100.05 | | $ | 0.14 | | 0.8 | |
| | | | | | | | | | | | | | | | | | | |
Storage | | | | | | | | | | | | | | | | | | | |
| | 100 Park Avenue | | 2 | | 6.0 | | 1,012 | | 1,128 | | $ | 21.32 | | $ | — | | $ | — | | 4.4 | |
| | 28 West 44th Street | | 3 | | 3.1 | | 649 | | 663 | | $ | 25.00 | | $ | — | | $ | — | | — | |
| | 800 Third Avenue | | 2 | | 8.7 | | 1,312 | | 1,312 | | $ | 25.00 | | $ | — | | $ | — | | — | |
| | 1350 Avenue of the Americas | | 1 | | 4.8 | | 88 | | 88 | | $ | 25.00 | | $ | — | | $ | — | | — | |
| | Total/Weighted Average | | 8 | | 6.5 | | 3,061 | | 3,191 | | $ | 23.70 | | $ | — | | $ | — | | 1.6 | |
| | | | | | | | | | | | | | | | | | | |
Leased Space | | | | | | | | | | | | | | | | | | | |
| | Office (3) | | 32 | | 11.0 | | 261,779 | | 302,686 | | $ | 68.76 | | $ | 43.13 | | $ | 35.29 | | 6.9 | |
| | Retail | | 3 | | 14.0 | | 6,874 | | 7,172 | | $ | 271.70 | | $ | 100.05 | | $ | 0.14 | | 0.8 | |
| | Storage | | 8 | | 6.5 | | 3,061 | | 3,191 | | $ | 23.70 | | $ | — | | $ | — | | 1.6 | |
| | Total | | 43 | | 11.0 | | 271,714 | | 313,049 | | $ | 72.95 | | $ | 44.56 | | $ | 34.13 | | 6.7 | |
| | | | | | | | | | | | | | | | | | | |
Total Available Space @ 9/30/08 | | | | | | 823,407 | | | | | | | | | | | |
| | | | | | | | | | | | | | | | | | | |
Early Renewals | | | | | | | | | | | | | | | | | |
Office | | | | | | | | | | | | | | | | | | | |
| | 317 Madison Avenue | | 1 | | 2.0 | | 2,906 | | 3,106 | | $ | 52.00 | | $ | 37.43 | | $ | — | | — | |
| | 19 West 44th Street | | 1 | | 1.0 | | 807 | | 881 | | $ | 47.00 | | $ | 40.62 | | $ | — | | — | |
| | 521 Fifth Avenue | | 2 | | 3.3 | | 10,451 | | 11,711 | | $ | 56.74 | | $ | 36.00 | | $ | 1.28 | | — | |
| | 711 Third Avenue | | 1 | | 10.0 | | 27,955 | | 30,035 | | $ | 60.00 | | $ | 45.71 | | $ | 30.00 | | 2.0 | |
| | 800 Third Avenue | | 1 | | 5.0 | | 6,587 | | 6,587 | | $ | 73.00 | | $ | 49.95 | | $ | — | | — | |
| | 420 Lexington Avenue | | 1 | | 5.0 | | 2,919 | | 4,061 | | $ | 52.00 | | $ | 35.00 | | $ | — | | — | |
| | Total/Weighted Average | | 7 | | 7.1 | | 51,625 | | 56,381 | | $ | 59.62 | | $ | 42.88 | | $ | 16.25 | | 1.1 | |
| | | | | | | | | | | | | | | | | | | |
Retail | | | | | | | | | | | | | | | | | | | |
| | 625 Madison Avenue | | 1 | | 9.6 | | 2,866 | | 2,866 | | $ | 115.00 | | 92.10 | | $ | — | | — | |
| | Total/Weighted Average | | 1 | | 9.6 | | 2,866 | | 2,866 | | $ | 115.00 | | $ | 92.10 | | $ | — | | — | |
| | | | | | | | | | | | | | | | | | | |
Storage | | | | | | | | | | | | | | | | | | | |
| | 420 Lexington Avenue | | 1 | | 5.0 | | 74 | | 79 | | $ | 26.60 | | 27.12 | | $ | — | | — | |
| | Total/Weighted Average | | 1 | | 5.0 | | 74 | | 79 | | $ | 26.60 | | $ | 27.12 | | $ | — | | — | |
| | | | | | | | | | | | | | | | | | | |
Renewals | | | | | | | | | | | | | | | | | | | |
| | Early Renewals Office | | 7 | | 7.1 | | 51,625 | | 56,381 | | $ | 59.62 | | $ | 42.88 | | $ | 16.25 | | 1.1 | |
| | Early Renewals Retail | | 1 | | 9.6 | | 2,866 | | 2,866 | | $ | 115.00 | | $ | 92.10 | | $ | — | | — | |
| | Early Renewals Storage | | 1 | | 5.0 | | 74 | | 79 | | $ | 26.60 | | $ | 27.12 | | $ | — | | — | |
| | Total | | 9 | | 7.2 | | 54,565 | | 59,326 | | $ | 62.25 | | $ | 45.24 | | $ | 15.44 | | 1.0 | |
(1) | Annual Base Rent |
(2) | Escalated Rent is calculated as Total Annual Income less Electric Charges |
(3) | Average starting office rent excluding new tenants replacing vacancies is $68.23/rsf for 278,243 rentable SF. |
| Average starting office rent for office space (leased and early renewals, excluding new tenants replacing vacancies) is $66.78/rsf for 334,624 rentable SF. |
37
Leasing Activity - Suburban Properties
| 
|
Available Space |
Activity | | Building Address | | # of Leases | | Usable SF | | Rentable SF | | Rent/Rentable SF ($’s)(1) | |
| | | | | | | | | | | |
Vacancy at 6/30/08 | | | | | | 645,323 | | | | | |
| | | | | | | | | | | |
Space which became available during the Quarter (A): | | | | | | | | | |
Office | | | | | | | | | | | |
| | | | | | | | | | | | |
| | 1100 King Street - 4 Int’l Drive | | 2 | | 3,100 | | 3,100 | | $ | 24.00 | |
| | 520 White Plains Road | | 1 | | 2,069 | | 2,069 | | $ | 29.02 | |
| | 140 Grand Street | | 1 | | 2,698 | | 2,698 | | $ | 32.75 | |
| | 399 Knollwood Road | | 1 | | 1,054 | | 1,054 | | $ | 26.50 | |
| | 1 Landmark Square | | 1 | | 3,914 | | 3,914 | | $ | 30.00 | |
| | 1055 Washington Boulevard | | 1 | | 6,230 | | 6,230 | | $ | 32.51 | |
| | The Meadows | | 3 | | 18,341 | | 18,341 | | $ | 24.56 | |
| | 16 Court Street | | 5 | | 13,999 | | 18,266 | | $ | 35.69 | |
| | Total/Weighted Average | | 15 | | 51,405 | | 55,672 | | $ | 30.05 | |
| | | | | | | | | | | |
| | Total Space became Available during the Quarter | | | | | | | |
| | Office | | 15 | | 51,405 | | 55,672 | | $ | 30.05 | |
| | | | 15 | | 51,405 | | 55,672 | | $ | 30.05 | |
| | | | | | | | | | | |
| | Total Available Space | | | | 696,728 | | | | | |
(1) Escalated Rent is calculated as Total Annual Income less Electric Charges
(A) - Includes expiring space, relocating tenants and move-outs where tenants vacated. Excludes lease expirations where tenants heldover.
38
Leasing Activity - Suburban Properties
|
|
Leased Space |
Activity | | Building Address | | # of Leases | | Term
(Yrs) | | Usable SF | | Rentable SF | | New Cash Rent
/ Rentable SF(1) | | Prev. Escalated
Rent/ Rentable
SF(2) | | TI / Rentable
SF | | Free Rent #
of Months | |
| | | | | | | | | | | | | | | | | | | |
Available Space as of 9/30/08 | | | | | | 696,728 | | | | | | | | | | | |
| | | | | | | | | | | | | | | | | | | |
Office | | | | | | | | | | | | | | | | | | | |
| | 1100 King Street - 4 Int’l Drive | | 1 | | 5.0 | | 1,740 | | 1,950 | | $ | 31.00 | | $ | 21.42 | | $ | 15.38 | | — | |
| | 520 White Plains Road | | 1 | | 7.4 | | 11,642 | | 11,642 | | $ | 25.00 | | $ | — | | $ | 40.00 | | 3.5 | |
| | 500 Summit Lake Drive | | 1 | | 5.3 | | 5,748 | | 5,748 | | $ | 26.25 | | $ | — | | $ | 34.65 | | 3.5 | |
| | 140 Grand Street | | 2 | | 5.0 | | 9,437 | | 9,437 | | $ | 40.00 | | $ | 34.16 | | $ | 26.02 | | — | |
| | 399 Knollwood Road | | 1 | | 2.0 | | 1,054 | | 1,054 | | $ | 26.50 | | $ | 26.50 | | $ | — | | — | |
| | 750 Washington Boulevard | | 1 | | 5.2 | | 5,238 | | 5,238 | | $ | 43.00 | | $ | 35.86 | | $ | 28.00 | | 3.0 | |
| | 1010 Washington Boulevard | | 1 | | 2.0 | | 642 | | 642 | | $ | 25.00 | | $ | — | | $ | 15.00 | | — | |
| | 1055 Washington Boulevard | | 1 | | 1.0 | | 985 | | 985 | | $ | 35.00 | | $ | 46.00 | | $ | — | | — | |
| | The Meadows | | 4 | | 5.1 | | 19,371 | | 19,867 | | $ | 29.69 | | $ | 23.87 | | $ | — | | 0.6 | |
| | 16 Court Street | | 3 | | 3.7 | | 4,067 | | 3,845 | | $ | 33.36 | | $ | — | | $ | 21.99 | | 0.3 | |
| | Total/Weighted Average | | 16 | | 5.3 | | 59,924 | | 60,408 | | $ | 31.48 | | $ | 29.11 | | $ | 19.55 | | 1.5 | |
| | | | | | | | | | | | | | | | | | | |
Storage | | | | | | | | | | | | | | | | | | | |
| | 1010 Washington Boulevard | | 1 | | 1.0 | | 215 | | 215 | | $ | 14.00 | | $ | — | | $ | — | | — | |
| | 1055 Washington Boulevard | | 2 | | 3.6 | | 305 | | 305 | | $ | 15.00 | | $ | — | | $ | — | | 0.3 | |
| | Total/Weighted Average | | 3 | | 2.5 | | 520 | | 520 | | $ | 14.59 | | $ | — | | $ | — | | 0.2 | |
| | | | | | | | | | | | | | | | | | | |
Leased Space | | | | | | | | | | | | | | | | | | | |
| | Office (3) | | 16 | | 5.3 | | 59,924 | | 60,408 | | $ | 31.48 | | $ | 29.11 | | $ | 19.55 | | 1.5 | |
| | Storage | | 3 | | 2.5 | | 520 | | 520 | | $ | 14.59 | | $ | — | | $ | — | | 0.2 | |
| | Total | | 19 | | 5.3 | | 60,444 | | 60,928 | | $ | 31.34 | | $ | 29.11 | | $ | 19.39 | | 1.5 | |
| | | | | | | | | | | | | | | | | | | |
Total Available Space @ 09/30/08 | | | | | | 636,284 | | | | | | | | | | | |
| | | | | | | | | | | | | | | | | | | |
Early Renewals | | | | | | | | | | | | | | | | | | | |
Office | | | | | | | | | | | | | | | | | | | |
| | 750 Washington Boulevard | | 1 | | 1.3 | | 16,111 | | 16,111 | | $ | 46.00 | | $ | 36.26 | | $ | 3.85 | | — | |
| | Total/Weighted Average | | 1 | | 1.3 | | 16,111 | | 16,111 | | $ | 46.00 | | $ | 36.26 | | $ | 3.85 | | — | |
| | | | | | | | | | | | | | | | | | | |
Renewals | | | | | | | | | | | | | | | | | | | |
| | Early Renewals Office | | 1 | | 1.3 | | 16,111 | | 16,111 | | $ | 46.00 | | $ | 36.26 | | $ | 3.85 | | — | |
| | Total | | 1 | | 1.3 | | 16,111 | | 16,111 | | $ | 46.00 | | $ | 36.26 | | $ | 3.85 | | — | |
(1) Annual Base Rent
(2) Escalated Rent is calculated as Total Annual Income less Electric Charges
(3) Average starting office rent excluding new tenants replacing vacancies is $34.95/rsf for 34,310 rentable SF.
Average starting office rent for office space (leased and early renewals, excluding new tenants replacing vacancies) is $38.48/rsf for 50,421 rentable SF.
39
ANNUAL LEASE EXPIRATIONS - Manhattan Properties | 
| |
| | Consolidated Properties | | Joint Venture Properties | |
Year of Lease
Expiration | | Number
of
Expiring
Leases (2) | | Rentable
Square
Footage of
Expiring
Leases | | Percentage of
Total
Leased
Sq. Ft. | | Annualized
Rent of
Expiring
Leases | | Annualized Rent
Per Leased
Square Foot of
Expiring Leases
$/psf (3) | | Year 2008
Weighted
Average
Asking
Rent
$/psf | | Number
of
Expiring
Leases (2) | | Rentable
Square
Footage of
Expiring
Leases | | Percentage
of
Total
Leased
Sq. Ft. | | Annualized
Rent of
Expiring
Leases | | Annualized Rent
Per Leased
Square Foot of
Expiring Leases
$ /psf (3) | | Year 2008
Weighted
Average
Asking
Rent
$ /psf | |
| | | | | | | | | | | | | | | | | | | | | | | | | |
In 1st Quarter 2008 (1) | | 11 | | 21,000 | | 0.15 | % | $ | 1,235,604 | | $ | 58.84 | | $ | 70.71 | | 2 | | 383 | | 0.00 | % | $ | 5,904 | | $ | 15.42 | | $ | 40.00 | |
In 2nd Quarter 2008 (1) | | — | | — | | — | | — | | — | | — | | 1 | | 350 | | 0.00 | % | $ | 9,600 | | $ | 27.43 | | $ | 65.00 | |
In 3rd Quarter 2008 (1) | | 15 | | 38,904 | | 0.27 | % | $ | 1,806,912 | | $ | 46.45 | | $ | 57.72 | | 2 | | 24,215 | | 0.27 | % | $ | 931,332 | | $ | 38.46 | | $ | 56.20 | |
In 4th Quarter 2008 | | 26 | | 150,084 | | 1.05 | % | $ | 7,661,628 | | $ | 51.05 | | $ | 63.91 | | 2 | | 12,184 | | 0.14 | % | $ | 354,504 | | $ | 29.10 | | $ | 62.82 | |
| | | | | | | | | | | | | | | | | | | | | | | | | |
Total 2008 | | 52 | | 209,988 | | 1.47 | % | $ | 10,704,144 | | $ | 50.98 | | $ | 63.44 | | 7 | | 37,132 | | 0.42 | % | $ | 1,301,340 | | $ | 35.05 | | $ | 58.29 | |
| | | | | | | | | | | | | | | | | | | | | | | | | |
In 1st Quarter 2009 | | 30 | | 195,465 | | 1.36 | % | $ | 8,349,792 | | $ | 42.72 | | $ | 56.94 | | 5 | | 42,112 | | 0.48 | % | $ | 1,601,340 | | $ | 38.03 | | $ | 70.09 | |
In 2nd Quarter 2009 | | 21 | | 136,364 | | 0.95 | % | $ | 6,093,504 | | $ | 44.69 | | $ | 59.73 | | 4 | | 25,905 | | 0.29 | % | $ | 1,118,196 | | $ | 43.17 | | $ | 64.43 | |
In 3rd Quarter 2009 | | 22 | | 453,189 | | 3.16 | % | $ | 21,362,694 | | $ | 47.14 | | $ | 54.45 | | 2 | | 14,157 | | 0.16 | % | $ | 683,952 | | $ | 48.31 | | $ | 62.46 | |
In 4th Quarter 2009 | | 30 | | 278,111 | | 1.94 | % | $ | 14,552,460 | | $ | 52.33 | | $ | 63.84 | | 5 | | 38,165 | | 0.43 | % | $ | 2,506,764 | | $ | 65.68 | | $ | 85.81 | |
| | | | | | | | | | | | | | | | | | | | | | | | | |
Total 2009 | | 103 | | 1,063,129 | | 7.42 | % | $ | 50,358,450 | | $ | 47.37 | | $ | 58.04 | | 16 | | 120,339 | | 1.36 | % | $ | 5,910,252 | | $ | 49.11 | | $ | 72.96 | |
| | | | | | | | | | | | | | | | | | | | | | | | | |
2010 | | 120 | | 880,769 | | 6.15 | % | $ | 41,832,936 | | $ | 47.50 | | $ | 61.51 | | 22 | | 1,437,659 | | 16.23 | % | $ | 75,449,388 | | $ | 52.48 | | $ | 70.97 | |
2011 | | 114 | | 868,628 | | 6.06 | % | $ | 44,690,280 | | $ | 51.45 | | $ | 61.70 | | 9 | | 150,116 | | 1.69 | % | $ | 6,720,816 | | $ | 44.77 | | $ | 69.38 | |
2012 | | 112 | | 921,945 | | 6.43 | % | $ | 40,042,572 | | $ | 43.43 | | $ | 55.60 | | 18 | | 149,080 | | 1.68 | % | $ | 7,884,396 | | $ | 52.89 | | $ | 67.76 | |
2013 | | 97 | | 1,171,544 | | 8.17 | % | $ | 56,507,256 | | $ | 48.23 | | $ | 61.27 | | 12 | | 1,020,878 | | 11.52 | % | $ | 60,842,328 | | $ | 59.60 | | $ | 80.72 | |
2014 | | 39 | | 739,991 | | 5.16 | % | $ | 33,161,916 | | $ | 44.81 | | $ | 62.78 | | 15 | | 231,108 | | 2.61 | % | $ | 19,225,848 | | $ | 83.19 | | $ | 108.26 | |
2015 | | 43 | | 557,858 | | 3.89 | % | $ | 26,235,780 | | $ | 47.03 | | $ | 60.74 | | 15 | | 311,106 | | 3.51 | % | $ | 13,798,296 | | $ | 44.35 | | $ | 59.77 | |
2016 | | 42 | | 1,131,684 | | 7.90 | % | $ | 57,092,340 | | $ | 50.45 | | $ | 65.18 | | 7 | | 209,736 | | 2.37 | % | $ | 16,239,876 | | $ | 77.43 | | $ | 80.50 | |
2017 | | 61 | | 1,841,188 | | 12.85 | % | $ | 94,915,416 | | $ | 51.55 | | $ | 61.65 | | 5 | | 154,846 | | 1.75 | % | $ | 10,332,720 | | $ | 66.73 | | $ | 64.93 | |
Thereafter | | 87 | | 4,945,057 | | 34.50 | % | $ | 264,471,636 | | $ | 53.48 | | $ | 67.97 | | 28 | | 2,401,560 | | 27.11 | % | $ | 144,892,188 | | $ | 60.33 | | $ | 81.15 | |
| | | | | | | | | | | | | | | | | | | | | | | | | |
| | 870 | | 14,331,781 | | 100.00 | % | $ | 720,012,726 | | $ | 50.24 | | $ | 63.47 | | 154 | | 6,223,560 | | 70.26 | % | $ | 362,597,448 | | $ | 58.26 | | $ | 77.34 | |
| | | | | | | | | | | | | | | | | | | | | | | | | |
| | | | | | | | | | | | | (4) | 2 | | 2,634,670 | | 29.74 | % | $ | 99,225,000 | | | | | |
| | | | | | | | | | | | | | 156 | | 8,858,230 | | 100.00 | % | $ | 461,822,448 | | | | | |
(1) Includes month to month holdover tenants that expired prior to 9/30/08.
(2) Tenants may have multiple leases.
(3) Represents in place annualized rent allocated by year of maturity.
(4) Citigroup 13 year Net Lease at 388-390 Greenwich Street , current net rent is $37.66/psf with annual CPI escalation.
40
ANNUAL LEASE EXPIRATIONS - Suburban Properties |
| |
| | Consolidated Properties | | Joint Venture Properties | |
Year of Lease
Expiration | | Number
of
Expiring
Leases (2) | | Rentable
Square
Footage of
Expiring
Leases | | Percentage
of
Total Leased
Sq. Ft. | | Annualized
Rent of
Expiring
Leases | | Annualized
Rent
Per Leased
Square Foot of
Expiring
Leases
$/psf (3) | | Year
2008
Weighted
Average
Asking
Rent
$/psf | | Number
of
Expiring
Leases (2) | | Rentable
Square
Footage of
Expiring
Leases | | Percentage
of
Total Leased
Sq. Ft. | | Annualized
Rent of
Expiring
Leases | | Annualized
Rent
Per Leased
Square Foot of
Expiring
Leases
$/psf (3) | | Year
2008
Weighted
Average
Asking
Rent
$/psf | |
| | | | | | | | | | | | | | | | | | | | | | | | | |
In 1st Quarter 2008 (1) | | 9 | | 69,981 | | 1.61 | % | $ | 601,032 | | $ | 8.59 | | $ | 10.07 | | 4 | | 30,736 | | 1.13 | % | $ | 611,909 | | $ | 19.91 | | $ | 33.42 | |
In 2nd Quarter 2008 (1) | | 1 | | 1,648 | | 0.04 | % | $ | 45,252 | | $ | 27.46 | | $ | 40.00 | | 1 | | 3,308 | | 0.12 | % | $ | 92,624 | | $ | 28.00 | | $ | 30.00 | |
In 3rd Quarter 2008 (1) | | 5 | | 9,644 | | 0.22 | % | $ | 296,292 | | $ | 30.72 | | $ | 34.74 | | 4 | | 22,135 | | 0.81 | % | $ | 699,792 | | $ | 31.61 | | $ | 31.21 | |
In 4th Quarter 2008 | | 10 | | 62,984 | | 1.45 | % | $ | 1,786,344 | | $ | 28.36 | | $ | 38.83 | | 4 | | 24,433 | | 0.90 | % | $ | 652,908 | | $ | 26.72 | | $ | 30.95 | |
| | | | | | | | | | | | | | | | | | | | | | | | | |
Total 2008 | | 25 | | 144,257 | | 3.32 | % | $ | 2,728,920 | | $ | 18.92 | | $ | 24.62 | | 13 | | 80,612 | | 2.96 | % | $ | 2,057,233 | | $ | 25.52 | | $ | 31.92 | |
| | | | | | | | | | | | | | | | | | | | | | | | | |
In 1st Quarter 2009 | | 13 | | 36,706 | | 0.85 | % | $ | 1,229,592 | | $ | 33.50 | | $ | 39.87 | | 6 | | 10,446 | | 0.38 | % | $ | 340,704 | | $ | 32.62 | | $ | 32.09 | |
In 2nd Quarter 2009 | | 10 | | 27,739 | | 0.64 | % | $ | 824,460 | | $ | 29.72 | | $ | 34.29 | | 3 | | 9,047 | | 0.33 | % | $ | 319,692 | | $ | 35.34 | | $ | 35.57 | |
In 3rd Quarter 2009 | | 11 | | 89,100 | | 2.05 | % | $ | 3,045,516 | | $ | 34.18 | | $ | 37.61 | | 8 | | 76,107 | | 2.79 | % | $ | 2,561,940 | | $ | 33.66 | | $ | 34.70 | |
In 4th Quarter 2009 | | 23 | | 153,688 | | 3.54 | % | $ | 4,585,440 | | $ | 29.84 | | $ | 42.78 | | 7 | | 34,922 | | 1.28 | % | $ | 1,143,216 | | $ | 32.74 | | $ | 33.43 | |
| | | | | | | | | | | | | | | | | | | | | | | | | |
Total 2009 | | 57 | | 307,233 | | 7.08 | % | $ | 9,685,008 | | $ | 31.52 | | $ | 40.17 | | 24 | | 130,522 | | 4.79 | % | $ | 4,365,552 | | $ | 33.45 | | $ | 34.21 | |
| | | | | | | | | | | | | | | | | | | | | | | | | |
2010 | | 62 | | 577,770 | | 13.32 | % | $ | 17,478,180 | | $ | 30.25 | | $ | 33.69 | | 23 | | 180,469 | | 6.62 | % | $ | 5,296,440 | | $ | 29.35 | | $ | 32.83 | |
2011 | | 71 | | 806,527 | | 18.59 | % | $ | 23,633,208 | | $ | 29.30 | | $ | 36.22 | | 25 | | 141,453 | | 5.19 | % | $ | 4,189,428 | | $ | 29.62 | | $ | 31.91 | |
2012 | | 42 | | 412,595 | | 9.51 | % | $ | 12,772,692 | | $ | 30.96 | | $ | 34.85 | | 21 | | 243,312 | | 8.93 | % | $ | 8,360,436 | | $ | 34.36 | | $ | 34.71 | |
2013 | | 32 | | 403,199 | | 9.29 | % | $ | 12,927,084 | | $ | 32.06 | | $ | 33.75 | | 15 | | 73,269 | | 2.69 | % | $ | 2,298,420 | | $ | 31.37 | | $ | 41.43 | |
2014 | | 17 | | 227,996 | | 5.25 | % | $ | 6,572,352 | | $ | 28.83 | | $ | 34.22 | | 13 | | 199,031 | | 7.30 | % | $ | 6,788,520 | | $ | 34.11 | | $ | 34.37 | |
2015 | | 17 | | 250,042 | | 5.76 | % | $ | 7,725,084 | | $ | 30.90 | | $ | 34.25 | | 8 | | 40,037 | | 1.47 | % | $ | 1,217,004 | | $ | 30.40 | | $ | 34.37 | |
2016 | | 14 | | 286,582 | | 6.60 | % | $ | 7,951,430 | | $ | 27.75 | | $ | 38.14 | | 5 | | 64,112 | | 2.35 | % | $ | 2,044,656 | | $ | 31.89 | | $ | 35.45 | |
2017 | | 11 | | 95,176 | | 2.19 | % | $ | 2,886,468 | | $ | 30.33 | | $ | 31.63 | | 7 | | 59,178 | | 2.17 | % | $ | 2,209,620 | | $ | 37.34 | | $ | 34.80 | |
Thereafter | | 12 | | 827,762 | | 19.08 | % | $ | 26,929,422 | | $ | 32.53 | | $ | 37.62 | | 10 | | 1,513,868 | | 55.54 | % | $ | 54,540,528 | | $ | 36.03 | | $ | 39.41 | |
| | | | | | | | | | | | | | | | | | | | | | | | | |
| | 360 | | 4,339,139 | | 100.00 | % | $ | 131,289,848 | | $ | 30.26 | | $ | 35.49 | | 164 | | 2,725,863 | | 100.00 | % | $ | 93,367,837 | | $ | 34.25 | | $ | 37.12 | |
(1) Includes month to month holdover tenants that expired prior to 9/30/08.
(2) Tenants may have multiple leases.
(3) Represents in place annualized rent allocated by year of maturity.
41
| |
SUMMARY OF REAL ESTATE ACQUISITION ACTIVITY POST 1997 - Manhattan | 
|
| |
| | | | | | | | | | % Leased | | Acquisition | |
| | Property | | Type of Ownership | | Submarket | | Net Rentable sf | | at acquisition | | 9/30/2008 | | Price ($’s) (1) | |
| | | | | | | | | | | | | | | |
1998 Acquisitions | | | | | | | | | | | | | | | |
Mar-98 | | 420 Lexington | | Operating Sublease | | Grand Central | | 1,188,000 | | 83.0 | | 97.0 | | $ | 78,000,000 | |
May-98 | | 711 3rd Avenue | | Operating Sublease | | Grand Central | | 524,000 | | 79.0 | | 93.3 | | $ | 65,600,000 | |
Jun-98 | | 440 9th Avenue | | Fee Interest | | Penn Station | | 339,000 | | 76.0 | | N/A | | $ | 32,000,000 | |
1999 Acquisitions | | | | | | | | | | | | | | | |
Jan-99 | | 420 Lexington Leasehold | | Sub-leasehold | | Grand Central | | — | | — | | — | | $ | 27,300,000 | |
Jan-99 | | 555 West 57th - 65% JV | | Fee Interest | | Midtown West | | 941,000 | | 100.0 | | 99.3 | | $ | 66,700,000 | |
Aug-99 | | 1250 Broadway - 50% JV | | Fee Interest | | Penn Station | | 670,000 | | 96.5 | | N/A | | $ | 93,000,000 | |
Nov-99 | | 555 West 57th - remaining 35% | | Fee Interest | | Midtown West | | — | | | | 99.3 | | $ | 34,100,000 | |
2000 Acquisitions | | | | | | | | | | | | | | | |
Feb-00 | | 100 Park Avenue - 50% JV | | Fee Interest | | Grand Central | | 834,000 | | 96.5 | | 80.4 | | $ | 192,000,000 | |
2001 Acquisitions | | | | | | | | | | | | | | | |
Jun-01 | | 317 Madison | | Fee Interest | | Grand Central | | 450,000 | | 95.0 | | 89.6 | | $ | 105,600,000 | |
Acquisition of JV Interest | | | | | | | | | | | | | | | |
Sep-01 | | 1250 Broadway - 49.9% JV (2) | | Fee Interest | | Penn Station | | 670,000 | | 97.7 | | N/A | | $ | 126,500,000 | |
2002 Acquisitions | | | | | | | | | | | | | | | |
May-02 | | 1515 Broadway - 55% JV | | Fee Interest | | Times Square | | 1,750,000 | | 98.0 | | 91.8 | | $ | 483,500,000 | |
2003 Acquisitions | | | | | | | | | | | | | | | |
Feb-03 | | 220 East 42nd Street | | Fee Interest | | Grand Central | | 1,135,000 | | 91.9 | | 99.7 | | $ | 265,000,000 | |
Mar-03 | | 125 Broad Street | | Fee Interest | | Downtown | | 525,000 | | 100.0 | | N/A | | $ | 92,000,000 | |
Oct-03 | | 461 Fifth Avenue | | Leasehold Interest | | Midtown | | 200,000 | | 93.9 | | 95.4 | | $ | 60,900,000 | |
Dec-03 | | 1221 Ave of Americas - 45% JV | | Fee Interest | | Rockefeller Center | | 2,550,000 | | 98.8 | | 92.9 | | $ | 1,000,000,000 | |
2004 Acquisitions | | | | | | | | | | | | | | | |
Mar-04 | | 19 West 44th Street - 35% JV | | Fee Interest | | Midtown | | 292,000 | | 86.0 | | 99.5 | | $ | 67,000,000 | |
Jul-04 | | 750 Third Avenue | | Fee Interest | | Grand Central | | 779,000 | | 100.0 | | 95.8 | | $ | 255,000,000 | |
Jul-04 | | 485 Lexington Avenue - 30% JV | | Fee Interest | | Grand Central | | 921,000 | | 100.0 | | 100.0 | | $ | 225,000,000 | |
Oct-04 | | 625 Madison Avenue | | Leasehold Interest | | Plaza District | | 563,000 | | 68.0 | | 97.6 | | $ | 231,500,000 | |
2005 Acquisitions | | | | | | | | | | | | | | | |
Feb-05 | | 28 West 44th Street | | Fee Interest | | Midtown | | 359,000 | | 87.0 | | 99.4 | | $ | 105,000,000 | |
Apr-05 | | 1 Madison Ave - 55% JV | | Fee Interest | | Park Avenue South | | 1,177,000 | | 96.0 | | 99.8 | | $ | 803,000,000 | |
Apr-05 | | 5 Madison Ave Clock Tower | | Fee Interest | | Park Avenue South | | 267,000 | | N/A | | N/A | | $ | 115,000,000 | |
Jun-05 | | 19 West 44th Street -remaining 65% | | Fee Interest | | Midtown | | — | | | | 99.5 | | $ | 91,200,000 | |
2006 Acquisition | | | | | | | | | | | | | | | |
Mar-06 | | 521 Fifth Avenue (3) | | Leasehold Interest | | Midtown | | 460,000 | | 97.0 | | 93.1 | | $ | 210,000,000 | |
Jun-06 | | 609 Fifth Avenue | | Fee Interest | | Midtown | | 160,000 | | 98.5 | | 100.0 | | $ | 182,000,000 | |
Dec-06 | | 485 Lexington Avenue - remaining 70% | | Fee Interest | | Grand Central | | — | | | | 100.0 | | $ | 578,000,000 | |
Dec-06 | | 800 Third Avenue - 46.9% JV | | Fee Interest | | Grand Central North | | 526,000 | | 96.9 | | 98.7 | | $ | 285,000,000 | |
2007 Acquisition | | | | | | | | | | | | | | | |
Jan-07 | | Reckson - NYC Portfolio | | Fee Interests / Leasehold Interest | | Various | | 5,612,000 | | 98.3 | | 98.3 | | $ | 3,679,530,000 | |
Apr-07 | | 331 Madison Avenue | | Fee Interest | | Grand Central | | 114,900 | | 97.6 | | 100.0 | | $ | 73,000,000 | |
Apr-07 | | 1745 Broadway - 32.3% JV | | Fee Interest | | Midtown | | 674,000 | | 100.0 | | 100.0 | | $ | 520,000,000 | |
Jun-07 | | 333 West 34th Street | | Fee Interest | | Penn Station | | 345,400 | | 100.0 | | 100.0 | | $ | 183,000,000 | |
Aug-07 | | 1 Madison Avenue - remaining 45% | | Fee Interest | | Park Avenue South | | 1,177,000 | | 99.8 | | 99.8 | | $ | 1,000,000,000 | |
Dec-07 | | 388 & 390 Greenwich Street - 50.6% JV | | Fee Interest | | Downtown | | 2,635,000 | | 100.0 | | 100.0 | | $ | 1,575,000,000 | |
| | | | | | | | 10,558,300 | | | | | | $ | 7,030,530,000 | |
(1) Acquisition price represents purchase price for consolidated acquisitions and purchase price or imputed value for joint venture properties.
(2) Current ownership interest is 55%. (From 9/1/01-10/31/01the company owned 99.8% of this property.)
(3) Current ownership interest is 50.1%. (From 3/17/06 - 12/14/06 the company owned 100% of the Leasehold Interest of this property.)
42
| |
SUMMARY OF REAL ESTATE SALES ACTIVITY POST 1999 - Manhattan
| 
|
| | |
| | | | | | | | | | Sales | | Sales | |
| | Property | | Type of Ownership | | Submarket | | Net Rentable sf | | Price ($’s) | | Price ($’s/SF) | |
| | | | | | | | | | | | | |
2000 Sales | | | | | | | | | | | | | |
Feb-00 | | 29 West 35th Street | | Fee Interest | | Penn Station | | 78,000 | | $ | 11,700,000 | | $ | 150 | |
Mar-00 | | 36 West 44th Street | | Fee Interest | | Grand Central | | 178,000 | | $ | 31,500,000 | | $ | 177 | |
May-00 | | 321 West 44th Street - 35% JV | | Fee Interest | | Times Square | | 203,000 | | $ | 28,400,000 | | $ | 140 | |
Nov-00 | | 90 Broad Street | | Fee Interest | | Financial | | 339,000 | | $ | 60,000,000 | | $ | 177 | |
Dec-00 | | 17 Battery South | | Fee Interest | | Financial | | 392,000 | | $ | 53,000,000 | | $ | 135 | |
| | | | | | | | 1,190,000 | | $ | 184,600,000 | | $ | 156 | |
2001 Sales | | | | | | | | | | | | | |
Jan-01 | | 633 Third Ave | | Fee Interest | | Grand Central North | | 40,623 | | $ | 13,250,000 | | $ | 326 | |
May-01 | | 1 Park Ave - 45% JV | | Fee Interest | | Grand Central South | | 913,000 | | $ | 233,900,000 | | $ | 256 | |
Jun-01 | | 1412 Broadway | | Fee Interest | | Times Square South | | 389,000 | | $ | 90,700,000 | | $ | 233 | |
Jul-01 | | 110 E. 42nd Street | | Fee Interest | | Grand Central | | 69,700 | | $ | 14,500,000 | | $ | 208 | |
Sep-01 | | 1250 Broadway (1) | | Fee Interest | | Penn Station | | 670,000 | | $ | 126,500,000 | | $ | 189 | |
| | | | | | | | 2,082,323 | | $ | 478,850,000 | | $ | 242 | |
2002 Sales | | | | | | | | | | | | | |
Jun-02 | | 469 Seventh Avenue | | Fee Interest | | Penn Station | | 253,000 | | $ | 53,100,000 | | $ | 210 | |
| | | | | | | | 253,000 | | $ | 53,100,000 | | $ | 210 | |
2003 Sales | | | | | | | | | | | | | |
Mar-03 | | 50 West 23rd Street | | Fee Interest | | Chelsea | | 333,000 | | $ | 66,000,000 | | $ | 198 | |
Jul-03 | | 1370 Broadway | | Fee Interest | | Times Square South | | 255,000 | | $ | 58,500,000 | | $ | 229 | |
Dec-03 | | 321 W 44th Street | | Fee Interest | | Times Square | | 203,000 | | $ | 35,000,000 | | $ | 172 | |
| | | | | | | | 791,000 | | $ | 159,500,000 | | $ | 202 | |
2004 Sales | | | | | | | | | | | | | |
May-04 | | 1 Park Avenue (2) | | Fee Interest | | Grand Central South | | 913,000 | | $ | 318,500,000 | | $ | 349 | |
Oct-04 | | 17 Battery Place North | | Fee Interest | | Financial | | 419,000 | | $ | 70,000,000 | | $ | 167 | |
Nov-04 | | 1466 Broadway | | Fee Interest | | Times Square | | 289,000 | | $ | 160,000,000 | | $ | 554 | |
| | | | | | | | 1,621,000 | | $ | 548,500,000 | | $ | 338 | |
2005 Sales | | | | | | | | | | | | | |
Apr-05 | | 1414 Avenue of the Americas | | Fee Interest | | Plaza District | | 111,000 | | $ | 60,500,000 | | $ | 545 | |
Aug-05 | | 180 Madison Avenue | | Fee Interest | | Grand Central | | 265,000 | | $ | 92,700,000 | | $ | 350 | |
| | | | | | | | 376,000 | | 153,200,000 | | $ | 407 | |
2006 Sales | | | | | | | | | | | | | |
Jul-06 | | 286 & 290 Madison Avenue | | Fee Interest | | Grand Central | | 149,000 | | $ | 63,000,000 | | $ | 423 | |
Aug-06 | | 1140 Avenue of the Americas | | Leasehold Interest | | Rockefeller Center | | 191,000 | | $ | 97,500,000 | | $ | 510 | |
Dec-06 | | 521 Fifth Avenue (3) | | Leasehold Interest | | Midtown | | 460,000 | | $ | 240,000,000 | | $ | 522 | |
| | | | | | | | 800,000 | | 400,500,000 | | $ | 501 | |
2007 Sales | | | | | | | | | | | | | |
Mar-07 | | 1 Park Avenue | | Fee Interest | | Grand Central South | | 913,000 | | $ | 550,000,000 | | $ | 602 | |
Mar-07 | | 70 West 36th Street | | Fee Interest | | Garment | | 151,000 | | $ | 61,500,000 | | $ | 407 | |
Jun-07 | | 110 East 42nd Street | | Fee Interest | | Grand Central North | | 181,000 | | $ | 111,500,000 | | $ | 616 | |
Jun-07 | | 125 Broad Street | | Fee Interest | | Downtown | | 525,000 | | $ | 273,000,000 | | $ | 520 | |
Jun-07 | | 5 Madison Clock Tower | | Fee Interest | | Park Avenue South | | 267,000 | | $ | 200,000,000 | | $ | 749 | |
Jul-07 | | 292 Madison | | Fee Interest | | Grand Central South | | 187,000 | | $ | 140,000,000 | | $ | 749 | |
Jul-07 | | 1372 Broadway (4) | | Fee Interest | | Penn Station/Garment | | 508,000 | | $ | 335,000,000 | | $ | 659 | |
Nov-07 | | 470 Park Ave South | | Fee Interest | | Park Avenue South/Flatiron | | 260,000 | | $ | 157,000,000 | | $ | 604 | |
| | | | | | | | 2,992,000 | | $ | 1,828,000,000 | | $ | 611 | |
| | | | | | | | | | | | | |
2008 Sales | | | | | | | | | | | | | |
Jan-08 | | 440 Ninth Avenue | | Fee Interest | | Penn Station | | 339,000 | | $ | 160,000,000 | | $ | 472 | |
May-08 | | 1250 Broadway | | Fee Interest | | Penn Station | | 670,000 | | $ | 310,000,000 | | $ | 463 | |
| | �� | | | | | | 1,009,000 | | $ | 470,000,000 | | $ | 466 | |
(1) Company sold a 45% JV interest in the property at an implied $126.5mm sales price.
(2) Company sold a 75% JV interest in the property at an implied $318.5mm sales price.
(3) Company sold a 50% JV interest in the property at an implied $240.0mm sales price
(4) Company sold a 85% JV interest in the property at an implied $335.0mm sales price.
43
SUMMARY OF REAL ESTATE ACQUISITION ACTIVITY POST 1997 - Suburban | 
|
| | | | | | | | | | % Leased | | Acquisition | |
| | Property | | Type of Ownership | | Submarket | | Net Rentable sf | | at acquisition | | 9/30/2008 | | Price ($’s) (1) | |
| | | | | | | | | | | | | | | |
2007 Acquisition | | | | | | | | | | | | | | | |
Jan-07 | | 300 Main Street | | Fee Interest | | Stamford, Connecticut | | 130,000 | | 92.5 | | 95.3 | | $ | 15,000,000 | |
Jan-07 | | 399 Knollwood Road | | Fee Interest | | White Plains, Westchester | | 145,000 | | 96.6 | | 96.3 | | $ | 31,600,000 | |
Jan-07 | | Reckson - Connecticut Portfolio | | Fee Interests / Leasehold Interest | | Stamford, Connecticut | | 1,369,800 | | 88.9 | | 87.5 | | $ | 490,750,000 | |
Jan-07 | | Reckson - Westchester Portfolio | | Fee Interests / Leasehold Interest | | Westchester | | 2,346,100 | | 90.6 | | 89.0 | | $ | 570,190,000 | |
Apr-07 | | Jericho Plazas - 20.26% JV | | Fee Interest | | Jericho, New York | | 640,000 | | 98.4 | | 96.3 | | $ | 210,000,000 | |
Jun-07 | | 1010 Washington Boulevard | | Fee Interest | | Stamford, Connecticut | | 143,400 | | 95.6 | | 95.1 | | $ | 38,000,000 | |
Jun-07 | | 500 West Putnam Avenue | | Fee Interest | | Greenwich, Connecticut | | 121,500 | | 94.4 | | 88.7 | | $ | 56,000,000 | |
Jul-07 | | 16 Court Street - 35% JV | | Fee Interest | | Brooklyn, New York | | 317,600 | | 80.6 | | 79.2 | | $ | 107,500,000 | |
Aug-07 | | 150 Grand Street | | Fee Interest | | White Plains, Westchester | | 85,000 | | 52.9 | | 17.5 | | $ | 6,700,000 | |
Sep-07 | | The Meadows - 25% JV | | Fee Interest | | Rutherford, New Jersey | | 582,100 | | 81.3 | | 85.3 | | $ | 111,500,000 | |
| | | | | | | | 5,880,500 | | | | | | $ | 1,637,240,000 | |
SUMMARY OF REAL ESTATE ACQUISITION ACTIVITY POST 1997 - Retail, Development & Land |
| | | | | | | | | | % Leased | | Acquisition | |
| | Property | | Type of Ownership | | Submarket | | Net Rentable sf | | at acquisition | | 9/30/2008 | | Price ($’s) (1) | |
| | | | | | | | | | | | | | | |
2005 Acquisition | | | | | | | | | | | | | | | |
Jul-05 | | 1551-1555 Broadway - 10% JV | | Fee Interest | | Times Square | | 25,600 | | N/A | | 100.0 | | $ | 85,000,000 | |
Jul-05 | | 21 West 34th Street - 50% JV | | Fee Interest | | Herald Square | | 30,100 | | N/A | | 100.0 | | $ | 17,500,000 | |
Sep-05 | | 141 Fifth Avenue - 50% JV | | Fee Interest | | Fllat Iron | | 21,500 | | 90.0 | | 100.0 | | $ | 13,250,000 | |
Nov-05 | | 1604 Broadway - 63% JV | | Leasehold Interest | | Times Square | | 29,876 | | 17.2 | | 100.0 | | $ | 4,400,000 | |
Dec-05 | | 379 West Broadway - 45% JV | | Leasehold Interest | | Cast Iron/Soho | | 62,006 | | 100.0 | | 100.0 | | $ | 19,750,000 | |
| | | | | | | | 169,082 | | | | | | $ | 139,900,000 | |
| | | | | | | | | | | | | | | |
2006 Acquisition | | | | | | | | | | | | | | | |
Jan-06 | | 25-29 West 34th Street - 50% JV | | Fee Interest | | Herald Square/Penn Station | | 41,000 | | 55.8 | | 100.0 | | $ | 30,000,000 | |
Sep-06 | | 717 Fifth Avenue - 32.75% JV | | Fee Interest | | Midtown/Plaza District | | 119,550 | | 63.1 | | 79.1 | | $ | 251,900,000 | |
| | | | | | | | 160,550 | | | | | | $ | 281,900,000 | |
| | | | | | | | | | | | | | | |
| | | | | | | | | | | | | | | |
2007 Acquisition | | | | | | | | | | | | | | | |
Aug-07 | | 180 Broadway - 50% JV | | Fee Interest | | Cast Iron / Soho | | 24,300 | | 85.2 | | 82.5 | | $ | 13,600,000 | |
Apr-07 | | Two Herald Square - 55% JV | | Fee Interest | | Herald Square | | N/A | | N/A | | N/A | | $ | 225,000,000 | |
Jul-07 | | 885 Third Avenue - 55% JV | | Fee Interest | | Midtown / Plaza District | | N/A | | N/A | | N/A | | $ | 317,000,000 | |
| | | | | | | | 24,300 | | | | | | $ | 555,600,000 | |
| | | | | | | | | | | | | | | |
2008 Acquisition | | | | | | | | | | | | | | | |
Feb-08 | | 182 Broadway - 50% JV | | Fee Interest | | Cast Iron / Soho | | 46,280 | | 83.8 | | 82.5 | | $ | 30,000,000 | |
| | | | | | | | 46,280 | | | | | | $ | 30,000,000 | |
(1) Acquisition price represents purchase price for consolidated acquisitions and purchase price or imputed value for joint venture properties.
44
SUPPLEMENTAL DEFINITIONS |

|
Annualized rent is calculated as monthly base rent and escalations per the lease, as of a certain date, multiplied by 12.
Debt service coverage is adjusted EBITDA divided by total interest and principal payments.
Equity income / (loss) from affiliates are generally accounted for on a cost basis and realized gains and losses are included in current earnings. For investments in private companies, the Company periodically reviews its investments and management determines if the value of such investments have been permanently impaired. Permanent impairment losses for investments in public and private companies are included in current earnings.
Fixed charge is the total payments for interest, principal amortization, ground leases and preferred stock dividend.
Fixed charge coverage is adjusted EBITDA divided by fixed charge.
Funds available for distribution (FAD) is defined as FFO plus non-real estate depreciation, 2% allowance for straight line credit loss, adjustment for straight line ground rent, non-cash deferred compensation, a pro-rata adjustment for FAD for SLG’s unconsolidated JV, less straight line rental income, free rent net of amortization, second cycle tenant improvement and leasing cost, and recurring building improvements.
Funds from operations (FFO) is defined under the White Paper approved by the Board of Governors of NAREIT in April 2002 as net income (loss) (computed in accordance with GAAP), excluding gains (or losses) from debt restructuring and sales of properties, plus real estate depreciation and amortization and after adjustments for unconsolidated partnerships and joint ventures.
Interest coverage is adjusted EBITDA divided by total interest expense.
Junior Mortgage Participations are subordinate interests in first mortgages.
Mezzanine Debt Loans are loans secured by ownership interests.
Percentage leased represents the percentage of leased square feet, including month-to-month leases, to total rentable square feet owned, as of the date reported. Space is considered leased when the tenant has either taken physical or economic occupancy.
Preferred Equity Investments are equity investments entitled to preferential returns that are senior to common equity.
Recurring capital expenditures represents non-incremental building improvements and leasing costs required to maintain current revenues. Recurring capital expenditures do not include immediate building improvements that were taken into consideration when underwriting the purchase of a building or which are incurred to bring a building up to “operating standard.”
Redevelopment costs are non-recurring capital expenditures incurred in order to improve buildings to SLG’s “operating standards.” These building costs are taken into consideration during the underwriting for a given property’s acquisition.
Same-store NOI growth is the change in the NOI (excluding straight-line rents) of the same-store properties from the prior year reporting period to the current year reporting period.
Same-store properties include all properties that were owned during both the current and prior year reporting periods and excludes development properties prior to being stabilized for both the current and prior reporting period.
Second generation TIs and LCs are tenant improvements, lease commissions, and other leasing costs incurred during leasing of second generation space. Costs incurred prior to leasing available square feet are not included until such space is leased. Second generation space excludes square footage vacant at acquisition.
SLG’s share of total debt to market capitalization is calculated as SLG’s share of total debt divided by the sum of total debt plus market equity and preferred stock at liquidation value. SLG’s share of total debt includes total consolidated debt plus SLG’s pro rata share of the debt of unconsolidated joint ventures less JV partners’ share of debt. Market equity assumes conversion of all OP units into common stock.
Total square feet owned represents 100% of the square footage of properties either owned directly by SLG or in which SLG has an interest (e.g. joint ventures).
45
CORPORATE GOVERNANCE |

|
Stephen L. Green
Chairman of the Board
Marc Holliday
Chief Executive Officer
Gregory F. Hughes
Chief Operating Officer and Chief Financial Officer
Andrew Mathias
President and Chief Investment Officer
Andrew S. Levine
Chief Legal Officer
ANALYST COVERAGE
Firm | | Analyst | | Phone | | Email |
Banc of America Securities, LLC | | Mitchell B. Germain | | (212) 847-5794 | | mitchell.b.germain@bofasecurities.com |
Barclays Capital | | Ross Smotrich | | (212) 526-2306 | | Ross.smotrich@barcap.com |
Citigroup Smith Barney, Inc. | | Michael Bilerman | | (212) 816-1383 | | michael.bilerman@citigroup.com |
Credit-Suisse | | Steve Benyik | | (212) 538-0239 | | steve.benyik@credit-suisse.com |
Deutsche Bank Securities, Inc. | | Louis W. Taylor | | (212) 250-4912 | | louis.taylor@db.com |
Goldman Sachs & Co. | | Jonathan Habermann | | (917) 343-4260 | | jonathan.habermann@gs.com |
Green Street Advisors | | Michael Knott | | (949) 640-8780 | | mknott@greenstreetadvisors.com |
JP Morgan Securities, Inc. | | Anthony Paolone | | (212) 622-6682 | | anthony.paolone@jpmorgan.com |
KeyBanc Capital Markets | | Jordan Sadler | | (917) 368-2280 | | jsadler@keybanccm.com |
Macquarie Research Equities (USA) | | Nick Pirsos | | (212) 231-2457 | | nick.pirsos@macquarie.com |
Merrill Lynch | | Steve Sakwa | | (212) 449-0335 | | steve_sakwa@ml.com |
Raymond James Financial, Inc. | | Paul D. Puryear | | (727) 567-2253 | | paul.puryear@raymondjames.com |
RBC Capital Markets | | David B. Rodgers | | (440) 715-2647 | | dave.rodgers@rbccm.com |
Stifel Nicolaus | | John Guinee | | (443) 224-1307 | | jwguinee@stifel.com |
UBS Securities LLC | | James C. Feldman | | (212) 713 4932 | | james.feldman@ubs.com |
Wachovia Securities, LLC | | Christopher Haley | | (443) 263-6773 | | christopher.haley@wachovia.com |
SL Green Realty Corp. is followed by the analysts listed above. Please note that any opinions, estimates or forecasts regarding SL Green Realty Corp.’s performance made by these analysts are theirs alone and do not represent opinions, forecasts or predictions of SL Green Realty Corp. or its management. SL Green Realty Corp. does not by its reference above or distribution imply its endorsement of or concurrence with such information, conclusions or recommendations.
46