Exhibit 99.2
SL Green Realty Corp.
First quarter
Supplemental Data
March 31, 2012
SL Green Realty Corp. is a fully integrated, self-administered and self-managed Real Estate Investment Trust, or REIT, that primarily acquires, owns, manages, leases and repositions office properties in emerging, high-growth submarkets of Manhattan.
· SL Green’s common stock is listed on the New York Stock Exchange, and trades under the symbol SLG.
· SL Green maintains an internet site at www.slgreen.com at which most key investor relations data pertaining to dividend declaration, payout, current and historic share price, etc. can be found. Such information is not incorporated into this supplemental financial package. This supplemental financial package is available through the Company’s internet site.
· This data is furnished to supplement audited and unaudited regulatory filings of the Company and should be read in conjunction with those filings. The financial data herein is unaudited and is provided from the perspective of timeliness to assist readers of quarterly and annual financial filings. As such, data otherwise contained in future regulatory filings covering the same period may restate the data presented herein.
Questions pertaining to the information contained herein should be referred to Investor Relations at investor.relations@slgreen.com or at 212-216-1601.
Forward-looking Statement
This press release contains “forward-looking statements” within the meaning of Section 27A of the Securities Act of 1933, as amended, and Section 21E of the Securities Exchange Act of 1934, as amended. All statements other than statements of historical facts included in this press release are forward-looking statements. All forward-looking statements speak only as of the date of this press release. Such forward-looking statements involve known and unknown risks, uncertainties and other factors that may cause the actual results, performance, achievements or transactions of the Company to be materially different from any future results, performance, achievements or transactions expressed or implied by such forward-looking statements. Such risks, uncertainties and other factors relate to, among others, the strength of the commercial office real estate markets in the New York metro area, reduced demand for office space, unanticipated increases in financing and other costs, competitive market conditions, unanticipated administrative costs, divergent interests from or the financial condition of our joint venture partners, timing of leasing income, general and local economic conditions, interest rates, capital market conditions, tenant bankruptcies and defaults, the availability and cost of comprehensive insurance, including coverage for terrorist acts, environmental, regulatory and/or safety requirements, and other factors, all of which are beyond the Company’s control. Additional information or factors that could affect the Company and the forward-looking statements contained herein are included in the Company’s filings with the Securities and Exchange Commission.
2
The Company assumes no obligation to update or supplement forward-looking statements that become untrue because of subsequent events.
Ratings
Ratings are not recommendations to buy, sell or hold the Company’s securities.
The following discussion related to the consolidated financial statements of the Company should be read in conjunction with the financial statements for the quarter ended March 31, 2012 that will be released on Form 10-Q to be filed on or before May 10, 2012.
3
TABLE OF CONTENTS | 
|
Highlights of Current Period Financial Performance | | |
| | |
Unaudited Financial Statements | | |
Corporate Profile | | 5 |
Highlights | | 6-13 |
Comparative Balance Sheets | | 14-15 |
Comparative Statements of Operations | | 16 |
Comparative Computation of FFO and FAD | | 17 |
Consolidated Statement of Equity | | 18 |
Joint Venture Statements | | 19-20 |
| | |
Selected Financial Data | | 21-24 |
Debt Summary Schedule | | 25-27 |
Summary of Ground Lease Arrangements | | 28 |
| | |
Debt and Preferred Equity Investments | | 29-31 |
| | |
Selected Property Data | | |
Composition of Property Portfolio | | 32-35 |
Largest Tenants | | 36 |
Tenant Diversification | | 37 |
Leasing Activity Summary | | 38-41 |
Annual Lease Expirations | | 42-43 |
| | |
Summary of Real Estate Acquisition/Disposition Activity | | 44-46 |
Corporate Information | | 47 |
Analyst Coverage | | 48 |
Supplemental Definitions | | 49 |
4
CORPORATE PROFILE |
|
SL Green Realty Corp., or the Company, is New York City’s largest commercial office landlord and is the only fully integrated, self-managed, self-administered Real Estate Investment Trust, or REIT, primarily focused on owning and operating office buildings in Manhattan.
The Company was formed on August 20, 1997 to continue the commercial real estate business of S.L. Green Properties Inc., a company that was founded in 1980 by Stephen L. Green, our current Chairman. For more than 25 years SL Green has been engaged in the business of owning, managing, leasing, acquiring and repositioning office properties in Manhattan. The Company’s investment focus is to create value through strategically acquiring, redeveloping and repositioning office properties primarily located in Manhattan, and re-leasing and managing these properties for maximum cash flow.
In 2007, SL Green acquired Reckson Associates Realty Corp. and added over 9 million square feet to its portfolio. Included in this total is over 3 million square feet of Class A office space located in Westchester, New York and Stamford, Connecticut. These suburban portfolios serve as natural extensions of SL Green’s core ownership in the Grand Central submarket of Midtown Manhattan. The Company has since made selective additions and dispositions to the holdings in these areas.
Looking forward, SL Green plans to continue its opportunistic investment philosophy through three established business lines: investment in long-term core properties, investment in opportunistic assets, and debt and preferred equity investments. This three-legged investment strategy allows SL Green to balance the components of its portfolio to take advantage of each stage in the business cycle.
5
FIRST QUARTER 2012 HIGHLIGHTS UNAUDITED |
|
Summary
New York, NY, April 25, 2012 — SL Green Realty Corp. (NYSE: SLG) today reported funds from operations, or FFO, of $99.3 million, or $1.10 per diluted share, for the quarter ended March 31, 2012, compared to $142.8 million, or $1.75 per diluted share, for the same quarter in 2011. The comparable results reflect the issuance of $660.5 million of common equity since the first quarter of 2011 as well as a one-time gain recognized in the first quarter of 2011 on the sale of interests in the mezzanine debt at 280 Park Avenue.
Net income attributable to common stockholders totaled $25.3 million, or $0.29 per diluted share, for the quarter ended March 31, 2012, compared to $80.9 million, or $1.01 per diluted share, for the same quarter in 2011.
Operating and Leasing Activity
For the first quarter of 2012, the Company reported revenues and operating income of $339.2 million and $182.1 million, respectively, compared to $329.2 million and $209.9 million, respectively, for the same period in 2011.
Same-store cash NOI on a combined basis increased by 6.2 percent to $172.0 million for 2012, after giving consideration to 1515 Broadway and 521 Fifth Avenue as consolidated properties, as compared to 2011. Consolidated property cash NOI increased by 6.4 percent to $145.7 million and unconsolidated joint venture property cash NOI increased 4.9 percent to $26.3 million.
Same-store GAAP NOI on a combined basis increased by 0.8 percent to $197.5 million for 2012, after giving consideration to 1515 Broadway and 521 Fifth Avenue as consolidated properties, as compared to 2011. Consolidated property GAAP NOI decreased by 0.6 percent to $167.4 million and unconsolidated joint venture property GAAP NOI increased 9.9 percent to $30.1 million.
Occupancy for the Company’s stabilized, same-store Manhattan portfolio at March 31, 2012 was 93.4 percent as compared to 93.1 percent at March 31, 2011. During the quarter, the Company signed 64 office leases in its Manhattan portfolio totaling 674,983 square feet. Twenty one leases totaling 157,433 square feet represented office leases that replaced previous vacancy, and 43 office leases comprising 517,550 square feet had average starting rents of $69.71 per rentable square foot, representing a 32.3 percent increase over the previously fully escalated rents on the same office spaces, which was largely driven by the 361,044 square foot lease with Random House, Inc. at 1745 Broadway. The average lease term on the Manhattan office leases signed in the first quarter was 6.3 years and average tenant concessions were 1.1 months of free rent with a tenant improvement allowance of $17.87 per rentable square foot. Of the 734,218 square feet of office leases which commenced during the first quarter, 194,731 square feet represented office leases that replaced previous vacancy, and 539,487 square feet represented office leases that had average starting rents of $69.81 per rentable square foot, representing a 31.4 percent increase over the previously fully escalated rents on the same office spaces.
Occupancy for the Company’s Suburban portfolio was 86.4 percent at March 31, 2012, as compared to 86.3 percent at March 31, 2011. Excluding the One Court Square office property, which is in contract for sale, the Company’s Suburban portfolio occupancy would be 82.9 percent at March 31, 2012, as compared to 82.7 percent at March 31, 2011.
6
FIRST QUARTER 2012 HIGHLIGHTS UNAUDITED |
|
During the quarter, the Company signed 32 office leases in the Suburban portfolio totaling 128,236 square feet. Nine leases totaling 22,577 square feet represented office leases that replaced previous vacancy, and 23 office leases comprising 105,659 square feet had average starting rents of $33.72 per rentable square foot, representing a 4.6 percent decrease over the previously fully escalated rents on the same office spaces. The average lease term on the Suburban office leases signed in the first quarter was 3.1 years and average tenant concessions were 1.1 months of free rent with a tenant improvement allowance of $5.33 per rentable square foot. Of the 145,978 square feet of office leases which commenced during the first quarter, 39,641 square feet represented office leases that replaced previous vacancy, and 106,337 square feet represented office leases that had average starting rents of $33.74 per rentable square foot, representing a 4.6 percent decrease over the previously fully escalated rents on the same office spaces.
Significant leases that were signed during the first quarter included:
· Early renewal on 361,044 square feet with Random House, Inc. for 5 years at 1745 Broadway bringing the total remaining lease term to 10 years;
· New lease on 30,653 square feet with Jazz at Lincoln Center, Inc. for 15.8 years at 3 Columbus Circle;
· Early renewal on 23,230 square feet with FTI Consulting, Inc. for 9 years at 750 Third Avenue;
· New lease on 22,363 square feet with Titan Outdoor LLC for 10.5 years at 100 Park Avenue; and
· Early renewal on 26,065 square feet with State Bank of Long Island for 1.5 years at Jericho Plaza, Long Island.
Marketing, general and administrative, or MG&A, expenses for the quarter ended March 31, 2012 were $20.2 million, or 5.2 percent of total revenues including the Company’s share of joint venture revenue compared to $20.0 million, or 5.2 percent for the quarter ended March 31, 2011.
Real Estate Investment Activity
In February 2012, the Company acquired the 390,000 square-foot office building located at 10 East 53rd Street through a joint venture with CPPIB for $252.5 million, or $647 per square foot.
In January 2012, SL Green, along with its joint venture partner Jeff Sutton, acquired 724 Fifth Avenue for $223.0 million. The anchor tenant in this 65,010 square foot property is Prada.
In January 2012, SL Green, along with its joint venture partner Stonehenge Partners, acquired five retail and two multifamily properties in Manhattan for total consideration of $193.1 million.
In February 2012, SL Green sold the leased fee interest at 292 Madison Avenue for $85.0 million. The transaction included assumption by the purchaser of $59.1 million of existing debt. SL Green recognized a gain on the sale of $6.6 million.
In February 2012, SL Green, along with its joint venture partner, Jeff Sutton, sold its two retail condominium units at 141 Fifth Avenue for $46.0 million. The transaction included the assumption by the purchaser of $25.0 million of existing debt. SL Green recognized a gain on the sale of $7.3 million.
In March 2012, SL Green, along with its joint venture partner, entered into an agreement to sell 379 West Broadway for $48.5 million, inclusive of the fee position.
7
FIRST QUARTER 2012 HIGHLIGHTS UNAUDITED |
|
In April 2012, SL Green, along with its joint venture partner, modified the agreement to sell One Court Square to provide the purchaser an extension of the closing date in exchange for an increase in the gross sale price to $478.1 million. The transaction, which includes the assumption by the purchaser of $315.0 million of existing debt, is expected to close in the second quarter.
Debt and Preferred Equity Investment Activity
The Company’s debt and preferred equity investment portfolio totaled $1.0 billion at March 31, 2012. During the first quarter, the Company purchased and originated new debt and preferred equity investments totaling $70.5 million, all of which are directly collateralized by New York City commercial office properties, and received $57.6 million of principal reductions from investments that were sold or repaid. The debt and preferred equity investment portfolio had a weighted average maturity of 3.1 years as of March 31, 2012 and had a weighted average yield for the quarter ended March 31, 2012 of 9.0 percent, exclusive of loans with a net carrying value of $25.2 million, which are on non-accrual status.
Financing and Capital Activity
In the first quarter of 2012, SL Green sold 2.9 million shares of common stock for aggregate gross proceeds of $225.0 million ($222.6 million of net proceeds after related expenses). In 2012 to date, SL Green sold 3.7 million shares of common stock for gross proceeds of $281.8 million ($278.5 million of net proceeds after related expenses). The Company’s existing ATM plan has $68.2 million of remaining sales capacity.
In March 2012, SL Green repaid approximately $102.2 million of its 3.0% exchangeable senior notes due 2027 pursuant to the holders’ scheduled put option. Approximately $18.0 million of these notes remain outstanding.
In January 2012, SL Green, along with its joint venture partner Stonehenge Partners, closed on two 7-year mortgage financings totaling $100.0 million in connection with the acquisition of two residential properties. These mortgages bear a fixed interest rate of 4.125%. In addition, the retail property located at 762 Madison Avenue, which was also acquired by the joint venture, was partially financed with a 5-year, $8.5 million mortgage loan which bears a fixed interest rate of 3.75%.
In February 2012, SL Green, along with its joint venture partner Jeff Sutton, closed on a 5-year $120.0 million mortgage in connection with the acquisition of 724 Madison Avenue. The mortgage bears interest at 235 basis points over the 30-day LIBOR.
In February 2012, SL Green, along with its joint venture partner, CPPIB, closed on a 5-year $125.0 million mortgage in connection with the acquisition of 10 East 53rd Street. The mortgage bears interest at 250 basis points over the 30-day LIBOR.
8
FIRST QUARTER 2012 HIGHLIGHTS UNAUDITED |
|
Dividends
During the first quarter of 2012, the Company declared quarterly dividends on its outstanding common and preferred stock as follows:
· $0.25 per share of common stock, which was paid on April 13, 2012 to stockholders of record on the close of business on March 30, 2012; and
· $0.4766 and $0.4922 per share on the Company’s Series C and D Preferred Stock, respectively, for the period January 15, 2012 through and including April 14, 2012, which were paid on April 13, 2012 to stockholders of record on the close of business on March 30, 2012, and reflect regular quarterly dividends which are the equivalent of annualized dividends of $1.9064 and $1.9688, respectively.
9
SL Green Realty Corp. | 
|
Key Financial Data |
March 31, 2012 |
(Amounts in Thousands Except Ratios, Percentages, Per Share and Sq. Ft.) |
| | As of or for the three months ended | |
| | 3/31/2012 | | 12/31/2011 | | 9/30/2011 | | 6/30/2011 | | 3/31/2011 | |
| | | | | | | | | | | |
Earnings Per Share | | | | | | | | | | | |
Net income (loss) available to common stockholders - diluted | | $ | 0.29 | | $ | 0.03 | | $ | 0.08 | | $ | 6.26 | | $ | 1.01 | |
Funds from operations available to common stockholders - diluted | | $ | 1.10 | | $ | 1.02 | | $ | 1.00 | | $ | 1.08 | | $ | 1.75 | |
Funds available for distribution to common stockholders - diluted | | $ | 0.87 | | $ | 0.52 | | $ | 0.44 | | $ | 0.57 | | $ | 1.07 | |
| | | | | | | | | | | |
Common Share Price & Dividends | | | | | | | | | | | |
At the end of the period | | $ | 77.55 | | $ | 66.64 | | $ | 58.15 | | $ | 82.87 | | $ | 75.20 | |
High during period | | $ | 79.27 | | $ | 71.33 | | $ | 87.54 | | $ | 90.01 | | $ | 75.63 | |
Low during period | | $ | 68.16 | | $ | 55.14 | | $ | 58.15 | | $ | 74.72 | | $ | 66.96 | |
Common dividends per share | | $ | 0.25 | | $ | 0.25 | | $ | 0.10 | | $ | 0.10 | | $ | 0.10 | |
| | | | | | | | | | | |
FFO payout ratio | | 22.7 | % | 24.6 | % | 10.0 | % | 9.3 | % | 5.7 | % |
FAD payout ratio | | 28.6 | % | 47.9 | % | 22.9 | % | 17.4 | % | 9.4 | % |
| | | | | | | | | | | |
Common Shares & Units | | | | | | | | | | | |
Common shares outstanding | | 88,855 | | 86,045 | | 85,969 | | 84,559 | | 80,925 | |
Units outstanding | | 3,051 | | 2,765 | | 1,910 | | 1,912 | | 1,912 | |
Total common shares and units outstanding | | 91,906 | | 88,810 | | 87,879 | | 86,471 | | 82,837 | |
| | | | | | | | | | | |
Weighted average common shares and units outstanding - basic | | 89,792 | | 88,326 | | 87,608 | | 85,490 | | 81,206 | |
Weighted average common shares and units outstanding - diluted | | 90,173 | | 88,744 | | 88,081 | | 86,010 | | 81,643 | |
| | | | | | | | | | | |
Market Capitalization | | | | | | | | | | | |
Market value of common equity | | $ | 7,127,310 | | $ | 5,918,298 | | $ | 5,110,164 | | $ | 7,165,852 | | $ | 6,229,342 | |
Liquidation value of preferred equity/units | | 442,050 | | 392,500 | | 392,500 | | 392,500 | | 392,500 | |
Consolidated debt | | 6,081,046 | | 6,094,696 | | 5,886,440 | | 5,597,585 | | 5,020,380 | |
Consolidated market capitalization | | $ | 13,650,406 | | $ | 12,405,494 | | $ | 11,389,104 | | $ | 13,155,937 | | $ | 11,642,222 | |
SLG portion of JV debt | | 1,940,840 | | 1,824,515 | | 1,823,611 | | 1,783,078 | | 1,670,792 | |
Combined market capitalization | | $ | 15,591,246 | | $ | 14,230,009 | | $ | 13,212,715 | | $ | 14,939,015 | | $ | 13,313,014 | |
| | | | | | | | | | | |
Consolidated debt to market capitalization | | 44.5 | % | 49.1 | % | 51.7 | % | 42.5 | % | 43.1 | % |
Combined debt to market capitalization | | 51.5 | % | 55.7 | % | 58.4 | % | 49.4 | % | 50.3 | % |
| | | | | | | | | | | |
Consolidated debt service coverage | | 2.1 | | 2.2 | | 2.2 | | 2.3 | | 2.9 | |
Consolidated fixed charge coverage | | 1.8 | | 1.8 | | 1.8 | | 2.0 | | 2.4 | |
Combined fixed charge coverage | | 1.6 | | 1.7 | | 1.6 | | 1.8 | | 2.1 | |
Supplemental Information | | First Quarter 2012 |
10
SL Green Realty Corp. | 
|
Key Financial Data |
March 31, 2012 |
(Dollars in Thousands Except Per Share and Sq. Ft.) |
| | As of or for the three months ended | |
| | 3/31/2012 | | 12/31/2011 | | 9/30/2011 | | 6/30/2011 | | 3/31/2011 | |
| | | | | | | | | | | |
Selected Balance Sheet Data | | | | | | | | | | | |
Real estate assets before depreciation | | $ | 11,338,420 | | $ | 11,202,854 | | $ | 10,619,202 | | $ | 10,609,660 | | $ | 9,377,934 | |
Investments in unconsolidated joint ventures | | $ | 1,022,931 | | $ | 893,933 | | $ | 921,146 | | $ | 896,632 | | $ | 916,600 | |
Debt and Preferred Equity Investments | | $ | 999,573 | | $ | 985,942 | | $ | 897,028 | | $ | 582,418 | | $ | 579,287 | |
Cash and cash equivalents | | $ | 133,665 | | $ | 138,192 | | $ | 394,505 | | $ | 390,229 | | $ | 234,009 | |
Investment in marketable securities | | $ | 25,689 | | $ | 25,323 | | $ | 54,962 | | $ | 55,366 | | $ | 64,440 | |
| | | | | | | | | | | |
Total assets | | $ | 13,761,713 | | $ | 13,483,852 | | $ | 13,162,645 | | $ | 12,644,078 | | $ | 11,442,366 | |
| | | | | | | | | | | |
Fixed rate & hedged debt | | $ | 4,773,768 | | $ | 4,832,209 | | $ | 4,750,111 | | $ | 4,458,109 | | $ | 4,117,683 | |
Variable rate debt | | 1,307,278 | | 1,262,487 | | 1,136,329 | | 1,139,476 | | 781,074 | |
Total consolidated debt | | $ | 6,081,046 | | $ | 6,094,696 | | $ | 5,886,440 | | $ | 5,597,585 | | $ | 4,898,757 | |
| | | | | | | | | | | |
Total liabilities | | $ | 6,822,003 | | $ | 6,833,513 | | $ | 6,635,292 | | $ | 6,224,415 | | $ | 5,682,787 | |
| | | | | | | | | | | |
Fixed rate & hedged debt - including SLG portion of JV debt | | $ | 6,105,516 | | $ | 6,176,764 | | $ | 6,094,873 | | $ | 5,814,931 | | $ | 5,100,904 | |
Variable rate debt - including SLG portion of JV debt | | 1,916,370 | | 1,742,447 | | 1,615,178 | | 1,565,732 | | 1,468,645 | |
Total combined debt | | $ | 8,021,886 | | $ | 7,919,211 | | $ | 7,710,051 | | $ | 7,380,663 | | $ | 6,569,549 | |
| | | | | | | | | | | |
Selected Operating Data | | | | | | | | | | | |
Property operating revenues | | $ | 302,477 | | $ | 294,495 | | $ | 282,114 | | $ | 273,629 | | $ | 257,295 | |
Property operating expenses | | (133,573 | ) | (126,223 | ) | (122,471 | ) | (114,183 | ) | (108,199 | ) |
Property operating NOI | | $ | 168,904 | | $ | 168,272 | | $ | 159,643 | | $ | 159,446 | | $ | 149,096 | |
NOI from discontinued operations | | 519 | | 1,945 | | 1,946 | | 2,785 | | 4,202 | |
Total property operating NOI - consolidated | | $ | 169,423 | | $ | 170,217 | | $ | 161,589 | | $ | 162,231 | | $ | 153,298 | |
SLG share of property NOI from JVs | | 38,704 | | 36,792 | | 37,532 | | 38,690 | | 41,878 | |
Total property operating NOI - combined | | $ | 208,127 | | $ | 207,009 | | $ | 199,121 | | $ | 200,921 | | $ | 195,176 | |
Debt and preferred equity investment income | | 26,338 | | 22,162 | | 18,433 | | 15,144 | | 64,678 | |
Other income | | 10,377 | | 12,222 | | 6,076 | | 9,932 | | 7,248 | |
Marketing general & administrative expenses | | (20,196 | ) | (18,728 | ) | (18,900 | ) | (22,454 | ) | (20,021 | ) |
EBITDA - combined | | $ | 224,646 | | $ | 222,665 | | $ | 204,730 | | $ | 203,543 | | $ | 247,081 | |
| | | | | | | | | | | |
Consolidated Debt to EBITDA (trailing-12 months) | | 8.4 | | 8.2 | | 8.0 | | 7.2 | | 6.8 | |
Combined Debt to EBITDA (trailing-12 months) | | 9.2 | | 8.8 | | 8.6 | | 7.8 | | 7.3 | |
11
SL Green Realty Corp. | 
|
Key Financial Data |
March 31, 2012 |
(Dollars in Thousands Except Per Share and Sq. Ft.) |
Manhattan Properties
| | As of or for the three months ended | |
| | 3/31/2012 | | 12/31/2011 | | 9/30/2011 | | 6/30/2011 | | 3/31/2011 | |
| | | | | | | | | | | |
Selected Operating Data (Manhattan) | | | | | | | | | | | |
Property operating revenues | | $ | 277,231 | | $ | 267,730 | | $ | 255,779 | | $ | 246,645 | | $ | 227,994 | |
Property operating expenses | | 117,869 | | 106,609 | | 106,716 | | 97,723 | | 91,776 | |
Property operating NOI | | $ | 159,362 | | $ | 161,121 | | $ | 149,063 | | $ | 148,922 | | $ | 136,218 | |
NOI from discontinued operations | | 519 | | 1,945 | | 1,946 | | 2,785 | | 4,202 | |
Total property operating NOI - consolidated | | $ | 159,881 | | $ | 163,066 | | $ | 151,009 | | $ | 151,707 | | $ | 140,420 | |
| | | | | | | | | | | |
Other income - consolidated | | $ | 3,011 | | $ | 2,263 | | $ | 863 | | $ | 1,784 | | $ | 1,808 | |
| | | | | | | | | | | |
SLG share of property NOI from unconsolidated JV | | $ | 34,418 | | $ | 32,300 | | $ | 31,386 | | $ | 34,026 | | $ | 37,456 | |
| | | | | | | | | | | |
Portfolio Statistics (Manhattan) | | | | | | | | | | | |
Consolidated operating office buildings | | 26 | | 26 | | 24 | | 24 | | 23 | |
Unconsolidated operating office buildings | | 7 | | 7 | | 7 | | 7 | | 7 | |
| | 33 | | 33 | | 31 | | 31 | | 30 | |
| | | | | | | | | | | |
Consolidated operating office buildings square footage | | 18,429,945 | | 18,429,945 | | 17,197,945 | | 17,197,945 | | 15,601,945 | |
Unconsolidated operating office buildings square footage | | 5,326,815 | | 6,191,673 | | 6,191,673 | | 6,191,673 | | 6,722,515 | |
| | 23,756,760 | | 24,621,618 | | 23,389,618 | | 23,389,618 | | 22,324,460 | |
| | | | | | | | | | | |
Quarter end occupancy- same store - combined office (consolidated + joint venture) | | 93.4 | % | 93.0 | % | 93.5 | % | 93.4 | % | 93.1 | % |
| | | | | | | | | | | |
Office Leasing Statistics (Manhattan) | | | | | | | | | | | |
Total office leases commenced | | 54 | | 49 | | 41 | | 46 | | 63 | |
Total office square footage commenced | | 734,218 | | 412,704 | | 544,836 | | 359,583 | | 703,023 | |
| | | | | | | | | | | |
Average rent psf — leases commenced | | $ | 69.81 | | $ | 63.11 | | $ | 49.37 | | $ | 59.91 | | $ | 48.20 | |
Previously escalated rents psf | | $ | 53.14 | | $ | 58.64 | | $ | 47.47 | | $ | 56.25 | | $ | 47.75 | |
Percentage of new rent over previously escalated rents (1) | | 31.4 | % | 7.6 | % | 4.0 | % | 6.5 | % | 0.9 | % |
Tenant concession packages psf | | $ | 22.41 | | $ | 22.82 | | $ | 37.74 | | $ | 36.49 | | $ | 23.54 | |
Free rent months | | 2.1 | | 2.5 | | 4.8 | | 3.4 | | 3.5 | |
(1) Calculated on space that was occupied within the previous 12 months
12
SL Green Realty Corp. | 
|
Key Financial Data |
March 31, 2012 |
(Dollars in Thousands Except Per Share and Sq. Ft.) |
Suburban Properties
| | As of or for the three months ended | |
| | 3/31/2012 | | 12/31/2011 | | 9/30/2011 | | 6/30/2011 | | 3/31/2011 | |
| | | | | | | | | | | |
Selected Operating Data (Suburban) | | | | | | | | | | | |
Property operating revenues | | $ | 26,038 | | $ | 25,515 | | $ | 25,061 | | $ | 25,653 | | $ | 28,002 | |
Property operating expenses | | 12,633 | | 14,872 | | 12,193 | | 13,183 | | 13,001 | |
Property operating NOI | | $ | 13,405 | | $ | 10,643 | | $ | 12,868 | | $ | 12,470 | | $ | 15,001 | |
NOI from discontinued operations | | — | | — | | — | | — | | — | |
Total property operating NOI - consolidated | | $ | 13,405 | | $ | 10,643 | | $ | 12,868 | | $ | 12,470 | | $ | 15,001 | |
| | | | | | | | | | | |
Other income - consolidated | | $ | 607 | | $ | 459 | | $ | 399 | | $ | 342 | | $ | 1,323 | |
| | | | | | | | | | | |
SLG share of property NOI from unconsolidated JV | | $ | 4,287 | | $ | 4,448 | | $ | 6,147 | | $ | 4,665 | | $ | 4,422 | |
| | | | | | | | | | | |
Portfolio Statistics (Suburban) | | | | | | | | | | | |
Consolidated operating office buildings | | 25 | | 25 | | 25 | | 25 | | 25 | |
Unconsolidated operating office buildings | | 6 | | 6 | | 6 | | 6 | | 6 | |
| | 31 | | 31 | | 31 | | 31 | | 31 | |
| | | | | | | | | | | |
Consolidated operating office buildings square footage | | 3,863,000 | | 3,863,000 | | 3,863,000 | | 3,863,000 | | 3,863,000 | |
Unconsolidated operating office buildings square footage | | 2,941,700 | | 2,941,700 | | 2,941,700 | | 2,941,700 | | 2,941,700 | |
| | 6,804,700 | | 6,804,700 | | 6,804,700 | | 6,804,700 | | 6,804,700 | |
| | | | | | | | | | | |
Quarter end occupancy- same store - combined office (consolidated + joint venture) | | 86.4 | % | 86.2 | % | 85.9 | % | 86.4 | % | 86.3 | % |
| | | | | | | | | | | |
Office Leasing Statistics (Suburban) | | | | | | | | | | | |
Total office leases commenced | | 32 | | 29 | | 17 | | 36 | | 32 | |
Total office square footage commenced | | 145,978 | | 84,332 | | 124,158 | | 180,505 | | 139,793 | |
| | | | | | | | | | | |
Average rent psf — leases commenced | | $ | 33.74 | | $ | 31.13 | | $ | 38.49 | | $ | 31.67 | | $ | 33.50 | |
Previously escalated rents psf | | $ | 35.36 | | $ | 33.72 | | $ | 37.85 | | $ | 33.10 | | $ | 34.62 | |
Percentage of new rent over previously escalated rents (1) | | -4.6 | % | -7.7 | % | 1.7 | % | -4.3 | % | -3.2 | % |
Tenant concession packages psf | | $ | 8.62 | | $ | 18.94 | | $ | 19.54 | | $ | 14.96 | | $ | 18.65 | |
Free rent months | | 2.0 | | 2.2 | | 12.0 | | 3.2 | | 4.7 | |
(1) Calculated on space that was occupied within the previous 12 months
13
COMPARATIVE BALANCE SHEETS | 
|
|
Unaudited |
($000’s omitted) |
| | 3/31/2012 | | 12/31/2011 | | 9/30/2011 | | 6/30/2011 | | 3/31/2011 | |
Assets | | | | | | | | | | | |
Commercial real estate properties, at cost: | | | | | | | | | | | |
Land & land interests | | 2,816,831 | | 2,684,626 | | 2,581,957 | | 2,472,584 | | 1,974,994 | |
Buildings & improvements fee interest | | 7,191,889 | | 7,147,527 | | 6,731,915 | | 6,835,204 | | 5,754,193 | |
Buildings & improvements leasehold | | 1,317,492 | | 1,302,790 | | 1,293,122 | | 1,289,664 | | 1,520,150 | |
Buildings & improvements under capital lease | | 12,208 | | 12,208 | | 12,208 | | 12,208 | | 12,208 | |
| | 11,338,420 | | 11,147,151 | | 10,619,202 | | 10,609,660 | | 9,261,545 | |
Less accumulated depreciation | | (1,202,507 | ) | (1,136,603 | ) | (1,071,183 | ) | (1,008,064 | ) | (953,993 | ) |
| | $ | 10,135,913 | | $ | 10,010,548 | | $ | 9,548,019 | | $ | 9,601,596 | | $ | 8,307,552 | |
Other real estate investments: | | | | | | | | | | | |
Investment in and advances to unconsolidated joint ventures | | 1,022,931 | | 893,933 | | 921,146 | | 896,632 | | 916,600 | |
Debt and Preferred Equity Investments, net | | 999,573 | | 985,942 | | 897,028 | | 582,418 | | 579,287 | |
| | | | | | | | | | | |
Assets held for sale, net | | — | | 76,562 | | — | | — | | 104,808 | |
Cash and cash equivalents | | 133,665 | | 138,192 | | 394,505 | | 390,229 | | 234,009 | |
Restricted cash | | 98,563 | | 86,584 | | 102,084 | | 85,370 | | 107,835 | |
Investment in marketable securities | | 25,689 | | 25,323 | | 54,962 | | 55,366 | | 64,440 | |
Tenant and other receivables, net of $19,605 reserve at 3/31/12 | | 29,020 | | 32,107 | | 31,661 | | 28,452 | | 26,314 | |
Related party receivables | | 7,665 | | 4,001 | | 3,212 | | 2,579 | | 3,653 | |
Deferred rents receivable, net of reserve for tenant credit loss of $30,611 at 3/31/12 | | 300,419 | | 281,974 | | 265,600 | | 244,008 | | 223,552 | |
Deferred costs, net | | 211,728 | | 210,786 | | 191,123 | | 182,241 | | 180,712 | |
Other assets | | 796,547 | | 737,900 | | 753,305 | | 575,187 | | 693,604 | |
| | | | | | | | | | | |
Total Assets | | $ | 13,761,713 | | $ | 13,483,852 | | $ | 13,162,645 | | $ | 12,644,078 | | $ | 11,442,366 | |
14
COMPARATIVE BALANCE SHEETS | 
|
|
Unaudited |
($000’s omitted) |
| | 3/31/2012 | | 12/31/2011 | | 9/30/2011 | | 6/30/2011 | | 3/31/2011 | |
Liabilities | | | | | | | | | | | |
Mortgages & other loans payable | | $ | 4,409,715 | | $ | 4,314,741 | | $ | 4,018,861 | | $ | 3,978,345 | | $ | 3,280,084 | |
Senior unsecured notes | | 1,171,331 | | 1,270,656 | | 1,267,580 | | 1,019,240 | | 1,018,674 | |
Revolving credit facility | | 400,000 | | 350,000 | | 500,000 | | 500,000 | | 500,000 | |
Accrued interest and other liabilities | | 116,498 | | 126,135 | | 126,405 | | 102,710 | | 150,895 | |
Accounts payable and accrued expenses | | 137,500 | | 142,428 | | 146,445 | | 130,735 | | 123,728 | |
Deferred revenue | | 373,573 | | 357,193 | | 381,211 | | 300,093 | | 294,634 | |
Capitalized lease obligations | | 17,130 | | 17,112 | | 17,094 | | 17,077 | | 17,060 | |
Deferred land lease payable | | 18,608 | | 18,495 | | 18,382 | | 18,322 | | 18,318 | |
Dividends and distributions payable | | 29,652 | | 28,398 | | 15,002 | | 14,861 | | 14,563 | |
Security deposits | | 47,996 | | 46,367 | | 44,312 | | 43,032 | | 43,196 | |
Liabilities related to assets held for sale | | — | | 61,988 | | — | | — | | 121,635 | |
Junior subordinated deferrable interest debentures | | 100,000 | | 100,000 | | 100,000 | | 100,000 | | 100,000 | |
Total liabilities | | $ | 6,822,003 | | $ | 6,833,513 | | $ | 6,635,292 | | $ | 6,224,415 | | $ | 5,682,787 | |
| | | | | | | | | | | |
Noncontrolling interest in operating partnership (3,051 units outstanding) at 3/31/12 | | 237,763 | | 195,030 | | 114,726 | | 158,418 | | 143,756 | |
Series G Preferred Units | | 47,550 | | — | | — | | — | | — | |
Series H Preferred Units | | 2,000 | | 2,000 | | — | | — | | — | |
| | | | | | | | | | | |
Equity | | | | | | | | | | | |
SL Green Realty Corp. Stockholders’ Equity: | | | | | | | | | | | |
Series C Perpetual Preferred Shares | | 274,022 | | 274,022 | | 274,022 | | 274,022 | | 274,022 | |
Series D Perpetual Preferred Shares | | 96,321 | | 96,321 | | 96,321 | | 96,321 | | 96,321 | |
Common stock, $.01 par value, 160,000 shares authorized, 92,460 issued and outstanding at 3/31/12 | | 925 | | 892 | | 892 | | 878 | | 844 | |
Additional paid—in capital | | 4,469,777 | | 4,236,959 | | 4,225,903 | | 4,105,442 | | 3,836,453 | |
Treasury stock (3,605 shares) at 3/31/12 | | (319,866 | ) | (308,708 | ) | (307,535 | ) | (307,419 | ) | (306,170 | ) |
Accumulated other comprehensive loss | | (24,376 | ) | (28,445 | ) | (24,462 | ) | (21,589 | ) | (13,011 | ) |
Retained earnings | | 1,665,547 | | 1,704,506 | | 1,763,403 | | 1,721,440 | | 1,207,504 | |
Total SL Green Realty Corp. stockholders’ equity | | 6,162,350 | | 5,975,547 | | 6,028,544 | | 5,869,095 | | 5,095,963 | |
| | | | | | | | | | | |
Noncontrolling interest in other partnerships | | 490,047 | | 477,762 | | 384,083 | | 392,150 | | 519,860 | |
| | | | | | | | | | | |
Total equity | | $ | 6,652,397 | | $ | 6,453,309 | | $ | 6,412,627 | | $ | 6,261,245 | | $ | 5,615,823 | |
| | | | | | | | | | | |
Total liabilities and equity | | $ | 13,761,713 | | $ | 13,483,852 | | $ | 13,162,645 | | $ | 12,644,078 | | $ | 11,442,366 | |
15
COMPARATIVE STATEMENTS OF OPERATIONS
Unaudited
($000’s omitted) | 
|
| | Three Months Ended | | Three Months Ended | | Three Months Ended | |
| | March 31, | | March 31, | | December 31, | | September 30, | |
| | 2012 | | 2011 | | 2011 | | 2011 | |
Revenues | | | | | | | | | |
Rental revenue, net | | $ | 260,814 | | $ | 227,020 | | $ | 253,343 | | $ | 242,938 | |
Escalation and reimbursement revenues | | 41,663 | | 30,275 | | 41,152 | | 39,176 | |
Investment income | | 26,338 | | 64,678 | | 22,162 | | 18,433 | |
Other income | | 10,377 | | 7,248 | | 12,222 | | 6,076 | |
Total Revenues, net | | 339,192 | | 329,221 | | 328,879 | | 306,623 | |
| | | | | | | | | |
Equity in net income (loss) from unconsolidated joint ventures | | (1,560 | ) | 8,206 | | (6,080 | ) | (2,728 | ) |
Gain (loss) on early extinguishment of debt | | — | | — | | — | | (67 | ) |
| | | | | | | | | |
Expenses | | | | | | | | | |
Operating expenses | | 73,269 | | 60,298 | | 71,916 | | 69,093 | |
Ground rent | | 8,806 | | 7,834 | | 8,810 | | 8,463 | |
Real estate taxes | | 51,498 | | 40,067 | | 45,497 | | 44,915 | |
Loan loss and other investment reserves, net of recoveries | | 564 | | (3,150 | ) | 8,592 | | — | |
Transaction related costs | | 1,151 | | 2,434 | | 1,741 | | 169 | |
Marketing, general and administrative | | 20,196 | | 20,021 | | 18,728 | | 18,900 | |
Total Operating Expenses | | 155,484 | | 127,504 | | 155,284 | | 141,540 | |
| | | | | | | | | |
Operating Income | | 182,148 | | 209,923 | | 167,515 | | 162,288 | |
| | | | | | | | | |
Interest expense, net of interest income | | 80,137 | | 64,266 | | 78,876 | | 74,603 | |
Amortization of deferred financing costs | | 3,580 | | 3,800 | | 4,649 | | 2,986 | |
Depreciation and amortization | | 77,083 | | 63,497 | | 74,951 | | 73,358 | |
Loss (gain) on equity investment in marketable securities | | — | | 127 | | (4,999 | ) | — | |
| | | | | | | | | |
Income from Continuing Operations | | 21,348 | | 78,233 | | 14,038 | | 11,341 | |
| | | | | | | | | |
Income (loss) from discontinued operations | | (78 | ) | 1,873 | | 1,115 | | 1,116 | |
Gain (loss) on sale of discontinued operations | | 6,627 | | — | | — | | — | |
Equity in net gain (loss) on sale of joint venture interest / real estate | | 7,260 | | — | | (114 | ) | 3,032 | |
Purchase price fair value adjustment | | — | | 13,788 | | 8,306 | | 999 | |
Depreciable real estate reserves | | — | | — | | (5,789 | ) | — | |
Net Income | | 35,157 | | 93,894 | | 17,556 | | 16,488 | |
| | | | | | | | | |
Net income attributable to noncontrolling interests | | (1,959 | ) | (5,462 | ) | (7,202 | ) | (1,864 | ) |
| | | | | | | | | |
Net Income (Loss) Attributable to SL Green Realty Corp | | 33,198 | | 88,432 | | 10,354 | | 14,624 | |
| | | | | | | | | |
Dividends on preferred units | | 397 | | — | | — | | — | |
Dividends on perpetual preferred shares | | 7,545 | | 7,545 | | 7,545 | | 7,545 | |
| | | | | | | | | |
Net Income (Loss) Attributable to Common Stockholders | | $ | 25,256 | | $ | 80,887 | | $ | 2,809 | | $ | 7,079 | |
| | | | | | | | | |
Earnings per Share | | | | | | | | | |
Net income (loss) per share (basic) | | $ | 0.29 | | $ | 1.02 | | $ | 0.03 | | $ | 0.08 | |
Net income (loss) per share (diluted) | | $ | 0.29 | | $ | 1.01 | | $ | 0.03 | | $ | 0.08 | |
16
COMPARATIVE COMPUTATION OF FFO AND FAD
Unaudited
($000’s omitted - except per share data) | 
|
| | Three Months Ended | | Three Months Ended | | Three Months Ended | |
| | March 31, | | March 31, | | December 31, | | September 30, | |
| | 2012 | | 2011 | | 2011 | | 2011 | |
Funds from operations | | | | | | | | | |
Net Income (Loss) Attributable to Common Stockholders | | $ | 25,256 | | $ | 80,887 | | $ | 2,809 | | $ | 7,079 | |
| | | | | | | | | |
Add: | Depreciation and amortization | | 77,083 | | 63,497 | | 74,951 | | 73,358 | |
| Discontinued operations depreciation adjustments | | — | | 676 | | — | | — | |
| Joint ventures depreciation and noncontrolling interests adjustments | | 9,141 | | 6,234 | | 8,005 | | 9,865 | |
| Net income attributable to noncontrolling interests | | 1,959 | | 5,462 | | 7,202 | | 1,864 | |
| Depreciable real estate reserves | | — | | — | | 5,789 | | — | |
Less: | Gain (loss) on sale of discontinued operations | | 6,627 | | — | | — | | — | |
| Equity in net gain (loss) on sale of joint venture property / real estate | | 7,260 | | — | | (114 | ) | 3,032 | |
| Purchase price fair value adjustment | | — | | 13,788 | | 8,306 | | 999 | |
| Non-real estate depreciation and amortization | | 267 | | 213 | | 255 | | 242 | |
| Funds From Operations | | $ | 99,285 | | $ | 142,755 | | $ | 90,309 | | $ | 87,893 | |
| | | | | | | | | | |
| Funds From Operations - Basic per Share | | $ | 1.11 | | $ | 1.76 | | $ | 1.02 | | $ | 1.00 | |
| | | | | | | | | | |
| Funds From Operations - Diluted per Share | | $ | 1.10 | | $ | 1.75 | | $ | 1.02 | | $ | 1.00 | |
| | | | | | | | | |
Funds Available for Distribution | | | | | | | | | |
FFO | | $ | 99,285 | | $ | 142,755 | | $ | 90,309 | | $ | 87,893 | |
| | | | | | | | | |
Add: | Non real estate depreciation and amortization | | 267 | | 213 | | 255 | | 242 | |
| Amortization of deferred financing costs | | 3,580 | | 3,800 | | 4,649 | | 2,986 | |
| Non-cash deferred compensation | | 8,662 | | 9,179 | | 17,987 | | 6,823 | |
Less: | FAD adjustment for Joint Ventures | | 2,810 | | 4,776 | | 192 | | 3,418 | |
| FAD adjustment for discontinued operations | | — | | 1,204 | | 1,265 | | 1,262 | |
| Straight-line rental income and other non cash adjustments | | 18,600 | | 51,501 | | 24,562 | | 21,206 | |
| Second cycle tenant improvements | | 1,934 | | 4,929 | | 19,979 | | 19,016 | |
| Second cycle leasing commissions | | 1,561 | | 4,798 | | 8,178 | | 5,503 | |
| Revenue enhancing recurring CAPEX | | 211 | | 587 | | 1,288 | | 1,464 | |
| Non-revenue enhancing recurring CAPEX | | 7,799 | | 1,058 | | 11,413 | | 7,639 | |
| | | | | | | | | |
Funds Available for Distribution | | $ | 78,879 | | $ | 87,094 | | $ | 46,323 | | $ | 38,436 | |
| Diluted per Share | | $ | 0.87 | | $ | 1.07 | | $ | 0.52 | | $ | 0.44 | |
| | | | | | | | | |
First cycle tenant improvements | | $ | 4,977 | | $ | 3,363 | | $ | 12,156 | | $ | 13,082 | |
First cycle leasing commissions | | $ | 377 | | $ | — | | $ | 5,184 | | $ | 2,820 | |
Redevelopment Costs | | $ | 7,682 | | $ | 1,609 | | $ | 9,942 | | $ | 7,786 | |
| | | | | | | | | |
Payout Ratio of Funds From Operations | | 22.7 | % | 5.7 | % | 24.6 | % | 10.0 | % |
Payout Ratio of Funds Available for Distribution | | 28.6 | % | 9.4 | % | 47.9 | % | 22.9 | % |
17
CONDENSED CONSOLIDATED STATEMENT OF EQUITY
Unaudited
($000’s omitted) | 
|
| | | | | | | | | | | | | | | | Accumulated | | | |
| | Series C | | Series D | | | | | | | | | | | | Other | | | |
| | Preferred | | Preferred | | Common | | Additional | | Treasury | | Retained | | Noncontrolling | | Comprehensive | | | |
| | Stock | | Stock | | Stock | | Paid-In Capital | | Stock | | Earnings | | Interests | | Income | | TOTAL | |
| | | | | | | | | | | | | | | | | | | |
Balance at December 31, 2011 | | $ | 274,022 | | $ | 96,321 | | $ | 892 | | $ | 4,236,959 | | $ | (308,708 | ) | $ | 1,704,506 | | $ | 477,762 | | $ | (28,445 | ) | $ | 6,453,309 | |
| | | | | | | | | | | | | | | | | | | |
Net Income attributable to SL Green | | | | | | | | | | | | 33,198 | | 1,071 | | | | 34,269 | |
Preferred Dividend | | | | | | | | | | | | (7,941 | ) | | | | | (7,941 | ) |
Cash distributions declared ($0.25 per common share) | | | | | | | | | | | | (22,280 | ) | | | | | (22,280 | ) |
Cash distributions to noncontrolling interests | | | | | | | | | | | | | | (7,117 | ) | | | (7,117 | ) |
Comprehensive Income - Unrealized loss on derivative instruments | | | | | | | | | | | | | | | | 503 | | 503 | |
Comprehensive Income - SLG share unrealized loss on derivative instruments of JVs | | | | | | | | | | | | | | | | 2,899 | | 2,899 | |
Comprehensive Income - Unrealized loss on marketable securities | | | | | | | | | | | | | | | | 667 | | 667 | |
Net proceeds from exercise of stock options | | | | | | 1 | | 2,570 | | | | | | | | | | 2,571 | |
Redemption of units and dividend reinvestment proceeds | | | | | | 13 | | 99,780 | | | | | | | | | | 99,793 | |
Consolidation of joint venture | | | | | | | | | | | | | | 18,331 | | | | 18,331 | |
Reallocation of noncontrolling interests in the operating partnership | | | | | | | | | | | | (41,936 | ) | | | | | (41,936 | ) |
Issuance of common stock | | | | | | 16 | | 122,937 | | | | | | | | | | 122,953 | |
Deferred compensation plan | | | | | | 3 | | 470 | | (11,158 | ) | | | | | | | (10,685 | ) |
Amortization of deferred compensation | | | | | | | | 7,061 | | | | | | | | | | 7,061 | |
Balance at March 31, 2012 | | $ | 274,022 | | $ | 96,321 | | $ | 925 | | $ | 4,469,777 | | $ | (319,866 | ) | $ | 1,665,547 | | $ | 490,047 | | $ | (24,376 | ) | $ | 6,652,397 | |
|
RECONCILIATION OF SHARES AND UNITS OUTSTANDING, AND DILUTION COMPUTATION |
|
| | Common Stock | | OP Units | | Stock-Based
Compensation | | Sub-total | | Preferred Stock | | Diluted Shares | |
| | | | | | | | | | | | | |
Share Count at December 31, 2011 | | 86,045,684 | | 2,764,737 | | | | 88,810,421 | | — | | 88,810,421 | |
| | | | | | | | | | | | | |
YTD share activity | | 2,808,878 | | 285,805 | | | | 3,094,683 | | | | 3,094,683 | |
Share Count at March 31, 2012 - Basic | | 88,854,562 | | 3,050,542 | | — | | 91,905,104 | | — | | 91,905,104 | |
| | | | | | | | | | | | | |
Weighting Factor | | (2,110,571 | ) | (1,851 | ) | 380,617 | | (1,731,805 | ) | | | (1,731,805 | ) |
Weighted Average Share Count at March 31, 2012 - Diluted | | 86,743,991 | | 3,048,691 | | 380,617 | | 90,173,299 | | — | | 90,173,299 | |
18
JOINT VENTURE STATEMENTS Balance Sheet for Unconsolidated Joint Ventures Unaudited ($000’s omitted) | 
|
| | March 31, 2012 | | March 31, 2011 | |
| | Total | | SLG Interest | | Total | | SLG Interest | |
Land & land interests | | $ | 1,610,447 | | $ | 748,238 | | $ | 1,045,399 | | $ | 467,258 | |
Buildings & improvements fee interest | | 5,035,155 | | 2,206,234 | | 4,506,945 | | 1,919,411 | |
Buildings & improvements leasehold | | 29,708 | | 13,369 | | 29,679 | | 13,356 | |
| | 6,675,310 | | 2,967,841 | | 5,582,023 | | 2,400,025 | |
Less accumulated depreciation | | (517,288 | ) | (214,547 | ) | (494,640 | ) | (213,834 | ) |
| | | | | | | | | |
Net real estate | | $ | 6,158,022 | | $ | 2,753,294 | | $ | 5,087,383 | | $ | 2,186,191 | |
| | | | | | | | | |
Cash and cash equivalents | | 89,147 | | 38,447 | | 72,014 | | 32,029 | |
Restricted cash | | 81,274 | | 39,928 | | 77,196 | | 35,796 | |
Debt investments | | — | | — | | 400,000 | | 200,000 | |
Tenant and other receivables, net of $1,190 reserve at 3/31/12 | | 25,769 | | 9,076 | | 16,873 | | 6,200 | |
Deferred rents receivable, net of reserve for tenant credit loss of $3,112 at 3/31/12 | | 90,410 | | 35,335 | | 97,783 | | 41,977 | |
Deferred costs, net | | 99,442 | | 44,482 | | 117,498 | | 49,552 | |
Other assets | | 218,896 | | 93,621 | | 204,671 | | 83,664 | |
| | | | | | | | | |
Total assets | | $ | 6,762,960 | | $ | 3,014,183 | | $ | 6,073,418 | | $ | 2,635,409 | |
| | | | | | | | | |
Mortgage loans payable | | $ | 4,353,988 | | $ | 1,940,840 | | $ | 3,854,953 | | $ | 1,670,792 | |
Derivative instruments-fair value | | 29,853 | | 14,912 | | 31,643 | | 15,985 | |
Accrued interest payable | | 12,054 | | 5,175 | | 12,551 | | 5,344 | |
Accounts payable and accrued expenses | | 65,488 | | 32,227 | | 57,279 | | 26,729 | |
Deferred revenue | | 126,529 | | 47,186 | | 126,601 | | 45,071 | |
Security deposits | | 6,572 | | 3,250 | | 5,831 | | 2,933 | |
Contributed Capital (1) | | 2,168,476 | | 970,593 | | 1,984,560 | | 868,555 | |
| | | | | | | | | |
Total liabilities and equity | | $ | 6,762,960 | | $ | 3,014,183 | | $ | 6,073,418 | | $ | 2,635,409 | |
As of March 31, 2012 the Company had twenty three unconsolidated joint venture interests. These interests are accounted for using the equity method of accounting and, therefore, are not consolidated into the Company’s financial statements. We consolidated the accounts of the following joint ventures: a 51% interest in 919 Third Avenue, a 51% interest in 680 Washington Avenue, a 51% interest in 750 Washington Avenue, a 49.9% interest in 180 Maiden Lane, and a 80% interest in 19-21 East 65th Street, 44 West 55th Street, 400 East 57th Street, 400 East 58th Street, 752-760 Madison Avenue and 762 Madison Avenue.
(1) Contributed capital reflects our share of capital based on implied sales prices of partially sold or contributed properties. Our investment in an unconsolidated joint venture reflects our actual contributed capital base.
19
JOINT VENTURE STATEMENTS Statements of Operations for Unconsolidated Joint Ventures Unaudited ($000’s omitted) | 
|
| | | | | | Three Months Ended | | | | | |
| | Three Months Ended March 31, 2012 | | December 31, 2011 | | Three Months Ended March 31, 2011 | |
| | Total | | SLG Interest | | SLG Interest | | Total | | SLG Interest | |
Revenues | | | | | | | | | | | |
Rental revenue, net | | $ | 104,874 | | $ | 45,278 | | $ | 43,260 | | $ | 109,793 | | $ | 51,663 | |
Escalation and reimbursement revenues | | 7,574 | | 3,239 | | 3,815 | | 12,261 | | 6,690 | |
Other income | | 7,600 | | 3,690 | | 4,079 | | 1,506 | | 714 | |
Total Revenues, net | | $ | 120,048 | | $ | 52,207 | | $ | 51,154 | | $ | 123,560 | | $ | 59,067 | |
| | | | | | | | | | | |
Expenses | | | | | | | | | | | |
Operating expenses | | $ | 16,766 | | $ | 7,574 | | $ | 8,608 | | $ | 19,687 | | $ | 10,249 | |
Ground rent | | 918 | | 117 | | 117 | | 914 | | 123 | |
Real estate taxes | | 13,374 | | 5,812 | | 5,637 | | 13,450 | | 6,817 | |
Total Operating Expenses | | $ | 31,058 | | $ | 13,503 | | $ | 14,362 | | $ | 34,051 | | $ | 17,189 | |
| | | | | | | | | | | |
GAAP NOI | | $ | 88,990 | | $ | 38,704 | | $ | 36,792 | | $ | 89,509 | | $ | 41,878 | |
Cash NOI | | $ | 81,525 | | $ | 36,577 | | $ | 35,315 | | $ | 82,234 | | $ | 39,504 | |
| | | | | | | | | | | |
Transaction related costs | | $ | 268 | | $ | 161 | | $ | 44 | | $ | 65 | | $ | 20 | |
Interest expense, net of interest income | | 54,868 | | 23,420 | | 26,702 | | 43,949 | | 18,384 | |
Amortization of deferred financing costs | | 1,767 | | 627 | | 1,095 | | 3,688 | | 1,511 | |
Depreciation and amortization | | 36,783 | | 16,056 | | 15,031 | | 31,724 | | 13,760 | |
| | | | | | | | | | | |
Net Income | | $ | (4,696 | ) | $ | (1,560 | ) | $ | (6,080 | ) | $ | 10,083 | | $ | 8,203 | |
| | | | | | | | | | | |
Plus: Real estate depreciation | | 36,750 | | 16,049 | | 15,021 | | 31,689 | | 13,752 | |
FFO Contribution | | $ | 32,054 | | $ | 14,489 | | $ | 8,941 | | $ | 41,772 | | $ | 21,955 | |
| | | | | | | | | | | |
FAD Adjustments: | | | | | | | | | | | |
Add: Non real estate depreciation and amortization | | $ | 1,800 | | $ | 634 | | $ | 1,105 | | $ | 3,723 | | $ | 1,519 | |
Less: Straight-line rental income and other non-cash adjustments | | (7,304 | ) | (2,131 | ) | 480 | | (6,870 | ) | (2,253 | ) |
Less: Second cycle tenant improvement | | (1,467 | ) | (646 | ) | (1,431 | ) | (4,718 | ) | (2,347 | ) |
Less: Second cycle leasing commissions | | (1,426 | ) | (654 | ) | (255 | ) | (2,900 | ) | (1,441 | ) |
Less: Recurring CAPEX | | (52 | ) | (13 | ) | (91 | ) | (698 | ) | (254 | ) |
FAD Adjustment | | $ | (8,449 | ) | $ | (2,810 | ) | $ | (192 | ) | $ | (11,463 | ) | $ | (4,776 | ) |
20
SELECTED FINANCIAL DATA Property NOI and Coverage Ratios Unaudited ($000’s omitted) | 
|
| | Three Months Ended | | Three Months Ended | | Three Months Ended | |
| | March 31, | | March 31, | | December 31, | | September 30, | |
| | 2012 | | 2011 | | 2011 | | 2011 | |
Property NOI | | | | | | | | | |
| | | | | | | | | |
Property operating NOI | | $ | 168,904 | | $ | 149,096 | | $ | 168,272 | | $ | 159,643 | |
NOI from discontinued operations | | 519 | | 4,202 | | 1,945 | | 1,946 | |
Total property operating NOI - consolidated | | 169,423 | | 153,298 | | 170,217 | | 161,589 | |
SLG share of property NOI from JVs | | 38,704 | | 41,878 | | 36,792 | | 37,532 | |
GAAP NOI | | $ | 208,127 | | $ | 195,176 | | $ | 207,009 | | $ | 199,121 | |
| | | | | | | | | |
Less: | Free rent (Net of Amortization) | | 6,399 | | 3,984 | | 6,725 | | 5,065 | |
| Net FAS 141 adjustment | | 174 | | 7,669 | | 2,101 | | 1,497 | |
| Straightline revenue adjustment | | 18,926 | | 25,901 | | 19,065 | | 20,910 | |
| | | | | | | | | | |
Plus: | Allowance for S/L tenant credit loss | | 2,794 | | 1,563 | | 2,127 | | 1,371 | |
| Ground lease straight-line adjustment | | 172 | | 50 | | 113 | | 95 | |
Cash NOI | | $ | 185,594 | | $ | 159,235 | | $ | 181,358 | | $ | 173,115 | |
| | | | | | | | | |
Components of Consolidated Debt Service and Fixed Charges | | | | | | | | | |
| | | | | | | | | |
Interest expense | | 80,735 | | 65,767 | | 79,700 | | 75,428 | |
Fixed amortization principal payments | | 13,526 | | 7,529 | | 10,353 | | 9,484 | |
Total Consolidated Debt Service | | 94,261 | | 73,296 | | 90,053 | | 84,912 | |
| | | | | | | | | |
Payments under ground lease arrangements | | 8,634 | | 7,884 | | 8,923 | | 8,558 | |
Dividends on preferred units | | 397 | | — | | — | | — | |
Dividends on perpetual preferred shares | | 7,545 | | 7,545 | | 7,545 | | 7,545 | |
Total Consolidated Fixed Charges | | 110,837 | | 88,725 | | 106,521 | | 101,015 | |
| | | | | | | | | |
Consolidated Interest Coverage Ratio | | 2.5 | | 3.2 | | 2.4 | | 2.4 | |
Consolidated Debt Service Coverage Ratio | | 2.1 | | 2.9 | | 2.2 | | 2.2 | |
Consolidated Fixed Charge Coverage Ratio | | 1.8 | | 2.4 | | 1.8 | | 1.8 | |
21
SELECTED FINANCIAL DATA
2012 Same Store - Consolidated
Unaudited
($000’s omitted) | 
|
| | Three Months Ended | | Three Months Ended | | Three Months Ended | |
| | March 31, | | March 31, | | | | December 31, | | September 30, | |
| | 2012 | | 2011 | | % | | 2011 | | 2011 | |
Revenues | | | | | | | | | | | |
| Rental revenue, net | | $ | 216,176 | | $ | 219,934 | | -1.7 | % | $ | 213,454 | | $ | 212,734 | |
| Escalation & reimbursement revenues | | 30,660 | | 29,376 | | 4.4 | % | 30,846 | | 31,906 | |
| Other income | | 3,440 | | 3,243 | | 6.1 | % | 2,601 | | 1,233 | |
| Total Revenues | | 250,276 | | 252,553 | | -0.9 | % | 246,901 | | 245,873 | |
Expenses | | | | | | | | | | | |
| Operating expenses | | 55,100 | | 54,923 | | 0.3 | % | 54,887 | | 56,732 | |
| Ground rent | | 9,010 | | 7,976 | | 13.0 | % | 9,047 | | 8,735 | |
| Real estate taxes | | 40,332 | | 39,026 | | 3.3 | % | 37,156 | | 38,277 | |
| Transaction related costs | | — | | 135 | | -100.0 | % | 3 | | 14 | |
| | | 104,442 | | 102,060 | | 2.3 | % | 101,093 | | 103,758 | |
| | | | | | | | | | | | |
| Operating Income | | 145,834 | | 150,493 | | -3.1 | % | 145,808 | | 142,115 | |
| | | | | | | | | | | | |
| Interest expense & amortization of financing costs | | 47,261 | | 45,655 | | 3.5 | % | 47,358 | | 47,086 | |
| Depreciation & amortization | | 60,125 | | 59,761 | | 0.6 | % | 60,998 | | 59,798 | |
| | | | | | | | | | | | |
| Income before noncontrolling interest | | 38,448 | | 45,077 | | -14.7 | % | 37,452 | | 35,231 | |
Plus: | Real estate depreciation & amortization | | 60,114 | | 59,751 | | 0.6 | % | 60,989 | | 59,789 | |
| | | | | | | | | | | | |
| FFO Contribution | | 98,562 | | 104,828 | | -6.0 | % | 98,441 | | 95,020 | |
| | | | | | | | | | | | |
Less: | Non—building revenue | | 712 | | 439 | | 62.2 | % | 477 | | 612 | |
| | | | | | | | | | | | |
Plus: | Transaction related costs | | — | | 135 | | -100.0 | % | 3 | | 14 | |
| Interest expense & amortization of financing costs | | 47,261 | | 45,655 | | 3.5 | % | 47,358 | | 47,086 | |
| Non-real estate depreciation | | 11 | | 10 | | 10.0 | % | 9 | | 9 | |
GAAP NOI | | 145,122 | | 150,189 | | -3.4 | % | 145,334 | | 141,517 | |
| | | | | | | | | | | | |
Cash Adjustments | | | | | | | | | | | |
Less: | Free rent (net of amortization) | | 4,061 | | 3,187 | | 27.4 | % | 4,385 | | 2,906 | |
| Straightline revenue adjustment | | 14,456 | | 21,858 | | -33.9 | % | 15,509 | | 16,566 | |
| Rental income - FAS 141 | | 4,737 | | 7,244 | | -34.6 | % | 4,212 | | 4,342 | |
Plus: | Ground lease straight-line adjustment | | 285 | | 317 | | -10.1 | % | 157 | | 139 | |
| Allowance for S/L tenant credit loss | | 2,260 | | 1,328 | | 70.2 | % | 1,701 | | 892 | |
Cash NOI | | $ | 124,413 | | $ | 119,545 | | 4.1 | % | $ | 123,086 | | $ | 118,734 | |
| | | | | | | | | | | | |
Operating Margins | | | | | | | | | | | |
| GAAP NOI to Real Estate Revenue, net | | 57.6 | % | 59.3 | % | | | 58.6 | % | 57.5 | % |
| Cash NOI to Real Estate Revenue, net | | 49.4 | % | 47.2 | % | | | 49.6 | % | 48.2 | % |
| | | | | | | | | | | | |
| GAAP NOI before Ground Rent/Real Estate Revenue, net | | 61.2 | % | 62.4 | % | | | 62.2 | % | 61.0 | % |
| Cash NOI before Ground Rent/Real Estate Revenue, net | | 52.9 | % | 50.2 | % | | | 53.2 | % | 51.7 | % |
22
SELECTED FINANCIAL DATA
2012 Same Store - Joint Venture
Unaudited
($000’s omitted) | 
|
| | Three Months Ended | | | | Three Months Ended | | Three Months Ended | |
| | March 31, | | March 31, | | | | December 31, | | September 30, | |
| | 2012 | | 2011 | | % | | 2011 | | 2011 | |
Revenues | | | | | | | | | | | |
| Rental revenue, net | | $ | 36,132 | | $ | 33,673 | | 7.3 | % | $ | 36,117 | | $ | 33,994 | |
| Escalation & reimbursement revenues | | 1,837 | | 1,986 | | -7.5 | % | 2,210 | | 2,158 | |
| Other income | | 90 | | 27 | | 233.3 | % | 23 | | 2,328 | |
| Total Revenues | | 38,059 | | 35,686 | | 6.6 | % | 38,350 | | 38,480 | |
Expenses | | | | | | | | | | | |
| Operating expenses | | 4,765 | | 5,135 | | -7.2 | % | 5,101 | | 4,881 | |
| Ground rent | | 117 | | 117 | | 0.0 | % | 117 | | 117 | |
| Real estate taxes | | 3,066 | | 3,068 | | -0.1 | % | 2,830 | | 2,909 | |
| Transaction related costs | | 18 | | 36 | | — | | — | | — | |
| | | 7,966 | | 8,356 | | -4.7 | % | 8,048 | | 7,907 | |
| | | | | | | | | | | | |
| Operating Income | | 30,093 | | 27,330 | | 10.1 | % | 30,302 | | 30,573 | |
| | | | | | | | | | | | |
| Interest expense & amortization of financing costs | | 15,671 | | 15,658 | | 0.1 | % | 15,731 | | 15,751 | |
| Depreciation & amortization | | 11,349 | | 10,906 | | 4.1 | % | 11,645 | | 11,797 | |
| | | | | | | | | | | | |
| Income before noncontrolling interest | | 3,073 | | 766 | | 301.2 | % | 2,926 | | 3,025 | |
Plus: | Real estate depreciation & amortization | | 11,342 | | 10,899 | | 4.1 | % | 11,636 | | 11,793 | |
| | | | | | | | | | | | |
| FFO Contribution | | 14,415 | | 11,665 | | 23.6 | % | 14,562 | | 14,818 | |
| | | | | | | | | | | | |
Less: | Non–building revenue | | 55 | | 25 | | 120.0 | % | 68 | | 28 | |
| | | | | | | | | | | | |
Plus: | Transaction related costs | | 18 | | 36 | | -50.0 | % | — | | — | |
| Interest expense & amortization of financing costs | | 15,671 | | 15,658 | | 0.1 | % | 15,731 | | 15,751 | |
| Non-real estate depreciation | | 7 | | 7 | | 0.0 | % | 9 | | 4 | |
GAAP NOI | | 30,056 | | 27,341 | | 9.9 | % | 30,234 | | 30,545 | |
| | | | | | | | | | | | |
Cash Adjustments | | | | | | | | | | | |
Less: | Free rent (net of amortization) | | 1,512 | | 136 | | 0.0 | % | 1,335 | | 1,130 | |
| Straightline revenue adjustment | | 1,782 | | 1,729 | | 8.0 | % | 1,384 | | 1,622 | |
| Rental income - FAS 141 | | 606 | | 531 | | 14.1 | % | 1,686 | | 630 | |
Plus: | Ground lease straight-line adjustment | | 95 | | 88 | | 8.0 | % | 10 | | 10 | |
| Allowance for S/L tenant credit loss | | 10 | | 10 | | 0.0 | % | 136 | | 276 | |
Cash NOI | | $ | 26,261 | | $ | 25,043 | | 4.9 | % | $ | 25,975 | | $ | 27,449 | |
| | | | | | | | | | | | |
Operating Margins | | | | | | | | | | | |
| GAAP NOI to Real Estate Revenue, net | | 78.9 | % | 76.5 | % | | | 79.0 | % | 79.4 | % |
| Cash NOI to Real Estate Revenue, net | | 68.9 | % | 70.1 | % | | | 67.8 | % | 71.4 | % |
| | | | | | | | | | | | |
| GAAP NOI before Ground Rent/Real Estate Revenue, net | | 79.2 | % | 76.8 | % | | | 79.3 | % | 79.7 | % |
| Cash NOI before Ground Rent/Real Estate Revenue, net | | 69.2 | % | 70.4 | % | | | 67.8 | % | 71.0 | % |
23
SELECTED FINANCIAL DATA
2012 Same Store - Combined
Unaudited
($000’s omitted) | 
|
| | | Three Months Ended | | | | Three Months Ended | | Three Months Ended | |
| | | March 31, | | March 31, | | | | December 31, | | September 30, | |
| | | 2012 | | 2011 | | % | | 2011 | | 2011 | |
Revenues | | | | | | | | | | | |
| Rental revenue, net | | $ | 252,308 | | $ | 253,607 | | -0.5 | % | $ | 249,571 | | $ | 246,728 | |
| Escalation & reimbursement revenues | | 32,497 | | 31,362 | | 3.6 | % | 33,056 | | 34,064 | |
| Other income | | 3,530 | | 3,270 | | 8.0 | % | 2,624 | | 3,561 | |
| Total Revenues | | 288,335 | | 288,239 | | 0.0 | % | 285,251 | | 284,353 | |
Expenses | | | | | | | | | | | |
| Operating expenses | | 59,865 | | 60,058 | | -0.3 | % | 59,988 | | 61,613 | |
| Ground rent | | 9,127 | | 8,093 | | 12.8 | % | 9,164 | | 8,852 | |
| Real estate taxes | | 43,398 | | 42,094 | | 3.1 | % | 39,986 | | 41,186 | |
| Transaction related costs | | 18 | | 171 | | -89.5 | % | 3 | | 14 | |
| | | 112,408 | | 110,416 | | 1.8 | % | 109,141 | | 111,665 | |
| | | | | | | | | | | | |
| Operating Income | | 175,927 | | 177,823 | | -1.1 | % | 176,110 | | 172,688 | |
| | | | | | | | | | | | |
| Interest expense & amortization of financing costs | | 62,932 | | 61,313 | | 2.6 | % | 63,089 | | 62,837 | |
| Depreciation & amortization | | 71,474 | | 70,667 | | 1.1 | % | 72,643 | | 71,595 | |
| | | | | | | | | | | | |
| Income before noncontrolling interest | | 41,521 | | 45,843 | | -9.4 | % | 40,378 | | 38,256 | |
Plus: | Real estate depreciation & amortization | | 71,456 | | 70,650 | | 1.1 | % | 72,625 | | 71,582 | |
| | | | | | | | | | | | |
| FFO Contribution | | 112,977 | | 116,493 | | -3.0 | % | 113,003 | | 109,838 | |
| | | | | | | | | | | | |
Less: | Non–building revenue | | 767 | | 464 | | 65.3 | % | 545 | | 640 | |
| | | | | | | | | | | | |
| | | | | | | | | | | | |
Plus: | Transaction related costs | | 18 | | 171 | | -89.5 | % | 3 | | 14 | |
| Interest expense & amortization of financing costs | | 62,932 | | 61,313 | | 2.6 | % | 63,089 | | 62,837 | |
| Non-real estate depreciation | | 18 | | 17 | | 5.9 | % | 18 | | 13 | |
GAAP NOI | | 175,178 | | 177,530 | | -1.3 | % | 175,568 | | 172,062 | |
| | | | | | | | | | | | |
Cash Adjustments | | | | | | | | | | | |
Less: | Free rent (net of amortization) | | 5,573 | | 3,323 | | 0.0 | % | 5,720 | | 4,036 | |
| Straightline revenue adjustment | | 16,238 | | 23,587 | | 8.0 | % | 16,893 | | 18,188 | |
| Rental income - FAS 141 | | 5,343 | | 7,775 | | -31.3 | % | 5,898 | | 4,972 | |
Plus: | Ground lease straight-line adjustment | | 380 | | 405 | | -6.2 | % | 167 | | 149 | |
| Allowance for S/L tenant credit loss | | 2,270 | | 1,338 | | 69.7 | % | 1,837 | | 1,168 | |
Cash NOI | | $ | 150,674 | | $ | 144,588 | | 4.2 | % | $ | 149,061 | | $ | 146,183 | |
| | | | | | | | | | | | |
Operating Margins | | | | | | | | | | | |
| GAAP NOI to Real Estate Revenue, net | | 60.8 | % | 61.6 | % | | | 61.6 | % | 60.6 | % |
| Cash NOI to Real Estate Revenue, net | | 52.3 | % | 50.2 | % | | | 52.3 | % | 51.5 | % |
| | | | | | | | | | | | |
| GAAP NOI before Ground Rent/Real Estate Revenue, net | | 64.0 | % | 64.4 | % | | | 64.8 | % | 63.7 | % |
| Cash NOI before Ground Rent/Real Estate Revenue, net | | 54.7 | % | 52.5 | % | | | 54.9 | % | 54.2 | % |
24
DEBT SUMMARY SCHEDULE - Consolidated
Unaudited
($000’s omitted) | 
|
| | Principal | | | | 2012 | | | | | | As-Of | | | |
| | Outstanding | | | | Principal | | Maturity | | Due at | | Right | | Earliest | |
| | 3/31/2012 | | Coupon (1) | | Amortization | | Date | | Maturity | | Extension | | Prepayment | |
Fixed rate debt | | | | | | | | | | | | | | | |
Secured fixed rate debt | | | | | | | | | | | | | | | |
673 First Avenue | | 29,678 | | 5.67 | % | 922 | | Feb-13 | | 28,984 | | — | | Open | |
609 Fifth Avenue | | 94,561 | | 5.85 | % | 1,616 | | Oct-13 | | 92,062 | | — | | Open | |
220 E 42nd Street | | 189,308 | | 5.25 | % | 4,525 | | Nov-13 | | 182,342 | | — | | Open | |
125 Park Avenue | | 146,250 | | 5.75 | % | — | | Oct-14 | | 146,250 | | — | | Open | |
711 Third Avenue | | 120,000 | | 4.99 | % | — | | Jun-15 | | 120,000 | | — | | Open | |
625 Madison Avenue | | 128,287 | | 7.22 | % | 3,495 | | Oct-15 | | 109,537 | | — | | Open | |
500 West Putnam Avenue | | 24,440 | | 5.52 | % | 503 | | Jan-16 | | 22,376 | | — | | Open | |
420 Lexington Avenue | | 186,649 | | 7.50 | % | 2,002 | | Sep-16 | | 175,740 | | — | | Sep-12 | |
1-6 Landmark Square | | 85,627 | | 4.00 | % | 1,514 | | Dec-16 | | 77,936 | | — | | Jun-13 | |
300 Main Street | | 11,500 | | 5.75 | % | — | | Feb-17 | | 11,500 | | — | | Open | |
485 Lexington Avenue | | 450,000 | | 5.61 | % | — | | Feb-17 | | 450,000 | | — | | Open | |
120 W 45th Street | | 170,000 | | 6.12 | % | — | | Feb-17 | | 170,000 | | — | | Open | |
762 Madison Avenue | | 8,486 | | 3.75 | % | 115 | | Feb-17 | | 7,298 | | — | | Aug-13 | |
2 Herald Square | | 191,250 | | 5.36 | % | — | | Apr-17 | | 191,250 | | — | | Open | |
885 Third Avenue | | 267,650 | | 6.26 | % | — | | Jul-17 | | 267,650 | | — | | Open | |
110 E 42nd Street | | 65,000 | | 5.81 | % | — | | Jul-17 | | 65,000 | | — | | Open | |
400 E 57th Street | | 70,000 | | 4.13 | % | — | | Feb-19 | | 70,000 | | — | | Open | |
400 E 58th Street | | 30,000 | | 4.13 | % | — | | Feb-19 | | 30,000 | | — | | Open | |
1 Madison Avenue - South Building | | 622,029 | | 5.91 | % | 19,061 | | May-20 | | 404,531 | | — | | Open | |
919 Third Avenue | | 500,000 | | 5.12 | % | — | | Jun-23 | | 450,608 | | — | | Jun-13 | |
| | 3,390,715 | | 5.71 | % | 33,753 | | | | 3,073,064 | | | | | |
Secured fixed rate debt - Other | | | | | | | | | | | | | | | |
609 Partners, LLC | | 31,721 | | 5.00 | % | — | | Jul-14 | | 31,721 | | — | | Open | |
Preferred Equity Investment | | 50,000 | | 8.00 | % | — | | Sep-19 | | 50,000 | | — | | Open | |
| | 81,721 | | 6.84 | % | — | | | | 81,721 | | | | | |
Unsecured fixed rate debt | | | | | | | | | | | | | | | |
Unsecured notes | | 98,578 | | 5.88 | % | — | | Aug-14 | | 98,578 | | — | | Open | |
Junior subordinated deferrable interest debentures | | 100,000 | | 5.61 | % | — | | Jul-35 | | 100,000 | | — | | — | |
Revolving credit facility (swap) | | 30,000 | | 3.20 | % | — | | Nov-15 | | 30,000 | | Nov-15 | | Open | |
Unsecured notes | | 274,814 | | 6.00 | % | — | | Mar-16 | | 275,000 | | — | | Open | |
Convertible notes | | 280,001 | | 3.00 | % | — | | Oct-17 | | 345,000 | | — | | Open | |
Unsecured notes | | 249,579 | | 5.00 | % | — | | Aug-18 | | 250,000 | | — | | Open | |
Unsecured notes | | 250,000 | | 7.75 | % | — | | Mar-20 | | 250,000 | | — | | Open | |
Convertible notes | | 357 | | 4.00 | % | — | | Jun-25 | (2) | 357 | | — | | Jun-15 | |
Convertible notes | | 18,003 | | 3.00 | % | — | | Mar-27 | (3) | 18,003 | | — | | Mar-17 | |
| | 1,301,332 | | 5.35 | % | — | | | | 1,366,938 | | | | | |
Total Fixed Rate Debt/Wtd Avg | | 4,773,768 | | 5.63 | % | 33,753 | | | | 4,521,723 | | | | | |
| | | | | | | | | | | | | | | |
Floating rate debt | | | | | | | | | | | | | | | |
Secured floating rate debt | | | | | | | | | | | | | | | |
521 Fifth Avenue (Libor +200 bps) | | 150,000 | | 2.27 | % | — | | Apr-13 | | 150,000 | | — | | Open | |
1515 Broadway (Libor + 250 bps) | | 447,160 | | 3.50 | % | 10,871 | | Dec-14 | | 419,483 | | — | | Open | |
180 Maiden Lane (Libor + 211.25 bps) | | 277,326 | | 2.56 | % | 7,934 | | Nov-16 | | 240,923 | | — | | Open | |
| | 874,486 | | 2.99 | % | 18,805 | | | | 810,406 | | | | | |
| | | | | | | | | | | | | | | |
Secured floating rate debt - Other | | | | | | | | | | | | | | | |
Senior mortgage (GBP Libor + 250 bps) | | 62,792 | | 3.54 | % | — | | Jun-13 | | 62,792 | | — | | Open | |
| | 62,792 | | 3.54 | % | — | | | | 62,792 | | | | | |
| | | | | | | | | | | | | | | |
Unsecured floating rate debt | | | | | | | | | | | | | | | |
Revolving credit facility (Libor + 150 bps) | | 370,000 | | 1.77 | % | — | | Nov-15 | | 370,000 | | Nov-15 | | Open | |
| | 370,000 | | 1.77 | % | — | | | | 370,000 | | | | | |
| | | | | | | | | | | | | | | |
Total Floating Rate Debt/Wtd Avg | | 1,307,278 | | 2.67 | % | 18,805 | | | | 1,243,198 | | | | | |
| | | | | | | | | | | | | | | |
Total Debt/Wtd Avg - Consolidated | | 6,081,046 | | 4.99 | % | 52,558 | | | | 5,764,921 | | | | | |
| | | | | | | | | | | | | | | |
Total Debt/Wtd Avg - Joint Venture | | 1,940,840 | | 4.84 | % | | | | | | | | | | |
| | | | | | | | | | | | | | | |
Weighted Average Balance & Interest Rate with SLG JV Debt | | 8,338,114 | | 4.91 | % | | | | | | | | | | |
(1) Average Libor for the quarter used to determine coupon on floating rate debt.
(2) Notes can be put to the Company, at the option of the holder, on June 15, 2015.
(3) Notes can be put to the Company, at the option of the holder, on March 30, 2017.
25
DEBT SUMMARY SCHEDULE - Joint Venture Unaudited
($000’s omitted) | 
|
| | | | | | | | 2012 | | | | | | As-Of | | | |
| | Principal Outstanding - 3/31/12 | | | | Principal | | Maturity | | Due at | | Right | | Earliest | |
| | Gross Principal | | SLG Share | | Coupon (1) | | Amortization | | Date | | Maturity | | Extension | | Prepayment | |
Fixed rate debt | | | | | | | | | | | | | | | | | |
| | | | | | | | | | | | | | | | | |
1604-1610 Broadway | | 27,000 | | 12,150 | | 5.66 | % | — | | Apr-12 | | 12,150 | | — | | Open | |
100 Park Avenue | | 214,054 | | 106,813 | | 6.64 | % | 1,167 | | Sep-14 | | 103,579 | | — | | Open | |
One Court Square | | 315,000 | | 94,500 | | 4.91 | % | — | | Sep-15 | | 94,500 | | — | | Open | |
11 West 34th Street | | 17,693 | | 5,308 | | 4.82 | % | 81 | | Jan-16 | | 4,977 | | — | | Open | |
280 Park Avenue | | 710,000 | | 351,177 | | 6.55 | % | — | | Jun-16 | | 341,953 | | — | | Open | |
21-25 West 34th Street | | 100,000 | | 50,000 | | 5.76 | % | — | | Dec-16 | | 50,000 | | — | | Open | |
1745 Broadway | | 340,000 | | 109,650 | | 5.68 | % | — | | Jan-17 | | 109,650 | | — | | Open | |
Jericho Plaza | | 163,750 | | 33,176 | | 5.65 | % | — | | May-17 | | 33,176 | | — | | Open | |
800 Third Avenue | | 20,910 | | 8,981 | | 6.00 | % | — | | Aug-17 | | 8,981 | | — | | Open | |
388/390 Greenwich Street | | 1,106,757 | | 559,993 | | 5.19 | % | — | | Dec-17 | | 559,993 | | — | | Open | |
Total Fixed Rate Debt/Wtd Avg | | 3,015,164 | | 1,331,748 | | 5.73 | % | 1,248 | | | | 1,318,959 | | | | | |
| | | | | | | | | | | | | | | | | |
Floating rate debt | | | | | | | | | | | | | | | | | |
| | | | | | | | | | | | | | | | | |
379 West Broadway (Libor + 165 bps) | | 20,991 | | 9,446 | | 1.94 | % | — | | Jul-12 | | 9,446 | | — | | Open | |
717 Fifth Avenue (Libor + 275 bps) | | 245,000 | | 80,238 | | 5.25 | % | — | | Sep-12 | | 80,238 | | — | | Open | |
Meadows (Libor + 135 bps) | | 84,109 | | 42,055 | | 1.63 | % | 789 | | Sep-12 | | 41,561 | | — | | Open | |
29 West 34th Street (Libor + 165 bps) | | 53,775 | | 26,888 | | 2.27 | % | 63 | | May-13 | | 26,888 | | — | | Open | |
1552 Broadway (Libor + 300 bps) | | 96,787 | | 48,394 | | 3.27 | % | — | | Aug-13 | | 48,394 | | — | | Open | |
16 Court Street (Libor + 250 bps) | | 85,290 | | 29,852 | | 2.77 | % | — | | Oct-13 | | 29,852 | | — | | Open | |
180-182 Broadway (Libor + 275 bps) | | 35,109 | | 8,953 | | 3.02 | % | — | | Dec-13 | | 8,953 | | — | | Open | |
747 Madison (Libor + 275 bps) | | 33,125 | | 11,041 | | 3.04 | % | — | | Oct-14 | | 11,041 | | — | | Open | |
3 Columbus Circle (Libor + 210 bps) | | 253,016 | | 123,725 | | 2.66 | % | 3,734 | | Jan-16 | | 111,380 | | — | | Open | |
Mezzanine Debt (Libor + 90 bps) | | 30,000 | | 15,000 | | 1.17 | % | — | | Jun-16 | | 15,000 | | — | | Open | |
724 Fifth Avenue (Libor + 235 bps) | | 120,000 | | 60,000 | | 2.61 | % | — | | Jan-17 | | 60,000 | | — | | Open | |
10 East 53rd Street (Libor +250 bps) | | 125,000 | | 68,750 | | 2.74 | % | — | | Feb-17 | | 68,750 | | — | | Mar-14 | |
600 Lexington Avenue (Libor + 200 bps) | | 125,000 | | 68,750 | | 2.53 | % | 342 | | Oct-17 | | 58,097 | | — | | Open | |
388/390 Greenwich Street (Libor + 115 bps) | | 31,622 | | 16,000 | | 1.43 | % | — | | Dec-17 | | 16,000 | | — | | Open | |
Total Floating Rate Debt/Wtd Avg | | 1,338,824 | | 609,092 | | 2.89 | % | 4,928 | | | | 585,599 | | | | | |
| | | | | | | | | | | | | | | | | |
Total Joint Venture Debt/Wtd Avg | 4,353,988 | | 1,940,840 | | 4.84 | % | 6,175 | | | | 1,904,557 | | | | | |
Covenants
Revolving Credit Facility Covenants | |
| | Actual | | Required | |
Total Debt / Total Assets | | 43.5 | % | Less than 60% | |
Fixed Charge Coverage | | 1.8x | | Greater than 1.5X | |
26
DEBT SUMMARY SCHEDULE - Reckson Unaudited ($000’s omitted) | 
|
Consolidated
| | Principal | | | | 2012 | | | | | | As-Of | | | |
| | Outstanding | | | | Principal | | Maturity | | Due at | | Right | | Earliest | |
| | 3/31/2012 | | Coupon (1) | | Amortization | | Date | | Maturity | | Extension | | Prepayment | |
Fixed rate debt | | | | | | | | | | | | | | | |
| | | | | | | | | | | | | | | |
Secured fixed rate debt | | | | | | | | | | | | | | | |
919 Third Avenue | | 500,000 | | 5.12 | % | — | | Jun-23 | | 450,608 | | — | | Jun-13 | |
| | 500,000 | | 5.12 | % | — | | | | 450,608 | | | | | |
| | | | | | | | | | | | | | | |
Unsecured fixed rate debt | | | | | | | | | | | | | | | |
Unsecured notes | | 98,578 | | 5.88 | % | — | | Aug-14 | | 98,578 | | — | | Open | |
Unsecured notes | | 274,814 | | 6.00 | % | — | | Mar-16 | | 275,000 | | — | | Open | |
Revolving credit facility | | 30,000 | | 3.20 | % | — | | Nov-15 | | 30,000 | | Nov-15 | | Open | |
Unsecured notes | | 249,579 | | 5.00 | % | — | | Aug-18 | | 250,000 | | — | | Open | |
Unsecured notes | | 250,000 | | 7.75 | % | — | | Mar-20 | | 250,000 | | — | | Open | |
Convertible notes | | 357 | | 4.00 | % | — | | Jun-25 | (2) | 357 | | — | | Jun-15 | |
| | 903,328 | | 6.10 | % | — | | | | 903,935 | | | | | |
| | | | | | | | | | | | | | | |
Total Fixed Rate Debt/Wtd Avg | | 1,403,328 | | 5.75 | % | | | | | 1,354,543 | | | | | |
| | | | | | | | | | | | | | | |
Floating rate debt | | | | | | | | | | | | | | | |
| | | | | | | | | | | | | | | |
Unsecured floating rate debt | | | | | | | | | | | | | | | |
Revolving credit facility (Libor + 150 bps) | | 370,000 | | 1.77 | % | — | | Nov-15 | | 370,000 | | Nov-15 | | Open | |
Total Floating Rate Debt/Wtd Avg | | 370,000 | | 1.77 | % | — | | | | 370,000 | | | | | |
| | | | | | | | | | | | | | | |
Total Debt/Wtd Avg - Consolidated | | 1,773,328 | | 4.92 | % | — | | | | 1,724,543 | | | | | |
Joint Venture
| | | | | | | | 2012 | | | | | | As-Of | | | |
| | Principal Outstanding - 3/31/12 | | | | Principal | | Maturity | | Due at | | Right | | Earliest | |
| | Gross Principal | | SLG Share | | Coupon | | Amortization | | Date | | Maturity | | Extension | | Prepayment | |
Fixed rate debt | | | | | | | | | | | | | | | | | |
| | | | | | | | | | | | | | | | | |
One Court Square | | 315,000 | | 94,500 | | 4.91 | % | — | | Sep-15 | | 94,500 | | — | | Open | |
Total Debt/Wtd Avg - Joint Venture | | 315,000 | | 94,500 | | 4.91 | % | — | | | | 94,500 | | | | | |
| | | | | | | | | | | | | | | | | |
Total Debt/Wtd Avg - Consolidated + Joint Venture | | | | 1,867,828 | | 4.92 | % | — | | | | 1,819,043 | | | | | |
(1) Average Libor for the quarter used to determine coupon on floating rate debt.
(2) Notes can be put to the Company, at the option of the holder, on June 15, 2015.
Covenants
Reckson Unsecured Notes Covenants | |
| | Actual | | Required | |
Total Debt / Total Assets | | 36.0 | % | Less than 60% | |
Secured Debt / Total Assets | | 10.0 | % | Less than 40% | |
Debt Service Coverage | | 3.3 | x | Greater than 1.5 | |
Unencumbered Assets / Unsecured Debt | | 289.0 | % | Greater than 150% | |
Revolving Credit Facility Covenants | |
| | Actual | | Required | |
Total Debt / Total Assets | | 46.9 | % | Less than 60% | |
Fixed Charge Coverage | | 3.4 | x | Greater than 1.5X | |
Secured Debt / Total Assets | | 11.2 | % | Less than 40% | |
Unsecured Debt / Unencumbered Assets | | 51.2 | % | Less than 60% | |
27
SUMMARY OF GROUND LEASE ARRANGEMENTS
Consolidated
($000’s omitted) | 
|
| | 2012 Scheduled | | 2013 Scheduled | | 2014 Scheduled | | 2015 Scheduled | | Deferred Land | | Year of | |
Property | | Cash Payment | | Cash Payment | | Cash Payment | | Cash Payment | | Lease Obligations (1) | | Maturity | |
| | | | | | | | | | | | | |
Operating Leases | | | | | | | | | | | | | |
625 Madison Avenue (2) | | $ | 4,613 | | $ | 4,613 | | $ | 4,613 | | $ | 4,613 | | $ | — | | 2022 | (3) |
461 Fifth Avenue (2) | | 2,100 | | 2,100 | | 2,100 | | 2,100 | | — | | 2027 | (4) |
420 Lexington Avenue (2) | | 10,933 | | 10,933 | | 10,933 | | 10,933 | | — | | 2029 | (5) |
711 Third Avenue (2) | | 5,250 | | 5,250 | | 5,250 | | 5,250 | | 157 | | 2033 | (6) |
752 Madison Avenue/19-21 65th Street (2) | | 209 | | 212 | | 212 | | 212 | | — | | 2037 | (7) |
673 First Avenue | | 3,010 | | 3,010 | | 3,010 | | 3,010 | | 18,451 | | 2037 | |
1185 Avenue of the Americas (2) | | 6,909 | | 6,909 | | 6,909 | | 6,909 | | — | | 2043 | |
1055 Washing Blvd, Stamford (2) | | 615 | | 615 | | 615 | | 615 | | — | | 2090 | |
| | | | | | | | | | | | | |
Total | | $ | 33,639 | | $ | 33,642 | | $ | 33,642 | | $ | 33,642 | | $ | 18,608 | | | |
| | | | | | | | | | | | | |
Capitalized Lease | | | | | | | | | | | | | |
673 First Avenue | | $ | 1,555 | | $ | 1,555 | | $ | 1,555 | | $ | 1,593 | | $ | 17,130 | | 2037 | |
(1) Per the balance sheet at March 31, 2012.
(2) These ground leases are classified as operating leases and, therefore, do not appear on the balance sheet as an obligation.
(3) Subject to renewal at the Company’s option through 2054.
(4) The Company has an option to purchase the ground lease for a fixed price on a specific date.
(5) Subject to renewal at the Company’s option through 2080.
(6) Reflects 50% of the annual ground rent payment as the Company owns 50% of the fee interest.
(7) Subject to a fair market value rent reset in 2015. The ground lease is subject to renewal through 2087.
28
DEBT AND PREFERRED EQUITY INVESTMENTS
($000’s omitted) | 
|
| | Assets | | Weighted Average | | Weighted Average | | Current | |
| | Outstanding | | Assets During Quarter | | Yield During Quarter | | Yield (2) | |
| | | | | | | | | |
12/31/2010 | | $ | 963,772 | | $ | 926,440 | | 7.93 | % | 7.90 | % |
| | | | | | | | | |
Debt originations/accretion (1) | | $ | 104,642 | | | | | | | |
Preferred Equity originations/accretion | | $ | 1,142 | | | | | | | |
Redemptions/Sales/Amortization/Reserves | | $ | (490,269 | ) | | | | | | |
3/31/2011 | | $ | 579,287 | | $ | 883,368 | | 7.37 | % | 6.19 | % |
| | | | | | | | | |
Debt originations/accretion (1) | | $ | 56,130 | | | | | | | |
Preferred Equity originations/accretion | | $ | 987 | | | | | | | |
Redemptions/Sales/Amortization/Reserves | | $ | (53,986 | ) | | | | | | |
6/30/2011 | | $ | 582,418 | | $ | 579,434 | | 6.12 | % | 6.28 | % |
| | | | | | | | | |
Debt originations/accretion (1) | | $ | 99,171 | | | | | | | |
Preferred Equity originations/accretion | | $ | 254,019 | | | | | | | |
Redemptions/Sales/Amortization/Reserves | | $ | (38,580 | ) | | | | | | |
9/30/2011 | | $ | 897,028 | | $ | 811,836 | | 7.99 | % | 8.02 | % |
| | | | | | | | | |
Debt originations/accretion (1) | | $ | 102,026 | | | | | | | |
Preferred Equity originations/accretion | | $ | 4,373 | | | | | | | |
Redemptions/Sales/Amortization/Reserves | | $ | (17,485 | ) | | | | | | |
12/31/2011 | | $ | 985,942 | | $ | 961,012 | | 8.20 | % | 8.36 | % |
| | | | | | | | | |
Debt originations/accretion (1) | | $ | 71,967 | | | | | | | |
Preferred Equity originations/accretion | | $ | 4,356 | | | | | | | |
Redemptions/Sales/Amortization/Reserves | | $ | (62,692 | ) | | | | | | |
3/31/2012 | | $ | 999,573 | | $ | 1,012,386 | | 8.96 | % | 9.65 | % |
(1) Accretion includes original issue discounts and compounding investment income.
(2) Includes interest, origination fees and amortized discount recognized in the last month of the quarter.
29
DEBT AND PREFERRED EQUITY INVESTMENTS
($000’s omitted) | 
|
| | | | | | Weighted Average | | Weighted Average | | Current | |
Type of Investment | | Quarter End Balance (1) | | Senior Financing | | Exposure PSF | | Yield During Quarter | | Yield | |
| | | | | | | | | | | |
New York City | | | | | | | | | | | |
| | | | | | | | | | | |
Senior Mortgage Debt | | $ | 3,000 | | $ | 28,500 | | $ | 207 | | 17.87 | % | 42.40 | % |
| | | | | | | | | | | |
Junior Mortgage Participation | | $ | 162,259 | | $ | 1,726,514 | | $ | 475 | | 8.33 | % | 9.24 | % |
| | | | | | | | | | | |
Mezzanine Debt | | $ | 424,869 | | $ | 1,250,000 | | $ | 873 | | 9.69 | % | 10.74 | % |
| | | | | | | | | | | |
Preferred Equity | | $ | 297,899 | | $ | 1,406,260 | | $ | 385 | | 9.80 | % | 10.16 | % |
| | | | | | | | | | | |
Other | | | | | | | | | | | |
| | | | | | | | | | | |
Senior Mortgage Debt | | $ | 86,339 | | $ | 0 | | $ | 821 | | 2.95 | % | 3.04 | % |
| | | | | | | | | | | |
Mezzanine Debt | | $ | 8,391 | | $ | 796,693 | | $ | 186 | | 3.72 | % | 3.58 | % |
| | | | | | | | | | | |
Preferred Equity | | $ | 16,816 | | $ | 177,980 | | $ | 226 | | 8.10 | % | 8.07 | % |
| | | | | | | | | | | |
Balance as of 3/31/12 | | $ | 999,573 | | $ | 5,385,947 | | $ | 639 | | 8.96 | % | 9.65 | % |
Current Maturity Profile (2)
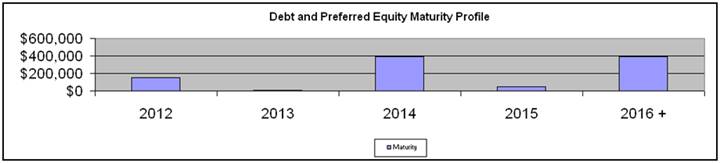
(1) Approximately 33.6% of our investments are indexed to LIBOR and are prepayable at dates prior to maturity subject to certain prepayment penalties or fees.
(2) The weighted maturity is 3.1 years.
30
DEBT AND PREFERRED EQUITY INVESTMENTS
10 Largest Investments
($000’s omitted) | 
|
| | | | | | | | Senior | | | | Current | |
Investment Type | | Book Value (1) | | Location | | Collateral Type | | Financing | | Last $ PSF | | Yield | |
| | | | | | | | | | | | | |
Preferred Equity | | $ | 204,850 | | New York City | | Office | | 926,260 | | $ | 447 | | 8.74 | % |
Mortgage and Mezzanine | | 109,105 | | New York City | | Office | | 1,109,000 | | $ | 1,110 | | 9.65 | % |
Preferred Equity | | 93,049 | | New York City | | Office | | 480,000 | | $ | 248 | | 13.27 | % |
Mortgage Loan | | 86,339 | | London, U.K. | | Office | | — | | $ | 821 | | 3.04 | % |
Mezzanine Loan | | 74,466 | | New York City | | Office/Retail | | 165,000 | | $ | 2,008 | | 13.89 | % |
Mortgage and Mezzanine | | 65,034 | | New York City | | Office/Retail | | 205,000 | | $ | 390 | | 7.34 | % |
Mezzanine Loan | | 60,000 | | New York City | | Office | | 170,000 | | $ | 337 | | 10.02 | % |
Junior Mortgage Participation | | 49,000 | | New York City | | Office | | 133,000 | | $ | 475 | | 8.77 | % |
Mortgage and Mezzanine | | 46,431 | | New York City | | Office | | 170,964 | | $ | 431 | | 10.83 | % |
Mortgage and Mezzanine | | 36,700 | | New York City | | Office/Retail | | — | | $ | 306 | | 8.73 | % |
| | | | | | | | | | | | | |
Total | | $ | 824,974 | | | | | | $ | 3,359,224 | | | | 9.34 | % |
| | | | | | | | | | | | | | | | |
(1) Net of unamortized fees, discounts, and reserves
31
SELECTED PROPERTY DATA Manhattan Properties
| 
|
| | | | | | # of | | Useable | | % of Total | | Occupancy (%) | | Annualized | | Annualized Cash Rent | | Total | |
Properties | | SubMarket | | Ownership | | Bldgs | | Sq. Feet | | Sq. Feet | | Mar-12 | | Dec-11 | | Sep-11 | | Jun-11 | | Mar-11 | | Cash Rent ($’s) | | 100% | | SLG | | Tenants | |
CONSOLIDATED PROPERTIES | | | | | | | | | | | | | | | | | | | | | | | | | | | |
“Same Store” | | | | | | | | | | | | | | | | | | | | | | | | | | | | | |
100 Church Street | | Downtown | | Fee Interest | | 1 | | 1,047,500 | | 3 | | 81.8 | | 70.9 | | 70.8 | | 70.5 | | 59.9 | | 32,039,352 | | 4 | | 3 | | 15 | |
120 West 45th Street | | Midtown | | Fee Interest | | 1 | | 440,000 | | 1 | | 86.0 | | 84.3 | | 85.3 | | 86.6 | | 87.6 | | 22,372,356 | | 2 | | 2 | | 26 | |
125 Park Avenue | | Grand Central | | Fee Interest | | 1 | | 604,245 | | 2 | | 70.0 | | 70.0 | | 94.0 | | 94.0 | | 94.2 | | 24,887,352 | | 3 | | 2 | | 19 | |
220 East 42nd Street | | Grand Central | | Fee Interest | | 1 | | 1,135,000 | | 4 | | 94.6 | | 95.2 | | 95.5 | | 91.4 | | 92.4 | | 47,186,568 | | 5 | | 4 | | 31 | |
317 Madison Avenue | | Grand Central | | Fee Interest | | 1 | | 450,000 | | 1 | | 85.1 | | 85.6 | | 86.1 | | 85.8 | | 86.9 | | 21,304,404 | | 2 | | 2 | | 81 | |
333 West 34th Street | | Penn Station | | Fee Interest | | 1 | | 345,400 | | 1 | | 90.2 | | 90.2 | | 90.2 | | 90.2 | | 90.2 | | 13,118,820 | | 1 | | 1 | | 3 | |
420 Lexington Ave (Graybar) | | Grand Central North | | Leasehold Interest | | 1 | | 1,188,000 | | 4 | | 90.9 | | 90.3 | | 86.4 | | 87.5 | | 89.7 | | 61,140,372 | | 7 | | 5 | | 218 | |
461 Fifth Avenue (1) | | Midtown | | Leasehold Interest | | 1 | | 200,000 | | 1 | | 98.8 | | 98.8 | | 98.8 | | 98.8 | | 98.8 | | 15,287,304 | | 2 | | 1 | | 16 | |
485 Lexington Avenue | | Grand Central North | | Fee Interest | | 1 | | 921,000 | | 3 | | 90.8 | | 90.8 | | 90.8 | | 95.4 | | 95.4 | | 48,251,652 | | 5 | | 4 | | 21 | |
555 West 57th Street | | Midtown West | | Fee Interest | | 1 | | 941,000 | | 3 | | 99.2 | | 99.2 | | 99.2 | | 99.2 | | 99.2 | | 32,780,184 | | 4 | | 3 | | 11 | |
609 Fifth Avenue | | Rockefeller Center | | Fee Interest | | 1 | | 160,000 | | 1 | | 84.7 | | 84.7 | | 84.2 | | 83.0 | | 85.0 | | 13,392,588 | | 1 | | 1 | | 9 | |
625 Madison Avenue | | Plaza District | | Leasehold Interest | | 1 | | 563,000 | | 2 | | 94.5 | | 94.6 | | 94.6 | | 94.6 | | 98.9 | | 43,045,272 | | 5 | | 4 | | 24 | |
673 First Avenue | | Grand Central South | | Leasehold Interest | | 1 | | 422,000 | | 1 | | 99.7 | | 99.7 | | 99.7 | | 99.7 | | 99.7 | | 19,560,024 | | 2 | | 2 | | 9 | |
711 Third Avenue (2) | | Grand Central North | | Leasehold Interest | | 1 | | 524,000 | | 2 | | 87.5 | | 94.8 | | 94.2 | | 94.2 | | 93.3 | | 26,653,272 | | 3 | | 2 | | 18 | |
750 Third Avenue | | Grand Central North | | Fee Interest | | 1 | | 780,000 | | 3 | | 97.9 | | 97.1 | | 97.1 | | 97.1 | | 98.7 | | 40,997,172 | | 5 | | 4 | | 31 | |
810 Seventh Avenue | | Times Square | | Fee Interest | | 1 | | 692,000 | | 2 | | 86.4 | | 86.4 | | 86.4 | | 84.2 | | 81.5 | | 38,340,336 | | 4 | | 3 | | 40 | |
919 Third Avenue (3) | | Grand Central North | | Fee Interest | | 1 | | 1,454,000 | | 5 | | 96.9 | | 99.9 | | 99.9 | | 99.9 | | 99.9 | | 84,407,724 | | | | 4 | | 14 | |
1185 Avenue of the Americas | | Rockefeller Center | | Leasehold Interest | | 1 | | 1,062,000 | | 3 | | 99.9 | | 99.9 | | 99.9 | | 99.9 | | 99.5 | | 75,487,668 | | 8 | | 7 | | 19 | |
1350 Avenue of the Americas | | Rockefeller Center | | Fee Interest | | 1 | | 562,000 | | 2 | | 97.8 | | 90.0 | | 91.5 | | 87.1 | | 87.4 | | 35,448,600 | | 4 | | 3 | | 40 | |
1 Madison Avenue | | Park Avenue South | | Fee Interest | | 1 | | 1,176,900 | | 4 | | 99.8 | | 99.8 | | 99.8 | | 99.8 | | 99.8 | | 67,524,960 | | 7 | | 6 | | 2 | |
331 Madison Avenue | | Grand Central | | Fee Interest | | 1 | | 114,900 | | 0 | | 96.9 | | 96.9 | | 96.9 | | 96.9 | | 96.9 | | 4,993,080 | | 1 | | 0 | | 17 | |
| | | | | | | | | | | | | | | | | | | | | | | | | | | | | |
Subtotal / Weighted Average | | 21 | | 14,782,945 | | 48 | % | 92.6 | % | 92.0 | % | 92.8 | % | 92.5 | % | 92.2 | % | $ | 768,219,060 | | 75 | % | 64 | % | 664 | |
| | | | | | | | | | | | | | | | | | | | | | | | | | | | | |
“Non Same Store” | | | | | | | | | | | | | | | | | | | | | | | | | | | | | |
51 East 42nd Street | | Grand Central | | Fee Interest | | 1 | | 142,000 | | 0 | | 96.9 | | 95.5 | | — | | — | | — | | 6,905,292 | | 1 | | 1 | | 90 | |
110 East 42nd Street | | Grand Central | | Fee Interest | | 1 | | 205,000 | | 1 | | 78.7 | | 69.9 | | 71.2 | | 72.6 | | — | | 7,201,980 | | 1 | | 1 | | 19 | |
180 Maiden Lane (4) | | Financial East | | Fee Interest | | 1 | | 1,090,000 | | 4 | | 97.7 | | 97.7 | | — | | — | | — | | 52,760,628 | | | | 2 | | 5 | |
521 Fifth Avenue | | Grand Central | | Fee Interest | | 1 | | 460,000 | | 2 | | 90.9 | | 90.9 | | 92.1 | | 88.9 | | 83.3 | | 23,253,552 | | 3 | | 2 | | 47 | |
1515 Broadway | | Times Square | | Fee Interest | | 1 | | 1,750,000 | | 6 | | 100.0 | | 100.0 | | 100.0 | | 98.5 | | 98.5 | | 107,615,880 | | 12 | | 10 | | 13 | |
| | | | | | | | | | | | | | | | | | | | | | | | | | | | | |
Subtotal / Weighted Average | | 5 | | 3,647,000 | | 12 | % | 96.8 | % | 96.2 | % | 96.1 | % | 94.4 | % | 95.3 | % | $ | 197,737,332 | | 16 | % | 15 | % | 174 | |
| | | | | | | | | | | | | | | | | | | | | | | | | | | | | |
Total / Weighted Average Manhattan Consolidated Properties | | 26 | | 18,429,945 | | 60 | % | 93.4 | % | 92.8 | % | 93.2 | % | 92.8 | % | 92.6 | % | $ | 965,956,392 | | 91 | % | 79 | % | 838 | |
| | | | | | | | | | | | | | | | | | | | | | | | | | | | | |
UNCONSOLIDATED PROPERTIES | | | | | | | | | | | | | | | | | | | | | | | | | | | |
“Same Store” | | | | | | | | | | | | | | | | | | | | | | | | | | | | | |
100 Park Avenue - 50% | | Grand Central South | | Fee Interest | | 1 | | 834,000 | | 3 | | 95.0 | | 95.0 | | 95.0 | | 95.0 | | 93.2 | | 51,327,348 | | | | 2 | | 35 | |
388 & 390 Greenwich Street - 50.6% | | Downtown | | Fee Interest | | 2 | | 2,635,000 | | 9 | | 100.0 | | 100.0 | | 100.0 | | 100.0 | | 100.0 | | 107,986,128 | | | | 5 | | 1 | |
600 Lexington Avenue - 55% | | Eastside | | Fee Interest | | 1 | | 303,515 | | 1 | | 72.6 | | 72.6 | | 77.8 | | 80.9 | | 81.9 | | 14,598,300 | | | | 1 | | 23 | |
800 Third Avenue - 42.95% | | Grand Central North | | Fee Interest | | 1 | | 526,000 | | 2 | | 84.2 | | 84.3 | | 80.9 | | 80.9 | | 80.9 | | 25,676,604 | | | | 1 | | 36 | |
1745 Broadway - 32.3% | | Midtown | | Fee Interest | | 1 | | 674,000 | | 2 | | 100.0 | | 100.0 | | 100.0 | | 100.0 | | 100.0 | | 34,739,508 | | | | 1 | | 1 | |
| | | | | | | | | | | | | | | | | | | | | | | | | | | | | |
Subtotal / Weighted Average | | 6 | | 4,972,515 | | 16 | % | 95.8 | % | 95.8 | % | 95.8 | % | 96.0 | % | 95.7 | % | $ | 234,327,888 | | | | 10 | % | 96 | |
| | | | | | | | | | | | | | | | | | | | | | | | | | | | | |
“Non Same Store” | | | | | | | | | | | | | | | | | | | | | | | | | | | | | |
10 East 53rd Street - 55% | | Plaza District | | Fee Interest | | 1 | | 354,300 | | 1 | | 91.9 | | — | | — | | — | | — | | 18,977,292 | | | | 1 | | 19 | |
| | | | | | | | | | | | | | | | | | | | | | | | | | | | | |
Subtotal / Weighted Average | | 1 | | 354,300 | | 1 | % | 91.9 | % | — | | — | | — | | — | | $ | 18,977,292 | | | | 1 | % | 19 | |
| | | | | | | | | | | | | | | | | | | | | | | | | | | | | |
Total / Weighted Average Unconsolidated Properties | | 7 | | 5,326,815 | | 17 | % | 95.6 | % | 95.8 | % | 95.8 | % | 96.0 | % | 95.7 | % | $ | 253,305,180 | | | | 11 | % | 115 | |
| | | | | | | | | | | | | | | | | | | | | | | | | |
Manhattan Grand Total / Weighted Average | | 33 | | 23,756,760 | | 78 | % | 93.9 | % | 92.5 | % | 93.0 | % | 92.7 | % | 93.3 | % | $ | 1,219,261,572 | | | | | | 953 | |
Manhattan Grand Total - SLG share of Annualized Rent | | | | | | | | | | | | | | | | | | $ | 1,019,180,382 | | | | 90 | % | | |
Manhattan Same Store Occupancy % - Combined | | | | 19,755,460 | | 83 | % | 93.4 | % | 93.0 | % | 93.5 | % | 93.4 | % | 93.1 | % | | | | | | | | |
| | | | | | | | | | | | | | | | | | | | | | | | | |
Portfolio Grand Total | | 64 | | 30,561,460 | | 100 | % | 92.2 | % | 91.2 | % | 91.4 | % | 91.3 | % | 91.7 | % | $ | 1,392,581,628 | | | | | | 1,375 | |
Portfolio Grand Total - SLG Share of Annualized Rent | | | | | | | | | | | | | | | | | | $ | 1,129,681,134 | | | | 100 | % | | |
(1) SL Green holds an option to acquire the fee interest on this building.
(2) SL Green owns 50% of the building fee.
(3) SL Green holds a 51% interest in this consolidated joint venture asset.
(4) SL Green holds a 49.9% interest in this consolidated joint venture asset.
32
SELECTED PROPERTY DATA
Suburban Properties
| 
|
| | | | | | # of | | Useable | | % of Total | | Occupancy (%) | | Annualized | | Annualized
Cash Rent | | Total | |
Properties | | SubMarket | | Ownership | | Bldgs | | Sq. Feet | | Sq. Feet | | Mar-12 | | Dec-11 | | Sep-11 | | Jun-11 | | Mar-11 | | Cash Rent ($’s) | | 100% | | SLG | | Tenants | |
CONSOLIDATED PROPERTIES | | | | | | | | | | | | | | | | | | | | | | | | | | | |
“Same Store” Westchester, NY | | | | | | | | | | | | | | | | | | | | | | | | | | | |
1100 King Street - 1 Int’l Drive | | Rye Brook, Westchester | | Fee Interest | | 1 | | 90,000 | | 0 | | 74.9 | | 74.9 | | 74.9 | | 74.9 | | 74.9 | | 1,549,392 | | 0 | | 0 | | 1 | |
1100 King Street - 2 Int’l Drive | | Rye Brook, Westchester | | Fee Interest | | 1 | | 90,000 | | 0 | | 80.3 | | 80.3 | | 80.3 | | 80.3 | | 79.4 | | 1,382,580 | | 0 | | 0 | | 3 | |
1100 King Street - 3 Int’l Drive | | Rye Brook, Westchester | | Fee Interest | | 1 | | 90,000 | | 0 | | 78.7 | | 80.1 | | 80.1 | | 80.1 | | 80.1 | | 1,933,848 | | 0 | | 0 | | 4 | |
1100 King Street - 4 Int’l Drive | | Rye Brook, Westchester | | Fee Interest | | 1 | | 90,000 | | 0 | | 59.4 | | 59.4 | | 59.4 | | 49.0 | | 55.9 | | 1,551,156 | | 0 | | 0 | | 7 | |
1100 King Street - 5 Int’l Drive | | Rye Brook, Westchester | | Fee Interest | | 1 | | 90,000 | | 0 | | 79.2 | | 79.2 | | 79.9 | | 79.9 | | 79.9 | | 2,031,384 | | 0 | | 0 | | 7 | |
1100 King Street - 6 Int’l Drive | | Rye Brook, Westchester | | Fee Interest | | 1 | | 90,000 | | 0 | | 78.2 | | 78.2 | | 78.2 | | 78.2 | | 78.2 | | 2,475,960 | | 0 | | 0 | | 3 | |
520 White Plains Road | | Tarrytown, Westchester | | Fee Interest | | 1 | | 180,000 | | 1 | | 73.6 | | 73.6 | | 73.6 | | 73.6 | | 72.5 | | 3,662,100 | | 0 | | 0 | | 9 | |
115-117 Stevens Avenue | | Valhalla, Westchester | | Fee Interest | | 1 | | 178,000 | | 1 | | 85.5 | | 85.5 | | 84.9 | | 84.9 | | 84.4 | | 3,215,232 | | 0 | | 0 | | 13 | |
100 Summit Lake Drive | | Valhalla, Westchester | | Fee Interest | | 1 | | 250,000 | | 1 | | 69.5 | | 61.2 | | 61.2 | | 61.2 | | 59.8 | | 3,125,508 | | 0 | | 0 | | 9 | |
200 Summit Lake Drive | | Valhalla, Westchester | | Fee Interest | | 1 | | 245,000 | | 1 | | 87.5 | | 87.5 | | 87.5 | | 92.4 | | 92.4 | | 6,381,396 | | 1 | | 1 | | 7 | |
500 Summit Lake Drive | | Valhalla, Westchester | | Fee Interest | | 1 | | 228,000 | | 1 | | 76.9 | | 78.1 | | 76.2 | | 76.2 | | 76.2 | | 3,935,484 | | 0 | | 1 | | 6 | |
140 Grand Street | | White Plains, Westchester | | Fee Interest | | 1 | | 130,100 | | 0 | | 95.3 | | 93.6 | | 95.3 | | 94.4 | | 94.4 | | 4,173,408 | | 0 | | 0 | | 11 | |
360 Hamilton Avenue | | White Plains, Westchester | | Fee Interest | | 1 | | 384,000 | | 1 | | 94.3 | | 94.3 | | 94.3 | | 94.3 | | 94.6 | | 13,158,216 | | 1 | | 1 | | 16 | |
| | | | | | | | | | | | | | | | | | | | | | | | | | | | | |
Westchester, NY Subtotal/Weighted Average | | 13 | | 2,135,100 | | 8 | % | 81.5 | % | 80.6 | % | 80.5 | % | 80.6 | % | 80.6 | % | $ | 48,575,664 | | 5 | % | 5 | % | 96 | |
| | | | | | | | | | | | | | | | | | | | | | | | | | | | | |
“Same Store” Connecticut | | | | | | | | | | | | | | | | | | | | | | | | | | | |
1 Landmark Square | | Stamford, Connecticut | | Fee Interest | | 1 | | 312,000 | | 1 | | 95.2 | | 95.6 | | 93.1 | | 96.5 | | 95.0 | | 8,731,596 | | 1 | | 1 | | 58 | |
2 Landmark Square | | Stamford, Connecticut | | Fee Interest | | 1 | | 46,000 | | 0 | | 66.6 | | 64.1 | | 64.1 | | 64.1 | | 64.1 | | 688,416 | | 0 | | 0 | | 7 | |
3 Landmark Square | | Stamford, Connecticut | | Fee Interest | | 1 | | 130,000 | | 0 | | 54.6 | | 52.3 | | 51.1 | | 61.2 | | 54.0 | | 2,299,296 | | 0 | | 0 | | 12 | |
4 Landmark Square | | Stamford, Connecticut | | Fee Interest | | 1 | | 105,000 | | 0 | | 72.7 | | 72.7 | | 72.7 | | 79.8 | | 75.5 | | 2,170,452 | | 0 | | 0 | | 9 | |
5 Landmark Square | | Stamford, Connecticut | | Fee Interest | | 1 | | 61,000 | | 0 | | 99.5 | | 99.1 | | 99.5 | | 99.5 | | 99.3 | | 749,112 | | 0 | | 0 | | 11 | |
6 Landmark Square | | Stamford, Connecticut | | Fee Interest | | 1 | | 172,000 | | 1 | | 87.1 | | 87.1 | | 87.1 | | 87.1 | | 87.1 | | 3,923,760 | | 0 | | 0 | | 6 | |
680 Washington Boulevard (1) | | Stamford, Connecticut | | Fee Interest | | 1 | | 133,000 | | 0 | | 88.5 | | 88.5 | | 88.5 | | 88.5 | | 88.5 | | 3,952,008 | | | | 0 | | 7 | |
750 Washington Boulevard (1) | | Stamford, Connecticut | | Fee Interest | | 1 | | 192,000 | | 1 | | 93.6 | | 93.6 | | 93.6 | | 93.6 | | 91.6 | | 6,955,320 | | | | 0 | | 9 | |
1055 Washington Boulevard | | Stamford, Connecticut | | Leasehold Interest | | 1 | | 182,000 | | 1 | | 81.0 | | 84.5 | | 87.7 | | 89.2 | | 91.3 | | 5,448,360 | | 1 | | 0 | | 19 | |
300 Main Street | | Stamford, Connecticut | | Fee Interest | | 1 | | 130,000 | | 0 | | 88.8 | | 88.8 | | 87.0 | | 87.0 | | 89.0 | | 1,842,888 | | 0 | | 0 | | 19 | |
1010 Washington Boulevard | | Stamford, Connecticut | | Fee Interest | | 1 | | 143,400 | | 0 | | 51.5 | | 53.3 | | 47.7 | | 48.7 | | 50.2 | | 2,235,288 | | 0 | | 0 | | 14 | |
500 West Putnam Avenue | | Greenwich, Connecticut | | Fee Interest | | 1 | | 121,500 | | 0 | | 51.3 | | 51.3 | | 51.2 | | 51.2 | | 51.2 | | 2,704,884 | | 0 | | 0 | | 9 | |
| | | | | | | | | | | | | | | | | | | | | | | | | | | | | |
Connecticut Subtotal/Weighted Average | | 12 | | 1,727,900 | | 5 | % | 80.0 | % | 80.3 | % | 79.5 | % | 81.5 | % | 80.8 | % | $ | 41,701,380 | | 3 | % | 3 | % | 180 | |
| | | | | | | | | | | | | | | | | | | | | | | | | | | | | |
Total / Weighted Average Consolidated Properties | | 25 | | 3,863,000 | | 13 | % | 80.8 | % | 80.5 | % | 80.1 | % | 81.0 | % | 80.7 | % | $ | 90,277,044 | | 9 | % | 8 | % | 276 | |
| | | | | | | | | | | | | | | | | | | | | | | | | | | | | |
UNCONSOLIDATED PROPERTIES | | | | | | | | | | | | | | | | | | | | | | | | | | | |
“Same Store” | | | | | | | | | | | | | | | | | | | | | | | | | | | | | |
One Court Square - 30% | | Long Island City, New York | | Fee Interest | | 1 | | 1,402,000 | | 5 | | 100.0 | | 100.0 | | 100.0 | | 100.0 | | 100.0 | | 39,819,192 | | | | 1 | | 1 | |
The Meadows - 50% | | Rutherford, New Jersey | | Fee Interest | | 2 | | 582,100 | | 2 | | 80.8 | | 79.0 | | 78.2 | | 78.8 | | 79.5 | | 11,267,196 | | | | 0 | | 45 | |
16 Court Street - 35% | | Brooklyn, New York | | Fee Interest | | 1 | | 317,600 | | 1 | | 87.4 | | 90.3 | | 89.9 | | 88.7 | | 88.5 | | 10,274,976 | | | | 0 | | 67 | |
Jericho Plaza - 20.26% | | Jericho, New York | | Fee Interest | | 2 | | 640,000 | | 2 | | 95.2 | | 95.2 | | 95.3 | | 95.3 | | 95.3 | | 21,681,648 | | | | 0 | | 33 | |
Total / Weighted Average Unconsolidated Properties | | 6 | | 2,941,700 | | 10 | % | 93.8 | % | 93.8 | % | 93.6 | % | 93.6 | % | 93.7 | % | $ | 83,043,012 | | | | 2 | % | 146 | |
| | | | | | | | | | | | | | | | | | | | | | | | | | | | | |
Suburban Grand Total / Weighted Average | | 31 | | 6,804,700 | | 22 | % | 86.4 | % | 86.2 | % | 85.9 | % | 86.4 | % | 86.3 | % | $ | 173,320,056 | | | | | | 422 | |
Suburban Grand Total - SLG share of Annualized Rent | | | | | | | | | | | | | | | | | | $ | 110,500,752 | | | | 10 | % | | |
Suburban Same Store Occupancy % - Combined | | | | 6,804,700 | | 100 | % | 86.4 | % | 86.2 | % | 85.9 | % | 86.4 | % | 86.3 | % | | | | | | | | |
(1) SL Green holds a 51% interest in this consolidated joint venture asset.
33
SELECTED PROPERTY DATA
Retail, Development & Land Properties
| 
|
| | | | | | # of | | Useable | | % of Total | | Occupancy (%) | | Annualized | | Annualized | | Gross Total | | Total | |
Properties | | SubMarket | | Ownership | | Bldgs | | Sq. Feet | | Sq. Feet | | Mar-12 | | Dec-11 | | Sep-11 | | Jun-11 | | Mar-11 | | Cash Rent ($’s) | | Cash Rent (SLG%) | | Book Value | | Tenants | |
| | | | | | | | | | | | | | | | | | | | | | | | | | | | | |
“Same Store” Retail | | | | | | | | | | | | | | | | | | | | | | | | | | | | | |
1604 Broadway - 63% | | Times Square | | Leasehold Interest | | 1 | | 29,876 | | 6 | | 23.7 | | 23.7 | | 23.7 | | 23.7 | | 23.7 | | 2,001,902 | | 4 | | 7,490,827 | | 2 | |
11 West 34th Street - 30% | | Herald Square/Penn Station | | Fee Interest | | 1 | | 17,150 | | 4 | | 100.0 | | 100.0 | | 100.0 | | 100.0 | | 100.0 | | 1,802,496 | | 2 | | 15,382,405 | | 1 | |
21-25 West 34th Street - 50% | | Herald Square/Penn Station | | Fee Interest | | 1 | | 30,100 | | 7 | | 100.0 | | 100.0 | | 100.0 | | 100.0 | | 100.0 | | 6,845,232 | | 10 | | 23,349,965 | | 1 | |
27-29 West 34th Street - 50% | | Herald Square/Penn Station | | Fee Interest | | 1 | | 15,600 | | 3 | | 100.0 | | 100.0 | | 100.0 | | 100.0 | | 100.0 | | 4,236,420 | | 6 | | 47,970,967 | | 2 | |
379 West Broadway - 45% (1) | | Cast Iron/Soho | | Leasehold Interest | | 1 | | 62,006 | | 13 | | 100.0 | | 100.0 | | 100.0 | | 100.0 | | 100.0 | | 3,640,680 | | 5 | | 22,216,815 | | 5 | |
717 Fifth Avenue - 32.75% | | Midtown/Plaza District | | Fee Interest | | 1 | | 119,550 | | 26 | | 89.4 | | 89.4 | | 79.4 | | 79.4 | | 75.8 | | 33,439,896 | | 34 | | 279,966,857 | | 7 | |
Williamsburg Terrace | | Brooklyn, NY | | Fee Interest | | 1 | | 52,000 | | 11 | | 100.0 | | 100.0 | | 100.0 | | 100.0 | | 100.0 | | 1,577,532 | | 5 | | 16,357,696 | | 3 | |
| | | | | | | | | | | | | | | | | | | | | | | | | | | | | |
Subtotal/Weighted Average | | 7 | | 326,282 | | 71 | % | 89.1 | % | 89.1 | % | 85.5 | % | 85.5 | % | 84.1 | % | $ | 53,544,158 | | 66 | % | $ | 412,735,531 | | 21 | |
| | | | | | | | | | | | | | | | | | | | | | | | | | | | | |
“Non Same Store” Retail | | | | | | | | | | | | | | | | | | | | | | | | | | | |
19-21 East 65th Street - 80% | | Plaza District | | Leasehold Interest | | 2 | | 23,610 | | 5 | | 100.0 | | — | | — | | — | | — | | 1,423,830 | | 3 | | 7,409,660 | | 7 | |
44 West 55th Street - 80% | | Plaza District | | Fee Interest | | 1 | | 8,557 | | 2 | | 56.4 | | — | | — | | — | | — | | 301,848 | | 1 | | 4,864,875 | | 3 | |
724 Fifth Avenue - 50% | | Plaza District | | Fee Interest | | 1 | | 65,010 | | 14 | | 92.9 | | — | | — | | — | | — | | 10,261,968 | | 16 | | 223,116,537 | | 9 | |
747 Madison Avenue - 33.33% | | Plaza District | | Fee Interest | | 1 | | 10,000 | | 2 | | 100.0 | | 100.0 | | 100.0 | | — | | — | | 5,004,000 | | 5 | | 66,737,118 | | 1 | |
752 Madison Avenue - 80% | | Plaza District | | Leasehold Interest | | 1 | | 21,124 | | 5 | | 100.0 | | — | | — | | — | | — | | 2,480,004 | | 6 | | 6,610,989 | | 1 | |
762 Madison Avenue - 80% | | Plaza District | | Fee Interest | | 1 | | 6,109 | | 1 | | 100.0 | | — | | — | | — | | — | | 1,215,456 | | 3 | | 17,250,000 | | 5 | |
| | | | | | | | | | | | | | | | | | | | | | | | | | | | | |
Subtotal/Weighted Average | | 7 | | 134,410 | | 29 | % | 93.8 | % | 100.0 | % | 100.0 | % | 0.0 | % | 0.0 | % | $ | 20,687,106 | | 34 | % | $ | 325,989,179 | | 26 | |
| | | | | | | | | | | | | | | | | | | | | | | | | | | | | |
Total / Weighted Average Retail Properties | | 14 | | 460,692 | | 100 | % | 90.5 | % | 89.5 | % | 85.9 | % | 85.5 | % | 84.1 | % | $ | 74,231,264 | | 100 | % | $ | 738,724,711 | | 47 | |
| | | | | | | | | | | | | | | | | | | | | | | | | | | | | |
Development | | | | | | | | | | | | | | | | | | | | | | | | | | | | | |
125 Chubb Way | | Lyndhurst, NJ | | Fee Interest | | 1 | | 278,000 | | 11 | | 57.1 | | 32.1 | | 32.1 | | 10.7 | | 10.7 | | 3,419,431 | | 9 | | 52,669,829 | | 4 | |
150 Grand Street | | White Plains, NY | | Fee Interest | | 1 | | 85,000 | | 3 | | 26.4 | | 26.0 | | 18.3 | | 14.5 | | 15.8 | | 528,336 | | 1 | | 16,260,989 | | 14 | |
7 Renaissance Square - 50% | | White Plains, NY | | Fee Interest | | 1 | | 65,641 | | 3 | | — | | — | | — | | — | | — | | — | | — | | 5,287,309 | | — | |
180-182 Broadway - 25.5% | | Cast Iron/Soho | | Fee Interest | | 2 | | 153,000 | | 6 | | — | | — | | — | | — | | — | | — | | — | | 73,610,859 | | — | |
7 Landmark Square | | Stamford, Connecticut | | Fee Interest | | 1 | | 36,800 | | 1 | | 10.8 | | 10.8 | | 10.8 | | 10.8 | | 10.8 | | 313,536 | | 1 | | 9,315,790 | | 1 | |
3 Columbus Circle - 48.9% | | Columbus Circle | | Fee Interest | | 1 | | 741,500 | | 28 | | 15.7 | | 16.8 | | 19.7 | | 19.7 | | 20.1 | | 12,062,364 | | 15 | | 507,346,963 | | 26 | |
280 Park Avenue - 49.5% | | Park Avenue | | Fee Interest | | 1 | | 1,219,158 | | 47 | | 55.1 | | 74.5 | | 78.2 | | 78.2 | | — | | 57,572,100 | | 74 | | 992,333,491 | | 32 | |
1552-1560 Broadway - 50% | | Times Square | | Fee Interest | | 2 | | 35,897 | | 1 | | 59.7 | | 59.7 | | 59.7 | | — | | — | | — | | — | | 142,217,180 | | 2 | |
| | | | | | | | | | | | | | | | | | | | | | | | | | | | | |
Total / Weighted Average Development Properties | | 10 | | 2,614,996 | | 100 | | 38.0 | % | 44.7 | % | 47.0 | % | 44.4 | % | 14.4 | % | $ | 73,895,767 | | 100 | % | $ | 1,799,042,409 | | 79 | |
| | | | | | | | | | | | | | | | | | | | | | | | | | | | | |
“Same Store” Land | | | | | | | | | | | | | | | | | | | | | | | | | | | | | |
2 Herald Square (2) | | Herald Square/Penn Station | | Fee Interest | | 1 | | 354,400 | | 37 | | 100.0 | | 100.0 | | 100.0 | | 100.0 | | 100.0 | | 9,000,000 | | 45 | | 229,336,692 | | | |
885 Third Avenue (2) | | Midtown/Plaza District | | Fee Interest | | 1 | | 607,000 | | 63 | | 100.0 | | 100.0 | | 100.0 | | 100.0 | | 100.0 | | 11,095,000 | | 55 | | 329,943,115 | | | |
| | | | | | | | | | | | | | | | | | | | | | | | | | | | | |
Total / Weighted Average Land | | 2 | | 961,400 | | 100 | % | 100.0 | % | 100.0 | % | 100.0 | % | 100.0 | % | 100.0 | % | $ | 20,095,000 | | 100 | % | $ | 559,279,807 | | | |
Residential Properties
| | | | | | # of | | Useable | | | | Occupancy (%) | | Average Monthly | | Annualized | | Gross Total | | | |
Properties | | SubMarket | | Ownership | | Bldgs | | Sq. Feet | | Total Units | | Mar-12 | | Dec-11 | | Sep-11 | | Jun-11 | | Mar-11 | | Rent Per Unit ($’s) | | Cash Rent ($’s) | | Book Value | | | |
400 East 57th Street - 80% | | Upper East Side | | Fee Interest | | 1 | | 290,482 | | 260 | | 95.0 | | — | | — | | — | | — | | 2,442 | | 8,775,149 | | 109,866,276 | | | |
400 East 58th Street - 80% | | Upper East Side | | Fee Interest | | 1 | | 140,000 | | 125 | | 96.0 | | — | | — | | — | | — | | 2,743 | | 4,446,578 | | 48,224,533 | | | |
Total / Weighted Average Residential Properties | | 2 | | 430,482 | | 385 | | 95.3 | % | — | | — | | — | | — | | $ | 2,540 | | $ | 13,221,726 | | $ | 158,090,809 | | | |
| | | | | | | | | | | | | | | | | | | | | | | | | | | | | | | | |
(1) SL Green holds an option to acquire the fee interest on this property.
(2) Subject to long-term, third party net operating leases.
34
SELECTED PROPERTY DATA Manhattan Properties - Reckson Portfolio | 
|
| | | | | | Useable | | % of Total | | Occupancy (%) | | Annualized | | Annualized Cash Rent | | Total | |
Properties | | SubMarket | | Ownership | | Sq. Feet | | Sq. Feet | | Mar-12 | | Dec-11 | | Sep-11 | | Jun-11 | | Mar-11 | | Cash Rent ($’s) | | 100% | | SLG | | Tenants | |
CONSOLIDATED PROPERTIES | | | | | | | | | | | | | | | | | | | | | | | | | | | |
“Same Store” | | | | | | | | | | | | | | | | | | | | | | | | | | | |
333 West 34th Street | | Penn Station | | Fee Interest | | 345,400 | | 3 | | 90.2 | | 90.2 | | 90.2 | | 90.2 | | 90.2 | | 13,118,820 | | 4 | | 4 | | 3 | |
461 Fifth Avenue | | Midtown | | Leasehold Interest | | 200,000 | | 2 | | 98.8 | | 98.8 | | 98.8 | | 98.8 | | 98.8 | | 15,287,304 | | 5 | | 4 | | 16 | |
555 West 57th Street | | Midtown West | | Fee Interest | | 941,000 | | 9 | | 99.2 | | 99.2 | | 99.2 | | 99.2 | | 99.2 | | 32,780,184 | | 11 | | 9 | | 11 | |
750 Third Avenue | | Grand Central North | | Fee Interest | | 780,000 | | 8 | | 97.9 | | 97.1 | | 97.1 | | 97.1 | | 98.7 | | 40,997,172 | | 13 | | 11 | | 31 | |
810 Seventh Avenue | | Times Square | | Fee Interest | | 692,000 | | 7 | | 86.4 | | 86.4 | | 86.4 | | 84.2 | | 81.5 | | 38,340,336 | | 12 | | 10 | | 40 | |
919 Third Avenue | | Grand Central North | | Fee Interest (1) | | 1,454,000 | | 14 | | 96.9 | | 99.9 | | 99.9 | | 99.9 | | 99.9 | | 84,407,724 | | | | 12 | | 14 | |
1185 Avenue of the Americas | | Rockefeller Center | | Leasehold Interest | | 1,062,000 | | 10 | | 99.9 | | 99.9 | | 99.9 | | 99.9 | | 99.5 | | 75,487,668 | | 25 | | 20 | | 19 | |
1350 Avenue of the Americas | | Rockefeller Center | | Fee Interest | | 562,000 | | 5 | | 97.8 | | 90.0 | | 91.5 | | 87.1 | | 87.4 | | 35,448,600 | | 12 | | 10 | | 40 | |
| | | | | | | | | | | | | | | | | | | | | | | | | | | |
Total / Weighted Average Consolidated Properties | | | | 6,036,400 | | 59 | % | 96.5 | % | 96.4 | % | 96.5 | % | 95.9 | % | 95.7 | % | $ | 335,867,808 | | 82 | % | 80 | % | 174 | |
| | | | | | | | | | | | | | | | | | | | | | | | | | | |
Grand Total / Weighted Average | | | | | | 6,036,400 | | 59 | % | 96.5 | % | 96.4 | % | 96.5 | % | 95.9 | % | 95.7 | % | $ | 335,867,808 | | | | | | 174 | |
Grand Total - SLG share of Annualized Rent | | | | | | | | | | | | | | | | | | $ | 294,508,023 | | | | 80 | % | | |
|
Suburban Properties - Reckson Portfolio |
|
| | | | | | Useable | | % of Total | | Occupancy (%) | | Annualized | | Annualized Rent | | Total | |
Properties | | SubMarket | | Ownership | | Sq. Feet | | Sq. Feet | | Mar-12 | | Dec-11 | | Sep-11 | | Jun-11 | | Mar-11 | | Cash Rent ($’s) | | 100% | | SLG | | Tenants | |
CONSOLIDATED PROPERTIES | | | | | | | | | | | | | | | | | | | | | | | | | | | |
“Same Store” | | | | | | | | | | | | | | | | | | | | | | | | | | | |
1100 King Street - 1 Int’l Drive | | Rye Brook, Westchester | | Fee Interest | | 90,000 | | 1 | | 74.9 | | 74.9 | | 74.9 | | 74.9 | | 74.9 | | 1,549,392 | | 1 | | 0 | | 1 | |
1100 King Street - 2 Int’l Drive | | Rye Brook, Westchester | | Fee Interest | | 90,000 | | 1 | | 80.3 | | 80.3 | | 80.3 | | 80.3 | | 79.4 | | 1,382,580 | | 0 | | 0 | | 3 | |
1100 King Street - 3 Int’l Drive | | Rye Brook, Westchester | | Fee Interest | | 90,000 | | 1 | | 78.7 | | 80.1 | | 80.1 | | 80.1 | | 80.1 | | 1,933,848 | | 1 | | 1 | | 4 | |
1100 King Street - 4 Int’l Drive | | Rye Brook, Westchester | | Fee Interest | | 90,000 | | 1 | | 59.4 | | 59.4 | | 59.4 | | 49.0 | | 55.9 | | 1,551,156 | | 1 | | 0 | | 7 | |
1100 King Street - 5 Int’l Drive | | Rye Brook, Westchester | | Fee Interest | | 90,000 | | 1 | | 79.2 | | 79.2 | | 79.9 | | 79.9 | | 79.9 | | 2,031,384 | | 1 | | 1 | | 7 | |
1100 King Street - 6 Int’l Drive | | Rye Brook, Westchester | | Fee Interest | | 90,000 | | 1 | | 78.2 | | 78.2 | | 78.2 | | 78.2 | | 78.2 | | 2,475,960 | | 1 | | 1 | | 3 | |
520 White Plains Road | | Tarrytown, Westchester | | Fee Interest | | 180,000 | | 2 | | 73.6 | | 73.6 | | 73.6 | | 73.6 | | 72.5 | | 3,662,100 | | 1 | | 1 | | 9 | |
115-117 Stevens Avenue | | Valhalla, Westchester | | Fee Interest | | 178,000 | | 2 | | 85.5 | | 85.5 | | 84.9 | | 84.9 | | 84.4 | | 3,215,232 | | 1 | | 1 | | 13 | |
100 Summit Lake Drive | | Valhalla, Westchester | | Fee Interest | | 250,000 | | 2 | | 69.5 | | 61.2 | | 61.2 | | 61.2 | | 59.8 | | 3,125,508 | | 1 | | 1 | | 9 | |
200 Summit Lake Drive | �� | Valhalla, Westchester | | Fee Interest | | 245,000 | | 2 | | 87.5 | | 87.5 | | 87.5 | | 92.4 | | 92.4 | | 6,381,396 | | 2 | | 2 | | 7 | |
500 Summit Lake Drive | | Valhalla, Westchester | | Fee Interest | | 228,000 | | 2 | | 76.9 | | 78.1 | | 76.2 | | 76.2 | | 76.2 | | 3,935,484 | | 1 | | 1 | | 6 | |
140 Grand Street | | White Plains, Westchester | | Fee Interest | | 130,100 | | 1 | | 95.3 | | 93.6 | | 95.3 | | 94.4 | | 94.4 | | 4,173,408 | | 1 | | 1 | | 11 | |
360 Hamilton Avenue | | White Plains, Westchester | | Fee Interest | | 384,000 | | 4 | | 94.3 | | 94.3 | | 94.3 | | 94.3 | | 94.6 | | 13,158,216 | | 4 | | 4 | | 16 | |
680 Washington Avenue | | Stamford, Connecticut | | Fee Interest (1) | | 133,000 | | 1 | | 88.5 | | 88.5 | | 88.5 | | 88.5 | | 88.5 | | 3,952,008 | | | | 1 | | 7 | |
750 Washington Avenue | | Stamford, Connecticut | | Fee Interest (1) | | 192,000 | | 2 | | 93.6 | | 93.6 | | 93.6 | | 93.6 | | 91.6 | | 6,955,320 | | | | 1 | | 9 | |
1055 Washington Avenue | | Stamford, Connecticut | | Leasehold Interest | | 182,000 | | 2 | | 81.0 | | 84.5 | | 87.7 | | 89.2 | | 91.3 | | 5,448,360 | | 2 | | 1 | | 19 | |
1010 Washington Boulevard | | Stamford, Connecticut | | Fee Interest | | 143,400 | | 1 | | 51.5 | | 53.3 | | 47.7 | | 48.7 | | 50.2 | | 2,235,288 | | 1 | | 1 | | 14 | |
| | | | | | | | | | | | | | | | | | | | | | | | | | | |
Total / Weighted Average Consolidated Properties | | | | 2,785,500 | | 27 | % | 81.1 | % | 80.7 | % | 80.6 | % | 80.8 | % | 80.8 | % | $ | 67,166,640 | | 18 | % | 17 | % | 145 | |
| | | | | | | | | | | | | | | | | | | | | | | | | |
UNCONSOLIDATED PROPERTIES | | | | | | | | | | | | | | | | | | | | | | | | | |
“Same Store” | | | | | | | | | | | | | | | | | | | | | | | | | |
One Court Square - 30% | | Long Island City, New York | | Fee Interest | | 1,402,000 | | 14 | | 100.0 | | 100.0 | | 100.0 | | 100.0 | | 100.0 | | 39,819,192 | | | | 3 | | 1 | |
| | | | | | | | | | | | | | | | | | | | | | | | | | | |
Total / Weighted Average Unconsolidated Properties | | | | 1,402,000 | | 14 | % | 100.0 | % | 100.0 | % | 100.0 | % | 100.0 | % | 100.0 | % | $ | 39,819,192 | | | | 3 | % | 1 | |
| | | | | | | | | | | | | | | | | | | | | | | | | | | |
| | | | | | | | | | | | | | | | | | | | | | | | | | | |
Grand Total / Weighted Average | | | | | | 4,187,500 | | 41 | % | 87.4 | % | 87.2 | % | 87.1 | % | 87.2 | % | 87.3 | % | $ | 106,985,832 | | | | | | 146 | |
Grand Total - SLG share of Annualized Rent | | | | | | | | | | | | | | | | | | $ | 73,767,807 | | | | 20 | % | | |
| | | | | | | | | | | | | | | | | | | | | | | | | | | |
| | | | | | | | | | | | | | | | | | | | | | | | | | | |
Reckson Portfolio Grand Total | | | | | | 10,223,900 | | 100 | % | 92.8 | % | 92.6 | % | 92.6 | % | 92.3 | % | 92.2 | % | $ | 442,853,640 | | | | | | 320 | |
Portfolio Grand Total - SLG Share of Annualized Rent | | | | | | | | | | | | | | | | | | $ | 368,275,830 | | 100 | % | 100 | % | | |
(1) SL Green holds a 51% interest in this consolidated joint venture asset.
35
| |
LARGEST TENANTS BY SQUARE FEET LEASED Manhattan and Suburban Properties
| 
|
| | | | | | | | | | | | | | | | % of | | | |
| | | | | | | | | | | | % of | | SLG Share of | | SLG Share of | | | |
| | | | Lease | | Total | | Annualized | | PSF | | Annualized | | Annualized | | Annualized | | Credit | |
Tenant Name | | Property | | Expiration | | Square Feet | | Cash Rent ($) | | Annualized | | Cash Rent | | Cash Rent($) | | Cash Rent | | Rating (2) | |
| | | | | | | | | | | | | | | | | | | |
Citigroup, N.A. | | 388 & 390 Greenwich Street, 485 Lexington Avenue, 750 Third Avenue, 800 Third Avenue, 750 Washington Blvd & One Court Square | | Various | | 4,425,032 | | $ | 167,977,622 | (1) | $ | 37.96 | | 12.1 | % | $ | 84,783,524 | | 7.5 | % | A- | |
Viacom International, Inc. | | 1515 Broadway | | 2015 & 2020 | | 1,271,881 | | 78,331,587 | | $ | 61.59 | | 5.6 | % | 78,331,587 | | 6.9 | % | BBB+ | |
Credit Suisse Securities (USA), Inc. | | 1 Madison Avenue & 280 Park Avenue | | 2012, 2014 & 2020 | | 1,250,893 | | 72,882,582 | | $ | 58.26 | | 5.2 | % | 69,530,207 | | 6.2 | % | A+ | |
AIG Employee Services, Inc. | | 180 Maiden Lane | | 2014 | | 803,222 | | 41,777,526 | | $ | 52.01 | | 3.0 | % | 20,855,341 | | 1.8 | % | A- | |
Random House, Inc. | | 1745 Broadway | | 2018 | | 644,598 | | 34,739,509 | | $ | 53.89 | | 2.5 | % | 11,206,966 | | 1.0 | % | BBB+ | |
Debevoise & Plimpton, LLP | | 919 Third Avenue | | 2021 | | 619,353 | | 40,522,397 | | $ | 65.43 | | 2.9 | % | 20,666,422 | | 1.8 | % | | |
Omnicom Group, Inc. | | 220 East 42nd Street & 420 Lexington Avenue | | 2017 | | 494,476 | | 20,406,901 | | $ | 41.27 | | 1.5 | % | 20,406,901 | | 1.8 | % | BBB+ | |
Ralph Lauren Corporation | | 625 Madison Avenue & 379 West Broadway | | 2017 & 2019 | | 342,129 | | 22,601,244 | | $ | 66.06 | | 1.6 | % | 22,601,244 | | 2.0 | % | A- | |
The City of New York | | 16 Court Street & 100 Church Street | | 2013, 2014 & 2017 | | 341,903 | | 13,545,702 | | $ | 39.62 | | 1.0 | % | 13,025,123 | | 1.2 | % | | |
Advance Magazine Group, Fairchild Publications | | 750 Third Avenue & 485 Lexington Avenue | | 2021 | | 339,195 | | 14,901,197 | | $ | 43.93 | | 1.1 | % | 14,901,197 | | 1.3 | % | | |
Harper Collins Publishers LLC | | 1350 Avenue of the Americas & 10 East 53rd Street | | 2014 & 2020 | | 291,028 | | 15,584,261 | | $ | 53.55 | | 1.1 | % | 10,130,154 | | 0.9 | % | | |
C.B.S. Broadcasting, Inc. | | 555 West 57th Street | | 2023 | | 282,385 | | 10,550,392 | | $ | 37.36 | | 0.8 | % | 10,550,392 | | 0.9 | % | BBB | |
Schulte, Roth & Zabel LLP | | 919 Third Avenue | | 2021 | | 263,186 | | 15,802,296 | | $ | 60.04 | | 1.1 | % | 8,059,171 | | 0.7 | % | | |
The Metropolitan Transportation Authority | | 333 West 34th Street & 420 Lexington Avenue | | 2016 & 2021 | | 242,663 | | 8,712,814 | | $ | 35.90 | | 0.6 | % | 8,712,814 | | 0.8 | % | | |
New York Presbyterian Hospital | | 673 First Avenue | | 2021 | | 232,772 | | 10,043,448 | | $ | 43.15 | | 0.7 | % | 10,043,448 | | 0.9 | % | | |
HF Management Services LLC | | 100 Church Street | | 2032 | | 230,394 | | 6,912,694 | | $ | 30.00 | | 0.5 | % | 6,912,694 | | 0.6 | % | | |
BMW of Manhattan | | 555 West 57th Street | | 2022 | | 227,782 | | 5,649,833 | | $ | 24.80 | | 0.4 | % | 5,649,833 | | 0.5 | % | | |
Stroock, Stroock & Lavan LLP | | 180 Maiden Lane | | 2023 | | 223,434 | | 9,964,354 | | $ | 44.60 | | 0.7 | % | 4,974,205 | | 0.4 | % | | |
The Travelers Indemnity Company | | 485 Lexington Avenue & 2 Jericho Plaza | | 2015 & 2016 | | 213,456 | | 10,582,851 | | $ | 49.58 | | 0.8 | % | 9,535,416 | | 0.8 | % | AA | |
The City University of New York - CUNY | | 555 West 57th Street & 16 Court Street | | 2012, 2015 & 2030 | | 207,136 | | 7,509,943 | | $ | 36.26 | | 0.5 | % | 6,989,403 | | 0.6 | % | | |
Verizon | | 120 West 45th Street, 1100 King Street Bldg 1, 1 Landmark Square, 2 Landmark Square & 500 Summit Lake Drive | | Various | | 204,076 | | 5,561,661 | | $ | 27.25 | | 0.8 | % | 5,561,661 | | 1.1 | % | A- | |
Amerada Hess Corp. | | 1185 Avenue of the Americas | | 2027 | | 181,569 | | 11,983,375 | | $ | 66.00 | | 0.9 | % | 11,983,375 | | 1.1 | % | BBB | |
Fuji Color Processing Inc. | | 200 Summit Lake Drive | | 2013 | | 165,880 | | 5,236,060 | | $ | 31.57 | | 0.4 | % | 5,236,060 | | 0.5 | % | AA- | |
King & Spalding | | 1185 Avenue of the Americas | | 2025 | | 162,243 | | 9,766,164 | | $ | 60.19 | | 0.7 | % | 9,766,164 | | 0.9 | % | | |
United Nations | | 220 East 42nd Street | | 2014, 2017, 2021 & 2022 | | 162,146 | | 7,144,222 | | $ | 44.06 | | 0.5 | % | 7,144,222 | | 0.6 | % | | |
News America Incorporated | | 1185 Avenue of the Americas | | 2020 | | 161,722 | | 13,374,080 | | $ | 82.70 | | 1.0 | % | 13,374,080 | | 1.2 | % | BB+ | |
National Hockey League | | 1185 Avenue of the Americas | | 2022 | | 148,217 | | 11,440,497 | | $ | 77.19 | | 0.8 | % | 11,440,497 | | 1.0 | % | | |
New York Hospitals Center/Mount Sinai | | 625 Madison Avenue & 673 First Avenue | | 2016, 2021 & 2026 | | 146,917 | | 6,842,482 | | $ | 46.57 | | 0.5 | % | 6,842,482 | | 0.6 | % | | |
D.E. Shaw and Company L.P. | | 120 West 45th Street | | 2013, 2015 & 2021 | | 145,964 | | 9,046,667 | | $ | 61.98 | | 0.6 | % | 9,046,667 | | 0.8 | % | | |
Banque National De Paris | | 919 Third Avenue | | 2016 | | 145,834 | | 9,174,537 | | $ | 62.91 | | 0.7 | % | 4,679,014 | | 0.4 | % | | |
| | | | | | | | | | | | | | | | | | | |
Total | | | | | | 14,571,486 | | $ | 698,568,898 | (1) | $ | 47.94 | | 50.6 | % | $ | 522,940,263 | | 46.9 | % | | |
| | | | | | | | | | | | | | | | | | | |
Portfolio Grand Total | | | | | | 30,561,460 | | $ | 1,392,581,628 | (1) | $ | 45.57 | | | | $ | 1,129,681,134 | | | | | |
(1) - Reflects the net rent of $40.99 PSF for the 388-390 Greenwich Street lease. If this lease were included on a gross basis, Citigroup’s total PSF annualized rent would be $48.80.
Total PSF annualized rent for the largest tenants would be $51.23 and Total PSF annualized rent for the Wholly Owned Portfolio + Allocated JV properties would be $47.14.
(2) - 43% of Portfolio’s largest tenants have investment grade credit ratings. 33% of SLG share of annualized rent is derived from these tenants.
36
| |
TENANT DIVERSIFICATION Manhattan and Suburban Properties
| 
|
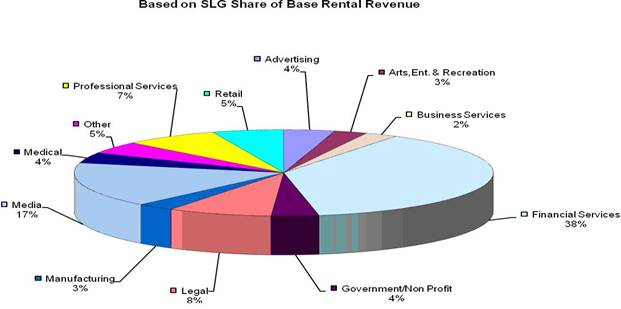
37
| |
Leasing Activity - Manhattan Properties
Available Space
| 
|
|
Activity | | Building Address | | # of Leases | | Useable SF | | Rentable SF | | Escalated Rent/
Rentable SF ($'s)(1) | |
| | | | | | | | | | | |
Vacancy at 12/31/11 | | | | | | 1,835,388 | | | | | |
| | | | | | | | | | | |
Add: Acquired Vacancies | | 10 East 53rd Street | | | | 28,860 | | | | | |
| | | | | | | | | | | |
Less: Property Taken Out of Service | | 280 Park Avenue | | | | (311,035 | ) | | | | |
| | | | | | | | | | | |
Space which became available during the Quarter (2): | | | | | | | | | |
Office | | | | | | | | | | | |
| | 51 East 42nd Street | | 6 | | 3,428 | | 3,428 | | $ | 52.89 | |
| | 120 West 45th Street | | 1 | | 5,488 | | 6,307 | | $ | 76.29 | |
| | 220 East 42nd Street | | 3 | | 7,132 | | 7,697 | | $ | 62.17 | |
| | 317 Madison Avenue | | 7 | | 15,895 | | 18,214 | | $ | 48.43 | |
| | 420 Lexington Avenue | | 7 | | 12,725 | | 14,464 | | $ | 49.58 | |
| | 625 Madison Avenue | | 1 | | 44,747 | | 46,053 | | $ | 66.05 | |
| | 711 Third Avenue | | 1 | | 42,575 | | 45,575 | | $ | 30.04 | |
| | 750 Third Avenue | | 2 | | 9,571 | | 9,944 | | $ | 45.18 | |
| | 800 Third Avenue | | 2 | | 8,856 | | 8,856 | | $ | 51.20 | |
| | 919 Third Avenue | | 4 | | 43,311 | | 43,380 | | $ | 70.22 | |
| | 1350 Avenue of the Americas | | 2 | | 7,736 | | 7,716 | | $ | 87.30 | |
| | Total/Weighted Average | | 36 | | 201,464 | | 211,634 | | $ | 55.63 | |
| | | | | | | | | | | |
Retail | | | | | | | | | | | |
| | 420 Lexington Avenue | | 1 | | 3,019 | | 3,214 | | $ | 227.56 | |
| | Total/Weighted Average | | 1 | | 3,019 | | 3,214 | | $ | 227.56 | |
| | | | | | | | | | | |
Storage | | | | | | | | | | | |
| | 420 Lexington Avenue | | 1 | | 49 | | 74 | | $ | 28.72 | |
| | 625 Madison Avenue | | 1 | | 661 | | 661 | | $ | 18.12 | |
| | Total/Weighted Average | | 2 | | 710 | | 735 | | $ | 19.19 | |
| | | | | | | | | | | |
| | Total Space which became available during the Quarter | | | | | | | | | |
| | Office | | 36 | | 201,464 | | 211,634 | | $ | 55.63 | |
| | Retail | | 1 | | 3,019 | | 3,214 | | $ | 227.56 | |
| | Storage | | 2 | | 710 | | 735 | | $ | 19.19 | |
| | | | 39 | | 205,193 | | 215,583 | | $ | 58.07 | |
| | | | | | | | | | | |
| | Total Available Space | | | | 1,758,406 | | | | | |
(1) Escalated Rent is calculated as Total Annual Income less Electric Charges.
(2) Includes expiring space, relocating tenants and move-outs where tenants vacated. Excludes lease expirations where tenants heldover.
38
Leasing Activity - Manhattan Properties
Leased Space
| 
|
Activity | | Building Address | | # of Leases | | Term
(Yrs) | | Useable SF | | Rentable SF | | New Cash Rent
/ Rentable SF(1) | | Prev. Escalated
Rent/ Rentable
SF(2) | | TI / Rentable
SF | | Free Rent #
of Months | |
| | | | | | | | | | | | | | | | | | | |
Available Space | | | | | | 1,758,406 | | | | | | | | | | | |
| | | | | | | | | | | | | | | | | | | |
Office | | | | | | | | | | | | | | | | | | | |
| | 51 East 42nd Street | | 7 | | 2.0 | | 5,528 | | 5,654 | | $ | 46.13 | | $ | 51.01 | | $ | 1.54 | | 0.4 | |
| | 100 Church Street | | 2 | | 17.7 | | 113,632 | | 115,762 | | $ | 33.50 | | $ | — | | $ | 67.34 | | 6.0 | |
| | 110 East 42nd Street | | 4 | | 4.2 | | 18,150 | | 18,226 | | $ | 43.78 | | $ | 47.48 | | $ | 34.68 | | 1.7 | |
| | 120 West 45th Street | | 2 | | 6.6 | | 12,890 | | 13,313 | | $ | 61.63 | | $ | 56.49 | | $ | 5.70 | | 3.3 | |
| | 317 Madison Avenue | | 6 | | 3.1 | | 13,920 | | 15,633 | | $ | 37.50 | | $ | 50.38 | | $ | 0.26 | | — | |
| | 420 Lexington Avenue | | 9 | | 4.8 | | 20,219 | | 24,565 | | $ | 44.78 | | $ | 52.46 | | $ | 12.73 | | 2.0 | |
| | 625 Madison Avenue | | 1 | | 8.0 | | 44,747 | | 49,104 | | $ | 72.48 | | $ | 61.95 | | $ | 45.00 | | 5.0 | |
| | 711 Third Avenue | | 1 | | 13.7 | | 4,289 | | 4,431 | | $ | 48.00 | | $ | — | | $ | 68.45 | | 11.0 | |
| | 750 Third Avenue | | 1 | | 10.1 | | 14,356 | | 16,881 | | $ | 45.00 | | $ | 52.99 | | $ | 65.00 | | 13.0 | |
| | 800 Third Avenue | | 2 | | 4.5 | | 8,466 | | 8,231 | | $ | 53.02 | | $ | 47.81 | | $ | — | | 1.9 | |
| | 1350 Avenue of the Americas | | 6 | | 6.8 | | 51,405 | | 53,126 | | $ | 62.53 | | $ | 63.59 | | $ | 34.20 | | 2.8 | |
| | Total/Weighted Average | | 41 | | 10.5 | | 307,602 | | 324,926 | | $ | 48.42 | | $ | 57.60 | | $ | 43.88 | | 4.6 | |
| | | | | | | | | | | | | | | | | | | |
Retail | | | | | | | | | | | | | | | | | | | |
| | 420 Lexington Avenue | | 1 | | 10.4 | | 3,019 | | 3,214 | | $ | 310.00 | | $ | 227.56 | | $ | 46.67 | | 3.0 | |
| | 750 Third Avenue | | 1 | | 10.4 | | 1,380 | | 1,380 | | $ | 147.82 | | $ | 176.04 | | $ | — | | 5.0 | |
| | Total/Weighted Average | | 2 | | 10.4 | | 4,399 | | 4,594 | | $ | 261.28 | | $ | 212.08 | | $ | 32.65 | | 3.6 | |
| | | | | | | | | | | | | | | | | | | |
Storage | | | | | | | | | | | | | | | | | | | |
| | 420 Lexington Avenue | | 1 | | 1.6 | | 74 | | 84 | | $ | 27.00 | | $ | 25.86 | | $ | — | | — | |
| | Total/Weighted Average | | 1 | | 1.6 | | 74 | | 84 | | $ | 27.00 | | $ | 25.86 | | $ | — | | — | |
| | | | | | | | | | | | | | | | | | | |
Leased Space | | | | | | | | | | | | | | | | | |
| | Office (3) | | 41 | | 10.5 | | 307,602 | | 324,926 | | $ | 48.42 | | $ | 57.60 | | $ | 43.88 | | 4.6 | |
| | Retail | | 2 | | 10.4 | | 4,399 | | 4,594 | | $ | 261.28 | | $ | 212.08 | | $ | 32.65 | | 3.6 | |
| | Storage | | 1 | | 1.6 | | 74 | | 84 | | $ | 27.00 | | $ | 25.86 | | $ | — | | — | |
| | Total | | 44 | | 10.5 | | 312,075 | | 329,604 | | $ | 51.38 | | $ | 62.85 | | $ | 43.71 | | 4.6 | |
| | | | | | | | | | | | | | | | | | | |
Total Available Space as of 3/31/12 | | | | | | 1,446,331 | | | | | | | | | | | |
| | | | | | | | | | | | | | | | | | | |
Early Renewals | | | | | | | | | | | | | | | | | | | |
Office | | | | | | | | | | | | | | | | | | | |
| | 51 East 42nd Street | | 3 | | 4.2 | | 8,905 | | 8,967 | | $ | 44.85 | | $ | 47.42 | | $ | — | | — | |
| | 100 Park Avenue | | 1 | | 2.1 | | 4,408 | | 5,118 | | $ | 89.71 | | $ | 89.71 | | $ | — | | 0.5 | |
| | 317 Madison Avenue | | 3 | | 5.0 | | 3,663 | | 4,628 | | $ | 41.63 | | $ | 42.49 | | $ | 1.54 | | 0.2 | |
| | 420 Lexington Avenue | | 3 | | 5.0 | | 4,021 | | 6,305 | | $ | 50.30 | | $ | 52.81 | | $ | 10.55 | | 3.2 | |
| | 750 Third Avenue | | 2 | | 9.0 | | 22,916 | | 23,230 | | $ | 59.57 | | $ | 61.81 | | $ | 15.75 | | 2.0 | |
| | 1745 Broadway | | 1 | | 5.0 | | 339,936 | | 361,044 | | $ | 75.00 | | $ | 50.74 | | $ | 4.87 | | — | |
| | Total/Weighted Average | | 13 | | 5.2 | | 383,849 | | 409,292 | | $ | 72.89 | | $ | 51.72 | | $ | 5.37 | | 0.2 | |
| | | | | | | | | | | | | | | | | | | |
Storage | | | | | | | | | | | | | | | | | | | |
| | 317 Madison Avenue | | 1 | | 5.0 | | 19 | | 61 | | $ | 25.65 | | 25.65 | | $ | — | | 0.5 | |
| | 673 First Avenue | | 1 | | 3.0 | | 700 | | 1,000 | | $ | 18.00 | | 19.77 | | $ | — | | — | |
| | Total/Weighted Average | | 2 | | 3.1 | | 719 | | 1,061 | | $ | 18.44 | | $ | 20.11 | | $ | — | | 0.0 | |
| | | | | | | | | | | | | | | | | | | |
Renewals | | | | | | | | | | | | | | | | | | | |
| | Early Renewals Office | | 13 | | 5.2 | | 383,849 | | 409,292 | | $ | 72.89 | | $ | 51.72 | | $ | 5.37 | | 0.2 | |
| | Early Renewals Storage | | 2 | | 3.1 | | 719 | | 1,061 | | $ | 18.44 | | $ | 20.11 | | $ | — | | 0.0 | |
| | Total | | 15 | | 5.2 | | 384,568 | | 410,353 | | $ | 72.75 | | $ | 51.64 | | $ | 5.36 | | 0.2 | |
(1) | Annual initial Base Rent. |
(2) | Escalated Rent is calculated as Total Annual Income less Electric Charges. |
(3) | Average starting office rent excluding new tenants replacing vacancies is $60.11/rsf for 130,195 rentable SF. |
| Average starting office rent for office space (leased and early renewals, excluding new tenants replacing vacancies) is $69.81/rsf for 539,487 rentable SF. |
39
Leasing Activity - Suburban Properties | 
|
|
Available Space |
|
Activity | | Building Address | | # of Leases | | Useable SF | | Rentable SF | | Escalated Rent/
Rentable SF ($’s)(1) | |
| | | | | | | | | | | |
Vacancy at 12/31/11 | | | | | | 1,033,182 | | | | | |
| | | | | | | | | | | |
Space which became available during the Quarter (2): | | | | | | | | | |
Office | | | | | | | | | | | |
| | 500 Summit Lake Drive | | 1 | | 2,944 | | 2,944 | | $ | 23.80 | |
| | 1 Landmark Square | | 4 | | 13,482 | | 13,482 | | $ | 30.50 | |
| | 300 Main Street | | 1 | | 1,000 | | 1,000 | | $ | 30.00 | |
| | 1010 Washington Boulevard | | 4 | | 6,877 | | 6,877 | | $ | 30.34 | |
| | 1055 Washington Boulevard | | 1 | | 6,460 | | 6,460 | | $ | 40.66 | |
| | 500 West Putnam Avenue | | 1 | | 2,491 | | 2,491 | | $ | 43.56 | |
| | The Meadows | | 1 | | 3,580 | | 3,580 | | $ | 27.61 | |
| | Jericho Plaza | | 1 | | 26,065 | | 26,065 | | $ | 36.35 | |
| | 16 Court Street | | 7 | | 13,603 | | 12,998 | | $ | 39.08 | |
| | Total/Weighted Average | | 21 | | 77,816 | | 77,211 | | $ | 34.62 | |
| | | | | | | | | | | |
Storage | | | | | | | | | | | |
| | 360 Hamilton Avenue | | 1 | | 224 | | 224 | | $ | 13.00 | |
| | Total/Weighted Average | | 1 | | 224 | | 224 | | $ | 13.00 | |
| | | | | | | | | | | |
| | Total Space which became available during the Quarter | | | | | | | |
| | Office | | 21 | | 77,816 | | 77,211 | | $ | 34.62 | |
| | Storage | | 1 | | 224 | | 224 | | $ | 13.00 | |
| | | | 22 | | 78,040 | | 77,435 | | $ | 34.56 | |
| | | | | | | | | | | |
| | Total Available Space | | | | 1,111,222 | | | | | |
(1) | Escalated Rent is calculated as Total Annual Income less Electric Charges. |
(2) | Includes expiring space, relocating tenants and move-outs where tenants vacated. Excludes lease expirations where tenants heldover. |
40
Leasing Activity - Suburban Properties | 
|
|
Leased Space |
|
Activity | | Building Address | | # of Leases | | Term
(Yrs) | | Useable SF | | Rentable SF | | New Cash Rent
/ Rentable SF(1) | | Prev. Escalated
Rent/ Rentable
SF(2) | | TI / Rentable
SF | | Free Rent #
of Months | |
| | | | | | | | | | | | | | | | | | | |
Available Space | | | | | | 1,111,222 | | | | | | | | | | | |
| | | | | | | | | | | | | | | | | | | |
Office | | | | | | | | | | | | | | | | | | | |
| | 100 Summit Lake Drive | | 1 | | 7.6 | | 20,817 | | 20,817 | | $ | 23.00 | | $ | — | �� | $ | 25.41 | | 7.0 | |
| | 140 Grand Street | | 1 | | 5.3 | | 2,135 | | 2,135 | | $ | 28.00 | | $ | 27.74 | | $ | 10.00 | | 3.0 | |
| | 1 Landmark Square | | 6 | | 5.6 | | 12,092 | | 12,092 | | $ | 33.31 | | $ | 34.27 | | $ | 13.35 | | 3.0 | |
| | 2 Landmark Square | | 1 | | 3.3 | | 1,182 | | 1,375 | | $ | 30.00 | | $ | — | | $ | 9.00 | | 3.0 | |
| | 3 Landmark Square | | 1 | | 11.0 | | 3,060 | | 3,060 | | $ | 27.00 | | $ | — | | $ | 52.00 | | 12.0 | |
| | 300 Main Street | | 1 | | 1.0 | | 1,000 | | 1,000 | | $ | 30.00 | | $ | 30.00 | | $ | — | | — | |
| | 1010 Washington Boulevard | | 3 | | 2.5 | | 4,189 | | 4,189 | | $ | 29.84 | | $ | 29.96 | | $ | 3.76 | | 0.2 | |
| | 500 West Putnam Avenue | | 1 | | 5.4 | | 2,491 | | 2,491 | | $ | 43.00 | | $ | 43.56 | | $ | — | | 3.0 | |
| | The Meadows | | 4 | | 3.3 | | 14,059 | | 14,059 | | $ | 25.28 | | $ | 27.61 | | $ | 11.51 | | 1.7 | |
| | Jericho Plaza | | 1 | | 1.5 | | 26,065 | | 26,065 | | $ | 33.00 | | $ | 36.35 | | $ | — | | — | |
| | 16 Court Street | | 5 | | 10.0 | | 4,554 | | 6,520 | | $ | 33.03 | | $ | 34.44 | | $ | 28.08 | | 1.1 | |
| | Total/Weighted Average | | 25 | | 4.8 | | 91,644 | | 93,803 | | $ | 29.40 | | $ | 34.69 | | $ | 13.26 | | 2.9 | |
| | | | | | | | | | | | | | | | | | | |
Storage | | | | | | | | | | | | | | | | | | | |
| | 5 Landmark Square | | 2 | | 3.1 | | 210 | | 210 | | $ | 15.00 | | $ | — | | $ | — | | — | |
| | 750 Washington Boulevard | | 1 | | 4.8 | | 43 | | 43 | | $ | 15.00 | | $ | — | | $ | — | | — | |
| | Total/Weighted Average | | 3 | | 3.4 | | 253 | | 253 | | $ | 15.00 | | $ | — | | $ | — | | — | |
| | | | | | | | | | | | | | | | | | | |
Leased Space | | | | | | | | | | | | | | | | | | | |
| | Office (3) | | 25 | | 4.8 | | 91,644 | | 93,803 | | $ | 29.40 | | $ | 34.69 | | $ | 13.26 | | 2.9 | |
| | Storage | | 3 | | 3.4 | | 253 | | 253 | | $ | 15.00 | | $ | — | | $ | — | | — | |
| | Total | | 28 | | 4.8 | | 91,897 | | 94,056 | | $ | 29.37 | | $ | 34.69 | | $ | 13.23 | | 2.9 | |
| | | | | | | | | | | | | | | | | | | |
Total Available Space as of 3/31/12 | | | | | | 1,019,325 | | | | | | | | | | | |
| | | | | | | | | | | | | | | | | | | |
Early Renewals | | | | | | | | | | | | | | | | | |
Office | | | | | | | | | | | | | | | | | | | |
| | 1 Landmark Square | | 2 | | 4.3 | | 5,496 | | 5,496 | | $ | 33.36 | | $ | 35.21 | | $ | 2.75 | | 3.5 | |
| | 2 Landmark Square | | 1 | | 1.0 | | 3,158 | | 3,158 | | $ | 32.57 | | $ | 32.43 | | $ | — | | — | |
| | 3 Landmark Square | | 1 | | 1.0 | | 6,450 | | 6,750 | | $ | 32.57 | | $ | 33.12 | | $ | — | | — | |
| | 500 West Putnam Avenue | | 1 | | 10.0 | | 1,965 | | 1,965 | | $ | 57.00 | | $ | 62.83 | | $ | — | | — | |
| | The Meadows | | 1 | | 1.3 | | 12,246 | | 12,246 | | $ | 26.00 | | $ | 29.75 | | $ | — | | — | |
| | 16 Court Street | | 1 | | 0.3 | | 17,015 | | 22,560 | | $ | 38.75 | | $ | 38.75 | | $ | — | | — | |
| | Total/Weighted Average | | 7 | | 1.5 | | 46,330 | | 52,175 | | $ | 34.70 | | $ | 36.06 | | $ | 0.29 | | 0.4 | |
| | | | | | | | | | | | | | | | | | | |
Renewals | | | | | | | | | | | | | | | | | | | |
| | Early Renewals Office | | 7 | | 1.5 | | 46,330 | | 52,175 | | $ | 34.70 | | $ | 36.06 | | $ | 0.29 | | 0.4 | |
| | Total | | 7 | | 1.5 | | 46,330 | | 52,175 | | $ | 34.70 | | $ | 36.06 | | $ | 0.29 | | 0.4 | |
(1) Annual initial Base Rent.
(2) Escalated Rent is calculated as Total Annual Income less Electric Charges.
(3) Average starting office rent excluding new tenants replacing vacancies is $32.82/rsf for 54,162 rentable SF.
Average starting office rent for office space (leased and early renewals, excluding new tenants replacing vacancies) is $33.74/rsf for 106,337 rentable SF.
41
ANNUAL LEASE EXPIRATIONS - Manhattan Properties | 
|
| | Consolidated Properties | | Joint Venture Properties | |
Year of Lease Expiration | | Number of
Expiring
Leases (2) | | Rentable
Square
Footage of
Expiring
Leases | | Percentage of
Total
Sq. Ft. | | Annualized
Cash Rent of
Expiring Leases | | Annualized Cash
Rent Per Square
Foot of Expiring
Leases $/psf (3) | | Current
Weighted
Average
Asking Rent
$/psf (5) | | Number of
Expiring
Leases (2) | | Rentable
Square
Footage of
Expiring
Leases | | Percentage of
Total
Sq. Ft. | | Annualized
Cash Rent of
Expiring Leases | | Annualized Cash
Rent Per Square
Foot of Expiring
Leases $/psf (3) | | Current
Weighted
Average
Asking Rent
$/psf (5) | |
| | | | | | | | | | | | | | | | | | | | | | | | | |
In 1st Quarter 2012 (1) | | 12 | | 46,609 | | 0.26 | % | $ | 2,955,972 | | $ | 63.42 | | $ | 92.39 | | — | | — | | — | | — | | — | | — | |
In 2nd Quarter 2012 | | 41 | | 156,409 | | 0.89 | % | $ | 7,195,296 | | $ | 46.00 | | $ | 56.08 | | 2 | | 19,347 | | 0.38 | % | $ | 830,796 | | $ | 42.94 | | $ | 41.37 | |
In 3rd Quarter 2012 | | 27 | | 73,686 | | 0.42 | % | $ | 4,455,588 | | $ | 60.47 | | $ | 55.93 | | 3 | | 24,298 | | 0.47 | % | $ | 1,502,580 | | $ | 61.84 | | $ | 70.08 | |
In 4th Quarter 2012 | | 30 | | 260,864 | | 1.48 | % | $ | 13,703,988 | | $ | 52.53 | | $ | 53.55 | | 6 | | 64,475 | | 1.26 | % | $ | 4,215,144 | | $ | 65.38 | | $ | 70.74 | |
| | | | | | | | | | | | | | | | | | | | | | | | | |
Total 2012 | | 110 | | 537,568 | | 3.05 | % | $ | 28,310,844 | | $ | 52.66 | | $ | 57.98 | | 11 | | 108,120 | | 2.11 | % | $ | 6,548,520 | | $ | 60.57 | | $ | 65.34 | |
| | | | | | | | | | | | | | | | | | | | | | | | | |
1st Quarter 2013 | | 26 | | 144,951 | | 0.82 | % | $ | 9,615,324 | | $ | 66.33 | | $ | 63.01 | | 1 | | 152 | | 0.00 | % | $ | 22,512 | | $ | 148.11 | | $ | 150.00 | |
2nd Quarter 2013 | | 41 | | 362,961 | | 2.06 | % | $ | 22,506,252 | | $ | 62.01 | | $ | 70.79 | | — | | — | | — | | — | | — | | — | |
3rd Quarter 2013 | | 42 | | 242,014 | | 1.37 | % | $ | 12,734,820 | | $ | 52.62 | | $ | 58.39 | | 1 | | 120 | | 0.00 | % | $ | 3,180 | | $ | 26.50 | | $ | 30.00 | |
4th Quarter 2013 | | 31 | | 569,488 | | 3.23 | % | $ | 29,056,572 | | $ | 51.02 | | $ | 49.63 | | 2 | | 45,510 | | 0.89 | % | $ | 2,126,484 | | $ | 46.73 | | $ | 68.91 | |
| | | | | | | | | | | | | | | | | | | | | | | | | |
Total 2013 | | 140 | | 1,319,414 | | 7.49 | % | $ | 73,912,968 | | $ | 56.02 | | $ | 58.53 | | 4 | | 45,782 | | 0.89 | % | $ | 2,152,176 | | $ | 47.01 | | $ | 69.08 | |
| | | | | | | | | | | | | | | | | | | | | | | | | |
2014 | | 119 | | 1,760,606 | | 10.00 | % | $ | 96,680,460 | | $ | 54.91 | | $ | 62.83 | | 16 | | 313,482 | | 6.12 | % | $ | 17,868,408 | | $ | 57.00 | | $ | 72.71 | |
2015 | | 115 | | 2,022,197 | | 11.48 | % | $ | 116,113,176 | | $ | 57.42 | | $ | 59.74 | | 20 | | 169,411 | | 3.31 | % | $ | 9,655,848 | | $ | 57.00 | | $ | 66.01 | |
2016 | | 81 | | 1,120,159 | | 6.36 | % | $ | 62,578,572 | | $ | 55.87 | | $ | 64.76 | | 15 | | 159,288 | | 3.11 | % | $ | 9,240,192 | | $ | 58.01 | | $ | 69.23 | |
2017 | | 81 | | 1,701,966 | | 9.67 | % | $ | 92,820,504 | | $ | 54.54 | | $ | 58.93 | | 10 | | 120,195 | | 2.35 | % | $ | 8,088,672 | | $ | 67.30 | | $ | 73.01 | |
2018 | | 35 | | 598,453 | | 3.40 | % | $ | 45,282,285 | | $ | 75.67 | | $ | 77.07 | | 16 | | 767,267 | | 14.98 | % | $ | 44,236,332 | | $ | 57.65 | | $ | 74.40 | |
2019 | | 24 | | 775,682 | | 4.41 | % | $ | 46,170,924 | | $ | 59.52 | | $ | 62.70 | | 4 | | 130,575 | | 2.55 | % | $ | 9,588,264 | | $ | 73.43 | | $ | 74.69 | |
2020 | | 41 | | 2,305,420 | | 13.09 | % | $ | 131,187,540 | | $ | 56.90 | | $ | 60.10 | | 6 | | 173,990 | | 3.40 | % | $ | 8,839,116 | | $ | 50.80 | | $ | 68.21 | |
2021 | | 45 | | 2,290,629 | | 13.01 | % | $ | 116,581,906 | | $ | 50.90 | | $ | 56.21 | | 3 | | 61,615 | | 1.20 | % | $ | 2,919,816 | | $ | 47.39 | | $ | 65.79 | |
Thereafter | | 69 | | 3,176,918 | | 18.04 | % | $ | 156,317,213 | | $ | 49.20 | | $ | 60.59 | | 11 | | 436,986 | | 8.53 | % | $ | 26,181,708 | | $ | 59.91 | | $ | 66.93 | |
| | 860 | | 17,609,012 | | 100.00 | % | $ | 965,956,392 | | $ | 54.86 | | $ | 60.61 | | 116 | | 2,486,711 | | 48.56 | % | $ | 145,319,052 | | $ | 58.44 | | $ | 65.23 | |
| | | | | | | | | | | | | | | | | | | | | | | | | |
| | | | | | | | | | | | | (4) | 2 | | 2,634,670 | | 51.44 | % | $ | 107,986,128 | | | | | |
| | | | | | | | | | | | | | 118 | | 5,121,381 | | 100.00 | % | $ | 253,305,180 | | | | | |
(1) | Includes month to month holdover tenants that expired prior to 3/31/12. |
(2) | Tenants may have multiple leases. |
(3) | Represents in place annualized rent allocated by year of maturity. |
(4) | Citigroup’s net lease at 388-390 Greenwich Street which expires in 2020, current net rent is $40.99/psf with annual CPI escalation. |
(5) | Management’s estimate of average asking rents as of March 31, 2012. Taking rents are typically lower than asking rents and may vary from property to property. |
42
ANNUAL LEASE EXPIRATIONS - Suburban Properties | 
|
| | Consolidated Properties | | Joint Venture Properties | |
Year of Lease
Expiration | | Number of
Expiring
Leases (2) | | Rentable
Square
Footage of
Expiring
Leases | | Percentage of
Total
Sq. Ft. | | Annualized
Cash Rent of
Expiring Leases | | Annualized Cash
Rent Per Square
Foot of Expiring
Leases $/psf (3) | | Current
Weighted
Average
Asking Rent
$/psf (4) | | Number of
Expiring
Leases (2) | | Rentable
Square
Footage of
Expiring
Leases | | Percentage of
Total
Sq. Ft. | | Annualized
Cash Rent of
Expiring Leases | | Annualized Cash
Rent Per Square
Foot of Expiring
Leases $/psf (3) | | Current
Weighted
Average
Asking Rent
$/psf (4) | |
| | | | | | | | | | | | | | | | | | | | | | | | | |
In 1st Quarter 2012 (1) | | 19 | | 114,571 | | 3.91 | % | $ | 1,978,566 | | $ | 17.27 | | $ | 16.62 | | 7 | | 64,383 | | 2.43 | % | $ | 2,349,480 | | $ | 36.49 | | $ | 34.62 | |
In 2nd Quarter 2012 | | 8 | | 32,709 | | 1.12 | % | $ | 1,159,968 | | $ | 35.46 | | $ | 36.04 | | 7 | | 99,745 | | 3.76 | % | $ | 3,486,036 | | $ | 34.95 | | $ | 32.45 | |
In 3rd Quarter 2012 | | 11 | | 68,054 | | 2.32 | % | $ | 2,106,588 | | $ | 30.95 | | $ | 32.78 | | 5 | | 20,011 | | 0.76 | % | $ | 684,948 | | $ | 34.23 | | $ | 33.67 | |
In 4th Quarter 2012 | | 11 | | 80,988 | | 2.77 | % | $ | 2,690,856 | | $ | 33.23 | | $ | 34.09 | | 8 | | 93,798 | | 3.54 | % | $ | 3,464,076 | | $ | 36.93 | | $ | 35.27 | |
| | | | | | | | | | | | | | | | | | | | | | | | | |
Total 2012 | | 49 | | 296,322 | | 10.12 | % | $ | 7,935,978 | | $ | 26.78 | | $ | 27.25 | | 27 | | 277,937 | | 10.49 | % | $ | 9,984,540 | | $ | 35.92 | | $ | 33.99 | |
| | | | | | | | | | | | | | | | | | | | | | | | | |
1st Quarter 2013 | | 12 | | 202,604 | | 6.92 | % | $ | 6,539,580 | | $ | 32.28 | | $ | 27.40 | | 4 | | 4,570 | | 0.17 | % | $ | 341,496 | | $ | 74.73 | | $ | 69.20 | |
2nd Quarter 2013 | | 10 | | 45,199 | | 1.54 | % | $ | 1,672,512 | | $ | 37.00 | | $ | 33.06 | | 9 | | 55,553 | | 2.10 | % | $ | 1,612,548 | | $ | 29.03 | | $ | 26.96 | |
3rd Quarter 2013 | | 9 | | 38,168 | | 1.30 | % | $ | 1,323,696 | | $ | 34.68 | | $ | 33.33 | | 3 | | 13,243 | | 0.50 | % | $ | 472,872 | | $ | 35.71 | | $ | 33.51 | |
4th Quarter 2013 | | 5 | | 27,799 | | 0.95 | % | $ | 1,031,016 | | $ | 37.09 | | $ | 42.31 | | 6 | | 15,378 | | 0.58 | % | $ | 517,428 | | $ | 33.65 | | $ | 27.86 | |
| | | | | | | | | | | | | | | | | | | | | | | | | |
Total 2013 | | 36 | | 313,770 | | 10.71 | % | $ | 10,566,804 | | $ | 33.68 | | $ | 30.26 | | 22 | | 88,744 | | 3.35 | % | $ | 2,944,344 | | $ | 33.18 | | $ | 30.27 | |
| | | | | | | | | | | | | | | | | | | | | | | | | |
2014 | | 37 | | 287,373 | | 9.81 | % | $ | 9,399,444 | | $ | 32.71 | | $ | 30.85 | | 30 | | 302,318 | | 11.41 | % | $ | 10,805,364 | | $ | 35.74 | | $ | 32.73 | |
2015 | | 33 | | 290,994 | | 9.93 | % | $ | 9,694,744 | | $ | 33.32 | | $ | 31.58 | | 21 | | 140,862 | | 5.32 | % | $ | 4,423,428 | | $ | 31.40 | | $ | 32.47 | |
2016 | | 44 | | 681,228 | | 23.26 | % | $ | 20,776,776 | | $ | 30.50 | | $ | 34.15 | | 9 | | 101,159 | | 3.82 | % | $ | 3,294,210 | | $ | 32.56 | | $ | 32.79 | |
2017 | | 21 | | 103,865 | | 3.55 | % | $ | 3,275,184 | | $ | 31.53 | | $ | 31.81 | | 8 | | 64,370 | | 2.43 | % | $ | 2,471,556 | | $ | 38.40 | | $ | 32.97 | |
2018 | | 16 | | 162,135 | | 5.54 | % | $ | 5,574,948 | | $ | 34.38 | | $ | 34.93 | | 4 | | 61,523 | | 2.32 | % | $ | 2,289,600 | | $ | 37.22 | | $ | 32.93 | |
2019 | | 13 | | 274,717 | | 9.38 | % | $ | 7,848,948 | | $ | 28.57 | | $ | 30.11 | | 6 | | 38,432 | | 1.45 | % | $ | 1,398,456 | | $ | 36.39 | | $ | 34.62 | |
2020 | | 11 | | 234,319 | | 8.00 | % | $ | 6,492,732 | | $ | 27.71 | | $ | 33.19 | | 8 | | 1,436,236 | | 54.19 | % | $ | 40,816,344 | | $ | 28.42 | | $ | 34.98 | |
2021 | | 8 | | 142,281 | | 4.86 | % | $ | 3,481,464 | | $ | 24.47 | | $ | 27.07 | | 5 | | 37,662 | | 1.42 | % | $ | 1,280,124 | | $ | 33.99 | | $ | 33.20 | |
Thereafter | | 11 | | 142,016 | | 4.85 | % | $ | 5,230,022 | | $ | 36.83 | | $ | 36.51 | | 6 | | 100,905 | | 3.81 | % | $ | 3,335,046 | | $ | 33.05 | | $ | 27.62 | |
| | | | | | | | | | | | | | | | | | | | | | | | | | | | | | | |
| | 279 | | 2,929,020 | | 100.00 | % | $ | 90,277,044 | | $ | 30.82 | | $ | 31.73 | | 146 | | 2,650,148 | | 100.00 | % | $ | 83,043,012 | | $ | 31.34 | | $ | 33.84 | |
(1) Includes month to month holdover tenants that expired prior to 3/31/12.
(2) Tenants may have multiple leases.
(3) Represents in place annualized rent allocated by year of maturity.
(4) Management’s estimate of average asking rents as of March 31, 2012. Taking rents are typically lower than asking rents and may vary from property to property.
43
SUMMARY OF REAL ESTATE ACQUISITION ACTIVITY POST 1997 - Manhattan | 
|
| | | | | | | | | | % Leased | | Acquisition | |
| | Property | | Type of Ownership | | Submarket | | Net Rentable sf | | at acquisition | | 3/31/2012 | | Price ($’s) (1) | |
| | | | | | | | | | | | | | | |
1998 Acquisitions | | | | | | | | | | | | | | | |
Mar-98 | | 420 Lexington Avenue | | Operating Sublease | | Grand Central | | 1,188,000 | | 83.0 | | 90.9 | | $ | 78,000,000 | |
May-98 | | 711 3rd Avenue | | Operating Sublease | | Grand Central | | 524,000 | | 79.0 | | 87.5 | | $ | 65,600,000 | |
Jun-98 | | 440 9th Avenue | | Fee Interest | | Penn Station | | 339,000 | | 76.0 | | N/A | | $ | 32,000,000 | |
| | | | | | | | 2,051,000 | | | | | | $ | 175,600,000 | |
1999 Acquisitions | | | | | | | | | | | | | | | |
Jan-99 | | 420 Lexington Leasehold | | Sub-leasehold | | Grand Central | | — | | — | | — | | $ | 27,300,000 | |
Jan-99 | | 555 West 57th Street - 65% JV | | Fee Interest | | Midtown West | | 941,000 | | 100.0 | | 99.2 | | $ | 66,700,000 | |
Aug-99 | | 1250 Broadway - 50% JV | | Fee Interest | | Penn Station | | 670,000 | | 96.5 | | N/A | | $ | 93,000,000 | |
Nov-99 | | 555 West 57th Street - remaining 35% | | Fee Interest | | Midtown West | | — | | | | 99.2 | | $ | 34,100,000 | |
| | | | | | | | 1,611,000 | | | | | | $ | 221,100,000 | |
2000 Acquisitions | | | | | | | | | | | | | | | |
Feb-00 | | 100 Park Avenue - 50% JV | | Fee Interest | | Grand Central | | 834,000 | | 96.5 | | 95.0 | | $ | 192,000,000 | |
| | | | | | | | 834,000 | | | | | | $ | 192,000,000 | |
2001 Acquisitions | | | | | | | | | | | | | | | |
Jun-01 | | 317 Madison Avenue | | Fee Interest | | Grand Central | | 450,000 | | 95.0 | | 85.1 | | $ | 105,600,000 | |
Acquisition of JV Interest | | | | | | | | | | | | | | | |
Sep-01 | | 1250 Broadway - 49.9% JV (2) | | Fee Interest | | Penn Station | | 670,000 | | 97.7 | | N/A | | $ | 126,500,000 | |
| | | | | | | | 1,120,000 | | | | | | $ | 232,100,000 | |
2002 Acquisitions | | | | | | | | | | | | | | | |
May-02 | | 1515 Broadway - 55% JV | | Fee Interest | | Times Square | | 1,750,000 | | 98.0 | | 100.0 | | $ | 483,500,000 | |
| | | | | | | | 1,750,000 | | | | | | $ | 483,500,000 | |
2003 Acquisitions | | | | | | | | | | | | | | | |
Feb-03 | | 220 East 42nd Street | | Fee Interest | | Grand Central | | 1,135,000 | | 91.9 | | 94.6 | | $ | 265,000,000 | |
Mar-03 | | 125 Broad Street | | Fee Interest | | Downtown | | 525,000 | | 100.0 | | N/A | | $ | 92,000,000 | |
Oct-03 | | 461 Fifth Avenue | | Leasehold Interest | | Midtown | | 200,000 | | 93.9 | | 98.8 | | $ | 60,900,000 | |
Dec-03 | | 1221 Avenue of the Americas - 45% JV | | Fee Interest | | Rockefeller Center | | 2,550,000 | | 98.8 | | N/A | | $ | 1,000,000,000 | |
| | | | | | | | 4,410,000 | | | | | | $ | 1,417,900,000 | |
2004 Acquisitions | | | | | | | | | | | | | | | |
Mar-04 | | 19 West 44th Street - 35% JV | | Fee Interest | | Midtown | | 292,000 | | 86.0 | | N/A | | $ | 67,000,000 | |
Jul-04 | | 750 Third Avenue | | Fee Interest | | Grand Central | | 779,000 | | 100.0 | | 97.9 | | $ | 255,000,000 | |
Jul-04 | | 485 Lexington Avenue - 30% JV | | Fee Interest | | Grand Central | | 921,000 | | 100.0 | | 90.8 | | $ | 225,000,000 | |
Oct-04 | | 625 Madison Avenue | | Leasehold Interest | | Plaza District | | 563,000 | | 68.0 | | 94.5 | | $ | 231,500,000 | |
| | | | | | | | 2,555,000 | | | | | | $ | 778,500,000 | |
2005 Acquisitions | | | | | | | | | | | | | | | |
Feb-05 | | 28 West 44th Street | | Fee Interest | | Midtown | | 359,000 | | 87.0 | | N/A | | $ | 105,000,000 | |
Apr-05 | | 1 Madison Avenue - 55% JV | | Fee Interest | | Park Avenue South | | 1,177,000 | | 96.0 | | 99.8 | | $ | 803,000,000 | |
Apr-05 | | 5 Madison Avenue Clock Tower | | Fee Interest | | Park Avenue South | | 267,000 | | N/A | | N/A | | $ | 115,000,000 | |
Jun-05 | | 19 West 44th Street - remaining 65% | | Fee Interest | | Midtown | | — | | | | N/A | | $ | 91,200,000 | |
| | | | | | | | 1,803,000 | | | | | | $ | 1,114,200,000 | |
2006 Acquisition | | | | | | | | | | | | | | | |
Mar-06 | | 521 Fifth Avenue | | Leasehold Interest | | Midtown | | 460,000 | | 97.0 | | 90.9 | | $ | 210,000,000 | |
Jun-06 | | 609 Fifth Avenue | | Fee Interest | | Midtown | | 160,000 | | 98.5 | | 84.7 | | $ | 182,000,000 | |
Dec-06 | | 485 Lexington Avenue - remaining 70% | | Fee Interest | | Grand Central | | — | | | | 90.8 | | $ | 578,000,000 | |
Dec-06 | | 800 Third Avenue - 42.95% JV | | Fee Interest | | Grand Central North | | 526,000 | | 96.9 | | 84.2 | | $ | 285,000,000 | |
| | | | | | | | 1,273,400 | | | | | | $ | 1,520,000,000 | |
2007 Acquisition | | | | | | | | | | | | | | | |
Jan-07 | | Reckson - NYC Portfolio | | Fee Interests / Leasehold Interest | | Various | | 5,612,000 | | 98.3 | | 96.2 | | $ | 3,679,530,000 | |
Apr-07 | | 331 Madison Avenue | | Fee Interest | | Grand Central | | 114,900 | | 97.6 | | 96.9 | | $ | 73,000,000 | |
Apr-07 | | 1745 Broadway - 32.3% JV | | Fee Interest | | Midtown | | 674,000 | | 100.0 | | 100.0 | | $ | 520,000,000 | |
Jun-07 | | 333 West 34th Street | | Fee Interest | | Penn Station | | 345,400 | | 100.0 | | 90.2 | | $ | 183,000,000 | |
Aug-07 | | 1 Madison Avenue - remaining 45% | | Fee Interest | | Park Avenue South | | 1,177,000 | | 99.8 | | 99.8 | | $ | 1,000,000,000 | |
Dec-07 | | 388 & 390 Greenwich Street - 50.6% JV | | Fee Interest | | Downtown | | 2,635,000 | | 100.0 | | 100.0 | | $ | 1,575,000,000 | |
| | | | | | | | 10,558,300 | | | | | | $ | 7,030,530,000 | |
2010 Acquisition | | | | | | | | | | | | | | | |
Jan-10 | | 100 Church Street | | Fee Interest | | Downtown | | 1,047,500 | | 41.3 | | 81.8 | | $ | 181,600,000 | |
May-10 | | 600 Lexington Avenue - 55% JV | | Fee Interest | | Eastside | | 303,515 | | 93.6 | | 72.6 | | $ | 193,000,000 | |
Aug-10 | | 125 Park Avenue | | Fee Interest | | Grand Central | | 604,245 | | 99.1 | | 70.0 | | $ | 330,000,000 | |
| | | | | | | | 1,955,260 | | | | | | $ | 704,600,000 | |
2011 Acquisition | | | | | | | | | | | | | | | |
Jan-11 | | 521 Fifth Avenue - remaining 49.9% | | Leasehold Interest | | Midtown | | 460,000 | | 80.7 | | 90.9 | | $ | 245,700,000 | |
Apr-11 | | 1515 Broadway - remaining 45% | | Fee Interest | | Times Square | | 1,750,000 | | 98.5 | | 100.0 | | $ | 1,210,000,000 | |
May-11 | | 110 East 42nd Street | | Fee Interest | | Grand Central | | 205,000 | | 72.6 | | 78.7 | | $ | 85,570,000 | |
May-11 | | 280 Park Avenue - 49.5% JV | | Fee Interest | | Park Avenue | | 1,219,158 | | 78.2 | | 55.1 | | $ | 1,110,000,000 | |
Nov-11 | | 180 Maiden Lane - 49.9% JV | | Fee Interest | | Financial East | | 1,090,000 | | 97.7 | | 97.7 | | $ | 425,680,000 | |
Nov-11 | | 51 East 42nd Street | | Fee Interest | | Grand Central | | 142,000 | | 95.5 | | 96.9 | | $ | 80,000,000 | |
| | | | | | | | 4,866,158 | | | | | | $ | 3,156,950,000 | |
2012 Acquisition | | | | | | | | | | | | | | | |
Feb-12 | | 10 East 53rd Street - 55% JV | | Fee Interest | | Plaza District | | 354,300 | | 91.9 | | 91.9 | | $ | 252,500,000 | |
(1) Acquisition price represents purchase price for consolidated acquisitions and purchase price or imputed value for joint venture properties.
(2) Ownership interest from November 01 - May 08 was 55%. (From 9/1/01-10/31/01 the Company owned 99.8% of this property.)
44
SUMMARY OF REAL ESTATE ACQUISITION ACTIVITY POST 1997 - Suburban | 
|
| | | | | | | | | | % Leased | | Acquisition | |
| | Property | | Type of Ownership | | Submarket | | Net Rentable sf | | at acquisition | | 3/31/2012 | | Price ($’s) (1) | |
2007 Acquisition | | | | | | | | | | | | | | | |
Jan-07 | | 300 Main Street | | Fee Interest | | Stamford, Connecticut | | 130,000 | | 92.5 | | 88.8 | | $ | 15,000,000 | |
Jan-07 | | 399 Knollwood Road | | Fee Interest | | White Plains, Westchester | | 145,000 | | 96.6 | | N/A | | $ | 31,600,000 | |
Jan-07 | | Reckson - Connecticut Portfolio | | Fee Interests / Leasehold Interest | | Stamford, Connecticut | | 1,369,800 | | 88.9 | | 84.8 | | $ | 490,750,000 | |
Jan-07 | | Reckson - Westchester Portfolio | | Fee Interests / Leasehold Interest | | Westchester | | 2,346,100 | | 90.6 | | 81.5 | | $ | 570,190,000 | |
Apr-07 | | Jericho Plazas - 20.26% JV | | Fee Interest | | Jericho, New York | | 640,000 | | 98.4 | | 95.2 | | $ | 210,000,000 | |
Jun-07 | | 1010 Washington Boulevard | | Fee Interest | | Stamford, Connecticut | | 143,400 | | 95.6 | | 51.5 | | $ | 38,000,000 | |
Jun-07 | | 500 West Putnam Avenue | | Fee Interest | | Greenwich, Connecticut | | 121,500 | | 94.4 | | 51.3 | | $ | 56,000,000 | |
Jul-07 | | 16 Court Street - 35% JV | | Fee Interest | | Brooklyn, New York | | 317,600 | | 80.6 | | 87.4 | | $ | 107,500,000 | |
Aug-07 | | 150 Grand Street | | Fee Interest | | White Plains, Westchester | | 85,000 | | 52.9 | | 26.4 | | $ | 6,700,000 | |
Sep-07 | | The Meadows - 25% JV | | Fee Interest | | Rutherford, New Jersey | | 582,100 | | 81.3 | | 80.8 | | $ | 111,500,000 | |
| | | | | | | | 5,880,500 | | | | | | $ | 1,637,240,000 | |
SUMMARY OF REAL ESTATE SALES ACTIVITY POST 1997 - Suburban |
| | | | | | | | | | | | Sales | | Sales | |
| | Property | | Type of Ownership | | Submarket | | Net Rentable sf | | | | Price ($’s) | | Price ($’s/SF) | |
2008 Sales | | | | | | | | | | | | | | | |
Oct-08 | | 100 & 120 White Plains Road | | Fee Interest | | Tarrytown, Westchester | | 311,000 | | | | $ | 48,000,000 | | $ | 154 | |
| | | | | | | | | | | | | | | |
2009 Sales | | | | | | | | | | | | | | | |
Jan-09 | | 55 Corporate Drive | | Fee Interest | | Bridgewater, New Jersey | | 670,000 | | | | $ | 230,000,000 | | $ | 343 | |
Aug-09 | | 399 Knollwood Road | | Fee Interest | | White Plains, Westchester | | 145,000 | | | | $ | 20,767,307 | | $ | 143 | |
| | | | | | | | 815,000 | | | | $ | 250,767,307 | | | |
SUMMARY OF REAL ESTATE ACQUISITION ACTIVITY POST 1997 - Retail, Residential, Development & Land |
| | | | | | | | | | % Leased | | Acquisition | |
| | Property | | Type of Ownership | | Submarket | | Net Rentable sf | | at acquisition | | 3/31/2012 | | Price ($’s) (1) | |
2005 Acquisition | | | | | | | | | | | | | | | |
Jul-05 | | 1551-1555 Broadway - 10% JV | | Fee Interest | | Times Square | | 25,600 | | N/A | | N/A | | $ | 85,000,000 | |
Jul-05 | | 21 West 34th Street - 50% JV | | Fee Interest | | Herald Square | | 30,100 | | N/A | | 100.0 | | $ | 17,500,000 | |
Sep-05 | | 141 Fifth Avenue - 50% JV | | Fee Interest | | Flatiron | | 21,500 | | N/A | | N/A | | $ | 13,250,000 | |
Nov-05 | | 1604 Broadway - 63% JV | | Leasehold Interest | | Times Square | | 29,876 | | 17.2 | | 23.7 | | $ | 4,400,000 | |
Dec-05 | | 379 West Broadway - 45% JV | | Leasehold Interest | | Cast Iron/Soho | | 62,006 | | 100.0 | | 100.0 | | $ | 19,750,000 | |
| | | | | | | | 169,082 | | | | | | $ | 139,900,000 | |
2006 Acquisition | | | | | | | | | | | | | | | |
Jan-06 | | 25-29 West 34th Street - 50% JV | | Fee Interest | | Herald Square/Penn Station | | 41,000 | | 55.8 | | 100.0 | | $ | 30,000,000 | |
Sep-06 | | 717 Fifth Avenue - 32.75% JV | | Fee Interest | | Midtown/Plaza District | | 119,550 | | 63.1 | | 89.4 | | $ | 251,900,000 | |
| | | | | | | | 160,550 | | | | | | $ | 281,900,000 | |
2007 Acquisition | | | | | | | | | | | | | | | |
Aug-07 | | 180 Broadway - 50% JV | | Fee Interest | | Cast Iron / Soho | | 24,300 | | 85.2 | | — | | $ | 13,600,000 | |
Apr-07 | | Two Herald Square - 55% JV | | Fee Interest | | Herald Square | | N/A | | N/A | | N/A | | $ | 225,000,000 | |
Jul-07 | | 885 Third Avenue - 55% JV | | Fee Interest | | Midtown / Plaza District | | N/A | | N/A | | N/A | | $ | 317,000,000 | |
| | | | | | | | 24,300 | | | | | | $ | 555,600,000 | |
2008 Acquisition | | | | | | | | | | | | | | | |
Jan-08 | | 125 Chubb Way | | Fee Interest | | Lyndhurst, NJ | | 278,000 | | — | | 57.1 | | $ | 29,364,000 | |
Feb-08 | | 182 Broadway - 50% JV | | Fee Interest | | Cast Iron / Soho | | 46,280 | | 83.8 | | — | | $ | 30,000,000 | |
| | | | | | | | 324,280 | | | | | | $ | 59,364,000 | |
2010 Acquisition | | | | | | | | | | | | | | | |
Nov-10 | | Williamsburg Terrace | | Fee Interest | | Brooklyn, NY | | 52,000 | | 100.0 | | 100.0 | | $ | 18,000,000 | |
Dec-10 | | 11 West 34th Street - 30% JV | | Fee Interest | | Herald Square/Penn Station | | 17,150 | | 100.0 | | 100.0 | | $ | 10,800,000 | |
Dec-10 | | 7 Renaissance Square - 50% JV | | Fee Interest | | White Plains, NY | | 65,641 | | — | | — | | $ | 4,000,000 | |
Dec-10 | | Two Herald Square - 45% (2) | | Fee Interest | | Herald Square | | 354,400 | | 100.0 | | 100.0 | | $ | 247,500,000 | |
Dec-10 | | 885 Third Avenue - 45% (2) | | Fee Interest | | Midtown / Plaza District | | 607,000 | | 100.0 | | 100.0 | | $ | 352,000,000 | |
Dec-10 | | 292 Madison Avenue | | Fee Interest | | Grand Central South | | 203,800 | | N/A | | N/A | | $ | 78,300,000 | |
| | | | | | | | 1,299,991 | | | | | | $ | 710,600,000 | |
2011 Acquisition | | | | | | | | | | | | | | | |
Jan-11 | | 3 Columbus Circle - 48.9% | | Fee Interest | | Columbus Circle | | 741,500 | | 20.1 | | 15.7 | | $ | 500,000,000 | |
Aug-11 | | 1552-1560 Broadway - 50% | | Fee Interest | | Times Square | | 35,897 | | 59.7 | | 59.7 | | $ | 136,550,000 | |
Sep-11 | | 747 Madison Avenue - 33.33% | | Fee Interest | | Plaza District | | 10,000 | | 100.0 | | 100.0 | | $ | 66,250,000 | |
| | | | | | | | 787,397 | | | | | | $ | 702,800,000 | |
2012 Acquisition | | | | | | | | | | | | | | | |
Jan-12 | | DFR Residential and Retail Portfolio | | Fee Interests / Leasehold Interest | | Plaza District, Upper East Side | | 489,882 | | 95.1 | | 95.1 | | $ | 193,000,000 | |
Jan-12 | | 724 Fifth Avenue - 50% | | Fee Interest | | Plaza District | | 65,010 | | 92.9 | | 92.9 | | $ | 223,000,000 | |
| | | | | | | | 554,892 | | | | | | $ | 416,000,000 | |
SUMMARY OF REAL ESTATE SALES ACTIVITY POST 1997 - Retail, Residential, Development & Land |
| | | | | | | | | | | | Sales | | Sales | |
| | Property | | Type of Ownership | | Submarket | | Net Rentable sf | | | | Price ($’s) | | Price ($’s/SF) | |
2011 Sales | | | | | | | | | | | | | | | |
Sep-11 | | 1551-1555 Broadway (3) | | Fee Interest | | Times Square | | 25,600 | | | | $ | 276,757,000 | | $ | 10,811 | |
| | | | | | | | | | | | | | | |
2012 Sales | | | | | | | | | | | | | | | |
Feb-12 | | 141 Fifth Avenue (4) | | Fee Interest | | Flatiron | | 13,000 | | | | $ | 48,500,000 | | $ | 3,731 | |
Feb-12 | | 292 Madison Avenue | | Fee Interest | | Grand Central South | | 203,800 | | | | $ | 85,000,000 | | $ | 417 | |
(1) Acquisition price represents purchase price for consolidated acquisitions and purchase price or imputed value for joint venture properties.
(2) Subject to long-term, third party net operating leases.
(3) Company sold our remaining 10% JV interest in the property at an implied $276.8 million sales price.
(4) Inclusive of the fee position which was acquired simultaneously with the sale pursuant to an option.
45
SUMMARY OF REAL ESTATE SALES ACTIVITY POST 1999 - Manhattan | 
|
| | | | | | | | | | Sales | | Sales | |
| | Property | | Type of Ownership | | Submarket | | Net Rentable sf | | Price ($’s) | | Price ($’s/SF) | |
2000 Sales | | | | | | | | | | | | | |
Feb-00 | | 29 West 35th Street | | Fee Interest | | Penn Station | | 78,000 | | $ | 11,700,000 | | $ | 150 | |
Mar-00 | | 36 West 44th Street | | Fee Interest | | Grand Central | | 178,000 | | $ | 31,500,000 | | $ | 177 | |
May-00 | | 321 West 44th Street - 35% JV | | Fee Interest | | Times Square | | 203,000 | | $ | 28,400,000 | | $ | 140 | |
Nov-00 | | 90 Broad Street | | Fee Interest | | Financial | | 339,000 | | $ | 60,000,000 | | $ | 177 | |
Dec-00 | | 17 Battery South | | Fee Interest | | Financial | | 392,000 | | $ | 53,000,000 | | $ | 135 | |
| | | | | | | | 1,190,000 | | $ | 184,600,000 | | $ | 156 | |
2001 Sales | | | | | | | | | | | | | |
Jan-01 | | 633 Third Ave | | Fee Interest | | Grand Central North | | 40,623 | | $ | 13,250,000 | | $ | 326 | |
May-01 | | 1 Park Ave - 45% JV | | Fee Interest | | Grand Central South | | 913,000 | | $ | 233,900,000 | | $ | 256 | |
Jun-01 | | 1412 Broadway | | Fee Interest | | Times Square South | | 389,000 | | $ | 90,700,000 | | $ | 233 | |
Jul-01 | | 110 E. 42nd Street | | Fee Interest | | Grand Central | | 69,700 | | $ | 14,500,000 | | $ | 208 | |
Sep-01 | | 1250 Broadway (1) | | Fee Interest | | Penn Station | | 670,000 | | $ | 126,500,000 | | $ | 189 | |
| | | | | | | | 2,082,323 | | $ | 478,850,000 | | $ | 242 | |
2002 Sales | | | | | | | | | | | | | |
Jun-02 | | 469 Seventh Avenue | | Fee Interest | | Penn Station | | 253,000 | | $ | 53,100,000 | | $ | 210 | |
| | | | | | | | 253,000 | | $ | 53,100,000 | | $ | 210 | |
2003 Sales | | | | | | | | | | | | | |
Mar-03 | | 50 West 23rd Street | | Fee Interest | | Chelsea | | 333,000 | | $ | 66,000,000 | | $ | 198 | |
Jul-03 | | 1370 Broadway | | Fee Interest | | Times Square South | | 255,000 | | $ | 58,500,000 | | $ | 229 | |
Dec-03 | | 321 W 44th Street | | Fee Interest | | Times Square | | 203,000 | | $ | 35,000,000 | | $ | 172 | |
| | | | | | | | 791,000 | | $ | 159,500,000 | | $ | 202 | |
2004 Sales | | | | | | | | | | | | | |
May-04 | | 1 Park Avenue (2) | | Fee Interest | | Grand Central South | | 913,000 | | $ | 318,500,000 | | $ | 349 | |
Oct-04 | | 17 Battery Place North | | Fee Interest | | Financial | | 419,000 | | $ | 70,000,000 | | $ | 167 | |
Nov-04 | | 1466 Broadway | | Fee Interest | | Times Square | | 289,000 | | $ | 160,000,000 | | $ | 554 | |
| | | | | | | | 1,621,000 | | $ | 548,500,000 | | $ | 338 | |
2005 Sales | | | | | | | | | | | | | |
Apr-05 | | 1414 Avenue of the Americas | | Fee Interest | | Plaza District | | 111,000 | | $ | 60,500,000 | | $ | 545 | |
Aug-05 | | 180 Madison Avenue | | Fee Interest | | Grand Central | | 265,000 | | $ | 92,700,000 | | $ | 350 | |
| | | | | | | | 376,000 | | $ | 153,200,000 | | $ | 407 | |
2006 Sales | | | | | | | | | | | | | |
Jul-06 | | 286 & 290 Madison Avenue | | Fee Interest | | Grand Central | | 149,000 | | $ | 63,000,000 | | $ | 423 | |
Aug-06 | | 1140 Avenue of the Americas | | Leasehold Interest | | Rockefeller Center | | 191,000 | | $ | 97,500,000 | | $ | 510 | |
Dec-06 | | 521 Fifth Avenue (3) | | Leasehold Interest | | Midtown | | 460,000 | | $ | 240,000,000 | | $ | 522 | |
| | | | | | | | 800,000 | | $ | 400,500,000 | | $ | 501 | |
2007 Sales | | | | | | | | | | | | | |
Mar-07 | | 1 Park Avenue | | Fee Interest | | Grand Central South | | 913,000 | | $ | 550,000,000 | | $ | 602 | |
Mar-07 | | 70 West 36th Street | | Fee Interest | | Garment | | 151,000 | | $ | 61,500,000 | | $ | 407 | |
Jun-07 | | 110 East 42nd Street | | Fee Interest | | Grand Central North | | 181,000 | | $ | 111,500,000 | | $ | 616 | |
Jun-07 | | 125 Broad Street | | Fee Interest | | Downtown | | 525,000 | | $ | 273,000,000 | | $ | 520 | |
Jun-07 | | 5 Madison Clock Tower | | Fee Interest | | Park Avenue South | | 267,000 | | $ | 200,000,000 | | $ | 749 | |
Jul-07 | | 292 Madison Avenue | | Fee Interest | | Grand Central South | | 187,000 | | $ | 140,000,000 | | $ | 749 | |
Jul-07 | | 1372 Broadway (4) | | Fee Interest | | Penn Station/Garment | | 508,000 | | $ | 335,000,000 | | $ | 659 | |
Nov-07 | | 470 Park Avenue South | | Fee Interest | | Park Avenue South/Flatiron | | 260,000 | | $ | 157,000,000 | | $ | 604 | |
| | | | | | | | 2,992,000 | | $ | 1,828,000,000 | | $ | 611 | |
2008 Sales | | | | | | | | | | | | | |
Jan-08 | | 440 Ninth Avenue | | Fee Interest | | Penn Station | | 339,000 | | $ | 160,000,000 | | $ | 472 | |
May-08 | | 1250 Broadway | | Fee Interest | | Penn Station | | 670,000 | | $ | 310,000,000 | | $ | 463 | |
Oct-08 | | 1372 Broadway (5) | | Fee Interest | | Penn Station/Garment | | 508,000 | | $ | 274,000,000 | | $ | 539 | |
| | | | | | | | 1,517,000 | | $ | 744,000,000 | | $ | 490 | |
2010 Sales | | | | | | | | | | | | | |
May-10 | | 1221 Avenue of the Americas (6) | | Fee Interest | | Rockefeller Center | | 2,550,000 | | $ | 1,280,000,000 | | $ | 502 | |
Sep-10 | | 19 West 44th Street | | Fee Interest | | Midtown | | 292,000 | | $ | 123,150,000 | | $ | 422 | |
| | | | | | | | 2,842,000 | | $ | 1,403,150,000 | | $ | 494 | |
2011 Sales | | | | | | | | | | | | | |
May-11 | | 28 West 44th Street | | Fee Interest | | Midtown | | 359,000 | | $ | 161,000,000 | | $ | 448 | |
(1) Company sold a 45% JV interest in the property at an implied $126.5 million sales price.
(2) Company sold a 75% JV interest in the property at an implied $318.5 million sales price.
(3) Company sold a 50% JV interest in the property at an implied $240.0 million sales price
(4) Company sold a 85% JV interest in the property at an implied $335.0 million sales price.
(5) Company sold a 15% JV interest in the property at an implied $274.0 million sales price.
(6) Company sold a 45% JV interest in the property at an implied $1.28 billion sales price.
46
Executive & Senior Management | 
|
Stephen L. Green
Chairman of the Board
Marc Holliday
Chief Executive Officer
Andrew Mathias
President
James Mead
Chief Financial Officer
Andrew S. Levine
Chief Legal Officer
Steven M. Durels
Executive Vice President, Director of Leasing and Real Property
Edward V. Piccinich
Executive Vice President, Property Management and Construction
Neil H. Kessner
Executive Vice President, General Counsel - Real Property
David M. Schonbraun
Co-Chief Investment Officer
Isaac Zion
Co-Chief Investment Officer
Matthew J. DiLiberto
Chief Accounting Officer
47
ANALYST COVERAGE | 
|
ANALYST COVERAGE
Firm | | Analyst | | Phone | | Email |
Bank of America - Merrill Lynch | | James C. Feldman | | (212) 449-6339 | | james_feldman@ml.com |
Barclays Capital | | Ross Smotrich | | (212) 526-2306 | | ross.smotrich@barcap.com |
Cantor Fitzgerald | | Sri Nagarajan | | (212) 915-1223 | | snagarajan@cantor.com |
Citigroup Smith Barney, Inc. | | Michael Bilerman | | (212) 816-1383 | | michael.bilerman@citigroup.com |
Cowen and Company | | James Sullivan | | (646) 562-1380 | | james.sullivan@cowen.com |
Credit-Suisse | | Andrew Rosivach | | (415) 249-7942 | | andrew.rosivach@credit-suisse.com |
Deutsche Bank | | John Perry | | (212) 250-4912 | | john.perry@db.com |
Goldman Sachs & Co. | | Conor Fennerty | | (212) 902-4227 | | conor.fennerty@gs.com |
Green Street Advisors | | Michael Knott | | (949) 640-8780 | | mknott@greenstreetadvisors.com |
ISI Group | | Steve Sakwa | | (212) 446-9462 | | ssakwa@isigrp.com |
JMP Securities | | Mitchell Germain | | (212) 906-3546 | | mgermain@jmpsecurities.com |
JP Morgan Securities, Inc. | | Anthony Paolone | | (212) 622-6682 | | anthony.paolone@jpmorgan.com |
Keefe, Bruyette & Woods | | Sheila K. McGrath | | (212) 887-7793 | | smcgrath@kbw.com |
KeyBanc Capital Markets | | Jordan Sadler | | (917) 368-2280 | | jsadler@keybanccm.com |
Macquarie Research Equities (USA) | | Robert Stevenson | | (212) 231-8068 | | rob.stevenson@macquarie.com |
RBC Capital Markets | | David B. Rodgers | | (440) 715-2647 | | dave.rodgers@rbccm.com |
Sandler O’Neill + Partners, L.P. | | Alexander D. Goldfarb | | (212) 466-7937 | | agoldfarb@sandleroneill.com |
Stifel Nicolaus | | John Guinee | | (443) 224-1307 | | jwguinee@stifel.com |
UBS Securities LLC | | Ross T. Nussbaum | | (212) 713-2484 | | ross.nussbaum@ubs.com |
Wells Fargo Securities, LLC | | Brendan Maiorana | | (443) 263-6516 | | brendan.maiorana@wachovia.com |
FIXED INCOME COVERAGE
Firm | | Analyst | | Phone | | Email |
Citigroup Inc. | | Thomas Cook | | (212) 723-1112 | | thomas.n.cook@citi.com |
Goldman Sachs & Co. | | Louise Pitt | | (212) 902-3644 | | louise.pitt@gs.com |
JP Morgan Securities, Inc. | | Mark Streeter | | (212) 834-6601 | | mark.streeter@jpmorgan.com |
Merrill Lynch, Pierce, Fenner & Smith Inc. | | Tom Truxillo | | (980) 386-5212 | | thomas.c.truxillo_jr@baml.com |
Wells Fargo Securities, LLC | | Thierry B. Perrein | | (704) 715-8455 | | thierry.perrein@wellsfargo.com |
SL Green Realty Corp. is followed by the analysts listed above. Please note that any opinions, estimates or forecasts regarding SL Green Realty Corp.’s performance made by these analysts are theirs alone and do not represent opinions, forecasts or predictions of SL Green Realty Corp. or its management. SL Green Realty Corp. does not by its reference above or distribution imply its endorsement of or concurrence with such information, conclusions or recommendations.
48
SUPPLEMENTAL DEFINITIONS |
|
Adjusted EBITDA is calculated by adding income taxes, loan loss reserves and our share of joint venture depreciation and amortization to EBITDA.
Annualized rent is calculated as monthly base rent and escalations per the lease, as of a certain date, multiplied by 12.
Debt service coverage is adjusted EBITDA divided by total interest and principal payments.
Fixed charge is the total payments for interest, principal amortization, ground leases and preferred stock dividend.
Fixed charge coverage is adjusted EBITDA divided by fixed charge.
Funds available for distribution (FAD) is defined as FFO plus non-real estate depreciation, 2% allowance for straight line credit loss, adjustment for straight line ground rent, non-cash deferred compensation, a pro-rata adjustment for FAD for SLG’s unconsolidated JV, less straight line rental income, free rent net of amortization, second cycle tenant improvement and leasing cost, and recurring building improvements.
Funds from operations (FFO) is defined under the White Paper approved by the Board of Governors of NAREIT in April 2002, as amended, as net income (loss) (computed in accordance with GAAP), excluding gains (or losses) from debt restructuring, sales of properties and real estate related impairment charges, plus real estate depreciation and amortization and after adjustments for unconsolidated partnerships and joint ventures.
Interest coverage is adjusted EBITDA divided by total interest expense.
Junior Mortgage Participations are subordinate interests in first mortgages.
Mezzanine Debt Loans are loans secured by ownership interests.
Percentage leased represents the percentage of leased square feet, including month-to-month leases, to total rentable square feet owned, as of the date reported. Space is considered leased when the tenant has either taken physical or economic occupancy.
Preferred Equity Investments are equity investments entitled to preferential returns that are senior to common equity.
Recurring capital expenditures represents non-incremental building improvements and leasing costs required to maintain current revenues. Recurring capital expenditures do not include immediate building improvements that were taken into consideration when underwriting the purchase of a building or which are incurred to bring a building up to “operating standard.”
Redevelopment costs are non-recurring capital expenditures incurred in order to improve buildings to SLG’s “operating standards.” These building costs are taken into consideration during the underwriting for a given property’s acquisition.
Same-store NOI growth is the change in the NOI (excluding straight-line rents) of the same-store properties from the prior year reporting period to the current year reporting period.
Same-store properties include all properties that were owned in the same manner during both the current and prior year reporting periods and excludes development properties prior to being stabilized for both the current and prior reporting period.
Second generation TIs and LCs are tenant improvements, lease commissions, and other leasing costs incurred during leasing of second generation space. Costs incurred prior to leasing available square feet are not included until such space is leased. Second generation space excludes square footage vacant at acquisition.
SLG’s share of total debt to market capitalization is calculated as SLG’s share of total debt divided by the sum of total debt plus market equity and preferred stock at liquidation value. SLG’s share of total debt includes total consolidated debt plus SLG’s pro rata share of the debt of unconsolidated joint ventures less JV partners’ share of debt. Market equity assumes conversion of all OP units into common stock.
Total square feet owned represents 100% of the square footage of properties either owned directly by SLG or in which SLG has an interest (e.g. joint ventures).
49
