UNITED STATES
SECURITIES AND EXCHANGE COMMISSION
WASHINGTON, D.C. 20549
FORM N-CSR
CERTIFIED SHAREHOLDER REPORT OF REGISTERED MANAGEMENT
INVESTMENT COMPANIES
Investment Company Act file number
811-08253
The Boyar Value Fund, Inc.
(Exact name of registrant as specified in charter)
35 East 21st Street, New York, NY 10010
(Address of principal executive offices)
(Zip code)
Emile R. Molineaux, Gemini Fund Services, LLC
80 Arkay Drive Suite 110, Hauppauge, NY 11788
(Name and address of agent for service)
Registrant's telephone number, including area code:
212 995-8300
Date of fiscal year end:12/31
Date of reporting period: 6/30/14
Item 1. Reports to Stockholders.
 | Our favorite holding period is forever.
-- Warren Buffett |
Dear Boyar Value Fund Shareholder:
The two best performing sectors within the S&P 500’s ten sectors for the 2nd quarter of 2014 were Energy and Utilities, returning 12.09% and 7.77% respectively. The Boyar Value Fund has no exposure to either of those areas, which obviously negatively impacted our relative performance when compared to that benchmark.
The Boyar Value Fund increased 2.63%% for the quarter versus 5.23% for the S&P 500. For the year The Fund has advanced 1.45% versus 7.14% for the S&P 500. As we indicated to you in previous letters, a stock market that has experienced an upward bias for more than two years without a meaningful correction, and with a large cash position that generates virtually no return; it becomes exceedingly difficult to beat an index that is 100% invested at all times.
Although the S&P 500 is not blatantly overvalued, it is clearly not as cheap as it was a few years back when our cash position was significantly lower. Hopefully, in the not too distant future, Mr. Market will accommodate us with a meaningful stock market decline, so we can put some of our excess cash to work.
Normally, before bull markets end and bear markets begin stock market valuations reach excessive levels. Sometimes however, some exogenous event occurs that shocks the system. Legendary investor John Templeton probably said it best, “bull markets are born on pessimism, grow on skepticism, mature on optimism and die on euphoria.” It is very difficult if not impossible to determine when a bull market will end; however, one must pay attention to history for clues.
We know for example, that this bull market is somewhat long in the tooth. The current bull market has advanced by about 180% since the March 2009 lows, which approximates the average since 1921, according to J.P. Morgan Asset Management. Furthermore, in terms of duration this bull is about 63 months old, while the average has been 62 since 1921.
So What is the Fund Doing?
First, we remember the old adage, “it is time in the market, not market timing that counts.” Secondly, we are always trying to expect the unexpected. We know market corrections are an integral part of the investment process and without them future outsize gains could never occur. We believe the Fund with its high cash position and portfolio of what we believe are intrinsically undervalued companies is well positioned to take advantage of a future market correction.
In our last quarterly letter, we mentioned there were more than a few companies that have become the darlings of the hedge fund crowd and sell at unfathomable valuations. Momentum stocks like Tesla, LinkedIn, and Netflix among others could do no wrong. In March, however, they experienced dramatic reversals in their share prices, declining by 15% or more. The swoon did not last long, however, with a number of them surpassing their recent highs. Normally, prior to a bull markets conclusion or just before a significant correction the market takes on a speculative tone. Therefore this type of leadership has us concerned.
We also cited the pickup in the new issue market as a troubling sign. Since the amount of capital that flows into the stock market is not infinite, the issuance of additional shares by a new business becomes a direct competitor to established companies already trading in the marketplace. This trend continued in the second quarter.
6 East 32st Street ● 7th Floor ● New York, NY 10016 ● P. 212.995.8300 ● F. 212.995.5636
www.BoyarValueGroup.com
In that same letter, we also mentioned that since 1970, based on total returns, the average second quarter in a midterm-election year produced a 2.5% decline in the S&P 500, versus an average gain of 2.7% during the second quarter for all years, according to Sam Stovall chief equity strategist for S&P Capital IQ. Apparently history did not repeat itself this time.
We will soon be entering a period when the stock market historically has demonstrated particularly poor performance. September on average has been one of the worst months of the year for equities. October, for whatever reason has seen its share of exogenous events (i.e. the 1987 stock market crash). The Federal Reserve recently confirmed that it will end its purchase of stocks, bonds and other assets in October of 2014. While they have been tapering their purchases in recent months, we have no idea what if any effect this will have on asset prices.
Another item that we have been writing/warning about for years and admittedly have been proven wrong (thus far), is what we perceive to be a fixed income bubble. Currently according to investment bank Barclays, the bonds of highly rated U.S. companies are yielding less than one percentage point more than comparably dated U.S. government bonds. This implies investors believe highly rated corporations are almost as safe a credit risk as the U.S. government. Once interest rates start to rise, holders of these type of investments will begin to experience large loses on their so-called “safe” investments.
As we mentioned earlier, the second quarter in a midterm election year historically has produced negative returns. This did not occur in 2014. So let’s try another little known stock market anomaly on for size. According to Ken Fisher, in a column he wrote for Forbes, he stated that since 1925 the S&P 500 has risen in 19 of 22 midterm - election year fourth quarters. That’s an astounding 86.4%. Positive fourth quarters are not necessarily huge. They have varied from 2% to 21.3%, averaging 9.5%. However 9.5% on average isn’t half bad.
So Where are we Finding Value?
In the current stock market environment it is increasingly hard to find companies or industries that are intrinsically undervalued. The battered retail industry is one of the few areas of the market where we are finding significant mispricing between current market prices and our intrinsic value estimates. In our view, the bear case for retailers is well known and goes something like this: Consumer purchases that were traditionally made at brick and mortar retailers will increasingly be made online (i.e. at Amazon, et al.). As sales migrate to online retailers, traditional retailers will experience margin compression as a result of fixed cost deleveraging.
While clearly the Amazon threat cannot be taken lightly, we think in certain instances, the Wall Street community is extrapolating current trends into eternity. We admit that the retail business is certainly not without its challenges; however we have in our opinion identified a basket of retailers that we believe are selling significantly below our estimate of intrinsic value. Many of these retailers not only pay an above market dividend (that we believe to be sustainable), but in many instances own real estate that we believe comprises a significant portion of the Company’s market capitalization. Here are some thoughts on a couple of the holdings of the Fund in the out of favor retail sector.
Staples
Staples is currently out of favor within the investment community. While the Company’s turnaround efforts will certainly have its share of ups and downs, we see reasons to be somewhat optimistic for long-term patient investors. The Company, which yields over 3% currently, is still a strong free cash flow generator and expects to generate over $600 million in FCF this year. There are several reasons for our optimism and why it is a current holding of the Fund. First, we believe Staples will benefit as Office Max/Office Depot close overlapping stores following their merger, and should be able to pick-up contract customers (mid-size/large businesses) during this integration. Also, Staples continues to expand into other categories and now 50% of sales are coming from categories beyond core office supplies, and we expect this trend to increase. The Company now sells more than 800,000 SKUs online versus 500,000 at year end, and they are reducing the size of their traditional retail store. Early results have found that they can reduce the size of their store by approximately 50% and still maintain ~90% of sales. Finally, they should be a prime beneficiary of the ongoing, albeit currently tepid, economic recovery and increase in small business formations. If shares continue to languish, we would not be surprised if private equity took a serious look at the Company due to the lack of significant insider ownership and its strong FCF.
Kohl’s
While Kohl’s shares have not participated in the stock market rally, the shares are currently yielding approximately 2.98% and we believe the Company’s intrinsic value is ~$72 per share. Importantly, we estimate approximately 50% of the Company’s current market capitalization is represented by Company owned real estate, giving us a margin of safety. It is worth noting that roughly 52% of the Company’s sales are from private or exclusive brands (up from 42% in 2009) which should help mitigate the Amazon threat. If share price performance results continue to be disappointing, KSS could attract the attention of private equity investors, due to the Company’s low valuation, unique offerings, owned real estate, and solid balance sheet.
Target
Target is a new position for the Fund and is a company that is certainly out of favor on Wall Street. In May of this year the CEO was forced to resign (a positive change in our view) as their recent foray into Canada, which was done under the previous CEO’s watch, has been nothing short of an unmitigated disaster. In addition, on June 11, 2014 the Company announced a 20% increase in their dividend, which should help to create a floor on the stock price. In 2007 activist investor William Ackman conducted a highly public campaign where he proposed that the Company monetize their real estate holdings (he estimated Company-owned real estate was worth $42 billion: The company’s current market capitalization is ~$38 billion). Shareholders supported management, and Ackman’s proposal was defeated in 2009. It is now 5 years later, and the Company’s stock price has achieved only modest gains and has significantly trailed the broader market. Perhaps shareholders are growing impatient and would now be more receptive to the suggestions of an activist investor? Although the firm does face near-term challenges, we believe the shares offer a very attractive opportunity for the long-term.
************************************
Competitive Returns (Unaudited)
Average Annual Returns ^
| | | | | | | | | | | 5/5/98* |
| | | | | | | | | | | To |
| (As of 6/30/2014) | | 1 Year | | 5 Year | | 10 Year | | 6/30/14 |
| Boyar Value Fund | | | | | | | | | | |
| At NAV | | | 14.01 | % | | 17.81% | | 5.67% | | 6.37% |
| Inclusive of sales charges** | | | 8.30 | % | | 16.61% | | 5.12% | | 6.03% |
| After taxes on distribution** | | | 8.10 | % | | 16.49% | | 4.83% | | 5.68% |
| After taxes on distribution and sale of shares** | | | 4.85 | % | | 13.47% | | 4.13% | | 4.91% |
| S&P 500 TR Index | | | 24.61 | % | | 18.83% | | 7.78% | | 5.48% |
| ** | Calculated using maximum sales charges of 5.00%. |
| *** | Calculated without sales charges. |
| Cumulative Returns Since Inception*** |
| At NAV (5/5/98 through 6/30/14) |

The Boyar Value Fund has a maximum sales charge of 5.00%. After-tax returns are calculated using the highest historical individual Federal income tax rate and do not reflect the additional impact of state and local taxes. Actual after-tax returns depend on a shareholder’s tax situation and may differ from those shown. After-tax returns are not relevant for shareholders who hold Fund shares in tax-deferred accounts or for shares held by non-taxable entities. The Fund may invest in stocks of several different capitalization levels and it is important to note that historically, small- and mid-cap stocks have experienced greater volatility than stocks of larger, more established companies. Additionally, value-based investments are subject to the risk that the broad market may not recognize their intrinsic value. As portfolio and market conditions change future distributions and yields will vary, dividends are
not guaranteed. Distribution amount may include net investment income, capital gains and or return of capital. Distribution amount is not indicative of Fund performance. Individual performance results will vary and may include the reinvestment of income/dividends and capital gains distributions. Performance figures for periods greater than one year are annualized.
The S&P 500 Total Return Index (“S&P 500 TR”) is an unmanaged capitalization weighted index of 500 stocks designed to measure performance of the broad domestic economy through changes in the aggregate market value of the 500 stocks representing all major industries.
The performance of the indices includes reinvestment of dividends and capital gains, however, it does not include any expenses or a deduction for Federal income taxes. A shareholder cannot invest in an index. This information is provided for comparison purposes only.
Comparisons to indexes have limitations because indexes have volatility and other material characteristics that may differ from a particular investment. Any indices and other financial benchmarks are provided for illustrative purposes only. Particularly, an Investment Index has results that do not represent actual trading or any material economic and market factors that might have had an impact on the advisor’s decision-making. An investment cannot be made directly in an index. Index performance does not reflect the deduction of any management fees, taxes or expenses.
The total annual operating expense ratio for the Boyar Value Fund (before fee waivers/expense reimbursements) as stated in the fee table in the Fund’s prospectus dated April 30, 2014 was 2.35%. The net annual operating expense ratio (after fee waivers/expense reimbursement) was 1.79% for the same period. [An updated total annual operating expenses figure will appear in the Fund’s next prospectus update.]
| ^ | The performance data quoted represents past performance. Past performance does not guarantee future results, and except where noted as after-tax, does not reflect the deduction of taxes that a shareholder would pay on Fund distributions or the redemption of Fund shares. The investment return and principal value of an investment will fluctuate. Consequently, an investor’s shares, when redeemed, may be worth more or less than their original cost. Returns for periods greater than one year are annualized. Current performance may be lower or higher than the performance data quoted. To obtain performance information current to the most recent month end, please call 1-800-266-5566. |
Comparison of the Change in Value of a $10,000 Investment (Unaudited)
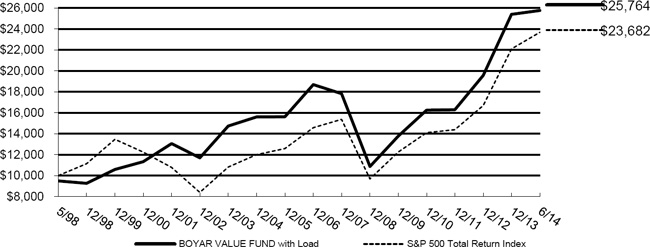
The Chart above represents historical performance of a hypothetical investment of $10,000 in the Boyar Value Fund from inception. The performance of the Fund includes the reinvestment of all dividend and capital gain distributions and has been adjusted for the maximum applicable sales charge of 5.00%. The performance of the Fund as reflected in the chart does not include the effect of taxes incurred on Fund distributions or on the redemption of Fund shares.
Portfolio Diversification By Sector (as of June 30, 2014)
(as a percentage of total net assets)
(Unaudited)
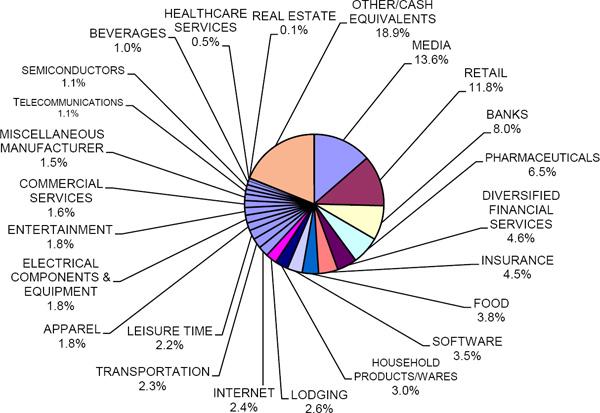
The composition of the Fund’s portfolio is subject to change.
Please refer to the Portfolio of Investments in this annual report for a detailed analysis of the Fund’s holdings.
The mention of specific securities or asset classes is not a recommendation or solicitation for any person to buy, sell or hold any particular security or asset class.
It’s not what you make; it’s what you keep – Taxes are potentially the biggest expense an individual mutual fund investor will experience.
| ● | By holding stocks for long periods of time, you postpone paying taxes, which positively impacts long-term returns. |
| ● | Buying and holding stocks for long periods may sound stodgy, but it postpones the payment of capital gains taxes with the added positive effects on the compounding rate. Since profit taking involves transactions, it obliges you to take the IRS in as a partner. With profits not taken, there is a future tax liability, but all the money is still working for its owner. No transactions, no tax. |
| ● | The Boyar Value Fund believes that holding stocks for long periods of time is the best way for an individual investor to create wealth. |
As you can see from the chart below, our buy and hold philosophy has enabled the Fund to produce after tax returns that pretty much mirror our pre-tax returns. The returns used in the illustration exclude loads, but are inclusive of all fees, and assumes the highest rates when calculating after tax returns.
| Period Ending June 30, 2014 ^ |
| | | Six Months | | 1 Year | | 5 Year | | 10 Year | | 5/5/98*
to
6/30/14 |
| No load pre-tax returns | | 1.45% | | 14.01% | | 17.81% | | 5.67% | | 6.37% |
| No load after-tax returns | | 0.82% | | 13.80% | | 17.68% | | 5.37% | | 6.01% |
| | Best regards, | |
| |  | |
| | Mark A. Boyar | |
Staples, Kohls, and Target in addition to being a holding of the Boyar Value Fund, “the Fund”, are also holdings of the access persons of Boyar Asset Management (BAM) including the portfolio manager. Also, Boyar’s Intrinsic Value Research LLC, an affiliate of BAM, provides research and analysis through its publication Asset Analysis Focus on these same securities. It is important to note, that this may create both personal and firm potential conflicts of interests.
This letter seeks to describe the Fund managers’ current view of the market. Statements referring to future events or actions, such as future financial performance, are based on current expectations and projections about future events provided by various sources, including the Fund’s management. These statements are not guarantees of future performance, and actual events and results may differ materially from those discussed herein. The mention of specific securities or asset classes is not a recommendation or solicitation for any person to buy, sell or hold any particular security or asset class.
| ^ | The performance data quoted represents past performance. Past performance does not guarantee future results, and except where noted as after-tax, does not reflect the deduction of taxes that a shareholder would pay on Fund distributions or the redemption of Fund shares. The investment return and principal value of an investment will fluctuate. Consequently, an investor’s shares, when redeemed, may be worth more or less than their original cost. Current performance may be lower or higher than the performance data quoted. To obtain performance information current to the most recent month end, please call 1-800-266-5566. |
Activities with respect to Distributor Services are conducted through Ladenburg Thalmann& Co. Inc,(“LTCO”) a member of the NYSE, NYSE AMEX and other principal exchanges. Member FINRA/SIPC.
| BOYAR VALUE FUND, INC. |
| PORTFOLIO OF INVESTMENTS (Unaudited) |
| June 30, 2014 |
| Shares | | | | | Value | |
| | | | | | | |
| | | | COMMON STOCK - 81.1 % | | | |
| | | | APPAREL - 1.8 % | | | |
| | 4,090 | | | Hanesbrands, Inc. | | $ | 402,620 | |
| | | | | | | | | |
| | | | | BANKS - 8.0 % | | | | |
| | 30,595 | | | Bank of America Corp. | | | 470,245 | |
| | 12,707 | | | Bank of New York Mellon Corp. | | | 476,258 | |
| | 4,430 | | | Citigroup, Inc. | | | 208,653 | |
| | 10,750 | | | JPMorgan Chase & Co. | | | 619,415 | |
| | | | | | | | 1,774,571 | |
| | | | | BEVERAGES - 1.0 % | | | | |
| | 3,150 | | | Molson Coors Brewing Co. | | | 233,604 | |
| | | | | | | | | |
| | | | | COMMERCIAL SERVICES - 1.6 % | | | | |
| | 6,300 | | | Weight Watchers International, Inc. | | | 127,071 | |
| | 13,000 | | | Western Union Co. | | | 225,420 | |
| | | | | | | | 352,491 | |
| | | | | DIVERSIFIED FINANCIAL SERVICES - 4.6 % | | | | |
| | 8,500 | | | Ameriprise Financial, Inc. | | | 1,020,000 | |
| | | | | | | | | |
| | | | | ELECTRICAL COMPONENTS & EQUIPMENT - 1.8 % | | | | |
| | 3,200 | | | Energizer Holdings, Inc. | | | 390,496 | |
| | | | | | | | | |
| | | | | ENTERTAINMENT - 1.8 % | | | | |
| | 6,016 | | | Madison Square Garden Co., Class A * | | | 375,699 | |
| | 500 | | | Marriott Vacations Worldwide Corp. * | | | 29,315 | |
| | | | | | | | 405,014 | |
See accompanying notes to financial statements.
| BOYAR VALUE FUND, INC. |
| PORTFOLIO OF INVESTMENTS (Unaudited) (Continued) |
| June 30, 2014 |
| Shares | | | | | Value | |
| | | | | FOOD - 3.8 % | | | | |
| | 3,000 | | | Campbell Soup Co. | | $ | 137,430 | |
| | 3,000 | | | Kraft Foods Group, Inc. | | | 179,850 | |
| | 9,000 | | | Mondelez International, Inc., Class A | | | 338,490 | |
| | 5,000 | | | Sysco Corp. | | | 187,250 | |
| | | | | | | | 843,020 | |
| | | | | HEALTHCARE SERVICES - 0.5 % | | | | |
| | 1,000 | | | Laboratory Corp. of America Holdings * | | | 102,400 | |
| | | | | | | | | |
| | | | | HOUSEHOLD PRODUCTS/WARES - 3.0 % | | | | |
| | 5,000 | | | Clorox Co. | | | 457,000 | |
| | 3,700 | | | Scotts Miracle-Gro Co., Class A | | | 210,382 | |
| | | | | | | | 667,382 | |
| | | | | | | | | |
| | | | | INSURANCE - 4.5 % | | | | |
| | 10,586 | | | Travelers Cos, Inc. | | | 995,825 | |
| | | | | | | | | |
| | | | | INTERNET - 2.4 % | | | | |
| | 11,600 | | | Reis, Inc. | | | 244,528 | |
| | 8,250 | | | Yahoo!, Inc. * | | | 289,822 | |
| | | | | | | | 534,350 | |
| | | | | LEISURE TIME - 2.2 % | | | | |
| | 7,500 | | | Carnival Corp. | | | 282,375 | |
| | 10,000 | | | Interval Leisure Group, Inc. | | | 219,400 | |
| | | | | | | | 501,775 | |
| | | | | LODGING - 2.6 % | | | | |
| | 5,008 | | | Marriott International, Inc., Class A | | | 321,013 | |
| | 9,500 | | | MGM Resorts International * | | | 250,800 | |
| | | | | | | | 571,813 | |
See accompanying notes to financial statements.
| BOYAR VALUE FUND, INC. |
| PORTFOLIO OF INVESTMENTS (Unaudited) (Continued) |
| June 30, 2014 |
| Shares | | | | | Value | |
| | | | | MEDIA - 13.6 % | | | | |
| | 3,641 | | | AMC Networks, Inc., Class A * | | $ | 223,885 | |
| | 9,952 | | | Cablevision Systems Corp., Class A | | | 175,653 | |
| | 11,011 | | | Comcast Corp., Special Class A | | | 587,217 | |
| | 9,000 | | | Meredith Corp. | | | 435,240 | |
| | 1,341 | | | Time, Inc. * | | | 32,479 | |
| | 10,733 | | | Time Warner, Inc. | | | 753,993 | |
| | 9,500 | | | Walt Disney Co. | | | 814,530 | |
| | | | | | | | 3,022,997 | |
| | | | | MISCELLANEOUS MANUFACTURER - 1.5 % | | | | |
| | 13,000 | | | General Electric Co. | | | 341,640 | |
| | | | | | | | | |
| | | | | PHARMACEUTICALS - 6.5 % | | | | |
| | 9,000 | | | Bristol-Myers Squibb Co. | | | 436,590 | |
| | 2,500 | | | Johnson & Johnson | | | 261,550 | |
| | 25,500 | | | Pfizer, Inc. | | | 756,840 | |
| | | | | | | | 1,454,980 | |
| | | | | REAL ESTATE - 0.1 % | | | | |
| | 3,700 | | | Trinity Place Holdings, Inc. * | | | 24,050 | |
| | | | | | | | | |
| | | | | RETAIL - 11.8 % | | | | |
| | 5,000 | | | Bed Bath & Beyond, Inc. * | | | 286,900 | |
| | 5,000 | | | CVS Caremark Corp. | | | 376,850 | |
| | 9,600 | | | Home Depot, Inc. | | | 777,216 | |
| | 5,000 | | | Kohl’s Corp. | | | 263,400 | |
| | 23,000 | | | Staples, Inc. | | | 249,320 | |
| | 3,800 | | | Target Corp. | | | 220,210 | |
| | 52,496 | | | Wendy’s Co. | | | 447,791 | |
| | | | | | | | 2,621,687 | |
See accompanying notes to financial statements.
| BOYAR VALUE FUND, INC. |
| PORTFOLIO OF INVESTMENTS (Unaudited) (Continued) |
| June 30, 2014 |
| Shares | | | | | Value | |
| | | | SEMICONDUCTORS - 1.1 % | | | |
| | 8,000 | | | Intel Corp. | | $ | 247,200 | |
| | | | | | | | | |
| | | | | SOFTWARE - 3.5 % | | | | |
| | 18,500 | | | Microsoft Corp. | | | 771,450 | |
| | | | | | | | | |
| | | | | TELECOMMUNICATIONS - 1.1 % | | | | |
| | 10,000 | | | Cisco Systems, Inc. | | | 248,500 | |
| | | | | | | | | |
| | | | | TRANSPORTATION - 2.3 % | | | | |
| | 5,000 | | | United Parcel Service, Inc., Class B | | | 513,300 | |
| | | | | | | | | |
| | | | | TOTAL COMMON STOCK (Cost - $10,770,109) | | | 18,041,165 | |
| | | | | | | | | |
| | | | | SHORT-TERM INVESTMENTS - 19.2 % | | | | |
| | 3,452,774 | | | Dreyfus Institutional Reserves Money Fund, 0.01% * * | | | 3,452,774 | |
| | 821,497 | | | Milestone Treasury Obligations Portfolio - Institutional Class, 0.01% ** | | | 821,497 | |
| | | | | TOTAL SHORT - TERM INVESTMENTS (Cost - $4,274,271) | | | 4,274,271 | |
| | | | | | | | | |
| | | | | TOTAL INVESTMENTS - 100.3 % (Cost - $15,044,380) (a) | | $ | 22,315,436 | |
| | | | | LIABILITIES LESS OTHER ASSETS - (0.3) % | | | (59,596 | ) |
| | | | | NET ASSETS - 100.0 % | | $ | 22,255,840 | |
| * | Non-income producing security. |
| ** | Money market fund; interest rate reflects seven-day effective yield on June 30, 2014. |
| (a) | Represents cost for financial reporting purposes. Aggregate cost for Federal income tax purposes is $15,050,965 and differs from value by net unrealized appreciation (depreciation) of securities as follows: |
| Unrealized appreciation: | | $ | 7,901,644 | |
| Unrealized depreciation: | | | (637,173 | ) |
| Net unrealized appreciation: | | $ | 7,264,471 | |
See accompanying notes to financial statements.
| BOYAR VALUE FUND, INC. |
| STATEMENT OF ASSETS AND LIABILITIES (Unaudited) |
| June 30, 2014 |
| ASSETS | | | | |
| Investment securities, at cost | | $ | 15,044,380 | |
| Investment securities, at value | | $ | 22,315,436 | |
| Dividends and interest receivable | | | 9,358 | |
| Prepaid expenses and other assets | | | 17,087 | |
| TOTAL ASSETS | | | 22,341,881 | |
| | | | | |
| LIABILITIES | | | | |
| Management fees payable | | | 5,608 | |
| Advisory fees payable | | | 7,520 | |
| Distribution fees (12b-1) payable | | | 9,111 | |
| Accrued administration fees | | | 9,114 | |
| Accrued accounting fees | | | 4,020 | |
| Accrued custody fees | | | 1,765 | |
| Accrued expenses and other liabilities | | | 48,903 | |
| TOTAL LIABILITIES | | | 86,041 | |
| NET ASSETS | | $ | 22,255,840 | |
| | | | | |
| Net Assets Consist Of: | | | | |
| Paid in capital | | $ | 14,638,082 | |
| Accumulated net investment loss | | | (16,531 | ) |
| Accumulated net realized gain from security transactions | | | 363,233 | |
| Net unrealized appreciation of investments | | | 7,271,056 | |
| NET ASSETS | | $ | 22,255,840 | |
| | | | | |
| Shares of capital stock outstanding (1,000,000,000 shares authorized, $0.001 par value) | | | 1,058,050 | |
| | | | | |
| Net asset value and redemption price per share (Net assets ÷ shares outstanding) (a) | | $ | 21.03 | |
| | | | | |
| Maximum offering price per share (maximum sales charge of 5.00%) (b) | | $ | 22.14 | |
| (a) | For certain purchases of $1 million or more, a 1.00% contingent deferred sales charge may apply to redemptions made within twelve months of purchase. Redemptions made within 60 days of purchase may be assessed a redemption fee of 2.00%. |
| (b) | On investments of $50,000 or more, the offering price is reduced. |
See accompanying notes to financial statements.
| BOYAR VALUE FUND, INC. |
| STATEMENT OF OPERATIONS (Unaudited) |
| For the Six Months Ended June 30, 2014 |
| INVESTMENT INCOME | | | | |
| Dividends | | $ | 171,334 | |
| Interest | | | 7 | |
| TOTAL INVESTMENT INCOME | | | 171,341 | |
| | | | | |
| EXPENSES | | | | |
| Investment advisory fees | | | 53,698 | |
| Management fees | | | 53,698 | |
| Distribution (12b-1) fees | | | 26,849 | |
| Administrative services fees | | | 22,811 | |
| Professional fees | | | 21,345 | |
| Transfer agent fees | | | 15,875 | |
| Accounting services fees | | | 11,901 | |
| Insurance expense | | | 9,279 | |
| Directors’ fees and expenses | | | 7,980 | |
| Shareholder servicing / Non 12b-1 fees | | | 6,990 | |
| Compliance officer fees | | | 6,697 | |
| Printing and postage expenses | | | 4,247 | |
| Custodian fees | | | 3,096 | |
| Other expenses | | | 5,160 | |
| | | | | |
| TOTAL EXPENSES | | | 249,626 | |
| | | | | |
| Fees waived by the Advisor | | | (30,877 | ) |
| Fees waived by the Manager | | | (30,877 | ) |
| NET EXPENSES | | | 187,872 | |
| NET INVESTMENT LOSS | | | (16,531 | ) |
| | | | | |
| REALIZED AND UNREALIZED GAIN ON INVESTMENTS | | | | |
| Net realized gain from security transactions | | | 131,091 | |
| Net change in unrealized appreciation (depreciation) of investments | | | 196,019 | |
| NET REALIZED AND UNREALIZED GAIN ON INVESTMENTS | | | 327,110 | |
| | | | | |
| NET INCREASE IN NET ASSETS RESULTING FROM OPERATIONS | | $ | 310,579 | |
See accompanying notes to financial statements.
| BOYAR VALUE FUND, INC. |
| STATEMENTS OF CHANGES IN NET ASSETS |
| | | For the Six Months | | | For the Year | |
| | | Ended | | | Ended | |
| | | June 30, 2014 | | | December 31, 2013 | |
| | | (Unaudited) | | | | |
| FROM OPERATIONS | | | | | | | | |
| Net investment loss | | $ | (16,531 | ) | | $ | (29,589 | ) |
| Net realized gain from security transactions | | | 131,091 | | | | 888,104 | |
| Net change in unrealized appreciation (depreciation) on investments | | | 196,019 | | | | 4,297,955 | |
| Net increase in net assets resulting from operations | | | 310,579 | | | | 5,156,470 | |
| | | | | | | | | |
| DISTRIBUTIONS TO SHAREHOLDERS | | | | | | | | |
| From net realized gains | | | — | | | | (166,344 | ) |
| Net decrease in net assets from distributions to shareholders | | | — | | | | (166,344 | ) |
| | | | | | | | | |
| FROM CAPITAL SHARE TRANSACTIONS | | | | | | | | |
| Proceeds from shares sold | | | 340,899 | | | | 2,056,337 | |
| Net asset value of shares issued in reinvestment of distributions to shareholders | | | — | | | | 104,150 | |
| Payments for shares redeemed | | | (706,675 | ) | | | (1,206,288 | ) |
| Redemption fee proceeds | | | 37 | | | | 45 | |
| Net increase (decrease) in net assets from capital share transactions | | | (365,739 | ) | | | 954,244 | |
| | | | | | | | | |
| TOTAL INCREASE (DECREASE) IN NET ASSETS | | | (55,160 | ) | | | 5,944,370 | |
| | | | | | | | | |
| NET ASSETS | | | | | | | | |
| Beginning of period | | | 22,311,000 | | | | 16,366,630 | |
| End of period * | | $ | 22,255,840 | | | $ | 22,311,000 | |
| * Includes accumulated net investment income (loss) of: | | $ | (16,531 | ) | | $ | — | |
| | | | | | | | | |
| CAPITAL SHARE ACTIVITY | | | | | | | | |
| Shares Sold | | | 16,765 | | | | 117,572 | |
| Shares Reinvested | | | — | | | | 5,205 | |
| Shares Redeemed | | | (34,742 | ) | | | (63,507 | ) |
| Net increase (decrease) in shares outstanding | | | (17,977 | ) | | | 59,270 | |
See accompanying notes to financial statements.
| BOYAR VALUE FUND, INC. |
| FINANCIAL HIGHLIGHTS |
| Per Share Data and Ratios for a Share of Capital Stock Outstanding Throughout Each Period |
| | | Six Months | | | Year | | | Year | | | Year | | | Year | | | Year | |
| | | Ended | | | Ended | | | Ended | | | Ended | | | Ended | | | Ended | |
| | | June 30, | | | December 31, | | | December 31, | | | December 31, | | | December 31, | | | December 31, | |
| | | 2014 | | | 2013 | | | 2012 | | | 2011 | | | 2010 | | | 2009 | |
| | | (Unaudited) | | | | | | | | | | | | | | | | |
| Net Asset Value, Beginning of Period | | $ | 20.73 | | | $ | 16.10 | | | $ | 13.44 | | | $ | 13.67 | | | $ | 11.58 | | | $ | 9.16 | |
| | | | | | | | | | | | | | | | | | | | | | | | | |
| Activity from investment operations: | | | | | | | | | | | | | | | | | | | | | | | | |
| Net investment income (loss)(1) | | | (0.02 | ) | | | (0.03 | ) | | | 0.05 | | | | 0.00 | (2) | | | (0.04 | ) | | | 0.02 | |
| Net realized and unrealized gain on investments | | | 0.32 | | | | 4.82 | | | | 2.66 | | | | 0.01 | | | | 2.10 | | | | 2.42 | |
| Total from investment operations | | | 0.30 | | | | 4.79 | | | | 2.71 | | | | 0.01 | | | | 2.06 | | | | 2.44 | |
| | | | | | | | | | | | | | | | | | | | | | | | | |
| Paid-in-Capital from Redemption Fees | | | 0.00 | (2) | | | 0.00 | (2) | | | — | | | | — | | | | 0.03 | | | | 0.00 | (2) |
| | | | | | | | | | | | | | | | | | | | | | | | | |
| Less distributions from: | | | | | | | | | | | | | | | | | | | | | | | | |
| Net investment income | | | — | | | | — | | | | (0.05 | ) | | | — | | | | — | | | | (0.02 | ) |
| Net realized gains | | | — | | | | (0.16 | ) | | | — | | | | (0.22 | ) | | | — | | | | — | |
| Paid in capital | | | — | | | | — | | | | (0.00 | ) (2) | | | (0.02 | ) | | | — | | | | — | |
| Total distributions | | | — | | | | (0.16 | ) | | | (0.05 | ) | | | (0.24 | ) | | | — | | | | (0.02 | ) |
| | | | | | | | | | | | | | | | | | | | | | | | | |
| Net Asset Value, End of Period | | $ | 21.03 | | | $ | 20.73 | | | $ | 16.10 | | | $ | 13.44 | | | $ | 13.67 | | | $ | 11.58 | |
| | | | | | | | | | | | | | | | | | | | | | | | | |
| Total Return (3) | | | 1.45 | % (4) | | | 29.76 | % | | | 20.16 | % | | | 0.17 | % | | | 18.05 | % | | | 26.61 | % |
| | | | | | | | | | | | | | | | | | | | | | | | | |
| Net Assets, At End of Period | | $ | 22,255,840 | | | $ | 22,311,000 | | | $ | 16,366,630 | | | $ | 13,372,592 | | | $ | 14,384,870 | | | $ | 14,970,245 | |
| | | | | | | | | | | | | | | | | | | | | | | | | |
| Ratio of gross expenses to average net assets (5) | | | 2.33 | % (6) | | | 2.31 | % | | | 2.81 | % | | | 2.98 | % | | | 2.91 | % | | | 2.94 | % |
| Ratio of net expenses to average net assets | | | 1.75 | % (6) | | | 1.75 | % | | | 1.75 | % | | | 1.75 | % | | | 1.75 | % | | | 1.75 | % |
| Ratio of net investment income (loss)to average net assets | | | (0.15 | )% (6) | | | (0.15 | )% | | | 0.32 | % | | | 0.00 | % (7) | | | (0.26 | )% | | | 0.13 | % |
| | | | | | | | | | | | | | | | | | | | | | | | | |
| Portfolio Turnover Rate | | | 2 | % (4) | | | 7 | % | | | 5 | % | | | 11 | % | | | 20 | % | | | 17 | % |
| (1) | Per share amounts calculated using the average shares method. |
| (2) | Amount represents less than $0.01 per share. |
| (3) | Total returns shown are historical in nature and assume changes in share price, reinvestment of dividends and capital gains distributions, if any, and exclude the effect of applicable sales loads/redemption fees. Had the Advisor and Manager not waived their fees and/or reimbursed expenses, total returns would have been lower. |
| (5) | Represents the ratio of expenses to average net assets absent fee waivers and/or expense reimbursements by the Advisor and Manager. |
| (6) | Annualized for periods less than one year. |
| (7) | Amount represents less than 0.01% per share. |
See accompanying notes to financial statements.
BOYAR VALUE FUND, INC.
NOTES TO FINANCIAL STATEMENTS (Unaudited)
June 30, 2014
Boyar Value Fund, Inc. (the “Fund”) was incorporated on February 28, 1997 under the laws of the State of Maryland and is registered under the Investment Company Act of 1940, as amended (the “1940 Act”), as an open-end, diversified management investment company. The Fund’s investment objective is long-term capital appreciation.
Under the Fund’s organizational documents, its officers and Directors are indemnified against certain liabilities arising out of the performance of their duties to the Fund. In addition, in the normal course of business, the Fund enters into contracts with its vendors and others that provide for general indemnifications. The Fund’s maximum exposure under these arrangements is unknown as this would involve future claims that may be made against the Fund. However, based on experience, the Fund expects that risk of loss to be remote.
| 2. | SIGNIFICANT ACCOUNTING POLICIES |
The following is a summary of significant accounting policies followed by the Fund in preparation of its financial statements. These policies are in conformity with accounting principles generally accepted in the United States of America (“GAAP”).
Securities valuation – Securities listed on an exchange are valued at the last reported sale price at the close of the regular trading session of the primary exchange on the business day the value is being determined, or in the case of securities listed on NASDAQ at the NASDAQ Official Closing Price (“NOCP”). In the absence of a sale such securities shall be valued at the mean between the current bid and ask prices on the day of valuation. Short-term debt obligations having 60 days or less remaining until maturity, at time of purchase, are valued at amortized cost.
The Fund utilizes various methods to measure the fair value of all of its investments on a recurring basis. GAAP establishes a hierarchy that prioritizes inputs to valuation methods. The three levels of input are:
Level 1 – Unadjusted quoted prices in active markets for identical assets and liabilities that the Fund has the ability to access.
Level 2 – Observable inputs other than quoted prices included in Level 1 that are observable for the asset or liability, either directly or indirectly. These inputs may include quoted prices for the identical instrument in an inactive market, prices for similar instruments, interest rates, prepayment speeds, credit risk, yield curves, default rates and similar data.
BOYAR VALUE FUND, INC.
NOTES TO FINANCIAL STATEMENTS (Unaudited) (Continued)
June 30, 2014
Level 3 – Unobservable inputs for the asset or liability, to the extent relevant observable inputs are not available, representing the Fund’s own assumptions about the assumptions a market participant would use in valuing the asset or liability, and based on the best information available.
The availability of observable inputs can vary from security to security and is affected by a wide variety of factors, including, for example, the type of security, whether the security is new and not yet established in the marketplace, the liquidity of markets, and other characteristics particular to the security. To the extent that valuation is based on models or inputs that are less observable or unobservable in the market, the determination of fair value requires more judgment. Accordingly, the degree of judgment exercised in determining fair value is greatest for instruments categorized in Level 3.
The inputs used to measure fair value may fall into different levels of the fair value hierarchy. In such cases, for disclosure purposes, the level in the fair value hierarchy within which the fair value measurement falls in its entirety, is determined based on the lowest level input that is significant to the fair value measurement in its entirety.
The inputs or methodology used for valuing securities are not necessarily an indication of the risk associated with investing in those securities. The following table summarizes the inputs used as of June 30, 2014 for the Fund’s investments measured at fair value:
| Assets* | | Level 1 | | | Level 2 | | | Level 3 | | | Total | |
| Common Stock | | $ | 18,041,165 | | | $ | — | | | $ | — | | | $ | 18,041,165 | |
| Short-Term Investments | | | 4,274,271 | | | | — | | | | — | | | | 4,274,271 | |
| Total | | $ | 22,315,436 | | | $ | — | | | $ | — | | | $ | 22,315,436 | |
The Fund did not hold any Level 3 securities during the period. There were no transfers into or out of Level 1 and Level 2 during the period. It is the Fund’s policy to recognize transfers between Level 1 and Level 2 at the end of the reporting period.
| * | Refer to the Portfolio of Investments for security classifications. |
Security Transactions and Related Income – Security transactions are accounted for on trade date. Interest income is recognized on an accrual basis. Discounts are accreted and premiums are amortized on securities purchased over the lives of the respective securities. Dividend income is recorded on the ex-dividend date. Realized gains or losses from sales of securities are determined by comparing the identified cost of the security lot sold with the net sales proceeds.
Dividends and Distributions to Shareholders – Dividends from net investment income, if any, are declared and paid annually. Distributable net realized capital gains, if any, are declared and distributed
BOYAR VALUE FUND, INC.
NOTES TO FINANCIAL STATEMENTS (Unaudited) (Continued)
June 30, 2014
annually. Dividends and distributions paid and distributed to shareholders are recorded on ex-dividend date.
Dividends from net investment income and distributions from net realized gains are determined in accordance with Federal income tax regulations, which may differ from GAAP. These “book/tax” differences are considered either temporary (i.e., deferred losses, capital loss carry forwards) or permanent in nature. To the extent these differences are permanent in nature, such amounts are reclassified within the composition of net assets based on their Federal tax-basis treatment; temporary differences do not require reclassification.
Federal Income Taxes – The Fund intends to continue to comply with the requirements of the Internal Revenue Code applicable to regulated investment companies and to distribute all of its taxable income to its shareholders. Therefore, no provision for Federal income tax is required. The Fund will recognize the tax benefits of uncertain tax positions only where the position is “more likely than not” to be sustained assuming examination by tax authorities. Management has analyzed the Fund’s tax positions, and has concluded that no liability for unrecognized tax benefits should be recorded related to uncertain tax positions taken on returns filed for open tax years (2011-2013), or expected to be taken in the Fund’s 2014 tax returns. The Fund identifies its major tax jurisdictions as U.S. Federal, Maryland and foreign jurisdictions where the Fund makes significant investments. The Fund is not aware of any tax positions for which it is reasonably possible that the total amounts of unrecognized tax benefits will change materially in the next twelve months.
Use of Estimates – The preparation of financial statements in accordance with GAAP requires management to make estimates and assumptions that affect the reported amounts of assets and liabilities and disclosure of contingent assets and liabilities at the date of the financial statements and the reported amounts of income and expenses for the reporting period. Actual results could differ from those estimates.
| 3. | INVESTMENT TRANSACTIONS |
For the six months ended June 30, 2014, cost of purchases and proceeds from sales of portfolio securities, other than short-term investments, amounted to $633,181 and $263,641, respectively.
| 4. | TRANSACTIONS WITH AFFILIATES |
The business activities of the Fund are supervised by the Board, which is responsible for the overall management of the Fund. Ladenburg Thalmann Fund Management LLC serves as the Fund’s manager (the “Manager”). Boyar Asset Management, Inc. (the “Advisor”) provides continuous advisory services to the Fund and Ladenburg Thalmann & Co., Inc. (the “Distributor”) acts as distributor of the Fund’s
BOYAR VALUE FUND, INC.
NOTES TO FINANCIAL STATEMENTS (Unaudited) (Continued)
June 30, 2014
shares. The Fund has employed Gemini Fund Services, LLC (“GFS”) to provide administration, fund accounting, and transfer agent services. Certain Directors and officers of the Fund are also officers of the Manager, Advisor or GFS, and are not paid any fees directly by the Fund for serving in such capacities.
Pursuant to a Management Agreement with the Fund, the Manager, under the supervision of the Board, oversees the daily operations of the Fund and supervises the performance of administrative and professional services provided by others, including the Advisor. As compensation for its services and the related expenses borne by the Manager, the Fund pays the Manager a management fee, computed and accrued daily and paid monthly, at an annual rate of 0.50% of the Fund’s average daily net assets.
Pursuant to an Investment Advisory Agreement among the Manager, the Advisor and the Fund, the Advisor agrees to furnish continuous investment advisory services to the Fund. For these services, the Fund pays the Advisor an investment advisory fee, which is computed and accrued daily and paid monthly, at an annual rate of 0.50% of the Fund’s average daily net assets.
Pursuant to a written contract, the Manager, the Advisor and the Distributor have agreed, until at least April 30, 2015, to waive a portion of their respective management fee, advisory fee and amounts, if any, payable to the Distributor pursuant to the Fund’s 12b-1 Plan (see below), and the Manager has agreed to reimburse the Fund for other expenses to the extent necessary so that the total expenses incurred by the Fund (excluding interest, taxes, brokerage commissions, other expenditures which are capitalized in accordance with GAAP, and other extraordinary expenses not incurred in the ordinary course of the Fund’s business) do not exceed 1.75% per annum of the Fund’s average daily net assets. During the term of this Agreement, to the extent that Operating Expenses incurred by the Fund in any fiscal year after waiver of advisory fees of the Advisor, management fees of the Manager and fees payable to the Distributor (“Rule 12b-1 fees”) exceed 1.75% per annum of the Fund’s average daily net assets, such excess amount shall be the liability of the Manager.
To the extent Operating Expenses in any fiscal year do not exceed 1.75% per annum of the Fund’s average daily net assets, the management fee, advisory fee and Rule 12b-1 fees shall be payable by the Fund in the following order:
| o | first, the Distributor shall be entitled to receive the Rule 12b-1 fees up to the amount payable under the Fund’s 12b-1 Plan; and |
| o | thereafter, the Manager and the Advisor shall each be entitled to receive a proportionate amount of their respective management fee and advisory fee up to the amounts payable under the Management Agreement or the Advisory Agreement, as applicable. |
BOYAR VALUE FUND, INC.
NOTES TO FINANCIAL STATEMENTS (Unaudited) (Continued)
June 30, 2014
If the Manager, the Advisor or the Distributor waives any fee or reimburses any expense pursuant to this Agreement, and the Fund’s Operating Expenses are subsequently less than 1.75% of average daily net assets, the Manager, the Advisor and the Distributor shall be entitled to reimbursement by the Fund for such waived fees or reimbursed expenses provided that such reimbursement does not cause the Fund’s expenses to exceed 1.75% of average daily net assets. If Fund Operating Expenses subsequently exceed 1.75% per annum of the Fund’s average daily net assets, the reimbursements shall be suspended. The Advisor, the Manager and the Distributor may each seek reimbursement only for expenses waived or paid by it during the two fiscal years prior to such reimbursement; provided, however, that such expenses may only be reimbursed hereunder to the extent they were waived or paid after the date of this Agreement (or any similar agreement). This Agreement may be continued from year to year thereafter provided each such continuance is specifically approved by the Fund, the Advisor, the Manager and the Distributor, including with respect to the Fund a majority of the non-interested Directors of the Fund; provided, however, that no party shall be obligated to extend the term of this Agreement. This Agreement shall terminate automatically with respect to the Fund and to the Advisor, the Manager or the Distributor upon the termination of the Advisory Agreement, the Management Agreement or the 12b-1 Plan, respectively.
As of December 31, 2013, the Manager, the Advisor, and the Distributor have the following amounts of waived/reimbursed expenses that may be recovered:
| Amount | | Expiration Date |
| $157,667 | | December 31, 2014 |
| $114,686 | | December 31, 2015 |
The Fund has adopted a Shareholder Servicing and Distribution Plan (the “Plan”) pursuant to Rule 12b-1 under the 1940 Act. The Plan provides that a monthly service fee is calculated by the Fund at an annual rate of 0.25% of its average daily net assets and is paid to the Distributor, to provide compensation for ongoing services and/or maintenance of the Fund’s shareholder accounts, not otherwise required to be provided by the Advisor. For the six months ended June 30, 2014, the Distributor received $100 from front-end sales charges, of which $10 was retained by the principal underwriter or other affiliated broker-dealers.
Pursuant to separate servicing agreements with GFS, the Fund pays GFS customary fees for providing administration, fund accounting and transfer agency services to the Fund.
In addition, certain affiliates of GFS provide ancillary services to the Fund as follows:
BOYAR VALUE FUND, INC.
NOTES TO FINANCIAL STATEMENTS (Unaudited) (Continued)
June 30, 2014
Northern Lights Compliance Services, LLC (“NLCS”)
NLCS, an affiliate of GFS, provides a Chief Compliance Officer to the Fund, as well as related compliance services, pursuant to a consulting agreement between NLCS and the Fund. Under the terms of such agreement, NLCS receives customary fees from the Fund.
Gemcom, LLC (“Gemcom”)
Gemcom, an affiliate of GFS, provides EDGAR conversion and filing services as well as print management services for the Fund on an ad-hoc basis. For the provision of these services, Gemcom receives customary fees from the Fund.
Custody Administration
Pursuant to the terms of the Fund’s Custody Agreement with Bank of New York Mellon (the “Custody Agreement”), the Fund pays an asset-based custody fee in decreasing amounts as Fund assets reach certain breakpoints. The Fund also pays certain transaction fees and out-of-pocket expenses pursuant to the Custody Agreement. GFS receives a portion of these fees for performing certain custody administration services. GFS’s share of such fees collected for the six months ended June 30, 2014 was $774. The Custodian fees listed in the Statement of Operations include the fees paid to GFS as Custody Administrator.
Directors
The Fund pays each Director an annual fee of $3,000 and $500 for each meeting attended. Expenses incurred in connection with attendance at board meetings may be reimbursed. No employee of the Manager, the Advisor or any of their respective affiliates will receive any compensation from the Fund for acting as either an officer or Director. None of the executive officers receive any compensation from the Fund.
The Fund may assess a short-term redemption fee of 2.00% of the total redemption amount if a shareholder sells their shares after holding them for less than 60 days. The redemption fee is paid directly to the Fund. For the six months ended June 30, 2014, the Fund assessed $37 in redemption fees. This fee does not apply to shares acquired through reinvestment of dividends and other distributions. For certain purchases of $1 million or more the Fund may also assess a contingent deferred sales charge of 1.00% to redemptions made within twelve months of purchase. There were no such charges assessed for the six months ended June 30, 2014.
BOYAR VALUE FUND, INC.
NOTES TO FINANCIAL STATEMENTS (Unaudited) (Continued)
June 30, 2014
| 6. | DISTRIBUTIONS TO SHAREHOLDERS AND TAX COMPONENTS OF CAPITAL |
The tax character of Fund distributions for the following years was as follows:
| | | Fiscal Year Ended | | | Fiscal Year Ended | |
| | | December 31, 2013 | | | December 31, 2012 | |
| Ordinary Income | | $ | — | | | $ | 47,757 | |
| Long-Term Capital Gain | | | 166,344 | | | | — | |
| Return of Capital | | | — | | | | 2,092 | |
| | | $ | 166,344 | | | $ | 49,849 | |
As of December 31, 2013, the components of accumulated earnings/(deficit) on a tax basis were as follows:
| Undistributed | | | Undistributed | | | Capital Loss | | | Other | | | Post October Loss | | | Unrealized | | | Total | |
| Ordinary | | | Long-Term | | | Carry | | | Book/Tax | | | and | | | Appreciation/ | | | Accumulated | |
| Income | | | Gains | | | Forwards | | | Differences | | | Late Year Loss | | | (Depreciation) | | | Earnings/(Deficits) | |
| $ | 31,102 | | | $ | 207,625 | | | $ | — | | | $ | — | | | $ | — | | | $ | 7,068,452 | | | $ | 7,307,179 | |
The difference between book basis and tax basis unrealized appreciation and accumulated net realized gain from security transactions is primarily attributable to the tax deferral of losses on wash sales.
Permanent book and tax differences, primarily attributable to the tax treatment of net operating losses, resulted in reclassification for the year ended December 31, 2013 as follows:
| Undistributed | | | Accumulated | |
| Net Investment | | | Net Realized | |
| Income (Loss) | | | Gains (Loss) | |
| $ | 29,589 | | | $ | (29,589 | ) |
Subsequent events after the date of the Statement of Assets and Liabilities have been evaluated through the date the financial statements were issued. Management has concluded that there is no impact requiring adjustment or disclosure in the financial statements.
BOYAR VALUE FUND, INC.
EXPENSE EXAMPLES (Unaudited)
June 30, 2014
As a shareholder of the Boyar Value Fund, you incur two types of costs: (1) transaction costs, including sales charges (loads) on purchases and redemption fees; (2) ongoing costs, including management fees and distribution fees; and other Fund expenses. This example is intended to help you understand your ongoing costs (in dollars) of investing in the Boyar Value Fund and to compare these costs with the ongoing costs of investing in other mutual funds.
The example is based on an investment of $1,000 invested at the beginning of the period and held for the entire period from January 1, 2014 through June 30, 2014.
Actual Expenses
The “Actual Expenses” line in the table below provides information about actual account values and actual expenses. You may use the information below, together with the amount you invested, to estimate the expenses that you paid over the period. Simply divide your account value by $1,000 (for example, an $8,600 account value divided by $1,000 = 8.6), then multiply the result by the number in the table under the heading entitled “Expenses Paid During Period” to estimate the expenses you paid on your account during this period.
Hypothetical Example for Comparison Purposes
The “Hypothetical” line in the table below provides information about hypothetical account values and hypothetical expenses based on the Boyar Value Fund’s actual expense ratio and an assumed rate of return of 5% per year before expenses, which is not the Fund’s actual return. The hypothetical account values and expenses may not be used to estimate the actual ending account balances or expenses you paid for the period. You may use this information to compare this 5% hypothetical example with the 5% hypothetical examples that appear in the shareholder reports of other funds.
Please note that the expenses shown in the table are meant to highlight your ongoing costs only and do not reflect any transactional costs, such as sales charges (loads), or redemption fees. Therefore, the table is useful in comparing ongoing costs only, and will not help you determine the relative total costs of owning different funds. In addition, if these transactional costs were included, your costs would have been higher.
| | | Beginning
Account Value
1/1/14 | | Ending
Account Value
6/30/14 | | Expenses Paid
During Period*
1/1/14 – 6/30/14 | | Expense Ratio
During Period **
1/1/14 – 6/30/14 |
| Actual | | $1,000.00 | | $1,014.50 | | $8.74 | | 1.75% |
Hypothetical
(5% return before expenses) | | $1,000.00 | | $1,016.12 | | $8.75 | | 1.75% |
| * | Expenses are equal to the average account value times the Fund’s annualized expense ratio multiplied by the number of days in the most recent fiscal half-year [181] divided by the number of days in the fiscal year [365]. |
BOYAR VALUE FUND, INC.
SUPPLEMENTAL INFORMATION (Unaudited)
June 30, 2014
FACTORS CONSIDERED BY BOARD IN APPROVING THE CONTINUANCE OF THE MANAGEMENT AGREEMENT AND THE ADVISORY AGREEMENT
At a Board meeting held on November 12, 2013, the Fund’s Board of Directors, including a majority of the Fund’s Independent Directors, approved the continuation of the Fund’s Investment Advisory Agreement with the Adviser and the Management Agreement with the Manager. As required by the 1940 Act, the Board requested and each of the Adviser and the Manager provided such information as the Board deemed to be reasonably necessary to evaluate the terms of the Agreements. Fund counsel noted in selecting the Adviser and the Manager and approving the continuance of the Agreements, the Independent Directors were informed that they are authorized to engage such experts as they consider appropriate, including counsel to the Independent Directors.
The Independent Directors, both prior to the meeting and other meetings held during the current year, received materials relating to the Adviser’s investment services under the Investment Advisory Agreement. These materials included information on (i) the investment performance of the Fund over various periods of time compared to the performance of a peer group of funds consisting of the Fund and other large-cap value funds (“Performance Universe”), as classified by Morningstar and objectively selected as comparable to the Fund, and to the Fund’s benchmark index; (ii) sales and redemption data with respect to the Fund; (iii) the general investment outlook in the markets in which the Fund invests; (iv) arrangements with respect to the distribution of the Fund’s shares; and (v) the overall nature, quality and extent of services provided by the Adviser and the Manager.
As part of the review of the continuance of the Investment Advisory Agreement and the Management Agreement, the Board requested, and the Adviser and Manager each provided, additional information in order to evaluate the quality of their services and the reasonableness of their fees under the Agreements. In a separate executive session, the Independent Directors reviewed information, which included data comparing: (i) the Fund’s advisory and management fees, 12b-1 fees, and other non-management fees, to those incurred by the Performance Universe; (ii) the Fund’s average expense ratio to those of its Performance Universe (both before and after waivers); (iii) the Fund’s investment performance over various time periods to the average performance of the Performance Universe and the Fund’s benchmark index; (iv) the Adviser’s financial results and condition, including an oral discussion of the Adviser’s and the Manager’s and their respective affiliates’ profitability from the services that have been performed for the Fund; (v) the Adviser’s current investment management staffing; and (vi) the Fund’s potential for achieving economies of scale. In support of its review of the statistical information, the Board was provided with a description of the methodology used by the Administrator to determine the Performance Universe to prepare its information.
The Board considered several matters in connection with its renewal of the Agreements including investment performance; personnel and methods; fees and expenses; nature and quality of other services; other benefits; and economies of scale. However, the Board did not identify any single factor as all-important or controlling, and this summary does not detail all the matters that were considered. The Independent Directors also met in executive session to deliberate in their considerations of the Agreements.
Investment Performance. The Board reviewed the Fund’s overall investment performance and compared it to its Performance Universe and the Fund’s benchmark index. The Board noted that the Fund outperformed the average performance of the Performance Universe for the one-, three- and five-year periods ended September 30, 2013, yet underperformed its benchmark index during each respective period. The Board concluded that the Fund’s performance was satisfactory.
BOYAR VALUE FUND, INC.
SUPPLEMENTAL INFORMATION (Unaudited) (Continued)
June 30, 2014
Personnel and Methods. The Board reviewed the background of Mr. Boyar, the portfolio manager who has been responsible for the daily management of the Fund’s portfolio since the Fund’s inception, achieving the Fund’s investment objective and adhering to the Fund’s investment strategy. The Independent Directors also engaged in discussions with Mr. Boyar and considered his staff who are responsible for assisting Mr. Boyar in the overall functioning of the Adviser, and the Manager and members of its staff who are responsible for the overall functioning of the Manager. Based on this review, the Board concluded that the Fund’s management team and the Adviser’s and the Manager’s overall resources (in conjunction with those of its affiliates that it relies upon) were adequate and that the Adviser in particular had investment management capabilities and personnel essential to performing its duties under the Investment Advisory Agreement. The Board considered the favorable history, reputation, qualifications and background of the Adviser, as well as the qualifications of its personnel. The Board concluded that the personnel and methods were satisfactory.
Fees and Expenses. The Board then considered the Adviser’s and the Manager’s fees under the Agreements relative to the management fees charged by the Fund’s Performance Universe. The Board noted that the Fund had a higher overall combined management fee and advisory fee rate and a higher gross and net expense ratios (before and after giving effect to the fee waiver and expense reimbursement) than many of the Funds in its Performance Universe. The Board also noted and viewed favorably that the Adviser typically charges its other clients an advisory fee at a rate higher than the Fund’s gross advisory fee rate and significantly higher than the net advisory fee rate that the Adviser receives from the Fund after giving effect to the fee waiver. The Board also viewed favorably that the Adviser, the Manager and the Fund’s distributor have since the Fund’s inception voluntarily agreed to waive all or a portion of their fees and to reimburse the Fund’s expenses in order to keep the Fund’s net total operating expenses (excluding extraordinary expenses and taxes) at 1.75% of the Fund’s average daily net assets. The Board noted that, after giving effect to the above described expense limitation, the Adviser and the Manager did not receive any advisory or management fees from the Fund for the 2012 calendar year and the Distributor reimbursed the Fund in an amount necessary to maintain the above described expense limitation. The Board also noted, that after giving effect to the above described expense limitation, the Adviser and the Manager are receiving only a portion of their respective advisory/management fees from the Fund for the current calendar year. Based on these factors, the Board determined that the Fund’s advisory and management fee rates under the Agreements do not constitute fees that are so disproportionately large as to bear no reasonable relationship to the services rendered and that could not have been the product of arm’s-length bargaining, and concluded that the advisory and management fee rates under the Agreements are fair and reasonable.
Nature and Quality of Other Services; Profitability. The Board next considered the nature, quality, cost and extent of other services provided by the Adviser and the Manager, and Ladenburg Thalmann & Co. as the Fund’s principal underwriter. At meetings held throughout the year, the Board reviewed the effectiveness of the Adviser’s and the Fund’s overall compliance programs. Based on this review, the Board concluded that the nature, quality, cost and extent of such other services provided by the Adviser and the Manager were satisfactory, reliable and beneficial to the Fund’s shareholders. The Board was informed by the Adviser and the Manager that given the amount of fees received from the Fund and the current fee waivers and periodic reimbursements being made in order to keep the Fund’s expense ratio at 1.75%, neither the Adviser nor the Manager is making a profit under the Agreements.
Other Benefits. The Board also considered the character and amount of other direct and incidental benefits received by the Adviser, the Manager and their respective affiliates from their association with the Fund. The Board concluded that potential “fall-out” benefits that they may receive, such as greater name recognition, appear to be reasonable, and may in some cases benefit the Fund.
BOYAR VALUE FUND, INC.
SUPPLEMENTAL INFORMATION (Unaudited) (Continued)
June 30, 2014
Economies of Scale. The Board noted that, given the current and anticipated size of the Fund, any perceived and potential economies of scale were not yet a relevant consideration for the Fund and the addition of break points was determined not to be necessary at this time.
Fees and Services Provided for Other Comparable Funds/Accounts Managed by the Adviser and its Affiliates. In addition to comparing the Fund’s combined advisory and management fee rate to unaffiliated mutual funds included in the Fund’s Performance Universe, the Board was informed by the Adviser that it does not manage any other registered investment companies, although it does manage an unregistered investment company that has a different fee structure that includes a performance allocation. As noted above, the Adviser also manages separate accounts that on average have a higher investment advisory fee rate than the contractual advisory fee rate with the Fund. The Board was informed that the Manager does not manage any other accounts.
Conclusion. Based on the Board’s deliberations and its evaluation of the information described above, the Board, including the Independent Directors, concluded that: (a) it was appropriate to continue to retain the Adviser and the Manager; (b) the terms of the Investment Advisory Agreement and the Management Agreement (including the fees thereunder) are fair and reasonable; and (c) the Fund’s Investment Advisory Agreement and Management Agreement each should continue for a one-year period.
| PRIVACY notice |
| |
| Rev. June 2011 |
| |
| FACTS | WHAT DOES BOYAR VALUE FUND, INC. DO WITH YOUR PERSONAL INFORMATION? |
| | |
| Why? | Financial companies choose how they share your personal information. Federal law gives consumers the right to limit some but not all sharing. Federal law also requires us to tell you how we collect, share, and protect your personal information. Please read this notice carefully to understand what we do. |
| | |
| What? | The types of personal information we collect and share depend on the product or service you have with us. This information can include: ■ Social Security number ■ Purchase History ■ Assets ■ Account Balances ■ Retirement Assets ■ Account Transactions ■ Transaction History ■ Wire Transfer Instructions ■ Checking Account Information When you are no longer our customer, we continue to share your information as described in this notice. |
| | |
| How? | All financial companies need to share customers’ personal information to run their everyday business. In the section below, we list the reasons financial companies can share their customers’ personal information; the reasons Boyar Value Fund, Inc. chooses to share; and whether you can limit this sharing. |
| | | |
| Reasons we can share your personal information | Does Boyar
Value Fund, Inc,
share? | Can you limit this sharing? |
For our everyday business purposes – such as to process your transactions, maintain your account(s), respond to court orders and legal investigations, or report to credit bureaus | Yes | No |
For our marketing purposes – to offer our products and services to you | No | We don’t share |
| For joint marketing with other financial companies | No | We don’t share |
For our affiliates’ everyday business purposes – information about your transactions and experiences | No | We don’t share |
For our affiliates’ everyday business purposes – information about your creditworthiness | No | We don’t share |
| For nonaffiliates to market to you | No | We don’t share |
| Questions? | Call 1-402-493-4603 |
Rev. June 2011
| Who we are |
| Who is providing this notice? | Boyar Value Fund, Inc. |
| What we do |
| How does Boyar Value Fund, Inc. protect my personal information? | To protect your personal information from unauthorized access and use, we use security measures that comply with federal law. These measures include computer safeguards and secured files and buildings. Our service providers are held accountable for adhering to strict policies and procedures to prevent any misuse of your nonpublic personal information. |
| How does Boyar Value Fund, Inc. collect my personal information? | We collect your personal information, for example, when you ■ Open an account ■ Provide account information ■ Give us your contact information ■ Make deposits or withdrawals from your account ■ Make a wire transfer ■ Tell us where to send the money ■ Tells us who receives the money ■ Show your government-issued ID ■ Show your driver’s license We also collect your personal information from other companies. |
| Why can’t I limit all sharing? | Federal law gives you the right to limit only ■ Sharing for affiliates’ everyday business purposes – information about your creditworthiness ■ Affiliates from using your information to market to you ■ Sharing for nonaffiliates to market to you State laws and individual companies may give you additional rights to limit sharing. |
| Definitions |
| Affiliates | Companies related by common ownership or control. They can be financial and nonfinancial companies. ■ Boyar Value Fund, Inc. does not share with our affiliates. |
| Nonaffiliates | Companies not related by common ownership or control. They can be financial and nonfinancial companies
■ Boyar Value Fund, Inc. does not share with nonaffiliates so they can market to you. |
| Joint marketing | A formal agreement between nonaffiliated financial companies that together market financial products or services to you.
■ Boyar Value Fund, Inc. does not jointly market. |
This Page Intentionally Left Blank.
PROXY VOTING POLICY
Information regarding how the Fund voted proxies relating to portfolio securities for the most recent twelve month period ended June 30 as well as a description of the policies and procedures that the Fund uses to determine how to vote proxies is available without charge, upon request, by calling 1-800-266-5566 or by referring to the Securities and Exchange Commission’s (“SEC”) website at http://www.sec.gov.
PORTFOLIO HOLDINGS
The Fund files its complete schedule of portfolio holdings with the SEC for the first and third quarters of each fiscal year on Form N-Q. Form N-Q is available on the SEC’s website at http://www.sec.gov and may be reviewed and copied at the SEC’s Public Reference Room in Washington, DC (1-800-SEC-0330). The information on Form N-Q is available without charge, upon request, by calling 1-800-266-5566.
FUND MANAGER
Ladenburg Thalmann Fund Management, LLC
520 Madison Avenue, 9th Floor
New York, New York 10022
INVESTMENT ADVISOR
Boyar Asset Management, Inc.
6 East 32nd Street, 7th Floor
New York, New York 10016
ADMINISTRATOR
Gemini Fund Services, LLC
80 Arkay Drive, Suite 110
Hauppauge, New York 11788
Item 2. Code of Ethics.
Not applicable for semi-annual reports.
Item 3. Audit Committee Financial Expert.
Not applicable for semi-annual reports.
Item 4. Principal Accountant Fees and Services.
Not applicable for semi-annual reports.
Item 5. Audit Committee of Listed Companies. Not applicable to open-end investment companies.
Item 6. Schedule of Investments. See Item 1.
Item 7. Disclosure of Proxy Voting Policies and Procedures for Closed-End Funds. Not applicable to open-end investment companies.
Item 8. Portfolio Managers of Closed-End Management Investment Companies. Not applicable to open-end investment companies.
Item 9. Purchases of Equity Securities by Closed-End Management Investment Company and Affiliated Purchasers. Not applicable to open-end investment companies.
Item 10. Submission of Matters to a Vote of Security Holder. None.
Item 11. Controls and Procedures.
(a)
Based on an evaluation of the registrant’s disclosure controls and procedures as of June 30, 2007, the disclosure controls and procedures are reasonably designed to ensure that the information required in filings on Forms N-CSR is recorded, processed, summarized, and reported on a timely basis.
(b)
There were no significant changes in the registrant’s internal control over financial reporting that occurred during the registrant’s last fiscal half-year that have materially affected, or are reasonably likely to materially affect, the registrant’s internal control over financial reporting.
Item 12. Exhibits.
(a)(1) Not applicable.
(a)(2) Certification(s) required by Section 302 of the Sarbanes-Oxley Act of 2002 (and Item 11(a)(2) of Form N-CSR) are filed herewith.
(a)(3) Not applicable.
(b) Certification(s) required by Section 906 of the Sarbanes-Oxley Act of 2002 (and Item 11(b) of Form N-CSR) are filed herewith.
SIGNATURES
Pursuant to the requirements of the Securities Exchange Act of 1934 and the Investment Company Act of 1940, the registrant has duly caused this report to be signed on its behalf by the undersigned, thereunto duly authorized.
(Registrant)
The Boyar Value Fund, Inc.
By (Signature and Title)
*
Jonathan Boyar
/s/ Jonathan Boyar, President
Date
8/27/14
Pursuant to the requirements of the Securities Exchange Act of 1934 and the Investment Company Act of 1940, this report has been signed below by the following persons on behalf of the registrant and in the capacities and on the dates indicated.
By (Signature and Title)
*
Jonathan Boyar
/s/ Jonathan Boyar, President
Date
8/27/14
By (Signature and Title)
*
Dawn Borelli
/s/ Dawn Borelli, Treasurer
Date
8/27/14
* Print the name and title of each signing officer under his or her signature.
-2-
-3-