united states
securities and exchange commission
washington, d.c. 20549
form n-csr
certified shareholder report of registered management
investment companies
Investment Company Act file number 811-08253
The Boyar Value Fund, Inc.
(Exact name of registrant as specified in charter)
6 East 32nd Street, 7th Floor, New York, NY 10016
(Address of principal executive offices) (Zip code)
Mike Wagner, Gemini Fund Services, LLC
80 Arkay Drive, Hauppauge, NY 11788
(Name and address of agent for service)
Registrant's telephone number, including area code: 212-995-8300
Date of fiscal year end: 12/31
Date of reporting period: 12/31/15
Item 1. Reports to Stockholders.
 | Our favorite holding period is forever.
-- Warren Buffett |
| | |
Dear Boyar Value Fund Shareholder:
The best performing asset class of 2015 was stocks, whose meager 1.38% total return as measured by the S&P 500 still surpassed those of long-term bonds, short-term treasury bills and commodities. Those minimal gains make 2015 the worst for finding positive returns since 1937, when the 3 month Treasury bill outdistanced the other major asset classes with a return of 0.3 percent.
Some of the world’s greatest investors struggled in 2015. Warren Buffett, David Einhorn and Carlos Slim, until recently the world’s richest man, all suffered double digit losses. Last year proved particularly troublesome for hedge funds, the average of which was down about 4 percent according to Hedge Fund Research. Bill Ackman of Pershing Square sent a letter to investors in December saying 2015 was the fund’s worst year since it was founded in 2004, losing more than 19%.
In previous bad years investors were able to capture substantial returns in at least one major asset class. For example, 2008 was a terrible year for equity markets worldwide, but bonds increased more than 20%. But in 2015 not one major asset class performed well.
The 30-year U.S. Treasury note returned a negative 2 percent, the 3-month Treasury bill returned 0.11% and the CRB commodities index fell more than 23% according to Societe Generale. 2015 was certainly an outlier when it came to investment returns. According to Bianco Research, gains from the best-performing assets had surpassed 10% in all but one year since 1995. Going back nine decades, 23 years (or a quarter of the total) saw at least one asset class return more than 30 percent. In addition only four years ended with gains smaller than 4 percent.
Had you been devoid of any type of communication for the full year, and checked the S&P 500 on December 31st you would have thought not much had happened in the markets during 2015. Although the S&P 500, inclusive of dividends advanced by about 1.45%, volatility spiked, with the number of days with 1% moves (in either direction) increasing dramatically. During August we saw a sharp and swift decline of 10%, the first such correction since 2008. Between August 10th and August 25th, the Dow Jones Industrial Average plunged 11% on fears that everyone had underestimated China’s troubles and their impact on the rest of the world. Besides the slowdown in China, as its economy shifts from one that is dependent on exports and government spending to an economy predicated on consumer spending there were a number of other factors that contributed to both the stock market volatility and lackluster results in 2015.
The Energy Market
The price of a barrel of West Texas Intermediate crude oil posted its all-time high of $147.27 on July 11, 2008. When the financial crisis struck later that year, the price of crude had fallen back all the way to around $30 a barrel. WTI did not top $100 a barrel again until February of 2011.
U.S. oil producers then turned to a new technology that had transformed the natural gas industry in the country - hydraulic fracturing, or fracking. By 2010, just three years after pundits had predicted the inevitable decline of U.S. onshore oil production, crude oil output had reached a low of 4.5 million barrels a day. By late 2013, fracking had boosted that total to 7.5 million barrels a day. Two years later that number has increased by an additional 1 million barrels per day, producing an oil glut. This oil supply coupled with a slowing in the world’s major economies has negatively impacted oil demand and has driven crude prices to below $30 a barrel.
In order to help finance the fracking revolution companies turned to the high yield debt market. It is estimated that approximately 20% of the total high yield debt market is currently represented by energy related companies. With the price of a barrel of oil plummeting there is concern that a number of these companies will not be able to service their debt.
6 East 32st Street • 7th Floor • New York, NY 10016 • P. 212.995.8300 • F. 212.995.5636
www.BoyarValueGroup.com
The precipitous decline in the price of crude is a double-edged sword. Clearly consumers benefit mightily, which should buoy both retail and leisure stocks among others. On the other hand, states such as North Dakota, Texas, Pennsylvania and California which benefited from the spike in oil prices have begun to feel the pain. Unemployment has risen and real estate values have softened. A lot of these lost jobs were high paying and helped drive the economy during the past couple of years. During the second half of the year, the stock market was held hostage by the price of oil. In fact the two markets seemed to move in lockstep. A number of forecasters are predicting a continued decline in crude prices during the first half of 2016. Goldman Sachs believes oil could fall to $20 per barrel. You may recall Goldman predicted $200 a barrel oil when it was trading at $140 a number of years ago.
The Federal Reserve & The U.S. Dollar
When the Fed cut short-term rates to near zero in December 2008, the U.S. was losing hundreds of thousands of jobs per month and the financial system was on the verge of collapse. The rate cut was an emergency response which was not expected to last very long. This “temporary” measure lasted for seven years. On December 16th, the Fed declared that the economy was finally healthy enough and raised interest rates by a quarter of a point. They are targeting approximately four rate hikes for 2016. With the world economy in such a fragile state it is questionable whether that will occur. Furthermore, the Fed is cognizant of what happened in the late 1930’s when interest rates rose too rapidly crippling the U.S. economy. The fear of an impending interest rate rise in 2015 (even though it was one of the most telegraphed in economic history) impeded the bull market advance.
The strong dollar negatively impacted the sales and earnings of many U.S. multi-national businesses causing them to miss analysts’ earnings expectations, driving down their share prices. Lastly the increase of terrorist attacks throughout the world proved to be an additional headwind for the market.
2015 Performance
2015 was certainly not a year to write home about. In the 4th quarter, The Boyar Value Fund increased 4.55% versus 7.04% for the S&P 500. For the year the fund was down .11% versus a 1.38% gain for the S&P 500. Our underperformance was caused by our lack of exposure to the so called “FANG” stocks (Facebook, Apple, Netflix and Google). Jessica Binder Graham, a Goldman Sachs analyst, quantified not only how much these stocks contributed to the S&P 500’s modest gain (The S&P 500 is a market weighted index, meaning that larger companies performance is given more weight when calculating index performance) but how it also masked how poorly most stocks fared in 2015. The S&P 500 ended the year at an index level of 2044 and according to Ms. Graham’s research Amazon was responsible for 15.8 points; Microsoft 8 points; Facebook 6.5 points and Alphabet formerly Google 15.8 points. If you exclude these names along with four other big-cap gainers, the S&P 500 would have decreased by 4%. Furthermore, the average S&P 500 stock declined almost 4%, according to Bespoke Investment Group. While as consumers we love the FANG stocks products/services, however as value investors we do not particularly care for the rich multiples they sell for.
A Look Ahead
Volatility
The past twelve months featured some stomach churning moments including a market drop of more than 10% during the month of August. In addition, there were many days when the stock market experienced 100 point moves both up and down. Towards the end of the year the market was held captive to the price movement of crude oil. In days when the price of that commodity advanced stocks also moved higher. Conversely, on down days when the price of oil slid so did stocks. We would look for more of the same in 2016.
Fourth Year of the Presidency
Presidential election years are the second best performing year of the four-year cycle, producing loses of greater than 5% in only six of those 30 years according to The Stock Trader’s Almanac. Incumbent parties lost power in five of those years. Interestingly eighth years of presidential terms represent the worst of election years since 1920. In the 8th year, the DJIA and the S&P 500 have suffered average declines of -13.9% and -10.9% respectively. Out of these six full years, only 1988 was positive.
To add to the confusion, the Obama years thus far have been diametrically opposed to normal historical patterns. The first and second year of a president’s term has normally been the worst in terms of stock market performance. In the case of President Obama, the first and second year of his second term saw the S&P 500 experience double digit returns, while the third year, normally the best for stocks has thus far been the worst. So it is anybody’s guess as to how the fourth year turns out. My suggestion is to listen to Henry Singleton, investor extraordinaire: “I don’t believe all this nonsense about historical rhetoric or market timing. Just buy good value and when the market is ready, that value will be recognized.”
The Strong U.S. Dollar
The strong U.S. dollar negatively impacts the earnings of U.S. multinational corporations. On the other hand, a strong currency attracts foreign investment and helps finance our deficit. It should also enable interest rates to remain lower than normally would be the case. However it causes particular pain for firms in emerging markets that issued bonds in dollars instead of local currencies. The dollar’s rise means it will take more of them to repay the debt. If we use the euro as a surrogate for all the major world currencies you can see the magnitude of the greenback’s gain. The summer of 2014 saw the euro trade at around 136, today it trades at ~109. There are a growing number of pundits who believe it will trade at par with the U.S. dollar. On a purchasing power parity basis that makes no sense. Our predication is the euro does not trade at 100, if it does take a European vacation or better still buy a house in Tuscany.
Higher Interest Rates
The Fed has telegraphed four interest rate hikes for 2016. With the U.S. economy growing at a paltry 2%, after all the stimulus thrown at it by the Federal Reserve, and the rest of the world’s major economies teetering, it is unlikely that we will get that many rate hikes in 2016. In all likelihood any interest hikes that occur will be in March and June. The Fed normally does not like to raise rates as Election Day nears. What you don’t want is for the Fed to be too aggressive and impede the economic expansion. Unfortunately, the history of the Federal Reserve is littered with mistakes big and small. Let’s hope the Fed does the right thing. The Fed is certainly cognizant of what happened to the economy in the late 1930’s, when it prematurely raised rates, thinking the economy was on sound footing.
Precipitous Decline in the Price of Oil
As mentioned in the early part of this letter, the decline in the price of oil from more than $140 a barrel to below $30 per barrel is a double edged sword. Approximately 20% of the entire high yield debt market is represented by oil and gas producers. The spread in the high yield market versus U.S. Treasuries has widened dramatically, reflecting potential defaults from highly leveraged energy related businesses. A growing number of analysts are predicting the price of oil could fall to $20 per-barrel in 2016, including Goldman Sachs, who once predicted oil would reach $200 per barrel....It is anyone’s guess how low oil can get before it rebounds. Fracking will continue to be a large contributor to oil output during the foreseeable future, and with Iran once again entering the market do not look for the price of oil to reach $100 a barrel anytime soon.
The Death of Bricks and Mortar Retail Has Been Greatly Exaggerated
Stock performance for conventional retailers has been subpar, reflecting industry concerns pertaining to consumer fundamentals and the potentially disruptive impact of e-commerce. In our view, the highly negative investor sentiment and corresponding declines have overstated the impact of these headwinds, and have created attractive investment opportunities that should begin to bear fruit in 2016.
Conventional store locations still retain a highly relevant and valuable part of the retail industry landscape. In some cases these store locations are also a meaningful source of value for companies that own the underlying real estate, providing an additional source of downside protection for shareholders. Importantly, many conventional retailers have invested significant resources in their e-commerce capabilities in order to become effective omni-channel providers. Broader consumer uncertainty could remain an ongoing challenge, but we would not view this as a long-term challenge to overall sector sales and profits. Looking ahead, any upgrade in consumer sentiment paired with the substantial recent declines in gasoline prices could eventually serve as meaningful drivers of demand across the retail space. While this gradual recovery materializes, several retail stocks that we follow offer dividend yields of over 3% that should further reward investor patience.
Time to Tune in to Media Stocks – Shares of Many Companies in the Bargain Bin
There are a number of uncertainties facing the media sector these days including OTT/SVOD threats, skinny bundles, cord cutting, among others. Investing in the rapidly evolving media sector is not without its perils, but we believe the sell-off in many media stocks has presented an opportunity. Media shares were buffeted in 2015 following the release of Disney’s 3Q 2015 earnings in August 2015 when it reduced its growth outlook for its cable networks to mid-single-digits (previously high single-digit) reflecting, in part, a “modest” decline in subscribers at its flagship ESPN cable network. During Liberty Media’s recent investor day held in November 2015, legendary media investor Dr. John Malone commented on the sell-off in media stocks post the Disney revelation and stated, “The overreaction of the market kind of surprised me. … Like anything else it creates opportunity. If things get mispriced, that’s opportunity for investors.” Historically the media sector has been a fertile ground for our firm due to the favorable investment merits of many media stocks, including irreplaceable assets, strong brands, and attractive recurring revenue streams. While the media sector was a tough place for investors during 2015, we believe from a long-term perspective this area of the market offers some compelling buying opportunities.
************************************
Competitive Returns (Unaudited)
As you can see from the chart below, our buy and hold philosophy has enabled the Fund to produce after tax returns that pretty much mirror our pre-tax returns. The returns used in the illustration exclude loads, but are inclusive of all fees, and assumes the highest rates when calculating after tax returns.
| Average Annual Returns |
| (Through 12/31/15) |
| | | | | | | | | | | Since |
| | | 1 Year | | 3 Year | | 5 Year | | 10 Year | | Inception* |
| At NAV | | (0.11)% | | 13.41% | | 11.91% | | 6.22% | | 6.43% |
| Inclusive of sales charges | | (5.09)% | | 11.48% | | 10.77% | | 5.68% | | 6.12% |
| After taxes on distribution | | (5.70)% | | 10.99% | | 10.41% | | 5.32% | | 5.72% |
| After taxes on distribution and the sale of shares | | (2.37)% | | 8.95% | | 8.57% | | 4.57% | | 5.01% |
| S&P 500 Index | | 1.38% | | 15.13% | | 12.57% | | 7.31% | | 5.44% |
| *(5/5/98) | | | | | | | | | | |
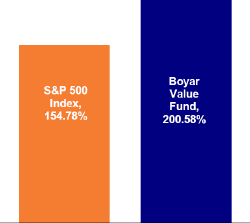
Cumulative Returns Since Inception
At NAV (5/5/98 through 12/31/15)
The Boyar Value Fund has a maximum sales charge of 5.00%. After-tax returns are calculated using the highest historical individual Federal income tax rate and do not reflect the additional impact of state and local taxes. Actual after-tax returns depend on a shareholder’s tax situation and may differ from those shown. After-tax returns are not relevant for shareholders who hold Fund shares in tax-deferred accounts or for shares held by non-taxable entities. The Fund may invest in stocks of several different capitalization levels and it is important to note that historically, small- and mid-cap stocks have experienced greater volatility than stocks of larger, more established companies. Additionally, value-based investments are subject to the risk that the broad market may not recognize their intrinsic value. As portfolio and market conditions change future distributions and yields will vary, dividends are not guaranteed. Distribution amount may include net investment income, capital gains and or return of capital. Distribution amount is not indicative of Fund performance. Individual performance results will vary and may include the reinvestment of income/dividends and capital gains distributions. Performance figures for periods greater than one year are annualized.
The S&P 500 Total Return Index (“S&P 500 TR”) is an unmanaged capitalization weighted index of 500 stocks designed to measure performance of the broad domestic economy through changes in the aggregate market value of the 500 stocks representing all major industries.
The performance of the indices includes reinvestment of dividends and capital gains, however, it does not include any expenses or a deduction for Federal income taxes. A shareholder cannot invest in an index. This information is provided for comparison purposes only.
Comparisons to indexes have limitations because indexes have volatility and other material characteristics that may differ from a particular investment. Any indices and other financial benchmarks are provided for illustrative purposes only. Particularly, an Investment Index has results that do not represent actual trading or any material economic and market factors that might have had an impact on the advisor’s decision-making. An investment cannot be made directly in an index. Index performance does not reflect the deduction of any management fees, taxes or expenses.
The total annual operating expense ratio for the Boyar Value Fund (before fee waivers/expense reimbursements) as stated in the fee table in the Fund’s prospectus dated May 1, 2015 was 2.40%. The net annual operating expense ratio (after fee waivers/expense reimbursement) was 1.82% for the same period. [An updated total annual operating expenses figure will appear in the Fund’s next prospectus update.]
^ The performance data quoted represents past performance. Past performance does not guarantee future results, and except where noted as after-tax, does not reflect the deduction of taxes that a shareholder would pay on Fund distributions or the redemption of Fund shares. The investment return and principal value of an investment will fluctuate. Consequently, an investor’s shares, when redeemed, may be worth more or less than their original cost. Returns for periods greater than one year are annualized. Current performance may be lower or higher than the performance data quoted. To obtain performance information current to the most recent month end, please call 1-800-266-5566.
Comparison of the Change in Value of a $10,000 Investment (Unaudited)
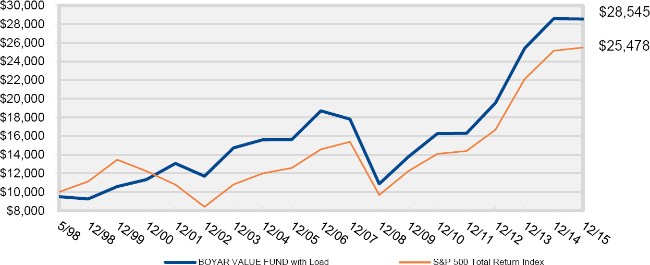
The Chart above represents historical performance of a hypothetical investment of $10,000 in the Boyar Value Fund from inception. The performance of the Fund includes the reinvestment of all dividend and capital gain distributions and has been adjusted for the maximum applicable sales charge of 5.00%. The performance of the Fund as reflected in the chart does not include the effect of taxes incurred on Fund distributions or on the redemption of Fund shares.
Portfolio Diversification By Sector (as of December 31, 2015)
(as a percentage of total net assets) (Unaudited)
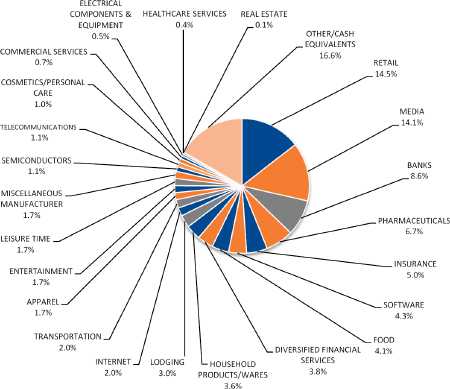
The composition of the Fund’s portfolio is subject to change.
Please refer to the Portfolio of Investments in this annual report for a detailed analysis of the Fund’s holdings.
The mention of specific securities or asset classes is not a recommendation or solicitation for any person to buy, sell or hold any particular security or asset class.
It’s not what you make; it’s what you keep – Taxes are potentially the biggest expense an individual mutual fund investor will experience.
By holding stocks for long periods of time, you postpone paying taxes, which positively impacts long-term returns. Buying and holding stocks for long periods may sound stodgy, but it postpones the payment of capital gains taxes with the added positive effects on the compounding rate. Since profit taking involves transactions, it obliges you to take the IRS in as a partner. With profits not taken, there is a future tax liability, but all the money is still working for its owner. No transactions, no tax. The Boyar Value Fund believes that holding stocks for long periods of time is the best way for an individual investor to create wealth.
| | Best regards, |
| |  |
| | Mark A. Boyar |
This letter seeks to describe the Fund managers’ current view of the market. Statements referring to future events or actions, such as future financial performance, are based on current expectations and projections about future events provided by various sources, including the Fund’s management. These statements are not guarantees of future performance, and actual events and results may differ materially from those discussed herein. The mention of specific securities or asset classes is not a recommendation or solicitation for any person to buy, sell or hold any particular security or asset class.
Activities with respect to Distributor Services are conducted through Ladenburg Thalmann & Co. Inc, (“LTCO”) a member of the NYSE, NYSE AMEX and other principal exchanges. Member FINRA/SIPC.
| BOYAR VALUE FUND, INC. |
| PORTFOLIO OF INVESTMENTS |
| December 31, 2015 |
| Shares | | | | | Value | |
| | | | | COMMON STOCK - 83.4% | | | | |
| | | | | APPAREL - 1.7% | | | | |
| | 13,900 | | | Hanesbrands, Inc. | | $ | 409,077 | |
| | | | | | | | | |
| | | | | BANKS - 8.6% | | | | |
| | 36,095 | | | Bank of America Corp. | | | 607,479 | |
| | 12,707 | | | Bank of New York Mellon Corp. | | | 523,783 | |
| | 4,430 | | | Citigroup, Inc. | | | 229,253 | |
| | 10,750 | | | JPMorgan Chase & Co. | | | 709,821 | |
| | | | | | | | 2,070,336 | |
| | | | | COMMERCIAL SERVICES - 0.7% | | | | |
| | 9,100 | | | Western Union Co. | | | 162,981 | |
| | | | | | | | | |
| | | | | COSMETICS/PERSONAL CARE - 1.0% | | | | |
| | 3,200 | | | Edgewell Personal Care Co. | | | 250,784 | |
| | | | | | | | | |
| | | | | DIVERSIFIED FINANCIAL SERVICES - 3.8% | | | | |
| | 8,500 | | | Ameriprise Financial, Inc. | | | 904,570 | |
| | | | | | | | | |
| | | | | ELECTRICAL COMPONENTS & EQUIPMENT - 0.5% | | | | |
| | 3,200 | | | Energizer Holdings, Inc. | | | 108,992 | |
| | | | | | | | | |
| | | | | ENTERTAINMENT - 1.7% | | | | |
| | 2,305 | | | Madison Square Garden Co., Class A* | | | 372,949 | |
| | 500 | | | Marriott Vacations Worldwide Corp. | | | 28,475 | |
| | | | | | | | 401,424 | |
| | | | | FOOD - 4.1% | | | | |
| | 3,000 | | | Campbell Soup Co. | | | 157,650 | |
| | 3,000 | | | Kraft Foods Group, Inc. | | | 218,280 | |
| | 9,000 | | | Mondelez International, Inc., Class A | | | 403,560 | |
| | 5,000 | | | Sysco Corp. | | | 205,000 | |
| | | | | | | | 984,490 | |
| | | | | | | | | |
See accompanying notes to financial statements.
| BOYAR VALUE FUND, INC. |
| PORTFOLIO OF INVESTMENTS (Continued) |
| December 31, 2015 |
| Shares | | | | | Value | |
| | | | | HEALTHCARE SERVICES - 0.4% | | | | |
| | 850 | | | Laboratory Corp. of America Holdings* | | $ | 105,094 | |
| | | | | | | | | |
| | | | | HOUSEHOLD PRODUCTS/WARES - 3.6% | | | | |
| | 5,000 | | | Clorox Co. | | | 634,150 | |
| | 3,700 | | | Scotts Miracle-Gro Co., Class A | | | 238,687 | |
| | | | | | | | 872,837 | |
| | | | | INSURANCE - 5.0% | | | | |
| | 10,586 | | | Travelers Cos, Inc. | | | 1,194,736 | |
| | | | | | | | | |
| | | | | INTERNET - 2.0% | | | | |
| | 11,600 | | | Reis, Inc. | | | 275,268 | |
| | 6,187 | | | Yahoo!, Inc. * | | | 205,780 | |
| | | | | | | | 481,048 | |
| | | | | LEISURE TIME - 1.7% | | | | |
| | 7,500 | | | Carnival Corp. | | | 408,600 | |
| | | | | | | | | |
| | | | | LODGING - 3.0% | | | | |
| | 10,000 | | | Interval Leisure Group, Inc. | | | 156,100 | |
| | 5,008 | | | Marriott International, Inc., Class A | | | 335,736 | |
| | 9,500 | | | MGM Resorts International* | | | 215,840 | |
| | | | | | | | 707,676 | |
| | | | | MEDIA - 14.1% | | | | |
| | 3,641 | | | AMC Networks, Inc., Class A* | | | 271,910 | |
| | 9,134 | | | Comcast Corp., Special Class A | | | 515,432 | |
| | 9,580 | | | Discovery Communications, Inc., Class C * | | | 241,608 | |
| | 18,653 | | | MSG Networks, Inc., Class A * | | | 387,982 | |
| | 1,341 | | | Time, Inc. | | | 21,013 | |
| | 10,733 | | | Time Warner, Inc., Class A | | | 694,103 | |
| | 7,703 | | | Tribune Media Co. * | | | 260,438 | |
| | 9,500 | | | Walt Disney Co. | | | 998,260 | |
| | | | | | | | 3,390,746 | |
| | | | | | | | | |
See accompanying notes to financial statements.
| BOYAR VALUE FUND, INC. |
| PORTFOLIO OF INVESTMENTS (Continued) |
| December 31, 2015 |
| Shares | | | | | Value | |
| | | | | MISCELLANEOUS MANUFACTURER - 1.7% | | | | |
| | 13,000 | | | General Electric Co. | | $ | 404,950 | |
| | | | | | | | | |
| | | | | PHARMACEUTICALS - 6.7% | | | | |
| | 7,500 | | | Bristol-Myers Squibb Co. | | | 515,925 | |
| | 2,500 | | | Johnson & Johnson | | | 256,800 | |
| | 25,500 | | | Pfizer, Inc. | | | 823,140 | |
| | | | | | | | 1,595,865 | |
| | | | | REAL ESTATE - 0.1% | | | | |
| | 3,700 | | | Trinity Place Holdings, Inc. | | | 22,755 | |
| | | | | | | | | |
| | | | | RETAIL - 14.5% | | | | |
| | 5,000 | | | Bed Bath & Beyond, Inc. * | | | 241,250 | |
| | 10,464 | | | Coach, Inc. | | | 342,487 | |
| | 5,000 | | | CVS Health Corp. | | | 488,850 | |
| | 9,600 | | | Home Depot, Inc. | | | 1,269,600 | |
| | 3,000 | | | McDonald’s Corp. | | | 354,420 | |
| | 19,100 | | | Staples, Inc. | | | 180,877 | |
| | 3,800 | | | Target Corp. | | | 275,918 | |
| | 29,787 | | | Wendy’s Co. | | | 320,806 | |
| | | | | | | | 3,474,208 | |
| | | | | SEMICONDUCTORS - 1.1% | | | | |
| | 8,000 | | | Intel Corp. | | | 275,600 | |
| | | | | | | | | |
| | | | | SOFTWARE - 4.3% | | | | |
| | 18,500 | | | Microsoft Corp. | | | 1,026,380 | |
| | | | | | | | | |
| | | | | TELECOMMUNICATIONS - 1.1% | | | | |
| | 10,000 | | | Cisco Systems, Inc. | | | 271,550 | |
| | | | | | | | | |
| | | | | TRANSPORTATION - 2.0% | | | | |
| | 5,000 | | | United Parcel Service, Inc, Class B | | | 481,150 | |
| | | | | | | | | |
| | | | | TOTAL COMMON STOCK (Cost - $11,123,876) | | | 20,005,849 | |
| | | | | | | | | |
See accompanying notes to financial statements.
| BOYAR VALUE FUND, INC. |
| PORTFOLIO OF INVESTMENTS (Continued) |
| December 31, 2015 |
| Shares | | | | | Value | |
| | | | | SHORT-TERM INVESTMENTS - 16.8% | | | | |
| | 3,225,077 | | | Dreyfus Institutional Reserves Money Fund, 0.01%** | | $ | 3,225,077 | |
| | 821,497 | | | Milestone Treasury Obligations Portfolio - Institutional Class, 0.13%** | | | 821,497 | |
| | | | | TOTAL SHORT-TERM INVESTMENTS (Cost - $4,046,574) | | | 4,046,574 | |
| | | | | | | | | |
| | | | | TOTAL INVESTMENTS - 100.2% (Cost - $15,170,450) (a) | | $ | 24,052,423 | |
| | | | | OTHER ASSETS LESS LIABILITIES - NET - (0.2)% | | | (53,149 | ) |
| | | | | NET ASSETS - 100.0% | | $ | 23,999,274 | |
| * | Non-income producing security. |
| ** | Money market fund; interest rate reflects seven-day effective yield on December 31, 2015. |
| (a) | Represents cost for financial reporting purposes. Aggregate cost for Federal income tax purposes is $15,173,704 and differs from value by net unrealized appreciation (depreciation) of securities as follows: |
| Unrealized appreciation: | | $ | 9,487,576 | |
| Unrealized depreciation: | | | (608,857 | ) |
| Net unrealized appreciation: | | $ | 8,878,719 | |
See accompanying notes to financial statements.
| BOYAR VALUE FUND, INC. |
| STATEMENT OF ASSETS AND LIABILITIES |
| December 31, 2015 |
| ASSETS | | | | |
| Investment securities, at cost | | $ | 15,170,450 | |
| Investment securities, at value | | $ | 24,052,423 | |
| Cash | | | 200 | |
| Dividends and interest receivable | | | 18,282 | |
| Receivable for Fund shares sold | | | 150 | |
| Prepaid expenses and other assets | | | 3,894 | |
| TOTAL ASSETS | | | 24,074,949 | |
| | | | | |
| LIABILITIES | | | | |
| Payable for Fund shares repurchased | | | 170 | |
| Management fees payable | | | 4,350 | |
| Advisory fees payable | | | 6,283 | |
| Distribution fees (12b-1) payable | | | 14,341 | |
| Payable to related parties | | | 11,967 | |
| Accrued expenses and other liabilities | | | 38,564 | |
| TOTAL LIABILITIES | | | 75,675 | |
| NET ASSETS | | $ | 23,999,274 | |
| | | | | |
| Net Assets Consist Of: | | | | |
| Paid in capital | | $ | 15,115,818 | |
| Undistributed net realized gain from security transactions | | | 1,483 | |
| Net unrealized appreciation on investments | | | 8,881,973 | |
| NET ASSETS | | $ | 23,999,274 | |
| | | | | |
| Shares of capital stock outstanding (1,000,000,000 shares authorized, $0.001 par value) | | | 1,080,252 | |
| Net asset value and redemption price per share (Net assets ÷ shares outstanding) (a) | | $ | 22.22 | |
| Maximum offering price per share (maximum sales charge of 5.00%) (b) | | $ | 23.39 | |
| (a) | For certain purchases of $1 million or more, a 1.00% contingent deferred sales charge may apply to redemptions made within twelve months of purchase. Redemptions made within 60 days of purchase may be assessed a redemption fee of 2.00%. |
| (b) | On investments of $50,000 or more, the offering price is reduced. |
See accompanying notes to financial statements.
| BOYAR VALUE FUND, INC. |
| STATEMENT OF OPERATIONS |
| For the Year Ended December 31, 2015 |
| INVESTMENT INCOME | | | | |
| Dividends | | $ | 475,738 | |
| Interest | | | 42 | |
| TOTAL INVESTMENT INCOME | | | 475,780 | |
| | | | | |
| EXPENSES | | | | |
| Investment advisory fees | | | 122,644 | |
| Management fees | | | 122,644 | |
| Distribution (12b-1) fees | | | 61,322 | |
| Administrative services fees | | | 44,846 | |
| Transfer agent fees | | | 33,670 | |
| Legal Fees | | | 32,267 | |
| Accounting services fees | | | 25,999 | |
| Audit Fees | | | 16,779 | |
| Insurance expense | | | 16,621 | |
| Compliance officer fees | | | 12,788 | |
| Directors’ fees and expenses | | | 12,074 | |
| Printing and postage expenses | | | 9,501 | |
| Custodian fees | | | 5,713 | |
| Registration fees | | | 1,985 | |
| Other expenses | | | 6,420 | |
| TOTAL EXPENSES | | | 525,273 | |
| | | | | |
| Fees waived by the Advisor | | | (48,044 | ) |
| Fees waived by the Manager | | | (48,044 | ) |
| NET EXPENSES | | | 429,185 | |
| NET INVESTMENT INCOME | | | 46,595 | |
| | | | | |
| REALIZED AND UNREALIZED GAIN (LOSS) ON INVESTMENTS | | | | |
| Net realized gain from security transactions | | | 548,487 | |
| Net change in unrealized appreciation (depreciation) of investments | | | (623,238 | ) |
| NET REALIZED AND UNREALIZED LOSS ON INVESTMENTS | | | (74,751 | ) |
| | | | | |
| NET DECREASE IN NET ASSETS RESULTING FROM OPERATIONS | | $ | (28,156 | ) |
| | | | | |
See accompanying notes to financial statements.
| BOYAR VALUE FUND, INC. |
| STATEMENTS OF CHANGES IN NET ASSETS |
| | | For the Year | | | For the Year | |
| | | Ended | | | Ended | |
| | | December 31, 2015 | | | December 31, 2014 | |
| | | | | | | | | |
| FROM OPERATIONS | | | | | | | | |
| Net investment income (loss) | | $ | 46,595 | | | $ | (10,354 | ) |
| Net realized gain from security transactions | | | 548,487 | | | | 294,655 | |
| Net change in unrealized appreciation (depreciation) on investments | | | (623,238 | ) | | | 2,430,174 | |
| Net increase (decrease) in net assets resulting from operations | | | (28,156 | ) | | | 2,714,475 | |
| | | | | | | | | |
| DISTRIBUTIONS TO SHAREHOLDERS | | | | | | | | |
| From net realized gains | | | (653,008 | ) | | | (469,777 | ) |
| | | | | | | | | |
| FROM CAPITAL SHARE TRANSACTIONS | | | | | | | | |
| Proceeds from shares sold | | | 755,840 | | | | 625,022 | |
| Net asset value of shares issued in reinvestment of distributions to shareholders | | | 598,531 | | | | 264,490 | |
| Payments for shares redeemed | | | (905,498 | ) | | | (1,213,835 | ) |
| Redemption fee proceeds | | | 152 | | | | 38 | |
| Net increase (decrease) in net assets from capital share transactions | | | 449,025 | | | | (324,285 | ) |
| | | | | | | | | |
| TOTAL INCREASE (DECREASE) IN NET ASSETS | | | (232,139 | ) | | | 1,920,413 | |
| | | | | | | | | |
| NET ASSETS | | | | | | | | |
| Beginning of year | | | 24,231,413 | | | | 22,311,000 | |
| End of year * | | $ | 23,999,274 | | | $ | 24,231,413 | |
| * Includes accumulated net investment income of: | | $ | — | | | $ | — | |
| | | | | | | | | |
| CAPITAL SHARE ACTIVITY | | | | | | | | |
| Shares Sold | | | 32,760 | | | | 29,774 | |
| Shares Reinvested | | | 26,708 | | | | 12,076 | |
| Shares Redeemed | | | (39,344 | ) | | | (57,749 | ) |
| Net increase (decrease) in shares outstanding | | | 20,124 | | | | (15,899 | ) |
| | | | | | | | | |
See accompanying notes to financial statements.
| BOYAR VALUE FUND, INC. |
| FINANCIAL HIGHLIGHTS |
| |
Per Share Data and Ratios for a Share of Capital Stock Outstanding Throughout Each Year
| | | Year | | | Year | | | Year | | | Year | | | Year | |
| | | Ended | | | Ended | | | Ended | | | Ended | | | Ended | |
| | | December 31, | | | December 31, | | | December 31, | | | December 31, | | | December 31, | |
| | | 2015 | | | 2014 | | | 2013 | | | 2012 | | | 2011 | |
| | | | | | | | | | | | | | | | |
| Net Asset Value, Beginning of Year | | $ | 22.86 | | | $ | 20.73 | | | $ | 16.10 | | | $ | 13.44 | | | $ | 13.67 | |
| Activity from investment operations: | | | | | | | | | | | | | | | | | | | | |
| Net investment income (loss)(1) | | | 0.04 | | | | (0.01 | ) | | | (0.03 | ) | | | 0.05 | | | | 0.00 | (2) |
| Net realized and unrealized gain (loss) on investments | | | (0.06 | ) | | | 2.58 | | | | 4.82 | | | | 2.66 | | | | 0.01 | |
| Total from investment operations | | | (0.02 | ) | | | 2.57 | | | | 4.79 | | | | 2.71 | | | | 0.01 | |
| Paid-in-Capital from Redemption Fees | | | 0.00 | (2) | | | 0.00 | (2) | | | 0.00 | (2) | | | — | | | | — | |
| Less distributions from: | | | | | | | | | | | | | | | | | | | | |
| Net investment income | | | — | | | | — | | | | — | | | | (0.05 | ) | | | — | |
| Net realized gains | | | (0.62 | ) | | | (0.44 | ) | | | (0.16 | ) | | | — | | | | (0.22 | ) |
| Paid in capital | | | — | | | | — | | | | — | | | | (0.00 | ) (2) | | | (0.02 | ) |
| Total distributions | | | (0.62 | ) | | | (0.44 | ) | | | (0.16 | ) | | | (0.05 | ) | | | (0.24 | ) |
| Net Asset Value, End of Year | | $ | 22.22 | | | $ | 22.86 | | | $ | 20.73 | | | $ | 16.10 | | | $ | 13.44 | |
| Total Return (3) | | | (0.11 | )% | | | 12.52 | % | | | 29.76 | % | | | 20.16 | % | | | 0.17 | % |
| Net Assets, At End of Year | | $ | 23,999,274 | | | $ | 24,231,413 | | | $ | 22,311,000 | | | $ | 16,366,630 | | | $ | 13,372,592 | |
| Ratio of gross expenses to average net assets (4) | | | 2.14 | % | | | 2.33 | % | | | 2.31 | % | | | 2.81 | % | | | 2.98 | % |
| Ratio of net expenses to average net assets | | | 1.75 | % | | | 1.75 | % | | | 1.75 | % | | | 1.75 | % | | | 1.75 | % |
| Ratio of net investment income (loss)to average net assets | | | 0.19 | % | | | (0.05 | )% | | | (0.15 | )% | | | 0.32 | % | | | 0.00 | % (5) |
| Portfolio Turnover Rate | | | 7 | % | | | 3 | % | | | 7 | % | | | 5 | % | | | 11 | % |
| (1) | Per share amounts calculated using the average shares method. |
| (2) | Amount represents less than $0.005 per share. |
| (3) | Total returns shown are historical in nature and assume changes in share price, reinvestment of dividends and capital gains distributions, if any, and exclude the effect of applicable sales loads/redemption fees. Had the Advisor and Manager not waived their fees and/or reimbursed expenses, total returns would have been lower. |
| (4) | Represents the ratio of expenses to average net assets absent fee waivers and/or expense reimbursements by the Advisor and Manager. |
| (5) | Amount represents less than 0.01% per share. |
See accompanying notes to financial statements.
| BOYAR VALUE FUND, INC. |
| NOTES TO FINANCIAL STATEMENTS |
| December 31, 2015 |
| |
Boyar Value Fund, Inc. (the “Fund”) was incorporated on February 28, 1997 under the laws of the State of Maryland and is registered under the Investment Company Act of 1940, as amended (the “1940 Act”), as an open-end, diversified management investment company. The Fund’s investment objective is long-term capital appreciation.
Under the Fund’s organizational documents, its officers and Directors are indemnified against certain liabilities arising out of the performance of their duties to the Fund. In addition, in the normal course of business, the Fund enters into contracts with its vendors and others that provide for general indemnifications. The Fund’s maximum exposure under these arrangements is unknown as this would involve future claims that may be made against the Fund. However, based on experience, the Fund expects that risk of loss to be remote.
| 2. | SIGNIFICANT ACCOUNTING POLICIES |
The following is a summary of significant accounting policies followed by the Fund in preparation of its financial statements. These policies are in conformity with accounting principles generally accepted in the United States of America (“GAAP”). The Fund follows the specialized accounting and reporting requirements under GAAP that are applicable to investment companies.
Securities valuation – Securities listed on an exchange are valued at the last reported sale price at the close of the regular trading session of the primary exchange on the business day the value is being determined, or in the case of securities listed on NASDAQ at the NASDAQ Official Closing Price (“NOCP”). In the absence of a sale such securities shall be valued at the mean between the current bid and ask prices on the day of valuation. Short-term debt obligations having 60 days or less remaining until maturity, at time of purchase, may be valued at amortized cost.
The Fund may hold securities, such as private investments, other non-traded securities or temporarily illiquid securities, for which market quotations are not readily available or are determined to be unreliable. These securities will be valued using the “fair value” procedures approved by the Fund’s Board of Directors (the “Board”).
The Fund utilizes various methods to measure the fair value of all of its investments on a recurring basis. GAAP establishes a hierarchy that prioritizes inputs to valuation methods. The three levels of input are:
Level 1 – Unadjusted quoted prices in active markets for identical assets and liabilities that the Fund has the ability to access.
| BOYAR VALUE FUND, INC. |
| NOTES TO FINANCIAL STATEMENTS (Continued) |
| December 31, 2015 |
| |
Level 2 – Observable inputs other than quoted prices included in Level 1 that are observable for the asset or liability, either directly or indirectly. These inputs may include quoted prices for the identical instrument in an inactive market, prices for similar instruments, interest rates, prepayment speeds, credit risk, yield curves, default rates and similar data.
Level 3 – Unobservable inputs for the asset or liability, to the extent relevant observable inputs are not available, representing the Fund’s own assumptions about the assumptions a market participant would use in valuing the asset or liability, and based on the best information available.
The availability of observable inputs can vary from security to security and is affected by a wide variety of factors, including, for example, the type of security, whether the security is new and not yet established in the marketplace, the liquidity of markets, and other characteristics particular to the security. To the extent that valuation is based on models or inputs that are less observable or unobservable in the market, the determination of fair value requires more judgment. Accordingly, the degree of judgment exercised in determining fair value is greatest for instruments categorized in Level 3.
The inputs used to measure fair value may fall into different levels of the fair value hierarchy. In such cases, for disclosure purposes, the level in the fair value hierarchy within which the fair value measurement falls in its entirety, is determined based on the lowest level input that is significant to the fair value measurement in its entirety.
The inputs or methodology used for valuing securities are not necessarily an indication of the risk associated with investing in those securities. The following table summarizes the inputs used as of December 31, 2015 for the Fund’s investments measured at fair value:
| Assets* | | Level 1 | | | Level 2 | | | Level 3 | | | Total | |
| Common Stock | | $ | 20,005,849 | | | $ | — | | | $ | — | | | $ | 20,005,849 | |
| Short-Term Investments | | | 4,046,574 | | | | — | | | | — | | | | 4,046,574 | |
| Total | | $ | 24,052,423 | | | $ | — | | | $ | — | | | $ | 24,052,423 | |
The Fund did not hold any Level 3 securities during the year. There were no transfers into or out of Level 1 and Level 2 during the year. It is the Fund’s policy to recognize transfers between Level 1 and Level 2 at the end of the reporting period.
| * | Refer to the Portfolio of Investments for security classifications. |
Security Transactions and Related Income – Security transactions are accounted for on trade date. Interest income is recognized on an accrual basis. Discounts are accreted and premiums are amortized on securities purchased over the lives of the respective securities. Dividend income is
| BOYAR VALUE FUND, INC. |
| NOTES TO FINANCIAL STATEMENTS (Continued) |
| December 31, 2015 |
| |
recorded on the ex-dividend date. Realized gains or losses from sales of securities are determined by comparing the identified cost of the security lot sold with the net sales proceeds.
Dividends and Distributions to Shareholders – Dividends from net investment income, if any, are declared and paid annually. Distributable net realized capital gains, if any, are declared and distributed annually. Dividends and distributions paid and distributed to shareholders are recorded on ex-dividend date.
Dividends from net investment income and distributions from net realized gains are determined in accordance with Federal income tax regulations, which may differ from GAAP. These “book/tax” differences are considered either temporary (i.e., deferred losses, capital loss carry forwards) or permanent in nature. To the extent these differences are permanent in nature, such amounts are reclassified within the composition of net assets based on their Federal tax-basis treatment; temporary differences do not require reclassification.
Federal Income Taxes – The Fund intends to continue to comply with the requirements of the Internal Revenue Code applicable to regulated investment companies and to distribute all of its taxable income to its shareholders. Therefore, no provision for Federal income tax is required. The Fund will recognize the tax benefits of uncertain tax positions only where the position is “more likely than not” to be sustained assuming examination by tax authorities. Management has analyzed the Fund’s tax positions, and has concluded that no liability for unrecognized tax benefits should be recorded related to uncertain tax positions taken on returns filed for open tax years (2012 - 2014), or expected to be taken in the Fund’s 2015 tax returns. The Fund identifies its major tax jurisdictions as U.S. Federal, Maryland and foreign jurisdictions where the Fund makes significant investments. The Fund is not aware of any tax positions for which it is reasonably possible that the total amounts of unrecognized tax benefits will change materially in the next twelve months.
Use of Estimates – The preparation of financial statements in accordance with GAAP requires management to make estimates and assumptions that affect the reported amounts of assets and liabilities and disclosure of contingent assets and liabilities at the date of the financial statements and the reported amounts of income and expenses for the reporting period. Actual results could differ from those estimates.
| 3. | INVESTMENT TRANSACTIONS |
For the year ended December 31, 2015, cost of purchases and proceeds from sales of portfolio securities, other than short-term investments, amounted to $1,430,124 and $2,290,311, respectively.
| BOYAR VALUE FUND, INC. |
| NOTES TO FINANCIAL STATEMENTS (Continued) |
| December 31, 2015 |
| |
| 4. | TRANSACTIONS WITH RELATED PARTIES |
Ladenburg Thalmann Fund Management LLC serves as the Fund’s manager (the “Manager”). Boyar Asset Management, Inc. (the “Advisor”) provides continuous advisory services to the Fund and Ladenburg Thalmann & Co., Inc. (the “Distributor”) acts as distributor of the Fund’s shares.
Pursuant to a Management Agreement with the Fund, the Manager, under the supervision of the Board, oversees the daily operations of the Fund and supervises the performance of administrative and professional services provided by others, including the Advisor. As compensation for its services and the related expenses borne by the Manager, the Fund pays the Manager a management fee, computed and accrued daily and paid monthly, at an annual rate of 0.50% of the Fund’s average daily net assets.
Pursuant to an Investment Advisory Agreement among the Manager, the Advisor and the Fund, the Advisor agrees to furnish continuous investment advisory services to the Fund. For these services, the Fund pays the Advisor an investment advisory fee, which is computed and accrued daily and paid monthly, at an annual rate of 0.50% of the Fund’s average daily net assets.
Pursuant to a written contract, the Manager, the Advisor and the Distributor have agreed, until at least January 1, 2017, to waive a portion of their respective management fee, advisory fee and amounts, if any, payable to the Distributor pursuant to the Fund’s 12b-1 Plan (see below), and the Manager has agreed to reimburse the Fund for other expenses to the extent necessary so that the total expenses incurred by the Fund (excluding interest, taxes, brokerage commissions, other expenditures which are capitalized in accordance with GAAP, and other extraordinary expenses not incurred in the ordinary course of the Fund’s business) do not exceed 1.75% per annum of the Fund’s average daily net assets. During the term of this Agreement, to the extent that Operating Expenses incurred by the Fund in any fiscal year after waiver of advisory fees of the Advisor, management fees of the Manager and fees payable to the Distributor (“Rule 12b-1 fees”) exceed 1.75% per annum of the Fund’s average daily net assets, such excess amount shall be the liability of the Manager. For the year ended December 31, 2015, the Manager and the Advisor waived fees in the amount of $48,044 and $48,044, respectively.
To the extent Operating Expenses in any fiscal year do not exceed 1.75% per annum of the Fund’s average daily net assets, the management fee, advisory fee and Rule 12b-1 fees shall be payable by the Fund in the following order:
| o | first, the Distributor shall be entitled to receive the Rule 12b-1 fees up to the amount payable under the Fund’s 12b-1 Plan; and |
| o | thereafter, the Manager and the Advisor shall each be entitled to receive a proportionate amount of their respective management fee and advisory fee up to the amounts payable under the Management Agreement or the Advisory Agreement, as applicable. |
| BOYAR VALUE FUND, INC. |
| NOTES TO FINANCIAL STATEMENTS (Continued) |
| December 31, 2015 |
| |
If the Manager, the Advisor or the Distributor waives any fee or reimburses any expense pursuant to this Agreement, and the Fund’s Operating Expenses are subsequently less than 1.75% of average daily net assets, the Manager, the Advisor and the Distributor shall be entitled to reimbursement by the Fund for such waived fees or reimbursed expenses provided that such reimbursement does not cause the Fund’s expenses to exceed 1.75% of average daily net assets. If Fund Operating Expenses subsequently exceed 1.75% per annum of the Fund’s average daily net assets, the reimbursements shall be suspended. The Advisor, the Manager and the Distributor may each seek reimbursement only for expenses waived or paid by it during the two fiscal years prior to such reimbursement; provided, however, that such expenses may only be reimbursed hereunder to the extent they were waived or paid after the date of this Agreement (or any similar agreement). This Agreement may be continued from year to year thereafter provided each such continuance is specifically approved by the Fund, the Advisor, the Manager and the Distributor, including with respect to the Fund a majority of the non-interested Directors of the Fund; provided, however, that no party shall be obligated to extend the term of this Agreement. This Agreement shall terminate automatically with respect to the Fund and to the Advisor, the Manager or the Distributor upon the termination of the Advisory Agreement, the Management Agreement or the 12b-1 Plan, respectively.
As of December 31, 2015, the Manager, the Advisor, and the Distributor have the following amounts of waived/reimbursed expenses that may be recovered:
| Amount | | | Expiration Date |
| $ | 129,274 | | | December 31, 2016 |
| $ | 96,088 | | | December 31, 2017 |
| | | | | |
The Fund has adopted a Shareholder Servicing and Distribution Plan (the “Plan”) pursuant to Rule 12b-1 under the 1940 Act. The Plan provides that a monthly service fee is calculated by the Fund at an annual rate of 0.25% of its average daily net assets and is paid to the Distributor, to provide compensation for ongoing services and/or maintenance of the Fund’s shareholder accounts, not otherwise required to be provided by the Advisor. For the year ended December 31, 2015, the Distributor received $8,014 from front-end sales charges, of which $819 was retained by the principal underwriter or other affiliated broker-dealers.
Gemini Fund Services, LLC (“GFS”),
GFS, provides administration, fund accounting, and transfer agent services to the Fund. Pursuant to a separate servicing agreement with GFS, the Fund pays GFS customary fees for providing administration, fund accounting and transfer agency services to the Fund. Certain Directors and officers of the Fund are also officers of the Manager, Advisor or GFS, and are not paid any fees directly by the Fund for serving in such capacities.
| BOYAR VALUE FUND, INC. |
| NOTES TO FINANCIAL STATEMENTS (Continued) |
| December 31, 2015 |
| |
In addition, certain affiliates of GFS provide services to the Fund as follows:
Northern Lights Compliance Services, LLC (“NLCS”)
NLCS, an affiliate of GFS, provides a Chief Compliance Officer to the Fund, as well as related compliance services, pursuant to a consulting agreement between NLCS and the Fund. Under the terms of such agreement, NLCS receives customary fees from the Fund.
Blu Giant, LLC (“Blu Giant”)
Blu Giant, an affiliate of GFS, provides EDGAR conversion and filing services as well as print management services for the Fund on an ad-hoc basis. For the provision of these services, Blu Giant receives customary fees from the Fund.
Custody Administration
Pursuant to the terms of the Fund’s Custody Agreement with Bank of New York Mellon (the “Custody Agreement”), the Fund pays an asset-based custody fee in decreasing amounts as Fund assets reach certain breakpoints. The Fund also pays certain transaction fees and out-of-pocket expenses pursuant to the Custody Agreement. GFS receives a portion of these fees for performing certain custody administration services. GFS’s share of such fees collected for the year ended December 31, 2015 was $2,390. The Custodian fees listed in the Statement of Operations include the fees paid to GFS as Custody Administrator.
Directors
The Fund pays each Director an annual fee of $3,000 and $500 for each meeting attended. Expenses incurred in connection with attendance at board meetings may be reimbursed. No employee of the Manager, the Advisor or any of their respective affiliates will receive any compensation from the Fund for acting as either an officer or Director. None of the executive officers receive any compensation from the Fund.
The Fund may assess a short-term redemption fee of 2.00% of the total redemption amount if a shareholder sells their shares after holding them for less than 60 days. The redemption fee is paid directly to the Fund. For the year ended December 31, 2015, the Fund assessed $152 in redemption fees. This fee does not apply to shares acquired through reinvestment of dividends and other distributions. For certain purchases of $1 million or more the Fund may also assess a contingent deferred sales charge of 1.00% to redemptions made within twelve months of purchase. There were no such charges assessed for the year ended December 31, 2015.
| BOYAR VALUE FUND, INC. |
| NOTES TO FINANCIAL STATEMENTS (Continued) |
| December 31, 2015 |
| |
| 6. | DISTRIBUTIONS TO SHAREHOLDERS AND TAX COMPONENTS OF CAPITAL |
The tax character of Fund distributions for the following years was as follows:
| | | Fiscal Year Ended | | | Fiscal Year Ended | |
| | | December 31, 2015 | | | December 31, 2014 | |
| Ordinary Income | | $ | — | | | $ | 31,102 | |
| Long-Term Capital Gain | | | 653,008 | | | | 438,675 | |
| | | $ | 653,008 | | | $ | 469,777 | |
| | | | | | | | | |
As of December 31, 2015, the components of accumulated earnings/(deficit) on a tax basis were as follows:
| Undistributed | | | Undistributed | | | Capital Loss | | | Other | | | Post October Loss | | | Unrealized | | | Total | |
| Ordinary | | | Long-Term | | | Carry | | | Book/Tax | | | and | | | Appreciation/ | | | Accumulated | |
| Income | | | Gains | | | Forwards | | | Differences | | | Late Year Loss | | | (Depreciation) | | | Earnings/(Deficits) | |
| $ | — | | | $ | 4,737 | | | $ | — | | | $ | — | | | $ | — | | | $ | 8,878,719 | | | $ | 8,883,456 | |
| | | | | | | | | | | | | | | | | | | | | | | | | | | |
The difference between book basis and tax basis unrealized appreciation and accumulated net realized gain from security transactions is primarily attributable to the tax deferral of losses on wash sales.
Permanent book and tax differences, primarily attributable to the tax treatment of net operating losses, short-term capital gains and tax adjustments due to a corporate merger, resulted in reclassification for the year ended December 31, 2015 as follows:
| Paid | | | Accumulated | | | Accumulated | |
| In | | | Net Investment | | | Net Realized | |
| Capital | | | Income (Loss) | | | Gains (Loss) | |
| $ | (2,389 | ) | | $ | (46,595 | ) | | $ | 48,984 | |
| | | | | | | | | | | |
| 7. | NEW ACCOUNTING PRONOUNCEMENTS |
In May 2015, the FASB issued Accounting Standards Update (“ASU”) No. 2015-07 “Disclosures for Investments in Certain Entities That Calculate Net Asset Value per Share (or Its Equivalent).” Investment companies are permitted to measure the fair value of certain privately offered investments using the NAV per share of the investment. Measuring the fair value of an investment this way is called using the NAV practical expedient. Prior to the amendments in ASU No. 2015-07, investments valued using the NAV practical expedient were required to be categorized within the fair value hierarchy. The amendments in ASU No. 2015-07 remove the requirement to categorize within the fair value hierarchy
| BOYAR VALUE FUND, INC. |
| NOTES TO FINANCIAL STATEMENTS (Continued) |
| December 31, 2015 |
| |
investments measured using the NAV practical expedient. The ASU also removes certain disclosure requirements for investments that qualify, but do not utilize, the NAV practical expedient. The amendments in the ASU are effective for fiscal years beginning after December 15, 2015, and interim periods within those fiscal years. Early adoption is allowed. Management is currently evaluating the impact these changes will have on the Fund’s financial statements and related disclosures.
Subsequent events after the date of the Statement of Assets and Liabilities have been evaluated through the date the financial statements were issued. Management has concluded that there is no impact requiring adjustment or disclosure in the financial statements.

REPORT OF INDEPENDENT REGISTERED PUBLIC ACCOUNTING FIRM
To the Board of Directors and the Shareholders of
Boyar Value Fund, Inc.
We have audited the accompanying statement of assets and liabilities of Boyar Value Fund, Inc. (the “Fund”), including the portfolio of investments, as of December 31, 2015, and the related statement of operations for the year then ended, the statements of changes in net assets for each of the years in the two-year period then ended and the financial highlights for each of the years in the five-year period then ended. These financial statements and financial highlights are the responsibility of the Fund’s management. Our responsibility is to express an opinion on these financial statements and financial highlights based on our audits.
We conducted our audits in accordance with the standards of the Public Company Accounting Oversight Board (United States). Those standards require that we plan and perform the audits to obtain reasonable assurance about whether the financial statements and financial highlights are free of material misstatement. An audit includes examining, on a test basis, evidence supporting the amounts and disclosures in the financial statements. Our procedures included confirmation of securities owned as of December 31, 2015 by correspondence with the custodian. An audit also includes assessing the accounting principles used and significant estimates made by management, as well as evaluating the overall financial statement presentation. We believe that our audits provide a reasonable basis for our opinion.
In our opinion, the financial statements and financial highlights referred to above present fairly, in all material respects, the financial position of Boyar Value Fund, Inc. as of December 31, 2015, and the results of its operations for the year then ended, the changes in its net assets for each of the years in the two-year period then ended and its financial highlights for each of the years in the five-year period then ended, in conformity with accounting principles generally accepted in the United States of America.
| |  |
| | |
| | BBD, LLP |
| | |
| Philadelphia, Pennsylvania | |
| February 29, 2016 | |
| BOYAR VALUE FUND, INC. |
| EXPENSE EXAMPLES (Unaudited) |
| December 31, 2015 |
| |
As a shareholder of the Boyar Value Fund, you incur two types of costs: (1) transaction costs, including sales charges (loads) on purchases and redemption fees; (2) ongoing costs, including management fees and distribution fees; and other Fund expenses. This example is intended to help you understand your ongoing costs (in dollars) of investing in the Boyar Value Fund and to compare these costs with the ongoing costs of investing in other mutual funds.
The example is based on an investment of $1,000 invested at the beginning of the period and held for the entire period from July 1, 2015 through December 31, 2015.
Actual Expenses
The “Actual” expenses line in the table below provides information about actual account values and actual expenses. You may use the information below, together with the amount you invested, to estimate the expenses that you paid over the period. Simply divide your account value by $1,000 (for example, an $8,600 account value divided by $1,000 = 8.6), then multiply the result by the number in the table under the heading entitled “Expenses Paid During Period” to estimate the expenses you paid on your account during this period.
Hypothetical Example for Comparison Purposes
The “Hypothetical” line in the table below provides information about hypothetical account values and hypothetical expenses based on the Boyar Value Fund’s actual expense ratio and an assumed rate of return of 5% per year before expenses, which is not the Fund’s actual return. The hypothetical account values and expenses may not be used to estimate the actual ending account balances or expenses you paid for the period. You may use this information to compare this 5% hypothetical example with the 5% hypothetical examples that appear in the shareholder reports of other funds.
Please note that the expenses shown in the table are meant to highlight your ongoing costs only and do not reflect any transactional costs, such as sales charges (loads), or redemption fees. Therefore, the table is useful in comparing ongoing costs only, and will not help you determine the relative total costs of owning different funds. In addition, if these transactional costs were included, your costs would have been higher.
| | Beginning | Ending | Expenses Paid | Expense Ratio |
| | Account Value | Account Value | During Period* | During Period ** |
| | 7/1/15 | 12/31/15 | 7/1/15 – 12/31/15 | 7/1/15 – 12/31/15 |
| Actual | $1,000.00 | $ 984.30 | $8.75 | 1.75% |
| Hypothetical | | | | |
| (5% return before expenses) | $1,000.00 | $1,016.38 | $8.89 | 1.75% |
| * | Expenses are equal to the average account value times the Fund’s annualized expense ratio multiplied by the number of days in the most recent fiscal half-year [184] divided by the number of days in the fiscal year [365]. |
| BOYAR VALUE FUND, INC. |
| SUPPLEMENTAL INFORMATION (Unaudited) |
| December 31, 2015 |
| |
FACTORS CONSIDERED BY BOARD IN APPROVING THE CONTINUANCE OF THE MANAGEMENT AGREEMENT AND THE ADVISORY AGREEMENT
The Investment Company Act of 1940 (the “1940 Act”) requires the Board of Directors, including a majority of Directors who are not “interested persons” of The Boyar Value Fund, Inc. (the “Fund”), as that term is defined in the 1940 Act (the “Independent Directors”), to annually consider the continuance of the Fund’s investment advisory agreement with its investment adviser, Boyar Asset Management, Inc. (the “Adviser”) and management agreement with Ladenburg Thalmann Fund Management, LLC (the “Manager”; and such agreements, the “Agreements”).
At a Board meeting held on November 3, 2015, the Fund’s Board of Directors, including all of the Independent Directors, approved the continuation of the Agreements. As required by the 1940 Act, the Board requested and each of the Adviser and the Manager provided such information as the Board deemed to be reasonably necessary to evaluate the terms of the Agreements. The Independent Directors were informed that, in selecting the Adviser and the Manager and approving the continuance of the Agreements, they are authorized to engage such experts as they consider appropriate, including counsel to the Independent Directors.
The Independent Directors, both prior to the meeting and other meetings held during the current year, received materials relating to the Adviser’s investment services under the Investment Advisory Agreement. These materials included information on (i) the investment performance of the Fund over various periods of time compared to the performance of two peer groups of mutual funds, the first of which consisted of the Fund and other large-cap value funds and the second of which consisted of the Fund and other large-cap blend funds (the “Performance Universes”), as classified by Morningstar and objectively selected by the Fund’s administrator as comparable to the Fund, and to the Fund’s benchmark index; (ii) sales and redemption data with respect to the Fund; (iii) the general investment outlook in the markets in which the Fund invests; (iv) arrangements with respect to the distribution of the Fund’s shares; and (v) the overall nature, quality and extent of services provided by the Adviser and the Manager.
As part of the review of the continuance of the Investment Advisory Agreement and the Management Agreement, the Board requested, and the Adviser and Manager each provided, additional information in order to evaluate the quality of their services and the reasonableness of their fees under the Agreements. In a separate executive session, the Independent Directors reviewed information, which included data comparing: (i) the Fund’s advisory and management fees, 12b-1 fees, and other non-management fees, to those incurred by the Performance Universes; (ii) the Fund’s average expense ratio to those of its Performance Universes (both before and after waivers); (iii) the Fund’s investment performance over various time periods to the mean performance of the Performance Universes and the Fund’s benchmark index; (iv) the Adviser’s financial results and condition, including an oral discussion of the Adviser’s and the Manager’s and their respective affiliates’ profitability from the services that have been performed for the Fund; (v) the Adviser’s current investment management staffing; and (vi) the Fund’s potential for achieving economies of scale. In support of its review of the statistical information, the Board was provided with a description of the objective non-performance-based methodology used by the Administrator to determine the Performance Universes to prepare its information and the rationale for including both Performance Universes.
The Board considered several matters in connection with its renewal of the Agreements including investment performance; personnel and methods; fees and expenses; nature and quality of other services; other benefits; and economies of scale. However, the Board did not identify any single factor as all-important or controlling, and this summary does not detail all the matters that were considered. The Independent Directors also met in executive session to deliberate in their considerations of the Agreements.
| BOYAR VALUE FUND, INC. |
| SUPPLEMENTAL INFORMATION (Unaudited) (Continued) |
| December 31, 2015 |
| |
Investment Performance. First, the Board reviewed the Fund’s overall investment performance as compared to its Performance Universes and the Fund’s benchmark index. The Board noted that the Fund outperformed the mean performance of the Performance Universes over the one-, two-, three-, five-year and ten-year periods ended October 26, 2015. However, the Fund only sometimes outperformed while it sometimes underperformed its benchmark index during each of those same periods. The Board concluded that the Fund’s performance was satisfactory.
Personnel and Methods. The Board next reviewed the background of Mr. Boyar, the portfolio manager who has been responsible for the daily management of the Fund’s portfolio since the Fund’s inception, achieving the Fund’s investment objective and adhering to the Fund’s investment strategy. The Independent Directors also engaged in discussions with Mr. Boyar and considered the Adviser’s staff responsible for assisting Mr. Boyar in the overall functioning of the Adviser, and the Manager and members of its staff who are responsible for the overall functioning of the Manager. Based on the Independent Directors’ review, the Board concluded that the Fund’s management team and the Adviser’s overall resources and the Manager’s overall resources (in conjunction with those of its affiliates that it relies upon) were adequate and that the Adviser in particular had investment management capabilities and personnel essential to performing its duties under the Investment Advisory Agreement. The Board considered the favorable history, reputation, qualifications and background of the Adviser, as well as the qualifications of its personnel. The Board concluded that the personnel and methods were satisfactory.
Fees and Expenses. The Board then considered the Adviser’s and the Manager’s fees under the Agreements relative to the management fees charged by the Fund’s Performance Universes. The Board noted that the Fund had a higher overall combined management fee and advisory fee rate and a lower gross expense ratio (before giving effect to the fee waiver and expense reimbursement) and higher net expense ratio (after giving effect to the fee waiver and expense reimbursement) than the mean gross and net expense ratios of the funds in its Performance Universes. The Board also noted and viewed favorably that the Adviser typically charges its other clients an advisory fee at a rate higher than the Fund’s gross advisory fee rate and significantly higher than the net advisory fee rate that the Adviser receives from the Fund after giving effect to the fee waiver. The Board also viewed favorably that the Adviser, the Manager and the Fund’s distributor have since the Fund’s inception (or since the date on which they became service providers to the Fund in the case of the Manager and the distributor) voluntarily agreed to waive all or portion of their fees and to reimburse the Fund’s expenses in order to keep the Fund’s net total operating expenses (excluding extraordinary expenses and taxes) at 1.75% of the Fund’s average daily net assets. The Board noted that, after giving effect to the above described expense limitation, the Adviser and the Manager received a relatively small dollar amount of advisory and management fees from the Fund for the 2014 calendar year. Based on these factors, the Board determined that the Fund’s advisory and management fee rates under the Agreements do not constitute fees that are so disproportionately large as to bear no reasonable relationship to the services rendered and that could not have been the product of arm’s-length bargaining, and concluded that the advisory and management fee rates under the Agreements are fair and reasonable.
Nature and Quality of Other Services; Profitability. The Board next considered the nature, quality, cost and extent of other services provided by the Adviser and the Manager. At meetings held throughout the year, the Board reviewed the effectiveness of the Adviser’s and the Fund’s overall compliance programs and also received reports regarding the effectiveness of the Manager’s compliance program. Based on this review, the Board concluded that the nature, quality, cost and extent of such other services provided by the Adviser and the Manager were satisfactory, reliable and beneficial to the Fund’s shareholders. The Board was informed by the Adviser and the Manager that given the amount of fees received from the Fund and the current fee waivers and periodic reimbursements being made in order to keep the Fund’s expense ratio at 1.75%, neither the Adviser nor the Manager believed they made a profit under the Agreements in the prior year.
ActiveUS 122724775v.4
| BOYAR VALUE FUND, INC. |
| SUPPLEMENTAL INFORMATION (Unaudited) (Continued) |
| December 31, 2015 |
| |
Other Benefits. The Board also considered the character and amount of other direct and incidental benefits received by the Adviser, the Manager and their respective affiliates from their association with the Fund. The Board concluded that potential “fall-out” benefits that they may receive, such as greater name recognition, appear to be reasonable, and may in some cases benefit the Fund.
Economies of Scale. The Board noted that, given the current and anticipated size of the Fund, any perceived and potential economies of scale were not yet a relevant consideration for the Fund and the addition of break points was determined not to be necessary at this time.
Fees and Services Provided for Other Comparable Funds/Accounts Managed by the Adviser and its Affiliates. In addition to comparing the Fund’s combined advisory and management fee rate to unaffiliated mutual funds included in the Fund’s Performance Universes, the Board was informed by the Adviser that it does not manage any other registered investment companies, although it does manage an unregistered investment company that has a different fee structure that includes a performance allocation. As noted above, the Adviser also manages separate accounts that on average have a higher investment advisory fee rate than the contractual advisory fee rate with the Fund. The Board was informed that the Manager does not manage any other accounts.
Conclusion. Based on the Board’s deliberations and its evaluation of the information described above, the Board, including the Independent Directors who attended the meeting in person, concluded that: (a) it was appropriate to continue to retain the Adviser and the Manager; (b) the terms of the Investment Advisory Agreement and the Management Agreement (including the fees thereunder) are fair and reasonable; and (c) the Fund’s Investment Advisory Agreement and Management Agreement each should continue for a one-year period.
ActiveUS 122724775v.4
| BOYAR VALUE FUND, INC. |
| SUPPLEMENTAL INFORMATION (Unaudited) |
| December 31, 2015 |
| |
DIRECTORS AND OFFICERS
The names, ages, addresses, present position(s) with the Fund, term of office and length of time served, principal occupation(s) during the past five years and other directorships held outside the Fund complex of the Fund’s Directors and officers are set forth in the table below. The Board of Directors is responsible for managing the business affairs of the Fund.
Name, Contact
Address and Age | Position
Held with
the Fund | Term of
Office
and
Length of
Time Served (1) | Principal Occupations
During the Last 5 Years | Number of
Portfolios
in Fund
Complex
Overseen
by Director | Other
Directorships
Held Outside the
Fund Complex |
| INTERESTED DIRECTOR |
Mark A. Boyar (2) 6 East 32nd Street New York, NY 10010 Age: 73 | Chairman | Since Inception | President Boyar Asset Management, Inc., June 1983 - present; President, Mark Boyar & Co., Inc., January 1979 –present; Partner, Boyar G.P. Holdings Ltd., May 1990 – present; Manager Ebbets Field Association LLC, April 1998 – present; | 1 | Chairman, Boyar G.P. Holdings Ltd., May 1990 - present; Chairman, N.R.M.B. Management, Inc., February 1988 - present |
| DISINTERESTED DIRECTORS |
Jay R. Petschek c/o Corsair Capital Management, LLC 366 Madison Avenue, 12th Floor
New York, NY 10017 Age: 57 | Director | Since Inception | Managing Member, Corsair Capital Management, LLC, June 2002 – present. | 1 | Chairman, Recognition Media, LLC, December 2003 – present; Director, Dab- O - Matic Corp, April 2000 – present. |
Henry A. Alpert 3333 New Hyde Park Road, Suite 201 New Hyde Park, NY 11042 Age: 68 | Director | Since Inception | President, Spartan Petroleum Corp., 1974 – present. | 1 | Director, Griffon Corp., February 1995 – present; Trustee, Incorporated Village of Old Westbury, June 1994 – July 2009 |
| BOYAR VALUE FUND, INC. |
| SUPPLEMENTAL INFORMATION (Unaudited) (Continued) |
| December 31, 2015 |
Name, Contact
Address and Age | Position
Held with
the Fund | Term of
Office
and
Length of
Time Served (1) | Principal Occupations
During the Last 5 Years | Number of
Portfolios
in Fund
Complex
Overseen
by Director | Other
Directorships
Held Outside the
Fund Complex |
Richard Finkelstein 500 NE Spanish River Blvd., Suite 108 Boca Raton, FL 33431 Age: 67 | Director | Since Inception | President, Kenco Communities, 1990 – 2012; Principal, Merit Builders, Inc. 2012-Present. | 1 | None |
| OFFICERS | | | | | |
Andrew B. Rogers 80 Arkay Drive Suite 110 Hauppauge, NY 11788 Age: 46 | President | June 2006 – present | Chief Executive Officer, Gemini Fund Services, LLC (since 2012); President and Manager, Gemini Fund Services, LLC (2006 – 2012); President, GemCom, LLC (2004-2011). | N/A | N/A |
Dawn Borelli 80 Arkay Drive, Suite 110 Hauppauge, NY 11788 Age: 43 | Treasurer | February 2011 – present | Assistant Vice President, Fund Administration, Gemini Fund Services, LLC (since 2010), Assistant Vice President, Global Fund Administration, Legg Mason & Co. LLC (2003 – 2010). | N/A | N/A |
Stephanie Shearer 80 Arkay Drive, Suite 110, Hauppauge, NY 11788 Age: 37 | Secretary | 2012 – present | Senior Paralegal, Gemini Fund Services, LLC (since 2013); Paralegal, Gemini Fund Services, LLC (2010-2013); Junior Paralegal, Gemini Fund Services, LLC (2008-2010); Legal Assistant, Gemini Fund Services, LLC (2007-2008). | N/A | N/A |
| BOYAR VALUE FUND, INC. |
| SUPPLEMENTAL INFORMATION (Unaudited) (Continued) |
| December 31, 2015 |
Name, Contact
Address and Age | Position
Held with
the Fund | Term of
Office
and
Length of
Time Served (1) | Principal Occupations
During the Last 5 Years | Number of
Portfolios
in Fund
Complex
Overseen
by Director | Other
Directorships
Held Outside the
Fund Complex |
Michael J. Wagner
80 Arkay Drive, Suite 110
Hauppauge, NY 11788
Age: 65 | Chief Compliance Officer | August 2014 - Present | President (2006 – Present) and Senior Vice President (2004 - 2006), Northern Lights Compliance Services, LLC (provides CCO services to mutual funds); Vice President, GemCom, LLC (2004 – Present) (provides EDGAR services to mutual funds); President (2004 – 2006) and Chief Operating Officer (2003 – 2006). | N/A | N/A |
| (1) | Each Director is elected to serve in accordance with the Articles of Incorporation and By-Laws of the Fund until his or her successor is duly elected and qualified. |
| (2) | Mr. Boyar is an “interested person” of the Fund as defined in the 1940 Act, because of his relationship with Boyar Asset Management, Inc. |
The Fund’s Statement of Additional Information includes additional information about the Directors and is available free of charge, upon request, by calling toll-free at 1-800-266-5566.
| PRIVACY notice |
| |
| Rev. June 2011 |
| |
| FACTS | WHAT DOES BOYAR VALUE FUND, INC. DO WITH YOUR PERSONAL INFORMATION? |
| | |
| Why? | Financial companies choose how they share your personal information. Federal law gives consumers the right to limit some but not all sharing. Federal law also requires us to tell you how we collect, share, and protect your personal information. Please read this notice carefully to understand what we do. |
| | |
| What? | The types of personal information we collect and share depend on the product or service you have with us. This information can include: ■ Social Security number ■ Purchase History ■ Assets ■ Account Balances ■ Retirement Assets ■ Account Transactions ■ Transaction History ■ Wire Transfer Instructions ■ Checking Account Information When you are no longer our customer, we continue to share your information as described in this notice. |
| | |
| How? | All financial companies need to share customers’ personal information to run their everyday business. In the section below, we list the reasons financial companies can share their customers’ personal information; the reasons Boyar Value Fund, Inc. chooses to share; and whether you can limit this sharing. |
| | | |
| Reasons we can share your personal information | Does Boyar
Value Fund, Inc,
share? | Can you limit this sharing? |
For our everyday business purposes – such as to process your transactions, maintain your account(s), respond to court orders and legal investigations, or report to credit bureaus | Yes | No |
For our marketing purposes – to offer our products and services to you | No | We don’t share |
| For joint marketing with other financial companies | No | We don’t share |
For our affiliates’ everyday business purposes – information about your transactions and experiences | No | We don’t share |
For our affiliates’ everyday business purposes – information about your creditworthiness | No | We don’t share |
| For nonaffiliates to market to you | No | We don’t share |
| Questions? | Call 1-402-493-4603 |
Rev. June 2011
| Who we are |
| Who is providing this notice? | Boyar Value Fund, Inc. |
| What we do |
| How does Boyar Value Fund, Inc. protect my personal information? | To protect your personal information from unauthorized access and use, we use security measures that comply with federal law. These measures include computer safeguards and secured files and buildings. Our service providers are held accountable for adhering to strict policies and procedures to prevent any misuse of your nonpublic personal information. |
| How does Boyar Value Fund, Inc. collect my personal information? | We collect your personal information, for example, when you ■ Open an account ■ Provide account information ■ Give us your contact information ■ Make deposits or withdrawals from your account ■ Make a wire transfer ■ Tell us where to send the money ■ Tells us who receives the money ■ Show your government-issued ID ■ Show your driver’s license We also collect your personal information from other companies. |
| Why can’t I limit all sharing? | Federal law gives you the right to limit only ■ Sharing for affiliates’ everyday business purposes – information about your creditworthiness ■ Affiliates from using your information to market to you ■ Sharing for nonaffiliates to market to you State laws and individual companies may give you additional rights to limit sharing. |
| Definitions |
| Affiliates | Companies related by common ownership or control. They can be financial and nonfinancial companies. ■ Boyar Value Fund, Inc. does not share with our affiliates. |
| Nonaffiliates | Companies not related by common ownership or control. They can be financial and nonfinancial companies
■ Boyar Value Fund, Inc. does not share with nonaffiliates so they can market to you. |
| Joint marketing | A formal agreement between nonaffiliated financial companies that together market financial products or services to you.
■ Boyar Value Fund, Inc. does not jointly market. |
PROXY VOTING POLICY
Information regarding how the Fund voted proxies relating to portfolio securities for the most recent twelve month period ended June 30 as well as a description of the policies and procedures that the Fund uses to determine how to vote proxies is available without charge, upon request, by calling 1-800-266-5566 or by referring to the Securities and Exchange Commission���s (“SEC”) website at http://www.sec.gov.
PORTFOLIO HOLDINGS
The Fund files its complete schedule of portfolio holdings with the SEC for the first and third quarters of each fiscal year on Form N-Q. Form N-Q is available on the SEC’s website at http://www.sec.gov and may be reviewed and copied at the SEC’s Public Reference Room in Washington, DC (1-800-SEC-0330). The information on Form N-Q is available without charge, upon request, by calling 1-800-266-5566.
| |
| |
| FUND MANAGER |
| Ladenburg Thalmann Fund Management, LLC |
| 520 Madison Avenue, 9th Floor |
| New York, New York 10022 |
| |
| INVESTMENT ADVISOR |
| Boyar Asset Management, Inc. |
| 6 East 32nd Street, 7th Floor |
| New York, New York 10016 |
| |
| ADMINISTRATOR |
| Gemini Fund Services, LLC |
| 80 Arkay Drive, Suite 110 |
| Hauppauge, New York 11788 |
Item 2. Code of Ethics.
(a) As of the end of the period covered by this report, the registrant has adopted a code of ethics that applies to the registrant's principal executive officer, principal financial officer, principal accounting officer or controller, or persons performing similar functions, regardless of whether these individuals are employed by the registrant or a third party.
(b) For purposes of this item, “code of ethics” means written standards that are reasonably designed to deter wrongdoing and to promote:
| (1) | Honest and ethical conduct, including the ethical handling of actual or apparent conflicts of interest between personal and professional relationships; |
| (2) | Full, fair, accurate, timely, and understandable disclosure in reports and documents that a registrant files with, or submits to, the Commission and in other public communications made by the registrant; |
| (3) | Compliance with applicable governmental laws, rules, and regulations; |
| (4) | The prompt internal reporting of violations of the code to an appropriate person or persons identified in the code; and |
| (5) | Accountability for adherence to the code. |
(c) Amendments: During the period covered by the report, there have not been any amendments to the provisions of the code of ethics.
(d) Waivers: During the period covered by the report, the registrant has not granted any express or implicit waivers from the provisions of the code of ethics.
(e) The Code of Ethics is not posted on Registrant’ website.
(f) A copy of the Code of Ethics is attached as an exhibit.
Item 3. Audit Committee Financial Expert.
(a)(1)ii The board of directors of the fund has determined that the fund does not have an audit committee financial expert serving on its audit committee.
(a)(2) Not applicable.
(a)(3) In this regard, no member of the audit committee was identified as having all of the required technical attributes identified in instruction 2 (b) to item 3 of Form N-CSR to qualify as an “audit committee financial expert,” whether through the type of specialized education or experience required by that instruction. At this time, the board believes the experience provided by each member of the audit committee collectively offers the fund adequate oversight by its audit committee given the fund’s level of financial complexity. The board will from time to time reexamine such belief.
Item 4. Principal Accountant Fees and Services.
2014 - $14,750
2012 - $14,750
2014 - None
2012 - None
2015 - $2,000
2014 - $2,000
2013 – $2,000
2012 – $2,000
Preparation of Federal & State income tax returns, assistance with calculation of required income, capital gain and excise distributions and preparation of Federal excise tax returns.
2015 - None
2014 - None
2013 - None
2012 - None
(e) (1) Audit Committee’s Pre-Approval Policies
| | The registrant’s Audit Committee is required to pre-approve all audit services and, when appropriate, any non-audit services (including audit-related, tax and all other services) to the registrant. The registrant’s Audit Committee also is required to pre-approve, when appropriate, any non-audit services (including audit-related, tax and all other services) to its adviser, or any entity controlling, controlled by or under common control with the adviser that provides ongoing services to the registrant, to the extent that the services may be determined to have an impact on the operations or financial reporting of the registrant. Services are reviewed on an engagement by engagement basis by the Audit Committee. |
| (2) | Percentages of Services Approved by the Audit Committee |
| | 2013 | 2012 | 2014 | 2015 |
| Audit-Related Fees: | 0.00% | 0.00% | 0.00% | 0.00% |
| Tax Fees: | 0.00% | 0.00% | 0.00% | 0.00% |
| All Other Fees: | 0.00% | 0.00% | 0.00% | 0.00% |
| (f) | During the audit of registrant's financial statements for the most recent fiscal year, less than 50 percent of the hours expended on the principal accountant's engagement were attributed to work performed by persons other than the principal accountant's full-time, permanent employees. |
| (g) | The aggregate non-audit fees billed by the registrant's accountant for services rendered to the registrant, and rendered to the registrant's investment adviser (not including any sub-adviser whose role is primarily portfolio management and is subcontracted with or overseen by another investment adviser), and any entity controlling, controlled by, or under common control with the adviser that provides ongoing services to the registrant: |
2015 - None
2014 - None
2013 - None
2012 - None
(h) The registrant's audit committee has considered whether the provision of non-audit services to the registrant's investment adviser (not including any sub-adviser whose role is primarily portfolio management and is subcontracted with or overseen by another investment adviser), and any entity controlling, controlled by, or under common control with the investment adviser that provides ongoing services to the registrant, that were not pre-approved pursuant to paragraph (c)(7)(ii) of Rule 2-01 of Regulation S-X, is compatible with maintaining the principal accountant's independence.
Item 5. Audit Committee of Listed Companies. Not applicable to open-end investment companies.
Item 6. Schedule of Investments. See Item 1.
Item 7. Disclosure of Proxy Voting Policies and Procedures for Closed-End Funds. Not applicable to open-end investment companies.
Item 8. Portfolio Managers of Closed Management Investment Companies. Not applicable to open-end investment companies.
Item 9. Purchases of Equity Securities by Closed-End Management Investment Company and Affiliated Purchasers. Not applicable to open-end investment companies.
Item 10. Submission of Matters to a Vote of Security Holder. None.
Item 11. Controls and Procedures.
(a) Based on an evaluation of the registrant’s disclosure controls and procedures as of December 31, 2009, the disclosure controls and procedures are reasonably designed to ensure that the information required in filings on Forms N-CSR is recorded, processed, summarized, and reported on a timely basis.
(b) There were no significant changes in the registrant’s internal control over financial reporting that occurred during the registrant’s second fiscal quarter of the period covered by this Form N-CSR that have materially affected, or are reasonably likely to materially affect, the registrant’s internal control over financial reporting.
Item 12. Exhibits.
(a)(1) Code of Ethics filed herewith.
(a)(2) Certification(s) required by Section 302 of the Sarbanes-Oxley Act of 2002 (and Item 11(a)(2) of Form N-CSR) are filed herewith.
(a)(3) Not applicable.
(b) Certification(s) required by Section 906 of the Sarbanes-Oxley Act of 2002 (and Item 11(b) of Form N-CSR) are filed herewith.
SIGNATURES
Pursuant to the requirements of the Securities Exchange Act of 1934 and the Investment Company Act of 1940, the registrant has duly caused this report to be signed on its behalf by the undersigned, thereunto duly authorized.
(Registrant) The Boyar Value Fund, Inc.
By (Signature and Title)
* /s/ Sam Singh
Sam Singh, Principal Executive Officer/President
Date 3/1/16
Pursuant to the requirements of the Securities Exchange Act of 1934 and the Investment Company Act of 1940, this report has been signed below by the following persons on behalf of the registrant and in the capacities and on the dates indicated.
By (Signature and Title)
* /s/ Dawn Borelli
Dawn Borelli, Principal Financial Officer/Treasurer
Date 3/1/16
By (Signature and Title)
* /s/ Sam Singh
Sam Singh, Principal Executive Officer/President
Date 3/1/16
* Print the name and title of each signing officer under his or her signature.