united states
securities and exchange commission
washington, d.c. 20549
form n-csr
certified shareholder report of registered management
investment companies
Investment Company Act file number 811-08253
The Boyar Value Fund, Inc.
(Exact name of registrant as specified in charter)
35 East 21st Street, New York, NY 10010
(Address of principal executive offices) (Zip code)
Mike Wagner, Gemini Fund Services, LLC
80 Arkay Drive Suite 110, Hauppauge, NY 11788
(Name and address of agent for service)
Registrant's telephone number, including area code: 212 995-8300
Date of fiscal year end: 12/31
Date of reporting period: 6/30/18
Item 1. Reports to Stockholders.
 | Our favorite holding period is forever.
-- Warren Buffett |
Dear Boyar Value Fund Shareholder:
A Look Back
Stocks were all over the map during the first half of 2018, with January a precursor of the stock market volatility we have experienced since then. You may recall that the Dow Jones Industrial Average reached an all-time high on January 26, but only one week later, the index had fallen ~4%. The S&P 500, despite having ended the 2nd quarter with a 2.65% gain had at one point, declined by ~10% from its 2018 high. From a historical perspective, this intra-year drop is not unusual: according to JP Morgan Asset Management, the average intra-year decline for the S&P 500 since 1980 has been 13.8%.
The market’s volatility was caused by many factors, including the potential for a trade war, which many pundits predict would negatively impact the economy. There is some evidence of such an impact already, as a number of CEOs report tempering capital expenditures until they can determine the magnitude of the situation. Uncertainty about the future direction of interest rates also played havoc with the stock market. The 10-year Treasury started the 2nd quarter yielding ~2.75% and was yielding ~3.12% by mid-May. However, approximately two weeks later, it was back to 2.76%, and it ended the quarter at 2.85%.
A rising interest-rate environment negatively impacts the multiple that investors will pay for stocks. Investors (all else being equal) will pay a lower multiple when the 10-year Treasury yields 3% than when it yields 1%.The S&P 500 currently sells for about 16.5x forward earnings (the multiple) versus a year ago, when it sold for 23.8x. With S&P profits expected to increase by about 20% in 2018, an argument can be made that the stock market is reasonably valued. However, now that the multiple has contracted from ~23x to ~16.5x, we see an outside chance of a multiple expansion over the short term (barring an all-out trade war).
While people may be nervous about investing in the stock market in a rising interest-rate environment, it is worth noting that according to JP Morgan Asset Management, since 1983, when the yield of the 10-year Treasury was below 5% (it is currently ~2.94%), increasing interest rates have historically been associated with rising stock prices. So, if history is any guide, we have a long way to go in terms of rate hikes before stock market performance is negatively impacted.
Mega cap technology stocks are still doing the heavy lifting when it comes to generating stock market returns (as measured by the S&P 500). David Kostin, chief U.S. equity strategist at Goldman Sachs, estimates that more than 100% of the S&P 500’s total return of 2.65% in the first half of 2018 is attributable to just 10 equities. Amazon alone was responsible for roughly 36% of the benchmark gauge’s advance. Amazon, Microsoft, Apple, and Netflix in the aggregate accounted for 84% of the index’s gain.
The narrowness of stock market leadership, however, has us concerned. History has shown that for a stock market advance to continue, the leadership cannot be limited to a small number of companies. Furthermore, the current leaders are among the most expensive when measured by their P/E ratio. Amazon, for example, sells for a whopping 109x forward earnings, and Netflix sells for 99x next year’s earnings.
Equally concerning, according to John Authers’s July 18th article in the Financial Times (citing Bianco research), if Microsoft were added to the FAANG grouping of stocks and these companies were their own sector, these six companies would comprise 17% of the S&P 500 in terms of market capitalization and would be the largest sector in the S&P 500. In the same article, (citing research by Michael Batnick), Authers reported that the market capitalization of the five biggest companies in the S&P 500 currently equals the market cap of the smallest 282 S&P 500 companies.
32 West 39th Street • 9th Floor • New York, NY 10018 • P. 212.995.8300 • F. 212.995.5636
www.BoyarValueGroup.com
Everyone seems to be jumping on the high-flying technology stock bandwagon. According to Jeff Cox of CNBC.com, fund managers who responded to the July Bank of America/Merrill Lynch fund managers survey (which polls 231 professional money managers who manage a total of $663 billion in assets to find out what they are buying/selling as well as their views on the market) identified the FAANG+BAT trade (this refers to a basket of popular technology stocks, including Facebook, Apple, Amazon, Alphabet, Netflix, Baidu, Alibaba, and Tencent) as the most popular trade for the sixth consecutive month. This bet has paid off handsomely, as the FAANG stocks alone have advanced by over 40% through mid-July. However, we doubt that the managers placing these trades are patient long-term investors (and we suspect that many, not wanting to underperform their benchmark, are buying these stocks simply because they are the stocks increasing in price) and anticipate that they will sell their shares at the first sign of trouble. We saw a sneak peak of what could occur on July 16th, when Netflix reported disappointing earnings and its stock dropped 14% in after-hours trading (the stock has since recovered a small portion of its loses). In addition, on July 25 Facebook provided disappointing sales and profitability forecasts and the stock plunged more than 20% in after-hours trading. Whether these were one-off events or a preview of more trouble is impossible to say for certain, but our best guess is that at some point, investors in many of these high-flyers will lose a great deal of money.
Performance
The last day of the second quarter was indicative of the first six months of 2018. Stocks ended the quarter on a sour note as the major indexes went south in the last few minutes of trading. The Dow had traded 293 points higher earlier in the day, but the mood suddenly reversed course after selling pressure picked up, leaving the DJIA in the green by about 44 points.
A $3.4 billion sell order that was entered toward the end of the day typified the mood that prevailed for the first half of the year. There were many days where the market experienced substantial gains up until the last half hour of trading, only to see those profits diminish sharply—or evaporate entirely.
The Boyar Value Fund was up 0.53% for the 2nd quarter and down 0.57% for the year versus a 3.43% gain for the S&P 500 for the quarter and a 2.65% gain for the year. This underperformance was a result of our cash position as well as our complete lack of exposure to FAANG stocks.
Some Thoughts about the Market
During the short term, the U.S. stock market could experience some turbulence. Midterm congressional elections are just around the corner. Historically (with rare exceptions), stocks have corrected prior to the event, only to rally once Election Day has passed.
We have seen a significant spike in the price of oil over the past six months. So far, consumers have ignored it and continued to spend. The recently enacted tax cuts have more than offset the price increase. However, if oil prices continue to increase, this could certainly prove to be a headwind.
Although interest rates have increased materially over the past year, they remain quite low from a historical perspective. If the Federal Reserve becomes more aggressive, this could cool the economy. However, with the 10-year Treasury under 3%, for the moment, we believe that this outcome does not present a problem.
Earlier in this letter, we commented that the market leadership has narrowed, noting that four stocks contributed, in aggregate, ~85% of the gain in the S&P 500 for the first half of 2018. All of these companies are technology stocks, a sector that represents over 25% of the index. Furthermore, these businesses have valuations that are among the highest of all listed U.S. stocks. (Currently the average trailing P/E ratio for technology companies within the S&P 500 is ~27x earnings.)
Conversely, money center banks such as JP Morgan, Bank America, Citigroup, and Wells Fargo were among the poorest performers during the first half the year, and yet in our opinion, they are among the cheapest publicly traded companies, utilizing any acceptable valuation technique. They are also currently very much out of favor. According to the previously mentioned Bank of America/Merrill Lynch survey, manager allocation to bank stocks has dropped by 33% over the prior two months.
In addition, these banks are overcapitalized and will continue to return significant amounts of money to shareholders. Just recently, JP Morgan increased its quarterly dividend to $0.80 cents per share, up from $0.56.The current yield is over 3%. It also announced it would buy back up to $20.7 billion in stock. Bank of America raised its annual dividend by 25% to $0.60 per share and announced that it will repurchase $20.6 billion of its common shares. The bear case for these stocks is a flattening yield curve that would negatively impact earnings. However, at their current valuations, we believe that much of this is already priced into these stocks.
Could the Passive Equity Investing Rally Be Breaking?
In the U.S., passive investing has gone from ~10% of all equity assets to ~40% since the late 1990s. But could that trend be reversing? And what would that mean for U.S. equities? According to Morningstar, the first half of 2018 saw a 44% reduction in inflows into U.S. passive investment vehicles from the prior year. Of particular interest, BlackRock (the world’s largest money manager and a major provider of passive investing products) saw institutional investors withdraw $21 billion from passive stock funds but experienced $7 billion of inflows into passive bond funds. This trend was not limited to professional investors, as retail investors withdrew $1.6 billion from BlackRock’s passive stock funds and increased their exposure to passive bond funds by $6 billion. This reaction could be a sign that investors are getting nervous and embracing the perceived safety of bonds. If this trend away from passive equity investing continues, it could create significant selling pressure on “popular” stocks that are components of major indexes and ETFs.
Is This 1999/2000 Revisited?
While the stock market, as measured by the S&P 500, is nowhere near as expensive as it was in 2000 (as of the end of June, it sold for 16x forward earnings, compared to 27x for March 2000), we are beginning to see some interesting similarities between the two periods. In 1999, superstar value investor Julian Robertson’s fund lost 19% as technology shares reached absurd levels. Not surprisingly, his investors fled and withdrew $7.7 billion, according to Tae Kim of CNBC.com. After losing almost 15% in the first two months of 2000, Robertson closed his fund, right before the technology-heavy NASDAQ lost 46% of its value from April through the end of the year. Perhaps David Einhorn, once a high-flying value investor, is this generation’s Julian Robertson. Einhorn, after having amassed one of the best records in the investment business, has been struggling. His fund declined by 19% for the first half of 2018, compared to a 2.65% gain for the S&P 500. This decrease follows a rough 2017, when his fund gained a mere 1.6% compared to a 19% gain for the S&P 500. While we admittedly may be grasping at straws looking for signals of value investing’s reemergence after a prolonged period of hibernation (as far as we know, Einhorn has no plans to close his fund), it is worth noting that almost immediately after Robertson threw in the towel, value investing staged an incredible comeback and richly rewarded those who had been willing to endure the pain of being a value investor in a market that rewarded only growth investments.
Longtime market strategist Jim Paulsen of The Leuthold Group has pointed out another similarity between the current investing climate and 1999/2000. In an interview on CNBC, he noted that for the past five years, excluding technology shares, the rest of the S&P 500 has consistently underperformed the rest of the market—almost exactly as long as the last period (1995-2000) when technology shares led the market to stratospheric heights. He went on to say that the current “character and attitude of the marketplace” are similar to the belief that “tech can’t lose.” Paulsen continued, “I just wonder if it might end similarly .. . . not to the same magnitude, but similarly.”
Some Value Investors Are Changing Their Stripes (But We Won’t)
It has been a lonely time for value investors. The Russell 1000 value index has underperformed its growth counterpart for 10 of the past 11 years, according to Michael Wursthorn’s June 4 article in the Wall Street Journal. This result has naturally led some pundits to declare value investing dead, arguing that value investing principles are not suited for this new technology-driven age (almost identical pronouncements were made in 1999/2000). This view has led some value investors to embrace the stocks of high-multiple-growth companies, like Amazon or Netflix—with even Warren Buffett owning Apple shares. We give Mr. Buffett a pass, however: with a cash hoard of over $100 billion to deploy, his investible universe is much smaller than that of most investors, and Apple arguably does have some traditional value characteristics. While it has been painful for us to watch high-flying growth stocks like Amazon gain 56% this year, we have no plans to change the investment style that has served us so well
for so long. At some point (hopefully sooner rather than later), value investing will come back into vogue, and many of the value investors who abandoned their style to keep up with a benchmark will regret their decision.
Should you have any questions, we are always available.
************************************
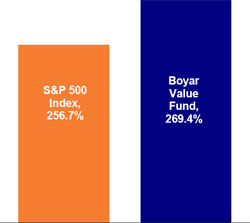
Competitive Returns (Unaudited)
As you can see from the chart below, our buy and hold philosophy has enabled the Fund to produce after tax returns that pretty much mirror our pre-tax returns. The returns used in the illustration exclude loads, but are inclusive of all fees, and assumes the highest rates when calculating after tax returns.
| Average Annual Returns |
| (Through 6/30/18) |
| |
| | | 1 Year | | 3 Year | | 5 Year | | 10 Year | | Since
Inception* |
| At NAV | | 7.77% | | 6.55% | | 9.20% | | 9.15% | | 6.70% |
| | | | | | | | | | | |
| Inclusive of sales charges | | 2.38% | | 4.75% | | 8.08% | | 8.59% | | 6.43% |
| | | | | | | | | | | |
| After taxes on distribution | | 1.98% | | 4.24% | | 7.62% | | 8.29% | | 6.04% |
| | | | | | | | | | | |
| After taxes on distribution and the sale of shares | | 1.70% | | 3.61% | | 6.31% | | 6.99% | | 5.31% |
| | | | | | | | | | | |
| S&P 500 Index *(5/5/98) | | 14.37% | | 11.93% | | 13.42% | | 10.17% | | 6.51% |
Cumulative Returns Since Inception
At NAV (5/5/98 through 6/30/18)
The Boyar Value Fund has a maximum sales charge of 5.00%. After-tax returns are calculated using the highest historical individual Federal income tax rate and do not reflect the additional impact of state and local taxes. Actual after-tax returns depend on a shareholder’s tax situation and may differ from those shown. After-tax returns are not relevant for shareholders who hold Fund shares in tax-deferred accounts or for shares held by non-taxable entities. The Fund may invest in stocks of several different capitalization levels and it is important to note that historically, small- and mid-cap stocks have experienced greater volatility than stocks of larger, more established companies. Additionally, value-based investments are subject to the risk that the broad market may not recognize their intrinsic value. As portfolio and market conditions change future distributions and yields will vary, dividends are not guaranteed. Distribution amount may include net investment income, capital gains and or return of capital. Distribution amount is not indicative of Fund performance. Individual performance results will vary and may include the reinvestment of income/dividends and capital gains distributions. Performance figures for periods greater than one year are annualized.
The S&P 500 Total Return Index (“S&P 500 TR”) is an unmanaged capitalization weighted index of 500 stocks designed to measure performance of the broad domestic economy through changes in the aggregate market value of the 500 stocks representing all major industries.
The performance of the indices includes reinvestment of dividends and capital gains, however, it does not include any expenses or a deduction for Federal income taxes. A shareholder cannot invest in an index. This information is provided for comparison purposes only.
Comparisons to indices have limitations because indices have volatility and other material characteristics that may differ from a particular investment. Any indices and other financial benchmarks are provided for illustrative purposes only. Particularly, an Investment Index has results that do not represent actual trading or any material economic and market factors that might have had an
impact on the advisor’s decision-making. An investment cannot be made directly in an index. Index performance does not reflect the deduction of any management fees, taxes or expenses.
The total annual operating expense ratio for the Boyar Value Fund (before fee waivers/expense reimbursements) as stated in the fee table in the Fund’s prospectus dated May 1, 2018 was 2.27%. The net annual operating expense ratio (after fee waivers/expense reimbursement) was 1.80% for the same period. [An updated total annual operating expenses figure will appear in the Fund’s next prospectus update.]
^ The performance data quoted represents past performance. Past performance does not guarantee future results, and except where noted as after-tax, does not reflect the deduction of taxes that a shareholder would pay on Fund distributions or the redemption of Fund shares. The investment return and principal value of an investment will fluctuate. Consequently, an investor’s shares, when redeemed, may be worth more or less than their original cost. Returns for periods greater than one year are annualized. Current performance may be lower or higher than the performance data quoted. To obtain performance information current to the most recent month end, please call 1-800-266-5566.
Comparison of the Change in Value of a $10,000 Investment (Unaudited)
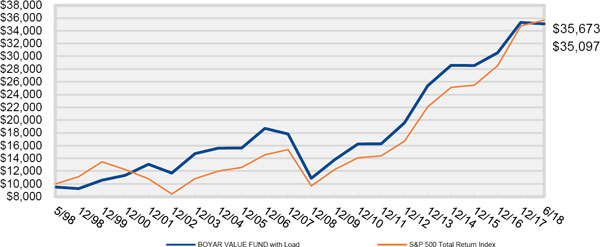
The Chart above represents historical performance of a hypothetical investment of $10,000 in the Boyar Value Fund from inception. The performance of the Fund includes the reinvestment of all dividend and capital gain distributions and has been adjusted for the maximum applicable sales charge of 5.00%. The performance of the Fund as reflected in the chart does not include the effect of taxes incurred on Fund distributions or on the redemption of Fund shares.
Portfolio Diversification By Sector (as of June 30, 2018)
(as a percentage of total net assets) (Unaudited)
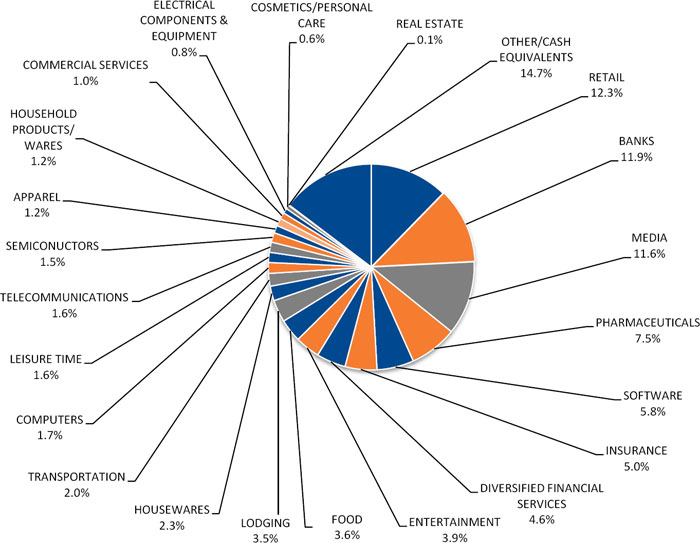
The composition of the Fund’s portfolio is subject to change.
Please refer to the Portfolio of Investments in this annual report for a detailed analysis of the Fund’s holdings.
The mention of specific securities or asset classes is not a recommendation or solicitation for any person to buy, sell or hold any particular security or asset class.
It’s not what you make; it’s what you keep – Taxes are potentially the biggest expense an individual mutual fund investor will experience.
By holding stocks for long periods of time, you postpone paying taxes, which positively impacts long-term returns. Buying and holding stocks for long periods may sound stodgy, but it postpones the payment of capital gains taxes with the added positive effects on the compounding rate. Since profit taking involves transactions, it obliges you to take the IRS in as a partner. With profits not taken, there is a future tax liability, but all the money is still working for its owner. No transactions, no tax. The Boyar Value Fund believes that holding stocks for long periods of time is the best way for an individual investor to create wealth.
| | Best regards, |
| | |
| |  |
| | |
| | Mark A. Boyar |
| | |
This letter seeks to describe the Fund managers’ current view of the market. Statements referring to future events or actions, such as future financial performance, are based on current expectations and projections about future events provided by various sources, including the Fund’s management. These statements are not guarantees of future performance, and actual events and results may differ materially from those discussed herein. The mention of specific securities or asset classes is not a recommendation or solicitation for any person to buy, sell or hold any particular security or asset class.
Activities with respect to Distributor Services are conducted through Ladenburg Thalmann & Co. Inc, (“LTCO”) a member of the NYSE, NYSE AMEX and other principal exchanges. Member FINRA/SIPC.
| BOYAR VALUE FUND, INC. |
| PORTFOLIO OF INVESTMENTS (Unaudited) |
| June 30, 2018 |
| Shares | | | | | Value | |
| | | | | COMMON STOCK - 85.3% | | | | |
| | | | | APPAREL - 1.2% | | | | |
| | 13,900 | | | Hanesbrands, Inc. | | $ | 306,078 | |
| | | | | | | | | |
| | | | | BANKS - 11.9% | | | | |
| | 36,095 | | | Bank of America Corp. | | | 1,017,518 | |
| | 12,707 | | | Bank of New York Mellon Corp. | | | 685,288 | |
| | 4,430 | | | Citigroup, Inc. | | | 296,456 | |
| | 10,750 | | | JPMorgan Chase & Co. | | | 1,120,150 | |
| | | | | | | | 3,119,412 | |
| | | | | COMMERCIAL SERVICES - 1.0% | | | | |
| | 11,600 | | | Reis, Inc. | | | 252,880 | |
| | | | | | | | | |
| | | | | COMPUTERS - 1.7% | | | | |
| | 24,657 | | | Conduent, Inc. * | | | 448,018 | |
| | | | | | | | | |
| | | | | COSMETICS/PERSONAL CARE - 0.6% | | | | |
| | 3,200 | | | Edgewell Personal Care Co. * | | | 161,472 | |
| | | | | | | | | |
| | | | | DIVERSIFIED FINANCIAL SERVICES - 4.6% | | | | |
| | 8,500 | | | Ameriprise Financial, Inc. | | | 1,188,980 | |
| | | | | | | | | |
| | | | | ELECTRICAL COMPONENTS & EQUIPMENT - 0.8% | | | | |
| | 3,200 | | | Energizer Holdings, Inc. | | | 201,472 | |
| | | | | | | | | |
| | | | | ENTERTAINMENT - 3.9% | | | | |
| | 3,105 | | | Madison Square Garden Co., Class A * | | | 963,140 | |
| | 500 | | | Marriott Vacations Worldwide Corp. | | | 56,480 | |
| | | | | | | | 1,019,620 | |
| | | | | FOOD - 3.6% | | | | |
| | 3,000 | | | Campbell Soup Co. | | | 121,620 | |
| | 3,000 | | | Kraft Foods Group, Inc. | | | 188,460 | |
| | 9,000 | | | Mondelez International, Inc., Class A | | | 369,000 | |
| | 4,000 | | | Sysco Corp. | | | 273,160 | |
| | | | | | | | 952,240 | |
| | | | | | | | | |
See accompanying notes to financial statements.
| BOYAR VALUE FUND, INC. |
| PORTFOLIO OF INVESTMENTS (Unaudited) (Continued) |
| June 30, 2018 |
| Shares | | | | | Value | |
| | | | | HOUSEHOLD PRODUCTS/WARES - 1.2% | | | | |
| | 2,250 | | | Clorox Co. | | $ | 304,313 | |
| | | | | | | | | |
| | | | | HOUSEWARES - 2.3% | | | | |
| | 11,552 | | | Newell Brands, Inc. | | | 297,926 | |
| | 3,700 | | | Scotts Miracle-Gro Co. | | | 307,692 | |
| | | | | | | | 605,618 | |
| | | | | INSURANCE - 5.0% | | | | |
| | 10,586 | | | Travelers Cos, Inc. | | | 1,295,091 | |
| | | | | | | | | |
| | | | | LEISURE TIME - 1.6% | | | | |
| | 7,500 | | | Carnival Corp. | | | 429,825 | |
| | | | | | | | | |
| | | | | LODGING - 3.5% | | | | |
| | 5,008 | | | Marriott International, Inc., Class A | | | 634,013 | |
| | 9,500 | | | MGM Resorts International | | | 275,785 | |
| | | | | | | | 909,798 | |
| | | | | MEDIA - 11.6% | | | | |
| | 3,641 | | | AMC Networks, Inc., Class A * | | | 226,470 | |
| | 18,268 | | | Comcast Corp., Special Class A | | | 599,373 | |
| | 13,580 | | | Discovery Communications, Inc., Class C * | | | 346,290 | |
| | 18,653 | | | MSG Networks, Inc., Class A * | | | 446,739 | |
| | 10,703 | | | Tribune Media Co. | | | 409,604 | |
| | 9,500 | | | Walt Disney Co. | | | 995,695 | |
| | | | | | | | 3,024,171 | |
| | | | | PHARMACEUTICALS - 7.5% | | | | |
| | 7,500 | | | Bristol-Myers Squibb Co. | | | 415,050 | |
| | 5,000 | | | CVS Health Corp. | | | 321,750 | |
| | 2,500 | | | Johnson & Johnson | | | 303,350 | |
| | 25,500 | | | Pfizer, Inc. | | | 925,140 | |
| | | | | | | | 1,965,290 | |
| | | | | REAL ESTATE - 0.1% | | | | |
| | 4,166 | | | Trinity Place Holdings, Inc. * | | | 27,287 | |
| | | | | | | | | |
See accompanying notes to financial statements.
| BOYAR VALUE FUND, INC. |
| PORTFOLIO OF INVESTMENTS (Unaudited) (Continued) |
| June 30, 2018 |
| Shares | | | | | Value | |
| | | | | RETAIL - 12.3% | | | | |
| | 8,000 | | | Home Depot, Inc. | | $ | 1,560,800 | |
| | 3,000 | | | McDonald’s Corp. | | | 470,070 | |
| | 10,464 | | | Tapestry, Inc. | | | 488,773 | |
| | 3,800 | | | Target Corp. | | | 289,256 | |
| | 23,830 | | | Wendy’s Co. | | | 409,399 | |
| | | | | | | | 3,218,298 | |
| | | | | SEMICONDUCTORS - 1.5% | | | | |
| | 8,000 | | | Intel Corp. | | | 397,680 | |
| | | | | | | | | |
| | | | | SOFTWARE - 5.8% | | | | |
| | 15,411 | | | Microsoft Corp. | | | 1,519,679 | |
| | | | | | | | | |
| | | | | TELECOMMUNICATIONS - 1.6% | | | | |
| | 10,000 | | | Cisco Systems, Inc. | | | 430,300 | |
| | | | | | | | | |
| | | | | TRANSPORTATION - 2.0% | | | | |
| | 5,000 | | | United Parcel Service, Inc., Class B | | | 531,150 | |
| | | | | | | | | |
| | | | | TOTAL COMMON STOCK (Cost - $10,039,517) | | | 22,308,672 | |
| | | | | | | | | |
| | | | | SHORT-TERM INVESTMENTS - 14.8% | | | | |
| | 3,049,802 | | | Dreyfus Institutional Preferred Government Money Market Fund - Institutional Class - Premier Shares, 1.55% ** | | | 3,049,802 | |
| | 821,496 | | | Milestone Treasury Obligations Portfolio - Institutional Class, 1.77% ** | | | 821,496 | |
| | | | | TOTAL SHORT-TERM INVESTMENTS (Cost - $3,871,298) | | | 3,871,298 | |
| | | | | | | | | |
| | | | | TOTAL INVESTMENTS - 100.1% (Cost - $13,910,815) | | $ | 26,179,970 | |
| | | | | OTHER ASSETS IN EXCESS OF LIABILITIES - NET - (0.1)% | | | (35,002 | ) |
| | | | | NET ASSETS - 100.0% | | $ | 26,144,968 | |
| | | | | | | | | |
| * | Non-income producing security. |
| ** | Money market fund; interest rate reflects seven-day effective yield on June 30, 2018. |
See accompanying notes to financial statements.
| BOYAR VALUE FUND, INC. |
| STATEMENT OF ASSETS AND LIABILITIES (Unaudited) |
| June 30, 2018 |
| ASSETS | | | | |
| Investment securities, at cost | | $ | 13,910,815 | |
| Investment securities, at value | | $ | 26,179,970 | |
| Dividends and interest receivable | | | 10,341 | |
| Prepaid expenses and other assets | | | 14,656 | |
| TOTAL ASSETS | | | 26,204,967 | |
| | | | | |
| LIABILITIES | | | | |
| Advisory fees payable | | | 7,066 | |
| Management fees payable | | | 7,066 | |
| Distribution fees (12b-1) payable | | | 5,895 | |
| Payable to service providers | | | 16,642 | |
| Audit fees payable | | | 9,253 | |
| Accrued expenses and other liabilities | | | 14,077 | |
| TOTAL LIABILITIES | | | 59,999 | |
| NET ASSETS | | $ | 26,144,968 | |
| | | | | |
| Net Assets Consist Of: | | | | |
| Paid in capital | | $ | 12,960,059 | |
| Accumulated net investment income | | | 19,006 | |
| Accumulated net realized gain from security transactions | | | 896,748 | |
| Net unrealized appreciation on investments | | | 12,269,155 | |
| NET ASSETS | | $ | 26,144,968 | |
| | | | | |
| Shares of capital stock outstanding (1,000,000,000 shares authorized, $0.001 par value) | | | 990,819 | |
| Net asset value and redemption price per share (Net assets ÷ shares outstanding) (a) | | $ | 26.39 | |
| Maximum offering price per share (maximum sales charge of 5.00%) (b) | | $ | 27.78 | |
| | | | | |
| (a) | For certain purchases of $1 million or more, a 1.00% contingent deferred sales charge may apply to redemptions made within twelve months of purchase. Redemptions made within 60 days of purchase may be assessed a redemption fee of 2.00%. |
| (b) | On investments of $50,000 or more, the offering price is reduced. |
See accompanying notes to financial statements.
| BOYAR VALUE FUND, INC. |
| STATEMENT OF OPERATIONS (Unaudited) |
| For the Six Months Ended June 30, 2018 |
| INVESTMENT INCOME | | | | |
| Dividends | | $ | 228,928 | |
| Interest | | | 24,699 | |
| TOTAL INVESTMENT INCOME | | | 253,627 | |
| | | | | |
| EXPENSES | | | | |
| Investment advisory fees | | | 67,049 | |
| Management fees | | | 67,049 | |
| Distribution (12b-1) fees | | | 33,525 | |
| Administrative services fees | | | 25,303 | |
| Legal Fees | | | 16,675 | |
| Transfer agent fees | | | 15,022 | |
| Accounting services fees | | | 14,027 | |
| Directors’ fees and expenses | | | 9,443 | |
| Audit Fees | | | 9,231 | |
| Compliance officer fees | | | 7,602 | |
| Insurance expense | | | 6,335 | |
| Custodian fees | | | 6,028 | |
| Printing and postage expenses | | | 5,045 | |
| Registration fees | | | 1,145 | |
| Other expenses | | | 3,982 | |
| TOTAL EXPENSES | | | 287,461 | |
| Less: | | | | |
| Fees waived by the Advisor | | | (26,420 | ) |
| Fees waived by the Manager | | | (26,420 | ) |
| NET EXPENSES | | | 234,621 | |
| NET INVESTMENT INCOME | | | 19,006 | |
| | | | | |
| REALIZED AND UNREALIZED GAIN (LOSS) ON INVESTMENTS | | | | |
| Net realized gain from security transactions | | | 981,487 | |
| Net change in unrealized appreciation (depreciation) of investments | | | (1,156,281 | ) |
| NET REALIZED AND UNREALIZED LOSS ON INVESTMENTS | | | (174,794 | ) |
| | | | | |
| NET DECREASE IN NET ASSETS RESULTING FROM OPERATIONS | | $ | (155,788 | ) |
| | | | | |
See accompanying notes to financial statements.
| BOYAR VALUE FUND, INC. |
| STATEMENTS OF CHANGES IN NET ASSETS |
| | | For the Six Months | | | For the Year | |
| | | Ended | | | Ended | |
| | | June 30, 2018 | | | December 31, 2017 | |
| | | (Unaudited) | | | | |
| FROM OPERATIONS | | | | | | | | |
| Net investment income | | $ | 19,006 | | | $ | 107,745 | |
| Net realized gain from security transactions | | | 981,487 | | | | 257,632 | |
| Net change in unrealized appreciation (depreciation) on investments | | | (1,156,281 | ) | | | 3,343,757 | |
| Net increase (decrease) in net assets resulting from operations | | | (155,788 | ) | | | 3,709,134 | |
| | | | | | | | | |
| DISTRIBUTIONS TO SHAREHOLDERS | | | | | | | | |
| From net investment income | | | — | | | | (109,422 | ) |
| From net realized gains | | | — | | | | (343,660 | ) |
| Net decrease in net assets from distributions to shareholders | | | — | | | | (453,082 | ) |
| | | | | | | | | |
| FROM CAPITAL SHARE TRANSACTIONS | | | | | | | | |
| Proceeds from shares sold | | | 177,800 | | | | 442,026 | |
| Net asset value of shares issued in reinvestment of distributions to shareholders | | | — | | | | 437,432 | |
| Payments for shares redeemed | | | (1,097,018 | ) | | | (1,348,125 | ) |
| Net decrease in net assets from capital share transactions | | | (919,218 | ) | | | (468,667 | ) |
| | | | | | | | | |
| TOTAL INCREASE (DECREASE) IN NET ASSETS | | | (1,075,006 | ) | | | 2,787,385 | |
| | | | | | | | | |
| NET ASSETS | | | | | | | | |
| Beginning of period | | | 27,219,974 | | | | 24,432,589 | |
| End of period * | | $ | 26,144,968 | | | $ | 27,219,974 | |
| * Includes accumulated undistributed net investment income of: | | $ | 19,006 | | | $ | — | |
| | | | | | | | | |
| CAPITAL SHARE ACTIVITY | | | | | | | | |
| Shares Sold | | | 6,667 | | | | 17,645 | |
| Shares Reinvested | | | — | | | | 16,476 | |
| Shares Redeemed | | | (41,445 | ) | | | (53,905 | ) |
| Net decrease in shares outstanding | | | (34,778 | ) | | | (19,784 | ) |
| | | | | | | | | |
See accompanying notes to financial statements.
| BOYAR VALUE FUND, INC. |
| FINANCIAL HIGHLIGHTS |
| |
| Per Share Data and Ratios for a Share of Capital Stock Outstanding Throughout Each Period Presented |
| | | Six Months | | | Year | | | Year | | | Year | | | Year | | | Year | |
| | | Ended | | | Ended | | | Ended | | | Ended | | | Ended | | | Ended | |
| | | June 30, | | | December 31, | | | December 31, | | | December 31, | | | December 31, | | | December 31, | |
| | | 2018 | | | 2017 | | | 2016 | | | 2015 | | | 2014 | | | 2013 | |
| | | (Unaudited) | | | | | | | | | | | | | | | | |
| Net Asset Value, Beginning of Period | | $ | 26.54 | | | $ | 23.37 | | | $ | 22.22 | | | $ | 22.86 | | | $ | 20.73 | | | $ | 16.10 | |
| Activity from investment operations: | | | | | | | | | | | | | | | | | | | | | | | | |
| Net investment income (loss)(1) | | | 0.02 | | | | 0.10 | | | | 0.03 | | | | 0.04 | | | | (0.01 | ) | | | (0.03 | ) |
| Net realized and unrealized gain (loss) on investments | | | (0.17 | ) | | | 3.52 | | | | 1.54 | | | | (0.06 | ) | | | 2.58 | | | | 4.82 | |
| Total from investment operations | | | (0.15 | ) | | | 3.62 | | | | 1.57 | | | | (0.02 | ) | | | 2.57 | | | | 4.79 | |
| Paid-in-Capital from Redemption Fees (1) | | | — | | | | — | | | | — | | | | 0.00 | (2) | | | 0.00 | (2) | | | 0.00 | (2) |
| Less distributions from: | | | | | | | | | | | | | | | | | | | | | | | | |
| Net investment income | | | — | | | | (0.11 | ) | | | (0.03 | ) | | | — | | | | — | | | | — | |
| Net realized gains | | | — | | | | (0.34 | ) | | | (0.39 | ) | | | (0.62 | ) | | | (0.44 | ) | | | (0.16 | ) |
| Total distributions | | | — | | | | (0.45 | ) | | | (0.42 | ) | | | (0.62 | ) | | | (0.44 | ) | | | (0.16 | ) |
| Net Asset Value, End of Period | | $ | 26.39 | | | $ | 26.54 | | | $ | 23.37 | | | $ | 22.22 | | | $ | 22.86 | | | $ | 20.73 | |
| Total Return (3) | | | (0.57 | )% (4) | | | 15.48 | % | | | 7.04 | % | | | (0.11 | )% | | | 12.52 | % | | | 29.76 | % |
| Net Assets, End of Period | | $ | 26,144,968 | | | $ | 27,219,974 | | | $ | 24,432,589 | | | $ | 23,999,274 | | | $ | 24,231,413 | | | $ | 22,311,000 | |
| Ratio of gross expenses to average net assets (5) | | | 2.14 | % (6) | | | 2.22 | % | | | 2.19 | % | | | 2.14 | % | | | 2.33 | % | | | 2.31 | % |
| Ratio of net expenses to average net assets | | | 1.75 | % (6) | | | 1.75 | % | | | 1.75 | % | | | 1.75 | % | | | 1.75 | % | | | 1.75 | % |
| Ratio of net investment income (loss) to average net assets | | | 0.14 | % (6) | | | 0.42 | % | | | 0.13 | % | | | 0.19 | % | | | (0.05 | )% | | | (0.15 | )% |
| Portfolio Turnover Rate | | | 1 | % (4) | | | 2 | % | | | 4 | % | | | 7 | % | | | 3 | % | | | 7 | % |
| | | | | | | | | | | | | | | | | | | | | | | | | |
| (1) | Per share amounts calculated using the average shares method. |
| (2) | Amount represents less than $0.005 per share. |
| (3) | Total returns shown are historical in nature and assume changes in share price, reinvestment of dividends and capital gains distributions, if any, and exclude the effect of applicable sales loads/redemption fees. Had the Advisor and Manager not waived their fees and/or reimbursed expenses, total returns would have been lower. |
| (5) | Represents the ratio of expenses to average net assets absent fee waivers and/or expense reimbursements by the Advisor and Manager. |
See accompanying notes to financial statements.
BOYAR VALUE FUND, INC.
NOTES TO FINANCIAL STATEMENTS (Unaudited)
June 30, 2018
Boyar Value Fund, Inc. (the “Fund”) was incorporated on February 28, 1997 under the laws of the State of Maryland and is registered under the Investment Company Act of 1940, as amended (the “1940 Act”), as an open-end, diversified management investment company. The Fund’s investment objective is long-term capital appreciation.
Under the Fund’s organizational documents, its officers and Directors are indemnified against certain liabilities arising out of the performance of their duties to the Fund. In addition, in the normal course of business, the Fund enters into contracts with its vendors and others that provide for general indemnifications. The Fund’s maximum exposure under these arrangements is unknown as this would involve future claims that may be made against the Fund. However, based on experience, the Fund expects that risk of loss to be remote.
| 2. | SIGNIFICANT ACCOUNTING POLICIES |
The following is a summary of significant accounting policies followed by the Fund in preparation of its financial statements. These policies are in conformity with accounting principles generally accepted in the United States of America (“GAAP”). The Fund is an investment company and accordingly follows the investment company accounting and reporting guidance of the Financial Accounting Standards Board (FASB) Accounting Standard Codification Topic 946 “Financial Services – Investment Companies”.
Securities valuation – Securities listed on an exchange are valued at the last reported sale price at the close of the regular trading session of the primary exchange on the business day the value is being determined, or in the case of securities listed on NASDAQ at the NASDAQ Official Closing Price. In the absence of a sale such securities shall be valued at the mean between the current bid and ask prices on the day of valuation. Short-term debt obligations having 60 days or less remaining until maturity, at time of purchase, may be valued at amortized cost.
The Fund may hold securities, such as private investments, other non-traded securities or temporarily illiquid securities, for which market quotations are not readily available or are determined to be unreliable. These securities will be valued using the “fair value” procedures approved by the Fund’s Board of Directors (the “Board”). The Board has delegated execution of these procedures to a Fair Value team composed of one or more representatives from each of the (i) Trust, (ii) administrator, and (iii) advisor.
Fair Valuation Process – As noted above, the Fair Value team is composed of one or more representatives from each of the (i) Trust, (ii) administrator, and (iii) advisor. The applicable investments are valued collectively via inputs from each of these groups. For example, fair value
BOYAR VALUE FUND, INC.
NOTES TO FINANCIAL STATEMENTS (Unaudited) (Continued)
June 30, 2018
determinations are required for the following securities: (i) securities for which market quotations are insufficient or not readily available on a particular business day (including securities for which there is a short and temporary lapse in the provision of a price by the regular pricing source), (ii) securities for which, in the judgment of the adviser, the prices or values available do not represent the fair value of the instrument. Factors which may cause the adviser to make such a judgment include, but are not limited to, the following: only a bid price or an ask price is available; the spread between bid and asked prices is substantial; the frequency of sales; the thinness of the market; the size of reported trades; and actions of the securities markets, such as the suspension or limitation of trading; (iii) securities determined to be illiquid; (iv) securities with respect to which an event that will affect the value thereof has occurred (a “significant event”) since the closing prices were established on the principal exchange on which they are traded, but prior to the Fund’s calculation of its net asset value.
The Fund utilizes various methods to measure the fair value of all of its investments on a recurring basis. GAAP establishes a hierarchy that prioritizes inputs to valuation methods. The three levels of input are:
Level 1 – Unadjusted quoted prices in active markets for identical assets and liabilities that the Fund has the ability to access.
Level 2 – Observable inputs other than quoted prices included in Level 1 that are observable for the asset or liability, either directly or indirectly. These inputs may include quoted prices for the identical instrument in an inactive market, prices for similar instruments, interest rates, prepayment speeds, credit risk, yield curves, default rates and similar data.
Level 3 – Unobservable inputs for the asset or liability, to the extent relevant observable inputs are not available, representing the Fund’s own assumptions about the assumptions a market participant would use in valuing the asset or liability, and based on the best information available.
The availability of observable inputs can vary from security to security and is affected by a wide variety of factors, including, for example, the type of security, whether the security is new and not yet established in the marketplace, the liquidity of markets, and other characteristics particular to the security. To the extent that valuation is based on models or inputs that are less observable or unobservable in the market, the determination of fair value requires more judgment. Accordingly, the degree of judgment exercised in determining fair value is greatest for instruments categorized in Level 3.
The inputs used to measure fair value may fall into different levels of the fair value hierarchy. In such cases, for disclosure purposes, the level in the fair value hierarchy within which the fair value measurement falls in its entirety, is determined based on the lowest level input that is significant to the fair value measurement in its entirety.
BOYAR VALUE FUND, INC.
NOTES TO FINANCIAL STATEMENTS (Unaudited) (Continued)
June 30, 2018
The inputs or methodology used for valuing securities are not necessarily an indication of the risk associated with investing in those securities. The following table summarizes the inputs used as of June 30, 2018 for the Fund’s investments measured at fair value:
| Assets* | | Level 1 | | | Level 2 | | | Level 3 | | | Total | |
| Common Stock | | $ | 22,308,672 | | | $ | — | | | $ | — | | | $ | 22,308,672 | |
| Short-Term Investments | | | 3,871,298 | | | | — | | | | — | | | | 3,871,298 | |
| Total | | $ | 26,179,970 | | | $ | — | | | $ | — | | | $ | 26,179,970 | |
The Fund did not hold any Level 3 securities during the period. There were no transfers into or out of Level 1 and Level 2 during the period. It is the Fund’s policy to recognize transfers between Level 1 and Level 2 at the end of the reporting period.
| * | Refer to the Portfolio of Investments for security classifications. |
Security Transactions and Related Income – Security transactions are accounted for on trade date. Interest income is recognized on an accrual basis. Discounts are accreted and premiums are amortized on securities purchased over the lives of the respective securities. Dividend income is recorded on the ex-dividend date. Realized gains or losses from sales of securities are determined by comparing the identified cost of the security lot sold with the net sales proceeds.
Dividends and Distributions to Shareholders – Dividends from net investment income, if any, are declared and paid annually. Distributable net realized capital gains, if any, are declared and distributed annually. Dividends and distributions paid and distributed to shareholders are recorded on ex-dividend date.
Dividends from net investment income and distributions from net realized gains are determined in accordance with Federal income tax regulations, which may differ from GAAP. These “book/tax” differences are considered either temporary (i.e., deferred losses, capital loss carry forwards) or permanent in nature. To the extent these differences are permanent in nature, such amounts are reclassified within the composition of net assets based on their Federal tax-basis treatment; temporary differences do not require reclassification.
Federal Income Taxes – The Fund intends to continue to comply with the requirements of the Internal Revenue Code applicable to regulated investment companies and to distribute all of its taxable income to its shareholders. Therefore, no provision for Federal income tax is required. The Fund will recognize the tax benefits of uncertain tax positions only where the position is “more likely than not” to be sustained assuming examination by tax authorities. Management has analyzed the Fund’s tax positions, and has concluded that no liability for unrecognized tax benefits should be recorded related to uncertain tax positions taken on returns filed for open tax years ended December 31, 2015 to December 31, 2017, or expected to be taken in the Fund’s December 31, 2018 year-end tax returns.
BOYAR VALUE FUND, INC.
NOTES TO FINANCIAL STATEMENTS (Unaudited) (Continued)
June 30, 2018
The Fund identifies its major tax jurisdictions as U.S. Federal, Maryland and foreign jurisdictions where the Fund makes significant investments. The Fund is not aware of any tax positions for which it is reasonably possible that the total amounts of unrecognized tax benefits will change materially in the next twelve months.
Use of Estimates – The preparation of financial statements in accordance with GAAP requires management to make estimates and assumptions that affect the reported amounts of assets and liabilities and disclosure of contingent assets and liabilities at the date of the financial statements and the reported amounts of income and expenses for the reporting period. Actual results could differ from those estimates.
| 3. | INVESTMENT TRANSACTIONS |
For the six months ended June 30, 2018, cost of purchases and proceeds from sales of portfolio securities, other than short-term investments, amounted to $303,199 and $1,526,667, respectively.
| 4. | AGGREGATE UNREALIZED APPRECIATION AND DEPRECIATION |
At June 30, 2018, the tax cost of investments and unrealized appreciation (depreciation) are as follows:
| | | | | | Gross Unrealized | | | Gross Unrealized | | | Net Unrealized | |
| Fund | | Tax Cost | | | Appreciation | | | Depreciation | | | Appreciation | |
| Boyar Value Fund | | $ | 13,912,329 | | | $ | 12,414,903 | | | $ | (147,262 | ) | | $ | 12,267,641 | |
| 5. | INVESTMENT ADVISORY AGREEMENT AND TRANSACTIONS WITH SERVICE PROVIDERS |
Ladenburg Thalmann Fund Management LLC serves as the Fund’s manager (the “Manager”). Boyar Asset Management, Inc. (the “Advisor”) provides continuous advisory services to the Fund and Ladenburg Thalmann & Co., Inc. (the “Distributor”) acts as distributor of the Fund’s shares.
Pursuant to a Management Agreement with the Fund, the Manager, under the supervision of the Board, oversees the daily operations of the Fund and supervises the performance of administrative and professional services provided by others, including the Advisor. As compensation for its services and the related expenses borne by the Manager, the Fund pays the Manager a management fee, computed and accrued daily and paid monthly, at an annual rate of 0.50% of the Fund’s average daily net assets.
Pursuant to an Investment Advisory Agreement among the Manager, the Advisor and the Fund, the Advisor agrees to furnish continuous investment advisory services to the Fund. For these services, the
BOYAR VALUE FUND, INC.
NOTES TO FINANCIAL STATEMENTS (Unaudited) (Continued)
June 30, 2018
Fund pays the Advisor an investment advisory fee, which is computed and accrued daily and paid monthly, at an annual rate of 0.50% of the Fund’s average daily net assets.
Pursuant to a written contract, the Manager, the Advisor and the Distributor have agreed, until at least April 30, 2019, to waive a portion of their respective management fee, advisory fee and amounts, if any, payable to the Distributor pursuant to the Fund’s 12b-1 Plan (see below), and the Manager has agreed to reimburse the Fund for other expenses to the extent necessary so that the total expenses incurred by the Fund (excluding interest, taxes, brokerage commissions, other expenditures which are capitalized in accordance with GAAP, and other extraordinary expenses not incurred in the ordinary course of the Fund’s business) do not exceed 1.75% per annum of the Fund’s average daily net assets. During the term of this Agreement, to the extent that Operating Expenses incurred by the Fund in any fiscal year after waiver of advisory fees of the Advisor, management fees of the Manager and fees payable to the Distributor (“Rule 12b-1 fees”) exceed 1.75% per annum of the Fund’s average daily net assets, such excess amount shall be the liability of the Manager. For the six months ended June 30, 2018, the Manager and the Advisor waived fees in the amount of $26,420 and $26,420, respectively.
To the extent Operating Expenses in any fiscal year do not exceed 1.75% per annum of the Fund’s average daily net assets, the management fee, advisory fee and Rule 12b-1 fees shall be payable by the Fund in the following order:
| o | first, the Distributor shall be entitled to receive the Rule 12b-1 fees up to the amount payable under the Fund’s 12b-1 Plan; and |
| o | thereafter, the Manager and the Advisor shall each be entitled to receive a proportionate amount of their respective management fee and advisory fee up to the amounts payable under the Management Agreement or the Advisory Agreement, as applicable. |
If the Manager, the Advisor or the Distributor waives any fee or reimburses any expense pursuant to this Agreement, and the Fund’s Operating Expenses are subsequently less than 1.75% of average daily net assets, the Manager, the Advisor and the Distributor shall be entitled to reimbursement by the Fund for such waived fees or reimbursed expenses provided that such reimbursement does not cause the Fund’s expenses to exceed 1.75% of average daily net assets. If Fund Operating Expenses subsequently exceed 1.75% per annum of the Fund’s average daily net assets, the reimbursements shall be suspended. The Advisor, the Manager and the Distributor may each seek reimbursement only for expenses waived or paid by it during the two fiscal years prior to such reimbursement; provided, however, that such expenses may only be reimbursed hereunder to the extent they were waived or paid after the date of this Agreement (or any similar agreement). This Agreement may be continued from year to year thereafter provided each such continuance is specifically approved by the Fund, the Advisor, the Manager and the Distributor, including with respect to the Fund a majority of the non-
BOYAR VALUE FUND, INC.
NOTES TO FINANCIAL STATEMENTS (Unaudited) (Continued)
June 30, 2018
interested Directors of the Fund; provided, however, that no party shall be obligated to extend the term of this Agreement. This Agreement shall terminate automatically with respect to the Fund and to the Advisor, the Manager or the Distributor upon the termination of the Advisory Agreement, the Management Agreement or the 12b-1 Plan, respectively.
As of December 31, 2017, the Manager, the Advisor, and the Distributor have the following amounts of waived/reimbursed expenses that may be recovered:
| Amount | | Expiration Date |
| $104,848 | | December 31, 2018 |
| $120,040 | | December 31, 2019 |
The Fund has adopted a Shareholder Servicing and Distribution Plan (the “Plan”) pursuant to Rule 12b-1 under the 1940 Act. The Plan provides that a monthly service fee is calculated by the Fund at an annual rate of 0.25% of its average daily net assets and is paid to the Distributor, to provide compensation for ongoing services and/or maintenance of the Fund’s shareholder accounts, not otherwise required to be provided by the Advisor. For the six months ended June 30, 2018, the Distributor received $100 from front-end sales charges, of which $10 was retained by the principal underwriter or other affiliated broker-dealers.
Gemini Fund Services, LLC (“GFS”),
GFS, provides administration, fund accounting, and transfer agent services to the Trust. Pursuant to a separate servicing agreement with GFS, the Fund pays GFS customary fees for providing administration, fund accounting and transfer agency services to the Fund. Certain Directors and officers of the Trust are also officers of the Manager, Advisor or GFS, and are not paid any fees directly by the Fund for serving in such capacities.
In addition, certain affiliates of GFS provide services to the Fund as follows:
Northern Lights Compliance Services, LLC (“NLCS”)
NLCS, an affiliate of GFS, provides a Chief Compliance Officer to the Fund, as well as related compliance services, pursuant to a consulting agreement between NLCS and the Fund. Under the terms of such agreement, NLCS receives customary fees from the Fund.
Blu Giant, LLC (“Blu Giant”)
Blu Giant, an affiliate of GFS, provides EDGAR conversion and filing services as well as print management services for the Fund on an ad-hoc basis. For the provision of these services, Blu Giant receives customary fees from the Fund.
BOYAR VALUE FUND, INC.
NOTES TO FINANCIAL STATEMENTS (Unaudited) (Continued)
June 30, 2018
Custody Administration
Pursuant to the terms of the Fund’s Custody Agreement with Bank of New York Mellon (the “Custody Agreement”), the Fund pays an asset-based custody fee in decreasing amounts as Fund assets reach certain breakpoints. The Fund also pays certain transaction fees and out-of-pocket expenses pursuant to the Custody Agreement. GFS receives a portion of these fees for performing certain custody administration services. GFS’s share of such fees collected for the six months ended June 30, 2018 was $2,428. The Custodian fees listed in the Statement of Operations include the fees paid to GFS as Custody Administrator.
Directors
The Fund pays each Director an annual fee of $3,000 and $500 for each meeting attended. Expenses incurred in connection with attendance at board meetings may be reimbursed. No employee of the Manager, the Advisor or any of their respective affiliates will receive any compensation from the Fund for acting as either an officer or Director. None of the executive officers receive any compensation from the Fund.
The beneficial ownership, either directly or indirectly, of more than 25% of the voting securities of a Fund creates presumption of control of the Fund, under Section 2(a)(9) of the 1940 Act. As of June 30, 2018, Vector Group Ltd. held approximately 34.3% while National Financial Services LLC held 47.9% of the voting securities of the Boyar Value Fund.
The Fund may assess a short-term redemption fee of 2.00% of the total redemption amount if a shareholder sells their shares after holding them for less than 60 days. The redemption fee is paid directly to the Fund. For the six months ended June 30, 2018, the Fund did not assess any redemption fees. This fee does not apply to shares acquired through reinvestment of dividends and other distributions. For certain purchases of $1 million or more the Fund may also assess a contingent deferred sales charge of 1.00% to redemptions made within twelve months of purchase. There were no such charges assessed for the six months ended June 30, 2018.
| 8. | DISTRIBUTIONS TO SHAREHOLDERS AND TAX COMPONENTS OF CAPITAL |
The tax character of Fund distributions paid for the years ended December 31, 2017 and December 31, 2016 was as follows:
BOYAR VALUE FUND, INC.
NOTES TO FINANCIAL STATEMENTS (Unaudited) (Continued)
June 30, 2018
| | | Fiscal Year Ended | | | Fiscal Year Ended | |
| | | December 31, 2017 | | | December 31, 2016 | |
| Ordinary Income | | $ | 109,422 | | | $ | 31,775 | |
| Long-Term Capital Gain | | | 343,660 | | | | 399,458 | |
| | | $ | 453,082 | | | $ | 431,233 | |
As of December 31, 2017, the components of accumulated earnings/(deficit) on a tax basis were as follows:
| Undistributed | | | Undistributed | | | Capital Loss | | | Other | | | Post October Loss | | | Unrealized | | | Total | |
| Ordinary | | | Long-Term | | | Carry | | | Book/Tax | | | and | | | Appreciation/ | | | Accumulated | |
| Income | | | Gains | | | Forwards | | | Differences | | | Late Year Loss | | | (Depreciation) | | | Earnings/(Deficits) | |
| $ | — | | | $ | — | | | $ | — | | | $ | — | | | $ | (83,225 | ) | | $ | 13,423,922 | | | $ | 13,340,697 | |
The difference between book basis and tax basis undistributed net investment income, accumulated net realized loss and unrealized appreciation from investments is primarily attributable to the tax deferral of losses on wash sales of $1,514.
Capital losses incurred after October 31 within the fiscal year are deemed to arise on the first business day of the following fiscal year for tax purposes. The Fund incurred and elected to defer such capital losses of $83,225.
Permanent book and tax differences attributable to the re-class of distributions for tax purposes at December 31, 2017 were as follows:
| Paid | | | Accumulated | | | Accumulated | |
| In | | | Net Investment | | | Net Realized | |
| Capital | | | Income | | | Gains | |
| $ | (1,677 | ) | | $ | 84,278 | | | $ | (82,601 | ) |
Subsequent events after the date of the Statement of Assets and Liabilities have been evaluated through the date the financial statements were issued. Management has determined that no events or transactions occured requiring adjustment or disclosure in the financial statements.
BOYAR VALUE FUND, INC.
EXPENSE EXAMPLES (Unaudited)
June 30, 2018
As a shareholder of the Boyar Value Fund, you incur two types of costs: (1) transaction costs, including sales charges (loads) on purchases and redemption fees; (2) ongoing costs, including management fees and distribution fees; and other Fund expenses. This example is intended to help you understand your ongoing costs (in dollars) of investing in the Boyar Value Fund and to compare these costs with the ongoing costs of investing in other mutual funds.
The example is based on an investment of $1,000 invested at the beginning of the period and held for the entire period from January 1, 2018 through June 30, 2018.
Actual Expenses
The “Actual” expenses line in the table below provides information about actual account values and actual expenses. You may use the information below, together with the amount you invested, to estimate the expenses that you paid over the period. Simply divide your account value by $1,000 (for example, an $8,600 account value divided by $1,000 = 8.6), then multiply the result by the number in the table under the heading entitled “Expenses Paid During Period” to estimate the expenses you paid on your account during this period.
Hypothetical Example for Comparison Purposes
The “Hypothetical” line in the table below provides information about hypothetical account values and hypothetical expenses based on the Boyar Value Fund’s actual expense ratio and an assumed rate of return of 5% per year before expenses, which is not the Fund’s actual return. The hypothetical account values and expenses may not be used to estimate the actual ending account balances or expenses you paid for the period. You may use this information to compare this 5% hypothetical example with the 5% hypothetical examples that appear in the shareholder reports of other funds.
Please note that the expenses shown in the table are meant to highlight your ongoing costs only and do not reflect any transactional costs, such as sales charges (loads), or redemption fees. Therefore, the table is useful in comparing ongoing costs only, and will not help you determine the relative total costs of owning different funds. In addition, if these transactional costs were included, your costs would have been higher.
| | Beginning | Ending | Expenses Paid | Expense Ratio |
| | Account Value | Account Value | During Period* | During Period ** |
| | 1/1/18 | 6/30/18 | 1/1/18 – 6/30/18 | 1/1/18 – 6/30/18 |
| Actual | $1,000.00 | $ 994.30 | $8.65 | 1.75% |
| Hypothetical | | | | |
| (5% return before expenses) | $1,000.00 | $1,016.12 | $8.75 | 1.75% |
| * | Expenses are equal to the average account value times the Fund’s annualized expense ratio multiplied by the number of days in the most recent fiscal half-year [181] divided by the number of days in the fiscal year [365]. |
BOYAR VALUE FUND, INC.
SUPPLEMENTAL INFORMATION (Unaudited)
June 30, 2018
FACTORS CONSIDERED BY BOARD IN APPROVING THE CONTINUANCE OF THE MANAGEMENT AGREEMENT AND THE ADVISORY AGREEMENT
The Investment Company Act of 1940 (the “1940 Act”) requires the Board of Directors, including a majority of Directors who are not “interested persons” of The Boyar Value Fund, Inc. (the “Fund”), as that term is defined in the 1940 Act (the “Independent Directors”), to annually consider the continuance of the Fund’s investment advisory agreement with its investment adviser, Boyar Asset Management, Inc. (the “Adviser”), and management agreement with Ladenburg Thalmann Fund Management, LLC (the “Manager”; and such agreements, the “Agreements”).
At a Board meeting held on November 14, 2017, the Fund’s Board of Directors, including all the Independent Directors, approved the continuation of the Agreements. As required by the 1940 Act, the Board requested and each of the Adviser and the Manager provided such information as the Board deemed to be reasonably necessary to evaluate the terms of the Agreements. The Independent Directors were informed that, in selecting the Adviser and the Manager and approving the continuance of the Agreements, they are authorized to engage such experts as they consider appropriate, including counsel to the Independent Directors.
The Independent Directors, both prior to the meeting and other meetings held during the current year, received materials relating to the Adviser’s investment services under the Investment Advisory Agreement. These materials included information on (i) the investment performance of the Fund over various periods of time compared to the performance of two peer groups of mutual funds, the first of which consisted of the Fund and other large-cap value funds and the second of which consisted of the Fund and other large-cap blend funds (the “Performance Universes”), as classified by Morningstar and objectively selected by the Fund’s administrator as comparable to the Fund based upon criteria previously specified by the Independent Directors and used in the prior year, and to the Fund’s benchmark index; (ii) sales and redemption data with respect to the Fund; (iii) the general investment outlook in the markets in which the Fund invests; (iv) arrangements with respect to the distribution of the Fund’s shares; and (v) the overall nature, quality and extent of services provided by the Adviser and the Manager.
As part of the review of the continuance of the Investment Advisory Agreement and the Management Agreement, the Board requested, and the Adviser and Manager each provided, additional information in order to evaluate the quality of their services and the reasonableness of their fees under the Agreements. In a separate executive session, the Independent Directors reviewed information, which included data comparing: (i) the Fund’s advisory and management fees (individually and together), 12b-1 fees, and other non-management fees, to those incurred by the Performance Universes; (ii) the Fund’s average expense ratio to those of its Performance Universes (both before and after waivers); (iii) the Fund’s investment performance over various time periods to the mean performance of the Performance Universes and the Fund’s benchmark index; (iv) the Adviser’s financial results and condition, including an oral discussion of the Adviser’s and the Manager’s (together with its affiliates’) profitability from the services that have been performed for the Fund; (v) the Adviser’s current investment management staffing; and (vi) the Fund’s potential for achieving economies of scale. In support of its review of the statistical information, the Board was provided with a description of the objective non-performance-based methodology used by the administrator to determine the Performance Universes to prepare its information and the rationale for including both Performance Universes, which was consistent with that used in the previous year.
The Board considered several matters in connection with its renewal of the Agreements including investment performance; personnel and methods; fees and expenses; nature and quality of other services; other benefits; and economies of scale. However, the Board did not identify any single factor as all-important or controlling, and this summary does not detail all the matters that were considered. The Independent Directors also met in executive session to deliberate in their considerations of the Agreements.
BOYAR VALUE FUND, INC.
SUPPLEMENTAL INFORMATION (Unaudited) (Continued)
June 30, 2018
Investment Performance. First, the Board reviewed the Fund’s overall investment performance as compared to its Performance Universes and the Fund’s benchmark index. The Board noted that the Fund underperformed the mean performance of the Performance Universes and the benchmark index over the one-, two-, three-, five- and ten-year periods ended September 30, 2017, except that the Fund outperformed the mean of the Large Value Performance Universe for the three-year period ended September 30, 2017. Given the Adviser’s long-term strategy and that the Fund’s performance is lowered by its expense ratio, the Board concluded that the Fund’s performance was satisfactory.
Personnel and Methods. The Board next reviewed the background of Mr. Boyar, the portfolio manager who has been responsible for the daily management of the Fund’s portfolio since the Fund’s inception, achieving the Fund’s investment objective and adhering to the Fund’s investment strategy. The Independent Directors also engaged in discussions with Mr. Boyar and considered the Adviser’s staff responsible for assisting Mr. Boyar in the overall functioning of the Adviser, and the Manager and members of its staff who are responsible for the overall functioning of the Manager. Based on the Independent Directors’ review, the Board concluded that the Fund’s management team and the Adviser’s overall resources and the Manager’s overall resources (in conjunction with those of its affiliates that it relies upon) were adequate and that the Adviser in particular had investment management capabilities and personnel essential to performing its duties under the Investment Advisory Agreement. The Board considered the favorable history, reputation, continuity, qualifications and background of the Adviser, as well as the qualifications of its personnel. The Board concluded that the personnel and methods were satisfactory.
Fees and Expenses. The Board then considered the Adviser’s and the Manager’s fees under the Agreements relative to the management fees charged by the Fund’s Performance Universes. The Board noted that the Fund had a higher overall combined management fee and advisory fee rate than the mean advisory fee rate of its Performance Universes, and that the Fund has a lower expense ratio (both gross and net) than the mean expense ratio (both gross and net) of its Large Blend Performance Universe and a higher expense ratio (both gross and net) than the mean expense ratio (both gross and net) of its Large Value Performance Universe. The Board also noted and viewed favorably that the Adviser typically charges its other clients an advisory fee at a rate higher than the Fund’s gross advisory fee rate and significantly higher than the net advisory fee rate that the Adviser receives from the Fund after giving effect to the fee waiver. The Board also viewed favorably that the Adviser, the Manager and the Fund’s principal underwriter have since the Fund’s inception (or since the date on which they became service providers to the Fund in the case of the Manager and the principal underwriter) voluntarily agreed to waive all or portion of their fees and to reimburse the Fund’s expenses in order to keep the Fund’s net total operating expenses (excluding extraordinary expenses and taxes) at 1.75% of the Fund’s average daily net assets. The Board noted that, after giving effect to the above described expense limitation, the Adviser and the Manager received a relatively modest dollar amount of advisory and management fees from the Fund for the 2016 calendar year). Based on these factors, the Board determined that the Fund’s advisory and management fee rates under the Agreements do not constitute fees that are so disproportionately large as to bear no reasonable relationship to the services rendered and that could not have been the product of arm’s-length bargaining, and concluded that the advisory and management fee rates under the Agreements are fair and reasonable.
Nature and Quality of Other Services; Profitability. The Board next considered the nature, quality, cost and extent of other services provided by the Adviser and the Manager. At meetings held throughout the year, the Board reviewed the effectiveness of the Adviser’s and the Fund’s overall compliance programs and also received reports regarding the effectiveness of the Manager’s compliance program. Based on this review, the Board concluded that the nature, quality, cost and extent of such other services provided by the Adviser and the Manager were satisfactory, reliable and beneficial to the Fund’s shareholders. The Board was informed by the Adviser and the Manager that given the amount of fees received from the Fund and the current fee waivers and periodic reimbursements being made in order to keep the Fund’s expense ratio at 1.75%, neither the Adviser nor the Manager believed they made a profit under the Agreements in the prior year. Further, given the expenses
BOYAR VALUE FUND, INC.
SUPPLEMENTAL INFORMATION (Unaudited) (Continued)
June 30, 2018
reimbursed to the Fund in prior years in order to maintain the Fund’s expense ratio at 1.75%, the Manager stated that it and its affiliate, the Fund’s principal underwriter, have not cumulatively made a profit under their arrangements with the Fund since the date on which they became service provides to the Fund.
Other Benefits. The Board also considered the character and amount of other direct and incidental benefits received by the Adviser, the Manager and their respective affiliates from their association with the Fund. The Board concluded that potential “fall-out” benefits that they may receive, such as greater name recognition, appear to be reasonable, and may in some cases benefit the Fund.
Economies of Scale. The Board noted that, given the current and anticipated size of the Fund, any perceived and potential economies of scale were not yet a relevant consideration for the Fund and the addition of break points was determined not to be necessary at this time.
Fees and Services Provided for Other Comparable Funds/Accounts Managed by the Adviser and its Affiliates. In addition to comparing the Fund’s combined advisory and management fee rate to unaffiliated mutual funds included in the Fund’s Performance Universes, the Board was informed by the Adviser that it does not manage any other registered investment companies, although it does manage an unregistered investment company that has a different fee structure that includes a performance allocation. As noted above, the Adviser also manages separate accounts that on average have a higher investment advisory fee rate than the contractual advisory fee rate with the Fund. The Board was informed that the Manager does not manage any other accounts.
Conclusion. Based on the Board’s deliberations and its evaluation of the information described above, the Board, including the Independent Directors, concluded that: (a) it was appropriate to continue to retain the Adviser and the Manager; (b) the terms of the Investment Advisory Agreement and the Management Agreement (including the fees thereunder) are fair and reasonable; and (c) the Fund’s Investment Advisory Agreement and Management Agreement each should continue for a one-year period.
| PRIVACY notice |
| |
| Rev. June 2011 |
| |
| FACTS | WHAT DOES BOYAR VALUE FUND, INC. DO WITH YOUR PERSONAL INFORMATION? |
| | |
| Why? | Financial companies choose how they share your personal information. Federal law gives consumers the right to limit some but not all sharing. Federal law also requires us to tell you how we collect, share, and protect your personal information. Please read this notice carefully to understand what we do. |
| | |
| What? | The types of personal information we collect and share depend on the product or service you have with us. This information can include: ■ Social Security number ■ Purchase History ■ Assets ■ Account Balances ■ Retirement Assets ■ Account Transactions ■ Transaction History ■ Wire Transfer Instructions ■ Checking Account Information When you are no longer our customer, we continue to share your information as described in this notice. |
| | |
| How? | All financial companies need to share customers’ personal information to run their everyday business. In the section below, we list the reasons financial companies can share their customers’ personal information; the reasons Boyar Value Fund, Inc. chooses to share; and whether you can limit this sharing. |
| | | |
| Reasons we can share your personal information | Does Boyar
Value Fund, Inc,
share? | Can you limit this sharing? |
For our everyday business purposes – such as to process your transactions, maintain your account(s), respond to court orders and legal investigations, or report to credit bureaus | Yes | No |
For our marketing purposes – to offer our products and services to you | No | We don’t share |
| For joint marketing with other financial companies | No | We don’t share |
For our affiliates’ everyday business purposes – information about your transactions and experiences | No | We don’t share |
For our affiliates’ everyday business purposes – information about your creditworthiness | No | We don’t share |
| For nonaffiliates to market to you | No | We don’t share |
| Questions? | Call 1-402-493-4603 |
Rev. June 2011
| Who we are |
| Who is providing this notice? | Boyar Value Fund, Inc. |
| What we do |
| How does Boyar Value Fund, Inc. protect my personal information? | To protect your personal information from unauthorized access and use, we use security measures that comply with federal law. These measures include computer safeguards and secured files and buildings. Our service providers are held accountable for adhering to strict policies and procedures to prevent any misuse of your nonpublic personal information. |
| How does Boyar Value Fund, Inc. collect my personal information? | We collect your personal information, for example, when you ■ Open an account ■ Provide account information ■ Give us your contact information ■ Make deposits or withdrawals from your account ■ Make a wire transfer ■ Tell us where to send the money ■ Tells us who receives the money ■ Show your government-issued ID ■ Show your driver’s license We also collect your personal information from other companies. |
| Why can’t I limit all sharing? | Federal law gives you the right to limit only ■ Sharing for affiliates’ everyday business purposes – information about your creditworthiness ■ Affiliates from using your information to market to you ■ Sharing for nonaffiliates to market to you State laws and individual companies may give you additional rights to limit sharing. |
| Definitions |
| Affiliates | Companies related by common ownership or control. They can be financial and nonfinancial companies. ■ Boyar Value Fund, Inc. does not share with our affiliates. |
| Nonaffiliates | Companies not related by common ownership or control. They can be financial and nonfinancial companies
■ Boyar Value Fund, Inc. does not share with nonaffiliates so they can market to you. |
| Joint marketing | A formal agreement between nonaffiliated financial companies that together market financial products or services to you.
■ Boyar Value Fund, Inc. does not jointly market. |
This Page Intentionally Left Blank.
PROXY VOTING POLICY
Information regarding how the Fund voted proxies relating to portfolio securities for the most recent twelve month period ended June 30 as well as a description of the policies and procedures that the Fund uses to determine how to vote proxies is available without charge, upon request, by calling 1-800-266-5566 or by referring to the Securities and Exchange Commission’s (“SEC”) website at http://www.sec.gov.
PORTFOLIO HOLDINGS
The Fund files its complete schedule of portfolio holdings with the SEC for the first and third quarters of each fiscal year on Form N-Q. Form N-Q is available on the SEC’s website at http://www.sec.gov and may be reviewed and copied at the SEC’s Public Reference Room in Washington, DC (1-800-SEC-0330). The information on Form N-Q is available without charge, upon request, by calling 1-800-266-5566.
| |
| |
| |
| |
| |
| |
| |
| |
| |
| |
| |
| |
| |
| |
| |
| FUND MANAGER |
| Ladenburg Thalmann Fund Management, LLC |
| 277 Park Avenue, 26th Floor |
| New York, NY 10172 |
| |
| INVESTMENT ADVISOR |
| Boyar Asset Management, Inc. |
| 32 West 39th Street, 9th Floor |
| New York, New York 10018 |
| |
| ADMINISTRATOR |
| Gemini Fund Services, LLC |
| 80 Arkay Drive, Suite 110 |
| Hauppauge, New York 11788 |
Item 2. Code of Ethics.
Not applicable for semi-annual reports.
Item 3. Audit Committee Financial Expert.
Not applicable for semi-annual reports.
Item 4. Principal Accountant Fees and Services.
Not applicable for semi-annual reports.
Item 5. Audit Committee of Listed Companies. Not applicable to open-end investment companies.
Item 6. Schedule of Investments. See Item 1.
Item 7. Disclosure of Proxy Voting Policies and Procedures for Closed-End Funds. Not applicable to open-end investment companies.
Item 8. Portfolio Managers of Closed-End Management Investment Companies. Not applicable to open-end investment companies.
Item 9. Purchases of Equity Securities by Closed-End Management Investment Company and Affiliated Purchasers. Not applicable to open-end investment companies.
Item 10. Submission of Matters to a Vote of Security Holder. None.
Item 11. Controls and Procedures.
(a) Based on an evaluation of the registrant’s disclosure controls and procedures as of June 30, 2007, the disclosure controls and procedures are reasonably designed to ensure that the information required in filings on Forms N-CSR is recorded, processed, summarized, and reported on a timely basis.
(b) There were no significant changes in the registrant’s internal control over financial reporting that occurred during the registrant’s last fiscal half-year that have materially affected, or are reasonably likely to materially affect, the registrant’s internal control over financial reporting.
Item 12. Exhibits.
(a)(1) Not applicable.
(a)(2) Certification(s) required by Section 302 of the Sarbanes-Oxley Act of 2002 (and Item 11(a)(2) of Form N-CSR) are filed herewith.
(a)(3) Not applicable.
(b) Certification(s) required by Section 906 of the Sarbanes-Oxley Act of 2002 (and Item 11(b) of Form N-CSR) are filed herewith.
SIGNATURES
Pursuant to the requirements of the Securities Exchange Act of 1934 and the Investment Company Act of 1940, the registrant has duly caused this report to be signed on its behalf by the undersigned, thereunto duly authorized.
(Registrant) The Boyar Value Fund, Inc.
By (Signature and Title)
* /s/ Sam Singh
Sam Singh, Principal Executive Officer/President
Date 8/30/18
Pursuant to the requirements of the Securities Exchange Act of 1934 and the Investment Company Act of 1940, this report has been signed below by the following persons on behalf of the registrant and in the capacities and on the dates indicated.
By (Signature and Title)
* /s/ Sam Singh
Sam Singh, Principal Executive Officer/President
Date 8/30/18
By (Signature and Title)
* /s/ Dawn Borelli
Dawn Borelli, Principal Financial Officer/Treasurer
Date 8/30/18
* Print the name and title of each signing officer under his or her signature.