united states
securities and exchange commission
washington, d.c. 20549
form n-csr
certified shareholder report of registered management
investment companies
Investment Company Act file number 811-08253
The Boyar Value Fund, Inc.
(Exact name of registrant as specified in charter)
32 West 39th Street, 9th Floor, New York, NY 10018
(Address of principal executive offices) (Zip code)
James Ash, Gemini Fund Services, LLC
80 Arkay Drive, Hauppauge, NY 11788
(Name and address of agent for service)
Registrant's telephone number, including area code: 212-995-8300
Date of fiscal year end: 12/31
Date of reporting period:12/31/19
Item 1. Reports to Stockholders.
Beginning on January 1, 2021, as permitted by regulations adopted by the Securities and Exchange Commission, paper copies of the Fund’s shareholder reports like this one will no longer be sent by mail, unless you specifically request paper copies of the reports. Instead, the reports will be made available on the Fund’s website www.boyarassetmanagement.com, and you will be notified by mail each time a report is posted and provided with a website link to access the report.
If you already elected to receive shareholder reports electronically, you will not be affected by this change and you need not take any action. You may elect to receive shareholder reports and other communications from the Fund electronically or to continue receiving paper copies of shareholder reports, which are available free of charge, by contacting your financial intermediary (such as a broker-dealer or bank) or, if you are a direct investor, by following the instructions included with paper Fund documents that have been mailed to you.
 | Our favorite holding period is forever.
— Warren Buffett |
| | |
Dear Boyar Value Fund Shareholder:
What a Difference a Year Makes
In 2018 Wall Street posted its worst yearly performance since the financial crisis, with the S&P 500 losing 6.2%—its biggest annual loss since 2008, when it plummeted by 38.5%. For the first time in three years, the S&P 500 and Dow fell; the Nasdaq broke a six-year winning streak by losing 3.9%. It was a year of volatility, marked by record highs and sharp reversals. It was also the first time the S&P 500 had posted a decline after rising for the first three quarters of a year.
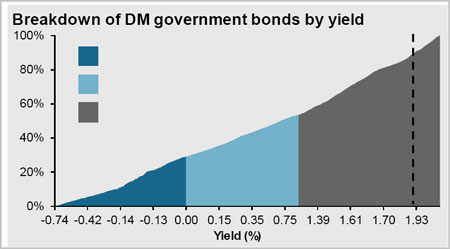
But 2019 was the polar opposite. Global markets enjoyed a fantastic run, gaining more than $17 trillion in value (starting the year just under $70 trillion and ending just above $85 trillion, according to Deutsche Bank). More than one factor fueled these gains, and more accommodative monetary policy certainly played a large part in the story. The Federal Reserve, for example, cut its benchmark interest rate three times in 2019—and has indicated that it will likely leave rates on hold in 2020. The 10-year Treasury ended 2019 yielding 1.92% (down from 2.7% at the end of 2018), compared with its historical average of 5.98%. What’s more, levels of negative-yielding corporate debt reached an all- time high in 2019, pushing investors toward equities in a quest for satisfactory returns. Incredibly, as the chart to the right demonstrates, more than 40% of the world’s government bonds yield less than 1%—and 20% are in negative territory.
The outlook for global trade has becomesomewhat less muddy recently. Domestically, the House of Representatives passed the new North American trade deal, and the U.S. and China have reached a phase 1 trade agreement.
Mega-Cap Dominance
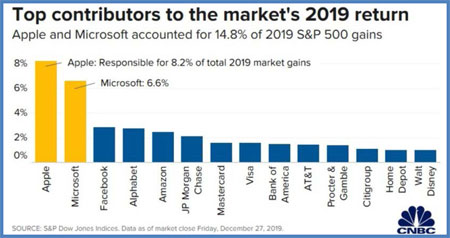
Mega-cap technology stocks were last year’s star performers, playing a leading role in driving up the S&P 500 and the Dow. The S&P 500 technology sector rose by about 50%—by far the biggest gain among the index’s 11 sectors. In fact, according to data from the S&P Dow Jones Indices, the technology sector alone was responsible for ~31% of the index’s total return for the year, including dividends.
Nearly 25% of the Dow’s 2019 gain came from Apple and Microsoft, which surged 85% and 55%, respectively. These two companies are the nation’s largest publicly traded companies, with market values exceeding $1 trillion each, and together they were responsible for ~15% of the S&P 500’s 2019 advance.
32 West 39th Street●9th Floor●New York, NY 10018●P. 212.995.8300●F. 212.995.5636
www.BoyarAssetManagement.com
Much of the index’s performance came thanks to just a few mega-capitalization stocks. The S&P 500 weights companies with greater market value more heavily, and the 10 largest companies in the S&P 500 represented more than 25% of the market value of the entire index—and were responsible for more than 27% of its 2019 gains.
These stocks’ median return was ~28% last year (pretty close to the index’s 31% gain) but gains within the index were far from democratic: the top 100 performers had a median return of ~57%, but the bottom 100 had a median return of negative 2.5%.
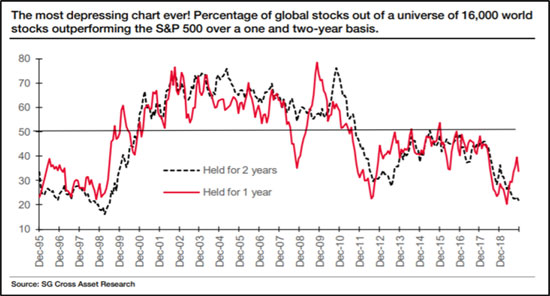
Lately the S&P 500 has been a hard benchmark to beat. As the following chart shows, over the past two years, out of 16,000 public companies worldwide, barely 20% have beaten the index (versus over 70% roughly a decade ago).
In our July 24, 2019 letter, we observed that:
“The new issue market today is reminiscent of the dot.com boom, and most of us remember just how badly that ended. Today’s new issues generate significantly higher revenue and have been in business far longer, but their hefty valuations remain troubling.”
It didn’t take long for individual investors to rethink their investments in initial public offerings. Most of the companies concerned were hemorrhaging money, were vastly overvalued, and were experiencing corporate government concerns. In January, a government shutdown halted IPOs, and in March and May, respectively, ride hailing companies Lyft Inc. and Uber Inc. debuted—only to see their share prices drop.
From there investors grew increasingly nervous about the remaining slate of IPOs, many of which were bleeding money. Companies such as Pinterest Inc., Slack Technologies Inc., and SmileDirectClub Inc. all saw
their value drop after they started trading in the public markets. Then came the WeWork debacle, in which instead of taking the company public at a valuation as high as $100 billion (as some investment banks thought they could), controversial CEO Adam Neumann was forced out, leaving the company foundering amid a cash crunch from which it was rescued by SoftBank.
Most of the companies that did go public are now trading far below the valuations they fetched during their last private funding round, let alone pre-IPO pricing expectations. Shares of Smile Direct Club Inc., for example, are trading more than 43% below their IPO price, and Lyft trades more than 30% below its IPO price. Even so, 2019 was still one of the biggest years for public offerings on record, with more total money raised than any time since 2000, at the height of the dot-com boom.
So why should investors be concerned about the huge amounts of money that flowed into the IPO market? Because a finite amount of money is earmarked for the U.S. stock market, much of the money put into these new issues would likely have been invested in established businesses already traded on various exchanges. What’s more, when investors lose a great deal of money in a short time, their appetite for risk diminishes. During the dotcom bust and the financial crisis, for example, many investors fled the stock market, never to return. Likewise, 2018’s fourth-quarter stock market swoon, when the leading averages dropped by 20% from their highs, prompted many investors to reduce or even eliminate their equity exposure.
Recent events could signal a shift from speculative or momentum investing to value investing, but only time will tell. There are encouraging signs, though, particularly in the new issue market. Going forward, underwriters expect investors to remain discerning and wary of money-losing companies.
| —Source: Maureen Farrell, “2019: The Year of IPO Disappointment,” |
| December 29, 2019, Wall Street Journal. |
| |
The Return of Value Investing?
We’ve been saying for some time that value investing is due for a renaissance. Looking at the stretched valuation of growth stocks and considering that value shares haven’t been this cheap relative to growth stocks since the height of the dot-com bubble (see the following chart), makes us confident that soon it will be value’s turn to shine.
According to Savina Rizova, head of research at Dimensional Fund Advisors (as quoted in aWall Street Journalarticle penned by Jason Zweig), this is not the first time that value has underperformed growth for at least 10 years. Value trailed for 10-year spans ending in the late 1930s, the late 1990s, and every year after 2010—about 15% of all periods. And over each decade following such poor returns, value has shown a tendency to bounce back sharply, beating growth by an average of more than 8 percentage points a year.
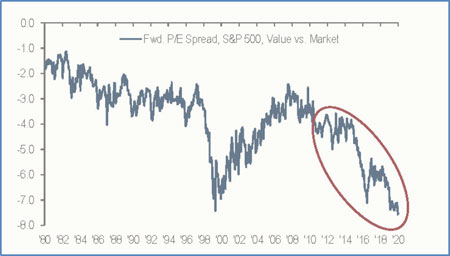
Source: JPMorgan Securities Research Report
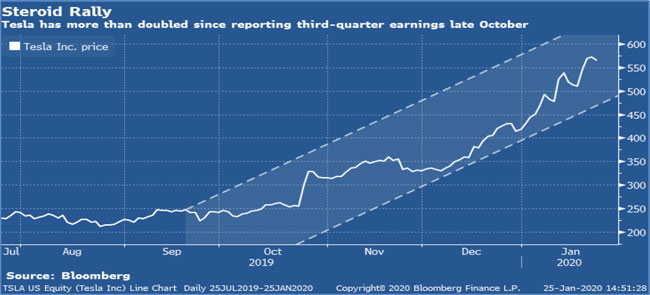
Tesla
The Tesla story never ceases to amaze us. Tesla’s current market value of over $100 billion exceeds those of Ford and General motors combined even though the company’s revenue was ~$24 billion over the last 12 months, compared with Ford’s ~$157 billion and GM’s ~$144 billion. Telsa’s shares have more than doubled
since it reported earnings in late October, earning it the title of most shorted stock. According to S3 Partners, $14.5 billion worth of shares are currently borrowed (shares must be borrowed to be shorted), and sellers have racked up $2.8 billion in losses—making Tesla an expensive ride indeed!
Valuation
The S&P 500 ended 2019 selling at 18.2x earnings (fwd.), more than the 15.7x it sold for at its 2007 peak but far below the 27.2x it fetched before the dot-com bubble burst. With the 10-year Treasury significantly below its levels for those periods (1.9% at the end of 2019 vs. 4.7% in 2007 and 6.2% in 2000), the market might well continue grinding still higher as investors keep flocking to equities in the hope of increasing their returns.
As the chart below demonstrates, the cheapest area of the market is currently in small-cap value stocks, which sell for an average of 15.6x earnings versus their 20-year average of 16.2x. By contrast, the most expensive area is in small-cap growth stocks, which sell at a whopping 44.4x earnings versus their historical 20-year average of 29.7x. Mid- and large-cap growth names are certainly no bargain, either, selling at 25.2x and 23.1x versus their 20-year averages of 20.8x and 19.1, respectively.
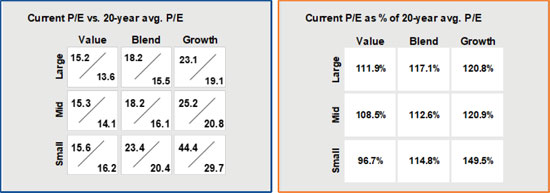
Source: JP Morgan Guide to The Markets
In the current low and even negative interest rate environment, investors have embraced consumer staple and utility shares, seeing these traditionally “safe” stocks as a good bond substitute. As a result, consumer staple shares are selling for 20.2x and utility stocks for a rich 19.9x, versus historical averages of 16.8x and 14.4x, respectively. But if interest rates rise, investors who purchased these stocks as a bond proxy may find them not so “safe” after all.
Small-Cap Rally?
InThe New York Times, Norm Alster noted that the Russell 1000 Growth Index (which indexes the largest growth companies) returned 15.2% per year over the past decade, while the Russell 2000 value index (an index of small-cap value companies) compounded at 10.6% over the same period. Despite this significant underperformance, looking at those two indices’ performance since January 1979 reveals that small-cap value stocks, despite their recent decade of significant underperformance, have outperformed their larger counterparts. For those keeping score, from January 1979 to December 30, 2009, the Russell value index returned 13.2% annually (including dividends), versus 10.46% (including dividends) for the corresponding growth index. So if history is any guide, the previous decade of underperformance by small-cap value shares is setting up for a period of future outperformance.
2019 Performance
The Boyar Value Fund generated solid absolute returns for both the 4thquarter and 2019 increasing 6.7% and 19.15% respectively. However, we significantly trailed the S&P 500 which was up 9.07% during the 4thquarter and 31.49% for the year. This underperformance is directly attributable to both our cash position as well as our significant underweighting in technology shares.
The Importance of Ignoring the Noise
Those who sold equities a year ago are probably kicking themselves now. Of course, seller’s remorse is nothing new—it follows each major stock market correction. After 2019’s robust market advance, CNBC found that 33% of those surveyed deeply regretted not having been more aggressive with their investments. Had the survey been conducted a year earlier, however, with the market fresh from its worst year since the financial crisis, their responses would certainly have been quite different. Investors too often make decisions based on emotion, not on the fundamentals of the underlying business. Such emotion-driven decision making is part of why, according to Dalbar, the average investor has compounded at 1.9% over the past 20 years, compared with the S&P 500’s 5.6% return.
Last year serves as the perfect example of why investors shouldn’t let geopolitical or economic events dictate their investment decisions. There is always a reason why “now is not a good time to invest”—after all, the world is chock full of scary headlines. Investors would be better off putting on blinders and making their investments based on fundamentals, not on the headlines of the day. Last year, for example, the Fed quickly reversed course and decided to cut rates instead of continuing to raise them. Likewise, President Trump decided that he wanted a trade truce with China, despite some harrowing fits and starts along the way. Neither event was readily predictable at the beginning of the year, but both were big contributors to last year’s outsized gains. And those sitting on the sidelines, worrying about how stocks would perform in a rising rate environment (as well as a trade war), missed out on some spectacular gains.
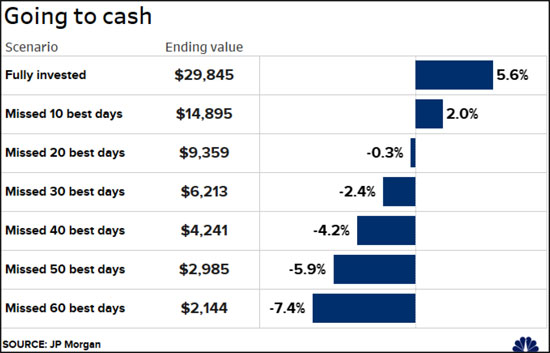
Going to cash may make you feel better temporarily but it could be an expensive proposition. This chart details how $10,000 invested in the S&P 500 would have performed from 1999-2018 if you missed the top performing days. While it is highly unlikely that someone would have such unfortunate timing, it demonstrates the important principal of not trying to time the market.
The same uncertainty surrounds stocks in 2020 and being in an election year only adds political volatility to the usual economic and policy variables. Will markets fall, at least temporarily, if Bernie Sanders or Elizabeth Warren appears likely to win the Democratic presidential nod? Nobody knows. Remember the infamous October 21, 2016,Politico article that began: “Wall Street is set up for a major crash if Donald Trump shocks the world on Election Day and wins the White House”? When those words were written, the S&P 500 was trading at about 2140. Now it stands above 3290.
Speaking of elections, presidential election years have historically produced solid stock market returns as the executive branch tries everything possible to retain the White House for its party. In the 29 U.S. presidential elections since the turn of the 20th century, the incumbent party has triumphed 17 times (bringing an average DJIA gain of 1.5% for the initial 5 months following). When the party in power was ousted, the DJIA declined an average of 4% over the ensuing 5 months, according to theStock Trader’s Almanac.
Since 1896, stock market losses of more than 5% have been seen only six times during presidential election years (with the incumbent party losing power in five of those elections). Stock market returns have been particularly strong when a president is running for reelection. Since 1900, the DJIA has gained 8.9%, on average, in election years when a sitting president is at the top of the ticket (versus only a 5.1% gain when both parties field a new candidate). But going long stocks in a presidential election year is not a formula for minting money: in 2000 (the bursting of the Internet bubble) and 2008 (the financial crisis), for example, the stock market suffered significant losses even during election years.
So let’s put last year’s advance into perspective. Yes, the market’s gain in 2019 was well above average—but the year before, the market had a negative return. As a result, the S&P 500’s returns over the past two years have not been materially higher, in aggregate, than its historical rate of return.
A banner year for stocks doesn’t necessarily mean that the market is “borrowing returns” from the following year, a fact that has been underscored by research from Bespoke Investment Group. In years when the market has come off an annual gain of at least 20%, the S&P 500 has risen by an average of 6.58% the following
year. Although this figure is slightly below the average return of 7.59% for all other years since 1928, a rise has been more likely in the year following a rise of at least 20% than it has in other years.
—Sources: Wall Street Journal Editorial Board, December 31, 2019; Boyar Research.
If you have any questions, we’re always available.
| Best regards, |
| |
| Mark A. Boyar |
| |
 |
| |
| Jonathan I. Boyar |
| |
 |
| |
2049-NLD-1/28/2020
Competitive Returns (Unaudited)
As you can see from the chart below, our buy and hold philosophy has enabled the Fund to produce after tax returns that pretty much mirror our pre-tax returns. The returns used in the illustration exclude loads, but are inclusive of all fees, and assumes the highest rates when calculating after tax returns.
Average Annual Returns
(Through 12/31/19)
| 1 Year | 5 Year | 10 Year | Since
Inception* |
| At NAV | 19.15% | 6.45% | 10.98% | 6.75% |
| Inclusive of sales charges | 13.17% | 5.37% | 10.41% | 6.49% |
| After taxes on distribution | 12.08% | 4.62% | 9.91% | |
| After taxes on distribution and the sale of shares | 8.43% | 4.10% | 8.55% | |
| S&P 500 TR | 31.49% | 11.70% | 13.56% | 7.05% |
| S&P Composite 1500 Value Index | 31.31% | 9.38% | 12.19% | |
| * (5/5/98) | | | | |
| | | | | |
The Boyar Value Fund has a maximum sales charge of 5.00%. After-tax returns are calculated using the highest historical individual Federal income tax rate and do not reflect the additional impact of state and local taxes. Actual after-tax returns depend on a shareholder’s tax situation and may differ from those shown. After-tax returns are not relevant for shareholders who hold Fund shares in tax-deferred accounts or for shares held by non-taxable entities. The Fund may invest in stocks of several different capitalization levels and it is important to note that historically, small- and mid-cap stocks have experienced greater volatility than stocks of larger, more established companies. Additionally, value-based investments are subject to the risk that the broad market may not recognize their intrinsic value. As portfolio and market conditions change future distributions and yields will
vary, dividends are not guaranteed. Distribution amount may include net investment income, capital gains and or return of capital. Distribution amount is not indicative of Fund performance. Individual performance results will vary and may include the reinvestment of income/dividends and capital gains distributions. Performance figures for periods greater than one year are annualized.
The S&P 500 Total Return Index (“S&P 500 TR”) is an unmanaged capitalization weighted index of 500 stocks designed to measure performance of the broad domestic economy through changes in the aggregate market value of the 500 stocks representing all major industries.
The S&P Composite 1500 Value Index combines three leading indices, the S&P 500®, the S&P MidCap 400®, and the S&P SmallCap 600®, to cover approximately 90% of U.S. market capitalization.
The performance of the indices includes reinvestment of dividends and capital gains, however, it does not include any expenses or a deduction for Federal income taxes. A shareholder cannot invest in an index. This information is provided for comparison purposes only.
Comparisons to indices have limitations because indices have volatility and other material characteristics that may differ from a particular investment. Any indices and other financial benchmarks are provided for illustrative purposes only. Particularly, an Investment Index has results that do not represent actual trading or any material economic and market factors that might have had an impact on the advisor’s decision-making. An investment cannot be made directly in an index. Index performance does not reflect the deduction of any management fees, taxes or expenses.
The total annual operating expense ratio for the Boyar Value Fund as stated in the fee table in the Fund’s prospectus dated May 1, 2019 was 1.80%. [An updated total annual operating expenses figure will appear in the Fund’s next prospectus update.]
^ The performance data quoted represents past performance. Past performance does not guarantee future results, and except where noted as after-tax, does not reflect the deduction of taxes that a shareholder would pay on Fund distributions or the redemption of Fund shares. The investment return and principal value of an investment will fluctuate. Consequently, an investor’s shares, when redeemed, may be worth more or less than their original cost. Returns for periods greater than one year are annualized. Current performance may be lower or higher than the performance data quoted. To obtain performance information current to the most recent month end, please call 1-800-266-5566.
Comparison of the Change in Value of a $10,000 Investment (Unaudited)
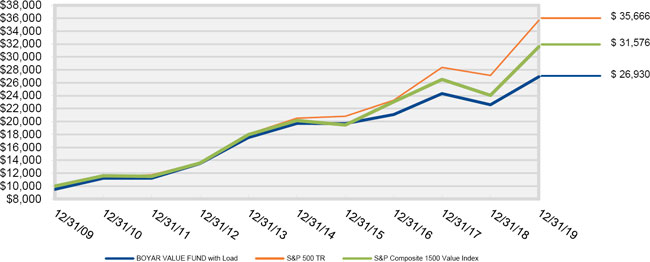
The Chart above represents historical performance of a hypothetical investment of $10,000 in the Boyar Value Fund from inception. The performance of the Fund includes the reinvestment of all dividend and capital gain distributions and has been adjusted for the maximum applicable sales charge of 5.00%. The performance of the Fund as reflected in the chart does not include the effect of taxes incurred on Fund distributions or on the redemption of Fund shares.
Portfolio Diversification By Sector (as of December 31, 2019)
(as a percentage of total net assets) (Unaudited)
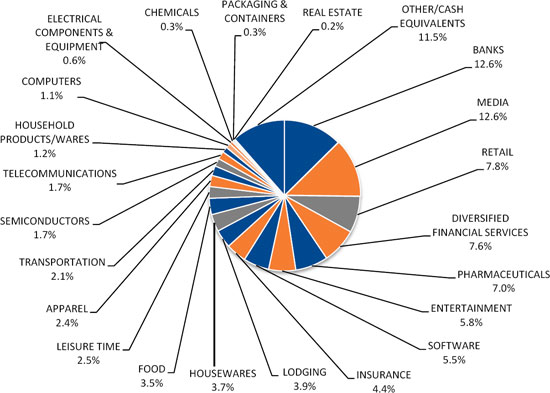
The composition of the Fund’s portfolio is subject to change.
Please refer to the Portfolio of Investments in this annual report for a detailed analysis of the Fund’s holdings.
The mention of specific securities or asset classes is not a recommendation or solicitation for any person to buy, sell or hold any particular security or asset class.
It’s not what you make; it’s what you keep – Taxes are potentially the biggest expense an individual mutual fund investor will experience.
By holding stocks for long periods of time, you postpone paying taxes, which positively impacts long-term returns. Buying and holding stocks for long periods may sound stodgy, but it postpones the payment of capital gains taxes with the added positive effects on the compounding rate. Since profit taking involves transactions, it obliges you to take the IRS in as a partner. With profits not taken, there is a future tax liability, but all the money is still working for its owner. No transactions, no tax. The Boyar Value Fund believes that holding stocks for long periods of time is the best way for an individual investor to create wealth.
This letter seeks to describe the Fund managers’ current view of the market. Statements referring to future events or actions, such as future financial performance, are based on current expectations and projections about future events provided by various sources, including the Fund’s management. These statements are not guarantees of future performance, and actual events and results may differ materially from those discussed herein. The mention of specific securities or asset classes is not a recommendation or solicitation for any person to buy, sell or hold any particular security or asset class.
Activities with respect to Distributor Services are conducted through Ladenburg Thalmann & Co. Inc, (“LTCO”) through June 30, 2019, a member of the NYSE, NYSE AMEX and other principal exchanges. Member FINRA/SIPC.
Past performance is no guarantee of future results. Investing in equities and fixed income involves risk, including the possible loss of principal.The S&P 500 Index is included to allow you to compare your returns against an unmanaged capitalization weighted index of 500 stocks designed to measure performance of the broad domestic economy through changes in the aggregate market value of the 500 stocks representing all major industries. The Russell 2000 is an index measuring the performance of approximately 2,000 small -cap companies in the Russell 3000 Index, which is made up of 3,000 of the biggest U.S. stocks. The NASDAQ Composite is a market-capitalization weighted index of the more than 3,000 common equities listed on the NASDAQ stock exchange. The Dow Jones Industrial Average is a price-weighted average of 30 significant stocks traded on the New York Stock Exchange and the NASDAQ.The S&P Composite 1500 Value Index combines three leading indices, the S&P 500®, the S&P MidCap 400®, and the S&P SmallCap 600®, to cover approximately 90% of U.S. market capitalization.
| BOYAR VALUE FUND, INC. |
| PORTFOLIO OF INVESTMENTS |
| December 31, 2019 |
| Shares | | | | | Fair Value | |
| | | | | COMMON STOCK - 88.5% | | | | |
| | | | | APPAREL - 2.4% | | | | |
| | 24,070 | | | Hanesbrands, Inc. | | $ | 357,440 | |
| | 11,964 | | | Tapestry, Inc. | | | 322,669 | |
| | | | | | | | 680,109 | |
| | | | | BANKS - 12.6% | | | | |
| | 29,221 | | | Bank of America Corp. | | | 1,029,164 | |
| | 12,707 | | | Bank of New York Mellon Corp. | | | 639,543 | |
| | 4,430 | | | Citigroup, Inc. | | | 353,913 | |
| | 10,750 | | | JPMorgan Chase & Co. | | | 1,498,550 | |
| | | | | | | | 3,521,170 | |
| | | | | CHEMICALS - 0.3% | | | | |
| | 3,000 | | | Univar, Inc. * | | | 72,720 | |
| | | | | | | | | |
| | | | | COMPUTERS - 1.1% | | | | |
| | 49,952 | | | Conduent, Inc. * | | | 309,702 | |
| | | | | | | | | |
| | | | | DIVERSIFIED FINANCIAL SERVICES - 7.6% | | | | |
| | 8,500 | | | Ameriprise Financial, Inc. | | | 1,415,930 | |
| | 8,359 | | | Franklin Resources, Inc. | | | 217,167 | |
| | 13,566 | | | Legg Mason, Inc. | | | 487,155 | |
| | | | | | | | 2,120,252 | |
| | | | | ELECTRICAL COMPONENTS & EQUIPMENT - 0.6% | | | | |
| | 3,200 | | | Energizer Holdings, Inc. | | | 160,704 | |
| | | | | | | | | |
| | | | | ENTERTAINMENT - 5.8% | | | | |
| | 13,672 | | | Liberty Media Corp-Liberty Braves * | | | 403,871 | |
| | 4,134 | | | Madison Square Garden Co., Class A * | | | 1,216,181 | |
| | | | | | | | 1,620,052 | |
| | | | | FOOD - 3.5% | | | | |
| | 3,000 | | | Campbell Soup Co. | | | 148,260 | |
| | 9,000 | | | Mondelez International, Inc., Class A | | | 495,720 | |
| | 4,000 | | | Sysco Corp. | | | 342,160 | |
| | | | | | | | 986,140 | |
| | | | | HOUSEHOLD PRODUCTS/WARES - 1.2% | | | | |
| | 2,250 | | | Clorox Co. | | | 345,465 | |
| | | | | | | | | |
See accompanying notes to financial statements.
| BOYAR VALUE FUND, INC. |
| PORTFOLIO OF INVESTMENTS (Continued) |
| December 31, 2019 |
| Shares | | | | | Fair Value | |
| | | | | HOUSEWARES - 3.7% | | | | |
| | 32,489 | | | Newell Brands, Inc. | | $ | 624,439 | |
| | 3,700 | | | Scotts Miracle-Gro Co., Class A | | | 392,866 | |
| | | | | | | | 1,017,305 | |
| | | | | INSURANCE - 4.4% | | | | |
| | 9,000 | | | Travelers Cos, Inc. | | | 1,232,550 | |
| | | | | | | | | |
| | | | | LEISURE TIME - 2.5% | | | | |
| | 10,000 | | | Acushnet Holdings Corp. | | | 325,000 | |
| | 7,500 | | | Carnival Corp. | | | 381,225 | |
| | | | | | | | 706,225 | |
| | | | | LODGING - 3.9% | | | | |
| | 5,008 | | | Marriott International, Inc., Class A | | | 758,361 | |
| | 9,500 | | | MGM Resorts International | | | 316,065 | |
| | | | | | | | 1,074,426 | |
| | | | | MEDIA - 12.6% | | | | |
| | 3,641 | | | AMC Networks, Inc., Class A * | | | 143,820 | |
| | 18,268 | | | Comcast Corp., Special Class A | | | 821,512 | |
| | 23,663 | | | Discovery Communications, Inc., Class C * | | | 721,485 | |
| | 26,201 | | | MSG Networks, Inc., Class A * | | | 455,897 | |
| | 9,500 | | | Walt Disney Co. | | | 1,373,985 | |
| | | | | | | | 3,516,699 | |
| | | | | PACKAGING & CONTAINERS - 0.3% | | | | |
| | 7,215 | | | O-I Glass, Inc. | | | 86,075 | |
| | | | | | | | | |
| | | | | PHARMACEUTICALS - 7.0% | | | | |
| | 7,500 | | | Bristol-Myers Squibb Co. | | | 481,425 | |
| | 6,500 | | | CVS Health Corp. | | | 482,885 | |
| | 2,500 | | | Johnson & Johnson | | | 364,675 | |
| | 16,000 | | | Pfizer, Inc. | | | 626,880 | |
| | | | | | | | 1,955,865 | |
| | | | | REAL ESTATE - 0.2% | | | | |
| | 21,539 | | | Trinity Place Holdings, Inc. * | | | 64,832 | |
| | | | | | | | | |
| | | | | RETAIL - 7.8% | | | | |
| | 6,385 | | | Home Depot, Inc. | | | 1,394,356 | |
| | 3,000 | | | McDonald’s Corp. | | | 592,830 | |
| | 1,425 | | | Target Corp. | | | 182,699 | |
| | | | | | | | 2,169,885 | |
| | | | | | | | | |
See accompanying notes to financial statements.
| BOYAR VALUE FUND, INC. |
| PORTFOLIO OF INVESTMENTS (Continued) |
| December 31, 2019 |
| Shares | | | | | Fair Value | |
| | | | | SEMICONDUCTORS - 1.7% | | | | |
| | 8,000 | | | Intel Corp. | | $ | 478,800 | |
| | | | | | | | | |
| | | | | SOFTWARE - 5.5% | | | | |
| | 9,734 | | | Microsoft Corp. | | | 1,535,052 | |
| | | | | | | | | |
| | | | | TELECOMMUNICATIONS - 1.7% | | | | |
| | 10,000 | | | Cisco Systems, Inc. | | | 479,600 | |
| | | | | | | | | |
| | | | | TRANSPORTATION - 2.1% | | | | |
| | 5,000 | | | United Parcel Service, Inc., Class B | | | 585,300 | |
| | | | | | | | | |
| | | | | TOTAL COMMON STOCK (Cost - $10,923,413) | | | 24,718,928 | |
| | | | | | | | | |
| | | | | SHORT-TERM INVESTMENTS - 11.6% | | | | |
| | 2,431,727 | | | Dreyfus Institutional Preferred Government Money Market Fund - Premier Shares, 1.25% ** | | | 2,431,727 | |
| | 821,497 | | | Milestone Treasury Obligations Portfolio - Institutional Class, 1.38% ** | | | 821,497 | |
| | | | | TOTAL SHORT-TERM INVESTMENTS(Cost - $3,253,224) | | | 3,253,224 | |
| | | | | | | | | |
| | | | | TOTAL INVESTMENTS - 100.1% (Cost - $14,176,637) | | $ | 27,972,152 | |
| | | | | OTHER ASSETS LESS LIABILITIES - NET - (0.1)% | | | (30,090 | ) |
| | | | | NET ASSETS - 100.0% | | $ | 27,942,062 | |
| | | | | | | | | |
| * | Non-income producing security. |
| ** | Money market fund; interest rate reflects seven-day effective yield on December 31, 2019. |
See accompanying notes to financial statements.
| BOYAR VALUE FUND, INC. |
| STATEMENT OF ASSETS AND LIABILITIES |
| December 31, 2019 |
| ASSETS | | | | |
| Investment securities, at cost | | $ | 14,176,637 | |
| Investment securities, at value | | $ | 27,972,152 | |
| Dividends and interest receivable | | | 22,897 | |
| Prepaid expenses and other assets | | | 11,853 | |
| TOTAL ASSETS | | | 28,006,902 | |
| | | | | |
| LIABILITIES | | | | |
| Advisory fees payable | | | 4,343 | |
| Distribution fees (12b-1) payable | | | 16,434 | |
| Payable to service providers | | | 19,726 | |
| Audit fees payable | | | 17,378 | |
| Accrued expenses and other liabilities | | | 6,959 | |
| TOTAL LIABILITIES | | | 64,840 | |
| NET ASSETS | | $ | 27,942,062 | |
| | | | | |
| Net Assets Consist Of: | | | | |
| Paid in capital | | $ | 14,144,412 | |
| Accumulated earnings | | | 13,797,650 | |
| NET ASSETS | | $ | 27,942,062 | |
| | | | | |
| Shares of capital stock outstanding (1,000,000,000 shares authorized, $0.001 par value) | | | 1,038,008 | |
| Net asset value and redemption price per share (Net assets ÷ shares outstanding) (a) | | $ | 26.92 | |
| Maximum offering price per share (maximum sales charge of 5.00%) (b) | | $ | 28.34 | |
| | | | | |
| (a) | For certain purchases of $1 million or more, a 1.00% contingent deferred sales charge may apply to redemptions made within twelve months of purchase. Redemptions made within 60 days of purchase may be assessed a redemption fee of 2.00%. |
| (b) | On investments of $50,000 or more, the offering price is reduced. |
See accompanying notes to financial statements.
| BOYAR VALUE FUND, INC. |
| STATEMENT OF OPERATIONS |
| For the Year Ended December 31, 2019 |
| INVESTMENT INCOME | | | | |
| Dividends | | $ | 517,708 | |
| Interest | | | 61,437 | |
| TOTAL INVESTMENT INCOME | | | 579,145 | |
| | | | | |
| EXPENSES | | | | |
| Investment advisory fees | | | 132,415 | |
| Legal fees | | | 70,663 | |
| Distribution (12b-1) fees | | | 66,207 | |
| Administrative services fees | | | 44,776 | |
| Transfer agent fees | | | 38,573 | |
| Accounting services fees | | | 22,471 | |
| Audit fees | | | 17,039 | |
| Compliance officer fees | | | 16,338 | |
| Directors’ fees and expenses | | | 14,312 | |
| Insurance expense | | | 13,764 | |
| Printing and postage expenses | | | 12,572 | |
| Custodian fees | | | 7,385 | |
| Registration fees | | | 5,952 | |
| Other expenses | | | 5,695 | |
| TOTAL EXPENSES | | | 468,162 | |
| NET INVESTMENT INCOME | | | 110,983 | |
| | | | | |
| REALIZED AND UNREALIZED GAIN ON INVESTMENTS | | | | |
| Net realized gain from security transactions | | | 598,709 | |
| Net change in unrealized appreciation of investments | | | 3,881,483 | |
| NET REALIZED AND UNREALIZED GAIN ON INVESTMENTS | | | 4,480,192 | |
| | | | | |
| NET INCREASE IN NET ASSETS RESULTING FROM OPERATIONS | | $ | 4,591,175 | |
| | | | | |
See accompanying notes to financial statements.
| BOYAR VALUE FUND, INC. |
| STATEMENTS OF CHANGES IN NET ASSETS |
| | | For the Year | | | For the Year | |
| | | Ended | | | Ended | |
| | | December 31, 2019 | | | December 31, 2018 | |
| | | | | | | |
| FROM OPERATIONS | | | | | | | | |
| Net investment income | | $ | 110,983 | | | $ | 79,986 | |
| Net realized gain from security transactions | | | 598,709 | | | | 1,548,494 | |
| Net change in unrealized appreciation (depreciation) on investments | | | 3,881,483 | | | | (3,511,404 | ) |
| Net increase (decrease) in net assets resulting from operations | | | 4,591,175 | | | | (1,882,924 | ) |
| | | | | | | | | |
| DISTRIBUTIONS TO SHAREHOLDERS | | | | | | | | |
| Total distributions paid | | | (1,040,534 | ) | | | (1,210,764 | ) |
| | | | | | | | | |
| FROM CAPITAL SHARE TRANSACTIONS | | | | | | | | |
| Proceeds from shares sold | | | 585,610 | | | | 415,422 | |
| Net asset value of shares issued in reinvestment of distributions to shareholders | | | 1,020,377 | | | | 1,162,344 | |
| Payments for shares redeemed | | | (1,605,407 | ) | | | (1,314,283 | ) |
| Redemption fee proceeds | | | 1,072 | | | | — | |
| Net increase in net assets from capital share transactions | | | 1,652 | | | | 263,483 | |
| | | | | | | | | |
| TOTAL INCREASE (DECREASE) IN NET ASSETS | | | 3,552,293 | | | | (2,830,205 | ) |
| | | | | | | | | |
| NET ASSETS | | | | | | | | |
| Beginning of year | | | 24,389,769 | | | | 27,219,974 | |
| End of year | | $ | 27,942,062 | | | $ | 24,389,769 | |
| | | | | | | | | |
| CAPITAL SHARE ACTIVITY | | | | | | | | |
| Shares Sold | | | 22,379 | | | | 15,383 | |
| Shares Reinvested | | | 38,461 | | | | 47,501 | |
| Shares Redeemed | | | (61,748 | ) | | | (49,565 | ) |
| Net increase (decrease) in shares outstanding | | | (908 | ) | | | 13,319 | |
| | | | | | | | | |
See accompanying notes to financial statements.
| BOYAR VALUE FUND, INC. |
| FINANCIAL HIGHLIGHTS |
| |
| Per Share Data and Ratios for a Share of Capital Stock Outstanding Throughout Each Year Presented |
| | | Year | | | Year | | | Year | | | Year | | | Year | |
| | | Ended | | | Ended | | | Ended | | | Ended | | | Ended | |
| | | December 31, | | | December 31, | | | December 31, | | | December 31, | | | December 31, | |
| | | 2019 | | | 2018 | | | 2017 | | | 2016 | | | 2015 | |
| | | | | | | | | | | | | | | | |
| Net Asset Value, Beginning of Year | | $ | 23.48 | | | $ | 26.54 | | | $ | 23.37 | | | $ | 22.22 | | | $ | 22.86 | |
| Activity from investment operations: | | | | | | | | | | | | | | | | | | | | |
| Net investment income (1) | | | 0.11 | | | | 0.08 | | | | 0.10 | | | | 0.03 | | | | 0.04 | |
| Net realized and unrealized gain (loss) on investments | | | 4.37 | | | | (1.92 | ) | | | 3.52 | | | | 1.54 | | | | (0.06 | ) |
| Total from investment operations | | | 4.48 | | | | (1.84 | ) | | | 3.62 | | | | 1.57 | | | | (0.02 | ) |
| Paid-in-Capital from Redemption Fees (1) | | | 0.00 | (2) | | | — | | | | — | | | | — | | | | 0.00 | (2) |
| Less distributions from: | | | | | | | | | | | | | | | | | | | | |
| Net investment income | | | (0.11 | ) | | | (0.08 | ) | | | (0.11 | ) | | | (0.03 | ) | | | — | |
| Net realized gains | | | (0.93 | ) | | | (1.14 | ) | | | (0.34 | ) | | | (0.39 | ) | | | (0.62 | ) |
| Total distributions | | | (1.04 | ) | | | (1.22 | ) | | | (0.45 | ) | | | (0.42 | ) | | | (0.62 | ) |
| Net Asset Value, End of Year | | $ | 26.92 | | | $ | 23.48 | | | $ | 26.54 | | | $ | 23.37 | | | $ | 22.22 | |
| Total Return (3) | | | 19.15 | % | | | (7.12 | )% | | | 15.48 | % | | | 7.04 | % | | | (0.11 | )% |
| Net Assets, End of Year | | $ | 27,942,062 | | | $ | 24,389,769 | | | $ | 27,219,974 | | | $ | 24,432,589 | | | $ | 23,999,274 | |
| Ratio of gross expenses to average net assets (4) | | | 1.75 | % | | | 2.11 | % | | | 2.22 | % | | | 2.19 | % | | | 2.14 | % |
| Ratio of net expenses to average net assets | | | 1.75 | % | | | 1.75 | % | | | 1.75 | % | | | 1.75 | % | | | 1.75 | % |
| Ratio of net investment income to average net assets | | | 0.42 | % | | | 0.30 | % | | | 0.42 | % | | | 0.13 | % | | | 0.19 | % |
| Portfolio Turnover Rate | | | 9 | % | | | 7 | % | | | 2 | % | | | 4 | % | | | 7 | % |
| | | | | | | | | | | | | | | | | | | | | |
| (1) | Per share amounts calculated using the average shares method. |
| (2) | Amount represents less than $0.005 per share. |
| (3) | Total returns shown are historical in nature and assume changes in share price, reinvestment of dividends and capital gains distributions, if any, and exclude the effect of applicable sales loads/redemption fees. Had the Adviser not waived their fees and/or reimbursed expenses, total returns would have been lower. |
| (4) | Represents the ratio of expenses to average net assets absent fee waivers and/or expense reimbursements by the Adviser. |
See accompanying notes to financial statements.
| BOYAR VALUE FUND, INC. |
| NOTES TO FINANCIAL STATEMENTS |
| December 31, 2019 |
| |
Boyar Value Fund, Inc. (the “Fund”) was incorporated on February 28, 1997 under the laws of the State of Maryland and is registered under the Investment Company Act of 1940, as amended (the “1940 Act”), as an open-end, diversified management investment company. The Fund’s investment objective is long-term capital appreciation.
Under the Fund’s organizational documents, its officers and Directors are indemnified against certain liabilities arising out of the performance of their duties to the Fund. In addition, in the normal course of business, the Fund enters into contracts with its vendors and others that provide for general indemnifications. The Fund’s maximum exposure under these arrangements is unknown as this would involve future claims that may be made against the Fund. However, based on experience, the Fund expects that risk of loss to be remote.
| 2. | SIGNIFICANT ACCOUNTING POLICIES |
The following is a summary of significant accounting policies followed by the Fund in preparation of its financial statements. These policies are in conformity with accounting principles generally accepted in the United States of America (“GAAP”). The Fund is an investment company and accordingly follows the investment company accounting and reporting guidance of the Financial Accounting Standards Board (FASB) Accounting Standard Codification Topic 946 “Financial Services – Investment Companies”.
Securities valuation –Securities listed on an exchange are valued at the last reported sale price at the close of the regular trading session of the primary exchange on the business day the value is being determined, or in the case of securities listed on NASDAQ at the NASDAQ Official Closing Price. In the absence of a sale such securities shall be valued at the mean between the current bid and ask prices on the day of valuation. Short-term debt obligations having 60 days or less remaining until maturity, at time of purchase, may be valued at amortized cost.
The Fund may hold securities, such as private investments, other non-traded securities or temporarily illiquid securities, for which market quotations are not readily available or are determined to be unreliable. These securities will be valued using the “fair value” procedures approved by the Fund’s Board of Directors (the “Board”). The Board has delegated execution of these procedures to a Fair Value team composed of one or more representatives from each of the (i) Trust, (ii) administrator, and (iii) adviser.
Fair Valuation Process –As noted above, the Fair Value team is composed of one or more representatives from each of the (i) Trust, (ii) administrator, and (iii) adviser. The applicable investments are valued collectively via inputs from each of these groups. For example, fair value
| BOYAR VALUE FUND, INC. |
| NOTES TO FINANCIAL STATEMENTS (Continued) |
| December 31, 2019 |
| |
determinations are required for the following securities: (i) securities for which market quotations are insufficient or not readily available on a particular business day (including securities for which there is a short and temporary lapse in the provision of a price by the regular pricing source), (ii) securities for which, in the judgment of the adviser, the prices or values available do not represent the fair value of the instrument. Factors which may cause the adviser to make such a judgment include, but are not limited to, the following: only a bid price or an ask price is available; the spread between bid and asked prices is substantial; the frequency of sales; the thinness of the market; the size of reported trades; and actions of the securities markets, such as the suspension or limitation of trading; (iii) securities determined to be illiquid; (iv) securities with respect to which an event that will affect the value thereof has occurred (a “significant event”) since the closing prices were established on the principal exchange on which they are traded, but prior to the Fund’s calculation of its net asset value.
The Fund utilizes various methods to measure the fair value of all of its investments on a recurring basis. GAAP establishes a hierarchy that prioritizes inputs to valuation methods. The three levels of input are:
Level 1 – Unadjusted quoted prices in active markets for identical assets and liabilities that the Fund has the ability to access.
Level 2 – Observable inputs other than quoted prices included in Level 1 that are observable for the asset or liability, either directly or indirectly. These inputs may include quoted prices for the identical instrument in an inactive market, prices for similar instruments, interest rates, prepayment speeds, credit risk, yield curves, default rates and similar data.
Level 3 – Unobservable inputs for the asset or liability, to the extent relevant observable inputs are not available, representing the Fund’s own assumptions about the assumptions a market participant would use in valuing the asset or liability, and based on the best information available.
The availability of observable inputs can vary from security to security and is affected by a wide variety of factors, including, for example, the type of security, whether the security is new and not yet established in the marketplace, the liquidity of markets, and other characteristics particular to the security. To the extent that valuation is based on models or inputs that are less observable or unobservable in the market, the determination of fair value requires more judgment. Accordingly, the degree of judgment exercised in determining fair value is greatest for instruments categorized in Level 3.
The inputs used to measure fair value may fall into different levels of the fair value hierarchy. In such cases, for disclosure purposes, the level in the fair value hierarchy within which the fair value measurement falls in its entirety, is determined based on the lowest level input that is significant to the fair value measurement in its entirety.
| BOYAR VALUE FUND, INC. |
| NOTES TO FINANCIAL STATEMENTS (Continued) |
| December 31, 2019 |
| |
The inputs or methodology used for valuing securities are not necessarily an indication of the risk associated with investing in those securities. The following table summarizes the inputs used as of December 31, 2019 for the Fund’s investments measured at fair value:
| Assets* | | Level 1 | | | Level 2 | | | Level 3 | | | Total | |
| Common Stock | | $ | 24,718,928 | | | $ | — | | | $ | — | | | $ | 24,718,928 | |
| Short-Term Investments | | | 3,253,224 | | | | — | | | | — | | | | 3,253,224 | |
| Total | | $ | 27,972,152 | | | $ | — | | | $ | — | | | $ | 27,972,152 | |
The Fund did not hold any Level 3 securities during the year.
| * | Refer to the Portfolio of Investments for security classifications. |
Security Transactions and Related Income –Security transactions are accounted for on trade date. Interest income is recognized on an accrual basis. Discounts are accreted and premiums are amortized on securities purchased over the lives of the respective securities. Dividend income is recorded on the ex-dividend date. Realized gains or losses from sales of securities are determined by comparing the identified cost of the security lot sold with the net sales proceeds.
Dividends and Distributions to Shareholders –Dividends from net investment income, if any, are declared and paid annually. Distributable net realized capital gains, if any, are declared and distributed annually. Dividends and distributions paid and distributed to shareholders are recorded on ex-dividend date.
Dividends from net investment income and distributions from net realized gains are determined in accordance with Federal income tax regulations, which may differ from GAAP. These “book/tax” differences are considered either temporary (i.e., deferred losses, capital loss carry forwards) or permanent in nature. To the extent these differences are permanent in nature, such amounts are reclassified within the composition of net assets based on their Federal tax-basis treatment; temporary differences do not require reclassification.
Federal Income Taxes –The Fund intends to continue to comply with the requirements of the Internal Revenue Code applicable to regulated investment companies and to distribute all of its taxable income to its shareholders. Therefore, no provision for Federal income tax is required. The Fund will recognize the tax benefits of uncertain tax positions only where the position is “more likely than not” to be sustained assuming examination by tax authorities. Management has analyzed the Fund’s tax positions and has concluded that no liability for unrecognized tax benefits should be recorded related to uncertain tax positions taken on returns filed for open tax years ended December 31, 2016 to December 31, 2018, or expected to be taken in the Fund’s December 31, 2019 year-end tax returns.
The Fund identifies its major tax jurisdictions as U.S. Federal, Maryland and foreign jurisdictions where the Fund makes significant investments. The Fund is not aware of any tax positions for which it is
| BOYAR VALUE FUND, INC. |
| NOTES TO FINANCIAL STATEMENTS (Continued) |
| December 31, 2019 |
| |
reasonably possible that the total amounts of unrecognized tax benefits will change materially in the next twelve months.
Use of Estimates –The preparation of financial statements in accordance with GAAP requires management to make estimates and assumptions that affect the reported amounts of assets and liabilities and disclosure of contingent assets and liabilities at the date of the financial statements and the reported amounts of income and expenses for the reporting period. Actual results could differ from those estimates.
| 3. | INVESTMENT TRANSACTIONS |
For the year ended December 31, 2019, cost of purchases and proceeds from sales of portfolio securities, other than short-term investments, amounted to $2,084,557 and $2,800,148, respectively.
| 4. | AGGREGATE UNREALIZED APPRECIATION AND DEPRECIATION |
At December 31, 2019, the tax cost of investments and unrealized appreciation (depreciation) are as follows:
| | | | | | Gross Unrealized | | | Gross Unrealized | | | Net Unrealized | |
| Fund | | Tax Cost | | | Appreciation | | | Depreciation | | | Appreciation | |
| Boyar Value Fund | | $ | 14,176,637 | | | $ | 14,175,294 | | | $ | (379,779 | ) | | $ | 13,795,515 | |
| | | | | | | | | | | | | | | | | |
| 5. | INVESTMENT ADVISORY AGREEMENT AND TRANSACTIONS WITH SERVICE PROVIDERS |
Boyar Asset Management, Inc. (the “Adviser”) provides continuous advisory services to the Fund and Northern Lights Distributors, LLC (the “Distributor”) acts as distributor of the Fund’s shares. Prior to July 1, 2019, Ladenburg Thalmann & Co., Inc. was the distributor.
Pursuant to an Investment Advisory Agreement among the Adviser and the Fund, the Adviser agrees to furnish continuous investment advisory services to the Fund. For these services, the Fund pays the Adviser an investment advisory fee, which is computed and accrued daily and paid monthly, at an annual rate of 0.50% of the Fund’s average daily net assets.
Pursuant to a written contract, the Adviser has agreed to waive a portion of its advisory fees and the to reimburse certain expenses of the Fund (excluding interest, taxes, brokerage commissions, other expenditures which are capitalized in accordance with generally accepted accounting principles, Underlying or Acquired Fund Fees and Expenses, and other extraordinary expenses not incurred in the
| BOYAR VALUE FUND, INC. |
| NOTES TO FINANCIAL STATEMENTS (Continued) |
| December 31, 2019 |
| |
ordinary course of the Fund’s business) to the extent necessary to limit the Fund’s total annual operating expenses (subject to the same exclusions) to 1.75% of the Fund’s average daily net assets (the “expense limitation”). The Adviser is permitted to subsequently recover reimbursed expenses and/or waived fees (within 2 years after the fiscal year end in which the waiver/reimbursement occurred) from the Fund to the extent that the Fund’s expense ratio is less than the expense limitation. The Adviser has agreed to maintain this expense limitation through at least April 30, 2020. For the year ended December 31, 2019, the Adviser did not waive any fees.
As of December 31, 2019, the Adviser has the following amounts of waived/reimbursed expenses that may be recovered:
| Amount | | | Expiration Date |
| $ | 48,198 | | | December 31, 2020 |
| | | | | |
The Fund has adopted a Shareholder Servicing and Distribution Plan (the “Plan”) pursuant to Rule 12b-1 under the 1940 Act. The Plan provides that a monthly service fee is calculated by the Fund at an annual rate of 0.25% of its average daily net assets and is paid to the Distributor, to provide compensation for ongoing services and/or maintenance of the Fund’s shareholder accounts, not otherwise required to be provided by the Adviser. For the year ended December 31, 2019, the Distributor did not receive any underwriting commissions.
Gemini Fund Services, LLC (“GFS”)
GFS, an affiliate of the Distributor, provides administration, fund accounting, and transfer agent services to the Trust. Pursuant to a separate servicing agreement with GFS, the Fund pays GFS customary fees for providing administration, fund accounting and transfer agency services to the Fund. Certain Directors and officers of the Trust are also officers of the Adviser or GFS, and are not paid any fees directly by the Fund for serving in such capacities.
In addition, certain affiliates of GFS provide services to the Fund as follows:
Northern Lights Compliance Services, LLC (“NLCS”)
NLCS, an affiliate of GFS and the Distributor, provides a Chief Compliance Officer to the Fund, as well as related compliance services, pursuant to a consulting agreement between NLCS and the Fund. Under the terms of such agreement, NLCS receives customary fees from the Fund.
Blu Giant, LLC (“Blu Giant”)
Blu Giant, an affiliate of GFS and the Distributor, provides EDGAR conversion and filing services as well as print management services for the Fund on an ad-hoc basis. For the provision of these services, Blu Giant receives customary fees from the Fund.
| BOYAR VALUE FUND, INC. |
| NOTES TO FINANCIAL STATEMENTS (Continued) |
| December 31, 2019 |
| |
Custody Administration
Pursuant to the terms of the Fund’s Custody Agreement with Bank of New York Mellon (the “Custody Agreement”), the Fund pays an asset-based custody fee in decreasing amounts as Fund assets reach certain breakpoints. The Fund also pays certain transaction fees and out-of-pocket expenses pursuant to the Custody Agreement. GFS receives a portion of these fees for performing certain custody administration services. GFS’s share of such fees collected for the year ended December 31, 2019 was $7,679. The Custodian fees listed in the Statement of Operations include the fees paid to GFS as Custody Administrator.
Directors
The Fund pays each Director an annual fee of $3,000 and $500 for each meeting attended. Expenses incurred in connection with attendance at board meetings may be reimbursed. No employee of the Adviser, GFS or any of their respective affiliates will receive any compensation from the Fund for acting as either an officer or Director. None of the executive officers receive any compensation from the Fund.
Effective February 1, 2019, NorthStar Financial Services Group, LLC, the parent company of GFS and its affiliated companies including NLD, NLCS and Blu Giant (collectively, the “Gemini Companies”), sold its interest in the Gemini Companies to a third party private equity firm that contemporaneously acquired Ultimus Fund Solutions, LLC (an independent mutual fund administration firm) and its affiliates (collectively, the “Ultimus Companies”). As a result of these separate transactions, the Gemini Companies and the Ultimus Companies are now indirectly owned through a common parent entity, The Ultimus Group, LLC.
The beneficial ownership, either directly or indirectly, of more than 25% of the voting securities of a Fund creates presumption of control of the Fund, under Section 2(a)(9) of the 1940 Act. As of December 31, 2019, Vector Group Ltd. held approximately 35.8% while National Financial Services LLC held 46.2% of the voting securities of the Boyar Value Fund.
The Fund may assess a short-term redemption fee of 2.00% of the total redemption amount if a shareholder sells their shares after holding them for less than 60 days. The redemption fee is paid directly to the Fund. This fee does not apply to shares acquired through reinvestment of dividends and other distributions. For certain purchases of $1 million or more the Fund may also assess a contingent deferred sales charge of 1.00% to redemptions made within twelve months of purchase. For the year ended December 31, 2019, the Fund had $1,072 in redemption fees.
| BOYAR VALUE FUND, INC. |
| NOTES TO FINANCIAL STATEMENTS (Continued) |
| December 31, 2019 |
| |
| 8. | DISTRIBUTIONS TO SHAREHOLDERS AND TAX COMPONENTS OF CAPITAL |
The tax character of fund distributions paid for the year ended December 31, 2019 and December 31, 2018 was as follows:
| | | Fiscal Year Ended | | | Fiscal Year Ended | |
| | | December 31, 2019 | | | December 31, 2018 | |
| Ordinary Income | | $ | 112,139 | | | $ | 78,363 | |
| Long-Term Capital Gain | | | 928,395 | | | | 1,132,401 | |
| | | $ | 1,040,534 | | | $ | 1,210,764 | |
| | | | | | | | | |
As of December 31, 2019, the components of accumulated earnings/(deficit) on a tax basis were as follows:
| Undistributed | | | Undistributed | | | Unrealized | | | Total | |
| Ordinary | | | Long-Term | | | Appreciation/ | | | Accumulated | |
| Income | | | Gains | | | (Depreciation) | | | Earnings/(Deficits) | |
| $ | 467 | | | $ | 1,668 | | | $ | 13,795,515 | | | $ | 13,797,650 | |
| | | | | | | | | | | | | | | |
| 9. | NEW ACCOUNTING PRONOUNCEMENT |
In August 2018, the FASB issued ASU No. 2018-13, which changed certain fair value measurement disclosure requirements. The new ASU, in addition to other modifications and additions, removes the requirement to disclose the amount and reasons for transfers between Level 1 and Level 2 of the fair value hierarchy, and the policy for the timing of transfers between levels. For investment companies, the amendments are effective for financial statements issued for fiscal years beginning after December 15, 2019, and interim periods within those fiscal years. Early adoption is allowed and the Fund has early adopted this amendment.
Subsequent events after the date of the Statement of Assets and Liabilities have been evaluated through the date the financial statements were issued. Management has determined that no events or transactions occurred requiring adjustment or disclosure in the financial statements.

REPORT OF INDEPENDENT REGISTERED PUBLIC ACCOUNTING FIRM
To the Board of Directors and the Shareholders
of Boyar Value Fund, Inc.
Opinion on the Financial Statements
We have audited the accompanying statement of assets and liabilities of Boyar Value Fund, Inc. (the“Fund”), including the portfolio of investments, as of December 31, 2019, and the related statement of operations for the year then ended, the statements of changes in net assets for each of the years in the two-year period then ended and the financial highlights for each of the years in the five- year period then ended, and the related notes (collectively referred to as the“financial statements”). In our opinion, the financial statements present fairly, in all material respects, the financial position of the Fund as of December 31, 2019, and the results of its operations for the year then ended, the changes in its net assets for each of the years in the two-year period then ended and its financial highlights for each of the years in the five-year period then ended, in conformity with accounting principles generally accepted in the United States of America.
Basis for Opinion
These financial statements are the responsibility of the Fund’s management. Our responsibility is to express an opinion on the Fund’s financial statements based on our audits. We are a public accounting firm registered with the Public Company Accounting Oversight Board (United States) (“PCAOB”) and are required to be independent with respect to the Fund in accordance with the U.S. federal securities law and the applicable rules and regulations of the Securities and Exchange Commission and the PCAOB.
We conducted our audits in accordance with the standards of the PCAOB. Those standards require that we plan and perform the audits to obtain reasonable assurance about whether the financial statements are free of material misstatement, whether due to error or fraud. The Fund is not required to have, nor were we engaged to perform, an audit of its internal control over financial reporting. As part of our audits we are required to obtain an understanding of internal control over financial reporting but not for the purpose of expressing an opinion on the effectiveness of the Fund’s internal control over financial reporting. Accordingly, we express no such opinion.
Our audits included performing procedures to assess the risk of material misstatement of the financial statements, whether due to error or fraud, and performing procedures that respond to those risks. Such procedures included examining, on a test basis, evidence regarding the amounts and disclosures in the financial statements. Our procedures included confirmation of securities owned as of December 31, 2019 by correspondence with the custodian. Our audits also included evaluating the accounting principles used and significant estimates made by management, as well as evaluating the overall presentation of the financial statements. We believe that our audits provide a reasonable basis for our opinion.

BBD, LLP
We have served as the auditor of the Boyar Value Fund, Inc. since 2009.
Philadelphia, Pennsylvania
March 2, 2020
| BOYAR VALUE FUND, INC. |
| EXPENSE EXAMPLES (Unaudited) |
| December 31, 2019 |
| |
As a shareholder of the Boyar Value Fund, you incur two types of costs: (1) transaction costs, including sales charges (loads) on purchases and redemption fees; (2) ongoing costs, including management fees and distribution fees; and other Fund expenses. This example is intended to help you understand your ongoing costs (in dollars) of investing in the Boyar Value Fund and to compare these costs with the ongoing costs of investing in other mutual funds.
The example is based on an investment of $1,000 invested at the beginning of the period and held for the entire period from July 1, 2019 through December 31, 2019.
Actual Expenses
The “Actual” expenses line in the table below provides information about actual account values and actual expenses. You may use the information below, together with the amount you invested, to estimate the expenses that you paid over the period. Simply divide your account value by $1,000 (for example, an $8,600 account value divided by $1,000 = 8.6), then multiply the result by the number in the table under the heading entitled “Expenses Paid During Period” to estimate the expenses you paid on your account during this period.
Hypothetical Example for Comparison Purposes
The “Hypothetical” line in the table below provides information about hypothetical account values and hypothetical expenses based on the Boyar Value Fund’s actual expense ratio and an assumed rate of return of 5% per year before expenses, which is not the Fund’s actual return. The hypothetical account values and expenses may not be used to estimate the actual ending account balances or expenses you paid for the period. You may use this information to compare this 5% hypothetical example with the 5% hypothetical examples that appear in the shareholder reports of other funds.
Please note that the expenses shown in the table are meant to highlight your ongoing costs only and do not reflect any transactional costs, such as sales charges (loads), or redemption fees. Therefore, the table is useful in comparing ongoing costs only, and will not help you determine the relative total costs of owning different funds. In addition, if these transactional costs were included, your costs would have been higher.
| | Beginning | Ending | Expenses Paid | Expense Ratio |
| | Account Value | Account Value | During Period* | During Period ** |
| | 7/1/19 | 12/31/19 | 7/1/19 – 12/31/19 | 7/1/19 – 12/31/19 |
| Actual | $1,000.00 | $1,057.70 | $9.08 | 1.75% |
| Hypothetical | | | | |
| (5% return before expenses) | $1,000.00 | $1,016.38 | $8.89 | 1.75% |
| | | | | |
| * | Expenses are equal to the average account value times the Fund’s annualized expense ratio multiplied by the number of days in the most recent fiscal half-year [184] divided by the number of days in the fiscal year [365]. |
| BOYAR VALUE FUND, INC. |
| SUPPLEMENTAL INFORMATION (Unaudited) |
| December 31, 2019 |
| |
FACTORS CONSIDERED BY BOARD IN APPROVING THE CONTINUANCE OF THE ADVISORY AGREEMENT
The Investment Company Act of 1940 (the “1940 Act”) requires the Board of Directors, including a majority of Directors who are not “interested persons” of The Boyar Value Fund, Inc. (the “Fund”), as that term is defined in the 1940 Act (the “Independent Directors”), to annually consider the continuance of the Fund’s investment advisory agreement with its investment adviser, Boyar Asset Management, Inc. (the “Adviser”), (the “Agreement”).
At a Board meeting held in-person on June 4, 2019 the Fund’s Board of Directors, including all the Independent Directors, approved the continuation of the Agreement. As required by the 1940 Act, the Board requested and the Adviser provided such information as the Board deemed to be reasonably necessary to evaluate the terms of the Agreement. The Independent Directors were informed that, in selecting the Adviser and approving the continuance of the Agreement, they are authorized to engage such experts as they consider appropriate, including counsel to the Independent Directors.
The Independent Directors, both prior to the meeting and other meetings held during the current year, received materials relating to the Adviser’s investment services under the Agreement. These materials included information on (i) the investment performance of the Fund over various periods of time compared to the performance of two peer groups of mutual funds, the first of which consisted of the Fund and other large-cap value funds and the second of which consisted of the Fund and other large-cap blend funds (the “Performance Universes”), as classified by Morningstar and objectively selected by the Adviser as comparable to the Fund based upon criteria previously specified by the Independent Directors and used in prior years, and to the Fund’s benchmark index; (ii) sales and redemption data with respect to the Fund; (iii) the general investment outlook in the markets in which the Fund invests; (iv) arrangements with respect to the distribution of the Fund’s shares; and (v) the overall nature, quality and extent of services provided by the Adviser.
As part of the review of the continuance of the Agreement, the Board requested, and the Adviser provided, additional information in order to evaluate the quality of their services and the reasonableness of their fees under the Agreement. In a separate executive session, the Independent Directors reviewed information, which included data comparing: (i) the Fund’s management fee and advisory fee (individually and together), 12b-1 fees, and other non-management expenses, to those incurred by the Performance Universes; (ii) the Fund’s average expense ratio to those of its Performance Universes (both before and after waivers); (iii) the Fund’s investment performance over various time periods to the mean performance of the Performance Universes and the Fund’s benchmark index; (iv) the Adviser’s financial results and condition, including an oral discussion of the Adviser’s profitability from the services that have been performed for the Fund; (v) the Adviser’s current investment management staffing; and (vi) the Fund’s potential for achieving economies of scale. In support of its review of the statistical information, the Board was provided with a description of the objective non-performance-based methodology used by the Adviser to determine the Performance Universes to prepare its information and the rationale for including both Performance Universes, which was consistent with that used in previous years.
The Board considered several matters in connection with its renewal of the Agreement including investment performance; personnel and methods; fees and expenses; nature and quality of other services; other benefits; and economies of scale. However, the Board did not identify any single factor as all-important or controlling, and this summary does not detail all the matters that were considered. The Independent Directors also met in executive session to deliberate in their considerations of the Agreement.
Investment Performance. First, the Board reviewed the Fund’s overall investment performance as compared to its Performance Universes and the Fund’s benchmark index. The Board noted that the Fund outperformed the mean performance of the Large Value Performance Universe over the two-, five- and ten-year periods ended March 31, 2019; underperformed the mean performance of the Large Blend Performance Universe
| BOYAR VALUE FUND, INC. |
| SUPPLEMENTAL INFORMATION (Unaudited) (Continued) |
| December 31, 2019 |
| |
and the Fund’s benchmark index over the year-to-date, one- , two-, three-, and five-year periods; and outperformed the mean of the Large Blend Performance Universe for the ten-year period ended March 31, 2019. In light of the Fund’s performance, and given the Adviser’s long-term strategy and that the Fund’s performance is negatively impacted by its expense ratio, the Board concluded that the Fund’s performance was satisfactory.
Personnel and Methods. The Board next reviewed the background of Mr. Jonathan Boyar, a co-portfolio manager, and Mr. Mark Boyar, the co-portfolio manager who has been responsible for the daily management of the Fund’s portfolio since the Fund’s inception, achieving the Fund’s investment objective and adhering to the Fund’s investment strategy, in each case until the addition of Mr. Jonathan Boyar as a co-portfolio manager in 2018. The Independent Directors also engaged in discussions with Messrs. Mark Boyar and Jonathan Boyar and considered the Adviser’s staff responsible for assisting the co-portfolio managers in the overall functioning of the Adviser and based on the Independent Directors’ review, the Board concluded that the Fund’s management team and the Adviser’s overall resources were adequate and that the Adviser in particular had investment management capabilities and personnel essential to performing its duties under the Agreement. The Board considered the favorable history, reputation, continuity, qualifications and background of the Adviser, as well as the qualifications of its personnel. The Board concluded that the personnel and methods were satisfactory.
Fees and Expenses. The Board then considered the Adviser’s fees under the Agreement relative to the management fees charged by the Fund’s Performance Universes. The Board noted that the Fund had a higher advisory fee rate than the mean advisory fee rate of its Performance Universes, and that the Fund has a lower gross expense ratio but higher net expense ratio than those of its Performance Universes. The Board also noted and viewed favorably that the Adviser typically charges its other clients an advisory fee at a rate higher than the Fund’s gross advisory fee rate and significantly higher than the net advisory fee rate that the Adviser receives from the Fund after giving effect to the fee waiver. The Board also viewed favorably that the Adviser has since the Fund’s inception voluntarily agreed to waive all or portion of their fees and to reimburse the Fund’s expenses in order to keep the Fund’s net total operating expenses (excluding extraordinary expenses and taxes) at 1.75% of the Fund’s average daily net assets. The Board noted that, after giving effect to the above described expense limitation, the Adviser received a relatively modest dollar amount of advisory fees from the Fund for the 2018 calendar year. Based on these factors, the Board determined that the Fund’s advisory fee rates under the Agreement do not constitute fees that are so disproportionately large as to bear no reasonable relationship to the services rendered and that could not have been the product of arm’s-length bargaining, and concluded that the advisory fee rate under the Agreement are fair and reasonable.
Nature and Quality of Other Services; Profitability. The Board next considered the nature, quality, cost and extent of other services provided by the Adviser. At meetings held the previous year and this year, the Board reviewed the effectiveness of the Adviser’s and the Fund’s overall compliance programs. Based on this review, the Board concluded that the nature, quality, cost and extent of such other services provided by the Adviser was satisfactory, reliable and beneficial to the Fund’s shareholders. The Board was informed by the Adviser that given the amount of fees received from the Fund and the current fee waiver to keep the Fund’s expense ratio at 1.75%, the Adviser did not believe they made a profit under the Agreement in the prior year.
Other Benefits. The Board also considered the character and amount of other direct and incidental benefits received by the Adviser and its affiliates from their association with the Fund. The Board concluded that potential “fall-out” benefits that they may receive, such as greater name recognition, appear to be reasonable, and may in some cases benefit the Fund.
Economies of Scale. The Board noted that, given the current and anticipated size of the Fund, any perceived and potential economies of scale were not yet a relevant consideration for the Fund and the addition of break points was determined not to be necessary at this time.
| BOYAR VALUE FUND, INC. |
| SUPPLEMENTAL INFORMATION (Unaudited) (Continued) |
| December 31, 2019 |
| |
Fees and Services Provided for Other Comparable Funds/Accounts Managed by the Adviser and its Affiliates. In addition to comparing the Fund’s combined advisory and management fee rate to unaffiliated mutual funds included in the Fund’s Performance Universes, the Board was informed by the Adviser that it does not manage any other registered investment companies, although it does manage an unregistered investment company that has a different fee structure that includes a performance allocation. As noted above, the Adviser also manages separate accounts that on average have a higher investment advisory fee rate than the contractual advisory fee rate with the Fund.
Conclusion. Based on the Board’s deliberations and its evaluation of the information described above, the Board, including the Independent Directors, concluded that: (a) it was appropriate to continue to retain the Adviser; (b) the terms of the Agreement (including the fees thereunder) are fair and reasonable; and (c) the Fund’s Agreement should continue for a one-year period.
| BOYAR VALUE FUND, INC. |
| SUPPLEMENTAL INFORMATION (Unaudited) |
| December 31, 2019 |
| |
Directors and Officers
Name, Contact
Address and Year of
Birth | Position Held
with the Fund | Term of
Office and
Length of
Time
Served(1) | Principal Occupations During
the Last 5 Years | Number of
Portfolios in
Fund Complex
Overseen by
Director | Other Directorships
Held Outside the
Fund Complex |
| INTERESTED DIRECTOR | |
Mark A. Boyar(2)
32 West 39th Street, 9th
Floor New York, NY
10018
Born in 1942 | Chairman | Since Inception | President, Boyar Asset Management, Inc., (June 1983 – present); President, Mark Boyar & Co., Inc., (January 1979 –present); Partner, Boyar G.P. Holdings Ltd., (May 1990 – present); Manager Ebbets Field Association LLC, (April 1998 – present). | 1 | Chairman, Boyar G.P. Holdings Ltd., May 1990 - present; Chairman, N.R.M.B. Management, Inc., February 1988 - present |
| DISINTERESTED DIRECTORS | | | | |
Jay R. Petschek
c/o Corsair Capital
Management, LLC
366 Madison Avenue,
12th Floor New York,
NY 10017
Born in 1958 | Director | Since Inception | Managing Member, Corsair Capital Management, LLC, (June 2002 – present). | 1 | Chairman, Recognition Media, LLC, December 2003 – present; Director, Dab- O -Matic Corp, April 2000 – present. |
Henry A. Alpert
3333 New Hyde Park
Road, Suite 201
New Hyde Park, NY
11042
Born in 1947 | Director | Since Inception | President, Spartan Petroleum Corp., (1974 – present). | 1 | Director, Griffon Corp., February 1995 – present; |
Richard Finkelstein
500 NE Spanish River
Blvd., Suite 108
Boca Raton, FL 33431
Born in 1949 | Director | Since Inception | Principal, Merit Builders, Inc. (2012-Present). | 1 | Trustee, The University of Maryland, July 2006 – present. |
| OFFICERS | | | | |
Sam Singh
80 Arkay Drive
Suite 110, Hauppauge,
NY 11788
Born in 1976 | President | Since 2016 | Vice President, Gemini Fund Services, LLC (since 2015). | N/A | N/A |
Jonathan Boyar
32 West 39th Street, 9th
Floor New York, NY
10018
Born in 1980 | Vice President | Since 2019 | Managing Director, Boyar Value Group (since 2008); Associate, Martin Clearwater & Bell (2006-2008). | 1 | N/A |
Dawn Borelli
80 Arkay Drive,
Suite 110, Hauppauge,
NY 11788
Born in 1972 | Treasurer | Since 2011 | Assistant Vice President, Fund Administration, Gemini Fund Services, LLC (since 2010). | N/A | N/A |
Stephanie Shearer
80 Arkay Drive, Suite
110, Hauppauge, NY
11788
Born in 1979 | Secretary | Since 2012 | Manager, Gemini Fund Services, LLC (since 2018); Senior Paralegal, Gemini Fund Services, LLC (2013 - 2018). | N/A | N/A |
James Ash
17645 Wright Street,
Suite. 200 Omaha,
Nebraska 68130
Born in 1976 | Chief Compliance Officer | Since 2019 | Senior Compliance Officer, Northern Lights Compliance, LLC (since 2019); Senior Vice President, National Sales Gemini Fund Services, LLC (2017-2019); Senior Vice President and Director of Legal Administration, Gemini Fund Services, LLC (2012 - 2017). | N/A | N/A |
| (1) | Each Director is elected to serve in accordance with the Articles of Incorporation and By-Laws of the Fund until his or her successor is duly elected and qualified. |
| (2) | Mr. Boyar is an “interested person” of the Fund as defined in the 1940 Act, because of his relationship with Boyar Asset Management, Inc. |
The Fund’s Statement of Additional Information includes additional information about the Directors and is available free of charge, upon request, by calling toll-free at 1-800-266-5566.
| PRIVACY notice |
| |
| Rev. June 2011 |
| |
| FACTS | WHAT DOES BOYAR VALUE FUND, INC. DO WITH YOUR PERSONAL INFORMATION? |
| | |
| Why? | Financial companies choose how they share your personal information. Federal law gives consumers the right to limit some but not all sharing. Federal law also requires us to tell you how we collect, share, and protect your personal information. Please read this notice carefully to understand what we do. |
| | |
| What? | The types of personal information we collect and share depend on the product or service you have with us. This information can include: ■ Social Security number ■ Purchase History ■ Assets ■ Account Balances ■ Retirement Assets ■ Account Transactions ■ Transaction History ■ Wire Transfer Instructions ■ Checking Account Information When you areno longer our customer, we continue to share your information as described in this notice. |
| | |
| How? | All financial companies need to share customers’ personal information to run their everyday business. In the section below, we list the reasons financial companies can share their customers’ personal information; the reasons Boyar Value Fund, Inc. chooses to share; and whether you can limit this sharing. |
| | | |
| Reasons we can share your personal information | Does Boyar
Value Fund, Inc,
share? | Can you limit this sharing? |
For our everyday business purposes – such as to process your transactions, maintain your account(s), respond to court orders and legal investigations, or report to credit bureaus | Yes | No |
For our marketing purposes – to offer our products and services to you | No | We don’t share |
| For joint marketing with other financial companies | No | We don’t share |
For our affiliates’ everyday business purposes – information about your transactions and experiences | No | We don’t share |
For our affiliates’ everyday business purposes – information about your creditworthiness | No | We don’t share |
| For nonaffiliates to market to you | No | We don’t share |
| Questions? | Call 1-402-493-4603 |
Rev. June 2011
| Who we are |
| Who is providing this notice? | Boyar Value Fund, Inc. |
| What we do |
| How does Boyar Value Fund, Inc. protect my personal information? | To protect your personal information from unauthorized access and use, we use security measures that comply with federal law. These measures include computer safeguards and secured files and buildings. Our service providers are held accountable for adhering to strict policies and procedures to prevent any misuse of your nonpublic personal information. |
| How does Boyar Value Fund, Inc. collect my personal information? | We collect your personal information, for example, when you ■ Open an account ■ Provide account information ■ Give us your contact information ■ Make deposits or withdrawals from your account ■ Make a wire transfer ■ Tell us where to send the money ■ Tells us who receives the money ■ Show your government-issued ID ■ Show your driver’s license We also collect your personal information from other companies. |
| Why can’t I limit all sharing? | Federal law gives you the right to limit only ■ Sharing for affiliates’ everyday business purposes – information about your creditworthiness ■ Affiliates from using your information to market to you ■ Sharing for nonaffiliates to market to you State laws and individual companies may give you additional rights to limit sharing. |
| Definitions |
| Affiliates | Companies related by common ownership or control. They can be financial and nonfinancial companies. ■ Boyar Value Fund, Inc. does not share with our affiliates. |
| Nonaffiliates | Companies not related by common ownership or control. They can be financial and nonfinancial companies
■ Boyar Value Fund, Inc. does not share with nonaffiliates so they can market to you. |
| Joint marketing | A formal agreement between nonaffiliated financial companies that together market financial products or services to you.
■ Boyar Value Fund, Inc. does not jointly market. |
PROXY VOTING POLICY
Information regarding how the Fund voted proxies relating to portfolio securities for the most recent twelve month period ended June 30 as well as a description of the policies and procedures that the Fund uses to determine how to vote proxies is available without charge, upon request, by calling 1-800-266-5566 or by referring to the Securities and Exchange Commission’s (“SEC”) website at http://www.sec.gov.
PORTFOLIO HOLDINGS
The Fund files its complete schedule of portfolio holdings with the SEC for the first and third quarters of each fiscal year on Form N-Q. Form N-Q is available on the SEC’s website at http://www.sec.gov and may be reviewed and copied at the SEC’s Public Reference Room in Washington, DC (1-800-SEC-0330). The information on Form N-Q is available without charge, upon request, by calling 1-800-266-5566.
| INVESTMENT ADVISOR |
| Boyar Asset Management, Inc. |
| 32 West 39th Street, 9th Floor |
| New York, New York 10018 |
| |
| ADMINISTRATOR |
| Gemini Fund Services, LLC |
| 80 Arkay Drive, Suite 110 |
| Hauppauge, New York 11788 |
Item 2. Code of Ethics.
(a) As of the end of the period covered by this report, the registrant has adopted a code of ethics that applies to the registrant's principal executive officer, principal financial officer, principal accounting officer or controller, or persons performing similar functions, regardless of whether these individuals are employed by the registrant or a third party.
(b) For purposes of this item, “code of ethics” means written standards that are reasonably designed to deter wrongdoing and to promote:
| (1) | Honest and ethical conduct, including the ethical handling of actual or apparent conflicts of interest between personal and professional relationships; |
| (2) | Full, fair, accurate, timely, and understandable disclosure in reports and documents that a registrant files with, or submits to, the Commission and in other public communications made by the registrant; |
(3) Compliance with applicable governmental laws, rules, and regulations;
| (4) | The prompt internal reporting of violations of the code to an appropriate person or persons identified in the code; and |
(5) Accountability for adherence to the code.
(c) Amendments: During the period covered by the report, there have not been any amendments to the provisions of the code of ethics.
(d) Waivers: During the period covered by the report, the registrant has not granted any express or implicit waivers from the provisions of the code of ethics.
(e) The Code of Ethics is not posted on Registrant’ website.
(f) A copy of the Code of Ethics is attached as an exhibit.
Item 3. Audit Committee Financial Expert.
(a)(1)ii The board of directors of the fund has determined that the fund does not have an audit committee financial expert serving on its audit committee.
(a)(2) Not applicable.
(a)(3) In this regard, no member of the audit committee was identified as having all of the required technical attributes identified in instruction 2 (b) to item 3 of Form N-CSR to qualify as an “audit committee financial expert,” whether through the type of specialized education or experience required by that instruction. At this time, the board believes the experience provided by each member of the audit committee collectively offers the fund adequate oversight by its audit committee given the fund’s level of financial complexity. The board will from time to time reexamine such belief.
Item 4. Principal Accountant Fees and Services.
2019 - $15,250
2018 - $15,250
2017 - $15,250
2016 - $15,250
2015 - $14,750
2014 - $14,750
2013 - $14,750
2012 - $14,750
2019 - None
2018 - None
2017 - None
2016 - None
2015 - None
2014 - None
2013 - None
2012 - None
2019 - $2,000
2018 - $2,000
2017 - $2,000
2016 - $2,000
2015 - $2,000
2014 - $2,000
2013 – $2,000
2012 – $2,000
Preparation of Federal & State income tax returns, assistance with calculation of required income, capital gain and excise distributions and preparation of Federal excise tax returns.
2019 - None
2018 - None
2017 - None
2016 - None
2015 - None
2014 - None
2013 - None
2012 - None
| (e) | (1)Audit Committee’s Pre-Approval Policies |
The registrant’s Audit Committee is required to pre-approve all audit services and, when appropriate, any non-audit services (including audit-related, tax and all other services) to the registrant. The registrant’s Audit Committee also is required to pre-approve, when appropriate, any non-audit services (including audit-related, tax and all other services) to its adviser, or any entity controlling, controlled by or under common control with the adviser that provides ongoing services to the registrant, to the extent that the services may be determined to have an impact on the operations or financial reporting of the registrant. Services are reviewed on an engagement by engagement basis by the Audit Committee.
| (2) | Percentages of Services Approved by the Audit Committee |
2013 2012 2014 2015 2016 2017 2018 2019
Audit-Related Fees: 0.00% 0.00% 0.00% 0.00% 0.00% 0.00% 0.00% 0.00%
Tax Fees: 0.00% 0.00% 0.00% 0.00% 0.00% 0.00% 0.00% 0.00%
All Other Fees: 0.00% 0.00% 0.00% 0.00% 0.00% 0.00% 0.00% 0.00%
| (f) | During the audit of registrant's financial statements for the most recent fiscal year, less than 50 percent of the hours expended on the principal accountant's engagement were attributed to work performed by persons other than the principal accountant's full-time, permanent employees. |
| (g) | The aggregate non-audit fees billed by the registrant's accountant for services rendered to the registrant, and rendered to the registrant's investment adviser (not including any sub-adviser whose role is primarily portfolio management and is subcontracted with or overseen by another investment adviser), and any entity controlling, controlled by, or under common control with the adviser that provides ongoing services to the registrant: |
2019 - None
2018 - None
2017 - None
2016 - None
2015 - None
2014 - None
2013 - None
2012 - None
(h) The registrant's audit committee has considered whether the provision of non-audit services to the registrant's investment adviser (not including any sub-adviser whose role is primarily portfolio management and is subcontracted with or overseen by another investment adviser), and any entity controlling, controlled by, or under common control with the investment adviser that provides ongoing services to the registrant, that were not pre-approved pursuant to paragraph (c)(7)(ii) of Rule 2-01 of Regulation S-X, is compatible with maintaining the principal accountant's independence.
Item 5. Audit Committee of Listed Companies.Not applicable to open-end investment companies.
Item 6. Schedule of Investments.See Item 1.
Item 7. Disclosure of Proxy Voting Policies and Procedures for Closed-End Funds. Not applicable to open-end investment companies.
Item 8. Portfolio Managers of Closed Management Investment Companies.Not applicable to open-end investment companies.
Item 9. Purchases of Equity Securities by Closed-End Management Investment Company and Affiliated Purchasers.Not applicable to open-end investment companies.
Item 10. Submission of Matters to a Vote of Security Holder.None.
Item 11. Controls and Procedures.
(a) Based on an evaluation of the registrant’s disclosure controls and procedures as of December 31, 2009, the disclosure controls and procedures are reasonably designed to ensure that the information required in filings on Forms N-CSR is recorded, processed, summarized, and reported on a timely basis.
(b) There were no significant changes in the registrant’s internal control over financial reporting that occurred during the registrant’s second fiscal quarter of the period covered by this Form N-CSR that have materially affected, or are reasonably likely to materially affect, the registrant’s internal control over financial reporting.
Item 12. Disclosure of Securities Lending Activities for Closed-End Management Investment Companies. Not applicable
Item 13. Exhibits.
(a)(1) Code of Ethics filed herewith.
(a)(2) Certification(s) required by Section 302 of the Sarbanes-Oxley Act of 2002 (and Item 11(a)(2) of Form N-CSR) are filed herewith.
(a)(3) Not applicable.
(b) Certification(s) required by Section 906 of the Sarbanes-Oxley Act of 2002 (and Item 11(b) of Form N-CSR) are filed herewith.
SIGNATURES
Pursuant to the requirements of the Securities Exchange Act of 1934 and the Investment Company Act of 1940, the registrant has duly caused this report to be signed on its behalf by the undersigned, thereunto duly authorized.
(Registrant) The Boyar Value Fund, Inc.
By (Signature and Title)
* /s/ Sam Singh
Sam Singh, Principal Executive Officer/President
Date 3/9/20
Pursuant to the requirements of the Securities Exchange Act of 1934 and the Investment Company Act of 1940, this report has been signed below by the following persons on behalf of the registrant and in the capacities and on the dates indicated.
By (Signature and Title)
* /s/ Dawn Borelli
Dawn Borelli, Principal Financial Officer/Treasurer
Date 3/9/20
By (Signature and Title)
* /s/ Sam Singh
Sam Singh, Principal Executive Officer/President
Date 3/9/20
* Print the name and title of each signing officer under his or her signature.