UNITED STATES
SECURITIES AND EXCHANGE COMMISSION
WASHINGTON, D.C. 20549
FORM N-CSR
CERTIFIED SHAREHOLDER REPORT OF REGISTERED
MANAGEMENT INVESTMENT COMPANIES
Investment Company Act file number 811-08299
Oppenheimer International Small Company Fund
(Exact name of registrant as specified in charter)
6803 South Tucson Way, Centennial, Colorado 80112-3924
(Address of principal executive offices) (Zip code)
Arthur S. Gabinet
OFI Global Asset Management, Inc.
225 Liberty Street, New York, New York 10281-1008
(Name and address of agent for service)
Registrant’s telephone number, including area code: (303) 768-3200
Date of fiscal year end: August 31
Date of reporting period: 2/27/2015
Item 1. Reports to Stockholders.
Class A Shares
AVERAGE ANNUAL TOTAL RETURNS AT 2/27/15*
| Class A Shares of the Fund | ||||||||||||
| Without Sales Charge | With Sales Charge | MSCI All Country World Ex U.S. Small | ||||||||||
6-Month | 2.32 | % | -3.57 | % | -4.84 | % | ||||||
1-Year | 1.54 | -4.30 | -2.43 | |||||||||
5-Year | 16.56 | 15.19 | 8.36 | |||||||||
10-Year | 12.44 | 11.77 | 6.76 | |||||||||
Performance data quoted represents past performance, which does not guarantee future results. The investment return and principal value of an investment in the Fund will fluctuate so that an investor’s shares, when redeemed, may be worth more or less than their original cost. Fund returns include changes in share price, reinvested distributions, and a 5.75% maximum applicable sales charge except where “without sales charge” is indicated. Current performance may be lower or higher than the performance quoted. Returns do not consider capital gains or income taxes on an individual’s investment. Returns for periods of less than one year are cumulative and not annualized. For performance data current to the most recent month-end, visit oppenheimerfunds.com or call 1.800.CALL OPP (225.5677).
* February 27, 2015, was the last business day of the Fund’s semiannual period. See Note 2 of the accompanying Notes to Financial Statements. Index returns are calculated through February 28, 2015.
2 OPPENHEIMER INTERNATIONAL SMALL COMPANY FUND
The Fund’s Class A shares (without sales charge) produced a return of 2.32% during the reporting period, outperforming the MSCI All Country World Ex U.S. Small Cap Net Index (the “Index”), which returned -4.84%. Our stock selection in information technology and health care was a main driver for the Fund’s outperformance this reporting period. We were also helped by having limited exposure to energy stocks. Financials and consumer discretionary were two sectors that underperformed the Index, as a result of stock selection.
It is important to note that we take a benchmark indifferent approach to managing the Fund. Our investment process is geared towards identifying future leaders and tends to rely heavily on bottom-up fundamental analysis. Geographic and sector weightings are a by-product of stock selection rather than top down decisions.
MARKET OVERVIEW
Outside of the U.S., the positive data points that had emerged in Europe in 2013 and early 2014 largely reversed themselves later in the reporting period and the European Central Bank (the “ECB”) came under even greater pressure to provide a credible plan to boost growth and avoid deflation. In response, the ECB adopted a number of policies designed to stimulate growth. In Japan, which has been mired in economic weakness for years, the Abe administration has adopted even more aggressive economic policies with the Bank of Japan (the “BoJ”) executing a massive quantitative easing (“QE”) program. However, the results have not been particularly impressive, with that economy slipping back into recession in the third quarter of 2014 following the consumption tax increase before coming out of that recession in the fourth quarter. Emerging markets’ economic growth was
mixed, as certain regions like Eastern Europe and the Middle East remained burdened by geopolitical turmoil. Many commodity producing emerging market economies also struggled as prices for most commodities fell. At the end of the reporting period in February, a robust bond-buying program was unveiled by ECB President Mario Draghi, which exceeded market expectations. In addition, positive data from the Eurozone has helped to increase investor confidence and European equities are seeing more inflows.
FUND REVIEW
Top performing holdings for the Fund this reporting period included Ocado Group plc, DBV Technologies SA and NICE Systems Ltd. Ocado is an online grocery retailer in the U.K. The company is evolving from food retail into other areas. It also leverages its expertise in technology and logistics by licensing that
3 OPPENHEIMER INTERNATIONAL SMALL COMPANY FUND
technology to other food retailers globally, allowing them to provide online retail services. These structural growth opportunities have allowed Ocado to perform positively despite a challenging industry backdrop where traditional grocery retailers in the U.K. have struggled with competitive and deflationary pressures. DBV Technologies is a French biotechnology company with a focus on developing drugs for the treatment of allergies. Because food allergies are on the rise, their treatment presents a large market opportunity. One of the critical areas that does not yet have an effective treatment is peanut allergies in children. DBV has developed a treatment that is delivered through a patch that activates the immune system. The company recently announced encouraging clinical results for the Phase II trial of this treatment in children. DBV is also developing treatments for allergies to other products, including milk. NICE Systems, based in Israel, is engaged in software solutions and services that help to analyze and manage transactional data (such as web, telephone and radio) along with multimedia content. NICE has operations in the following market segments: financial crime and compliance solutions; customer interaction solutions and security solutions. We believe NICE is well-positioned to benefit from an increased adoption of advanced business applications and a strong pipeline.
Detractors from performance this reporting period included BM&FBovespa S.A., OPAP SA (Greek Organisation of Football Prognostics), and Askul Corp. BM&FBovespa, based in
Brazil, combines the activities of BOVESPA (Brazilian Stock Exchange) and BM&F (the futures and commodities exchange). It also organizes, develops and provides systems for trading a variety of securities including equities, derivatives, fixed income securities, federal government securities, spot foreign exchange and agricultural commodities. The company has continued to struggle under challenging economic and market conditions. Askul is transitioning from its role as a dominant player in the online office supply market in Japan. It is leveraging its supply chain to expand into the MRO (maintenance, repair and operations) market and a B2C (business to consumer) business. Askul’s B2C business, LOHACO, will offer daily consumable products. The company has been experiencing some growing pains on the back of LOHACO’s expansion and this has impacted the stock’s performance. Market sentiment has shifted from overly enthusiastic to overly pessimistic. We are patient investors and believe that management is making the right investments and profitability will follow as the business gains scale.
STRATEGY & OUTLOOK
While circumstances vary depending on industry, we are generally interested in companies that have meaningful competitive advantages, innovative technology and product offerings, defendable market positions, high quality management teams and the ability to generate returns in excess of their weighted average cost of capital.
4 OPPENHEIMER INTERNATIONAL SMALL COMPANY FUND
We have a long-term investment horizon and are willing to wait for our ideas to play out. We view entry price as a key component of future returns. Therefore, we embrace volatility and seek to take advantage of attractive prices during times of adversity.

5 OPPENHEIMER INTERNATIONAL SMALL COMPANY FUND
TOP TEN COMMON STOCK HOLDINGS
Lonza Group AG | 2.5 | % | ||
Ocado Group plc | 2.3 | |||
Baloise Holding AG | 1.6 | |||
Hoshizaki Electric Co. Ltd. | 1.6 | |||
Tech Mahindra Ltd. | 1.6 | |||
Bank of Ireland | 1.5 | |||
WuXi PharmaTech Cayman, Inc., ADR | 1.5 | |||
MonotaRO Co. Ltd. | 1.4 | |||
Cyient Ltd. | 1.3 | |||
Britvic plc | 1.3 |
Portfolio holdings and allocations are subject to change. Percentages are as of February 27, 2015, and are based on net assets. For more current Fund holdings, please visit oppenheimerfunds.com.
TOP TEN GEOGRAPHICAL HOLDINGS
United Kingdom | 18.4 | % | ||
Japan | 14.9 | |||
United States | 12.5 | |||
Germany | 9.9 | |||
Switzerland | 9.6 | |||
India | 7.2 | |||
France | 5.8 | |||
Ireland | 2.6 | |||
China | 2.2 | |||
Brazil | 2.1 |
Portfolio holdings and allocation are subject to change. Percentages are as of February 27, 2015, and are based on total market value of investments.
REGIONAL ALLOCATION
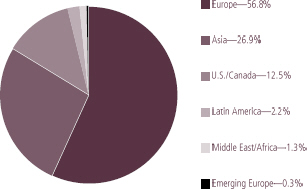
Portfolio holdings and allocations are subject to change. Percentages are as of February 27, 2015, and are based on the total market value of investments.
| *February | 27, 2015, was the last business day of the Fund’s semiannual period. See Note 2 of the accompanying Notes to Financial Statements. |
6 OPPENHEIMER INTERNATIONAL SMALL COMPANY FUND
Share Class Performance
AVERAGE ANNUAL RETURNS WITHOUT SALES CHARGE AS OF 2/27/15
| Inception Date | 6-Month | 1-Year | 5-Year | 10-Year | ||||||||||
Class A (OSMAX) | 11/17/97 | 2.32% | 1.54% | 16.56% | 12.44% | |||||||||
Class B (OSMBX) | 11/17/97 | 1.96% | 0.80% | 15.56% | 11.86% | |||||||||
Class C (OSMCX) | 11/17/97 | 1.96% | 0.81% | 15.69% | 11.57% | |||||||||
Class I (OSCIX) | 12/29/11 | 2.56% | 1.99% | 23.20% | * | N/A | ||||||||
Class R (OSMNX) | 3/1/01 | 2.20% | 1.30% | 16.20% | 12.07% | |||||||||
Class Y (OSMYX) | 9/7/05 | 2.46% | 1.82% | 16.99% | 12.30% * |
AVERAGE ANNUAL RETURNS WITH SALES CHARGE AS OF 2/27/15
| Inception Date | 6-Month | 1-Year | 5-Year | 10-Year | ||||||||||
Class A (OSMAX) | 11/17/97 | -3.57% | -4.30% | 15.19% | 11.77% | |||||||||
Class B (OSMBX) | 11/17/97 | -3.04% | -4.20% | 15.33% | 11.86% | |||||||||
Class C (OSMCX) | 11/17/97 | 0.96% | -0.19% | 15.69% | 11.57% | |||||||||
Class I (OSCIX) | 12/29/11 | 2.56% | 1.99% | 23.20% | * | N/A | ||||||||
Class R (OSMNX) | 3/1/01 | 1.20% | 0.30% | 16.20% | 12.07% | |||||||||
Class Y (OSMYX) | 9/7/05 | 2.46% | 1.82% | 16.99% | 12.30% * |
* Shows performance since inception.
Performance data quoted represents past performance, which does not guarantee future results. The investment return and principal value of an investment in the Fund will fluctuate so that an investor’s shares, when redeemed, may be worth more or less than their original cost. Current performance may be lower or higher than the performance quoted. Returns do not consider capital gains or income taxes on an individual’s investment. For performance data current to the most recent month-end, visit oppenheimerfunds.com or call 1.800.CALL OPP (225.5677). Fund returns include changes in share price, reinvested distributions, and the applicable sales charge: for Class A shares, the current maximum initial sales charge of 5.75%; for Class B shares, the contingent deferred sales charge (“CDSC”) of 5% (1-year) and 2% (5-year); and for Class C shares, the 1% CDSC for the 1-year period. Prior to 7/1/14, Class R shares were named Class N shares. Beginning 7/1/14, new purchases of Class R shares will no longer be subject to a CDSC upon redemption (any CDSC will remain in effect for purchases prior to 7/1/14). There is no sales charge for Class I and Y shares. Because Class B shares convert to Class A shares 72 months after purchase, 10-year returns for Class B shares reflect Class A performance for the period after conversion. Returns for periods of less than one year are cumulative and not annualized.
The Fund’s performance is compared to the performance of the MSCI All Country World Ex U.S. Small Cap Index, which is designed to measure the equity market performance of small capitalization developed and emerging markets, excluding the United States. The Index is unmanaged and cannot be purchased directly by investors. While index comparisons may be useful to provide a benchmark for the Fund’s performance, it must be noted that the Fund’s investments are not limited to the investments comprising the Index. Index performance
7 OPPENHEIMER INTERNATIONAL SMALL COMPANY FUND
includes reinvestment of income, but does not reflect transaction costs, fees, expenses or taxes. Index performance is shown for illustrative purposes only as a benchmark for the Fund’s performance, and does not predict or depict performance of the Fund. The Fund’s performance reflects the effects of the Fund’s business and operating expenses.
The Fund’s investment strategy and focus can change over time. The mention of specific fund holdings does not constitute a recommendation by OppenheimerFunds, Inc. or its affiliates.
Before investing in any of the Oppenheimer funds, investors should carefully consider a fund’s investment objectives, risks, charges and expenses. Fund prospectuses and summary prospectuses contain this and other information about the funds, and may be obtained by asking your financial advisor, visiting oppenheimerfunds.com, or calling 1.800.CALL OPP (225.5677). Read prospectuses and summary prospectuses carefully before investing.
Shares of Oppenheimer funds are not deposits or obligations of any bank, are not guaranteed by any bank, are not insured by the FDIC or any other agency, and involve investment risks, including the possible loss of the principal amount invested.
8 OPPENHEIMER INTERNATIONAL SMALL COMPANY FUND
Fund Expenses. As a shareholder of the Fund, you incur two types of costs: (1) transaction costs, which may include sales charges (loads) on purchase payments, contingent deferred sales charges on redemptions; and (2) ongoing costs, including management fees; distribution and service fees; and other Fund expenses. These examples are intended to help you understand your ongoing costs (in dollars) of investing in the Fund and to compare these costs with the ongoing costs of investing in other mutual funds.
The examples are based on an investment of $1,000.00 invested at the beginning of the period and held for the entire
6-month period ended February 27, 2015.
Actual Expenses. The first section of the table provides information about actual account values and actual expenses. You may use the information in this section for the class of shares you hold, together with the amount you invested, to estimate the expense that you paid over the period. Simply divide your account value by $1,000.00 (for example, an $8,600.00 account value divided by $1,000.00 = 8.60), then multiply the result by the number in the first section under the heading entitled “Expenses Paid During 6 Months Ended February 27, 2015” to estimate the expenses you paid on your account during this period.
Hypothetical Example for Comparison Purposes. The second section of the table provides information about hypothetical account values and hypothetical expenses based on the Fund’s actual expense ratio for each class of shares, and an assumed rate of return of 5% per year for each class before expenses, which is not the Fund’s actual return. The hypothetical account values and expenses may not be used to estimate the actual ending account balance or expenses you paid for the period. You may use this information to compare the ongoing costs of investing in the Fund and other funds. To do so, compare this 5% hypothetical example for the class of shares you hold with the 5% hypothetical examples that appear in the shareholder reports of the other funds.
Please note that the expenses shown in the table are meant to highlight your ongoing costs only and do not reflect any transactional costs, such as front-end or contingent deferred sales charges (loads). Therefore, the “hypothetical” section of the table is useful in comparing ongoing costs only, and will not help you determine the relative total costs of owning different funds. In addition, if these transactional costs were included, your costs would have been higher.
9 OPPENHEIMER INTERNATIONAL SMALL COMPANY FUND
| Actual | Beginning Value | Ending Account Value | Expenses Paid During 6 Months Ended | |||||||||
| Class A | $ | 1,000.00 | $ | 1,023.20 | $ | 5.95 | ||||||
| Class B | 1,000.00 | 1,019.60 | 9.76 | |||||||||
| Class C | 1,000.00 | 1,019.60 | 9.71 | |||||||||
| Class I | 1,000.00 | 1,025.60 | 3.80 | |||||||||
| Class R | 1,000.00 | 1,022.00 | 7.20 | |||||||||
| Class Y | 1,000.00 | 1,024.60 | 4.75 | |||||||||
Hypothetical | ||||||||||||
(5% return before expenses) | ||||||||||||
Class A | 1,000.00 | 1,018.79 | 5.94 | |||||||||
Class B | 1,000.00 | 1,015.04 | 9.74 | |||||||||
Class C | 1,000.00 | 1,015.09 | 9.69 | |||||||||
Class I | 1,000.00 | 1,020.91 | 3.79 | |||||||||
Class R | 1,000.00 | 1,017.56 | 7.19 | |||||||||
Class Y | 1,000.00 | 1,019.97 | 4.74 | |||||||||
Expenses are equal to the Fund’s annualized expense ratio for that class, multiplied by the average account value over the period, multiplied by 180/365 (to reflect the one-half year period). Those annualized expense ratios, excluding indirect expenses from affiliated funds, based on the 6-month period ended February 27, 2015 are as follows:
| Class | Expense Ratios | |||
Class A | 1.19 | % | ||
Class B | 1.95 | |||
Class C | 1.94 | |||
Class I | 0.76 | |||
Class R | 1.44 | |||
Class Y | 0.95 | |||
The expense ratios reflect voluntary and/or contractual waivers and/or reimbursements of expenses by the Fund’s Manager. Some of these undertakings may be modified or terminated at any time, as indicated in the Fund’s prospectus. The “Financial Highlights” tables in the Fund’s financial statements, included in this report, also show the gross expense ratios, without such waivers or reimbursements and reduction to custodian expenses, if applicable.
10 OPPENHEIMER INTERNATIONAL SMALL COMPANY FUND
| STATEMENT OF INVESTMENTS February 27, 2015* Unaudited |
| Shares | Value | |||||||
Common Stocks—90.1% | ||||||||
Consumer Discretionary—16.1% |
| |||||||
Distributors—0.6% | ||||||||
Inchcape plc | 1,700,000 | $ | 19,307,378 | |||||
Diversified Consumer Services—0.5% |
| |||||||
Benesse Holdings, Inc. | 326,800 | 10,398,351 | ||||||
Kroton Educacional SA | 1,172,593 | 4,291,763 | ||||||
| 14,690,114 | ||||||||
Hotels, Restaurants & Leisure—1.6% |
| |||||||
J.D. Wetherspoon plc | 2,354,630 | 29,789,743 | ||||||
OPAP SA | 2,181,360 | 20,112,089 | ||||||
| 49,901,832 | ||||||||
Household Durables—1.3% | ||||||||
de’ Longhi | 1,384,699 | 27,071,028 | ||||||
SEB SA | 187,770 | 13,933,275 | ||||||
| 41,004,303 | ||||||||
Internet & Catalog Retail—4.8% | ||||||||
ASKUL Corp. | 1,457,741 | 28,498,323 | ||||||
ASOS plc1 | 295,696 | 14,742,639 | ||||||
Ocado Group plc1 | 12,374,830 | 70,250,003 | ||||||
Qliro Group AB1,2 | 7,836,819 | 16,903,604 | ||||||
Start Today Co. Ltd. | 631,458 | 15,391,015 | ||||||
| 145,785,584 | ||||||||
Media—2.6% | ||||||||
CTS Eventim AG & Co. KGaA | 458,924 | 14,158,819 | ||||||
Daily Mail & General Trust plc, Cl. A | 1,265,090 | 16,651,500 | ||||||
GFK SE | 257,484 | 10,630,337 | ||||||
Next Co. Ltd.2 | 1,607,300 | 12,645,230 | ||||||
Smiles SA | 562,400 | 9,416,423 | ||||||
Zenrin Co. Ltd. | 1,381,700 | 17,364,783 | ||||||
| 80,867,092 | ||||||||
Specialty Retail—3.5% | ||||||||
Dufry AG1 | 58,059 | 8,391,068 | ||||||
Dunelm Group plc | 1,577,780 | 22,353,284 | ||||||
Esprit Holdings Ltd. | 19,619,519 | 20,291,892 | ||||||
Jin Co. Ltd. | 539,900 | 16,353,757 | ||||||
SuperGroup plc1 | 707,480 | 10,642,459 | ||||||
United Arrows Ltd. | 450,700 | 13,903,879 | ||||||
USS Co. Ltd. | 847,000 | 14,986,039 | ||||||
| 106,922,378 | ||||||||
Textiles, Apparel & Luxury Goods—1.2% |
| |||||||
Asics Corp. | 770,400 | 20,202,846 | ||||||
| Shares | Value | |||||||||
| Consumer Staples—5.2% | ||||||||||
Salvatore Ferragamo SpA | 547,268 | $ | 16,581,499 | |||||||
| 36,784,345 | ||||||||||
| Consumer Staples—5.2% | ||||||||||
| Beverages—2.0% | ||||||||||
Britvic plc | 3,458,738 | 40,782,390 | ||||||||
Treasury Wine Estates Ltd. | 4,737,300 | 20,115,005 | ||||||||
| 60,897,395 | ||||||||||
| Food Products—2.1% | ||||||||||
Ariake Japan Co. Ltd. | 1,044,500 | 28,574,206 | ||||||||
Aryzta AG1 | 201,794 | 16,111,578 | ||||||||
Kaveri Seed Co. Ltd. | 1,304,868 | 19,923,545 | ||||||||
Pescanova SA1 | 138,481 | 1,550 | ||||||||
| 64,610,879 | ||||||||||
| Household Products—0.6% | ||||||||||
Rohto Pharmaceutical Co. Ltd. | 1,557,833 | 19,333,504 | ||||||||
| Personal Products—0.5% | ||||||||||
Colgate-Palmolive India Ltd. | 500,000 | 15,645,118 | ||||||||
| Financials—11.9% | ||||||||||
| Capital Markets—1.1% | ||||||||||
CETIP SA-Mercados Organizados | 1,904,720 | 23,081,415 | ||||||||
EFG International AG1 | 849,386 | 9,895,198 | ||||||||
| 32,976,613 | ||||||||||
| Commercial Banks—1.5% | ||||||||||
Bank of Ireland1 | 123,071,722 | 47,437,037 | ||||||||
| Diversified Financial Services—1.7% | ||||||||||
BM&FBovespa SA | 3,607,000 | 12,757,122 | ||||||||
Coface SA1 | 2,145,453 | 25,812,620 | ||||||||
CRISIL Ltd. | 287,694 | 9,650,591 | ||||||||
Moscow Exchange (The) | 4,612,064 | 5,749,953 | ||||||||
| 53,970,286 | ||||||||||
| Insurance—4.6% | ||||||||||
Baloise Holding AG | 392,767 | 51,037,496 | ||||||||
Euler Hermes Group | 268,620 | 29,658,706 | ||||||||
Grupo Catalana Occidente SA | 1,067,356 | 32,715,263 | ||||||||
Porto Seguro SA | 884,000 | 9,753,194 | ||||||||
11 OPPENHEIMER INTERNATIONAL SMALL COMPANY FUND
| STATEMENT OF INVESTMENTS Unaudited / Continued |
| Shares | Value | |||||||
Insurance (Continued) |
| |||||||
St James’s Place plc | 1,319,134 | $ | 19,295,345 | |||||
| 142,460,004 | ||||||||
Real Estate Investment Trusts (REITs)—1.4% |
| |||||||
Frasers Centrepoint |
| |||||||
Trust | 7,000,000 | 10,477,164 | ||||||
Hibernia REIT plc | 23,473,083 | 31,513,919 | ||||||
| 41,991,083 | ||||||||
Real Estate Management & Development—0.9% |
| |||||||
DLF Ltd. | 5,577,679 | 14,098,066 | ||||||
Oberoi Realty Ltd. | 2,539,341 | 13,221,690 | ||||||
| 27,319,756 | ||||||||
Thrifts & Mortgage Finance—0.7% |
| |||||||
Aareal Bank AG | 492,137 | 22,079,736 | ||||||
Health Care—22.2% |
| |||||||
Biotechnology—3.4% |
| |||||||
Abcam plc | 3,148,610 | 22,941,820 | ||||||
ARIAD Pharmaceuticals, Inc.1 | 1,852,920 | 15,064,240 | ||||||
Galapagos NV1 | 192,942 | 4,305,758 | ||||||
Genmab AS1 | 244,304 | 18,050,332 | ||||||
Medivir AB, Cl. B1 | 399,920 | 4,448,293 | ||||||
Repligen Corp.1 | 839,100 | 21,573,261 | ||||||
Swedish Orphan Biovitrum AB1 | 1,264,463 | 14,173,644 | ||||||
uniQure BV1 | 158,720 | 3,688,653 | ||||||
| 104,246,001 | ||||||||
Health Care Equipment & Supplies—7.1% |
| |||||||
Ambu AS, Cl. B | 943,404 | 19,271,028 | ||||||
BioMerieux | 227,890 | 24,823,539 | ||||||
Carl Zeiss Meditec AG | 1,034,848 | 28,443,490 | ||||||
DBV Technologies SA1 | 754,989 | 33,207,107 | ||||||
Mindray Medical International Ltd., ADR | 373,690 | 10,560,480 | ||||||
Ossur HF1 | 11,918,219 | 37,877,808 | ||||||
Oxford Immunotec Global plc1 | 516,227 | 7,263,314 | ||||||
Sirona Dental Systems, Inc.1 | 371,870 | 33,773,233 | ||||||
STRATEC Biomedical AG | 425,311 | 21,506,580 | ||||||
| 216,726,579 | ||||||||
| Shares | Value | |||||||||
Health Care Providers & Services—0.2% |
| |||||||||
Diagnosticos da America SA | 1,754,200 | $ | 6,605,865 | |||||||
Health Care Technology—0.3% |
| |||||||||
M3, Inc. | 425,000 | 9,457,538 | ||||||||
Life Sciences Tools & Services—7.2% |
| |||||||||
Bruker Corp.1 | 1,323,050 | 25,177,642 | ||||||||
Genfit1 | 190,016 | 12,746,583 | ||||||||
Lonza Group AG1 | 632,872 | 77,886,945 | ||||||||
MorphoSys AG1 | 145,379 | 12,108,702 | ||||||||
QIAGEN NV1 | 672,970 | 16,999,222 | ||||||||
Tecan Group AG | 257,964 | 30,894,007 | ||||||||
WuXi PharmaTech Cayman, Inc., ADR1 | 1,135,657 | 45,369,497 | ||||||||
| 221,182,598 | ||||||||||
Pharmaceuticals—4.0% |
| |||||||||
Almirall SA1 | 841,944 | 12,733,640 | ||||||||
BTG plc1 | 1,533,310 | 17,928,983 | ||||||||
Hikma Pharmaceuticals plc | 307,290 | 11,719,175 | ||||||||
Ipsen SA | 345,460 | 17,548,049 | ||||||||
Nippon Shinyaku Co. Ltd. | 731,000 | 24,583,617 | ||||||||
Sosei Group Corp.1 | 185,800 | 5,199,068 | ||||||||
Vectura Group plc1 | 15,227,001 | 34,513,219 | ||||||||
| 124,225,751 | ||||||||||
Industrials—13.7% | ||||||||||
Air Freight & Couriers—0.6% |
| |||||||||
Panalpina Welttransport Holding AG | 140,673 | 19,525,034 | ||||||||
Construction & Engineering—0.4% |
| |||||||||
Balfour Beatty plc | 3,433,457 | 13,250,510 | ||||||||
Machinery—6.4% |
| |||||||||
Aalberts Industries NV | 462,878 | 14,313,912 | ||||||||
Burckhardt Compression Holding AG | 76,263 | 29,861,884 | ||||||||
Hoshizaki Electric Co. Ltd. | 834,400 | 49,345,175 | ||||||||
Hy-Lok Corp. | 218,431 | 5,651,456 | ||||||||
Metso OYJ | 642,107 | 20,623,065 | ||||||||
Norma Group SE | 348,758 | 18,623,718 | ||||||||
Rotork plc | 360,374 | 13,633,797 | ||||||||
12 OPPENHEIMER INTERNATIONAL SMALL COMPANY FUND
| Shares | Value | |||||||
Machinery (Continued) | ||||||||
Spirax-Sarco | ||||||||
Engineering plc | 640,987 | $ | 31,731,904 | |||||
Vesuvius plc | 1,844,900 | 13,614,509 | ||||||
| 197,399,420 | ||||||||
Road & Rail—0.6% | ||||||||
ComfortDelGro Corp. Ltd. | 8,543,000 | 18,426,903 | ||||||
Trading Companies & Distributors—4.5% |
| |||||||
Brammer plc | 3,980,490 | 21,787,424 | ||||||
Bunzl plc | 915,579 | 26,746,647 | ||||||
Cramo OYJ | 1,085,272 | 17,343,527 | ||||||
MonotaRO Co. Ltd. | 1,286,100 | 42,589,151 | ||||||
SIG plc | 9,645,420 | 29,476,404 | ||||||
| 137,943,153 | ||||||||
Transportation Infrastructure—1.2% | ||||||||
Flughafen Zuerich AG | 48,865 | 34,968,503 | ||||||
Information Technology—15.5% | ||||||||
Electronic Equipment, Instruments, & Components—2.4% | ||||||||
Halma plc | 1,520,827 | 16,706,978 | ||||||
Ingenico | 188,530 | 20,979,477 | ||||||
Renishaw plc | 575,920 | 23,173,005 | ||||||
Yokogawa Electric Corp. | 1,306,500 | 13,866,519 | ||||||
| 74,725,979 | ||||||||
Internet Software & Services—2.8% | ||||||||
Kakaku.com, Inc. | 745,986 | 12,388,271 | ||||||
Moneysupermarket.com Group plc | 6,523,390 | 27,500,585 | ||||||
SMS Co. Ltd. | 483,000 | 5,478,018 | ||||||
XING AG2 | 287,626 | 39,829,835 | ||||||
| 85,196,709 | ||||||||
IT Services—5.2% | ||||||||
GMO Payment Gateway, Inc. | 1,111,200 | 24,499,842 | ||||||
Obic Co. Ltd. | 717,500 | 26,689,851 | ||||||
QIWI plc, Sponsored ADR | 137,190 | 3,232,196 | ||||||
SCSK Corp. | 1,241,708 | 34,136,333 | ||||||
Tech Mahindra Ltd. | 1,045,743 | 47,872,792 | ||||||
Wirecard AG | 536,475 | 24,755,816 | ||||||
| 161,186,830 | ||||||||
| Shares | Value | |||||||||
Semiconductors & Semiconductor Equipment—1.0% |
| |||||||||
Dialog Semiconductor plc1 | 346,109 | $ | 15,311,096 | |||||||
Disco Corp. | 139,900 | 12,853,279 | ||||||||
Imagination Technologies Group plc1 | 896,290 | 3,546,318 | ||||||||
| 31,710,693 | ||||||||||
Software—4.1% | ||||||||||
Cyient Ltd. | 4,603,554 | 41,338,779 | ||||||||
Nemetschek AG | 261,053 | 34,306,537 | ||||||||
NICE-Systems Ltd., Sponsored ADR | 674,030 | 39,343,131 | ||||||||
SimCorp AS | 324,106 | 11,416,067 | ||||||||
| 126,404,514 | ||||||||||
Materials—4.7% | ||||||||||
Chemicals—4.7% | ||||||||||
Bayer CropScience Ltd. | 438,008 | 24,358,211 | ||||||||
Borregaard ASA | 3,655,618 | 23,112,701 | ||||||||
LANXESS AG | 180,194 | 9,280,494 | ||||||||
PI Industries Ltd. | 2,322,724 | 22,319,476 | ||||||||
Sika AG | 4,969 | 17,543,363 | ||||||||
Symrise AG | 503,876 | 32,041,191 | ||||||||
Victrex plc | 535,420 | 15,617,394 | ||||||||
| 144,272,830 | ||||||||||
Utilities—0.8% | ||||||||||
Gas Utilities—0.8% | ||||||||||
ENN Energy Holdings Ltd. | 1,946,000 | 10,367,879 | ||||||||
Indraprastha Gas Ltd. | 1,869,377 | 13,323,023 | ||||||||
| 23,690,902 | ||||||||||
Total Common Stocks (Cost $2,161,232,556) | 2,775,130,749 | |||||||||
Preferred Stock—0.8% | ||||||||||
Sartorius AG, Preference (Cost $11,135,136) | 168,498 | 23,473,648 | ||||||||
| ||||||||||
13 OPPENHEIMER INTERNATIONAL SMALL COMPANY FUND
| STATEMENT OF INVESTMENTS Unaudited / Continued |
| Shares | Value | |||||||
Investment Company—9.2% |
| |||||||
Oppenheimer Institutional Money Market Fund, Cl. E, 0.11%2,3 (Cost $281,898,766) | 281,898,766 | $ | 281,898,766 | |||||
Total Investments, at Value (Cost $2,454,266,458) | 100.1% | 3,080,503,163 | ||||||
Net Other Assets (Liabilities) | (0.1 | ) | (1,820,589 | ) | ||||
Net Assets | 100.0% | $ | 3,078,682,574 | |||||
Footnotes to Statement of Investments
*February 27, 2015 represents the last business day of the Fund’s 2015 reporting period. See Note 2 of the accompanying Notes.
1. Non-income producing security.
2. Is or was an affiliate, as defined in the Investment Company Act of 1940, as amended, at or during the period ended February 27, 2015, by virtue of the Fund owning at least 5% of the voting securities of the issuer or as a result of the Fund and the issuer having the same investment adviser. Transactions during the period in which the issuer was an affiliate are as follows:
Shares August 29, | Gross Additions | Gross Reductions | Shares February 27, | |||||||||||||
Next Co. Ltd.b | 3,598,100 | — | 1,990,800 | 1,607,300 | ||||||||||||
Oppenheimer Institutional Money Market Fund, Cl. E | 229,090,309 | 391,828,301 | 339,019,844 | 281,898,766 | ||||||||||||
Qliro Group AB (formerly, CDON Group AB) | 5,668,966 | 2,167,853 | c | — | 7,836,819 | |||||||||||
XING AG | 242,811 | 44,815 | — | 287,626 | ||||||||||||
| Value | Income | |||||||
Next Co. Ltd.b | $ | — | d | $ | — | |||
Oppenheimer Institutional Money Market Fund, Cl. E | 281,898,766 | 130,475 | ||||||
Qliro Group AB (formerly, CDON Group AB) | 16,903,604 | — | ||||||
XING AG | 39,829,835 | — | ||||||
Total | $ | 338,632,205 | $ | 130,475 | ||||
a. August 29, 2014 represents the last business day of the Fund’s reporting period. See Note 2 of the accompanying Notes.
b. No longer an affiliate as of November 28, 2014.
c. All or a portion is the result of a corporate action.
d. The security is no longer an affiliate. Therefore, the value has been excluded from this table.
3. Rate shown is the 7-day yield as of February 27, 2015.
14 OPPENHEIMER INTERNATIONAL SMALL COMPANY FUND
Distribution of investments representing geographic holdings, as a percentage of total investments at value, is as follows:
| Geographic Holdings | Value | Percent | ||||||
United Kingdom | $ | 567,703,414 | 18.4 | % | ||||
Japan | 458,738,593 | 14.9 | ||||||
United States | 384,750,455 | 12.5 | ||||||
Germany | 306,549,997 | 9.9 | ||||||
Switzerland | 296,115,076 | 9.6 | ||||||
India | 221,751,293 | 7.2 | ||||||
France | 178,709,357 | 5.8 | ||||||
Ireland | 78,950,956 | 2.6 | ||||||
China | 66,297,855 | 2.2 | ||||||
Brazil | 65,905,782 | 2.1 | ||||||
Denmark | 48,737,428 | 1.6 | ||||||
Spain | 45,450,453 | 1.5 | ||||||
Italy | 43,652,527 | 1.4 | ||||||
Israel | 39,343,131 | 1.3 | ||||||
Finland | 37,966,592 | 1.2 | ||||||
Iceland | 37,877,808 | 1.2 | ||||||
Sweden | 35,525,542 | 1.2 | ||||||
Netherlands | 35,001,787 | 1.1 | ||||||
Singapore | 28,904,067 | 0.9 | ||||||
Norway | 23,112,701 | 0.7 | ||||||
Hong Kong | 20,291,892 | 0.7 | ||||||
Australia | 20,115,005 | 0.7 | ||||||
Greece | 20,112,089 | 0.7 | ||||||
Russia | 8,982,149 | 0.3 | ||||||
South Korea | 5,651,456 | 0.2 | ||||||
Belgium | 4,305,758 | 0.1 | ||||||
Total | $ | 3,080,503,163 | 100.0 | % | ||||
See accompanying Notes to Financial Statements.
15 OPPENHEIMER INTERNATIONAL SMALL COMPANY FUND
| STATEMENT OF ASSETS AND LIABILITIES February 27, 20151 Unaudited |
Assets | ||||
Investments, at value—see accompanying statement of investments: | ||||
Unaffiliated companies (cost $2,109,753,939) | $ | 2,741,870,959 | ||
Affiliated companies (cost $344,512,519) | 338,632,204 | |||
| 3,080,503,163 | ||||
Cash | 2,997,201 | |||
Receivables and other assets: | ||||
Shares of beneficial interest sold | 14,346,932 | |||
Dividends | 2,616,148 | |||
Investments sold | 2,343,319 | |||
Other | 174,868 | |||
Total assets | 3,102,981,631 | |||
Liabilities | ||||
Payables and other liabilities: | ||||
Investments purchased | 18,420,532 | |||
Shares of beneficial interest redeemed | 3,009,092 | |||
Foreign capital gains tax | 2,169,013 | |||
Distribution and service plan fees | 289,445 | |||
Trustees’ compensation | 240,225 | |||
Shareholder communications | 3,059 | |||
Other | 167,691 | |||
Total liabilities | 24,299,057 | |||
Net Assets | $ | 3,078,682,574 | ||
Composition of Net Assets | ||||
Paid-in capital | $ | 2,664,560,086 | ||
Accumulated net investment loss | (14,045,907 | ) | ||
Accumulated net realized loss on investments and foreign currency transactions | (195,645,573 | ) | ||
Net unrealized appreciation on investments and translation of assets and liabilities denominated in foreign currencies | 623,813,968 | |||
Net Assets | $ | 3,078,682,574 | ||
1. February 27, 2015 represents the last business day of the Fund’s reporting period. See Note 2 of the accompanying Notes.
16 OPPENHEIMER INTERNATIONAL SMALL COMPANY FUND
Net Asset Value Per Share |
| |||
Class A Shares: | ||||
| Net asset value and redemption price per share (based on net assets of $1,274,394,655 and 36,881,794 shares of beneficial interest outstanding) | $ | 34.55 | ||
Maximum offering price per share (net asset value plus sales charge of 5.75% of offering price) | $ | 36.66 | ||
Class B Shares: | ||||
| Net asset value, redemption price (excludes applicable contingent deferred sales charge) and offering price per share (based on net assets of $9,572,750 and 292,320 shares of beneficial interest outstanding) | $ | 32.75 | ||
Class C Shares: | ||||
| Net asset value, redemption price (excludes applicable contingent deferred sales charge) and offering price per share (based on net assets of $197,745,163 and 6,115,579 shares of beneficial interest outstanding) | $ | 32.33 | ||
Class I Shares: | ||||
| Net asset value, redemption price and offering price per share (based on net assets of $873,737,768 and 25,449,775 shares of beneficial interest outstanding) | $ | 34.33 | ||
Class R Shares: | ||||
| Net asset value, redemption price (excludes applicable contingent deferred sales charge) and offering price per share (based on net assets of $39,931,657 and 1,202,698 shares of beneficial interest outstanding) | $ | 33.20 | ||
Class Y Shares: | ||||
| Net asset value, redemption price and offering price per share (based on net assets of $683,300,581 and 19,923,853 shares of beneficial interest outstanding) | $ | 34.30 | ||
See accompanying Notes to Financial Statements.
17 OPPENHEIMER INTERNATIONAL SMALL COMPANY FUND
| STATEMENT OF OPERATIONS For the Six Months Ended February 27, 20151 |
Investment Income |
| |||
Dividends: | ||||
Unaffiliated companies (net of foreign withholding taxes of $484,927) | $ | 9,637,797 | ||
Affiliated companies | 130,475 | |||
Interest | 80 | |||
|
| |||
Total investment income | 9,768,352 | |||
Expenses |
| |||
Management fees | 9,906,546 | |||
Distribution and service plan fees: | ||||
Class A | 1,361,849 | |||
Class B | 51,417 | |||
Class C | 910,640 | |||
Class R | 94,664 | |||
Transfer and shareholder servicing agent fees: | ||||
Class A | 1,229,472 | |||
Class B | 11,358 | |||
Class C | 201,200 | |||
Class I | 126,481 | |||
Class R | 42,065 | |||
Class Y | 649,949 | |||
Shareholder communications: | ||||
Class A | 12,017 | |||
Class B | 341 | |||
Class C | 1,276 | |||
Class I | 227 | |||
Class R | 151 | |||
Class Y | 2,955 | |||
Custodian fees and expenses | 240,879 | |||
Trustees’ compensation | 22,148 | |||
Other | 86,649 | |||
|
| |||
Total expenses | 14,952,284 | |||
Less reduction to custodian expenses | (455 | ) | ||
Less waivers and reimbursements of expenses | (134,491 | ) | ||
|
| |||
Net expenses | 14,817,338 | |||
Net Investment Loss | (5,048,986 | ) | ||
1. February 27, 2015 represents the last business day of the Fund’s reporting period. See Note 2 of the accompanying Notes.
18 OPPENHEIMER INTERNATIONAL SMALL COMPANY FUND
Realized and Unrealized Gain (Loss) |
| |||
Net realized gain (loss) on: | ||||
Investments from unaffiliated companies (net of foreign capital gains tax of $ 372,615) | $ | 57,918,795 | ||
Foreign currency transactions | (563,377 | ) | ||
|
| |||
Net realized gain | 57,355,418 | |||
Net change in unrealized appreciation/depreciation on: | ||||
Investments | 206,953,048 | |||
Translation of assets and liabilities denominated in foreign currencies | (182,889,040 | ) | ||
|
| |||
Net change in unrealized appreciation/depreciation | 24,064,008 | |||
Net Increase in Net Assets Resulting from Operations | $ | 76,370,440 | ||
|
| |||
See accompanying Notes to Financial Statements.
19 OPPENHEIMER INTERNATIONAL SMALL COMPANY FUND
STATEMENTS OF CHANGES IN NET ASSETS Unaudited
| Six Months Ended February 27, 20151 (Unaudited) | Year Ended August 29, 20141 | |||||||||
Operations | ||||||||||
Net investment income (loss) | $ | (5,048,986) | $ | 12,548,661 | ||||||
| ||||||||||
Net realized gain | 57,355,418 | 121,830,778 | ||||||||
| ||||||||||
Net change in unrealized appreciation/depreciation | 24,064,008 | 269,793,467 | ||||||||
Net increase in net assets resulting from operations | 76,370,440 | 404,172,906 | ||||||||
Dividends and/or Distributions to Shareholders | ||||||||||
Dividends from net investment income: | ||||||||||
Class A | (5,430,295) | (5,642,189 | ) | |||||||
Class B | — | — | ||||||||
Class C | — | (371,694 | ) | |||||||
Class I | (7,446,914) | (7,722,817 | ) | |||||||
Class R2 | (86,899) | (160,920 | ) | |||||||
Class Y | (4,127,214) | (2,098,089 | ) | |||||||
|
| |||||||||
| (17,091,322) | (15,995,709 | ) | ||||||||
Beneficial Interest Transactions | ||||||||||
Net increase (decrease) in net assets resulting from beneficial interest transactions: | ||||||||||
Class A | 166,656,348 | 322,222,833 | ||||||||
Class B | (3,025,941) | (2,616,513 | ) | |||||||
Class C | 776,366 | 61,214,573 | ||||||||
Class I | (30,766,170) | 174,456,675 | ||||||||
Class R2 | 77,118 | 4,522,854 | ||||||||
Class Y | 48,881,111 | 472,918,651 | ||||||||
| 182,598,832 | 1,032,719,073 | |||||||||
Net Assets | ||||||||||
Total increase | 241,877,950 | 1,420,896,270 | ||||||||
| ||||||||||
Beginning of period | 2,836,804,624 | 1,415,908,354 | ||||||||
| End of period (including accumulated net investment income (loss) of $(14,045,907) and $8,084,401, respectively) | $ 3,078,682,574 | $ 2,836,804,624 | ||||||||
|
| |||||||||
1. February 27, 2015 and August 29, 2014 represent the last business days of the Fund’s respective reporting periods. See Note 2 of the accompanying Notes.
2. Effective July 1, 2014, Class N shares were renamed Class R. See Note 1 of the accompanying Notes.
See accompanying Notes to Financial Statements.
20 OPPENHEIMER INTERNATIONAL SMALL COMPANY FUND
| FINANCIAL HIGHLIGHTS |
Class A | | Six Months Ended February 27, 20151 (Unaudited) | | | Year Ended August 29, 2014 1 | | | Year Ended August 30, 2013 | 1 | | Year Ended August 31, 2012 | | | Year Ended August 31, 2011 | | | Year Ended August 31, 2010 | | ||||||
Per Share Operating Data | ||||||||||||||||||||||||
Net asset value, beginning of period | $ | 33.92 | $ | 27.32 | $ | 20.56 | $ | 21.90 | $ | 19.70 | $ | 17.57 | ||||||||||||
Income (loss) from investment operations: | ||||||||||||||||||||||||
Net investment income (loss)2 | (0.08 | ) | 0.14 | 0.20 | 0.12 | (0.01 | ) | (0.03 | ) | |||||||||||||||
Net realized and unrealized gain (loss) | 0.86 | 6.69 | 6.81 | (0.55 | ) | 4.37 | 2.86 | |||||||||||||||||
Total from investment operations | 0.78 | 6.83 | 7.01 | (0.43 | ) | 4.36 | 2.83 | |||||||||||||||||
Dividends and/or distributions to shareholders: | ||||||||||||||||||||||||
Dividends from net investment income | (0.15 | ) | (0.23 | ) | (0.25 | ) | (0.91 | ) | (2.16 | ) | (0.70 | ) | ||||||||||||
Net asset value, end of period | $ | 34.55 | $ | 33.92 | $ | 27.32 | $ | 20.56 | $ | 21.90 | $ | 19.70 | ||||||||||||
Total Return, at Net Asset Value3 | 2.32 | % | 25.06 | % | 34.40 | % | (1.39 | )% | 21.27 | % | 16.28 | % | ||||||||||||
Ratios/Supplemental Data | ||||||||||||||||||||||||
Net assets, end of period (in thousands) | $ | 1,274,395 | $ | 1,076,376 | $ | 593,624 | $ | 454,037 | $ | 552,604 | $ | 566,559 | ||||||||||||
Average net assets (in thousands) | $ | 1,127,198 | $ | 922,903 | $ | 517,067 | $ | 476,217 | $ | 658,653 | $ | 616,135 | ||||||||||||
Ratios to average net assets:4 | ||||||||||||||||||||||||
Net investment income (loss) | (0.50)% | 0.42% | 0.83% | 0.61% | (0.03)% | (0.13)% | ||||||||||||||||||
Total expenses5 | 1.20% | 1.20% | 1.24% | 1.29% | 1.23% | 1.28% | ||||||||||||||||||
| Expenses after payments, waivers and/or reimbursements and reduction to custodian expenses | 1.19% | 1.19% | 1.24% | 1.29% | 1.22% | 1.28% | ||||||||||||||||||
Portfolio turnover rate | 12% | 18% | 25% | 46% | 122% | 107% | ||||||||||||||||||
21 OPPENHEIMER INTERNATIONAL SMALL COMPANY FUND
FINANCIAL HIGHLIGHTS Continued
|
1. February 27, 2015, August 29, 2014 and August 30, 2013 represent the last business days of the Fund’s respective reporting periods. See Note 2 of the accompanying Notes.
2. Per share amounts calculated based on the average shares outstanding during the period.
3. Assumes an initial investment on the business day before the first day of the fiscal period, with all dividends and distributions reinvested in additional shares on the reinvestment date, and redemption at the net asset value calculated on the last business day of the fiscal period. Sales charges are not reflected in the total returns. Total returns are not annualized for periods less than one full year. Returns do not reflect the deduction of taxes that a shareholder would pay on fund distributions or the redemption of fund shares. The returns do not include adjustments in accordance with generally accepted accounting principles required at the period end for financial reporting purposes.
4. Annualized for periods less than one full year.
5. Total expenses including indirect expenses from affiliated fund fees and expenses were as follows:
Six Months Ended February 27, 2015 | 1.21 | % | ||||
Year Ended August 29, 2014 | 1.21 | % | ||||
Year Ended August 30, 2013 | 1.24 | % | ||||
Year Ended August 31, 2012 | 1.29 | % | ||||
Year Ended August 31, 2011 | 1.24 | % | ||||
Year Ended August 31, 2010 | 1.28 | % |
See accompanying Notes to Financial Statements.
22 OPPENHEIMER INTERNATIONAL SMALL COMPANY FUND
| FINANCIAL HIGHLIGHTS Continued |
Class B |
| Six Months Ended February 27, 20151 |
| | Year Ended August 29, 2014 1 | | | Year Ended August 30, 2013 1 | |
| Year Ended August 31, 2012 |
| | Year Ended August 31, 2011 | | | Year Ended August 31, 2010 | | ||||||
Per Share Operating Data | ||||||||||||||||||||||||
| Net asset value, beginning of period | $ | 32.11 | $ | 25.87 | $ | 19.47 | $ | 20.59 | $ | 18.63 | $ | 16.68 | ||||||||||||
| Income (loss) from investment operations: | ||||||||||||||||||||||||
| Net investment loss2 | (0.19 | ) | (0.13 | ) | (0.03 | ) | (0.08 | ) | (0.23 | ) | (0.20 | ) | ||||||||||||
| Net realized and unrealized gain (loss) | 0.83 | 6.37 | 6.45 | (0.43 | ) | 4.14 | 2.72 | |||||||||||||||||
| Total from investment operations | 0.64 | 6.24 | 6.42 | (0.51 | ) | 3.91 | 2.52 | |||||||||||||||||
| Dividends and/or distributions to shareholders: | ||||||||||||||||||||||||
| Dividends from net investment income | 0.00 | 0.00 | (0.02 | ) | (0.61 | ) | (1.95 | ) | (0.57 | ) | ||||||||||||||
| Net asset value, end of period | $ | 32.75 | $ | 32.11 | $ | 25.87 | $ | 19.47 | $ | 20.59 | $ | 18.63 | ||||||||||||
| Total Return, at Net Asset Value3 | 1.96 | % | 24.12 | % | 33.01 | % | (2.10 | )% | 20.07 | % | 15.24 | % | ||||||||||||
Ratios/Supplemental Data | ||||||||||||||||||||||||
| Net assets, end of period (in thousands) | $ | 9,573 | $ | 12,523 | $ | 12,246 | $ | 13,160 | $ | 29,111 | $ | 39,428 | ||||||||||||
| Average net assets (in thousands) | $ | 10,413 | $ | 13,627 | $ | 12,556 | $ | 18,009 | $ | 40,509 | $ | 46,429 | ||||||||||||
| Ratios to average net assets:4 | ||||||||||||||||||||||||
| Net investment loss | (1.23)% | (0.43)% | (0.13)% | (0.40)% | (1.03)% | (1.08)% | ||||||||||||||||||
| Total expenses5 | 1.96% | 1.96% | 2.29% | 2.40% | 2.20% | 2.27% | ||||||||||||||||||
| Expenses after payments, waivers and/or reimbursements and reduction to custodian expenses | 1.95% | 1.95% | 2.13% | 2.17% | 2.18% | 2.20% | ||||||||||||||||||
| Portfolio turnover rate | 12% | 18% | 25% | 46% | 122% | 107% | ||||||||||||||||||
23 OPPENHEIMER INTERNATIONAL SMALL COMPANY FUND
| FINANCIAL HIGHLIGHTS Continued |
1. February 27, 2015, August 29, 2014 and August 30, 2013 represent the last business days of the Fund’s respective reporting periods. See Note 2 of the accompanying Notes.
2. Per share amounts calculated based on the average shares outstanding during the period.
3. Assumes an initial investment on the business day before the first day of the fiscal period, with all dividends and distributions reinvested in additional shares on the reinvestment date, and redemption at the net asset value calculated on the last business day of the fiscal period. Sales charges are not reflected in the total returns. Total returns are not annualized for periods less than one full year. Returns do not reflect the deduction of taxes that a shareholder would pay on fund distributions or the redemption of fund shares. The returns do not include adjustments in accordance with generally accepted accounting principles required at the period end for financial reporting purposes.
4. Annualized for periods less than one full year.
5. Total expenses including indirect expenses from affiliated fund fees and expenses were as follows:
Six Months Ended February 27, 2015 | 1.97 | % | ||||
Year Ended August 29, 2014 | 1.97 | % | ||||
Year Ended August 30, 2013 | 2.29 | % | ||||
Year Ended August 31, 2012 | 2.40 | % | ||||
Year Ended August 31, 2011 | 2.21 | % | ||||
Year Ended August 31, 2010 | 2.27 | % |
See accompanying Notes to Financial Statements.
24 OPPENHEIMER INTERNATIONAL SMALL COMPANY FUND
| Class C | Six Months Ended February 27, 20151 (Unaudited) | Year Ended August 29, 2014 1 | Year Ended 2013 1 | Year Ended August 31, 2012 | Year Ended August 31, 2011 | Year Ended August 31, 2010 | ||||||||||||||||||
Per Share Operating Data | ||||||||||||||||||||||||
| Net asset value, beginning of period | $ | 31.71 | $ | 25.61 | $ | 19.30 | $ | 20.56 | $ | 18.61 | $ | 16.65 | ||||||||||||
| Income (loss) from investment operations: | ||||||||||||||||||||||||
| Net investment income (loss)2 | (0.19 | ) | (0.10 | ) | 0.02 | (0.03 | ) | (0.17 | ) | (0.17 | ) | |||||||||||||
| Net realized and unrealized gain (loss) | 0.81 | 6.28 | 6.39 | (0.49 | ) | 4.12 | 2.71 | |||||||||||||||||
| Total from investment operations | 0.62 | 6.18 | 6.41 | (0.52 | ) | 3.95 | 2.54 | |||||||||||||||||
| Dividends and/or distributions to shareholders: | ||||||||||||||||||||||||
| Dividends from net investment income | 0.00 | (0.08 | ) | (0.10 | ) | (0.74 | ) | (2.00 | ) | (0.58 | ) | |||||||||||||
Net asset value, end of period | $ | 32.33 | $ | 31.71 | $ | 25.61 | $ | 19.30 | $ | 20.56 | $ | 18.61 | ||||||||||||
| Total Return, at Net Asset Value3 | 1.96 | % | 24.14 | % | 33.33 | % | (2.07 | )% | 20.30 | % | 15.43 | % | ||||||||||||
Ratios/Supplemental Data | ||||||||||||||||||||||||
| Net assets, end of period (in thousands) | $ | 197,745 | $ | 193,529 | $ | 104,547 | $ | 76,156 | $ | 96,197 | $ | 102,571 | ||||||||||||
| Average net assets (in thousands) | $ | 184,446 | $ | 161,291 | $ | 88,338 | $ | 81,613 | $ | 115,526 | $ | 111,524 | ||||||||||||
| Ratios to average net assets:4 | ||||||||||||||||||||||||
Net investment income (loss) | (1.24)% | (0.34)% | 0.07% | (0.14)% | (0.79)% | (0.91)% | ||||||||||||||||||
Total expenses5 | 1.95% | 1.96% | 2.02% | 2.04% | 1.99% | 2.07% | ||||||||||||||||||
| Expenses after payments, waivers and/or reimbursements and reduction to custodian expenses | 1.94% | 1.95% | 2.02% | 2.04% | 1.98% | 2.07% | ||||||||||||||||||
Portfolio turnover rate | 12% | 18% | 25% | 46% | 122% | 107% | ||||||||||||||||||
25 OPPENHEIMER INTERNATIONAL SMALL COMPANY FUND
FINANCIAL HIGHLIGHTS Continued
|
1. February 27, 2015, August 29, 2014 and August 30, 2013 represent the last business days of the Fund’s respective reporting periods. See Note 2 of the accompanying Notes.
2. Per share amounts calculated based on the average shares outstanding during the period.
3. Assumes an initial investment on the business day before the first day of the fiscal period, with all dividends and distributions reinvested in additional shares on the reinvestment date, and redemption at the net asset value calculated on the last business day of the fiscal period. Sales charges are not reflected in the total returns. Total returns are not annualized for periods less than one full year. Returns do not reflect the deduction of taxes that a shareholder would pay on fund distributions or the redemption of fund shares. The returns do not include adjustments in accordance with generally accepted accounting principles required at the period end for financial reporting purposes.
4. Annualized for periods less than one full year.
5. Total expenses including indirect expenses from affiliated fund fees and expenses were as follows:
Six Months Ended February 27, 2015 | 1.96 | % | ||
Year Ended August 29, 2014 | 1.97 | % | ||
Year Ended August 30, 2013 | 2.02 | % | ||
Year Ended August 31, 2012 | 2.04 | % | ||
Year Ended August 31, 2011 | 2.00 | % | ||
Year Ended August 31, 2010 | 2.07 | % |
See accompanying Notes to Financial Statements.
26 OPPENHEIMER INTERNATIONAL SMALL COMPANY FUND
| FINANCIAL HIGHLIGHTS Continued |
Class I | | Six Months Ended February 27, 20151 (Unaudited) | | | Year Ended August 29, 2014 1 | | | Year Ended August 30, 2013 | 1 | | Period Ended August 31, 2012 | 2 | ||||
Per Share Operating Data | ||||||||||||||||
| Net asset value, beginning of period | $ | 33.76 | $ | 27.17 | $ | 20.40 | $ | 18.38 | ||||||||
| Income (loss) from investment operations: | ||||||||||||||||
| Net investment income (loss)3 | (0.01 | ) | 0.26 | 0.30 | 0.15 | |||||||||||
| Net realized and unrealized gain | 0.86 | 6.66 | 6.83 | 1.87 | ||||||||||||
| Total from investment operations | 0.85 | 6.92 | 7.13 | 2.02 | ||||||||||||
| Dividends and/or distributions to shareholders: | ||||||||||||||||
| Dividends from net investment income | (0.28 | ) | (0.33 | ) | (0.36 | ) | 0.00 | |||||||||
| Net asset value, end of period | $ | 34.33 | $ | 33.76 | $ | 27.17 | $ | 20.40 | ||||||||
| Total Return, at Net Asset Value4 | 2.56 | % | 25.59 | % | 35.34 | % | 10.99 | % | ||||||||
Ratios/Supplemental Data | ||||||||||||||||
| Net assets, end of period (in thousands) | $ | 873,738 | $ | 893,125 | $ | 571,154 | $ | 1,093 | ||||||||
| Average net assets (in thousands) | $ | 850,178 | $ | 787,902 | $ | 114,975 | $ | 293 | ||||||||
| Ratios to average net assets:5 | ||||||||||||||||
| Net investment income (loss) | (0.05)% | 0.81% | 1.15% | 1.20% | ||||||||||||
| Total expenses6 | 0.77% | 0.77% | 0.83% | 0.83% | ||||||||||||
| Expenses after payments, waivers and/or reimbursements and reduction to custodian expenses | 0.76% | 0.76% | 0.83% | 0.83% | ||||||||||||
| Portfolio turnover rate | 12% | 18% | 25% | 46% | ||||||||||||
1. February 27, 2015, August 29, 2014 and August 30, 2013 represent the last business days of the Fund’s respective reporting periods. See Note 2 of the accompanying Notes.
2. For the period from December 29, 2011 (inception of offering) to August 31, 2012.
3. Per share amounts calculated based on the average shares outstanding during the period.
4. Assumes an initial investment on the business day before the first day of the fiscal period, with all dividends and distributions reinvested in additional shares on the reinvestment date, and redemption at the net asset value calculated on the last business day of the fiscal period. Sales charges are not reflected in the total returns. Total returns are not annualized for periods less than one full year. Returns do not reflect the deduction of taxes that a shareholder would pay on fund distributions or the redemption of fund shares. The returns do not include adjustments in accordance with generally accepted accounting principles required at the period end for financial reporting purposes.
5. Annualized for periods less than one full year.
6. Total expenses including indirect expenses from affiliated fund fees and expenses were as follows:
| Six Months Ended February 27, 2015 | 0.78% | |||
| Year Ended August 29, 2014 | 0.78% | |||
| Year Ended August 30, 2013 | 0.83% | |||
| Period Ended August 31, 2012 | 0.83% |
See accompanying Notes to Financial Statements.
27 OPPENHEIMER INTERNATIONAL SMALL COMPANY FUND
FINANCIAL HIGHLIGHTS Continued |
Class R |
| Six Months Ended February 27, 20151 |
| | Year Ended August 29, 2014 1 | | | Year Ended August 30, 2013 1 | | | Year Ended August 31, 2012 | | | Year Ended August 31, 2011 | | | Year Ended August 31, 2010 | | ||||||
Per Share Operating Data | ||||||||||||||||||||||||
| Net asset value, beginning of period | $ | 32.55 | $ | 26.22 | $ | 19.75 | $ | 21.03 | $ | 18.98 | $ | 16.97 | ||||||||||||
| Income (loss) from investment operations: | ||||||||||||||||||||||||
| Net investment income (loss)2 | (0.11 | ) | 0.04 | 0.12 | 0.05 | (0.09 | ) | (0.09 | ) | |||||||||||||||
| Net realized and unrealized gain (loss) | 0.83 | 6.44 | 6.53 | (0.51 | ) | 4.23 | 2.76 | |||||||||||||||||
| Total from investment operations | 0.72 | 6.48 | 6.65 | (0.46 | ) | 4.14 | 2.67 | |||||||||||||||||
| Dividends and/or distributions to shareholders: | ||||||||||||||||||||||||
| Dividends from net investment income | (0.07 | ) | (0.15 | ) | (0.18 | ) | (0.82 | ) | (2.09 | ) | (0.66 | ) | ||||||||||||
| Net asset value, end of period | $ | 33.20 | $ | 32.55 | $ | 26.22 | $ | 19.75 | $ | 21.03 | $ | 18.98 | ||||||||||||
| Total Return, at Net Asset Value3 | 2.20% | 24.74% | 33.90% | (1.67)% | 20.88% | 15.89% | ||||||||||||||||||
Ratios/Supplemental Data | ||||||||||||||||||||||||
| Net assets, end of period (in thousands) | $ | 39,932 | $ | 39,082 | $ | 27,641 | $ | 24,303 | $ | 30,562 | $ | 36,199 | ||||||||||||
| Average net assets (in thousands) | $ | 38,570 | $ | 35,888 | $ | 26,402 | $ | 25,519 | $ | 40,162 | $ | 40,738 | ||||||||||||
| Ratios to average net assets:4 | ||||||||||||||||||||||||
| Net investment income (loss) | (0.74)% | 0.13% | 0.50% | 0.28% | (0.39)% | (0.48)% | ||||||||||||||||||
| Total expenses5 | 1.45% | 1.46% | 1.57% | 1.62% | 1.56% | 1.63% | ||||||||||||||||||
| Expenses after payments, waivers and/or reimbursements and reduction to custodian expenses | 1.44% | 1.45% | 1.57% | 1.62% | 1.55% | 1.62% | ||||||||||||||||||
Portfolio turnover rate | 12% | 18% | 25% | 46% | 122% | 107% | ||||||||||||||||||
28 OPPENHEIMER INTERNATIONAL SMALL COMPANY FUND
FINANCIAL HIGHLIGHTS Continued
|
1. February 27, 2015, August 29, 2014 and August 30, 2013 represent the last business days of the Fund’s respective reporting periods. See Note 2 of the accompanying Notes.
2. Per share amounts calculated based on the average shares outstanding during the period.
3. Assumes an initial investment on the business day before the first day of the fiscal period, with all dividends and distributions reinvested in additional shares on the reinvestment date, and redemption at the net asset value calculated on the last business day of the fiscal period. Sales charges are not reflected in the total returns. Total returns are not annualized for periods less than one full year. Returns do not reflect the deduction of taxes that a shareholder would pay on fund distributions or the redemption of fund shares. The returns do not include adjustments in accordance with generally accepted accounting principles required at the period end for financial reporting purposes.
4. Annualized for periods less than one full year.
5. Total expenses including indirect expenses from affiliated fund fees and expenses were as follows:
Six Months Ended February 27, 2015 | 1.46 | % | ||
Year Ended August 29, 2014 | 1.47 | % | ||
Year Ended August 30, 2013 | 1.57 | % | ||
Year Ended August 31, 2012 | 1.62 | % | ||
Year Ended August 31, 2011 | 1.57 | % | ||
Year Ended August 31, 2010 | 1.63 | % |
See accompanying Notes to Financial Statements.
29 OPPENHEIMER INTERNATIONAL SMALL COMPANY FUND
| Class Y | Six Months Ended February 27, 20151 (Unaudited) | Year Ended August 29, 2014 1 | Year Ended August 30, 2013 1 | Year Ended August 31, 2012 | Year Ended August 31, 2011 | Year Ended August 31, 2010 | ||||||||||||||||||
Per Share Operating Data | ||||||||||||||||||||||||
| Net asset value, beginning of period | $ | 33.71 | $ | 27.14 | $ | 20.45 | $ | 21.81 | $ | 19.62 | $ | 17.49 | ||||||||||||
| Income (loss) from investment operations: | ||||||||||||||||||||||||
| Net investment income (loss)2 | (0.04 | ) | 0.26 | 0.32 | 0.22 | 0.09 | 0.07 | |||||||||||||||||
| Net realized and unrealized gain (loss) | 0.86 | 6.61 | 6.73 | (0.57 | ) | 4.36 | 2.83 | |||||||||||||||||
| Total from investment operations | 0.82 | 6.87 | 7.05 | (0.35 | ) | 4.45 | 2.90 | |||||||||||||||||
| Dividends and/or distributions to shareholders: | ||||||||||||||||||||||||
| Dividends from net investment income | (0.23 | ) | (0.30 | ) | (0.36 | ) | (1.01 | ) | (2.26 | ) | (0.77 | ) | ||||||||||||
| Net asset value, end of period | $ | 34.30 | $ | 33.71 | $ | 27.14 | $ | 20.45 | $ | 21.81 | $ | 19.62 | ||||||||||||
| Total Return, at Net Asset Value3 | 2.46% | 25.40% | 34.85% | (0.95 | )% | 21.77% | 16.80% | |||||||||||||||||
| Ratios/Supplemental Data | ||||||||||||||||||||||||
| Net assets, end of period (in thousands) | $ | 683,300 | $ | 622,170 | $ | 106,696 | $ | 394,848 | $ | 408,243 | $ | 445,179 | ||||||||||||
| Average net assets (in thousands) | $ | 595,880 | $ | 357,072 | $ | 429,700 | $ | 381,371 | $ | 584,364 | $ | 393,600 | ||||||||||||
Ratios to average net assets:4 | ||||||||||||||||||||||||
Net investment income (loss) | (0.25)% | 0.79% | 1.35% | 1.12% | 0.39% | 0.36% | ||||||||||||||||||
Total expenses5 | 0.96% | 0.96% | 0.83% | 0.82% | 0.83% | 0.86% | ||||||||||||||||||
| Expenses after payments, waivers and/or reimbursements and reduction to custodian expenses | 0.95% | 0.95% | 0.83% | 0.82% | 0.82% | 0.86% | ||||||||||||||||||
Portfolio turnover rate | 12% | 18% | 25% | 46% | 122% | 107% | ||||||||||||||||||
30 OPPENHEIMER INTERNATIONAL SMALL COMPANY FUND
| FINANCIAL HIGHLIGHTS Continued |
1. February 27, 2015, August 29, 2014 and August 30, 2013 represent the last business days of the Fund’s respective reporting periods. See Note 2 of the accompanying Notes.
2. Per share amounts calculated based on the average shares outstanding during the period.
3. Assumes an initial investment on the business day before the first day of the fiscal period, with all dividends and distributions reinvested in additional shares on the reinvestment date, and redemption at the net asset value calculated on the last business day of the fiscal period. Sales charges are not reflected in the total returns. Total returns are not annualized for periods less than one full year. Returns do not reflect the deduction of taxes that a shareholder would pay on fund distributions or the redemption of fund shares. The returns do not include adjustments in accordance with generally accepted accounting principles required at the period end for financial reporting purposes.
4. Annualized for periods less than one full year.
5. Total expenses including indirect expenses from affiliated fund fees and expenses were as follows:
| Six Months Ended February 27, 2015 | 0.97% | |||
| Year Ended August 29, 2014 | 0.97% | |||
| Year Ended August 30, 2013 | 0.83% | |||
| Year Ended August 31, 2012 | 0.82% | |||
| Year Ended August 31, 2011 | 0.84% | |||
| Year Ended August 31, 2010 | 0.86% |
See accompanying Notes to Financial Statements.
31 OPPENHEIMER INTERNATIONAL SMALL COMPANY FUND
NOTES TO FINANCIAL STATEMENTS February 27, 2015 Unaudited
1. Organization
Oppenheimer International Small Company Fund (the “Fund”) is registered under the Investment Company Act of 1940 (“1940 Act”), as amended, as a diversified open-end management investment company. The Fund’s investment objective is to seek capital appreciation. The Fund’s investment adviser is OFI Global Asset Management, Inc. (“OFI Global” or the “Manager”), a wholly-owned subsidiary of OppenheimerFunds, Inc. (“OFI” or the “Sub-Adviser”). The Manager has entered into a sub-advisory agreement with OFI.
The Fund offers Class A, Class C, Class I, Class R and Class Y shares, and previously offered Class B shares for new purchase through June 29, 2012. Subsequent to that date, no new purchases of Class B shares are permitted, however reinvestment of dividend and/or capital gain distributions and exchanges of Class B shares into and from other Oppenheimer funds will be allowed. As of July 1, 2014, Class N shares were renamed Class R shares. Class N shares subject to a contingent deferred sales charge (“CDSC”) on July 1, 2014, will continue to be subject to a CDSC after the shares are renamed. Purchases of Class R shares occurring on or after July 1, 2014, will not be subject to a CDSC upon redemption. Class A shares are sold at their offering price, which is normally net asset value plus a front-end sales charge. Class C and Class R shares are sold, and Class B shares were sold, without a front-end sales charge but may be subject to a contingent deferred sales charge (“CDSC”). Class R shares are sold only through retirement plans. Retirement plans that offer Class R shares may impose charges on those accounts. Class I and Class Y shares are sold to certain institutional investors or intermediaries without either a front-end sales charge or a CDSC, however, the intermediaries may impose charges on their accountholders who beneficially own Class I and Class Y shares. All classes of shares have identical rights and voting privileges with respect to the Fund in general and exclusive voting rights on matters that affect that class alone. Earnings, net assets and net asset value per share may differ due to each class having its own expenses, such as transfer and shareholder servicing agent fees and shareholder communications, directly attributable to that class. Class A, B, C and R shares have separate distribution and/or service plans under which they pay fees. Class I and Class Y shares do not pay such fees. Class B shares will automatically convert to Class A shares 72 months after the date of purchase.
The following is a summary of significant accounting policies consistently followed by the Fund.
2. Significant Accounting Policies
Security Valuation. All investments in securities are recorded at their estimated fair value, as described in Note 3.
Semiannual and Annual Periods. The last day of the Fund’s semiannual and annual periods was the last day the New York Stock Exchange was open for trading. The Fund’s financial statements have been presented through that date to maintain consistency with the Fund’s net asset value calculations used for shareholder transactions.
32 OPPENHEIMER INTERNATIONAL SMALL COMPANY FUND
|
| 2. Significant Accounting Policies (Continued) |
Foreign Currency Translation. The Fund’s accounting records are maintained in U.S. dollars. The values of securities denominated in foreign currencies and amounts related to the purchase and sale of foreign securities and foreign investment income are translated into U.S. dollars as of the close of the New York Stock Exchange (the “Exchange”), normally 4:00 P.M. Eastern time, on each day the Exchange is open for trading. Foreign exchange rates may be valued primarily using a reliable bank, dealer or service authorized by the Board of Trustees.
Reported net realized gains and losses from foreign currency transactions arise from sales of portfolio securities, sales and maturities of short-term securities, sales of foreign currencies, exchange rate fluctuations between the trade and settlement dates on securities transactions, and the difference between the amounts of dividends, interest, and foreign withholding taxes recorded on the Fund’s books and the U.S. dollar equivalent of the amounts actually received or paid. Net unrealized appreciation and depreciation on the translation of assets and liabilities denominated in foreign currencies arise from changes in the values of assets and liabilities, including investments in securities at fiscal period end, resulting from changes in exchange rates.
The effect of changes in foreign currency exchange rates on investments is separately identified from the fluctuations arising from changes in market values of securities held and reported with all other foreign currency gains and losses in the Fund’s Statement of Operations.
Allocation of Income, Expenses, Gains and Losses. Income, expenses (other than those attributable to a specific class), gains and losses are allocated on a daily basis to each class of shares based upon the relative proportion of net assets represented by such class. Operating expenses directly attributable to a specific class are charged against the operations of that class.
Dividends and Distributions to Shareholders. Dividends and distributions to shareholders, which are determined in accordance with income tax regulations and may differ from U.S. generally accepted accounting principles, are recorded on the ex-dividend date. Income and capital gain distributions, if any, are declared and paid annually or at other times as deemed necessary by the Manager.
The tax character of distributions is determined as of the Fund’s fiscal year end. Therefore, a portion of the Fund’s distributions made to shareholders prior to the Fund’s fiscal year end may ultimately be categorized as a tax return of capital.
Investment Income. Dividend income is recorded on the ex-dividend date or upon ex-dividend notification in the case of certain foreign dividends where the ex-dividend date may have passed. Non-cash dividends included in dividend income, if any, are recorded at the fair market value of the securities received. Interest income is recognized on an accrual basis. Discount and premium, which are included in interest income on the Statement of Operations, are amortized or accreted daily.
33 OPPENHEIMER INTERNATIONAL SMALL COMPANY FUND
| NOTES TO FINANCIAL STATEMENTS Unaudited / Continued |
|
| 2. Significant Accounting Policies (Continued) |
Custodian Fees. “Custodian fees and expenses” in the Statement of Operations may include interest expense incurred by the Fund on any cash overdrafts of its custodian account during the period. Such cash overdrafts may result from the effects of failed trades in portfolio securities and from cash outflows resulting from unanticipated shareholder redemption activity. The Fund pays interest to its custodian on such cash overdrafts, to the extent they are not offset by positive cash balances maintained by the Fund, at a rate equal to the Federal Funds Rate plus 0.50%. The “Reduction to custodian expenses” line item, if applicable, represents earnings on cash balances maintained by the Fund during the period. Such interest expense and other custodian fees may be paid with these earnings.
Security Transactions. Security transactions are recorded on the trade date. Realized gains and losses on securities sold are determined on the basis of identified cost.
Indemnifications. The Fund’s organizational documents provide current and former Trustees and officers with a limited indemnification against liabilities arising in connection with the performance of their duties to the Fund. In the normal course of business, the Fund may also enter into contracts that provide general indemnifications. The Fund’s maximum exposure under these arrangements is unknown as this would be dependent on future claims that may be made against the Fund. The risk of material loss from such claims is considered remote.
Federal Taxes. The Fund intends to comply with provisions of the Internal Revenue Code applicable to regulated investment companies and to distribute substantially all of its investment company taxable income to shareholders. Therefore, no federal income or excise tax provision is required. The Fund files income tax returns in U.S. federal and applicable state jurisdictions. The statute of limitations on the Fund’s tax return filings generally remain open for the three preceding fiscal reporting period ends.
During the fiscal year ended August 29, 2014, the Fund utilized $111,033,724 of capital loss carryforward to offset capital gains realized in that fiscal year. Details of the fiscal year ended August 29, 2014 capital loss carryforwards are included in the table below. Capital loss carryforwards with no expiration, if any, must be utilized prior to those with expiration dates. Capital losses with no expiration will be carried forward to future years if not offset by gains.
| Expiring | ||||
2017 | $ | 78,067,994 | ||
2018 | 168,642,989 | |||
2019 | 7,946,140 | |||
Total | $ | 254,657,123 | ||
As of February 27, 2015, it is estimated that the capital loss carryforwards would be $197,301,705 expiring by 2019. The estimated capital loss carryforward represents the carryforward as of the end of the last fiscal year, increased or decreased by capital losses or gains realized in the first six months of the current fiscal year. During the six months ended
34 OPPENHEIMER INTERNATIONAL SMALL COMPANY FUND
|
| 2. Significant Accounting Policies (Continued) |
February 27, 2015, it is estimated that the Fund will utilize $57,355,418 of capital loss carryforward to offset realized capital gains.
Net investment income (loss) and net realized gain (loss) may differ for financial statement and tax purposes. The character of dividends and distributions made during the fiscal year from net investment income or net realized gains may differ from their ultimate characterization for federal income tax purposes. Also, due to timing of dividends and distributions, the fiscal year in which amounts are distributed may differ from the fiscal year in which the income or net realized gain was recorded by the Fund.
The aggregate cost of securities and other investments and the composition of unrealized appreciation and depreciation of securities and other investments for federal income tax purposes as of February 27, 2015 are noted in the following table. The primary difference between book and tax appreciation or depreciation of securities and other investments, if applicable, is attributable to the tax deferral of losses or tax realization of financial statement unrealized gain or loss.
Federal tax cost of securities | $ | 2,454,266,458 | ||
|
| |||
Gross unrealized appreciation | $ | 902,826,796 | ||
Gross unrealized depreciation | (276,590,091 | ) | ||
|
| |||
Net unrealized appreciation | $ | 626,236,705 | ||
|
|
Certain foreign countries impose a tax on capital gains which is accrued by the Fund based on unrealized appreciation, if any, on affected securities. The tax is paid when the gain is realized.
Use of Estimates. The preparation of financial statements in conformity with accounting principles generally accepted in the United States of America requires management to make estimates and assumptions that affect the reported amounts of assets and liabilities and disclosure of contingent assets and liabilities at the date of the financial statements and the reported amounts of increases and decreases in net assets from operations during the reporting period. Actual results could differ from those estimates.
3. Securities Valuation
The Fund calculates the net asset value of its shares as of the close of the New York Stock Exchange (the “Exchange”), normally 4:00 P.M. Eastern time, on each day the Exchange is open for trading.
The Fund’s Board has adopted procedures for the valuation of the Fund’s securities and has delegated the day-to-day responsibility for valuation determinations under those procedures to the Manager. The Manager has established a Valuation Committee which is responsible for determining a “fair valuation” for any security for which market quotations are not “readily available.” The Valuation Committee’s fair valuation determinations are
subject to review, approval and ratification by the Fund’s Board at its next regularly scheduled meeting covering the calendar quarter in which the fair valuation was determined.
35 OPPENHEIMER INTERNATIONAL SMALL COMPANY FUND
| NOTES TO FINANCIAL STATEMENTS Unaudited / Continued |
|
| 3. Securities Valuation (Continued) |
Valuation Methods and Inputs
Securities are valued using unadjusted quoted market prices, when available, as supplied primarily by third party pricing services or dealers.
The following methodologies are used to determine the market value or the fair value of the types of securities described below:
Securities traded on a registered U.S. securities exchange (including exchange-traded derivatives other than futures and futures options) are valued based on the last sale price of the security reported on the principal exchange on which it is traded, prior to the time when the Fund’s assets are valued. In the absence of a sale, the security is valued at the last sale price on the prior trading day, if it is within the spread of the current day’s closing “bid” and “asked” prices, and if not, at the current day’s closing bid price. A security of a foreign issuer traded on a foreign exchange, but not listed on a registered U.S. securities exchange, is valued based on the last sale price on the principal exchange on which the security is traded, as identified by the third party pricing service used by the Manager, prior to the time when the Fund’s assets are valued. If the last sale price is unavailable, the security is valued at the most recent official closing price on the principal exchange on which it is traded. If the last sales price or official closing price for a foreign security is not available, the security is valued at the mean between the bid and asked price per the exchange or, if not available from the exchange, obtained from two dealers. If bid and asked prices are not available from either the exchange or two dealers, the security is valued by using one of the following methodologies (listed in order of priority): (1) using a bid from the exchange, (2) the mean between the bid and asked price as provided by a single dealer, or (3) a bid from a single dealer.
Shares of a registered investment company that are not traded on an exchange are valued at that investment company’s net asset value per share.
Corporate and government debt securities (of U.S. or foreign issuers) and municipal debt securities, event-linked bonds, loans, mortgage-backed securities, collateralized mortgage obligations, and asset-backed securities are valued at the mean between the “bid” and “asked” prices utilizing evaluated prices obtained from third party pricing services or broker-dealers who may use matrix pricing methods to determine the evaluated prices.
Short-term money market type debt securities with a remaining maturity of sixty days or less are valued at cost adjusted by the amortization of discount or premium to maturity (amortized cost), which approximates market value. Short-term debt securities with a remaining maturity in excess of sixty days are valued at the mean between the “bid” and “asked” prices utilizing evaluated prices obtained from third party pricing services or broker-dealers.
A description of the standard inputs that may generally be considered by the third party pricing vendors in determining their evaluated prices is provided below.
36 OPPENHEIMER INTERNATIONAL SMALL COMPANY FUND
|
| 3. Securities Valuation (Continued) |
| Security Type | Standard inputs generally considered by third-party pricing vendors | |
| Corporate debt, government debt, municipal, mortgage-backed and asset-backed securities | Reported trade data, broker-dealer price quotations, benchmark yields, issuer spreads on comparable securities, the credit quality, yield, maturity, and other appropriate factors. | |
Loans | Information obtained from market participants regarding reported trade data and broker-dealer price quotations. | |
Event-linked bonds | Information obtained from market participants regarding reported trade data and broker-dealer price quotations. |
If a market value or price cannot be determined for a security using the methodologies described above, or if, in the “good faith” opinion of the Manager, the market value or price obtained does not constitute a “readily available market quotation,” or a significant event has occurred that would materially affect the value of the security, the security is fair valued either (i) by a standardized fair valuation methodology applicable to the security type or the significant event as previously approved by the Valuation Committee and the Fund’s Board or (ii) as determined in good faith by the Manager’s Valuation Committee. The Valuation Committee considers all relevant facts that are reasonably available, through either public information or information available to the Manager, when determining the fair value of a security. Fair value determinations by the Manager are subject to review, approval and ratification by the Fund’s Board at its next regularly scheduled meeting covering the calendar quarter in which the fair valuation was determined. Those fair valuation standardized methodologies include, but are not limited to, valuing securities at the last sale price or initially at cost and subsequently adjusting the value based on: changes in company specific fundamentals, changes in an appropriate securities index, or changes in the value of similar securities which may be further adjusted for any discounts related to security-specific resale restrictions. When possible, such methodologies use observable market inputs such as unadjusted quoted prices of similar securities, observable interest rates, currency rates and yield curves. The methodologies used for valuing securities are not necessarily an indication of the risks associated with investing in those securities nor can it be assured that the Fund can obtain the fair value assigned to a security if it were to sell the security.
To assess the continuing appropriateness of security valuations, the Manager, or its third party service provider who is subject to oversight by the Manager, regularly compares prior day prices, prices on comparable securities, and sale prices to the current day prices and challenges those prices exceeding certain tolerance levels with the third party pricing service or broker source. For those securities valued by fair valuations, whether through a standardized fair valuation methodology or a fair valuation determination, the Valuation Committee reviews and affirms the reasonableness of the valuations based on such methodologies and fair valuation determinations on a regular basis after considering all relevant information that is reasonably available.
Classifications
Each investment asset or liability of the Fund is assigned a level at measurement date based on the significance and source of the inputs to its valuation. Various data inputs are used in determining the value of each of the Fund’s investments as of the reporting period end. These
37 OPPENHEIMER INTERNATIONAL SMALL COMPANY FUND
| NOTES TO FINANCIAL STATEMENTS Unaudited / Continued |
|
3. Securities Valuation (Continued) |
data inputs are categorized in the following hierarchy under applicable financial accounting standards:
1) Level 1-unadjusted quoted prices in active markets for identical assets or liabilities (including securities actively traded on a securities exchange)
2) Level 2-inputs other than unadjusted quoted prices that are observable for the asset or liability (such as unadjusted quoted prices for similar assets and market corroborated inputs such as interest rates, prepayment speeds, credit risks, etc.)
3) Level 3-significant unobservable inputs (including the Manager’s own judgments about assumptions that market participants would use in pricing the asset or liability).
The inputs used for valuing securities are not necessarily an indication of the risks associated with investing in those securities.
The table below categorizes amounts that are included in the Fund’s Statement of Assets and Liabilities as of February 27, 2015 based on valuation input level:
| Level 1— Unadjusted Quoted Prices | Level 2— Other Significant | Level 3— Significant Unobservable Inputs | Value | |||||||||||||
Assets Table | ||||||||||||||||
Investments, at Value: | ||||||||||||||||
Common Stocks | ||||||||||||||||
Consumer Discretionary | $ | — | $ | 495,263,026 | $ | — | $ | 495,263,026 | ||||||||
Consumer Staples | — | 160,485,346 | 1,550 | 160,486,896 | ||||||||||||
Financials | — | 368,234,515 | — | 368,234,515 | ||||||||||||
Health Care | 179,469,542 | 502,974,790 | — | 682,444,332 | ||||||||||||
Industrials | — | 421,513,523 | — | 421,513,523 | ||||||||||||
Information Technology | 42,575,327 | 436,649,398 | — | 479,224,725 | ||||||||||||
Materials | — | 144,272,830 | — | 144,272,830 | ||||||||||||
Utilities | — | 23,690,902 | — | 23,690,902 | ||||||||||||
Preferred Stock | — | 23,473,648 | — | 23,473,648 | ||||||||||||
Investment Company | 281,898,766 | — | — | 281,898,766 | ||||||||||||
|
| |||||||||||||||
Total Assets | $ | 503,943,635 | $ | 2,576,557,978 | $ | 1,550 | $ | 3,080,503,163 | ||||||||
|
| |||||||||||||||
Forward currency exchange contracts and futures contracts, if any, are reported at their unrealized appreciation/depreciation at measurement date, which represents the change in the contract’s value from trade date. All additional assets and liabilities included in the above table are reported at their market value at measurement date.
4. Investments and Risks
Investment in Oppenheimer Institutional Money Market Fund. The Fund is permitted to invest daily available cash balances in an affiliated money market fund. The Fund may invest the available cash in Class E shares of Oppenheimer Institutional Money Market Fund (“IMMF”) to seek current income while preserving liquidity or for defensive purposes. IMMF is a registered open-end management investment company, regulated as a money market fund under the 1940 Act. The Manager is the investment adviser of IMMF, and the Sub-Adviser provides investment and related advisory services to IMMF. When applicable, the Fund’s
38 OPPENHEIMER INTERNATIONAL SMALL COMPANY FUND
4. Investments and Risks (Continued)
investment in IMMF is included in the Statement of Investments. Shares of IMMF are valued at their net asset value per share. As a shareholder, the Fund is subject to its proportional share of IMMF’s Class E expenses, including its management fee. The Manager will waive fees and/or reimburse Fund expenses in an amount equal to the indirect management fees incurred through the Fund’s investment in IMMF.
Equity Security Risk. Stocks and other equity securities fluctuate in price. The value of the Fund’s portfolio may be affected by changes in the equity markets generally. Equity markets may experience significant short-term volatility and may fall sharply at times. Different markets may behave differently from each other and U.S. equity markets may move in the opposite direction from one or more foreign stock markets. Adverse events in any part of the equity or fixed-income markets may have unexpected negative effects on other market segments.
The prices of individual equity securities generally do not all move in the same direction at the same time and a variety of factors can affect the price of a particular company’s securities. These factors may include, but are not limited to, poor earnings reports, a loss of customers, litigation against the company, general unfavorable performance of the company’s sector or industry, or changes in government regulations affecting the company or its industry.
5. Shares of Beneficial Interest
The Fund has authorized an unlimited number of no par value shares of beneficial interest of each class. Transactions in shares of beneficial interest were as follows:
| Six Months Ended February 27, 2015 | Year Ended August 29, 2014 | |||||||||||||||
| Shares | Amount | Shares | Amount | |||||||||||||
Class A | ||||||||||||||||
Sold | 10,799,468 | $ | 350,645,649 | 19,514,128 | $ | 635,879,037 | ||||||||||
Dividends and/or distributions reinvested | 159,498 | 5,142,214 | 169,507 | 5,293,705 | ||||||||||||
Redeemed | (5,810,485 | ) | (189,131,515 | ) | (9,680,229 | ) | (318,949,909 | ) | ||||||||
|
| |||||||||||||||
Net increase | 5,148,481 | $ | 166,656,348 | 10,003,406 | $ | 322,222,833 | ||||||||||
|
| |||||||||||||||
Class B | ||||||||||||||||
Sold | 14,651 | $ | 452,231 | 101,876 | $ | 3,100,050 | ||||||||||
Dividends and/or distributions reinvested | — | — | — | — | ||||||||||||
Redeemed | (112,306 | ) | (3,478,172 | ) | (185,260 | ) | (5,716,563 | ) | ||||||||
|
| |||||||||||||||
Net decrease | (97,655 | ) | $ | (3,025,941 | ) | (83,384 | ) | $ | (2,616,513 | ) | ||||||
|
| |||||||||||||||
39 OPPENHEIMER INTERNATIONAL SMALL COMPANY FUND
NOTES TO FINANCIAL STATEMENTS Unaudited / Continued |
5. Shares of Beneficial Interest (Continued) |
| Six Months Ended February 27, 2015 | Year Ended August 29, 2014 | |||||||||||||||
| Shares | Amount | Shares | Amount | |||||||||||||
| ||||||||||||||||
Class C | ||||||||||||||||
Sold | 843,496 | $ | 25,980,814 | 2,856,469 | $ | 86,687,134 | ||||||||||
Dividends and/or distributions reinvested | — | — | 11,173 | 327,926 | ||||||||||||
Redeemed | (831,511 | ) | (25,204,448 | ) | (846,475 | ) | (25,800,487 | ) | ||||||||
|
| |||||||||||||||
Net increase | 11,985 | $ | 776,366 | 2,021,167 | $ | 61,214,573 | ||||||||||
|
| |||||||||||||||
Class I | ||||||||||||||||
Sold | 2,531,191 | $ | 83,008,284 | 7,476,386 | $ | 241,546,782 | ||||||||||
Dividends and/or distributions reinvested | 227,684 | 7,285,880 | 249,198 | 7,722,635 | ||||||||||||
Redeemed | (3,760,380 | ) | (121,060,334 | ) | (2,296,069 | ) | (74,812,742 | ) | ||||||||
|
| |||||||||||||||
Net increase (decrease) | (1,001,505 | ) | $ | (30,766,170 | ) | 5,429,515 | $ | 174,456,675 | ||||||||
|
| |||||||||||||||
Class R1 | ||||||||||||||||
Sold | 289,780 | $ | 9,120,837 | 481,572 | $ | 15,067,721 | ||||||||||
Dividends and/or distributions reinvested | 2,726 | 84,509 | 5,250 | 157,591 | ||||||||||||
Redeemed | (290,431 | ) | (9,128,228 | ) | (340,457 | ) | (10,702,458 | ) | ||||||||
|
| |||||||||||||||
Net increase | 2,075 | $ | 77,118 | 146,365 | $ | 4,522,854 | ||||||||||
|
| |||||||||||||||
Class Y | ||||||||||||||||
Sold | 7,974,019 | $ | 259,208,467 | 18,225,483 | $ | 595,053,057 | ||||||||||
Dividends and/or distributions reinvested | 112,496 | 3,597,628 | 60,821 | 1,884,243 | ||||||||||||
Redeemed | (6,620,386 | ) | (213,924,984 | ) | (3,759,203 | ) | (124,018,649 | ) | ||||||||
|
| |||||||||||||||
Net increase | 1,466,129 | $ | 48,881,111 | 14,527,101 | $ | 472,918,651 | ||||||||||
|
| |||||||||||||||
1. Effective July 1, 2014, Class N shares were renamed Class R.
6. Purchases and Sales of Securities
The aggregate cost of purchases and proceeds from sales of securities, other than short-term obligations and investments in IMMF, for the six months ended February 27, 2015 were as follows:
| Purchases | Sales | |||||||
Investment securities | $ | 409,192,753 | $ | 306,414,114 | ||||
7. Fees and Other Transactions with Affiliates
Management Fees. Under the investment advisory agreement, the Fund pays the Manager a management fee based on the daily net assets of the Fund at an annual rate as shown in the following table:
40 OPPENHEIMER INTERNATIONAL SMALL COMPANY FUND
7. Fees and Other Transactions with Affiliates (Continued) |
| Fee Schedule | ||||
Up to $250 million | 0.80 | % | ||
Next $250 million | 0.77 | |||
Next $500 million | 0.75 | |||
Next $1 billion | 0.69 | |||
Next $4 billion | 0.67 | |||
Over $6 billion | 0.65 | |||
The Fund’s management fee for the fiscal six months ended February 27, 2015 was 0.71% of average annual net assets before any applicable waivers.
Sub-Adviser Fees. The Manager has retained the Sub-Adviser to provide the day-to-day portfolio management of the Fund. Under the Sub-Advisory Agreement, the Manager pays the Sub-Adviser an annual fee in monthly installments, equal to a percentage of the investment management fee collected by the Manager from the Fund, which shall be calculated after any investment management fee waivers. The fee paid to the Sub-Adviser is paid by the Manager, not by the Fund.
Transfer Agent Fees. OFI Global (the “Transfer Agent”) serves as the transfer and shareholder servicing agent for the Fund. The Fund pays the Transfer Agent a fee based on annual net assets. Fees incurred and average net assets for each class with respect to these services are detailed in the Statement of Operations and Financial Highlights, respectively.
Sub-Transfer Agent Fees. The Transfer Agent has retained Shareholder Services, Inc., a wholly-owned subsidiary of OFI (the “Sub-Transfer Agent”), to provide the day-to-day transfer agent and shareholder servicing of the Fund. Under the Sub-Transfer Agency Agreement, the Transfer Agent pays the Sub-Transfer Agent an annual fee in monthly installments, equal to a percentage of the transfer agent fee collected by the Transfer Agent from the Fund, which shall be calculated after any applicable fee waivers. The fee paid to the Sub-Transfer Agent is paid by the Transfer Agent, not by the Fund.
Trustees’ Compensation. The Fund has adopted an unfunded retirement plan (the “Plan”) for the Fund’s Independent Trustees. Benefits are based on years of service and fees paid to each Trustee during their period of service. The Plan was frozen with respect to adding new participants effective December 31, 2006 (the “Freeze Date”) and existing Plan Participants as of the Freeze Date will continue to receive accrued benefits under the Plan. Active Independent Trustees as of the Freeze Date have each elected a distribution method with respect to their benefits under the Plan. During the six months ended February 27, 2015, the Fund’s projected benefit obligations, payments to retired Trustees and accumulated liability were as follows:
Projected Benefit Obligations Increased | $ | — | ||
Payments Made to Retired Trustees | 14,435 | |||
Accumulated Liability as of February 27, 2015 | 114,395 |
The Fund’s Board of Trustees (“Board”) has adopted a compensation deferral plan for Independent Trustees that enables Trustees to elect to defer receipt of all or a portion of the
41 OPPENHEIMER INTERNATIONAL SMALL COMPANY FUND
| NOTES TO FINANCIAL STATEMENTS Unaudited / Continued |
|
7. Fees and Other Transactions with Affiliates (Continued)
annual compensation they are entitled to receive from the Fund. For purposes of determining the amount owed to the Trustee under the plan, deferred amounts are treated as though equal dollar amounts had been invested in shares of the Fund or in other Oppenheimer funds selected by the Trustee. The Fund purchases shares of the funds selected for deferral by the Trustee in amounts equal to his or her deemed investment, resulting in a Fund asset equal to the deferred compensation liability. Such assets are included as a component of “Other” within the asset section of the Statement of Assets and Liabilities. Deferral of Trustees’ fees under the plan will not affect the net assets of the Fund and will not materially affect the Fund’s assets, liabilities or net investment income per share. Amounts will be deferred until distributed in accordance with the compensation deferral plan.
Distribution and Service Plan (12b-1) Fees. Under its General Distributor’s Agreement with the Fund, OppenheimerFunds Distributor, Inc. (the “Distributor”) acts as the Fund’s principal underwriter in the continuous public offering of the Fund’s classes of shares.
Service Plan for Class A Shares. The Fund has adopted a Service Plan (the “Plan”) for Class A shares pursuant to Rule 12b-1 under the 1940 Act. Under the Plan, the Fund reimburses the Distributor for a portion of its costs incurred for services provided to accounts that hold Class A shares. Reimbursement is made periodically at an annual rate of up to 0.25% of the daily net assets of Class A shares of the Fund. The Distributor currently uses all of those fees to pay dealers, brokers, banks and other financial institutions periodically for providing personal service and maintenance of accounts of their customers that hold Class A shares. Any unreimbursed expenses the Distributor incurs with respect to Class A shares in any fiscal year cannot be recovered in subsequent periods. Fees incurred by the Fund under the Plan are detailed in the Statement of Operations.
Distribution and Service Plans for Class B, Class C and Class R Shares. The Fund has adopted Distribution and Service Plans (the “Plans”) for Class B, Class C and Class R shares pursuant to Rule 12b-1 under the 1940 Act to compensate the Distributor for distributing those share classes, maintaining accounts and providing shareholder services. Under the Plans, the Fund pays the Distributor an annual asset-based sales charge of 0.75% on Class B and Class C shares daily net assets and 0.25% on Class R shares daily net assets. The Fund also pays a service fee under the Plans at an annual rate of 0.25% of daily net assets. The Plans continue in effect from year to year only if the Fund’s Board of Trustees vote annually to approve its continuance at an in person meeting called for that purpose. Fees incurred by the Fund under the Plans are detailed in the Statement of Operations.
Sales Charges. Front-end sales charges and CDSC do not represent expenses of the Fund. They are deducted from the proceeds of sales of Fund shares prior to investment or from redemption proceeds prior to remittance, as applicable. The sales charges retained by the Distributor from the sale of shares and the CDSC retained by the Distributor on the redemption of shares is shown in the following table for the period indicated.
42 OPPENHEIMER INTERNATIONAL SMALL COMPANY FUND
|
7. Fees and Other Transactions with Affiliates (Continued) |
| Class A | Class B | Class C | Class R | |||||||||||||||||
| Class A | Contingent | Contingent | Contingent | Contingent | ||||||||||||||||
| Front-End | Deferred Sales | Deferred Sales | Deferred Sales | Deferred Sales | ||||||||||||||||
| Sales Charges | Charges | Charges | Charges | Charges | ||||||||||||||||
| Retained by | Retained by | Retained by | Retained by | Retained by | ||||||||||||||||
| Six Months Ended | Distributor | Distributor | Distributor | Distributor | Distributor | |||||||||||||||
February 27, 2015 | $133,820 | $— | $3,223 | $42,489 | $2,736 | |||||||||||||||
Waivers and Reimbursements of Expenses. The Manager will waive fees and/or reimburse Fund expenses in an amount equal to the indirect management fees incurred through the Fund’s investment in IMMF. During the six months ended February 27, 2015, the Manager waived fees and/or reimbursed the Fund $134,491 for IMMF management fees.
These undertakings may be modified or terminated as set forth according to the terms in the prospectus.
8. Pending Litigation
In 2009, seven class action lawsuits were filed in the U.S. District Court for the District of Colorado against OppenheimerFunds, Inc. (“OFI”), OppenheimerFunds Distributor, Inc., the Fund’s principal underwriter and distributor (the “Distributor”), and certain funds – including the Fund – advised by OFI Global Asset Management, Inc. and distributed by the Distributor (the “Defendant Funds”). The lawsuits also named as defendants certain officers and current and former trustees of the respective Defendant Funds. The lawsuits raised claims under federal securities laws and alleged, among other things, that the disclosure documents of the respective Defendant Funds contained misrepresentations and omissions and that the respective Defendant Funds’ investment policies were not followed. The plaintiffs in these actions sought unspecified damages, equitable relief and awards of attorneys’ fees and litigation expenses. The Defendant Funds’ Boards of Trustees also engaged counsel to represent the Funds and the present and former Independent Trustees named in those suits. In March 2014, the parties – including the Fund – in six of these lawsuits executed stipulations and agreements of settlement resolving those actions. In July 2014, the court entered an order and final judgment approving the settlements as fair, reasonable and adequate. The settlements do not resolve a seventh outstanding lawsuit relating to Oppenheimer Rochester California Municipal Fund (the “California Fund Suit”). OFI believes the California Fund Suit is without legal merit and is defending the suit vigorously. While it is premature to render any opinion as to the outcome in the California Fund Suit, or whether any costs that OFI may bear in defending the California Fund Suit might not be reimbursed by insurance, OFI believes the California Fund Suit should not impair the ability of OFI or the Distributor to perform their respective duties to the Fund, and that the outcome of the California Fund Suit should not have any material effect on the operations of any of the Oppenheimer funds.
43 OPPENHEIMER INTERNATIONAL SMALL COMPANY FUND
SUB-ADVISORY AGREEMENTS Unaudited
|
The Fund has entered into an investment advisory agreement with OFI Global Asset Management, Inc. (“OFI Global” or the “Adviser”), a wholly-owned subsidiary of OppenheimerFunds, Inc. (“OFI” or the “Sub-Adviser”) (“OFI Global” and “OFI” together the “Managers”) and OFI Global has entered into a sub-advisory agreement with OFI whereby OFI provides investment sub-advisory services to the Fund (collectively, the “Agreements”). Each year, the Board of Trustees (the “Board”), including a majority of the independent Trustees, is required to determine whether to renew the Agreements. The Investment Company Act of 1940, as amended, requires that the Board request and evaluate, and that the Managers provide, such information as may be reasonably necessary to evaluate the terms of the Agreements. The Board employs an independent consultant to prepare a report that provides information, including comparative information that the Board requests for that purpose. In addition to in-person meetings focused on this evaluation, the Board receives information throughout the year regarding Fund services, fees, expenses and performance.
The Adviser, Sub-Adviser and the independent consultant provided information to the Board on the following factors: (i) the nature, quality and extent of the Managers’ services, (ii) the investment performance of the Fund and the Managers, (iii) the fees and expenses of the Fund, including comparative expense information, (iv) the profitability of the Managers and their affiliates, including an analysis of the cost of providing services, (v) whether economies of scale are realized as the Fund grows and whether fee levels reflect these economies of scale for Fund investors and (vi) other benefits to the Managers from their relationship with the Fund. The Board was aware that there are alternatives to retaining the Managers.
Outlined below is a summary of the principal information considered by the Board as well as the Board’s conclusions.
Nature, Quality and Extent of Services. The Board considered information about the nature, quality and extent of the services provided to the Fund and information regarding the Managers’ key personnel who provide such services. The Sub-Adviser’s duties include providing the Fund with the services of the portfolio manager and the Sub-Adviser’s investment team, who provide research, analysis and other advisory services in regard to the Fund’s investments; securities trading services; oversight of third-party service providers; monitoring compliance with applicable Fund policies and procedures and adherence to the Fund’s investment restrictions; and risk management. The Managers are responsible for providing certain administrative services to the Fund as well. Those services include providing and supervising all administrative and clerical personnel who are necessary in order to provide effective corporate administration for the Fund; compiling and maintaining records with respect to the Fund’s operations; preparing and filing reports required by the Securities and Exchange Commission; preparing periodic reports regarding the operations of the Fund for its shareholders; preparing proxy materials for shareholder meetings; and preparing the registration statements required by Federal and state securities laws for the sale of the Fund’s shares. The Managers also provide the Fund with office space, facilities and equipment.
The Board also considered the quality of the services provided and the quality of the Managers’ resources that are available to the Fund. The Board took account of the fact that the Sub-Adviser has had over fifty years of experience as an investment adviser and that its assets under management rank it among the top mutual fund managers in the United States. The Board evaluated the Sub-Adviser’s advisory, administrative, accounting, legal, compliance
44 OPPENHEIMER INTERNATIONAL SMALL COMPANY FUND
services and risk management, and information the Board has received regarding the experience and professional qualifications of the Managers’ key personnel and the size and functions of its staff. In its evaluation of the quality of the portfolio management services provided, the Board considered the experience of Rezo Kanovich, the portfolio manager for the Fund, and the Sub-Adviser’s investment team and analysts. The Board members also considered the totality of their experiences with the Managers as directors or trustees of the Fund and other funds advised by the Managers. The Board considered information regarding the quality of services provided by affiliates of the Managers, which its members have become knowledgeable about in connection with the renewal of the Fund’s service agreements. The Board concluded, in light of the Managers’ experience, reputation, personnel, operations and resources that the Fund benefits from the services provided under the Agreements.
Investment Performance of the Adviser and the Fund. Throughout the year, the Adviser provided information on the investment performance of the Fund, including comparative performance information. The Board also reviewed information, prepared by the Adviser and by the independent consultant, comparing the Fund’s historical performance to relevant market indices and to the performance of other retail funds in the Foreign Small/Mid Growth category. The Board noted that the Fund’s one-year, three-year, five-year and ten-year performance was better than its category median.
Costs of Services by the Adviser. The Board reviewed the fees paid to the Adviser and the other expenses borne by the Fund. The independent consultant provided comparative data in regard to the fees and expenses of the Fund and other retail front-end load Foreign Small/Mid Growth funds with comparable asset levels and distribution features. The Fund’s contractual management fees and total expenses were lower than its peer group median and category median.
Economies of Scale and Profits Realized by the Managers. The Board considered information regarding OFI Global’s costs in serving as the Fund’s investment adviser, including the costs associated with the personnel and systems necessary to manage the Fund, and information regarding the Managers’ profitability from their relationship with the Fund. The Board reviewed whether the Managers may realize economies of scale in managing and supporting the Fund. The Board noted that the Fund currently has management fee breakpoints, which are intended to share with Fund shareholders economies of scale that may exist as the Fund’s assets grow.
Other Benefits to the Managers. In addition to considering the profits realized by the Managers, the Board considered information that was provided regarding the direct and indirect benefits the Managers receive as a result of their relationship with the Fund, including compensation paid to the Managers’ affiliates and research provided to the Adviser in connection with permissible brokerage arrangements (soft dollar arrangements). The Board also considered that the Managers must be able to pay and retain experienced professional personnel at competitive rates to provide quality services to the Fund.
Conclusions. These factors were also considered by the independent Trustees meeting separately from the full Board, assisted by experienced counsel to the Fund and to the independent Trustees. Fund counsel and the independent Trustees’ counsel are independent of the Managers within the meaning and intent of the Securities and Exchange Commission Rules.
45 OPPENHEIMER INTERNATIONAL SMALL COMPANY FUND
BOARD APPROVAL OF THE FUND’S INVESTMENT ADVISORY AND SUB-ADVISORY AGREEMENTS Unaudited / Continued |
Based on its review of the information it received and its evaluations described above, the Board, including a majority of the independent Trustees, decided to continue the Agreements through September 30, 2015. In arriving at its decision, the Board did not identify any factor or factors as being more important than others, but considered all of the above information, and considered the terms and conditions of the Agreements, including the management fees, in light of all the surrounding circumstances.
46 OPPENHEIMER INTERNATIONAL SMALL COMPANY FUND
PORTFOLIO PROXY VOTING POLICIES AND PROCEDURES; UPDATES TO STATEMENTS OF INVESTMENTS Unaudited |
|
The Fund has adopted Portfolio Proxy Voting Policies and Procedures under which the Fund votes proxies relating to securities (“portfolio proxies”) held by the Fund. A description of the Fund’s Portfolio Proxy Voting Policies and Procedures is available (i) without charge, upon request, by calling the Fund toll-free at 1.800.CALL OPP (225.5677), (ii) on the Fund’s website at www.oppenheimerfunds.com, and (iii) on the SEC’s website at www.sec.gov. In addition, the Fund is required to file Form N-PX, with its complete proxy voting record for the
12 months ended June 30th, no later than August 31st of each year. The Fund’s voting record is available (i) without charge, upon request, by calling the Fund toll-free at 1.800.CALL OPP (225.5677), and (ii) in the Form N-PX filing on the SEC’s website at www.sec.gov.
The Fund files its complete schedule of portfolio holdings with the SEC for the first quarter and the third quarter of each fiscal year on Form N-Q. The Fund’s Form N-Q filings are available on the SEC’s website at www.sec.gov. Those forms may be reviewed and copied at the SEC’s Public Reference Room in Washington, D.C. Information on the operation of the Public Reference Room may be obtained by calling 1-800-SEC-0330.
Householding—Delivery of Shareholder Documents
This is to inform you about OppenheimerFunds’ “householding” policy. If more than one member of your household maintains an account in a particular fund, OppenheimerFunds will mail only one copy of the fund’s prospectus (or, if available, the fund’s summary prospectus), annual and semiannual report and privacy policy. The consolidation of these mailings, called householding, benefits your fund through reduced mailing expense, and benefits you by reducing the volume of mail you receive from OppenheimerFunds. Householding does not affect the delivery of your account statements.
Please note that we will continue to household these mailings for as long as you remain an OppenheimerFunds shareholder, unless you request otherwise. If you prefer to receive multiple copies of these materials, please call us at 1.800.CALL-OPP (225-5677). You may also notify us in writing or via email. We will begin sending you individual copies of the prospectus (or, if available, the summary prospectus), reports and privacy policy within 30 days of receiving your request to stop householding.
47 OPPENHEIMER INTERNATIONAL SMALL COMPANY FUND
OPPENHEIMER INTERNATIONAL SMALL COMPANY FUND
| Trustees and Officers | Brian F. Wruble, Chairman of the Board of Trustees and Trustee | |
| David K. Downes, Trustee | ||
| Matthew P. Fink, Trustee | ||
| Edmund P. Giambastiani, Jr., Trustee | ||
| Elizabeth Krentzman, Trustee | ||
| Mary F. Miller, Trustee | ||
| Joel W. Motley, Trustee | ||
| Joanne Pace, Trustee | ||
| Daniel Vandivort, Trustee | ||
| Peter I. Wold, Trustee | ||
| Rezo Kanovich, Vice President | ||
| William F. Glavin, Jr., Trustee | ||
| Arthur P. Steinmetz, President and Principal Executive Officer | ||
| Arthur S. Gabinet, Secretary and Chief Legal Officer | ||
| Jennifer Sexton, Vice President and Chief Business Officer | ||
| Mary Ann Picciotto, Chief Compliance Officer and Chief Anti-Money Laundering Officer | ||
| Brian W. Wixted, Treasurer and Principal Financial & Accounting Officer | ||
| Manager | OFI Global Asset Management, Inc. | |
| Sub-Adviser | OppenheimerFunds, Inc. | |
| Distributor | OppenheimerFunds Distributor, Inc. | |
| Transfer and Shareholder Servicing Agent | OFI Global Asset Management, Inc. | |
| Sub-Transfer Agent | Shareholder Services, Inc. DBA OppenheimerFunds Services | |
| Independent Registered Public Accounting Firm | KPMG LLP | |
| Legal Counsel | Kramer Levin Naftalis & Frankel LLP | |
| The financial statements included herein have been taken from the records of the Fund without examination of those records by the independent registered public accounting firm. | ||
© 2015 OppenheimerFunds, Inc. All rights reserved.
48 OPPENHEIMER INTERNATIONAL SMALL COMPANY FUND
As an Oppenheimer fund shareholder, you are entitled to know how we protect your personal information and how we limit its disclosure.
Information Sources
We obtain nonpublic personal information about our shareholders from the following sources:
| • | Applications or other forms |
| • | When you create a user ID and password for online account access |
| • | When you enroll in eDocs Direct, our electronic document delivery service |
| • | Your transactions with us, our affiliates or others |
| • | A software program on our website, often referred to as a “cookie,” which indicates which parts of our site you’ve visited |
| • | When you set up challenge questions to reset your password online |
If you visit oppenheimerfunds.com and do not log on to the secure account information areas, we do not obtain any personal information about you. When you do log on to a secure area, we do obtain your user ID and password to identify you. We also use this information to provide you with products and services you have requested, to inform you about products and services that you may be interested in and assist you in other ways.
We do not collect personal information through our website unless you willingly provide it to us, either directly by email or in those areas of the website that request information. In order to update your personal information (including your mailing address, email address and phone number) you must first log on and visit your user profile.
If you have set your browser to warn you before accepting cookies, you will receive the warning message with each cookie. You can refuse cookies by turning them off in your browser. However, doing so may limit your access to certain sections of our website.
We use cookies to help us improve and manage our website. For example, cookies help us recognize new versus repeat visitors to the site, track the pages visited, and enable some special features on the website. This data helps us provide a better service for our website visitors.
Protection of Information
We do not disclose any non-public personal information (such as names on a customer list) about current or former customers to anyone, except as permitted by law.
Disclosure of Information
Copies of confirmations, account statements and other documents reporting activity in your fund accounts are made available to your financial advisor (as designated by you). We may also use details about you and your investments to help us, our financial service affiliates, or firms that jointly market their financial products and services with ours, to better serve your investment needs or suggest financial services or educational material that may be of interest to you. If this requires us to provide you with an opportunity to “opt in” or “opt out” of such information sharing with a firm not affiliated with us, you will receive notification on how to do so, before any such sharing takes place.
Right of Refusal
We will not disclose your personal information to unaffiliated third parties (except as permitted by law), unless we first offer you a reasonable opportunity to refuse or “opt out” of such disclosure.
49 OPPENHEIMER INTERNATIONAL SMALL COMPANY FUND
| PRIVACY POLICY NOTICE Continued |
Internet Security and Encryption
In general, the email services provided by our website are encrypted and provide a secure and private means of communication with us. To protect your own privacy, confidential and/or personal information should only be communicated via email when you are advised that you are using a secure website. As a security measure, we do not include personal or account information in non-secure emails, and we advise you not to send such information to us in non-secure emails. Instead, you may take advantage of the secure features of our website to encrypt your email correspondence. To do this, you will need to use a browser that supports Secure Sockets Layer (SSL) protocol.
We do not guarantee or warrant that any part of our website, including files available for download, are free of viruses or other harmful code. It is your responsibility to take appropriate precautions, such as use of an anti-virus software package, to protect your computer hardware and software.
| • | All transactions, including redemptions, exchanges and purchases, are secured by SSL and 256-bit encryption. SSL is used to establish a secure connection between your PC and OppenheimerFunds’ server. It transmits information in an encrypted and scrambled format. |
| • | Encryption is achieved through an electronic scrambling technology that uses a “key” to code and then decode the data. Encryption acts like the cable converter box you may have on your television set. It scrambles data with a secret code so that no one can make sense of it while it is being transmitted. When the data reaches its destination, the same software unscrambles the data. |
| • | You can exit the secure area by either closing your browser, or for added security, you can use the Log Out button before you close your browser. |
Other Security Measures
We maintain physical, electronic and procedural safeguards to protect your personal account information. Our employees and agents have access to that information only so that they may offer you products or provide services, for example, when responding to your account questions.
How You Can Help
You can also do your part to keep your account information private and to prevent unauthorized transactions. If you obtain a user ID and password for your account, do not allow it to be used by anyone else. Also, take special precautions when accessing your account on a computer used by others.
Who We Are
This joint notice describes the privacy policies of the Oppenheimer funds, OppenheimerFunds, Inc., each of its investment adviser subsidiaries, OppenheimerFunds Distributor, Inc. and OFI Global Trust Co. It applies to all Oppenheimer fund accounts you presently have, or may open in the future, using your Social Security number—whether or not you remain a shareholder of our funds. This notice was last updated March 2015. In the event it is updated or changed, we will post an updated notice on our website at oppenheimerfunds.com. If you have any questions about this privacy policy, write to us at P.O. Box 5270, Denver, CO 80217-5270, email us by clicking on the Contact Us section of our website at oppenheimerfunds.com or call us at 1.800.CALL OPP (225.5677).
50 OPPENHEIMER INTERNATIONAL SMALL COMPANY FUND
THIS PAGE INTENTIONALLY LEFT BLANK.
51 OPPENHEIMER INTERNATIONAL SMALL COMPANY FUND
THIS PAGE INTENTIONALLY LEFT BLANK.
52 OPPENHEIMER INTERNATIONAL SMALL COMPANY FUND
THIS PAGE INTENTIONALLY LEFT BLANK.
53 OPPENHEIMER INTERNATIONAL SMALL COMPANY FUND
THIS PAGE INTENTIONALLY LEFT BLANK.
54 OPPENHEIMER INTERNATIONAL SMALL COMPANY FUND
THIS PAGE INTENTIONALLY LEFT BLANK.
55 OPPENHEIMER INTERNATIONAL SMALL COMPANY FUND
Item 2. Code of Ethics.
Not applicable to semiannual reports.
Item 3. Audit Committee Financial Expert.
Not applicable to semiannual reports.
Item 4. Principal Accountant Fees and Services.
Not applicable to semiannual reports.
Item 5. Audit Committee of Listed Registrants
Not applicable.
Item 6. Schedule of Investments.
a) Not applicable. The complete schedule of investments is included in Item 1 of this Form N-CSR.
b) Not applicable.
Item 7. Disclosure of Proxy Voting Policies and Procedures for Closed-End Management Investment Companies.
Not applicable.
Item 8. Portfolio Managers of Closed-End Management Investment Companies.
Not applicable.
Item 9. Purchases of Equity Securities by Closed-End Management Investment Company and Affiliated Purchasers.
Not applicable.
Item 10. Submission of Matters to a Vote of Security Holders.
The Fund’s Governance Committee Provisions with Respect to Nominations of Directors/Trustees to the Respective Boards
None
Item 11. Controls and Procedures.
Based on their evaluation of the registrant’s disclosure controls and procedures (as defined in rule 30a-3(c) under the Investment Company Act of 1940 (17 CFR 270.30a-3(c)) as of 2/27/2015, the registrant’s principal executive officer and principal financial officer found the registrant’s disclosure controls and procedures to provide reasonable assurances that information required to be disclosed by the registrant in the reports that it files under the Securities Exchange Act of 1934 (a) is accumulated and communicated to registrant’s management, including its principal executive officer and principal financial officer, to allow timely decisions regarding required disclosure, and (b) is recorded, processed, summarized and reported, within the time periods specified in the rules and forms adopted by the U.S. Securities and Exchange Commission.
There have been no changes in the registrant’s internal controls over financial reporting that occurred during the registrant’s second fiscal quarter of the period covered by this report that have materially affected, or are reasonably likely to materially affect, the registrant’s internal control over financial reporting.
Item 12. Exhibits.
| (a) | (1) Not applicable to semiannual reports. |
(2) Exhibits attached hereto.
(3) Not applicable.
| (b) | Exhibit attached hereto. |
SIGNATURES
Pursuant to the requirements of the Securities Exchange Act of 1934 and the Investment Company Act of 1940, the registrant has duly caused this report to be signed on its behalf by the undersigned, thereunto duly authorized.
Oppenheimer International Small Company Fund
| By: | /s/ Arthur P. Steinmetz | |
| Arthur P. Steinmetz | ||
| Principal Executive Officer | ||
| Date: | 4/10/2015 |
Pursuant to the requirements of the Securities Exchange Act of 1934 and the Investment Company Act of 1940, this report has been signed below by the following persons on behalf of the registrant and in the capacities and on the dates indicated.
| By: | /s/ Arthur P. Steinmetz | |
| Arthur P. Steinmetz | ||
| Principal Executive Officer | ||
| Date: | 4/10/2015 |
| By: | /s/ Brian W. Wixted | |
| Brian W. Wixted | ||
| Principal Financial Officer | ||
| Date: | 4/10/2015 |