                                  UNITED STATES
                       SECURITIES AND EXCHANGE COMMISSION
                             Washington, D.C. 20549

                                   FORM N-CSR

                   CERTIFIED SHAREHOLDER REPORT OF REGISTERED
                         MANAGEMENT INVESTMENT COMPANIES

Investment Company Act file number: 811-08265

Morgan Stanley S&P 500 Index Fund
               (Exact name of registrant as specified in charter)

1221 Avenue of the Americas, New York, New York 10020
       (Address of principal executive offices)               (Zip code)

Ronald E. Robison
1221 Avenue of the Americas, New York, New York 10020
                     (Name and address of agent for service)

Registrant's telephone number, including area code: 212-762-4000

Date of fiscal year end: August 31, 2003

Date of reporting period: August 31, 2003
Item 1 - Report to Shareholders
Welcome, Shareholder:
In this report, you'll learn about how your investment in Morgan Stanley S&P 500 Index Fund performed during the annual period. We will provide an overview of the market conditions, and discuss some of the factors that affected performance during the reporting period. In addition, this report includes the Fund's financial statements and a list of Fund investments.
| This material must be preceded or accompanied by a prospectus for the fund being offered. Market forecasts provided in this report may not necessarily come to pass. There is no assurance that the Fund will achieve its investment objective. The Fund is subject to market risk, which is the possibility that the market values of securities owned by the Fund will decline and, therefore, the value of the Fund shares may be less than what you paid for them. Accordingly you can lose money investing in this Fund. |
| Fund Report | |
| For the year ended August 31, 2003 | |
Total Return for the 12-Month Period Ended August 31, 2003
| Class A | Class B | Class C | Class D | S&P 500 Index1 | Lipper S&P 500 Funds Index2 | |||||||||||||||||||||||||||
| 11.36% | 10.42 | % | 10.42 | % | 11.59 | % | 12.06 | % | 11.70 | % | ||||||||||||||||||||||
| The performance of the Fund's four share classes varies because each has different expenses. The Fund's total return figures assume the reinvestment of all distributions but do not reflect the deduction of any applicable sales charges. Such costs would lower performance. Past performance is no guarantee of future results. See Performance Summary for standardized performance information. |
Market Conditions
Throughout the fiscal year ended August 31, 2003, the economic data regarding the economy's underlying strength gave off mixed signals. Investor confidence continued to waver during the early part of the period, aggravated by concerns about corporate governance and a perceived lack of balance sheet integrity. Although the weakness in equities was fairly broadly based, technology companies were hit especially hard as corporations trimmed their capital spending on equipment. In addition, downward earnings revisions continued to afflict the telecommunications sector. Investor sentiment was further dampened by geopolitical tensions leading up to the war in Iraq.
While these negative forces were the ones that held investors' attention during most of the first three months of 2003, under the surface the financial conditions were improving. Accommodative fiscal and monetary policy signaled to many that the economy might potentially recover in the near future. Recognizing strong values among equities, investors began to return to the market by the end of March. The surprisingly quick resolution to the Iraq conflict prompted a strong market rally that saw the S&P 500 Index appreciate more than 25 percent from its mid-March lows. By August 31, the Index had posted six consecutive positive months, a feat it had not accomplished since November 1997.
Performance Analysis
The Fund's performance was dominated by a sharp second-quarter-2003 rally triggered by the onset and rapid conclusion of major military activity in Iraq. While the rally was fairly broadly based, with all market sectors posting positive returns, a few areas were notable standouts. Technology and financials, among those that had suffered the worst during the bear market, could count themselves among the best performers during the rebound, to some degree because of what we considered low valuations. Consumer discretionary issues, information technology and the materials sectors, which had all been shunned by the market earlier, posted strong returns in anticipation of improving economic conditions. Conversely, more-defensive sectors such as consumer staples and health care proved to be notable laggards.
2
| TOP 10 HOLDINGS | ||||||
| General Electric | 3.1 | % | ||||
| Microsoft | 3.0 | |||||
| Wal-Mart | 2.8 | |||||
| Exxon Mobil | 2.7 | |||||
| Pfizer | 2.5 | |||||
| Citigroup | 2.4 | |||||
| Intel | 2.0 | |||||
| American International Group | 1.7 | |||||
| Johnson & Johnson | 1.6 | |||||
| IBM | 1.5 | |||||
| LARGEST INDUSTRIES | ||||||
| Pharmaceuticals, Major | 8.1 | % | ||||
| Industrial Conglomerates | 5.1 | |||||
| Major Banks | 4.9 | |||||
| Packaged Software | 4.5 | |||||
| Financial Conglomerates | 4.3 | |||||
| Subject to change daily. All percentages are as a percentage of net assets. Provided for informational purposes only and should not be deemed as a recommendation to buy the securities mentioned. Morgan Stanley is a full-service securities firm engaged in securities trading and brokerage activities, investment banking, research and analysis, financing and financial advisory services. |
Investment Strategy
The Fund invests in stocks in approximately the same proportion as they are represented in the S&P 500 Index and is therefore diversified among 500 stocks in many of America's leading industries.
Annual Householding Notice
To reduce printing and mailing costs, the Fund attempts to eliminate duplicate mailings to the same address. The Fund delivers a single copy of certain shareholder documents including shareholder reports, prospectuses and proxy materials to investors with the same last name and who reside at the same address. Your participation in this program will continue for an unlimited period of time, unless you instruct us otherwise. You can request multiple copies of these documents by calling (800) 350-6414, 8:00 am to 8:00 pm, ET. Once our Customer Service Center has received your instructions, we will begin sending individual copies for each account within 30 days.
Proxy Voting Policies and Procedures
A description of the Fund's policies and procedures with respect to the voting of proxies relating to the Fund's portfolio securities is available without charge, upon request, by calling (800) 869-NEWS (6397). This information is also available on the Securities and Exchange Commission's Web site at http://www.sec.gov.
3
| Performance Summary | |
Performance of a $10,000 Investment
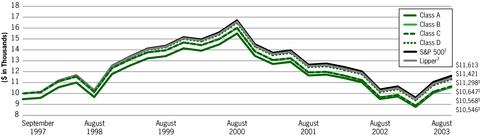
| Past performance is not predictive of future returns. Investment return and principal value will fluctuate. When you sell fund shares, they may be worth less than their original cost. The graph and table do not reflect the deduction of taxes that a shareholder would pay on fund distributions or the redemption of fund shares. Performance for Class A, Class B, Class C, and Class D shares will vary due to differences in sales charges and expenses. |
4
Average Annual Total Returns — Period Ended August 31, 2003
| Class A Shares* (since 09/26/97) | Class B Shares** (since 09/26/97) | Class C Shares† (since 09/26/97) | Class D Shares†† (since 09/26/97) | |||||||||||||||||||||||
| Symbol | SPIAX | SPIBX | SPICX | SPIDX | ||||||||||||||||||||||
| 1 Year | 11.36% | 3 | 10.42% | 3 | 10.42% | 3 | 11.59% | 3 | ||||||||||||||||||
| 5.51 | 4 | 5.42 | 4 | 9.42 | 4 | |||||||||||||||||||||
| 5 Years | 1.79 | 3 | 0.98 | 3 | 0.99 | 3 | 2.01 | 3 | ||||||||||||||||||
| 0.70 | 4 | 0.60 | 4 | 0.99 | 4 | |||||||||||||||||||||
| Since Inception | 1.86 | 3 | 1.06 | 3 | 1.06 | 3 | 2.08 | 3 | ||||||||||||||||||
| 0.94 | 4 | 0.90 | 4 | 1.06 | 4 | |||||||||||||||||||||
Notes on Performance
| (1) | The Standard and Poor's 500 Index (S&P 500®) is a broad-based index, the performance of which is based on the performance of 500 widely-held common stocks chosen for market size, liquidity and industry group representation. Indexes are unmanaged and their returns do not include any sales charges or fees. Such costs would lower performance. It is not possible to invest directly in an index. |
| (2) | The Lipper S&P 500 Funds Index is an equally weighted performance index of the largest qualifying funds (based on net assets) in the Lipper S&P 500 Funds classification. The Index, which is adjusted for capital gains distributions and income dividends, is unmanaged and should not be considered an investment. There are currently 30 funds represented in this Index. |
| (3) | Figure shown assumes reinvestment of all distributions and does not reflect the deduction of any sales charges. |
| (4) | Figure shown assumes reinvestment of all distributions and the deduction of the maximum applicable sales charge. See the Fund's current prospectus for complete details on fees and sales charges. |
| * | The maximum front-end sales charge for Class A is 5.25%. |
| ** | The maximum contingent deferred sales charge (CDSC) for Class B is 5.0%. The CDSC declines to 0% after six years. |
| † | The maximum contingent deferred sales charge for Class C is 1% for shares redeemed within one year of purchase. |
| †† | Class D has no sales charge. |
| ‡ | Closing value assuming a complete redemption on August 31, 2003. |
5
Morgan Stanley S&P 500 Index Fund
Portfolio of Investments  August 31, 2003
| NUMBER OF SHARES | VALUE | ||||||||||
| Common Stocks (98.7%) | |||||||||||
| Advertising/Marketing Services (0.2%) | |||||||||||
| 71,772 | Interpublic Group of Companies, Inc. | $ | 1,087,346 | ||||||||
| 34,726 | Omnicom Group, Inc. | 2,712,101 | |||||||||
| 3,799,447 | |||||||||||
| Aerospace & Defense (1.1%) | |||||||||||
| 154,873 | Boeing Co. | 5,790,701 | |||||||||
| 36,355 | General Dynamics Corp. | 3,130,529 | |||||||||
| 21,652 | Goodrich Corp. | 563,602 | |||||||||
| 82,909 | Lockheed Martin Corp. | 4,247,428 | |||||||||
| 33,692 | Northrop Grumman Corp. | 3,216,912 | |||||||||
| 75,626 | Raytheon Co. | 2,424,570 | |||||||||
| 32,796 | Rockwell Collins, Inc. | 887,132 | |||||||||
| 20,260,874 | |||||||||||
| Agricultural Commodities/ Milling (0.1%) | |||||||||||
| 118,747 | Archer-Daniels-Midland Co. | 1,647,021 | |||||||||
| Air Freight/Couriers (1.0%) | |||||||||||
| 54,955 | FedEx Corp. | 3,687,480 | |||||||||
| 207,279 | United Parcel Service, Inc. (Class B) | 13,008,830 | |||||||||
| 16,696,310 | |||||||||||
| Airlines (0.1%) | |||||||||||
| 22,724 | Delta Air Lines, Inc. | 292,458 | |||||||||
| 143,474 | Southwest Airlines Co. | 2,451,971 | |||||||||
| 2,744,429 | |||||||||||
| Alternative Power Generation (0.0%) | |||||||||||
| 70,518 | Calpine Corp.* | 397,722 | |||||||||
| Aluminum (0.2%) | |||||||||||
| 155,696 | Alcoa, Inc. | 4,446,678 | |||||||||
| Apparel/Footwear (0.4%) | |||||||||||
| 31,400 | Cintas Corp. | 1,253,802 | |||||||||
| 23,563 | Jones Apparel Group, Inc. | 727,861 | |||||||||
| 19,775 | Liz Claiborne, Inc. | 681,644 | |||||||||
| 48,627 | Nike, Inc. (Class B) | 2,770,766 | |||||||||
| 10,915 | Reebok International Ltd. | $ | 365,107 | ||||||||
| 19,897 | VF Corp. | 797,870 | |||||||||
| 6,597,050 | |||||||||||
| Apparel/Footwear Retail (0.4%) | |||||||||||
| 164,050 | Gap, Inc. (The) | 3,427,004 | |||||||||
| 96,157 | Limited Brands, Inc. | 1,630,823 | |||||||||
| 25,021 | Nordstrom, Inc. | 652,297 | |||||||||
| 94,036 | TJX Companies, Inc. (The) | 2,036,820 | |||||||||
| 7,746,944 | |||||||||||
| Auto Parts: O.E.M. (0.3%) | |||||||||||
| 27,376 | Dana Corp. | 422,138 | |||||||||
| 103,205 | Delphi Corp. | 935,037 | |||||||||
| 13,741 | Eaton Corp. | 1,286,707 | |||||||||
| 16,424 | Johnson Controls, Inc. | 1,625,976 | |||||||||
| 24,077 | Visteon Corp. | 162,520 | |||||||||
| 4,432,378 | |||||||||||
| Automotive Aftermarket (0.0%) | |||||||||||
| 13,505 | Cooper Tire & Rubber Co. | 243,090 | |||||||||
| 32,188 | Goodyear Tire & Rubber Co. (The) | 229,179 | |||||||||
| 472,269 | |||||||||||
| Beverages: Alcoholic (0.5%) | |||||||||||
| 153,689 | Anheuser-Busch Companies, Inc. | 7,921,131 | |||||||||
| 11,100 | Brown-Forman Corp. (Class B) | 877,344 | |||||||||
| 6,694 | Coors (Adolph) Co. (Class B) | 369,174 | |||||||||
| 9,167,649 | |||||||||||
| Beverages: Non-Alcoholic (1.3%) | |||||||||||
| 453,738 | Coca-Cola Co. (The) | 19,746,678 | |||||||||
| 83,281 | Coca-Cola Enterprises Inc. | 1,539,866 | |||||||||
| 50,504 | Pepsi Bottling Group, Inc. (The) | 1,218,156 | |||||||||
| 22,504,700 | |||||||||||
| Biotechnology (1.2%) | |||||||||||
| 232,005 | Amgen Inc.* | 15,289,129 | |||||||||
| 27,370 | Biogen, Inc.* | 1,080,020 | |||||||||
| 34,340 | Chiron Corp.* | 1,745,159 | |||||||||
| 39,749 | Genzyme Corp.* | 1,874,165 | |||||||||
| 46,433 | MedImmune, Inc.* | 1,619,119 | |||||||||
| 21,607,592 | |||||||||||
See Notes to Financial Statements
6
Morgan Stanley S&P 500 Index Fund
Portfolio of Investments August 31, 2003 continued
| NUMBER OF SHARES | VALUE | ||||||||||
| Broadcasting (0.4%) | |||||||||||
| 113,125 | Clear Channel Communications, Inc. | $ | 5,104,200 | ||||||||
| 42,223 | Univision Communications Inc. (Class A)* | 1,582,940 | |||||||||
| 6,687,140 | |||||||||||
| Building Products (0.2%) | |||||||||||
| 13,229 | American Standard Companies, Inc.* | 1,060,834 | |||||||||
| 87,789 | Masco Corp. | 2,176,289 | |||||||||
| 3,237,123 | |||||||||||
| Cable/Satellite TV (0.7%) | |||||||||||
| 414,248 | Comcast Corp. (Class A)* | 12,323,878 | |||||||||
| Casino/Gaming (0.1%) | |||||||||||
| 20,204 | Harrah's Entertainment, Inc. | 836,850 | |||||||||
| 62,928 | International Game Technology | 1,626,060 | |||||||||
| 2,462,910 | |||||||||||
| Chemicals: Agricultural (0.1%) | |||||||||||
| 48,154 | Monsanto Co. | 1,238,039 | |||||||||
| Chemicals: Major Diversified (1.0%) | |||||||||||
| 168,645 | Dow Chemical Co. (The) | 5,823,312 | |||||||||
| 183,462 | Du Pont (E.I.) de Nemours & Co. | 8,208,090 | |||||||||
| 14,254 | Eastman Chemical Co. | 510,436 | |||||||||
| 23,197 | Engelhard Corp. | 651,140 | |||||||||
| 20,247 | Hercules Inc.* | 226,766 | |||||||||
| 40,898 | Rohm & Haas Co. | 1,485,824 | |||||||||
| 16,905,568 | |||||||||||
| Chemicals: Specialty (0.3%) | |||||||||||
| 41,862 | Air Products & Chemicals, Inc. | 1,980,910 | |||||||||
| 9,216 | Great Lakes Chemical Corp. | 195,287 | |||||||||
| 29,926 | Praxair, Inc. | 1,909,877 | |||||||||
| 13,055 | Sigma-Aldrich Corp. | 714,761 | |||||||||
| 4,800,835 | |||||||||||
| Commercial Printing/Forms (0.1%) | |||||||||||
| 10,183 | Deluxe Corp. | $ | 434,814 | ||||||||
| 20,870 | Donnelley (R.R.) & Sons Co. | 524,672 | |||||||||
| 959,486 | |||||||||||
| Computer Communications (1.5%) | |||||||||||
| 70,241 | Avaya Inc.* | 734,018 | |||||||||
| 1,292,866 | Cisco Systems, Inc.* | 24,758,384 | |||||||||
| 25,492,402 | |||||||||||
| Computer Peripherals (0.5%) | |||||||||||
| 402,849 | EMC Corp.* | 5,136,325 | |||||||||
| 23,485 | Lexmark International, Inc.* | 1,574,434 | |||||||||
| 62,506 | Network Appliance, Inc.* | 1,400,759 | |||||||||
| 8,111,518 | |||||||||||
| Computer Processing Hardware (1.8%) | |||||||||||
| 67,346 | Apple Computer, Inc.* | 1,524,040 | |||||||||
| 473,083 | Dell Inc.* | 15,436,698 | |||||||||
| 59,499 | Gateway, Inc.* | 343,309 | |||||||||
| 562,271 | Hewlett-Packard Co. | 11,200,438 | |||||||||
| 17,573 | NCR Corp.* | 509,793 | |||||||||
| 594,907 | Sun Microsystems, Inc.* | 2,296,341 | |||||||||
| 31,310,619 | |||||||||||
| Construction Materials (0.0%) | |||||||||||
| 18,705 | Vulcan Materials Co. | 774,574 | |||||||||
| Consumer Sundries (0.0%) | |||||||||||
| 12,088 | American Greetings Corp. (Class A)* | 223,628 | |||||||||
| Containers/Packaging (0.2%) | |||||||||||
| 10,502 | Ball Corp. | 554,506 | |||||||||
| 9,781 | Bemis Company, Inc. | 442,786 | |||||||||
| 29,374 | Pactiv Corp.* | 589,830 | |||||||||
| 15,547 | Sealed Air Corp.* | 756,517 | |||||||||
| 9,955 | Temple-Inland, Inc. | 495,560 | |||||||||
| 2,839,199 | |||||||||||
| Contract Drilling (0.2%) | |||||||||||
| 26,828 | Nabors Industries, Ltd. (Bermuda)* | 1,077,144 | |||||||||
| 24,611 | Noble Corp. (Cayman Islands)* | 890,426 | |||||||||
See Notes to Financial Statements
7
Morgan Stanley S&P 500 Index Fund
Portfolio of Investments August 31, 2003 continued
| NUMBER OF SHARES | VALUE | ||||||||||
| 17,249 | Rowan Companies, Inc.* | $ | 431,915 | ||||||||
| 58,903 | Transocean Inc.* | 1,244,031 | |||||||||
| 3,643,516 | |||||||||||
| Data Processing Services (1.1%) | |||||||||||
| 110,158 | Automatic Data Processing, Inc. | 4,396,406 | |||||||||
| 34,487 | Computer Sciences Corp.* | 1,468,112 | |||||||||
| 89,632 | Concord EFS, Inc.* | 1,241,403 | |||||||||
| 27,254 | Convergys Corp.* | 490,572 | |||||||||
| 137,775 | First Data Corp. | 5,290,560 | |||||||||
| 35,587 | Fiserv, Inc.* | 1,382,555 | |||||||||
| 69,339 | Paychex, Inc. | 2,496,204 | |||||||||
| 52,386 | SunGard Data Systems Inc.* | 1,477,285 | |||||||||
| 18,243,097 | |||||||||||
| Department Stores (0.6%) | |||||||||||
| 15,547 | Dillard's, Inc. (Class A) | 235,226 | |||||||||
| 34,506 | Federated Department Stores, Inc. | 1,507,912 | |||||||||
| 62,413 | Kohl's Corp.* | 3,947,622 | |||||||||
| 53,136 | May Department Stores Co. | 1,465,491 | |||||||||
| 49,550 | Penney (J.C.) Co., Inc. | 1,051,451 | |||||||||
| 56,576 | Sears, Roebuck & Co. | 2,490,476 | |||||||||
| 10,698,178 | |||||||||||
| Discount Stores (3.5%) | |||||||||||
| 21,503 | Big Lots, Inc.* | 393,505 | |||||||||
| 84,022 | Costco Wholesale Corp.* | 2,696,266 | |||||||||
| 61,443 | Dollar General Corp. | 1,408,888 | |||||||||
| 31,688 | Family Dollar Stores, Inc. | 1,271,323 | |||||||||
| 167,763 | Target Corp. | 6,811,178 | |||||||||
| 806,605 | Wal-Mart Stores, Inc. | 47,726,818 | |||||||||
| 60,307,978 | |||||||||||
| Drugstore Chains (0.5%) | |||||||||||
| 72,576 | CVS Corp. | 2,365,978 | |||||||||
| 188,790 | Walgreen Co. | 6,148,890 | |||||||||
| 8,514,868 | |||||||||||
| Electric Utilities (2.3%) | |||||||||||
| 112,851 | AES Corp. (The)* | 731,274 | |||||||||
| 23,077 | Allegheny Energy, Inc. | 213,924 | |||||||||
| 29,697 | Ameren Corp. | 1,262,122 | |||||||||
| 72,758 | American Electric Power Co., Inc. | 2,059,779 | |||||||||
| 56,270 | CenterPoint Energy, Inc. | $ | 477,732 | ||||||||
| 32,436 | Cinergy Corp. | 1,109,960 | |||||||||
| 26,456 | CMS Energy Corp. | 176,462 | |||||||||
| 41,128 | Consolidated Edison, Inc. | 1,625,790 | |||||||||
| 30,455 | Constellation Energy Group, Inc. | 1,108,257 | |||||||||
| 57,251 | Dominion Resources, Inc. | 3,468,266 | |||||||||
| 30,941 | DTE Energy Co. | 1,080,150 | |||||||||
| 165,993 | Duke Energy Corp. | 2,835,160 | |||||||||
| 60,015 | Edison International* | 1,131,883 | |||||||||
| 41,591 | Entergy Corp. | 2,181,448 | |||||||||
| 59,725 | Exelon Corp. | 3,517,802 | |||||||||
| 54,825 | FirstEnergy Corp. | 1,604,179 | |||||||||
| 33,762 | FPL Group, Inc. | 2,088,517 | |||||||||
| 75,374 | PG&E Corp.* | 1,671,042 | |||||||||
| 16,809 | Pinnacle West Capital Corp. | 576,549 | |||||||||
| 31,049 | PPL Corp. | 1,231,714 | |||||||||
| 44,356 | Progress Energy, Inc. | 1,795,974 | |||||||||
| 41,609 | Public Service Enterprise Group, Inc. | 1,761,725 | |||||||||
| 132,945 | Southern Co. (The) | 3,772,979 | |||||||||
| 32,513 | TECO Energy, Inc. | 384,629 | |||||||||
| 59,361 | TXU Corp. | 1,305,942 | |||||||||
| 73,444 | Xcel Energy, Inc. | 1,075,955 | |||||||||
| 40,249,214 | |||||||||||
| Electrical Products (0.4%) | |||||||||||
| 36,213 | American Power Conversion Corp. | 648,937 | |||||||||
| 17,178 | Cooper Industries Ltd. (Class A) | 874,188 | |||||||||
| 77,540 | Emerson Electric Co. | 4,323,630 | |||||||||
| 35,205 | Molex Inc. | 1,035,731 | |||||||||
| 15,245 | Power-One, Inc.* | 180,043 | |||||||||
| 10,770 | Thomas & Betts Corp.* | 183,952 | |||||||||
| 7,246,481 | |||||||||||
| Electronic Components (0.2%) | |||||||||||
| 36,588 | Jabil Circuit, Inc.* | 1,029,952 | |||||||||
| 17,284 | QLogic Corp.* | 847,262 | |||||||||
| 93,948 | Sanmina-SCI Corp.* | 843,653 | |||||||||
| 152,850 | Solectron Corp.* | 906,400 | |||||||||
| 3,627,267 | |||||||||||
See Notes to Financial Statements
8
Morgan Stanley S&P 500 Index Fund
Portfolio of Investments August 31, 2003 continued
| NUMBER OF SHARES | VALUE | ||||||||||
| Electronic Equipment/ Instruments (0.5%) | |||||||||||
| 86,815 | Agilent Technologies, Inc.* | $ | 2,111,341 | ||||||||
| 263,442 | JDS Uniphase Corp.* | 906,240 | |||||||||
| 34,133 | Rockwell Automation, Inc. | 929,100 | |||||||||
| 27,444 | Scientific-Atlanta, Inc. | 933,096 | |||||||||
| 42,470 | Symbol Technologies, Inc. | 575,044 | |||||||||
| 15,625 | Tektronix, Inc.* | 369,375 | |||||||||
| 29,795 | Thermo Electron Corp.* | 679,028 | |||||||||
| 22,888 | Waters Corp.* | 698,084 | |||||||||
| 136,599 | Xerox Corp.* | 1,472,537 | |||||||||
| 8,673,845 | |||||||||||
| Electronic Production Equipment (0.6%) | |||||||||||
| 305,294 | Applied Materials, Inc.* | 6,594,350 | |||||||||
| 35,056 | KLA-Tencor Corp.* | 2,080,924 | |||||||||
| 27,614 | Novellus Systems, Inc.* | 1,103,455 | |||||||||
| 34,066 | Teradyne, Inc.* | 607,397 | |||||||||
| 10,386,126 | |||||||||||
| Electronics/Appliance Stores (0.3%) | |||||||||||
| 59,358 | Best Buy Co., Inc.* | 3,087,210 | |||||||||
| 38,166 | Circuit City Stores – Circuit City Group | 398,071 | |||||||||
| 31,021 | RadioShack Corp. | 943,038 | |||||||||
| 4,428,319 | |||||||||||
| Electronics/Appliances (0.2%) | |||||||||||
| 52,771 | Eastman Kodak Co. | 1,471,783 | |||||||||
| 14,429 | Maytag Corp. | 391,026 | |||||||||
| 12,636 | Whirlpool Corp. | 879,213 | |||||||||
| 2,742,022 | |||||||||||
| Engineering & Construction (0.0%) | |||||||||||
| 15,016 | Fluor Corp. | 553,189 | |||||||||
| Environmental Services (0.2%) | |||||||||||
| 38,508 | Allied Waste Industries, Inc.* | 425,898 | |||||||||
| 108,932 | Waste Management, Inc. | 2,898,681 | |||||||||
| 3,324,579 | |||||||||||
| Finance/Rental/Leasing (1.8%) | |||||||||||
| 41,711 | Capital One Financial Corp. | $ | 2,227,367 | ||||||||
| 24,060 | Countrywide Financial Corp. | 1,632,471 | |||||||||
| 180,485 | Fannie Mae | 11,693,623 | |||||||||
| 126,616 | Freddie Mac | 6,729,640 | |||||||||
| 235,350 | MBNA Corp. | 5,493,069 | |||||||||
| 53,390 | Providian Financial Corp.* | 547,247 | |||||||||
| 11,559 | Ryder System, Inc. | 347,117 | |||||||||
| 83,298 | SLM Corp. | 3,346,914 | |||||||||
| 32,017,448 | |||||||||||
| Financial Conglomerates (4.3%) | |||||||||||
| 238,902 | American Express Co. | 10,762,535 | |||||||||
| 948,279 | Citigroup Inc. | 41,107,895 | |||||||||
| 374,158 | J.P. Morgan Chase & Co. | 12,803,687 | |||||||||
| 53,232 | John Hancock Financial Services, Inc. | 1,625,173 | |||||||||
| 60,290 | Principal Financial Group, Inc. | 1,896,723 | |||||||||
| 101,255 | Prudential Financial, Inc. | 3,686,695 | |||||||||
| 61,228 | State Street Corp. | 2,690,971 | |||||||||
| 74,573,679 | |||||||||||
| Financial Publishing/ Services (0.2%) | |||||||||||
| 25,972 | Equifax, Inc. | 595,798 | |||||||||
| 35,127 | McGraw-Hill Companies, Inc. (The) | 2,142,747 | |||||||||
| 27,317 | Moody's Corp. | 1,416,660 | |||||||||
| 4,155,205 | |||||||||||
| Food Distributors (0.3%) | |||||||||||
| 24,643 | Supervalu, Inc. | 593,896 | |||||||||
| 119,663 | SYSCO Corp. | 3,764,598 | |||||||||
| 4,358,494 | |||||||||||
| Food Retail (0.4%) | |||||||||||
| 67,565 | Albertson's, Inc. | 1,420,216 | |||||||||
| 138,981 | Kroger Co.* | 2,669,825 | |||||||||
| 81,307 | Safeway Inc.* | 1,984,704 | |||||||||
| 25,940 | Winn-Dixie Stores, Inc. | 260,697 | |||||||||
| 6,335,442 | |||||||||||
| Food: Major Diversified (1.5%) | |||||||||||
| 75,619 | Campbell Soup Co. | 1,829,980 | |||||||||
| 68,074 | General Mills, Inc. | 3,155,911 | |||||||||
| 64,729 | Heinz (H.J.) Co. | 2,094,630 | |||||||||
See Notes to Financial Statements
9
Morgan Stanley S&P 500 Index Fund
Portfolio of Investments August 31, 2003 continued
| NUMBER OF SHARES | VALUE | ||||||||||
| 74,885 | Kellogg Co. | $ | 2,510,894 | ||||||||
| 316,479 | PepsiCo, Inc. | 14,095,975 | |||||||||
| 143,160 | Sara Lee Corp. | 2,717,177 | |||||||||
| 26,404,567 | |||||||||||
| Food: Meat/Fish/Dairy (0.1%) | |||||||||||
| 98,921 | ConAgra Foods Inc. | 2,176,262 | |||||||||
| Food: Specialty/Candy (0.3%) | |||||||||||
| 24,162 | Hershey Foods Corp. | 1,688,924 | |||||||||
| 25,638 | McCormick & Co., Inc. (Non-Voting) | 684,535 | |||||||||
| 41,456 | Wrigley (Wm.) Jr. Co. (Class A) | 2,199,241 | |||||||||
| 4,572,700 | |||||||||||
| Forest Products (0.2%) | |||||||||||
| 19,202 | Louisiana-Pacific Corp.* | 252,506 | |||||||||
| 40,346 | Weyerhaeuser Co. | 2,400,587 | |||||||||
| 2,653,093 | |||||||||||
| Gas Distributors (0.3%) | |||||||||||
| 68,644 | Dynegy, Inc. (Class A)* | 212,110 | |||||||||
| 28,979 | KeySpan Corp. | 978,041 | |||||||||
| 22,486 | Kinder Morgan, Inc. | 1,197,379 | |||||||||
| 8,109 | Nicor Inc. | 275,625 | |||||||||
| 48,365 | NiSource Inc. | 935,379 | |||||||||
| 6,641 | Peoples Energy Corp. | 266,636 | |||||||||
| 38,212 | Sempra Energy | 1,136,807 | |||||||||
| 5,001,977 | |||||||||||
| Home Building (0.1%) | |||||||||||
| 11,467 | Centex Corp. | 864,841 | |||||||||
| 8,760 | KB HOME | 501,247 | |||||||||
| 11,238 | Pulte Homes, Inc. | 748,001 | |||||||||
| 2,114,089 | |||||||||||
| Home Furnishings (0.1%) | |||||||||||
| 35,529 | Leggett & Platt, Inc. | 822,852 | |||||||||
| 50,508 | Newell Rubbermaid, Inc. | 1,199,565 | |||||||||
| 10,710 | Tupperware Corp. | 174,894 | |||||||||
| 2,197,311 | |||||||||||
| Home Improvement Chains (1.3%) | |||||||||||
| 423,224 | Home Depot, Inc. (The) | 13,610,884 | |||||||||
| 143,640 | Lowe's Companies, Inc. | 7,880,090 | |||||||||
| 27,045 | Sherwin-Williams Co. | 813,514 | |||||||||
| 22,304,488 | |||||||||||
| Hospital/Nursing Management (0.4%) | |||||||||||
| 94,226 | HCA Inc. | $ | 3,579,646 | ||||||||
| 43,965 | Health Management Associates, Inc. (Class A) | 979,540 | |||||||||
| 16,580 | Manor Care, Inc. | 457,608 | |||||||||
| 85,953 | Tenet Healthcare Corp.* | 1,379,546 | |||||||||
| 6,396,340 | |||||||||||
| Hotels/Resorts/ Cruiselines (0.5%) | |||||||||||
| 115,788 | Carnival Corp. (Panama) | 4,005,107 | |||||||||
| 69,406 | Hilton Hotels Corp. | 1,060,524 | |||||||||
| 42,711 | Marriott International, Inc. (Class A) | 1,743,890 | |||||||||
| 36,957 | Starwood Hotels & Resorts Worldwide, Inc. | 1,250,255 | |||||||||
| 8,059,776 | |||||||||||
| Household/Personal Care (2.5%) | |||||||||||
| 10,805 | Alberto-Culver Co. (Class B) | 616,749 | |||||||||
| 43,255 | Avon Products, Inc. | 2,772,645 | |||||||||
| 39,923 | Clorox Co. (The) | 1,710,701 | |||||||||
| 99,107 | Colgate-Palmolive Co. | 5,478,635 | |||||||||
| 188,101 | Gillette Co. (The) | 6,105,758 | |||||||||
| 17,322 | International Flavors & Fragrances, Inc. | 545,643 | |||||||||
| 93,708 | Kimberly-Clark Corp. | 4,789,416 | |||||||||
| 238,487 | Procter & Gamble Co. (The) | 20,817,530 | |||||||||
| 42,837,077 | |||||||||||
| Industrial Conglomerates (5.1%) | |||||||||||
| 71,992 | 3M Co. | 10,256,700 | |||||||||
| 1,840,980 | General Electric Co.** | 54,437,779 | |||||||||
| 158,027 | Honeywell International, Inc. | 4,581,203 | |||||||||
| 31,201 | Ingersoll-Rand Co., Ltd. (Class A) (Bermuda) | 1,857,084 | |||||||||
| 16,924 | ITT Industries, Inc. | 1,101,414 | |||||||||
| 24,885 | Textron, Inc. | 1,119,825 | |||||||||
| 367,830 | Tyco International Ltd. (Bermuda) | 7,569,941 | |||||||||
| 86,187 | United Technologies Corp. | 6,916,507 | |||||||||
| 87,840,453 | |||||||||||
See Notes to Financial Statements
10
Morgan Stanley S&P 500 Index Fund
Portfolio of Investments August 31, 2003 continued
| NUMBER OF SHARES | VALUE | ||||||||||
| Industrial Machinery (0.3%) | |||||||||||
| 56,653 | Illinois Tool Works Inc. | $ | 4,095,445 | ||||||||
| 21,759 | Parker-Hannifin Corp. | 1,077,506 | |||||||||
| 5,172,951 | |||||||||||
| Industrial Specialties (0.2%) | |||||||||||
| 48,407 | Ecolab Inc. | 1,248,417 | |||||||||
| 31,263 | PPG Industries, Inc. | 1,716,651 | |||||||||
| 2,965,068 | |||||||||||
| Information Technology Services (1.8%) | |||||||||||
| 30,452 | Citrix Systems, Inc.* | 627,007 | |||||||||
| 88,118 | Electronic Data Systems Corp. | 1,923,616 | |||||||||
| 318,301 | International Business Machines Corp. | 26,103,865 | |||||||||
| 67,905 | PeopleSoft, Inc.* | 1,229,080 | |||||||||
| 60,377 | Unisys Corp.* | 783,693 | |||||||||
| 30,667,261 | |||||||||||
| Insurance Brokers/ Services (0.4%) | |||||||||||
| 57,504 | AON Corp. | 1,276,589 | |||||||||
| 98,609 | Marsh & McLennan Companies, Inc. | 4,930,450 | |||||||||
| 6,207,039 | |||||||||||
| Integrated Oil (3.9%) | |||||||||||
| 16,565 | Amerada Hess Corp. | 781,040 | |||||||||
| 196,789 | ChevronTexaco Corp. | 14,340,014 | |||||||||
| 125,025 | ConocoPhillips | 6,981,396 | |||||||||
| 1,230,356 | Exxon Mobil Corp. | 46,384,421 | |||||||||
| 68,486,871 | |||||||||||
| Internet Software/ Services (0.3%) | |||||||||||
| 90,175 | Siebel Systems, Inc.* | 908,964 | |||||||||
| 111,115 | Yahoo! Inc.* | 3,711,241 | |||||||||
| 4,620,205 | |||||||||||
| Investment Banks/ Brokers (1.9%) | |||||||||||
| 18,248 | Bear Stearns Companies, Inc. (The) | 1,276,995 | |||||||||
| 86,499 | Goldman Sachs Group, Inc. (The) | 7,654,297 | |||||||||
| 44,680 | Lehman Brothers Holdings, Inc. | 2,936,816 | |||||||||
| 171,367 | Merrill Lynch & Co., Inc. | $ | 9,216,117 | ||||||||
| 200,281 | Morgan Stanley (See Note 4) | 9,771,710 | |||||||||
| 248,748 | Schwab (Charles) Corp. (The) | 2,701,403 | |||||||||
| 33,557,338 | |||||||||||
| Investment Managers (0.4%) | |||||||||||
| 20,084 | Federated Investors, Inc. (Class B) | 589,666 | |||||||||
| 46,689 | Franklin Resources, Inc. | 2,016,498 | |||||||||
| 44,077 | Janus Capital Group Inc. | 761,210 | |||||||||
| 79,478 | Mellon Financial Corp. | 2,491,635 | |||||||||
| 22,470 | Price (T.) Rowe Group, Inc. | 954,975 | |||||||||
| 6,813,984 | |||||||||||
| Life/Health Insurance (0.6%) | |||||||||||
| 94,564 | AFLAC, Inc. | 3,026,994 | |||||||||
| 26,176 | Jefferson-Pilot Corp. | 1,158,812 | |||||||||
| 32,695 | Lincoln National Corp. | 1,158,057 | |||||||||
| 140,025 | MetLife, Inc. | 3,979,510 | |||||||||
| 21,383 | Torchmark Corp. | 863,018 | |||||||||
| 52,998 | UnumProvident Corp. | 747,272 | |||||||||
| 10,933,663 | |||||||||||
| Major Banks (4.9%) | |||||||||||
| 275,942 | Bank of America Corp. | 21,868,403 | |||||||||
| 142,028 | Bank of New York Co., Inc. (The) | 4,178,464 | |||||||||
| 210,425 | Bank One Corp. | 8,305,475 | |||||||||
| 86,812 | BB&T Corp. | 3,170,374 | |||||||||
| 32,266 | Comerica, Inc. | 1,592,004 | |||||||||
| 193,693 | FleetBoston Financial Corp. | 5,731,376 | |||||||||
| 42,114 | Huntington Bancshares, Inc. | 842,280 | |||||||||
| 77,881 | KeyCorp | 2,120,700 | |||||||||
| 112,673 | National City Corp. | 3,569,481 | |||||||||
| 52,097 | PNC Financial Services Group | 2,479,817 | |||||||||
| 62,670 | SouthTrust Corp. | 1,816,803 | |||||||||
| 51,594 | SunTrust Banks, Inc. | 3,153,941 | |||||||||
| 247,784 | Wachovia Corp. | 10,444,096 | |||||||||
| 308,558 | Wells Fargo & Co. | 15,471,098 | |||||||||
| 84,744,312 | |||||||||||
See Notes to Financial Statements
11
Morgan Stanley S&P 500 Index Fund
Portfolio of Investments August 31, 2003 continued
| NUMBER OF SHARES | VALUE | ||||||||||
| Major Telecommunications (2.8%) | |||||||||||
| 57,337 | ALLTEL Corp. | $ | 2,626,035 | ||||||||
| 144,830 | AT&T Corp. | 3,229,709 | |||||||||
| 340,192 | BellSouth Corp. | 8,572,838 | |||||||||
| 611,993 | SBC Communications, Inc. | 13,763,723 | |||||||||
| 165,609 | Sprint Corp. (FON Group) | 2,446,045 | |||||||||
| 506,601 | Verizon Communications Inc. | 17,893,147 | |||||||||
| 48,531,497 | |||||||||||
| Managed Health Care (0.7%) | |||||||||||
| 27,973 | Aetna Inc. | 1,594,461 | |||||||||
| 25,468 | Anthem, Inc.* | 1,864,258 | |||||||||
| 25,825 | CIGNA Corp. | 1,231,336 | |||||||||
| 29,791 | Humana, Inc.* | 524,024 | |||||||||
| 109,157 | UnitedHealth Group Inc. | 5,395,631 | |||||||||
| 26,800 | WellPoint Health Networks, Inc.* | 2,090,400 | |||||||||
| 12,700,110 | |||||||||||
| Media Conglomerates (2.1%) | |||||||||||
| 828,378 | AOL Time Warner Inc.* | 13,552,264 | |||||||||
| 376,363 | Disney (Walt) Co. (The) | 7,715,442 | |||||||||
| 323,448 | Viacom, Inc. (Class B) (Non-Voting) | 14,555,160 | |||||||||
| 35,822,866 | |||||||||||
| Medical Distributors (0.4%) | |||||||||||
| 20,333 | AmerisourceBergen Corp. | 1,183,584 | |||||||||
| 82,237 | Cardinal Health, Inc. | 4,681,752 | |||||||||
| 53,331 | McKesson Corp. | 1,746,057 | |||||||||
| 7,611,393 | |||||||||||
| Medical Specialties (2.0%) | |||||||||||
| 38,492 | Applera Corp. – Applied Biosystems Group | 837,586 | |||||||||
| 9,587 | Bard (C.R.), Inc. | 642,329 | |||||||||
| 9,803 | Bausch & Lomb, Inc. | 413,294 | |||||||||
| 110,062 | Baxter International, Inc. | 3,092,742 | |||||||||
| 46,919 | Becton, Dickinson & Co. | 1,714,420 | |||||||||
| 47,524 | Biomet, Inc. | 1,412,889 | |||||||||
| 75,554 | Boston Scientific Corp.* | 4,540,795 | |||||||||
| 56,974 | Guidant Corp. | 2,860,095 | |||||||||
| 224,639 | Medtronic, Inc. | 11,137,602 | |||||||||
| 8,930 | Millipore Corp.* | 405,422 | |||||||||
| 22,658 | Pall Corp. | 566,450 | |||||||||
| 23,198 | PerkinElmer, Inc. | 383,695 | |||||||||
| 33,144 | St. Jude Medical, Inc.* | 1,725,808 | |||||||||
| 36,570 | Stryker Corp. | $ | 2,772,006 | ||||||||
| 36,188 | Zimmer Holdings, Inc.* | 1,872,367 | |||||||||
| 34,377,500 | |||||||||||
| Miscellaneous Commercial Services (0.0%) | |||||||||||
| 26,392 | Sabre Holdings Corp. | 596,987 | |||||||||
| Miscellaneous Manufacturing (0.2%) | |||||||||||
| 10,932 | Crane Co. | 279,750 | |||||||||
| 28,151 | Danaher Corp. | 2,174,665 | |||||||||
| 37,305 | Dover Corp. | 1,418,336 | |||||||||
| 3,872,751 | |||||||||||
| Motor Vehicles (0.6%) | |||||||||||
| 337,151 | Ford Motor Co. | 3,897,466 | |||||||||
| 103,269 | General Motors Corp. | 4,244,356 | |||||||||
| 55,692 | Harley-Davidson, Inc. | 2,774,575 | |||||||||
| 10,916,397 | |||||||||||
| Multi-Line Insurance (1.9%) | |||||||||||
| 480,472 | American International Group, Inc. | 28,621,717 | |||||||||
| 51,545 | Hartford Financial Services Group, Inc. (The) | 2,743,225 | |||||||||
| 34,160 | Loews Corp. | 1,406,026 | |||||||||
| 25,491 | Safeco Corp. | 919,205 | |||||||||
| 33,690,173 | |||||||||||
| Office Equipment/ Supplies (0.2%) | |||||||||||
| 20,349 | Avery Dennison Corp. | 1,114,108 | |||||||||
| 43,144 | Pitney Bowes, Inc. | 1,682,616 | |||||||||
| 2,796,724 | |||||||||||
| Oil & Gas Pipelines (0.1%) | |||||||||||
| 110,357 | El Paso Corp. | 810,020 | |||||||||
| 95,365 | Williams Companies, Inc. (The) | 870,682 | |||||||||
| 1,680,702 | |||||||||||
| Oil & Gas Production (0.8%) | |||||||||||
| 45,952 | Anadarko Petroleum Corp. | 1,998,912 | |||||||||
| 29,767 | Apache Corp. | 2,053,328 | |||||||||
| 36,967 | Burlington Resources Inc. | 1,789,942 | |||||||||
| 42,511 | Devon Energy Corp. | 2,199,944 | |||||||||
| 21,106 | EOG Resources, Inc. | 894,894 | |||||||||
| 18,577 | Kerr-McGee Corp. | 816,459 | |||||||||
See Notes to Financial Statements
12
Morgan Stanley S&P 500 Index Fund
Portfolio of Investments August 31, 2003 continued
| NUMBER OF SHARES | VALUE | ||||||||||
| 69,861 | Occidental Petroleum Corp. | $ | 2,398,328 | ||||||||
| 47,528 | Unocal Corp. | 1,455,307 | |||||||||
| 13,607,114 | |||||||||||
| Oil Refining/Marketing (0.1%) | |||||||||||
| 12,570 | Ashland, Inc. | 415,564 | |||||||||
| 57,079 | Marathon Oil Corp. | 1,591,933 | |||||||||
| 14,119 | Sunoco, Inc. | 573,655 | |||||||||
| 2,581,152 | |||||||||||
| Oilfield Services/ Equipment (0.6%) | |||||||||||
| 62,011 | Baker Hughes Inc. | 2,074,888 | |||||||||
| 29,115 | BJ Services Co.* | 1,088,028 | |||||||||
| 80,524 | Halliburton Co. | 1,947,070 | |||||||||
| 107,256 | Schlumberger Ltd. | 5,310,245 | |||||||||
| 10,420,231 | |||||||||||
| Other Consumer Services (0.8%) | |||||||||||
| 32,276 | Apollo Group, Inc. (Class A)* | 2,067,923 | |||||||||
| 32,993 | Block (H.&R.), Inc. | 1,454,991 | |||||||||
| 187,613 | Cendant Corp.* | 3,373,282 | |||||||||
| 116,968 | eBay Inc.* | 6,495,233 | |||||||||
| 13,391,429 | |||||||||||
| Other Consumer Specialties (0.1%) | |||||||||||
| 26,768 | Fortune Brands, Inc. | 1,509,715 | |||||||||
| Other Metals/Minerals (0.0%) | |||||||||||
| 16,391 | Phelps Dodge Corp.* | 786,604 | |||||||||
| Packaged Software (4.5%) | |||||||||||
| 42,708 | Adobe Systems Inc. | 1,658,352 | |||||||||
| 20,594 | Autodesk, Inc. | 368,633 | |||||||||
| 42,973 | BMC Software, Inc.* | 630,844 | |||||||||
| 106,483 | Computer Associates International, Inc. | 2,729,159 | |||||||||
| 69,639 | Compuware Corp.* | 414,352 | |||||||||
| 37,803 | Intuit Inc.* | 1,713,232 | |||||||||
| 15,725 | Mercury Interactive Corp.* | 690,170 | |||||||||
| 1,977,639 | Microsoft Corp. | 52,446,986 | |||||||||
| 67,851 | Novell, Inc.* | 341,291 | |||||||||
| 965,770 | Oracle Corp.* | 12,342,541 | |||||||||
| 48,712 | Parametric Technology Corp.* | 162,211 | |||||||||
| 27,209 | Symantec Corp.* | $ | 1,562,613 | ||||||||
| 76,405 | VERITAS Software Corp.* | 2,634,444 | |||||||||
| 77,694,828 | |||||||||||
| Personnel Services (0.1%) | |||||||||||
| 20,595 | Monster Worldwide Inc.* | 562,655 | |||||||||
| 31,340 | Robert Half International, Inc.* | 697,002 | |||||||||
| 1,259,657 | |||||||||||
| Pharmaceuticals: Generic Drugs (0.0%) | |||||||||||
| 19,720 | Watson Pharmaceuticals, Inc.* | 810,492 | |||||||||
| Pharmaceuticals: Major (8.1%) | |||||||||||
| 287,533 | Abbott Laboratories | 11,587,580 | |||||||||
| 357,044 | Bristol-Myers Squibb Co. | 9,058,206 | |||||||||
| 546,862 | Johnson & Johnson | 27,113,418 | |||||||||
| 206,954 | Lilly (Eli) & Co. | 13,768,650 | |||||||||
| 413,041 | Merck & Co., Inc. | 20,784,223 | |||||||||
| 1,454,268 | Pfizer Inc. | 43,511,699 | |||||||||
| 270,573 | Schering-Plough Corp. | 4,110,004 | |||||||||
| 244,614 | Wyeth | 10,481,710 | |||||||||
| 140,415,490 | |||||||||||
| Pharmaceuticals: Other (0.3%) | |||||||||||
| 23,989 | Allergan, Inc. | 1,906,166 | |||||||||
| 66,866 | Forest Laboratories, Inc.* | 3,142,702 | |||||||||
| 44,347 | King Pharmaceuticals, Inc.* | 623,075 | |||||||||
| 5,671,943 | |||||||||||
| Precious Metals (0.2%) | |||||||||||
| 26,781 | Freeport-McMoRan Copper & Gold, Inc. (Class B) | 803,430 | |||||||||
| 74,086 | Newmont Mining Corp. | 2,908,616 | |||||||||
| 3,712,046 | |||||||||||
| Property – Casualty Insurers (1.1%) | |||||||||||
| 48,758 | ACE Ltd. (Bermuda) | 1,570,008 | |||||||||
| 129,666 | Allstate Corp. (The) | 4,635,560 | |||||||||
| 31,612 | Chubb Corp. (The) | 2,147,719 | |||||||||
| 29,651 | Cincinnati Financial Corp. | 1,196,418 | |||||||||
| 40,094 | Progressive Corp. (The) | 2,836,250 | |||||||||
| 41,921 | St. Paul Companies, Inc . (The) | 1,457,174 | |||||||||
See Notes to Financial Statements
13
Morgan Stanley S&P 500 Index Fund
Portfolio of Investments August 31, 2003 continued
| NUMBER OF SHARES | VALUE | ||||||||||
| 185,388 | Travelers Property Casualty Corp. (Class B) | $ | 2,871,660 | ||||||||
| 25,161 | XL Capital Ltd. (Class A) (Cayman Islands) | 1,905,946 | |||||||||
| 18,620,735 | |||||||||||
| Publishing: Books/ Magazines (0.0%) | |||||||||||
| 9,161 | Meredith Corp. | 434,415 | |||||||||
| Publishing: Newspapers (0.5%) | |||||||||||
| 14,989 | Dow Jones & Co., Inc. | 636,583 | |||||||||
| 49,478 | Gannett Co., Inc. | 3,880,065 | |||||||||
| 15,049 | Knight-Ridder, Inc. | 1,021,225 | |||||||||
| 27,808 | New York Times Co. (The) (Class A) | 1,234,397 | |||||||||
| 56,917 | Tribune Co. | 2,632,411 | |||||||||
| 9,404,681 | |||||||||||
| Pulp & Paper (0.3%) | |||||||||||
| 10,701 | Boise Cascade Corp. | 291,602 | |||||||||
| 46,103 | Georgia-Pacific Corp. | 1,068,207 | |||||||||
| 88,221 | International Paper Co. | 3,577,362 | |||||||||
| 36,911 | MeadWestvaco Corp. | 935,694 | |||||||||
| 5,872,865 | |||||||||||
| Railroads (0.4%) | |||||||||||
| 68,643 | Burlington Northern Santa Fe Corp. | 1,946,029 | |||||||||
| 39,367 | CSX Corp. | 1,270,767 | |||||||||
| 71,802 | Norfolk Southern Corp. | 1,367,110 | |||||||||
| 46,801 | Union Pacific Corp. | 2,852,053 | |||||||||
| 7,435,959 | |||||||||||
| Real Estate Investment Trusts (0.4%) | |||||||||||
| 17,284 | Apartment Investment & Management Co. (Class A) | 666,298 | |||||||||
| 74,178 | Equity Office Properties Trust | 2,063,632 | |||||||||
| 50,202 | Equity Residential | 1,459,874 | |||||||||
| 33,701 | Plum Creek Timber Co., Inc. | 881,281 | |||||||||
| 9,820 | ProLogis | 276,826 | |||||||||
| 34,814 | Simon Property Group, Inc. | 1,486,906 | |||||||||
| 6,834,817 | |||||||||||
| Recreational Products (0.3%) | |||||||||||
| 16,629 | Brunswick Corp. | $ | 448,650 | ||||||||
| 26,821 | Electronic Arts Inc.* | 2,407,185 | |||||||||
| 31,906 | Hasbro, Inc. | 590,261 | |||||||||
| 80,993 | Mattel, Inc. | 1,564,785 | |||||||||
| 5,010,881 | |||||||||||
| Regional Banks (1.6%) | |||||||||||
| 64,673 | AmSouth Bancorporation | 1,393,056 | |||||||||
| 41,494 | Charter One Financial, Inc. | 1,286,314 | |||||||||
| 105,778 | Fifth Third Bancorp | 6,198,591 | |||||||||
| 23,265 | First Tennessee National Corp. | 962,008 | |||||||||
| 41,754 | Marshall & Ilsley Corp. | 1,294,374 | |||||||||
| 28,857 | North Fork Bancorporation, Inc. | 974,501 | |||||||||
| 40,601 | Northern Trust Corp. | 1,714,986 | |||||||||
| 40,912 | Regions Financial Corp. | 1,442,557 | |||||||||
| 55,926 | Synovus Financial Corp. | 1,367,391 | |||||||||
| 353,618 | U.S. Bancorp | 8,451,470 | |||||||||
| 36,569 | Union Planters Corp. | 1,166,551 | |||||||||
| 16,604 | Zions Bancorporation | 924,843 | |||||||||
| 27,176,642 | |||||||||||
| Restaurants (0.6%) | |||||||||||
| 31,004 | Darden Restaurants, Inc. | 675,887 | |||||||||
| 234,363 | McDonald's Corp. | 5,254,418 | |||||||||
| 71,937 | Starbucks Corp.* | 2,045,888 | |||||||||
| 20,900 | Wendy's International, Inc. | 659,395 | |||||||||
| 53,876 | Yum! Brands, Inc.* | 1,597,423 | |||||||||
| 10,233,011 | |||||||||||
| Savings Banks (0.5%) | |||||||||||
| 28,116 | Golden West Financial Corp. | 2,425,567 | |||||||||
| 171,397 | Washington Mutual, Inc. | 6,681,055 | |||||||||
| 9,106,622 | |||||||||||
| Semiconductors (3.5%) | |||||||||||
| 63,698 | Advanced Micro Devices, Inc.* | 719,150 | |||||||||
| 70,530 | Altera Corp.* | 1,582,693 | |||||||||
| 67,292 | Analog Devices, Inc.* | 2,758,972 | |||||||||
| 56,013 | Applied Micro Circuits Corp.* | 325,436 | |||||||||
| 51,594 | Broadcom Corp. (Class A)* | 1,417,803 | |||||||||
See Notes to Financial Statements
14
Morgan Stanley S&P 500 Index Fund
Portfolio of Investments August 31, 2003 continued
| NUMBER OF SHARES | VALUE | ||||||||||
| 1,203,575 | Intel Corp. | $ | 34,446,317 | ||||||||
| 57,653 | Linear Technology Corp. | 2,376,457 | |||||||||
| 69,119 | LSI Logic Corp.* | 797,633 | |||||||||
| 59,805 | Maxim Integrated Products, Inc. | 2,685,843 | |||||||||
| 112,113 | Micron Technology, Inc.* | 1,609,943 | |||||||||
| 33,609 | National Semiconductor Corp.* | 979,366 | |||||||||
| 29,300 | NVIDIA Corp.* | 532,088 | |||||||||
| 31,123 | PMC – Sierra, Inc.* | 443,814 | |||||||||
| 318,537 | Texas Instruments Inc. | 7,597,107 | |||||||||
| 62,151 | Xilinx, Inc.* | 1,916,737 | |||||||||
| 60,189,359 | |||||||||||
| Services to the Health Industry (0.2%) | |||||||||||
| 44,869 | IMS Health Inc. | 873,599 | |||||||||
| 49,813 | Medco Health Solutions Inc.* | 1,330,000 | |||||||||
| 19,403 | Quest Diagnostics Inc.* | 1,164,180 | |||||||||
| 21,788 | Quintiles Transnational Corp.* | 310,261 | |||||||||
| 3,678,040 | |||||||||||
| Specialty Insurance (0.2%) | |||||||||||
| 19,574 | Ambac Financial Group, Inc. | 1,270,744 | |||||||||
| 26,501 | MBIA Inc. | 1,496,246 | |||||||||
| 18,180 | MGIC Investment Corp. | 1,024,807 | |||||||||
| 3,791,797 | |||||||||||
| Specialty Stores (0.6%) | |||||||||||
| 51,823 | AutoNation, Inc.* | 973,754 | |||||||||
| 16,483 | AutoZone, Inc.* | 1,513,139 | |||||||||
| 54,391 | Bed Bath & Beyond Inc.* | 2,340,445 | |||||||||
| 56,879 | Office Depot, Inc.* | 1,037,473 | |||||||||
| 89,693 | Staples, Inc.* | 2,209,139 | |||||||||
| 26,743 | Tiffany & Co. | 1,040,838 | |||||||||
| 39,245 | Toys 'R' Us, Inc.* | 534,517 | |||||||||
| 9,649,305 | |||||||||||
| Specialty Telecommunications (0.2%) | |||||||||||
| 26,363 | CenturyTel, Inc. | 916,378 | |||||||||
| 52,212 | Citizens Communications Co.* | 595,217 | |||||||||
| 312,288 | Qwest Communications International, Inc.* | 1,389,682 | |||||||||
| 2,901,277 | |||||||||||
| Steel (0.1%) | |||||||||||
| 14,806 | Allegheny Technologies Inc. | $ | 110,305 | ||||||||
| 14,402 | Nucor Corp. | 740,407 | |||||||||
| 18,999 | United States Steel Corp. | 349,772 | |||||||||
| 15,828 | Worthington Industries, Inc. | 239,003 | |||||||||
| 1,439,487 | |||||||||||
| Telecommunication Equipment (0.9%) | |||||||||||
| 147,717 | ADC Telecommunications, Inc.* | 375,201 | |||||||||
| 28,113 | Andrew Corp.* | 348,039 | |||||||||
| 86,775 | CIENA Corp.* | 564,038 | |||||||||
| 34,665 | Comverse Technology, Inc.* | 571,626 | |||||||||
| 233,171 | Corning Inc.* | 1,923,661 | |||||||||
| 762,051 | Lucent Technologies Inc.* | 1,455,517 | |||||||||
| 426,559 | Motorola, Inc. | 4,576,978 | |||||||||
| 145,410 | QUALCOMM Inc. | 6,002,525 | |||||||||
| 75,941 | Tellabs, Inc.* | 495,895 | |||||||||
| 16,313,480 | |||||||||||
| Tobacco (1.0%) | |||||||||||
| 372,980 | Altria Group, Inc. | 15,374,236 | |||||||||
| 15,531 | R. J. Reynolds Tobacco Holdings, Inc. | 530,384 | |||||||||
| 30,802 | UST, Inc. | 1,028,787 | |||||||||
| 16,933,407 | |||||||||||
| Tools/Hardware (0.1%) | |||||||||||
| 14,293 | Black & Decker Corp. (The) | 611,455 | |||||||||
| 10,724 | Snap-On, Inc. | 316,358 | |||||||||
| 15,730 | Stanley Works (The) | 476,147 | |||||||||
| 1,403,960 | |||||||||||
| Trucks/Construction/Farm Machinery (0.6%) | |||||||||||
| 63,449 | Caterpillar Inc. | 4,557,542 | |||||||||
| 7,620 | Cummins Inc. | 379,781 | |||||||||
| 44,095 | Deere & Co. | 2,491,808 | |||||||||
| 12,569 | Navistar International Corp.* | 562,211 | |||||||||
| 21,413 | PACCAR, Inc. | 1,824,388 | |||||||||
| 9,815,730 | |||||||||||
See Notes to Financial Statements
15
Morgan Stanley S&P 500 Index Fund
Portfolio of Investments August 31, 2003 continued
| NUMBER OF SHARES | VALUE | ||||||||||
| Wholesale Distributors (0.1%) | |||||||||||
| 32,068 | Genuine Parts Co. | $ | 1,026,817 | ||||||||
| 16,879 | Grainger (W.W.), Inc. | 841,081 | |||||||||
| 1,867,898 | |||||||||||
| Wireless Telecommunications (0.5%) | |||||||||||
| 499,533 | AT&T Wireless Services Inc.* | 4,305,974 | |||||||||
| 189,373 | Nextel Communications, Inc. (Class A)* | 3,651,111 | |||||||||
| 188,515 | Sprint Corp. (PCS Group)* | 978,393 | |||||||||
| 8,935,478 | |||||||||||
| Total Common Stocks (Cost $1,791,535,164) | 1,712,201,401 | ||||||||||
| PRINCIPAL AMOUNT IN THOUSANDS | |||||||||||
| Short-Term Investment (1.2%) Repurchase Agreement | |||||||||||
| $ | 20,503 | Joint repurchase agreement 1.05% due 09/02/03 (dated 08/29/03; proceeds $20,505,392) (a) (Cost $20,503,000) | 20,503,000 | ||||||||
| Total Investments (Cost $1,812,038,164) (b) (c) | 99.9 | % | 1,732,704,401 | |||||||
| Other Assets in Excess of Liabilities | 0.1 | 1,969,845 | ||||||||
| Net Assets | 100.0 | % | $ | 1,734,674,246 | ||||||
| * | Non-income producing security. |
| ** | A portion of this security has been physically segregated in connection with open futures contracts. |
| (a) | Collateralized by federal agency and U.S. Treasury obligations. |
| (b) | Securities have been designated as collateral in an amount equal to $14,679,215 in connection with open futures contracts. |
| (c) | The aggregate cost for federal income tax purposes is $1,823,027,031. The aggregate gross unrealized appreciation is $257,622,195 and the aggregate gross unrealized depreciation is $347,944,825, resulting in net unrealized depreciation of $90,322,630. |
Futures Contracts Open at August 31, 2003:
| NUMBER OF CONTRACTS | LONG/ SHORT | DESCRIPTION, DELIVERY MONTH, AND YEAR | UNDERLYING FACE AMOUNT AT VALUE | UNREALIZED APPRECIATION | ||||||||||||||
| 117 | Long | S&P 500 Index E-Mini September 2003 | $ | 5,895,045 | $ | 170,443 | ||||||||||||
| 67 | Long | S&P 500 Index September 2003 | 16,878,975 | 147,939 | ||||||||||||||
| Total Unrealized Appreciation | $318,382 | |||||||||||||||||
See Notes to Financial Statements
16
Morgan Stanley S&P 500 Index Fund
Financial Statements
Statement of Assets and Liabilities
August 31, 2003
| Assets: | ||||||
| Investments in securities, at value (cost $1,812,038,164) | $ | 1,732,704,401 | ||||
| Receivable for: | ||||||
| Dividends | 2,725,797 | |||||
| Shares of beneficial interest sold | 2,480,525 | |||||
| Variation margin | 148,205 | |||||
| Investments sold | 111,957 | |||||
| Prepaid expenses and other assets | 103,605 | |||||
| Total Assets | 1,738,274,490 | |||||
| Liabilities: | ||||||
| Payable for: | ||||||
| Shares of beneficial interest redeemed | 1,574,959 | |||||
| Distribution fee | 1,152,623 | |||||
| Investment management fee | 458,802 | |||||
| Investments purchased | 281,954 | |||||
| Accrued expenses and other payables | 131,906 | |||||
| Total Liabilities | 3,600,244 | |||||
| Net Assets | $ | 1,734,674,246 | ||||
| Composition of Net Assets: | ||||||
| Paid-in-capital | $ | 2,096,271,707 | ||||
| Net unrealized depreciation | (79,015,381 | ) | ||||
| Accumulated undistributed net investment income | 7,285,866 | |||||
| Accumulated net realized loss | (289,867,946 | ) | ||||
| Net Assets | $ | 1,734,674,246 | ||||
| Class A Shares: | ||||||
| Net Assets | $ | 233,232,620 | ||||
| Shares Outstanding (unlimited authorized, $.01 par value) | 21,267,436 | |||||
| Net Asset Value Per Share | $ | 10.97 | ||||
| Maximum Offering Price Per Share, (net asset value plus 5.54% of net asset value) | $ | 11.58 | ||||
| Class B Shares: | ||||||
| Net Assets | $ | 1,160,156,501 | ||||
| Shares Outstanding (unlimited authorized, $.01 par value) | 109,434,974 | |||||
| Net Asset Value Per Share | $ | 10.60 | ||||
| Class C Shares: | ||||||
| Net Assets | $ | 160,962,881 | ||||
| Shares Outstanding (unlimited authorized, $.01 par value) | 15,179,399 | |||||
| Net Asset Value Per Share | $ | 10.60 | ||||
| Class D Shares: | ||||||
| Net Assets | $ | 180,322,244 | ||||
| Shares Outstanding (unlimited authorized, $.01 par value) | 16,304,248 | |||||
| Net Asset Value Per Share | $ | 11.06 | ||||
Statement of Operations
For the year ended August 31, 2003
| Net Investment Income: | ||||||
| Income | ||||||
| Dividends | $ | 28,230,724 | ||||
| Interest | 188,744 | |||||
| Total Income | 28,419,468 | |||||
| Expenses | ||||||
| Distribution fee (Class A shares) | 377,698 | |||||
| Distribution fee (Class B shares) | 10,873,492 | |||||
| Distribution fee (Class C shares) | 1,414,844 | |||||
| Investment management fee | 6,258,098 | |||||
| Transfer agent fees and expenses | 2,803,850 | |||||
| Shareholder reports and notices | 158,706 | |||||
| Registration fees | 95,758 | |||||
| Custodian fees | 83,178 | |||||
| Professional fees | 51,118 | |||||
| Trustees' fees and expenses | 17,543 | |||||
| Organizational expenses | 977 | |||||
| Other | 187,340 | |||||
| Total Expenses | 22,322,602 | |||||
| Less: amounts waived/reimbursed | (1,807,585 | ) | ||||
| Net Expenses | 20,515,017 | |||||
| Net Investment Income | 7,904,451 | |||||
| Net Realized and Unrealized Gain (Loss): | ||||||
| Net Realized Gain/Loss on: | ||||||
| Investments | (39,774,992 | ) | ||||
| Futures contracts | 352,664 | |||||
| Net Realized Loss | (39,422,328 | ) | ||||
| Net Change in Unrealized Appreciation/Depreciation on: | ||||||
| Investments | 191,483,790 | |||||
| Futures contracts | (1,070,370 | ) | ||||
| Net Appreciation | 190,413,420 | |||||
| Net Gain | 150,991,092 | |||||
| Net Increase | $ | 158,895,543 | ||||
See Notes to Financial Statements
17
Morgan Stanley S&P 500 Index Fund
Financial Statements continued
Statement of Changes in Net Assets
| FOR THE YEAR ENDED AUGUST 31, 2003 | FOR THE YEAR ENDED AUGUST 31, 2002 | |||||||||
| Increase (Decrease) in Net Assets: | ||||||||||
| Operations: | ||||||||||
| Net investment income | $ | 7,904,451 | $ | 1,822,437 | ||||||
| Net realized loss | (39,422,328 | ) | (171,075,896 | ) | ||||||
| Net change in unrealized appreciation (depreciation) | 190,413,420 | (221,286,623 | ) | |||||||
| Net Increase (Decrease) | 158,895,543 | (390,540,082 | ) | |||||||
| Dividends to Shareholders from Net Investment Income: | ||||||||||
| Class A shares | (1,059,177 | ) | — | |||||||
| Class D shares | (1,290,827 | ) | — | |||||||
| Total Dividends | (2,350,004 | ) | — | |||||||
| Net increase (decrease) from transactions in shares of beneficial interest | (33,864,106 | ) | 12,625,323 | |||||||
| Net Increase (Decrease) | 122,681,433 | (377,914,759 | ) | |||||||
| Net Assets: | ||||||||||
| Beginning of period | 1,611,992,813 | 1,989,907,572 | ||||||||
| End of Period | ||||||||||
| (Including accumulated undistributed net investment income of $7,285,866 and $1,836,163, respectively) | $ | 1,734,674,246 | $ | 1,611,992,813 | ||||||
See Notes to Financial Statements
18
Morgan Stanley S&P 500 Index Fund
Notes to Financial Statements August 31, 2003
1. Organization and Accounting Policies
Morgan Stanley S&P 500 Index Fund (the "Fund") is registered under the Investment Company Act of 1940, as amended (the "Act"), as a diversified, open-end management investment company. The Fund's investment objective is to provide investment results that, before expenses, correspond to the total return of the Standard & Poor's 500 Composite Stock Price Index (the "S&P 500 Index"). The Fund seeks to achieve its objective by investing at least 80% of its total assets in common stocks included in the S&P 500 Index in approximately the same weighting as the Index. The Fund was organized as a Massachusetts business trust on June 18, 1997 and commenced operations on September 26, 1997.
The Fund offers Class A shares, Class B shares, Class C shares and Class D shares. The four classes are substantially the same except that most Class A shares are subject to a sales charge imposed at the time of purchase and some Class A shares, and most Class B shares and Class C shares are subject to a contingent deferred sales charge imposed on shares redeemed within one year, six years and one year, respectively. Class D shares are not subject to a sales charge. Additionally, Class A shares, Class B shares and Class C shares incur distribution expenses.
The following is a summary of significant accounting policies:
A. Valuation of Investments — (1) an equity portfolio security listed or traded on the New York or American Stock Exchange or other exchange is valued at its latest sale price prior to the time when assets are valued; if there were no sales that day, the security is valued at the mean between the last reported bid and asked price; (2) an equity portfolio security listed or traded on the Nasdaq is valued at the Nasdaq Official Closing Price; if there were no sales that day, the security is valued at the mean between the last reported bid and asked price; (3) all other equity portfolio securities for which over-the-counter market quotations are readily available are valued at the mean between the last reported bid and asked price. In cases where a security is traded on more than one exchange, the security is valued on the exchange designated as the primary market; (4) for equity securities traded on foreign exchanges, the last reported sale price or the latest bid price may be used if there were no sales on a particular day; (5) futures are valued at the latest price published by the commodities exchange on which they trade; (6) when market quotations are not readily available or Morgan Stanley Investment Advisors Inc. (the "Investment Manager") determines that the latest sale price, the bid price or the mean between the last reported bid and asked price do not reflect a security's market value, portfolio securities are valued at their fair value as determined in good faith under procedures established by and under the general supervision of the Fund's Trustees; and (7) short-term debt securities having a maturity date of more than sixty days at time of purchase are valued on a mark-to-market basis until sixty days prior to maturity and thereafter at amortized cost based on their value on the 61st day. Short-term debt securities having a maturity date of sixty days or less at the time of purchase are valued at amortized cost.
B. Accounting for Investments — Security transactions are accounted for on the trade date (date the order to buy or sell is executed). Realized gains and losses on security transactions are determined by the identified
19
Morgan Stanley S&P 500 Index Fund
Notes to Financial Statements August 31, 2003 continued
cost method. Dividend income and other distributions are recorded on the ex-dividend date. Discounts are accreted and premiums are amortized over the life of the respective securities. Interest income is accrued daily.
C. Repurchase Agreements — Pursuant to an Exemptive Order issued by the Securities and Exchange Commission, the Fund, along with other affiliated entities managed by the Investment Manager, may transfer uninvested cash balances into one or more joint repurchase agreement accounts. These balances are invested in one or more repurchase agreements and are collateralized by cash, U.S. Treasury or federal agency obligations. The Fund may also invest directly with institutions in repurchase agreements. The Fund's custodian receives the collateral, which is marked-to-market daily to determine that the value of the collateral does not decrease below the repurchase price plus accrued interest.
D. Multiple Class Allocations — Investment income, expenses (other than distribution fees), and realized and unrealized gains and losses are allocated to each class of shares based upon the relative net asset value on the date such items are recognized. Distribution fees are charged directly to the respective class.
E. Futures Contracts — A futures contract is an agreement between two parties to buy and sell financial instruments or contracts based on financial indices at a set price on a future date. Upon entering into such a contract, the Fund is required to pledge to the broker cash, U.S. Government securities or other liquid portfolio securities equal to the minimum initial margin requirements of the applicable futures exchange. Pursuant to the contract, the Fund agrees to receive from or pay to the broker an amount of cash equal to the daily fluctuation in the value of the contract. Such receipts or payments known as variation margin are recorded by the Fund as unrealized gains and losses. Upon closing of the contract, the Fund realizes a gain or loss equal to the difference between the value of the contract at the time it was opened and the value at the time it was closed.
F. Federal Income Tax Policy — It is the Fund's policy to comply with the requirements of the Internal Revenue Code applicable to regulated investment companies and to distribute substantially all of its taxable income to its shareholders. Accordingly, no federal income tax provision is required.
G. Dividends and Distributions to Shareholders — Dividends and distributions to shareholders are recorded on the ex-dividend date.
H. Organizational Expenses — The Investment Manager incurred the organizational expenses of the Fund in the amount of approximately $68,000 which have been reimbursed by the Fund for the full amount thereof. Such expenses have been deferred and were fully amortized as of September 25, 2002.
I.�� Use of Estimates — The preparation of financial statements in accordance with generally accepted accounting principles requires management to make estimates and assumptions that affect the reported amounts and disclosures. Actual results could differ from those estimates.
20
Morgan Stanley S&P 500 Index Fund
Notes to Financial Statements August 31, 2003 continued
2. Investment Management Agreement
Pursuant to an Investment Management Agreement, the Fund pays the Investment Manager a management fee, accrued daily and payable monthly, by applying the following annual rates to the net assets of the Fund determined as of the close of each business day: 0.40% to the portion of daily net assets not exceeding $1.5 billion; 0.375% to the portion of daily net assets exceeding $1.5 billion but not exceeding $3 billion; and 0.35% to the portion of daily net assets in excess of $3 billion.
The Investment Manager has agreed to assume all operating expenses (except for distribution fees) and to waive the compensation provided for in its Investment Management Agreement to the extent that such expenses and compensation on an annualized basis exceed 0.50% of the daily net assets of the Fund
3. Plan of Distribution
Shares of the Fund are distributed by Morgan Stanley Distributors Inc. (the "Distributor"), an affiliate of the Investment Manager. The Fund has adopted a Plan of Distribution (the "Plan") pursuant to Rule 12b-1 under the Act. The Plan provides that the Fund will pay the Distributor a fee which is accrued daily and paid monthly at the following annual rates: (i) Class A – up to 0.25% of the average daily net assets of Class A; (ii) Class B – 1.0% of the average daily net assets of Class B; and (iii) Class C – up to 1.0% of the average daily net assets of Class C.
In the case of Class B shares, provided that the Plan continues in effect, any cumulative expenses incurred by the Distributor but not yet recovered may be recovered through the payment of future distribution fees from the Fund pursuant to the Plan and contingent deferred sales charges paid by investors upon redemption of Class B shares. Although there is no legal obligation for the Fund to pay expenses incurred in excess of payments made to the Distributor under the Plan and the proceeds of contingent deferred sales charges paid by investors upon redemption of shares, if for any reason the Plan is terminated, the Trustees will consider at that time the manner in which to treat such expenses. The Distributor has advised the Fund that such excess amounts totaled $49,726,578 at August 31,2003.
In the case of Class A shares and Class C shares, expenses incurred pursuant to the Plan in any calendar year in excess of 0.25% or 1.0% of the average daily net assets of Class A or Class C, respectively, will not be reimbursed by the Fund through payments in any subsequent year, except that expenses representing a gross sales credit to Morgan Stanley Financial Advisors or other selected broker-dealer representatives may be reimbursed in the subsequent calendar year. For the year ended August 31, 2003, the distribution fee was accrued for Class A shares and Class C shares at the annual rate of 0.20% and 0.99%, respectively.
The Distributor has informed the Fund that for the year ended August 31, 2003, it received contingent deferred sales charges from certain redemptions of the Fund's Class A shares, Class B shares and Class C
21
Morgan Stanley S&P 500 Index Fund
Notes to Financial Statements August 31, 2003 continued
shares of $2,378, $2,846,110 and $33,705, respectively and received $274,408 in front-end sales charges from sales of the Fund's Class A shares. The respective shareholders pay such charges which are not an expense of the Fund.
4. Security Transactions and Transactions with Affiliates
The cost of purchases and proceeds from sales of portfolio securities, excluding short-term investments, for the year ended August 31, 2003 aggregated $29,298,549 and $62,525,375, respectively. Included in the aforementioned are sales of common stock of Morgan Stanley, an affiliate of the Investment Manager and Distributor, of $280,464, as well as a realized loss of $133,650.
Morgan Stanley Trust, an affiliate of the Investment Manager and Distributor, is the Fund's transfer agent. At August 31, 2003, the Fund had transfer agent fees and expenses payable of approximately $3,300.
5. Federal Income Tax Status
The amount of dividends and distributions from net investment income and net realized capital gains are determined in accordance with federal income tax regulations which may differ from generally accepted accounting principles. These "book/tax" differences are either considered temporary or permanent in nature. To the extent these differences are permanent in nature, such amounts are reclassified within the capital accounts based on their federal tax-basis treatment; temporary differences do not require reclassification. Dividends and distributions which exceed net investment income and net realized capital gains for tax purposes are reported as distributions of paid-in-capital.
The tax character of distributions paid was as follows:
| FOR THE YEAR ENDED AUGUST 31, 2003 | FOR THE YEAR ENDED AUGUST 31, 2002 | |||||||||
| Ordinary income | $2,350,004 | — | ||||||||
22
Morgan Stanley S&P 500 Index Fund
Notes to Financial Statements August 31, 2003 continued
As of August 31, 2003, the tax-basis components of accumulated losses were as follows:
| Undistributed ordinary income | $ | 7,263,345 | ||||
| Undistributed long-term gains | — | |||||
| Net accumulated earnings | 7,263,345 | |||||
| Capital loss carryforward* | (253,390,627 | ) | ||||
| Post-October losses | (25,147,549 | ) | ||||
| Net unrealized depreciation | (90,322,630 | ) | ||||
| Total accumulated losses | $ | (361,597,461 | ) | |||
* As of August 31, 2003, the Fund had a net capital loss carryforward of $253,390,627 of which $687,345 will expire on August 31, 2006, $1,110,663 will expire on August 31, 2007, $14,522,885 will expire on August 31, 2008, $14,524,329 will expire on August 31, 2009, $66,339,275 will expire on August 31, 2010 and $156,206,130 will expire on August 31, 2011 to offset future capital gains to the extent provided by regulations.
As part of the Fund's acquisition of the assets of Morgan Stanley S&P 500 Select Fund ("S&P 500 Select"), the Fund obtained a net capital loss carryforward of $16,493,580 from S&P 500 Select. Utilization of this carryforward is subject to limitations imposed by the Internal Revenue Code and Treasury Regulations, reducing the total carryforward available.
As of August 31, 2003, the Fund had temporary book/tax differences primarily attributable to post-October losses (capital losses incurred after October 31 within the taxable year which are deemed to arise on the first business day of the Fund's next taxable year), capital loss deferrals on wash sales and mark-to-market of open futures contracts and permanent book/tax differences primarily attributable to tax adjustments on real estate investment trusts held by the Fund. To reflect reclassifications arising from the permanent differences, paid-in-capital was charged $385, accumulated undistributed net investment income was charged $104,744 and accumulated net realized loss was credited $105,129.
23
Morgan Stanley S&P 500 Index Fund
Notes to Financial Statements August 31, 2003 continued
6. Shares of Beneficial Interest
Transactions in shares of beneficial interest were as follows:
| FOR THE YEAR ENDED AUGUST 31, 2003 | FOR THE YEAR ENDED AUGUST 31, 2002 | ||||||||||||||||||
| SHARES | AMOUNT | SHARES | AMOUNT | ||||||||||||||||
| CLASS A SHARES | |||||||||||||||||||
| Sold | 10,488,519 | $ | 103,054,438 | 15,990,003 | $ | 181,044,670 | |||||||||||||
| Shares issued in connection with the acquisition of Morgan Stanley S&P 500 Select Fund | — | — | 317,381 | 3,159,291 | |||||||||||||||
| Reinvestment of dividends | 105,392 | 1,020,200 | — | — | |||||||||||||||
| Redeemed | (5,565,675 | ) | (54,696,361 | ) | (13,142,149 | ) | (147,330,753 | ) | |||||||||||
| Net increase – Class A | 5,028,236 | 49,378,277 | 3,165,235 | 36,873,208 | |||||||||||||||
| CLASS B SHARES | |||||||||||||||||||
| Sold | 21,183,000 | 202,881,480 | 30,060,188 | 341,082,040 | |||||||||||||||
| Shares issued in connection with the acquisition of Morgan Stanley S&P 500 Select Fund | — | — | 5,067,694 | 48,876,882 | |||||||||||||||
| Redeemed | (33,495,369 | ) | (314,102,708 | ) | (43,333,038 | ) | (471,959,709 | ) | |||||||||||
| Net decrease - Class B | (12,312,369 | ) | (111,221,228 | ) | (8,205,156 | ) | (82,000,787 | ) | |||||||||||
| CLASS C SHARES | |||||||||||||||||||
| Sold | 3,918,125 | 37,713,844 | 4,948,691 | 55,926,214 | |||||||||||||||
| Shares issued in connection with the acquisition of Morgan Stanley S&P 500 Select Fund | — | — | 527,578 | 5,089,841 | |||||||||||||||
| Redeemed | (4,009,024 | ) | (38,062,695 | ) | (4,412,442 | ) | (48,240,359 | ) | |||||||||||
| Net increase (decrease) - Class C | (90,899 | ) | (348,851 | ) | 1,063,827 | 12,775,696 | |||||||||||||
| CLASS D SHARES | |||||||||||||||||||
| Sold | 6,932,537 | 68,900,746 | 8,140,294 | 94,304,700 | |||||||||||||||
| Shares issued in connection with the acquisition of Morgan Stanley S&P 500 Select Fund | — | — | 1,411,661 | 14,166,238 | |||||||||||||||
| Reinvestment of dividends | 106,565 | 1,039,006 | — | — | |||||||||||||||
| Redeemed | (4,289,985 | ) | (41,612,056 | ) | (5,655,472 | ) | (63,493,732 | ) | |||||||||||
| Net increase - Class D | 2,749,117 | 28,327,696 | 3,896,483 | 44,977,206 | |||||||||||||||
| Net increase (decrease) in Fund | (4,625,915 | ) | $ | (33,864,106 | ) | (79,611 | ) | $ | 12,625,323 | ||||||||||
7. Purposes of and Risks Relating to Certain Financial Instruments
The Fund may purchase and sell stock index futures ("futures contracts") for the following reasons: to simulate full investment in the S&P 500 Index while retaining a cash balance for fund management purposes; to facilitate trading; to reduce transaction costs; or to seek higher investment returns when a futures contract is priced more attractively than stocks comprising the S&P 500 Index.
24
Morgan Stanley S&P 500 Index Fund
Notes to Financial Statements August 31, 2003 continued
These futures contracts involve elements of market risk in excess of the amount reflected in the Statement of Assets and Liabilities. The Fund bears the risk of an unfavorable change in the value of the underlying securities.
At August 31, 2003, the Fund had outstanding futures contracts.
8. Acquisition of Morgan Stanley S&P 500 Select Fund
On July 15, 2002, the Fund acquired all the net assets of the Morgan Stanley S&P 500 Select Fund ("S&P 500 Select") based on the respective valuations as of the close of business on July 12, 2002 pursuant to a plan of reorganization approved by the shareholders of S&P 500 Select on June 19, 2002. The acquisition was accomplished by a tax-free exchange of 317,381 Class A shares of the Fund at a net asset value of $9.95 per share for 372,839 Class A shares of S&P 500 Select; 5,067,694 Class B shares of the Fund at a net asset value of $9.65 per share for 5,927,666 Class B shares of S&P 500 Select; 527,578 Class C shares of the Fund at a net asset value of $9.65 per share for 616,360 Class C shares of S&P 500 Select; and 1,411,661 Class D shares of the Fund at a net asset value of $10.04 per share for 1,657,669 Class D shares of S&P 500 Select. The net assets of the Fund and S&P 500 Select immediately before the acquisition were $1,590,353,693 and $71,292,253, respectively, including unrealized depreciation of $5,471,646 for S&P 500 Select. Immediately after the acquisition, the combined net assets of the Fund amounted to $1,661,645,946.
9. Litigation
On August 6, 2003, a complaint was filed in the United States District Court for the Southern District of New York by a shareholder of the Fund on behalf of the Fund against Morgan Stanley Investment Advisors Inc. and Morgan Stanley Distributors Inc. (collectively, the "Defendants") alleging breach of fiduciary duty in respect of the Defendants' compensation. Plaintiff alleges the Fund trustees are not independent as required and seeks a declaration that the investment management and distribution agreements between the Fund and the Defendants are void. Plaintiff also alleges that the investment management and distribution fees were excessive and seeks damages equivalent to the investment management and distribution fees paid to the Defendants. The Defendants believe that the lawsuit has no merit and have moved to dismiss the action. The ultimate course of this matter is not presently determinable and no provision has been made in the Fund's financial statements for the effect, if any, of such a matter.
25
Morgan Stanley S&P 500 Index Fund
Financial Highlights
Selected ratios and per share data for a share of beneficial interest outstanding throughout each period:
| FOR THE YEAR ENDED AUGUST 31, | |||||||||||||||||||||||
| 2003 | 2002 | 2001 | 2000 | 1999 | |||||||||||||||||||
| Class A Shares | |||||||||||||||||||||||
| Selected Per Share Data: | |||||||||||||||||||||||
| Net asset value, beginning of period | $ | 9.91 | $ | 12.17 | $ | 16.20 | $ | 14.05 | $ | 10.18 | |||||||||||||
| Income (loss) from investment operations: | |||||||||||||||||||||||
| Net investment income‡ | 0.11 | 0.08 | 0.08 | 0.08 | 0.10 | ||||||||||||||||||
| Net realized and unrealized gain (loss) | 1.01 | (2.34 | ) | (4.11 | ) | 2.10 | 3.85 | ||||||||||||||||
| Total income (loss) from investment operations. | 1.12 | (2.26 | ) | (4.03 | ) | 2.18 | 3.95 | ||||||||||||||||
| Less dividends and distributions from: | |||||||||||||||||||||||
| Net investment income | (0.06 | ) | — | — | — | (0.07 | ) | ||||||||||||||||
| Net realized gain | — | — | — | (0.03 | ) | (0.01 | ) | ||||||||||||||||
| Total dividends and distributions | (0.06 | ) | — | — | (0.03 | ) | (0.08 | ) | |||||||||||||||
| Net asset value, end of period | $ | 10.97 | $ | 9.91 | $ | 12.17 | $ | 16.20 | $ | 14.05 | |||||||||||||
| Total Return† | 11.36 | % | (18.57 | )% | (24.83 | )% | 15.49 | % | 38.82 | % | |||||||||||||
| Ratios to Average Net Assets(1)(2): | |||||||||||||||||||||||
| Expenses. | 0.70 | % | 0.73 | % | 0.69 | % | 0.75 | % | 0.73 | % | |||||||||||||
| Net investment income | 1.11 | % | 0.73 | % | 0.59 | % | 0.49 | % | 0.72 | % | |||||||||||||
| Supplemental Data: | |||||||||||||||||||||||
| Net assets, end of period, in thousands | $233,233 | $160,949 | $159,099 | $183,085 | $99,140 | ||||||||||||||||||
| Portfolio turnover rate | 2 | % | 12 | % | 4 | % | 5 | % | 5 | % | |||||||||||||
| ‡ | The per share amounts were computed using an average number of shares outstanding during the period. |
| † | Does not reflect the deduction of sales charge. Calculated based on the net asset value as of the last business day of the period. |
| (1) | If the Fund had borne all of its expenses that were reimbursed or waived by the Investment Manager, the annualized expense and net investment income ratios would have been as follows: |
| PERIOD ENDED | EXPENSE RATIO | NET INVESTMENT INCOME RATIO | ||||||||
| August 31, 2003 | 0.82 | % | 0.99 | % | ||||||
| August 31, 2002 | 0.80 | % | 0.66 | % | ||||||
| August 31, 2001 | 0.72 | % | 0.56 | % | ||||||
| August 31, 2000 | 0.76 | % | 0.48 | % | ||||||
| August 31, 1999 | 0.81 | % | 0.64 | % | ||||||
| (2) | Reflects overall Fund ratios for investment income and non-class specific expenses. |
See Notes to Financial Statements
26
Morgan Stanley S&P 500 Index Fund
Financial Highlights continued
| FOR THE YEAR ENDED AUGUST 31, | |||||||||||||||||||||||
| 2003 | 2002 | 2001 | 2000 | 1999 | |||||||||||||||||||
| Class B Shares | |||||||||||||||||||||||
| Selected Per Share Data: | |||||||||||||||||||||||
| Net asset value, beginning of period | $ | 9.60 | $ | 11.88 | $ | 15.94 | $ | 13.93 | $ | 10.13 | |||||||||||||
| Income (loss) from investment operations: | |||||||||||||||||||||||
| Net investment income (loss)‡ | 0.03 | (0.01 | ) | (0.03 | ) | (0.04 | ) | (0.01 | ) | ||||||||||||||
| Net realized and unrealized gain (loss) | 0.97 | (2.27 | ) | (4.03 | ) | 2.08 | 3.83 | ||||||||||||||||
| Total income (loss) from investment operations | 1.00 | (2.28 | ) | (4.06 | ) | 2.04 | 3.82 | ||||||||||||||||
| Less dividends and distributions from: | |||||||||||||||||||||||
| Net investment income | — | — | — | — | (0.01 | ) | |||||||||||||||||
| Net realized gain | — | — | — | (0.03 | ) | (0.01 | ) | ||||||||||||||||
| Total dividends and distributions | — | — | — | (0.03 | ) | (0.02 | ) | ||||||||||||||||
| Net asset value, end of period | $ | 10.60 | $ | 9.60 | $ | 11.88 | $ | 15.94 | $ | 13.93 | |||||||||||||
| Total Return† | 10.42 | % | (19.19 | )% | (25.47 | )% | 14.69 | % | 37.68 | % | |||||||||||||
| Ratios to Average Net Assets(1)(2): | |||||||||||||||||||||||
| Expenses | 1.50 | % | 1.50 | % | 1.50 | % | 1.50 | % | 1.50 | % | |||||||||||||
| Net investment income (loss) | 0.31 | % | (0.04 | )% | (0.22 | )% | (0.26 | )% | (0.05 | )% | |||||||||||||
| Supplemental Data: | |||||||||||||||||||||||
| Net assets, end of period, in millions | $1,160 | $1,169 | $1,544 | $2,036 | $1,588 | ||||||||||||||||||
| Portfolio turnover rate | 2 | % | 12 | % | 4 | % | 5 | % | 5 | % | |||||||||||||
| ‡ | The per share amounts were computed using an average number of shares outstanding during the period. |
| † | Does not reflect the deduction of sales charge. Calculated based on the net asset value as of the last business day of the period. |
| (1) | If the Fund had borne all of its expenses that were reimbursed or waived by the Investment Manager, the annualized expense and net investment income (loss) ratios would have been as follows: |
| PERIOD ENDED | EXPENSE RATIO | NET INVESTMENT INCOME (LOSS) RATIO | ||||||||
| August 31, 2003 | 1.62% | 0.19 | % | |||||||
| August 31, 2002 | 1.57% | (0.11 | )% | |||||||
| August 31, 2001 | 1.53% | (0.25 | )% | |||||||
| August 31, 2000 | 1.51% | (0.27 | )% | |||||||
| August 31, 1999 | 1.58% | (0.13 | )% | |||||||
| (2) | Reflects overall Fund ratios for investment income and non-class specific expenses. |
See Notes to Financial Statements
27
Morgan Stanley S&P 500 Index Fund
Financial Highlights continued
| FOR THE YEAR ENDED AUGUST 31, | |||||||||||||||||||||||
| 2003 | 2002 | 2001 | 2000 | 1999 | |||||||||||||||||||
| Class C Shares | |||||||||||||||||||||||
| Selected Per Share Data: | |||||||||||||||||||||||
| Net asset value, beginning of period | $ | 9.60 | $ | 11.88 | $ | 15.94 | $ | 13.93 | $ | 10.13 | |||||||||||||
| Income (loss) from investment operations: | |||||||||||||||||||||||
| Net investment income (loss)‡ | 0.03 | 0.00 | (0.03 | ) | (0.04 | ) | (0.01 | ) | |||||||||||||||
| Net realized and unrealized gain (loss) | 0.97 | (2.28 | ) | (4.03 | ) | 2.08 | 3.83 | ||||||||||||||||
| Total income (loss) from investment operations | 1.00 | (2.28 | ) | (4.06 | ) | 2.04 | 3.82 | ||||||||||||||||
| Less dividends and distributions from: | |||||||||||||||||||||||
| Net investment income | — | — | — | — | (0.01 | ) | |||||||||||||||||
| Net realized gain | — | — | — | (0.03 | ) | (0.01 | ) | ||||||||||||||||
| Total dividends and distributions | — | — | — | (0.03 | ) | (0.02 | ) | ||||||||||||||||
| Net asset value, end of period | $ | 10.60 | $ | 9.60 | $ | 11.88 | $ | 15.94 | $ | 13.93 | |||||||||||||
| Total Return† | 10.42 | % | (19.19 | )% | (25.47 | )% | 14.69 | % | 37.70 | % | |||||||||||||
| Ratios to Average Net Assets(1)(2): | |||||||||||||||||||||||
| Expenses | 1.49 | % | 1.49 | % | 1.50 | % | 1.50 | % | 1.50 | % | |||||||||||||
| Net investment income (loss) | 0.32 | % | (0.03 | )% | (0.22 | )% | (0.26 | )% | (0.05 | )% | |||||||||||||
| Supplemental Data: | |||||||||||||||||||||||
| Net assets, end of period, in thousands | $160,963 | $146,615 | $168,751 | $211,446 | $143,092 | ||||||||||||||||||
| Portfolio turnover rate | 2 | % | 12 | % | 4 | % | 5 | % | 5 | % | |||||||||||||
| ‡ | The per share amounts were computed using an average number of shares outstanding during the period. |
| † | Does not reflect the deduction of sales charge. Calculated based on the net asset value as of the last business day of the period. |
| (1) | If the Fund had borne all of its expenses that were reimbursed or waived by the Investment Manager, the annualized expense and net investment income (loss) ratios would have been as follows: |
| PERIOD ENDED | EXPENSE RATIO | NET INVESTMENT INCOME (LOSS) RATIO | ||||||||
| August 31, 2003 | 1.61% | 0.20 | % | |||||||
| August 31, 2002 | 1.56% | (0.10 | )% | |||||||
| August 31, 2001 | 1.53% | (0.25 | )% | |||||||
| August 31, 2000 | 1.51% | (0.27 | )% | |||||||
| August 31, 1999 | 1.58% | (0.13 | )% | |||||||
| (2) | Reflects overall Fund ratios for investment income and non-class specific expenses. |
See Notes to Financial Statements
28
Morgan Stanley S&P 500 Index Fund
Financial Highlights continued
| FOR THE YEAR ENDED AUGUST 31, | |||||||||||||||||||||||
| 2003 | 2002 | 2001 | 2000 | 1999 | |||||||||||||||||||
| Class D Shares | |||||||||||||||||||||||
| Selected Per Share Data: | |||||||||||||||||||||||
| Net asset value, beginning of period | $ | 10.00 | $ | 12.26 | $ | 16.28 | $ | 14.09 | $ | 10.20 | |||||||||||||
| Income (loss) from investment operations: | |||||||||||||||||||||||
| Net investment income‡ | 0.13 | 0.11 | 0.11 | 0.11 | 0.13 | ||||||||||||||||||
| Net realized and unrealized gain (loss) | 1.02 | (2.37 | ) | (4.13 | ) | 2.11 | 3.85 | ||||||||||||||||
| Total income (loss) from investment operations | 1.15 | (2.26 | ) | (4.02 | ) | 2.22 | 3.98 | ||||||||||||||||
| Less dividends and distributions from: | |||||||||||||||||||||||
| Net investment income | (0.09 | ) | — | — | — | (0.08 | ) | ||||||||||||||||
| Net realized gain | — | — | — | (0.03 | ) | (0.01 | ) | ||||||||||||||||
| Total dividends and distributions | (0.09 | ) | — | — | (0.03 | ) | (0.09 | ) | |||||||||||||||
| Net asset value, end of period | $ | 11.06 | $ | 10.00 | $ | 12.26 | $ | 16.28 | $ | 14.09 | |||||||||||||
| Total Return† | 11.59 | % | (18.43 | )% | (24.69 | )% | 15.81 | % | 39.13 | % | |||||||||||||
| Ratios to Average Net Assets(1)(2): | |||||||||||||||||||||||
| Expenses | 0.50 | % | 0.50 | % | 0.50 | % | 0.50 | % | 0.50 | % | |||||||||||||
| Net investment income | 1.31 | % | 0.96 | % | 0.78 | % | 0.74 | % | 0.95 | % | |||||||||||||
| Supplemental Data: | |||||||||||||||||||||||
| Net assets, end of period, in thousands | $180,322 | $135,611 | $118,378 | $92,304 | $16,538 | ||||||||||||||||||
| Portfolio turnover rate | 2 | % | 12 | % | 4 | % | 5 | % | 5 | % | |||||||||||||
| ‡ | The per share amounts were computed using an average number of shares outstanding during the period. |
| † | Calculated based on the net asset value as of the last business day of the period. |
| (1) | If the Fund had borne all of its expenses that were reimbursed or waived by the Investment Manager, the annualized expense and net investment income ratios would have been as follows: |
| PERIOD ENDED | EXPENSE RATIO | NET INVESTMENT INCOME RATIO | ||||||||
| August 31, 2003 | 0.62 | % | 1.19 | % | ||||||
| August 31, 2002 | 0.57 | % | 0.89 | % | ||||||
| August 31, 2001 | 0.53 | % | 0.75 | % | ||||||
| August 31, 2000 | 0.51 | % | 0.73 | % | ||||||
| August 31, 1999 | 0.58 | % | 0.87 | % | ||||||
| (2) | Reflects overall Fund ratios for investment income and non-class specific expenses. |
See Notes to Financial Statements
29
Morgan Stanley S&P 500 Index Fund
Independent Auditors' Report
To the Shareholders and Board of Trustees of
Morgan Stanley S&P 500 Index Fund:
We have audited the accompanying statement of assets and liabilities of Morgan Stanley S&P 500 Index Fund (the "Fund"), including the portfolio of investments, as of August 31, 2003, and the related statements of operations for the year then ended and changes in net assets for each of the two years in the period then ended, and the financial highlights for each of the five years in the period then ended. These financial statements and financial highlights are the responsibility of the Fund's management. Our responsibility is to express an opinion on these financial statements and financial highlights based on our audits.
We conducted our audits in accordance with auditing standards generally accepted in the United States of America. Those standards require that we plan and perform the audit to obtain reasonable assurance about whether the financial statements and financial highlights are free of material misstatement. An audit includes examining, on a test basis, evidence supporting the amounts and disclosures in the financial statements. Our procedures included confirmation of securities owned as of August 31, 2003, by correspondence with the custodian and brokers; where replies were not received from brokers, we performed other auditing procedures. An audit also includes assessing the accounting principles used and significant estimates made by management, as well as evaluating the overall financial statement presentation. We believe that our audits provide a reasonable basis for our opinion.
In our opinion, the financial statements and financial highlights referred to above present fairly, in all material respects, the financial position of Morgan Stanley S&P 500 Index Fund as of August 31, 2003, the results of its operations for the year then ended, the changes in its net assets for each of the two years in the period then ended, and the financial highlights for each of the five years in the period then ended, in conformity with accounting principles generally accepted in the United States of America.
Deloitte & Touche LLP
New York, New York
October 15, 2003
2003 Federal Tax Notice (unaudited)
For the fiscal year ended August 31, 2003, 100% of the income dividends paid by the Fund qualified for the dividends received deduction available to corporations.
30
Morgan Stanley S&P 500 Index Fund
Trustee and Officer Information
Independent Trustees:
| Name, Age and Address of Independent Trustee | Position(s) Held with Registrant | Term of Office and Length of Time Served* | Principal Occupation(s) During Past 5 Years** | Number of Portfolios in Fund Complex Overseen by Trustee*** | Other Directorships Held by Trustee | |||||||||||||||||
| Michael Bozic (62) c/o Mayer, Brown, Rowe & Maw LLP Counsel to the Independent Directors 1675 Broadway New York, NY | Trustee | Since April 1994 | Retired; Director or Trustee of the Retail Funds and TCW/DW Term Trust 2003 (since April 1994) and the Institutional Funds (since July 2003); formerly Vice Chairman of Kmart Corporation (December 1998-October 2000), Chairman and Chief Executive Officer of Levitz Furniture Corporation (November 1995-November 1998) and President and Chief Executive Officer of Hills Department Stores (May 1991-July 1995); formerly variously Chairman, Chief Executive Officer, President and Chief Operating Officer (1987-1991) of the Sears Merchandise Group of Sears, Roebuck & Co. | 216 | Director of Weirton Steel Corporation. | |||||||||||||||||
| Edwin J. Garn (70) c/o Summit Ventures LLC 1 Utah Center 201 S. Main Street Salt Lake City, UT | Trustee | Since January 1993 | Director or Trustee of the Retail Funds and TCW/DW Term Trust 2003 (since January 1993) and the Institutional Funds (since July 2003); member of the Utah Regional Advisory Board of Pacific Corp.; formerly United States Senator (R-Utah) (1974-1992) and Chairman, Senate Banking Committee (1980-1986), Mayor of Salt Lake City, Utah (1971-1974), Astronaut, Space Shuttle Discovery (April 12-19, 1985), and Vice Chairman, Huntsman Corporation (chemical company). | 216 | Director of Franklin Covey (time management systems), BMW Bank of North America, Inc. (industrial loan corporation), United Space Alliance (joint venture between Lockheed Martin and the Boeing Company) and Nuskin Asia Pacific (multilevel marketing); member of the board of various civic and charitable organizations. | |||||||||||||||||
| Wayne E. Hedien (69) c/o Mayer, Brown, Rowe & Maw LLP Counsel to the Independent Directors 1675 Broadway New York, NY | Trustee | Since September 1997 | Retired; Director or Trustee of the Retail Funds and TCW/DW Term Trust 2003; (Since September 1997) and the Institutional Funds (since July 2003); formerly associated with the Allstate Companies (1966-1994), most recently as Chairman of The Allstate Corporation (March 1993-December 1994) and Chairman and Chief Executive Officer of its wholly-owned subsidiary, Allstate Insurance Company (July 1989-December 1994). | 216 | Director of The PMI Group Inc. (private mortgage insurance); Trustee and Vice Chairman of The Field Museum of Natural History; director of various other business and charitable organizations. | |||||||||||||||||
31
Morgan Stanley S&P 500 Index Fund
Trustee and Officer Information continued
| Name, Age and Address of Independent Trustee | Position(s) Held with Registrant | Term of Office and Length of Time Served* | Principal Occupation(s) During Past 5 Years** | Number of Portfolios in Fund Complex Overseen by Trustee*** | Other Directorships Held by Trustee | |||||||||||||||||
| Dr. Manuel H. Johnson (54) c/o Johnson Smick International, Inc. 2099 Pennsylvania Avenue, N.W. Suite 950 Washington, D.C. | Trustee | Since July 1991 | Chairman of the Audit Committee and Director or Trustee of the Retail Funds and TCW/DW Term Trust 2003 (since July 1991) and the Institutional Funds (since July 2003); Senior Partner, Johnson Smick International, Inc., a consulting firm; Co-Chairman and a founder of the Group of Seven Council (G7C), an international economic commission; formerly Vice Chairman of the Board of Governors of the Federal Reserve System and Assistant Secretary of the U.S. Treasury. | 216 | Director of NVR, Inc. (home construction); Chairman and Trustee of the Financial Accounting Foundation (oversight organization of the Financial Accounting Standards Board); Director of RBS Greenwich Capital Holdings (financial holding company). | |||||||||||||||||
| Joseph J. Kearns (61) PMB754 23852 Pacific Coast Highway Malibu, CA | Trustee | Since July 2003 | Deputy Chairman of the Audit Committee and Director or Trustee of the Retail Funds and TCW/DW Term Trust 2003 (since July 2003) and the Institutional Funds (since August 1994); previously Chairman of the Audit Committee of the Institutional Funds (October 2001-July 2003); President, Kearns & Associates LLC (investment consulting); formerly CFO of the J. Paul Getty Trust. | 217 | Director of Electro Rent Corporation (equipment leasing), The Ford Family Foundation, and the UCLA Foundation. | |||||||||||||||||
| Michael E. Nugent (67) c/o Triumph Capital, L.P. 445 Park Avenue New York, NY | Trustee | Since July 1991 | Chairman of the Insurance Committee and Director or Trustee of the Retail Funds and TCW/DW Term Trust 2003 (since July 1991) and the Institutional Funds (since July 2001); General Partner of Triumph Capital, L.P., a private investment partnership; formerly Vice President, Bankers Trust Company and BT Capital Corporation (1984-1988). | 216 | Director of various business organizations. | |||||||||||||||||
| Fergus Reid (71) 85 Charles Colman Blvd. Pawling, NY | Trustee | Since July 2003 | Chairman of the Governance Committee and Director or Trustee of the Retail Funds and TCW/DW Term Trust 2003 (since July 2003) and the Institutional Funds (since June 1992); Chairman of Lumelite Plastics Corporation. | 217 | Trustee and Director of certain investment companies in the JPMorgan Funds complex managed by JP Morgan Investment Management Inc. | |||||||||||||||||
32
Morgan Stanley S&P 500 Index Fund
Trustee and Officer Information continued
Interested Trustees:
| Name, Age and Address of Independent Trustee | Position(s) Held with Registrant | Term of Office and Length of Time Served* | Principal Occupation(s) During Past 5 Years** | Number of Portfolios in Fund Complex Overseen by Trustee*** | Other Directorships Held by Trustee | |||||||||||||||||
| Charles A. Fiumefreddo (70) c/o Morgan Stanley Trust Harborside Financial Center, Plaza Two, Jersey City, NJ | Chairman of the Board and Trustee | Since July 1991 | Chairman and Director or Trustee of the Retail Funds and TCW/DW Term Trust 2003 (since July 1991) and the Institutional Funds (since July 2003); formerly Chief Executive Officer of the Retail Funds and the TCW/DW Term Trust 2003 (until September 2002). | 216 | None | |||||||||||||||||
| James F. Higgins (55) c/o Morgan Stanley Trust Harborside Financial Center, Plaza Two, Jersey City, NJ | Trustee | Since June 2000 | Director or Trustee of the Retail Funds and TCW/DW Term Trust 2003 (since June 2000) and the Institutional Funds (since July 2003); Senior Advisor of Morgan Stanley (since August 2000); Director of the Distributor and Dean Witter Realty Inc.; previously President and Chief Operating Officer of the Private Client Group of Morgan Stanley (May 1999-August 2000), and President and Chief Operating Officer of Individual Securities of Morgan Stanley (February 1997-May 1999). | 216 | Director of AXA Financial, Inc. and The Equitable Life Assurance Society of the United States (financial services). | |||||||||||||||||
| Philip J. Purcell (59) 1585 Broadway New York, NY | Trustee | Since April 1994 | Director or Trustee of the Retail Funds and TCW/DW Term Trust 2003 (since April 1994) and the Institutional Funds (since July 2003); Chairman of the Board of Directors and Chief Executive Officer of Morgan Stanley and Morgan Stanley DW Inc.; Director of the Distributor; Chairman of the Board of Directors and Chief Executive Officer of Novus Credit Services Inc.; Director and/or officer of various Morgan Stanley subsidiaries. | 216 | Director of American Airlines, Inc. and its parent company, AMR Corporation. | |||||||||||||||||
| * | This is the earliest date the Trustee began serving the funds advised by Morgan Stanley Investment Advisors Inc. (the "Investment Manager") (the "Retail Funds"). |
| ** | The dates referenced below indicating commencement of services as Director/Trustee for the Retail Funds and the funds advised by Morgan Stanley Investment Management Inc., Morgan Stanley Investments LP and Morgan Stanley AIP GP LP (the "Institutional Funds") reflect the earliest date the Director/Trustee began serving the Retail or Institutional Funds as applicable. |
| *** | The Fund Complex includes all open-end and closed-end funds (including all of their portfolios) advised by the Investment Manager and any funds that have an investment advisor that is an affiliated person of the Investment Manager (including but not limited to Morgan Stanley Investment Management Inc. and Morgan Stanley Investments LP). |
33
Morgan Stanley S&P 500 Index Fund
Trustee and Officer Information continued
Officers:
| Name, Age and Address of Executive Officer | Position(s) Held with Registrant | Term of Office and Length of Time Served* | Principal Occupation(s) During Past 5 Years** | |||||||||||
| Mitchell M. Merin (50) 1221 Avenue of the Americas New York, NY | President | Since May 1999 | President and Chief Operating Officer of Morgan Stanley Investment Management Inc.; President, Director and Chief Executive Officer of the Investment Manager and Morgan Stanley Services; Chairman, Chief Executive Officer and Director of the Distributor; Chairman and Director of the Transfer Agent; Director of various Morgan Stanley subsidiaries; President Morgan Stanley Investments LP (since February 2003); President of the Institutional Funds (since July 2003) and President of the Retail Funds and TCW/DW Term Trust 2003 (since May 1999); Trustee (since July 2003) and President (since December 2002) of the Van Kampen Closed-End Funds; Trustee (since May 1999) and President (since October 2002) of the Van Kampen Open-End Funds. | |||||||||||
| Ronald E. Robison (64) 1221 Avenue of the Americas New York, NY | Executive Vice President and Principal Executive Officer | Since April 2003 | Chief Global Operations Officer and Managing Director of Morgan Stanley Investment Management Inc.; Managing Director of Morgan Stanley & Co. Incorporated; Managing Director of Morgan Stanley; Managing Director, Chief Administrative Officer and Director of the Investment Manager and Morgan Stanley Services; Chief Executive Officer and Director of the Transfer Agent; Executive Vice President and Principal Executive Officer of the Institutional Funds (since July 2003); and the TCW/DW Term Trust 2003 (since April 2003); previously President of the Institutional Funds (March 2001-July 2003) and Director of the Institutional Funds (March 2001-July 2003). | |||||||||||
| Barry Fink (48) 1221 Avenue of the Americas New York, NY | Vice President and General Counsel | Since February 1997 | General Counsel (since May 2000) and Managing Director (since December 2000) of Morgan Stanley Investment Management; Managing Director (since December 2000), Secretary (since February 1997) and Director (since July 1998) of the Investment Manager and Morgan Stanley Services; Assistant Secretary of Morgan Stanley DW; Chief Legal Officer of Morgan Stanley Investments LP (since July 2002); Vice President of the Institutional Funds (since July 2003); Vice President and Secretary of the Distributor; previously Secretary of the Retail Funds (February 1997-July 2003); previously Vice President and Assistant General Counsel of the Investment Manager and Morgan Stanley Services (February 1997-December 2001). | |||||||||||
| Joseph J. McAlinden (60) 1221 Avenue of the Americas New York, NY | Vice President | Since July 1995 | Managing Director and Chief Investment Officer of the Investment Manager, Morgan Stanley Investment Management Inc. and Morgan Stanley Investments LP; Director of the Transfer Agent, Chief Investment Officer of the Van Kampen Funds; Vice President of the Institutional Funds (since July 2003) and the Retail Funds (since July 1995). | |||||||||||
| Stefanie V. Chang (36) 1221 Avenue of the Americas New York, NY | Vice President | Since July 2003 | Executive Director of Morgan Stanley & Co. and Morgan Stanley Investment Management Inc. and Vice President of the Institutional Funds (since December 1997) and the Retail Funds (since July 2003); formerly practiced law with the New York law firm of Rogers & Wells (now Clifford Chance LLP). | |||||||||||
34
Morgan Stanley S&P 500 Index Fund
Trustee and Officer Information continued
| Name, Age and Address of Executive Officer | Position(s) Held with Registrant | Term of Office and Length of Time Served* | Principal Occupation(s) During Past 5 Years** | |||||||||||
| Francis Smith (38) c/o Morgan Stanley Trust Harborside Financial Center, Plaza Two, Jersey City, NJ | Treasurer and Chief Financial Officer | Treasurer since July 2003 and Chief Financial Officer since September 2002 | Executive Director of the Investment Manager and Morgan Stanley Services (since December 2001); previously Vice President of the Retail Funds (September 2002-July 2003); previously Vice President of the Investment Manager and Morgan Stanley Services (August 2000-November 2001) and Senior Manager at PricewaterhouseCoopers LLP (January 1998-August 2000). | |||||||||||
| Thomas F. Caloia (57) c/o Morgan Stanley Trust Harborside Financial Center, Plaza Two, Jersey City, NJ | Vice President | Since July 2003 | Executive Director (since December 2002) and Assistant Treasurer of the Investment Manager, the Distributor and Morgan Stanley Services; previously Treasurer of the Retail Funds (April 1989-July 2003); formerly First Vice President of the Investment Manager, the Distributor and Morgan Stanley Services. | |||||||||||
| Mary E. Mullin (36) 1221 Avenue of the Americas New York, NY | Secretary | Since July 2003 | Vice President of Morgan Stanley & Co. Incorporated and Morgan Stanley Investment Management Inc.; Secretary of the Institutional Funds (since June 1999) and the Retail Funds (since July 2003); formerly practiced law with the New York law firms of McDermott, Will & Emery and Skadden, Arps, Slate, Meagher & Flom LLP. | |||||||||||
| * | This is the earliest date the Officer began serving the Retail Funds. Each Officer serves an indefinite term, until his or her successor is elected. |
| ** | The dates referenced below indicating commencement of service as an Officer for the Retail and Institutional Funds reflect the earliest date the Officer began serving the Retail or Institutional Funds as applicable. |
35
Trustees Michael Bozic Officers Charles A. Fiumefreddo Mitchell M. Merin Ronald E. Robison Barry Fink Joseph J. McAlinden Stefanie V. Chang Francis Smith Thomas F. Caloia Mary E. Mullin Transfer Agent Morgan Stanley Trust Independent Auditors Deloitte & Touche LLP Investment Manager Morgan Stanley Investment Advisors Inc. This report is submitted for the general information of the shareholders of the Fund. For more detailed information about the Fund, its fees and expenses and other pertinent information, please read its Prospectus. The Fund's Statement of Additional Information contains additional information about the Fund, including its trustees. It is available, without charge, by calling (800) 869-NEWS. This report is not authorized for distribution to prospective investors in the Fund unless preceded or accompanied by an effective Prospectus. Read the Prospectus carefully before investing. Investments and services offered through Morgan Stanley DW Inc., member SIPC. Morgan Stanley Distributors Inc., member NASD. © 2003 Morgan Stanley 36007RPT-12357J03-OP-10/03 | MORGAN STANLEY FUNDS | |
Morgan Stanley S&P 500 Index Fund Annual Report August 31, 2003 | ||
 |
Item 2.  Code of Ethics.

(a) The Fund has adopted a code of ethics (the "Code of Ethics") that applies to
its principal executive officer, principal financial officer, principal
accounting officer or controller, or persons performing similar functions,
regardless of whether these individuals are employed by the Fund or a third
party.

(b) No information need be disclosed pursuant to this paragraph.

(c) The Fund has amended its Code of Ethics during the period covered by the
shareholder report presented in Item 1 hereto

(d) The Fund has granted a waiver or an implicit waiver from a provision of its
Code of Ethics.

(e) Not applicable.

(f)

     (1) The Fund's Code of Ethics is attached hereto as Exhibit A.

     (2) Not applicable.

     (3) Not applicable.


Item 3.  Audit Committee Financial Expert.

The Fund's Board of Trustees has determined that it has two "audit committee
financial experts" serving on its audit committee, each of whom are
"independent" Trustees: Dr. Manuel H. Johnson and Joseph J. Kearns. Under
applicable securities laws, a person who is determined to be an audit committee
financial expert will not be deemed an "expert" for any purpose, including
without limitation for the purposes of Section 11 of the Securities Act of 1933,
as a result of being designated or identified as an audit committee financial
expert. The designation or identification of a person as an audit committee
financial expert does not impose on such person any duties, obligations, or
liabilities that are greater than the duties, obligations, and liabilities
imposed on such person as a member of the audit committee and Board of Trustees
in the absence of such designation or identification.


Item 9 - Controls and Procedures

(a) The Fund's principal executive officer and principal financial officer have
concluded that the Fund's disclosure controls and procedures are sufficient to
ensure that information required to be disclosed by the Fund in this Form N-CSR
was recorded, processed, summarized and reported within the time periods
specified in the Securities and Exchange Commission's rules and forms, based
upon such officers' evaluation of these controls and procedures as of a date
within 90 days of the filing date of the report.

     There were no significant changes or corrective actions with regard to
significant deficiencies or material weaknesses in the Fund's internal controls
or in other factors that could significantly affect the Fund's internal controls
subsequent to the date of their evaluation.


(b) There were no changes in the registrant's internal control over financial
reporting that occurred during the registrant's most recent fiscal half-year
(the registrant's second fiscal half-year in the case of an annual report) that
has materially affected, or is reasonably likely to materially affect, the
registrant's internal control over financial reporting.


                                       2


Item 10 Exhibits

(a) The Code of Ethics for Principal Executive and Senior Financial Officers is
attached hereto.

(b) A separate certification for each principal executive officer and principal
financial officer of the registrant are attached hereto as part of EX-99.CERT.

Items 4 - 8 are not applicable


                                   SIGNATURES

     Pursuant to the requirements of the Securities Exchange Act of 1934 and the
Investment Company Act of 1940, the registrant has duly caused this report to be
signed on its behalf by the undersigned, thereunto duly authorized.

Morgan Stanley S&P 500 Index Fund
Ronald E. Robison
Principal Executive Officer
October 20, 2003

     Pursuant to the requirements of the Securities Exchange Act of 1934 and the
Investment Company Act of 1940, this report has been signed by the following
persons on behalf of the registrant and in the capacities and on the dates
indicated.

Ronald E. Robison
Principal Executive Officer
October 20, 2003

Francis Smith
Principal Financial Officer
October 20, 2003


                                       3


                                                                    EXHIBIT 10 A

      CODE OF ETHICS FOR PRINCIPAL EXECUTIVE AND SENIOR FINANCIAL OFFICERS
      --------------------------------------------------------------------
                              ADOPTED JULY 31, 2003
                              ---------------------


I.   This Code of Ethics (the "Code") for the investment companies within the
     Morgan Stanley complex identified in Exhibit A (collectively, "Funds" and
     each, a "Fund") applies to each Fund's Principal Executive Officer,
     President, Principal Financial Officer and Treasurer (or persons performing
     similar functions) ("Covered Officers" each of whom are set forth in
     Exhibit B) for the purpose of promoting:

     o    honest and ethical conduct, including the ethical handling of actual
          or apparent conflicts of interest between personal and professional
          relationships.

     o    full, fair, accurate, timely and understandable disclosure in reports
          and documents that a company files with, or submits to, the Securities
          and Exchange Commission ("SEC") and in other public communications
          made by the Fund;

     o    compliance with applicable laws and governmental rules and
          regulations;

     o    prompt internal reporting of violations of the Code to an appropriate
          person or persons identified in the Code; and

     o    accountability for adherence to the Code.

     Each Covered Officer should adhere to a high standard of business ethics
and should be sensitive to situations that may give rise to actual as well as
apparent conflicts of interest. Any question about the application of the Code
should be referred to the General Counsel or his/her designee (who is set forth
in Exhibit C).

II.  COVERED OFFICERS SHOULD HANDLE ETHICALLY ACTUAL AND APPARENT CONFLICTS OF
     INTEREST


                                       4


     OVERVIEW. A "conflict of interest" occurs when a Covered Officer's private
interest interferes, or appears to interfere, with the interests of, or his
service to, the Fund. For example, a conflict of interest would arise if a
Covered Officer, or a member of his family, receives improper personal benefits
as a result of his position with the Fund.

     Certain conflicts of interest arise out of the relationships between
Covered Officers and the Fund and already are subject to conflict of interest
provisions in the Investment Company Act of 1940 ("Investment Company Act") and
the Investment Advisers Act of 1940 ("Investment Advisers Act"). For example,
Covered Officers may not individually engage in certain transactions (such as
the purchase or sale of securities or other property) with the Fund because of
their status as "affiliated persons" (as defined in the Investment Company Act)
of the Fund. The Fund's and its investment adviser's compliance programs and
procedures are designed to prevent, or identify and correct, violations of these
provisions. This Code does not, and is not intended to, repeat or replace these
programs and procedures, and such conflicts fall outside the parameters of this
Code, unless or until the General Counsel determines that any violation of such
programs and procedures is also a violation of this Code.

     Although typically not presenting an opportunity for improper personal
benefit, conflicts may arise from, or as a result of, the contractual
relationship between the Fund and its investment adviser of which the Covered
Officers are also officers or employees. As a result, this Code recognizes that
the Covered Officers will, in the normal course of their duties (whether
formally for the Fund or for the investment adviser, or for both), be involved
in establishing policies and implementing decisions that will have different
effects on the Fund and its investment adviser. The participation of the Covered
Officers in such activities is inherent in the contractual relationship between
the Fund and the investment adviser and is consistent with the performance by
the Covered Officers of their duties as officers of the Fund. Thus, if performed
in conformity with the provisions of the Investment Company Act and the
Investment Advisers Act, such activities will be deemed to have been handled
ethically. In addition, it is recognized by the Funds' Boards of
Directors/Trustees ("Boards") that the Covered Officers may also be officers or
employees of one or more other investment companies covered by this or other
codes.

     Other conflicts of interest are covered by the Code, even if such conflicts
of interest are not subject to provisions in the Investment Company Act and the
Investment Advisers Act. The following list provides examples of conflicts of
interest under the Code, but Covered Officers should keep in mind that these
examples are not exhaustive. The overarching principle is that the personal
interest of a Covered Officer should not be placed improperly before the
interest of the Fund.

     Each Covered Officer must not:

o    use his personal influence or personal relationships improperly to
     influence investment decisions or financial reporting by the Fund whereby
     the Covered Officer would benefit personally (directly or indirectly) to
     the detriment of the Fund;


                                       5


o    cause the Fund to take action, or fail to take action, for the individual
     personal benefit of the Covered Officer rather than the benefit of the
     Fund; or

o    use material non-public knowledge of portfolio transactions made or
     contemplated for, or actions proposed to be taken by, the Fund to trade
     personally or cause others to trade personally in contemplation of the
     market effect of such transactions.

     Each Covered Officer must, at the time of signing this Code, report to the
General Counsel all affiliations or significant business relationships outside
the Morgan Stanley complex and must update the report annually.

     Conflict of interest situations should always be approved by the General
Counsel and communicated to the relevant Fund or Fund's Board. Any activity or
relationship that would present such a conflict for a Covered Officer would
likely also present a conflict for the Covered Officer if an immediate member of
the Covered Officer's family living in the same household engages in such an
activity or has such a relationship. Examples of these include:

     o    service or significant business relationships as a director on the
          board of any public or private company;

     o    accepting directly or indirectly, anything of value, including gifts
          and gratuities in excess of $100 per year from any person or entity
          with which the Fund has current or prospective business dealings, not
          including occasional meals or tickets for theatre or sporting events
          or other similar entertainment; provided it is business-related,
          reasonable in cost, appropriate as to time and place, and not so
          frequent as to raise any question of impropriety;

     o    any ownership interest in, or any consulting or employment
          relationship with, any of the Fund's service providers, other than its
          investment adviser, principal underwriter, or any affiliated person
          thereof; and

     o    a direct or indirect financial interest in commissions, transaction
          charges or spreads paid by the Fund for effecting portfolio
          transactions or for selling or redeeming shares other than an interest
          arising from the Covered Officer's employment, such as compensation or
          equity ownership.

III. DISCLOSURE AND COMPLIANCE

     o    Each Covered Officer should familiarize himself/herself with the
          disclosure and compliance requirements generally applicable to the
          Funds;

     o    each Covered Officer must not knowingly misrepresent, or cause others
          to misrepresent, facts about the Fund to others, whether within or
          outside the


                                       6


          Fund, including to the Fund's Directors/Trustees and auditors, or to
          governmental regulators and self-regulatory organizations;

     o    each Covered Officer should, to the extent appropriate within his area
          of responsibility, consult with other officers and employees of the
          Funds and their investment advisers with the goal of promoting full,
          fair, accurate, timely and understandable disclosure in the reports
          and documents the Funds file with, or submit to, the SEC and in other
          public communications made by the Funds; and

     o    it is the responsibility of each Covered Officer to promote compliance
          with the standards and restrictions imposed by applicable laws, rules
          and regulations.

IV.  REPORTING AND ACCOUNTABILITY

     Each Covered Officer must:

     o    upon adoption of the Code (thereafter as applicable, upon becoming a
          Covered Officer), affirm in writing to the Boards that he has
          received, read and understands the Code;

     o    annually thereafter affirm to the Boards that he has complied with the
          requirements of the Code;

     o    not retaliate against any other Covered Officer, other officer or any
          employee of the Funds or their affiliated persons for reports of
          potential violations that are made in good faith; and

     o    notify the General Counsel promptly if he/she knows or suspects of any
          violation of this Code. Failure to do so is itself a violation of this
          Code.

     The General Counsel is responsible for applying this Code to specific
situations in which questions are presented under it and has the authority to
interpret this Code in any particular situation. However, any waivers(1) sought
by a Covered Officer must be considered by the Board of the relevant Fund or
Funds.

     The Funds will follow these procedures in investigating and enforcing this
Code:

     o    the General Counsel will take all appropriate action to investigate
          any potential violations reported to him;


- --------------
(1)  Item 2 of Form N-CSR defines "waiver" as "the approval by the registrant of
     a material departure from a provision of the code of ethics."

                                       7


     o    if, after such investigation, the General Counsel believes that no
          violation has occurred, the General Counsel is not required to take
          any further action;

     o    any matter that the General Counsel believes is a violation will be
          reported to the relevant Fund's Audit Committee;

     o    if the directors/trustees/managing general partners who are not
          "interested persons" as defined by the Investment Company Act (the
          "Independent Directors/Trustees/Managing General Partners") of the
          relevant Fund concur that a violation has occurred, they will consider
          appropriate action, which may include review of, and appropriate
          modifications to, applicable policies and procedures; notification to
          appropriate personnel of the investment adviser or its board; or a
          recommendation to dismiss the Covered Officer or other appropriate
          disciplinary actions;

     o    the Independent Directors/Trustees/Managing General Partners of the
          relevant Fund will be responsible for granting waivers of this Code,
          as appropriate; and

     o    any changes to or waivers of this Code will, to the extent required,
          be disclosed as provided by SEC rules.

V.   OTHER POLICIES AND PROCEDURES

     This Code shall be the sole code of ethics adopted by the Funds for
purposes of Section 406 of the Sarbanes-Oxley Act of 2002 and the rules and
forms applicable to registered investment companies thereunder. Insofar as other
policies or procedures of the Funds, the Funds' investment advisers, principal
underwriters, or other service providers govern or purport to govern the
behavior or activities of the Covered Officers who are subject to this Code,
they are superseded by this Code to the extent that they overlap or conflict
with the provisions of this Code unless any provision of this Code conflicts
with any applicable federal or state law, in which case the requirements of such
law will govern. The Funds' and their investment advisers' and principal
underwriters' codes of ethics under Rule 17j-1 under the Investment Company Act
and Morgan Stanley's Code of Ethics are separate requirements applying to the
Covered Officers and others, and are not part of this Code.

VI.  AMENDMENTS

     Any amendments to this Code, other than amendments to Exhibits A, B

or C, must be approved or ratified by a majority vote of the Board of each
Fund, including a majority of Independent Directors/Trustees/Managing General
Partners.

VII. CONFIDENTIALITY


                                       8


     All reports and records prepared or maintained pursuant to this Code will
be considered confidential and shall be maintained and protected accordingly.
Except as otherwise required by law or this Code, such matters shall not be
disclosed to anyone other than the Independent Directors/Trustees/Managing
General Partners of the relevant Fund or Funds and their counsel, the relevant
Fund or Funds and their counsel and the relevant investment adviser and its
counsel.


                                       9


VIII. INTERNAL USE

     The Code is intended solely for the internal use by the Funds and does not
constitute an admission, by or on behalf of any Fund, as to any fact,
circumstance, or legal conclusion


I have read and understand the terms of the above Code. I recognize the
responsibilities and obligations incurred by me as a result of my being subject
to the Code. I hereby agree to abide by the above Code.


- ---------------------------------------

Date:
     ---------------------------------


                                       10


                                   EXHIBIT B
                                   ---------

                               INSTITUTIONAL FUNDS
                                COVERED OFFICERS
                                ----------------

                          Mitchell M. Merin - President
  Ronald E. Robison - Executive Vice President and Principal Executive Officer
            James W. Garrett - Chief Financial Officer and Treasurer

                                  RETAIL FUNDS
                                COVERED OFFICERS
                                ----------------

                          Mitchell M. Merin - President
  Ronald E. Robison - Executive Vice President and Principal Executive Officer
               Frank Smith - Chief Financial Officer and Treasurer


                                       11


                                    EXHIBIT C
                                    ---------

                                 GENERAL COUNSEL
                                 ---------------

                                   Barry Fink


                                       12


                                                                   EXHIBIT 10 B1

                  CERTIFICATION OF PRINCIPAL EXECUTIVE OFFICER

                                 CERTIFICATIONS
                                 --------------

I, Ronald E. Robison, certify that:

          1. I have reviewed this report on Form N-CSR of Morgan Stanley S&P 500
Index Fund;

          2.     Based on my knowledge, this report does not contain any untrue
                 statement of a material fact or omit to state a material fact
                 necessary to make the statements made, in light of the
                 circumstances under which such statements were made, not
                 misleading with respect to the period covered by this report;

          3.     Based on my knowledge, the financial statements, and other
                 financial information included in this report, fairly present
                 in all material respects the financial condition, results of
                 operations, changes in net assets, and cash flows (if the
                 financial statements are required to include a statement of
                 cash flows) of the registrant as of, and for, the periods
                 presented in this report;

          4.     The registrant's other certifying officers and I are
                 responsible for establishing and maintaining disclosure
                 controls and procedures (as defined in Rule 30a-2(c) under the
                 Investment Company Act of 1940) for the registrant and have:

          a)     designed such disclosure controls and procedures to ensure that
                 material information relating to the registrant, including its
                 consolidated subsidiaries, is made known to us by others within
                 those entities, particularly during the period in which this
                 report is being prepared;

          b)     evaluated the effectiveness of the registrant's disclosure
                 controls and procedures as of a date within 90 days prior to
                 the filing date of this report (the "Evaluation Date"); and

          c)     presented in this report our conclusions about the
                 effectiveness of the disclosure controls and procedures based
                 on our evaluation as of the Evaluation Date;

          5.     The registrant's other certifying officers and I have
                 disclosed, based on our most recent evaluation, to the
                 registrant's auditors and the audit committee of the
                 registrant's board of directors (or persons performing the
                 equivalent functions):


                                       13


          a)     all significant deficiencies in the design or operation of
                 internal controls which could adversely affect the registrant's
                 ability to record, process, summarize, and report financial
                 data and have identified for the registrant's auditors any
                 material weaknesses in internal controls; and

          b)     any fraud, whether or not material, that involves management or
                 other employees who have a significant role in the registrant's
                 internal controls; and

          6.     The registrant's other certifying officers and I have indicated
                 in this report whether or not there were significant changes in
                 internal controls or in other factors that could significantly
                 affect internal controls subsequent to the date of our most
                 recent evaluation, including any corrective actions with regard
                 to significant deficiencies and material weaknesses.

Date: October 20, 2003


                                       Ronald E. Robison

                                       Principal Executive Officer


                                       14


                                                                   EXHIBIT 10 B2

                  CERTIFICATION OF PRINCIPAL FINANCIAL OFFICER

                                 CERTIFICATIONS
                                 --------------

I, Francis Smith, certify that:

          1. I have reviewed this report on Form N-CSR of Morgan Stanley S&P 500
Index Fund;

          2.     Based on my knowledge, this report does not contain any untrue
                 statement of a material fact or omit to state a material fact
                 necessary to make the statements made, in light of the
                 circumstances under which such statements were made, not
                 misleading with respect to the period covered by this report;

          3.     Based on my knowledge, the financial statements, and other
                 financial information included in this report, fairly present
                 in all material respects the financial condition, results of
                 operations, changes in net assets, and cash flows (if the
                 financial statements are required to include a statement of
                 cash flows) of the registrant as of, and for, the periods
                 presented in this report;

          4.     The registrant's other certifying officers and I are
                 responsible for establishing and maintaining disclosure
                 controls and procedures (as defined in Rule 30a-2(c) under the
                 Investment Company Act of 1940) for the registrant and have:

          (i)    designed such disclosure controls and procedures to ensure that
                 material information relating to the registrant, including its
                 consolidated subsidiaries, is made known to us by others within
                 those entities, particularly during the period in which this
                 report is being prepared;

          (ii)   evaluated the effectiveness of the registrant's disclosure
                 controls and procedures as of a date within 90 days prior to
                 the filing date of this report (the "Evaluation Date"); and

          (iii)  presented in this report our conclusions about the
                 effectiveness of the disclosure controls and procedures based
                 on our evaluation as of the Evaluation Date;

          5.     The registrant's other certifying officers and I have
                 disclosed, based on our most recent evaluation, to the
                 registrant's auditors and the audit committee of the
                 registrant's board of directors (or persons performing the
                 equivalent functions):


                                       15


          a)     all significant deficiencies in the design or operation of
                 internal controls which could adversely affect the registrant's
                 ability to record, process, summarize, and report financial
                 data and have identified for the registrant's auditors any
                 material weaknesses in internal controls; and

          b)     any fraud, whether or not material, that involves management or
                 other employees who have a significant role in the registrant's
                 internal controls; and

          6.     The registrant's other certifying officers and I have indicated
                 in this report whether or not there were significant
                 changes in internal controls or in other factors that could
                 significantly affect internal controls subsequent to the date
                 of our most recent evaluation, including any corrective actions
                 with regard to significant deficiencies and material
                 weaknesses.

Date: October 20, 2003


                                       Francis Smith

                                       Principal Financial Officer


                                       16


                            SECTION 906 CERTIFICATION

                Certification Pursuant to 18 U.S.C. Section 1350,
                             As Adopted Pursuant to
                  Section 906 of the Sarbanes-Oxley Act of 2002

Morgan Stanley S&P 500 Index Fund

     In connection with the Report on Form N-CSR (the "Report") of the
above-named issuer for the period ended August 31, 2003 that is accompanied by
this certification, the undersigned hereby certifies that:

1.   The Report fully complies with the requirements of Section 13(a) or 15(d)
     of the Securities Exchange Act of 1934; and

2.   The information contained in the Report fairly presents, in all material
     respects, the financial condition and results of operations of the Issuer.


Date: October 20, 2003                 Ronald E. Robison
                                       Principal Executive Officer


A signed original of this written statement required by Section 906 has been
provided to Morgan Stanley S&P 500 Index Fund and will be retained by Morgan
Stanley S&P 500 Index Fund and furnished to the Securities and Exchange
Commission or its staff upon request.


                                       17


                            SECTION 906 CERTIFICATION

                Certification Pursuant to 18 U.S.C. Section 1350,
                             As Adopted Pursuant to
                  Section 906 of the Sarbanes-Oxley Act of 2002

Morgan Stanley S&P 500 Index Fund

     In connection with the Report on Form N-CSR (the "Report") of the
above-named issuer for the period ended August 31, 2003 that is accompanied by
this certification, the undersigned hereby certifies that:

1.   The Report fully complies with the requirements of Section 13(a) or 15(d)
     of the Securities Exchange Act of 1934; and

2.   The information contained in the Report fairly presents, in all material
     respects, the financial condition and results of operations of the Issuer.


Date: October 20, 2003                 Francis Smith
                                       Principal Financial Officer


A signed original of this written statement required by Section 906 has been
provided to Morgan Stanley S&P 500 Index Fund and will be retained by Morgan
Stanley S&P 500 Index Fund and furnished to the Securities and Exchange
Commission or its staff upon request.


                                       18