UNITED STATES SECURITIES AND EXCHANGE COMMISSION
WASHINGTON, D.C. 20549
FORM 20-F
(Mark One)
| ¨ | REGISTRATION STATEMENT PURSUANT TO SECTION 12(b) OR 12(g) OF THE SECURITIES EXCHANGE ACT OF 1934 |
OR
| x | ANNUAL REPORT PURSUANT TO SECTION 13 OR 15(d) OF THE SECURITIES EXCHANGE ACT OF 1934 |
For the fiscal year ended December 31, 2013
OR
| ¨ | TRANSITION REPORT PURSUANT TO SECTION 13 OR 15(d) OF THE SECURITIES EXCHANGE ACT OF 1934 |
For the transition period from _____________ to _____________
OR
| ¨ | SHELL COMPANY REPORT PURSUANT TO SECTION 13 OR 15(d) OF THE SECURITIES EXCHANGE ACT OF 1934 |
Date of event requiring this shell company report __________________
Commission File Number: 000-29336
ATNA RESOURCES LTD.
(Exact name of registrant as specified in its charter)
Not applicable
(Translation of registrant’s name into English)
Province of British Columbia (Canada)
(Jurisdiction of incorporation or organization)
14142 Denver West Parkway, Suite 250
Golden, Colorado 80401
United States
(Address of principal executive offices)
Rod Gloss
Vice President and Chief Financial Officer
14142 Denver West Parkway, Suite 250
Golden, Colorado 80401
United States
Telephone: (303) 278-8464
Fax: (303) 279-3772
(Name, Telephone, E-mail and/or Facsimile number and Address of Company Contact Person)
Securities registered or to be registered pursuant to Section 12(b) of the Act:
None
Securities registered or to be registered pursuant to Section 12(g) of the Act:
Common Shares Without Par Value
(Title of Class)
Securities for which there is a reporting obligation pursuant to Section 15(d) of the Act:
None
Indicate the number of outstanding shares of each of the issuer's classes of capital or common stock as of the close of the period covered by the annual report:
| Title of Each Class | Issued and Outstanding as at December 31, 2013 |
| | |
| Common Shares without par value | 189,922,144 |
| Preferred Shares without par value | Nil |
Indicate by check mark if the registrant is a well-known seasoned issuer, as defined in Rule 405 of the Securities Act.
¨ Yes x No
If this report is an annual or transition report, indicate by check mark if the registrant is not required to file reports pursuant to Section 13 or 15(d) of the Securities Exchange Act of 1934.
¨ Yes x No
Indicate by check mark whether the registrant (1) has filed all reports required to be filed by Section 13 or 15(d) of the Securities Exchange Act of 1934 during the preceding 12 months (or for such shorter period that the registrant was required to file such reports), and (2) has been subject to such filing requirements for the past 90 days.
x Yes ¨ No
Indicate by check mark whether the registrant has submitted electronically and posted on its corporate Web site, if any, every Interactive Data File required to be submitted and posted pursuant to Rule 405 of Regulation S-T (§232.405 of this chapter) during the preceding 12 months (or for such shorter period that the registrant was required to submit and post such files).
¨ Yes ¨ No
Indicate by check mark whether the registrant is a large accelerated filer, an accelerated filer or a non-accelerated filer. See definition of “accelerated filer and large accelerated filer” in Rule 12b-2 of the Exchange Act.:
¨ Large accelerated filer¨ Accelerated filerx Non-accelerated filer
Indicate by check mark which basis of accounting the registrant has used to prepare the financial statements included in this filing:
| ¨ U.S. GAAP | x International Financial Reporting Standards as issued by the International Accounting Standards Board | ¨ Other |
If “Other” has been checked in response to the previous question, indicate by check mark which financial statement item the registrant has elected to follow:
¨ Item 17¨ Item 18
If this is an annual report, indicate by check mark whether the registrant is a shell company (as defined in Rule 12b-2 of the Exchange Act):
¨ Yes x No
TABLE OF CONTENTS
| CAUTIONARY INFORMATION ABOUT FORWARD-LOOKING STATEMENTS | | 3 |
| CAUTIONARY NOTE TO U.S. INVESTORS CONCERNING ESTIMATES OF MINERAL RESERVES AND MINERAL RESOURCES | | 5 |
| GLOSSARY OF SELECTED MINING TERMS | | 5 |
| MINERAL RESERVE AND RESOURCE DISCLOSURE | | 7 |
| | | | | |
| PART I | | 8 |
| | ITEM 1. | IDENTITY OF DIRECTORS, SENIOR MANAGEMENT AND ADVISERS | | 8 |
| | ITEM 2. | OFFER STATISTICS AND EXPECTED TIMETABLE | | 8 |
| | ITEM 3. | KEY INFORMATION | | 8 |
| | ITEM 4. | INFORMATION ON THE COMPANY | | 15 |
| | ITEM 4A. | UNRESOLVED STAFF COMMENTS | | 45 |
| | ITEM 5. | OPERATING AND FINANCIAL REVIEW AND PROSPECTS | | 45 |
| | ITEM 6. | DIRECTORS, SENIOR MANAGEMENT AND EMPLOYEES | | 56 |
| | ITEM 7. | MAJOR SHAREHOLDERS AND RELATED PARTY TRANSACTIONS | | 74 |
| | ITEM 8. | FINANCIAL INFORMATION | | 75 |
| | ITEM 9. | THE OFFER AND LISTING | | 76 |
| | ITEM 10. | ADDITIONAL INFORMATION | | 78 |
| | ITEM 11. | QUANTITATIVE AND QUALITATIVE DISCLOSURES ABOUT MARKET RISK | | 88 |
| | ITEM 12. | DESCRIPTION OF SECURITIES OTHER THAN EQUITY SECURITIES | | 91 |
| | | | | |
| PART II | | 92 |
| | ITEM 13. | DEFAULTS, DIVIDEND ARREARAGES AND DELINQUENCIES | | 92 |
| | ITEM 14. | MATERIAL MODIFICATIONS TO THE RIGHTS OF SECURITY HOLDERS AND USE OF PROCEEDS | | 92 |
| | ITEM 15. | CONTROLS AND PROCEDURES | | 92 |
| | ITEM 16. | RESERVED | | 93 |
| | ITEM 16A. | AUDIT COMMITTEE FINANCIAL EXPERT | | 93 |
| | ITEM 16B. | CODE OF ETHICS | | 93 |
| | ITEM 16C. | PRINCIPAL ACCOUNTANT FEES AND SERVICES | | 94 |
| | ITEM 16D. | EXCEPTIONS FROM THE LISTING STANDARDS FOR AUDIT COMMITTEES | | 94 |
| | ITEM 16E. | PURCHASES OF EQUITY SECURITIES BY THE ISSUER AND AFFILIATED PERSONS | | 94 |
| | ITEM 16F. | CHANGE IN REGISTRANT’S CERTIFYING ACCOUNTANT | | 95 |
| | ITEM 16G. | CORPORATE GOVERNANCE | | 95 |
| | ITEM 16H. | MINE SAFETY DISCLOSURE | | 95 |
| | | | | |
| PART III | | 95 |
| | ITEM 17. | FINANCIAL STATEMENTS | | 95 |
| | ITEM 18. | FINANCIAL STATEMENTS | | 95 |
| | ITEM 19. | EXHIBITS | | 95 |
CAUTIONARY INFORMATION ABOUT FORWARD-LOOKING STATEMENTS
This Annual Report and the documents incorporated by reference herein contain “forward-looking statements” within the meaning of applicable securities legislation. These “forward-looking statements” are based on projections, expectations and estimates as of the report date or, in the case of documents incorporated by reference herein, as of the date of such documents. Forward-looking statements are provided for the purpose of providing information about management’s expectations and plans related to the future. All of the forward-looking statements made in this Annual Report are qualified by these cautionary statements.
Forward-looking statements may include, but are not limited to, statements with respect to the future price of gold and silver, the estimation of mineral reserves and resources, the realization of mineral reserve estimates, the timing and amount of estimated future production, anticipated costs of production, estimated capital expenditures, estimated net present values, estimated internal rates of return, estimated development activities, mine development plans, currency fluctuations, requirements for additional capital, government regulation of mining operations, environmental risks or claims, the anticipated use of proceeds from financings, anticipated capital spending and liquidity, the timing of commencement of commercial production, drilling schedules and potential results thereof, granting of permits and approvals, and the timing and potential results of studies and reports. In certain cases, forward-looking statements can be identified by the use of words such as “plans”, “is planned”, “expects” or “does not expect”, “is expected”, “is designed”, “budget” or “budgeted”, “scheduled”, “estimates”, “projects”, “forecasts”, “contemplates”, “continue”, “targets”, “targeted”, “intends”, “anticipates” or “does not anticipate”, or “believes”, or variations of such words and phrases or statements that certain actions, events or results “may”, “could”, “would”, “might” or “will be taken”, “occur” or “be achieved”.
In particular, this Annual Report and other documents incorporated by reference herein contain forward-looking statements pertaining to the following:
| · | Any projections of earnings, revenues, synergies, costs and cost savings, cash flows, liquidity, capital spending, and other financial items; |
| · | Any projections of production, recoveries, stripping ratios, conversions of resources to reserves, operational efficiencies and inefficiencies, and other operating items; |
| · | Any projections that new financing can be obtained upon commercially acceptable terms given market and economic conditions at the time; |
| · | Any statement of the plans, strategies, objectives, and goals of management for future operations, including the Briggs mine production, development of the Pinson-underground, Pinson Mag open-pit, Reward, Cecil-R, and Columbia gold mining projects; |
| · | Any statements regarding future economic conditions or performance; |
| · | Any statements of belief or intent; and |
| · | Any assumptions regarding the foregoing. |
The actual results could differ materially from those anticipated in these forward-looking statements as a result of the risk factors set forth below and in the sections of thE MD&A entitled “Financial Risk Management”, “Critical Accounting Estimates” and “Risks and Uncertainties” and in the Company’s other filings with Canadian Securities Administrators and the US Securities and Exchange Commission (“SEC”):
| · | Fluctuations in gold and other metals prices; |
| · | Risks relating to the Company’s ability to generate material revenues or obtain adequate financing or its planned exploration and development activities; |
| · | Actual results of current exploration activities; |
| · | Conclusions of economic evaluations; |
| · | Changes in project parameters as plans continue to be refined; |
| · | Possible variations in ore reserves, grade or recovery rates; |
| · | Failure of plant, equipment or processes to operate as anticipated; |
| · | Risks related to fluctuations in the currency market; |
| · | Risks related to the business being subject to environmental laws and regulations which may increase costs of doing business and restrict the Company’s operations; |
| · | Delays in obtaining government approvals or financing or in the completion of development or construction activities; |
| · | Risks related to hedging metal production and key operating inputs; |
| · | Risks related to operating hazards; |
| · | Risks related to the exploration, permitting, development and mining of precious metals; |
| · | Risks related to estimation of reserves and resources; |
| · | Risks related to governmental regulation, including environmental regulation; |
| · | Risks related to competition; |
| · | Risks related to joint ventures; |
| · | Uncertainty of capital costs, operating costs, production, metal recoveries and economic returns; |
| · | Risks related to the uncertainty of the title of assets; |
| · | The need to attract and retain qualified management and technical personnel; |
| · | Risks related to reclamation activities on properties; and |
| · | Other risks described in other documents incorporated by reference herein. |
Forward-looking statements provide information about management’s current expectations and plans relating to anticipated future events and are based on the Company’s current beliefs and assumptions regarding, among other things:
| · | Future gold and other metals prices; |
| · | The overall success of the Company’s ability to generate material revenues and to obtain adequate financing for its planned exploration and development activities; |
| · | Actual results of current exploration activities; |
| · | Conclusions of economic evaluations; |
| · | Changes in project parameters as plans continue to be refined; |
| · | Future variations in ore reserves, grade, or recovery rates; |
| · | Failure of plant, equipment or processes to operate as anticipated; |
| · | Realization of benefits from all capital including deferred stripping costs incurred during development and production; |
| · | The estimated fair value of share-based compensation; |
| · | The estimated fair value of financial instruments and nonmonetary transactions; |
| · | Future profitability affecting deferred tax assets and liabilities; |
| · | The probable outcome of contingencies; |
| · | Fluctuations in the currency market; |
| · | The regulatory frame work governing environmental laws and regulations; |
| · | Possible delays in obtaining governmental approvals or financing or in the completion of development or construction activities; |
| · | Hedging metal production and key operating inputs; |
| · | The exploration, permitting, development and mining of precious metals; |
| · | Estimation of reserves and resources; |
| · | Capital costs, operating costs, production, metal recoveries and economic returns; and |
| · | The Company’s ability to attract and retain qualified management and technical personnel. |
Statements relating to mineral reserves and resources are deemed to be forward-looking statements, as they involve the implied assessment, based on certain estimates and assumptions, that the mineral reserves and resources described exist in the quantities predicted or estimated and can be profitably produced in the future. Estimated values of future net revenue do not represent fair market value. There is no certainty that it will be commercially viable to produce any portion of the resources.
Although the Company has attempted to identify important factors that could cause actual actions, events or results to differ materially from those described in forward-looking statements, there may be other factors that cause actions, events or results not to be as anticipated, estimated or intended. There can be no assurance that forward-looking statements will prove to be accurate, as actual results and future events could differ materially from those anticipated in such statements. The Company’s forward-looking statements are based on the beliefs, expectations and opinions of management as of the date the statements are made, and the Company does not assume any obligation to update any forward-looking statements if circumstances or management’s beliefs, expectations or opinions should change, except as required by law. For reasons set forth above, readers should not place undue reliance on forward-looking statements. Forward-looking statements are made as of the report date and other than as required by applicable securities laws, the Company assumes no obligation to update or revise such forward-looking statements to reflect new events or circumstances.
CAUTIONARY NOTE TO U.S. INVESTORS CONCERNING ESTIMATES OF MINERAL RESERVES AND MINERAL RESOURCES
We advise U.S. investors that the definitions of the terms “mineral reserve,” “proven mineral reserve” and “probable mineral reserve” under the Standards on Mineral Resources and Mineral Reserves Definitions and Guidelines adopted by the Canadian Institute of Mining, Metallurgy and Petroleum are different than the definitions adopted by the SEC and applicable to U.S. companies filing reports with the SEC pursuant to SEC Industry Guide 7. It is the view of the SEC’s staff that:
| · | A “final” or “bankable” Feasibility Study is required to meet the requirements to designate reserves under Industry Guide 7. |
| · | A historic three-year average price is to be used in any reserve or cash flow analysis to designate reserves. |
| · | To meet the “legal” part of the reserve definition, the primary environmental analysis or document should have been submitted to governmental authorities. |
Cautionary Note to U.S. Investors – The SEC permits U.S. mining companies, in their filings with the SEC, to disclose only those mineral deposits that a company can economically and legally extract or produce. We use certain terms in this report, such as “measured,” “indicated,” and “inferred mineral resources” which the SEC guidelines generally prohibit U.S. registered companies from including in their filings with the SEC. U.S. investors are urged to consider closely the disclosure in this Annual Report on Form 20-F.
GLOSSARY OF SELECTED MINING TERMS
Cut-off Grade: The minimum grade of mineralized material used to establish reserves and resources.
Doré: Unrefined gold and silver bullion consisting of approximately 90 percent precious metals that will be further refined to almost pure metal.
Feasibility Study: A Feasibility Study is a comprehensive technical and economic study of the selected development option for a mineral project that includes appropriately detailed assessments of realistically assumed mining, processing, metallurgical, economic, marketing, legal, environmental, social and governmental considerations together with any other relevant operational factors and detailed financial analysis, that are necessary to demonstrate at the time of reporting that extraction is reasonably justified (economically mineable). The results of the study may reasonably serve as the basis for a final decision by a proponent or financial institution to proceed with, or finance, the development of the project. The confidence level of the study will be higher than that of a Pre-Feasibility Study.
Grade: The metal content of sampled material, usually expressed in troy ounces per ton or grams per tonne. In this report we consistently use ounces per ton to describe our grades of reserves or mineralized material. (See “Ounces per Ton” or “Grams per Tonne” below).
Grams per Tonne (“g/t”): Metric units used to describe the grade of sampled material, reserve or resource. It represents the portion of a gram estimated to be contained in a metric ton of rock.
Heap Leaching: A method of recovering gold or other precious metals from a heap of ore placed on an impervious pad, whereby a dilute leaching solution is allowed to percolate through the heap, dissolving the precious metal, which is subsequently captured and recovered.
Net Smelter Return (“NSR”) Royalty: A defined percentage of the gross revenue from a mineral extraction operation, less a proportionate share of transportation, insurance, and processing costs.
Ounces per Ton (“oz/ton”): English units used to describe the grade of ore or other material analyzed, reserve or resource. It represents the portion of an ounce estimated to be contained in a ton of rock.
Patented Mining Claim: A patented mining claim is one for which the federal government has passed its title to the claimant, making it private land. A person may mine and remove minerals from a mining claim without a mineral patent. However, a mineral patent gives the owner exclusive title to the locatable minerals. It also gives the owner title to the surface and other resources.
Preliminary Feasibility Study (or Pre-Feasibility Study): A Preliminary Feasibility Study is a comprehensive study of a range of options for the technical and economic viability of a mineral project that has advanced to a stage where a preferred mining method, in the case of underground mining, or the pit configuration, in the case of an open pit, is established and an effective method of mineral processing is determined. It includes a financial analysis based on reasonable assumptions on mining, processing, metallurgical, economic, marketing, legal, environmental, social and governmental considerations and the evaluation of any other relevant factors which are sufficient for a Qualified Person, acting reasonably, to determine if all or part of the Mineral Resource may be classified as a Mineral Reserve.
Reclamation: The process of returning land to another use after mining is completed.
Recoverable: That portion of metal contained in ore that can be extracted by processing.
Run-of-Mine: Mined ore of a size that can be processed without further crushing.
Strip Ratio: The ratio between tonnage of waste and ore in an open-pit mine.
Stope:An area developed in an underground mine for the purpose of extracting ore.
Tons or Tonnes: Tons or short tons contain 2,000 pounds and tonnes or metric tons contain 2,204.6 pounds or 1,000 kilograms.
Unpatented Mining Claim: A parcel of property located on federal lands pursuant to the General Mining Law and the requirements of the state in which the unpatented claim is located, the paramount title of which remains with the federal government. The holder of a valid, unpatented lode-mining claim is granted certain rights including the right to explore and mine such claim under the General Mining Law.
Waste: Barren rock or mineralized material that is too low in grade to be economically processed.
MINERAL RESERVE AND RESOURCE DISCLOSURE
Mineral Reserves and Mineral Resources are defined under National Instrument 43-101 (“NI 43-101”) as follows. NI 43-101 technical reports referenced herein can be viewed on SEDAR atwww.sedar.com and on EDGAR atwww.sec.gov.
Mineral Reserve:A Mineral Reserve is the economically mineable part of a Measured or Indicated Mineral Resource demonstrated by at least a Preliminary Feasibility Study. This Study must include adequate information on mining, processing, metallurgical, economic, and other relevant factors that demonstrate, at the time of reporting, that economic extraction can be justified. A Mineral Reserve includes diluting materials and allowances for losses that may occur when the material is mined.
Proven Mineral Reserve:A ‘Proven Mineral Reserve’ is the economically mineable part of a Measured Mineral Resource demonstrated by at least a Preliminary Feasibility Study. This Study must include adequate information on mining, processing, metallurgical, economic, and other relevant factors that demonstrate, at the time of reporting, that economic extraction is justified.
Probable Mineral Reserve:A ‘Probable Mineral Reserve’ is the economically mineable part of an Indicated and, in some circumstances, a Measured Mineral Resource demonstrated by at least a Preliminary Feasibility Study. This Study must include adequate information on mining, processing, metallurgical, economic, and other relevant factors that demonstrate, at the time of reporting, that economic extraction can be justified.
Mineral Resource:A Mineral Resource is a concentration or occurrence of diamonds, natural solid inorganic material, or natural solid fossilized organic material including base and precious metals, coal, and industrial minerals in or on the Earth’s crust in such form and quantity and of such a grade or quality that it has reasonable prospects for economic extraction. The location, quantity, grade, geological characteristics and continuity of a Mineral Resource are known, estimated or interpreted from specific geological evidence and knowledge.
Measured Mineral Resource:A ‘Measured Mineral Resource’ is that part of a Mineral Resourcefor which quantity, grade or quality, densities, shape, and physical characteristics are so well established that they can be estimated with confidence sufficient to allow the appropriate application of technical and economic parameters, to support production planning and evaluation of the economic viability of the deposit. The estimate is based on detailed and reliable exploration, sampling and testing information gathered through appropriate techniques from locations such as outcrops, trenches, pits, workings and drill holes that are spaced closely enough to confirm both geological and grade continuity.
Indicated Mineral Resource:An ‘Indicated Mineral Resource’ is that part of a Mineral Resourcefor which quantity, grade or quality, densities, shape and physical characteristics can be estimated with a level of confidence sufficient to allow the appropriate application of technical and economic parameters and to support mine planning and evaluation of the economic viability of the deposit. The estimate is based on detailed and reliable exploration and testing information gathered through appropriate techniques from locations such as outcrops, trenches, pits, workings and drill holes that are spaced closely enough for geological and grade continuity to be reasonably assumed.
Inferred Mineral Resource:An ‘Inferred Mineral Resource’ is that part of a Mineral Resourcefor which quantity and grade or quality can be estimated on the basis of geological evidence and limited sampling and reasonably assumed, but not verified, geological and grade continuity. The estimate is based on limited information and sampling gathered through appropriate techniques from locations such as outcrops, trenches, pits, workings and drill holes.
PART I
| ITEM 1. | IDENTITY OF DIRECTORS, SENIOR MANAGEMENT AND ADVISERS |
This Form 20-F is being filed as an annual report under the Exchange Act and, as such, there is no requirement to provide any information under this item.
| ITEM 2. | OFFER STATISTICS AND EXPECTED TIMETABLE |
This Form 20-F is being filed as an annual report under the Exchange Act and, as such, there is no requirement to provide any information under this item.
| A. | Selected Financial Data |
The following tables summarize certain consolidated financial information of the Company. Excerpts from the audited consolidated financial statements for 2009 through 2013 have been prepared in accordance with International Financial Reporting Standards (“IFRS”). The following information should be read in conjunction with the consolidated financial statements and notes thereto, included in Item 18 of this report. Monetary data not labeled herein is stated in United States Dollars (“U.S. Dollars” or “$”). Certain disclosures are reported in Canadian Dollars (“Canadian Dollars” or “C$”). SeeExchange Rates Data in this section.
| Year ended | | 2013 | | | 2012 | | | 2011 | | | 2010 | | | 2009 | |
| Total revenues | | $ | 45,035,100 | | | $ | 59,763,300 | | | $ | 51,755,400 | | | $ | 30,606,900 | | | $ | 8,689,200 | |
| Net (loss) income | | $ | (49,619,600 | ) | | $ | 6,886,000 | | | $ | 15,084,400 | | | $ | (5,891,900 | ) | | $ | (5,779,800 | ) |
| Basic and diluted (loss) income per share | | $ | (0.32 | ) | | $ | 0.05 | | | $ | 0.14 | | | $ | (0.07 | ) | | $ | (0.07 | ) |
| Working capital | | $ | (7,039,800 | ) | | $ | 6,429,000 | | | $ | (4,726,500 | ) | | $ | 11,734,800 | | | $ | 11,365,200 | |
| Total assets | | $ | 112,277,300 | | | $ | 160,184,700 | | | $ | 131,205,300 | | | $ | 83,206,100 | | | $ | 80,037,600 | |
| Total liabilities | | $ | 35,767,300 | | | $ | 42,816,200 | | | $ | 44,413,700 | | | $ | 26,069,500 | | | $ | 25,819,900 | |
| Total shareholders' equity | | $ | 76,510,000 | | | $ | 117,368,500 | | | $ | 86,791,600 | | | $ | 57,136,600 | | | $ | 54,217,700 | |
| Number of shares issued and outstanding | | | 189,922,144 | | | | 144,989,922 | | | | 117,374,643 | | | | 99,002,468 | | | | 83,291,133 | |
Exchange Rate Data
Unless otherwise indicated, all monetary references herein are denominated in U.S. Dollars. The exchange rates used herein were obtained from U. S. Federal Reserve Bank; however, they cannot be guaranteed.
As of December 31, 2013 and March 14, 2014, the noon rate as quoted by Bank of Canada was Canadian Dollar $1.063 and Canadian Dollar $1.109 equals U.S. $1.00, respectively.
The following table sets out the U.S. Dollar to Canadian Dollar high and low exchange rates for each month during the previous six months, expressed as U.S. Dollars per Canadian Dollar.
| | | High for Period | | | Low for Period | |
| February-2014 | | | 1.114 | | | | 1.095 | |
| January-2014 | | | 1.117 | | | | 1.061 | |
| December-2013 | | | 1.069 | | | | 1.057 | |
| November-2013 | | | 1.059 | | | | 1.041 | |
| October-2013 | | | 1.045 | | | | 1.028 | |
| September-2013 | | | 1.053 | | | | 1.023 | |
The following table sets forth the average exchange rates for the past five years, expressed as U.S. Dollars per Canadian Dollar.
| Year | | Average | |
| 2013 | | | 1.029 | |
| 2012 | | | 1.000 | |
| 2011 | | | 0.989 | |
| 2010 | | | 1.030 | |
| 2009 | | | 1.142 | |
| B. | Capitalization and Indebtedness |
This Form 20-F is being filed as an annual report under the Exchange Act and, as such, there is no requirement to provide any information under this item.
| C. | Reasons for the Offer and Use of Proceeds |
This Form 20-F is being filed as an annual report under the Exchange Act and, as such, there is no requirement to provide any information under this item.
The securities of the Company are considered speculative due to the nature of the Company’s business and the present stage of its development. A prospective investor should consider carefully the following factors.
Risk Factors Relating to the Company
The Company was not a Passive Foreign Investment Company, or PFIC, for the year ending December 31, 2013, although we may have been in prior years which could result in adverse U.S. Tax Consequences to U.S. Investors.
Shareholders who are U.S. taxpayers should be aware that Atna is not a passive foreign investment company (“PFIC”) for the current fiscal year, although it may have been a PFIC in prior years and could also be a PFIC in subsequent years. If Atna is a PFIC for any year during a U.S. taxpayer’s holding period, then such U.S. taxpayer generally will be required to treat any so-called “excess distribution” received on its common shares, or any gain realized upon a disposition of common shares, as ordinary income and to pay an interest charge on a portion of such distribution or gain, unless the taxpayer makes a timely and effective qualified electing fund (“QEF”) election or a mark-to-market election with respect to the shares of Atna. In certain circumstances, the sum of the tax and the interest charge may exceed the amount of the excess distribution received, or the amount of proceeds of disposition realized, by the taxpayer. A U.S. taxpayer who makes a QEF election generally must report on a current basis its share of Atna’s net capital gain and ordinary earnings for any year in which we are a PFIC, whether or not we distribute any amounts to our shareholders. A U.S. taxpayer who makes the mark-to-market election, generally, must include as ordinary income in each year, the excess of the fair market value of the common shares over the taxpayer’s tax basis therein. Refer to additional details under “E. Taxation – U.S. Federal Income Tax Consequences” for more information.
Precious and Base Metal Price Fluctuations
The profitability of the Company’s operations is dependent upon the market price of certain precious and base metals. The markets for gold and other metals are affected by numerous factors, many of which are beyond our control. Such factors include the price of the metal in the marketplace, imports of metals from other nations, demand for metals, the availability of adequate refining and milling facilities, and the market price of competitive metals used in the same industrial applications. The market price of metals is volatile and beyond our control. Gold prices are generally influenced by basic supply/demand fundamentals, inflation, alternative investment markets, and the strength or weakness of the U.S. Dollar. Demand for gold as a safe haven against economic turmoil, currency devaluations and other factors in the financial marketplace often has more of an impact on the price of gold than does the annual production of gold. The market dynamics of supply/demand can be heavily influenced by economic policy; e.g., central banks sales/purchases, political unrest, conflicts between nations, and general perceptions about inflation. Fluctuating metal prices may have a significant impact on our results of operations and operating cash flow. Decreasing mineral prices will adversely affect the market values of our properties and may lead to the recording of asset impairments.
Hedging Risks Related to Precious Metal Production and Key Operating Inputs
The Company may from time to time enter into gold hedge contracts to protect against declines in the price of gold or it may also enter into consumable off-take agreements that may protect against the increasing cost of consumables such as diesel fuel. The Company’s goal is to protect the Company’s cash flows against declining gold prices or increasing diesel prices. The Company’s primary risk mitigation for hedge transactions is its policy to limit net hedge levels to 50 percent of its expected gold production or diesel usage. Although a hedging program is designed to protect cash flow against a decline in the price of gold or rise in the price of diesel fuel, it could also limit the Company’s gold realizations over the term of a hedge contract during periods of increasing gold prices or could increase diesel costs during periods of declining diesel prices.
Operating Hazards and Risks
Mining operations generally involve a high degree of risk, which even a combination of experience, knowledge and careful evaluation may not be able to overcome. Hazards such as unusual or unexpected geologic structures and other conditions are involved. Operations in which the Company has a direct or indirect interest will be subject to all of the hazards and risks normally incidental to exploration, development and production of precious and base metals, any of which could result in work stoppages, damage to or destruction of mines and other producing facilities, damage to life and property, environmental damage and possible legal liability for any or all damage. The Company maintains liability insurance in an amount that it considers adequate for its operations; however, the Company may become subject to liabilities due to events of pollution, slope failure, cave-in, flood or other hazards against which it cannot insure or against which it may elect not to insure. The payment of such liabilities may have a material adverse effect on the Company’s financial position.
Exploration and Development
Mineral exploration and development involves a high degree of risk and few properties explored ultimately are developed into producing mines. There is no assurance that Atna’s mineral exploration and development activities will result in any discovery or development of bodies of commercial ore. The long-term profitability of Atna’s operations will be in part directly related to the cost and success of its exploration programs, which may be affected by a number of factors.
Substantial expenditures are required to establish reserves through drilling, to develop metallurgical processes to extract metal from ore and to develop the mining and processing facilities and infrastructure at any site chosen for mining. Although substantial benefits may be derived from the discovery of a major mineralized deposit, no assurance can be given that minerals will be discovered in sufficient quantities to justify commercial operations or that the funds required for development can be obtained on a timely basis.
The marketability of any minerals acquired or discovered may be affected by numerous factors which are beyond the Company’s control and which cannot be accurately predicted, such as market fluctuations, the proximity and capacity of milling facilities, mineral markets and processing equipment, and other factors such as government regulations, including regulations relating to royalties, allowable production, importing and exporting minerals and environmental protection.
Calculation of Reserves and Resources and Precious and Base Metal Recovery
There is a degree of uncertainty attributable to the calculation of reserves and resources and corresponding grades being mined or dedicated to future production. Until reserves or resources are actually mined and processed, the quantity of mineralization and grades must be considered as estimates only. In addition, the quantity of reserves and resources may vary depending on metal prices, operating costs, and design parameters. Any material change in quantity of reserves, resources, grade or stripping ratio may affect the economic viability of the Company’s properties. In addition, there can be no assurance that precious or other metal recoveries as determined in small-scale laboratory tests will be duplicated in larger scale tests under on-site conditions or during production.
Government Regulation
Operations, development and exploration on the Company’s properties are affected to varying degrees by government regulations and laws relating to matters such as, but not limited to, environmental protection; health, safety and labour; mining law reform; homeland security; restrictions on production; price controls; tax increases; maintenance of claims; tenure; and expropriation of property. There is no assurance that future changes in such regulation, if any, will not adversely affect the Company’s operations.
Environmental Factors
All phases of the Company’s operations are subject to environmental regulation and permitting in the various jurisdictions in which the Company operates. Environmental legislation is evolving in a manner that will require stricter standards and enforcement, increased fines and penalties for non-compliance, more stringent environmental assessments of proposed projects and a heightened degree of responsibility for companies and their officers, directors and employees. There is no assurance that future changes in environmental regulation, if any, will not adversely affect the Company’s operations. Environmental hazards may exist on the Company’s properties unknown to the Company at present, which have been caused by previous or existing owners or operators of the properties.
Competition and Agreements with Other Parties
The mining industry is intensely competitive at all phases, and the Company competes with many companies possessing greater financial and technical resources than those of the Company. Competition in the mining business could adversely affect the Company’s ability to attract qualified mining personnel, competitive financing, or acquire suitable producing properties or prospects for mineral exploration in the future.
The Company may, in the future, be unable to meet its share of costs incurred under agreements to which it is a party and the Company may have its interest in the properties subject to such agreements reduced as a result. Furthermore, if other parties to such agreements do not meet their share of such costs, the Company may be unable to finance the cost required to complete recommended programs.
Ongoing Financing
The business of mineral exploration and extraction involves a high degree of risk with very few properties that are explored ultimately achieving commercial production. As a mining company in the exploration, development and mining stage, the ability of the Company to conduct exploration, development and mining operations is affected principally by its ability to raise adequate amounts of capital through equity financings, debt financings, joint ventures or joint operations of projects, asset sales and other means. In turn, the Company’s ability to obtain funding depends in part upon the market’s perception of its management and properties, the price of gold, the marketability of its securities, the attractiveness of its assets for sale and its creditworthiness with potential lenders. Servicing existing debt, previously incurred to finance projects, may hamper the Company’s ability to invest in new projects and obtain new financing. There is no assurance that the Company will be successful in obtaining required financing.
Cash Flow
Briggs is the Company’s sole operating unit and source of operating cash flow. Any positive cash flow developed from Briggs may be used to fund some or all of the Company’s corporate overhead, exploration and project development costs. The Company has limited financial resources and there is no assurance that additional funding will be available to allow the Company to accomplish its stated goals or to fulfil its obligations with regard to existing debt, development, exploration, and joint venture properties. Failure to obtain additional financing could result in delay or indefinite postponement of further development and/or exploration and the possible, partial or total loss of the Company’s interest in certain properties.
Conflict of Interest
Certain directors and officers of the Company are officers and/or directors of, or are associated with other natural resource companies, that acquire interest in mineral properties. Such associations may give rise to conflicts of interest from time to time. Directors are required by law, however, to act honestly and in good faith with a view to the best interests of the Company and its shareholders and to disclose any personal interest which they may have in any material transactions which are proposed to be entered into with the Company and to abstain from voting as a director for the approval of any such transaction.
Title to Assets
Although the Company has or will receive title opinions for any properties in which it has a material interest in Canada and the U.S., there is no guarantee that title to such properties will not be challenged or impugned. The Company has not conducted surveys of all of the claims in which its holds direct or indirect interests and therefore, the precise area and location of such claims may be in doubt. The majority of the Company’s properties are located in the U.S. where mineral title is held through either patented or unpatented mining claims, fee mineral rights, and as leased mineral interests. Members of the U.S. Congress have repeatedly introduced bills which would supplant or alter the provisions of the Mining Law of 1872. If enacted, such legislation could change the cost of holding unpatented mining claims and could impact our ability to develop mineral resources on unpatented mining claims. Such bills have proposed, among other things, to either eliminate or greatly limit the right to a mineral patent and to impose a federal royalty on production from unpatented mining claims. Although it is impossible to predict at this point what any legislated royalties might be, enactment could adversely affect the potential for development of such mining claims and the economics of existing operating mines on federal unpatented mining claims. Passage of such legislation could adversely affect the Company’s financial performance.
The Company’s Canadian mineral claims may be subject to prior unregistered agreements or transfers or native land claims and title may be affected by undetected defects. Native land claim settlements are more advanced in the Yukon Territory than they are in British Columbia, and to the best of the Company’s knowledge, none of the Company’s properties in the Yukon Territory cover areas where the Federal Crown proposes to transfer mineral rights to the First Nations. However, there is no guarantee that this will not change before settlements are finalized.
Dividends
The Company has not, since the date of its incorporation, declared or paid any dividends on its Common Shares and does not currently intend to pay dividends. For the foreseeable future, earnings, if any, are expected to be retained to finance further growth and development of the business of the Company.
Resale of Shares
The continued operation of the Company will be dependent upon its ability to generate operating revenues and to procure additional financing. There can be no assurance that any such revenues can be generated or that other financing can be obtained. If the Company is unable to generate such revenues or obtain such additional financing, any investment in the Company may be lost. In such event, the probability of resale of the shares purchased would be diminished.
Joint Arrangements
Certain of the properties in which the Company has an interest are operated through joint operations and joint ventures with other mining companies. The existence or occurrence of one or more of the following circumstances and events could have a material adverse impact on the viability of the Company’s interests held through joint arrangements and on the Company’s future cash flows, earnings, results of operations and financial condition: (i) disagreements with joint arrangement partners on how to develop and operate mines efficiently; (ii) inability of joint arrangement partners to meet their obligations to the joint arrangement or third parties; (iii) litigation between joint arrangement partners regarding joint arrangement matters; (iv) the sale of a joint arrangement partner’s interest to a third party; and (v) limited legal rights to influence the direction of project development where Atna is not the operator of the project.
Potential Litigation
From time to time, during the ordinary course of business, the Company and its subsidiaries and affiliates may be threatened with, or may be named as a defendant in various actions, disputes, and legal proceedings, including claims of breach of contract, lost profits or other consequential damage claims. A significant judgment against the Company or any of its subsidiaries or affiliates or a failure to settle any dispute on terms satisfactory to the Company could have a material adverse effect on the Company’s ability to continue operations.
Risk Factors Specific to the Company
Gold Recovery at Briggs
CR Briggs Corporation, a wholly-owned subsidiary of the Company, operates Briggs. Briggs has been producing gold since the second quarter of 2009 and produced approximately 32,800 ounces of gold doré during 2013. Briggs uses a conventional gold heap-leach recovery process. This process involves the application of cyanide solutions by drip irrigation to crushed ore stacked on an impervious pad. As the solution percolates through the heap, gold is dissolved from the ore into solution. This solution is collected and processed with activated carbon that collects the gold from the solution. The gold laden carbon is further processed through pressure stripping the carbon into a more highly concentrated gold bearing solution. The gold bearing solution is further concentrated by an electrowinning circuit, which collects the gold onto electric cathodes which are then melted into gold doré bars. Factors impacting gold recovery include variation in ore grade, crushed ore size, rock type, solution concentration, lime addition, temperature, rainfall, irrigation time, pressure stripping, refining efficiencies, leach pad dynamics and other associated factors.
Production Costs and Risk Factors at Briggs
The cost of gold produced may be impacted by numerous variables including ore grade and gold recovery, stripping ratio, fuel and consumable costs, labor and benefit costs, equipment operating and maintenance costs, and numerous other factors. Production risk factors may include labor strife, slope failure, poor gold recovery, unavailability of skilled labor and management, availability of mining equipment, lack of machine parts, availability of consumables used in mining, mine plan implementation, weather, governmental regulations and other operating factors.
California Legislation and Regulations May Cause the Development of Projects Adjacent To Briggs to Become Uneconomic.
On April 10, 2003, the California State Mining and Geology Board enacted a Backfill Regulation (the “Backfill Regulation”) that requires that all future metal mines, with certain exceptions, be backfilled to the approximate original contour of the landscape subject to certain limitations. Any new open pit developments on our properties outside the existing Briggs plan of operations area may be required to comply with the Backfill Regulation.
Atna Has Significant Obligations At Its Mines, Which May Adversely Impact Liquidity.
Briggs operates under permits granted by various agencies including the U.S. Department of the Interior Bureau of Land Management (the “BLM”), Inyo County, California, the California Department of Conservation, and the Lahontan Regional Water Quality Control Board (“Lahontan”). The Company has posted reclamation bonds with these agencies in the amount of $4.4 million, supported by sureties with the exception of a $30,000 cash bond.
The Company has posted reclamation bonds for Pinson with the BLM and the State of Nevada in the amount of $0.8 million, which is supported by a surety. These agencies will require the posting of additional bonds of $0.9 million in 2014.
The Company has posted an additional $0.9 million of reclamation bonds with the State of Nevada for Reward, which is supported by a surety.
Please refer to the discussion below of the “Kendall, Montana” property and its reclamation requirements. In addition to $2.3 million of cash deposits held as reclamation bonds, the Company has posted an additional $0.2 million of reclamation bonds, supported by a surety, with the Montana Department of Environmental Quality (“MDEQ”).
All surety bonds are subject to annual review and adjustment. Surety bonds presently totaling another $0.2 million are outstanding for Clover, Columbia, and other properties.
Development Risks at Pinson and Reward
Mine development is subject to numerous risks. These risks are typically quantified through technical and economic estimates generated in Pre-Feasibility and Feasibility Studies. There is no guarantee that these estimates will be correct or realized once the mine is developed.
The Company commenced development of the Pinson-underground mine in January 2012. In June of 2013, Pinson-underground mine development activities were halted and the mine was placed on care and maintenance pending a combination of engineering activities, improvements in market conditions, and additional financing. Based on experience gained during development activities at Pinson-underground, additional engineering studies, mine design, costing studies, and economic analyses are deemed appropriate. This work-program will be ongoing during 2014.
A Pre-Feasibility Study for the Mag open-pit mine at Pinson is expected to be completed in 2014. This study will be utilized as the basis for the submission of a Mine-Plan-of-Operations to State regulatory authorities to commence the permitting process on this project.
In January 2011, the Company commenced Phase 1 infrastructure development work on Reward. The majority of this construction, which included construction of wildlife exclusion fencing, drilling and completing the production water well, and extending power lines from local grid power sources to the mine site, has been completed. Development of Reward including the construction of leach pad facilities, purchase or lease of a semi-portable crushing plant, the installation of offices, lab and shop facilities and pre-stripping of mine waste will commence when adequate financing becomes available, remaining engineering activities have been completed, and market conditions are supportive.
Montana Regulatory Authorities May Impose Additional Reclamation Requirements On Our Closure Of The Kendall Mining Property
Atna’s wholly-owned subsidiary, CR Kendall Corporation (“CRK”), is reclaiming and closing the Kendall mining property (“Kendall”) located near Lewistown, Montana. In April 2012, Kendall entered into an agreement with the Montana Department of Environmental Quality (“MDEQ”), whereby Atna agreed to provide financial support to complete a final EIS closure study. As part of this agreement, Kendall submitted on July 25, 2012 an application to the MDEQ providing a final closure and reclamation plan for the Kendall mine site. The MDEQ has performed a completeness review of this plan, and Kendall has prepared responses to this review. The EIS will be managed by the MDEQ in consultation with Kendall. Any costs in excess of the EIS project budget will be shared equally between CRK and the MDEQ. No work has commenced on this study.In 2001, CRK deposited with the MDEQ approximately $1.9 million in a fund to accomplish required reclamation work. This fund was never utilized and with accumulated interest now totals approximately $2.3 million. Once a final Record of Decision on the final closure plan has been issued by the MDEQ, as part of the Agreement, CRK will create a trust fund to provide for any future operation, maintenance and replacement of water treatment and closure facilities. Funds remaining in the current funds on deposit with the MDEQ will be utilized in funding this trust.
| ITEM 4. | INFORMATION ON THE COMPANY |
| A. | History and Development of the Company |
Atna Resources Ltd. was incorporated under theCompany Act of the Province of British Columbia, Canada, on May 30, 1984, by registration of its Memorandum and Articles under its present name. The Company was extra-territorially registered in the Yukon Territory on April 13, 1995. The Company’s business is to explore, acquire, develop, and mine precious metals, uranium and other mineral properties. The Company’s properties are primarily located in the United States and Canada. The Company is a reporting issuer in British Columbia, Alberta, Ontario and Nova Scotia and a Foreign Private Issuer in the U.S., based on the residency of stockholders as of June 30, 2013. The Company’s common stock is listed on the Toronto Stock Exchange (the “TSX”) under the symbol “ATN” in Canada and on the over-the-counter Bulletin Board (the “OTCQB”) under the symbol “ATNAF” in the U.S.
Atna merged with Canyon Resources Corporation (“Canyon”) on March 18, 2008 (the “Canyon Merger”), at which time Canyon became a wholly-owned subsidiary of the Company. Canyon was incorporated under the General Corporation Laws of the State of Delaware in 1979.
Atna’s headquarters are located at 14142 Denver West Parkway, Suite 250, Golden, Colorado, USA, 80401. The toll free telephone number for the Atna headquarters is 877-692-8182. Bull, Housser & Tupper LLP is the Company’s Canadian legal counsel and registered agent and is located at Suite 900, 900 Howe Street, Vancouver, BC, Canada V6Z 2M4.
The Company’s expenditures have included those primarily for general corporate purposes, capital and development, servicing debt, and the acquisition of a 70 percent interest in Pinson in 2011. General corporate purposes primarily include: profit or loss on sales from mining operations, exploration expense, property maintenance expense, expenditures to build inventories and working capital, spending on asset retirement obligations, and net interest expense. Virtually all of the Company’s investments in the last three years have been in the western U.S.
A summary of the Company’s significant cash flows and expenditures is set forth below, as well as a summary of amounts expended on exploration and property maintenance.
| Net Uses of Cash | | 2013 | | | 2012 | | | 2011 | | | Total | |
| Purchases and development of property and equipment | | $ | 26,410,800 | | | $ | 21,705,700 | | | $ | 9,929,500 | | | | 58,046,000 | |
| Increases in restricted cash / surety deposits | | | N/A | | | | N/A | | | | 686,700 | | | | 686,700 | |
| Pinson purchase price | | | N/A | | | | N/A | | | | 15,000,000 | | | | 15,000,000 | |
| Capitalized loan interest - Pinson | | | 1,185,600 | | | | 2,161,400 | | | | 700,100 | | | | 4,047,100 | |
| Additions of stripping activity assets | | | 3,187,500 | | | | 540,500 | | | | 4,033,900 | | | | 7,761,900 | |
| Repayments of Debt | | | 9,559,500 | | | | 5,573,900 | | | | 5,989,400 | | | | 21,122,800 | |
| Effect of exchange rate changes | | | 167,700 | | | | 6,500 | | | | 23,000 | | | | 197,200 | |
| Total net uses of cash | | $ | 40,511,100 | | | $ | 29,988,000 | | | $ | 36,362,600 | | | | 106,861,700 | |
| | | | | | | | | | | | | | | | | |
| Exploration expense | | $ | 703,900 | | | $ | 1,733,300 | | | $ | 634,900 | | | | 3,072,100 | |
| Property maintenance expense | | $ | 1,132,200 | | | $ | - | | | $ | - | | | | 1,132,200 | |
The Company’s expenditures have been financed primarily by operations, debt financings equity financings, and proceeds from the sale of investments and assets as follows.
| Net Sources of Cash | | 2013 | | | 2012 | | | 2011 | | | Total | |
| Net contribution by Operations | | $ | 8,307,100 | | | $ | 13,590,500 | | | $ | 15,498,700 | | | $ | 37,396,300 | |
| Preproduction gold sales | | | 6,532,400 | | | | 1,353,100 | | | | - | | | $ | 7,885,500 | |
| Proceeds from sale of investments | | | 42,100 | | | | 833,600 | | | | 465,600 | | | $ | 1,341,300 | |
| Proceeds from asset sales | | | 736,600 | | | | 135,800 | | | | 471,500 | | | $ | 1,343,900 | |
| Proceeds from insurance settlement | | | 368,800 | | | | 435,800 | | | | - | | | $ | 804,600 | |
| Decrease in restricted-cash / surety-deposits | | | 645,000 | | | | 391,000 | | | | N/A | | | $ | 1,036,000 | |
| Exercise of stock options | | | 31,400 | | | | 337,400 | | | | 74,900 | | | $ | 443,700 | |
| Exercise of warrants | | | - | | | | 5,960,100 | | | | 122,900 | | | $ | 6,083,000 | |
| Net Proceeds from equity financings | | | 5,294,700 | | | | 16,330,500 | | | | - | | | $ | 21,625,200 | |
| Net Proceeds from debt financings | | | - | | | | - | | | | 20,098,900 | | | $ | 20,098,900 | |
| Total net sources | | $ | 21,958,100 | | | $ | 39,367,800 | | | $ | 36,732,500 | | | $ | 98,058,400 | |
Atna expects that cash requirements over the next 12 months can be met through a combination of a debt refinancing that occurred in January 2014; cash flow from the Briggs operations; equipment financing; asset sales; and existing cash. If required, supplemental financing may be generated from the issuance of debt, convertible bonds, or equity; new lines of credit; asset sales; or combinations thereof. As of December 31, 2013, the Company had a net working capital (current assets less current liabilities) deficit of $7.0 million; however $22.0 million of working capital was subsequently drawn in January of 2014 through a long-term note obligation to refinance current obligations. Current assets as of December 31, 2013 included recoverable, gold inventories of approximately 18,100 ounces at Briggs.
As a result of the debt refinancing in January of 2014, whereby payment of $22.0 million of obligations was deferred until January of 2016, the principal use of funds anticipated within the next 12 months is the accumulation of cash to fund repayment of this debt in two years and to fund the future development of several existing properties. The 2009 Gold Bond obligation was repaid in full in 2013. The debt with Sprott Resource Lending Partnership (“Sprott”) was pre-paid in January 2014 via the referenced refinancing. Development of several existing properties is on hold pending additional engineering, improvements in the gold market, and the availability of additional financing.
The Company is involved in all phases of the mining business including exploration, preparation of Pre-Feasibility and Feasibility studies, permitting, construction and development, operation, and final closure of mining properties. Atna’s ongoing exploration and development efforts are focused primarily on precious metals in the western United States. The Company conducts a portion of its mineral exploration and development activities through joint arrangements with other companies.
Atna’s business model is principally one of adding value through the development and operation of precious-metal mines in the United States. The Company seeks to produce positive cash flow principally from the mining and production of gold and to maximize the return on cash invested. The Company believes that unlocking the value of its portfolio of gold properties, either through direct development and production or through the sale of assets, to which value has been added, provides the greatest opportunity to add value for its shareholders.
The Company’s primary focus for 2014 is to increase productivity and reduce costs at the Briggs Mine with the goal of reaching targeted production rates of 40,000 to 45,000 gold ounces in 2014. Key development activities planned for 2014 include completion of a Pre-Feasibility Study for the Mag open pit mine at Pinson, modifying the underground mine plan at Pinson based on experience gained in 2013, and completing detailed engineering for Reward to make that project ready for construction. The Company believes these activities will provide a long term pipeline of development opportunities. Additionally, the Company will engage in reserve-expansion-studies at Briggs to endeavor to extend mine life, inclusive of pit-expansion through cost reductions and through exploration of the potential of underground mining.
Production at Briggs during 2013 included the mining of 2.1 million tons of gold ore containing 41,000 ounces of gold at a strip ratio of 4.4 tons of waste per ton of ore to produce 32,800 ounces of gold in doré. Approximately 31,700 ounces of gold were sold by Briggs at an average gold price of $1,412 per ounce. Estimated mined recoverable gold inventory at year-end was 18,100 contained ounces in all stages of processing.
The Company’s financial results are not significantly impacted by seasonality. Quarterly expenses and income vary depending on the tons of ore mined and processed; ore grades; stripping ratios; labor, diesel, chemical, tire, and maintenance costs; realized and unrealized gains and losses on derivatives; gains or losses on the sale of investments and disposals of properties; and other factors. Significant operating costs include: labor and benefits, fuel, maintenance and supplies, chemicals, explosives, and outside services. Competition for experienced mining staff continues to be an issue and has been a factor in increasing the costs of doing business. Fuel cost is a significant cost factor at Briggs. In 2013 and 2012, diesel fuel represented approximately 22 percent and 21 percent of “Cost of sales, excluding depreciation”, respectively. The prices of consumable materials used in the production and processing of gold ores stabilized in 2013 after rapid price increases over the prior three years.
Atna’s 2008 sale of its royalty portfolio provided approximately $20 million of net proceeds, which was sufficient to re-start and operate the Briggs mine without additional financing until October 2009 when Atna closed C$1.5 million in convertible debentures. In December 2009, the Company closed the Gold Bond Financing of $14.5 million using the funds for general corporate purposes and the continued development of Briggs. These 2009 Gold Bonds were repaid in full, as scheduled, in December 2013. In December 2010, the Company closed a $9.2 million bought-deal equity offering. Briggs began operations in 2009 and has provided net positive operating cash flows since the fourth quarter of 2010.
In September 2011, the Company closed a C$20 million debt facility to fund the acquisition of the remaining 70 percent interest in the Pinson mine as further described under “D. Property, Plant and Equipment – Production Property – Pinson Mine Property, Nevada” and to provide initial development capital for that project. The term of this debt facility (“Sprott Loan”) was extended in February 2012, C$2.5 million was repaid in February 2013, and in March 2013 and October 2013, the term of the remaining C$17.5 million was amended to be payable at later dates in 2014. In January of 2014, the Sprott Loan was refinanced and rolled into a $22 million 2-year term-loan with Waterton Precious Metals Fund II Cayman, L.P. (“Waterton Loan”) (Also see descriptions of the Waterton Loan in “Item 5, B. Liquidity and Capital Resources, Debt” and “Item 10, C. Material Contracts”.). The exercise of options and warrants during 2012 resulted in net proceeds to the Company of $6.3 million. In September 2012, the Company closed a $17.25 million stock offering, netting $16.3 million in proceeds, principally used for development of Pinson-underground. In September 2013, the Company closed a C$5.8 million bought-deal private placement of equity netting $5.3 million in proceeds, principally used for strengthening working capital, paying for Pinson-underground development, and general corporate purposes.
When conditions permit, the Company’s business model also calls for the acquisition of mineral prospects under what are judged to be favorable terms. Our principal acquisition objective is to acquire mining prospects in a later stage of exploration that provide a reasonable return on capital upon completion of exploration activities and development. These opportunities may include properties that were closed due to lack of capital. The Company continually reviews acquisition opportunities that could provide potential long term value through further investment. The Company targets acquisitions that have the potential to provide positive cash flow over a significant operating reserve life and annually produce over 100,000 ounces of gold. The target property would need to be located in a setting where positive community relations may exist, where development of that property would not create long term environmental issues, and where there is a reasonable chance of obtaining the required permits.
Regulatory agencies, both state, county, and federal, having authority over the Company’s exploration, development and mining are numerous and include, but are not limited to, Mine Safety and Health Administration (“MSHA”), U.S. Department of Occupational Safety and Health (“OSHA”) Department of the Interior, Bureau of Land Management (“BLM”), U.S. Forest Service (“USFS”) U.S. Department of Alcohol Tobacco and Firearms (“BATF”), U.S. Department of Homeland Security, U.S. Environmental Protection Agency (“EPA”), U.S. Corp of Engineers on the Federal level. On the State level the Company is subject to regulation by the California Department of Occupational Safety and Health (“CAL-OSHA”), California Air Resources Board (“CARB”), Great Basin Unified Air Pollution Control District, California Regional Water Quality Control Board, California Department of Fish and Game, California Environmental Protection Agency (“CEPA”), Nevada Division of Environmental Protection (“NDEP”) and the Montana Department of Environmental Protection ("MDEP").
Numerous factors affect the marketing of metals, many of which are beyond our control. Products are dictated by the ore reserves located, developed, and mined. Metals are widely traded on international markets, so the sale of products does not require significant marketing except to the extent milling and refining capacities become a limitation. Metal prices are determined by volatile international market factors beyond the Company’s control. Such factors include marketplace speculation as to gold’s value as a safe haven, basic supply/demand fundamentals, inflation, conditions in alternative investment markets, the strength or weakness of the U.S. Dollar, governmental economic policies, central banks’ sales and purchases, political unrest, and other factors noted under Item 3. “D. Risk Factors”. Fluctuating metal prices may have a significant impact on our results of operations and operating cash flow. Decreasing mineral prices will adversely affect the market values of our properties and may lead to the recording of asset impairments.
The decision to put a mine into production and the commitment of the funds necessary for that purpose must be made long before the first revenues from production will be received. Over the last five years, between 2009 and 2013, the average annual London PM Fix price per ounce of gold steadily increased from $810 in January 2009 to $1,895 in September 2011, varied between $1,531 in December 2011 and $1,792 in October 2012, and steadily declined from that $1,792 price in October 2012 to bounce off bottoms of $1,192 in June 2013 and $1,195 in December 2013. The economics of a gold mine change over time due to gold price fluctuations during the project’s life. Although it is possible in certain circumstances to protect against price fluctuations by hedging, at a cost, the volatility of mineral prices represents a substantial risk to the realization of adequate returns.
Exploration, development, and production programs conducted in the U.S. are subject to local, state, and federal regulations regarding environmental protection. A significant amount of the mining and exploration activities are conducted on public lands. The BLM regulations cover mining operations carried out on most public lands. Exploration for or the production of minerals are subject to existing laws and regulations relating to exploration procedures, safety precautions, employee health and safety, air quality standards, pollution of water sources, waste materials, odor, noise, dust and other environmental protection requirements adopted by federal, state and local governmental authorities. As a result, environmental assessment or environmental impact studies are generally required before any proposed exploration work or production activities can be commenced. The requirements imposed by such authorities may be costly, time consuming, and may delay or restrict the conduct of exploration, development, and mining operations. Future legislation and regulations designed to protect the environment, as well as future interpretations of existing laws and regulations, may require substantial increases in equipment and operating costs and delays, interruptions, or a termination of operations. We cannot accurately predict or estimate the impact of any such future laws or regulations, or future interpretations of existing laws and regulations, on our operations.
The U.S. has an extensive framework of environmental legislation that undergoes constant revision. We participate in the legislative process through independent contact with legislators and through trade organizations to assist legislative bodies in making informed decisions.
Historic mining activities have occurred on certain of the Company’s properties. In the event that such historic activities have resulted in releases or threatened releases of regulated substances into the environment, there exists the potential for liability under federal or state remediation statutes. Except as discussed in the Company’s periodic public reports, the Company is not aware of any pending claims under these statutes at this time, and cannot predict whether any such claims will be asserted in the future.
Environmental regulations add to the cost and time needed to bring new mines into production and add to operating and closure costs for mines already in operation. As mines are placed into production, the costs associated with regulatory compliance can be expected to increase. Such costs are a normal cost of doing business in the mining industry, and may require significant capital and operating expenditures in the future. The Company believes that it is currently in material compliance with all applicable environmental regulations and there are no material enforcement procedures currently ongoing.
| C. | Organizational Structure |
The Company owns all of the issued and outstanding shares of the common stock of Canyon. The organizational chart below reflects the Company’s legal ownership of its significant subsidiaries and ownership interests in various gold properties as of the date of this Annual Report on Form 20-F. Properties are routinely acquired, sold, subjected to a joint-venture, or abandoned in the ordinary course of business.

| D. | Property, Plant and Equipment |
Summary of Mineral Reserves and Resources
The mineral reserve and resource figures below are estimates, subject to forward-looking-statement limitations. The reader is urged to review the sections of this Annual Report entitled “Cautionary Information About Forward Looking Statements” and “Risk Factors”. All reserve and resource figures are considered current as indicated in the footnotes to the tables. The scientific and technical information about the Company’s mineral properties contained in this Report has been prepared under the supervision of, reviewed by and approved by William Stanley, a Registered Member of the Society for Mining, Metallurgy and Exploration, a Licensed Geologist, the Company's Vice President Exploration, a “qualified person” as that term is defined in NI 43-101.
The mineral resources reported below, other than those declared as proven and probable mineral reserves, have no demonstrated economic viability at this time. The quantity and grade of reported Inferred Mineral Resources in these estimations are based on limited information and should be considered conceptual in nature. It is uncertain if further exploration will result in discovery of a Measured or Indicated Mineral Resource within those areas classified as Inferred Resources.
Underground reserves at Pinson were disclosed in May 2012 after completion of an NI 43-101 Technical Report and Pre-Feasibility Study on the Pinson property titled “NI43-101 Technical Report Pinson Project Humbolt, County Nevada” dated May 30, 2012 with an effective date May 18, 2012 (filed on SEDAR in May2012) (the “Pinson Technical Report”), endorsed by William J. Crowl, R.G., MMSA SME-RM and Donald E. Hulse, P.E. of Gustavson Associates, LLC. The Company is currently reviewing the mine planning, costing, and engineering of the underground mine and believes additional engineering studies, mine design, costing, and economic analysis are appropriate.
Gold Mineral Reserves - Proven and Probable(1, 2, 3)
| Category | | Tons (x1,000) | | | Au (oz/ton) | | | Contained Ounces | |
| Briggs (1)- 100% Atna | | | | | | | | | | | | |
| Proven | | | 3,380 | | | | 0.020 | | | | 69,013 | |
| Probable | | | 3,582 | | | | 0.021 | | | | 75,264 | |
| | | | | | | | | | | | | |
| Briggs reserves | | | 6,962 | | | | 0.021 | | | | 144,277 | |
| | | | | | | | | | | | | |
| Reward(2) - 100% Atna | | | | | | | | | | | | |
| Proven | | | 3,293 | | | | 0.025 | | | | 83,049 | |
| Probable | | | 7,438 | | | | 0.022 | | | | 166,466 | |
| | | | | | | | | | | | | |
| Reward reserves | | | 10,731 | | | | 0.023 | | | | 249,516 | |
| | | | | | | | | | | | | |
| Pinson Underground(3) - 100% Atna | | | | | | | | | | | | |
| Proven | | | 989 | | | | 0.362 | | | | 358,176 | |
| Probable | | | 736 | | | | 0.373 | | | | 274,453 | |
| | | | | | | | | | | | | |
| Pinson Underground reserves | | | 1,724 | | | | 0.367 | | | | 632,629 | |
| | | | | | | | | | | | | |
| Total reserves | | | 19,417 | | | | 0.053 | | | | 1,026,422 | |
| (1) | Briggs mineral reserve summary is based on a 0.0069 oz/ton gold incremental leach cut-off grade calculated using $1,300 per ounce gold supported by the report titled “2012 NI 43-101 Technical Report on the Briggs Mine, Inyo County, California” dated May 29, 2012 with an effective date of March 26, 2012 (the “Briggs Report”) prepared by Alan C. Noble, P.E. of Ore Reserves Engineering, Michael J. Read, SME-RM of Chlumsky, Armbrust & Meyer LLC, William R. Stanley, SME-RM, V.P. Exploration of the Company, and Douglas E. Stewart, P.E., former V.P. and COO of the Company. Messrs. Noble and Read are independent qualified persons in accordance with NI 43-101 and Messrs. Stanley and Stewart are non-independent qualified persons in accordance with NI 43-101. The Briggs Report was filed on SEDAR on May 22, 2012. The mineral reserve has been updated and reconciled by Mr. Read for mine production in 2013 and is current as of December 31, 2013. |
| (2) | Reward mineral reserve is current as of December 31, 2013, using a >$0.01 net incremental value and $1,300 per ounce gold price, and is supported by the Reward Report (as defined below) filed on SEDAR on July 9, 2012. The reserves have been updated using the 12/31/2013 block model by Michael J. Read, SME-RM of Chlumsky, Armbrust & Meyer LLC. |
| (3) | The Pinson Underground Reserve is supported by the Pinson Technical Report filed on SEDAR on May 30, 2012 and has been reconciled for underground development and test mining completed through 12/31/2013. |
Gold Mineral Resources - Measured, Indicated and Inferred(1, 2, 3, 4, 5, and 6)
| Category | | Tons (x1,000) | | | Au (oz/ton) | | | Contained Ounces | |
| Measured | | | | | | | | | | | | |
| Briggs - 100%(1) | | | 10,208 | | | | 0.021 | | | | 217,100 | |
| Reward - 100%(2) | | | 4,819 | | | | 0.022 | | | | 105,500 | |
| Pinson - Underground 100% (3,4) | | | 1,596 | | | | 0.352 | | | | 562,700 | |
| Pinson - Open pit 100%(3,4) | | | 21,159 | | | | 0.035 | | | | 732,000 | |
| Columbia - 100%(5) | | | 5,370 | | | | 0.047 | | | | 254,400 | |
| Cecil-R - 100%(6) | | | 858 | | | | 0.024 | | | | 20,800 | |
| | | | | | | | | | | | | |
| Total measured | | | 44,010 | | | | 0.043 | | | | 1,892,500 | |
| | | | | | | | | | | | | |
| Indicated | | | | | | | | | | | | |
| Briggs - 100%(1) | | | 17,546 | | | | 0.019 | | | | 336,600 | |
| Reward - 100%(2) | | | 15,474 | | | | 0.018 | | | | 282,400 | |
| Pinson - Underground 100%(3,4) | | | 1,301 | | | | 0.383 | | | | 498,000 | |
| Pinson Open pit 100%(3,4) | | | 4,307 | | | | 0.058 | | | | 249,600 | |
| Columbia - 100%(5) | | | 11,294 | | | | 0.043 | | | | 487,300 | |
| Cecil-R - 100%(6) | | | 2,382 | | | | 0.022 | | | | 52,700 | |
| | | | | | | | | | | | | |
| Total indicated | | | 52,304 | | | | 0.036 | | | | 1,906,600 | |
| | | | | | | | | | | | | |
| Measured & indicated | | | | | | | | | | | | |
| Briggs - 100%(1) | | | 27,754 | | | | 0.020 | | | | 553,700 | |
| Reward - 100%(2) | | | 20,294 | | | | 0.019 | | | | 387,900 | |
| Pinson - Underground 100% (3,4) | | | 2,897 | | | | 0.366 | | | | 1,060,700 | |
| Pinson - Open pit 100%(3,4) | | | 25,466 | | | | 0.039 | | | | 981,700 | |
| Columbia - 100%(5) | | | 16,664 | | | | 0.045 | | | | 741,700 | |
| Cecil-R - 100%(6) | | | 3,240 | | | | 0.023 | | | | 73,500 | |
| | | | | | | | | | | | | |
| Total measured & indicated | | | 96,315 | | | | 0.039 | | | | 3,799,200 | |
| | | | | | | | | | | | | |
| Inferred | | | | | | | | | | | | |
| Briggs - 100%(1) | | | 12,285 | | | | 0.018 | | | | 218,600 | |
| Reward - 100%(2) | | | 7,071 | | | | 0.015 | | | | 106,400 | |
| Pinson - Underground 100% (3,4) | | | 2,236 | | | | 0.378 | | | | 845,700 | |
| Pinson - Open pit 100%(3,4) | | | 824 | | | | 0.034 | | | | 28,300 | |
| Columbia - 100%(5) | | | 10,705 | | | | 0.042 | | | | 453,600 | |
| Cecil-R - 100%(6) | | | 5,144 | | | | 0.019 | | | | 99,400 | |
| | | | | | | | | | | | | |
| Total inferred | | | 38,265 | | | | 0.046 | | | | 1,752,000 | |
Silver Mineral Resources (Columbia) - Measured, Indicated and Inferred(5)
| Category | | Tons (x1,000) | | | Ag (oz/ton) | | | Contained Ounces | |
| Measured | | | 5,370 | | | | 0.155 | | | | 831,100 | |
| Indicated | | | 11,295 | | | | 0.115 | | | | 1,304,400 | |
| | | | | | | | | | | | | |
| Total measured & indicated | | | 16,665 | | | | 0.128 | | | | 2,135,500 | |
| | | | | | | | | | | | | |
| Total inferred | | | 10,705 | | | | 0.097 | | | | 1,035,800 | |
| 1. | Mineral Resources for Briggs, Reward and Pinson – Underground include Proven and Probable Reserves |
| 2. | Briggs Report, NI 43-101 Technical Report Briggs Mine, dated May 29, 2012; 0.006 oz/ton gold cut-off, adjusted for 2013 production and other changes during production. |
| 3. | Reward Report, NI 43-101 Technical Report Reward Gold Project, dated June 29, 2012; Resource updated to include 2013 drilling by Robert Sandefur of Chlumsky, Armbrust & Meyer LLC using a 0.006 oz/ton gold cut-off grade and $1,300 per ounce gold price. |
| 4. | Pinson Report, NI 43-101 Technical Report, dated May 25, 2012: using 0.20 oz/ton cut-off (underground) and 0.010 oz/ton cut-off (open pit). The underground resource has to be reconciled against development and test-mining completed in 2013. |
| 5. | Columbia Report, NI 43-101 Technical Report Columbia Gold Property, June 2010; 0.020 oz/ton gold cut-off. |
| 6. | Cecil R Report, NI 43-101 Technical Report Cecil R Gold Property, March 2010; using a 0.010 oz/ton gold cut-off. |
Cautionary Note to US Investors concerning estimates of Measured and Indicated Resources: This section uses the terms “measured” and “indicated” mineral resources. The Company advises US investors that while those terms are recognized and required by Canadian regulations, the SEC does not recognize them. US investors are cautioned not to assume that any part or all of mineral resources in these categories will ever be converted into reserves.
Cautionary Note to US Investors concerning estimates of Inferred Resources: This section uses the term “Inferred Mineral Resources”. The Company advises US investors that while this term is recognized and required by Canadian regulations, the SEC does not recognize it. Inferred Mineral Resources have a great amount of uncertainty as to their existence, and great uncertainty as to their economic and legal feasibility. It cannot be assumed that all or any part of an Inferred Mineral Resource will ever be upgraded to a higher category. Under Canadian rules, estimates of Inferred Mineral Resources may not form the basis of Feasibility or Pre-Feasibility studies, except in rare cases. US investors are cautioned not to assume that part or all of an Inferred Mineral Resource exist, or is economically or legally minable.
PRODUCTION PROPERTY
Briggs Mine, California
The Briggs gold mining property (“Briggs”) was acquired by the Company in 1990. The Briggs mine was initially constructed in 1995; mining ceased in 2004 due to gold-market conditions, and commercial production recommenced in mid-2009. Briggs is a conventional open pit mine that uses heap leach gold recovery. Ore is crushed to a targeted 80 percent passing a ¼-inch-screen prior to placement on the leach pad; and targeted gold recovery is 80 percent.
Briggs is located on the west side of the Panamint Range near Death Valley, California. From the city of Ridgecrest, Briggs is accessed by State Highway 178, which passes through the mining town of Trona and to the ghost town of Ballarat, a distance of 42 miles. The mine is reached from Ballarat by means of an improved dirt road which heads south and skirts the east side of Panamint Valley, a distance of eight miles. The legal description of the project area is Townships 21 through 23 South, and Ranges 44 through 45 East, Mount Diablo Meridian.
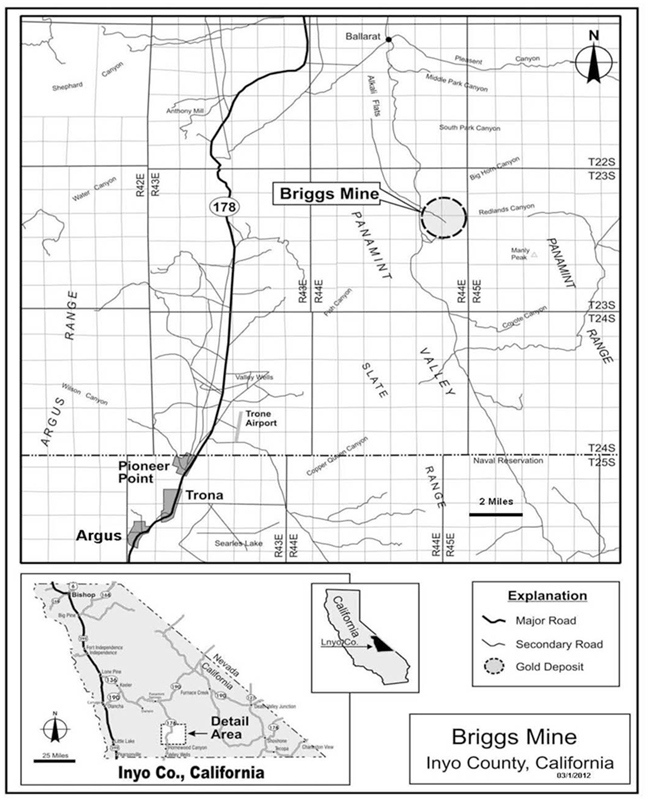
The Briggs mine is located on 156 unpatented claims, including 15 mill site claims, covering approximately 2,890 acres, on land administered by the BLM. No royalties are payable at Briggs. In addition to Briggs, the Company owns or controls four satellite projects (“Briggs Satellite Projects”) totaling 2,505 acres located between two and four miles north of Briggs: Cecil R, which includes 48 claims; the Jackson project (“Jackson”) located on 40 unpatented claims, two patented claims and one patented mill site; and the Mineral Hill project (“Mineral Hill”) and Suitcase projects (“Suitcase”) located on 48 unpatented claims. All of the mining claims are located on land prescribed for multiple use management by the BLM.
The sequencing of stripping of the Goldtooth South Pit deferred the availability of ore for crushing in the first five months of 2013. This reduced the ounces of gold placed on the leach pad and subsequently reduced gold production. In the second half of 2013, gold production was negatively impacted by intermittent mechanical and productivity issues in the power-generation and crushing circuits. Changes in plant supervisory staff have been made in part to address these production and maintenance challenges. As mining progresses in the Goldtooth South Pit in the first half of 2014, average ore grades are expected to increase as ore is mined at depth in the high-grade Goldtooth pits. This expectation of increased ore grade is driving a higher gold production forecast for 2014 when Briggs is expected to sell 40,000 to 45,000 ounces of gold. Pioneering work has also commenced on the Briggs Main North Pit to provide additional ore in the second half of 2014. In 2014, Briggs is budgeted to crush and place on the leach pad approximately 2.8 to 3.0 million tons of ore containing 60,000 to 70,000 ounces of gold. The waste stripping ratio is projected to be 3.6 tons of waste per ton of ore.
Ore-haulage cycles will increase in the first half of 2014, but decline in the second half as increasing tons of ore are mined from the North Main Briggs and Main Briggs pits. Waste haul cycles are also expected to decline through the year, both having a positive impact on operating costs. Ore-grade mined will decline in the second half of 2014 to levels more typical of 2013 as the ore supply shifts from the higher grade Goldtooth pits to the North Main Briggs and Main Briggs pits. However, due to the delay in gold recovery inherent in the leach-pad process, gold production and sales are expected to remain strong through 2014. Ore is currently being placed on the fifth lift of the Briggs leach pad and is expected to be placed on the seventh lift by year-end 2014. This increased stacking height will result in an increased leach recovery time. To account for this increase, the lag between ore placement and first gold recovery from the leach pad has been increased from 30 days to 45 days in production forecasts.
Production details for Briggs in 2013 and 2012 are shown in the following tables:
| | | First | | | Second | | | Third | | | Fourth | | | Total | |
| Production Statistics for 2013 | | Quarter | | | Quarter | | | Quarter | | | Quarter | | | 2013 | |
| Waste tons | | | 2,635,600 | | | | 2,505,800 | | | | 1,975,100 | | | | 2,369,300 | | | | 9,485,800 | |
| Ore tons | | | 371,800 | | | | 562,200 | | | | 624,100 | | | | 581,500 | | | | 2,139,600 | |
| Total tons | | | 3,007,400 | | | | 3,068,000 | | | | 2,599,200 | | | | 2,950,800 | | | | 11,625,400 | |
| Strip ratio (waste tons / ore tons) | | | 7.1 | | | | 4.5 | | | | 3.2 | | | | 4.1 | | | | 4.4 | |
| Ore grade (oz/ton) | | | 0.022 | | | | 0.019 | | | | 0.019 | | | | 0.018 | | | | 0.019 | |
| Contained gold ounces mined | | | 8,000 | | | | 10,800 | | | | 11,600 | | | | 10,600 | | | | 41,000 | |
| Gold ounces sold | | | 7,700 | | | | 6,800 | | | | 9,100 | | | | 8,100 | | | | 31,700 | |
| Recoverable gold ounces in inventory | | | 15,100 | | | | 17,300 | | | | 17,300 | | | | 18,100 | | | | 18,100 | |
| Cash cost of gold sales ($/oz) | | $ | 1,098 | | | $ | 1,131 | | | $ | 986 | | | $ | 977 | | | $ | 1,042 | |
| All-in sustaining cost ($/oz) | | $ | 1,452 | | | $ | 1,409 | | | $ | 1,084 | | | $ | 1,109 | | | $ | 1,249 | |
| | | First | | | Second | | | Third | | | Fourth | | | Total | |
| Production Statistics for 2012 | | Quarter | | | Quarter | | | Quarter | | | Quarter | | | 2012 | |
| Waste tons | | | 1,719,500 | | | | 1,348,100 | | | | 1,201,100 | | | | 1,718,900 | | | | 5,987,600 | |
| Ore tons | | | 712,400 | | | | 581,500 | | | | 634,600 | | | | 599,200 | | | | 2,527,700 | |
| Total tons | | | 2,431,900 | | | | 1,929,600 | | | | 1,835,700 | | | | 2,318,100 | | | | 8,515,300 | |
| Strip ratio (waste tons / ore tons) | | | 2.4 | | | | 2.3 | | | | 1.9 | | | | 2.9 | | | | 2.4 | |
| Ore grade (oz/ton) | | | 0.018 | | | | 0.020 | | | | 0.017 | | | | 0.019 | | | | 0.018 | |
| Contained gold ounces mined | | | 12,500 | | | | 11,600 | | | | 10,700 | | | | 11,100 | | | | 45,900 | |
| Gold ounces sold | | | 9,400 | | | | 8,100 | | | | 8,600 | | | | 9,600 | | | | 35,700 | |
| Recoverable gold ounces in inventory | | | 16,600 | | | | 17,700 | | | | 16,700 | | | | 16,600 | | | | 16,600 | |
| Cash cost of gold sales ($/oz) | | $ | 911 | | | $ | 928 | | | $ | 1,037 | | | $ | 1,061 | | | $ | 985 | |
| All-in sustaining cost ($/oz) | | $ | 1,061 | | | $ | 1,111 | | | $ | 1,110 | | | $ | 1,286 | | | $ | 1,146 | |
Note: Cash cost of gold production is a non-GAAP measure and is calculated utilizing Gold Institute Standards. All-in sustaining cost is also a non-GAAP measure and is calculated utilizing guidance from the World Gold Council. A reconciliation of GAAP measures to these non-GAAP measures follows later in this section.
The cash cost of gold sales decreased in the second half of 2013 after the early-2013 stripping campaign was concluded and ore-tons mined and gold-ounces produced increased. Cost reduction efforts also contributed to this change. All-in sustaining cost decreased in the second half of 2013, principally as a result of the completion of capital spending on the stripping campaign. In the latter half of 2012, cash cost of gold sales increased due to crusher-maintenance issues and an abnormally high consumption of wear-items and supplies.
Cash cost per gold ounce sold is a common gold mining industry measure and is therefore provided for benchmarking purposes. The measure may be useful as an indication of the average cash cost per ounce sold; but the measure does not reflect incremental costs or all cash expenditures because fixed costs are included in the calculation, and capital spending is ignored by the measure. Under IFRS, there is no standardized definition of cash cost per gold ounce sold and therefore the measure may not be comparable to similar measures reported by other issuers. The Company calculates cash cost per gold ounce sold using the Gold Institute Standards, and the measure is calculated by subtracting depreciation, depletion, amortization, silver by-product credits, and any mark-downs of inventory to net realizable value from cost of sales. Cost of sales includes all mine-site operating costs, mine-site overhead, production taxes, royalties, production stripping costs net of capitalization, secondary development costs, changes in inventory, and mine-site depreciation, amortization, and depletion.
All-in sustaining cost per ounce is a non-GAAP performance measure developed by the World Gold Council. The World Gold Council is a non-regulatory, non-profit, market development organization whose members include global senior mining companies. Quoting a June 2013 press release by the World Gold Council — “The World Gold Council … worked closely with its member companies to develop these non-GAAP measures which are intended to provide further transparency into (and comparability between) the costs associated with producing gold.” “The ‘all-in sustaining costs’ is an extension of existing ‘cash cost’ metrics and incorporates costs related to sustaining production (from current operations).” The Company believes that this measure will be useful to external users in assessing operating performance and the ability to generate free cash flow from current operations. This measure uses cash costs per ounce sold as its basis, and adds sustaining capital expenditures, general and administrative expenses, sustaining exploration and evaluation costs, and accretion and depletion of reclamation provisions, all allocable to the Briggs Mine. As this measure seeks to reflect the full cost of producing gold at current operations, it excludes capital expenditures to develop new operations and to materially enhance production or reserves at existing operations. Other cash expenditures, principally income tax payments and financing costs, are excluded. The World Gold Council issued guidance on the calculation of all-in sustaining cost in June of 2013, and presentation of this metric by the Company is the first presentation of this metric by the Company in its Annual Report, although comparable figures, consistently determined, are presented in this Report.
The following schedule reconciles cost of sales to cash cost per gold ounce sold for the periods indicated.
| | | 2013 | | | 2012 | |
| Total cost of sales | | $ | 42,910,500 | | | $ | 43,580,700 | |
| Less - mining related depreciation and amortization | | | (7,015,100 | ) | | | (8,095,100 | ) |
| Less - silver by-product credits | | | (286,300 | ) | | | (357,300 | ) |
| Less - adjustment of inventory to net realizable value | | | (2,595,600 | ) | | | - | |
| Total cash cost of sales | | $ | 33,013,500 | | | $ | 35,128,300 | |
| | | | | | | | | |
| Ounces sold | | | 31,687 | | | | 35,646 | |
| | | | | | | | | |
| Total cash cost per ounce | | $ | 1,042 | | | $ | 985 | |
| | | | | | | | | |
| Additional sustaining costs per ounce sold: | | | | | | | | |
| General & administrative costs - Corporate allocation | | $ | 25 | | | $ | 23 | |
| Accretion of Asset Retirement Obligation | | | 7 | | | | 6 | |
| Sustaining exploration expenditures | | | 5 | | | | 12 | |
| Sustaining capital expenditures | | | 170 | | | | 118 | |
| All-in sustaining cost per ounce sold | | $ | 1,249 | | | $ | 1,144 | |
Briggs produced $3.7 million in positive operating cash flow in Fourth Quarter 2013, inclusive of a net reduction of $0.9 million in working capital. In Fourth Quarter 2013, Briggs’ loss before tax was $1.4 million, inclusive of a $1.8 million non-cash write-down of inventories to net realizable values as of December 31, 2013. The cash cost of gold per ounce sold decreased in Fourth Quarter 2013 by approximately one percent over Third Quarter 2013 even though gold ounces sold decreased by 10 percent. This marginal change in cash cost was driven largely by cost reduction efforts and shorter waste haul cycles.
Briggs produced $15.4 million in operating cash flow and $1.8 million of income in 2013 before tax, intercompany allocations, and an asset retirement obligation recovery. Gold ounces produced and sold by Briggs decreased approximately 11 percent in 2013 over 2012 and the average sales price of gold declined by 15 percent, so revenues decreased $14.7 million or by 25 percent. Cost of sales, excluding depreciation and amortization and inventory adjustments to net realizable value, decreased $2.2 million or by 6 percent in 2013 relative to 2012. The decrease in the absolute cost of sales is attributable to the lower number of ounces sold, and much of the increase in per unit costs resulted from fixed costs being spread over the decreased number of ounces sold. Fewer ounces produced and sold followed from an emphasis on capitalized stripping during the first five months of 2013 and secondarily from intermittent plant mechanical and productivity issues in the second half of 2013.
Briggs’ production costs on a per-ton-mined and processed basis are summarized below for the prior two years.
| Briggs Mine Average Operating Cost Per Ton |
| | | | | | | | | |
| Function | | Basis | | 2013 | | | 2012 | |
| Mining | | $/ton of material, ore & waste | | $ | 1.54 | | | $ | 1.77 | |
| | | | | | | | | | | |
| Mining | | $/ton of ore crushed | | $ | 8.64 | | | $ | 5.90 | |
| Crushing | | $/ton of ore crushed | | $ | 3.19 | | | $ | 3.60 | |
| Leach and Plant | | $/ton of ore crushed | | $ | 2.79 | | | $ | 1.79 | |
| Site Gen and Admin | | $/ton of ore crushed | | $ | 3.34 | | | $ | 3.16 | |
| Total Operating Cost | | $/ton of ore crushed | | $ | 17.96 | | | $ | 14.45 | |
Unit mining costs declined as Briggs effectively mined 36 percent more tons of material in 2013 over 2012. Total operating cost on a per ore-ton crushed basis increased primarily due to a 15 percent reduction in the total ore tons crushed in the second half of 2013 for reasons previously discussed.
Project and sustaining capital expenditures in 2014 are expected to be between $3.6 million and $4.2 million. Sustaining capital expenditures are budgeted to be primarily focused on mining equipment rebuilds. Budgeted project capital is limited to the construction of additional pit dewatering infrastructure. No material equipment additions are planned at Briggs in 2014. As of December 31, 2013, the cumulative, recorded cost of Briggs’ property, plant, mine development, and mineral interests was $60.5 million, having a carrying-value of $25.6 million, net of depreciation and amortization.
Mobile equipment at Briggs includes seven 85 to 100-ton trucks, three 15-cubic-yard loaders, three blast-hole drills, four dozers, and two graders. The three-stage crushing plant at Briggs has a nominal capacity of 600 to 700 tons per hour depending on hardness of ore-feed. Ore is typically crushed in three stages to 80 percent minus-¼-inch-size and conveyor-stacked on the leach-pad for leaching. Gold recovery at this crush size is estimated to be approximately 80 percent. The gold recovery plant utilizes the carbon absorption and desorption process to recover gold from solution, and the refinery utilizes conventional furnace technology. Power for the mine is currently supplied by three 1.1 megawatt diesel generators.
Briggs operates under the requirements of the following significant permits and agencies: (1) Plan of Operations, BLM; (2) Mining and Reclamation Plan, Inyo County; (3) Waste Discharge Requirements, Lahontan; (4) Permits to Operate, Great Basin Unified Air Pollution Control District; and (5) a stream bed alteration permit with California Fish and Game. The Company, via sureties, has posted reclamation bonds with these agencies in the amount of $4.4 million. All surety bonds are subject to annual review and adjustment.
In June 2013, Briggs received a Notice of Violation (NOV) in connection with the fact that one of its then four stationary diesel generators did not meet State of California emission standards for diesel toxic control measures. The Company has removed the subject generator from service and is negotiating final resolution of this NOV with the CARB.
Briggs is hosted by Precambrian quartz-rich gneiss and amphibolite which have undergone ductile folding during Precambrian time and subsequently subject to brittle deformation by high and low-angle faulting during Mesozoic and Tertiary time. High-angle faults and shear zones are believed to have acted as conduits that channeled gold-bearing hydrothermal fluids upwards into the Precambrian gneiss and amphibolites rock units. The principal gold mineralized high-angle fault zone at the mine is the north-south trending Goldtooth fault. The Goldtooth fault was developed historically by underground methods in the early 1900’s and remains an important source of ore at Briggs.
The table below summarizes the change in gold reserves in contained ounces at Briggs in 2013.
| | | Beginning | | | | | | Other | | | Ending | |
| Contained Ounces | | 2013 | | | Production | | | Changes | | | 2013 | |
| Proven | | | 89,281 | | | | | | | | | | | | 69,013 | |
| Probable | | | 94,170 | | | | | | | | | | | | 75,264 | |
| | | | | | | | | | | | | | | | | |
| Total Briggs Reserves | | | 183,451 | | | | (40,952 | ) | | | 1,778 | | | | 144,277 | |
Detailed proven and probable reserves by pit area as of December 31, 2013, estimated utilizing a 0.006 oz/ton gold incremental leach cutoff grade, are shown in the following table. (See Section D. Property, Plant and Equipment, Summary of Mineral Reserves and Resources for certification.)
| | | | | Tons | | | Gold | | | Contained | |
| Mining Area | | Category | | (x1,000) | | | (oz/ton) | | | Ounces | |
| Briggs Main | | Proven | | | 1,854 | | | | 0.017 | | | | 30,764 | |
| | | Probable | | | 1,640 | | | | 0.016 | | | | 25,940 | |
| | | Sub-Total | | | 3,494 | | | | 0.016 | | | | 56,704 | |
| Briggs Main North | | Proven | | | 854 | | | | 0.019 | | | | 16,051 | |
| | | Probable | | | 1,027 | | | | 0.020 | | | | 20,041 | |
| | | Sub-Total | | | 1,881 | | | | 0.019 | | | | 36,091 | |
| Goldtooth - North | | Proven | | | 85 | | | | 0.040 | | | | 3,404 | |
| | | Probable | | | 168 | | | | 0.037 | | | | 6,256 | |
| | | Sub-Total | | | 253 | | | | 0.038 | | | | 9,659 | |
| Goldtooth - South | | Proven | | | 587 | | | | 0.032 | | | | 18,794 | |
| | | Probable | | | 747 | | | | 0.031 | | | | 23,028 | |
| | | Sub-Total | | | 1,334 | | | | 0.031 | | | | 41,822 | |
| Total - Briggs Reserves | | Proven | | | 3,380 | | | | 0.020 | | | | 69,013 | |
| | | Probable | | | 3,582 | | | | 0.021 | | | | 75,264 | |
| | | Grand Total | | | 6,962 | | | | 0.021 | | | | 144,277 | |
DEVELOPMENT PROPERTIES
Reward Mine, Nevada
Reward is located on approximately 2,214 acres in southwestern Nye County, Nevada, about 5.5 miles south-southeast of the town of Beatty. Access is gained via state highway 95 to the site access road turnoff followed by a two-mile gravel access road. The Company leases eight placer claims and 14 unpatented lode claims that expire in 2024 and 2025. Additionally, the Company also owns 99 unpatented lode claims and six patented claims. The leases and patented claims each carry a 3 percent net smelter return royalty. No modern commercial mining activities have been undertaken previously at Reward; it is a ‘green-field’ project which the Company believes it can develop with a comparatively low capital investment relative to many other properties.

While resource and reserve estimates have since been updated, the following describes the most recent and still materially current Feasibility Study. In July 2012, the Company announced the results of the “NI 43-101 Technical Report, Reward Gold Project, Nye County, Nevada” dated June 29, 2012 with an effective date of December 31, 2011 (the “Reward Report”) prepared by Fred Barnard, PhD, AIPG-CM, Greg Chlumsky, MMSA, Michael J. Read, SME-RM, Matthew P. Reilly, P.E. and Robert L. Sandefur, P.E. of Chlumsky, Armbrust & Meyer LLC, an independent engineering firm. Each of the foregoing persons is an independent qualified person in accordance with NI 43-101. Atna contracted with Chlumsky, Armbrust, & Meyer LLC of Lakewood, Colorado, to prepare the Reward Report in order to consolidate information in relation to the mineral resource estimate, mineral reserve estimate and update the feasibility information for Reward. Projected project economics at varying gold prices are shown in the following table.
| Gold Price | | $1,200 | | | $1,300 | | | $1,400 | | | $1,500 | | | $1,600 | |
| | | | | | | | | | | | | | | | |
| Cash Flow (US $Million) | | $ | 75.0 | | | $ | 94.6 | | | $ | 114.2 | | | $ | 133.8 | | | $ | 153.5 | |
| NPV @5% (US $Million) | | $ | 52.8 | | | $ | 68.6 | | | $ | 84.4 | | | $ | 100.2 | | | $ | 116.0 | |
| IRR | | | 38.4 | % | | | 48.0 | % | | | 57.5 | % | | | 66.9 | % | | | 76.1 | % |
| Payback (Years) | | | 2.6 | | | | 2.2 | | | | 2.1 | | | | 2.0 | | | | 1.9 | |
| | | | | | | | | | | | | | | | | | | | | |
| C2-Cash Cost* (US $/oz) | | $ | 569 | | | $ | 576 | | | $ | 584 | | | $ | 592 | | | $ | 600 | |
| C3-Full Cost** (US$/oz) | | $ | 847 | | | $ | 855 | | | $ | 863 | | | $ | 871 | | | $ | 878 | |
* C2 cash cost includes all direct operating costs, royalties and severance taxes
** C3, full cost, includes C2 costs plus capital cost recovery
Reward Report Highlights(M=million)
Mine Production Rate: 6,500 ore tons per day
Mine Life: seven years
Average Gold Recovery: 80% (60% in first two months)
Crush Size: 80% passing 1/2 inch
Life of Mine Strip Ratio: 3.1:1 (waste: ore)
Initial Capital Cost: $34.5M (including $5.5M in capital leases and $2.2M in contingency)
Phase 2 Expansion Capital: $6.9M (including $1.2M bond collateral)
Underlying NSR royalty: 3.0%
Average Annual Gold Production: 35,000 ounces
Planned start-up capital costs total $34.5 million for crushing and process plants, facilities and infrastructure, mobile mining fleet, capitalized stripping and funding of surety bonds; however this is likely to increase by the time the development occurs. Offsite infrastructure development requirements for the project have been completed. The production water well, wildlife exclusion fencing, electrical power lines, and road improvements were completed in 2011. Additional infill and step-out drilling was completed in early 2013 and this information has been incorporated into the resource model. Reward’s carrying cost as of December 31, 2013 was $11.1 million, net of accumulated depreciation.
The mineral resource was updated in February 2014 by Robert L. Sandefur to include additional drilling completed by the Company in early 2013. Additionally, the project’s reserves were updated by Michael J. Read to reflect current gold prices and operating costs. Both Mr. Sandefur and Mr. Read are independent mining engineers and Qualified Persons as defined by NI 43-101 and are with Chlumsky, Armbrust & Meyer LLC, of Lakewood, Colorado.
The current proven and probable gold reserve for the Reward Property is as follows:
| | | Tons | | | Gold | | | Contained | |
| Category* | | (x 1,000) | | | (oz/ton) | | | Ounces | |
| Proven | | | 3,293 | | | | 0.025 | | | | 83,000 | |
| Probable | | | 7,438 | | | | 0.022 | | | | 166,500 | |
| | | | | | | | | | | | | |
| Proven plus Probable | | | 10,731 | | | | 0.023 | | | | 249,500 | |
* The mineral reserve estimate is based upon $1,300 per ounce gold and current operating cost data using a >$0.01 incremental value cut-off.
The current mineral resource estimate for the Reward Property is as follows:
| | | Tons | | | Gold | | | Contained | |
| Category* | | (x 1,000) | | | (oz/ton) | | | Ounces | |
| Measured | | | 4,819 | | | | 0.022 | | | | 105,500 | |
| Indicated | | | 15,474 | | | | 0.018 | | | | 282,400 | |
| | | | | | | | | | | | | |
| Measured and Indicated | | | 20,293 | | | | 0.019 | | | | 387,900 | |
| | | | | | | | | | | | | |
| Inferred | | | 7,071 | | | | 0.015 | | | | 106,400 | |
* The mineral resource is reported using a 0.006 ounce per ton gold cut-off grade and a gold price of $1,300 per ounce.
Phase 1 development bonds have been posted and substantially all permits required for mine development and operating activities have been received. The US Bureau of Land Management signed the Record of Decision and Finding of No Significant Impact approving the development of Reward in August 2009. In January 2010, the Nevada Division of Environmental Protection issued a Reclamation Permit that became effective February 7, 2010. This permit, subject to the placement of a total of $6.2 million in reclamation bonds, will allow Atna to construct the Reward Mine. Approximately $0.9 million of the bonding is in place, and the balance is expected to be placed prior to commencing final construction. Reclamation bonds may be subject to inflation and other adjustments. Other major permits, including the Class II Air Quality Operating Permit, Water Pollution Control Permit, and a Permit to Change Point of Diversion, Manner of Use and Place of Use of The Public Waters, have also been issued by the State of Nevada.
The Company expects to commence construction of the Reward mine once sufficient financial resources are available to fund the development and working capital required. Once construction is commenced, a nine-month construction period is anticipated; with gold production commencing three months after construction is completed.
Current reserve estimates are based on estimated future costs and a gold price of $1,300 per ounce as of December 31, 2013. The Reward Report, an NI 43-101 compliant Technical Report dated June 29, 2012, supports the reserve and resource disclosures. Reserves assume an 80 percent processing recovery rate based on metallurgical test results. The Reward operation is expected to produce approximately 199,600 ounces of recovered gold over a seven-year mine life. The life of mine waste-to-ore strip ratio is expected to be 3.6 to 1.
Upon completion of the planned construction activities, Reward will be a conventional open-pit mining operation with ore crushing and heap-leach gold recovery. Mining operations at Reward will utilize conventional 100-ton open pit trucks and 15-yard loaders. Mined ore will be crushed to minus 3/8 inch and placed on a lined pad for leaching and gold recovery. Target gold recovery is 80 percent for the project. Process solutions will be captured in solution tanks and circulated through activated carbon to capture entrained gold. The gold laden carbon is further processed by pressure stripping the carbon into a more highly concentrated gold bearing solution. The gold bearing solution is further concentrated by an electrowinning circuit, which collects the gold onto electric cathodes which are then melted into gold doré bars.
Gold mineralization at the Reward property may be characterized as a mesothermal gold system hosted in early-Cambrian to late-Proterozoic siltstones, shales, and dolomites of the Wood Canyon Formation and the Sterling Quartzite. The main zone of gold mineralization is associated with the Good Hope fault zone which strikes northerly and dips steeply to the east. Both the Good Hope fault and the Wood Canyon Formation contain strong zones of gold mineralization associated with white quartz veining and disseminated iron oxides after pyrite. The vast majority of the mineralized zone explored to date is has been oxidized by meteoric waters.
Pinson Mine Property, Nevada
Pinson is located in Humboldt County, Nevada, about 30 miles east of Winnemucca and is accessed by an all-weather road about ten miles north of the Golconda Exit from Interstate Highway 80. The property is located on the Getchell Gold Belt in north-central Nevada near its intersection with the north end of the Battle Mountain-Eureka trend. Prior to 2000, Pinson produced over 987,000 ounces of gold from oxidized ore by open pit mining and oxide heap-leach and mill recovery. Gold production came from decalcified, locally silicified and/or argillized, fine-grained, limy sedimentary rocks of the Ordovician Period Comus Formation and is considered a Carlin-type, sedimentary host gold system. Mineralization is focused along and adjacent to the Getchell Fault zone.
In September 2011, Atna completed an Asset Purchase and Sale Agreement ("APSA") with Pinson Mining Company ("PMC") a subsidiary of Barrick Gold to acquire PMC’s 70 percent interest in Pinson. The site had previously been operated as a joint venture with PMC owning 70% and Atna owning 30%. Atna now controls approximately four square miles of land containing the historic Pinson Mine and the related mineral resources. Atna had originally entered into an Exploration and Development Agreement with PMC at Pinson in 2004 and ultimately earned a 30% equity interest in the project. The joint venture spent over $50 million on drilling and development work at Pinson from 2004 through 2011.
The land controlled by the Company contains substantially all of the mineral resources developed by the former joint venture. The land position includes approximately four square miles of leased and owned fee lands and unpatented mining claims. This includes 30 claims owned 100 percent, ownership of two additional sections of fee surface and mineral lands, ownership of 41.66 percent of 18 additional claims and a lease interest in 18 full and two fractional mining claims. The Company owns an additional 41.66 percent interest on an additional 120 acres of fee and mineral lands and leases the remainder of that interest, with the remainder controlled by local landowners. In total, there are 2,545 acres in the Pinson package. The Pinson underground ores are subject to a 6.0% Net Smelter Return ("NSR") royalty payable to underlying landholders and the Mag open pit will be subject to NSR’s ranging from 2.0% to 6.0%. An NSR royalty is a defined percentage of the gross revenues from a mining operation, less a proportionate share of incidental transportation, insurance, refining and smelting costs. PMC also retained a 10 percent, net profits royalty, that is payable after all development expenditures are recaptured and the first 120,000 ounces of gold have been sold.
As of December 31, 2013, Pinson’s net carrying cost was $34.9 million. While secondary underground development was written-off as impaired in 2013, principal assets deemed to retain value at Pinson include: Mag open-pit resources, resources and reserves accessible from the primary underground access at the Pinson-underground mine, buildings and equipment, and primary underground development deemed likely to yield future benefits through use.

Pinson Underground
Pinson-underground contains numerous ore zones. The principal zones are the Ogee (OG), Range Front (RF), Adams Peak (AP) and the CX. To date, ore has been developed and mined only in the OG zone. The Pinson deposits are structurally controlled Carlin type deposits. Mineralization is emplaced as karst fillings and carbonate replacements. Mineralization includes oxide, mixed, and sulfide ores that require different types of processing for gold recovery. Mining has not proceeded to the depth at Pinson where sulfide ores, unmixed with oxide, have been encountered.
Development of the Pinson underground mine commenced in early 2012 and mine ramp-up began in late 2012. A total of 4,100 feet of primary and secondary development was completed during 2013 and 2012. The primary spiral was driven to the 4530 level from the 4650 adit level (120 feet below the mine portal) and both top cut and underhand ore mining occurred in three Ogee-zone stope blocks during development. Additionally five stope blocks were partially developed and may be completed from the existing spiral. Mining was performed by contract-miners utilizing underground mining equipment owned by the contractor.
Mixed sulfide/oxide ores mined during development operations were processed at the Jerritt Canyon roaster facility, owned by Veris Gold USA Inc., and oxide ores were processed at Newmont's Twin Creek's oxide mill. A total of 30,150 tons of ore mined during development was shipped for processing. This ore contained 7,915 ounces of gold, from which 6,834 ounces were recovered. Atna received payment for 5,383 ounces from the third party processors, which was credited against capitalized development.
At the end of June 2013, the mine was placed on care and maintenance status until such time that a revised mine plan has been developed and additional financing can be arranged. A number of factors led to the decision to place the mine on care and maintenance. These included: deteriorating gold market conditions; Atna’s limited financial capacity to support continued development; lower than expected ore-mining productivity during development; and higher than anticipated costs during development.
Care and maintenance activities at Pinson include mine examinations in the main access to monitor ground conditions, water elevations and air quality evaluations. Two surface wells are used to continue to de-water underground mine workings. Water is being discharged into two existing rapid infiltration basins. A third basin is permitted for construction. Environmental monitoring continues as part of maintaining permits.
Underhand cut and fill mining methods, using cemented rock fill (“CRF”), were utilized to develop the ore stopes as recommended by the pre-mining Feasibility Study. This mining method was chosen due to the variable geometry of the various ore bodies at Pinson and the low strength of the rock in the ore zones. This method is designed to maximize safety and minimize ore dilution and ore losses due to mining. The underhand cut-and-fill mining method was effective at Pinson, but resulted in high development and operating cost as implemented. Experience gained during development clearly indicates that improvements can be made to the mine design and mining methods outlined in the pre-mining Feasibility Study.
Experience gained during the recent development work led to a number of conclusions that will be used as a basis for re-engineering future mine plans. These include the following:
| 1. | Ground conditions in development workings were generally fair to good and posed no impediment to development operations. Original roof control and bolting patterns were likely over-designed. |
| 2. | Underhand cut and fill mining with CRF can be conducted safely in the ore zones. |
| 3. | It was determined that the developed stope-access drifts, accounted for as ‘secondary development’, were not properly placed to achieve good mining orientations and high ore yields. A strong focus needs to be placed on future placement and orientation of access drifts into the mining levels to increase mining productivity and ore yield from any given access drift. Original stope-access designs did not take these considerations into account. |
| 4. | No apparent in-situ stress or rib squeeze was detected in the ribs or walls on the development levels. As a result, cuts were increased in height during operation from their original designs with no impact. Further work is required to determine optimal cut height. Increased cut height should reduce required access development costs. |
| 5. | Ore geometry is complex in the OG zone which requires a strong geologic understanding to guide ore mining operations. Close-spaced drilling of stoping areas is required to clearly delineate ore geometries and boundaries prior to mining. This work was not considered in the original pre-mining Feasibility Study. |
| 6. | Limestone clasts inherent in the ore combined with waste dilution from mining created grade dilution. Grade distribution tests verified that larger rock particles in the ore were mostly waste. To enhance shipped ore grade, ore screening tests revealed that up to 20 percent of total material may be screened off using a 3” passing-screen-deck, and the rejected material contained little or no gold, thus resulting in higher ore grades being shipped to third-party processing facilities. |
| 7. | Stope productivity can be improved by decreasing inefficiencies associated with geologically controlled “selective” mining activities and focusing instead on a bulk mining approach while removing waste dilution from the ore on surface by screening. |
| 8. | Engineers, on review of underground mining conditions, have recommended that modified long-hole stoping systems be considered for Pinson-underground. |
| 9. | Actual mining results reconciled to within 20 percent of modeled reserve ounces. The reserve model generally performed well; however with only approximately two percent of total reserve tons mined, and only from the OG zone, an accurate conclusion concerning model performance cannot be drawn due to the limited sample. It is believed that further review of data used to model ore zones may create greater production design control. |
| 10. | The feasibility resource model at Pinson utilized two sets of ore shells to control model grades; one outlining the outer zones of mineralization with a 0.05 ounce per ton envelope and an inner high-grade shell utilizing 0.25 ounce per ton. The cutoff grade utilized in the outer shell was overly low and needs to be increased to reduce excessive dilution in some areas and grade extrapolation in others. This issue must be fixed prior to any re-design of the mine. |
| 11. | Multiple types of ore, the use of multiple processing plants for gold recovery, and processors using sliding scales based on head-grade to determine payable recoverable ounces combined to require a strong focus on ore control and ore management systems at Pinson. Improving these ore control systems is a key to success for future mining. |
| 12. | Start-up of operations in a peak gold market environment with significant competition for contactors and personnel led, in part, to higher than anticipated costs. Care must be taken upon re-starting operations to manage third-party pricing expectations and employees’ salaries. Bringing some components of the mining and surface operations in-house may improve cost structure and productivity. |
Based on this experience, it is believed that improvements to the project design and plan can be made to improve future project economics and that additional engineering, mine-design, and costing studies are justified.
During 2014, Atna plans to reassess the Pinson underground resource model followed by a re-design of the underground mine plan utilizing experience gained, as discussed above. This work will be performed in preparation for resuming development when gold markets are stronger and financing becomes available to fund the re-start. Pre-feasibility work is currently underway for the Mag pit project adjacent to the underground project. Management believes that operating the potential open pit, heap leach operation simultaneously with the underground operation will assist in distributing overhead cost and provide a lower cost processing outlet for oxide ores mined from underground.
The Company spent $22.2 million in 2013 at Pinson on underground development, equipment purchases, and construction of buildings and other infrastructure. Prior to an impairment evaluation and write-off in 2013 of $30.7 million of secondary-development, Pinson, inclusive of the cost of the resources in the Mag open-pit area, had a net carrying cost of $65.5 million.
As discussed above, the existing ore stope access or secondary development drifts were poorly placed to maintain good mining productivities and ore yields. The existing secondary development work may or may not be utilized in any future mine design. In view of this uncertainty, the Company determined that all secondary underground development at Pinson-underground was impaired as it may not be utilized in the future and $30.7 million of secondary development was written-off as impaired. Other principal assets were determined to have probable future benefits and fair values in excess of carrying cost; such assets include: Mag open-pit resources, underground resources and reserves, buildings and equipment, and primary underground development.
Pinson underground is permitted to extract by underground mining up to 400,000 tons of ore per year for offsite processing. Atna provided the State of Nevada with approximately $0.8 million of bonding to date and anticipates posting an additional $0.9 million in the second quarter of 2014.
Mag Open Pit at Pinson
The Pinson mine had previously operated as an open-pit mine with gold produced from oxide ores through heap-leach and oxide mill recovery. Between 2004 and 2011, the Pinson joint venture conducted substantial drilling from surface in and around the existing open pits providing new information and expanding the mineral resource base in and around the old pits. The Company has evaluated this potential, which resulted in the development of a substantial Measured and Indicated Mineral Resource containing 981,700 gold ounces that the Company believes to be amenable to open-pit mining and heap-leach gold recovery. This resource is adjacent to but separate from the underground resource.
The Company has initiated a Pre-Feasibility Study to determine the economic feasibility of developing the section 33 pit, which resides on private property. This study is expected to be completed by the end of the second quarter 2014. A second goal of this study is to develop information needed to produce a Mine Plan of Operations to be submitted to the NDEP to commence the permitting process. This project is currently unpermitted and will be subjected to the permitting process prior to the commencement of mining.
A metallurgical-sample drilling program in the Mag open pit was completed in May, 2012. Four PQ core holes were drilled totaling 2,086 feet to acquire samples for column leach testing of the potential open-pit, heap-leach gold resources in the Mag pit. Column leach testing was the focus of the metallurgical work with attention to crush-size optimization, gold recovery optimization, evaluation of reagent costs, and the evaluation of any recovery issues associated with carbon or gold encapsulation. This metallurgical program was completed in 2013 with positive results.
Mag pit mineralization is typical of a Carlin type system in that mineralization will range from fully oxidized in nature to fully refractory sulfide at depth with a range of mixed oxide-sulfide mineralization between these ranges. It was determined from this metallurgical work that cyanide soluble gold assays can be utilized as a good proxy for recoverable gold content. This may range from as high as 90 percent in highly oxidized material to zero percent in the refractory sulfide. Gold recovery approximately tracks cyanide soluble gold content which is expected to average in the range of 55 to 60 percent.
Columbia Project, Montana
The Company wholly-owns or leases 24 patented and 162 unpatented mining claims at Columbia, which is located approximately seven miles east of Lincoln and 45 miles northwest of Helena, in Lewis and Clark County, Montana. The patented claims are subject to NSR royalties that range from zero to six percent. Columbia is a ‘green-field’ site, subject only to minor historic mining, and not previously having operated as a commercial modern mine.

The Company engaged Gustavson Associates, LLC, an independent engineering to complete the “NI 43-101 Technical Report and Preliminary Assessment on the Columbia Project, Lewis and Clark County, Montana” dated June 2, 2010 (the “Columbia PEA”) prepared by William J. Crowl R.G., MMSA SME-RM, Donald Hulse P.E., and Richard Moritz, MMSA of Gustavson Associates, LLC. Each of the foregoing persons is an independent qualified person in accordance with NI 43-101. Results of the Columbia PEA demonstrate that the project may have favorable development potential. The preliminary assessment includes inferred mineral resources within the pit boundary that are considered too speculative geologically to have the economic considerations applied to them that would enable them to be categorized as mineral reserves, and there is no certainty that the preliminary assessment estimates will be realized. Additional studies are required to fully demonstrate the future economic feasibility of the project. This work however justifies moving ahead with a feasibility level study to further define the economics of the project which may potentially justify commencing the permitting process.
The Columbia mineral resource estimate is summarized in the Summary of Mineral Resources and Reserves section utilizing a cut-off gold grade of 0.02 oz/ton, which is calculated utilizing operating cost and expected recovery parameters as developed in the Columbia PEA with supporting metallurgical test work. The Columbia resource estimate is based on 337 drill holes totaling 147,000 feet of drilling and 12,500 feet of surface trenching in 78 trenches carried out between 1989 and 1993. Bulk sampling, development studies, metallurgical testing, and environmental baseline studies were conducted during the same time period. The deposit remains open for possible extension both along strike and to depth.
The economic results of the Columbia PEA are dated, having been prepared in 2010, and both capital and operating costs are subject to change due to inflation of costs over time. The Columbia PEA contemplates a conventional open pit truck/loader mining operation with sequential pit waste backfill and a conventional 5,000 ton per day gravity and flotation mill to produce an average annual production of approximately 70,000 ounces of gold and 96,000 ounces of silver over a nine-year mine life of both doré and a gold and silver concentrate. Concentrates would be sold to third-party processing facilities. The initial design seeks to minimize environmental impact by incorporating dry tailings for pit backfill versus a conventional wet tailings dam.
The Columbia PEA developed a number of recommendations for future work. These include:
| · | Additional metallurgical sampling to adequately test the various parts of the resource sufficiently to refine the process flow and complete a plant design. |
| · | Additional drilling to confirm the resource and upgrade the ore classification of the Donnely South area. |
| · | An evaluation of the permitting requirements of the project. |
| · | A geotechnical study to optimize pit slope angles and confirm waste dump stability and design. |
| · | Feasibility and project optimization studies. |
A second round of metallurgical test work was completed in February 2012. This work was focused on optimizing flotation gold recovery and characterizing gold concentrate grade and quality utilizing conventional gravity and flotation gold recovery methods to produce concentrate products. Reverse circulation reject samples were composited to create representative oxide mineral samples for testing. Overall recovery was approximately 88 percent for gold and 50 percent for silver. Cleaner flotation upgraded the flotation concentrate to the range of 39 ounces per ton of gold and 125 ounces of silver. Cyanide leach test on flotation concentrate produced a gold recovery of 98 percent and a silver recovery of 96 percent, indicating a high level of oxidation.
In 2012, the Company completed seven reverse-circulation rotary holes drilled to obtain metallurgical samples for additional process optimization studies. Total footage drilled was 3,468 feet (1,057 m). Holes in this program were drilled down dip on the structural zones to obtain large quantities of mineralized sample material and the intercept lengths do not represent true thicknesses. The long, down-structure intercepts provide strong support for the down-dip continuity of the gold and silver grades in both the Columbia and Donnely vein systems and provide additional support for the resource estimate detailed in the Columbia PEA.
Additional metallurgical test work will be conducted utilizing samples from this drilling program to further support the currently selected flotation and gravity gold recovery process. Atna's goal is to continue to develop base data to support the completion of a Mine Plan of Operations as a basis to commence the permitting process at Columbia.
In addition to drilling, the Company continues to gather environmental baseline data. Monitoring of water resources has been conducted at the Project since the 1990s and has yielded an extensive water quality database. The program was expanded in 2012 with the addition of eight groundwater piezometers and a geomorphic survey of stream reaches. The collected groundwater information will support evaluation of mine water issues such as water supply and dewatering needs. The geomorphic survey is the initial step in characterizing aquatic habitat in the area. The environmental program was also expanded to include terrestrial resources including wildlife, vegetation and wetlands. Monitoring continued through the 2013 summer field season. Extensive logging operations and timber sales were conducted from the property throughout the summer of 2013.
Gold mineralization at Columbia is considered a Tertiary-age, low-sulfidation, epithermal volcanic-hosted quartz-adularia vein system. Mineralization is associated with two high-angle fault zones which host the two principal vein and stockwork vein zones known as the Columbia and Donnely veins. The veins are exposed on the surface for over 7,000 feet (2,100 m) in a north-south direction and have been explored to a depth of over 500 feet (150 m) vertically. Gold and silver mineralization is accompanied by broad zones of argillic to propylitic alteration of the dominantly mafic volcanic flows which host the deposit.
Columbia is not currently permitted for development. As with virtually all mining projects in the United States, an environmental impact statement and permitting process must be completed before a mine can be developed on the property. There are no assurances that all needed permits will be issued, issued timely, or issued without onerous conditions.
Briggs Satellite Projects, California
Cecil R is located four miles north of Briggs. The Company completed an initial NI 43-101 compliant mineral resource estimate and technical report titled “NI 43-101 Technical Report Mineral Resource Estimate Cecil R Gold Deposit, Inyo County, California USA” dated March 2, 2010 (the “Cecil Report”) prepared by Fred Barnard, PhD and Robert L. Sandefur, P.E. of Chlumsky, Armbrust & Meyer LLC. Each of the foregoing persons is an independent qualified person in accordance with NI 43-101.
Work at Cecil R leading up to the NI 43-101 resource estimate included over 94 drill holes, surface geologic mapping, surface and underground sampling, and 3D geologic modeling. Gold mineralization at Cecil R is hosted by the same geologic unit which hosts the nearby Briggs gold deposit. The gently west dipping blanket-like zone of gold mineralization dips beneath Quaternary gravel cover and is distributed over an area 1,500 feet by 1,200 feet and has a thickness of 10 to 60 feet.
In late 2012, a scoping level economic study was commenced on the Cecil R project. This non-NI 43-101 compliant report produced positive results, and the Company believes this justifies continued work on the project. Additional preliminary engineering work is planned in order to allow a Mine Plan of Operations to be submitted to regulatory authorities. The Cecil R open-pit project may be required to comply with the California Backfill Regulation and be permitted as a stand-alone project.
In 2006, Atna acquired Suitcase and Mineral Hill for 10,000 shares of common stock of Atna. In addition, Atna will pay a total of $135,000 in ten yearly installments, plus a 3 percent NSR royalty that may be reduced to 1 percent for $0.5 million per point of reduction. Suitcase and Mineral Hill are located east and upslope from Cecil R and Jackson.

Both Suitcase and Mineral Hill have been actively explored by a number of mining companies since the early 1980s. In 1990, Pegasus Gold Corp conducted detailed helicopter supported exploration work, including an 8,033 foot drilling program at the properties. Cimarron Resources completed a 3,625 foot drill program at Suitcase in 1997. These programs confirmed both areas as having significant quantities of gold mineralization. Most holes averaged only 100 to 200 feet in vertical depth and the deeper potential of both properties, particularly Mineral Hill with its steep structural controls on gold mineralization, remains to be tested.
None of the Jackson, Suitcase or Mineral Hill deposits are permitted for operation. Permitting will be required before any operation may be contemplated.
EXPLORATION PROPERTIES
Clover, Nevada
The Clover gold exploration property (“Clover”) is situated approximately 42 miles (67.5 kilometers) northeast of Winnemucca in Elko County, north-central Nevada, and consists of 255 unpatented lode claims covering approximately 2,000 acres (810 hectares). Access is via all-weather gravel roads off Nevada State Route 18 and accessed from Interstate 80 at the Golconda exit. Under an agreement dated March 11, 2003, the Company acquired a 100 percent interest in 22 claims on Clover, subject to a three percent NSR royalty. Clover has a fully bonded Plan of Operations permit with the Bureau of Land Management.
The Clover prospect is a low sulfidation epithermal, vein-hosted gold prospect situated along the northern margin of the Midas trough, on the southwest flank of the Snowstorm Mountains. The property is underlain by mid-Miocene aged, bi-modal volcanic rocks on the western margin of the Northern Nevada Rift. These rocks are the stratigraphic equivalents to the units that host bonanza veins in the Midas district.
The Company is seeking a new venture partner to carry out additional exploration at the property.
Sand Creek Uranium Joint Arrangement, Wyoming
In August 2006, the Company and Uranium One Exploration USA Inc, (“Uranium One”) formed the Sand Creek Joint Venture (“Sand Creek JV”). The area of interest for the Sand Creek JV covers an area of approximately 92,000 acres, located east and south of Douglas, Wyoming. In June 2009, the Company entered into a supplemental agreement to the Sand Creek Agreement, which was amended in later periods (“the “Supplemental Agreement”). Under the Supplemental Agreement, Uranium One assumed the role of project manager and may spend up to $1.6 million before June 2014 to increase its interest in the project from 30 percent to 51 percent. As of December 31, 2013, Uranium One reported having spent $1.3 million of the $1.6 million, and having increased their interest to 39.9 percent. At termination or completion of the Supplemental Agreement, the Sand Creek JV will remain effective and the parties’ operating interests will be set in proportion to the amount of their respective expenditures or the 51/49 percent stipulated interest, respectively.
The Sand Creek JV area was identified by the Company and its former joint venture partners during a uranium exploration program in the early 1980s. Since that time a total of 174 drill-holes have been completed totaling approximately 130,000 feet of drilling. Within the program area, uranium drill-hole intercepts, as defined by down-hole gamma logging, identified the potential for multiple uranium roll-front-type uranium deposits. Uranium mineralization in the program area is hosted in the Chadron Formation, which is composed of sandstones, conglomerates, and red to green siltstones and claystones. The sandstones are lenticular in nature and average from five to 20 feet in thickness and occasionally range up to 45-feet in thickness. All of the claims are underlain by the uranium host rocks of the Chadron Formation. This work has confirmed the presence of “roll front” style uranium mineralization. The Company does not control the timing of future drilling operations under the terms of the Sand Creek Supplemental Agreement.
Montana Mineral Rights
Atna owns approximately 0.8 million acres of mineral rights in western Montana. The fee mineral rights underlay surface rights owned by other parties. The lands and mineral rights are comprised primarily of lands assembled in the early 1900s by the former Anaconda Company for their timber and mineral potential. The lands occur in thirteen counties in the mountainous terrain west of the Continental Divide, with most of the lands being located within 50 miles east and west of Missoula, extending to the Idaho State line, and within 60 miles west of Kalispell in northwestern Montana. The mineral rights contain many known occurrences of mineral commodities including gold, silver, copper, barite and phosphate. The Company is in the process of subdividing this package for exploration joint venture or sale.
In February 2011, CR Montana Corporation, a wholly owned Company subsidiary, signed an agreement with the Montana Department of Fish, Wildlife & Parks to sell 29,488 acres of mineral rights in the Fish Creek State Park area for a price of $0.15 million to the State of Montana. The sale was completed November 29, 2012.
Kennecott Exploration Company (KEX) signed a Purchase and Sale Agreement on December 18, 2013 for the purchase of 22,975 acres of mineral rights in Missoula and Granite Counties. KEX will pay at closing $300,000 and will receive as part of the purchase a buy-back right to acquire 1,000 acres of the surface estate. CR Montana Corporation will retain a 1.5 percent NSR on the purchased rights. The due diligence period for this purchase is 90 days, and the purchase is scheduled to close on March 18, 2014.
Blue Bird Prospect, Montana
The Company owns a 100 percent interest in 6 unpatented mining claims (the “Blue Bird Prospect”) in Granite County, Montana located approximately 40 road miles southwest of the town of Phillipsburg, Montana. The Blue Bird Prospect was initially acquired by the Company in January 2013 by claim-staking. The property is located on a sedimentary-hosted copper-silver occurrence similar to the copper-gold mineralization at the Troy, Rock Creek and Montanore deposits located to the northwest in Lincoln County, Montana. Copper-silver mineralization is strataform and hosted by units of the Bonner Formation of the Precambrian Belt Super Group. Anaconda Corporation drill-tested the Blue Bird Prospect in the late-1970s and early-1980s and more recently General Minerals Corporation, which had an option on the property, tested the property. Historic Anaconda drill-hole intercepts include 19 feet grading 1.93 percent copper and 0.88 oz/ton silver. The foregoing historic numbers are being disclosed in reliance on Anaconda Company’s February 1980 drill-hole report and have not been confirmed by a NI 43-101 Technical Report and the Company is not treating these historic numbers as current resources or reserves. The Company is offering this property for joint venture.
Canadian Properties, Yukon and British Columbia
The Wolf polymetallic prospect is located in the Pelly Mountains of southeastern Yukon. The property is currently held as a joint venture with the Company controlling 65.6 percent and Veris Gold Corporation (TSX:VG) controlling 34.4 percent. The Ecstall polymetallic prospect is located in the Skeena Mining District of British Columbia. These two properties are available for joint venture or sale.
CLOSURE PROPERTY
Kendall, Montana
Kendall is located approximately 20 miles north of Lewistown, Montana. Kendall was developed as an open-pit, heap-leach gold mine that operated from 1988 to its closure in 1995. Leaching of the remaining gold in the heap-leach pads continued through early 1998. Kendall produced approximately 302,000 ounces of gold and 136,000 ounces of silver from 1988 through 1998. From 1998 to the present time, the Company has continued with closure activities.
The Kendall permit area covers approximately 1,040 acres of which approximately 448 acres are disturbed. As of December 31, 2013, a total of 432 acres or approximately 97 percent of the disturbed mining area has been reclaimed. CR Kendall has approximately $2.3 million on deposit in an interest-bearing account with the MDEQ for reclamation at Kendall. A further $0.2 million surety bond is also on deposit.
Kendall operated under permits issued by MDEQ and other regulatory agencies. The MDEQ has approved portions of the closure plan related to re-contouring, re-vegetation, drainage and heap dewatering, and heap closure. The Company believes that reclamation earthwork at the site is substantially complete. Water management and treatment at the site will be continued for the foreseeable future.
In April 2012, Kendall entered into an agreement with the MDEQ, whereby Atna agreed to provide financial support to complete a final EIS closure study. As part of this agreement, Kendall submitted on July 25, 2012 an application to the MDEQ providing a final closure and reclamation plan for the Kendall mine site. The MDEQ has performed a completeness review of this plan, and Kendall has prepared responses to this review. The EIS will be managed by the MDEQ in consultation with Kendall. Any costs in excess of the EIS project budget will be shared equally between CRK and the MDEQ. No work has commenced on this study.
As reclamation objectives at Kendall are achieved, parcels of land are being made available for purchase to the general public. In late 2010, 58.4 acres were donated to the Montana Council of the Boy Scouts of America. In 2011, Kendall completed sales of 304.8 acres of reclaimed land in three parcels and in June 2013, approximately 135 acres were sold to private parties. Kendall retains the water rights associated with the sold parcels as well as right-of-access to conduct environmental monitoring and additional reclamation, if required.
Regulatory agencies must give final approval to all closure measures and be satisfied that the mine has met all reclamation requirements. There is no assurance of agency satisfaction with mine closure. Kendall uses internal and external technical and legal experts to monitor and ensure environmental compliance. Atna believes the operation is currently in material compliance with all environmental and safety regulations.
| ITEM 4A. | UNRESOLVED STAFF COMMENTS |
Not applicable.
| ITEM 5. | OPERATING AND FINANCIAL REVIEW AND PROSPECTS |
The following discussion of the results of operations of the Company for the last two years should be read in conjunction with the consolidated financial statements of the Company included in Item 18 - Financial Statements.
The Company’s expenditures were financed in 2013 and 2012 primarily by cash from operations equity financings including the exercise of warrants and options, equipment debt-financings, and proceeds from the sale of investments and assets. The Company restarted Briggs in 2009 and has recognized positive operating cash flows since the fourth quarter of 2010 based on Briggs operations.
The long-term success of the Company depends on the Company continuing to place into production its portfolio of advanced stage exploration and development properties or to discover or acquire additional advanced-stage properties to generate profit and cash flow. The Company substantially completed the first phase of developing Reward in 2012. Reward is fully permitted and the Company expects to commence construction of the Reward mine as gold market conditions improve and financing for new gold projects becomes more readily available. Development of the Pinson-underground mine commenced in early 2012 and mine ramp-up began in late 2012 with increasing development through this period. At the end of June 2013, Pinson-underground was placed on a care and maintenance status until such time that a revised mine plan has been developed and additional financing can be arranged. The Company expects to complete a Pre-Feasibility study of the Mag open-pit mine at Pinson in 2014, after which the Company expects to pursue development and operating permits for that mine.
Most of the Company’s revenues, expenses, assets, and liabilities are denominated in U.S. Dollars, which the Company expects to continue in the foreseeable future. C$2.5 million of a loan denominated in Canadian dollars was repaid in 2013, and the balance of that loan, C$17.5 million, was repaid in January of 2014, leaving little exposure to foreign exchange risks, other than to the extent that currency fluctuations affect gold prices.
The global economy experienced a period of high commodity prices through the end of 2012. Throughout 2013, the global economy experienced a period of severe pullback in commodity prices, causing significant retrenchment and restructuring in the mining industry. This placed significant pressure on mining companies to slow development and to reduce operating and administrative costs, while creating a focus on optimizing existing operations versus constructing new mines. While retrenchment has occurred as a result, the industry is still experiencing a shortage of qualified mining personnel as an aging workforce has chosen retirement over re-employment. This has maintained cost pressures on salaries, while consumable and equipment prices have stabilized.
Results of Operations – Year Ended December 31, 2013 versus Year Ended December 31, 2012
Atna recognized a net loss of $49.6 million, $(0.32) per basic share, in 2013. The loss before income tax was $39.6 million in 2013. These 2013 results compare to a net income of $6.9 million, $0.05 per basic share, for 2012. Income before income tax was $7.1 million in 2012. Significant elements of the $46.7 million decrease in income before income tax and the $56.5million decrease in net income between the two periods are presented below.
| · | Gold and silver revenues decreased $14.7 million, or 25 percent, to $45.0 million in 2013 relative to 2012. Gold ounces sold decreased from 35,641 to 31,683 ounces, an 11 percent decrease, and the average price realized per gold ounce decreased from $1,667 to $1,412, a 15 percent decrease. |
| · | Cost of sales, excluding depreciation and inventory adjustments to net realizable value, decreased $2.2 million, or 6 percent, in 2013. Ounces sold decreased 11 percent, so a net 5 percent increase relates to increased per unit costs. Much of the increase in per unit costs resulted from fixed costs being spread over the decreased ounces sold. Fewer ounces produced and sold resulted from the factors previously discussed in the Briggs-property section. |
| · | Depreciation and amortization within cost of sales decreased $1.1 million, or 13 percent, in 2013 relative to 2012. The units-of-production method of calculating depreciation generally causes depreciation to vary with the ounces sold. Approximately a $0.8 million decrease in recognized depreciation expense resulted in 2013 from less depreciation being reclassified from inventory to cost of sales in the third quarter of 2013 as the depreciation associated with the inventory sold had been diminished by the June 30, 2013 write-down of inventory to its net realizable value. Please see next bullet point. |
| · | In 2013, the Company recognized a write-down of $2.6 million in its inventory carrying-cost, adjusting to net realizable value less estimated costs of completion. There were no similar adjustments in 2012. At June 28, 2013, the London pm fix price was $1,192 per ounce of gold, and as Briggs’ weighted average cost per ounce was greater than this estimated net realizable value less estimated costs of completion, a $1.4 million write-down in the value of the inventory was recognized. At September 30, 2013, the London pm fix price was $1,327 per ounce of gold, and as Briggs’ weighted average cost per ounce was less than this estimated net realizable value less estimated costs of completion, consistent with IFRS guidance, the inventory value was increased by $0.6 million to its updated weighted average cost at that time. As the weighted average cost of the inventory declined in the third quarter of 2013, the adjustment from net realizable value back to weighted average cost was less in absolute terms than the original write-off. As a result, a $0.8 million adjustment to net realizable value remained on the Statement of Operations after the third-quarter 2013. At December 30, 2013, the London pm fix price was $1,205 per ounce of gold, and as Briggs’ weighted average cost per ounce was greater than this estimated net realizable value less estimated costs of completion, a $1.8 million write-down in the value of the inventory was recognized. This $1.8 million write-down of inventories on-hand at year-end plus the $0.8 million net write-down carried forward from prior quarters equals the $2.6 million recognized on the Statement of Operations. |
| · | An impairment loss for non-current assets of $33.1 million was recognized at December 31, 2013, whereas no impairment was recognized in 2012. $30.7 million of the loss was for the impairment of the secondary-mine development at Pinson-underground, and $2.4 million of the loss followed from fair-value adjustments for exploration properties, land, and mineral rights. |
| · | General and administrative expenses changed little between 2013 and 2012. Increased legal and outside-service expenses were offset by the elimination of a few positions and the reduced use of consultants. |
| · | Exploration expenses decreased $1.0 million to $0.7 million in 2013. In 2012, drilling programs were undertaken at Pinson’s Mag open-pit, at Columbia, and at Briggs whereas in 2013, exploration expenses principally were incurred only for continuing studies at Pinson’s Mag open-pit. |
| · | Property maintenance expenses increased from $0 to $1.1 million in 2013, relative to 2012. These expenses principally relate to costs of winding-down Pinson-underground, placing it on care and maintenance at the end of June 2013, and maintaining Pinson-underground in the latter half of 2013. As Reward is a development project on care and maintenance pending financing and market improvements, its maintenance costs were also included in this expense-category in 2013. |
| · | The provision for site restoration decreased $1.0 million to a recovery of $0.6 million in 2013 due principally to the determination of lower estimated future costs for the reclamation of the Briggs mine. |
| · | Interest expense increased $2.1 million to $3.4 million for 2013 principally as interest was no longer capitalized to Pinson-underground development after that project was placed on care and maintenance in June of 2013. Interest expense also includes the amortization of loan discounts and in the fourth quarter of 2013 the write-off of the Sprott loan-amendment costs of $1.1 million. As noted in the Supplemental disclosures of cash flow information with the 2013 Financial Statements, interest paid decreased from $2.8 million in 2012 to $2.4 million in 2013. |
| · | The realized and unrealized gains and losses on derivatives increased income by $0.9 million in 2013, whereas in 2012 they decreased income by $0.8 million, an increase in income of $1.7 million. The influence of period-end gold prices on the embedded forward derivatives in the 2009 Gold Bonds drove these gains and losses. In 2013, a realized loss of $0.2 million and an unrealized gain of $1.1 million were recognized for changes in the market value of the embedded 2009 Gold Bond derivatives. The 2009 Gold Bonds were retired, inclusive of the closure of their derivative elements, in December 2013. |
| · | Losses on the disposal of assets aggregated $0.3 million in 2013, little change from results in 2012. In 2013, losses on disposals were principally related to disposals of mineral rights. In 2012, losses on disposals were principally related to early disposals of a haul-truck engine and pond netting. |
| · | A loss of $0.1 million was realized in 2013 on the sale of investments, whereas a gain of $0.1 million was realized in 2012 on the sale of investments. |
| · | In 2013, Other income was $0.6 million consisting principally of recoveries in excess of basis from insurance claims and from the sale of an exploration property. In 2012, Other income was $0.3 million and included a gain of $0.2 million realized as a result of an insurance settlement. |
| · | In 2013, income tax expense was $10.0 million consisting of a $0.3 million current recovery and a $10.3 million deferred tax expense. During 2013, the Company updated and recognized reductions of $10.3 million in its deferred tax assets (“DTA”) attributable to its US net operating loss carryforwards and all other sources. As development efforts have been suspended for the time being for Pinson and Reward and until the timing and magnitude of future taxable profits becomes clearer, the Company determined that there is not a sufficient probability that future taxable profits will be available to utilize tax loss carryforwards and deductible temporary differences. In 2012, current tax expense was $0.1 million and deferred tax expense was $0.1 million. |
As of December 31, 2013, cash and cash equivalents were $0.8 million, a decrease or net use of $18.5 million since December 31, 2012. The significant elements underlying the net decrease in cash in 2013 are presented below with comparisons to 2012.
| · | A stock offering in Third Quarter 2013 netted $5.3 million, used principally for general corporate purposes and to pay for development at Pinson. A stock offering in Third Quarter 2012 netted $16.3 million. The proceeds of this stock offering were principally used toward the development of Pinson-underground. |
| · | In 2013, $26.4 million was used for mine development and to acquire capital equipment principally at Pinson ($20.6 million) and Briggs ($5.1 million). In 2012, $21.7 million was used for mine development and to acquire capital equipment principally at Pinson ($16.7 million) and Briggs ($3.4 million). |
| · | Additionally, $1.2 million of interest-paid was capitalized for Pinson in 2013 whereas in 2012, $2.2 million of interest-paid was capitalized for Pinson. |
| · | In 2013, $6.5 million was received for Pinson ore shipments, while Pinson was in development, reducing net capital spending. In 2012, the equivalent figure for ore shipments was $1.4 million. |
| · | In 2013, $3.2 million was expended on stripping activity assets at Briggs whereas in 2012, $0.5 million was expended. |
| · | $0.4 million was received in 2013 and also in 2012 from insurance settlements for pre-mature mechanical-failure claims. |
| · | $8.3 million was provided by operations in 2013, inclusive of a $4.0 million decrease in working capital / source of funds. This compares to $13.6 million provided by operations in 2012, inclusive of a $2.4 million increase in working capital / use of funds. The $5.3 million decrease in cash flows from operations principally resulted from decreased revenues of $14.7 million, offset to a large degree by the $6.4 million change in working capital and a $3.0 million net decrease in cash-costs. |
| · | $9.6 million of cash was used for the scheduled repayments of notes, the 2009 Gold Bonds, and capital leases in 2013 compared to $5.6 million used for debt repayments in 2012. |
| · | Minor quantities of warrants and options were exercised in 2013, whereas warrants and options exercised in 2012 contributed $6.3 million. |
| · | In 2013 and 2012, $0.6 million and $0.4 million, respectively, were provided by decreasing reclamation-bond security deposits in turn related to decreased collateral requirements by a surety, net of new bonding requirements. |
| · | In 2013 and 2012, less than $0.1 million and $0.8 million, respectively, were provided through the sale of investments. |
| · | The disposition of various property and equipment provided $0.7 million and $0.1 million in 2013 and 2012, respectively. |
Results of Operations – Year Ended December 31, 2012 versus Year Ended December 31, 2011
Atna generated net income of $6.9 million, $0.05 per basic share, in 2012. Income before income tax was $7.1 million in 2012. These 2012 results compare to a net income of $15.1 million, $0.14 per basic share, for 2011. Income before income tax was $6.0 million in 2011. Significant elements of the $1.1 million increase in income before income tax and the $8.2million decrease in net income between the two periods are presented below.
| · | Gold and silver revenues increased $8.0 million, or 15 percent, to $59.8 million in 2012 relative to 2011. Gold ounces sold increased from 32,371 to 35,641 ounces, a 10 percent increase, and the average price realized per gold ounce increased from $1,588 to $1,667, a 5 percent increase. |
| · | Cost of sales, excluding depreciation, increased $5.5 million, or 18 percent, in 2012. Ounces sold increased 10 percent, so a net 8 percent increase relates to increased per unit costs. Ore-mining productivity decreased in the fourth quarter of 2012 due to sequencing issues in accessing ore, including: reduced working space in the bottom of the Main pit, the unusual presence of water in the Main pit, and the narrow approach to and bottleneck in the Goldtooth North Pit. Costs per unit increased in 2012 as a result of the secondary crusher outage; an unusual cycling of high-cost wear items, primarily tires and conveyor belts; relocation and repair of the leach pad stacking system; and increasing diesel fuel prices. Stripping activities are capitalized to the extent that they exceed an expected average stripping ratio for each pit / component, but these costs are not later reported as depreciation but rather as cost of sales, excluding depreciation, when underlying minerals are mined. Hence, $3.1 million of cost of greater-than-average stripping activities in years prior to 2012 were carried forward into the 2012 inventory and cost of sales. |
| · | Depreciation and amortization within cost of sales increased $0.5 million, or 7 percent, in 2012 relative to 2011. The units-of-production method of calculating depreciation generally causes depreciation to vary with the ounces sold. The increase in depreciation was not as great as the increase in ounces sold due largely to a declining / older asset base at Briggs. |
| · | General and administrative expenses increased $0.4 million, or 8 percent, to $4.8 million in 2012 due to legal and consulting support, slightly higher levels of staff, and Sarbanes-Oxley compliance audit fees. |
| · | Exploration expenses increased $1.1 million to $1.7 million in 2012 due to drilling programs at Pinson open-pit and Columbia that will contribute to Feasibility Studies for those sites and at Briggs. Much of the drilling at Briggs and Reward in 2011 was capitalized. |
| · | The provision for site restoration increased $0.5 million to $0.4 million in 2012 due to an increase in estimated future reclamation costs at Kendall. |
| · | Interest expense decreased $1.0 million, or 42 percent, to $1.3 million for 2012 principally as the result of the retirement of scheduled portions of the 2009 Gold Bonds and capitalization of interest associated with the Pinson project. |
| · | The realized and unrealized gains and losses on derivatives decreased income by $0.8 million in 2012, whereas in 2011 they decreased income by $1.9 million, an increase in income of $1.1 million. The influence of period-end gold prices on the embedded forward derivatives in the 2009 Gold Bonds drove these gains and losses |
| · | Gains and losses on the disposal of assets decreased income by $0.9 million in 2012 relative to 2011. In 2012, losses on disposals aggregated $0.4 million, principally related to early disposals of a haul-truck engine and pond netting. In 2011, the Atlanta property in Nevada and miscellaneous other properties were sold, resulting in gain of $0.6 million. |
| · | In 2012, other income included a gain of $0.2 million realized as a result of an insurance settlement of $0.4 million for the principal property damage claim related to the pre-mature failure of the secondary crusher. While operations were diminished by the subject failure, they were not interrupted for a period of sufficient duration to validate a business-interruption claim. |
| · | 2012 current tax expense was $0.1 million and deferred tax expense was $0.1 million. 2011 net income included a one-time $9.5 million deferred tax benefit, recognized principally in expectation of being able to use more of Atna’s past NOL’s in future years. This was partially offset by a $0.4 million current tax liability for 2011, resulting in a net $9.1 million income tax benefit. |
As of December 31, 2012, cash and cash equivalents were $19.3 million, an increase of $9.4 million since December 31, 2011. The significant elements underlying the net increase in cash in 2012 are presented below with comparisons to 2011.
| · | A stock offering in Third Quarter 2012 netted $16.3 million. The proceeds of the stock offering were principally used toward the development of Pinson-underground. In 2011, a new debt obligation contributed $20.1 million; $15.0 million of this cash being used in 2011 toward the acquisition of a 100 percent ownership interest in Pinson. |
| · | $21.7 million was used for mine development and to acquire capital equipment principally at Pinson ($16.7 million) and Briggs ($3.4 million) in 2012 while $9.9 million was used principally at Briggs and Pinson in 2011. |
| · | Additionally, $2.2 million of interest was capitalized for Pinson in 2012 whereas $0.7 million of interest was capitalized for Pinson in 2011. |
| · | In 2012, $1.4 million was received for Pinson ore shipments, while Pinson was in development, reducing net capital spending. |
| · | In 2012, $0.5 million was expended on stripping activity assets at Briggs whereas $4.0 million was expended on stripping activity assets in 2011. |
| · | $0.4 million was received in 2012 as an insurance settlement for the principal claim related to the mechanical failure of the secondary crusher at Briggs in June of 2012. |
| · | $13.6 million was provided by operations in 2012, inclusive of a $2.4 million increase in working capital, compared to $15.5 million provided by operations in 2011, inclusive of a $1.1 million decrease in working capital. The $1.9 million decrease in cash flows from operations principally resulted from the $3.5 million aggregate increase/change in working capital in turn largely resulting from inventory build-ups at Briggs. |
| · | $5.6 million was used for the scheduled repayments of notes, 2009 Gold Bonds, and capital leases in 2012 compared to $6.0 million used for debt repayments in 2011. |
| · | Warrants and option exercised in 2012 contributed $6.3 million whereas warrants and options exercised in 2011 contributed $0.2 million. |
| · | In 2012, $0.4 million was provided by decreasing reclamation-bond security deposits in turn related to decreased collateral requirements by a surety, net of new requirements. In 2011, $0.7 million was used principally for Pinson’s reclamation bond. |
| · | In 2012, $0.8 million was provided through the sale of investments while proceeds from the sale of investments in 2011 contributed $0.5 million. |
| · | Disposition of property provided $0.1 million in 2012. In 2011, $0.5 million was provided through the sale of the Atlanta property. |
| · | Other changes in cash flows in 2012 netted $0.1 million in contributions and in 2011 netted $0.1 million in uses. |
| B. | Liquidity and Capital Resources |
Atna expects that cash requirements over the next 12 months can be met through a combination of a debt refinancing that occurred in January 2014; cash flow from the Briggs operations; equipment financing; asset sales; and existing cash. Supplemental financing, if required, may be generated from the issuance of debt; equity; new lines of credit; asset sales; or combinations thereof. The Company’s 2014 budget and recent forecasts indicate that supplemental financing will not be required; however, this is principally contingent upon Briggs realizing operating cash flow targets. Funding requirements could be significantly affected by the future price of gold and any unforeseen, prolonged production disruptions at Briggs. Capital is not currently adequate to undertake significant development programs, however drilling and development projects at Reward, Pinson-underground, Mag open-pit, and Columbia may be undertaken as funds become available.
As of December 31, 2013, the Company had a net working capital (current assets less current liabilities) deficit of $7.0 million, however $22.0 million of working capital was subsequently drawn in January of 2014 through a long-term note to refinance current obligations. Current assets as of December 31, 2013 included recoverable, in-process gold inventories of approximately 18,100 ounces at Briggs.
Past cash requirements were met through the use of a combination of operating cash flows, asset sales, and debt and equity financings. In August 2011, the Company arranged a C$20 million line of credit with Sprott to finance the acquisition of the remaining 70 percent interest of Pinson. In September 2011, the Company acquired the remaining 70 percent of Pinson for 15 million shares of common stock, $15 million in cash, and other consideration. In February of 2012, the term of the C$20 million credit facility with Sprott was extended into 2013; and in the first and fourth quarters of 2013, the term of the remaining credit facility of C$17.5 million with Sprott was extended into 2014. In January 2014, the Company entered into a $22.0 million credit facility with Waterton Precious Metals Fund II Cayman, LP (“Waterton”). The Company used this new credit facility to pay the current liability due Sprott of approximately C$18.1 million under the Company’s existing secured credit facility, and the balance was used for general working capital purposes including a reduction in trade payables. In September of 2012, the Company completed a C$17.25 million equity offering, principally to complete funding for the Pinson-underground mine development. In September 2013, the Company closed a C$5.8 million bought-deal private placement of equity netting $5.3 million in proceeds, principally used for strengthening working capital, paying for Pinson-underground development, and general corporate purposes.
As a result of the debt refinancing in January of 2014, whereby payment of $22.0 million of current obligations was deferred until January of 2016, the principal use of funds anticipated within the next 12 months is the accumulation of cash to fund repayment of this debt in two years and to fund the future development of several existing properties. The 2009 Gold Bonds obligation was repaid in full in 2013. The debt with Sprott , including C$17.5 million of principal, was pre-paid in January 2014 via the referenced refinancing. Development of several existing properties is on hold pending additional engineering, improvements in the gold market, and the availability of additional financing.
With Briggs as Atna’s only operating mine in 2013 and in 2012, net cash provided by operating activities was $8.3 million and $13.6 million, respectively. Briggs sold 31,683 ounces of gold in 2013 at an average price of $1,412 and sold 35,641 ounces of gold in 2012 at an average price of $1,667. As mining progresses in the Goldtooth South Pit in the first half of 2014, average ore grades are expected to increase as mining continues to depth in the high-grade Goldtooth pits. This expectation of increased ore grade is driving a higher gold production forecast for 2014 when Briggs is expected to sell 40,000 to 45,000 ounces of gold. Pioneering work has also commenced on the Briggs Main North Pit to provide additional ore in the second half of 2014. In 2014, Briggs is budgeted to crush and place on the leach pad approximately 2.8 to 3.0 million tons of ore containing 60,000 to 70,000 ounces of gold. The waste stripping ratio is projected to be 3.6 tons of waste per ton of ore. As costs are believed to be largely fixed over a relevant range of mining and processing activities/ounces, the increased production and sales ounces expected should result in a proportional reduction in the cash cost per ounce and increased profitability. Briggs capital spending in 2014 is expected to be between $3.6 million and $4.2 million, inclusive of equipment rebuilds expected to be financed through financing leases.
Financing Transactions
Equity Issuance: On September 24, 2013, the Company completed a bought-deal private placement conducted by Dundee Securities Ltd. and Sprott Private Wealth LP by issuing 36.4 million common shares for gross proceeds of C$5.8 million and net proceeds of $5.3 million.
On September 12, 2012, the Company completed a short-form prospectus financing and issued 17.25 million common shares for gross proceeds of C$17.25 million and net proceeds of C$16.0 million. In addition, the Company issued a total of 1,035,000 brokers’ warrants with an exercise price of C$1.00 and an eighteen-month term. The warrants were determined to have a fair value at the time of issuance of C$0.3 million.
In 2012, the Company issued 8.5 million shares upon the exercise of outstanding warrants at C$0.70 per share providing $6.0 million and issued 1.3 million shares upon the exercise of vested options providing $0.3 million. No warrants and few options were exercised in 2013. Options and Restricted Stock Units (“RSU’s”) are granted and issued in accordance with the Company’s compensation plans. Exercises of warrants and options and issuances of RSU’s are summarized in the table below for 2013 and 2012.
In connection with extensions and amendments to the Sprott Loan, the Company in 2013 issued 7.2 million shares with a value of $1.5 million for fees and in 2012 issued 0.6 million shares for fees with a value of $0.6 million.
A roll forward of the Company’s common shares outstanding during 2013 and 2012 follows.
| | | Number of Shares | |
| | | December 31, | | | December 31, | |
| | | 2013 | | | 2012 | |
| Balance, beginning of the period | | | 144,989,922 | | | | 117,374,643 | |
| Sprott credit agreement and amendments | | | 7,237,740 | | | | 618,556 | |
| Warrant exercises | | | - | | | | 8,459,911 | |
| Option exercises | | | 150,544 | | | | 1,286,812 | |
| Restricted shares | | | 1,143,938 | | | | - | |
| Equity Offerings | | | 36,400,000 | | | | 17,250,000 | |
| Balance, end of the period | | | 189,922,144 | | | | 144,989,922 | |
As of March 14, 2014; 190,280,597 common shares were outstanding.
Subsequent to year-end 2013, in January 2014, as part of the consideration for structuring a new credit facility, Atna, after receipt of approval from the TSX, issued to Waterton 10,000,000 non-transferable common share purchase warrants (the “Lender Warrants”). Each Lender Warrant entitles Waterton to acquire one common share of the Company at an exercise price of C$0.25 per common share for a period of three years expiring on January 31, 2017. The Lender Warrants are subject to a four-month hold period in Canada.
Debt:In 2013 and 2012, capitalized leases and equipment-financing notes of $5.8 million and $3.2 million, respectively, were issued for mining equipment. In 2013 and 2012, principal repayments for capitalized leases and equipment-financing notes aggregated $3.5 million and $1.9 million, respectively.
In February of 2012, March of 2013, and October of 2013, Atna and Sprott agreed to amend and extend the existing C$20 million credit facility, such facility having been reduced to C$17.5 in February of 2013 via a C$2.5 million repayment. The $1.1 million balance of capitalized loan origination and amendment fees related to the Sprott Loan were written-off to interest expense in December of 2013 in the expectation of closing the credit facility next described.
On January 31, 2014, the Company entered into a $22.0 million credit facility agreement (the “Agreement”) with Waterton Precious Metals Fund II Cayman, LP (“Waterton”). The Company used this new credit facility to pay the current liability due Sprott of approximately C$18.1 million under the Company’s existing secured credit facility, and the balance for general working capital purposes including a reduction in trade payables. Under the terms of the Agreement, the credit facility is a non-revolving, senior secured facility, that bears interest at a coupon-rate of 10% per annum and matures on the earlier of (i) the date that is 24 months following the date of the Agreement (or if the facility has been accelerated in the event of a default, the date on which Waterton demands repayment), and (ii) the date all amounts owing under the credit facility are voluntarily or mandatorily prepaid in full, without a repayment penalty. On the maturity date, Atna will pay to Waterton (i) a cash fee equal to 5% of the credit facility, and (ii) if the payment date occurs on or after the first anniversary of the date of the Agreement, the Company will pay an additional cash fee equal to 5% of the credit facility less any prepayments made during the first 12 months of the Agreement. As consideration for structuring the credit facility, Atna paid to Waterton a cash structuring fee of US$440,000 and issued to Waterton 10,000,000 non-transferable common share purchase warrants, previously described.
Assets owned by Atna in Canyon Resources Corp. (CRC) and assets owned by CRC in CR Briggs Corporation, CR Montana Corporation, CR Reward Corporation, and Atna Resources Inc. were pledged as security against the Waterton Loan. Covenants restrict equipment financings to $12 million, preclude the issuance of new debt, except for Permitted Debt, and require Waterton’s consent for material asset sales. The loan origination costs were capitalized and will be amortized over the minimum contractual life of the loan facility.
2009 Gold Bonds Payable: On December 9, 2009, the Company closed a private placement of $14.5 million of Gold Bonds (the “2009 Gold Bonds”). The 2009 Gold Bonds matured and were retired in December 2013. The 2009 Gold Bonds had an annual interest rate of 10 percent and were redeemed in quarterly installments, each equivalent, inclusive of their derivative element, to the market value of 814 ounces of gold per quarter based on a closing gold price ten trading days prior to the end of each quarter.
The Company recorded an initial discount on the 2009 Gold Bonds of $1.8 million. The discount was comprised of $1.2 million of transaction costs associated with the 2009 Gold Bonds and the $0.6 million initial fair value of the embedded derivative. The embedded derivative called for the forward sale of 814 ounces of gold per quarter through December 31, 2013 at a price of $1,113, the spot price of gold at the time the bonds were issued. The fair value of the embedded derivative fluctuated with changes in the forward price of gold. The initial fair value of the embedded derivative was discounted at the Company’s assumed borrowing rate of 12 percent. Principal repayments, exclusive of the derivative elements, were $3.6 million both 2013 and 2012. Other financial metrics related to the 2009 Gold Bonds follow.
| | | As of December 31, | | | As of December 31, | |
| | | 2013 | | | 2012 | |
| Current gold bond derivative liability | | $ | - | | | $ | 1,733,500 | |
| Long-term gold bond derivative liability | | | - | | | | - | |
| Total gold bond derivative liability | | $ | - | | | $ | 1,733,500 | |
| | | | | | | | | |
| Current gold bond liability | | $ | - | | | $ | 3,494,800 | |
| Long-term gold bond liability | | | - | | | | - | |
| Total gold bond liability | | $ | - | | | $ | 3,494,800 | |
| | | Twelve Months 2013 | | | Twelve Months 2012 | |
| Realized loss on gold bond derivatives | | $ | (197,000 | ) | | $ | (1,865,300 | ) |
| Unrealized gain on gold bond derivatives | | $ | 1,080,800 | | | $ | 1,111,700 | |
| Interest on gold bond liabilities | | $ | (226,600 | ) | | $ | (589,100 | ) |
| Bond discount amortized as interest expense | | $ | (130,200 | ) | | $ | (338,600 | ) |
Investing Transactions
Disposition of Assets: In 2013 and 2012, the Company received less than $0.1 million and $0.8 million, respectively, in cash for investments sold. The investments sold were principally stock in other mining companies acquired in exchange for joint venture or property option interests.
In 2013 and 2012, the Company received $0.7 million and $0.1 million, respectively, in cash for property and equipment sold. Principally, the sales were of redundant equipment. In 2013, the Company received $0.4 million from settlements of two insurance claims related to pre-mature mechanical failures of crushing equipment and $0.6 million from the reduction in collateral for reclamation surety bonds.
In 2012, the Company received $0.4 million from the settlement of an insurance claim related to the pre-mature mechanical failure of the secondary crusher at Briggs and $0.4 million from the reduction in collateral for reclamation surety bonds.
Capital Expenditures: Cash expended for mine development and capital purchases in 2013 and 2012 was $26.4 million and $21.7 million, respectively. These capital expenditures were principally for development of Pinson-underground in both years, stripping of the Goldtooth South pit at Briggs in 2013, and crusher improvements at Briggs in 2012. Additionally, in 2013 and 2012, capitalized interest of $1.2 million and $2.2 million, respectively, were paid for financing and development of Pinson-underground. Capital spending was reduced by $6.5 million and $1.4 million, respectively in 2013 and 2012, as a result of ore sales by Pinson-underground. $3.2 million was expended in 2013 for stripping activity assets at Briggs, whereas $0.5 million was expended in 2012.
Capital expenditures are approved for expenditure by the Company on a case-by-case basis, and capital spending may be modified over time based on judgments as to potential benefits, project requirements and the availability of funds.
Outstanding Warrants
The following table summarizes warrants outstanding as of December 31, 2013.
| | | Remaining | | | | | | Underlying | |
| Expiration Date | | Life in Years | | | Exercise Price | | | Shares | |
| | | | | | | | | | |
| March 11, 2014 | | | 0.2 | | | CAD$ | 1.00 | | | | 1,035,000 | |
As of the reporting date, March 14, 2013; none of the above 1,035,000 warrants had been exercised and all had expired. As previously described, 10,000,000 non-transferable common share purchase warrants were issued to Waterton in January 2014.
Surety Bonds
All surety bonds are subject to annual review and adjustment. Additional permitting, extension of mine life, areas of mining activity and changes in the regulatory environment affect surety requirements.
Briggs operates under permits granted by various agencies including the BLM, Inyo County, California, the California Department of Conservation, and the Lahontan Regional Water Quality Control Board. The Company has posted reclamation bonds and cash with these agencies in the amount of $4.4 million of which $4.3 million are reclamation bonds supported by a surety. Restricted cash held as collateral by the surety and a government agency amounts to $1.3 million.
The total bonding requirement for Reward was determined to be $6.2 million. In July 2010, the Company posted with the State of Nevada an initial bond backed by surety of $0.9 million to cover development activities that include the installation of fencing, site road improvements, in-fill drilling, water wells and related pipelines, other earthwork and installation of power lines and facilities. The Company has placed $0.3 million into a collateral account related to the surety bond. The remaining $5.3 million in bonding is not expected to be required until mine development is continued.
The total bonding requirement for Pinson is roughly $1.7 million of which Atna has already placed one bond of $0.8 million. The Company has placed $0.2 million into a collateral account related to the surety bond. The remainder of the bonds, approximately $0.9 million, is pending review Federal and State agencies, and is expected to be placed in 2014.
The Company has on deposit with the MDEQ $2.3 million in an interest-bearing account for reclamation at the Kendall Mine. The Company placed an additional bond of $0.2 million with the MDEQ in 2012 as a special purpose bond in connection with the 2011 approval of the final leach pad capping plan. The surety of the latter bond is holding $0.1 million in collateral.
Columbia and Clover, combined, have placed another $0.2 million in reclamation bonds and have approximately $0.1 million in collateral on deposit with the surety.
| C. | Research and Development, Patents and Licenses, etc. |
Not applicable.
| | | | | | | | | Percent | |
| | | | | | | | | Increase | |
| | | 2013 | | | 2012 | | | (Decrease) | |
| Revenues | | $ | 45,035,100 | | | $ | 59,763,300 | | | | -25 | % |
| Impairments & adjustments to net realizable value | | $ | 35,685,700 | | | $ | - | | | | N/A | |
| All other operating expenses | | $ | 46,598,000 | | | $ | 50,609,500 | | | | -8 | % |
| Operating (loss) income | | $ | (37,248,600 | ) | | $ | 9,153,800 | | | | -507 | % |
| Interest and Other expenses | | $ | 2,342,700 | | | $ | 2,074,200 | | | | 13 | % |
| Income tax expense | | $ | 10,028,300 | | | $ | 193,600 | | | | 5080 | % |
| Net (loss) income | | $ | (49,619,600 | ) | | $ | 6,886,000 | | | | -821 | % |
| Operating cash flow | | $ | 8,307,100 | | | $ | 13,590,500 | | | | -39 | % |
| | | | | | | | | | | | | |
| Tons mined | | | 11,625,400 | | | | 8,515,300 | | | | 37 | % |
| Gold ounces mined | | | 41,000 | | | | 45,900 | | | | -11 | % |
| Gold ounces produced | | | 31,700 | | | | 36,900 | | | | -14 | % |
| Gold ounces sold | | | 31,700 | | | | 35,700 | | | | -11 | % |
| | | | | | | | | | | | | |
| Gold price per Ounce sold | | $ | 1,412 | | | $ | 1,667 | | | | -15 | % |
| Cash cost per Ounce sold | | $ | 1,042 | | | $ | 985 | | | | 6 | % |
Briggs was the Company’s only operating mine in 2013 and 2012. The ounces of gold sold by Briggs decreased by 11 percent in 2013, principally due to lower levels of ore production resulting from a focus on a capitalized stripping campaign in the first five months of 2013, noticeable in part by the 37 percent increase in total tons mined. The Company suffered from decreasing gold prices in 2013, the average price having fallen 15 percent. Overall, operating expenses decreased 8 percent, exclusive of impairments of non-current assets and inventory adjustments to net realizable value. Consistent with the decreasing gold price and a generally depressed market for mining properties, impairments of $33.1 million were recognized and inventory values were written-down $2.6 million. A $10.0 million tax expense principally resulted from a write-off of deferred tax assets related to expected future profits for properties for which development has been delayed. Operating cash flows declined 39 percent to $8.3 million, but remained positive.
As mining progresses at Briggs in the first half of 2014, average ore grades are expected to increase as mining continues to depth in the high-grade Goldtooth pits. This expectation of increased ore grade is driving a higher gold production forecast for 2014 when Briggs is expected to sell 40,000 to 45,000 ounces of gold. Pioneering work has also commenced on the Briggs Main North Pit to provide additional ore in the second half of 2014. In 2014, Briggs is budgeted to crush and place on the leach pad approximately 2.8 to 3.0 million tons of ore containing 60,000 to 70,000 ounces of gold. The waste stripping ratio is projected to be 3.6 tons of waste per ton of ore.
Key development activities planned for 2014 include completion of a Pre-Feasibility study for the Mag open pit mine at Pinson, modifying the underground mine plan at Pinson based on experience gained in 2013, and completing detailed engineering for Reward so that the project is ready for the commencement of construction. The Company believes these activities will provide a long term pipeline of development opportunities. Additionally, the Company will engage in reserve-expansion-studies at Briggs to endeavor to extend mine life, inclusive of pit-expansion through cost reductions and through exploration of the potential of underground mining
Diesel fuel is and will continue to be a significant operating and reclamation expense. Prices and costs for supplies, maintenance-parts, and equipment seem to have stabilized in 2014, but did not decline significantly. The Company expects the cost of retaining qualified mining personnel to continue to escalate.
| E. | Off-Balance Sheet Arrangements |
As of December 31, 2013 and December 31, 2012, the Company had no outstanding off-balance sheet arrangements.
| F. | Tabular Disclosure of Contractual Obligations |
The Company’s material undiscounted contractual obligations as of December 31, 2013 follow.
| | | | | | Payments due by Period as of December 31, 2013 | |
| | | | | | Less than | | | | | | | | | More than | |
| | | Total | | | 1-year | | | 1-3 years | | | 4-5 years | | | 5-years | |
| Long term debt obligations | | | 19,006,900 | | | $ | 1,148,700 | | | $ | 17,858,200 | | | $ | - | | | $ | - | |
| Finance lease obligations | | | 5,842,800 | | | | 2,136,100 | | | | 3,706,700 | | | | - | | | | - | |
| Operating lease obligations | | | 289,000 | | | | 145,200 | | | | 143,800 | | | | | | | | - | |
| Asset retirement obligations | | | 7,517,300 | | | | 478,700 | | | | 1,251,600 | | | | 1,054,000 | | | | 4,733,000 | |
| | | | | | | | | | | | | | | | | | | | | |
| Total | | $ | 32,656,000 | | | $ | 3,908,700 | | | $ | 22,960,300 | | | $ | 1,054,000 | | | $ | 4,733,000 | |
Based on subsequent events, specifically a refinancing of the C$17.5 million otherwise due Sprott in 2014, this table includes the reclassification of $16.4 million from the ‘Less than 1-year’ column to the ‘1-3 years’ column.
| ITEM 6. | DIRECTORS, SENIOR MANAGEMENT AND EMPLOYEES |
| A. | Directors and Senior Management |
Names, state or province of residence, offices and principal occupations of the members of the board of directors of the Company (the “Board”) and senior executives of the Company are as follows.
Name and Municipality of Residence | | Office held with the Company | | Director or Officer since | | Other Principal Directorships | | Principal Occupation |
David H. Watkins(3) British Columbia, Canada | | Chairman and Director | | March 2000 | | EURO Ressources SA, Golden Minerals Company, Argonaut Gold Inc., Commander Resources Ltd., Bearing Resources Ltd. Camino Minerals Corporation & Rio Novo Gold Inc. | | Director |
Glen D. Dickson(1,2) British Columbia, Canada | | Director | | December 2002 | | Venerable Ventures Ltd. | | Retired |
David K. Fagin(1,3) Colorado, United States | | Director | | March 2008 | | None | | Investor |
| Christopher E. Herald(2,4)Colorado, United States | | Director | | August 2009 | | Solitario Exploration and Royalty Corp. | | President and Chief Executive Officer of Solitario Exploration and Royalty Corp. |
Ronald D. Parker(2,4) Missouri, United States | | Director | | March 2008 | | None | | Retired |
Paul H. Zink(1,3) Colorado, United States | | Director | | April 2011 | | None | | Senior Vice President and Chief Financial Officer, Rare Element Resources Ltd. |
James K. B. Hesketh(4) Colorado, United States | | President, Chief Executive Officer and Director | | September 2001 | | None | | President & Chief Executive Officer of the Company |
William R. Stanley Arizona, United States | | Vice President Exploration | | January 2004 | | None | | Vice President Exploration of the Company |
| Rodney D. Gloss Colorado, United States | | Vice President and Chief Financial Officer | | October 2011 | | None | | Vice President & Chief Financial Officer of the Company |
Daniel Saint Don(5) Colorado, United States | | Vice President and Chief Operating Officer | | January 2013- December 2013 | | None | | Vice President & Chief Operating Officer of the Company |
| (1) | Member of the Audit Committee. |
| (2) | Member of the Compensation Committee. |
| (3) | Member of the Nomination and Corporate Governance Committee. |
| (4) | Member of the Health Safety and Environment Committee. |
| (5) | Mr. Saint Don’s contract was not renewed on January 1, 2013 due to reduced development activity. |
Each director shall, unless he resigns or his office becomes vacant for any reason, hold office until the close of the next annual meeting of shareholders or until his successor is elected or appointed.
There are no family relationships between any of the directors and officers of Atna.
There are no arrangements or understandings with major shareholders, customers, suppliers or others, pursuant to which any person referred to above was selected as a director or member of senior management.
The business experience, functions and areas of experience of each director and officer, including activities performed outside the Company, are as follows:
David H. Watkins, 69, has been a Director of the Company since 2000, he was appointed Executive Chairman in January 2009 and he stepped down as Executive Chairman becoming Chairman on July 1, 2010. Mr. Watkins has over 40 years experience in exploration, development, and mining operations. During the early part of his career, he served as exploration geologist for Newmont and Noranda. He later joined Falconbridge Copper Ltd. as an Exploration Geologist and rose to Chief Geologist responsible for exploration in Quebec and mine operations at Lake Dufault and Opemiska. Mr. Watkins was appointed Vice President, Exploration in 1986 and later became President of Minnova Inc., the successor company to Falconbridge Copper. Mr. Watkins served as President of Cyprus Exploration and Development Corporation and Senior Vice President, Exploration for Cyprus Amax Minerals Company for six years prior to joining Atna in 1999. Mr. Watkins served as President and CEO of Atna from 1999 to 2008.
Glen D. Dickson, 64, has been a Director of the Company since 2002. Mr. Dickson obtained his B.Sc. (Advanced) degree in Geology in 1974 and has been involved in mineral exploration continuously since then with a variety of Canadian major and junior exploration companies.Mr. Dickson served as Senior Geologist with Asamera Minerals Inc. from 1987 to 1992, and later served as President and Chief Executive Officer of Cumberland Resources Ltd from 1993 through 2002. Most recently, Mr. Dickson was the Chief Executive Officer and Director of Gold-Ore Resources Ltd., until it merged with Elgin Mining Inc. on April 30, 2012. Mr. Dickson served as a Director of Elgin Mining Inc. through May 22, 2013.
David K. Fagin,75, was appointed a Director of the Company on March 18, 2008. From 1992 to 1996, he served as Chairman and CEO of Golden Star Resources Ltd. and then as non-executive Chairman for an additional two years. From 1997 to 2000, he served as Chairman and CEO of Western Exploration and Development Ltd., and later as consultant and Corporate Director. Mr. Fagin has served as President and Director of Homestake Mining Company, Rosario Resources Corporation, and as Vice President of AMAX Inc. He served as a Director of Pacific Rim Mining Ltd. until November 27, 2013.
Christopher E. Herald, 60, joined the Board in August 2009. He has over 30 years of experience in the mining industry and has been President and CEO and a Director of Solitario Exploration and Royalty Corporation since 1992. He was instrumental in discovering the 1.5 million ounce high-grade Buckhorn Mountain Gold deposit for Crown Resources and its subsequent sale to Kinross Gold for approximately $240 million in 2006. Chris was also responsible for the initial exploration successes of the 1.5 million ounce Kettle River open pit and underground deposits. During his career, he has held various positions in Anaconda Minerals, Echo Bay Mines, Crown Resources, and as Chairman of The Denver Gold Group.
Ronald D. Parker, 63, was appointed a director of the Company on March 18, 2008. From 2002 to 2012, Mr. Parker served as President and CEO of Gammill Inc, a manufacturing company. From 1998 to 2002, he served as President and CEO of Apollo Gold Inc. Mr. Parker has held several positions with Homestake Mining Company and its subsidiaries including Vice President of Homestake Mining Company, President of Homestake Canada, Inc., President of Prime Resources Group, Inc. and General Manager of the McLaughlin Mine.
Paul H. Zink, 58,joined the Company's board in April, 2011. Paul was appointed Chief Financial Officer of Rare Element Resources in December 2013. Prior to that he was Chief Executive Officer of Americas Bullion Royalty Corp. Paul served as President of Eurasian Capital, the royalty and merchant banking division of Eurasian Minerals Inc., from July 2010 through January 2013. He has more than 30 years of experience in the financial and extractive industries. He began his career in the metals and mining industry with a 17-year tenure at J.P. Morgan & Co., Inc., where he performed merger and acquisition analysis, banking and project finance advisory work for European mining companies, and sell-side equity research on U.S. mining stocks. His extractive industry experience includes managing Pegasus Gold, Inc.'s acquisition efforts and serving as Chief Financial Officer for Koch Mineral Services, a unit of Koch Industries Inc. From 2008-2010, Mr. Zink served as President and Director of International Royalty Corporation ("IRC") and was a key member of the senior management team that negotiated IRC's successful sale to Royal Gold, Inc. in February, 2010.
James K. B. Hesketh, 56, became President and Chief Executive Officer in January 2009. Mr. Hesketh has a diverse career in the mining industry, with over 30 years in positions covering mining finance, corporate business development, mine operations, mine engineering and consulting with companies including NM Rothschild & Sons (Denver) Inc., Cyprus Amax Minerals Company, Pincock, Allen & Holt, Inc., and Dresser Industries. He has been a Director of the Company since 2001.
William R. Stanley, 58, was appointedVice President of Exploration in 2004. Mr. Stanley has over 35 years experience as a mineral exploration geologist. While the vast majority of Mr. Stanley’s exploration experience is in the western United States, he has also developed and led international exploration efforts in Mexico, Chile, and New Zealand. Mr. Stanley holds a Bachelor of Science degree in Geology, from Central Washington University, and a Master of Business Administration from Arizona State University. Prior to joining Atna, Mr. Stanley was an independent mining consultant providing services to both major and junior exploration firms. He has held positions with Cyprus Amax as the U.S. Exploration Manager, and Homestake Mining Company as Senior Exploration Geologist where he was responsible for several gold deposit discoveries, two of which were placed into production.
Rodney D. Gloss, 57,joined Atna in October of 2011 as Vice President and Chief Financial Officer. Mr. Gloss has an extensive background in the global mining and manufacturing sectors with experience in managing all aspects of accounting and finance. He is an experienced and proven leader with the analytical and financial know-how to reduce costs and grow enterprises in a profitable manner. Mr. Gloss has served as Corporate Controller for Alacer Gold; VP, Chief Accounting Officer, and Corporate Controller for Intrepid Potash; and CFO, VP, Controller, and Director of Treasury for Timminco Ltd. Mr. Gloss holds an MBA in Finance and Marketing from the University of California, Los Angeles and a BS in Mathematics from Northern Arizona University. He is a CPA in the State of California.
The following table and notes set forth all compensation earned by directors and senior management for the positions held during 2013. As such, deferred compensation and awards earned in 2013 but paid or issued subsequently are included.
Name and principal
position | | Fee or Salary ($) | | | RSU awards ($) (1) | | | Option awards ($) (1) | | | Cash incentive plan ($) (1) | | | Total compensation ($) | |
| Glen D. Dickson – Director | | | 5,375 | | | | 24,125 | | | | 11,889 | | | | nil | | | | 41,389 | |
| David K. Fagin – Director | | | 6,000 | | | | 26,000 | | | | 11,889 | | | | nil | | | | 43,889 | |
| Ronald D. Parker – Director | | | 4,500 | | | | 22,500 | | | | 11,889 | | | | nil | | | | 38,889 | |
| Christopher E. Herald – Director | | | 4,250 | | | | 21,750 | | | | 11,889 | | | | nil | | | | 37,889 | |
| Paul H. Zink – Director | | | 5,000 | | | | 22,500 | | | | 11,889 | | | | nil | | | | 39,389 | |
| David H. Watkins – Director & Chairman of the Board | | | 6,000 | | | | 26,500 | | | | 11,889 | | | | nil | | | | 44,389 | |
| James K. B. Hesketh – Director, President, Chief Executive Officer | | | 297,000 | | | | 33,000 | | | | 83,901 | | | | 500 | | | | 414,401 | |
| Rodney D. Gloss – Vice President and Chief Financial Officer | | | 175,500 | | | | 19,500 | | | | 22,859 | | | | 500 | | | | 218,359 | |
| Daniel Saint Don – Vice President and Chief Operating Officer – January 7 2013-December 31, 2013 | | | 223,249 | | | | Nil | | | | nil | | | | 20,500 | | | | 243,749 | |
| William R. Stanley – Vice President, Exploration | | | 187,200 | | | | 20,800 | | | | 22,859 | | | | 500 | | | | 231,359 | |
| (1) | Dollar amounts provided for option-based and restricted-stock-unit (RSU) awards reflect fair value on the date of grant. Option-based awards, RSU’s, and dollar amounts for annual incentives are determined as discussed in the Compensation Discussion and Analysis below. |
No part of this compensation was paid pursuant to a profit sharing plan. There were no amounts set aside for a pension, retirement or similar benefits plans for any director or officer.
Termination of Employment, Change in Responsibilities and Employment Contracts
The following summarizes the employment agreements (the “Employment Agreements”) of Mr. Hesketh, Mr. Gloss and Mr. Stanley (the “Executives”). The Employment Agreements will terminate annually on December 31st, unless sooner terminated in accordance with the provisions of the Employment Agreements, and may be renewed for periods of one year at a time thereafter. If Atna terminates the employment of the Executive without cause, or the Executive terminates employment for good reason (as defined in the Employment Agreements), then the Executive will be entitled to: (i) accrued compensation including a pro rata bonus as defined in the Employment Agreement, (ii) a severance payment equal to one year’s salary plus one month’s salary of each year of service to the Company up to a maximum of 18 months’ salary; or if the termination by the Company without cause or by the Executive for good reason occurs upon or within ninety days after a Change of Control, as defined in the Employment Agreements, then the severance payment shall be equal to twenty four months of the Executive’s annual salary, (iii) the Executive is eligible to receive COBRA continuation coverage paid by the Company for a period of up to twelve months, and (iv) subject to the terms of the Employment Agreements, all equity awards shall vest. Atna is also obligated to pay a tax gross-up payment to cover certain excise tax imposed by Section 4999 of the Code which may be incurred in connection with a severance payment. The Employment Agreements contain a covenant not to compete with the Company during the term of employment and for a period of one year following termination of employment, including recruitment of any employee away from Atna.
Salary payments related to the above Employment Agreements are based on the current salary at the time of the event. The pro rata bonus payment is based on the average payments received by the Executive in the previous two years. The option-based payment is based on the fair value of options received in the previous year. Assuming that an event triggered a contractual payment at the mid-point of 2014, the following estimated maximum payments would be required.
| Executive Name and Title | | Maximum
Employment
Contract Payments | |
| James K.B. Hesketh, President and Chief Executive Officer | | $ | 783,276 | |
| Rodney D. Gloss, Vice President and Chief Financial Officer | | $ | 444,627 | |
| William R. Stanley, Vice President of Exploration | | $ | 469,484 | |
Except for the Company’s 401(k) plan, the Company does not provide pension or retirement benefits, and no amounts have been set aside for such benefits. As for all eligible employees who elect to contribute to the Company’s 401(k) plan, the Company will match up to 4 percent of contributed compensation.
Election of Directors
Directors of the Company are elected at the annual general meeting to hold office until the next general meeting or until that person ceases to be a Director before then.
No service contracts exist with the directors providing for benefits upon termination.
Description of Board Committees
The Board has established two full-time committees, an audit committee (the “Audit Committee”), and the compensation committee (the “Compensation Committee”). These committees are comprised entirely of independent non-related directors. The Board has adopted a charter with respect to its Audit and Compensation Committees and a Code of Ethics for Officers, as more fully set forth below.
Audit Committee Charter
Purpose
The committee serves as the representative of the Board for the general oversight of the Company’s affairs relating to:
| · | the internal controls and management information systems of the Company; |
| · | the quality and integrity of the Company’s consolidated financial statements; |
| · | the Company’s compliance with legal and regulatory requirements; |
| · | the auditor’s qualifications and independence; and |
| · | the performance of the Company’s internal audit function and auditors. |
Through its activities, the committee facilitates open communication among directors, auditors and management by meeting in private sessions regularly with these parties.
The committee also provides oversight regarding significant financial matters, including borrowing, currency exposure, dividends, share issuance and repurchases, and the financial aspects of the Company’s benefit plans.
Audit Committee Membership
The Audit Committee must consist of at least three directors. Each member of the Audit Committee must meet the listing standards relating to independence of the Toronto Stock Exchange (the “TSX”) and all other applicable regulatory authorities. Under the Sarbanes-Oxley Act, at least one member of the Committee must be a “financial expert,” whose qualifications include financial literacy, independence and accounting or related financial expertise. The Audit Committee reports to the Board. A majority of the members of the committee constitute a quorum. The following members of the Audit Committee have been appointed by and replaced at the will of the Board.
Mr. Fagin (Chairman)
Mr. Dickson
Mr. Zink
Meetings and Procedures
The Audit Committee must convene at least four times a year, and endeavors to determine that auditing procedures and controls are adequate to safeguard Company assets and to assess compliance with Company policies and legal requirements.
Responsibilities
The Audit Committee shall:
| 1. | Have the sole authority to select, compensate, oversee, evaluate and, where appropriate, replace the auditor. |
| 2. | Annually review the management arrangements for the Company. |
| 3. | Annually review and approve the proposed scope of each fiscal year’s internal and outside audit at the beginning of each new fiscal year. |
| 4. | Review and approve any audit and non-audit services and fees to be provided by the Company’s auditor. |
| 5. | At or shortly after the end of each fiscal year, review with the auditor and management, the audited consolidated financial statements and related opinion and costs of the audit of that year. |
| 6. | Review funding and investment policies, implementation of funding policies and investment performance of the Company’s benefit plans. |
| 7. | Provide any recommendations, certifications and reports that may be required by the Exchange or applicable regulatory authorities including the report of the Audit Committee that must be included in the Company’s annual proxy statement. |
| 8. | Review and discuss the annual audited consolidated financial statements and quarterly consolidated financial statements with management and the auditor. |
| 9. | Have the authority to engage independent counsel and other advisers as it determines necessary to carry out its duties. The Company shall provide for appropriate funding, as determined by the Audit Committee, in its capacity as a committee of the Board, for payment of compensation to any advisers employed by the Audit committee and to the auditor employed by the Company for the purpose of rendering or issuing an audit report. |
| 10. | Discuss with management and the auditor the Company’s policies with respect to risk assessment and risk management. |
| 11. | Meet separately, periodically, with management and the auditor. |
| 12. | In consultation with the auditor and management, review the integrity of the Company’s financial reporting process. |
| 13. | Review periodically the effect of regulatory and accounting initiatives, as well as off-balance sheet structures, on the consolidated financial statements of the Company. |
| 14. | Review with the auditor: |
(a) any audit problems or other difficulties encountered by the auditor in the course of the audit process, including any restrictions on the scope of the auditor’s activities or on access to requested information, and any significant disagreements with management; and
(b) management’s responses to such matters.
| 15. | Review and discuss with the auditor the responsibility, budget and staffing of the Company’s internal audit function. |
| 16. | Report regularly to the Board. Such report to the Board may take the form of an oral report by the Chairman or any other member of the Audit Committee designated by the Audit Committee to make such report. |
| 17. | Perform a review and evaluation, at least annually, of the performance of the Audit committee. In addition, the Audit Committee shall review and reassess, at least annually, the adequacy of this Charter and recommend to the Board any improvements to this Charter that the Audit Committee considers necessary or valuable. The Audit Committee shall conduct such evaluations and reviews in such manner as it deems appropriate. |
Compensation Committee Charter
The mandate of the Compensation Committee (the "Committee") is to discharge the responsibilities of the Board relating to compensation of Atna's officers and directors, to provide general oversight of Atna's compensation structure including equity compensation plans and benefits programs and to perform the additional specific duties and responsibilities set out herein.
The Compensation Committee will consist of at least two members, a majority of whom will be independent directors of Atna, and one of whom will act as chairperson. An "independent" director is a director who is independent, as determined by the Board, within the definitions prescribed for executive compensation committee members by applicable stock exchange listing standards, and applicable laws and, if and as applicable, SEC rules. Compensation Committee members will be appointed, and the Chairperson of the Compensation Committee will be selected from among them, by the Board of Directors.
Members are as follows:
Mr. Glen Dickson- Chairman
Mr. Ronald Parker
Mr. Christopher Herald
| III. | Meetings and Procedures |
The Compensation Committee will meet as often as may be considered necessary or appropriate, in its judgment. The Committee may meet either in person or by telephone, and at such times and places as the Committee determines. At least two members of the Committee must be present to constitute a quorum for the transaction of Compensation Committee business. The Chairperson will preside over the meetings, but will have no greater voting rights or decision-making authority than the other member(s) of the Compensation Committee. The Compensation Committee will report regularly to the full Board with respect to its activities. As a matter of practice, the Compensation Committee will discuss significant matters, as determined by the Committee, with the full Board prior to taking final action on such matters. All recommendations of the Compensation Committee with respect to the awarding of compensation to the executive (senior) officers of the Company will be submitted to the full Board for approval before implementation.
The Compensation Committee will have the authority, acting reasonably, to retain, at the Company's expense, such outside consultants, legal counsel, and other advisors as it determines is appropriate to assist it in the full performance of its functions, including the authority to approve such advisors' fees and other engagement terms. The Compensation Committee will notify the Board prior to retaining any outside consultant, legal counsel, or advisor.
| V. | Duties and Responsibilities |
(a) Human Resources and Compensation Strategies. The Compensation Committee will oversee and evaluate Atna's overall human resources and compensation structure, policies and programs, with the objective of ensuring that these establish appropriate incentives and leadership development for management and other employees.
(b) Executive Compensation. The Compensation Committee will review and approve corporate goals and objectives relevant to the compensation of the President, Chief Executive Officer, Chief Financial Officer, Chief Operating Officer, and the other executive officers of Atna, evaluate the performance of the President, CEO, CFO, COO and the other executive officers in light of those goals and objectives and approve their annual compensation levels, including salaries, bonuses, and stock option grants based on such evaluation.
(c) Employment Agreements. The Compensation Committee will review and approve all employment related agreements and severance arrangements for the President, CEO, CFO, COO, and other executive officers, including, without limitation, change-of-control agreements.
(d) External Reporting of Compensation Matters. The Compensation Committee will prepare an annual report on executive officer compensation for publication in Atna's proxy circulars, as required by the securities regulatory authorities having jurisdiction over the Company. The Chairperson of the Compensation Committee will make him or herself available for questions from shareholders of the Company at the Company's Annual General Meeting.
(e) Stock Option, Restricted Stock Unit, and Incentive Compensation Plans. The Compensation Committee will supervise and administer Atna's stock option, restricted stock unit, or any other equity-based compensation programs, and the incentive compensation plan, and may approve, amend, modify, interpret, ratify the terms of, or terminate any such plan, to the extent that such plans and applicable laws so permit, and will make recommendations to the Board with respect to equity-based plans and incentive-compensation plans as appropriate.
(f) Employee Benefit Plans. The Compensation Committee will monitor the effectiveness of benefit plan offerings, in particular benefit plan offerings pertaining to executive officers, and will review and approve any new employee benefit plan or change to an existing plan that creates a material financial commitment by Atna. In its discretion, the Compensation Committee may otherwise approve, amend, modify, ratify, interpret the terms of, or terminate any benefit plan.
(g) Leadership Development and Succession Planning. The Compensation Committee will review the leadership development and succession planning processes for senior management positions and ensure that appropriate compensation, incentive and other programs are in place in order to promote appropriate leadership development.
(h) Director Compensation. The Compensation Committee will annually review the compensation of directors for service on the Board and its committees and recommend to the Board the annual board member compensation package, including retainer, committee member and chair retainers, board and committee meeting attendance fees and any other form of compensation, such as stock option grants or stock awards.
(i) Annual Evaluation. The Compensation Committee will annually evaluate the performance of the Compensation Committee and the adequacy of the Compensation Committee's charter and recommend to the Board such changes as it deems appropriate.
(j) General. The Compensation Committee will perform such other duties and responsibilities as are consistent with the purpose of the Compensation Committee and as the Board or the Compensation Committee deems appropriate.
The Compensation Committee may delegate any of the foregoing duties and responsibilities to one or more members of the Compensation Committee. In addition, the Compensation Committee may delegate to one or more executive officers of the Company the administration of equity incentive or employee benefit plans, unless otherwise prohibited by such plans, or applicable law or stock exchange rules. Any such delegation may be revoked by the Compensation Committee at any time.
As of December 31, 2013, the Company had approximately 143 full-time and part-time employees. The following table provides information on the activity and geographical location of the Company’s employees and contractors.
| Activity | | Geographical
Location | | Number of Employees
at December 31, 2013 | | Number
of Contractors at
December 31, 2013 |
| Corporate headquarters | | Colorado USA | | 10 | | 3 |
| Briggs Mine | | California USA | | 126 | | 3 |
| Reward Property | | Nevada USA | | 1 | | - |
| Pinson Property | | Nevada USA | | 2 | | - |
| Kendall Mine in Reclamation | | Montana USA | | 4 | | - |
The following table sets forth the share ownership of those persons listed in subsection 6B above and includes details of all options to purchase common shares of the Company held by such persons at March 14, 2014.
| Name | | # of Common(3)
Shares Held | | | Number of
Stock Options | | | Exercise Price
Canadian Dollars$ | | | Expiry Date |
| Glen D. Dickson | | | 111,034 | | | | 120,000 | (1) | | | 0.71 | | | Dec 17/2014 |
| | | | | | | | 120,000 | (1) | | | 0.60 | | | Dec 13/2015 |
| | | | | | | | 150,000 | (2) | | | 0.90 | | | Dec 13/2015 |
| | | | | | | | 130,000 | (2) | | | 1.13 | | | Dec 11/2016 |
| | | | | | | | 207,200 | (2) | | | 0.105 | | | Dec 12/2018 |
| David K. Fagin | | | 416,324 | | | | 120,000 | (1) | | | 0.71 | | | Dec 17/2014 |
| | | | | | | | 120,000 | (2) | | | 0.60 | | | Dec 13/2015 |
| | | | | | | | 150,000 | (2) | | | 0.90 | | | Dec 13/2015 |
| | | | | | | | 130,000 | (2) | | | 1.13 | | | Dec 11/2016 |
| | | | | | | | 207,200 | (2) | | | 0.105 | | | Dec 12/2018 |
| Ronald D. Parker | | | 225,944 | | | | 120,000 | (1) | | | 0.71 | | | Dec 17/2014 |
| | | | | | | | 120,000 | (2) | | | 0.60 | | | Dec 13/2015 |
| | | | | | | | 150,000 | (2) | | | 0.90 | | | Dec 13/2015 |
| | | | | | | | 130,000 | (2) | | | 1.13 | | | Dec 11/2016 |
| | | | | | | | 207,200 | (2) | | | 0.105 | | | Dec 12/2018 |
| Christopher E. Herald | | | 253,036 | | | | 40,000 | (1) | | | 0.71 | | | Aug 06/2014 |
| | | | | | | | 120,000 | (1) | | | 0.71 | | | Dec 17/2014 |
| | | | | | | | 120,000 | (2) | | | 0.60 | | | Dec 13/2015 |
| | | | | | | | 150,000 | (2) | | | 0.90 | | | Dec 13/2015 |
| | | | | | | | 130,000 | (2) | | | 1.13 | | | Dec 11/2016 |
| | | | | | | | 207,200 | (2) | | | 0.105 | | | Dec 12/2018 |
| Paul H. Zink | | | 249,448 | | | | 100,000 | (2) | | | 0.52 | | | Apr 05/2016 |
| | | | | | | | 150,000 | (2) | | | 0.90 | | | Dec 13/2015 |
| | | | | | | | 130,000 | (2) | | | 1.13 | | | Dec 11/2016 |
| | | | | | | | 207,200 | (2) | | | 0.105 | | | Dec 12/2018 |
| David H. Watkins | | | 1,690,388 | | | | 120,000 | (1) | | | 0.71 | | | Dec 17/2014 |
| | | | | | | | 120,000 | (2) | | | 0.60 | | | Dec 13/2015 |
| | | | | | | | 150,000 | (2) | | | 0.90 | | | Dec 13/2015 |
| | | | | | | | 130,000 | (2) | | | 1.13 | | | Dec 11/2016 |
| | | | | | | | 207,200 | (2) | | | 0.105 | | | Dec 12/2018 |
| James K. B. Hesketh | | | 529,022 | | | | 400,000 | (1) | | | 0.71 | | | Dec 17/2014 |
| | | | | | | | 400,000 | (2) | | | 0.60 | | | Dec 13/2015 |
| | | | | | | | 500,000 | (2) | | | 0.90 | | | Dec 13/2015 |
| | | | | | | | 500,000 | (2) | | | 1.13 | | | Dec 11/2016 |
| | | | | | | | 796,900 | (2) | | | 0.203 | | | Jan 11/2019 |
| Name | | # of Common(3)
Shares Held | | | Number of
Stock Options | | | Exercise Price
Canadian Dollars$ | | | Expiry Date |
| Rodney D. Gloss | | | 135,321 | | | | 200,000 | (1) | | | 0.75 | | | Oct 03/2016 |
| | | | | | | | 75,000 | (1) | | | 0.90 | | | Dec 13/2015 |
| | | | | | | | 250,000 | (2) | | | 1.13 | | | Dec 11/2016 |
| | | | | | | | 398,400 | (2) | | | 0.105 | | | Dec 12/2018 |
| William R. Stanley | | | 415,869 | | | | 200,000 | (1) | | | 0.71 | | | Dec 17/2014 |
| | | | | | | | 200,000 | (1) | | | 0.60 | | | Dec 13/2015 |
| | | | | | | | 300,000 | (2) | | | 0.90 | | | Dec 13/2015 |
| | | | | | | | 250,000 | (2) | | | 1.13 | | | Dec 11/2016 |
| | | | | | | | 398,400 | (2) | | | 0.105 | | | Dec 12/2018 |
| (1) | This option grant is fully vested. |
| (2) | These option grants vest 1/3 on the grant date and 1/3 each year over the next two anniversary dates. |
| (3) | At March 14, 2014, persons listed in item 6B above independently owned less than two percent of the Company’s shares outstanding and collectively own approximately 2.1 percent of the shares outstanding. |
Incentive Stock Option Plan
In 2007, the Company adopted an incentive stock option plan pursuant to the policies of the TSX with the approval of the Company’s shareholders, which plan was amended in 2008, 2009 and 2013 (as amended the “Option Plan”). A copy of the Option Plan is available upon request from the Corporate Secretary of the Company, 14142 Denver West Parkway - Suite 250, Golden, Colorado, 80401. Key provisions of the Option Plan include:
| · | persons who are eligible to receive options pursuant to the Option Plan are directors, officers and employees of the Company and its subsidiaries and others providing management or consulting services to the Company or an entity controlled by the Company; |
| · | a restriction that the maximum number of common shares issuable pursuant to options granted under the Option Plan will be a number equal to 10 percent of the issued and outstanding common shares on a non-diluted basis at any time, less the aggregate total number of shares that are subject to issuance under outstanding rights that have been granted by the Company under any other share compensation arrangement, including outstanding restricted share units issued by the Company under its Restricted Share Unit Plan (as discussed below); |
| · | unless permitted by regulatory approval and, if required by applicable law, shareholder approval is obtained: (i) the aggregate number of shares which may be issuable to insiders of the Company pursuant to options granted under the Option Plan and under any other share compensation arrangement shall not exceed 10% of the total number of issued and outstanding shares at the date of grant on a non-diluted basis; (ii) the aggregate number of shares which may be issued to insiders pursuant to options granted under the Option Plan and under any other share compensation arrangement; |
| · | within any one-year period, shall not exceed 10% of the total number of issued and outstanding shares at the end of such period on a non-diluted basis; and (iii) the aggregate number of shares which may be reserved for issuance, from time to time, to any one service provider under the Option Plan and under any other share compensation arrangement may not exceed 5% of the total number of issued and outstanding shares at the date of grant on a non-diluted basis; |
| · | the option price per common share is to be determined by the Board provided that such exercise price is not less than the market price on the date of grant of such options or such other minimum price as may be required by the TSX and the options may be priced in Canadian or U.S. Dollars as determined by the Board at the time the option is granted; |
| · | the market price is defined as the average of the daily high and low board lot trading prices of the common shares of the Company for three trading days immediately preceding the time the option is granted; |
| · | the vesting period of all options are determined by the Board; |
| · | options may be exercisable for a period of up to a maximum term of five years, subject to a blackout period allowance, such period to be determined by the Board, and the options are non-transferable; |
| · | options held by individuals who are terminated without cause are subject to an accelerated expiry term for those options which requires that options held by those individuals expire on the earlier of: (a) the original expiry term of such options; (b) 30 days after the Optionee ceases active employment with the Company; or (c) 30 days after the date of delivery of written notice of retirement, resignation or termination; |
| · | options held by an individual who ceases to be employed by the Company for cause or is removed from office or becomes disqualified from being a director will terminate immediately; |
| · | options held by an individual who ceases to be employed by the Company due to death, disability or retirement in accordance with the Company’s retirement policy will terminate on the earlier of: (a) 365 days after the date of death, disability or retirement; and (b) the original expiry term of such options; |
| · | options which expire unexercised or are otherwise cancelled will be returned to the Option Plan and may be made available for future option grant pursuant to the provisions of the Option Plan or may be made subject to issuance under a right granted pursuant to any other share compensation arrangement; |
| · | optionees may, rather than exercise their options, elect to terminate such option, in whole or in part, and receive the number of common shares, which have a value equivalent to the number of options terminated multiplied by the difference between the fair value of a common share and the option price of the options terminated; |
| · | the Board may, without shareholder approval, from time to time, subject to applicable law and the prior approval, if required, of the TSX or any other applicable regulatory body having authority over the Company, the Option Plan or the shareholders of the Company: (i) suspend, terminate, or discontinue the Option Plan, and (ii) amend or revise the terms of the Option Plan or any option granted under the Option Plan and the Option Agreement relating thereto at any time without the consent of the optionee, provided that such amendment does not adversely alter or impair the option previously granted (except as permitted under the adjustment provisions of the Option Plan), including amendments of a typographical, grammatical, clerical or administrative nature, to the vesting provisions of the Option Plan or any option, to change the termination provisions of any option that does not entail an extension beyond the original expiration date of the option and to change the eligible participants under the Option Plan; |
| · | the Board, absent prior approval of the shareholders of the Company and of the TSX or any other regulatory body having authority over the Company, will not be entitled to (i) increase the maximum percentage of shares issuable by the Company pursuant to the Option Plan; (ii) amend an option grant for an option held by an insider of the Company to effectively reduce the exercise price, or to extend the expiry date; (iii) extend the Blackout Expiration Term as provided in the Option Plan; (iv) make a change to the class of eligible participants which would have the potential of broadening or increasing participation by insiders of the Company; (v) add any form of financial assistance; or (vi) add a deferred or restricted share unit or any other provision which results in an eligible participant receiving shares while no cash consideration is received by the Company. Notwithstanding any provision in the Option Plan to the contrary, any revision to the terms of an option granted to a U.S. Participant (as defined in the Option Plan) shall be made only if it complies with, and does not create adverse tax consequences under, Sections 424 and/or 409A of the Code (as defined in the Option Plan), as applicable; and |
| · | options issued to eligible U.S. Participants (as defined in the Option Plan) may qualify as an “incentive stock option” pursuant to Section 422 of the Code. |
The rules of the TSX provide that a listed issuer having in place an evergreen plan such as the Option Plan must obtain shareholder approval within three years after the institution of the plan and every three years thereafter in order to continue to grant awards under it. The Company’s shareholders last approved the renewal of the Option Plan on May 7, 2013.
During the financial year ended December 31, 2013, the Company amended the Option Plan in order to accommodate the introduction of the Restricted Share Unit Plan as a new component of the Company’s equity-based incentive program. The amendments did not represent a substantive change to the Company’s existing Option Plan. Rather, they were required merely to align certain terms and definitions of the Option Plan with the Company’s newly adopted Restricted Share Unit Plan, as the existing Option Plan was prepared prior to the institution of the RSU Plan. The key amendments (the “Amendments”), which were approved by the shareholders of the Company at the Annual General Meeting held on May 7, 2013, were as follows:
| 1. | to add the definitions of “Applicable Law”, “RSU Plan” and “Share Compensation Arrangement” under section 2.1 of the Option Plan; |
| 2. | to amend section 3.3 of the Option Plan to provide that: |
| (a) | the maximum number of common shares of the Company that may be issuable pursuant to options granted under the Option Plan, which options are outstanding but unexercised and whether or not they are vested, shall be a number equal to 10% of the number of issued and outstanding common shares of the Company on a non-diluted basis at any time, less the aggregate total number of common shares of the Company that are, from time to time, subject to issuance under outstanding rights that have been granted by the Company under any other share compensation arrangement, including outstanding restricted share units issued by the Company under its Restricted Share Unit Plan; and |
| (b) | unless permitted by regulatory approval and, if required by applicable law, shareholder approval is obtained: |
| (i) | the aggregate number of common shares of the Company which may be issuable to insiders pursuant to options granted under the Option Plan and under any other share compensation arrangement shall not exceed 10% of the total number of issued and outstanding common shares of the Company at the date of grant of the option on a non-diluted basis; |
| (ii) | the aggregate number of common shares of the Company which may be issued to insiders pursuant to options granted under the Option Plan and under any other share compensation arrangement, within any one-year period, shall not exceed 10% of the total number of issued and outstanding common shares of the Company at the end of such period on a non-diluted basis; and |
| (iii) | the aggregate number of common shares of the Company which may be reserved for issuance, from time to time to any one service provider under the Option Plan and under any other share compensation arrangement may not exceed 5.0% of the total number of issued and outstanding common shares of the Company at the date of grant of the option on a non-diluted basis; |
| 3. | to amend section 4.9 of the Option Plan to provide that any unissued option shares not acquired by an optionee under an option, which have expired or have been cancelled, may be made the subject of a further option grant pursuant to the provisions of the Option Plan or may be made subject to issuance under a right granted pursuant to any other share compensation arrangement; and |
| 4. | to amend section 6.3(a) of the Option Plan to provide that notwithstanding any other provision of the Option Plan to the contrary, the aggregate number of common shares of the Company available for options granted to citizens of the United States is 6,000,000 subject to: (i) the limitations set out in section 3.3 of the Option Plan, (ii) adjustment pursuant to section 5 of the Option Plan; and (iii) the provisions of sections 422 and 424 of the U.S. Internal Revenue Code of 1986, as amended. |
Restricted Share Unit Plan
Effective May 7, 2013, the Company adopted a restricted share unit plan (the “RSU Plan”), pursuant to which the Board may grant restricted share units (the “RSUs”) to eligible participants. The RSUs are substantially like “phantom” shares, the implied value of which will rise and fall in value based on the underlying market value of the Company’s common shares and are redeemable for common shares on the vesting dates determined by the Board when the RSUs are granted. The key features of the RSU Plan are as follows:
| · | the eligible participants are directors, officers, employees and consultants of the Company; |
| · | the maximum number of common shares of the Company which may be made subject to issuance under RSUs granted under the RSU Plan shall be a number equal to 10% of the number of issued and outstanding common shares of the Company on a non-diluted basis at any time, less the aggregate total number of common shares of the Company that are, from time to time, subject to issuance under outstanding rights that have been granted by the Company under any other share compensation arrangement, including outstanding stock options issued by the Company under its Option Plan; |
| · | unless permitted by regulatory approval and, if required by applicable law, shareholder approval is obtained: (i) the aggregate number of common shares of the Company that may be made subject to issuance to insiders pursuant to RSUs granted under the RSU Plan and under any other share compensation arrangement may not exceed 10% of the total number of common shares of the Company outstanding at the date of grant of the RSU (on a non-diluted basis); (ii) the aggregate number of common shares of the Company that may be issued to insiders pursuant to RSUs granted under the RSU Plan and under any other share compensation arrangement, within any one year period, may not exceed 10% of the total number of common shares of the Company outstanding at the end of such period (on a non-diluted basis); and (iii) the aggregate number of common shares of the Company which may be reserved for issuance, from time to time, to any one person or company under the RSU Plan and under any other share compensation arrangement may not exceed 5% of the total number of common shares of the Company outstanding at the date of grant of the RSU (on a non-diluted basis); |
| · | RSUs shall consist of a grant of units, each of which represents the right of the participant to receive one common share of the Company; |
| · | the Board has the discretion to determine the vesting date for each RSU or any other vesting requirements; |
| · | unless otherwise determined by the Board, in its sole discretion, or specified in the applicable RSU agreement: |
| (a) | upon the voluntary resignation or the termination for cause of a participant, all of the participant’s RSUs which remain unvested shall be forfeited without any entitlement to such participant. If the participant has an employment or consulting agreement with the Company, the term “cause” shall have the meaning given to it in the applicable participant’s employment or consulting agreement; |
| (b) | upon the termination without cause or death of a participant, the participant or the participant’s beneficiary, as the case may be, shall have a number of RSUs become vested in a linear manner equal to the sum for each grant of RSUs of the original number of RSUs granted multiplied by the number of completed months of employment since the date of grant divided by the number of months required to achieve the full vesting of such grant of RSUs reduced by the actual number of RSUs that have previously become vested. |
| · | the assignment or transfer of RSUs, or any other benefits under the RSU Plan, are not permitted; |
| · | the Board has the right, in its absolute discretion, subject to any necessary regulatory approvals, to at any time amend, suspend, terminate or discontinue the RSU Plan, or revoke or alter any action taken in connection therewith, except that no general amendment or suspension of the RSU Plan will, without the written consent of all holders of outstanding RSUs, impair the rights and entitlements of any such holder pursuant to then-outstanding RSUs unless such amendment is the result of a change in the rules and policies of the TSX or the US Market (as defined in the RSU Plan), all without shareholder approval or participant approval, except that this discretionary authority will not extend to the directors the authority to increase the Plan Limit (as defined in the RSU Plan) without shareholder approval, excluding, where required by the policies of the TSX or the US Market, the votes attaching to shares held by persons eligible to be participants under the RSU Plan. If the RSU Plan is terminated, the provisions of the RSU Plan and any administrative guidelines, and other rules and regulations adopted by the Board and in force at the time of the RSU Plan shall continue in effect during such time as an RSU or any rights pursuant thereto remain outstanding; |
| · | subject to regulatory approval, the Board may, without shareholder or participant approval, amend or modify in any manner an outstanding RSU to the extent that the Board would have had the authority to initially grant such award as so modified or amended, including without limitation, to change the date or dates as of which an RSU vests, except that no amendment will, without the written consent of all affected participants, alter or impair any RSU previously granted under the RSU Plan unless as a result of a change in applicable law or the Company’s status or classification thereunder; and |
| · | upon the occurrence of a Change of Control (as defined in the RSU Plan), all outstanding RSUs at that time shall automatically and irrevocably vest in full. |
The RSU Plan is intended to complement the Option Plan and to create, through combinations of these equity-based incentive programs, alignment of the interests of management and employees of the Company to those of its shareholders. The recommendation to implement a RSU Plan was taken by the Board after an analysis of various alternative equity-based plans, and the recommendation was approved by a majority of the shareholders of the Company on May 7, 2013. Of the potential equity-based plans considered, a combination of the current Option Plan together with a RSU Plan was considered to provide the best balance between alignment with shareholder interests, protection against downside risk, share price volatility protection and employee retention.
Maximum Shares Available
The maximum number of common shares of Atna that may be issuable under the Option Plan and the RSU Plan (together “the Equity Incentive Plans”) is a number equal to 10 percent of the number of issued and outstanding common shares of Atna on a non-diluted basis at any time, less the aggregate total number of common shares of the Company that are, from time to time, subject to issuance under outstanding rights that have been granted by the Company under any other share compensation arrangement, including outstanding stock options issued by the Company under its Option Plan and outstanding RSUs issued by the Company under its RSU Plan. As of March 14, 2014, the maximum number of common shares issuable under the Equity Incentive Plans was 19,028,059. As of March 14, 2014, approximately 11,652,650 common shares were issuable upon the exercise of outstanding options issued under the Equity Incentive Plans leaving 7,375,409 common shares reserved for future issuance.
Maximum Shares Available to Insiders
To ensure that insiders of Atna have the opportunity to vote on certain approvals listed in Section 613(a) of the TSX Company Manual, the Equity Incentive restrict the maximum number of common shares of Atna that are issued under these plans, or that may be issuable, to insiders (as defined under applicable securities law). Under the Equity Incentive Plans, unless permitted by regulatory approval and, if required by applicable law, shareholder approval is obtained: (i) the aggregate number of common shares of the Company which may be issuable to insiders of Atna pursuant to options granted under the Option Plan or RSUs granted under the RSU Plan, and under any other share compensation arrangement, shall not exceed 10% of the total number of issued and outstanding common shares of Atna at the date of grant of the option or the RSU on a non-diluted basis; and (ii) the aggregate number of common shares of Atna which may be issued to insiders of Atna pursuant to options granted under the Option Plan or RSUs granted under the RSU Plan, and under any other share compensation arrangement, within any one-year period, shall not exceed 10% of the total number of issued and outstanding common shares of Atna at the end of such period on a non-diluted basis.
Share Appreciation Rights
The Option Plan includes the concept of share appreciation rights. Pursuant to the terms of the Option Plan, an optionee may, rather than exercise any option which such optionee is entitled to exercise under the Option Plan, elect to terminate such option, in whole or in part, and elect either: (i) to receive the number of common shares calculated pursuant to the difference between the fair value of a common share and the exercise price of the option so terminated; or (ii) with the consent of the Company, to receive a cash payment equal to the product of the number of option shares to which the option so terminated relates multiplied by the difference between the fair value of a common share and the exercise price of the option so terminated.
Exchange Controls
Atna is a Province of British Columbia, Canadian corporation. There is no law or governmental decree or regulation in Canada that restricts the export or import of capital, or affects the remittance of dividends, interest or other payments to a non-resident holder of common shares, other than withholding tax requirements. Any such remittances to United States residents are generally subject to withholding tax, however no such remittances are likely in the foreseeable future.
There is no limitation imposed by the laws of Canada or by the charter or other constituent documents of Atna on the right of a non-resident to hold or vote its common shares, other than as provided in the Investment Canada Act (Canada) (the “Investment Act”). The following discussion summarizes the material features of the Investment Act for a non-resident who proposes to acquire a controlling number of Atna’s common shares. It is general only, it is not a substitute for independent advice from an investor’s own advisor, and it does not anticipate statutory or regulatory amendments. Atna does not believe the Investment Act will have any effect on it or on its non-Canadian shareholders due to a number of factors including the nature of its operations and Atna’s relatively small capitalization.
The Investment Act generally prohibits implementation of a “reviewable” investment by an individual, government or agency thereof, corporation, partnership, trust or joint venture (each an “entity”) that is not a “Canadian” as defined in the Investment Act (i.e. a “non-Canadian”), unless after review the Director of Investments appointed by the minister responsible for the Investment Act is satisfied that the investment is likely to be of net benefit to Canada. The size and nature of a proposed transaction may give rise to an obligation to notify the Director to seek an advance ruling. An investment in Atna’s common shares by a non-Canadian (other than a “WTO Investor” as that term is defined in the Investment Act and which term includes entities which are nationals of or are controlled by nationals of member states of the World Trade Organization) when Atna was not controlled by a WTO Investor, would be reviewable under the Investment Act if it was an investment to acquire control of Atna and the value of the assets of Atna, as determined in accordance with the regulations promulgated under the Investment Act, was over a certain figure, or if an order for review was made by the federal cabinet on the grounds that the investment related to Canada’s cultural heritage or national identity, regardless of the value of the assets of Atna. An investment in the common shares by a WTO Investor, or by a non-Canadian when Atna was controlled by a WTO Investor, would be reviewable under the Investment Act if it was an investment to acquire control of Atna and the value of the assets of Atna, as determined in accordance with the regulations promulgated under the Investment Act, was not less than a specified amount, which currently exceeds approximately C$250 million. A non-Canadian would acquire control of Atna for the purposes of the Investment Act if the non-Canadian acquired a majority of the common shares. The acquisition of less than a majority but one-third or more of the common shares would be presumed to be an acquisition of control of Atna unless it could be established that, on the acquisition, Atna was not controlled in fact by the acquirer through the ownership of the common shares.
The foregoing assumes Atna will not engage in the production of uranium or own an interest in a producing uranium property in Canada, or provide any financial service or transportation service, as the rules governing those businesses are different.
Certain transactions relating to the common shares of Atna would be exempt from the Investment Act, including:
| (a) | an acquisition of the common shares by a person in the ordinary course of that person’s business as a trade or dealer in securities, |
| (b) | an acquisition of control of Atna in connection with the realization of security granted for a loan or other financial assistance and not for a purpose related to the provisions of the Investment Act, and |
| (c) | an acquisition of control of Atna by reason of an amalgamation, merger, consolidation or corporate reorganization following which the ultimate direct or indirect control in fact of Atna, through the ownership of the common shares, remain unchanged. |
Quantitative and Qualitative Disclosures of Market Risk
Refer to the discussion of quantitative and qualitative disclosures of market risk in Item 11.
| ITEM 7. | MAJOR SHAREHOLDERS AND RELATED PARTY TRANSACTIONS |
To the knowledge of the Company, and based upon the Company’s review of current public filings, as at March 14, 2014, the following shareholder beneficially owned, directly or indirectly, or exercised control or direction over more than five percent of the voting rights of the Company.
| Name | | Number of Shares | | | Percentage of Shares Outstanding | |
| Sprott Inc. | | | 39,077,588 | | | | 20.5% | |
On December 31, 2011, Sheldon Inwentash and his associates are believed to have beneficially owned approximately 11,400,000 shares, 9.4 percent of the outstanding shares. In February 2012, Sheldon Inwentash filed a report indicating that he, together with his associates, held 11,565,000 common shares of the Company, representing 6.1 percent of the current outstanding common shares; however the Company is not aware of any more recent filing. As of December 31, 2011, Hedgehog Capital is believed to have beneficially owned approximately 13,200,000 shares, 6.9 percent of the current outstanding shares, however in a December 31, 2012 filing, Hedgehog Capital indicated beneficial ownership had declined to 6,700,000 shares, 3.5 percent of the outstanding shares. Both Hedgehog Capital and Sheldon Inwentash and his associates acquired the common shares of the Company in the public market. On September 19, 2013, Sprott Inc. reported owing 39,077,588 common shares of the Company; 33,400,000 of these shares having been acquired in a private placement at C$0.16 per share on the same date. Sprott Inc. acquired an additional 5,677,588 shares in the public market at an unknown price and time prior to September 19, 2013. These named shareholders did not possess voting rights different from those of other Company shareholders.
To the knowledge of the Company and based on current public filings as well as information provided by the Company’s transfer agent, the table below is the distribution of the shareholders of the Company at February 28th 2014.
| Country | | Total Holders | | | Holders percent | | | Total Holdings | | | Holdings
percent | |
| | | | | | | | | | | | | |
| Canada | | | 2,945 | | | | 35.27 | | | | 94,599,654 | | | | 49.72 | |
| | | | | | | | | | | | | | | | | |
| USA | | | 5,304 | | | | 63.51 | | | | 58,182,377 | | | | 30.58 | |
| | | | | | | | | | | | | | | | | |
| Other Countries | | | 102 | | | | 1.22 | | | | 37,498,566 | | | | 19.71 | |
The Company is not directly or indirectly owned or controlled by another corporation, by any foreign government, or by any other natural or legal person severally or jointly. The Company knows of no arrangements, the operation of which may at a subsequent date result in a change in control of the Company.
| B. | Related Party Transactions |
During 2013 and 2012, and through the date of this report, the Company had no related party transactions.
Indebtedness to Company of Directors, Executive Officers and Senior Officers
No directors or senior officers of the Company are indebted to the Company or have been financially indebted to the Company since the beginning of the last full fiscal year of the Company.
| C. | Interests of Experts and Counsel |
This Form 20-F is being filed as an annual report under the Exchange Act and, as such, there is no requirement to provide any information under this item.
EKS&H LLLP, auditors of the Company, has advised the Company that it is independent within the Rules of Professional Conduct of the Institute of Chartered Accountants of British Columbia, within the meaning of applicable securities laws of Canada, and within the rules of the PCAOB and SEC.
No director, officer, employee, or partner, as applicable, of EKS&H LLLP is currently expected to be elected, appointed or employed as a director, officer or employee of the Company or of any associate or affiliate of the Company.
| ITEM 8. | FINANCIAL INFORMATION |
| A. | Consolidated Financial Statements and Other Financial Information |
Attached hereto as Exhibit 15.1 (i) to (vi) are the audited consolidated financial statements of the Company for the fiscal years ended December 31, 2013, 2012 and 2011. The consolidated financial statements are accompanied by auditors' reports and related notes. See “Item 18. Financial Statements”.
Legal Proceedings
As of March 14, 2014, there are no legal or arbitration proceedings, which may have, or have had in the recent past, significant effects on the Company’s financial position or profitability.
Dividend Distributions
The Company is permitted to pay dividends under its governing documents. The Company has no current plans to pay any dividends.
Changes in Accounting Policies
International Financial Reporting Standards:
The consolidated financial statements have been prepared in accordance with International Financial Reporting Standards (“IFRS”) and interpretations as issued by the International Accounting Standards Board (“IASB”). IFRS has been consistently applied and all periods shown in the 2013 consolidated financial statements are comparable.
Recent Accounting Pronouncements
Following are the recently issued accounting standards relevant to our Company and business that may impact the Company in the future. It includes standards that have been recently adopted or ones that have been issued and not yet adopted.
IFRS 9 – Financial Instruments – On November 12, 2009, the IASB issued IFRS 9Financial Instruments as the first step in its project to replace International Accounting Standard (“IAS”) 39Financial Instruments: Recognition and Measurement.IFRS 9 retains but simplifies the mixed measurement model and establishes two primary measurement categories for financial assets: amortized cost and fair value. The basis of classification is made at the time the financial asset is initially recognized, namely when the entity becomes a party to the contractual provisions of the instrument. IFRS 9 amends some of the requirements of IFRS 7Financial Instruments: Disclosuresincluding additional disclosures about investments in equity instruments measured at fair value in other comprehensive income, and guidance on financial liabilities and de-recognition of financial instruments. Although early adoption is permitted, in December 2011, the IASB issued an amendment that adjusted the mandatory effective date of IFRS 9 from January 1, 2013 to January 1, 2015. The Company has early adopted IFRS 9 and determined it had no impact on the Company’s consolidated financial statements.
IFRS 36 Amendments – Recoverable Amount Disclosures for Non-Financial Assets –The ISAB issued amendments to IAS 36 Recoverable Amount Disclosures for Non-Financial Assets. The amendments to IAS 36 clarify the IASB’s original intention that the scope of the disclosures is limited to the recoverable amount of impaired assets that is based on fair value less costs of disposal. The amendments to IAS 36 must be applied starting January 1, 2014, with early adoption permitted when the Company has already applied IFRS 13. The Company has early adopted the amendments to IAS 36.
| ITEM 9. | THE OFFER AND LISTING |
| A. | Offer and Listing Details |
The high and low market prices in Canadian Dollars for the Company’s common stock on the TSX:ATN, expressed in Canadian dollars and on the OTCQB:ATNAF, in U. S. Dollars, are set forth below.
For the five most recent full financial years: the annual high and low market prices:
| | | TSX | | | OTCQB | |
| | | High - $ | | | Low - $ | | | High - $ | | | Low - $ | |
| | | | | | | | | | | | | |
| 2009 | | | 0.990 | | | | 0.480 | | | | 0.87 | | | | 0.40 | |
| 2010 | | | 0.770 | | | | 0.430 | | | | 0.75 | | | | 0.40 | |
| 2011 | | | 1.020 | | | | 0.520 | | | | 1.00 | | | | 0.53 | |
| 2012 | | | 1.540 | | | | 0.760 | | | | 1.58 | | | | 0.75 | |
| 2013 | | | 1.290 | | | | 0.090 | | | | 1.32 | | | | 0.09 | |
For the two most recent full financial years and any subsequent period: the high and low market prices for each full financial quarter follow.
| | | TSX | | | OTCQB | |
| | | High - $ | | | Low - $ | | | High - $ | | | Low - $ | |
| Fiscal 2012 | | | | | | | | | | | | | | | | |
| First Quarter, ended 03/31/12 | | | 1.540 | | | | 0.850 | | | | 1.58 | | | | 0.83 | |
| Second Quarter, ended 06/30/12 | | | 1.320 | | | | 0.760 | | | | 1.34 | | | | 0.75 | |
| Third Quarter, ended 09/30/12 | | | 1.330 | | | | 0.860 | | | | 1.36 | | | | 0.84 | |
| Fourth Quarter, ended 12/31/12 | | | 1.370 | | | | 1.080 | | | | 1.39 | | | | 1.08 | |
| | | | | | | | | | | | | | | | | |
| Fiscal 2013 | | | | | | | | | | | | | | | | |
| First Quarter, ended 03/31/13 | | | 1.290 | | | | 0.800 | | | | 1.32 | | | | 0.78 | |
| Second Quarter, ended 06/30/13 | | | 0.830 | | | | 0.095 | | | | 0.82 | | | | 0.10 | |
| Third Quarter, ended 09/30/13 | | | 0.235 | | | | 0.105 | | | | 0.23 | | | | 0.10 | |
| Fourth Quarter, ended 12/31/13 | | | 0.160 | | | | 0.090 | | | | 0.16 | | | | 0.09 | |
| | | | | | | | | | | | | | | | | |
| Fiscal 2014 | | | | | | | | | | | | | | | | |
| Period ended 03/14/14 | | | 0.240 | | | | 0.120 | | | | 0.22 | | | | 0.09 | |
For the most recent six months: the high and low market prices and the average daily trading volumes for each month follow.
| | | TSX | | | OTCQB | |
| | | High - $ | | | Low - $ | | | High - $ | | | Low - $ | |
| March 1-14, 2014 | | | 0.240 | | | | 0.190 | | | | 0.22 | | | | 0.17 | |
| February-14 | | | 0.235 | | | | 0.145 | | | | 0.22 | | | | 0.13 | |
| January-14 | | | 0.235 | | | | 0.120 | | | | 0.19 | | | | 0.10 | |
| December-13 | | | 0.120 | | | | 0.090 | | | | 0.12 | | | | 0.09 | |
| November-13 | | | 0.145 | | | | 0.100 | | | | 0.14 | | | | 0.09 | |
| October-13 | | | 0.160 | | | | 0.115 | | | | 0.16 | | | | 0.12 | |
| September-13 | | | 0.215 | | | | 0.140 | | | | 0.21 | | | | 0.14 | |
This Form 20-F is being filed as an annual report under the Exchange Act and, as such, there is no requirement to provide any information under this item.
The Company’s common shares have been listed and traded in Canada on the TSX under the symbol “ATN” since March 14, 1996. The Company is also traded on the OTC Bulletin Board in the U.S. under the symbol “ATNAF”.
This Form 20-F is being filed as an annual report under the Exchange Act and, as such, there is no requirement to provide any information under this item.
This Form 20-F is being filed as an annual report under the Exchange Act and, as such, there is no requirement to provide any information under this item.
This Form 20-F is being filed as an annual report under the Exchange Act and, as such, there is no requirement to provide any information under this item.
| ITEM 10. | ADDITIONAL INFORMATION |
This Form 20-F is being filed as an annual report under the Exchange Act and, as such, there is no requirement to provide any information under this item.
| B. | Memorandum and Articles of Association |
The information required by this Item 10.B is contained in the Company's registration statements on Form 20-FR filed under the Exchange Act with the SEC on June 23, 1997 and on Form F-4/A (File No. 333-147973) filed under the Securities Act with the SEC on January 17, 2008, including any amendments or reports filed for the purpose of updating such description.
During the two years preceding this report, the following are considered to be material contracts: 1) amendments to the Sprott credit agreement in February 2012, March 2013, and October/December 2013, and 2) the Waterton credit agreement of January 2014.
On August 31, 2011, the Company closed a C$20 million Credit Agreement with Sprott to finance the Pinson acquisition and commence development. C$2.5 million was repaid to Sprott in February 2013. In February 2012, the Credit Agreement was amended to change the mandatory prepayments, to increase the amount of certain permitted indebtedness and to extend the maturity date to August 31, 2013. In March 2013, the Credit Agreement was further amended to extend the maturity date to August 29, 2014, to provide for the payment of an extension bonus in respect of the maturity date extension, to amend the prepayment terms and to amend certain negative covenants. In October and December 2013, the Credit Agreement was further amended to extend the maturity date to November 30, 2014, increase the interest rate from 9 percent to 12 percent per annum, provide for additional mandatory principal prepayments commencing January 31, 2014, provide for the issuance of a common share bonus to Sprott, provide for additional security to be granted over the Briggs Project and to amend certain other covenants contained in the Credit Agreement.
On January 31, 2014, the Company entered into a $22.0 million credit facility agreement (the “Agreement”) with Waterton Precious Metals Fund II Cayman, LP (“Waterton”). The Company used this new credit facility to pay the current liability due Sprott of approximately C$18.1 million under the Company’s existing secured credit facility, and the balance for general working capital purposes including a reduction in trade payables. Under the terms of the Agreement, the credit facility is a non-revolving, senior secured facility, that bears interest at a coupon-rate of 10% per annum and matures on the earlier of (i) the date that is 24 months following the date of the Agreement (or if the facility has been accelerated in the event of a default, the date on which Waterton demands repayment), and (ii) the date all amounts owing under the credit facility are voluntarily or mandatorily prepaid in full, without a repayment penalty. On the maturity date, Atna will pay to Waterton (i) a cash fee equal to 5% of the credit facility, and (ii) if the payment date occurs on or after the first anniversary of the date of the Agreement, the Company will pay an additional cash fee equal to 5% of the credit facility less any prepayments made during the first 12 months of the Agreement. As consideration for structuring the credit facility, Atna paid to Waterton a cash structuring fee of US$440,000 and, after receipt of approval from the TSX, issued to Waterton 10,000,000 non-transferable common share purchase warrants (the “Lender Warrants”). Each Lender Warrant entitles Waterton to acquire one common share of the Company at an exercise price of C$0.25 per common share for a period of three years expiring on January 31, 2017. The Lender Warrants are subject to a four-month hold period in Canada. Assets owned by Atna in Canyon Resources Corp. (CRC) and assets owned by CRC in CR Briggs Corporation, CR Montana Corporation, CR Reward Corporation, and Atna Resources Inc. were pledged as security under the Waterton Loan. Covenants restrict equipment financings to $12 million and require Waterton’s consent for material asset sales. The Waterton Loan also precludes additional borrowings and guarantees of debt, except for Permitted Debt and Liens, and allows early prepayments without incurrence of a prepayment fee. The loan origination costs were capitalized and will be amortized over the minimum contractual life of the loan facility.
Canada has no system of exchange controls. There are no Canadian restrictions on the repatriation of capital or earnings of a Canadian public company to non-resident investors. There are no laws in Canada or exchange restrictions affecting the remittance of dividends, profits, interest, royalties and other ..payments to non-resident holders of the Company's securities, except as discussed in Item 10.E., “Taxation” below.
U.S. Federal Income Tax Consequences
The following is a summary of the anticipated material U.S. federal income tax consequences to a U.S. Holder (as defined below) arising from and relating to the acquisition, ownership, and disposition of Common Shares.
This summary is for general information purposes only and does not purport to be a complete analysis or listing of all potential U.S. federal income tax consequences that may apply to a U.S. Holder as a result of the acquisition, ownership, and disposition of Common Shares. In addition, this summary does not take into account the individual facts and circumstances of any particular U.S. Holder that may affect the U.S. federal income tax consequences of the acquisition, ownership, and disposition of Common Shares. Accordingly, this summary is not intended to be, and should not be construed as, legal or U.S. federal income tax advice with respect to any U.S. Holder. Each U.S. Holder should consult its own financial advisor, legal counsel, or accountant regarding the U.S. federal income, U.S. state and local, and foreign tax consequences of the acquisition, ownership, and disposition of Common Shares.
Scope of this Summary
Authorities
This summary is based on the Code, Treasury Regulations (whether final, temporary, or proposed), published rulings of the Internal Revenue Service (the “IRS”), published administrative positions of the IRS, the Convention Between Canada and the United States of America with Respect to Taxes on Income and on Capital, signed September 26, 1980, as amended (the “Canada-U.S. Tax Convention”), and U.S. court decisions that are applicable and, in each case, as in effect and available, as of the date of this Annual Report. Any of the authorities on which this summary is based could be changed in a material and adverse manner at any time, and any such change could be applied on a retroactive basis. This summary does not discuss the potential effects, whether adverse or beneficial, of any proposed legislation that, if enacted, could be applied on a retroactive basis.
U.S. Holders
For purposes of this summary, a “U.S. Holder” is a beneficial owner of Common Shares that, for U.S. federal income tax purposes, is (a) an individual who is a citizen or resident of the U.S., (b) a corporation, or any other entity classified as a corporation for U.S. federal income tax purposes, that is created or organized in or under the laws of the U.S. or any state in the U.S., including the District of Columbia, (c) an estate if the income of such estate is subject to U.S. federal income tax regardless of the source of such income, or (d) a trust if (i) such trust has validly elected to be treated as a U.S. person for U.S. federal income tax purposes or (ii) a U.S. court is able to exercise primary supervision over the administration of such trust and one or more U.S. persons have the authority to control all substantial decisions of such trust.
Non-U.S. Holders
For purposes of this summary, a “non-U.S. Holder” is a beneficial owner of Common Shares other than a U.S. Holder. This summary does not address the U.S. federal income tax consequences of the acquisition, ownership, and disposition of Common Shares to non-U.S. Holders. Accordingly, a non-U.S. Holder should consult its own financial advisor, legal counsel, or accountant regarding the U.S. federal income, U.S. state and local, and foreign tax consequences (including the potential application of and operation of any income tax treaties) of the acquisition, ownership, and disposition of Common Shares.
U.S. Holders Subject to Special U.S. Federal Income Tax Rules Not Addressed
This summary does not address the U.S. federal income tax consequences of the acquisition, ownership, and disposition of Common Shares to U.S. Holders that are subject to special provisions under the Code, including the following U.S. Holders: (a) U.S. Holders that are tax-exempt organizations, qualified retirement plans, individual retirement accounts, or other tax-deferred accounts; (b) U.S. Holders that are financial institutions, insurance companies, real estate investment trusts, or regulated investment companies; (c) U.S. Holders that are dealers in securities or currencies or U.S. Holders that are traders in securities that elect to apply a mark-to-market accounting method; (d) U.S. Holders that have a “functional currency” other than the U.S. Dollar; (e) U.S. Holders that are liable for the alternative minimum tax under the Code; (f) U.S. Holders that own Common Shares as part of a straddle, hedging transaction, conversion transaction, constructive sale, or other arrangement involving more than one position; (g) U.S. Holders that acquired Common Shares in connection with the exercise of employee stock options or otherwise as compensation for services; (h) U.S. Holders that hold Common Shares other than as a capital asset within the meaning of Section 1221 of the Code; or (i) U.S. Holders that own (directly, indirectly, or constructively) 10 percent or more, by voting power or value, of the outstanding shares of the Company. U.S. Holders that are subject to special provisions under the Code, including U.S. Holders described immediately above, should consult their own financial advisor, legal counsel or accountant regarding the U.S. federal income, U.S. state and local, and foreign tax consequences of the acquisition, ownership, and disposition of Common Shares.
If an entity that is classified as a partnership (or “pass-through” entity) for U.S. federal income tax purposes holds Common Shares, the U.S. federal income tax consequences to such partnership (or “pass-through” entity) and the partners of such partnership (or owners of such “pass-through” entity) generally will depend on the activities of the partnership (or “pass-through” entity) and the status of such partners (or owners). Partners of entities that are classified as partnerships (or owners of “pass-through” entities) for U.S. federal income tax purposes should consult their own financial advisor, legal counsel or accountant regarding the U.S. federal income tax consequences of the acquisition, ownership, and disposition of Common Shares.
Tax Consequences Other than U.S. Federal Income Tax Consequences Not Addressed
This summary does not address the U.S. state and local, U.S. federal estate and gift, or foreign tax consequences to U.S. Holders of the acquisition, ownership, and disposition of Common Shares. Each U.S. Holder should consult its own financial advisor, legal counsel, or accountant regarding the U.S. state and local, U.S. federal estate and gift, and foreign tax consequences of the acquisition, ownership, and disposition of Common Shares.
U.S. Federal Income Tax Consequences of the Acquisition, Ownership, and Disposition of Common Shares
Distributions on Common Shares
General Taxation of Distributions
A U.S. Holder that receives a distribution, including a constructive distribution, with respect to the Common Shares will be required to include the amount of such distribution in gross income as a dividend (without reduction for any Canadian income tax withheld from such distribution) to the extent of the current or accumulated “earnings and profits” of the Company. To the extent that a distribution exceeds the current and accumulated “earnings and profits” of the Company, such distribution will be treated (a) first, as a tax-free return of capital to the extent of a U.S. Holder’s tax basis in the Common Shares and, (b) thereafter, as gain from the sale or exchange of such Common Shares. (See more detailed discussion at “Disposition of Common Shares” below).
Reduced Tax Rates for Certain Dividends
For taxable years beginning after December 31, 2002 and before January 1, 2013, a dividend paid by the Company generally will be taxed at the preferential tax rates applicable to long-term capital gains if (a) the Company is a “qualified foreign corporation” (as defined below), (b) the U.S. Holder receiving such dividend is an individual, estate, or trust, and (c) such dividend is paid on Common Shares that have been held by such U.S. Holder for at least 61 days during the 121-day period beginning 60 days before the “ex-dividend date.”
The Company generally will be a “qualified foreign corporation” under Section 1(h)(11) of the Code (a “QFC”) if: (a) the Company is incorporated in a possession of the U.S., (b) the Company is eligible for the benefits of the Canada-U.S. Tax Convention, or (c) the Common Shares are readily tradable on an established securities market in the U.S. However, even if the Company satisfies one or more of such requirements, the Company will not be treated as a QFC if the Company is a “passive foreign investment company” (as defined below) for the taxable year during which the Company pays a dividend or for the preceding taxable year.
As discussed below, the Company reasonably believes that it was not a “passive foreign investment company” for the taxable years ended December 31, 2008 through December 31, 2011. (See more detailed discussion at “Additional Rules that May Apply to U.S. Holders—Passive Foreign Investment Company” below).
If the Company is not a QFC, a dividend paid by the Company to a U.S. Holder, including a U.S. Holder that is an individual, estate, or trust, generally will be taxed at ordinary income tax rates (and not at the preferential tax rates applicable to long-term capital gains). The dividend rules are complex, and each U.S. Holder should consult its own financial advisor, legal counsel, or accountant regarding the dividend rules.
Distributions Paid in Foreign Currency
The amount of a distribution paid to a U.S. Holder in foreign currency generally will be equal to the U.S. Dollar value of such distribution based on the exchange rate applicable on the date of receipt.
Dividends Received Deduction
Dividends paid on the Common Shares generally will not be eligible for the “dividends received deduction.” The availability of the dividends received deduction is subject to complex limitations that are beyond the scope of this discussion, and a U.S. Holder that is a corporation should consult its own financial advisor, legal counsel, or accountant regarding the dividends received deduction.
Disposition of Common Shares
A U.S. Holder will recognize gain or loss on the sale or other taxable disposition of Common Shares in an amount equal to the difference, if any, between (a) the amount of cash plus the fair market value of any property received and (b) such U.S. Holder’s tax basis in the Common Shares sold or otherwise disposed. Any such gain or loss generally will be capital gain or loss, which will be long-term capital gain or loss if the Common Shares are held for more than one year. Gain or loss recognized by a U.S. Holder on the sale or other taxable disposition of Common Shares generally will be treated as “U.S. source” for purposes of applying the U.S. foreign tax credit rules. (See more detailed discussion at “Foreign Tax Credit” below).
Preferential tax rates apply to long-term capital gains of a U.S. Holder that is an individual, estate, or trust. There are currently no preferential tax rates for long-term capital gains of a U.S. Holder that is a corporation. Deductions for capital losses are subject to significant limitations under the Code.
Foreign Tax Credit
A U.S. Holder that pays (whether directly or through withholding) Canadian income tax with respect to dividends paid on the Common Shares generally will be entitled, at the election of such U.S. Holder, to receive either a deduction or a credit for such Canadian income tax paid. Generally, a credit will reduce a U.S. Holder’s U.S. federal income tax liability on a Dollar-for-Dollar basis, whereas a deduction will reduce a U.S. Holder’s income subject to U.S. federal income tax. This election is made on a year-by-year basis and applies to all foreign taxes paid (whether directly or through withholding) by a U.S. Holder during a year.
Complex limitations apply to the foreign tax credit, including the general limitation that the credit cannot exceed the proportionate share of a U.S. Holder’s U.S. federal income tax liability that such U.S. Holder’s “foreign source” taxable income bears to such U.S. Holder’s worldwide taxable income. In applying this limitation, a U.S. Holder’s various items of income and deduction must be classified, under complex rules, as either “foreign source” or “U.S. source.” In addition, this limitation is calculated separately with respect to specific categories of income. Dividends paid by the Company generally will constitute “foreign source” income and generally will be categorized as “passive income.” The foreign tax credit rules are complex, and each U.S. Holder should consult its own financial advisor, legal counsel, or accountant regarding the foreign tax credit rules.
Information Reporting; Backup Withholding Tax
Payments made within the U.S., or by a U.S. payer or U.S. middleman, of dividends on, or proceeds arising from the sale or other taxable disposition of, Common Shares generally will be subject to information reporting and backup withholding tax, at the rate of 28 percent, if a U.S. Holder (a) fails to furnish such U.S. Holder’s correct U.S. taxpayer identification number (generally on Form W-9), (b) furnishes an incorrect U.S. taxpayer identification number, (c) is notified by the IRS that such U.S. Holder has previously failed to properly report items subject to backup withholding tax, or (d) fails to certify, under penalty of perjury, that such U.S. Holder has furnished its correct U.S. taxpayer identification number and that the IRS has not notified such U.S. Holder that it is subject to backup withholding tax. However, U.S. Holders that are corporations generally are excluded from these information reporting and backup withholding tax rules. Any amounts withheld under the U.S. backup withholding tax rules will be allowed as a credit against a U.S. Holder’s U.S. federal income tax liability, if any, or will be refunded, if such U.S. Holder furnishes required information to the IRS. Each U.S. Holder should consult its own financial advisor, legal counsel, or accountant regarding the information reporting and backup withholding tax rules.
Additional Rules that May Apply to U.S. Holders
If the Company is a “controlled foreign corporation” or a “passive foreign investment company” (each as defined below), the preceding sections of this summary may not describe the U.S. federal income tax consequences to U.S. Holders of the acquisition, ownership, and disposition of Common Shares.
Controlled Foreign Corporation
The Company generally will be a “controlled foreign corporation” under Section 957 of the Code (a “CFC”) if more than 50 percent of the total voting power or the total value of the outstanding shares of the Company is owned, directly or indirectly, by citizens or residents of the U.S., domestic partnerships, domestic corporations, domestic estates, or domestic trusts (each as defined in Section 7701(a)(30) of the Code), each of which own, directly or indirectly, 10 percent or more of the total voting power of the outstanding shares of the Company (a “10 percent Shareholder”).
If the Company is a CFC, a 10 percent Shareholder generally will be subject to current U.S. federal income tax with respect to (a) such 10 percent Shareholder’s pro rata share of the “subpart F income” (as defined in Section 952 of the Code) of the Company and (b) such 10 percent Shareholder’s pro rata share of the earnings of the Company invested in “United States property” (as defined in Section 956 of the Code). In addition, under Section 1248 of the Code, any gain recognized on the sale or other taxable disposition of Common Shares by a U.S. Holder that was a 10 percent Shareholder at any time during the five-year period ending with such sale or other taxable disposition generally will be treated as a dividend to the extent of the “earnings and profits” of the Company that are attributable to such Common Shares. If the Company is both a CFC and a “passive foreign investment company” (as defined below), the Company generally will be treated as a CFC (and not as a “passive foreign investment company”) with respect to any 10 percent Shareholder.
The Company does not believe that it has previously been, or currently is, a CFC. However, there can be no assurance that the Company will not be a CFC for the current or any subsequent taxable year.
Passive Foreign Investment Company
The Company would be a “passive foreign investment company” under Section 1297 of the Code (a “PFIC”) if, for a taxable year, (a) 75 percent or more of the gross income of the Company for such taxable year is passive income or (b) 50 percent or more of the assets held by the Company either produce passive income or are held for the production of passive income, based on the fair market value of such assets (or on the adjusted tax basis of such assets, if the Company is not publicly traded and either is a “controlled foreign corporation” or makes an election). “Passive income” includes, for example, dividends, interest, certain rents and royalties, certain gains from the sale of stock and securities, and certain gains from commodities transactions.
For purposes of the PFIC income test and asset test described above, if the Company owns, directly or indirectly, 25 percent or more of the total value of the outstanding shares of another corporation, the Company will be treated as if it (a) held a proportionate share of the assets of such other foreign corporation and (b) received directly a proportionate share of the income of such other foreign corporation. In addition, for purposes of the PFIC income test and asset test described above, “passive income” does not include any interest, dividends, rents, or royalties that are received or accrued by the Company from a “related person” (as defined in Section 954(d)(3) of the Code), to the extent such items are properly allocable to the income of such related person that is not passive income.
Based on currently available information, the Companyreasonably believes that it was not a “passive foreign investment company” for the taxable years ended December 31, 2008 through December 31, 2012.
The determination of whether the Company was, or will be, a PFIC for a taxable year depends, in part, on the application of complex U.S. federal income tax rules, which are subject to differing interpretations. In addition, whether the Company will be a PFIC for each subsequent taxable year depends on the assets and income of the Company over the course of each such taxable year and, as a result, cannot be predicted with certainty as of the date of this Annual Report. Accordingly, there can be no assurance that the IRS will not challenge the determination made by the Company concerning its PFIC status.
Default PFIC Rules Under Section 1291 of the Code
If the Company is a PFIC, the U.S. federal income tax consequences to a U.S. Holder of the acquisition, ownership, and disposition of Common Shares will depend on whether such U.S. Holder makes an election to treat the Company as a “qualified electing fund” or “QEF” under Section 1295 of the Code (a “QEF Election”) or a mark-to-market election under Section 1296 of the Code (a “Mark-to-Market Election”). A U.S. Holder that does not make either a QEF Election or a Mark-to-Market Election will be referred to in this summary as a “Non-Electing U.S. Holder.”
A Non-Electing U.S. Holder will be subject to the rules of Section 1291 of the Code with respect to (a) any gain recognized on the sale or other taxable disposition of Common Shares and (b) any excess distribution paid on the Common Shares. A distribution generally will be an “excess distribution” to the extent that such distribution (together with all other distributions received in the current taxable year) exceeds 125 percent of the average distributions received during the three preceding taxable years (or during a U.S. Holder’s holding period for the Common Shares, if shorter).
Under Section 1291 of the Code, any gain recognized on the sale or other taxable disposition of Common Shares, and any excess distribution paid on the Common Shares, must be ratably allocated to each day in a Non-Electing U.S. Holder’s holding period for the Common Shares. The amount of any such gain or excess distribution allocated to prior years of such Non-Electing U.S. Holder’s holding period for the Common Shares (other than years prior to the first taxable year of the Company beginning after December 31, 1986 for which the Company was not a PFIC) will be subject to U.S. federal income tax at the highest tax applicable to ordinary income in each such prior year. A Non-Electing U.S. Holder will be required to pay interest on the resulting tax liability for each such prior year, calculated as if such tax liability had been due in each such prior year. Such a Non-Electing U.S. Holder that is not a corporation must treat any such interest paid as “personal interest,” which is not deductible. The amount of any such gain or excess distribution allocated to the current year of such Non-Electing U.S. Holder’s holding period for the Common Shares will be treated as ordinary income in the current year, and no interest charge will be incurred with respect to the resulting tax liability for the current year.
If the Company is a PFIC for any taxable year during which a Non-Electing U.S. Holder holds Common Shares, the Company will continue to be treated as a PFIC with respect to such Non-Electing U.S. Holder, regardless of whether the Company ceases to be a PFIC in one or more subsequent years. A Non-Electing U.S. Holder may terminate this deemed PFIC status by electing to recognize gain (which will be taxed under the rules of Section 1291 of the Code discussed above) as if such Common Shares were sold on the last day of the last taxable year for which the Company was a PFIC.
QEF Election
A U.S. Holder that makes a QEF Election generally will not be subject to the rules of Section 1291 of the Code discussed above. However, a U.S. Holder that makes a QEF Election will be subject to U.S. federal income tax on such U.S. Holder’s pro rata share of (a) the net capital gain of the Company, which will be taxed as long-term capital gain to such U.S. Holder, and (b) and the ordinary earnings of the Company, which will be taxed as ordinary income to such U.S. Holder. Generally, “net capital gain” is the excess of (a) net long-term capital gain over (b) net short-term capital loss, and “ordinary earnings” are the excess of (a) “earnings and profits” over (b) net capital gain. A U.S. Holder that makes a QEF Election will be subject to U.S. federal income tax on such amounts for each taxable year in which the Company is a PFIC, regardless of whether such amounts are actually distributed to such U.S. Holder by the Company. However, a U.S. Holder that makes a QEF Election may, subject to certain limitations, elect to defer payment of current U.S. federal income tax on such amounts, subject to an interest charge. If such U.S. Holder is not a corporation, any such interest paid will be treated as “personal interest,” which is not deductible.
A U.S. Holder that makes a QEF Election generally (a) may receive a tax-free distribution from the Company to the extent that such distribution represents “earnings and profits” of the Company that were previously included in income by the U.S. Holder because of such QEF Election and (b) will adjust such U.S. Holder’s tax basis in the Common Shares to reflect the amount included in income or allowed as a tax-free distribution because of such QEF Election. In addition, a U.S. Holder that makes a QEF Election generally will recognize capital gain or loss on the sale or other taxable disposition of Common Shares.
The procedure for making a QEF Election, and the U.S. federal income tax consequences of making a QEF Election, will depend on whether such QEF Election is timely. A QEF Election will be treated as “timely” if such QEF Election is made for the first year in the U.S. Holder’s holding period for the Common Shares in which the Company was a PFIC. A U.S. Holder may make a timely QEF Election by filing the appropriate QEF Election documents at the time such U.S. Holder files a U.S. federal income tax return for such first year. However, if the Company was a PFIC in a prior year, then in addition to filing the QEF Election documents, a U.S. Holder must elect to recognize (a) gain (which will be taxed under the rules of Section 1291 of the Code discussed above) as if the Common Shares were sold on the qualification date or (b) if the Company was also a CFC, such U.S. Holder’s pro rata share of the post-1986 “earnings and profits” of the Company as of the qualification date. The “qualification date” is the first day of the first taxable year in which the Company was a QEF with respect to such U.S. Holder. The election to recognize such gain or “earnings and profits” can only be made if such U.S. Holder’s holding period for the Common Shares includes the qualification date. By electing to recognize such gain or “earnings and profits,” such U.S. Holder will be deemed to have made a timely QEF Election. In addition, under very limited circumstances, a U.S. Holder may make a retroactive QEF Election if such U.S. Holder failed to file the QEF Election documents in a timely manner.
A QEF Election will apply to the taxable year for which such QEF Election is made and to all subsequent taxable years, unless such QEF Election is invalidated or terminated or the IRS consents to revocation of such QEF Election. If a U.S. Holder makes a QEF Election and, in a subsequent taxable year, the Company ceases to be a PFIC, the QEF Election will remain in effect (although it will not be applicable) during those taxable years in which the Company is not a PFIC. Accordingly, if the Company becomes a PFIC in another subsequent taxable year, the QEF Election will be effective and the U.S. Holder will be subject to the QEF rules described above during any such subsequent taxable year in which the Company qualifies as a PFIC. In addition, the QEF Election will remain in effect (although it will not be applicable) with respect to a U.S. Holder even after such U.S. Holder disposes of all of such U.S. Holder’s direct and indirect interest in the Common Shares. Accordingly, if such U.S. Holder reacquires an interest in the Company, such U.S. Holder will be subject to the QEF rules described above for each taxable year in which the Company is a PFIC.
Each U.S. Holder should consult its own financial advisor, legal counsel, or accountant regarding the availability of, and procedure for making, a QEF Election. U.S. Holders should be aware that there can be no assurance that the Company will satisfy record keeping requirements that apply to a QEF, or that the Company will supply U.S. Holders with information that such U.S. Holders require to report under the QEF rules, in event that the Company is a PFIC and a U.S. Holder wishes to make a QEF Election.
Mark-to-Market Election
A U.S. Holder may make a Mark-to-Market Election only if the Common Shares are marketable stock. The Common Shares generally will be “marketable stock” if the Common Shares are regularly traded on a qualified exchange or other market. For this purpose, a “qualified exchange or other market” includes (a) a national securities exchange that is registered with the SEC, (b) the national market system established pursuant to section 11A of the Securities and Exchange Act of 1934, or (c) a foreign securities exchange that is regulated or supervised by a governmental authority of the country in which the market is located, provided that (i) such foreign exchange has trading volume, listing, financial disclosure, surveillance, and other requirements designed to prevent fraudulent and manipulative acts and practices, remove impediments to and perfect the mechanism of a free, open, fair, and orderly market, and protect investors (and the laws of the country in which the foreign exchange is located and the rules of the foreign exchange ensure that such requirements are actually enforced) (ii) the rules of such foreign exchange effectively promote active trading of listed stocks. If the Common Shares are traded on such a qualified exchange or other market, the Common Shares generally will be “regularly traded” for any calendar year during which the Common Shares are traded, other than in de minimis quantities, on at least 15 days during each calendar quarter. The Company believes that its Common Shares should qualify as marketable stock.
A U.S. Holder that makes a Mark-to-Market Election generally will not be subject to the rules of Section 1291 of the Code discussed above. However, if a U.S. Holder makes a Mark-to-Market Election after the beginning of such U.S. Holder’s holding period for the Common Shares and such U.S. Holder has not made a timely QEF Election, the rules of Section 1291 of the Code discussed above will apply to certain dispositions of, and distributions on, the Common Shares.
A U.S. Holder that makes a Mark-to-Market Election will include in ordinary income, for each taxable year in which the Company is a PFIC, an amount equal to the excess, if any, of (a) the fair market value of the Common Shares as of the close of such taxable year over (b) such U.S. Holder’s tax basis in such Common Shares. A U.S. Holder that makes a Mark-to-Market Election will be allowed a deduction in an amount equal to the lesser of (a) the excess, if any, of (i) such U.S. Holder’s adjusted tax basis in the Common Shares over (ii) the fair market value of such Common Shares as of the close of such taxable year or (b) the excess, if any, of (i) the amount included in ordinary income because of such Mark-to-Market Election for prior taxable years over (ii) the amount allowed as a deduction because of such Mark-to-Market Election for prior taxable years.
A U.S. Holder that makes a Mark-to-Market Election generally also will adjust such U.S. Holder’s tax basis in the Common Shares to reflect the amount included in gross income or allowed as a deduction because of such Mark-to-Market Election. In addition, upon a sale or other taxable disposition of Common Shares, a U.S. Holder that makes a Mark-to-Market Election will recognize ordinary income or loss (such ordinary loss not to exceed the excess, if any, of (a) the amount included in ordinary income because of such Mark-to-Market Election for prior taxable years over (b) the amount allowed as a deduction because of such Mark-to-Market Election for prior taxable years).
A Mark-to-Market Election applies to the taxable year in which such Mark-to-Market Election is made and to each subsequent taxable year, unless the Common Shares cease to be “marketable stock” or the IRS consents to revocation of such election. Each U.S. Holder should consult its own financial advisor, legal counsel, or accountant regarding the availability of, and procedure for making, a Mark-to-Market Election.
Other PFIC Rules
Under Section 1291(f) of the Code, the IRS has issued proposed Treasury Regulations that, subject to certain exceptions, would cause a U.S. Holder that had not made a timely QEF Election to recognize gain (but not loss) upon certain transfers of Common Shares that would otherwise be tax-deferred (e.g., gifts and exchanges pursuant to corporate reorganizations). However, the specific U.S. federal income tax consequences to a U.S. Holder may vary based on the manner in which Common Shares are transferred.
Certain additional adverse rules will apply with respect to a U.S. Holder if the Company is a PFIC, regardless of whether such U.S. Holder makes a QEF Election. For example under Section 1298(b)(6) of the Code, a U.S. Holder that uses Common Shares as security for a loan will, except as may be provided in Treasury Regulations, be treated as having made a taxable disposition of such Common Shares.
The PFIC rules are complex, and each U.S. Holder should consult its own financial advisor, legal counsel, or accountant regarding the PFIC rules and how the PFIC rules may affect the U.S. federal income tax consequences of the acquisition, ownership, and disposition of Common Shares.
Additional Tax on Passive Income
For tax years beginning after December 31, 2012, certain individuals, estates and trusts whose income exceeds certain thresholds will be required to a pay 3.8 percent Medicare surtax on “net investment income” including, among other things, dividends and get gain from disposition of property (other than property held in a trade or business). U.S. Holders should consult with their own tax advisors regarding the effect, if any, of this tax on their ownership and disposition of common shares.
| F. | Dividends and Paying Agents |
This Form 20-F is being filed as an Annual Report under the Exchange Act and, as such, there is no requirement to provide any information under this section.
This Form 20-F is being filed as an Annual Report under the Exchange Act and, as such, there is no requirement to provide any information under this section.
Documents referred to in this Annual Report may be inspected at the head office of the Company at Suite 250 – 14142 Denver West Parkway, Golden, Colorado 80401 or the Company's Canadian legal counsel located at –Suite 900, 900 Howe Street, Vancouver, British Columbia, V6Z 2M4 during normal business hours.
The Company is subject to the information requirements of the Exchange Act and, to the extent required of Canadian companies, will file periodic reports and other information with the SEC. All such reports and information may be ready and copied at the public reference facilities listed below. The Company intends to give its shareholders annual reports containing audited consolidated financial statements and a report thereon from its independent chartered accountants and quarterly reports for the first three quarters of each year containing unaudited interim financial information.
The Company’s SEC filings, and the exhibits thereto, are available for inspection and copying at the public reference facilities maintained by the SEC in Judiciary Plaza, 100 F Street, NE, Room 1580, Washington, DC 20549. Copies of these filings may be obtained from these offices after the payment of prescribed fees. Please call the SEC at (202) 551-8090 for further information on the public reference rooms. These filings are also available at no charge at the SEC’s website at http//www.sec.gov.
The Company will also provide its shareholders with proxy statements prepared according to Canadian law. As a Canadian company, the Company is exempt from the Exchange Act rules about prescribing the furnishing and content of proxy statements to shareholders and is also exempt from the short-swing profit recovery and disclosure regime of section 16 of the Exchange Act.
| ITEM 11. | QUANTITATIVE AND QUALITATIVE DISCLOSURES ABOUT MARKET RISK |
Quantitative Information about Market Risk
Derivatives:As of December 31, 2013, the Company owned an immaterial set of call options. Other than the embedded forward sales contracts within the 2009 Gold Bonds, with one exception, no other derivatives were utilized in 2013 and 2012. In October 2013, the Company placed hedges to cover the sale of 2,600 gold ounces in the first quarter of 2014. These hedges set a floor on the sales price of $1,300 per ounce and set call-price participation at $1,425 per ounce. These hedges were a combination of forward sales at a discount and call options purchased with the discount to set a price at which the Company again profits from upward movements. In December 2013, the Company exercised the forwards early, securing the $1,300 price per ounce when the spot rate was below this level, and retained the call options.
The Company’s open hedge positions as of December 31, 2012 consisted solely of those embedded in the 2009 Gold Bonds. The 2009 Gold Bonds were repaid by delivering 814 gold ounces per quarter through and including December 2013.
The Company’s policy is to not hedge more than 50 percent of projected production and to retain a 25 percent production reserve tail. At December 31, 2013 and 2012, the outstanding hedge positions covered, to some degree, less than 6 percent and less than 9 percent, respectively, of the annual forward looking gold production from Briggs.
Qualitative Information about Market Risks
The Company is exposed to a number of financial risks including market risks, credit risks and liquidity risks. Market risks include commodity price risk, security price risk, foreign exchange risk, and fair value interest rate risk. The Company has risk management policies and programs that involve senior management and when appropriate, the Board of Directors of the Company (the “Board”). The main purpose of these policies and programs is to manage cash flow and raise financing as required and in a timely fashion for the Company’s development programs. The Company may use various financial instruments to manage related risks. It is the Company’s policy that no trading in derivatives for speculative purposes shall be undertaken.
Gold price risk: The Company’s primary product is gold. The value of the Company’s inventory and long-lived assets, its earnings and its operating cash flows are significantly impacted by the market price of gold. The market price of gold and the value of mineral interests related thereto have fluctuated widely and are affected by numerous factors beyond the control of the Company. These factors include international economic and political conditions, expectations of inflation, international currency exchange rates, interest rates, global or regional consumptive patterns, speculative activities, changes in production due to mine development and improved mining and production methods, metal stock levels, governmental regulations, and central bank policies. The exact effect of these factors cannot be accurately predicted, but the combination of these factors may result in the Company not receiving a profit or acceptable rate of return on invested capital or the investment not retaining its value.
For 2013, if the price of gold averaged 10 percent higher or lower per ounce, the Company would have recorded an increase or decrease in revenue of approximately $4.5 million, respectively. For 2012, if the price of gold averaged 10 percent higher or lower per ounce, the Company would have recorded an increase or decrease in revenue of approximately $6.0 million, respectively.
The Company may enter into gold derivative contracts (hedges) to mitigate the impacts of lower gold prices on its operations. Management and the Board have set a gold hedge limit of 50 percent of annual production plus a reserve tail of 25 percent of the life-of-mine production. The gold derivative contracts may include the purchase of put options and the sale of call options, which in some cases are structured as a collar, and forward gold sales, including embedded derivatives. Derivative financial instruments are recorded at fair value, and hedge accounting has not been employed.
2,600 call-options, participating at $1,425 per gold ounce and having maturity dates throughout first quarter 2014, were held at December 31, 2013; and these had an immaterial fair value. The only derivative contracts existing as of December 31, 2012 were embedded forward gold sales in the 2009 Gold Bonds.
Liquidity risk: Liquidity risk represents the risk that the Company cannot fund its current operations and obligations. This risk arises in turn primarily from operating and business risks that have the potential to disrupt cash flows, inclusive of risks of material changes in gold prices, production schedules and outputs, operating costs, spending on or timing of development, and changes in regulations. Cash flow forecasting is performed regularly in aggregate for the Company with the objective of managing operating, investing, and financing cash flows to maintain a continuity of funding.
Economic factors beyond the Company’s control may also make additional funding temporarily unavailable. Should cash flows from operations and existing cash be insufficient to meet current obligations, refinancing of debt obligations, the sale of assets, or an equity issuance would be necessary, and there is no assurance that such financing activities would be successful.
A new covenant in the third amendment to the Sprott credit agreement, entered in October of 2013, reduced permitted equipment financing to $10.5 million through December 31, 2013 and to $10.0 million for periods in 2014 through the loan expiration date of November 31, 2014. The subsequent refinancing with Waterton permits up to $12 million of equipment financing.
The Sprott Loan, as amended in October 2013, precluded additional borrowing, except for Permitted Encumbrances. The Sprott Loan could be terminated early, however as amended, an early prepayment fee of 2 percent was due Sprott. The subsequent refinancing with Waterton also precluded additional borrowing, other than Permitted Debt, and allows early prepayments without incurrence of a prepayment fee.
Sprott required security interests principally in the Briggs Mine and Pinson Mine. In the subsequent refinancing, Waterton required security interests in the Reward and Columbia projects in addition to these two mines.
The table below summarizes the maturity profile of the Company’s financial liabilities based on contractual undiscounted payments as of the dates indicated. In both 2013 and in 2012, extensions and refinancings subsequent to year-ends of note obligationshave been reclassified to the later appropriate columns. The amounts shown are based on payment obligations and exclude unamortized discounts with which these amounts are combined on the balance sheets.
| | | | | | Payments due by Period as of December 31, 2013 | |
| | | | | | Less than | | | Between 3
months | | | | | | | | | More than | |
| | | Total | | | 3 months | | | and 1 year | | | 1-3 years | | | 3-5 years | | | 5-years | |
| Trade and other payables | | $ | 7,196,300 | | | $ | 6,745,100 | | | $ | 451,200 | | | $ | - | | | $ | - | | | $ | - | |
| Finance lease obligations | | | 5,842,800 | | | $ | 537,400 | | | $ | 1,598,700 | | | $ | 3,706,700 | | | $ | - | | | $ | - | |
| Long term debt obligations | | | 19,006,900 | | | $ | 100,500 | | | $ | 1,048,200 | | | $ | 17,858,200 | | | $ | - | | | $ | - | |
| | | | | | | | | | | | | | | | | | | | | | | | | |
| Total | | $ | 32,046,000 | | | $ | 7,383,000 | | | $ | 3,098,100 | | | $ | 21,564,900 | | | $ | - | | | $ | - | |
| | | | | | Payments due by Period as of December 31, 2012 | |
| | | | | | Less than | | | Between 3
months | | | | | | | | | More than | |
| | | Total | | | 3 months | | | and 1 year | | | 1-3 years | | | 3-5 years | | | 5-years | |
| Trade and other payables | | $ | 7,163,500 | | | $ | 6,642,500 | | | $ | 521,000 | | | $ | - | | | $ | - | | | $ | - | |
| Finance lease obligations | | | 3,330,900 | | | | 276,700 | | | | 788,200 | | | | 2,266,000 | | | | - | | | | - | |
| Derivative financial instruments | | | 1,733,500 | | | | 442,600 | | | | 1,290,900 | | | | - | | | | - | | | | - | |
| Long term debt obligations | | | 26,601,400 | | | | 3,738,900 | | | | 9,630,133 | | | | 13,232,367 | | | | - | | | | - | |
| | | | | | | | | | | | | | | | | | | | | | | | | |
| Total | | $ | 38,829,300 | | | $ | 11,100,700 | | | $ | 12,230,233 | | | $ | 15,498,367 | | | $ | - | | | $ | - | |
Capital management: The primary objective of the Company’s capital management is to maintain healthy capital ratios in order to support its operations and development, limit the risks of default on debt obligations, and maximize shareholder value. The Company manages its capital structure and makes adjustments to it in light of business and economic conditions. To date, the Company has not declared or paid any dividends. The Company has issued new shares and may again in order to maintain or adjust its capital structure. The Company has the practice of developing its mines at a controlled and measured pace in order to manage financial leverage. Management principally considers the debt to total asset ratio as a measure of financial leverage and overall capital structure; such ratio being 32 percent at December 31, 2013 after recognizing the impacts of impairments of long-lived assets and 27 percent at December 31, 2012. Long-term cash flow forecasts are prepared at least annually for the Company with the objective of managing debt levels, rates of development, and the long-term capital structure.
Foreign exchange risk: A debt obligation of C$17.5 million was denominated in Canadian dollars as of December 31, 2013. Otherwise, the Company’s assets, liabilities, revenues and costs are primarily denominated in USD, and not significantly impacted by foreign exchange risks. When this debt was refinanced on January 31, 2014, the exchange rate was 1.1178 CAD/USD and the value in USD was $15.7 million.
One of the market conditions that may affect the price of gold is the extent to which gold is viewed as a safe-haven or hedge against fluctuations in major currencies such as the US dollar and the Euro. Foreign exchange may therefore have a significant indirect impact upon the Company.
Credit and customer risks: Credit risk represents the loss that would be recognized if counterparties failed to perform as contracted. Credit risks arise from market, industry, and individual counterparty conditions. Concentrations of credit risk, on or off balance sheet, exist for counterparties when they have similar economic characteristics that would cause their ability to meet contractual obligations to be similarly affected by changes in economic or other conditions. The Company manages counterparty credit risk by monitoring the creditworthiness of counterparties.
The Company is subject to concentrations of credit risk in connection with maintaining its cash balances primarily in U.S. and Canadian financial institutions in amounts in excess of levels insured by the Federal Deposit Insurance Corporation and the Canada Deposit Insurance Corporation. Restricted cash held as collateral against surety bonds is invested by the surety-trustee in certificates of deposit and US Treasury instruments.
Sales of gold by Briggs expose the Company to the credit risk of nonpayment by the buyer. Briggs sells all of its gold to one or two customers with payment terms of 0 to 14 days. At any one time, the level of receivable is usually less than two percent of the Company’s total annual revenues. Due to the global and liquid markets for gold, geographic and customer concentrations are considered to pose immaterial risks.
Pinson-underground is presently on care and maintenance. When it resumes development and operations and to the extent it sells ore and doré, distinguished from gold sales by Briggs, and generates trade receivables, credit risk will arise. Pinson has a life-of-mine contract to place, at its option, sulfide ore with a separate third-party processor, Barrick Gold Corporation (“Barrick”), who will also buy the resultant doré under agreed upon terms.
To date, the Company has undertaken little credit risk with counter-parties for hedges, however this risk may increase in the future to the extent more hedging is undertaken or prices of the underlying commodities vary more dramatically during the term of the hedges.
Equity securities price risk: The Company is exposed to equity securities price risk because of investments held as available-for-sale. These securities have typically been received in payment from joint venture or other business partners for obligations due. The fair value balances of available-for-sale securities at December 31, 2013 and December 31, 2012 were $56,400 and $83,900, respectively, representing the maximum potential losses from changes in prices of equity investments.
Fair value interest rate risk: The Company has only entered into debt agreements with fixed interest rates. Fixed interest rates expose the Company to fair value interest rate risks. There is the qualitative risk that a fixed rate liability will become uncompetitive in the future as market rates decline or the Company’s credit position improves. There is a quantitative risk that the interest rate will increase upon refinancing of debt obligations in the future as market rates increase or the Company’s credit position deteriorates. The Company’s other qualitative interest rate risk arises from the mismatch of fixed rate liabilities and floating rate assets. Management of the fair value interest rate risk involves taking into consideration the duration of debt agreements, refinancing penalties, options to renew existing positions, the availability of floating–rate debt and other alternative financing.
Regulatory risk: Changes in the regulatory environment in the U.S. may affect the recoverability of mineral reserves, the costs of operating, the costs of reclamation, and other factors having a material impact upon the business. The Company works diligently and in good faith to meet or exceed all applicable permitting requirements, reclamation obligations, and other regulations, but is subject to the authoritative changes.
Another form of regulatory risk is the potential change in income, severance, or other tax rates and laws that could reduce future profitability and impair deferred tax assets. The Company has only taken more-likely-than-not positions in determining its deferred tax assets.
| ITEM 12. | DESCRIPTION OF SECURITIES OTHER THAN EQUITY SECURITIES |
This Form 20-F is being filed as an Annual Report under the Exchange Act and, as such, there is no requirement to provide any information under this section.
This Form 20-F is being filed as an Annual Report under the Exchange Act and, as such, there is no requirement to provide any information under this section.
Not applicable.
PART II
| ITEM 13. | DEFAULTS, DIVIDEND ARREARAGES AND DELINQUENCIES |
Not applicable.
| ITEM 14. | MATERIAL MODIFICATIONS TO THE RIGHTS OF SECURITY HOLDERS AND USE OF PROCEEDS |
At the Annual General & Special Meeting of the Company held on June 5, 2012, the shareholders approved a shareholders rights plan. Previously, the Company had a Shareholder Rights Plan (the “Rights Plan”), which was confirmed by the shareholders at the Annual and Extraordinary General Meeting held on June 8, 2001 and at the Annual and Extraordinary General Meeting held on April 14, 2005. The prior Rights Plan expired on May 8, 2008.
| ITEM 15. | CONTROLS AND PROCEDURES |
Evaluation of Disclosure Controls and Procedures
The Company maintains disclosure controls and procedures that are designed to ensure that information required to be disclosed in our Exchange Act reports is recorded, processed, summarized and reported within the time periods specified in the SEC’s rules and forms and that such information is accumulated and communicated to our chief executive officer and chief financial officer to allow timely decisions regarding required disclosure. Management, including our chief executive officer and our chief financial officer, after evaluating the effectiveness of our disclosure controls and procedures (as defined in the U.S. Securities Exchange Act of 1934 under Rule 13a-15(e)) has concluded that our disclosure controls and procedures were effective for 2013 and 2012.
Management’s Annual Report on Internal Control Over Financial Reporting
Management, including the chief executive officer and chief financial officer, is responsible for establishing and maintaining adequate internal control over financial reporting, as defined under Exchange Act Rules 13a-15(f) and 15d-15(f). Internal control over financial reporting is a process designed to provide reasonable assurance regarding the reliability of financial reporting and the preparation of financial statements for external purposes in accordance with accounting principles generally accepted in the United States. Internal control over financial reporting includes those policies and procedures that: (i) pertain to the maintenance of records that, in reasonable detail, accurately and fairly reflect the transactions and dispositions of our assets; (ii) provide reasonable assurance that transactions are recorded as necessary to permit preparation of financial statements in accordance with generally accepted accounting principles, and that receipts and expenditures are being made only in accordance with appropriate authorizations; and (iii) provide reasonable assurance regarding prevention or timely detection of unauthorized acquisition, use, or disposition of assets that could have a material effect on the financial statements.
Management assessed the effectiveness of internal control over financial reporting as of December 31, 2013 and December 31, 2012. In conducting its assessment of internal control over financial reporting, management based its evaluation on the framework in “Internal Control – Integrated Framework” issued by the Committee of Sponsoring Organizations, or the COSO, of the Treadway Commission. Based on that assessment, management has concluded that internal control over financial reporting was effective as of December 31, 2013 and December 31, 2012.
As the capitalization of the Company as of June 30, 2013 did not meet the threshold required pursuant to rules of the SEC, this Annual Report does not include an attestation report of the Company’s independent registered public accounting firm regarding internal control over financial reporting whereas such an attestation report was provided in the Annual Report for 2012.
There were no significant changes in internal control over financial reporting that occurred during 2013 or 2012 that have materially affected, or are reasonably likely to materially affect, our internal control over financial reporting.
| ITEM 16A. | AUDIT COMMITTEE FINANCIAL EXPERT |
The Board has determined that it has at least two audit committee financial experts (as such term is defined in the rules and regulations of the SEC) serving on its Audit Committee. Mr. David Fagin and Mr. Paul Zink have been determined to be such audit committee financial experts and are independent as defined in National Instrument 58-101, meaning that, they have no direct or indirect relationship with the issuer which could, in the view of the Board, reasonably be expected to interfere with the exercise of their independent judgment, and are not otherwise deemed not to be independent. The SEC has indicated that the designation of an audit committee financial expert does not make Mr. Fagin or Mr. Zink an “expert” for any purpose, impose on him any duties, obligations or liability that are greater than the duties, obligations or liability imposed on him as a member of the Audit Committee and the Board in absence of such designation, or affect the duties, obligations or liability of any other member of the Audit Committee or Board.
The Company has adopted the following code of ethics that applies to all the Company’s officers, including the chief executive officer and the chief financial officer. The Code of Ethics has been posted to the Company’s website at http://www.atna.com/i/pdf/CodeEthics.pdf.
It is the policy of the Company that all officers, including the chief executive officer and the chief financial officer, adhere to and advocates the following principles governing their professional and ethical conduct in the fulfillment of their responsibilities:
| 1. | Act with honesty and integrity, avoiding actual or apparent conflicts between his or her personal, private interest and the interest of the Company, including receiving improper personal benefits as a result of his or her position. |
| 2. | Provide stakeholders with information that is accurate, complete, objective, relevant, timely and understandable. |
| 3. | Comply with laws of federal, provincial and local governments applicable to the Company, and the rules and regulations of private and public regulatory agencies having jurisdiction over the Company. |
| 4. | Act in good faith, responsibly, with due care, and diligence, without misrepresenting or omitting material facts or allowing independent judgment to be compromised. |
| 5. | Respect the confidentiality of information acquired in the course of the performance of his or her responsibilities except when authorized or otherwise legally obligated to disclose. Do not use confidential information, acquired in the course of the performance of his or her responsibilities, for personal advantage. Do not compete directly or indirectly with the Company. |
| 6. | Proactively promote ethical behavior among subordinates and peers. |
| 7. | Use corporate assets and resources employed or entrusted in a responsible manner. |
| 8. | Advance the Company’s legitimate interest and proactively promote high integrity as a responsible member of his or her business team and/or in his or her work environment. |
| ITEM 16C. | PRINCIPAL ACCOUNTANT FEES AND SERVICES |
Audit Fees
The appointment of the Company’s auditor, EKS&H LLLP, was approved by the shareholders at the Annual General Meeting held on May 7, 2013. For the years ended December 31, 2013 and 2012, fees charged by the Company’s external auditors are shown below.
| | | 2013 | | | 2012 | |
| | | | | | | |
| Audit fees | | $ | 111,100 | | | $ | 103,700 | |
| Tax fees | | | - | | | | - | |
| Internal control audit | | | - | | | $ | 46,000 | |
| All other | | $ | 19,600 | | | $ | 20,500 | |
The Company’s Audit Committee Charter incorporates the Company’s pre-approval policies and procedures. All services rendered by EKS&H LLLP during 2013 and 2012 were approved by the Audit Committee pursuant to the pre-approval policies and procedures contained in the Audit Committee Charter.
| ITEM 16D. | EXEMPTION FROM THE LISTING STANDARDS FOR AUDIT COMMITTEES |
Not Applicable.
| ITEM 16E. | PURCHASES OF EQUITY SECURITIES BY THE ISSUER AND AFFILIATED PURCHASERS |
The Company did not repurchase any of its shares in the fiscal years ended December 31, 2013 and 2012.
| ITEM 16F. | CHANGE IN REGISTRANT’S CERTIFYING ACCOUNTANT |
Not Applicable.
| ITEM 16G. | CORPORATE GOVERNANCE |
Not Applicable.
| ITEM 16H. | MINE SAFETY DISCLOSURE |
The information concerning mine safety violations or other regulatory matters required by Section 1503(a) of the Dodd-Frank Wall Street Reform and Consumer Protection Act is attached hereto as Exhibit 16.1 and incorporated herein by reference.
PART III
| ITEM 17. | FINANCIAL STATEMENTS |
Not applicable.
| ITEM 18. | FINANCIAL STATEMENTS |
See the Exhibits listed in Item 19 of this document and filed as part of this annual report.
The consolidated financial statements were prepared in accordance with IFRS and are expressed in U.S. Dollars. For a history of exchange rates in effect for Canadian Dollars as against U.S. Dollars, see Item 3.A, titled “Selected Financial Data”.
| Exhibit 1.1 | | | BC Business Corporation Act – Articles of Incorporation (Filed as Exhibit 99.0 to the Company’s Annual Report on Form 20-F for the fiscal year ended December 31, 2007 (File No. 0-29336), and are incorporated herein by reference). | | |
| | | | | | |
| Exhibit 3.1 | | | Employment Agreements for last two years. (Those for continuing officers; Hesketh, Gloss, and Stanley; were filed as Exhibit 3.1 to the Company’s Annual Report on Form 20-F for the fiscal year ended December 31, 2011, and are incorporated herein by reference.) | | |
| | | | | | |
| Exhibit 4.1 | | | Pinson Purchase Agreement (edited). (Filed as Exhibit 4.1 to the Company’s Annual Report on Form 20-F for the fiscal year ended December 31, 2011, and incorporated herein by reference.) | | |
| | | | | | |
| Exhibit 4.2 | | | The Sprott Loan Agreement Amendment of October / December 2013. (The Sprott Loan Agreement with Amendments of February 2012 and March 2013 were filed as Exhibit 4.2 to the Company’s Annual Report on Form 20-F for the fiscal year ended December 31, 2012, and are incorporated herein by reference.) | | (1) |
| | | | | | |
| Exhibit 4.3 | | | Gold Bond Agreement without attachments/exhibits. (Filed as Exhibit 4.3 to the Company’s Annual Report on Form 20-F for the fiscal year ended December 31, 2011, and incorporated herein by reference.) | | |
| | | | | | |
| Exhibit 4.4 | | | Shareholder Rights Plan adopted in June 2012 (Filed as Exhibit 4.4 to the Company’s Annual Report on Form 20-F for the fiscal year ended December 31, 2012, and incorporated herein by reference.) | | |
| Exhibit 4.5 | | | Short Form Offering – September 2012 (Filed as Exhibit 4.5 to the Company’s Annual Report on Form 20-F for the fiscal year ended December 31, 2012, and incorporated herein by reference.) | | |
| | | | | | |
| Exhibit 4.6 | | | Majority Voting & Advance Notice policies (Filed as Exhibit 4.6 to the Company’s Annual Report on Form 20-F for the fiscal year ended December 31, 2012, and incorporated herein by reference.) | | |
| | | | | | |
| Exhibit 4.7 | | | Restricted Share Unit Plan adopted May 7, 2013 | | (1) |
| | | | | | |
| Exhibit 4.8 | | | Amended Stock Option Plan, May 7, 2013 | | (1) |
| | | | | | |
| Exhibit 4.9 | | | Documents related to Private Placement of common shares in September of 2013 | | (1) |
| | | | | | |
| Exhibit 4.10 | | | Waterton Credit Agreement, January 31, 2013 (Filed on SEDAR on February 7, 2014 and as 6-K on EDGAR on February 13, 2014 and incorporated herein by reference.) | | |
| | | | | | |
| Exhibit 8.1 | | | List of Subsidiaries. | | (1) |
| | | | | | |
| Exhibit 12.1 | | | Section 302 Certifications by the chief executive officer and chief financial officer as required by rule 13a-14(a) or Rule 15d-14(a). | | (1) |
| | | | | | |
| Exhibit 13.1 | | | Section 906 Certifications by the Chief Executive Officer and Chief Financial Officer as required by Rule 13a-14(b) or Rule 15d-14(b) and Section 1350 of Chapter 63 of Title 18 of the United States code. | | (1) |
| | | | | | |
| Exhibit 14.1 | | | Consent of Independent Registered Public Accounting Firm EKS&H LLLP. | | (1) |
| | | | | | |
| Exhibit 15.1 | | | Audited Consolidated Financial Statements and Notes thereto. | | (1) |
| | | | | | |
| | (i) | | Report of Independent Registered Public Accounting Firm EKS&H LLLP dated March 14, 2014. | | (1) |
| | | | | | |
| | (ii) | | Consolidated Balance Sheets as of December 31, 2013 and 2012. | | (1) |
| | | | | | |
| | (iii) | | Consolidated Statements of Operations for the years ended December 31, 2013, 2012 and 2011. | | (1) |
| | | | | | |
| | (iv) | | Consolidated Statements of Cash Flows for the years ended December 31, 2013, 2012 and 2011. | | (1) |
| | | | | | |
| | (v) | | Notes to Consolidated Financial Statements | | (1) |
| | | | | | |
| | (vi) | | Consolidated Financial Statements Schedules are omitted because they are not applicable, not required or because the required information is included in the consolidated financial statements or notes thereto filed herein. | | N/A |
| | | | | | |
| Exhibit 15.2 | | | Management’s Discussion and Analysis for the years ended December 31, 2013 and 2012. | | (1) |
| | | | | | |
| Exhibit 16.1 | | | Mine safety disclosure, as required by Section 1503 of the Dodd-Frank Wall Street Reform and Consumer Protection Act. | | (1) |
SIGNATURES
The registrant hereby certifies that it meets all of the requirements for filing on Form 20-F and that it has duly caused and authorized the undersigned to sign this annual report on its behalf.
| ATNA RESOURCES LTD. | |
| | |
| /s/ “James K.B. Hesketh” | |
| | |
| James K.B. Hesketh | |
| President and Chief Executive Officer | |
| March 14, 2014 | |