 HopFed Bancorp, Inc. Investor Presentation NASDAQ: HFBC www.bankwithheritage.com Exhibit 99.1 |
 CAUTIONARY STATEMENT Information provided herein contains “forward-looking statements” with respect to the Company’s financial condition, results of operations and business. These forward- looking statements involve certain risks and uncertainties and are based on the beliefs and assumptions of management and information available at the time that this presentation was prepared. Factors that may cause actual results to differ materially from those contemplated by such forward-looking statements include: (1) general economic or business conditions may be less favorable than expected; (2) changes in interest rates may reduce net interest margins and/or the volumes and values of loans made or held, as well as the value of other financial assets; (3) competitive pressures among depository and other financial institutions may increase significantly; (4) legislative or regulatory changes may adversely affect the Company’s business; (5) local, state or federal taxing authorities may take adverse tax positions; (6) adverse changes may occur in the securities markets; and (7) competitors may have greater financial resources and develop products that enable them to compete more successfully than the Company. Accordingly, any forward-looking statements included herein do not purport to be predictions of future events or circumstances and may not be realized. Factors that might cause such a difference, include, but are not limited to, those discussed in periodic filings with the SEC. |
 History of Organization • 1879 Hopkinsville Building and Loan founded • 1940 Date of deposit insurance • 1998 HopFed Bancorp first traded on NASDAQ • 5/2002 Changed bank name to Heritage Bank • 9/2002 Acquired 2 branch offices in Fulton, Kentucky • 6/2006 Acquired 4 branch offices in Cheatham and Houston Counties in Middle Tennessee • 12/2006 Opened first of three retail banking offices in Clarksville, Tennessee |
 • John E. Peck President & CEO • Mike Woolfolk Executive VP & COO • Boyd Clark Senior Vice President • Billy Duvall Sr.VP & & Chief Financial Officer • Michael F. Stalls Sr.VP & Chief Credit Officer SENIOR MANAGEMENT |
 Full Service Banking from a Local Community Bank • Retail Loan Services included both fixed and variable rate home mortgages that include options for servicing release or retained • Full product line of consumer loans with modest exposure to Indirect Lending • Full range of business loans including SBA loans, floor plan loans, small business loans, development and construction loans, agricultural loans and agri-business loans. • Brokerage Services • Property, Life and Casualty Insurance • Full range of deposit products including Internet Banking with free bill pay, bank by phone, ATM / Debit Cards and Cash Management Services • Specialize in providing deposit services to municipal customers in Western Kentucky and Middle Tennessee |
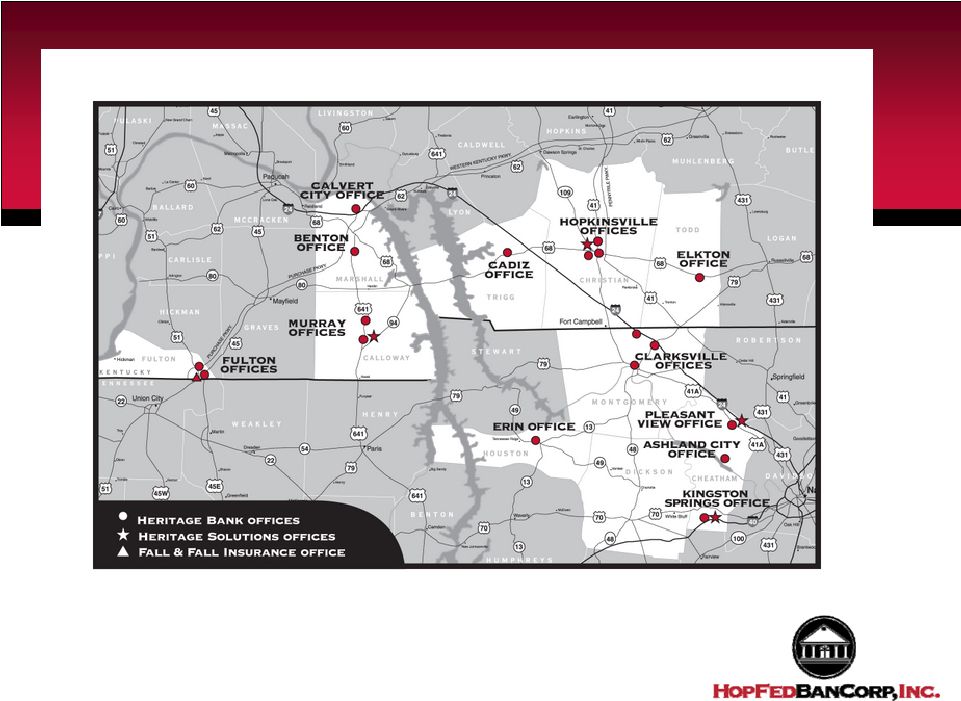 Kentucky & Tennessee Locations |
 Operational Philosophy • Local Market Presidents provide superior customer service due to decentralized decision making • Local Community Boards provide support and local contacts to Market Presidents • Utilize technology to provide a full product offering with a local touch |
 Diversity of Markets • The Company feels one of our strengths is the diversity of its marketplace • This diversity provides stability during difficult economic times • Economic diversity lowers the risk profile of a community banking organization that is generally geographically concentrated |
 Western Kentucky • Six offices in three counties • Significant agricultural base with wheat, corn and soybean production prominent • Light manufacturing • Tourism focused on Kentucky Lake and Land Between the Lakes • Home to Murray State University with 10,000 students |
 Clarksville / Hopkinsville MSA • Population growth in MSA expected to grow 22% by 2010 to 270,000 • Clarksville named the ninth fastest growing city by the US Census Bureau in 2008 • MSA median age is 6 years younger than national average, providing ideal demographics for retail and employment • Nationally recognized in numerous publications for its growth, a talented labor pool and for affordable living |
 • Fort Campbell Army Post is home of the 101 st Screaming Eagles and is the largest employer in Tennessee and Kentucky • Austin Peay State University, with approximately 10,000 students, is one of Tennessee’s fastest growing Universities • Strong retail and service industries • Diverse agricultural production on corn, wheat, soybeans, cattle and tobacco Clarksville / Hopkinsville MSA Economic Drivers |
 Hemlock Semiconductor Corporation • One of world’s leading providers of polycrystalline silicon used to manufacture semiconductor devices and solar panels • In December 2008, announced plans to building a $1.2 billion plant in Clarksville • Project provides 1,000 construction jobs for up to seven years • Project will result in 900 permanent jobs upon full completion • Additional employment likely to result from suppliers being required to relocate to community • Combined with a similar plant being built by another company near Chattanooga, Tennessee, community and political leaders are marketing this area as a “Green Energy Corridor” |
 Middle Tennessee • Includes three offices in Cheatham County and one office in Houston County • Cheatham County is located in the Nashville / Davidson County MSA • US Census bureau reports that Cheatham County’s median household income is $48,058 • Large tracts of undeveloped land less than a thirty minute commute from downtown Nashville • Currently has light manufacturing and serves as bedroom community to Nashville • Management values for good deposit mix, long term growth prospects and proximity to Nashville |
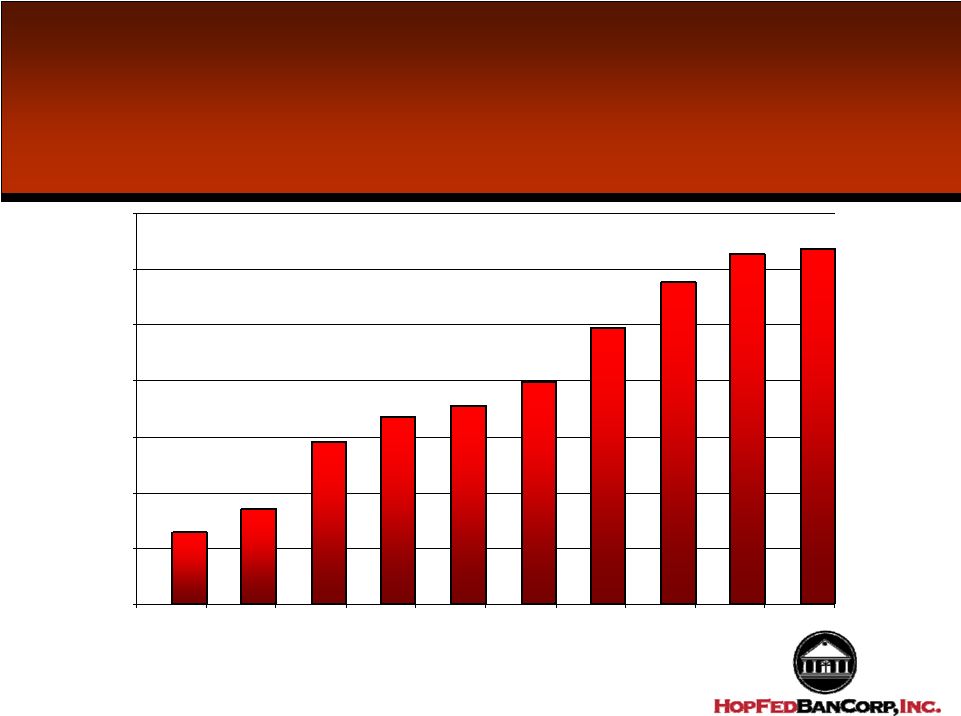
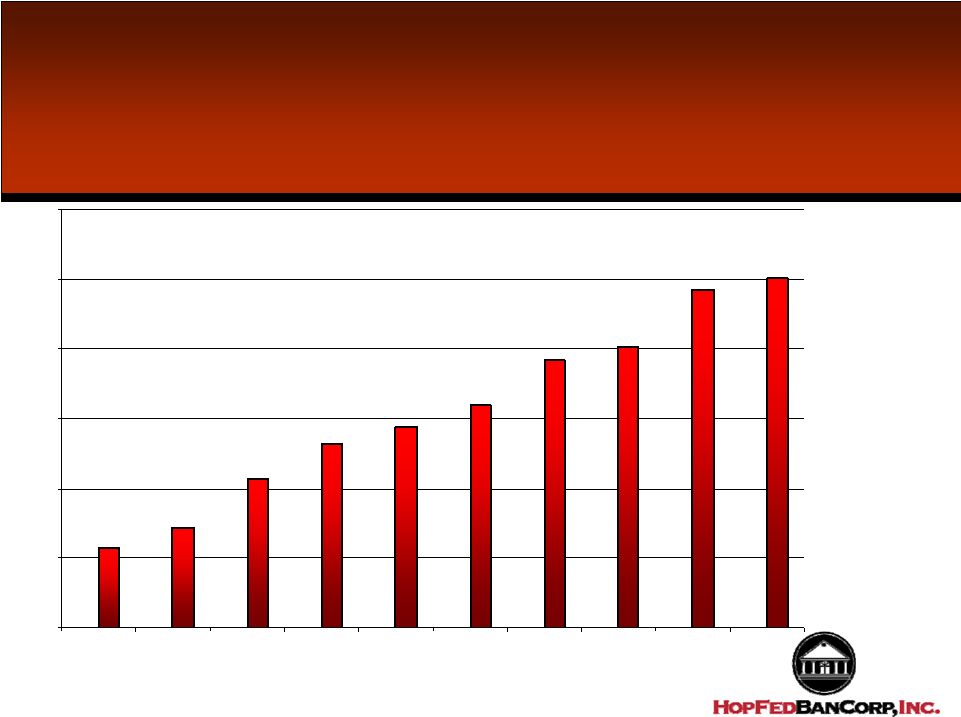 Total Assets (In Millions) 229 286 425 529 578 637 768 808 968 1,002 0 200 400 600 800 1000 1200 2000 2001 2002 2003 2004 2005 2006 2007 2008 June 2009 |
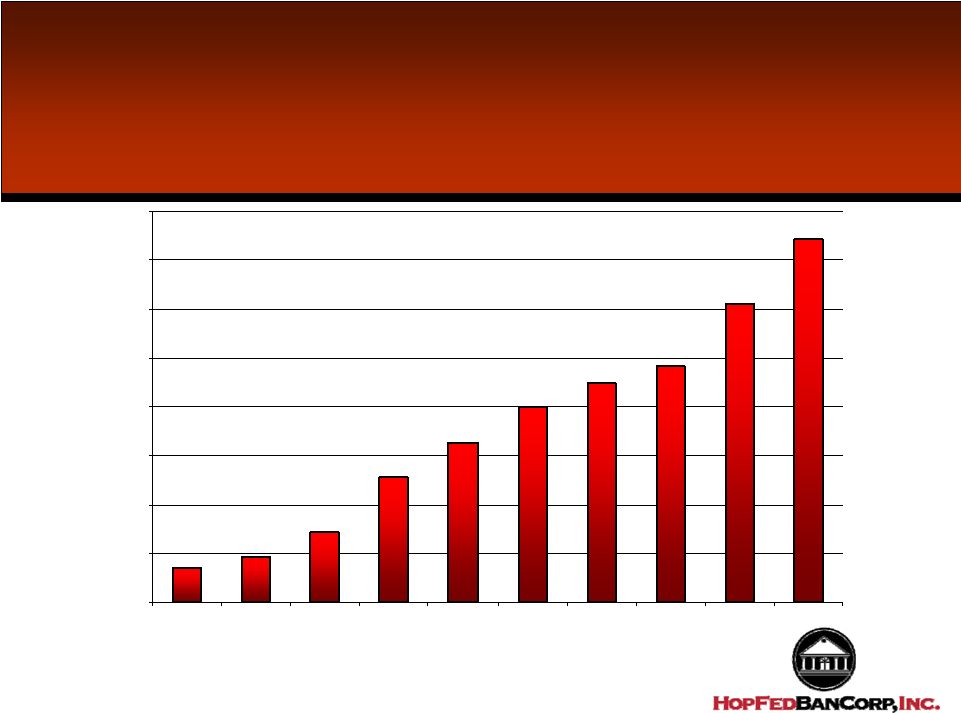
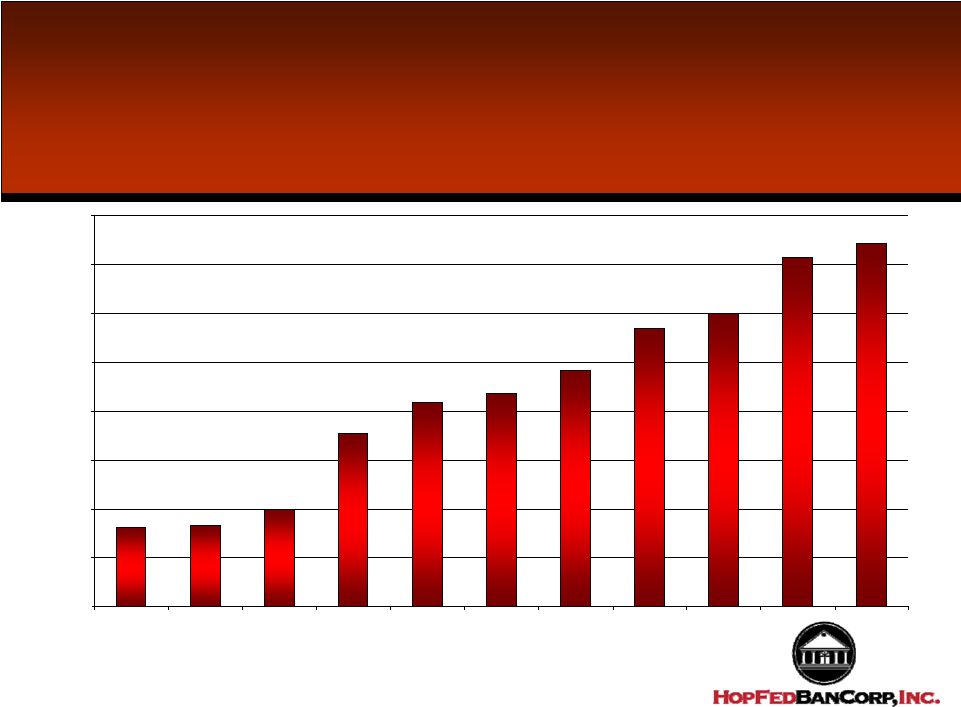 Total Deposits (In Millions) 161 166 200 354 418 436 483 570 599 713 744 0 100 200 300 400 500 600 700 800 1999 2000 2001 2002 2003 2004 2005 2006 2007 2008 June 09 |
 Deposit Mix Percentage of 30-Jun-09 Total Deposits (Dollars in Thousands) Deposits: Non-interest-bearing accounts: $63,721 8.6% Interest-bearing accounts: NOW accounts 90,111 12.1% Savings and money market accounts 57,529 7.7% Other time deposits 532,186 71.6% Total deposits $743,547 |
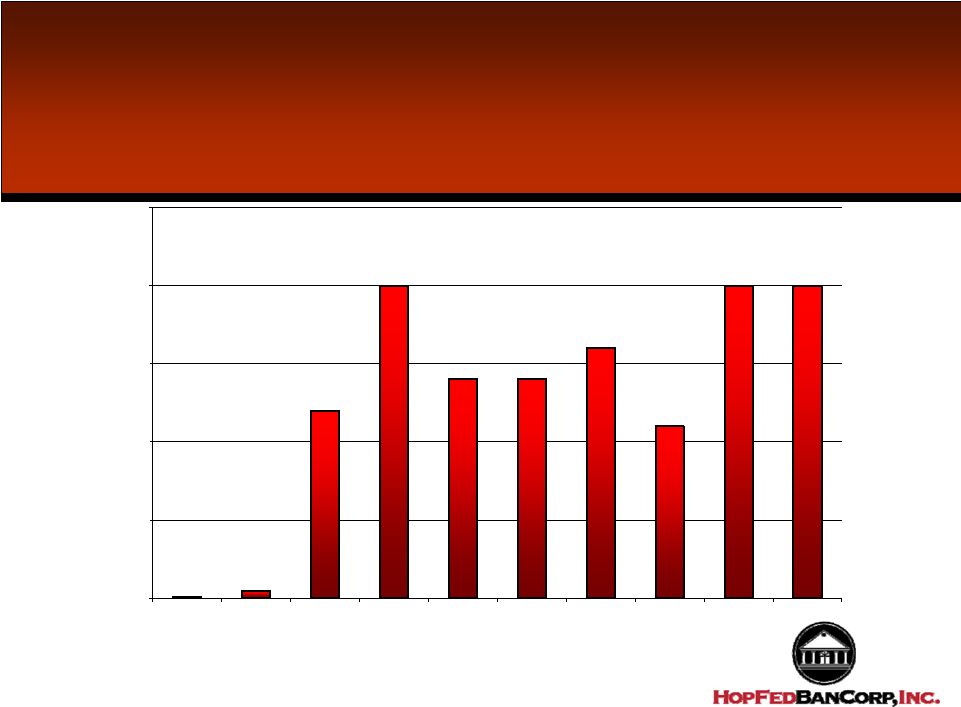
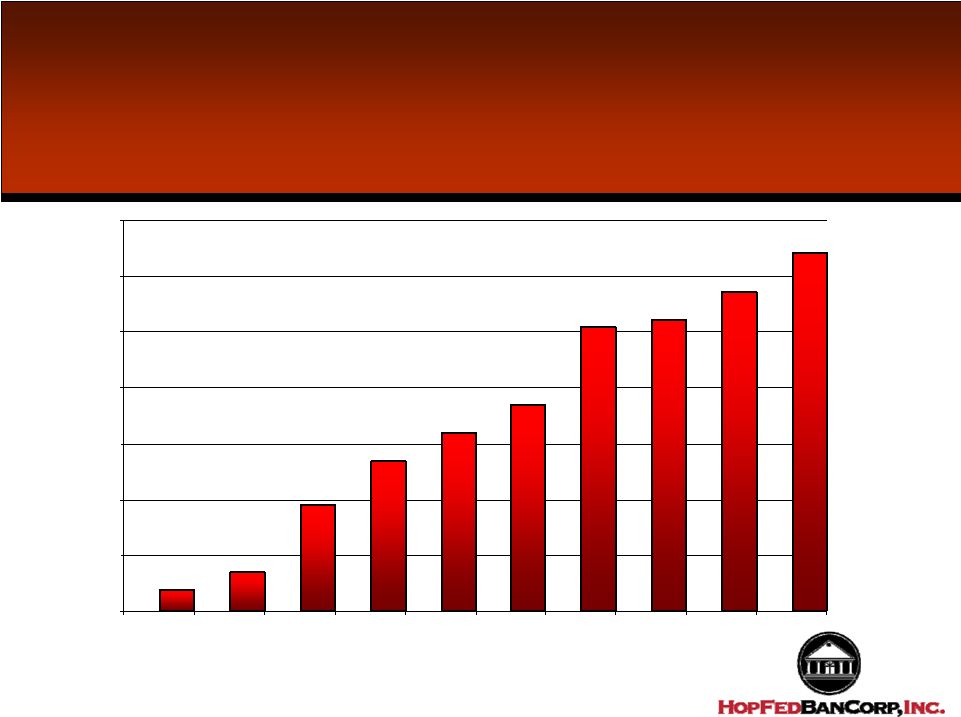 Growth in Non-Interest Bearing Deposits (Dollars in Millions) 4 7 19 27 32 37 51 52 57 64 0 10 20 30 40 50 60 70 2000 2001 2002 2003 2004 2005 2006 2007 2008 June 2009 |
 Total Loans (In Millions) 129 170 292 335 357 397 495 576 628 637 0 100 200 300 400 500 600 700 2000 2001 2002 2003 2004 2005 2006 2007 2008 June 2009 |
 Loan Portfolio Mix 06/30/09 6/30/2009 6/30/2008 6/30/2008 Amount Percent Amount Percent Real estate loans: (Dollars in Thousands) One-to-four family (closed end) first mortgages $192,383 29.9% $178,898 29.8% Second mortgages (closed end) 7,198 1.1% $8,429 1.4% Home equity lines of credit 37,206 5.8% $33,562 5.6% Multi-family 47,682 7.4% 29,732 4.9% Construction 31,436 4.9% 55,434 9.2% Commercial real estate 253,335 39.3% 212,162 35.3% Total mortgage loans 569,240 88.4% 518,217 86.3% Loans secured by deposits 4,329 0.7% 3,200 0.5% Other consumer loans 16,903 2.6% 20,803 3.5% Commercial loans 53,792 8.3% 58,502 9.7% Total loans, gross 644,264 11.6% 600,722 13.7% Deferred loan cost, net of income 274 288 Less allowance for loan losses (7,427) (5,118) Total loans $637,111 $595,892 |
 Allowance for Loan Losses (In Millions) 708 923 1,455 2,576 3,273 4,004 4,470 4,842 6,113 7,427 0 1,000 2,000 3,000 4,000 5,000 6,000 7,000 8,000 2000 2001 2002 2003 2004 2005 2006 2007 2008 June 2009 |
 Allowance for Loan Loss / Total Loans 0.55% 0.54% 0.50% 0.76% 0.91% 1.00% 0.90% 0.83% 0.97% 1.15% 0 0.002 0.004 0.006 0.008 0.01 0.012 0.014 2000 2001 2002 2003 2004 2005 2006 2007 2008 June 2009 |
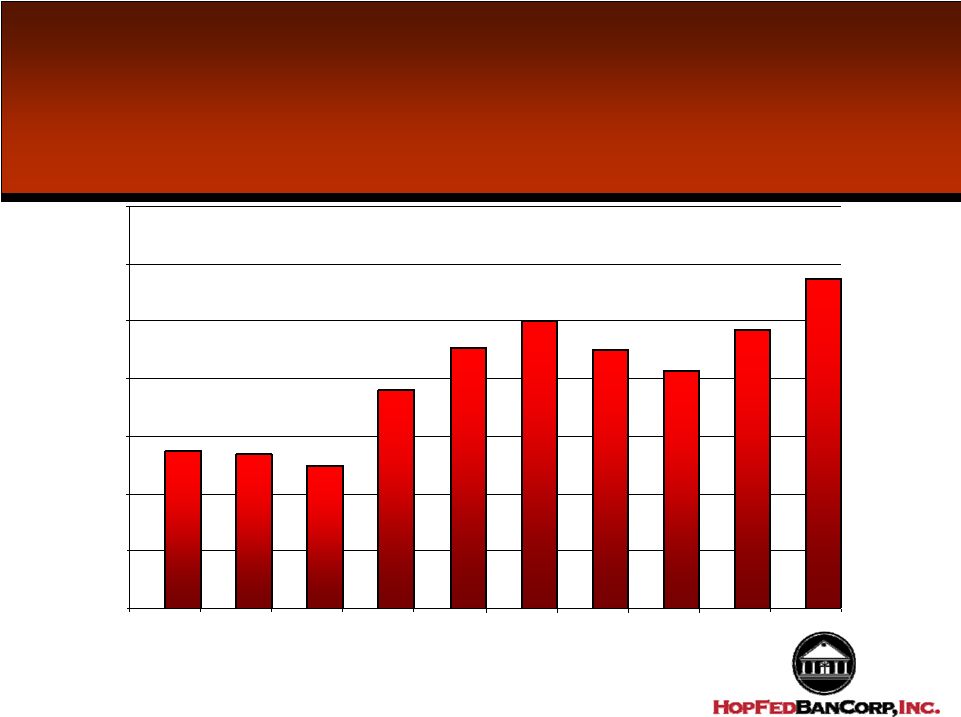
 Non-Performing Asset Ratio 0.19% 0.19% 0.29% 0.34% 0.18% 0.19% 0.16% 0.12% 0.86% 0.91% 0.00% 0.10% 0.20% 0.30% 0.40% 0.50% 0.60% 0.70% 0.80% 0.90% 1.00% 2000 2001 2002 2003 2004 2005 2006 2007 2008 June 2009 |
 Net Charge Off Ratio 0.00% 0.01% 0.12% 0.20% 0.14% 0.14% 0.16% 0.11% 0.20% 0.20% 0.00% 0.05% 0.10% 0.15% 0.20% 0.25% 2000 2001 2002 2003 2004 2005 2006 2007 2008 June 2009 |
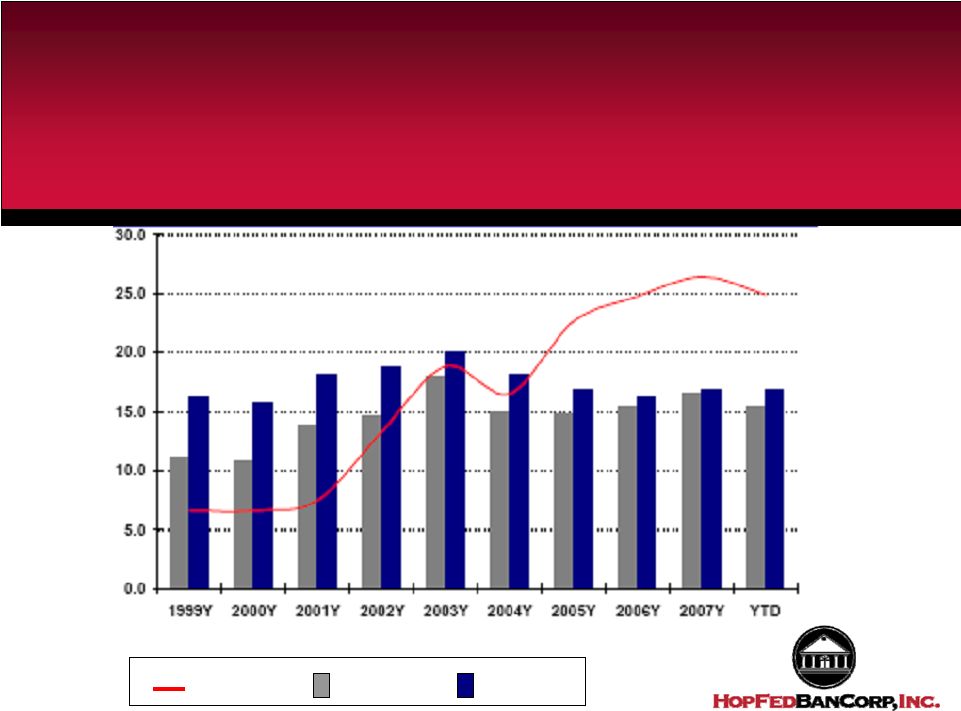 HopFed Industry Comparison Noninterest Income / Operating Revenue (%) HFBC Thrifts Banks |
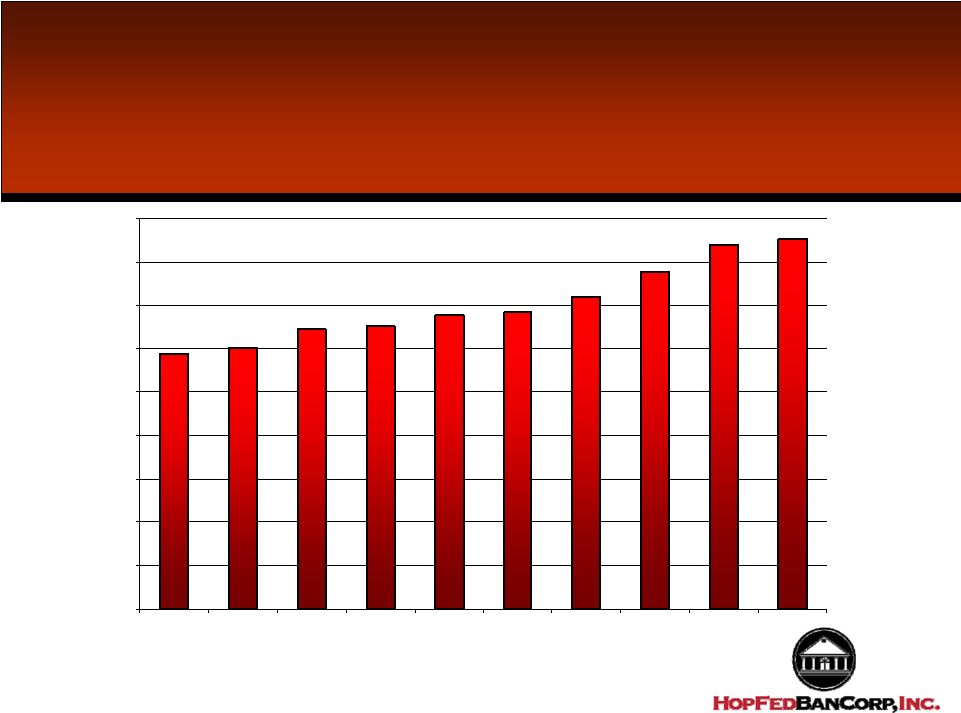 Book Value Per Share 11.77 12.00 12.91 13.01 13.57 13.66 14.42 15.54 16.77 17.08 0.00 2.00 4.00 6.00 8.00 10.00 12.00 14.00 16.00 18.00 2000 2001 2002 2003 2004 2005 2006 2007 2008 June 2009 |
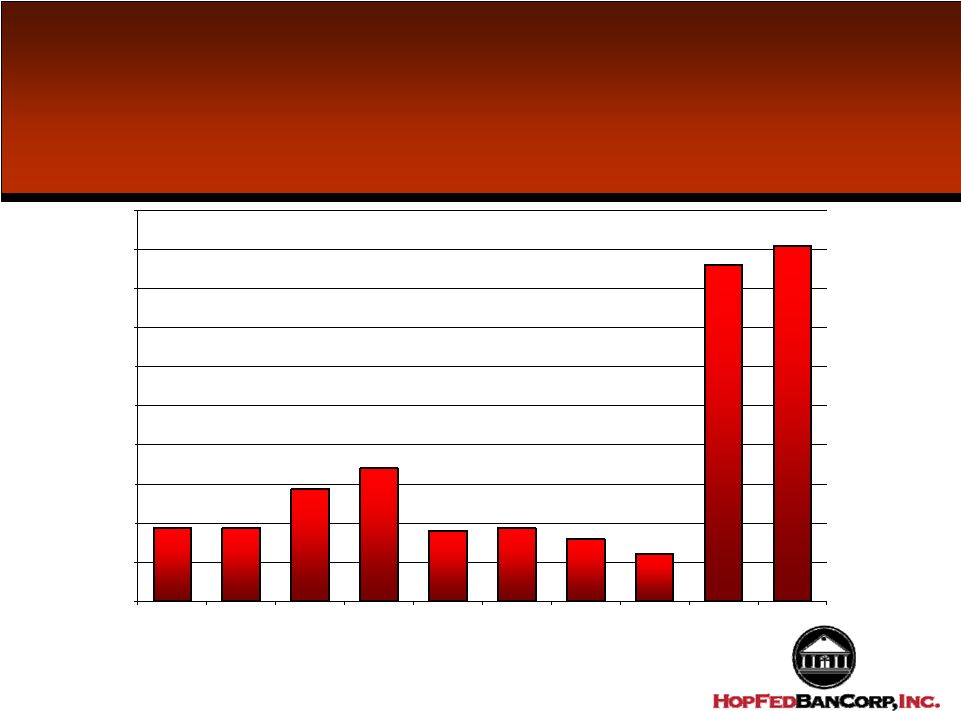
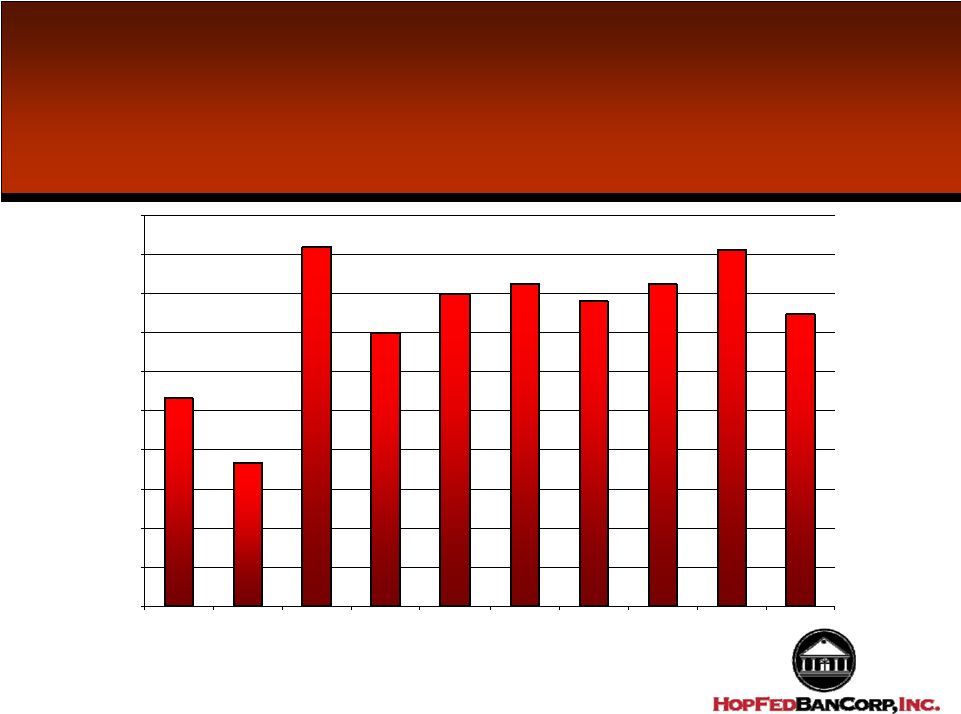 Net Income (In Thousands) 2,666 1,839 4,594 3,495 3,991 4,130 3,908 4,116 4,559 3,732 0 500 1,000 1,500 2,000 2,500 3,000 3,500 4,000 4,500 5,000 2000 2001 2002 2003 2004 2005 2006 2007 2008 * June 2009 |
 Participation in Treasury Capital Purchase Plan • Issued $18.4 million in preferred stock to the United States Treasury on December 12, 2008 • Maintained $4.4 million at holding company while remainder was transferred to banking subsidiary • Increased total assets by more then $124 million in the fourth quarter of 2008. Growth occurred through a combination of aggressive deposit growth and Federal Home Loan Bank borrowings • Proceeds used to fund net loan growth of $6.8 million and $102.7 million of growth in investment portfolio. The portfolio growth was accomplished to offset the cost of the preferred stock dividend • Result has been to increase the subsidiary bank’s risk based capital ratio from 10.8% on September 30, 2008 to almost 13% at June 30, 2009 |
 Why Invest in HopFed Bancorp • Diversity of markets and loan portfolio mix provides a lower risk profile as compared to many community banks • Risk profile enhanced by long history of below average charge offs and non- performing assets • New opportunities for growth as larger banks continue to struggle • Attractive P/E Ratio of 10% • Trading at approximately 82% of Tangible Book Value • Attractive dividend yield of approximately 4.5% • Experienced management team with history that has provided meaningful growth while maintaining an appropriate risk profile |