 Acquisition of Sumner Bank & Trust Investor Presentation April 2013 * * * * * * * * * * * * * * * Exhibit 99.1 |
 |
 |
 |
 |
 |
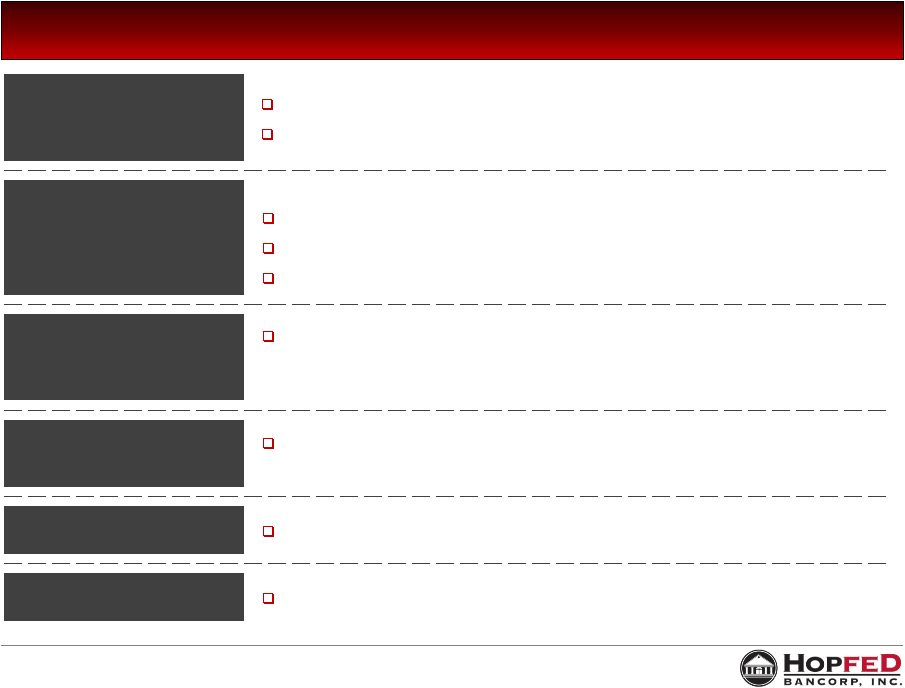
 7 Significantly enhances our presence in the Nashville MSA with the addition of 3 branches and 3 loan production offices Expansion into markets with attractive demographics and growth profiles Local leadership has been retained and will lead our efforts in these new markets Utilizes our enhanced infrastructure allowing for significant cost savings Improves our deposit mix and net interest margin Includes attractive retail mortgage business Strategic Considerations Financial Considerations Transaction Rationale Cash transaction priced at 111% of tangible book value as of December 31, 2012 Significantly earnings accretive; $0.25 - $0.30 per share with fully-implemented cost savings Moderate tangible book value dilution; $0.63 - $0.70 per share with earn-out in under 2.5 years $2.1 million in cost savings; 20% of expenses (40% when excluding mortgage business) Pro forma capital ratios will be levered, but remain strong |
 8 Sumner Bank & Trust is a $184 million asset-sized bank headquartered in Gallatin, Tennessee, operating three branches and three loan production offices in the Nashville MSA Branches are all located in Sumner County Loan production offices located in Williamson, Madison and Wilson counties Sumner Bank & Trust was organized in 2005 to meet the need in Sumner County for a true community bank owned by local shareholders Sumner is led by a strong, experienced management team Sumner currently has $4.3 million of SBLF Preferred Stock outstanding, which HopFed will retain Sumner has a growing and profitable retail mortgage banking business Overview of Sumner Bank & Trust Overview of Sumner Bank & Trust Corporate Overview GAAP Balance Sheet (12/31/2012) GAAP Performance Metrics (12/31/2012) Headquarters: Gallatin, TN Chief Executive Officer: Michael Wayne Cook Employees (FTE): 64 Corporation Type: C-Corporation Assets: $184.0 million Cash & Securities: $54.1 million Gross Loans: $121.6 million Total Deposits: $157.6 million Tangible Common Equity: $12.2 million SBLF Preferred Equity: $4.3 million Efficiency Ratio (LTM): 85.9% Return on Average Assets (LTM): 0.67% Net Interest Margin (LTM): 3.38% Pre-Tax Income (LTM): $1.1 million NPAs / Assets: 3.46% TCE Ratio: 6.63% Source: SNL Financial |
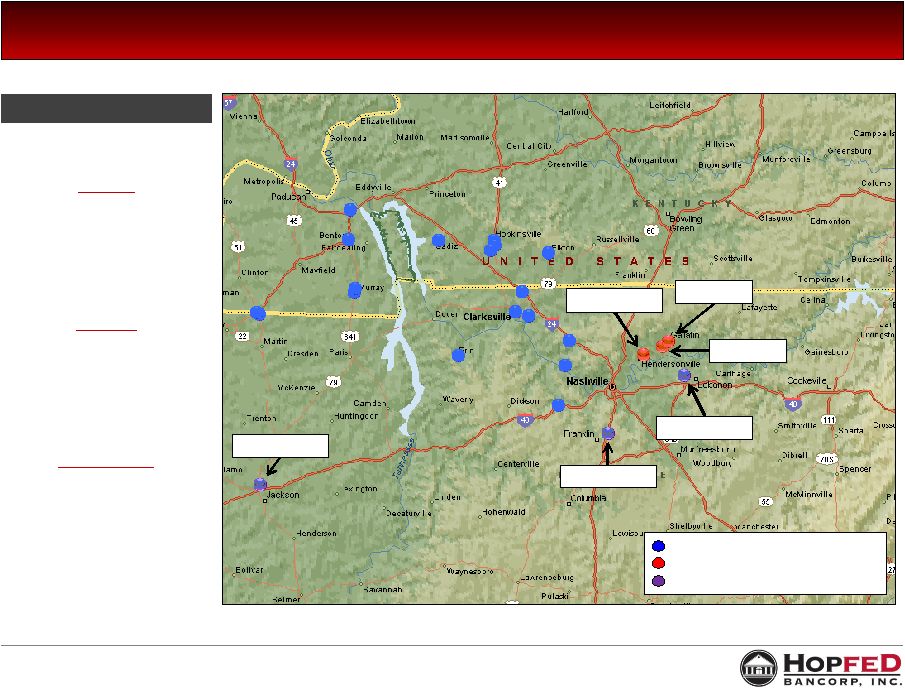 9 Pro Forma Branch Map Gallatin I 780 Browns Lane Gallatin, TN 37066 2012 Deposits: $55,306 2011 Deposits: $46,531 Gallatin II 240 W Broadway Gallatin, TN 37066 2012 Deposits: $55,848 2011 Deposits: $56,364 Hendersonville 255 Indian Lake Blvd Hendersonville, TN 37075 2012 Deposits: $28,083 2011 Deposits: $16,039 HopFed Bancorp (18) Sumner Bank & Trust Branch (3) Sumner Loan Production Office (3) For the period ended June 30, 2012 (Dollars in Thousands) Branch Summary Hendersonville Gallatin I Gallatin II Jackson Franklin Lebanon Source: SNL Financial |
 10 $10.04 per share or $14.3 million in cash Subject to possible increase or reduction based on Sumner performance Transaction Value SBLF Preferred Stock Transaction Overview Anticipated Closing Sumner SBLF Preferred Stock will be exchanged for shares of HopFed Preferred Stock and will be subject to the same terms as Sumner agreed to with the U.S. Department of the Treasury Third Quarter 2013 Price to tangible book value of 111% Core deposit premium of 1.2% Price to LTM earnings per share of 14.6x Valuation Multiples (as of 12/31/12) Credit Mark Transaction Expenses Estimated at $1.5 million $3.0 million or approximately 47% of NPAs ($1.8 million on loans and $1.2 million on OREO) |
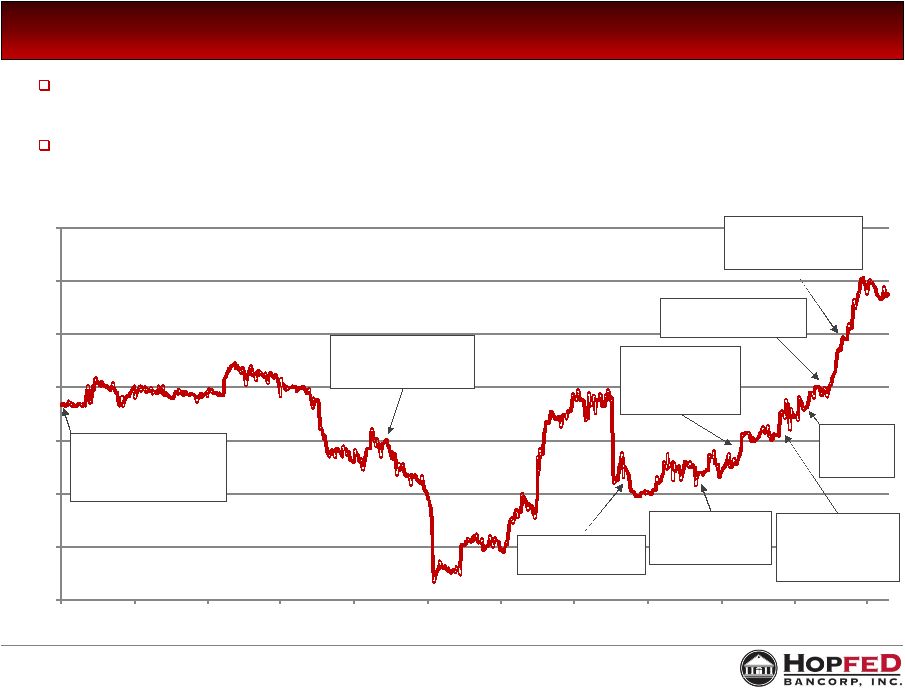 11 June 2010 Equity Offering Use of Proceeds: Organic Growth; Opportunistic Acquisitions; General Corporate Purposes; Repurchase of TARP Existence of MOU until November 2012 prevented more timely repurchase of TARP and related warrant and removed HopFed from M&A arena; we repurchased TARP on December 19, 2012. HFBC Stock Price Since Common Stock Offering Source: SNL Financial Pricing as of April 11, 2013 6/16/10: Closing of $32.3 M follow-on common stock offering at $8.65 (split- adjusted) 7/21/11: OTS transfers authority to Federal Reserve and OCC 10/10/12: MOU is terminated between the OCC and Heritage Bank 11/21/12: MOU is terminated between Federal Reserve and HopFed Bancorp, Inc. 1/16/13: Repurchased warrants relating to TARP 2/12/13: Announce acquisition of Sumner Bank & Trust 5/21/12: Initial OCC exam commences 8/6/12: Signed NDA to explore Sumner ac quisition 12/19/12: Repurchase TARP at par $5.00 $6.00 $7.00 $8.00 $9.00 $10.00 $11.00 $12.00 6/16/10 9/16/10 12/16/10 3/16/11 6/16/11 9/16/11 12/16/11 3/16/12 6/16/12 9/16/12 12/16/12 3/16/13 |
 12 Current Market Area Attractive Market Demographics HopFed’s Current Market Area 18 branches in Western Kentucky and Middle Tennessee Focus in the cities of: • Hopkinsville, KY (3 branches, $198M in deposits, #3 market share) • Murray, KY (2 branches, $113M in deposits, #3 market share) • Fulton, KY (2 branches, $146M in deposits, #1 market share) • Clarksville, TN (3 branches, $64M in deposits, #10 market share) Transaction bolsters presence in attractive Nashville MSA 3 bank branches located in two cities within Sumner County • Gallatin, TN (2 branches, $111M in deposits, #3 market share) • Hendersonville, TN (1 branch, $28M in deposits, #13 market share) Loan production offices in Wilson and Williamson counties Nashville, TN MSA Source: SNL Financial Note: Branch deposit and market share data as of June 30, 2012 Note: Acquired branches/LPO’s are located in the highlighted counties 2012 Population 2012 Median Median Value 2012 Change Household Owner Occupied County (Seat) Population 2000-2012 Income Housing Unit Kentucky: Christian (Hopkinsville) 75,855 5.0% $36,568 $137,536 Marshall (Lewisburg) 31,778 5.5 37,915 141,622 Calloway (Murray) 38,066 11.4 35,859 97,429 Todd (Elkton) 12,571 5.0 33,039 82,288 Trigg (Cadiz) 14,586 15.8 40,026 105,937 Fulton (Hickman) 6,752 -12.9 30,749 59,111 Kentucky Total 179,608 6.3% $36,471 $120,377 Tennessee: Montgomery (Clarksville) 179,558 33.2% $47,627 $145,102 Cheatham (Ashland City) 39,446 9.8 50,105 136,390 Houston (Erin) 8,438 4.3 36,908 85,864 Obion (Union City) 31,739 -2.2 36,299 87,182 Weakley (Dresden) 35,141 0.7 32,538 88,160 Tennessee Total 294,322 19.6% $44,629 $129,191 Market Total 473,930 14.2% $41,537 $125,851 2012 Population 2012 Median Median Value 2012 Change Household Owner Occupied County (Seat) Population 2000-2012 Income Housing Unit Robertson (Springfield) 67,683 24.3% $45,984 $146,778 Sumner (Gallatin) 165,950 27.2 52,233 178,732 Wilson (Lebanon) 118,990 34.0 56,555 175,577 Rutherford (Murfreesboro) 273,378 50.2 51,533 149,005 Williamson (Franklin) 191,532 51.2 78,845 321,900 Maury (Columbia) 83,089 19.6 45,787 124,137 Dickson (Dickson) 50,144 16.2 41,711 127,735 Davidson (Nashville) 640,154 12.3 42,642 164,240 Cheatham (Ashland City) 39,446 9.8 50,105 136,390 Nashville MSA Total 1,630,366 25.3% $50,828 $177,944 |
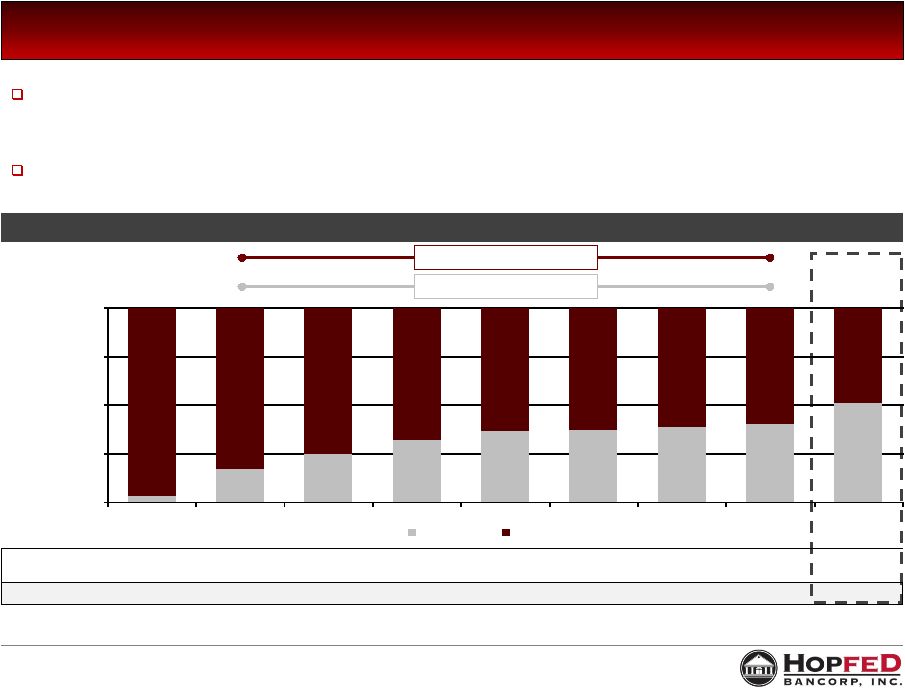 13 In April 2006 HopFed announced the acquisition of four branches with $65.5 million in deposits and $34.5 million in loans in the Nashville MSA from AmSouth Bancorporation Opened de novo branch offices in Clarksville, TN in December 2006, May 2007, and September 2007 HopFed Loan Composition by State Kentucky and Tennessee Loan Mix Since 2005 Kentucky 6-Yr CAGR: -4.2% Tennessee 6-Yr CAGR: 16.6% Source: SNL Financial KY Loans ($M) $388.6 $414.2 $436.8 $432.3 $412.8 $385.4 $348.7 $321.0 $321.0 TN Loans ($M) $12.7 $85.2 $144.3 $202.2 $238.4 $224.7 $218.9 $214.6 $336.3 Total Loans ($M) $401.3 $499.4 $581.1 $634.5 $651.2 $610.0 $567.6 $535.6 $657.4 3% 17% 25% 32% 37% 37% 39% 40% 51% 97% 83% 75% 68% 63% 63% 61% 60% 49% 0% 25% 50% 75% 100% 2005 2006 2007 2008 2009 2010 2011 2012 Pro Forma w/ Sumner Tennessee Kentucky |
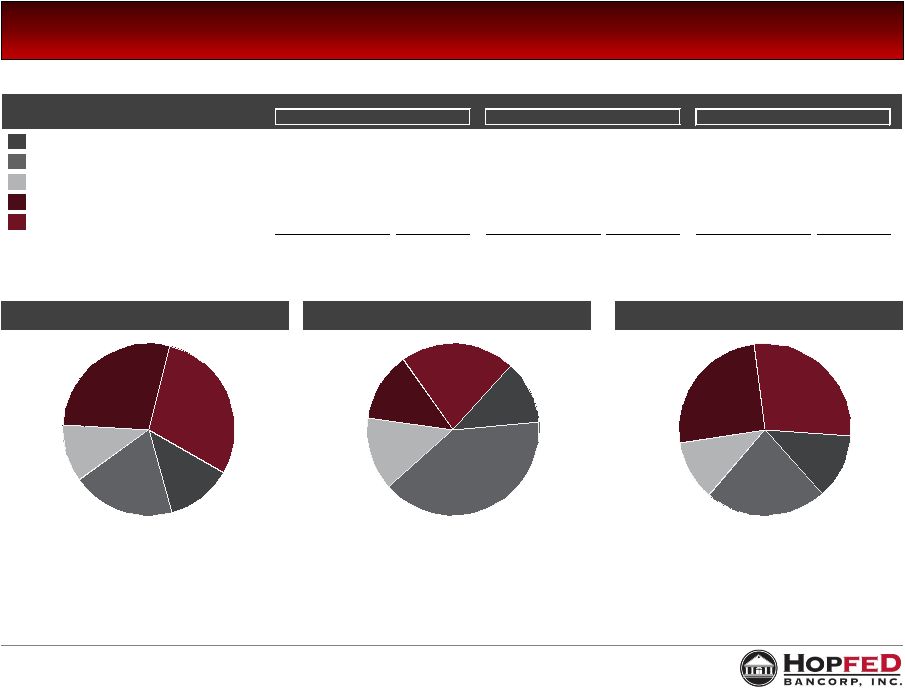 14 Demand Deps. 12% NOW and ATS 19% MMDA and Savings 11% Retail Time 28% Jumbo Time 30% Demand Deps. 12% NOW and ATS 40% MMDA and Savings 14% Retail Time 13% Jumbo Time 21% Demand Deps. 12% NOW and ATS 23% MMDA and Savings 11% Retail Time 26% Jumbo Time 28% Pro Forma Deposit Composition Heritage Bank Sumner Bank & Trust Pro Forma Dollars in Thousands For the period ended December 31, 2012 Heritage Bank Sumner Bank & Trust Pro Forma Demand Deposits 94,083 $ 12.4% 18,787 $ 11.9% 112,870 $ 12.3% NOW and ATS 147,047 19.4% 62,837 39.9% 209,884 22.9% MMDA and Savings 81,643 10.7% 21,418 13.6% 103,061 11.2% Retail Time Deposits ( < $100K) 213,216 28.1% 20,672 13.1% 233,888 25.5% Jumbo Time Deposits ( > $100K) 223,876 29.5% 33,874 21.5% 257,750 28.1% Total Deposits 759,865 $ 100.0% 157,588 $ 100.0% 917,453 $ 100.0% Source: SNL Financial Note: Data reflects bank level regulatory financials |
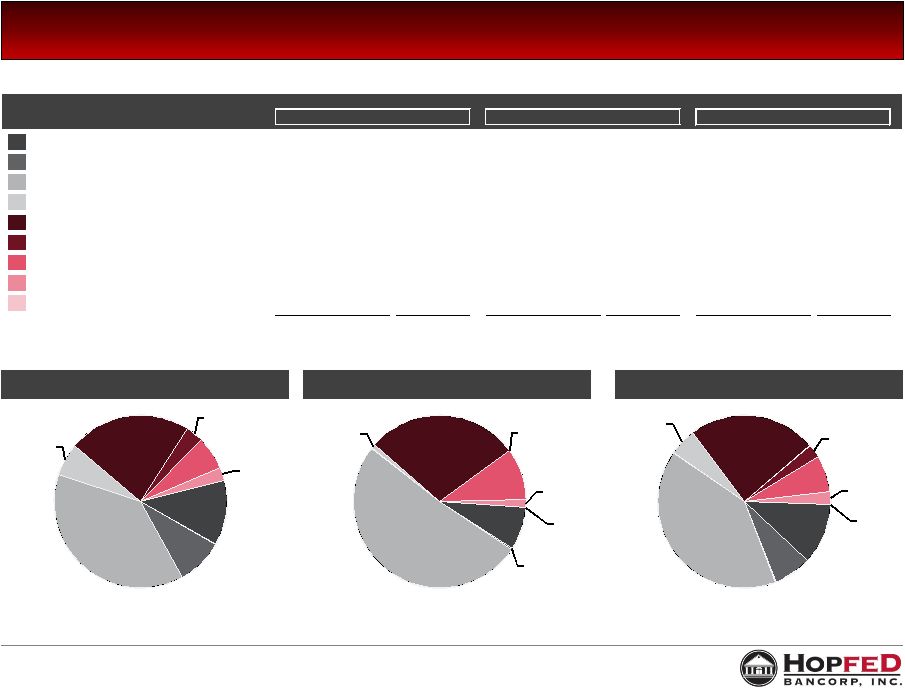 15 Pro Forma Loan Composition Heritage Bank Sumner Bank & Trust Pro Forma Dollars in Thousands For the period ended December 31, 2012 Heritage Bank Sumner Bank & Trust Pro Forma Construction & Development 64,952 $ 12.1% 9,699 $ 8.0% 74,651 $ 11.4% Secured by Farmland 46,799 8.7% 327 0.3% 47,126 7.2% 1 - 4 Family Real Estate 203,764 38.0% 62,429 51.3% 266,193 40.5% 5+ Family Real Estate 33,056 6.2% 985 0.8% 34,041 5.2% Commercial Real Estate 122,637 22.9% 34,695 28.5% 157,332 23.9% Agricultural 17,448 3.3% 11 0.0% 17,459 2.7% Commercial & Industrial 33,045 6.2% 11,734 9.6% 44,779 6.8% Consumer 13,928 2.6% 1,835 1.5% 15,763 2.4% Other - 0.0% 10 0.0% 10 0.0% Gross Loans and Leases 535,629 $ 100.0% 121,725 $ 100.0% 657,354 $ 100.0% (1) Includes $33.3 million in loans held for sale from the mortgage business Source: SNL Financial; Note: Data reflects bank level regulatory financials (1) C&D 12% Farm 9% 1 -4 Family 38% 5+ Family 6% Comm. RE 23% Agriculture 3% C&I 6% Consumer 3% C&D 8% Farm <1% 1 - 4 Family 51% 5+ Family 1% Comm. RE 28% Agriculture <1% C&I 10% Consumer 2% Other <1% C&D 11% Farm 7% 1 - 4 Family 41% 5+ Family 5% Comm. RE 24% Agriculture 3% C&I 7% Consumer 2% Other <1% |
 John E. Peck President & Chief Executive Officer (270) 887-8401 john.peck@bankwithheritage.com Billy C. Duvall SVP & Chief Financial Officer (270) 887-8404 billy.duvall@bankwithheritage.com |