As filed with the Securities and Exchange Commission on January 30, 2009
File No. 333-
SECURITIES AND EXCHANGE COMMISSION
Washington, D.C. 20549
FORM N-14
REGISTRATION STATEMENT
UNDER
THE SECURITIES ACT OF 1933
¨ Pre-Effective Amendment No.
¨ Post-Effective Amendment No.
NUVEEN INVESTMENT TRUST II
(Exact Name of Registrant as Specified in Charter)
333 West Wacker Drive
Chicago, Illinois 60606
(Address of Principal Executive Offices, Zip Code)
Registrant’s Telephone Number, including Area Code (312) 917-7700
Kevin J. McCarthy
Vice President and Secretary
Nuveen Investments
333 West Wacker Drive
Chicago, Illinois 60606
(Name and Address of Agent for Service)
Copy to:
| | |
Eric F. Fess Chapman and Cutler LLP 111 West Monroe Street Chicago, Illinois 60603 | | Cathy G. O’Kelly Vedder Price P.C. 222 North LaSalle Street Chicago, Illinois 60601 |
Approximate date of proposed public offering: As soon as practicable after the effective date of this Registration Statement.
It is proposed that this filing will become effective on March 2, 2009 pursuant to Rule 488.
No filing fee is required because an indefinite number of shares have previously been registered pursuant to Rule 24f-2 under the Investment Company Act of 1940.

Important Information for
Nuveen Rittenhouse Growth Fund Shareholders
At a Special Meeting of shareholders of the Nuveen Rittenhouse Growth Fund (the “Growth Fund”), you will be asked to vote upon an important change affecting your fund. The purpose of the Special Meeting is to allow you to vote on a reorganization of your fund into the Nuveen Santa Barbara Dividend Growth Fund (the “Dividend Growth Fund”). If the reorganization is approved and completed, you will become a shareholder of the Dividend Growth Fund. The Growth Fund and the Dividend Growth Fund are collectively referred to herein as the “Funds”.
Although we recommend that you read the complete Proxy Statement/Prospectus, for your convenience, we have provided the following brief overview of the issue to be voted on.
| Q. | Why am I receiving this Proxy Statement/Prospectus? |
| A. | The Board of Trustees (the “Board”) of the Funds has called a Special Meeting of Shareholders for , 2009, at which you will be asked to vote on a reorganization of the Growth Fund into the Dividend Growth Fund (the “Reorganization”). The Reorganization, if approved by shareholders of the Growth Fund, will result in you becoming a shareholder of the Dividend Growth Fund. |
| Q. | What advantages will this produce for Growth Fund shareholders? |
| A. | After the Reorganization, Growth Fund shareholders will become shareholders of the Dividend Growth Fund, which has (i) lower management fees and net operating expenses than the Growth Fund, (ii) a portfolio management team that has demonstrated a stronger historic performance record than the Growth Fund, and (iii) distribution opportunities that are expected to exceed those of the Growth Fund. The Board has determined that the proposed Reorganization is in the best interest of each Fund. |
| Q. | What are the similarities between the Funds? |
| A. | Both Funds invest primarily in large-capitalization U.S. stocks and follow a conservative growth philosophy centered on companies with quality earnings and earnings growth potential. |
| Q. | Are there any significant differences between the Funds’ investment policies? |
| A. | The primary differences between the Funds are that (i) the Dividend Growth Fund, unlike the Growth Fund, emphasizes companies that pay tax-advantaged dividends, (ii) the Dividend Growth Fund invests in companies that exhibit both growth and value characteristics, while the Growth Fund focuses primarily on growth stocks, and (iii) the Dividend Growth Fund may invest a higher percentage of its net assets in non-U.S. securities than the Growth Fund. |
| Q. | What will happen if shareholders do not approve the reorganization? |
| A. | If the Reorganization is not approved, the Board will take such actions as it deems to be in the best interests of the Growth Fund, which may involve the Fund’s liquidation and closure. This is discussed in more detail in the Proxy Statement/Prospectus. |
| Q. | Will Growth Fund shareholders receive new shares in exchange for their current shares? |
| A. | Yes. Upon approval and completion of the Reorganization, each Growth Fund shareholder will receive shares of the Dividend Growth Fund equal in total value to the total value of the Growth Fund shares surrendered by such shareholder. |
| Q. | Will this Reorganization create a taxable event for me? |
| A. | The Reorganization is intended to qualify as a reorganization for federal income tax purposes. It is expected that you will recognize no gain or loss for federal income tax purposes as a result of the Reorganization. You may, however, receive a taxable distribution as a result of the normal operations of the Growth Fund prior to the closing of the Reorganization. |
| Q. | How do management fees and other fund operating expenses compare between the two Funds? |
| A. | The management fee rate as a percentage of assets is lower for the Dividend Growth Fund. In addition, although each Fund’s operating expenses (excluding 12b-1 distribution and service fees, interest expenses, taxes, fees incurred in acquiring and disposing of portfolio securities and extraordinary expenses) are temporarily capped through November 30, 2009, the Dividend Growth Fund’s operating expenses are capped at a lower rate (1.05%) than the Growth Fund (1.22%). After November 30, 2009, the Dividend Growth |
| | Fund’s operating expenses (excluding 12b-1 distribution and service fees, interest expenses, taxes, fees incurred in acquiring and disposing of portfolio securities and extraordinary expenses) are permanently capped at 1.30%, while the Growth Fund’s expenses are not capped. If the Reorganization is approved and completed, Nuveen Asset Management (“Nuveen”), the Funds’ investment adviser, has agreed to extend the Dividend Growth Fund’s temporary expense cap through November 30, 2011, and to reduce the Dividend Growth Fund’s permanent cap to 1.25% (excluding 12b-1 distribution and service fees, interest expenses, taxes, fees incurred in acquiring and disposing of portfolio securities and extraordinary expenses) thereafter. |
| Q. | Will I have to pay any fees or expenses in connection with the Reorganization? |
| A. | Although shareholders will not directly bear any fees or expenses in connection with the Reorganization, all the expenses associated with the Reorganization will be borne by the Growth Fund; thus, Growth Fund shareholders will indirectly bear the costs of the Reorganization. |
| Q. | What is the timetable for the Reorganization? |
| A. | If approved by shareholders on , 2009, the Reorganization is expected to take effect on or about , 2009. |
| Q. | Who do I call if I have questions? |
| A. | If you need any assistance, or have any questions regarding the proposal or how to vote your shares, please call Computershare Fund Services, your proxy solicitor, at ( ) - , weekdays during its business hours of 7:00 a.m. to 7:00 p.m. Central time. Please have your proxy material available when you call. |
| Q. | How do I vote my shares? |
| A. | You may vote by mail, telephone or over the Internet: |
| | • | | To vote by mail, please mark, sign, date and mail the enclosed proxy card. No postage is required if mailed in the United States. |
| | • | | To vote by telephone, please call the toll-free number located on your proxy card and follow the recorded instructions, using your proxy card as a guide. |
| | • | | To vote over the Internet, go to the Internet address provided on your proxy card and follow the instructions, using your proxy card as a guide. |
| Q. | Will Nuveen contact me? |
| A. | You may receive a call from representatives of Nuveen to verify that you received your proxy materials and to answer any questions you may have about the Reorganization. |
| Q. | How does the Board suggest that I vote? |
| A. | After careful consideration, the Board has agreed unanimously that this Reorganization is in the best interests of your Fund and recommends that you vote “FOR” the Reorganization. |
, 2009
Dear Shareholders:
We are pleased to invite you to the Special Meeting of Shareholders of the Nuveen Rittenhouse Growth Fund (the “Special Meeting”). The Special Meeting is scheduled for , , 2009, at :00 am, Central time, in the 31st floor conference room of Nuveen Investments, LLC, 333 West Wacker Drive, Chicago, Illinois 60606.
At the Special Meeting, you will be asked to consider and approve a very important proposal. Subject to shareholder approval, the Nuveen Santa Barbara Dividend Growth Fund (the “Dividend Growth Fund”) will acquire all the assets and liabilities of the Nuveen Rittenhouse Growth Fund (the “Growth Fund”) in exchange solely for shares of the Dividend Growth Fund, which will be distributed in complete liquidation of the Growth Fund to the shareholders of the Growth Fund.
After the Reorganization, Growth Fund shareholders will become shareholders of the Dividend Growth Fund, which has (i) lower management fees and net operating expenses than the Growth Fund, (ii) a portfolio management team that has demonstrated a stronger historic performance record than the Growth Fund, and (iii) distribution opportunities that are expected to exceed those of the Growth Fund. The Board of Trustees of the Funds has determined that the proposed Reorganization is in the best interest of each Fund.
Because the benefits of the reorganization flow primarily to the Growth Fund, the Growth Fund will pay all costs associated with the reorganization.
The attached Proxy Statement/Prospectus has been prepared to give you information about this proposal.
All shareholders are cordially invited to attend the Special Meeting. In order to avoid delay and additional expense for the Growth Fund, and to assure that your shares are represented, please vote as promptly as possible, whether or not you plan to attend the Special Meeting. You may vote by mail, telephone or over the Internet.
| | • | | To vote by mail, please mark, sign, date and mail the enclosed proxy card. No postage is required if mailed in the United States. |
| | • | | To vote by telephone, please call the toll-free number located on your proxy card and follow the recorded instructions, using your proxy card as a guide. |
| | • | | To vote over the Internet, go to the Internet address provided on your proxy card and follow the instructions, using your proxy card as a guide. |
We appreciate your continued support and confidence in Nuveen and our family of investments.
|
| Very truly yours, |
|
| Kevin J. McCarthy |
| Vice President and Secretary |
, 2009
NUVEEN RITTENHOUSE GROWTH FUND
NOTICE OF SPECIAL MEETING OF SHAREHOLDERS TO BE HELD ON , 2009
To the Shareholders:
Notice is hereby given that a Special Meeting of shareholders of the Nuveen Rittenhouse Growth Fund (the “Growth Fund”), a series of the Nuveen Investment Trust II (the “Trust”), a Massachusetts business trust, will be held in the 31st floor conference room of Nuveen Investments, LLC, 333 West Wacker Drive, Chicago, Illinois 60606, on , , 2009 at :00 a.m., Central time (the “Special Meeting”), for the following purposes:
1. To approve an Agreement and Plan of Reorganization (and the related transactions) pursuant to which the Growth Fund would (i) transfer all its assets to the Nuveen Santa Barbara Dividend Growth Fund (the “Dividend Growth Fund”) in exchange solely for Class A, Class B, Class C and Class I shares of beneficial interest of the Dividend Growth Fund and the Dividend Growth Fund’s assumption of all the liabilities of the Growth Fund, (ii) distribute such shares of the Dividend Growth Fund to the holders of shares of the Growth Fund and (iii) be liquidated, dissolved and terminated as a series of the Trust in accordance with the Trust’s Declaration of Trust.
| 2. | To transact such other business as may properly come before the Special Meeting. |
Only shareholders of record as of the close of business on , 2009 are entitled to vote at the Special Meeting or any adjournment thereof.
All shareholders are cordially invited to attend the Special Meeting. In order to avoid delay and additional expense for the Growth Fund, and to assure that your shares are represented, please vote as promptly as possible, whether or not you plan to attend the Special Meeting. You may vote by mail, telephone or over the Internet.
• To vote by mail, please mark, sign, date and mail the enclosed proxy card. No postage is required if mailed in the United States.
• To vote by telephone, please call the toll-free number located on your proxy card and follow the recorded instructions, using your proxy card as a guide.
• To vote over the Internet, go the Internet address provided on your proxy card and follow the instructions, using your proxy card as a guide.
Kevin J. McCarthy
Vice President and Secretary
1
Proxy Statement/Prospectus
Dated , 2009
NUVEEN SANTA BARBARA DIVIDEND GROWTH FUND
Relating to the Acquisition of the Assets and Liabilities of
NUVEEN RITTENHOUSE GROWTH FUND
This Proxy Statement/Prospectus is being furnished to shareholders of the Nuveen Rittenhouse Growth Fund (the “Growth Fund”), a series of the Nuveen Investment Trust II (the “Trust”), a Massachusetts business trust and an open-end investment company registered under the Investment Company Act of 1940, as amended (the “1940 Act”), and relates to the special meeting of shareholders of the Growth Fund to be held in the 31st floor conference room of Nuveen Investments, LLC, 333 West Wacker Drive, Chicago, Illinois 60606, on , , 2009 at :00 a.m., Central time and at any and all adjournments thereof (the “Special Meeting”). This Proxy Statement/Prospectus is provided in connection with the solicitation by the Board of Trustees of the Trust (the “Board”) of proxies to be voted at the Special Meeting, and any and all adjournments thereof. The primary purpose of the Special Meeting is to approve or disapprove the proposed reorganization (the “Reorganization”) of the Growth Fund into the Nuveen Santa Barbara Dividend Growth Fund (the “Dividend Growth Fund”). The Growth Fund and the Dividend Growth Fund are referred to herein collectively as the “Funds” and individually as a “Fund.” The Reorganization will result in shareholders of the Growth Fund in effect exchanging their Class A, Class B, Class C and Class I shares of the Growth Fund for Class A, Class B, Class C and Class I shares of the Dividend Growth Fund of corresponding value. After the Reorganization, Growth Fund shareholders will become shareholders of the Dividend Growth Fund, which has (i) lower management fees and net operating expenses than the Growth Fund, (ii) a portfolio management team that has demonstrated a stronger historic performance record than the Growth Fund, and (iii) distribution opportunities that are expected to exceed those of the Growth Fund. The Board has determined that the Reorganization is in the best interest of each Fund. The address, principal executive office and telephone number of the Funds and the Trust is 333 West Wacker Drive, Chicago, Illinois 60606, (312) 917-7700 or (800) 257-8787.
The enclosed proxy and this Proxy Statement/Prospectus are first being sent to shareholders of the Growth Fund on or about , 2009. Shareholders of record as of the close of business on , 2009 are entitled to vote at the Special Meeting and any adjournment thereof.
The Securities and Exchange Commission has not approved or disapproved these securities or determined whether the information in this Proxy Statement/Prospectus is truthful or complete. Any representation to the contrary is a criminal offense.
This Proxy Statement/Prospectus concisely sets forth the information shareholders of the Growth Fund should know before voting on the Reorganization (in effect, investing in Class A, Class B, Class C and Class I shares of the Dividend Growth Fund) and constitutes an offering of Class A, Class B, Class C and Class I shares of beneficial interest, par value $.01 per share, of the Dividend Growth Fund only. Please read it carefully and retain it for future reference.
The following documents have been filed with the Securities and Exchange Commission (“SEC”) and are incorporated into this Proxy Statement/Prospectus by reference:
(i) the Funds’ prospectus dated November 28, 2008, as supplemented from time to time, for Class A, Class B, Class C and Class I shares, a copy of which is included with this Proxy Statement/Prospectus;
(ii) the Funds’ Statement of Additional Information dated November 28, 2008, as supplemented from time to time, for Class A, Class B, Class C and Class I shares;
(iii) the Statement of Additional Information relating to the proposed Reorganization, dated January , 2009 (the “Reorganization SAI”); and
(iv) the audited financial statements and related independent registered public accounting firm’s report for the Funds and the financial highlights for the Funds contained in the Funds’ Annual Report for the fiscal year ended July 31, 2008.
No other parts of the Funds’ Annual Report are incorporated by reference herein.
Copies of the foregoing may be obtained without charge by calling or writing the Funds at the telephone number or address shown above. If you wish to request the Reorganization SAI, please ask for the “Reorganization SAI.” In addition, the Dividend Growth Fund will furnish, without charge, a copy of its most recent annual report and subsequent semiannual report to a shareholder upon request. Any such request should be directed to the Dividend Growth Fund by calling (800) 257-8787 or by writing the Dividend Growth Fund at 333 West Wacker Drive, Chicago, Illinois 60606.
The Trust is subject to the informational requirements of the Securities Exchange Act of 1934, as amended, and the 1940 Act, and in accordance therewith file reports and other information with the SEC. Reports, proxy statements, registration statements and other information filed by the Trust (including the Registration Statement relating to the Dividend Growth Fund on Form N-14 of which this Proxy Statement/Prospectus is a part may be inspected without charge and copied (for a duplication fee at prescribed rates) at the SEC’s public reference room at 100 F Street, N.E., Washington, D.C. 20549 or at the SEC’s Northeast Regional Office (3 World Financial Center, New York, New York 10281) or Midwest Regional Office (175 W. Jackson Boulevard, Suite 900, Chicago, Illinois 60604). You may call the SEC at (202) 551-5850 for information about the operation of the public reference room. You may obtain copies of this information, with payment of a duplication fee, by electronic request at the following e-mail address: publicinfo@sec.gov, or by writing the SEC’s Public Reference Branch, Office of Consumer Affairs and Information Services, Securities and Exchange Commission, Washington, D.C. 20549. You may also access reports and other information about the Funds on the EDGAR database on the SEC’s Internet site at http://www.sec.gov.
2
Proxy Statement/Prospectus
NUVEEN SANTA BARBARA DIVIDEND GROWTH FUND
Relating to the Acquisition of the Assets and Liabilities of
NUVEEN RITTENHOUSE GROWTH FUND
SUMMARY
The following is a summary of, and is qualified by reference to, the more complete information contained in this Proxy Statement/Prospectus and the information attached hereto or incorporated herein by reference (including the Agreement and Plan of Reorganization). As discussed more fully below and elsewhere in this Proxy Statement/Prospectus, the Board of Trustees (the “Board”) of Nuveen Investment Trust II (the “Trust”) believes the proposed Reorganization (as defined herein) is in the best interests of the Growth Fund and would not result in dilution of existing Growth Fund shareholders’ interests. As a result of the Reorganization, shareholders of the Growth Fund will become shareholders of the Dividend Growth Fund and will cease to be shareholders of the Growth Fund.
Shareholders should read the entire Proxy Statement/Prospectus carefully together with the Dividend Growth Fund’s Prospectus that accompanies this Proxy Statement/Prospectus and is incorporated herein by reference. This Proxy Statement/Prospectus constitutes an offering of Class A, Class B, Class C and Class I shares of the Dividend Growth Fund only.
The Reorganization
This Proxy Statement/Prospectus is being furnished to shareholders of the Growth Fund in connection with the proposed combination of the Fund with and into the Dividend Growth Fund pursuant to the terms and conditions of the Agreement and Plan of Reorganization dated , 2009 by the Trust on behalf of each of the Growth Fund and the Dividend Growth Fund (the “Agreement”). The Agreement provides for (i) the transfer of all the assets of the Growth Fund to the Dividend Growth Fund in exchange solely for Class A, Class B, Class C and Class I shares of beneficial interest, par value $0.01 per share, of the Dividend Growth Fund and the assumption by the Dividend Growth Fund of all the liabilities of the Growth Fund; and (ii) the distribution by the Growth Fund of the Class A, Class B, Class C and Class I shares of the Dividend Growth Fund, respectively, to the Class A, Class B, Class C and Class I shareholders of the Growth Fund, respectively, as part of the termination, dissolution and complete liquidation of the Growth Fund as soon as practicable following the Closing Date (as defined herein)(the “Reorganization”).
After the Reorganization, Growth Fund shareholders will become shareholders of the Dividend Growth Fund, which has (i) lower management fees and net operating expenses than the Growth Fund, (ii) a portfolio management team that has demonstrated a stronger historic performance record than the Growth Fund, and (iii) distribution opportunities that are expected to exceed those of the Growth Fund. The Board has determined that the Reorganization is in the best interests of each Fund and that the interests of existing shareholders will not be diluted as a result of the Reorganization. The Board unanimously approved the Reorganization and the Agreement on November 19, 2008. The Board recommends a vote “FOR” the Reorganization.
If the Reorganization is approved and completed, the Growth Fund will pay all costs associated with the Reorganization, which are estimated to be approximately $190,000. If the Reorganization is not approved or not completed, Nuveen Asset Management, the Funds’ investment adviser (the “Adviser” or “NAM”), will pay such costs.
The Board is asking shareholders of the Growth Fund to approve the Reorganization at the Special Meeting to be held on , 2009. For the Growth Fund, approval of the Reorganization requires the favorable vote of the holders of a majority of the outstanding voting securities entitled to vote, as defined by the Investment Company Act of 1940, as amended (the “1940 Act”). See “Voting Information and Requirements” below.
If shareholders of the Growth Fund approve the Reorganization, it is expected that the Reorganization will occur on , 2009 (the “Closing Date”), but it may be at a different time as described herein. If the Reorganization is not approved, the Board may liquidate and terminate the Growth Fund. The Reorganization may be abandoned at any time by the mutual agreement of the parties. In addition, either Fund may at its option terminate the Agreement at or before the Closing Date due to (i) a breach by any other party of any representation, warranty, or agreement contained in the Agreement to be performed at or before the Closing Date, if not cured within 30 days, (ii) a condition precedent to the obligations of the terminating party that has not been met and it reasonably appears that it will not or cannot be met, or (iii) a determination by the Board that the consummation of the transactions contemplated by the Agreement is not in the best interests of the Fund.
3
Reasons for the Proposed Reorganization
The Board believes that the proposed Reorganization would be in the best interests of each Fund. In making this determination, the Board considered information regarding the Funds, the proposed Reorganization and a number of factors, including, among other things:
| | • | | The compatibility of the Growth Fund’s investment objective, investment philosophy and investment approach with those of the Dividend Growth Fund; |
| | • | | The relative past and current asset levels of the Funds; |
| | • | | The investment performance of the Funds; |
| | • | | The relative fees and expense ratios of the Funds, including caps on the Funds’ expenses agreed to by NAM; |
| | • | | The anticipated tax-free nature of the Reorganization; |
| | • | | The expected costs of the Reorganization and the extent to which the Funds would bear any such costs; |
| | • | | The terms of the Reorganization and whether the Reorganization would dilute the interests of shareholders of the Funds; |
| | • | | The portfolio managers that will manage the combined fund; and |
| | • | | Any potential benefits of the Reorganization to NAM as a result of the Reorganization. |
In approving the Reorganization, the Board considered, in particular, the following:
| | • | | Reduced Management Fees and Net Operating Expenses. The Dividend Growth Fund has lower management fees and net operating expenses than the Growth Fund. |
| | • | | Stronger Portfolio Management Team. The Dividend Growth Fund has a portfolio management team that has demonstrated a stronger historic performance record than the Growth Fund. |
| | • | | Improved Distribution Opportunities. After the Reorganization, the Dividend Growth Fund’s distribution opportunities are expected to exceed those of the Growth Fund. Improving distribution opportunities has the potential to grow the size of the Fund, which may lead to lower operating expenses over time. |
For a fuller discussion of the Board’s considerations regarding the approval of the Reorganization, see “The Board’s Approval of the Reorganization.”
Federal Income Tax Consequences of the Reorganization
The Reorganization is intended to qualify as a reorganization for federal income tax purposes. If the Reorganization so qualifies, neither the Growth Fund nor its shareholders will recognize any gain or loss as a direct result of the transfers contemplated by the Reorganization. In connection with the Reorganization, a portion of the Growth Fund’s portfolio assets will be sold prior to the Reorganization, which may result in the Growth Fund declaring taxable distributions to its shareholders on or prior to the Closing Date. For a more detailed discussion of the federal income tax consequences of the Reorganization, please see “The Proposed Reorganization — Certain Federal Income Tax Consequences” below.
COMPARISON OF THE DIVIDEND GROWTH FUND WITH THE GROWTH FUND
Investment Objectives
The Dividend Growth Fund and the Growth Fund have similar, although not identical, investment objectives. The investment objective of the Dividend Growth Fund is to seek an attractive total return comprised of income from dividends and long-term capital appreciation. The investment objective of the Growth Fund is to provide long-term growth of capital by investing in a diversified portfolio consisting primarily of equity securities traded in U.S. securities markets of large-capitalization companies that have a history of consistent earnings and dividend growth. While both Funds seek long-term capital appreciation, only the Dividend Growth Fund emphasizes companies that pay tax-advantaged dividends.
Investment Policies
The Dividend Growth Fund and the Growth Fund have similar, although not identical, investment policies. Both Funds invest primarily in large-capitalization U.S. stocks and follow a conservative growth philosophy centered on companies with quality earnings and earnings growth potential. The primary differences between the Funds are that (i) the Dividend Growth Fund, unlike the Growth Fund, emphasizes companies that pay tax-advantaged dividends, (ii) the Dividend Growth Fund invests in companies that exhibit both growth and value
4
characteristics, while the Growth Fund focuses primarily on growth stocks, (iii) the Dividend Growth Fund may invest a higher percentage of its net assets in non-U.S. securities than the Growth Fund.
Under normal market conditions, the Dividend Growth Fund invests at least 80% of its net assets in dividend-paying common and preferred stocks. The Dividend Growth Fund seeks to provide income from dividends that is tax-advantaged, subject to holding period requirements. The Dividend Growth Fund may invest up to 25% of its net assets in non-U.S. equity securities that are U.S. dollar-denominated.
Under normal market conditions, the Growth Fund invests at least 65% of its net assets in equity securities of high quality companies — those large-capitalization companies with a high financial strength rating and a history of consistent and predictable earnings growth. The Growth Fund may invest up to 15% of its net assets in non-U.S. equity securities that are U.S. dollar denominated.
As a result of its focus on dividend-paying securities, the Dividend Growth Fund may, from time to time, have a greater exposure to those sectors of the market that have historically provided higher dividend yields (such as the financial services, utilities and energy sectors) than the broad equity market. The Dividend Growth Fund may also invest a higher percentage of its net assets in non-U.S. securities, thus potentially exposing its shareholders to the risks associated with foreign investment to a greater extent than shareholders of the Growth Fund.
In evaluating the Reorganization, each Growth Fund shareholder should consider the impact of investing in the Dividend Growth Fund. For a description of the risks involved in investing in the Dividend Growth Fund, please see the section below entitled “Risk Factors.”
As a result of the foregoing differences in investment policies, the Reorganization is expected to result in one-time brokerage costs for the Growth Fund associated with the alignment of the portfolios of the two Funds and could result in the payment by Growth Fund shareholders of increased taxes on realized investment gains.
Board Members and Officers
Both Funds are series of the Trust and, as a result, the same individuals constitute the Board. The Funds also have the same officers. The management of each Fund, including general supervision of the duties performed by the Adviser under the Investment Management Agreement for each Fund, is the responsibility of its Board. There are currently nine (9) trustees of the Trust, one (1) of whom is an “interested person” (as defined in the 1940 Act) and eight (8) of whom are not interested persons (the “independent trustees”). The names and business addresses of the trustees and officers of the Funds and their principal occupations and other affiliations during the past five years are set forth under “Management” in the Statement of Additional Information for the Funds incorporated herein by reference.
Performance Information
A comparison of the total returns of the Funds for the periods ended December 31, 2008, is set forth in the chart and tables below.
The chart below illustrates annual calendar year returns for each of the past ten years for the Growth Fund and for each of the past two years for the Dividend Growth Fund. The tables below illustrate average annual returns for the one-year, five-year and ten-year periods ended December 31, 2008 for the Growth Fund, and one-year and since inception periods ended December 31, 2008 for the Dividend Growth Fund. The tables also show how each Fund’s performance compares with the returns of a broad measure of market performance and a peer group of funds with similar investment objectives. This information is intended to help you assess the variability of Fund returns (and consequently, the potential rewards and risks of a fund investment).
Returns before taxes do not reflect the effects of any income or capital gains taxes. All after-tax returns are calculated using the highest historical marginal individual federal income tax rates and do not reflect the impact of any state or local tax. After-tax returns are shown for Class A shares only; after-tax returns for Class B, Class C and Class I shares will vary. Returns after taxes on distributions reflect the taxed return on the payment of dividends and capital gains. Returns after taxes on distributions and sale of shares assume you sold your shares at period end, and, therefore, are also adjusted for any capital gains or losses incurred on the sale of Fund shares. Returns for market indices do not include expenses, which are deducted from Fund returns, or taxes.
Your own actual after-tax returns will depend on your specific tax situation and may differ from what is shown here. After-tax returns are not relevant to investors who hold Fund shares in tax-deferred accounts such as individual retirement accounts (IRAs) or employer-sponsored retirement plans.
5
Past performance does not necessarily indicate future performance.
Total Returns
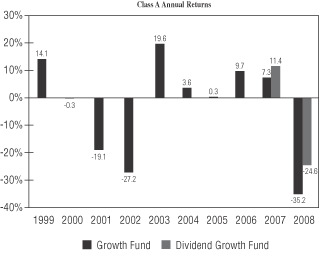
During the ten years ended December 31, 2008, the Growth Fund’s highest and lowest calendar quarter returns were 16.36% and -21.26%, respectively, for the quarters ended December 31, 1999 and December 31, 2008.
During the two years ended December 31, 2008, the Dividend Growth Fund’s highest and lowest calendar quarter returns were 4.92% and -13.94%, respectively, for the quarters ended March 31, 2007 and December 31, 2008.
| | | | | | | | | |
| | | Average Annual Total Returns for the
Periods Ended December 31, 2008 | |
Growth Fund | | 1 Year | | | 5 Year | | | 10 Year | |
Class Returns Before Taxes: | | | | | | | | | |
Class A (Offer) | | -38.92 | % | | -5.67 | % | | -5.01 | % |
Class B | | -38.23 | % | | -5.44 | % | | -5.03 | % |
Class C | | -35.67 | % | | -5.26 | % | | -5.17 | % |
Class I | | -35.02 | % | | -4.31 | % | | -4.22 | % |
Class A (Offer) Returns After Taxes: | | | | | | | | | |
After Taxes on Distributions | | -38.92 | % | | -5.67 | % | | -5.01 | % |
After Taxes on Distributions and Sale of Shares | | -25.30 | % | | -4.73 | % | | -4.09 | % |
Russell 1000® Growth Index* | | -38.44 | % | | -3.42 | % | | -4.27 | % |
Russell Top 200® Growth Index* | | -36.06 | % | | -3.64 | % | | -5.14 | % |
Lipper Peer Group* | | -41.39 | % | | -3.99 | % | | -4.76 | % |
| | | | | | |
| | | Average Annual Total Returns for the
Periods Ended December 31, 2008 | |
Dividend Growth Fund | | 1 Year | | | Since Inception
(March 28, 2006) | |
Class Returns Before Taxes: | | | | | | |
Class A (Offer) | | -28.93 | % | | -3.57 | % |
Class B | | -28.12 | % | | -3.57 | % |
Class C | | -25.20 | % | | -2.23 | % |
Class I | | -24.42 | % | | -1.24 | % |
Class A (Offer) Returns After Taxes: | | | | | | |
After Taxes on Distributions | | -29.10 | % | | -3.87 | % |
After Taxes on Distributions and Sale of Shares | | -18.52 | % | | -2.96 | % |
S&P 500 Index* | | -37.00 | % | | -10.44 | % |
Lipper Peer Group* | | -35.40 | % | | -9.83 | % |
| * | Returns assume reinvestment of dividends, but do not include any brokerage commissions, sales charges or other fees (except management fees in the case of the Lipper Peer Group). You cannot invest directly in an index or the Lipper Peer Group. For the Growth Fund, the Lipper Peer Group returns reflect the performance of the Lipper Large-Cap Growth Funds Index. For the Dividend Growth Fund, the Lipper Peer Group returns reflect the performance of the Lipper Equity Income Funds Index. See “Glossary of Investment Terms” in the Funds’ Prospectus for information regarding the indices and the Lipper Peer Groups. |
6
Investment Adviser and Sub-Advisers
The Dividend Growth Fund and the Growth Fund are both managed by NAM. NAM offers advisory and investment management services to a broad range of mutual fund clients. NAM has overall responsibility for management of the Funds. NAM oversees the management of the Funds’ portfolios, manages the Funds’ business affairs and provides certain clerical, bookkeeping and other administrative services. NAM is located at 333 West Wacker Drive, Chicago, Illinois 60606. NAM is a wholly-owned subsidiary of Nuveen Investments, Inc. (“Nuveen Investments”).
On November 13, 2007, Nuveen Investments was acquired by investors led by Madison Dearborn Partners, LLC, which is a private equity investment firm based in Chicago, Illinois (the “MDP Acquisition”). The investor group led by Madison Dearborn Partners, LLC includes affiliates of Merrill Lynch, Pierce, Fenner & Smith Incorporated (“Merrill Lynch”). Merrill Lynch has since been acquired by Bank of America Corporation. NAM has adopted policies and procedures that address arrangements involving NAM and Bank of America Corporation (including Merrill Lynch) that may give rise to certain conflicts of interest.
Each Fund is dependent upon services and resources provided by its investment adviser, NAM, and therefore the investment adviser’s parent, Nuveen Investments. Nuveen Investments significantly increased its level of debt in connection with the MDP Acquisition. While Nuveen Investments believes that monies generated from operations and cash on hand will be adequate to fund debt service requirements, capital expenditures and working capital requirements for the foreseeable future, there can be no assurance that Nuveen Investments’ business will generate sufficient cash flow from operations or that future borrowings will be available in an amount sufficient to enable Nuveen Investments to pay its indebtedness (with scheduled maturities beginning in 2014) or to fund its other liquidity needs. Nuveen Investments believes that potential adverse changes to its overall financial position and business operations would not adversely affect NAM’s portfolio management operations and would not otherwise adversely affect NAM’s ability to fulfill its obligations to the Funds under their investment management agreements.
Santa Barbara Asset Management (“SBAM”), 200 E. Carrillo St., Santa Barbara, California 93101, an affiliate of NAM, is the sub-adviser to the Dividend Growth Fund. SBAM manages the investment of the Dividend Growth Fund’s assets on a discretionary basis, subject to the supervision of NAM.
The portfolio manager for the Dividend Growth Fund is James Boothe. Mr. Boothe, CFA, joined SBAM in 2002. His investment management career began in 1978. His prior affiliations include USAA Investment Management Co., San Juan Asset Management, Bradford & Marzec and Farmers Insurance Group.
Prior to January 1, 2009, Rittenhouse Asset Management, Inc. (“Rittenhouse”), Five Radnor Corporate Center, Suite 300, Radnor, Pennsylvania 19087-9570, a wholly-owned subsidiary of Nuveen Investments, was the sub-adviser to the Growth Fund. On January 1, 2009, Rittenhouse’s advisory business and portfolio management personnel were consolidated with SBAM, a wholly-owned subsidiary of Nuveen Investments and an affiliate of Rittenhouse. There were no changes in the portfolio management team of the Growth Fund, although as a result of the consolidation, SBAM became the sub-adviser to the Growth Fund. SBAM manages the investment of the Growth Fund’s assets on a discretionary basis, subject to the supervision of NAM.
The Growth Fund’s investment management strategy and portfolio purchase and sale determinations are set through a team approach, with all its investment professionals contributing. The portfolio managers for the Growth Fund are:
| | • | | James J. Jolinger, Managing Director and Portfolio Manager, has been a member of the Fund’s research and investment team since 2001. He previously was a Portfolio Manager and Executive Director at Morgan Stanley Investment Management, Inc. from 1997 to 2003. |
| | • | | Daniel C. Roarty, CFA, Managing Director and Portfolio Manager, has been a member of the Fund’s research and investment team since 2001. |
| | • | | Nancy M. Crouse, CFA, Managing Director and Portfolio Manager, has been a member of the Fund’s research and investment team since 2005. She was previously Senior Vice President/Senior Portfolio Manager at Delaware Investment Advisers from 1993 to 2005. |
| | • | | Robert A. Norton, Jr., CFA, Vice President and Portfolio Manager, has been a member of the Fund’s research and investment team since 2002. Prior to 2002, he was with Delaware Investments for 17 years as a Vice President. |
For a complete description of the advisory services provided to the Funds, see the section of the Funds’ Prospectus entitled “How We Manage Your Money” and the section of the Funds’ Statement of Additional Information entitled “Fund Manager and Sub-Advisers.”
7
Advisory and Other Fees
Pursuant to an investment management agreement between the Adviser and the Trust, the Growth Fund and the Dividend Growth Fund pay the Adviser annual fund-level fees, payable monthly, at the rates set forth below:
| | | | | | |
| | | Management Fee | |
Average Daily Net Assets | | Growth Fund | | | Dividend Growth
Fund | |
For the first $125 million | | 0.6500 | % | | 0.6000 | % |
For the next $125 million | | 0.6375 | % | | 0.5875 | % |
For the next $250 million | | 0.6250 | % | | 0.5750 | % |
For the next $500 million | | 0.6125 | % | | 0.5625 | % |
For the next $1 billion | | 0.6000 | % | | 0.5500 | % |
For net assets over $2 billion | | 0.5750 | % | | 0.5250 | % |
In addition to the fund-level fee, each Fund pays a complex-level fee. The complex-level fee is the same for each Fund and begins at a maximum rate of 0.20% of each Fund’s net assets, based upon complex-level assets of $55 billion, with breakpoints for assets above that level. Therefore, the maximum management fee rate for each Fund is the fund-level fee plus 0.20%. As of September 30, 2008, the effective complex-level fee for each Fund was 0.1947% of net assets.
For the Funds’ most recent fiscal year ended July 31, 2008, each Fund paid NAM the following management fees (net of fee waivers and expense reimbursements, where applicable) as a percentage of average net assets:
| | | |
Growth Fund | | 0.68 | % |
Dividend Growth Fund | | 0.05 | % |
The Growth Fund and the Dividend Growth Fund have adopted identical distribution and service plans (the “Plans”) pursuant to Rule 12b-1 under the 1940 Act. The Plans provide that Class B shares and Class C shares are subject to an annual distribution fee, and that Class A shares, Class B shares and Class C shares are all subject to an annual service fee. Class I shares are not subject to either distribution or service fees.
Each Fund may spend up to 0.25% per year of the average daily net assets of Class A shares as a service fee under the Plan as applicable to Class A shares. Each Fund may spend up to 0.75% per year of the average daily net assets of each of the Class B shares and Class C shares as a distribution fee which constitutes an asset-based sales charge whose purpose is the same as an up-front sales charge and up to 0.25% per year of the average daily net assets of each of the Class B shares and Class C shares as a service fee under the Plan as applicable to such classes. For a complete description of these arrangements with respect to the Dividend Growth Fund, see the section of the Funds’ Prospectus entitled “How You Can Buy and Sell Shares” and the section of the Funds’ Statement of Additional Information entitled “Distribution and Service Plans.”
The table below sets forth (i) fees charged to shareholders of the Growth Fund and the Dividend Growth Fund during the Funds’ most recently completed fiscal year and (ii) pro forma fees for the combined fund as if the Reorganization occurred on July 31, 2008.
Shareholder Fees1
(paid directly from your investment)
| | | | | | | | | |
| | | Growth
Fund | | | Dividend
Growth
Fund | | | Combined
Fund Pro
Forma | |
Maximum Sales Charge Imposed on Purchases | | | | | | | | | |
Class A | | 5.75 | %2 | | 5.75 | %2 | | 5.75 | %2 |
Class B | | None | | | None | | | None | |
Class C | | None | | | None | | | None | |
Class I3 | | None | | | None | | | None | |
Maximum Sales Charge Imposed on Reinvested Dividends | | | | | | | | | |
Class A | | None | | | None | | | None | |
Class B | | None | | | None | | | None | |
Class C | | None | | | None | | | None | |
Class I3 | | None | | | None | | | None | |
8
| | | | | | | | | |
| | | Growth
Fund | | | Dividend
Growth
Fund | | | Combined
Fund Pro
Forma | |
Exchange Fees | | | | | | | | | |
Class A | | None | | | None | | | None | |
Class B | | None | | | None | | | None | |
Class C | | None | | | None | | | None | |
Class I3 | | None | | | None | | | None | |
Deferred Sales Charge4 | | | | | | | | | |
Class A | | None | 5 | | None | 5 | | None | 5 |
Class B | | 5.00 | %6 | | 5.00 | %6 | | 5.00 | %6 |
Class C | | 1.00 | %7 | | 1.00 | %7 | | 1.00 | %7 |
Class I3 | | None | | | None | | | None | |
| 1 | As a percentage of offering price. Financial intermediaries may charge additional fees for shareholder transactions or for advisory services. Please see their materials for details. |
| 2 | Reduced Class A sales charges apply to purchases of $50,000 or more. See “How You Can Buy and Sell Shares” in the Funds’ Prospectus. |
| 3 | Class I shares may be purchased only under limited circumstances, or by specified classes of investors. See “How You Can Buy and Sell Shares” in the Funds’ Prospectus. |
| 4 | As a percentage of the lesser of purchase price or redemption proceeds. |
| 5 | Certain Class A purchases at net asset value of $1 million or more may be subject to a contingent deferred sales charge (“CDSC”) if redeemed within 12 months of purchase. See “How You Can Buy and Sell Shares” in the Funds’ Prospectus. |
| 6 | Class B shares redeemed within six years of purchase are subject to a CDSC of 5% during the first year, 4% during the second and third years, 3% during the fourth year, 2% during the fifth year, and 1% during the sixth year. Class B shares may be purchased only under limited circumstances. See “How You Can Buy and Sell Shares” in the Funds’ Prospectus. |
| 7 | Class C shares redeemed within one year of purchase are subject to a 1% CDSC. See “How You Can Buy and Sell Shares” in the Funds’ Prospectus. |
The table below sets forth (i) the expenses paid by the Growth Fund and the Dividend Growth Fund during the Funds’ most recently completed fiscal year and (ii) pro forma expenses for the combined fund as if the Reorganization occurred on July 31, 2008. The table shows that, as a percentage of net assets, the management fees and net operating expenses of the Dividend Growth Fund were lower for the most recent fiscal year than those of the Growth Fund. If the Reorganization is approved and completed, NAM has agreed to waive fees and reimburse expenses for the combined fund through November 30, 2011, so that total annual fund operating expenses (excluding 12b-1 distribution and service fees, interest expenses, taxes, fees incurred in acquiring and disposing of portfolio securities, and extraordinary expenses) do not exceed 1.05% (1.25% after November 30, 2011) of the average daily net assets of any class of the combined fund’s shares.
Annual Fund Operating Expenses
(paid from Fund assets)
| | | | | | | | | |
| | | Growth
Fund | | | Dividend
Growth
Fund | | | Combined
Fund Pro
Forma1 | |
Management Fees | | | | | | | | | |
Class A | | 0.84 | % | | 0.79 | % | | 0.79 | % |
Class B | | 0.84 | % | | 0.79 | % | | 0.79 | % |
Class C | | 0.84 | % | | 0.79 | % | | 0.79 | % |
Class I2 | | 0.84 | % | | 0.79 | % | | 0.79 | % |
12b-1 Distribution and Service Fee | | | | | | | | | |
Class A | | 0.25 | % | | 0.25 | % | | 0.25 | % |
Class B3 | | 1.00 | % | | 1.00 | % | | 1.00 | % |
Class C3 | | 1.00 | % | | 1.00 | % | | 1.00 | % |
Class I2 | | None | | | None | | | None | |
Other Expenses | | | | | | | | | |
Class A | | 0.53 | %4 | | 0.98 | %4 | | 0.49 | %5 |
Class B | | 0.51 | %4 | | 1.27 | %4 | | 0.49 | %5 |
Class C | | 0.52 | %4 | | 1.28 | %4 | | 0.49 | %5 |
Class I2 | | 0.52 | %4 | | 0.77 | %4 | | 0.49 | %5 |
Total Annual Fund Operating Expenses— Gross | | | | | | | | | |
Class A | | 1.62 | %6 | | 2.02 | %7 | | 1.53 | %8 |
Class B | | 2.35 | %6 | | 3.06 | %7 | | 2.28 | %8 |
Class C | | 2.36 | %6 | | 3.07 | %7 | | 2.28 | %8 |
Class I2 | | 1.36 | %6 | | 1.56 | %7 | | 1.28 | %8 |
9
| | | | | | | | | |
| | | Growth
Fund | | | Dividend
Growth
Fund | | | Combined
Fund Pro
Forma1 | |
Fee Waivers and Reimbursements | | | | | | | | | |
Class A | | (0.17 | %) | | (0.74 | %) | | (0.25 | %) |
Class B | | (0.15 | %) | | (1.02 | %) | | (0.24 | %) |
Class C | | (0.15 | %) | | (1.03 | %) | | (0.24 | %) |
Class I2 | | (0.16 | %) | | (0.53 | %) | | (0.25 | %) |
Total Annual Fund Operating Expenses—Net9 | | | | | | | | | |
Class A | | 1.45 | % | | 1.28 | % | | 1.28 | % |
Class B | | 2.20 | % | | 2.04 | % | | 2.04 | % |
Class C | | 2.21 | % | | 2.04 | % | | 2.04 | % |
Class I2 | | 1.20 | % | | 1.03 | % | | 1.03 | % |
| 1 | Pro forma expenses do not include the expenses to be borne by the Growth Fund in connection with the Reorganization. See pages and for additional information on these expenses. |
| 2 | Class I shares may be purchased only under limited circumstances, or by specified classes of investors. See “How You Can Buy and Sell Shares” in the Fund’s Prospectus. |
| 3 | Long-term holders of Class B and Class C shares may pay more in Rule 12b-1 fees and CDSCs than the economic equivalent of the maximum front-end sales charge permitted under the Financial Industry Regulatory Authority Conduct Rules. |
| 4 | Other Expenses reflect the actual expense levels for each share class during the most recent fiscal year. |
| 5 | Other Expenses are estimated, accounting for the effect of the Reorganization. |
| 6 | For the Growth Fund, the Adviser has agreed to waive fees and reimburse expenses through November 30, 2009, so that Total Annual Fund Operating Expenses (excluding 12b-1 distribution and service fees, interest expenses, taxes, fees incurred in acquiring and disposing of portfolio securities, and extraordinary expenses) do not exceed 1.22% of the average daily net assets of any class of Fund shares. |
| 7 | For the Dividend Growth Fund, the Adviser has agreed to waive fees and reimburse expenses through November 30, 2009, so that Total Annual Fund Operating Expenses (excluding 12b-1 distribution and service fees, interest expenses, taxes, fees incurred in acquiring and disposing of portfolio securities, and extraordinary expenses) do not exceed 1.05% (1.30% after November 30, 2009) of the average daily net assets of any class of Fund shares. |
| 8 | If the Reorganization is approved and completed, the Adviser has agreed to waive fees and reimburse expenses through November 30, 2011, so that Total Annual Fund Operating Expenses (excluding 12b-1 distribution and service fees, interest expenses, taxes, fees incurred in acquiring and disposing of portfolio securities, and extraordinary expenses) do not exceed 1.05% (1.25% after November 30, 2011) of the average daily net assets of any class of Fund shares. |
| 9 | The Funds have an arrangement with the custodian bank whereby certain custodian fees and expenses are reduced by credits earned on the Funds’ cash on deposit with the bank. Such deposit arrangements are an alternative to overnight investments. For the fiscal year ended July 31, 2008, the Dividend Growth Fund earned 0.04%, 0.05%, 0.05%, and 0.04% in custodian fee credits for Class A, B, C and I shares, respectively. There is no guarantee that the Fund will earn such credits in the future. |
The example below is intended to help you compare the cost of investing in the Growth Fund, the Dividend Growth Fund and the pro forma cost of investing in the combined fund. The example assumes you invest $10,000 in a Fund for the time periods indicated and then either redeem or do not redeem your shares at the end of a period. For the Growth Fund, the example assumes that your investment has a 5% return each year and that Total Annual Fund Operating Expenses are 1.22% for Class A, B, C and I shares, respectively (excluding 12b-1 distribution and service fees, interest expenses, taxes, fees incurred in acquiring and disposing of portfolio securities, and extraordinary expenses) through November 30, 2009, and 1.62%, 2.35%, 2.36%, and 1.36% for Class A, B, C and I shares, respectively (excluding interest expenses, taxes, fees incurred in acquiring and disposing of portfolio securities, and extraordinary expenses) thereafter. For the Dividend Growth Fund and the combined fund, the example assumes that your investment has a 5% return each year and that Total Annual Fund Operating Expenses do not exceed the applicable expense cap for the applicable time periods. Your actual returns and costs may be higher or lower.
| | | | | | | | | |
| | | Growth
Fund | | Dividend
Growth
Fund | | Combined
Fund
Pro Forma |
1 Year Assuming you sold your shares at the end of each period. | | | | | | | | | |
Class A | | $ | 716 | | $ | 700 | | $ | 700 |
Class B | | $ | 625 | | $ | 608 | | $ | 608 |
Class C | | $ | 225 | | $ | 208 | | $ | 208 |
Class I | | $ | 124 | | $ | 107 | | $ | 107 |
Assuming you kept your shares. | | | | | | | | | |
Class A | | $ | 716 | | $ | 700 | | $ | 700 |
Class B | | $ | 225 | | $ | 208 | | $ | 208 |
Class C | | $ | 225 | | $ | 208 | | $ | 208 |
Class I | | $ | 124 | | $ | 107 | | $ | 107 |
3 Years Assuming you sold your shares at the end of each period. | | | | | | |
Class A | | $ | 1,043 | | $ | 1,013 | | $ | 963 |
Class B | | $ | 1,021 | | $ | 994 | | $ | 943 |
Class C | | $ | 723 | | $ | 694 | | $ | 643 |
Class I | | $ | 417 | | $ | 387 | | $ | 334 |
10
| | | | | | | | | |
| | | Growth
Fund | | Dividend
Growth
Fund | | Combined
Fund
Pro Forma |
Assuming you kept your shares. | | | | | | | | | |
Class A | | $ | 1,043 | | $ | 1,013 | | $ | 963 |
Class B | | $ | 721 | | $ | 694 | | $ | 643 |
Class C | | $ | 723 | | $ | 694 | | $ | 643 |
Class I | | $ | 417 | | $ | 387 | | $ | 334 |
5 Years Assuming you sold your shares at the end of each period. | | | | | | |
Class A | | $ | 1,392 | | $ | 1,349 | | $ | 1,290 |
Class B | | $ | 1,344 | | $ | 1,308 | | $ | 1,247 |
Class C | | $ | 1,248 | | $ | 1,208 | | $ | 1,147 |
Class I | | $ | 731 | | $ | 689 | | $ | 626 |
Assuming you kept your shares. | | | | | | | | | |
Class A | | $ | 1,392 | | $ | 1,349 | | $ | 1,290 |
Class B | | $ | 1,244 | | $ | 1,208 | | $ | 1,147 |
Class C | | $ | 1,248 | | $ | 1,208 | | $ | 1,147 |
Class I | | $ | 731 | | $ | 689 | | $ | 626 |
10 Years Assuming you sold your shares at the end of each period. | | | | | | |
Class A | | $ | 2,375 | | $ | 2,294 | | $ | 2,211 |
Class B | | $ | 2,494 | | $ | 2,428 | | $ | 2,346 |
Class C | | $ | 2,685 | | $ | 2,616 | | $ | 2,535 |
Class I | | $ | 1,623 | | $ | 1,546 | | $ | 1,455 |
Assuming you kept your shares. | | | | | | | | | |
Class A | | $ | 2,375 | | $ | 2,294 | | $ | 2,211 |
Class B | | $ | 2,494 | | $ | 2,428 | | $ | 2,346 |
Class C | | $ | 2,685 | | $ | 2,616 | | $ | 2,535 |
Class I | | $ | 1,623 | | $ | 1,546 | | $ | 1,455 |
Distribution, Purchase, Redemption, Exchange of Shares and Dividends
The Growth Fund offers four classes of shares. The Dividend Growth Fund offers five classes of shares, although only Class A, Class B, Class C and Class I shares are offered in this Proxy Statement/Prospectus. For a complete description of Class A, Class B, Class C and Class I shares, see the section of the Funds’ Prospectus entitled “How You Can Buy and Sell Shares” and the section of the Funds’ Statement of Additional Information entitled “Additional Information on the Purchase and Redemption of Fund Shares and Shareholder Programs.”
No initial sales charge or contingent deferred sales charges will be imposed on shares of the Dividend Growth Fund received or shares of the Growth Fund exchanged in connection with the Reorganization. The holding period for Class B shares and Class C shares and the conversion period for Class B shares of the Dividend Growth Fund received in connection with the Reorganization will be measured from the earlier of the time (i) the holder purchased such shares from the Growth Fund or (ii) the holder purchased such shares from any other Nuveen fund and subsequently exchanged them for shares of the Growth Fund.
The Dividend Growth Fund intends to pay income dividends on a quarterly basis and any taxable gains annually. The Growth Fund intends to pay income dividends and any taxable gains annually. As a result of the Reorganization, you will receive dividends more frequently. If the Reorganization is approved by the shareholders of the Growth Fund, the Growth Fund intends to distribute to its shareholders, prior to the closing of the Reorganization, all its net investment income and net capital gains, if any, for the period ending on the Closing Date.
No further purchases of the shares of the Growth Fund may be made after the date on which the shareholders of the Growth Fund approve the Reorganization, and the stock transfer books of the Growth Fund will be permanently closed as of the Closing Date. Only redemption requests and transfer instructions received in proper form by the close of business on the day prior to the Closing Date will be fulfilled by the Growth Fund. Redemption requests or transfer instructions received by the Growth Fund after that date will be treated by the Fund as requests for the redemption or instructions for transfer of the shares of the Dividend Growth Fund credited to the accounts of the shareholders of the Growth Fund. Redemption requests or transfer instructions received by the Growth Fund after the close of business on the day prior to the Closing Date will be forwarded to the Dividend Growth Fund. For a complete description of the redemption arrangements for the Funds, see the section of the Funds’ Prospectus entitled “How to Sell Shares.”
11
Capitalization
The following table sets forth the capitalization of the Growth Fund and the Dividend Growth Fund as of July 31, 2008, and the pro forma capitalization of the combined fund as if the Reorganization had occurred on that date. These numbers may differ at the time of the Closing Date.
Capitalization Table as of July 31, 2008 (Unaudited)
| | | | | | | | | |
| | | Growth
Fund | | Dividend
Growth
Fund | | Pro Forma
Combined
Fund* |
Net Assets | | | | | | | | | |
Class A | | $ | 43,708,192 | | $ | 4,225,994 | | $ | 47,844,111 |
Class B | | | 10,440,342 | | | 724,899 | | | 11,143,725 |
Class C | | | 26,478,966 | | | 2,870,237 | | | 29,294,634 |
Class I | | | 11,568,085 | | | 10,563,353 | | | 22,107,598 |
| | | | | | | | | |
Total | | | 92,195,585 | | | 18,384,483 | | | 110,390,068 |
| | | | | | | | | |
Shares Outstanding | | | | | | | | | |
Class A | | | 1,970,822 | | | 185,159 | | | 2,096,257 |
Class B | | | 509,676 | | | 31,780 | | | 488,547 |
Class C | | | 1,291,813 | | | 125,892 | | | 1,284,897 |
Class I | | | 508,239 | | | 462,724 | | | 968,416 |
| | | | | | | | | |
Total | | | 4,280,550 | | | 805,555 | | | 4,838,117 |
| | | | | | | | | |
Net Asset Value Per Share | | | | | | | | | |
Class A | | $ | 22.18 | | $ | 22.82 | | $ | 22.82 |
Class B | | | 20.48 | | | 22.81 | | | 22.81 |
Class C | | | 20.50 | | | 22.80 | | | 22.80 |
Class I | | | 22.76 | | | 22.83 | | | 22.83 |
Shares Authorized | | | | | | | | | |
Class A | | | Unlimited | | | Unlimited | | | Unlimited |
Class B | | | Unlimited | | | Unlimited | | | Unlimited |
Class C | | | Unlimited | | | Unlimited | | | Unlimited |
Class I | | | Unlimited | | | Unlimited | | | Unlimited |
| * | The figures for the combined fund reflect the costs associated with the proposed Reorganization (estimated to be approximately $190,000) which will be borne by the shareholders of the Growth Fund if the Reorganization is approved and completed. |
Further Information
Additional information concerning the Dividend Growth Fund and Growth Fund is contained in this Proxy Statement/Prospectus and in the accompanying Dividend Growth Fund and Growth Fund Prospectus. The cover page of this Proxy Statement/Prospectus describes how you may obtain further information.
12
RISK FACTORS
In evaluating the Reorganization, you should consider carefully the risks of the Dividend Growth Fund to which you will be subject if the Reorganization is approved and completed. Risk is inherent in all investing. Investing in a mutual fund — even the most conservative – involves risk, including the risk that you may receive little or no return on your investment or even that you may lose part or all of your investment. Because of these and other risks, you should consider an investment in the Dividend Growth Fund to be a long-term investment. An investment in the Dividend Growth Fund may not be appropriate for all Growth Fund shareholders. For a complete description of the risks of an investment in the Dividend Growth Fund, see the section in the Funds’ Prospectus entitled “What the Risks Are.”
The Growth Fund and the Dividend Growth Fund invest primarily in the equity securities of domestic issuers, exposing the Funds to many similar risk factors. However, due to the differing nature of the Funds’ investment practices, there are certain differences in their risks. The differences and similarities in risks between the two Funds are set forth in greater detail below.
Differences in Risks
The Dividend Growth Fund seeks an attractive total return comprised of income from dividends and long-term capital appreciation, while the Growth Fund seeks long-term growth of capital by investing in a diversified portfolio consisting primarily of equity securities traded in U.S. securities markets of large-capitalization companies that have a history of consistent earnings and dividend growth. To the extent that the investment practices of the Funds differ, the risks associated with an investment in the Dividend Growth Fund are different from the risks associated with an investment in the Growth Fund.
A primary difference in the Funds’ investment policies is that the Dividend Growth Fund focuses on dividend-paying common and preferred stocks. As a result of its focus on dividend-paying securities, the Dividend Growth Fund may, from time to time, have a greater exposure to those sectors of the market that have historically provided higher dividend yields (such as the financial services, utilities and energy sectors) than the broad equity market.
The Dividend Growth Fund may also invest a higher percentage of its net assets in non-U.S. securities than the Growth Fund. Accordingly, shareholders of the Dividend Growth Fund may be subject to the risks associated with non-U.S. investments to a greater extent than shareholders of the Growth Fund.
The Dividend Growth Fund may also invest in preferred securities, which gives rise to the following risks:
Limited Voting Rights. Generally, preferred securities holders (such as the Fund) have no voting rights with respect to the issuing company unless preferred dividends have been in arrears for a specified number of periods, at which time the preferred security holders may elect a number of directors to the issuer’s board. Generally, once all the arrearages have been paid, the preferred security holders no longer have voting rights.
In the case of certain preferred securities, holders generally have no voting rights, except (i) if the issuer fails to pay dividends for a specified period of time or (ii) if a declaration of default occurs and is continuing. In such an event, rights of preferred security holders generally would include the right to appoint and authorize a trustee to enforce the trust or special purpose entity’s rights as a creditor under the agreement with its operating company.
Special Redemption Rights. In certain varying circumstances, an issuer of preferred securities may redeem the securities prior to a specified date. For instance, for certain types of preferred securities, a redemption may be triggered by a change in federal income tax or securities laws. As with call provisions, a redemption by the issuer may negatively impact the return of the security held by the Fund.
Interest Rate Risk. Generally, the market values of the preferred securities tend to decline as interest rates increase and, conversely, to increase as interest rates decline. Falling market interest rates can adversely affect the Fund’s income when the Fund invests the new proceeds at market interest rates that are below the portfolio’s current earnings rate.
Credit Risk. An issuer of preferred securities may be unable to meet its obligation to make dividend and principal payments when due as a result of changing financial or market conditions. Preferred securities are subordinated to bonds and other debt instruments in a company’s capital structure and therefore will be subject to greater credit risk than those debt instruments.
Similarities of Risks
Despite the differences noted above, the Funds face many of the same types of risks, including the following:
Equity Market Risk. Equity market risk is the risk that market values of equity securities owned by a Fund will fall in value. The value of your investment in a Fund will go up and down with the prices of the securities in which the Fund invests. The prices of stocks change in
13
response to many factors, including the historical and prospective earnings of the issuer, the value of its assets, management decisions, decreased demand for an issuer’s products or services, increased production costs, general economic conditions, interest rates, currency exchange rates, investor perceptions and market liquidity.
Non-U.S. Investment Risk. Securities of non-U.S. issuers present risks beyond those of U.S. securities. The prices of non-U.S. securities can be more volatile than U.S. securities due to such factors as political, social and economic developments abroad, the differences between the regulations to which U.S. and non-U.S. issuers and markets are subject, the seizure by the government of company assets, excessive taxation, withholding taxes on dividends and interest and limitations on the use or transfer of portfolio assets. Other risks include the following:
| | • | | Enforcing legal rights may be difficult, costly and slow in non-U.S. countries, and there may be special problems enforcing claims against non-U.S. governments. |
| | • | | Non-U.S. companies may not be subject to accounting standards or governmental supervision comparable to U.S. companies, and there may be less public information about their operations. |
| | • | | Non-U.S. markets may be less liquid and more volatile than U.S. markets. |
To the extent a Fund invests in securities issued by entities located in emerging markets, the Fund may be exposed to additional risks. These markets are generally more volatile than those of countries with more mature economies.
Currency Risk. Non-U.S. securities often trade in currencies other than the U.S. dollar. Changes in currency exchange rates may affect a Fund’s net asset value, the value of dividends and interest earned, and gains and losses realized on the sale of securities. An increase in the strength of the U.S. dollar relative to these other currencies may cause the value of a Fund to decline. Certain non-U.S. currencies may be particularly volatile, and non-U.S. governments may intervene in the currency markets, causing a decline in value or liquidity in a Fund’s non-U.S. holdings whose value is tied to the affected non-U.S. currency. American Depositary Receipts and other non-U.S. securities denominated in U.S. dollars are also subject to currency risk.
Correlation Risk. The U.S. and non-U.S. equity markets often rise and fall at different times or by different amounts due to economic or other developments particular to a given country or region. This phenomenon would tend to lower the overall price volatility of a portfolio that included both U.S. and non-U.S. stocks. Sometimes, however, global trends will cause the U.S. and non-U.S. markets to move in the same direction, reducing or eliminating the risk reduction benefit of international investing.
Small and Medium-Sized Company Risk. Each Fund may invest a portion of its assets in medium-sized companies. Companies with lower market capitalizations may involve greater risk than larger capitalization companies because they tend to have younger and more limited product lines, markets and financial resources and may be dependent on a smaller management group than larger, more established companies. In addition, the securities of such companies are typically more volatile and less liquid than securities of larger capitalization companies. As a result, certain securities may be difficult or impossible to sell at the time and the price that a Fund would like, and so a Fund may have to lower the price, sell other securities instead or forego an investment opportunity. Any of these could have a negative effect on a Fund’s performance.
Derivatives Risk. The use of derivatives can lead to losses because of diverse movements in the price or value of the underlying asset, index or rate, which may be magnified by certain features of the derivatives. These risks are heightened when a Fund uses derivatives to enhance a Fund’s return or as a substitute for a position or security, rather than solely to hedge (or offset) the risk of a position or security held by a Fund.
THE PROPOSED REORGANIZATION
The proposed Reorganization will be governed by the Agreement, a form of which is attached as Appendix I. The Agreement provides that the Growth Fund will transfer all its assets to the Dividend Growth Fund solely in exchange for the issuance of full and fractional Dividend Growth Fund shares and the assumption, by the Dividend Growth Fund, of all the Growth Fund’s liabilities. Dividend Growth Fund shares will be issued on , 2009, or such other date as may be agreed upon by the parties (the “Closing Date”). The following discussion of the Agreement is qualified in its entirety by the full text of the Agreement.
The Growth Fund will transfer all its assets to the Dividend Growth Fund, and in exchange, the Dividend Growth Fund will assume all the liabilities of the Growth Fund and deliver to the Growth Fund a number of full and fractional Dividend Growth Fund shares having a net asset value equal to the value of the assets of the Growth Fund less the liabilities of the Growth Fund assumed by the Dividend Growth Fund. On or as soon after the Closing Date as is conveniently practicable, but in no event later than 12 months after the Closing Date, the
14
Growth Fund will distribute in complete liquidation of the Growth Fund, pro rata to its shareholders of record, all Dividend Growth Fund shares received by the Growth Fund. This distribution will be accomplished by the transfer of the Dividend Growth Fund shares credited to the account of the Growth Fund on the books of the Dividend Growth Fund to open accounts on the share records of the Dividend Growth Fund in the name of the Growth Fund shareholders, and representing the respective pro rata number of Dividend Growth Fund shares due such shareholders. All issued and outstanding shares of the Growth Fund will simultaneously be canceled on the books of the Growth Fund. As a result of the proposed Reorganization, each Growth Fund shareholder will receive a number of Dividend Growth Fund shares equal in value, as of the close of regular trading on the New York Stock Exchange on the business day immediately prior to the Closing Date, to the value of the Growth Fund shares surrendered by such shareholder.
The Board has determined that the proposed Reorganization is in the best interests of the Funds and that the interests of shareholders will not be diluted as a result of the transactions contemplated by the Agreement.
The consummation of the Reorganization is subject to the terms and conditions and on the representations and warranties set forth in the Agreement. The Agreement may be terminated by mutual agreement of the Funds. In addition, either Fund may at its option terminate the Agreement at or before the Closing Date due to (i) a breach by any other party of any representation, warranty, or agreement to be performed at or before the Closing Date, if not cured within 30 days; (ii) a condition precedent to the obligations of the terminating party that has not been met and it reasonably appears that it will not or cannot be met; or (iii) a determination by the Board that the consummation of the transactions contemplated therein is not in the best interests of a Fund.
The Growth Fund will, within a reasonable period of time before the Closing Date, furnish the Dividend Growth Fund with a list of the Growth Fund’s portfolio securities and other investments. The Dividend Growth Fund will, within a reasonable period of time before the Closing Date, furnish the Growth Fund with a list of the securities, if any, on the Growth Fund’s list referred to above that do not conform to the Dividend Growth Fund’s investment objective, policies, and restrictions. The Growth Fund, if requested by the Dividend Growth Fund, will dispose of securities on the Dividend Growth Fund’s list before the Closing Date. In addition, if it is determined that the portfolios of the Funds, when aggregated, would contain investments exceeding certain percentage limitations imposed upon the Dividend Growth Fund with respect to such investments, the Growth Fund, if requested by the Dividend Growth Fund, will dispose of a sufficient amount of such investments as may be necessary to avoid violating such limitations as of the Closing Date. The sale of such investments could result in taxable distributions to shareholders of the Growth Fund prior to the Reorganization. Notwithstanding the foregoing, nothing herein will require the Growth Fund to dispose of any investments or securities if, in the reasonable judgment of the Board or the Adviser, such disposition would adversely affect the tax-free nature of the Reorganization for federal income tax purposes or would otherwise not be in the best interests of the Growth Fund.
All fees and expenses, including legal and accounting expenses, portfolio transfer taxes (if any), trading costs and any other expenses incurred in connection with the consummation of the Reorganization and related transactions contemplated by the Agreement, will be borne by the Growth Fund. The Reorganization is expected to result in one-time brokerage costs for the Growth Fund associated with the alignment of the portfolios of the two Funds and could result in the payment by Growth Fund shareholders of increased taxes on realized investment gains. See “Certain Federal Income Tax Consequences” below.
Description of Securities to be Issued
Shares of Beneficial Interest. Beneficial interests in the Dividend Growth Fund being offered hereby are represented by transferable Class A, Class B, Class C and Class I shares, par value $0.01 per share. The Trust’s Declaration of Trust permits the Board, in its sole discretion, and subject to compliance with the 1940 Act, to further subdivide the shares of the Dividend Growth Fund into one or more other classes of shares.
Voting Rights of Shareholders. Holders of shares of the Dividend Growth Fund are entitled to one vote per share on matters as to which they are entitled to vote with fractional shares voting proportionally; however, separate votes generally are taken by each series on matters affecting an individual series.
The Dividend Growth Fund operates as a series of the Trust, an open-end management investment company registered with the SEC under the 1940 Act. The Trust currently has 24 series, including the Dividend Growth Fund, and the Board may, in its sole discretion, create additional series from time to time. In addition to the specific voting rights described above, shareholders of the Dividend Growth Fund are entitled, under current law, to vote with respect to certain other matters, including changes in fundamental investment policies and restrictions. Moreover, under the 1940 Act, shareholders owning not less than 10% of the outstanding shares of the Trust may request that the Board call a shareholders’ meeting for the purpose of voting upon the removal of one or more trustees.
15
Continuation of Shareholder Accounts and Plans; Share Certificates
If the Reorganization is approved, the Dividend Growth Fund will establish an account for each Growth Fund shareholder containing the appropriate number of shares of the appropriate class of the Dividend Growth Fund. The shareholder services and shareholder programs of the Dividend Growth Fund and the Growth Fund are substantially identical. Shareholders of the Growth Fund who are accumulating shares of the Growth Fund through systematic investing, or who are receiving payment under the systematic withdrawal plan with respect to shares of the Growth Fund, will retain the same rights and privileges after the Reorganization in connection with the Dividend Growth Fund Class A, B, C or I shares received in the Reorganization through substantially identical plans maintained by the Dividend Growth Fund. State Street Bank & Trust Company serves as the custodian for the assets of each Fund. No certificates for Dividend Growth Fund shares will be issued as part of the Reorganization.
Certain Federal Income Tax Consequences
As a condition to each Fund’s obligation to consummate the Reorganization, each Fund will receive a tax opinion from Vedder Price P.C. (which opinion will be based on certain factual representations and certain customary assumptions) substantially to the effect that, on the basis of the existing provisions of the Internal Revenue Code of 1986, as amended (the “Code”), current administrative rules and court decisions, for federal income tax purposes:
| | 1. | The transfer of all the assets of the Growth Fund to the Dividend Growth Fund in exchange solely for Dividend Growth Fund shares and the assumption by the Dividend Growth Fund of all the liabilities of the Growth Fund, followed by the pro rata distribution to the Growth Fund shareholders of all the Dividend Growth Fund shares received by the Growth Fund in complete liquidation of the Growth Fund will constitute a “reorganization” within the meaning of Section 368(a) of the Code and the Dividend Growth Fund and the Growth Fund will each be a “party to a reorganization,” within the meaning of Section 368(b) of the Code, with respect to the Reorganization. |
| | 2. | No gain or loss will be recognized by the Dividend Growth Fund upon the receipt of all the assets of the Growth Fund solely in exchange for Dividend Growth Fund shares and the assumption by the Dividend Growth Fund of all the liabilities of the Growth Fund. |
| | 3. | No gain or loss will be recognized by the Growth Fund upon the transfer of all the Growth Fund’s assets to the Dividend Growth Fund solely in exchange for Dividend Growth Fund shares and the assumption by the Dividend Growth Fund of all the liabilities of the Growth Fund or upon the distribution (whether actual or constructive) of all such Dividend Growth Fund shares to the Growth Fund shareholders solely in exchange for such shareholders’ shares of the Growth Fund in complete liquidation of the Growth Fund. |
| | 4. | No gain or loss will be recognized by the Growth Fund shareholders upon the exchange of their Growth Fund shares solely for Dividend Growth Fund shares in the Reorganization. |
| | 5. | The aggregate basis of the Dividend Growth Fund shares received by each Growth Fund shareholder pursuant to the Reorganization will be the same as the aggregate basis of the Growth Fund shares exchanged therefor by such shareholder. The holding period of the Dividend Growth Fund shares received by each Growth Fund shareholder will include the period during which the Growth Fund shares exchanged therefor were held by such shareholder, provided such Growth Fund shares are held as capital assets at the time of the Reorganization. |
| | 6. | The tax basis of the Growth Fund’s assets acquired by the Dividend Growth Fund will be the same as the tax basis of such assets to the Growth Fund immediately before the Reorganization. The holding period of the assets of the Growth Fund in the hands of the Dividend Growth Fund will include the period during which those assets were held by the Growth Fund. |
Prior to the date of the Reorganization, the Growth Fund will declare a distribution to its shareholders, which together with all previous distributions, will have the effect of distributing to shareholders all its net investment income and realized net capital gains (after reduction by any capital loss carryforwards), if any, through the date of the Reorganization. This distribution will be taxable to shareholders for federal income tax purposes and will include any net capital gains resulting from the sale of portfolio assets discussed below. Additional distributions may be made if necessary. All dividends and distributions will be reinvested in additional shares of the Growth Fund unless a shareholder has made an election to receive dividends and distributions in cash. Dividends and distributions are treated the same for federal income tax purposes whether received in cash or additional shares.
A portion of the Growth Fund’s portfolio assets will be sold in connection with the Reorganization. The federal income tax effect of such sales will depend on the holding periods of such assets and the difference between the price at which such portfolio assets are sold and the Growth Fund’s basis in such assets. Any net capital gains (net long-term capital gain in excess of any net short-term capital loss) recognized in these sales, after the application of any available capital loss carryforwards, will be distributed to the Growth Fund’s shareholders as capital gain dividends. Any net short-term capital gains (in excess of any net long-term capital loss and after application of
16
any available capital loss carryforwards) will be distributed as ordinary dividends. All such distributions will be made during or with respect to the Growth Fund’s taxable year in which the sale occurs and will be taxable to shareholders for federal income tax purposes.
After the Reorganization, the combined fund’s ability to use the Growth Fund’s or the Dividend Growth Fund’s pre-Reorganization capital losses may be limited under certain federal income tax rules applicable to reorganizations of this type. Therefore, in certain circumstances, former shareholders of the Growth Fund may pay federal income taxes sooner, or pay more federal income taxes, than they would have had had the Reorganization not occurred. The effect of these potential limitations, however, will depend on a number of factors including the amount of the losses, the amount of gains to be offset, the exact timing of the Reorganization and the amount of unrealized capital gains in the Funds at the time of the Reorganization.
In addition, the shareholders of the Growth Fund will receive a proportionate share of any taxable income and gains realized by the Dividend Growth Fund and not distributed to its shareholders prior to the Reorganization when such income and gains are eventually distributed by the Dividend Growth Fund. As a result, shareholders of the Growth Fund may receive a greater amount of taxable distributions than they would have had the Reorganization not occurred.
This description of the federal income tax consequences of the Reorganization is made without regard to the particular facts and circumstances of any shareholder. Shareholders are urged to consult their own tax advisors as to the specific consequences to them of the Reorganization, including the applicability and effect of state, local, non-U.S. and other tax laws.
Expenses
Because the benefits of the Reorganization are anticipated to accrue almost exclusively to shareholders of the Growth Fund, the Growth Fund will pay all the costs associated with the Reorganization. The Board believes that these costs will be offset over time by the anticipated lower operating costs of the Dividend Growth Fund after the Reorganization. Management of the Growth Fund estimates that expenses for the Reorganization will equal approximately $190,000. The Growth Fund has engaged Computershare Fund Services to assist in the solicitation of proxies at an estimated cost of $38,000, which is included in the expense estimate above and which will be paid by the Growth Fund.
Rights of Shareholders
Both of the Funds are open-end diversified management companies organized as series of a Massachusetts business trust. The Growth Fund and the Dividend Growth Fund are both series of the Trust. As such, there are no material differences in the rights of shareholders.
Legal Matters
Certain legal matters concerning the Funds and their participation in the Reorganization, the federal income tax consequences of the Reorganization and the issuance of Class A, Class B, Class C and Class I shares of the Dividend Growth Fund will be passed on by Vedder Price P.C., 222 North LaSalle Street, Chicago, Illinois 60601.
Information Filed with the Securities and Exchange Commission
This Proxy Statement/Prospectus and the related Statement of Additional Information do not contain all the information set forth in the registration statements and the exhibits relating thereto and annual and semi-annual reports which the Funds have filed with the SEC pursuant to the requirements of the Securities Act of 1933, as amended, and the 1940 Act, to which reference is hereby made. The SEC file number for the registration statement containing the current Prospectus and Statement of Additional Information for the Growth Fund and the Dividend Growth Fund is Registration No. 811-08333. Such Prospectus and Statement of Additional Information are incorporated herein by reference.
17
THE BOARD’S APPROVAL OF THE REORGANIZATION
Based on the considerations described below, the Board, including the independent trustees, on behalf of the Growth Fund and the Dividend Growth Fund, have determined that the Reorganization would be in the best interests of each Fund and that the interests of each Fund’s existing shareholders would not be diluted as a result of the Reorganization. The Board approved the Reorganization and recommended Growth Fund shareholders approve the Reorganization.
In preparation for a meeting of the Board held on November 19, 2008 (the “Meeting”) at which the Reorganization was proposed, NAM provided the Board with information regarding the proposed Reorganization, including the rationale therefore and alternatives considered to the Reorganization of the Growth Fund. Prior to approving the Reorganization, the independent trustees reviewed the foregoing information with their independent legal counsel and with management, reviewed with independent legal counsel applicable law and their duties in considering such matters, and met with independent legal counsel in a private session without management present. The Board considered a number of principal factors in reaching its determination, including the following:
| | • | | The compatibility of the Growth Fund’s investment objective, investment philosophy and investment approach with those of the Dividend Growth Fund; |
| | • | | The relative past and current asset levels of the Funds; |
| | • | | The investment performance of the Funds; |
| | • | | The relative fees and expense ratios of the Funds, including caps on the Funds’ expenses agreed to by NAM; |
| | • | | The anticipated tax-free nature of the Reorganization; |
| | • | | The expected costs of the Reorganization and the extent to which the Funds would bear any such costs; |
| | • | | The terms of the Reorganization and whether the Reorganization would dilute the interests of shareholders of the Funds; |
| | • | | The portfolio managers that will manage the combined fund; and |
| | • | | Any potential benefits of the Reorganization to NAM as a result of the Reorganization. |
Investment Compatibility
Based on the information presented, the Dividend Growth Fund’s investment objective, philosophy, market capitalization range and investment positioning appear similar to that of the Growth Fund. In this regard, the Board noted that (i) both Funds invest in large capitalization U.S. stocks, (ii) both Funds follow a conservative growth philosophy centered on companies with quality earnings and earnings growth potential and (iii) both Funds seek relative tax efficiency via a low turnover approach and explicit dividend management. The Funds’ risk characteristics also appear similar; the Funds’ returns have lower standard deviations than their indices, indicative of their “conservative growth” approach.
Distribution Opportunities
With respect to the Dividend Growth Fund, the Board considered the potential economies of scale which may be realized by the Fund’s larger asset size following the Reorganization. Given the performance record of the Dividend Growth Fund, its larger asset size following the Reorganization may provide it with sufficient scale to qualify for better access to the distribution platforms of broker-dealers, thus potentially improving its future growth prospects and potential for greater economies of scale. With respect to the Growth Fund, the Board reviewed the asset levels of the Growth Fund from 1999 to 2008 and recognized the decline in assets. The Board noted that the Growth Fund’s decline in assets has resulted in a rising gross expense ratio.
Investment Performance
The Board considered the investment performance of each Fund, including the Funds’ historic performance compared to funds with similar investment objectives (a “Peer Group”) based on data provided by an independent third party as well as compared to their benchmarks. The information provided at the Meeting supplemented the performance information the Board receives at its meetings during the year. Although the Dividend Growth Fund has been in existence for a shorter period of time than the Growth Fund, the Board recognized that the Dividend Growth Fund had a stronger investment performance record than that of the Growth Fund. With respect to the Growth Fund’s long-term performance, the Board noted that although relative returns had improved recently for the Growth Fund, the five- and ten-year returns for the Fund as of September 30, 2008 trailed its benchmark indices (with a limited exception) and were in the bottom Lipper quartile competitively. In contrast, the Board recognized that the Dividend Growth Fund had investment returns in the top 10% of its Peer Group each year since its inception in March 2006.
18
Fees and Expense Ratios
The Board considered the fees and expense ratios of the Funds (including estimated expenses after the Reorganization) and the impact of expense caps. With respect to the Dividend Growth Fund, the management fees and net expenses paid by the Fund were lower than the management fees and net expenses of the Growth Fund during the Funds’ most recently completed fiscal year. The management fees of the Dividend Growth Fund are .05% lower as a percentage of daily net assets than those of the Growth Fund at each breakpoint level. In addition, it was anticipated that the Reorganization would result in lower net expenses for the combined fund than that of the Growth Fund. The Board further recognized that under the current expense limitation agreement regarding the Growth Fund, NAM has agreed to waive fees and reimburse expenses through November 30, 2009 so that the Growth Fund’s total annual operating expenses (excluding 12b-1 distribution and service fees, interest expenses, taxes, fees incurred in acquiring and disposing of portfolio securities, and extraordinary expenses) do not exceed 1.22% of the average daily net assets of any class of Fund shares. The Board considered that the Dividend Growth Fund’s expense cap is lower than that of the Growth Fund. More specifically, under the current expense limitation agreement regarding the Dividend Growth Fund, NAM has agreed to waive fees and reimburse expenses through November 30, 2009 so that the Dividend Growth Fund’s total annual operating expenses (excluding 12b-1 distribution and service fees, interest expenses, taxes, fees incurred in acquiring and disposing of portfolio securities, and extraordinary expenses) do not exceed 1.05% (1.30% after November 30, 2009) of the average daily net assets of any class of Fund shares. In addition, if the Reorganization is approved and completed, NAM has agreed to lower its permanent expense cap and extend the duration of the lower temporary expense cap. More specifically, NAM has agreed to waive fees and reimburse expenses through November 30, 2011 so that the combined fund’s total annual operating expenses (excluding 12b-1 distribution and service fees, interest expenses, taxes, fees incurred in acquiring and disposing of portfolio securities, and extraordinary expenses) do not exceed 1.05% (1.25% after November 30, 2011) of the average daily net assets of any class of fund shares. Accordingly, the lower temporary expense cap on the Dividend Growth Fund will be extended for an additional two years and the permanent expense cap will be reduced by 0.05% of average daily net assets. The Board considered the additional cost savings provided to shareholders pursuant to this modified expense cap arrangement and believed that the costs of the Reorganization to the Growth Fund would be offset over time by the anticipated lower operating costs of the combined fund following the Reorganization.
Tax-Free Reorganization and Potential Tax Benefits
The Reorganization will be structured with the intention that it qualify as a tax-free reorganization for federal income tax purposes. In addition, NAM advised the Board that the proposed Reorganization may allow shareholders of the Funds to benefit from the potential use of certain capital loss carryforwards of the Growth Fund.
Costs
Although the Growth Fund would bear the costs of the Reorganization, NAM would pay such costs if the Reorganization is not approved or completed.
Dilution
The terms of the Reorganization are intended to avoid dilution of the interests of the shareholders of the Funds. In this regard, each Growth Fund shareholder will receive shares of the Dividend Growth Fund equal in value to its share of the net assets of the Growth Fund held.
Potential Benefits to NAM
The Board recognized that the Reorganization may result in benefits and economies for NAM. These may include, for example, a reduction in the level of operational expenses incurred for administrative, compliance and portfolio management services as a result of the elimination of the Growth Fund as a separate Nuveen fund.
Conclusion
The Board, including the independent trustees, approved the Reorganization, concluding that the Reorganization is in the best interests of both the Growth Fund and the Dividend Growth Fund and that the interests of existing shareholders of the Growth Fund and the Dividend Growth Fund will not be diluted as a result of the Reorganization.
19
OTHER INFORMATION
Shareholders of the Dividend Growth Fund and the Growth Fund
As of , 2009, the trustees and officers of the Dividend Growth Fund as a group owned less than 1% of the total outstanding shares of the Dividend Growth Fund and as a group owned % of the Class shares of the Dividend Growth Fund. The following table sets forth the percentage of each person who, as of , 2009, owns of record, or is known by the Fund to own of record or beneficially, 5% or more of any class of shares of the Dividend Growth Fund.
| | | | |
Class | | Name and Address
of Owner | | Percentage of
Ownership |
| | | | |
| | | | |
At the close of business on , 2009, the record date with respect to the Special Meeting, there were Class A shares, Class B shares, Class C shares and Class I shares of the Growth Fund. As of , 2009, the trustees and officers of the Growth Fund as a group owned % of the total outstanding shares of the Growth Fund and as a group owned % of the Class shares of the Growth Fund. The following table sets forth the percentage of each person who, as of , 2009, owns of record, or is known by the Fund to own of record or beneficially, 5% or more of any class of shares of the Growth Fund. The table also sets forth the pro forma percentages of the Dividend Growth Fund shares that would have been owned by such parties if the Reorganization had occurred on , 2009. These amounts may differ on the Closing Date.
| | | | | | |
Class | | Name and Address
of Owner | | Percentage of Ownership
of Each Class of the
Growth Fund | | Estimated Pro Forma
Ownership of
Each Class Of
Dividend Growth Fund
Shares After
Reorganization |
| | | | | | |
| | | | | | |
| | | | | | |
Shareholder Proposals
The Funds generally do not hold annual shareholders’ meetings, but will hold special meetings as required or deemed desirable. Because each Fund does not hold regular shareholders’ meetings, the anticipated date of the next special shareholders’ meeting (if any) cannot be provided. Shareholders wishing to submit proposals for inclusion in a proxy statement for a subsequent shareholders’ meeting of a Fund should send their written proposal to the Trust at 333 West Wacker Drive, Chicago, Illinois 60606. Proposals must be received a reasonable time before a Fund begins to print and mail its proxy materials for the meeting.
Shareholder Communications
Shareholders who want to communicate with the Board or any individual trustee should write their Fund to the attention of Lorna Ferguson, Manager of Fund Board Relations, Nuveen Investments, 333 West Wacker Drive, Chicago, Illinois 60606. The letter should indicate that you are a Fund shareholder, and identify the Fund (or Funds). If the communication is intended for a specific trustee and so indicates it will be sent only to that trustee. If a communication does not indicate a specific trustee, it will be sent to the chair of the nominating and governance committee and the outside counsel to the independent trustees for further distribution as deemed appropriate by such persons.
Proxy Statement/Prospectus Delivery
Please note that only one Proxy Statement/Prospectus may be delivered to two or more shareholders of the Growth Fund who share an address, unless the Fund has received instructions to the contrary. To request a separate copy of the Proxy Statement/Prospectus, or for instructions as to how to request a separate copy of such document or as to how to request a single copy if multiple copies of such document are received, shareholders should contact the Growth Fund at 333 West Wacker Drive, Chicago, Illinois 60606 or by calling (800) 257-8787.
20
VOTING INFORMATION AND REQUIREMENTS
Holders of shares of the Growth Fund are entitled to one vote per share on matters as to which they are entitled to vote with fractional shares voting proportionally.
Each valid proxy given by a shareholder of the Growth Fund will be voted by the persons named in the proxy in accordance with the instructions marked thereon and as the persons named in the proxy may determine on such other business as may come before the Special Meeting on which shareholders are entitled to vote. If no designation is made, the proxy will be voted by the persons named in the proxy as recommended by the Board “FOR” approval of the Reorganization. Abstentions and broker non-votes (i.e., shares held by brokers or nominees, typically in “street name,” as to which (i) instructions have not been received from beneficial owners or persons entitled to vote and (ii) the broker or nominee does not have discretionary voting power on a particular matter) do not count as votes “FOR” the proposal and are treated as votes “AGAINST.” At least a majority of the outstanding shares of the Fund entitled to vote on the proposals must be present in person or by proxy to have a quorum to conduct business at the Special Meeting. Abstentions and broker non-votes will be deemed present for quorum purposes.
Shareholders who execute proxies may revoke them at any time before they are voted by filing with the Growth Fund a written notice of revocation, by delivering a duly executed proxy bearing a later date, or by attending the Special Meeting and voting in person. The giving of a proxy will not affect your right to vote in person if you attend the Special Meeting and wish to do so.
It is not anticipated that any action will be asked of the shareholders of the Growth Fund other than as indicated above, but if other matters are properly brought before the Special Meeting, it is intended that the persons named in the proxy will vote in accordance with their judgment.
Shareholders of the Dividend Growth Fund are not required to approve the Reorganization.
Approval of the Reorganization will require the favorable vote of the holders of a majority of the outstanding voting securities of the Growth Fund entitled to vote, with the Class A, Class B, Class C and Class I shareholders voting together as a single class. The “vote of a majority of the outstanding voting securities” is defined in the 1940 Act as the lesser of the vote of (i) 67% or more of the shares of the Fund entitled to vote thereon present at the meeting if the holders of more than 50% of such outstanding shares are present in person or represented by proxy; or (ii) more than 50% of such outstanding shares of the Fund entitled to vote thereon.
In the event that sufficient votes in favor of a proposal are not received by the scheduled time of the Special Meeting, the persons named in the proxy may propose and vote in favor of one or more adjournments of the Special Meeting to permit further solicitation of proxies. If sufficient shares were present to constitute a quorum, but insufficient votes had been cast in favor of a proposal to approve it, proxies would be voted in favor of adjournment only if the persons named in the proxies determined that adjournment and additional solicitation was reasonable and in the best interest of the shareholders of the Growth Fund, taking into account the nature of the proposal, the percentage of the votes actually cast, the percentage of negative votes, the nature of any further solicitation that might be made and the information provided to shareholders about the reasons for additional solicitation. Any such adjournment will require the affirmative vote of the holders of a majority of the outstanding shares present in person or by proxy and entitled to vote at the session of the Special Meeting to be adjourned. If the adjournment is approved, the date, time and place of the new meeting will be announced at the time of adjournment, and no further notice of the new meeting time and date will be given to shareholders.
Proxies of shareholders of the Growth Fund are solicited by the Board. Additional solicitation may be made by mail, telephone, telegraph or personal interview by representatives of the Adviser or Nuveen, or by dealers or their representatives.
, 2009
Please sign and return your proxy promptly.
Your vote is important and your participation
in the affairs of your Fund does make a difference.
21
Appendix I
Form of Agreement and Plan of Reorganization
THIS AGREEMENT AND PLAN OF REORGANIZATION (the “Agreement”) is made as of this th day of , 2009 by Nuveen Investment Trust II, a Massachusetts business trust (the “Trust”), on behalf of and between Santa Barbara Dividend Growth Fund (the “Acquiring Fund”) and Nuveen Rittenhouse Growth Fund (the “Acquired Fund” and, together with the Acquiring Fund, the “Funds”).
This Agreement is intended to be, and is adopted as, a plan of reorganization within the meaning of Section 368 of the United States Internal Revenue Code of 1986, as amended (the “Code”), and the Treasury Regulations promulgated thereunder. The reorganization will consist of: (i) the transfer of all the assets of the Acquired Fund to the Acquiring Fund in exchange solely for Class A, Class B, Class C and Class I voting shares of beneficial interest, par value $0.01 per share, of the Acquiring Fund (“Acquiring Fund Shares”) and the assumption by the Acquiring Fund of all the liabilities of the Acquired Fund; and (ii) the distribution of all the Class A, Class B, Class C and Class I Acquiring Fund Shares, respectively, to the Class A, Class B, Class C and Class I shareholders of the Acquired Fund, respectively, as part of the termination, dissolution and complete liquidation of the Acquired Fund as provided herein, all upon the terms and conditions set forth in this Agreement (the “Reorganization”).
WHEREAS, each Fund is a separate series of the Trust, and the Trust is an open-end, management investment company registered under the Investment Company Act of 1940, as amended (the “1940 Act”), and the Acquired Fund owns securities that generally are assets of the character in which the Acquiring Fund is permitted to invest;
WHEREAS, the Acquiring Fund is authorized to issue its shares of beneficial interests; and
WHEREAS, the Board of Trustees of the Trust (the “Board”) has determined that the Reorganization is in the best interests of each Fund and that the interests of the existing shareholders of the Fund will not be diluted as a result of the Reorganization.
NOW, THEREFORE, in consideration of the premises and of the covenants and agreements hereinafter set forth, the parties hereto covenant and agree as follows:
ARTICLE I
TRANSFER OF ASSETS OF THE ACQUIRED FUND IN EXCHANGE FOR ACQUIRING FUND SHARES AND THE ASSUMPTION OF THE ACQUIRED FUND LIABILITIES AND TERMINATION AND LIQUIDATION OF THE ACQUIRED FUND
1.1 THE EXCHANGE. Subject to the terms and conditions contained herein and on the basis of the representations and warranties contained herein, the Acquired Fund agrees to transfer all of its assets, as set forth in Section 1.2, to the Acquiring Fund. In exchange, the Acquiring Fund agrees: (i) to deliver to the Acquired Fund the number of full and fractional Class A, Class B, Class C and Class I Acquiring Fund Shares, computed in the manner set forth in Section 2.3; and (ii) to assume all the liabilities of the Acquired Fund, as set forth in Section 1.3. Such transactions shall take place at the closing provided for in Section 3.1 (the “Closing”).
1.2 ASSETS TO BE TRANSFERRED. The Acquired Fund shall transfer all of its assets to the Acquiring Fund, including, without limitation, all cash, securities, commodities, interests in futures and dividends or interest receivables owned by the Acquired Fund and any deferred or prepaid expenses shown as an asset on the books of the Acquired Fund on the Closing Date as such term is defined in Section 3.1.
The Acquired Fund will, within a reasonable period of time before the Closing Date, furnish the Acquiring Fund with a list of the Acquired Fund’s portfolio securities and other investments. The Acquiring Fund will, within a reasonable period of time before the Closing Date, furnish the Acquired Fund with a list of the securities, if any, on the Acquired Fund’s list referred to above that do not conform to the Acquiring Fund’s investment objective, policies, and restrictions. The Acquired Fund, if requested by the Acquiring Fund, will dispose of securities on the Acquiring Fund’s list before the Closing Date. In addition, if it is determined that the portfolios of the Acquired Fund and the Acquiring Fund, when aggregated, would contain investments exceeding certain percentage limitations imposed upon the Acquiring Fund with respect to such investments, the Acquired Fund, if requested by the Acquiring Fund, will dispose of a sufficient amount of such investments as may be necessary to avoid violating such limitations as of the Closing Date. Notwithstanding the foregoing, nothing herein will require the Acquired Fund to dispose of any investments or securities if, in the reasonable judgment of the Board or Nuveen Asset Management (the “Adviser”), such disposition would adversely affect the tax-free nature of the Reorganization for federal income tax purposes or would otherwise not be in the best interests of the Acquired Fund.
I-1
1.3 LIABILITIES TO BE ASSUMED. The Acquired Fund will endeavor to discharge all of its known liabilities and obligations to the extent possible before the Closing Date. Notwithstanding the foregoing, any liabilities not so discharged shall be assumed by the Acquiring Fund, which assumed liabilities shall include all of the Acquired Fund’s liabilities, debts, obligations, and duties of whatever kind or nature, whether absolute, accrued, contingent, or otherwise, whether or not arising in the ordinary course of business, whether or not determinable at the Closing Date, and whether or not specifically referred to in this Agreement.
1.4 LIQUIDATION AND DISTRIBUTION. On or as soon after the Closing Date as is conveniently practicable but in no event later than 12 months after the Closing Date (the “Liquidation Date”): (a) the Acquired Fund will distribute in complete liquidation of the Acquired Fund, pro rata to its Class A, Class B, Class C and Class I shareholders of record, respectively, determined as of the close of business on the Valuation Date, as such term is defined in Section 2.1 (the “Acquired Fund Shareholders”), all of the Class A, Class B, Class C and Class I Acquiring Fund Shares, respectively, received by the Acquired Fund pursuant to Section 1.1; and (b) the Acquired Fund will thereupon proceed to dissolve and terminate as set forth in Section 1.7 below. Such distribution will be accomplished by the transfer of Class A, Class B, Class C and Class I Acquiring Fund Shares, respectively, credited to the account of the Acquired Fund on the books of the Acquiring Fund to open accounts on the share records of the Acquiring Fund in the name of the Class A, Class B, Class C and Class I Acquired Fund Shareholders, respectively, and representing the respective pro rata number of Class A, Class B, Class C and Class I Acquiring Fund Shares due such shareholders. All issued and outstanding Class A, Class B, Class C and Class I shares of the Acquired Fund will simultaneously be canceled on the books of the Acquired Fund. The Acquiring Fund shall not issue certificates representing Acquiring Fund Shares in connection with such transfer.
1.5 OWNERSHIP OF SHARES. Ownership of Acquiring Fund Shares will be shown on the books of the Acquiring Fund’s transfer agent. Class A, Class B, Class C and Class I Acquiring Fund Shares will be issued simultaneously to the Acquired Fund, in an amount computed in the manner set forth in Section 2.3, to be distributed to Class A, Class B, Class C and Class I Acquired Fund Shareholders, respectively.
1.6 TRANSFER TAXES. Any transfer taxes payable upon the issuance of Acquiring Fund Shares in a name other than the registered holder of the Acquired Fund shares on the books of the Acquired Fund as of that time shall, as a condition of such issuance and transfer, be paid by the person to whom such Acquiring Fund Shares are to be issued and transferred.
1.7 TERMINATION. The Acquired Fund shall completely liquidate and be dissolved, terminated and have its affairs wound up in accordance with Massachusetts state law, promptly following the Closing Date and the making of all distributions pursuant to Section 1.4.
ARTICLE II
VALUATION
2.1 VALUATION OF ASSETS. The value of the net assets of the Class A, Class B, Class C and Class I shares of the Acquired Fund shall be the value of the assets, less the liabilities, of the respective class computed with respect to that class as of the close of regular trading on the New York Stock Exchange (“NYSE”) on the business day immediately prior to the Closing Date (such time and date being hereinafter called the “Valuation Date”). The value of the Acquired Fund’s assets shall be determined by using the valuation procedures set forth in the Trust’s Declaration of Trust and the Acquiring Fund’s then current prospectus and statement of additional information or such other valuation procedures as shall be mutually agreed upon by the parties.
2.2 VALUATION OF SHARES. The net asset value per share for Class A, Class B, Class C and Class I Acquiring Fund Shares shall be the net asset value per share for such class computed on the Valuation Date, using the valuation procedures set forth in the Trust’s Declaration of Trust and the Acquiring Fund’s then current prospectus and statement of additional information or such other valuation procedures as shall be mutually agreed upon by the parties.
2.3 SHARES TO BE ISSUED. The number of Class A, Class B, Class C and Class I Acquiring Fund Shares to be issued (including fractional shares, if any) in exchange for the Acquired Fund’s Class A, Class B, Class C and Class I shares’ net assets, shall be determined by dividing the value of the Acquired Fund’s net assets per respective class determined in accordance with Section 2.1 by the net asset value per share of the respective class of Acquiring Fund Shares determined in accordance with Section 2.2.
2.4 EFFECT OF SUSPENSION IN TRADING. In the event that on the Valuation Date, either: (a) the NYSE or another primary exchange on which the portfolio securities of the Acquiring Fund or the Acquired Fund are purchased or sold shall be closed to trading or trading on such exchange shall be restricted; or (b) trading or the reporting of trading on the NYSE or elsewhere shall be disrupted so that accurate appraisal of the value of the net assets of the Acquiring Fund or the Acquired Fund is impracticable, the Valuation Date shall be postponed until the first business day after the day when trading is fully resumed and reporting is restored.
I-2
ARTICLE III
CLOSINGS AND CLOSING DATE
3.1 CLOSING DATE. The Closing shall occur on , 2009 or such other date as the parties may agree (the “Closing Date”). All acts taking place at the Closing shall be deemed to take place as of immediately after the close of regular trading on the Valuation Date. The Closing shall be held as of 8:00 a.m. Central time (the “Effective Time”) at the offices of Vedder Price P.C. in Chicago, Illinois or at such other time and/or place as the parties may agree.
3.2 CUSTODIAN’S CERTIFICATE. The Acquired Fund shall cause State Street Bank & Trust Company, as custodian for the Acquired Fund (the “Custodian”), to deliver to the Acquiring Fund at the Closing a certificate of an authorized officer stating that: (a) the Acquired Fund’s portfolio securities, cash, and any other assets shall have been delivered in proper form to the Acquiring Fund on the Closing Date; and (b) all necessary taxes, including all applicable federal and state stock transfer stamps, if any, shall have been paid, or provision for payment shall have been made, in conjunction with the delivery of portfolio securities by the Acquired Fund.
3.3 TRANSFER AGENT’S CERTIFICATE. The Acquired Fund shall cause Boston Financial Data Services, as transfer agent for the Acquired Fund, to deliver to the Acquiring Fund at the Closing a certificate of an authorized officer stating that its records contain the names and addresses of all the Class A, Class B, Class C and Class I Acquired Fund Shareholders, and the number and percentage ownership of outstanding shares per class owned by each such shareholder immediately prior to the Closing. The Acquiring Fund shall issue and deliver or cause Boston Financial Data Services, its transfer agent, to issue and deliver to the Acquired Fund a confirmation evidencing the Class A, Class B, Class C and Class I Acquiring Fund Shares to be credited on the Closing Date to the Secretary of the Trust or provide evidence satisfactory to the Acquired Fund that such Acquiring Fund Shares have been credited to the Acquired Fund’s account on the books of the Acquiring Fund.
3.4 DELIVERY OF ADDITIONAL ITEMS. At the Closing, each party shall deliver to the other such bills of sale, checks, assignments, share certificates, receipts and other documents, if any, as such other party or its counsel may reasonably request to effect the transactions contemplated by this Agreement.
ARTICLE IV
REPRESENTATIONS AND WARRANTIES
4.1 REPRESENTATIONS OF THE ACQUIRED FUND. The Trust, on behalf of the Acquired Fund, represents and warrants as follows:
(a) The Trust is a business trust duly organized, validly existing and in good standing under the laws of the Commonwealth of Massachusetts.
(b) The Acquired Fund is a separate series of the Trust duly authorized in accordance with the applicable provisions of the Trust’s Declaration of Trust.
(c) The Trust is registered as an open-end management investment company under the 1940 Act, and such registration is in full force and effect.
(d) The Acquired Fund is not, and the execution, delivery, and performance of this Agreement (subject to shareholder approval) will not result, in the violation of any provision of the Trust’s Declaration of Trust or By-Laws or of any material agreement, indenture, instrument, contract, lease, or other undertaking to which the Acquired Fund is a party or by which it is bound.
(e) Except as otherwise disclosed in writing to and accepted by the Acquiring Fund, the Acquired Fund has no material contracts or other commitments (other than this Agreement) that will be terminated with liability to it before the Closing Date.
(f) No litigation, administrative proceeding, or investigation of or before any court or governmental body is presently pending or to its knowledge threatened against the Acquired Fund or any of its properties or assets, which, if adversely determined, would materially and adversely affect its financial condition, the conduct of its business, or the ability of the Acquired Fund to carry out the transactions contemplated by this Agreement. The Acquired Fund knows of no facts that might form the basis for the institution of such proceedings and is not a party to or subject to the provisions of any order, decree, or judgment of any court or governmental body that materially and adversely affects its business or its ability to consummate the transactions contemplated herein.
(g) The financial statements of the Acquired Fund as of July 31, 2008, and for the year then ended have been prepared in accordance with generally accepted accounting principles, and such statements (copies of which have been furnished to the Acquiring Fund) fairly reflect the financial condition of the Acquired Fund as of July 31, 2008, and there are no known contingent liabilities of the Acquired Fund as of such date that are not disclosed in such statements. The unaudited financial statements of the
I-3
Acquired Fund as of January 31, 2009, and for the semi-annual period then ended, will be prepared in accordance with generally accepted accounting principles, and such statements (copies of which will be furnished to the Acquiring Fund) will fairly reflect the financial condition of the Acquired Fund as of January 31, 2009, and there will not by any known contingent liabilities of the Acquired Fund as of such date that are not disclosed in such statements.
(h) Since the date of the financial statements referred to in subsection (g) above, there have been no material adverse changes in the Acquired Fund’s financial condition, assets, liabilities or business (other than changes occurring in the ordinary course of business) and there are no known contingent liabilities of the Acquired Fund arising after such date. For the purposes of this subsection (h), a decline in the net asset value of the Acquired Fund shall not constitute a material adverse change.
(i) All federal, state, local and other tax returns and reports of the Acquired Fund required by law to be filed by it (taking into account permitted extensions for filing) have been timely filed and are correct in all material respects. All federal, state, local and other taxes of the Acquired Fund required to be paid (whether or not shown on any such return or report) have been paid, or provision shall have been made for the payment thereof and any such unpaid taxes are properly reflected on the financial statements referred to in subsection (g) above. To the best of the Acquired Fund’s knowledge, no tax authority is currently auditing or preparing to audit the Acquired Fund, and no assessment for taxes, interest, additions to tax, or penalties has been asserted against the Acquired Fund.
(j) All issued and outstanding shares of the Acquired Fund are duly and validly issued and outstanding, fully paid and non-assessable by the Acquired Fund. All of the issued and outstanding shares of the Acquired Fund will, at the time of the Closing Date, be held by the persons and in the amounts set forth in the records of the Acquired Fund’s transfer agent as provided in Section 3.3. The Acquired Fund has no outstanding options, warrants, or other rights to subscribe for or purchase any shares of the Acquired Fund, and has no outstanding securities convertible into shares of the Acquired Fund.
(k) At the Closing Date, the Acquired Fund will have good and marketable title to the Acquired Fund’s assets to be transferred to the Acquiring Fund pursuant to Section 1.2, and full right, power, and authority to sell, assign, transfer, and deliver such assets, and the Acquiring Fund will acquire good and marketable title thereto.
(l) The execution, delivery and performance of this Agreement have been duly authorized by all necessary action on the part of the Acquired Fund. Subject to approval by the Acquired Fund shareholders, this Agreement constitutes a valid and binding obligation of the Acquired Fund, enforceable in accordance with its terms, subject as to enforcement, to bankruptcy, insolvency, reorganization, moratorium, and other laws relating to or affecting creditors’ rights and to general equity principles.
(m) The information to be furnished by the Acquired Fund for use in no-action letters, applications for orders, registration statements, proxy materials, and other documents that may be necessary in connection with the transactions contemplated herein shall be accurate and complete in all material respects and shall comply in all material respects with federal securities and other laws and regulations.
(n) From the effective date of the Registration Statement (as defined in Section 5.7), through the time of the meeting of the Acquired Fund shareholders and on the Closing Date, any written information furnished by the Trust with respect to the Acquired Fund for use in the Proxy Materials (as defined in Section 5.7), or any other materials provided in connection with the Reorganization, does not and will not contain any untrue statement of a material fact or omit to state a material fact required to be stated or necessary to make the statements, in light of the circumstances under which such statements were made, not misleading.
(o) For each taxable year of its operations, including the short taxable year ending with the Closing Date, the Acquired Fund (i) has elected to qualify, and has qualified or will qualify (in the case of the short taxable year ending with the Closing Date), as a “regulated investment company” under the Code (a “RIC”), (ii) has been eligible to and has computed its federal income tax under Section 852 of the Code, and will do so for the short taxable year ending with the Closing Date and (iii) has been, and will be (in the case of the short taxable year ending with the Closing Date), treated as a separate corporation for federal income tax purposes pursuant to Section 851(g) of the Code.
4.2 REPRESENTATIONS OF THE ACQUIRING FUND. The Trust, on behalf of the Acquiring Fund, represents and warrants as follows:
(a) The Trust is a business trust, duly organized, validly existing and in good standing under the laws of the Commonwealth of Massachusetts.
(b) The Acquiring Fund is a separate series of the Trust duly authorized in accordance with the applicable provisions of the Trust’s Declaration of Trust.
(c) The Trust is registered as an open-end management investment company under the 1940 Act, and such registration is in full force and effect.
(d) The Acquiring Fund is not, and the execution, delivery and performance of this Agreement will not result, in a violation of the Trust’s Declaration of Trust or By-Laws or of any material agreement, indenture, instrument, contract, lease, or other undertaking to which the Acquiring Fund is a party or by which it is bound.
I-4
(e) No litigation, administrative proceeding or investigation of or before any court or governmental body is presently pending or to its knowledge threatened against the Acquiring Fund or any of its properties or assets, which, if adversely determined, would materially and adversely affect its financial condition, the conduct of its business or the ability of the Acquiring Fund to carry out the transactions contemplated by this Agreement. The Acquiring Fund knows of no facts that might form the basis for the institution of such proceedings and it is not a party to or subject to the provisions of any order, decree, or judgment of any court or governmental body that materially and adversely affects its business or its ability to consummate the transaction contemplated herein.
(f) The financial statements of the Acquiring Fund as of July 31, 2008 and for the fiscal year then ended have been prepared in accordance with generally accepted accounting principles and have been audited by independent auditors, and such statements (copies of which have been furnished to the Acquired Fund) fairly reflect the financial condition of the Acquiring Fund as of July 31, 2008, and there are no known contingent liabilities of the Acquiring Fund as of such date that are not disclosed in such statements. The unaudited financial statements of the Acquiring Fund as of January 31, 2009, and for the semi-annual period then ended, will be prepared in accordance with generally accepted accounting principles, and such statements (copies of which will be furnished to the Acquired Fund) will fairly reflect the financial condition of the Acquiring Fund as of January 31, 2009, and there will not be any known contingent liabilities of the Acquiring Fund as of such date that are not disclosed in such statement.
(g) Since the date of the financial statements referred to in subsection (f) above, there have been no material adverse changes in the Acquiring Fund’s financial condition, assets, liabilities or business (other than changes occurring in the ordinary course of business) and there are no known contingent liabilities of the Acquiring Fund arising after such date. For the purposes of this subsection (g), a decline in the net asset value of the Acquiring Fund shall not constitute a material adverse change.
(h) All federal, state, local and other tax returns and reports of the Acquiring Fund required by law to be filed by it (taking into account permitted extensions for filing) have been timely filed and are correct in all material respects. All federal, state, local and other taxes of the Acquiring Fund required to be paid (whether or not shown on any such return or report) have been paid or provision shall have been made for their payment and any such unpaid taxes are properly reflected on the financial statements referred to in subsection (f) above. To the best of the Acquiring Fund’s knowledge, no tax authority is currently auditing or preparing to audit the Acquiring Fund, and no assessment for taxes, interest, additions to tax or penalties has been asserted against the Acquiring Fund.
(i) All issued and outstanding Acquiring Fund Shares are duly and validly issued and outstanding, fully paid and non-assessable by the Acquiring Fund. The Acquiring Fund has no outstanding options, warrants, or other rights to subscribe for or purchase shares of the Acquiring Fund, and there are no outstanding securities convertible into shares of the Acquiring Fund.
(j) The execution, delivery and performance of this Agreement have been duly authorized by all necessary action on the part of the Acquiring Fund, and this Agreement constitutes a valid and binding obligation of the Acquiring Fund, enforceable in accordance with its terms, subject as to enforcement, to bankruptcy, insolvency, reorganization, moratorium, and other laws relating to or affecting creditors’ rights and to general equity principles.
(k) The Acquiring Fund Shares to be issued and delivered to the Acquired Fund for the account of the Acquired Fund Shareholders pursuant to the terms of this Agreement will, at the Closing Date, have been duly authorized. When so issued and delivered, such shares will be duly and validly issued shares of the Acquiring Fund, and will be fully paid and non-assessable.
(l) The information to be furnished by the Acquiring Fund for use in no-action letters, applications for orders, registration statements, proxy materials, and other documents that may be necessary in connection with the transactions contemplated herein shall be accurate and complete in all material respects and shall comply in all material respects with federal securities and other laws and regulations.
(m) From the effective date of the Registration Statement (as defined in Section 5.7), through the time of the meeting of the Acquired Fund shareholders and on the Closing Date, any written information furnished by the Trust with respect to the Acquiring Fund for use in the Proxy Materials (as defined in Section 5.7), or any other materials provided in connection with the Reorganization, does not and will not contain any untrue statement of a material fact or omit to state a material fact required to be stated or necessary to make the statements, in light of the circumstances under which such statements were made, not misleading.
(n) For each taxable year of its operations, including the taxable year that includes the Closing Date, the Acquiring Fund (i) has elected to qualify, has qualified or will qualify (in the case of the year that includes the Closing Date) and intends to continue to qualify as a RIC under the Code, (ii) has been eligible to and has computed its federal income tax under Section 852 of the Code, and will do so for the taxable year that includes the Closing Date and (iii) has been, and will be (in the case of the taxable year that includes the Closing Date), treated as a separate corporation for federal income tax purposes pursuant to Section 851(g) of the Code.
(o) The Acquiring Fund agrees to use all reasonable efforts to obtain the approvals and authorizations required by the Securities Act of 1933, as amended (the “1933 Act”), the 1940 Act, and any state securities laws as it may deem appropriate in order to continue its operations after the Closing Date.
I-5
ARTICLE V
COVENANTS OF THE FUNDS
5.1 OPERATION IN ORDINARY COURSE. Subject to Sections 1.2 and 8.5, the Acquiring Fund and the Acquired Fund will operate its respective business in the ordinary course between the date of this Agreement and the Closing Date, it being understood that such ordinary course of business will include customary dividends and distributions, any other distribution necessary or desirable to avoid federal income or excise taxes, and shareholder purchases and redemptions.
5.2 APPROVAL OF SHAREHOLDERS. The Trust will call a special meeting of the Acquired Fund shareholders to consider and act upon this Agreement (or transactions contemplated thereby) and to take all other appropriate action necessary to obtain approval of the transactions contemplated herein.
5.3 INVESTMENT REPRESENTATION. The Acquired Fund covenants that the Acquiring Fund Shares to be issued pursuant to this Agreement are not being acquired for the purpose of making any distribution, other than in connection with the Reorganization and in accordance with the terms of this Agreement.
5.4 ADDITIONAL INFORMATION. The Acquired Fund will assist the Acquiring Fund in obtaining such information as the Acquiring Fund reasonably requests concerning the beneficial ownership of the Acquired Fund’s shares.
5.5 FURTHER ACTION. Subject to the provisions of this Agreement, each Fund will take or cause to be taken, all action, and do or cause to be done, all things reasonably necessary, proper or advisable to consummate and make effective the transactions contemplated by this Agreement, including any actions required to be taken after the Closing Date.
5.6 STATEMENT OF EARNINGS AND PROFITS. As promptly as practicable, but in any case within 60 days after the Closing Date, the Acquired Fund shall furnish the Acquiring Fund, in such form as is reasonably satisfactory to the Acquiring Fund and which shall be certified by the Trust’s Controller, a statement of the earnings and profits of the Acquired Fund for federal income tax purposes, as well as any net operating loss carryovers and capital loss carryovers, that will be carried over to the Acquiring Fund as a result of Section 381 of the Code.
5.7 PREPARATION OF REGISTRATION STATEMENT AND PROXY MATERIALS. The Trust will prepare and file with the Securities and Exchange Commission (the “Commission”) a registration statement on Form N-14 relating to the Acquiring Fund Shares to be issued to the Acquired Fund Shareholders (the “Registration Statement”). The Registration Statement shall include a proxy statement and a prospectus of the Acquiring Fund relating to the transaction contemplated by this Agreement. The Registration Statement shall be in compliance with the 1933 Act, the Securities Exchange Act of 1934, as amended (the “1934 Act”), and the 1940 Act, as applicable. Each party will provide the other party with the materials and information necessary to prepare the proxy statement and related materials (the “Proxy Materials”), for inclusion therein, in connection with the meeting of the Acquired Fund’s shareholders to consider the approval of this Agreement and the transactions contemplated herein.
ARTICLE VI
CONDITION PRECEDENT TO OBLIGATIONS OF THE ACQUIRED FUND
The obligations of the Acquired Fund to consummate the transactions provided for herein shall be subject to the following condition:
6.1 All representations, covenants, and warranties of the Acquiring Fund contained in this Agreement shall be true and correct in all material respects as of the date hereof and as of the Closing Date, with the same force and effect as if made on and as of the Closing Date. The Acquiring Fund shall have delivered to the Acquired Fund a certificate executed in the Acquiring Fund’s name by the Trust’s President or Vice President and its Controller, in form and substance satisfactory to the Acquired Fund and dated as of the Closing Date, to such effect and as to such other matters as the Acquired Fund shall reasonably request.
I-6
ARTICLE VII
CONDITIONS PRECEDENT TO OBLIGATIONS OF THE ACQUIRING FUND
The obligations of the Acquiring Fund to consummate the transactions provided for herein shall be subject to the following conditions:
7.1 All representations, covenants, and warranties of the Acquired Fund contained in this Agreement shall be true and correct in all material respects as of the date hereof and as of the Closing Date, with the same force and effect as if made on and as of the Closing Date. The Acquired Fund shall have delivered to the Acquiring Fund on the Closing Date a certificate executed in the Acquired Fund’s name by the Trust’s President or Vice President and the Controller, in form and substance satisfactory to the Acquiring Fund and dated as of the Closing Date, to such effect and as to such other matters as the Acquiring Fund shall reasonably request.
7.2 The Acquired Fund shall have delivered to the Acquiring Fund a statement of the Acquired Fund’s assets and liabilities, together with a list of the Acquired Fund’s portfolio securities showing the tax basis of such securities by lot and the holding periods of such securities, as of the Closing Date, certified by the Controller of the Trust.
ARTICLE VIII
FURTHER CONDITIONS PRECEDENT
The obligations of the Acquired Fund or the Acquiring Fund hereunder shall also be subject to the following:
8.1 This Agreement and the transactions contemplated herein, with respect to the Acquired Fund, shall have been approved by the requisite vote of the holders of the outstanding shares of the Acquired Fund in accordance with applicable law and the provisions of the Trust’s Declaration of Trust and By-Laws. Notwithstanding anything herein to the contrary, neither the Acquiring Fund nor the Acquired Fund may waive the conditions set forth in this Section 8.1.
8.2 On the Closing Date, the Commission shall not have issued an unfavorable report under Section 25(b) of the 1940 Act, or instituted any proceeding seeking to enjoin the consummation of the transactions contemplated by this Agreement under Section 25(c) of the 1940 Act. Furthermore, no action, suit or other proceeding shall be threatened or pending before any court or governmental agency in which it is sought to restrain or prohibit, or obtain damages or other relief in connection with this Agreement or the transactions contemplated herein.
8.3 All required consents of other parties and all other consents, orders, and permits of federal, state and local regulatory authorities (including those of the Commission and of state securities authorities, including any necessary “no-action” positions and exemptive orders from such federal and state authorities) to permit consummation of the transactions contemplated herein shall have been obtained.
8.4 The Registration Statement shall have become effective under the 1933 Act, and no stop orders suspending the effectiveness thereof shall have been issued. To the best knowledge of the parties to this Agreement, no investigation or proceeding for that purpose shall have been instituted or be pending, threatened or contemplated under the 1933 Act.
8.5 The Acquired Fund shall have declared and paid a dividend or dividends which, together with all previous such dividends, shall have the effect of distributing to its shareholders all of the Acquired Fund’s investment company taxable income for all taxable periods ending on or before the Closing Date (computed without regard to any deduction for dividends paid), if any, plus the excess of its interest income excludible from gross income under Section 103(a) of the Code, if any, over its deductions disallowed under Sections 265 and 171(a)(2) of the Code for all taxable periods ending on or before the Closing Date and all of its net capital gains realized in all taxable periods ending on or before the Closing Date (after reduction for any capital loss carry forward).
8.6 The Funds shall have received on the Closing Date an opinion from Vedder Price P.C., dated as of the Closing Date, substantially to the effect that:
(a) Each Fund is a legally designated, separate series of the Trust, and the Trust is a business trust, validly existing under the laws of the Commonwealth of Massachusetts, which, to such counsel’s knowledge, has the power to own all of its properties and assets and to carry on its business as presently conducted.
(b) The Trust is registered as an investment company under the 1940 Act, and, to such counsel’s knowledge, such registration under the 1940 Act is in full force and effect.
(c) Assuming that consideration of not less than the net asset value of the Acquired Fund shares has been paid, and assuming that such shares were issued in accordance with the terms of the Acquired Fund’s registration statement, or any amendment thereto,
I-7
in effect at the time of such issuance, all issued and outstanding shares of the Acquired Fund are legally issued and fully paid and non-assessable, and no shareholder of the Acquired Fund has any preemptive rights with respect to the Acquired Fund’s shares.
(d) Assuming that the Acquiring Fund Shares have been issued in accordance with the terms of this Agreement, the Acquiring Fund Shares to be issued and delivered to the Acquired Fund on behalf of the Acquired Fund Shareholders as provided by this Agreement are duly authorized and upon such delivery will be legally issued and outstanding and fully paid and non-assessable, and no shareholder of the Acquiring Fund has any preemptive rights with respect to Acquiring Fund Shares.
(e) The Registration Statement is effective and, to such counsel’s knowledge, no stop order under the 1933 Act pertaining thereto has been issued, and to the knowledge of such counsel, no consent, approval, authorization or order of any court or governmental authority of the United States or the Commonwealth of Massachusetts is required for consummation by the Funds of the transactions contemplated herein, except as have been obtained.
(f) The execution and delivery of this Agreement did not, and the consummation of the transactions contemplated herein will not, result in a violation of the Trust’s Declaration of Trust (assuming approval of Acquired Fund shareholders has been obtained) or By-Laws.
8.7 The Funds shall have received an opinion of Vedder Price P.C. addressed to the Acquiring Fund and the Acquired Fund substantially to the effect that for federal income tax purposes:
(a) The transfer of all the Acquired Fund’s assets to the Acquiring Fund in exchange solely for Acquiring Fund Shares and the assumption by the Acquiring Fund of all the liabilities of the Acquired Fund followed by the pro rata distribution to the Acquired Fund shareholders of all the Acquiring Fund Shares received by the Acquired Fund in complete liquidation of the Acquired Fund will constitute a “reorganization” within the meaning of Section 368(a) of the Code and the Acquiring Fund and the Acquired Fund will each be a “party to a reorganization,” within the meaning of Section 368(b) of the Code, with respect to the Reorganization.
(b) No gain or loss will be recognized by the Acquiring Fund upon the receipt of all the assets of the Acquired Fund solely in exchange for Acquiring Fund Shares and the assumption by the Acquiring Fund of all the liabilities of the Acquired Fund.
(c) No gain or loss will be recognized by the Acquired Fund upon the transfer of all the Acquired Fund’s assets to the Acquiring Fund solely in exchange for Acquiring Fund Shares and the assumption by the Acquiring Fund of all the liabilities of the Acquired Fund or upon the distribution (whether actual or constructive) of the Acquiring Fund Shares, respectively, to the Acquired Fund Shareholders solely in exchange for such shareholder’s Class A, Class B, Class C and Class I shares, respectively, of the Acquired Fund in complete liquidation of the Acquired Fund.
(d) No gain or loss will be recognized by the Acquired Fund Shareholders upon the exchange of their Acquired Fund shares solely for Class A, Class B, Class C and Class I Acquiring Fund Shares, respectively, in the Reorganization.
(e) The aggregate basis of the Acquiring Fund Shares received by each Class A, Class B, Class C and Class I Acquired Fund Shareholder, respectively, pursuant to the Reorganization will be the same as the aggregate basis of the Acquired Fund shares exchanged therefor by such shareholder. The holding period of the Acquiring Fund Shares received by each Acquired Fund Shareholder will include the period during which the Acquired Fund shares exchanged therefor were held by such shareholder, provided such Acquired Fund shares are held as capital assets at the time of the Reorganization.
(f) The basis of the Acquired Fund’s assets transferred to the Acquiring Fund will be the same as the basis of such assets to the Acquired Fund immediately before the Reorganization. The holding period of the assets of the Acquired Fund in the hands of the Acquiring Fund will include the period during which those assets were held by the Acquired Fund.
Such opinion shall be based on customary assumptions and such representations as Vedder Price P.C. may reasonably request of the Funds, and the Acquired Fund and the Acquiring Fund will cooperate to make and certify the accuracy of such representations. Notwithstanding anything herein to the contrary, neither the Acquiring Fund nor the Acquired Fund may waive the conditions set forth in this Section 8.7.
I-8
ARTICLE IX
EXPENSES
9.1 The Acquired Fund will pay the expenses incurred in connection with the Reorganization. Reorganization expenses include, without limitation: (a) expenses associated with the preparation and filing of the Registration Statement and other Proxy Materials; (b) postage; (c) printing; (d) accounting fees; (e) legal fees incurred by each Fund; (f) solicitation costs of the transaction; and (g) other related administrative or operational costs.
9.2 Each party represents and warrants to the other that there is no person or entity entitled to receive any broker’s fees or similar fees or commission payments in connection with the transactions provided for herein.
ARTICLE X
ENTIRE AGREEMENT; SURVIVAL OF WARRANTIES
10.1 The parties agree that no party has made to the other parties any representation, warranty and/or covenant not set forth herein, and that this Agreement constitutes the entire agreement between and among the parties.
10.2 The representations, warranties, and covenants contained in this Agreement or in any document delivered pursuant to or in connection with this Agreement shall not survive the consummation of the transactions contemplated hereunder.
ARTICLE XI
TERMINATION
11.1 This Agreement may be terminated by the mutual agreement of the parties and such termination may be effected by the Trust’s President or the Vice President without further action by the Board. In addition, either Fund may at its option terminate this Agreement at or before the Closing Date due to:
(a) a breach by any other party of any representation, warranty, or agreement contained herein to be performed at or before the Closing Date, if not cured within 30 days;
(b) a condition precedent to the obligations of the terminating party that has not been met and it reasonably appears that it will not or cannot be met; or
(c) a determination by the Board that the consummation of the transactions contemplated herein is not in the best interests of the Fund.
11.2 In the event of any such termination, in the absence of willful default, there shall be no liability for damages on the part of the Trust, the Trustees, the Acquiring Fund, the Acquired Fund, the Adviser, or the Trust’s or Adviser’s officers.
ARTICLE XII
AMENDMENTS
12.1 This Agreement may be amended, modified, or supplemented in such manner as may be mutually agreed upon in writing by the officers of the Trust as specifically authorized by the Board; provided, however, that following the meeting of the Acquired Fund shareholders called by the Acquired Fund pursuant to Section 5.2 of this Agreement, no such amendment may have the effect of changing the provisions for determining the number of Acquiring Fund Shares to be issued to the Acquired Fund Shareholders under this Agreement to the detriment of such shareholders without their further approval.
ARTICLE XIII
HEADINGS; COUNTERPARTS; GOVERNING LAW; ASSIGNMENT; LIMITATION OF LIABILITY
13.1 The article and section headings contained in this Agreement are for reference purposes only and shall not affect in any way the meaning or interpretation of this Agreement.
I-9
13.2 This Agreement may be executed in any number of counterparts, each of which shall be deemed an original.
13.3 This Agreement shall be governed by and construed in accordance with the laws of the Commonwealth of Massachusetts.
13.4 This Agreement shall bind and inure to the benefit of the parties hereto and their respective successors and assigns, but, except as provided in this section, no assignment or transfer hereof or of any rights or obligations hereunder shall be made by any party without the written consent of the other parties. Nothing herein expressed or implied is intended or shall be construed to confer upon or give any person, firm, or corporation, other than the parties hereto and their respective successors and assigns, any rights or remedies under or by reason of this Agreement.
13.5 It is expressly agreed that the obligations of each Fund hereunder shall not be binding upon any of the Trustees, shareholders, nominees, officers, agents, or employees of the Trust personally, but shall bind only the trust property of the respective Fund, as provided in the Trust’s Declaration of Trust. The execution and delivery of this Agreement have been authorized by the Trustees of the Trust on behalf of each Fund and signed by authorized officers of the Trust, acting as such. Neither the authorization by such Trustees nor the execution and delivery by such officers shall be deemed to have been made by any of them individually or to impose any liability on any of them personally, but shall bind only the trust property of the respective Fund as provided in the Trust’s Declaration of Trust.
IN WITNESS WHEREOF, the parties have duly executed this Agreement, all as of the date first written above.
| | |
NUVEEN INVESTMENT TRUST II, on behalf of Nuveen Rittenhouse Growth Fund |
| |
| By: | | |
| Name: | | Gifford R. Zimmerman |
| Title: | | Chief Administrative Officer |
| | |
| ACKNOWLEDGED: |
| |
| By: | | |
| Name: | | Christopher M. Rohrbacher |
| Title: | | Vice President and Assistant Secretary |
| | |
NUVEEN INVESTMENT TRUST II, on behalf of Nuveen Santa Barbara Dividend Growth Fund |
| |
| By: | | |
| Name: | | Gifford R. Zimmerman |
| Title: | | Chief Administrative Officer |
| | |
| ACKNOWLEDGED: |
| |
| By: | | |
| Name: | | Christopher M. Rohrbacher |
| Title: | | Vice President and Assistant Secretary |
I-10
Table of Contents
Nuveen Investments
Equity Funds
PROSPECTUS NOVEMBER 28, 2008
For investors seeking long-term capital appreciation.

Nuveen Santa Barbara Dividend Growth Fund
Nuveen Santa Barbara Growth Fund
Nuveen Santa Barbara Growth Opportunities Fund
Nuveen Rittenhouse Growth Fund
The Securities and Exchange Commission has not approved or disapproved these securities or passed upon the adequacy of this prospectus. Any representation to the contrary is a criminal offense. | 
|
Table of Contents
| | |
| |
| Section 1 The Funds | | |
| This section provides you with an overview of the funds, including the investment objectives, risk factors, expense information and historical performance information. | | |
| |
| Introduction | | 1 |
|
| Nuveen Santa Barbara Dividend Growth Fund | | 2 |
|
| Nuveen Santa Barbara Growth Fund | | 5 |
|
| Nuveen Santa Barbara Growth Opportunities Fund | | 8 |
|
| Nuveen Rittenhouse Growth Fund | | 11 |
|
| |
| Section 2 How We Manage Your Money | | |
| This section gives you a detailed discussion of our investment and risk management strategies. | | |
| |
| Who Manages the Funds | | 13 |
|
| What Types of Securities We Invest In | | 15 |
|
| How We Select Investments | | 17 |
|
| What the Risks Are | | 19 |
|
| |
| Section 3 How You Can Buy and Sell Shares | | |
| This section provides the information you need to move money into or out of your account. | | |
| |
| What Share Classes We Offer | | 22 |
|
| How to Reduce Your Sales Charge | | 24 |
|
| How to Buy Shares | | 25 |
|
| Special Services | | 26 |
|
| How to Sell Shares | | 28 |
|
| |
| Section 4 General Information | | |
| This section summarizes the funds’ distribution policies and other general fund information. | | |
| |
| Dividends, Distributions and Taxes | | 30 |
|
| Distribution and Service Plans | | 31 |
|
| Net Asset Value | | 32 |
|
| Frequent Trading | | 33 |
|
| Fund Service Providers | | 34 |
|
| |
| Section 5 Financial Highlights | | |
| This section provides the funds’ financial performance. | | 35 |
|
| |
| Section 6 Glossary of Investment Terms | | |
| This section provides definitions for certain terms in the prospectus. | | 39 |
|
November 28, 2008
Section 1 The Funds
Nuveen Santa Barbara Dividend Growth Fund
Nuveen Santa Barbara Growth Fund
Nuveen Santa Barbara Growth Opportunities Fund
Nuveen Rittenhouse Growth Fund

This prospectus is intended to provide important information to help you evaluate whether one of the Nuveen Mutual Funds listed above may be right for you. Please read it carefully before investing and keep it for future reference.
NOT FDIC OR GOVERNMENT INSURED MAY LOSE VALUE NO BANK GUARANTEE
Section 1 The Funds
1

Nuveen Santa Barbara Dividend Growth Fund
Fund Overview

| Investment Objective |
The investment objective of the fund is to seek an attractive total return comprised of income from dividends and long-term capital appreciation.
| How the Fund Pursues Its Objective |
Under normal market conditions, the fund invests at least 80% of its net assets in dividend-paying common and preferred stocks. The fund seeks to provide income from dividends that is tax-advantaged, subject to holding period requirements.
Nuveen Asset Management (“NAM”), the fund’s investment adviser, has selected Santa Barbara Asset Management (“SBAM”) to serve as sub-adviser to the fund. SBAM employs bottom-up, fundamental analysis when selecting companies in which to invest. SBAM favors companies that exhibit stable and consistent earnings growth, defendable competitive advantages, strong management, and low dependence on capital markets. SBAM believes that companies exhibiting stable growth characteristics will perform through various business and economic cycles. Although stable growth companies are not immune from earnings and valuation declines during economic and market slowdowns, the fund’s management believes that they are better suited to grow in periods of recovery and to reach new earnings peaks with each subsequent business cycle.
Reflecting the fund’s focus on dividend-paying securities, SBAM begins the investment process for this fund by applying a screen for dividend-paying common and preferred stocks. From this group of stocks, SBAM focuses on those companies growing their dividends faster and/or yielding more than the S&P 500 Index. SBAM then employs bottom-up, fundamental analysis to select the companies in which to invest.
Companies in certain economic sectors of the market, such as the financial services, utilities and energy sectors, have historically provided higher dividend yields than companies in other sectors and industries. As a result, given the fund’s focus on dividend-paying securities, the fund may, from time to time, have a greater exposure to these higher dividend-yield sectors and industries than the broad equity market.
The fund may invest up to 25% of its net assets in non-U.S. equity securities that are U.S. dollar-denominated.

| What Are the Risks of Investing in the Fund? |
Equity Market Risk—Equity market risk is the risk that market values of equity securities owned by the fund will fall in value. The value of equity securities will rise and fall in response to the activities of the companies that issued them, general market conditions and/or economic conditions.
Preferred Security Risk—Generally, preferred security holders have no voting rights with respect to the issuing company unless certain events occur. In certain circumstances, an issuer of preferred securities may redeem the securities prior to a specified date. As with call provisions, a redemption by the issuer may negatively impact the return of the security held by the fund. Preferred securities are subordinated to bonds and other debt instruments in a company’s capital structure and therefore will be subject to greater credit risk than those debt instruments.
Non-U.S. Risk—Non-U.S. risk is the risk that non-U.S. securities will be more volatile than U.S. securities due to such factors as adverse economic, currency, political, social or regulatory developments in a country, including government seizure of assets, excessive taxation, limitations on the use or transfer of assets, the lack of liquidity or regulatory controls or differing legal and/or accounting standards.
As with any mutual fund investment, loss of money is a risk of investing.
| Is This Fund Right For You? |
This fund may be right for you if you are seeking:
| | Ÿ | | attractive total return potential; |
| | Ÿ | | a growth-oriented equity investing strategy; |
| | Ÿ | | exposure to dividend-paying stocks; or |
| | Ÿ | | to meet long-term financial goals. |
You should not invest in this fund if you are:
| | Ÿ | | unwilling to accept share price fluctuations, including the possibility of sharp price declines; or |
| | Ÿ | | investing to meet short-term financial goals. |
How the Fund Has Performed
The chart and table that follow illustrate annual fund calendar year returns for the past year as well as average annual fund and index returns for the one-year and since inception periods ended December 31, 2007. This information gives some indication of the risks of an investment in the fund by comparing the fund’s performance with the returns of a broad measure of market performance and a peer group of funds with similar investment objectives.
Returns before taxes do not reflect the effects of any income or capital gains taxes. All after-tax returns are calculated using the historical highest individual federal marginal income tax rates and do not reflect the impact of any state or local tax. After-tax returns are shown for Class A shares only; after-tax returns for
Section 1 The Funds
2
Class B, C, R3 and I shares will vary. Returns after taxes on distributions reflect the taxed return on the payment of dividends and capital gains. Returns after taxes on distributions and sale of shares assume you sold your shares at period end, and, therefore, are also adjusted for any capital gains or losses incurred. Returns for market indices do not include expenses, which are deducted from fund returns, or taxes.
Your own actual after-tax returns will depend on your specific tax situation and may differ from what is shown here. After-tax returns are not relevant to investors who hold fund shares in tax-deferred accounts such as individual retirement accounts (IRAs) or employer-sponsored retirement plans.
Past performance does not necessarily indicate future performance.
Total Returns1
During the one-year period ended December 31, 2007, the highest and lowest quarterly returns were 4.92% and -2.26%, respectively, for the quarters ended March 31, 2007 and December 31, 2007. The bar chart and highest/lowest quarterly returns do not reflect sales charges, which would reduce returns, while the Average Annual Total Return table does reflect sales charges.
| | | | |
| | | Average Annual Total Returns
for the Periods Ended
December 31, 2007 |
| | | |
| Class Returns Before Taxes | | 1 Year | | Since Inception
(March 28, 2006) |
Class A (Offer) | | 4.97% | | 10.87% |
Class B | | 6.60% | | 11.77% |
Class C | | 10.55% | | 13.81% |
Class R32 | | N/A | | N/A |
Class I3 | | 11.64% | | 14.93% |
Class A (Offer) Returns: | | | | |
After Taxes on
Distributions | | 4.57% | | 10.48% |
After Taxes on
Distributions and
Sale of Shares | | 3.63% | | 9.25% |
S&P 500 Index4 | | 5.49% | | 9.51% |
Lipper Peer Group4 | | 2.98% | | 9.00% |
What Are the Costs of Investing?

| This table describes the fees and expenses that you may pay if you buy and hold shares of the fund. |
Shareholder Transaction Expenses5
Paid Directly From Your Investment
| | | | | | | | | | | | | |
| Share Class | | A | | | B | | | C | | | R32 | | I3 |
| Maximum Sales Charge Imposed on Purchases | | 5.75% | 6 | | None | | | None | | | None | | None |
|
| Maximum Sales Charge Imposed on Reinvested Dividends | | None | | | None | | | None | | | None | | None |
|
| Exchange Fees | | None | | | None | | | None | | | None | | None |
|
| Deferred Sales Charge7 | | None | 8 | | 5% | 9 | | 1% | 10 | | None | | None |
|
Annual Fund Operating Expenses
Paid From Fund Assets
| | | | | | | | | | |
| Share Class | | A | | B | | C | | R32 | | I3 |
| Management Fees | | 0.79% | | 0.79% | | 0.79% | | 0.79% | | 0.79% |
|
| 12b-1 Distribution and Service Fees11 | | 0.25% | | 1.00% | | 1.00% | | 0.50% | | — |
|
| Other Expenses12 | | 0.98% | | 1.27% | | 1.28% | | 0.99% | | 0.77% |
|
| Total Annual Fund Operating Expenses—Gross13 | | 2.02% | | 3.06% | | 3.07% | | 2.28% | | 1.56% |
|
| Fee Waivers and Expense Reimbursements | | (0.74%) | | (1.02%) | | (1.03%) | | (0.74%) | | (0.53%) |
|
| Custodian Fee Credits14 | | (0.04%) | | (0.05%) | | (0.05%) | | — | | (0.04%) |
|
| Total Annual Fund Operating Expenses—Net | | 1.24% | | 1.99% | | 1.99% | | 1.54% | | 0.99% |
|
Section 1 The Funds
3
The following example is intended to help you compare the cost of investing in the fund with the costs of investing in other mutual funds. The example assumes you invest $10,000 in the fund for the time periods indicated and then either redeem or do not redeem your shares at the end of a period. The example assumes that your investment has a 5% return each year and that the Total Annual Fund Operating Expenses do not exceed the fund’s expense cap. 13 Your actual returns and costs may be higher or lower.
| | | | | | | | | | | | | | | | | | | | | | | | | | | | | | |
| | | Redemption | | No Redemption |
Share
Class | | A | | B | | C | | R32 | | I3 | | A | | B | | C | | R32 | | I3 |
| 1 Year | | $ | 700 | | $ | 608 | | $ | 208 | | $ | 158 | | $ | 107 | | $ | 700 | | $ | 208 | | $ | 208 | | $ | 158 | | $ | 107 |
|
| 3 Years | | $ | 1,013 | | $ | 994 | | $ | 694 | | $ | 542 | | $ | 387 | | $ | 1,013 | | $ | 694 | | $ | 694 | | $ | 542 | | $ | 387 |
|
| 5 Years | | $ | 1,349 | | $ | 1,308 | | $ | 1,208 | | $ | 952 | | $ | 689 | | $ | 1,349 | | $ | 1,208 | | $ | 1,208 | | $ | 952 | | $ | 689 |
|
| 10 Years | | $ | 2,294 | | $ | 2,428 | | $ | 2,616 | | $ | 2,095 | | $ | 1,546 | | $ | 2,294 | | $ | 2,428 | | $ | 2,616 | | $ | 2,095 | | $ | 1,546 |
|
| 1. | | The Class A year-to-date return on net asset value as of September 30, 2008 was -12.40% |
| 2. | | The fund expects to offer Class R3 shares beginning on or about March 30, 2009. Class R3 shares may be purchased only by qualified investors. See “How You Can Buy and Sell Shares.” |
| 3. | | Class I shares, formerly named Class R shares, may be purchased only under limited circumstances, or by specified classes of investors. See “How You Can Buy and Sell Shares.” |
| 4. | | Returns assume reinvestment of dividends, but do not include any brokerage commissions, sales charges or other fees (except management fees in the case of the Lipper Peer Group). You cannot invest directly in an index or the Lipper Peer Group. The Lipper Peer Group returns reflect the performance of the Lipper Equity Income Funds Index. See “Glossary of Investment Terms” for information regarding the index and the Lipper Peer Group. |
| 5. | | As a percentage of offering price unless otherwise noted. Financial intermediaries may charge additional fees for shareholder transactions or for advisory services. Please see their materials for details. |
| 6. | | Reduced Class A sales charges apply to purchases of $50,000 or more. See “How You Can Buy and Sell Shares.” |
| 7. | | As a percentage of the lesser of purchase price or redemption proceeds. |
| 8. | | Certain Class A purchases at net asset value of $1 million or more may be subject to a contingent deferred sales charge (“CDSC”) if redeemed within 12 months of purchase. See “How You Can Buy and Sell Shares.” |
| 9. | | Class B shares redeemed within six years of purchase are subject to a CDSC of 5% during the first year, 4% during the second and third years, 3% during the fourth, 2% during the fifth, and 1% during the sixth year. Class B shares may be purchased only under limited circumstances. See “How You Can Buy and Sell Shares.” |
| 10. | | Class C shares redeemed within one year of purchase are subject to a 1% CDSC. |
| 11. | | Long-term holders of Class B, C and R3 shares may pay more in Rule 12b-1 fees and CDSCs (Class B and C shares only) than the economic equivalent of the maximum front-end sales charge permitted under the Financial Industry Regulatory Authority Conduct Rules. |
| 12. | | Other Expenses for Class A, B, C and I reflect the actual expense levels for each share class during the most recent fiscal year. Other Expenses for Class R3 are estimated based on the actual expenses for the fund during the most recent fiscal year. |
| 13. | | The investment adviser has agreed to waive fees and reimburse expenses through November 30, 2009, so that Total Annual Fund Operating Expenses (excluding 12b-1 distribution and service fees, interest expenses, taxes, fees incurred in acquiring and disposing of portfolio securities, and extraordinary expenses) do not exceed 1.05% (1.30% after November 30, 2009) of the average daily net assets of any class of fund shares. |
| 14. | | The fund has an arrangement with the custodian bank whereby certain custodian fees and expenses are reduced by credits earned on the fund’s cash on deposit with the bank. Such deposit arrangements are an alternative to overnight investments. There is no guarantee that the fund will earn such credits in the future. |
Section 1 The Funds
4
Nuveen Santa Barbara Growth Fund
Fund Overview
| Investment Objective |
The investment objective of the fund is to seek long-term capital appreciation.
| How the Fund Pursues Its Objective |
Under normal market conditions, the fund invests primarily in equity securities of companies with market capitalizations at the time of investment comparable to companies in the Russell 1000 Index. The fund will not be forced to sell a stock because it has exceeded or fallen below the current market capitalization range.
Nuveen Asset Management (“NAM”), the fund’s investment adviser, has selected Santa Barbara Asset Management (“SBAM”) to serve as sub-adviser to the fund. SBAM employs bottom-up, fundamental analysis when selecting companies in which to invest. SBAM favors companies that exhibit stable and consistent earnings growth, defendable competitive advantages, strong management, and low dependence on capital markets. SBAM believes that companies exhibiting stable growth characteristics will perform through various business and economic cycles. Although stable growth companies are not immune from earnings and valuation declines during economic and market slowdowns, the fund’s management believes that they are better suited to grow in periods of recovery and to reach new earnings peaks with each subsequent business cycle.
The fund may invest up to 25% of its net assets in non-U.S. equity securities that are U.S. dollar-denominated.
| What Are the Risks of Investing in the Fund? |
Equity Market Risk—Equity market risk is the risk that market values of equity securities owned by the fund will fall in value. The value of equity securities will rise and fall in response to the activities of the companies that issued them, general market conditions and/or economic conditions. These risks are generally greater for lower market capitalization companies because they tend to have more limited product lines, markets and financial resources and may be dependent on a smaller management group than larger, more established companies.
Non-U.S. Risk—Non-U.S. risk is the risk that non-U.S. securities will be more volatile than U.S. securities due to such factors as adverse economic, currency, political, social or regulatory developments in a country, including government seizure of assets, excessive taxation, limitations on the use or transfer of assets, the lack of liquidity or regulatory controls or differing legal and/or accounting standards.
As with any mutual fund investment, loss of money is a risk of investing.
| Is This Fund Right For You? |
This fund may be right for you if you are seeking:
| | Ÿ | | long-term capital appreciation potential; |
| | Ÿ | | a growth-oriented equity investing strategy; or |
| | Ÿ | | to meet long-term financial goals. |
You should not invest in this fund if you are:
| | Ÿ | | unwilling to accept share price fluctuations, including the possibility of sharp price declines; or |
| | Ÿ | | investing to meet short-term financial goals. |
How the Fund Has Performed
The chart and table that follow illustrate annual fund calendar year returns for the past year as well as average annual fund and index returns for the one-year and since inception periods ended December 31, 2007. This information gives some indication of the risks of an investment in the fund by comparing the fund’s performance with the returns of a broad measure of market performance and a peer group of funds with similar investment objectives.
Returns before taxes do not reflect the effects of any income or capital gains taxes. All after-tax returns are calculated using the historical highest individual federal marginal income tax rates and do not reflect the impact of any state or local tax. After-tax returns are shown for Class A shares only; after-tax returns for Class B, C, R3 and I shares will vary. Returns after taxes on distributions reflect the taxed return on the payment of dividends and capital gains. Returns after taxes on distributions and sale of shares assume you sold your shares at period end, and, therefore, are also adjusted for any capital gains or losses incurred. Returns for market indices do not include expenses, which are deducted from fund returns, or taxes.
Your own actual after-tax returns will depend on your specific tax situation and may differ from what is shown here. After-tax returns are not relevant to investors who hold fund shares in tax-deferred accounts such as individual retirement accounts (IRAs) or employer-sponsored retirement plans.
Past performance does not necessarily indicate future performance.
Section 1 The Funds
5
Total Returns1

During the one-year period ended December 31, 2007, the highest and lowest quarterly returns were 4.70% and –3.47%, respectively, for the quarters ended June 30, 2007 and December 31, 2007. The bar chart and highest/lowest quarterly returns do not reflect sales charges, which would reduce returns, while the Average Annual Total Return table does reflect sales charges.
| | | | |
| | | Average Annual Total Returns
for the Periods Ended
December 31, 2007 |
| | | |
| Class Returns Before Taxes | | 1 Year | | Since Inception
(March 28, 2006) |
Class A (Offer) | | -2.13% | | -0.45% |
Class B | | -0.91% | | -0.05% |
Class C | | 3.09% | | 2.20% |
Class R32 | | N/A | | N/A |
Class I3 | | 4.10% | | 3.21% |
Class A (Offer) Returns: | | | | |
After Taxes on
Distributions | | -2.21% | | -0.50% |
After Taxes on
Distributions and Sale of Shares | | -1.38% | | -0.41% |
Russell 1000® Growth Index 4 | | 11.81% | | 10.08% |
Lipper Peer Group4 | | 6.63% | | 8.87% |
What Are the Costs of Investing?
| This table describes the fees and expenses that you may pay if you buy and hold shares of the fund. |
Shareholder Transaction Expenses5
Paid Directly From Your Investment
| | | | | | | | | | | | | |
| Share Class | | A | | | B | | | C | | | R32 | | I3 |
| Maximum Sales Charge Imposed on Purchases | | 5.75% | 6 | | None | | | None | | | None | | None |
|
| Maximum Sales Charge Imposed on Reinvested Dividends | | None | | | None | | | None | | | None | | None |
|
| Exchange Fees | | None | | | None | | | None | | | None | | None |
|
| Deferred Sales Charge7 | | None | 8 | | 5% | 9 | | 1% | 10 | | None | | None |
|
Annual Fund Operating Expenses
Paid From Fund Assets
| | | | | | | | | | | | | | | |
| Share Class | | A | | | B | | | C | | | R32 | | | I3 | |
| Management Fees | | 0.89% | | | 0.89% | | | 0.89% | | | 0.89% | | | 0.89% | |
| |
| 12b-1 Distribution and Service Fees 11 | | 0.25% | | | 1.00% | | | 1.00% | | | 0.50% | | | — | |
| |
| Other Expenses12 | | 1.12% | | | 1.14% | | | 1.18% | | | 1.01% | | | 0.79% | |
| |
| Total Annual Fund Operating Expenses—Gross13 | | 2.26% | | | 3.03% | | | 3.07% | | | 2.40% | | | 1.68% | |
| |
| Fee Waivers and Expense Reimbursements | | (0.87% | ) | | (0.89% | ) | | (0.93% | ) | | (0.76% | ) | | (0.54% | ) |
| |
| Custodian Fee Credits14 | | (0.07% | ) | | (0.07% | ) | | (0.07% | ) | | — | | | (0.07% | ) |
| |
| Total Annual Fund Operating Expenses—Net | | 1.32% | | | 2.07% | | | 2.07% | | | 1.64% | | | 1.07% | |
| |
Section 1 The Funds
6
The following example is intended to help you compare the cost of investing in the fund with the costs of investing in other mutual funds. The example assumes you invest $10,000 in the fund for the time periods indicated and then either redeem or do not redeem your shares at the end of a period. The example assumes that your investment has a 5% return each year and that the Total Annual Fund Operating Expenses do not exceed the fund’s expense cap. 13 Your actual returns and costs may be higher or lower.
| | | | | | | | | | | | | | | | | | | | | | | | | | | | | | |
| | | Redemption | | No Redemption |
Share
Class | | A | | B | | C | | R32 | | I3 | | A | | B | | C | | R32 | | I3 |
| 1 Year | | $ | 709 | | $ | 618 | | $ | 218 | | $ | 168 | | $ | 117 | | $ | 709 | | $ | 218 | | $ | 218 | | $ | 168 | | $ | 117 |
|
| 3 Years | | $ | 1,042 | | $ | 1,025 | | $ | 725 | | $ | 573 | | $ | 419 | | $ | 1,042 | | $ | 725 | | $ | 725 | | $ | 573 | | $ | 419 |
|
| 5 Years | | $ | 1,398 | | $ | 1,358 | | $ | 1,258 | | $ | 1,003 | | $ | 742 | | $ | 1,398 | | $ | 1,258 | | $ | 1,258 | | $ | 1,003 | | $ | 742 |
|
| 10 Years | | $ | 2,397 | | $ | 2,531 | | $ | 2,717 | | $ | 2,202 | | $ | 1,658 | | $ | 2,397 | | $ | 2,531 | | $ | 2,717 | | $ | 2,202 | | $ | 1,658 |
|
| 1. | | The Class A year-to-date return on net asset value as of September 30, 2008 was -13.14%. |
| 2. | | The fund expects to offer Class R3 shares beginning on or about March 30, 2009. Class R3 shares may be purchased only by qualified investors. See “How You Can Buy and Sell Shares.” |
| 3. | | Class I shares, formerly named Class R shares, may be purchased only under limited circumstances, or by specified classes of investors. See “How You Can Buy and Sell Shares.” |
| 4. | | Returns assume reinvestment of dividends, but do not include any brokerage commissions, sales charges or other fees (except management fees in the case of the Lipper Peer Group). You cannot invest directly in an index or the Lipper Peer Group. The Lipper Peer Group returns reflect the performance of the Lipper Large-Cap Core Funds Index. See “Glossary of Investment Terms” for information regarding the index and the Lipper Peer Group. |
| 5. | | As a percentage of offering price unless otherwise noted. Financial intermediaries may charge additional fees for shareholder transactions or for advisory services. Please see their materials for details. |
| 6. | | Reduced Class A sales charges apply to purchases of $50,000 or more. See “How You Can Buy and Sell Shares.” |
| 7. | | As a percentage of the lesser of purchase price or redemption proceeds. |
| 8. | | Certain Class A purchases at net asset value of $1 million or more may be subject to a contingent deferred sales charge (“CDSC”) if redeemed within 12 months of purchase. See “How You Can Buy and Sell Shares.” |
| 9. | | Class B shares redeemed within six years of purchase are subject to a CDSC of 5% during the first year, 4% during the second and third years, 3% during the fourth, 2% during the fifth, and 1% during the sixth year. Class B shares may be purchased only under limited circumstances. See “How You Can Buy and Sell Shares.” |
| 10. | | Class C shares redeemed within one year of purchase are subject to a 1% CDSC. |
| 11. | | Long-term holders of Class B, C and Class R3 shares may pay more in Rule 12b-1 fees and CDSCs (Class B and C shares only) than the economic equivalent of the maximum front-end sales charge permitted under the Financial Industry Regulatory Authority Conduct Rules. |
| 12. | | Other Expenses for Class A, B, C and I reflect the actual expense levels for each share class during the most recent fiscal year. Other Expenses for Class R3 are estimated based on the actual expenses for the fund during the most recent fiscal year. |
| 13. | | The investment adviser has agreed to waive fees and reimburse expenses through November 30, 2009, so that Total Annual Fund Operating Expenses (excluding 12b-1 distribution and service fees, interest expenses, taxes, fees incurred in acquiring and disposing of portfolio securities, and extraordinary expenses) do not exceed 1.15% (1.40% after November 30, 2009) of the average daily net assets of any class of fund shares. |
| 14. | | The fund has an arrangement with the custodian bank whereby certain custodian fees and expenses are reduced by credits earned on the fund’s cash on deposit with the bank. Such deposit arrangements are an alternative to overnight investments. There is no guarantee that the fund will earn such credits in the future. |
Section 1 The Funds
7
Nuveen Santa Barbara Growth Opportunities Fund
Fund Overview
| Investment Objective |
The investment objective of the fund is to seek long-term capital appreciation.
| How the Fund Pursues Its Objective |
Under normal market conditions, the fund invests in equity securities of companies with small- to mid-sized market capitalizations at the time of purchase (currently from $50 million to $20 billion). The fund will not be forced to sell a stock because it has exceeded or fallen below the current market capitalization range.
Nuveen Asset Management (“NAM”), the fund’s investment adviser, has selected Santa Barbara Asset Management (“SBAM”) to serve as sub-adviser to the fund. SBAM employs bottom-up, fundamental analysis when selecting companies in which to invest. SBAM favors companies that exhibit stable and consistent earnings growth, defendable competitive advantages, strong management, and low dependence on capital markets. SBAM believes that companies exhibiting stable growth characteristics will perform through various business and economic cycles. Although stable growth companies are not immune from earnings and valuation declines during economic and market slowdowns, the fund’s management believes that they are better suited to grow in periods of recovery and to reach new earnings peaks with each subsequent business cycle.
The fund may invest up to 25% of its net assets in non-U.S. equity securities that are U.S. dollar-denominated.
| What Are the Risks of Investing in the Fund? |
Equity Market Risk—Equity market risk is the risk that market values of equity securities owned by the fund will fall in value. The value of equity securities will rise and fall in response to the activities of the companies that issued them, general market conditions and/or economic conditions. These risks are generally greater for lower market capitalization companies because they tend to have more limited product lines, markets and financial resources and may be dependent on a smaller management group than larger, more established companies.
Non-U.S. Risk—Non-U.S. risk is the risk that non-U.S. securities will be more volatile than U.S. securities due to such factors as adverse economic, currency, political, social or regulatory developments in a country, including government seizure of assets, excessive taxation, limitations on the use or transfer of assets, the lack of liquidity or regulatory controls or differing legal and/or accounting standards.
As with any mutual fund investment, loss of money is a risk of investing.
| Is This Fund Right For You? |
This fund may be right for you if you are seeking:
| | Ÿ | | long-term capital appreciation potential; |
| | Ÿ | | a growth-oriented equity investing strategy; or |
| | Ÿ | | to meet long-term financial goals. |
You should not invest in this fund if you are:
| | Ÿ | | unwilling to accept share price fluctuations, including the possibility of sharp price declines; or |
| | Ÿ | | investing to meet short-term financial goals. |
How the Fund Has Performed
The chart and table that follow illustrate annual fund calendar year returns for the past year as well as average annual fund and index returns for the one-year and since inception periods ended December 31, 2007. This information gives some indication of the risks of an investment in the fund by comparing the fund’s performance with the returns of a broad measure of market performance and a peer group of funds with similar investment objectives.
Returns before taxes do not reflect the effects of any income or capital gains taxes. All after-tax returns are calculated using the historical highest individual federal marginal income tax rates and do not reflect the impact of any state or local tax. After-tax returns are shown for Class A shares only; after-tax returns for Class B, C, R3 and I shares will vary. Returns after taxes on distributions reflect the taxed return on the payment of dividends and capital gains. Returns after taxes on distributions and sale of shares assume you sold your shares at period end, and, therefore, are also adjusted for any capital gains or losses incurred. Returns for market indices do not include expenses, which are deducted from fund returns, or taxes.
Your own actual after-tax returns will depend on your specific tax situation and may differ from what is shown here. After-tax returns are not relevant to investors who hold fund shares in tax-deferred accounts such as individual retirement accounts (IRAs) or employer-sponsored retirement plans.
Past performance does not necessarily indicate future performance.
Section 1 The Funds
8
Total Returns1
During the one-year period ended December 31, 2007, the highest and lowest quarterly returns were 7.17% and –4.39%, respectively, for the quarters ended June 30, 2007 and December 31, 2007. The bar chart and highest/lowest quarterly returns do not reflect sales charges, which would reduce returns, while the Average Annual Total Return table does reflect sales charges.
| | | | |
| | | Average Annual Total Returns
for the Periods Ended
December 31, 2007 |
| | | |
| Class Returns Before Taxes | | 1 Year | | Since Inception
(March 28, 2006) |
Class A (Offer) | | -2.06% | | 2.28% |
Class B | | -0.68% | | 2.79% |
Class C | | 3.13% | | 4.97% |
Class R32 | | N/A | | N/A |
Class I3 | | 4.17% | | 6.05% |
Class A (Offer) Returns: | | | | |
After Taxes on
Distributions | | -4.02% | | 0.81% |
After Taxes on
Distributions and Sale of Shares | | -0.78% | | 1.24% |
Russell 2500™ Growth Index4 | | 9.69% | | 6.36% |
Lipper Peer Group4 | | 6.34% | | 6.60% |
What Are the Costs of Investing?
| This table describes the fees and expenses that you may pay if you buy and hold shares of the fund. |
Shareholder Transaction Expenses5
Paid Directly From Your Investment
| | | | | | | | | | | | | |
| Share Class | | A | | | B | | | C | | | R32 | | I3 |
| Maximum Sales Charge Imposed on Purchases | | 5.75% | 6 | | None | | | None | | | None | | None |
|
| Maximum Sales Charge Imposed on Reinvested Dividends | | None | | | None | | | None | | | None | | None |
|
| Exchange Fees | | None | | | None | | | None | | | None | | None |
|
| Deferred Sales Charge7 | | None | 8 | | 5% | 9 | | 1% | 10 | | None | | None |
|
Annual Fund Operating Expenses
Paid From Fund Assets
| | | | | | | | | | |
| Share Class | | A | | B | | C | | R32 | | I3 |
| Management Fees | | 0.99% | | 0.99% | | 0.99% | | 0.99% | | 0.99% |
|
| 12b-1 Distribution and Service Fees11 | | 0.25% | | 1.00% | | 1.00% | | 0.50% | | — |
|
| Other Expenses12 | | 4.87% | | 4.76% | | 4.93% | | 5.11% | | 5.63% |
|
| Total Annual Fund Operating Expenses—Gross13 | | 6.11% | | 6.75% | | 6.92% | | 6.60% | | 6.62% |
|
| Fee Waivers and Expense Reimbursements | | (4.63%) | | (4.51%) | | (4.68%) | | (4.86%) | | (5.39%) |
|
| Custodian Fee Credits14 | | (0.20%) | | (0.21%) | | (0.21%) | | — | | (0.20%) |
|
| Total Annual Fund Operating Expenses—Net | | 1.28% | | 2.03% | | 2.03% | | 1.74% | | 1.03% |
|
Section 1 The Funds
9
The following example is intended to help you compare the cost of investing in the fund with the costs of investing in other mutual funds. The example assumes you invest $10,000 in the fund for the time periods indicated and then either redeem or do not redeem your shares at the end of a period. The example assumes that your investment has a 5% return each year and that the Total Annual Fund Operating Expenses do not exceed the fund’s expense cap. 13 Your actual returns and costs may be higher or lower.
| | | | | | | | | | | | | | | | | | | | | | | | | | | | | | |
| | | Redemption | | No Redemption |
Share
Class | | A | | B | | C | | R32 | | I3 | | A | | B | | C | | R32 | | I3 |
| 1 Year | | $ | 719 | | $ | 628 | | $ | 228 | | $ | 178 | | $ | 127 | | $ | 719 | | $ | 228 | | $ | 228 | | $ | 178 | | $ | 127 |
|
| 3 Years | | $ | 1,071 | | $ | 1,055 | | $ | 755 | | $ | 603 | | $ | 450 | | $ | 1,071 | | $ | 755 | | $ | 755 | | $ | 603 | | $ | 450 |
|
| 5 Years | | $ | 1,447 | | $ | 1,408 | | $ | 1,308 | | $ | 1,055 | | $ | 795 | | $ | 1,447 | | $ | 1,308 | | $ | 1,308 | | $ | 1,055 | | $ | 795 |
|
| 10 Years | | $ | 2,499 | | $ | 2,633 | | $ | 2,817 | | $ | 2,307 | | $ | 1,769 | | $ | 2,499 | | $ | 2,633 | | $ | 2,817 | | $ | 2,307 | | $ | 1,769 |
|
| 1. | | The Class A year-to-date return on net asset value as of September 30, 2008 was -23.41%. |
| 2. | | The fund expects to offer Class R3 shares beginning on or about March 30, 2009. Class R3 shares may be purchased only by qualified investors. See “How You Can Buy and Sell Shares.” |
| 3. | | Class I shares, formerly named Class R shares, may be purchased only under limited circumstances, or by specified classes of investors. See “How You Can Buy and Sell Shares.” |
| 4. | | Returns assume reinvestment of dividends, but do not include any brokerage commissions, sales charges or other fees (except management fees in the case of the Lipper Peer Group). You cannot invest directly in an index or the Lipper Peer Group. The Lipper Peer Group returns reflect the performance of the Lipper Mid-Cap Core Funds Index. See “Glossary of Investment Terms” for information regarding the index and the Lipper Peer Group. |
| 5. | | As a percentage of offering price unless otherwise noted. Financial intermediaries may charge additional fees for shareholder transactions or for advisory services. Please see their materials for details. |
| 6. | | Reduced Class A sales charges apply to purchases of $50,000 or more. See “How You Can Buy and Sell Shares.” |
| 7. | | As a percentage of the lesser of purchase price or redemption proceeds. |
| 8. | | Certain Class A purchases at net asset value of $1 million or more may be subject to a contingent deferred sales charge (“CDSC”) if redeemed within 12 months of purchase. See “How You Can Buy and Sell Shares.” |
| 9. | | Class B shares redeemed within six years of purchase are subject to a CDSC of 5% during the first year, 4% during the second and third years, 3% during the fourth, 2% during the fifth, and 1% during the sixth year. Class B shares may be purchased only under limited circumstances. See “How You Can Buy and Sell Shares.” |
| 10. | | Class C shares redeemed within one year of purchase are subject to a 1% CDSC. |
| 11. | | Long-term holders of Class B, C and Class R3 shares may pay more in Rule 12b-1 fees and CDSCs (Class B and C shares only) than the economic equivalent of the maximum front-end sales charge permitted under the Financial Industry Regulatory Authority Conduct Rules. |
| 12. | | Other Expenses for Class A, B, C and I reflect the actual expense levels for each share class during the most recent fiscal year. Other Expenses for Class R3 are estimated based on the actual expenses for the fund during the most recent fiscal year. |
| 13. | | The investment adviser has agreed to waive fees and reimburse expenses through November 30, 2009, so that Total Annual Fund Operating Expenses (excluding 12b-1 distribution and service fees, interest expense, taxes, fees incurred in acquiring and disposing of portfolio securities, and extraordinary expenses) do not exceed 1.25% (1.50% after November 30, 2009) of the average daily net assets of any class of fund shares. |
| 14. | | The fund has an arrangement with the custodian bank whereby certain custodian fees and expenses are reduced by credits earned on the fund’s cash on deposit with the bank. Such deposit arrangements are an alternative to overnight investments. There is no guarantee that the fund will earn such credits in the future. |
Section 1 The Funds
10
Nuveen Rittenhouse Growth Fund
Fund Overview
| Investment Objective |
The investment objective of the fund is to provide long-term growth of capital by investing in a diversified portfolio consisting primarily of equity securities traded in U.S. securities markets of large-capitalization companies that have a history of consistent earnings and dividend growth.
| How the Fund Pursues Its Objective |
Under normal market conditions, the fund invests at least 65% of its net assets in equity securities of high quality companies—those large-capitalization companies with a high financial strength rating and a history of consistent and predictable earnings growth.
Nuveen Asset Management (“NAM”), the fund’s investment adviser, has selected Rittenhouse Asset Management, Inc. (“Rittenhouse”) to serve as sub-adviser to the fund. Rittenhouse uses fundamental research supplemented by quantitative analysis in the security selection and portfolio construction processes. Through this combination of fundamental and quantitative analysis, Rittenhouse seeks to invest in the 50-80 companies that it believes have a demonstrated industry leadership position and offer the best mix of sustained growth opportunities at reasonable valuations.
The fund may invest up to 15% of its net assets in non-U.S. equity securities that are U.S. dollar-denominated.
| What Are the Risks of Investing in the Fund? |
Equity Market Risk—Equity market risk is the risk that market values of equity securities owned by the fund will fall in value. The value of equity securities will rise and fall in response to the activities of the companies that issued them, general market conditions and/or economic conditions.
Non-U.S. Risk—Non-U.S. risk is the risk that non-U.S. securities will be more volatile than U.S. securities due to such factors as adverse economic, currency, political, social or regulatory developments in a country, including government seizure of assets, excessive taxation, limitations on the use or transfer of assets, the lack of liquidity or regulatory controls or differing legal and/or accounting standards.
As with any mutual fund investment, loss of money is a risk of investing.
| Is This Fund Right For You? |
This fund may be right for you if you are seeking:
| | Ÿ | | long-term capital appreciation potential; |
| | Ÿ | | a growth-oriented equity investing strategy; or |
| | Ÿ | | to meet long-term financial goals. |
You should not invest in this fund if you are:
| | Ÿ | | unwilling to accept share price fluctuations, including the possibility of sharp price declines; or |
| | Ÿ | | investing to meet short-term financial goals. |
How the Fund Has Performed
The chart and table that follow illustrate annual fund calendar year returns for each of the past ten years as well as average annual fund and index returns for the one-year, five-year and ten-year periods ended December 31, 2007. This information is intended to help you assess the variability of fund returns (and consequently, the potential rewards and risks of a fund investment). The information also shows how the fund’s performance compares with the returns of broad measures of market performance and a peer group of funds with similar investment objectives.
Returns before taxes do not reflect the effects of any income or capital gains taxes. All after-tax returns are calculated using the historical highest individual federal marginal income tax rates and do not reflect the impact of any state or local tax. After-tax returns are shown for Class A shares only; after-tax returns for Class B, C, and I shares will vary. Returns after taxes on distributions reflect the taxed return on the payment of dividends and capital gains. Returns after taxes on distributions and sale of shares assume you sold your shares at period end, and, therefore, are also adjusted for any capital gains or losses incurred. Returns for market indices do not include expenses, which are deducted from fund returns, or taxes.
Your own actual after-tax returns will depend on your specific tax situation and may differ from what is shown here. After-tax returns are not relevant to investors who hold fund shares in tax-deferred accounts such as individual retirement accounts (IRAs) or employer-sponsored retirement plans.
Past performance does not necessarily indicate future performance.
Total Returns1
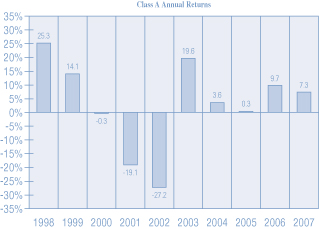
Section 1 The Funds
11
During the ten-year period ended December 31, 2007, the highest and lowest quarterly returns were 21.21% and -17.60%, respectively for the quarters ended December 31, 1998, and March 31, 2001. The bar chart and highest/lowest quarterly returns do not reflect sales charges, which would reduce returns, while the Average Annual Total Return table does reflect sales charges.
| | | | | | |
| | | Average Annual Total Returns
for the Periods Ended
December 31, 2007 |
| Class Returns Before Taxes | | 1 Year | | 5 Year | | 10 Year |
Class A (Offer) | | 1.16% | | 6.62% | | 1.46% |
Class B | | 2.53% | | 6.92% | | 1.46% |
Class C | | 6.52% | | 7.08% | | 1.31% |
Class I2 | | 7.60% | | 8.16% | | 2.31% |
Class A (Offer) Returns: | | | | | | |
After Taxes on Distributions | | 1.16% | | 6.62% | | 1.45% |
After Taxes on Distributions and Sale of Shares | | 0.75% | | 5.73% | | 1.25% |
Russell 1000® Growth Index3 | | 11.81% | | 12.11% | | 3.83% |
Russell Top 200® Growth Index3 | | 12.15% | | 10.47% | | 2.96% |
Lipper Peer Group3 | | 14.97% | | 12.06% | | 3.64% |
What Are the Costs of Investing?
| This table describes the fees and expenses that you may pay if you buy and hold shares of the fund. |
Shareholder Transaction Expenses4
Paid Directly From Your Investment
| | | | | | | | | | | |
| Share Class | | A | | | B | | | C | | | I2 |
| Maximum Sales Charge Imposed on Purchases | | 5.75% | 5 | | None | | | None | | | None |
|
| Maximum Sales Charge Imposed on Reinvested Dividends | | None | | | None | | | None | | | None |
|
| Exchange Fees | | None | | | None | | | None | | | None |
|
| Deferred Sales Charge6 | | None | 7 | | 5% | 8 | | 1% | 9 | | None |
|
Annual Fund Operating Expenses
Paid From Fund Assets
| | | | | | | | | | | | |
| Share Class | | A | | | B | | | C | | | I2 | |
| Management Fees | | 0.84% | | | 0.84% | | | 0.84% | | | 0.84% | |
| |
| 12b-1 Distribution and Service Fees10 | | 0.25% | | | 1.00% | | | 1.00% | | | — | |
| |
| Other Expenses | | 0.53% | | | 0.51% | | | 0.52% | | | 0.52% | |
| |
| Total Annual Fund Operating Expenses—Gross11 | | 1.62% | | | 2.35% | | | 2.36% | | | 1.36% | |
| |
| Fee Waivers and Expense Reimbursements | | (0.17% | ) | | (0.15% | ) | | (0.15% | ) | | (0.16% | ) |
| |
Total Annual Fund Operating
Expenses—Net | | 1.45% | | | 2.20% | | | 2.21% | | | 1.20% | |
| |
The following example is intended to help you compare the cost of investing in the fund with the costs of investing in other mutual funds. The example assumes you invest $10,000 in the fund for the time periods indicated and then either redeem or do not redeem your shares at the end of a period. The example assumes that your investment has a 5% return each year and that the Total Annual Fund Operating Expenses-Gross remain the same. Your actual returns and costs may be higher or lower.
| | | | | | | | | | | | | | | | | | | | | | | | |
| | | Redemption | | No Redemption |
| Share Class | | A | | B | | C | | I2 | | A | | B | | C | | I2 |
| 1 Year | | $ | 730 | | $ | 638 | | $ | 239 | | $ | 138 | | $ | 730 | | $ | 238 | | $ | 239 | | $ | 138 |
|
| 3 Years | | $ | 1,057 | | $ | 1,033 | | $ | 736 | | $ | 431 | | $ | 1,057 | | $ | 733 | | $ | 736 | | $ | 431 |
|
| 5 Years | | $ | 1,406 | | $ | 1,355 | | $ | 1,260 | | $ | 745 | | $ | 1,406 | | $ | 1,255 | | $ | 1,260 | | $ | 745 |
|
| 10 Years | | $ | 2,386 | | $ | 2,504 | | $ | 2,696 | | $ | 1,635 | | $ | 2,386 | | $ | 2,504 | | $ | 2,696 | | $ | 1,635 |
|
| 1. | | The Class A year-to-date return on net asset value as of September 30, 2008 was -17.70%. |
| 2. | | Class I shares, formerly named Class R shares, may be purchased only under limited circumstances, or by specified classes of investors. See “How You Can Buy and Sell Shares.” |
| 3. | | Returns assume reinvestment of dividends, but do not include any brokerage commissions, sales charges or other fees (except management fees in the case of the Lipper Peer Group). You cannot invest directly in an index or the Lipper Peer Group. The Lipper Peer Group returns reflect the performance of the Lipper Large-Cap Growth Funds Index. See “Glossary of Investment Terms” for information regarding the indices and the Lipper Peer Group. |
| 4. | | As a percentage of offering price unless otherwise noted. Financial intermediaries may charge additional fees for shareholder transactions or for advisory services. Please see their materials for details. |
| 5. | | Reduced Class A sales charges apply to purchases of $50,000 or more. See “How You Can Buy and Sell Shares.” |
| 6. | | As a percentage of the lesser of purchase price or redemption proceeds. |
| 7. | | Certain Class A purchases at net asset value of $1 million or more may be subject to a contingent deferred sales charge (“CDSC”) if redeemed within 12 months of purchase. See “How You Can Buy and Sell Shares.” |
| 8. | | Class B shares redeemed within six years of purchase are subject to a CDSC of 5% during the first year, 4% during the second and third years, 3% during the fourth, 2% during the fifth and 1% during the sixth year. Class B shares may be purchased only under limited circumstances. See “How You Can Buy and Sell Shares.” |
| 9. | | Class C shares redeemed within one year of purchase are subject to a 1% CDSC. |
| 10. | | Long-term holders of Class B and Class C shares may pay more in Rule 12b-1 fees and CDSCs than the economic equivalent of the maximum front-end sales charge permitted under the Financial Industry Regulatory Authority Conduct Rules. |
| 11. | | The investment adviser has agreed to waive fees and reimburse expenses through November 30, 2008, so that Total Annual Fund Operating Expenses (excluding 12b-1 distribution and service fees, interest expenses, taxes, fees incurred in acquiring and disposing of portfolio securities, and extraordinary expenses) do not exceed 1.22%, of the average daily net assets of any class of fund shares. |
Section 1 The Funds
12
Section 2 How We Manage Your Money
To help you better understand the funds, this section includes a detailed discussion of the funds’ investment and risk management strategies. For a more complete discussion of these matters, please see the Statement of Additional Information, which is available by calling (800) 257-8787 or by visiting Nuveen’s website at www.nuveen.com.

Nuveen Asset Management (“NAM”), the funds’ investment adviser, offers advisory and investment management services to a broad range of mutual fund clients. NAM has overall responsibility for management of the funds. NAM oversees the management of the funds’ portfolios, manages the funds’ business affairs and provides certain clerical, bookkeeping and other administrative services. NAM is located at 333 West Wacker Drive, Chicago, IL 60606. NAM is a wholly-owned subsidiary of Nuveen Investments, Inc. (“Nuveen Investments”).
On November 13, 2007, Nuveen Investments was acquired by investors led by Madison Dearborn Partners, LLC, which is a private equity investment firm based in Chicago, Illinois. The investor group includes affiliates of Merrill Lynch & Co., Inc. (“Merrill Lynch”). In connection with the transaction, Merrill Lynch became an indirect “affiliated person” (as that term is defined in the Investment Company Act of 1940, as amended (the “1940 Act”)) of the funds. As a result, the funds are generally prohibited from entering into principal transactions with Merrill Lynch and certain of its affiliates, and are subject to other limitations in transacting with Merrill Lynch. NAM and the funds do not believe that any such prohibition or limitations will have a materially adverse effect on the funds’ ability to pursue their investment objectives and policies.
NAM has selected Santa Barbara Asset Management (“SBAM”), 200 E. Carrillo St., Santa Barbara, California 93101, an affiliate of NAM, as sub-adviser to the Nuveen Santa Barbara Dividend Growth Fund (the “Dividend Growth Fund”), the Nuveen Santa Barbara Growth Fund (the “Growth Fund”) and the Nuveen Santa Barbara Growth Opportunities Fund (the “Growth Opportunities Fund”) (collectively, the “Santa Barbara Funds”). SBAM manages the investment of the Santa Barbara Funds’ assets on a discretionary basis, subject to the supervision of NAM.
The portfolio manager for the Dividend Growth Fund is James Boothe. The portfolio managers for the Growth Fund are Michael Mayfield, George Tharakan, Britton Smith and Mr. Boothe. The portfolio manager for the Growth Opportunities Fund is Mr. Tharakan.
| | Ÿ | | Michael G. Mayfield, President and Chief Investment Officer, joined SBAM in 1995. Prior to SBAM, Mr. Mayfield led the structuring and initial fund for the Scudder Latin American Trust for Independent Power at NatWest Markets in New York. Mr. Mayfield also was with Drexel Burnham Lambert where he founded and managed Drexel’s Special Equity Transaction Department. |
| | Ÿ | | George Tharakan, CFA, Director of Research and Portfolio Manager, joined SBAM in 2003. Prior to SBAM, Mr. Tharakan was a Senior Vice President at Vantis Capital, a Senior Vice President at Roxbury Capital Management and Senior Design Engineer for Intel Corporation. |
Section 2 How We Manage Your Money
13
| | Ÿ | | James Boothe, CFA, Portfolio Manager, joined SBAM in 2002. His investment management career began in 1978. His prior affiliations include USAA Investment Management Co., San Juan Asset Management, Bradford & Marzec and Farmers Insurance Group. |
| | Ÿ | | Britton Smith, CFA, Portfolio Manager/Research Analyst, joined SBAM in 2001. Prior to SBAM, Mr. Smith was a Senior Research Analyst with Peritus Asset Management. |
NAM has selected Rittenhouse Asset Management, Inc. (“Rittenhouse”), Five Radnor Corporate Center, Suite 300, Radnor, Pennsylvania 19087-9570, an affiliate of NAM, as sub-adviser to the Nuveen Rittenhouse Growth Fund (the “Rittenhouse Growth Fund”). Rittenhouse manages the investment of the Rittenhouse Growth Fund’s assets on a discretionary basis, subject to the supervision of NAM. Rittenhouse’s investment management strategy and portfolio purchase and sale determinations are set through a team approach, with all of its investment professionals contributing. Members of the investment team are described below.
| | Ÿ | | James J. Jolinger, Managing Director and Portfolio Manager, has been a member of the fund’s research and investment team since 2001. He previously was a Portfolio Manager and Executive Director at Morgan Stanley Investment Management, Inc. from 1997 to 2003. |
| | Ÿ | | Daniel C. Roarty, CFA, Managing Director and Portfolio Manager, has been a member of the fund’s research and investment team since 2001. |
| | Ÿ | | Nancy M. Crouse, CFA, Chief Investment Officer, Managing Director and Portfolio Manager, has been a member of the fund’s research and investment team since 2005. She was previously Senior Vice President/Senior Portfolio Manager at Delaware Investment Advisers from 1993 to 2005. |
| | Ÿ | | Robert A. Norton, Jr., CFA, Vice President and Portfolio Manager, has been a member of the fund’s research and investment team since 2002. Prior to 2002, he was with Delaware Investments for 17 years as a Vice President. |
Additional information about the portfolio managers’ compensation, other accounts managed by the portfolio managers and the portfolio managers’ ownership of securities in the funds is provided in the Statement of Additional Information. The Statement of Additional Information is available free of charge by calling (800) 257-8787 or by visiting Nuveen’s website at www.nuveen.com/MF/resources/eReports.aspx.
At such time as the funds receive an exemptive order permitting them to do so, or as otherwise permitted by the 1940 Act or the rules thereunder, the funds may, without obtaining approval of shareholders, retain an unaffiliated sub-adviser to perform some or all of the portfolio management functions on behalf of the funds.
Management Fee
The management fee schedule for each fund consists of two components—a fund-level fee, based only on the amount of assets within a fund, and a complex-level fee, based on the aggregate amount of all fund assets managed by NAM and its affiliates.
Section 2 How We Manage Your Money
14
The annual fund-level fee, payable monthly, for each fund is based upon the average daily net assets of each fund as follows:
| | | | | | | | |
| Average Daily Net Assets | | Santa
Barbara
Dividend
Growth
Fund | | Santa
Barbara
Growth
Fund | | Santa
Barbara
Growth
Opportunities
Fund | | Rittenhouse
Growth
Fund |
| For the first $125 million | | 0.6000% | | 0.7000% | | 0.8000% | | 0.6500% |
| For the next $125 million | | 0.5875% | | 0.6875% | | 0.7875% | | 0.6375% |
| For the next $250 million | | 0.5750% | | 0.6750% | | 0.7750% | | 0.6250% |
| For the next $500 million | | 0.5625% | | 0.6625% | | 0.7625% | | 0.6125% |
| For the next $1 billion | | 0.5500% | | 0.6500% | | 0.7500% | | 0.6000% |
| For net assets over $2 billion | | 0.5250% | | 0.6250% | | 0.7250% | | 0.5750% |
The complex-level fee is the same for each fund and begins at a maximum rate of 0.20% of each fund’s net assets, based upon complex-level assets of $55 billion, with breakpoints for assets above that level. Therefore, the maximum management fee rate for each fund is the fund-level fee plus 0.20%. As of September 30, 2008, the effective complex-level fee for each fund was 0.1947% of fund net assets.
For the most recent fiscal year, each fund paid NAM the following management fees (net of fee waivers and expense reimbursements, where applicable) as a percentage of average net assets:
| | |
| Nuveen Santa Barbara Dividend Growth Fund | | 0.05% |
|
| Nuveen Santa Barbara Growth Fund | | 0.14% |
|
| Nuveen Santa Barbara Growth Opportunities Fund | | —% |
|
| Nuveen Rittenhouse Growth Fund | | 0.68% |
|
Information regarding the Board of Trustees’ approval of investment advisory contracts is available in the funds’ annual report for the fiscal year ended July 31, 2008.

Each fund’s investment objective may not be changed without shareholder approval. The funds’ investment policies may be changed by the Board of Trustees without shareholder approval unless otherwise noted in this prospectus or the Statement of Additional Information.
Equity Securities
Under normal market conditions, each fund will invest primarily in equity securities. Equity securities include common stocks; preferred stocks; warrants to purchase common stocks or preferred stocks; securities convertible into common or preferred stocks, such as convertible bonds and debentures; and other securities with equity characteristics.
Non-U.S. Investments
Although the funds will invest primarily in U.S. equity securities, the Santa Barbara Funds and the Rittenhouse Growth Fund may invest up to 25% and 15%, respectively, of their net assets in dollar-denominated non-U.S. equity securities, including American Depositary Receipts (“ADRs”) and other types of depositary receipts.
Cash Equivalents and Short-Term Fixed-Income Securities
Normally, the funds will invest substantially all of their assets to meet their investment objectives. The funds may invest the remainder of their assets in securities with maturities of less than one year or cash equivalents or they may
Section 2 How We Manage Your Money
15
hold cash. The percentage of each fund invested in such holdings will vary and depends on several factors, including market conditions. For temporary defensive purposes, including during periods of high cash inflows, the funds may depart from their principal investment strategies and invest part or all of their assets in these securities or they may hold cash. During such periods, the funds may not be able to achieve their investment objectives. The funds may adopt a defensive strategy when their portfolio managers believe securities in which the funds normally invest have elevated risks due to political or economic factors and in other extraordinary circumstances.
Exchange Traded Funds
The funds may invest in the securities of registered investment companies that are exchange traded funds (“ETFs”) in excess of the limits imposed under the 1940 Act pursuant to exemptive orders obtained by certain ETFs and their sponsors from the Securities and Exchange Commission. An ETF is a fund that holds a portfolio of common stocks or bonds designed to track the performance of a securities index, including industry, sector, country and region indexes. ETFs trade on a securities exchange and their shares may, at times, trade at a premium or discount to their net asset value. An ETF may not replicate exactly the performance of the index it seeks to track for a number of reasons, including transaction costs incurred by the ETF. ETFs incur fees and expenses, such as operating expenses, licensing fees, trustee fees and marketing expenses, which are borne proportionately by ETF shareholders, such as the fund. The funds will also incur brokerage costs when purchasing and selling shares of ETFs.
Use of Derivatives and Hedging
The funds may use various investment techniques designed to hedge against changes in the values of securities the funds own or expect to purchase, to reduce transaction costs, to maintain full market exposure (which means to adjust the characteristics of their investments to more closely approximate those of the markets in which they invest), to manage cash flows, to enhance returns, to limit risk of price fluctuations, to limit exposure to losses due to changes to non-U.S. currency exchange rates or to preserve capital. The portfolio managers may use derivatives, such as futures contracts, options and swaps. These strategies may reduce fund returns and will benefit the funds largely to the extent that the funds are able to use them successfully. However, the funds could lose money on futures transactions or an option can expire worthless. The use of derivatives is not a principal investment strategy of the funds.
Delayed Delivery Transactions
The funds may buy or sell securities on a when-issued or delayed-delivery basis, paying for or taking delivery of the securities at a later date, normally within 15 to 45 days of the trade. These transactions involve an element of risk because the value of the security to be purchased may decline to a level below its purchase price before the settlement date.
Portfolio Holdings
A description of the funds’ policies and procedures with respect to the disclosure of the funds’ portfolio holdings is available in the funds’ Statement of Additional Information. Certain portfolio holdings information for the funds is available on the funds’ website—www.nuveen.com—by clicking the “Individual Investors—Mutual Funds” section of the home page and following the applicable link for your fund in the “Find A Fund” section. By following these links, you can obtain a list of your fund’s top ten holdings as of the end of the most recent month. A complete list of portfolio holdings information is
Section 2 How We Manage Your Money
16
generally made available on the funds’ website following the end of each month with an approximately one-month lag. This information will remain available on the funds’ website until the funds file with the Securities and Exchange Commission their annual, semiannual or quarterly holdings report for the fiscal period that includes the date(s) as of which the website information is current.

Santa Barbara Funds
SBAM believes that, over time, well-managed growth companies performance will be reflected through stock appreciation. As a result, SBAM’s investment focus centers on accurately assessing the longer-term prospects of a given business and industry. Starting with a universe of more than 5,000 companies, SBAM looks at a series of both quantitative and qualitative factors in a fundamental, bottom-up approach designed to narrow the list to a more manageable level before making final investment decisions.
For the Growth Fund and the Dividend Growth Fund, some of the factors that SBAM uses to identify potential investments include:
| | Ÿ | | Above average earnings growth over the long term |
| | Ÿ | | Consistent earnings growth over the long term |
| | Ÿ | | Earnings growth momentum |
| | Ÿ | | Proven management track records |
| | Ÿ | | Position as industry leader |
| | Ÿ | | Sustainable competitive advantage(s) |
For the Dividend Growth Fund, SBAM also looks for dividend-paying companies that distribute qualified dividend income, show attractive dividend growth rates and have a minimum market capitalization of $3 billion, which is a universe of approximately 1000 companies. Additional screens for the Dividend Growth Fund include:
| | Ÿ | | A positive assessment of management’s commitment to pay cash dividends |
| | Ÿ | | Fundamentals which support growth of a company’s dividends |
For the Growth Opportunities Fund, some of the factors that SBAM uses to identify potential investments include:
| | Ÿ | | Stable, sustainable earnings growth at a reasonable price |
| | Ÿ | | New management creating opportunities |
| | Ÿ | | A near-term catalyst that will fix under-performing businesses |
| | Ÿ | | “Fallen angels” on the verge of a turn-around |
| | Ÿ | | Moderate projected growth rates at compelling valuations |
| | Ÿ | | Potential for the company to be acquired at a premium to current prices |
Companies that pass SBAM’s quantitative and qualitative reviews then are subjected to price risk analysis and a macroeconomic review to judge the likelihood that a company will be able to continue the success it has experienced in the past. In particular, the research is focused on evaluating a company’s competitive advantage and the steps its management has taken to defend its margins and markets.
Section 2 How We Manage Your Money
17
This analysis results in an investment universe of approximately 30 to 50 companies for the Dividend Growth Fund, 40 to 50 companies for the Growth Fund and 40 to 60 companies for the Growth Opportunities Fund.
Rittenhouse Growth Fund
The Rittenhouse Growth Fund will ordinarily invest at least 65% of its net assets in the equity securities of high quality companies. High quality companies are generally characterized by their substantial capitalization, established history of earnings and dividends, ready access to credit, industry leadership position and superior management.
Quality Growth Investing
From the universe of all stocks traded in the U.S. securities markets, Rittenhouse first identifies companies with an aggregate market capitalization of at least $5 billion under current market conditions. Also, it then selects companies that meet at least one of the following criteria 1) earnings quality rating of “A-” or better by Standard & Poor’s; 2) financial strength rating of “A-” or better from Value Line; or 3) high quality companies identified by the Rittenhouse Quality Model, a proprietary multi-factor model designed to monitor the quality of individual companies. Rittenhouse believes this constitutes an attractive investment universe from which to select individual securities for purchase using thorough fundamental research. Rittenhouse uses fundamental research supplemented by quantitative analysis in the security selection and portfolio construction processes. Using a long-term perspective and a disciplined investment process, Rittenhouse seeks to invest in 50-80 stocks where growth potential exceeds market expectations.
Certain of the Rittenhouse Growth Fund’s investment policies may result in reduced taxable distributions and enhanced after-tax returns. Because it tends to invest in stocks with lower dividend yields, the fund expects to distribute little, if any, taxable dividend income. The fund seeks to reduce realized short-term and long-term capital gains as a result of its relatively low portfolio turnover rate and generally long investment holding periods. When selling portfolio securities, Rittenhouse will generally seek to minimize the gains realized by the fund by taking into account the tax implications associated with selling specific securities.
Portfolio Turnover
Each fund buys and sells portfolio securities in the normal course of its investment activities. The proportion of a fund’s investment portfolio that is sold and replaced during a year is known as the fund’s portfolio turnover rate. The portfolio turnover rate of the Dividend Growth Fund is expected to be between 15% and 40%. The portfolio turnover rate of the Growth Fund is expected to be between 15% and 35%. The portfolio turnover rate of the Growth Opportunities Fund is expected to be between 70% and 100%. The portfolio turnover rate of the Rittenhouse Growth Fund is expected to be between 40% and 100%. A turnover rate of 100% would occur, for example, if a fund sold and replaced securities valued at 100% of its net assets within one year. Active trading would result in the payment by the fund of increased brokerage costs and could result in the payment by shareholders of increased taxes on realized investment gains or may result in shareholders being exposed to additional short-term capital gains that are subject to taxation at higher tax rates than those of long-term capital gains. Accordingly, active trading may adversely affect the funds’ performance.
Section 2 How We Manage Your Money
18

Risk is inherent in all investing. Investing in a mutual fund—even the most conservative—involves risk, including the risk that you may receive little or no return on your investment or even that you may lose part or all of your investment. In addition, the funds’ investment styles may not be successful in realizing the funds’ investment objectives. Therefore, before investing you should consider carefully the following risks that you assume when you invest in these funds. Because of these and other risks, you should consider an investment in these funds to be a long-term investment.
Equity market risk: Equity market risk is the risk that the market values of the equity securities owned by a fund will fall in value. The value of your investment in a fund will go up and down with the prices of the securities in which the fund invests. The prices of stocks change in response to many factors, including the historical and prospective earnings of the issuer, the value of its assets, management decisions, decreased demand for an issuer’s products or services, increased production costs, general economic conditions, interest rates, currency exchange rates, investor perceptions and market liquidity.
Non-U.S. investment risk: Securities of non-U.S. issuers present risks beyond those of U.S. securities. The prices of non-U.S. securities can be more volatile than U.S. securities due to such factors as political, social and economic developments abroad, the differences between the regulations to which U.S. and non-U.S. issuers and markets are subject, the seizure by the government of company assets, taxation, withholding taxes on dividends and interest and limitations on the use or transfer of portfolio assets. Other risks include the following:
| | Ÿ | | Enforcing legal rights may be difficult, costly and slow in non-U.S. countries, and there may be special problems enforcing claims against non-U.S. governments. |
| | Ÿ | | Non-U.S. companies may not be subject to accounting standards or governmental supervision comparable to U.S. companies, and there may be less public information about their operations. |
| | Ÿ | | Non-U.S. markets may be less liquid and more volatile than U.S. markets. |
To the extent the funds invest in securities issued by entities located in emerging markets, the funds may be exposed to additional risk. These markets are generally more volatile than those of countries with more mature economies.
Currency risk: Non-U.S. securities often trade in currencies other than the U.S. dollar. Changes in currency exchange rates may affect a fund’s net asset value, the value of dividends and interest earned, and gains and losses realized on the sale of securities. An increase in the strength of the U.S. dollar relative to these other currencies may cause the value of a fund to decline. Certain non-U.S. currencies may be particularly volatile, and non-U.S. governments may intervene in the currency markets, causing a decline in value or liquidity in a fund’s non-U.S. holdings whose value is tied to the affected non-U.S. currency. ADRs and non-U.S. securities denominated in U.S. dollars are also subject to currency risk.
Correlation risk: The U.S. and non-U.S. equity markets often rise and fall at different times or by different amounts due to economic or other developments particular to a given country or region. This phenomenon would tend to lower the overall price volatility of a portfolio that included both U.S. and non-U.S. stocks. Sometimes, however, global trends will cause the U.S.
Section 2 How We Manage Your Money
19
and non-U.S. markets to move in the same direction, reducing or eliminating the risk reduction benefit of international investing.
Small and medium-sized company risk: The Dividend Growth Fund and the Growth Fund may invest a portion of their assets in medium-sized companies. The Growth Opportunities Fund will invest in equity securities of small and medium-sized companies. Companies with lower market capitalizations may involve greater risk than larger capitalization companies because they tend to have younger and more limited product lines, markets and financial resources and may be dependent on a smaller management group than larger, more established companies. In addition, the securities of such companies are typically more volatile and less liquid than securities of larger capitalization companies. As a result, certain securities may be difficult or impossible to sell at the time and the price that a fund would like, and so a fund may have to lower the price, sell other securities instead or forego an investment opportunity. Any of these could have a negative effect on fund management or performance.
Small fund risk: Because the Santa Barbara Funds are relatively small, large inflows may cause a fund to temporarily invest a substantial portion of its investment portfolio in cash equivalents, causing the fund’s performance to vary from the fund’s model portfolio. This impact may be positive or negative, depending on the direction of market movement during the period the fund is in cash equivalents. The funds do not limit large inflows, but they have policies in place to reduce the impact of these inflows where Nuveen has prior knowledge of such inflows.
Derivatives risk: The use of derivatives can lead to losses because of diverse movements in the price or value of the underlying asset, index or rate, which may be magnified by certain features of the derivatives. These risks are heightened when a fund uses derivatives to enhance a fund’s return or as a substitute for a position or security, rather than solely to hedge (or offset) the risk of a position or security held by a fund.
Preferred security risk: For the Dividend Growth Fund, there are special risks associated with investing in preferred securities:
Limited voting rights. Generally, preferred security holders (such as the fund) have no voting rights with respect to the issuing company unless preferred dividends have been in arrears for a specified number of periods, at which time the preferred security holders may elect a number of directors to the issuer’s board. Generally, once all the arrearages have been paid, the preferred security holders no longer have voting rights.
In the case of certain preferred securities, holders generally have no voting rights, except (i) if the issuer fails to pay dividends for a specified period of time or (ii) if a declaration of default occurs and is continuing. In such an event, rights of preferred security holders generally would include the right to appoint and authorize a trustee to enforce the trust or special purpose entity’s rights as a creditor under the agreement with its operating company.
Special redemption rights. In certain varying circumstances, an issuer of preferred securities may redeem the securities prior to a specified date. For instance, for certain types of preferred securities, a redemption may be triggered by a change in federal income tax or securities laws. As with call provisions, a redemption by the issuer may negatively impact the return of the security held by the fund.
Section 2 How We Manage Your Money
20
Interest rate risk. Generally, the market values of preferred securities tend to decline as interest rates increase and, conversely, to increase as interest rates decline. Falling market interest rates can adversely affect the fund’s income when the fund invests the new proceeds at market interest rates that are below the portfolio’s current earnings rate.
Credit risk. An issuer of preferred securities may be unable to meet its obligation to make dividend and principal payments when due as a result of changing financial or market conditions. Preferred securities are subordinated to bonds and other debt instruments in a company’s capital structure and therefore will be subject to greater credit risk than those debt instruments.
Section 2 How We Manage Your Money
21
Section 3 How You Can Buy and Sell Shares
The funds offer multiple classes of shares, each with a different combination of sales charges, fees, eligibility requirements and other features. Your financial advisor can help you determine which class is best for you. For further details, please see the Statement of Additional Information.

Class A Shares
You can buy Class A shares at the offering price, which is the net asset value per share plus an up-front sales charge. You may qualify for a reduced sales charge, or the sales charge may be waived, as described in “How to Reduce Your Sales Charge.” Class A shares are also subject to an annual service fee of 0.25% of your fund’s average daily net assets, which compensates your financial advisor and other entities for providing ongoing service to you. Nuveen Investments, LLC (“Nuveen”), a wholly-owned subsidiary of Nuveen Investments and the distributor of the funds, retains the up-front sales charge and the service fee on accounts with no financial intermediary of record. The up-front Class A sales charges for the funds are as follows:
| | | | | | | | | |
| Amount of Purchase | | Sales Charge as % of
Public Offering Price | | | Sales Charge as % of
Net Amount Invested | | | Maximum
Financial Intermediary
Commission as % of
Public Offering Price | |
Less than $50,000 | | 5.75 | % | | 6.10 | % | | 5.00 | % |
| |
$50,000 but less than $100,000 | | 4.50 | | | 4.71 | | | 4.00 | |
| |
$100,000 but less than $250,000 | | 3.75 | | | 3.90 | | | 3.25 | |
| |
$250,000 but less than $500,000 | | 2.75 | | | 2.83 | | | 2.50 | |
| |
$500,000 but less than $1,000,000 | | 2.00 | | | 2.04 | | | 1.75 | |
| |
$1,000,000 and over* | | — | | | — | | | 1.00 | |
| |
| | * | | You can buy $1 million or more of Class A shares at net asset value without an up-front sales charge. Nuveen pays financial intermediaries of record a commission equal to 1% of the first $2.5 million, plus 0.50% of the next $2.5 million, plus 0.25% of the amount over $5 million. Unless the financial intermediary waived the commission, you may be assessed a contingent deferred sales charge (“CDSC”) of 1% if you redeem any of your shares within 12 months of purchase. The CDSC is calculated on the lower of your purchase price or your redemption proceeds. You do not pay a CDSC on any Class A shares you purchase by reinvesting dividends. |
Class B Shares
Class B shares are not available for new accounts or for additional investment into existing accounts. However, the funds will issue Class B shares upon the exchange of Class B shares from another Nuveen Mutual Fund or for purposes of dividend reinvestment. Class B shares will also be available through December 31, 2008 for defined contribution plans and investors using automatic investment plans with existing investments in Class B shares as of March 31, 2008.
Eligible investors can buy Class B shares at the offering price, which is the net asset value per share without any up-front sales charge. Class B shares are subject to annual distribution and service fees of 1% of your fund’s average daily net assets. The annual 0.25% service fee compensates your financial
Section 3 How You Can Buy and Sell Shares
22
advisor for providing ongoing service to you. The annual 0.75% distribution fee compensates Nuveen for paying your financial advisor a 4% up-front sales commission, which includes an advance of the first year’s service fee. Nuveen retains the service and distribution fees on accounts with no financial intermediary of record. If you redeem your shares within six years of purchase, you will normally pay a CDSC as shown in the schedule below. The CDSC is based on your purchase price or redemption proceeds, whichever is lower. You do not pay a CDSC on any Class B shares you purchase by reinvesting dividends.
| | | | | | | | | | | | | | | | | | | | |
Years Since Purchase | | 0-1 | | | 1-2 | | | 2-3 | | | 3-4 | | | 4-5 | | | 5-6 | | | Over 6 |
CDSC | | 5 | % | | 4 | % | | 4 | % | | 3 | % | | 2 | % | | 1 | % | | None |
|
Class B shares automatically convert to Class A shares eight years after you buy them so that the distribution fees you pay over the life of your investment are limited. You will continue to pay an annual service fee on any converted Class B shares.
The funds have established a limit to the amount of Class B shares that may be purchased by an individual investor. See the Statement of Additional Information for more information.
Class C Shares
You can buy Class C shares at the offering price, which is the net asset value per share without any up-front sales charge. Class C shares are subject to annual distribution and service fees of 1% of your fund’s average daily net assets. The annual 0.25% service fee compensates your financial advisor for providing ongoing service to you. The annual 0.75% distribution fee compensates Nuveen for paying your financial advisor an ongoing sales commission as well as an advance of the first year’s service and distribution fees. Nuveen retains the service and distribution fees on accounts with no financial intermediary of record. If you redeem your shares within 12 months of purchase, you will normally pay a 1% CDSC, which is calculated on the lower of your purchase price or your redemption proceeds. You do not pay a CDSC on any Class C shares you purchase by reinvesting dividends. Class C shares do not convert.
The funds have established a limit to the amount of Class C shares that may be purchased by an individual investor. See the Statement of Additional Information for more information.
Class R3 Shares
The Dividend Growth Fund, Growth Fund and Growth Opportunities Fund expect to offer Class R3 shares beginning on or about March 30, 2009. Class R3 shares are available for purchase at the offering price, which is the net asset value per share without any up-front sales charge, to certain retirement plan clients. Class R3 shares are subject to annual distribution and service fees of 0.50% of your fund’s average daily net assets. Class R3 shares are only available for purchase by certain retirement plans that have an agreement with Nuveen to utilize Class R3 shares in certain investment products or programs. Class R3 shares are not available to traditional and Roth IRAs, Coverdell Education Savings Accounts, SEPs, SAR-SEPs, SIMPLE IRAs, or individual 403(b) plans. See the Statement of Additional Information for more information.
Class I Shares
Class R shares were renamed Class I shares effective May 1, 2008. You may purchase Class I shares only under limited circumstances, at the offering price, which is the net asset value per share without any up-front sales charge. Class I shares are not subject to sales charges or ongoing service or distribution fees. Class I shares have lower ongoing expenses than the other classes.
Section 3 How You Can Buy and Sell Shares
23
Class I shares are available for (i) purchases of $1 million or more, (ii) purchases using dividends and capital gains distributions on Class I shares, and (iii) purchase by the following categories of investors:
| | Ÿ | | Certain trustees, directors, employees and affiliates of Nuveen. |
| | Ÿ | | Certain financial intermediary personnel. |
| | Ÿ | | Certain bank or broker-affiliated trust departments. |
| | Ÿ | | Certain employer-sponsored retirement plans. |
| | Ÿ | | Certain additional categories of investors, including certain advisory accounts of Nuveen and its affiliates, and qualifying clients of investment advisers, financial planners, or other financial intermediaries that charge periodic or asset-based fees for their services. |
Please refer to the Statement of Additional Information for more information about Class A, Class B, Class C, Class R3 and Class I shares, including more detailed program descriptions and eligibility requirements. The Statement of Additional Information is available free of charge by calling (800) 257-8787 or by visiting Nuveen’s website at www.nuveen.com/MF/resources/eReports.aspx, where you will also find the information included in this prospectus. Additional information is also available from your financial advisor, who can also help you prepare any necessary application forms.

The funds offer a number of ways to reduce or eliminate the up-front sales charge on Class A shares. See “What Share Classes We Offer” (above) for a discussion of eligibility requirements for purchasing Class R3 and Class I shares.
Class A Sales Charge Reductions
| | Ÿ | | Rights of Accumulation. In calculating the appropriate sales charge on a purchase of Class A shares of a fund, you may be able to add the amount of your purchase to the value that day of all of your prior purchases of any Nuveen Mutual Fund. |
| | Ÿ | | Letter of Intent. Subject to certain requirements, you may purchase Class A shares of a fund at the sales charge rate applicable to the total amount of the purchases you intend to make over a 13-month period. |
For purposes of calculating the appropriate sales charge as described under Rights of Accumulation and Letter of Intent above, you may include purchases by (i) you, (ii) your spouse (or equivalent if recognized under local law) and children under 21 years of age, and (iii) a corporation, partnership or sole proprietorship that is 100% owned by any of the persons in (i) or (ii). In addition, a trustee or other fiduciary can count all shares purchased for a single trust, estate or other single fiduciary account that has multiple accounts (including one or more employee benefit plans of the same employer).
Class A Sales Charge Waivers
Class A shares of a fund may be purchased at net asset value without a sales charge as follows:
| | Ÿ | | Purchases of $1,000,000 or more. |
| | Ÿ | | Monies representing reinvestment of Nuveen Defined Portfolios and Nuveen Mutual Fund distributions. |
| | Ÿ | | Certain employer-sponsored retirement plans. |
Section 3 How You Can Buy and Sell Shares
24
| | Ÿ | | Certain employees and affiliates of Nuveen. Purchases by any officers, trustees and former trustees of the Nuveen Funds, as well as bona fide full-time and retired employees of Nuveen, and subsidiaries thereof, and such employees’ immediate family members (as defined in the Statement of Additional Information). |
| | Ÿ | | Financial intermediary personnel. Purchases by any person who, for at least the last 90 days, has been an officer, director, or bona fide employee of any financial intermediary or any such person’s immediate family member. |
| | Ÿ | | Certain trust departments. Purchases by bank or broker-affiliated trust departments investing funds over which they exercise exclusive discretionary investment authority and that are held in a fiduciary, agency, advisory, custodial, or similar capacity. |
| | Ÿ | | Additional categories of investors. Purchases made by: (i) investors purchasing on a periodic fee, asset-based fee, or no transaction fee basis through a broker-dealer sponsored mutual fund purchase program; and (ii) clients of investment advisers, financial planners, or other financial intermediaries that charge periodic or asset-based fees for their services. |
In order to obtain a sales charge reduction or waiver, it may be necessary at the time of purchase for you to inform the funds or your financial advisor of the existence of other accounts in which there are holdings eligible to be aggregated for such purposes. You may need to provide the funds or your financial advisor information or records, such as account statements, in order to verify your eligibility for a sales charge reduction or waiver. This may include account statements of family members and information regarding Nuveen Mutual Fund shares held in accounts with other financial advisors. You or your financial advisor must notify Nuveen at the time of each purchase if you are eligible for any of these programs. The funds may modify or discontinue these programs at any time.

Fund shares may be purchased on any business day, which is any day the New York Stock Exchange (the “NYSE”) is open for business and normally ends at 4:00 p.m. New York time. Generally, the NYSE is closed on weekends and national holidays. The share price you pay depends on when Nuveen receives your order. Orders received before the close of trading on a business day will receive that day’s closing share price; otherwise, you will receive the next business day’s price.
Through a Financial Advisor
You may buy shares through your financial advisor, who can handle all the details for you, including opening a new account. Financial advisors can also help you review your financial needs and formulate long-term investment goals and objectives. In addition, financial advisors generally can help you develop a customized financial plan, select investments and monitor and review your portfolio on an ongoing basis to help assure your investments continue to meet your needs as circumstances change. Financial advisors (including brokers or agents) are paid for providing ongoing investment advice and services, either from fund sales charges and fees or by charging you a separate fee in lieu of a sales charge. If you do not have a financial advisor, call (800) 257-8787 and Nuveen can refer you to one in your area.
Section 3 How You Can Buy and Sell Shares
25
Financial advisors or other dealer firms may charge their customers a processing or service fee in connection with the purchase or redemption of fund shares. The amount and applicability of such a fee is determined and disclosed to customers by each individual dealer. Processing or service fees typically are fixed, nominal dollar amounts and are in addition to the sales and other charges described in this prospectus and the Statement of Additional Information. Your dealer will provide you with specific information about any processing or service fees you will be charged.
By Mail
You may open an account and buy shares by mail by completing an application and mailing it along with your check to: Nuveen Investor Services, P.O. Box 8530, Boston, Massachusetts 02266-8530. Applications may be obtained at www.nuveen.com or by calling (800) 257-8787. No third party checks will be accepted.
On-Line
Existing shareholders may process certain account transactions on-line. You may purchase additional shares or exchange shares between existing, identically registered accounts. You can continue to look up your account balance, history and dividend information, as well as order duplicate account statements and tax forms from the funds’ website. To access your account, follow the links under “Individual Investors” on www.nuveen.com to “Account Access” and choose “Mutual Funds.” The system will walk you through the log-in process. To purchase shares on-line, you must have established Fund DirectSM privileges on your account prior to the requested transaction.
By Telephone
Existing shareholders may also process these same mutual fund transactions via our automated information line. Simply call (800) 257-8787, press 1 for mutual funds and the voice menu will walk you through the process. To purchase shares via the telephone, you must have established Fund DirectSM privileges on your account prior to the requested transaction.
Investment Minimums
The minimum initial investment is $3,000 ($1,000 for a Traditional/Roth IRA account; $500 for an Education IRA account; $50 through systematic investment plan accounts) and is lower for accounts opened through certain fee-based programs as described in the Statement of Additional Information. Subsequent investments must be in amounts of $50 or more. The funds reserve the right to reject purchase orders and to waive or increase the minimum investment requirements. There is no minimum investment amount for the purchase of Class R3 shares.

To help make your investing with us easy and efficient, we offer you the following services at no extra cost. Your financial advisor can help you complete the forms for these services, or you can call Nuveen at (800) 257-8787 for copies of the necessary forms.
Systematic Investing
Systematic investing allows you to make regular investments through automatic deductions from your bank account, directly from your paycheck or from exchanging shares from another mutual fund account (simply complete the appropriate application). The minimum automatic deduction is $50 per month. There is no charge to participate in each fund’s systematic investment plan. You can stop the deductions at any time by notifying your fund in writing.
Section 3 How You Can Buy and Sell Shares
26
| | Ÿ | | From Your Bank Account. You can make systematic investments of $50 or more per month by authorizing us to draw preauthorized checks on your bank account. |
| | Ÿ | | From Your Paycheck. With your employer’s consent, you can make systematic investments of $25 or more per pay period (meeting the monthly minimum of $50) by authorizing your employer to deduct monies from your paycheck. |
| | Ÿ | | Systematic Exchanging. You can make systematic investments by authorizing Nuveen to exchange shares from one Nuveen Mutual Fund account into another identically registered Nuveen account of the same share class. |
Systematic Withdrawal
If the value of your fund account is at least $10,000, you may request to have $50 or more withdrawn automatically from your account. You may elect to receive payments monthly, quarterly, semi-annually or annually, and may choose to receive a check, have the monies transferred directly into your bank account (see “Fund DirectSM”), paid to a third party or sent payable to you at an address other than your address of record.
You should not establish systematic withdrawals if you intend to make concurrent purchases of Class A, B or C shares because you may unnecessarily pay a sales charge or CDSC on these purchases.
Exchanging Shares
You may exchange fund shares into an identically registered account for the same class of another Nuveen Mutual Fund available in your state. Your exchange must meet the minimum purchase requirements of the fund into which you are exchanging. You may also, under certain limited circumstances, exchange between certain classes of shares of the same fund, subject to the payment of any applicable CDSC. Please consult the Statement of Additional Information for details.
The funds may change or cancel their exchange policy at any time upon 60 days’ notice. Each fund reserves the right to revise or suspend the exchange privilege, limit the amount or number of exchanges, or reject any exchange. See “General Information—Frequent Trading” below. Because an exchange between funds is treated for tax purposes as a purchase and sale, any gain may be subject to tax. An exchange between classes of shares of the same fund is not considered a taxable event. You should consult your tax advisor about the tax consequences of exchanging your shares.
Fund DirectSM
The Fund DirectSM Program allows you to link your fund account to your bank account, transfer money electronically between these accounts and perform a variety of account transactions, including purchasing shares by telephone and investing through a systematic investment plan. You may also have dividends, distributions, redemption payments or systematic withdrawal plan payments sent directly to your bank account.
Reinstatement Privilege
If you redeem fund shares, you may reinvest all or part of your redemption proceeds up to one year later without incurring any additional charges. You may only reinvest into the same share class you redeemed. If you paid a CDSC, we will refund your CDSC and reinstate your holding period. You may use this reinstatement privilege only once for any redemption. The reinstatement privilege for Class B shares will no longer be available as of December 31, 2008.
Section 3 How You Can Buy and Sell Shares
27
An Important Note About Telephone Transactions
Although Nuveen Investor Services has certain safeguards and procedures to confirm the identity of callers, it will not be liable for losses resulting from following telephone instructions it reasonably believes to be genuine. Also, you should verify your trade confirmations immediately upon receipt.

You may sell (redeem) your shares on any business day. You will receive the share price next determined after the fund has received your properly completed redemption request. Your redemption request must be received before the close of trading for you to receive that day’s price. If you are selling shares purchased recently with a check, you will not receive your redemption proceeds until your check has cleared. This may take up to ten days from your purchase date. You may be assessed a CDSC, if applicable. When you redeem Class A, Class B, or Class C shares subject to a CDSC, each fund will first redeem any shares that are not subject to a CDSC, and then redeem the shares you have owned for the longest period of time, unless you ask the fund to redeem your shares in a different order. No CDSC is imposed on shares you buy through the reinvestment of dividends and capital gains. The holding period is calculated on a monthly basis and begins the first day of the month in which the order for investment is received. When you redeem shares subject to a CDSC, the CDSC is calculated on the lower of your purchase price or redemption proceeds, deducted from your redemption proceeds, and paid to Nuveen. The CDSC may be waived under certain special circumstances as described in the Statement of Additional Information.
Through Your Financial Advisor
You may sell your shares through your financial advisor, who can prepare the necessary documentation. Your financial advisor may charge for this service.
By Telephone
If you have authorized telephone redemption privileges, call (800) 257-8787 to redeem your shares, press 1 for mutual funds and the voice menu will walk you through the process. Telephone redemptions are not available for shares owned in certificate form and, with respect to redemptions where the proceeds are payable by check, may not exceed $50,000. Checks will only be issued to you as the shareholder of record and mailed to your address of record. If you have established Fund DirectSM privileges, you may have redemption proceeds transferred electronically to your bank account. We will normally mail your check the next business day.
By Mail
You can sell your shares at any time by sending a written request to the appropriate fund, c/o Nuveen Investor Services, P.O. Box 8530, Boston, Massachusetts 02266-8530. Your request must include the following information:
| | Ÿ | | Your name and account number; |
| | Ÿ | | The dollar or share amount you wish to redeem; |
| | Ÿ | | The signature of each owner exactly as it appears on the account; |
| | Ÿ | | The name of the person to whom you want your redemption proceeds paid (if other than to the shareholder of record); |
| | Ÿ | | The address where you want your redemption proceeds sent (if other than the address of record); and |
| | Ÿ | | Any required signature guarantees. |
Section 3 How You Can Buy and Sell Shares
28
An Important Note About Involuntary Redemption
From time to time, the funds may establish minimum account size requirements. The funds reserve the right to liquidate your account upon 30 days’ written notice if the value of your account falls below an established minimum. The funds have set a minimum balance of $1,000 unless you have an active Nuveen Defined Portfolio reinvestment account. You will not be assessed a CDSC on an involuntary redemption.
We will normally mail your check the next business day, but in no event more than seven days after we receive your request. If you purchased your shares by check, your redemption proceeds will not be mailed until your check has cleared. Guaranteed signatures are required if you are redeeming more than $50,000, you want the check payable to someone other than the shareholder of record or you want the check sent to another address (or the address of record has been changed within the last 30 days). Signature guarantees must be obtained from a bank, brokerage firm or other financial intermediary that is a member of an approved Medallion Guarantee Program or that a fund otherwise approves. A notary public cannot provide a signature guarantee.
On-Line
You may redeem shares or exchange shares between existing, identically registered accounts on-line. To access your account, follow the links under “Individual Investors” on www.nuveen.com to “Account Access” and choose “Mutual Funds.” The system will walk you through the log-in process. On-line redemptions are not available for shares owned in certificate form and, with respect to redemptions where the proceeds are payable by check, may not exceed $50,000. Checks will only be issued to you as the shareholder of record and mailed to your address of record. If you have established Fund DirectSM privileges, you may have redemption proceeds transferred electronically to your bank account.
Redemptions In-Kind
The funds generally pay redemption proceeds in cash. Under unusual conditions that make cash payment unwise and for the protection of existing shareholders, the funds may pay all or a portion of your redemption proceeds in securities or other fund assets. Although it is unlikely that your shares would be redeemed in-kind, you would probably have to pay brokerage costs to sell the securities distributed to you, as well as taxes on any capital gains from that sale.
Section 3 How You Can Buy and Sell Shares
29
Section 4 General Information
To help you understand the tax implications of investing in the funds, this section includes important details about how the funds make distributions to shareholders. We discuss some other fund policies as well.

The Dividend Growth Fund intends to pay income dividends on a quarterly basis and any taxable gains annually. The other funds intend to pay income dividends and any taxable gains annually.
Payment and Reinvestment Options
The funds automatically reinvest your dividends in additional fund shares unless you request otherwise. You may request to have your dividends paid to you by check, deposited directly into your bank account, paid to a third party, sent to an address other than your address of record or reinvested in shares of another Nuveen Mutual Fund. For further information, contact your financial advisor or call Nuveen at (800) 257-8787.
Non-U.S. Income Tax Considerations
Investment income that the funds receive from their non-U.S. investments may be subject to non-U.S. income taxes, which generally will reduce fund distributions. However, the United States has entered into tax treaties with many non-U.S. countries that may entitle you to certain tax benefits.
Taxes and Tax Reporting
The funds will make distributions that may be taxed as ordinary income (which may be taxable at different rates, depending on the sources of the distributions) or capital gains (which may be taxable at different rates, depending on the length of time a fund holds its assets). Dividends from a fund’s long-term capital gains are generally taxable as long-term capital gains, while dividends from short-term capital gains and net investment income are generally taxable as ordinary income. However, certain ordinary income distributions received from a fund that are determined to be qualified dividend income may be taxed at tax rates equal to those applicable to long-term capital gains. The tax you pay on a given capital gains distribution depends generally on how long the fund has held the portfolio securities it sold. It does not depend on how long you have owned your fund shares. Dividends generally do not qualify for a dividends received deduction if you are a corporate shareholder.
Early in each year, you will receive a statement detailing the amount and nature of all dividends and capital gains that you were paid during the prior year. If you hold your investment at the firm where you purchased your fund shares, you will receive the statement from that firm. If you hold your shares directly with the fund, Nuveen will send you the statement. The tax status of your dividends is the same whether you reinvest your dividends or elect to receive them in cash. The sale of shares in your account may produce a gain or loss, and is a taxable event. For tax purposes, an exchange of shares between funds is generally the same as a sale.
Please note that if you do not furnish your fund with your correct Social Security number or employer identification number, federal law requires the fund to withhold federal income tax from your distributions and redemption proceeds at the then current rate.
Section 4 General Information
30
Please consult the Statement of Additional Information and your tax advisor for more information about taxes.
Buying or Selling Shares Close to a Record Date
Buying fund shares shortly before the record date for a taxable dividend is commonly known as “buying the dividend.” The entire dividend may be taxable to you even though a portion of the dividend effectively represents a return of your purchase price.

Nuveen serves as the selling agent and distributor of the funds’ shares. In this capacity, Nuveen manages the offering of the funds’ shares and is responsible for all sales and promotional activities. In order to reimburse Nuveen for its costs in connection with these activities, including compensation paid to financial intermediaries, each fund has adopted a distribution and service plan under Rule 12b-1 under the 1940 Act. See “How You Can Buy and Sell Shares—What Share Classes We Offer” for a description of the distribution and service fees paid under this plan.
Nuveen receives the distribution fee for Class B, C and R3 shares primarily for providing compensation to financial intermediaries, including Nuveen, in connection with the distribution of shares. Nuveen uses the service fee for Class A, B, C and R3 shares to compensate financial intermediaries, including Nuveen, for providing ongoing account services to shareholders. These services may include establishing and maintaining shareholder accounts, answering shareholder inquiries, and providing other personal services to shareholders. These fees also compensate Nuveen for other expenses, including printing and distributing prospectuses to persons other than shareholders, and preparing, printing and distributing advertising and sales literature and reports to shareholders used in connection with the sale of shares. Because these fees are paid out of a fund’s assets on an ongoing basis, over time these fees will increase the cost of your investment and may cost you more than paying other types of sales charges.
Other Payments to Financial Intermediaries
In addition to the sales commissions and certain payments related to 12b-1 distribution and service fees paid by Nuveen to financial intermediaries as previously described, Nuveen may from time to time make additional payments, out of its own resources, to certain financial intermediaries that sell shares of Nuveen Mutual Funds in order to promote the sales and retention of fund shares by those firms and their customers. The amounts of these payments vary by financial intermediary and, with respect to a given firm, are typically calculated by reference to the amount of the firm’s recent gross sales of Nuveen Mutual Fund shares and/or total assets of Nuveen Mutual Funds held by the firm’s customers. The level of payments that Nuveen is willing to provide to a particular financial intermediary may be affected by, among other factors, the firm’s total assets held in and recent net investments into Nuveen Mutual Funds, the firm’s level of participation in Nuveen Mutual Fund sales and marketing programs, the firm’s compensation program for its registered representatives who sell fund shares and provide services to fund shareholders, and the asset class of the Nuveen Mutual Funds for which these payments are provided. For 2007, these payments in the aggregate were approximately 0.025% to 0.035% of the assets in the Nuveen Mutual Funds, although payments to particular financial intermediaries can be significantly higher. The Statement of Additional Information contains additional information about these payments, including the names of the firms to which
Section 4 General Information
31
payments are made. Nuveen may also make payments to financial intermediaries in connection with sales meetings, due diligence meetings, prospecting seminars and other meetings at which Nuveen promotes its products and services.
In connection with the availability of Nuveen Mutual Funds within selected mutual fund no-transaction fee institutional platforms and fee-based wrap programs (together, “Platform Programs”) at certain financial intermediaries, Nuveen also makes payments out of its own assets to those firms as compensation for certain recordkeeping, shareholder communications and other account administration services provided to Nuveen Mutual Fund shareholders who own their fund shares in these Platform Programs. These payments are in addition to the 12b-1 service fee and any applicable omnibus sub-accounting fees paid to these firms with respect to these services by the Nuveen Mutual Funds out of fund assets.

The price you pay for your shares is based on each fund’s net asset value per share, which is determined as of the close of trading (normally 4:00 p.m. New York time) on each day the NYSE is open for business. Net asset value is calculated for each class of each fund by taking the value of the class’ total assets, including interest or dividends accrued but not yet collected, less all liabilities, and dividing by the total number of shares outstanding. The result, rounded to the nearest cent, is the net asset value per share. All valuations are subject to review by the funds’ Board of Trustees or its delegate.
In determining net asset value, expenses are accrued and applied daily, and securities and other assets for which market quotations are available are valued at market value. Common stocks and other equity securities are generally valued at the last sales price that day. However, securities admitted to trade on the NASDAQ National Market are valued, except as indicated below, at the NASDAQ Official Closing Price. Common stocks and other equity securities not listed on a securities exchange or the NASDAQ National Market are valued at the mean between the bid and asked prices. The prices of fixed-income securities are provided by a pricing service and based on the mean between the bid and asked prices. When price quotes are not readily available, the pricing service establishes fair value based on various factors, including prices of comparable securities.
Certain securities may not be able to be priced by pre-established pricing methods. Such securities may be valued by the Board of Trustees or its delegate at fair value. These securities generally include but are not limited to, restricted securities (securities that may not be publicly sold without registration under the Securities Act of 1933, as amended) for which a pricing service is unable to provide a market price; securities whose trading has been formally suspended; debt securities that have gone into default and for which there is no current market quotation; a security whose market price is not available from a pre-established pricing source; a security with respect to which an event has occurred that is likely to materially affect the value of the security after the market has closed but before the calculation of fund net asset value or make it difficult or impossible to obtain a reliable market quotation; and, a security whose price, as provided by the pricing service, does not reflect the security’s “fair value.” As a general principle, the “fair value” of a security is the amount that the owner might reasonably expect to receive for it upon its current sale. A variety of factors may be considered in determining the fair value of securities. In particular, for non-U.S.-traded securities whose
Section 4 General Information
32
principal local markets close before the time as of which the funds’ shares are priced, the funds on certain days may adjust the local closing price based upon such factors (which may be evaluated by an outside pricing service) as developments in non-U.S. markets, the performance of U.S. securities markets, and the performance of instruments trading in U.S. markets that represent non-U.S. securities. See the Statement of Additional Information for details.
If a fund holds securities that are primarily listed on non-U.S. exchanges, the net asset value of the fund’s shares may change on days when shareholders will not be able to purchase or redeem the fund’s shares.

The funds are intended for long-term investment and should not be used for excessive trading. Excessive trading in the funds’ shares can disrupt portfolio management, lead to higher operating costs, and cause other operating inefficiencies for the funds. However, the funds are also mindful that shareholders may have valid reasons for periodically purchasing and redeeming fund shares.
Accordingly, the funds have adopted a Frequent Trading Policy that seeks to balance the funds’ need to prevent excessive trading in fund shares while offering investors the flexibility in managing their financial affairs to make periodic purchases and redemptions of fund shares.
The funds’ Frequent Trading Policy generally limits an investor to four “round trip” trades in a 12-month period. A “round trip” is the purchase and subsequent redemption of fund shares, including by exchange. Each side of a round trip may be comprised of either a single transaction or a series of closely-spaced transactions. The funds may also suspend the trading privileges of any investor who makes a round trip within a 30-day period if the purchase and redemption are of substantially similar dollar amounts and represent at least 25% of the value of the investor’s account.
The funds primarily receive share purchase and redemption orders through third-party financial intermediaries, some of whom rely on the use of omnibus accounts. An intermediary’s account typically includes multiple investors and provides the funds only with a net purchase or redemption amount on any given day where multiple purchases, redemptions and exchanges of shares occur in the account. The identity of individual purchasers, redeemers and exchangers whose orders are aggregated in omnibus accounts, and the size of their orders, will generally not be known by the funds. Despite the funds’ efforts to detect and prevent frequent trading, the funds may be unable to identify frequent trading because the netting effect in omnibus accounts often makes it more difficult to identify frequent traders. Nuveen, the funds’ distributor, has entered into agreements with financial intermediaries that maintain omnibus accounts with the funds’ transfer agent. Under the terms of these agreements, the financial intermediaries undertake to cooperate with Nuveen in monitoring purchase, exchange and redemption orders by their customers in order to detect and prevent frequent trading in the funds through such accounts. Technical limitations in operational systems at such intermediaries or at Nuveen may also limit the funds’ ability to detect and prevent frequent trading. In addition, the funds may permit certain financial intermediaries, including broker-dealer and retirement plan administrators, among others, to enforce their own internal policies and procedures
concerning frequent trading. Such policies may differ from the funds’ Frequent Trading Policy and may be approved for use in instances where the funds
Section 4 General Information
33
reasonably believe that the intermediary’s policies and procedures effectively discourage inappropriate trading activity. Shareholders holding their accounts with such intermediaries may wish to contact the intermediary for information regarding its frequent trading policy. Although the funds do not knowingly permit frequent trading, they cannot guarantee that they will be able to identify and restrict all frequent trading activity.
The funds reserve the right in their sole discretion to waive unintentional or minor violations (including transactions below certain dollar thresholds) if they determine that doing so would not harm the interests of fund shareholders. In addition, certain categories of redemptions may be excluded from the application of the Frequent Trading Policy, as described in more detail in the Statement of Additional Information. These include, among others, redemptions pursuant to systematic withdrawal plans, redemptions in connection with the total disability or death of the investor, involuntary redemptions by operation of law, redemptions in payment of account or plan fees, and certain redemptions by retirement plans, including redemptions in connection with qualifying loans or hardship withdrawals, termination of plan participation, return of excess contributions, and required minimum distributions. The funds may also modify or suspend the Frequent Trading Policy without notice during periods of market stress or other unusual circumstances.
The funds reserve the right to impose restrictions on purchases or exchanges that are more restrictive than those stated above if they determine, in their sole discretion, that a transaction or a series of transactions involves market timing or excessive trading that may be detrimental to fund shareholders. The funds also reserve the right to reject any purchase order, including exchange purchases, for any reason. For example, a fund may refuse purchase orders if the fund would be unable to invest the proceeds from the purchase order in accordance with the fund’s investment policies and/or objectives, or if the fund would be adversely affected by the size of the transaction, the frequency of trading in the account or various other factors. For more information about the funds’ Frequent Trading Policy and its enforcement, see “Additional Information on the Purchase and Redemption of Fund Shares and Shareholder Programs—Frequent Trading Policy” in the Statement of Additional Information.

The custodian of the assets of the funds is State Street Bank & Trust Company, P.O. Box 5043, Boston, Massachusetts 02206-5043. The custodian also provides certain accounting services to the funds. The funds’ transfer, shareholder services and dividend paying agent, Boston Financial Data Services, P.O. Box 8530, Boston, Massachusetts 02266-8530, performs bookkeeping, data processing and administrative services for the maintenance of shareholder accounts.
Section 4 General Information
34
Section 5 Financial Highlights
The financial highlights table is intended to help you understand each fund’s financial performance for the past five fiscal years or the life of the fund, if shorter. Certain information reflects financial results for a single fund share. The total returns represent the rate that an investor would have earned (or lost) on an investment in a fund (assuming reinvestment of all dividends and distributions). The information has been audited by PricewaterhouseCoopers LLP, whose report for the most recent fiscal year, along with the funds’ financial statements, are included in the annual report, which is available upon request.
Nuveen Santa Barbara Dividend Growth Fund
| | | | | | | | | | | | | | | | | | | | | | | | | | | | | | | | | | | | | | | | | | | | |
Class
(Inception
Date) | | | | Investment Operations | | | Less Distributions | | | | | | | | Ratios/Supplemental Data | |
Year Ended
July 31, | | Beginning
Net Asset
Value | | Net
Investment
Income(a) | | Net
Realized/
Unrealized
Investment
Gain (Loss) | | | Total | | | Net
Investment
Income | | | Capital
Gains | | | Total | | | Ending
Net
Asset
Value | | Total
Return(b) | | | Ending
Net
Assets
(000) | | Ratios of
Expenses
to
Average
Net
Assets(c) | | | Ratios of
Net
Investment
Income
to
Average
Net
Assets(c) | | | Portfolio
Turnover
Rate | |
| | | | | | | | | | | | | |
| Class A (3/06) | | | | | | | | | | | | | | | | | | | | | | | | | | | | | | | | | | | | | | | | | | | | |
| 2008 | | $ | 23.78 | | $ | .47 | | $ | (.86 | ) | | $ | (.39 | ) | | $ | (.44 | ) | | $ | (.13 | ) | | $ | (.57 | ) | | $ | 22.82 | | (1.77 | )% | | $ | 4,226 | | 1.28 | % | | 1.89 | % | | 39 | % |
| 2007 | | | 21.27 | | | .43 | | | 2.63 | | | | 3.06 | | | | (.54 | ) | | | (.01 | ) | | | (.55 | ) | | | 23.78 | | 14.49 | | | | 776 | | 1.28 | | | 1.66 | | | 21 | |
| 2006(d) | | | 20.00 | | | .15 | | | 1.12 | | | | 1.27 | | | | — | | | | — | | | | — | | | | 21.27 | | 6.35 | | | | 266 | | 1.29 | * | | 2.10 | * | | 4 | |
| | | | | | | | | | | | | |
| Class B (3/06) | | | | | | | | | | | | | | | | | | | | | | | | | | | | | | | | | | | | | | | | | | | | |
| 2008 | | | 23.77 | | | .29 | | | (.87 | ) | | | (.58 | ) | | | (.25 | ) | | | (.13 | ) | | | (.38 | ) | | | 22.81 | | (2.51 | ) | | | 725 | | 2.04 | | | 1.12 | | | 39 | |
| 2007 | | | 21.22 | | | .28 | | | 2.61 | | | | 2.89 | | | | (.33 | ) | | | (.01 | ) | | | (.34 | ) | | | 23.77 | | 13.68 | | | | 366 | | 2.03 | | | 1.04 | | | 21 | |
| 2006(d) | | | 20.00 | | | .10 | | | 1.12 | | | | 1.22 | | | | — | | | | — | | | | — | | | | 21.22 | | 6.10 | | | | 265 | | 2.04 | * | | 1.35 | * | | 4 | |
| | | | | | | | | | | | | |
| Class C (3/06) | | | | | | | | | | | | | | | | | | | | | | | | | | | | | | | | | | | | | | | | | | | | |
| 2008 | | | 23.76 | | | .27 | | | (.85 | ) | | | (.58 | ) | | | (.25 | ) | | | (.13 | ) | | | (.38 | ) | | | 22.80 | | (2.51 | ) | | | 2,870 | | 2.04 | | | 1.07 | | | 39 | |
| 2007 | | | 21.22 | | | .24 | | | 2.64 | | | | 2.88 | | | | (.33 | ) | | | (.01 | ) | | | (.34 | ) | | | 23.76 | | 13.63 | | | | 806 | | 2.04 | | | .84 | | | 21 | |
| 2006(d) | | | 20.00 | | | .10 | | | 1.12 | | | | 1.22 | | | | — | | | | — | | | | — | | | | 21.22 | | 6.10 | | | | 265 | | 2.04 | * | | 1.35 | * | | 4 | |
| | | | | | | | | | | | | |
| Class I (3/06)(e) | | | | | | | | | | | | | | | | | | | | | | | | | | | | | | | | | | | | | | | | | | | | |
| 2008 | | | 23.79 | | | .50 | | | (.83 | ) | | | (.33 | ) | | | (.50 | ) | | | (.13 | ) | | | (.63 | ) | | | 22.83 | | (1.52 | ) | | | 10,563 | | 1.03 | | | 2.03 | | | 39 | |
| 2007 | | | 21.29 | | | .46 | | | 2.66 | | | | 3.12 | | | | (.61 | ) | | | (.01 | ) | | | (.62 | ) | | | 23.79 | | 14.77 | | | | 1,163 | | 1.04 | | | 1.77 | | | 21 | |
| 2006(d) | | | 20.00 | | | .17 | | | 1.12 | | | | 1.29 | | | | — | | | | — | | | | — | | | | 21.29 | | 6.45 | | | | 266 | | 1.04 | * | | 2.35 | * | | 4 | |
| (a) | | Per share Net Investment Income is calculated using the average daily shares method. |
| (b) | | Total Return is the combination of changes in net asset value without any sales charge, reinvested dividend income at net asset value and reinvested capital gains distributions at net asset value, if any. Total Return is not annualized. |
| (c) | | After expense reimbursement from NAM, where applicable. When custodian fee credits are applied, the Ratios of Expenses to Average Net Assets for 2008 are 1.24%, 1.99%, 1.99% and .99% for classes A, B, C and I, respectively, and the Ratios of Net Investment Income to Average Net Assets for 2008 are 1.93%, 1.17%, 1.11% and 2.07% for classes A, B, C and I, respectively. |
| (d) | | For the period ended March 28, 2006 (commencement of operations) through July 31, 2006. |
| (e) | | Effective May 1, 2008, Class R shares were renamed Class I shares. |
Section 5 Financial Highlights
35
Nuveen Santa Barbara Growth Fund
| | | | | | | | | | | | | | | | | | | | | | | | | | | | | | | | | | | | | | | | | | | | | |
Class
(Inception
Date) | | | | Investment Operations | | | Less Distributions | | | | | | | | Ratios/Supplemental Data | |
Year Ended
July 31, | | Beginning
Net Asset
Value | | Net
Investment
Income
(Loss)(a) | | | Net
Realized/
Unrealized
Investment
Gain (Loss) | | | Total | | | Net
Investment
Income | | | Capital
Gains | | | Total | | | Ending
Net
Asset
Value | | Total
Return(b) | | | Ending
Net
Assets
(000) | | Ratios of
Expenses
to
Average
Net
Assets(c) | | | Ratios of
Net
Investment
Income (Loss)
to
Average
Net
Assets(c) | | | Portfolio
Turnover
Rate | |
| | | | | | | | | | | | | |
| Class A (3/06) | | | | | | | | | | | | | | | | | | | | | | | | | | | | | | | | | | | | | | | | | | | | | |
| 2008 | | $ | 21.08 | | $ | (.02 | ) | | $ | (.92 | ) | | $ | (.94 | ) | | $ | — | | | $ | (.05 | ) | | $ | (.05 | ) | | $ | 20.09 | | (4.46 | )% | | $ | 7,131 | | 1.39 | % | | (.15 | )% | | 37 | % |
| 2007 | | | 18.86 | | | (.04 | ) | | | 2.26 | | | | 2.22 | | | | — | | | | — | | | | — | | | | 21.08 | | 11.77 | | | | 1,991 | | 1.39 | | | (.43 | ) | | 48 | |
| 2006(d) | | | 20.00 | | | — | ** | | | (1.14 | ) | | | (1.14 | ) | | | — | | | | — | | | | — | | | | 18.86 | | (5.70 | ) | | | 236 | | 1.39 | * | | (.12 | )* | | 6 | |
| | | | | | | | | | | | | |
| Class B (3/06) | | | | | | | | | | | | | | | | | | | | | | | | | | | | | | | | | | | | | | | | | | | | | |
| 2008 | | | 20.88 | | | (.16 | ) | | | (.92 | ) | | | (1.08 | ) | | | — | | | | (.05 | ) | | | (.05 | ) | | | 19.75 | | (5.17 | ) | | | 371 | | 2.14 | | | (.87 | ) | | 37 | |
| 2007 | | | 18.81 | | | (.18 | ) | | | 2.25 | | | | 2.07 | | | | — | | | | — | | | | — | | | | 20.88 | | 11.00 | | | | 319 | | 2.14 | | | (1.14 | ) | | 48 | |
| 2006(d) | | | 20.00 | | | (.05 | ) | | | (1.14 | ) | | | (1.19 | ) | | | — | | | | — | | | | — | | | | 18.81 | | (5.95 | ) | | | 235 | | 2.14 | * | | (.87 | )* | | 6 | |
| | | | | | | | | | | | | |
| Class C (3/06) | | | | | | | | | | | | | | | | | | | | | | | | | | | | | | | | | | | | | | | | | | | | | |
| 2008 | | | 20.87 | | | (.16 | ) | | | (.92 | ) | | | (1.08 | ) | | | — | | | | (.05 | ) | | | (.05 | ) | | | 19.74 | | (5.18 | ) | | | 2,321 | | 2.14 | | | (.87 | ) | | 37 | |
| 2007 | | | 18.81 | | | (.19 | ) | | | 2.25 | | | | 2.06 | | | | — | | | | — | | | | — | | | | 20.87 | | 10.95 | | | | 2,182 | | 2.15 | | | (1.18 | ) | | 48 | |
| 2006(d) | | | 20.00 | | | (.05 | ) | | | (1.14 | ) | | | (1.19 | ) | | | — | | | | — | | | | — | | | | 18.81 | | (5.95 | ) | | | 235 | | 2.14 | * | | (.87 | )* | | 6 | |
| | | | | | | | | | | | | |
| Class I (3/06)(e) | | | | | | | | | | | | | | | | | | | | | | | | | | | | | | | | | | | | | | | | | | | | | |
| 2008 | | | 21.14 | | | .01 | | | | (.91 | ) | | | (.90 | ) | | | — | | | | (.05 | ) | | | (.05 | ) | | | 20.19 | | (4.21 | ) | | | 21,083 | | 1.14 | | | (.02 | ) | | 37 | |
| 2007 | | | 18.88 | | | .02 | | | | 2.26 | | | | 2.28 | | | | (.02 | ) | | | — | | | | (.02 | ) | | | 21.14 | | 12.06 | | | | 2,217 | | 1.13 | | | (.15 | ) | | 48 | |
| 2006(d) | | | 20.00 | | | .01 | | | | (1.13 | ) | | | (1.12 | ) | | | — | | | | — | | | | — | | | | 18.88 | | (5.60 | ) | | | 1,180 | | 1.14 | * | | .13 | * | | 6 | |
| ** | | Rounds to less than $.01 per share. |
| (a) | | Per share Net Investment Income (Loss) is calculated using the average daily shares method. |
| (b) | | Total Return is the combination of changes in net asset value without any sales charge, reinvested dividend income at net asset value and reinvested capital gains distributions at net asset value, if any. Total Return is not annualized. |
| (c) | | After expense reimbursement from NAM, where applicable. When custodian fee credits are applied, the Ratios of Expenses to Average Net Assets for 2008 are 1.32%, 2.07%, 2.07% and 1.07% for classes A, B, C and I, respectively, and the Ratios of Net Investment Income (Loss) to Average Net Assets for 2008 are (.08)%, (.80)%, (.80)% and .05% for classes A, B, C and I, respectively. |
| (d) | | For the period ended March 28, 2006 (commencement of operations) through July 31, 2006. |
| (e) | | Effective May 1, 2008, Class R shares were renamed Class I shares. |
Section 5 Financial Highlights
36
Nuveen Santa Barbara Growth Opportunities Fund
| | | | | | | | | | | | | | | | | | | | | | | | | | | | | | | | | | | | | | | | | | | | | | | | | |
Class
(Inception
Date) | | | | Investment Operations | | | Less Distributions | | | | | | | | Ratios/Supplemental Data | |
Year Ended
July 31, | | Beginning
Net Asset
Value | | Net
Investment
Income
(Loss)(a) | | | Net
Realized/
Unrealized
Investment
Gain (Loss) | | | Total | | | Net
Investment
Income | | | Tax Return
of Capital | | | Capital
Gains | | | Total | | | Ending
Net
Asset
Value | | Total
Return(b) | | | Ending
Net
Assets
(000) | | Ratios of
Expenses
to
Average
Net
Assets(c) | | | Ratios of
Net
Investment
Income (Loss)
to
Average
Net
Assets(c) | | | Portfolio
Turnover
Rate | |
| | | | | | | | | | | | | | |
| Class A (3/06) | | | | | | | | | | | | | | | | | | | | | | | | | | | | | | | | | | | | | | | | | | | | | | | | | |
| 2008 | | $ | 22.30 | | $ | — | ** | | $ | (2.78 | ) | | $ | (2.78 | ) | | $ | — | | | $ | (.04 | ) | | $ | (1.54 | ) | | $ | (1.58 | ) | | $ | 17.94 | | (13.07 | )% | | $ | 280 | | 1.48 | % | | (.18 | )% | | 76 | % |
| 2007 | | | 19.00 | | | .08 | | | | 3.54 | | | | 3.62 | | | | — | | | | — | | | | (.32 | ) | | | (.32 | ) | | | 22.30 | | 19.20 | | | | 279 | | 1.48 | | | .17 | | | 71 | |
| 2006(d) | | | 20.00 | | | — | ** | | | (1.00 | ) | | | (1.00 | ) | | | — | | | | — | | | | — | | | | — | | | | 19.00 | | (5.00 | ) | | | 237 | | 1.49 | * | | (.13 | )* | | 14 | |
| | | | | | | | | | | | | | |
| Class B (3/06) | | | | | | | | | | | | | | | | | | | | | | | | | | | | | | | | | | | | | | | | | | | | | | | | | |
| 2008 | | | 22.08 | | | (.14 | ) | | | (2.75 | ) | | | (2.89 | ) | | | — | | | | (.04 | ) | | | (1.54 | ) | | | (1.58 | ) | | | 17.61 | | (13.72 | ) | | | 223 | | 2.24 | | | (.92 | ) | | 76 | |
| 2007 | | | 18.95 | | | (.09 | ) | | | 3.54 | | | | 3.45 | | | | — | | | | — | | | | (.32 | ) | | | (.32 | ) | | | 22.08 | | 18.34 | | | | 276 | | 2.24 | | | (.59 | ) | | 71 | |
| 2006(d) | | | 20.00 | | | (.05 | ) | | | (1.00 | ) | | | (1.05 | ) | | | — | | | | — | | | | — | | | | — | | | | 18.95 | | (5.25 | ) | | | 237 | | 2.24 | * | | (.88 | )* | | 14 | |
| | | | | | | | | | | | | | |
| Class C (3/06) | | | | | | | | | | | | | | | | | | | | | | | | | | | | | | | | | | | | | | | | | | | | | | | | | |
| 2008 | | | 22.08 | | | (.14 | ) | | | (2.76 | ) | | | (2.90 | ) | | | — | | | | (.04 | ) | | | (1.54 | ) | | | (1.58 | ) | | | 17.60 | | (13.77 | ) | | | 291 | | 2.24 | | | (.92 | ) | | 76 | |
| 2007 | | | 18.95 | | | (.09 | ) | | | 3.54 | | | | 3.45 | | | | — | | | | — | | | | (.32 | ) | | | (.32 | ) | | | 22.08 | | 18.34 | | | | 276 | | 2.24 | | | (.59 | ) | | 71 | |
| 2006(d) | | | 20.00 | | | (.05 | ) | | | (1.00 | ) | | | (1.05 | ) | | | — | | | | — | | | | — | | | | — | | | | 18.95 | | (5.25 | ) | | | 237 | | 2.24 | * | | (.88 | )* | | 14 | |
| | | | | | | | | | | | | | |
| Class I (3/06)(e) | | | | | | | | | | | | | | | | | | | | | | | | | | | | | | | | | | | | | | | | | | | | | | | | | |
| 2008 | | | 22.35 | | | .05 | | | | (2.80 | ) | | | (2.75 | ) | | | (.02 | ) | | | (.04 | ) | | | (1.54 | ) | | | (1.60 | ) | | | 18.00 | | (12.90 | ) | | | 487 | | 1.23 | | | .06 | | | 76 | |
| 2007 | | | 19.02 | | | .13 | | | | 3.55 | | | | 3.68 | | | | (.03 | ) | | | — | | | | (.32 | ) | | | (.35 | ) | | | 22.35 | | 19.50 | | | | 279 | | 1.23 | | | .42 | | | 71 | |
| 2006(d) | | | 20.00 | | | .02 | | | | (1.00 | ) | | | (.98 | ) | | | — | | | | — | | | | — | | | | — | | | | 19.02 | | (4.90 | ) | | | 238 | | 1.24 | * | | .13 | * | | 14 | |
| ** | | Rounds to less than $.01 per share. |
| (a) | | Per share Net Investment Income (Loss) is calculated using the average daily shares method. |
| (b) | | Total Return is the combination of changes in net asset value without any sales charge, reinvested dividend income at net asset value and reinvested capital gains distributions at net asset value, if any. Total Return is not annualized. |
| (c) | | After expense reimbursement from NAM, where applicable. When custodian fee credits are applied, the Ratios of Expenses to Average Net Assets for 2008 are 1.28%, 2.03%, 2.03% and 1.03% for classes A, B, C and I, respectively, and the Ratios of Net Investment Income (Loss) to Average Net Assets for 2008 are .02%, (.71)%, (.72)% and .26% for classes A, B, C and I, respectively. |
| (d) | | For the period ended March 28, 2006 (commencement of operations) through July 31, 2006. |
| (e) | | Effective May 1, 2008, Class R shares were renamed Class I shares. |
Section 5 Financial Highlights
37
Nuveen Rittenhouse Growth Fund
| | | | | | | | | | | | | | | | | | | | | | | | | | | | | | | | | | | | | | | | | | |
Class (Inception
Date) | | | | Investment Operations | | | Less Distributions | | | | | | | Ratios/Supplemental Data | |
Year Ended
July 31, | | Beginning
Net Asset
Value | | Net
Investment
Income
(Loss)(a) | | | Net
Realized/
Unrealized
Gain (Loss) | | | Total | | | Net
Investment
Income | | Capital
Gains | | Total | | Ending
Net
Asset
Value | | Total
Return(b) | | | Ending
Net
Assets
(000) | | Ratios of
Expenses
to
Average
Net
Assets(c) | | | Ratios of
Net
Investment
Income (Loss)
to
Average
Net
Assets(c) | | | Portfolio
Turnover
Rate | |
| | | | | | | | | | | | | |
| Class A (12/97) | | | | | | | | | | | | | | | | | | | | | | | | | | | | | | | | | | | | | | | | | | |
| 2008 | | $ | 23.87 | | $ | .01 | | | $ | (1.70 | ) | | $ | (1.69 | ) | | $ | — | | $ | — | | $ | — | | $ | 22.18 | | (7.08 | )% | | $ | 43,708 | | 1.45 | % | | .05 | % | | 55 | % |
| 2007 | | | 20.59 | | | .03 | | | | 3.25 | | | | 3.28 | | | | — | | | — | | | — | | | 23.87 | | 15.93 | | | | 44,322 | | 1.45 | | | .11 | | | 37 | |
| 2006 | | | 20.92 | | | (.02 | ) | | | (.31 | ) | | | (.33 | ) | | | — | | | — | | | — | | | 20.59 | | (1.58 | ) | | | 37,129 | | 1.51 | | | (.07 | ) | | 73 | |
| 2005 | | | 19.43 | | | .06 | | | | 1.43 | | | | 1.49 | | | | — | | | — | | | — | | | 20.92 | | 7.67 | | | | 41,139 | | 1.48 | | | .32 | | | 25 | |
| 2004 | | | 18.53 | | | (.06 | ) | | | .96 | | | | .90 | | | | — | | | — | | | — | | | 19.43 | | 4.86 | | | | 53,804 | | 1.43 | | | (.28 | ) | | 19 | |
| | | | | | | | | | | | | |
| Class B (12/97) | | | | | | | | | | | | | | | | | | | | | | | | | | | | | | | | | | | | | | | | | | |
| 2008 | | | 22.21 | | | (.15 | ) | | | (1.58 | ) | | | (1.73 | ) | | | — | | | — | | | — | | | 20.48 | | (7.79 | ) | | | 10,440 | | 2.20 | | | (.68 | ) | | 55 | |
| 2007 | | | 19.32 | | | (.13 | ) | | | 3.02 | | | | 2.89 | | | | — | | | — | | | — | | | 22.21 | | 14.96 | | | | 21,002 | | 2.20 | | | (.59 | ) | | 37 | |
| 2006 | | | 19.77 | | | (.16 | ) | | | (.29 | ) | | | (.45 | ) | | | — | | | — | | | — | | | 19.32 | | (2.28 | ) | | | 41,445 | | 2.27 | | | (.82 | ) | | 73 | |
| 2005 | | | 18.50 | | | (.08 | ) | | | 1.35 | | | | 1.27 | | | | — | | | — | | | — | | | 19.77 | | 6.86 | | | | 80,600 | | 2.23 | | | (.43 | ) | | 25 | |
| 2004 | | | 17.78 | | | (.19 | ) | | | .91 | | | | .72 | | | | — | | | — | | | — | | | 18.50 | | 4.05 | | | | 114,954 | | 2.18 | | | (1.04 | ) | | 19 | |
| | | | | | | | | | | | | |
| Class C (12/97) | | | | | | | | | | | | | | | | | | | | | | | | | | | | | | | | | | | | | | | | | | |
| 2008 | | | 22.23 | | | (.15 | ) | | | (1.58 | ) | | | (1.73 | ) | | | — | | | — | | | — | | | 20.50 | | (7.78 | ) | | | 26,479 | | 2.21 | | | (.69 | ) | | 55 | |
| 2007 | | | 19.33 | | | (.13 | ) | | | 3.03 | | | | 2.90 | | | | — | | | — | | | — | | | 22.23 | | 15.00 | | | | 34,870 | | 2.21 | | | (.62 | ) | | 37 | |
| 2006 | | | 19.79 | | | (.16 | ) | | | (.30 | ) | | | (.46 | ) | | | — | | | — | | | — | | | 19.33 | | (2.32 | ) | | | 40,849 | | 2.27 | | | (.82 | ) | | 73 | |
| 2005 | | | 18.51 | | | (.08 | ) | | | 1.36 | | | | 1.28 | | | | — | | | — | | | — | | | 19.79 | | 6.92 | | | | 64,103 | | 2.23 | | | (.43 | ) | | 25 | |
| 2004 | | | 17.79 | | | (.19 | ) | | | .91 | | | | .72 | | | | — | | | — | | | — | | | 18.51 | | 4.05 | | | | 86,376 | | 2.18 | | | (1.04 | ) | | 19 | |
| | | | | | | | | | | | | |
| Class I (12/97)(d) | | | | | | | | | | | | | | | | | | | | | | | | | | | | | | | | | | | | | | | | | | |
| 2008 | | | 24.44 | | | .07 | | | | (1.75 | ) | | | (1.68 | ) | | | — | | | — | | | — | | | 22.76 | | (6.87 | ) | | | 11,568 | | 1.20 | | | .31 | | | 55 | |
| 2007 | | | 21.04 | | | .09 | | | | 3.31 | | | | 3.40 | | | | — | | | — | | | — | | | 24.44 | | 16.16 | | | | 14,823 | | 1.20 | | | .37 | | | 37 | |
| 2006 | | | 21.32 | | | .04 | | | | (.32 | ) | | | (.28 | ) | | | — | | | — | | | — | | | 21.04 | | (1.31 | ) | | | 13,052 | | 1.26 | | | .18 | | | 73 | |
| 2005 | | | 19.75 | | | .11 | | | | 1.46 | | | | 1.57 | | | | — | | | — | | | — | | | 21.32 | | 7.95 | | | | 16,082 | | 1.22 | | | .55 | | | 25 | |
| 2004 | | | 18.79 | | | — | * | | | .96 | | | | .96 | | | | — | | | — | | | — | | | 19.75 | | 5.11 | | | | 16,052 | | 1.17 | | | (.02 | ) | | 19 | |
| * | Rounds to less than $.01 per share. |
| (a) | | Per share Net Investment Income (Loss) is calculated using the average daily shares method. |
| (b) | | Total Return is the combination of changes in net asset value without any sales charge, reinvested dividend income at net asset value and reinvested capital gains distributions at net asset value, if any. Total Return is not annualized. |
| (c) | | After expense reimbursement from NAM, where applicable. |
| (d) | | Effective May 1, 2008, Class R shares were renamed Class I shares. |
Section 5 Financial Highlights
38
Section 6 Glossary of Investment Terms
| | Ÿ | | American Depositary Receipts (“ADRs”): Certificates issued by an U.S. depositary bank that represent a bank’s holdings of a stated number of shares of a non-U.S. company. ADRs are typically bought and sold in the same manner as U.S. securities (although investors can also purchase the non-U.S. securities overseas and convert them to ADRs, and likewise can convert an ADR to its underlying non-U.S. security and sell it overseas) and are priced in U.S. dollars. ADRs carry most of the risks of investing directly in non-U.S. equity securities. |
| | Ÿ | | Derivatives: Financial instruments whose performance is derived from the performance of an underlying asset, security or index. Derivatives involve the trading of rights or obligations based on the underlying product. They are used to hedge risk, to exchange a floating rate of return for fixed rate of return or to gain investment exposure. Derivatives include futures, options and swaps, among other instruments. |
| | Ÿ | | Futures: A financial contract obligating the buyer to purchase an asset or the seller to sell an asset at a predetermined future date and price. Futures contracts detail the quality and quantity of the underlying asset; they are standardized to facilitate trading on a futures exchange. |
| | Ÿ | | Lipper Equity Income Funds Index: A managed index that represents the average annualized returns of the 30 largest funds in the Lipper Equity Income Category. |
| | Ÿ | | Lipper Large-Cap Core Funds Index: A managed index that represents the average annualized returns of the 30 largest funds in the Lipper Large-Cap Core Funds Category. |
| | Ÿ | | Lipper Large-Cap Growth Funds Index: A managed index that represents the average annualized returns of the 30 largest funds in the Lipper Large-Cap Growth Funds Category. |
| | Ÿ | | Lipper Mid-Cap Core Funds Index: A managed index that represents the average annualized returns of the 30 largest funds in the Lipper Mid-Cap Core Funds Category. |
| | Ÿ | | Lipper Multi-Cap Core Funds Index: A managed index that represents the average annualized returns of the 30 largest funds in the Lipper Multi-Cap Core Funds Category. |
| | Ÿ | | Lipper Peer Group: The Lipper Peer Group returns reflect the performance of select funds in particular Lipper categories. |
| | Ÿ | | Options: An investment that gives the buyer the right to buy or to sell shares of a specified stock at a specified price on or before a given date. There are also options on currencies and other financial assets. |
| | Ÿ | | Russell 1000® Growth Index: An index that measures the performance of those Russell 1000 companies with higher price-to-book ratios and higher forecasted growth values. |
| | Ÿ | | Russell 2500™ Growth Index: An index that measures the performance of those Russell 2500™ companies with higher price-to-book ratios and higher forecasted growth values. |
| | Ÿ | | Russell Top 200® Growth Index: An index that measures the performance of those Russell Top 200® companies with higher price-to-book ratios and higher forecasted growth values. The stocks are also members of the Russell 1000® Growth Index. |
Section 6 Glossary of Investment Terms
39
| | Ÿ | | S&P 500 Index: An unmanaged index generally considered representative of the U.S. stock market. |
| | Ÿ | | Swaps: A financial contract between two parties to exchange a set of payments that one party owns for a set of payments owned by the other party. |
Section 6 Glossary of Investment Terms
40
Nuveen Investments Mutual Funds
Nuveen Investments offers a variety of mutual funds designed to help you reach your financial goals. The funds below are grouped by category.
Global/International
Nuveen Symphony International Equity Fund
Nuveen Tradewinds International Value Fund
Nuveen Tradewinds Global All-Cap Fund
Nuveen Tradewinds Global Resources Fund
Value
Nuveen Multi-Manager Large-Cap Value Fund
Nuveen NWQ Large-Cap Value Fund
Nuveen NWQ Multi-Cap Value Fund
Nuveen NWQ Small-Cap Value Fund
Nuveen NWQ Small/Mid-Cap Value Fund
Nuveen Symphony Large-Cap Value Fund
Nuveen Tradewinds Value Opportunities Fund
Growth
Nuveen Rittenhouse Growth Fund
Nuveen Santa Barbara Growth Fund
Nuveen Santa Barbara Growth Opportunities Fund
Nuveen Symphony Large-Cap Growth Fund
Core
Nuveen Santa Barbara Dividend Growth Fund
Nuveen Symphony All-Cap Core Fund
Nuveen Symphony Mid-Cap Core Fund
Nuveen Symphony Optimized Alpha Fund
Nuveen Symphony Small-Mid Cap Core Fund
Quantitative/Enhanced
Nuveen Enhanced Core Equity Fund
Nuveen Enhanced Mid-Cap Fund
Asset Allocation
Nuveen Growth Allocation Fund
Nuveen Moderate Allocation Fund
Nuveen Conservative Allocation Fund
Taxable Fixed Income
Nuveen High Yield Bond Fund
Nuveen Preferred Securities Fund
Nuveen Multi-Strategy Income Fund
Nuveen Short Duration Bond Fund
Municipal Bond
National Funds
Nuveen High Yield Municipal Bond Fund
Nuveen All-American Municipal Bond Fund
Nuveen Insured Municipal Bond Fund
Nuveen Intermediate Duration Municipal Bond Fund
Nuveen Limited Term Municipal Bond Fund
State Funds
| | | | |
Arizona | | Louisiana | | North Carolina |
California1 | | Maryland | | Ohio |
Colorado | | Massachusetts2 | | Pennsylvania |
Connecticut | | Michigan | | Tennessee |
Florida Preference | | Missouri | | Virginia |
Georgia | | New Jersey | | Wisconsin |
Kansas | | New Mexico | | |
Kentucky | | New York2 | | |
Several additional sources of information are available to you, including the codes of ethics adopted by the funds, Nuveen, NAM, Rittenhouse and SBAM. The Statement of Additional Information, incorporated by reference into this prospectus, contains detailed information on the policies and operation of the funds included in this prospectus. Additional information about the funds’ investments is available in the annual and semi-annual reports to shareholders. In the funds’ annual reports, you will find a discussion of the market conditions and investment strategies that significantly affected the funds’ performance during their last fiscal year. The funds’ most recent Statement of Additional Information, annual and semi-annual reports and certain other information are available free of charge by calling Nuveen at (800) 257-8787, on the funds’ website at www.nuveen.com or through your financial advisor. Shareholders may call the toll free number above with any inquiries.
You may also obtain this and other fund information directly from the Securities and Exchange Commission (“SEC”). The SEC may charge a copying fee for this information. Visit the SEC on-line at http://www.sec.gov or in person at the SEC’s Public Reference Room in Washington, D.C. Call the SEC at (202) 942-8090 for room hours and operation. You may also request fund information by sending an e-mail request to publicinfo@sec.gov or by writing to the SEC’s Public Reference Section at 100 F Street NE, Washington, D.C. 20549.
The funds are series of Nuveen Investment Trust II, whose Investment Company Act file number is 811-08333.
| 1. | | Long-term, insured long-term and high yield portfolios. |
| 2. | | Long-term and insured long-term portfolios. |
MPR-SANTB-1108D NA
Distributed by
Nuveen Investments, LLC | 333 West Wacker Drive | Chicago, Illinois 60606 I (800) 257-8787 I www.nuveen.com
| | |
Statement of Additional Information NUVEEN SANTA BARBARA DIVIDEND GROWTH FUND Relating to the Acquisition of the Assets and Liabilities of NUVEEN RITTENHOUSE GROWTH FUND | | 333 West Wacker Dr. Chicago, Illinois 60606 Telephone: (312) 917-7700 |
This Statement of Additional Information is not a prospectus but should be read in conjunction with the Proxy Statement/Prospectus dated , 2009 for use in connection with the Special Meeting of Shareholders (the “Special Meeting”) of the Nuveen Rittenhouse Growth Fund (the “Growth Fund”), a series of Nuveen Investment Trust II (the “Trust”), to be held on , 2009. At the Special Meeting, shareholders of the Growth Fund will be asked to approve the reorganization (the “Reorganization”) of the Growth Fund into the Nuveen Santa Barbara Dividend Growth Fund (the “Dividend Growth Fund”; the Growth Fund and the Dividend Growth Fund are collectively referred to as the “Funds”) as described in the Proxy Statement/Prospectus. Copies of the Proxy Statement/Prospectus may be obtained at no charge by writing to the Trust at the address shown above or by calling (800) 257-8787.
Unless otherwise indicated, capitalized terms used herein and not otherwise defined have the same meanings as are given to them in the Proxy Statement/Prospectus.
Further information about the Funds is contained in the Funds’ Statement of Additional Information dated November 28, 2008, as supplemented from time to time, which is incorporated herein by reference only insofar as it relates to the Funds. No other parts are incorporated by reference herein.
The unaudited pro forma financial statements, attached hereto as Appendix A, are intended to present the financial condition and related results of operations of the Dividend Growth Fund as if the Reorganization had been consummated on July 31, 2008.
The audited financial statements and related independent registered public accounting firm’s report for the Funds are contained in the Funds’ Annual Report for the fiscal year ended July 31, 2008 and are incorporated herein by reference only insofar as they relate to the Funds. No other parts of the Annual Report are incorporated by reference herein.
The date of this Statement of Additional Information is , 2009.
Pro Forma Financial Statements for the Reorganization of Nuveen Rittenhouse Growth
Fund into Nuveen Santa Barbara Dividend Growth Fund
Pro Forma Portfolio of Investments (Unaudited)
July 31 , 2008
| | | | | | | | | | | | | | | | | | | | | |
| Shares | | | | Value |
Growth
Fund
(Actual) | | Dividend Growth
Fund
(Actual) | | Combined
Fund
(Pro Forma) | | Description (1) | | �� | | | | Growth
Fund
(Actual) | | Dividend Growth Fund
(Actual) | | Pro Forma
Adjustments | | Combined
Fund
(Pro Forma) |
| | | | | | | | | | | | | | | | | | | | | |
| | | | | | COMMON STOCKS – 95.9% | | | | | | | | | | | | | | | |
| | | | | | Aerospace & Defense – 2.3% | | | | | | | | | | | | | | | |
| | | | | | | | | |
| — | | 9,305 | | 9,305 | | Raytheon Company | | | | | | $ | — | | $ | 529,734 | | | | $ | 529,734 |
| | | | | | | | | |
| 32,000 | | — | | 32,000 | | United Technologies Corporation | | | | | | | 2,047,360 | | | — | | | | | 2,047,360 |
| | | | | | Total Aerospace & Defense | | | | | | | 2,047,360 | | | 529,734 | | | | | 2,577,094 |
| | | | | | Beverages – 2.4% | | | | | | | | | | | | | | | |
| | | | | | | | | |
| — | | 10,070 | | 10,070 | | Coca-Cola Company | | | | | | | — | | | 518,605 | | | | | 518,605 |
| | | | | | | | | |
| 32,000 | | — | | 32,000 | | PepsiCo, Inc. | | | | | | | 2,129,920 | | | — | | | | | 2,129,920 |
| | | | | | Total Beverages | | | | | | | 2,129,920 | | | 518,605 | | | | | 2,648,525 |
| | | | | | Biotechnology – 4.4% | | | | | | | | | | | | | | | |
| | | | | | | | | |
| 37,000 | | — | | 37,000 | | Celgene Corporation, (2) | | | | | | | 2,793,130 | | | — | | | | | 2,793,130 |
| | | | | | | | | |
| 39,000 | | — | | 39,000 | | Gilead Sciences, Inc., (2) | | | | | | | 2,105,220 | | | — | | | | | 2,105,220 |
| | | | | | Total Biotechnology | | | | | | | 4,898,350 | | | — | | | | | 4,898,350 |
| | | | | | Capital Markets – 2.9% | | | | | | | | | | | | | | | |
| | | | | | | | | |
| 7,500 | | — | | 7,500 | | Goldman Sachs Group, Inc. | | | | | | | 1,380,300 | | | — | | | | | 1,380,300 |
| | | | | | | | | |
| 24,000 | | — | | 24,000 | | SEI Investments Company | | | | | | | 552,720 | | | — | | | | | 552,720 |
| | | | | | | | | |
| 18,000 | | — | | 18,000 | | State Street Corporation | | | | | | | 1,289,520 | | | — | | | | | 1,289,520 |
| | | | | | Total Capital Markets | | | | | | | 3,222,540 | | | — | | | | | 3,222,540 |
| | | | | | Commercial Banks – 1.5% | | | | | | | | | | | | | | | |
| | | | | | | | | |
| — | | 9,600 | | 9,600 | | Cullen/Frost Bankers, Inc. | | | | | | | — | | | 506,304 | | | | | 506,304 |
| | | | | | | | | |
| — | | 8,470 | | 8,470 | | PNC Financial Services Group, Inc. | | | | | | | — | | | 603,826 | | | | | 603,826 |
| | | | | | | | | |
| — | | 19,000 | | 19,000 | | U.S. Bancorp | | | | | | | — | | | 581,590 | | | | | 581,590 |
| | | | | | Total Commercial Banks | | | | | | | — | | | 1,691,720 | | | | | 1,691,720 |
| | | | | | Commercial Services & Supplies – 0.5% | | | | | | | | | | | | | | | |
| | | | | | | | | |
| — | | 14,050 | | 14,050 | | Waste Management, Inc. | | | | | | | — | | | 499,337 | | | | | 499,337 |
| | | | | | Communications Equipment – 8.8% | | | | | | | | | | | | | | | |
| | | | | | | | | |
| 147,000 | | — | | 147,000 | | Cisco Systems, Inc., (2) | | | | | | | 3,232,530 | | | — | | | | | 3,232,530 |
| | | | | | | | | |
| 70,000 | | 20,505 | | 90,505 | | Nokia Oyj, Sponsored ADR | | | | | | | 1,912,400 | | | 560,197 | | | | | 2,472,597 |
| | | | | | | | | |
| 62,000 | | 11,055 | | 73,055 | | QUALCOMM Inc. | | | | | | | 3,431,080 | | | 611,782 | | | | | 4,042,862 |
| | | | | | Total Communications Equipment | | | | | | | 8,576,010 | | | 1,171,979 | | | | | 9,747,989 |
| | | | | | Computers & Peripherals – 3.9% | | | | | | | | | | | | | | | |
| | | | | | | | | |
| 21,000 | | — | | 21,000 | | Hewlett-Packard Company | | | | | | | 940,800 | | | — | | | | | 940,800 |
| | | | | | | | | |
| 26,000 | | — | | 26,000 | | International Business Machines Corporation (IBM) | | | | | | | 3,327,480 | | | — | | | | | 3,327,480 |
| | | | | | Total Computers & Peripherals | | | | | | | 4,268,280 | | | — | | | | | 4,268,280 |
| | | | | | Construction Materials – 0.6% | | | | | | | | | | | | | | | |
| | | | | | | | | |
| — | | 8,695 | | 8,695 | | Vulcan Materials Company | | | | | | | — | | | 558,132 | | | | | 558,132 |
| | | | | | Consumer Finance – 0.9% | | | | | | | | | | | | | | | |
| | | | | | | | | |
| 28,000 | | — | | 28,000 | | American Express Company | | | | | | | 1,039,360 | | | — | | | | | 1,039,360 |
| | | | | | Diversified Financial Services – 0.7% | | | | | | | | | | | | | | | |
| | | | | | | | | |
| 43,000 | | — | | 43,000 | | Citigroup Inc. | | | | | | | 803,670 | | | — | | | | | 803,670 |
| | | | | | Diversified Telecommunication Services – 0.9% | | | | | | | | | | | | | | | |
| | | | | | | | | |
| — | | 16,200 | | 16,200 | | AT&T Inc. | | | | | | | — | | | 499,122 | | | | | 499,122 |
| | | | | | | | | |
| — | | 6,195 | | 6,195 | | Telefonica SA | | | | | | | — | | | 482,157 | | | | | 482,157 |
| | | | | | Total Diversified Telecommunication Services | | | | | | | — | | | 981,279 | | | | | 981,279 |
1
Pro Forma Portfolio of Investments (Unaudited) (continued)
July 31, 2008
| | | | | | | | | | | | | | | | | | | | | |
| Shares | | | | Value |
Growth
Fund
(Actual) | | Dividend Growth
Fund
(Actual) | | Combined
Fund
(Pro Forma) | | Description (1) | | | | | | Growth
Fund
(Actual) | | Dividend Growth
Fund
(Actual) | | Pro Forma
Adjustments | | Combined
Fund
(Pro Forma) |
| | | | | | | | | | | | | | | | | | | | | |
| | | | | | Electric Utilities – 1.2% | | | | | | | | | | | | | | | |
| | | | | | | | | |
| — | | 5,470 | | 5,470 | | Exelon Corporation | | | | | | $ | — | | $ | 430,051 | | | | $ | 430,051 |
| | | | | | | | | |
| — | | 7,405 | | 7,405 | | FPL Group, Inc. | | | | | | | — | | | 477,845 | | | | | 477,845 |
| | | | | | | | | |
| — | | 8,865 | | 8,865 | | PPL Corporation | | | | | | | — | | | 416,300 | | | | | 416,300 |
| | | | | | Total Electric Utilities | | | | | | | — | | | 1,324,196 | | | | | 1,324,196 |
| | | | | | Electrical Equipment – 1.7% | | | | | | | | | | | | | | | |
| | | | | | | | | |
| — | | 10,225 | | 10,225 | | Emerson Electric Co. | | | | | | | — | | | 497,958 | | | | | 497,958 |
| | | | | | | | | |
| 30,000 | | — | | 30,000 | | Rockwell Automation, Inc. | | | | | | | 1,335,300 | | | — | | | | | 1,335,300 |
| | | | | | Total Electrical Equipment | | | | | | | 1,335,300 | | | 497,958 | | | | | 1,833,258 |
| | | | | | Electronic Equipment & Instruments – 1.8% | | | | | | | | | | | | | | | |
| | | | | | | | | |
| 33,000 | | — | | 33,000 | | Thermo Fisher Scientific, Inc., (2) | | | | | | | 1,997,160 | | | — | | | | | 1,997,160 |
| | | | | | Energy Equipment & Services – 4.8% | | | | | | | | | | | | | | | |
| | | | | | | | | |
| 25,000 | | — | | 25,000 | | Baker Hughes Incorporated | | | | | | | 2,072,750 | | | — | | | | | 2,072,750 |
| | | | | | | | | |
| 28,000 | | — | | 28,000 | | Halliburton Company | | | | | | | 1,254,960 | | | — | | | | | 1,254,960 |
| | | | | | | | | |
| 19,500 | | — | | 19,500 | | Schlumberger Limited | | | | | | | 1,981,200 | | | — | | | | | 1,981,200 |
| | | | | | Total Energy Equipment & Services | | | | | | | 5,308,910 | | | — | | | | | 5,308,910 |
| | | | | | Food & Staples Retailing– 1.9% | | | | | | | | | | | | | | | |
| | | | | | | | | |
| 61,000 | | — | | 61,000 | | Walgreen Co. | | | | | | | 2,094,740 | | | — | | | | | 2,094,740 |
| | | | | | Food Products – 2.3% | | | | | | | | | | | | | | | |
| | | | | | | | | |
| 40,000 | | — | | 40,000 | | Archer-Daniels-Midland Company | | | | | | | 1,145,200 | | | — | | | | | 1,145,200 |
| | | | | | | | | |
| 12,000 | | — | | 12,000 | | Monsanto Company | | | | | | | 1,429,320 | | | — | | | | | 1,429,320 |
| | | | | | Total Food Products | | | | | | | 2,574,520 | | | — | | | | | 2,574,520 |
| | | | | | Gas Utilities – 0.5% | | | | | | | | | | | | | | | |
| | | | | | | | | |
| — | | 8,085 | | 8,085 | | Equitable Resources Inc. | | | | | | | — | | | 422,441 | | | | | 422,441 |
| | | | | | Health Care Equipment & Supplies – 3.1% | | | | | | | | | | | | | | | |
| | | | | | | | | |
| 41,500 | | — | | 41,500 | | Baxter International Inc. | | | | | | | 2,847,315 | | | — | | | | | 2,847,315 |
| | | | | | | | | |
| — | | 6,840 | | 6,840 | | Becton, Dickinson and Company | | | | | | | — | | | 580,784 | | | | | 580,784 |
| | | | | | Total Health Care Equipment & Supplies | | | | | | | 2,847,315 | | | 580,784 | | | | | 3,428,099 |
| | | | | | Hotels, Restaurants & Leisure – 0.5% | | | | | | | | | | | | | | | |
| | | | | | | | | |
| — | | 15,280 | | 15,280 | | YUM! Brands, Inc. | | | | | | | — | | | 547,330 | | | | | 547,330 |
| | | | | | Household Products – 3.1% | | | | | | | | | | | | | | | |
| | | | | | | | | |
| 44,000 | | 7,430 | | 51,430 | | Procter & Gamble Company | | | | | | | 2,881,120 | | | 486,516 | | | | | 3,367,636 |
| | | | | | Industrial Conglomerates – 3.7% | | | | | | | | | | | | | | | |
| | | | | | | | | |
| 111,000 | | — | | 111,000 | | General Electric Company | | | | | | | 3,140,190 | | | — | | | | | 3,140,190 |
| | | | | | | | | |
| 22,000 | | — | | 22,000 | | Textron Inc. | | | | | | | 956,340 | | | — | | | | | 956,340 |
| | | | | | Total Industrial Conglomerates | | | | | | | 4,096,530 | | | — | | | | | 4,096,530 |
| | | | | | Insurance – 1.7% | | | | | | | | | | | | | | | |
| | | | | | | | | |
| — | | 35,388 | | 35,388 | | Fidelity National Title Group Inc., Class A | | | | | | | — | | | 472,784 | | | | | 472,784 |
| | | | | | | | | |
| — | | 13,090 | | 13,090 | | Manulife Financial Corporation | | | | | | | — | | | 482,105 | | | | | 482,105 |
| | | | | | | | | |
| 14,000 | | — | | 14,000 | | Prudential Financial, Inc. | | | | | | | 965,580 | | | — | | | | | 965,580 |
| | | | | | Total Insurance | | | | | | | 965,580 | | | 954,889 | | | | | 1,920,469 |
| | | | | | IT Services – 0.5% | | | | | | | | | | | | | | | |
| | | | | | | | | |
| — | | 16,240 | | 16,240 | | Paychex, Inc. | | | | | | | — | | | 534,621 | | | | | 534,621 |
2
Pro Forma Portfolio of Investments (Unaudited) (continued)
July 31, 2008
| | | | | | | | | | | | | | | | | | | | | |
| Shares | | | | Value |
Growth Fund (Actual) | | Dividend Growth Fund (Actual) | | Combined
Fund
(Pro Forma) | | Description (1) | | | | | | Growth Fund (Actual) | | Dividend Growth Fund (Actual) | | Pro Forma Adjustments | | Combined
Fund
(Pro Forma) |
| | | | | | Machinery – 3.1% | | | | | | | | | | | | | | | |
| | | | | | | | | |
| 13,500 | | — | | 13,500 | | Caterpillar Inc. | | | | | | $ | 938,520 | | $ | — | | | | $ | 938,520 |
| | | | | | | | | |
| 31,000 | | — | | 31,000 | | ITT Industries Inc. | | | | | | | 2,075,760 | | | — | | | | | 2,075,760 |
| | | | | | | | | |
| — | | 10,892 | | 10,892 | | PACCAR Inc. | | | | | | | — | | | 458,118 | | | | | 458,118 |
| | | | | | Total Machinery | | | | | | | 3,014,280 | | | 458,118 | | | | | 3,472,398 |
| | | | | | Media – 4.5% | | | | | | | | | | | | | | | |
| | | | | | | | | |
| 56,000 | | — | | 56,000 | | McGraw-Hill Companies, Inc. | | | | | | | 2,277,520 | | | — | | | | | 2,277,520 |
| | | | | | | | | |
| 74,000 | | — | | 74,000 | | Walt Disney Company | | | | | | | 2,245,900 | | | — | | | | | 2,245,900 |
| | | | | | | | | |
| — | | 37,925 | | 37,925 | | Pearson Public Limited Company | | | | | | | — | | | 486,199 | | | | | 486,199 |
| | | | | | Total Media | | | | | | | 4,523,420 | | | 486,199 | | | | | 5,009,619 |
| | | | | | Metals & Mining – 2.2% | | | | | | | | | | | | | | | |
| | | | | | | | | |
| 15,000 | | — | | 15,000 | | BHP Billiton PLC | | | | | | | 1,119,900 | | | — | | | | | 1,119,900 |
| | | | | | | | | |
| 9,000 | | — | | 9,000 | | Freeport-McMoRan Copper & Gold, Inc. | | | | | | | 870,750 | | | — | | | | | 870,750 |
| | | | | | | | | |
| — | | 16,515 | | 16,515 | | Southern Copper Corporation | | | | | | | — | | | 458,787 | | | | | 458,787 |
| | | | | | Total Metals & Mining | | | | | | | 1,990,650 | | | 458,787 | | | | | 2,449,437 |
| | | | | | Multiline Retail – 1.2% | | | | | | | | | | | | | | | |
| | | | | | | | | |
| 31,000 | | — | | 31,000 | | Kohl’s Corporation, (2) | | | | | | | 1,299,210 | | | — | | | | | 1,299,210 |
| | | | | | Oil, Gas & Consumable Fuels – 3.1% | | | | | | | | | | | | | | | |
| | | | | | | | | |
| 6,000 | | — | | 6,000 | | Apache Corporation | | | | | | | 673,020 | | | — | | | | | 673,020 |
| | | | | | | | | |
| — | | 5,320 | | 5,320 | | Chevron Corporation | | | | | | | — | | | 449,859 | | | | | 449,859 |
| | | | | | | | | |
| — | | 5,500 | | 5,500 | | EnCana Corporation | | | | | | | — | | | 397,045 | | | | | 397,045 |
| | | | | | | | | |
| 18,000 | | — | | 18,000 | | Occidental Petroleum Corporation | | | | | | | 1,418,940 | | | — | | | | | 1,418,940 |
| | | | | | | | | |
| — | | 6,760 | | 6,760 | | Royal Dutch Shell PLC, Class A | | | | | | | — | | | 478,540 | | | | | 478,540 |
| | | | | | Total Oil, Gas & Consumable Fuels | | | | | | | 2,091,960 | | | 1,325,444 | | | | | 3,417,404 |
| | | | | | Personal Products – 2.0% | | | | | | | | | | | | | | | |
| | | | | | | | | |
| 49,000 | | — | | 49,000 | | Estee Lauder Companies Inc., Class A | | | | | | | 2,160,900 | | | — | | | | | 2,160,900 |
| | | | | | Pharmaceuticals – 4.9% | | | | | | | | | | | | | | | |
| | | | | | | | | |
| 51,000 | | 10,115 | | 61,115 | | Abbott Laboratories | | | | | | | 2,873,340 | | | 569,879 | | | | | 3,443,219 |
| | | | | | | | | |
| 29,000 | | — | | 29,000 | | Allergan, Inc. | | | | | | | 1,505,970 | | | — | | | | | 1,505,970 |
| | | | | | | | | |
| — | | 10,850 | | 10,850 | | Eli Lilly and Company | | | | | | | — | | | 511,144 | | | | | 511,144 |
| | | | | | Total Pharmaceuticals | | | | | | | 4,379,310 | | | 1,081,023 | | | | | 5,460,333 |
| | | | | | Semiconductors & Equipment – 4.3% | | | | | | | | | | | | | | | |
| | | | | | | | | |
| 133,000 | | — | | 133,000 | | Intel Corporation | | | | | | | 2,951,270 | | | — | | | | | 2,951,270 |
| | | | | | | | | |
| — | | 16,910 | | 16,910 | | Microchip Technology Incorporated | | | | | | | — | | | 539,936 | | | | | 539,936 |
| | | | | | | | | |
| 50,000 | | — | | 50,000 | | Texas Instruments Incorporated | | | | | | | 1,219,000 | | | — | | | | | 1,219,000 |
| | | | | | Total Semiconductors & Equipment | | | | | | | 4,170,270 | | | 539,936 | | | | | 4,710,206 |
| | | | | | Software – 8.5% | | | | | | | | | | | | | | | |
| | | | | | | | | |
| 35,000 | | — | | 35,000 | | Electronic Arts Inc. (EA), (2) | | | | | | | 1,511,300 | | | — | | | | | 1,511,300 |
| | | | | | | | | |
| 165,000 | | — | | 165,000 | | Microsoft Corporation | | | | | | | 4,243,800 | | | — | | | | | 4,243,800 |
| | | | | | | | | |
| 122,000 | | — | | 122,000 | | Oracle Corporation, (2) | | | | | | | 2,626,660 | | | — | | | | | 2,626,660 |
| | | | | | | | | |
| 18,000 | | — | | 18,000 | | SAP AG, Sponsored ADR | | | | | | | 1,040,580 | | | — | | | | | 1,040,580 |
| | | | | | Total Software | | | | | | | 9,422,340 | | | — | | | | | 9,422,340 |
3
Pro Forma Portfolio of Investments (Unaudited) (continued)
July 31, 2008
| | | | | | | | | | | | | | | | | | | | | |
| Shares | | | | Value |
Growth Fund (Actual) | | Dividend Growth Fund (Actual) | | Combined Fund (Pro Forma) | | Description (1) | | | | | | Growth Fund (Actual) | | Dividend Growth Fund (Actual) | | Pro Forma
Adjustments | | Combined
Fund
(Pro Forma) |
| | | | | | | | | | | | | | | | | | | | | |
| | | | | | Specialty Retail – 1.0% | | | | | | | | | | | | | | | |
| | | | | | | | | |
| 50,000 | | — | | 50,000 | | Staples, Inc. | | | | | | $ | 1,125,000 | | $ | — | | | | $ | 1,125,000 |
| | | | | | Textiles, Apparel & Luxury Goods – 2.7% | | | | | | | | | | | | | | | |
| | | | | | | | | |
| 42,000 | | — | | 42,000 | | Coach, Inc., (2) | | | | | | | 1,071,420 | | | — | | | | | 1,071,420 |
| | | | | | | | | |
| 32,000 | | — | | 32,000 | | Nike, Inc., Class B | | | | | | | 1,877,760 | | | — | | | | | 1,877,760 |
| | | | | | Total Textiles, Apparel & Luxury Goods | | | | | | | 2,949,180 | | | — | | | | | 2,949,180 |
| | | | | | Thrifts & Mortgage Finance – 0.9% | | | | | | | | | | | | | | | |
| | | | | | | | | |
| — | | 31,170 | | 31,170 | | Hudson City Bancorp, Inc. | | | | | | | — | | | 569,164 | | | | | 569,164 |
| | | | | | | | | |
| — | | 24,985 | | 24,985 | | New York Community Bancorp, Inc. | | | | | | | — | | | 415,251 | | | | | 415,251 |
| | | | | | Total Thrifts & Mortgage Finance | | | | | | | — | | | 984,415 | | | | | 984,415 |
| | | | | | Tobacco – 0.9% | | | | | | | | | | | | | | | |
| | | | | | | | | |
| — | | 7,680 | | 7,680 | | Lorillard Inc. | | | | | | | — | | | 515,405 | | | | | 515,405 |
| | | | | | | | | |
| — | | 9,385 | | 9,385 | | Philip Morris International, (2) | | | | | | | — | | | 484,735 | | | | | 484,735 |
| | | | | | Total Tobacco | | | | | | | — | | | 1,000,140 | | | | | 1,000,140 |
| | | | | | Total Common Stocks (cost $93,506,208, $18,321,456 and $111,827,664, respectively) | | | | | | | 88,213,185 | | | 17,633,583 | | | | | 105,846,768 |
| | | | | | | | | | | | | | | | | | | | | | | | | |
| Principal Amount (000) | | | | Value |
Growth Fund (Actual) | | Dividend Growth Fund (Actual) | | Combined Fund (Pro Forma) | | Description (1) | | Coupon | | Maturity | | Growth Fund (Actual) | | Dividend Growth Fund (Actual) | | Pro Forma
Adjustments | | | Combined
Fund
(Pro Forma) |
| | | | | | | | | | | | | | | | | | | | | | | | | |
| | | | | | | | | SHORT-TERM INVESTMENTS – 3.8% | | | | | | | | | | | | | | | | |
| | | | | | | | | |
| $ | 3,717 | | | $— | | $ | 3,717 | | Repurchase Agreement with Fixed Income Clearing Corporation, dated 7/31/08, repurchase price $3,716,708, collateralized by $3,345,000 U.S. Treasury Bonds, 5.500%, due 8/15/28, value $3,792,394 | | 1.840% | | 8/01/08 | | $ | 3,716,518 | | $ | — | | | | | $ | 3,716,518 |
| | | | | | | | | |
| | — | | | 516 | | | 516 | | Repurchase Agreement with Fixed Income Clearing Corporation, dated 7/31/08, repurchase price $515,727, collateralized by $505,000 U.S. Treasury Notes, 4.000%, due 2/15/15, value $527,725 | | 1.840% | | 8/01/08 | | | — | | | 515,701 | | | | | | 515,701 |
| $ | 3,717 | | $ | 516 | | $ | 4,233 | | Total Short-Term Investments (cost $3,716,518, $515,701 and $4,232,219, respectively) | | | | | | | 3,716,518 | | | 515,701 | | | | | | 4,232,219 |
| | | | | | | | | Total Investments (cost $97,222,726, $18,837,157 and $116,059,883, respectively) – 99.7% | | | | | | | 91,929,703 | | | 18,149,284 | | | | | | 110,078,987 |
| | | | | | | | | |
| | | | | | | | | Other Assets Less Liabilities – 0.3% | | | | | | | 265,882 | | | 235,199 | | (190,000) | (3) | | | 311,081 |
| | | | | | | | | |
| | | | | | | | | Net Assets – 100.0% | | | | | | $ | 92,195,585 | | $ | 18,384,483 | | (190,000) | | | $ | 110,390,068 |
| | | | | | | | | |
| | (1) | | Percentages shown in the Portfolio of Investments are based on the Combined Fund (Pro Forma). |
| | (2) | | Non-income producing. |
| | (3) | | Non-recurring cost associated with the proposed Reorganization (estimated to be $190,000) which will be borne by the shareholders of the Growth Fund if the Reorganization is approved and completed. |
| | ADR | | American Depositary Receipt. |
4
Pro Forma Portfolio of Investments (Unaudited) (continued)
July 31, 2008
Country Allocation (As a percentage of total investments):
| | | | | | | | | |
| | | Growth
Fund (Actual) | | | Dividend Growth
Fund (Actual) | | | Combined
Fund
(Pro Forma) | |
| Australia | | 1.2 | % | | — | % | | 1.0 | % |
| Canada | | — | | | 4.8 | | | 0.8 | |
| Finland | | 2.1 | | | 3.1 | | | 2.2 | |
| Germany | | 1.2 | | | — | | | 0.9 | |
| Netherlands | | — | | | 2.6 | | | 0.5 | |
| Spain | | — | | | 2.7 | | | 0.5 | |
| United Kingdom | | — | | | 2.7 | | | 0.5 | |
| United States | | 91.5 | | | 81.3 | | | 89.8 | |
| Short-Term Investments | | 4.0 | | | 2.8 | | | 3.8 | |
| Total | | 100.0 | % | | 100.0 | % | | 100.0 | % |
See accompanying notes to financial statements.
5
Pro Forma Statement of Assets and Liabilities (Unaudited)
July 31, 2008
| | | | | | | | | | | | | | | | |
| | | Growth Fund (Actual) | | | Dividend Growth Fund (Actual) | | | Pro Forma
Adjustments | | | Combined Fund
(Pro Forma) | |
Assets | | | | | | | | | | | | | | | | |
Investments, at value (cost $93,506,208, $18,321,456 and $111,827,664, respectively) | | $ | 88,213,185 | | | $ | 17,633,583 | | | | | | | $ | 105,846,768 | |
Short-term investments (at cost, which approximates value) | | | 3,716,518 | | | | 515,701 | | | | | | | | 4,232,219 | |
Receivables: | | | | | | | | | | | | | | | | |
Dividends and interest | | | 76,833 | | | | 22,842 | | | | | | | | 99,675 | |
Investments sold | | | 2,012,078 | | | | — | | | | | | | | 2,012,078 | |
Reclaims | | | 14,464 | | | | 302 | | | | | | | | 14,766 | |
Shares sold | | | 47,248 | | | | 325,400 | | | | | | | | 372,648 | |
Other assets | | | 93,380 | | | | — | | | | | | | | 93,380 | |
Total assets | | | 94,173,706 | | | | 18,497,828 | | | | | | | | 112,671,534 | |
Liabilities | | | | | | | | | | | | | | | | |
Payables: | | | | | | | | | | | | | | | | |
Investments purchased | | | 1,351,478 | | | | — | | | | | | | | 1,351,478 | |
Shares redeemed | | | 321,958 | | | | 72,745 | | | | | | | | 394,703 | |
Accrued expenses: | | | | | | | | | | | | | | | | |
Management fees | | | 9,651 | | | | 14,607 | | | | | | | | 24,258 | |
12b-1 distribution and service fees | | | 40,240 | | | | 3,829 | | | | | | | | 44,069 | |
Other | | | 254,794 | | | | 22,164 | | | | | | | | 276,958 | |
Reorganization costs | | | — | | | | — | | | | 190,000 | (a) | | | 190,000 | |
Total liabilities | | | 1,978,121 | | | | 113,345 | | | | 190,000 | | | | 2,281,466 | |
Net assets | | $ | 92,195,585 | | | $ | 18,384,483 | | | $ | (190,000 | ) | | $ | 110,390,068 | |
Class A Shares | | | | | | | | | | | | | | | | |
Net assets | | $ | 43,708,192 | | | $ | 4,225,994 | | | $ | (90,075 | ) (a) | | $ | 47,844,111 | |
Shares outstanding | | | 1,970,822 | | | | 185,159 | | | | (59,724 | ) (b) | | | 2,096,257 | |
Net asset value per share | | $ | 22.18 | | | $ | 22.82 | | | | | | | $ | 22.82 | |
Offering price per share (net asset value per share plus
maximum sales charge of 5.75% of offering price) | | $ | 23.53 | | | $ | 24.21 | | | | | | | $ | 24.21 | |
Class B Shares | | | | | | | | | | | | | | | | |
Net assets | | $ | 10,440,342 | | | $ | 724,899 | | | $ | (21,516 | ) (a) | | $ | 11,143,725 | |
Shares outstanding | | | 509,676 | | | | 31,780 | | | | (52,909 | ) (b) | | | 488,547 | |
Net asset value and offering price per share | | $ | 20.48 | | | $ | 22.81 | | | | | | | $ | 22.81 | |
Class C Shares | | | | | | | | | | | | | | | | |
Net assets | | $ | 26,478,966 | | | $ | 2,870,237 | | | $ | (54,569 | ) (a) | | $ | 29,294,634 | |
Shares outstanding | | | 1,291,813 | | | | 125,892 | | | | (132,808 | ) (b) | | | 1,284,897 | |
Net asset value and offering price per share | | $ | 20.50 | | | $ | 22.80 | | | | | | | $ | 22.80 | |
Class I Shares | | | | | | | | | | | | | | | | |
Net assets | | $ | 11,568,085 | | | $ | 10,563,353 | | | $ | (23,840 | ) (a) | | $ | 22,107,598 | |
Shares outstanding | | | 508,239 | | | | 462,724 | | | | (2,547 | ) (b) | | | 968,416 | |
Net asset value and offering price per share | | $ | 22.76 | | | $ | 22.83 | | | | | | | $ | 22.83 | |
| | | | |
Net Assets Consist of: | | | | | | | | | | | | | | | | |
Capital paid-in | | $ | 176,226,284 | | | $ | 19,554,606 | | | $ | (190,000 | ) (a) | | $ | 195,590,890 | |
Undistributed (Over-distribution of) net investment income | | | — | | | | 6,971 | | | | | | | | 6,971 | |
Accumulated net realized gain (loss) from investments | | | (78,737,676 | ) | | | (489,221 | ) | | | | | | | (79,226,897 | ) |
Net unrealized appreciation (depreciation) of investments | | | (5,293,023 | ) | | | (687,873 | ) | | | | | | | (5,980,896 | ) |
Net assets | | $ | 92,195,585 | | | $ | 18,384,483 | | | $ | (190,000 | ) | | $ | 110,390,068 | |
| (a) | Non-recurring cost associated with the proposed Reorganization (estimated to be $190,000) which will be borne by the shareholders of the Growth Fund if the Reorganization is approved and completed. |
| (b) | The pro forma statements presume the issuance by Santa Barbara Dividend Growth of approximately 1,911,098 Class A shares, 456,767 Class B shares, 1,159,005 Class C shares, and 505,692 Class I shares in exchange for the assets and liabilities of Rittenhouse Growth after their reduction for the costs associated with the proposed reorganization. |
See accompanying notes to financial statements.
6
Pro Forma Statement of Operations (Unaudited)
Year Ended July 31, 2008
| | | | | | | | | | | | | | | | |
| | | Growth
Fund
(Actual) | | | Dividend Growth
Fund
(Actual) | | | Pro Forma
Adjustments | | | Combined Fund
(Pro Forma) | |
Dividend and Interest Income (net of foreign tax withheld of $33,927, $6,371 and $40,298, respectively) | | $ | 1,617,627 | | | $ | 316,659 | | | | | | | $ | 1,934,286 | |
Expenses | | | | | | | | | | | | | | | | |
Management fees | | | 893,624 | | | | 80,071 | | | | (52,956 | ) (a) | | | 920,739 | |
12b-1 service fees – Class A | | | 116,080 | | | | 5,886 | | | | | | | | 121,966 | |
12b-1 distribution and service fees – Class B | | | 158,423 | | | | 8,633 | | | | | | | | 167,056 | |
12b-1 distribution and service fees – Class C | | | 319,755 | | | | 25,432 | | | | | | | | 345,187 | |
Shareholders’ servicing agent fees and expenses | | | 299,470 | | | | 10,450 | | | | | | | | 309,920 | |
Custodian’s fees and expenses | | | 19,621 | | | | 14,086 | | | | | | | | 33,707 | |
Trustees’ fees and expenses | | | 2,659 | | | | 293 | | | | | | | | 2,952 | |
Professional fees | | | 21,276 | | | | 14,426 | | | | (9,000 | ) (b) | | | 26,702 | |
Shareholders’ reports – printing and mailing expenses | | | 142,756 | | | | 6,381 | | | | (11,000 | ) (b) | | | 138,137 | |
Federal and state registration fees | | | 71,873 | | | | 53,168 | | | | (70,000 | ) (b) | | | 55,041 | |
Other expenses | | | 6,422 | | | | 2,077 | | | | | | | | 8,499 | |
Total expenses before custodian fee credit and expense reimbursement | | | 2,051,959 | | | | 220,903 | | | | (142,956 | ) | | | 2,129,906 | |
Custodian fee credit | | | (125 | ) | | | (4,588 | ) | | | | | | | (4,713 | ) |
Expense reimbursement | | | (168,190 | ) | | | (75,465 | ) | | | (21,405 | ) (c) | | | (265,060 | ) |
Net expenses | | | 1,883,644 | | | | 140,850 | | | | (164,361 | ) | | | 1,860,133 | |
Net investment income (loss) | | | (266,017 | ) | | | 175,809 | | | | 164,361 | | | | 74,153 | |
Realized and Unrealized Gain (Loss) | | | | | | | | | | | | | | | | |
Net realized gain (loss) from investments | | | 260,757 | | | | (489,284 | ) | | | | | | | (228,527 | ) |
Change in net unrealized appreciation (depreciation) of investments | | | (7,598,797 | ) | | | (776,220 | ) | | | | | | | (8,375,017 | ) |
Net realized and unrealized gain (loss) | | | (7,338,040 | ) | | | (1,265,504 | ) | | | | | | | (8,603,544 | ) |
Net increase (decrease) in net assets from operations | | $ | (7,604,057 | ) | | $ | (1,089,695 | ) | | $ | 164,361 | | | $ | (8,529,391 | ) |
| (a) | Reflects the impact of applying the Combined Fund’s fund-level management fee schedule to the Combined Fund’s average net assets. |
| (b) | Reflects the anticipated reduction of certain duplicative expenses eliminated as a result of the Reorganization. |
| (c) | Reflects the impact of applying the Combined Fund’s expense cap to the adjusted operating expenses that would have been in effect if the Reorganization was completed. |
See accompanying notes to financial statements.
7
Notes to Pro Forma Financial Statements (Unaudited)
1. Basis of Combination
The accompanying unaudited pro forma financial statements are presented to show the effect of the proposed Reorganization of Nuveen Rittenhouse Growth Fund (“Growth Fund”) into Nuveen Santa Barbara Dividend Growth Fund (“Dividend Growth Fund”) as if such Reorganization had taken place as of July 31, 2008.
Under the terms of the Agreement and Plan of Reorganization, the combination of the Growth Fund and the Dividend Growth Fund (the “Combined Fund”) will be accounted for by the method of accounting for tax-free mergers of investment companies. The Reorganization would be accomplished by an acquisition of the net assets of the Growth Fund in exchange for shares of the Dividend Growth Fund at net asset value. The statement of assets and liabilities and the related statement of operations of the Growth Fund and Dividend Growth Fund have been combined as of and for the twelve months ended July 31, 2008. Following the acquisition, the Dividend Growth Fund will be the accounting survivor. In accordance with accounting principles generally accepted in the United States of America, the historical cost of investment securities will be carried forward to the surviving fund and the results of operations for pre-combination periods of the surviving fund will not be restated.
The accompanying pro forma financial statements and notes to financial statements should be read in conjunction with the financial statements of the Growth Fund and the Dividend Growth Fund included in their annual reports dated July 31, 2008.
2. General Information and Significant Accounting Policies
The Combined Fund is a series of Nuveen Investment Trust II (the “Trust”). The Trust is an open-end management investment company registered under the Investment Company Act of 1940, as amended. The Trust was organized as a Massachusetts business trust in 1997.
The Combined Fund ordinarily invests 80% of its net assets in dividend-paying common and preferred stocks in an attempt to provide income from dividends that is tax-advantaged and to provide long-term capital appreciation. The Combined Fund may also invest up to 25% of its net assets in U.S. dollar-denominated equity securities of non-U.S. companies, including ADRs and other types of dollar-denominated depositary receipts of such companies.
The following is a summary of significant accounting policies followed by the Combined Fund in the preparation of its pro forma financial statements in accordance with accounting principles generally accepted in the United States.
Investment Valuation
Exchange-listed securities are generally valued at the last sales price on the securities exchange on which such securities are primarily traded. Securities traded on a securities exchange for which there are no transactions on a given day or securities not listed on a securities exchange are valued at the mean of the closing bid and asked prices. Securities traded on Nasdaq are valued at the Nasdaq Official Closing Price. If it is determined that the market price for an investment is unavailable or inappropriate, the Board of Trustees of the Fund, or its designee, may establish fair value in accordance with procedures established in good faith by the Board of Trustees. Short-term investments are valued at amortized cost, which approximates value.
Investment Transactions
Investment transactions are recorded on a trade date basis. Realized gains and losses from investment transactions are determined on the specific identification method.
Investment Income
Dividend income is recorded on the ex-dividend date or, for foreign securities, when information is available. Interest income is recorded on an accrual basis.
Dividends and Distributions to Shareholders
Dividends from net investment income are declared and distributed to shareholders quarterly. Dividends from net realized capital gains from investment transactions, if any, are declared and distributed to shareholders at least annually. Furthermore, capital gains are distributed only to the extent they exceed available capital loss carryforwards.
Distributions to shareholders are recorded on the ex-dividend date. The amount and timing of distributions are determined in accordance with federal income tax regulations, which may differ from accounting principles generally accepted in the United States.
Income Taxes
The Combined Fund intends to distribute substantially all of its net investment income and net capital gains to shareholders and to otherwise comply with the requirements of Subchapter M of the Internal Revenue Code applicable to regulated investment companies. Therefore, no federal income tax provision is required.
The Combined Fund is not aware of any tax positions for which it is reasonably possible that the total amounts of unrecognized tax benefits will significantly change in the next twelve months.
Flexible Sales Charge Program
The Combined Fund offers Class A, C and I Shares. Class A Shares are generally sold with an up-front sales charge and incur a .25% annual 12b-1 service fee. Class A Share purchases of $1 million or more are sold at net asset value without an up-front sales charge
8
Notes to Pro Forma Financial Statements (Unaudited) (continued)
but may be subject to a CDSC if redeemed within twelve months of purchase. Class B Shares were sold without an up-front sales charge but incur a .75% annual 12b-1 distribution fee and a .25% annual 12b-1 service fee. Class B Shares are subject to a CDSC of up to 5% depending upon the length of time the shares are held by the investor (CDSC is reduced to 0% at the end of six years). Class B Shares convert to Class A Shares eight years after purchase. Class C Shares are sold without an up-front sales charge but incur a .75% annual 12b-1 distribution fee and a .25% annual 12b-1 service fee. Class C Shares are subject to a CDSC of 1% if redeemed within one year of purchase. Class I Shares are not subject to any sales charge or 12b-1 distribution or service fees.
Foreign Currency Transactions
The Combined Fund is authorized to engage in foreign currency exchange transactions, including foreign currency futures, forward, options and swap contracts. To the extent that the Combined Fund invests in securities and/or contracts that are denominated in a currency other than U.S. dollars, the Combined Fund will be subject to currency risk, which is the risk that an increase in the U.S. dollar relative to the foreign currency will reduce returns or portfolio value. Generally, when the U.S. dollar rises in value against a foreign currency, the Combined Fund’s investments denominated in that currency will lose value because its currency is worth fewer U.S. dollars; the opposite effect occurs if the U.S. dollar falls in relative value. Investments and other assets and liabilities denominated in foreign currencies are converted into U.S. dollars on a spot (i.e. cash) basis at the spot rate prevailing in the foreign currency exchange market at the time of valuation. Purchases and sales of investments and income denominated in foreign currencies are translated into U.S. dollars on the respective dates of such transactions. The gains or losses resulting from changes in foreign exchange rates, if any, are included in “Realized gain (loss) from investments” on the Statement of Operations.
The books and records of the Combined Fund are maintained in U.S. dollars. Foreign currencies, investments and other assets and liabilities are translated into U.S. dollars at 4:00 p.m. Eastern time. Investments and income and expenses are translated on the respective dates of such transactions. Net realized foreign currency gains and losses resulting from changes in exchange rates include foreign currency gains and losses between trade date and settlement date of the transactions, foreign currency transactions, and the difference between the amounts of interest and dividends recorded on the books of the Combined Fund and the amounts actually received.
Derivative Financial Instruments
The Combined Fund is authorized to invest in certain derivative financial instruments, including futures, forwards, options and swap transactions. Although the Combined Fund is authorized to invest in such financial instruments, and may do so in the future, it did not make any such investments during the fiscal year ended July 31, 2008.
Repurchase Agreements
In connection with transactions in repurchase agreements, it is the Combined Fund’s policy that its custodian take possession of the underlying collateral securities, the fair value of which exceeds the principal amount of the repurchase transaction, including accrued interest, at all times. If the seller defaults, and the fair value of the collateral declines, realization of the collateral may be delayed or limited.
Expense Allocation
Expenses of the Combined Fund that are not directly attributable to a specific class of shares are prorated among the classes based on the relative net assets of each class. Expenses directly attributable to a class of shares, which presently only include 12b-1 distribution and service fees, are recorded to the specific class.
Custodian Fee Credit
The Combined Fund has an arrangement with the custodian bank whereby certain custodian fees and expenses are reduced by net credits earned on the Combined Fund’s cash on deposit with the bank. Such deposit arrangements are an alternative to overnight investments. Credits for cash balances may be offset by charges for any days on which the Combined Fund overdraws its account at the custodian bank.
Indemnifications
Under the Trust’s organizational documents, its Officers and Trustees are indemnified against certain liabilities arising out of the performance of their duties to the Trust. In addition, in the normal course of business, the Trust enters into contracts that provide general indemnifications to other parties. The Trust’s maximum exposure under these arrangements is unknown as this would involve future claims that may be made against the Trust that have not yet occurred. However, the Trust has not had prior claims or losses pursuant to these contracts and expects the risk of loss to be remote.
Use of Estimates
The preparation of financial statements in conformity with accounting principles generally accepted in the United States requires management to make estimates and assumptions that affect the reported amounts of assets and liabilities at the date of the financial statements and the reported amounts of increases and decreases in net assets from operations during the reporting period. Actual results may differ from those estimates.
3. Income Tax Information
The following information is presented on an income tax basis. Differences between amounts for financial statement and federal income tax purposes are primarily due to timing differences in recognizing certain gains and losses on investment transactions. To
9
Notes to Pro Forma Financial Statements (Unaudited) (continued)
the extent that differences arise that are permanent in nature, such amounts are reclassified within the capital accounts on the Statement of Assets and Liabilities presented in the annual report, based on their federal tax basis treatment; temporary differences do not require reclassification. Temporary and permanent differences do not impact the net asset value of the Combined Fund.
At July 31, 2008, the cost of investments was as follows:
| | | |
| | | |
Cost of investments | | $ | 116,262,634 |
Gross unrealized appreciation and gross unrealized depreciation of investments at July 31, 2008, were as follows:
| | | | |
| | | | |
Gross unrealized: | | | | |
Appreciation | | $ | 9,864,975 | |
Depreciation | | | (16,048,622 | ) |
Net unrealized appreciation (depreciation) of investments | | $ | (6,183,647 | ) |
The tax components of undistributed net ordinary income and net long-term capital gains at July 31, 2008, the Combined Fund’s tax year end, were as follows:
| | | |
| | | |
Undistributed net ordinary income* | | $ | 7,034 |
Undistributed net long-term capital gains | | | — |
* Net ordinary income consists of net taxable income derived from dividends, interest, and net short-term capital gains, if any.
At July 31, 2008, the Combined Fund’s tax year end, the Combined Fund had unused capital loss carryforwards available for federal income tax purposes to be applied against future capital gains, if any. If not applied, the carryforwards will expire as follows:
| | | |
| | | |
Expiration: | | | |
July 31, 2009 | | $ | 7,067,416 |
July 31, 2010 | | | 57,624,742 |
July 31, 2011 | | | 10,576,243 |
July 31, 2016 | | | 40,459 |
Total | | $ | 75,308,860 |
4. Management Fees and Other Transactions with Affiliates
The Combined Fund’s management fee is separated into two components – a complex-level component, based on the aggregate amount of all fund assets managed by Nuveen Asset Management (the “Adviser”), a wholly owned subsidiary of Nuveen Investments, Inc. (“Nuveen”), and a specific fund-level component, based only on the amount of assets within the Combined Fund. This pricing structure enables Nuveen fund shareholders to benefit from growth in the assets within each individual fund as well as from growth in the amount of complex-wide assets managed by the Adviser.
The annual fund-level fee, payable monthly, for the Combined Fund is based upon the average daily net assets as follows:
| | | |
| Average Daily Net Assets | | | |
For the first $125 million | | .6000 | % |
For the next $125 million | | .5875 | |
For the next $250 million | | .5750 | |
For the next $500 million | | .5625 | |
For the next $1 billion | | .5500 | |
For net assets over $2 billion | | .5250 | |
The annual complex-level fee, payable monthly, which is additive to the fund-level fee, for all Nuveen sponsored funds in the U.S., is based on the aggregate amount of total fund assets managed as stated in the tables below. As of September 30, 2008, the complex-level fee rate was .1947%.
10
Notes to Pro Forma Financial Statements (Unaudited) (continued)
The complex-level fee schedule is as follows:
| | | |
| Complex-Level Asset Breakpoint Level* | | Effective Rate at Breakpoint Level | |
$55 billion | | .2000 | % |
$56 billion | | .1996 | |
$57 billion | | .1989 | |
$60 billion | | .1961 | |
$63 billion | | .1931 | |
$66 billion | | .1900 | |
$71 billion | | .1851 | |
$76 billion | | .1806 | |
$80 billion | | .1773 | |
$91 billion | | .1691 | |
$125 billion | | .1599 | |
$200 billion | | .1505 | |
$250 billion | | .1469 | |
$300 billion | | .1445 | |
| * | The complex-level fee component of the management fee for the funds is calculated based upon the aggregate Managed Assets (“Managed Assets” means the average daily net assets of each fund including assets attributable to preferred stock issued by or borrowings by the Nuveen funds) of Nuveen sponsored funds in the U.S. |
The management fee compensates the Adviser for overall investment advisory and administrative services and general office facilities. The Adviser has entered into a Sub-Advisory Agreement with Santa Barbara Asset Management (“Santa Barbara”), a wholly owned subsidiary of Nuveen. Santa Barbara is compensated for its services to the Combined Fund from the management fee paid to the Adviser.
The Adviser agreed to waive part of its management fees or reimburse certain expenses of the Combined Fund through November 30, 2011, so that total operating expenses (excluding 12b-1 distribution and service fees, interest expense, taxes, fees incurred in acquiring and disposing of portfolio securities and extraordinary expenses) do not exceed 1.05% (1.25% after November 30, 2011) of the Combined Fund’s average daily net assets.
The Adviser may also voluntarily reimburse additional expenses from time to time. Voluntary reimbursements may be terminated at any time at the Adviser’s discretion.
The Trust pays no compensation directly to those of its trustees who are affiliated with the Adviser or to its officers, all of whom receive remuneration for their services to the Trust from the Adviser or its affiliates. The Board of Trustees has adopted a deferred compensation plan for independent trustees that enables them to elect to defer receipt of all or a portion of the annual compensation they are entitled to receive from certain Nuveen-advised funds. Under the plan, deferred amounts are treated as though equal dollar amounts had been invested in shares of select Nuveen-advised funds.
11
November 28, 2008
NUVEEN INVESTMENT TRUST II
333 West Wacker Drive
Chicago, Illinois 60606
Nuveen Santa Barbara Dividend Growth Fund
Nuveen Santa Barbara Growth Fund
Nuveen Santa Barbara Growth Opportunities Fund
Nuveen Rittenhouse Growth Fund
STATEMENT OF ADDITIONAL INFORMATION
This Statement of Additional Information is not a prospectus. This Statement of Additional Information relates to, and should be read in conjunction with, the Prospectus for the Nuveen Santa Barbara Dividend Growth Fund (the “Dividend Growth Fund”), Nuveen Santa Barbara Growth Fund (the “Growth Fund”), Nuveen Santa Barbara Growth Opportunities Fund (the “Growth Opportunities Fund”) and Nuveen Rittenhouse Growth Fund (the “Rittenhouse Fund”) (individually, a “Fund,” and collectively, the “Funds”) dated November 28, 2008. A Prospectus may be obtained without charge from certain securities representatives, banks and other financial institutions that have entered into sales agreements with Nuveen Investments, LLC (“Nuveen”), or from a Fund, by written request to the applicable Fund, c/o Nuveen Investor Services, P.O. Box 8530, Boston, Massachusetts 02266-8530, or by calling (800) 257-8787.
TABLE OF CONTENTS
| | |
| | | Page |
General Information | | S-2 |
| |
Investment Restrictions | | S-2 |
| |
Investment Policies and Techniques | | S-4 |
| |
Management | | S-19 |
| |
Fund Manager and Sub-Advisers | | S-33 |
| |
Portfolio Transactions | | S-39 |
| |
Net Asset Value | | S-41 |
| |
Tax Matters | | S-42 |
| |
Additional Information on the Purchase and Redemption of Fund Shares and Shareholder Programs | | S-44 |
| |
Disclosure of Portfolio Holdings | | S-56 |
| |
Distribution and Service Plans | | S-56 |
| |
Independent Registered Public Accounting Firm, Custodian and Transfer Agent | | S-58 |
| |
Financial Statements | | S-58 |
| |
General Trust Information | | S-58 |
The audited financial statements for each Fund’s most recent fiscal year appear in the Fund’s Annual Report dated July 31, 2008; each is incorporated herein by reference and is available without charge by calling (800) 257-8787.
GENERAL INFORMATION
The Funds are diversified series of Nuveen Investment Trust II (the “Trust”), an open-end management investment company organized as a Massachusetts business trust on June 27, 1997. Each series of the Trust represents shares of beneficial interest in a separate portfolio of securities and other assets, with its own objectives and policies. Currently, 23 series of the Trust are authorized and outstanding. On July 28, 2003 the Nuveen Innovation Fund reorganized with and into the Rittenhouse Fund.
Certain matters under the Investment Company Act of 1940, as amended (the “1940 Act”), which must be submitted to a vote of the holders of the outstanding voting securities of a series, shall not be deemed to have been effectively acted upon unless approved by the holders of a majority of the outstanding voting shares of each series affected by such matter.
INVESTMENT RESTRICTIONS
The investment objective and certain fundamental investment policies of each Fund are described in the Prospectus for that Fund. A Fund, as a fundamental policy, may not, without the approval of the holders of a majority of the Fund’s outstanding voting shares:
(1) With respect to 75% of the total assets of the Funds, individually, purchase the securities of any issuer (except securities issued or guaranteed by the United States government or any agency or instrumentality thereof) if, as a result, (i) more than 5% of a Fund’s total assets would be invested in securities of that issuer, or (ii) a Fund would hold more than 10% of the outstanding voting securities of that issuer.
(2) With respect to the Dividend Growth Fund, the Growth Fund and the Growth Opportunities Fund (collectively, the “Santa Barbara Funds”), borrow money, except as permitted by the 1940 Act and exemptive orders granted under the 1940 Act.
(3) With respect to the Rittenhouse Fund, borrow money, except that the Fund may (i) borrow money from banks for temporary or emergency purposes (but not for leverage or the purchase of investments) and (ii) make other investments or engage in other transactions permissible under the 1940 Act that may involve a borrowing, provided that the combination of (i) and (ii) shall not exceed 33 1/3% of the value of the Fund’s total assets (including the amount borrowed), less the Fund’s liabilities (other than borrowings).
(4) Act as an underwriter of another issuer’s securities, except to the extent that a Fund may be deemed to be an underwriter within the meaning of the Securities Act of 1933 in connection with the purchase and sale of portfolio securities.
(5) With respect to the Santa Barbara Funds, make loans except as permitted by the 1940 Act and exemptive orders granted under the 1940 Act.
(6) With respect to the Rittenhouse Fund, make loans to other persons, except through (i) the purchase of debt securities permissible under a Fund’s investment policies, (ii) repurchase agreements, or (iii) the lending of portfolio securities, provided that no such loan of portfolio securities my be made by a Fund if, as a result, the aggregate of such loans would exceed 33 1/3% of the value of the Fund’s total assets.
(7) Purchase or sell physical commodities unless acquired as a result of ownership of securities or other instruments (but this shall not prevent a Fund from purchasing or selling options, futures contracts, or other derivative instruments, or from investing in securities or other instruments backed by physical commodities).
(8) Purchase or sell real estate unless acquired as a result of ownership of securities or other instruments (but this shall not prohibit a Fund from purchasing or selling securities or other instruments backed by real estate or of issuers engaged in real estate activities).
(9) Issue senior securities, except as permitted under the 1940 Act.
S-2
(10) Purchase the securities of any issuer if, as a result, 25% or more of a Fund’s total assets would be invested in the securities of issuers whose principal business activities are in the same industry; except that this restriction shall not be applicable to securities issued or guaranteed by the U.S. government or any agency or instrumentality thereof.
Except for restriction (3) that relates exclusively to the Rittenhouse Fund, the foregoing restrictions and limitations will apply only at the time of purchase of securities, and the percentage limitations will not be considered violated unless an excess or deficiency occurs or exists immediately after and as a result of an acquisition of securities, unless otherwise indicated.
The foregoing fundamental investment policies, together with the investment objective of each Fund and certain other policies specifically identified in the Prospectus, cannot be changed without approval by holders of a “majority of the Fund’s outstanding voting shares.” As defined in the 1940 Act, this means the vote of (i) 67% or more of the Fund’s shares present at a meeting, if the holders of more than 50% of the Fund’s shares are present or represented by proxy, or (ii) more than 50% of the Fund’s shares, whichever is less.
In addition to the foregoing fundamental investment policies, each Fund is also subject to the following non-fundamental restrictions and policies, which may be changed by the Board of Trustees. A Fund may not:
(1) Sell securities short, unless a Fund owns or has the right to obtain securities equivalent in kind and amount to the securities sold short at no added cost, and provided that transactions in options, futures contracts, options on futures contracts, or other derivative instruments are not deemed to constitute selling securities short.
(2) Purchase securities on margin, except that a Fund may obtain such short term credits as are necessary for the clearance of transactions; and provided that margin deposits in connection with futures contracts, options on futures contracts, or other derivative instruments shall not constitute purchasing securities on margin.
(3) Purchase securities of open-end and closed-end investment companies except in compliance with the 1940 Act.
(4) Enter into futures contracts or related options if more than 30% of the Fund’s net assets would be represented by such instruments or more than 5% of the Fund’s net assets would be committed to initial margin deposits and premiums on futures contracts and related options.
(5) Invest in direct interests in oil, gas or other mineral exploration programs or leases; however, a Fund may invest in the securities of issuers that engage in these activities.
(6) Purchase securities when borrowings exceed 5% of its total assets. If due to market fluctuations or other reasons, the value of a Fund’s assets falls below 300% of its borrowings, the Fund will reduce its borrowings within 3 business days.
(7) Invest in illiquid securities if, as a result of such investment, more than 15% of a Fund’s net assets would be invested in illiquid securities.
S-3
INVESTMENT POLICIES AND TECHNIQUES
The following information supplements the discussion of the Funds’ investment objectives, policies, and techniques that appears in the Prospectus for the Funds.
Equity Securities
Under normal market conditions, the Funds invest primarily in equity securities, which include common stocks, preferred stocks, warrants, convertible securities and other securities with equity characteristics.
Common Stocks
Common stocks represent units of ownership in a company. Common stocks usually carry voting rights and earn dividends. Unlike preferred stocks, which are described below, dividends on common stocks are not fixed but are declared at the discretion of a company’s board.
Preferred Stocks
Preferred stocks are also units of ownership in a company. Preferred stocks normally have preference over common stock in the payment of dividends and the liquidation of the company. However, in all other respects, preferred stocks are subordinated to the liabilities of the issuer. Unlike common stocks, preferred stocks are generally not entitled to vote on corporate matters. Types of preferred stocks include adjustable-rate preferred stock, fixed dividend preferred stock, perpetual preferred stock, and sinking fund preferred stock. Generally, the market value of preferred stock with a fixed dividend rate and no conversion element varies inversely with interest rates and perceived credit risk.
Warrants
The Santa Barbara Funds may invest in warrants if, after giving effect thereto, not more than 5% of their net assets will be invested in warrants other than warrants acquired in units or attached to other securities. The Rittenhouse Fund does not intend to invest more than 5% of its net assets in warrants. Investing in warrants is purely speculative in that they have no voting rights, pay no dividends, and have no rights with respect to the assets of the corporation issuing them. Warrants basically are options to purchase equity securities at a specific price for a specific period of time. They do not represent ownership of the securities but only the right to buy them. Warrants are issued by the issuer of the security, which may be purchased on their exercise. The prices of warrants do not necessarily parallel the prices of the underlying securities.
Convertible Securities
Convertible securities for the Rittenhouse Fund must be rated A or higher by Moody’s, S&P or Fitch when purchased. Convertible securities are hybrid securities that combine the investment characteristics of bonds and common stocks. Convertible securities typically consist of debt securities or preferred stock that may be converted within a specified period of time (typically for the entire life of the security) into a certain amount of common stock or other equity security of the same or a different issuer at a predetermined price. They also include debt securities with warrants or common stock attached and derivatives combining the features of debt securities and equity securities. Convertible securities entitle the holder to receive interest paid or accrued on debt, or dividends paid or accrued on preferred stock, until the security matures or is redeemed, converted or exchanged.
The market value of a convertible security generally is a function of its “investment value” and its “conversion value.” A security’s “investment value” represents the value of the security without its conversion feature (i.e., a comparable nonconvertible fixed-income security). The investment value is determined by, among other things, reference to its credit quality and the current value of its yield to maturity or probable call date. At any given time, investment value is dependent upon such factors as the general level of interest rates, the yield of similar nonconvertible securities, the financial strength of the issuer and the seniority of the security in the issuer’s capital structure. A security’s “conversion value” is determined by multiplying the number of shares the holder is entitled to receive upon conversion or exchange by the current price of the underlying security. If the conversion value of a convertible security is significantly below its investment value, the convertible security will trade like nonconvertible debt or
S-4
preferred stock in the sense that its market value will not be influenced greatly by fluctuations in the market price of the underlying security into which it can be converted. Instead, the convertible security’s price will tend to move in the opposite direction from interest rates. Conversely, if the conversion value of a convertible security is significantly above its investment value, the market value of the convertible security will be more heavily influenced by fluctuations in the market price of the underlying stock. In that case, the convertible security’s price may be as volatile as that of the common stock. Because both interest rate and market movements can influence its value, a convertible security is not generally as sensitive to interest rates as a similar fixed-income security, nor is it generally as sensitive to changes in share price as its underlying stock.
A Fund’s investments in convertible securities, particularly securities that are convertible into securities of an issuer other than the issuer of the convertible security, may be illiquid—that is, a Fund may not be able to dispose of such securities in a timely fashion or for a fair price, which could result in losses to the Fund. A Fund’s investments in convertible securities may at times include securities that have a mandatory conversion feature, pursuant to which the securities convert automatically into common stock or other equity securities (of the same or a different issuer) at a specified date and a specified conversion ratio, or that are convertible at the option of the issuer. For issues where the conversion of the security is not at the option of the holder, the Fund may be required to convert the security into the underlying common stock even at times when the value of the underlying common stock or other equity security has declined substantially.
In addition, some convertibles are often rated below investment-grade or are not rated, and therefore may be considered speculative investments. Companies that issue convertible securities are usually small to medium size, and accordingly carry the capitalization risks described in the Prospectus. In addition, the credit rating of a company’s convertible securities is generally lower than that of its conventional debt securities. Convertibles are normally considered “junior” securities—that is, the company usually must pay interest on its conventional corporate debt before it can make payments on its convertible securities. Some convertibles are particularly sensitive to interest rate changes when their predetermined conversion price is much higher than the issuing company’s common stock.
Over-the-Counter Market
The Funds may invest in over-the-counter stocks. In contrast to the securities exchanges, the over-the-counter market is not a centralized facility that limits trading activity to securities of companies which initially satisfy certain defined standards. Generally, the volume of trading in an unlisted or over-the-counter common stock is less than the volume of trading in a listed stock. This means that the depth of market liquidity of some stocks in which the Funds invest may not be as great as that of other securities and, if the Funds were to dispose of such a stock, they might have to offer the shares at a discount from recent prices, or sell the shares in small lots over an extended period of time.
Initial Public Offerings (“IPO”)
The Funds may invest a portion of their assets in securities of companies offering shares in IPOs. IPOs may have a magnified performance impact on the Funds with a small asset base. The impact of IPOs on the Funds’ performance likely will decrease as the Funds’ asset size increases, which could reduce each Fund’s total returns. IPOs may not be consistently available to a Fund for investing, particularly as the Fund’s asset base grows. Because IPO shares frequently are volatile in price, a Fund may hold IPO shares for a very short period of time. This may increase the turnover of a Fund and may lead to increased expenses for a Fund, such as commissions and transaction costs. By selling shares, a Fund may realize taxable gains it will subsequently distribute to shareholders. In addition, the market for IPO shares can be speculative and/or inactive for extended periods of time. The limited number of shares available for trading in some IPOs may make it more difficult for a Fund to buy or sell significant amounts of shares without an unfavorable impact on prevailing prices. Shareholders in IPO shares can be affected by substantial dilution in the value of their shares, by sales of additional shares and by concentration of control in existing management and principal shareholders.
A Fund’s investment in IPO shares may include the securities of unseasoned companies (companies with less than three years of continuous operations), which presents risks considerably greater than common stocks of more established companies. These companies may have limited operating histories and their prospects for profitability may be uncertain. These companies may be involved in new and
S-5
evolving businesses and may be vulnerable to competition and changes in technology, markets and economic conditions. They may be more dependent on key managers and third parties and may have limited product lines.
General Risks of Investing in Stocks
While investing in stocks allows shareholders to participate in the benefits of owning a company, such shareholders must accept the risks of ownership. Unlike bondholders, who have preference to a company’s earnings and cash flow, preferred stockholders, followed by common stockholders in order of priority, are entitled only to the residual amount after a company meets its other obligations. For this reason, the value of a company’s stock will usually react more strongly to actual or perceived changes in the company’s financial condition or prospects than its debt obligations. Stockholders of a company that fares poorly can lose money.
Stock markets tend to move in cycles with short or extended periods of rising and falling stock prices. The value of a company’s stock may fall because of:
| | • | | Factors that directly relate to that company, such as decisions made by its management or lower demand for the company’s products or services; |
| | • | | Factors affecting an entire industry, such as increases in production costs; and |
| | • | | Changes in financial market conditions that are relatively unrelated to the company or its industry, such as changes in interest rates, currency exchange rates or inflation rates. |
Because preferred stock is generally junior to debt securities and other obligations of the issuer, deterioration in the credit quality of the issuer will cause greater changes in the value of a preferred stock than in a more senior debt security with similar stated yield characteristics.
The Funds may invest in securities of issuers with small or medium market capitalizations. Any investment in small and medium capitalization companies involves greater risk and price volatility than that customarily associated with investments in larger, more established companies. This increased risk may be due to the greater business risks of their small or medium size, limited markets and financial resources, narrow product lines and frequent lack of management depth. The securities of small and medium capitalization companies are often traded in the over-the-counter market, and might not be traded in volumes typical of securities traded on a national securities exchange. Thus, the securities of small and medium capitalization companies are likely to be less liquid and subject to more abrupt or erratic market movements than securities of larger, more established companies.
Non-U.S. Securities
The Funds may invest in a variety of non-U.S. securities. Investments in non-U.S. securities involve risks in addition to the usual risks inherent in domestic investments, including currency risk. The value of a non-U.S. security in U.S. dollars tends to decrease when the value of the U.S. dollar rises against the non-U.S. currency in which the security is denominated and tends to increase when the value of the U.S. dollar falls against such currency.
Non-U.S. securities are affected by the fact that in many countries there is less publicly available information about issuers than is available in the reports and ratings published about companies in the United States and companies may not be subject to uniform accounting, auditing and financial reporting standards. Other risks inherent in non-U.S. investments include expropriation; confiscatory taxation; withholding taxes on dividends and interest; less extensive regulation of non-U.S. brokers, securities markets and issuers; diplomatic developments; and political or social instability. Non-U.S. economies may differ favorably or unfavorably from the U.S. economy in various respects, and many non-U.S. securities are less liquid and their prices tend to be more volatile than comparable U.S. securities. From time to time, non-U.S. securities may be difficult to liquidate rapidly without adverse price effects.
The Funds may invest directly in dollar-denominated securities of non-U.S. issuers. The Funds may invest in non-U.S. securities by purchasing depositary receipts, denominated in U.S. dollars, including American Depositary Receipts (“ADRs”), European Depositary Receipts (“EDRs”), Global Depositary Receipts (“GDRs”) or other securities representing indirect ownership interests in the securities of non-U.S. issuers. Generally, ADRs, in registered form, are denominated in U.S. dollars and are designated for
S-6
use in the U.S. securities markets, while EDRs and GDRs are typically in bearer form and may be denominated in non-U.S. currencies and are designed for use in European and other markets. ADRs are receipts typically issued by a U.S. bank or trust company evidencing ownership of the underlying non-U.S. security. ADRs, EDRs and GDRs are deemed to have the same classification as the underlying securities they represent, except that ADRs, EDRs and GDRs shall be treated as indirect non-U.S. investments. Thus, an ADR, EDR or GDR representing ownership of common stock will be treated as common stock. ADRs, EDRs and GDRs do not eliminate all of the risks associated with directly investing in the securities of non-U.S. issuers, such as changes in non-U.S. currency exchange rates. However, by investing in ADRs rather than directly in non-U.S. issuers’ stock, the Funds avoid currency risks during the settlement period. Some ADRs may not be sponsored by the issuer.
Other types of depositary receipts include American Depositary Shares (“ADSs”), Global Depositary Certificates (“GDCs”) and International Depositary Receipts (“IDRs”). ADSs are shares issued under a deposit agreement representing the underlying ordinary shares that trade in the issuer’s home market. An ADR, described above, is a certificate that represents a number of ADSs. GDCs and IDRs are typically issued by a non-U.S. bank or trust company, although they may sometimes also be issued by a U.S. bank or trust company. GDCs and IDRs are depositary receipts that evidence ownership of underlying securities issued by either a non-U.S. or a U.S. corporation.
Depositary receipts may be available through “sponsored” or “unsponsored” facilities. A sponsored facility is established jointly by a depositary and the issuer of the security underlying the receipt. An unsponsored facility may be established by a depositary without participation by the issuer of the security underlying the receipt. There are greater risks associated with holding unsponsored depositary receipts. For example, if a Fund holds an unsponsored depositary receipt, it will generally bear all of the costs of establishing the unsponsored facility. In addition, the depositary of an unsponsored facility frequently is under no obligation to distribute shareholder communications received from the issuer of the deposited security. Whether a sponsored or unsponsored facility, there is no assurance that either would pass through to the holders of the receipts voting rights with respect to the deposited securities.
In considering whether to invest in the securities of a non-U.S. company, the portfolio manager considers such factors as the characteristics of the particular company, differences between economic trends, and the performance of securities markets within the United States and those within other countries. The portfolio manager also considers factors relating to the general economic, governmental and social conditions of the country or countries where the company is located.
Securities transactions conducted outside the United States may not be regulated as rigorously as in the United States, may not involve a clearing mechanism and related guarantees, and are subject to the risk of governmental actions affecting trading in, or the prices of, non-U.S. securities, currencies and other instruments. The value of such positions also could be adversely affected by (i) other complex non-U.S. political, legal and economic factors, (ii) lesser availability than in the United States of data on which to make trading decisions, (iii) delays in a Fund’s ability to act upon economic events occurring in non-U.S. markets during non-business hours in the United States, (iv) the imposition of different exercise and settlement terms and procedures and the margin requirements than in the United States, (v) currency exchange rate changes, and (vi) lower trading volume and liquidity.
Currency Risk
By investing in non-U.S. securities, a Fund will be subject to currency risk, which is the risk that an increase in the U.S. dollar relative to the non-U.S. currency will reduce returns or portfolio value. Generally, when the U.S. dollar rises in value relative to a non-U.S. currency, a Fund’s investment in securities denominated in that currency will lose value because its currency is worth fewer U.S. dollars. On the other hand, when the value of the U.S. dollar falls relative to a non-U.S. currency, a Fund’s investments denominated in that currency will tend to increase in value because that currency is worth more U.S. dollars. The exchange rates between the U.S. dollar and non-U.S. currencies depend upon such factors as supply and demand in the currency exchange markets, international balance of payments, governmental intervention, speculation, and other economic and political conditions. Although a Fund values its assets daily in U.S. dollars, such Fund may not convert its holdings of non-U.S. currencies to U.S. dollars on a daily basis. A Fund may incur conversion costs when it converts its holdings to another currency. Non-U.S. exchange dealers may realize a profit on the difference between
S-7
the price at which a Fund buys and sells currencies. A Fund may engage in non-U.S. currency exchange transactions in connection with its portfolio investments. A Fund conducts its non-U.S. currency exchange transactions either on a spot (i.e., cash) basis at the spot rate prevailing in the non-U.S. currency exchange market or through forward contracts to purchase or sell non-U.S. contracts.
Cash Equivalents and Short-Term Investments
The Santa Barbara Funds may invest up to 10% of its total assets, and for temporary defensive purposes or to keep cash on hand fully invested up to 100% of its total assets, in cash equivalents, money market funds and short-term taxable fixed income securities. The Rittenhouse Fund may invest up to 100% of its total assets, for temporary defensive purposes and to keep cash on hand fully invested, in cash equivalents and short-term taxable fixed income securities. The short-term taxable fixed income securities issuers shall have a long-term rating of at least A or higher by S&P, Moody’s or Fitch and shall have a maturity of one year or less. Short-term taxable fixed income securities are defined to include, without limitation, the following:
(1) Each Fund may invest in U.S. government securities, including bills, notes and bonds differing as to maturity and rates of interest, which are either issued or guaranteed by the U.S. Treasury or by U.S. government agencies or instrumentalities. U.S. government agency securities include securities issued by (a) the Federal Housing Administration, Farmers Home Administration, Export-Import Bank of the United States, Small Business Administration, and the Government National Mortgage Association, whose securities are supported by the full faith and credit of the United States; (b) the Federal Home Loan Banks, Federal Intermediate Credit Banks, and the Tennessee Valley Authority, whose securities are supported by the right of the agency to borrow from the U.S. Treasury; (c) the Federal National Mortgage Association, whose securities are supported by the discretionary authority of the U.S. government to purchase certain obligations of the agency or instrumentality; and (d) the Student Loan Marketing Association, whose securities are supported only by its credit. While the U.S. government provides financial support to such U.S. government-sponsored agencies or instrumentalities, no assurance can be given that it always will do so since it is not so obligated by law. The U.S. government, its agencies, and instrumentalities do not guarantee the market value of their securities, and consequently, the value of such securities may fluctuate. In addition, the Fund may invest in sovereign debt obligations of non-U.S. countries. A sovereign debtor’s willingness or ability to repay principal and interest in a timely manner may be affected by a number of factors, including its cash flow situation, the extent of its non-U.S. reserves, the availability of sufficient non-U.S. exchange on the date a payment is due, the relative size of the debt service burden to the economy as a whole, the sovereign debtor’s policy toward principal international lenders and the political constraints to which it may be subject.
(2) Each Fund may invest in certificates of deposit issued against funds deposited in a bank or savings and loan association. Such certificates are for a definite period of time, earn a specified rate of return, and are normally negotiable. If such certificates of deposit are non-negotiable, they will be considered illiquid securities and be subject to the Fund’s 15% restriction on investments in illiquid securities. Pursuant to the certificate of deposit, the issuer agrees to pay the amount deposited plus interest to the bearer of the certificate on the date specified thereon. Under current FDIC regulations, the maximum insurance payable as to any one certificate of deposit is $100,000; therefore, certificates of deposit purchased by a Fund may not be fully insured.
(3) Each Fund may invest in bankers’ acceptances, which are short-term credit instruments used to finance commercial transactions. Generally, an acceptance is a time draft drawn on a bank by an exporter or an importer to obtain a stated amount of funds to pay for specific merchandise. The draft is then “accepted” by a bank that, in effect, unconditionally guarantees to pay the face value of the instrument on its maturity date. The acceptance may then be held by the accepting bank as an asset or it may be sold in the secondary market at the going rate of interest for a specific maturity.
(4) Each Fund may invest in repurchase agreements which involve purchases of debt securities. In such an action, at the time the Fund purchases the security, it simultaneously agrees to resell and redeliver the security to the seller, who also simultaneously agrees to buy back the security at a fixed price and time. This assures a predetermined yield for a Fund during its holding period since the resale price is always greater than the purchase price and reflects an agreed-upon market rate.
S-8
Such actions afford an opportunity for a Fund to invest temporarily available cash. A Fund may enter into repurchase agreements only with respect to obligations of the U.S. government, its agencies or instrumentalities; certificates of deposit; or bankers’ acceptances in which the Fund may invest. Repurchase agreements may be considered loans to the seller, collateralized by the underlying securities. The risk to a Fund is limited to the ability of the seller to pay the agreed-upon sum on the repurchase date; in the event of default, the repurchase agreement provides that the affected Fund is entitled to sell the underlying collateral. If the value of the collateral declines after the agreement is entered into, however, and if the seller defaults under a repurchase agreement when the value of the underlying collateral is less than the repurchase price, the Fund could incur a loss of both principal and interest. The portfolio manager monitors the value of the collateral at the time the action is entered into and at all times during the term of the repurchase agreement. The portfolio manager does so in an effort to determine that the value of the collateral always equals or exceeds the agreed-upon repurchase price to be paid to a Fund. If the seller were to be subject to a federal bankruptcy proceeding, the ability of a Fund to liquidate the collateral could be delayed or impaired because of certain provisions of the bankruptcy laws.
(5) Each Fund may invest in bank time deposits, which are monies kept on deposit with banks or savings and loan associations for a stated period of time at a fixed rate of interest. There may be penalties for the early withdrawal of such time deposits, in which case the yields of these investments will be reduced.
(6) Each Fund may invest in commercial paper, which are short-term unsecured promissory notes, including variable rate master demand notes issued by corporations to finance their current operations. Master demand notes are direct lending arrangements between a Fund and a corporation. There is no secondary market for the notes. However, they are redeemable by a Fund at any time. The portfolio manager will consider the financial condition of the corporation (e.g., earning power, cash flow, and other liquidity ratios) and will continuously monitor the corporation’s ability to meet all of its financial obligations, because a Fund’s liquidity might be impaired if the corporation were unable to pay principal and interest on demand. The Santa Barbara Funds may only invest in commercial paper rated A-2 or better by S&P, Prime-2 or higher by Moody’s or F2 or higher by Fitch, or unrated commercial paper which is, in the opinion of the portfolio manager, of comparable quality. The Rittenhouse Fund may only invest in commercial paper rated A-1 or better by S&P, Prime-l or better by Moody’s or F2 or higher by Fitch, or unrated commercial paper which is, in the opinion of the portfolio manager, of comparable quality.
Hedging Strategies
General Description of Hedging Strategies
Each Fund may utilize a variety of financial instruments, including options, futures contracts (sometimes referred to as “futures”), forward contracts, options and swaps to attempt to hedge a Fund’s holdings.
Derivative hedges are generally used to hedge against price movements in one or more particular securities positions that a Fund owns or intends to acquire. Such instruments may also be used to “lock-in” realized but unrecognized gains in the value of portfolio securities. Hedging instruments on stock indices, in contrast, generally are used to hedge against price movements in broad equity market sectors in which a Fund has invested or expects to invest. Hedging strategies, if successful, can reduce the risk of loss by wholly or partially offsetting the negative effect of unfavorable price movements in the investments being hedged. However, hedging strategies can also reduce the opportunity for gain by offsetting the positive effect of favorable price movements in the hedged investments. A Fund may also use derivative instruments to manage the risks of its assets. Risk management strategies include, but are not limited to, facilitating the sale of securities, establishing a position in the derivatives markets as a substitute for buying or selling certain securities or creating or altering exposure to certain asset classes, such as non-U.S. securities. The use of derivative instruments may provide a less expensive, more expedient, or more specifically focused way for a Fund to invest than would “traditional” securities (i.e., stocks or bonds). The use of hedging instruments is subject to applicable regulations of the Securities and Exchange Commission (the “SEC”), the several options and futures exchanges upon which they are traded, the Commodity Futures Trading Commission (the “CFTC”) and various state regulatory authorities. In addition, a Fund’s ability to use hedging instruments will be limited by tax considerations.
S-9
General Limitations on Futures and Options Transactions
The Trust has filed a notice of eligibility for exclusion from the definition of the term “commodity pool operator” with the CFTC and the National Futures Association (“NFA”), which regulate trading in the futures markets. As a result of the Trust’s filing with the CFTC and the NFA, the Trust, its officers and directors are not subject to the registration requirements of the Commodity Exchange Act, as amended (the “CEA”) and are not subject to regulation as commodity pool operators under the CEA. The Trust reserves the right to engage in transactions involving futures and options thereon to the extent allowed by CFTC regulations in effect from time to time and in accordance with the Trust’s policies.
The foregoing limitations are not fundamental policies of a Fund and may be changed without shareholder approval as regulatory agencies permit. Various exchanges and regulatory authorities have undertaken reviews of options and futures trading in light of market volatility. Among the possible actions that have been presented are proposals to adopt new or more stringent daily price fluctuation limits for futures and options transactions and proposals to increase the margin requirements for various types of futures transactions.
Asset Coverage for Futures and Options Positions
Each Fund will comply with the regulatory requirements of the SEC and the CFTC with respect to coverage of options and futures positions by registered investment companies and, if the guidelines so require, will set aside cash, U.S. government securities, high grade liquid debt securities and/or other liquid assets permitted by the SEC and CFTC in a segregated custodial account in the amount prescribed. Securities held in a segregated account cannot be sold while the futures or options position is outstanding, unless replaced with other permissible assets, and will be marked-to-market daily.
Certain Considerations Regarding Options
There is no assurance that a liquid secondary market on an options exchange will exist for any particular option, or at any particular time, and for some options no secondary market on an exchange or elsewhere may exist. If a Fund is unable to close out a call option on securities that it has written before the option is exercised, the Fund may be required to purchase the optioned securities in order to satisfy its obligation under the option to deliver such securities. If a Fund is unable to effect a closing sale transaction with respect to options on securities that it has purchased, it would have to exercise the option in order to realize any profit and would incur transaction costs upon the purchase and sale of the underlying securities.
The writing and purchasing of options is a highly specialized activity which involves investment techniques and risks different from those associated with ordinary portfolio securities transactions. Imperfect correlation between the options and securities markets may detract from the effectiveness of attempted hedging. Options transactions may result in significantly higher transaction costs for a Fund.
Federal Income Tax Treatment of Options
In the case of transactions involving “nonequity options,” as defined in Section 1256 of the Internal Revenue Code (the “Code”), the Funds will treat any gain or loss arising from the lapse, closing out or exercise of such positions as 60% long-term and 40% short-term capital gain or loss as required by Section 1256 of the Code. In addition, such positions must be marked-to-market as of the last business day of the year, and gain or loss must be recognized for federal income tax purposes in accordance with the 60%/40% rule discussed above even though the position has not been terminated. A “nonequity option” generally includes an option with respect to any group of stocks or a stock index unless the value of the option is determined directly or indirectly by reference to any stock or any narrow-based security index (as defined in the Securities Exchange Act of 1934). If such an option is part of a “mixed straddle” under Code Section 1256, a Fund may be able to make certain elections to avoid this requirement. If an option is treated as part of a straddle under the Code, a Fund may be required to defer capital losses it would otherwise recognize.
Stock Index Options
Each Fund may (i) purchase stock index options for any purpose, (ii) sell stock index options in order to close out existing positions, and/or (iii) write covered options on stock indexes for hedging purposes. Stock index options are put options and call options on various stock indexes. In most
S-10
respects, they are identical to listed options on common stocks. The primary difference between stock options and index options occurs when index options are exercised. In the case of stock options, the underlying security, common stock, is delivered. However, upon the exercise of an index option, settlement does not occur by delivery of the securities comprising the index. The option holder who exercises the index option receives an amount of cash if the closing level of the stock index upon which the option is based is greater than, in the case of a call, or less than, in the case of a put, the exercise price of the option. This amount of cash is equal to the difference between the closing price of the stock index and the exercise price of the option expressed in dollars times a specified multiple.
A stock index fluctuates with changes in the market values of the stock included in the index. For example, some stock index options are based on a broad market index, such as the Standard & Poor’s 500 or the Value Line Composite Index or a narrower market index, such as the Standard & Poor’s 100. Indexes may also be based on an industry or market segment, such as the AMEX Oil and Gas Index or the Computer and Business Equipment Index. Options on stock indexes are currently traded on the following exchanges: the Chicago Board of Options Exchange, the New York Stock Exchange, the American Stock Exchange, the Pacific Stock Exchange, and the Philadelphia Stock Exchange.
A Fund’s use of stock index options is subject to certain risks. Successful use by a Fund of options on stock indexes will be subject to the ability of the portfolio managers to correctly predict movements in the direction of the stock market. This requires different skills and techniques than predicting changes in the prices of individual securities. In addition, a Fund’s ability to effectively hedge all or a portion of the securities in its portfolio, in anticipation of or during a market decline through transactions in put options on stock indexes, depends on the degree to which price movements in the underlying index correlate with the price movements of the securities held by a Fund. Inasmuch as a Fund’s securities will not duplicate the components of an index, the correlation will not be perfect. Consequently, a Fund will bear the risk that the prices of its securities being hedged will not move in the same amount as the prices of its put options on the stock indexes. It is also possible that there may be a negative correlation between the index and a Fund’s securities which would result in a loss on both such securities and the options on stock indexes acquired by the Fund.
The hours of trading for options may not conform to the hours during which the underlying securities are traded. To the extent that the options markets close before the markets for the underlying securities, significant price and rate movements can take place in the underlying markets that cannot be reflected in the options markets. The purchase of options is a highly specialized activity which involves investment techniques and risks different from those associated with ordinary portfolio securities transactions. The purchase of stock index options involves the risk that the premium and transaction costs paid by a Fund in purchasing an option will be lost as a result of unanticipated movements in prices of the securities comprising the stock index on which the option is based. Options transactions may result in significantly higher transaction costs for the Fund.
Futures Contracts
Each Fund may enter into futures contracts (hereinafter referred to as “Futures Contracts”), including index futures, as a hedge against movements in the equity markets, in order to establish more definitely the effective return on securities held or intended to be acquired by a Fund or for other purposes permissible under the CEA. A Fund’s hedging may include sales of futures as an offset against the effect of expected declines in stock prices and purchases of futures as an offset against the effect of expected increases in stock prices. A Fund will not enter into Futures Contracts which are prohibited under the CEA and will, to the extent required by regulatory authorities, enter only into Futures Contracts that are traded on national futures exchanges and are standardized as to maturity date and underlying financial instrument. The principal interest rate futures exchanges in the United States are the Board of Trade of the City of Chicago and the Chicago Mercantile Exchange. Futures exchanges and trading are regulated under the CEA by the CFTC.
An interest rate Futures Contract provides for the future sale by one party and purchase by another party of a specified amount of a specific financial instrument (e.g., a debt security) or currency for a specified price at a designated date, time and place. An index Futures Contract is an agreement pursuant to which the parties agree to take or make delivery of an amount of cash equal to the difference between the value of the index at the close of the last trading day of the contract and the price at which
S-11
the index Futures Contract was originally written. Transaction costs are incurred when a Futures Contract is bought or sold and margin deposits must be maintained. A Futures Contract may be satisfied by delivery or purchase, as the case may be, of the instrument or by payment of the change in the cash value of the index. More commonly, Futures Contracts are closed out prior to delivery by entering into an offsetting transaction in a matching Futures Contract. Although the value of an index might be a function of the value of certain specified securities, no physical delivery of those securities is made. If the offsetting purchase price is less than the original sale price, a gain will be realized; if it is more, a loss will be realized. Conversely, if the offsetting sale price is more than the original purchase price, a gain will be realized; if it is less, a loss will be realized. The transaction costs must also be included in these calculations. There can be no assurance, however, that a Fund will be able to enter into an offsetting transaction with respect to a particular Futures Contract at a particular time. If a Fund is not able to enter into an offsetting transaction, the Fund will continue to be required to maintain the margin deposits on the Futures Contract.
Margin is the amount of funds that must be deposited by a Fund with its custodian in a segregated account in the name of the futures commission merchant in order to initiate futures trading and to maintain the Fund’s open positions in Futures Contracts. A margin deposit is intended to ensure a Fund’s performance of the Futures Contract. The margin required for a particular Futures Contract is set by the exchange on which the Futures Contract is traded and may be significantly modified from time to time by the exchange during the term of the Futures Contract. Futures Contracts are customarily purchased and sold on margins that may range upward from less than 5% of the value of the Futures Contract being traded.
If the price of an open Futures Contract changes (by increase in the case of a sale or by decrease in the case of a purchase) so that the loss on the Futures Contract reaches a point at which the margin on deposit does not satisfy margin requirements, the broker will require an increase in the margin. However, if the value of a position increases because of favorable price changes in the Futures Contract so that the margin deposit exceeds the required margin, the broker will pay the excess to the Fund. In computing daily net asset value, a Fund will mark to market the current value of its open Futures Contracts. The Funds expect to earn interest income on their margin deposits.
Because of the low margin deposits required, futures trading involves an extremely high degree of leverage. As a result, a relatively small price movement in a Futures Contract may result in immediate and substantial loss, as well as gain, to the investor. For example, if at the time of purchase, 10% of the value of the Futures Contract is deposited as margin, a subsequent 10% decrease in the value of the Futures Contract would result in a total loss of the margin deposit, before any deduction for the transaction costs, if the account were then closed out. A 15% decrease would result in a loss equal to 150% of the original margin deposit, if the Futures Contract were closed out. Thus, a purchase or sale of a Futures Contract may result in losses in excess of the amount initially invested in the Futures Contract. However, a Fund would presumably have sustained comparable losses if, instead of the Futures Contract, it had invested in the underlying financial instrument and sold it after the decline.
Most U.S. futures exchanges limit the amount of fluctuation permitted in Futures Contract prices during a single trading day. The day limit establishes the maximum amount that the price of a Futures Contract may vary either up or down from the previous day’s settlement price at the end of a trading session. Once the daily limit has been reached in a particular type of Futures Contract, no trades may be made on that day at a price beyond that limit. The daily limit governs only price movement during a particular trading day and therefore does not limit potential losses, because the limit may prevent the liquidation of unfavorable positions. Futures Contract prices have occasionally moved to the daily limit for several consecutive trading days with little or no trading, thereby preventing prompt liquidation of Futures positions and subjecting some Futures traders to substantial losses.
There can be no assurance that a liquid market will exist at a time when a Fund seeks to close out a Futures position. The Fund would continue to be required to meet margin requirements until the position is closed, possibly resulting in a decline in the Fund’s net asset value. In addition, many of the contracts discussed above are relatively new instruments without a significant trading history. As a result, there can be no assurance that an active secondary market will develop or continue to exist.
S-12
A public market exists in Futures Contracts covering a number of indexes, including, but not limited to, the S&P 500 Index, the S&P 100 Index, the NASDAQ-100 Index, the Value Line Composite Index and the New York Stock Exchange Composite Index.
Options on Futures
Each Fund may also purchase or write put and call options on Futures Contracts and enter into closing transactions with respect to such options to terminate an existing position. A futures option gives the holder the right, in return of the premium paid, to assume a long position (call) or short position (put) in a Futures Contract at a specified exercise price prior to the expiration of the option. Upon exercise of a call option, the holder acquires a long position in the Futures Contract and the writer is assigned the opposite short position. In the case of a put option, the opposite is true. Prior to exercise or expiration, a futures option may be closed out by an offsetting purchase or sale of a futures option of the same series.
Each Fund may use options on Futures Contracts in connection with hedging strategies. Generally, these strategies would be applied under the same market and market sector conditions in which a Fund uses put and call options on securities or indexes. The purchase of put options on Futures Contracts is analogous to the purchase of puts on securities or indexes so as to hedge a Fund’s securities holdings against the risk of declining market prices. The writing of a call option or the purchasing of a put option on a Futures Contract constitutes a partial hedge against declining prices of the securities which are deliverable upon exercise of the Futures Contract. If the futures price at expiration of a written call option is below the exercise price, a Fund will retain the full amount of the option premium which provides a partial hedge against any decline that may have occurred in the Fund’s holdings of securities. If the futures price when the option is exercised is above the exercise price, however, a Fund will incur a loss, which may be offset, in whole or in part, by the increase in the value of the securities held by the Fund that were being hedged. Writing a put option or purchasing a call option on a Futures Contract serves as a partial hedge against an increase in the value of the securities a Fund intends to acquire.
As with investments in Futures Contracts, a Fund is required to deposit and maintain margin with respect to put and call options on Futures Contracts written by it. Such margin deposits will vary depending on the nature of the underlying Futures Contract (and the related initial margin requirements), the current market value of the option, and other futures positions held by the Fund. A Fund will set aside in a segregated account at the Fund’s custodian liquid assets, such as cash, U.S. government securities or other high grade liquid debt obligations equal in value to the amount due on the underlying obligation. Such segregated assets will be marked-to-market daily, and additional assets will be placed in the segregated account whenever the total value of the segregated account falls below the amount due on the underlying obligation.
The risks associated with the use of options on Futures Contracts include the risk that a Fund may close out its position as a writer of an option only if a liquid secondary market exists for such options, which cannot be assured. A Fund’s successful use of options on Futures Contracts depends on the Fund’s portfolio managers’ ability to correctly predict the movement in prices of Futures Contracts and the underlying instruments, which may prove to be incorrect. In addition, there may be imperfect correlation between the instruments being hedged and the Futures Contract subject to the option.
For additional information, see “Futures Contracts.” Certain characteristics of the futures market might increase the risk that movements in the prices of Futures Contracts or options on Futures Contracts might not correlate perfectly with movements in the prices of the investments being hedged. For example, all participants in the futures and options on Futures Contracts markets are subject to daily variation margin calls and might be compelled to liquidate futures or options on Futures Contracts positions whose prices are moving unfavorably to avoid being subject to further calls. These liquidations could increase the price volatility of the instruments and distort the normal price relationship between the futures or options and the investments being hedged. Also, because of initial margin deposit requirements in futures markets, there might be increased participation by speculators in the futures markets. This participation also might cause temporary price distortions. In addition, activities of large traders in both the futures and securities markets involving arbitrage, “program trading,” and other investment strategies might result in temporary price distortions.
S-13
Federal Income Tax Treatment of Futures Contracts
For federal income tax purposes, each Fund is required to recognize as income for each taxable year its net unrealized gains and losses on certain Futures Contracts as of the end of the year, as well as gains and losses actually realized during the year. Except for transactions that are classified as part of a “mixed straddle” under Code Section 1256, any gain or loss recognized with respect to certain Futures Contracts is considered to be 60% long-term capital gain or loss and 40% short-term capital gain or loss, without regard to the holding period of the Futures Contract. If such a Futures Contract is part of a “mixed straddle” under Code Section 1256, the Fund may be able to make certain elections to avoid this requirement.
Each Fund will distribute to shareholders annually any net capital gains which have been recognized for federal income tax purposes (including unrealized gains at the end of the Fund’s fiscal year) on Futures transactions. Such distributions will be combined with distributions of capital gains realized on a Fund’s other investments and shareholders will be advised of the nature of the payments.
Risks and Special Considerations Concerning Derivatives
The use of derivative instruments involves certain general risks and considerations as described below. The specific risks pertaining to certain types of derivative instruments are described below:
(1) Market Risk. Market risk is the risk that the value of the underlying assets may go up or down. Adverse movements in the value of an underlying asset can expose the Fund to losses. Market risk is the primary risk associated with derivative transactions. Derivative instruments may include elements of leverage and, accordingly, fluctuations in the value of the derivative instrument in relation to the underlying asset may be magnified. The successful use of derivative instruments depends upon a variety of factors, particularly the portfolio manager’s ability to predict movements of the securities, currencies, and commodities markets, which may require different skills than predicting changes in the prices of individual securities. There can be no assurance that any particular strategy adopted will succeed. A decision to engage in a derivative transaction will reflect the portfolio manager’s judgment that the derivative transaction will provide value to the applicable Fund and its shareholders and is consistent with the Fund’s objective, investment limitations, and operating policies. In making such a judgment, the portfolio manager will analyze the benefits and risks of the derivative transactions and weigh them in the context of the Fund’s overall investments and investment objective.
(2) Credit Risk. Credit risk is the risk that a loss may be sustained as a result of the failure of a counterparty to comply with the terms of a derivative instrument. The counterparty risk for exchange-traded derivatives is generally less than for privately-negotiated or OTC derivatives, since generally a clearing agency, which is the issuer or counterparty to each exchange-traded instrument, provides a guarantee of performance. For privately-negotiated instruments, there is no similar clearing agency guarantee. In all transactions, a Fund will bear the risk that the counterparty will default, and this could result in a loss of the expected benefit of the derivative transactions and possibly other losses to the Fund. A Fund will enter into transactions in derivative instruments only with counterparties that their respective portfolio manager reasonably believes are capable of performing under the contract.
(3) Correlation Risk. Correlation risk is the risk that there might be an imperfect correlation, or even no correlation, between price movements of a derivative instrument and price movements of investments being hedged. When a derivative transaction is used to completely hedge another position, changes in the market value of the combined position (the derivative instrument plus the position being hedged) result from an imperfect correlation between the price movements of the two instruments. With a perfect hedge, the value of the combined position remains unchanged with any change in the price of the underlying asset. With an imperfect hedge, the value of the derivative instrument and its hedge are not perfectly correlated. For example, if the value of a derivative instrument used in a short hedge (such as writing a call option, buying a put option or selling a futures contract) increased by less than the decline in value of the hedged investments, the hedge would not be perfectly correlated. This might occur due to factors unrelated to the value of the investments being hedged, such as speculative or other pressures on the markets in which these instruments are traded. The effectiveness of hedges using instruments on indices will depend, in
S-14
part, on the degree of correlation between price movements in the index and the price movements in the investments being hedged.
(4) Liquidity Risk. Liquidity risk is the risk that a derivative instrument cannot be sold, closed out, or replaced quickly at or very close to its fundamental value. Generally, exchange contracts are very liquid because the exchange clearinghouse is the counterparty of every contract. OTC transactions are less liquid than exchange-traded derivatives since they often can only be closed out with the other party to the transaction. A Fund might be required by applicable regulatory requirements to maintain assets as “cover,” maintain segregated accounts, and/or make margin payments when it takes positions in derivative instruments involving obligations to third parties (i.e., instruments other than purchase options). If a Fund is unable to close out its positions in such instruments, it might be required to continue to maintain such assets or accounts or make such payments until the position expires, matures, or is closed out. These requirements might impair a Fund’s ability to sell a security or make an investment at a time when it would otherwise be favorable to do so, or require that the Fund sell a portfolio security at a disadvantageous time. A Fund’s ability to sell or close out a position in an instrument prior to expiration or maturity depends upon the existence of a liquid secondary market or, in the absence of such a market, the ability and willingness of the counterparty to enter into a transaction closing out the position. Due to liquidity risk, there is no assurance that any derivatives position can be sold or closed out at a time and price that is favorable to a Fund.
(5) Legal Risk. Legal risk is the risk of loss caused by the unenforceability of a party’s obligations under the derivative. While a party seeking price certainty agrees to surrender the potential upside in exchange for downside protection, the party taking the risk is looking for a positive payoff. Despite this voluntary assumption of risk, a counterparty that has lost money in a derivative transaction may try to avoid payment by exploiting various legal uncertainties about certain derivative products.
(6) Systemic or “Interconnection” Risk. Systemic or interconnection risk is the risk that a disruption in the financial markets will cause difficulties for all market participants. In other words, a disruption in one market will spill over into other markets, perhaps creating a chain reaction. Much of the OTC derivatives market takes place among the OTC dealers themselves, thus creating a large interconnected web of financial obligations. This interconnectedness raises the possibility that a default by one large dealer could create losses for other dealers and destabilize the entire market for OTC derivative instruments.
Swaps, Caps, Collars and Floors
Swap Agreements
A swap is a financial instrument that typically involves the exchange of cash flows between two parties on specified dates (settlement dates), where the cash flows are based on agreed-upon prices, rates, indices, etc. The nominal amount on which the cash flows are calculated is called the notional amount. Swaps are individually negotiated and structured to include exposure to a variety of different types of investments or market factors, such as interest rates, non-U.S. currency rates, mortgage securities, corporate borrowing rates, security prices, indexes or inflation rates.
Swap agreements may increase or decrease the overall volatility of the investments of a Fund and its share price. The performance of swap agreements may be affected by a change in the specific interest rate, currency, or other factors that determine the amounts of payments due to and from a Fund. If a swap agreement calls for payments by a Fund, the Fund must be prepared to make such payments when due. In addition, if the counterparty’s creditworthiness declines, the value of a swap agreement would be likely to decline, potentially resulting in losses.
Generally, swap agreements have a fixed maturity date that will be agreed upon by the parties. The agreement can be terminated before the maturity date only under limited circumstances, such as default by one of the parties or insolvency, among others, and can be transferred by a party only with the prior written consent of the other party. A Fund may be able to eliminate its exposure under a swap agreement either by assignment or by other disposition, or by entering into an offsetting swap agreement with the same party or a similarly creditworthy party. If the counterparty is unable to meet its obligations under the contract, declares bankruptcy, defaults or becomes insolvent, a Fund may not be able to recover the money it expected to receive under the contract.
S-15
A swap agreement can be a form of leverage, which can magnify a Fund’s gains or losses. In order to reduce the risk associated with leveraging, a Fund may cover its current obligations under swap agreements according to guidelines established by the SEC. If a Fund enters into a swap agreement on a net basis, it will segregate assets with a daily value at least equal to the excess, if any, of a Fund’s accrued obligations under the swap agreement over the accrued amount the Fund is entitled to receive under the agreement. If a Fund enters into a swap agreement on other than a net basis, it will segregate assets with a value equal to the full amount of a Fund’s accrued obligations under the agreement.
Equity Swaps. In a typical equity swap, one party agrees to pay another party the return on a stock, stock index or basket of stocks in return for a specified interest rate. By entering into an equity index swap, for example, the index receiver can gain exposure to stocks making up the index of securities without actually purchasing those stocks. Equity index swaps involve not only the risk associated with investment in the securities represented in the index, but also the risk that the performance of such securities, including dividends, will not exceed the return on the interest rate that a Fund will be committed to pay.
Interest Rate Swaps. Interest rate swaps are financial instruments that involve the exchange of one type of interest rate for another type of interest rate cash flow on specified dates in the future. Some of the different types of interest rate swaps are “fixed-for floating rate swaps,” “termed basis swaps” and “index amortizing swaps.” Fixed-for floating rate swaps involve the exchange of fixed interest rate cash flows for floating rate cash flows. Termed basis swaps entail cash flows to both parties based on floating interest rates, where the interest rate indices are different. Index amortizing swaps are typically fixed-for floating swaps where the notional amount changes if certain conditions are met.
Like a traditional investment in a debt security, a Fund could lose money by investing in an interest rate swap if interest rates change adversely. For example, if a Fund enters into a swap where it agrees to exchange a floating rate of interest for a fixed rate of interest, the Fund may have to pay more money than it receives. Similarly, if a Fund enters into a swap where it agrees to exchange a fixed rate of interest for a floating rate of interest, the Fund may receive less money than it has agreed to pay.
Currency Swaps. A currency swap is an agreement between two parties in which one party agrees to make interest rate payments in one currency and the other promises to make interest rate payments in another currency. A Fund may enter into a currency swap when it has one currency and desires a different currency. Typically the interest rates that determine the currency swap payments are fixed, although occasionally one or both parties may pay a floating rate of interest. Unlike an interest rate swap, however, the principal amounts are exchanged at the beginning of the contract and returned at the end of the contract. Changes in non-U.S. exchange rates and changes in interest rates, as described above, may negatively affect currency swaps.
Credit Default Swaps. A credit default swap is similar to an insurance contract in that it provides the buyer with protection against specific risks. Most often, corporate bond investors buy credit default swaps for protection against a default by the issuer of the corporate bond, but these flexible instruments can be used in many ways to customize exposure to corporate credit. Credit default swap agreements can mitigate risks in bond investing by transferring a given risk from one party to another without transferring the underlying bond or other credit asset. In a credit default swap agreement, one party “sells” risk and the counterparty “buys” that risk. The “seller” of credit risk, who also tends to own the underlying credit asset, pays a periodic fee to the risk “buyer.” In return, the risk “buyer” agrees to pay the “seller” a set amount if there is a default, or a credit event.
A Fund’s use of credit default swap agreements exposes the Fund to additional risks, including but not limited to, the credit and liquidity risk of a counterparty. If the credit quality of any such counterparty deteriorates, such counterparty may default on its obligations to make payments under the swap agreement. A Fund may also be exposed to liquidity risk because the market for credit default swaps are relatively illiquid and the Fund will generally not be permitted to terminate or assign its credit default swaps without the consent of the related counterparty and accordingly may not be able to terminate or assign such credit default swaps in a timely fashion and for a fair price, potentially restricting its ability to take advantage of market opportunities.
S-16
Caps, Collars and Floors
Caps and floors have an effect similar to buying or writing options. In a typical cap or floor agreement, one party agrees to make payments only under specified circumstances, usually in return for payment of a fee by the other party. For example, the buyer of an interest rate cap obtains the right to receive payments to the extent that a specified interest rate exceeds an agreed-upon level. The seller of an interest rate floor is obligated to make payments to the extent that a specified interest rate falls below an agreed-upon level. An interest rate collar combines elements of buying a cap and selling a floor.
Other Investment Policies and Techniques
Delayed-Delivery Transactions
Each Fund may from time to time purchase securities on a “when-issued” or other delayed-delivery basis. The price of securities purchased on a when-issued basis is fixed at the time the commitment to purchase is made, but delivery and payment for the securities take place at a later date. Normally, the settlement date occurs within 45 days of the purchase. During the period between the purchase and settlement, no payment is made by a Fund to the issuer and no interest is accrued on debt securities or dividend income is earned on equity securities. Forward commitments involve a risk of loss if the value of the security to be purchased declines prior to the settlement date. This risk is in addition to the risk of decline in value of a Fund’s other assets. While when-issued securities may be sold prior to the settlement date, the Funds intend to purchase such securities with the purpose of actually acquiring them. At the time a Fund makes the commitment to purchase a security on a when-issued basis, it will record the transaction and reflect the value of the security in determining its net asset value. The Funds do not believe that net asset value will be adversely affected by purchases of securities on a when-issued basis.
Each Fund will maintain in a segregated account cash, U.S. government securities and high grade liquid debt securities equal in value to commitments for when-issued securities. Such segregated securities either will mature or, if necessary, be sold on or before the settlement date. When the time comes to pay for when-issued securities, each Fund will meet its obligations from then-available cash flow, sale of the securities held in the separate account (described above), sale of other securities, or, although it would not normally expect to do so, from the sale of the when-issued securities themselves (which may have a market value greater or less than the Fund’s payment obligation).
Illiquid Securities
Each Fund may invest in illiquid securities (i.e., securities that are not readily marketable). For purposes of this restriction, illiquid securities include, but are not limited to, restricted securities (securities the disposition of which is restricted under the federal securities laws), securities that may only be resold pursuant to Rule 144A under the Securities Act of 1933, as amended (the “Securities Act”), but that are deemed to be illiquid; and repurchase agreements with maturities in excess of seven days. However, a Fund will not acquire illiquid securities if, as a result, such securities would comprise more than 15% of the value of the Fund’s net assets. The Board of Trustees or its delegate has the ultimate authority to determine, to the extent permissible under the federal securities laws, which securities are liquid or illiquid for purposes of this 15% limitation. The Board of Trustees has delegated to the investment adviser of the Funds the day-to-day determination of the illiquidity of any security held by a Fund, although it has retained oversight and ultimate responsibility for such determinations. Although no definitive liquidity criteria are used, the Board of Trustees has directed the investment adviser of the Funds to look to such factors as (i) the nature of the market for a security (including the institutional private resale market; the frequency of trades and quotes for the security; the number of dealers willing to purchase or sell the security; and the amount of time normally needed to dispose of the security, the method of soliciting offers and the mechanics of transfer), (ii) the terms of certain securities or other instruments allowing for the disposition to a third party or the issuer thereof (e.g., certain repurchase obligations and demand instruments), and (iii) other permissible relevant factors.
Restricted securities may be sold only in privately negotiated transactions or in a public offering with respect to which a registration statement is in effect under the Securities Act. Where registration is required, a Fund may be obligated to pay all or part of the registration expenses and a considerable period may elapse between the time of the decision to sell and the time the Fund may be permitted to
S-17
sell a security under an effective registration statement. If, during such a period, adverse market conditions were to develop, a Fund might obtain a less favorable price than that which prevailed when it decided to sell. Illiquid securities will be priced at a fair value as determined in good faith by the Board of Trustees or its delegate. If, through the appreciation of illiquid securities or the depreciation of liquid securities, a Fund should be in a position where more than 15% of the value of its net assets are invested in illiquid securities, including restricted securities which are not readily marketable, the affected Fund will take such steps as is deemed advisable, if any, to protect liquidity.
Short Sales Against the Box
When a Fund’s portfolio manager believes that the price of a particular security held by a Fund may decline, it may make “short sales against the box” to hedge the unrealized gain on such security. Selling short against the box involves selling a security which a Fund owns for delivery at a specified date in the future. The Funds will limit their transactions in short sales against the box to 5% of their net assets. If, for example, a Fund bought 100 shares of ABC at $40 per share in January and the price appreciates to $50 in March, the Fund might “sell short” the 100 shares at $50 for delivery the following July. Thereafter, if the price of the stock declines to $45, it will realize the full $1,000 gain rather than the $500 gain it would have received had it sold the stock in the market. On the other hand, if the price appreciates to $55 per share, the Fund would be required to sell at $50 and thus receive a $1,000 gain rather than the $1,500 gain it would have received had it sold the stock in the market. A Fund may also be required to pay a premium for short sales which would partially offset any gain.
Lending of Portfolio Securities
Each Fund may lend its portfolio securities, up to 33 1/3% of its total assets, to broker-dealers or institutional investors. The loans will be secured continuously by collateral at least equal to the value of the securities lent by “marking to market” daily. A Fund will continue to receive the equivalent of the interest or dividends paid by the issuer of the securities lent and will retain the right to call, upon notice, the lent securities. A Fund may also receive interest on the investment of the collateral or a fee from the borrower as compensation for the loan. As with other extensions of credit, there are risks of delay in recovery or even loss of rights in the collateral should the borrower of the securities fail financially. However, loans will be made only to firms deemed by the portfolio manager to be of good standing.
Investment Companies
Each Fund may invest in shares of other investment companies to the extent permitted by the 1940 Act. Such companies include open-end funds, closed-end funds, exchange-traded funds (“ETFs”) and unit investment trusts. A Fund may invest in certain ETFs in excess of the limits imposed by the 1940 Act pursuant to exemptive orders obtained from the SEC by certain ETFs and their sponsors. Investing in another investment company subjects a Fund to the same risks associated with investing in the securities held by the applicable investment company. In addition, the benefit of investing in another investment company is largely dependent on the skill of the investment adviser of the underlying company and whether the associated fees and costs involved with investing in such company are offset by the potential gains. Investing in another investment company, including those affiliated with a Fund or its investment adviser, may subject the Fund to overlapping fees and expenses that may be payable to the adviser or its affiliates.
S-18
MANAGEMENT
The management of the Trust, including general supervision of the duties performed for the Funds under the Management Agreement, is the responsibility of the Board of Trustees. The number of trustees of the Trust is nine, one of whom is an “interested person” (as the term “interested person” is defined in the 1940 Act) and eight of whom are not interested persons (referred to herein as “independent trustees”). None of the independent trustees has ever been a trustee, director or employee of, or consultant to, Nuveen or its affiliates. The names, business addresses and birthdates of the trustees and officers of the Funds, their principal occupations and other affiliations during the past five years, the number of portfolios each oversees and other directorships they hold are set forth below. The trustees of the Trust are directors or trustees, as the case may be, of 66 Nuveen-sponsored open-end funds (the “Nuveen Mutual Funds”) and 120 Nuveen-sponsored closed-end funds (collectively with the Nuveen Mutual Funds, the “Nuveen Funds”).
| | | | | | | | | | |
Name, Business Address
and Birthdate | | Position(s)
Held with
Funds | | Term of Office and Length of Time Served with
Trust | | Principal Occupation(s) During Past Five Years | | Number of
Portfolios
in Fund
Complex
Overseen by
Trustee | | Other
Directorships Held by
Trustee |
|
Independent Trustees: |
| | | | | |
Robert P. Bremner
333 West Wacker Drive
Chicago, IL 60606
(8/22/40) | | Chairman of the Board and Trustee | | Term—Indefinite* Length of service—
Since 2003 | | Private Investor and Management Consultant. | | 186 | | N/A |
| | | | | |
Jack B. Evans
333 West Wacker Drive
Chicago, IL 60606
(10/22/48)
| | Trustee | | Term—Indefinite* Length of service—
Since inception | | President, The Hall-Perrine Foundation, a private philanthropic corporation (since 1996); Director and Vice Chairman, United Fire Group, a publicly held company; Member of the Board of Regents for the State of Iowa University System; Director, Gazette Companies; Life Trustee of Coe College; Director, Iowa College Foundation; Member of the Advisory Council of the Department of Finance in the Tippie College of Business, University of Iowa; formerly, Director, Alliant Energy; formerly, Director, Federal Reserve Bank of Chicago; formerly, President and Chief Operating Officer, SCI Financial Group, Inc. (a regional financial services firm). | | 186 | | See Principal Occupation description |
S-19
| | | | | | | | | | |
Name, Business Address
and Birthdate | | Position(s)
Held with
Funds | | Term of Office and Length of Time Served with
Trust | | Principal Occupation(s) During Past Five Years | | Number of
Portfolios
in Fund
Complex
Overseen by
Trustee | | Other
Directorships Held by
Trustee |
| | | | | |
William C. Hunter
333 West Wacker Drive
Chicago, IL 60606
(3/6/48)
| | Trustee | | Term—Indefinite* Length of service—
Since 2004 | | Dean (since July 2006) Tippie College of Business, University of Iowa; Director (since 1997), Credit Research Center at Georgetown University; Director (since 2004) of Xerox Corporation; Director (since 2005), Beta Gamma Sigma International Honor Society; formerly, Director (May 2005-October 2005) of SS&C Technologies, Inc.; formerly, Dean and Distinguished Professor of Finance, School of Business at the University of Connecticut (2003-2006); previously, Senior Vice President and Director of Research at the Federal Reserve Bank of Chicago (1995-2003). | | 186 | | See Principal Occupation description |
| | | | | |
David J. Kundert
333 West Wacker Drive
Chicago, IL 60606
(10/28/42)
| | Trustee | | Term—Indefinite* Length of service—
Since 2005 | | Director, Northwestern Mutual Wealth Management Company; retired (since 2004) as Chairman, JPMorgan Fleming Asset Management, President and CEO, Banc One Investment Advisors Corporation, and President, One Group Mutual Funds; prior thereto, Executive Vice President, Bank One Corporation and Chairman and CEO, Banc One Investment Management Group; Board of Regents, Luther College; member of the Wisconsin Bar Association; member of Board of Directors, Friends of Boerner Botanical Gardens; Member of Investment Committee, Greater Milwaukee Foundation. | | 186 | | See Principal Occupation description |
| | | | | |
William J. Schneider
333 West Wacker Drive
Chicago, IL 60606
(9/24/44)
| | Trustee | | Term—Indefinite* Length of service—
Since 2003 | | Chairman, formerly, Senior Partner and Chief Operating Officer (retired 2004) of Miller-Valentine Partners Ltd., a real estate investment company; Director, Dayton Development Coalition; formerly, Member, Business Advisory Council, Cleveland Federal Reserve Bank. | | 186 | | See Principal Occupation description |
S-20
| | | | | | | | | | |
Name, Business Address
and Birthdate | | Position(s)
Held with
Funds | | Term of Office and Length of Time Served with
Trust | | Principal Occupation(s) During Past Five Years | | Number of
Portfolios
in Fund
Complex
Overseen by
Trustee | | Other
Directorships Held by
Trustee |
| | | | | |
Judith M. Stockdale
333 West Wacker Drive
Chicago, IL 60606
(12/29/47) | | Trustee | | Term—Indefinite* Length of service—
Since 2003 | | Executive Director, Gaylord and Dorothy Donnelley Foundation (since 1994); prior thereto, Executive Director, Great Lakes Protection Fund (1990-1994). | | 186 | | N/A |
| | | | | |
Carole E. Stone
333 West Wacker Drive
Chicago, IL 60606
(6/28/47)
| | Trustee | | Term—Indefinite* Length of service— Since 2007 | | Director, Chicago Board Options Exchange (since 2006); Commissioner, New York State Commission on Public Authority Reform (since 2005); formerly, Chair, New York Racing Association Oversight Board (2005-2007), Director, New York State Division of the Budget (2000-2004), Chair, Public Authorities Control Board (2000-2004) and Director, Local Government Assistance Corporation (2000-2004). | | 186 | | See Principal Occupation description |
| | | | | |
Terence J. Toth
333 West Wacker Drive
Chicago, IL 60606
(9/29/59) | | Trustee | | Term—Indefinite* Length of service—
Since 2008 | | Director, Legal & General Investment Management (since 2008); Private Investor (since 2007); CEO and President, Northern Trust Investments (2004-2007); Executive Vice President, Quantitative Management & Securities Lending (2000-2004); prior thereto, various positions with Northern Trust Company (since 1994); Member: Goodman Theatre Board (since 2004); Chicago Fellowship Board (since 2005), University of Illinois Leadership Council Board (since 2007) and Catalyst Schools of Chicago Board (since 2008); formerly Member: Northern Trust Mutual Funds Board (2005-2007), Northern Trust Japan Board (2004-2007), Northern Trust Securities Inc. Board (2003-2007) and Northern Trust Hong Kong Board (1997-2004). | | 186 | | N/A |
S-21
| | | | | | | | | | |
Name, Business Address
and Birthdate | | Position(s)
Held with
Funds | | Term of Office and Length of Time Served with
Trust | | Principal Occupation(s) During Past Five Years | | Number of
Portfolios
in Fund
Complex
Overseen by
Trustee | | Other
Directorships Held by
Trustee |
|
Interested Trustee: |
| | | | | |
John P. Amboian** 333 West Wacker Drive Chicago, IL 60606 (6/14/61) | | Trustee | | Term—Indefinite* Length of service—
Since 2008 | | Chief Executive Officer (since July 2007) and Director (since 1999) of Nuveen Investments, Inc.; Chief Executive Officer (since 2007) of Nuveen Asset Management, Rittenhouse Asset Management, Nuveen Investments Advisors, Inc.; formerly, President (1999-2004) of Nuveen Advisory Corp. and Nuveen Institutional Advisory Corp.*** | | 186 | | See Principal Occupation description |
| * | | Each trustee serves an indefinite term until his or her successor is elected. |
| ** | | Mr. Amboian is an “interested person” of the Trust, as defined in the 1940 Act, by reason of his positions with Nuveen Investments, Inc. (“Nuveen Investments”) and certain of its subsidiaries. |
| *** | | Nuveen Advisory Corp. and Nuveen Institutional Advisory Corp. were reorganized into Nuveen Asset Management (“NAM”), effective January 1, 2005. |
S-22
| | | | | | | | |
Name, Business Address
and Birthdate | | Position(s) Held with Funds | | Term of
Office and
Length of Time Served
with Trust | | Principal Occupation(s) During Past Five Years | | Number of
Portfolios
in Fund
Complex
Overseen by
Officer |
|
Officers of the Trust: |
| | | | |
Gifford R. Zimmerman
333 West Wacker Drive
Chicago, IL 60606
(9/9/56)
| | Chief Administrative Officer | | Term—Until July 2009 Length of service—
Since inception | | Managing Director (since 2002), Assistant Secretary and Associate General Counsel of Nuveen Investments, LLC; Managing Director (since 2002) and Assistant Secretary and Associate General Counsel of Nuveen Asset Management; Managing Director (since 2004) and Assistant Secretary (since 1994) of Nuveen Investments, Inc.; Vice President and Assistant Secretary of NWQ Investment Management Company, LLC (since 2002); Vice President and Assistant Secretary of Nuveen Investments Advisers Inc. (since 2002); Managing Director, Associate General Counsel and Assistant Secretary of Rittenhouse Asset Management, Inc. and Symphony Asset Management LLC (since 2003); Vice President and Assistant Secretary of Tradewinds Global Investors, LLC and Santa Barbara Asset Management, LLC (since 2006), and Nuveen HydePark Group, LLC and Nuveen Investment Solutions, Inc. (since 2007); formerly, Managing Director (2002-2004), General Counsel (1998-2004) and Assistant Secretary of Nuveen Advisory Corp. and Nuveen Institutional Advisory Corp.*; Chartered Financial Analyst. | | 186 |
| | | | |
Michael T. Atkinson
333 West Wacker Drive
Chicago, IL 60606
(2/3/66) | | Vice President | | Term—Until July 2009 Length of service—Since 2002 | | Vice President (since 2002); of Nuveen Investments, LLC. | | 186 |
| | | | |
Alan A. Brown
333 West Wacker Drive
Chicago, IL 60606
(8/1/62)
| | Vice President | | Term—Until July 2009 Length of service—Since 2007 | | Executive Vice President, Mutual Funds, Nuveen Investments, LLC (since 2005), previously, Managing Director and Chief Marketing Officer (2001-2005). | | 66 |
| | | | |
Lorna C. Ferguson
333 West Wacker Drive
Chicago, IL 60606
(10/24/45)
| | Vice President | | Term—Until July 2009 Length of service—Since inception | | Managing Director (since 2004), formerly, Vice President of Nuveen Investments, LLC; Managing Director (since 2005) of Nuveen Asset Management; formerly, Managing Director (2004-2005) and Vice President (1998-2004) of Nuveen Advisory Corp. and Nuveen Institutional Advisory Corp.* | | 186 |
| | | | |
Stephen D. Foy 333 West Wacker Drive
Chicago, IL 60606
(5/31/54)
| | Vice President and Controller | | Term—Until July 2009 Length of service—Since inception | | Vice President (since 1993) and Funds Controller (since 1998) of Nuveen Investments, LLC; Vice President (since 2005) of Nuveen Asset Management; formerly, Vice President and Funds Controller of Nuveen Investments, Inc. (1998-2004); Certified Public Accountant. | | 186 |
S-23
| | | | | | | | |
Name, Business Address
and Birthdate | | Position(s) Held with Funds | | Term of
Office and
Length of Time Served
with Trust | | Principal Occupation(s) During Past Five Years | | Number of
Portfolios
in Fund
Complex
Overseen by
Officer |
| | | | |
Walter M. Kelly
333 West Wacker Drive
Chicago, IL 60606
(2/24/70) | | Chief Compliance Officer and
Vice President | | Term—Until July 2009 Length of service—Since 2003 | | Senior Vice President (since 2008), formerly, Vice President, formerly, Assistant Vice President and Assistant General Counsel (2003-2006) of Nuveen Investments, LLC; Senior Vice President (since 2008) and Assistant Secretary (since 2003), formerly, Vice President (2006-2008) of Nuveen Asset Management; previously, Assistant Vice President and Assistant Secretary of the Nuveen Funds (2003-2006). | | 186 |
| | | | |
David J. Lamb
333 West Wacker Drive
Chicago, IL 60606
(3/22/63)
| | Vice President | | Term—Until July 2009 Length of service—Since inception | | Vice President (since 2000) of Nuveen Investments, LLC; Certified Public Accountant. | | 186 |
| | | | |
Tina M. Lazar
333 West Wacker Drive
Chicago, IL 60606
(8/27/61)
| | Vice President | | Term—Until July 2009 Length of service—Since 2002 | | Vice President (since 1999) of Nuveen Investments, LLC. | | 186 |
| | | | |
Larry W. Martin
333 West Wacker Drive
Chicago, IL 60606
(7/27/51)
| | Vice President and Assistant Secretary | | Term—Until July 2009 Length of service—Since inception | | Vice President, Assistant Secretary and Assistant General Counsel of Nuveen Investments, LLC; Vice President (since 2005) and Assistant Secretary of Nuveen Investments, Inc.; Vice President (since 2005) and Assistant Secretary (since 1997) of Nuveen Asset Management; Vice President (since 2000), Assistant Secretary and Assistant General Counsel (since 1998) of Rittenhouse Asset Management, Inc.; Vice President and Assistant Secretary of Nuveen Investments Advisers Inc. (since 2002), NWQ Investment Management Company, LLC, Symphony Asset Management LLC (since 2003), Tradewinds Global Investors, LLC and Santa Barbara Asset Management LLC (since 2006) and of Nuveen HydePark Group, LLC and Nuveen Investment Solutions, Inc. (since 2007); formerly, Vice President and Assistant Secretary of Nuveen Advisory Corp. and Nuveen Institutional Advisory Corp.* | | 186 |
S-24
| | | | | | | | |
Name, Business Address
and Birthdate | | Position(s) Held with Funds | | Term of
Office and
Length of Time Served
with Trust | | Principal Occupation(s) During Past Five Years | | Number of
Portfolios
in Fund
Complex
Overseen by
Officer |
| | | | |
Kevin J. McCarthy 333 West Wacker Drive Chicago, IL 60606 (3/26/66) | | Vice President
and Secretary | | Term—Until July 2009 Length of service—Since 2007 | | Managing Director (since 2008), formerly, Vice President (2007-2008) of Nuveen Investments, LLC; Managing Director (since 2008), Vice President and Assistant Secretary (since 2007) of Nuveen Asset Management and Rittenhouse Asset Management, Inc.; Vice President and Assistant Secretary of Nuveen Investment Advisers Inc., Nuveen Investment Institutional Services Group LLC, NWQ Investment Management Company, LLC, Tradewinds Global Investors, LLC, NWQ Holdings, LLC, Symphony Asset Management LLC, Santa Barbara Asset Management, LLC, Nuveen HydePark Group, LLC and Nuveen Investment Solutions, Inc.; prior thereto, Partner, Bell, Boyd & Lloyd LLP (1997-2007). | | 186 |
| | | | |
John V. Miller 333 West Wacker Drive Chicago, IL 60606 (4/10/67) | | Vice President | | Term—Until July 2009 Length of service—Since 2007 | | Managing Director (since 2007), formerly, Vice President (2002-2007) of Nuveen Asset Management and Nuveen Investments, LLC; Chartered Financial Analyst. | | 186 |
| | | | |
Christopher M. Rohrbacher 333 West Wacker Drive Chicago, IL 60606 (8/1/71) | | Vice President and Assistant Secretary | | Term—Until July 2009 Length of service—Since 2008 | | Vice President and Assistant Secretary of Nuveen Investments, LLC (since 2008); Vice President and Assistant Secretary of Nuveen Asset Management (since 2008); prior thereto, Associate, Skadden, Arps, Slate Meagher & Flom LLP (2002-2008). | | 186 |
| | | | |
James F. Ruane 333 West Wacker Drive
Chicago, IL 60606 (7/3/62) | | Vice President and Assistant Secretary | | Term—Until July 2009 Length of service— Since 2007 | | Vice President of Nuveen Investments, LLC (since 2007); prior thereto, Partner (2005-2007), formerly, senior tax manager (2002-2005), Deloitte & Touche USA LLP; Certified Public Accountant. | | 186 |
| | | | |
John S. White 333 West Wacker Drive Chicago, IL 60606 (5/12/67) | | Vice President | | Term—Until July 2009 Length of service—Since 2007 | | Vice President (since 2006) of Nuveen Investments, LLC, formerly, Assistant Vice President (since 2002); Lieutenant Colonel (since 2007), United States Marine Corps Reserve, formerly, Major (since 2001). | | 66 |
| | | | |
Mark L. Winget 333 West Wacker Drive Chicago, IL 60606 (12/21/68) | | Vice President and Assistant Secretary | | Term—Until July 2009 Length of service—Since 2008 | | Vice President and Assistant Secretary of Nuveen Investments, LLC (since 2008); Vice President and Assistant Secretary of Nuveen Asset Management (since 2008); prior thereto, Counsel, Vedder Price P.C. (1997-2007). | | 186 |
| * | | Nuveen Advisory Corp. and Nuveen Institutional Advisory Corp. were reorganized into NAM, effective January 1, 2005. |
S-25
Board Committees
The Board of Trustees of the Trust has five standing committees: the Executive Committee, the Audit Committee, the Nominating and Governance Committee, the Dividend Committee and the Compliance, Risk Management and Regulatory Oversight Committee.
Robert P. Bremner, Chair, Judith M. Stockdale and John P. Amboian serve as the current members of the Executive Committee of the Board of Trustees. The Executive Committee, which meets between regular meetings of the Board of Trustees, is authorized to exercise all of the powers of the Board of Trustees. During the fiscal year ended July 31, 2008, the Executive Committee met one time.
The Dividend Committee is authorized to declare distributions on each Fund’s shares, including, but not limited to, regular and special dividends, capital gains and ordinary income distributions. The members of the Dividend Committee are Jack B. Evans, Chair, Judith M. Stockdale and Terence J. Toth. During the fiscal year ended July 31, 2008, the Dividend Committee met two times.
The Audit Committee monitors the accounting and reporting policies and practices of each Fund, the quality and integrity of the financial statements of each Fund, compliance by each Fund with legal and regulatory requirements and the independence and performance of the external and internal auditors. The members of the Audit Committee are Jack B. Evans, Robert P. Bremner, David J. Kundert, Chair, William J. Schneider and Terence J. Toth, each of whom is an independent trustee of the Trust. During the fiscal year ended July 31, 2008, the Audit Committee met four times.
Nomination of independent trustees is committed to a Nominating and Governance Committee composed of the independent trustees of the Trust. The Committee operates under a written charter adopted and approved by the Board of Trustees. The Nominating and Governance Committee is responsible for trustee selection and tenure; selection and review of committees; and trustee education and operations. In addition, the Committee monitors performance of legal counsel and other service providers; periodically reviews and makes recommendations about any appropriate changes to trustee compensation; and has the resources and authority to discharge its responsibilities, including retaining special counsel and other experts or consultants at the expense of the Funds. In the event of a vacancy on the Board of Trustees, the Nominating and Governance Committee receives suggestions from various sources as to suitable candidates. Suggestions should be sent in writing to Lorna Ferguson, Manager of Fund Board Relations, Nuveen Investments, 333 West Wacker Drive, Chicago, IL 60606. The Nominating and Governance Committee sets appropriate standards and requirements for nominations for new trustees and reserves the right to interview all candidates and to make the final selection of any new trustees. The members of the Nominating and Governance Committee are Robert P. Bremner, Chair, Jack B. Evans, William C. Hunter, David J. Kundert, William J. Schneider, Judith M. Stockdale, Carole E. Stone and Terence J. Toth. During the fiscal year ended July 31, 2008, the Nominating and Governance Committee met four times.
The Compliance, Risk Management and Regulatory Oversight Committee is responsible for the oversight of compliance issues, risk management and other regulatory matters affecting the Funds that are not otherwise the jurisdiction of the other committees. As part of its duties regarding compliance matters, the Committee is responsible for the oversight of the Pricing Procedures of the Funds and the Valuation Group. The members of the Compliance, Risk Management and Regulatory Oversight Committee are William C. Hunter, William J. Schneider, Chair, Judith M. Stockdale and Carole E. Stone. During the fiscal year ended July 31, 2008, the Compliance, Risk Management and Regulatory Oversight Committee met four times.
Independent Chairman
The trustees have elected Robert P. Bremner as the independent Chairman of the Board of Trustees. Specific responsibilities of the Chairman include (a) presiding at all meetings of the Board of Trustees and of the shareholders; (b) seeing that all orders and resolutions of the trustees are carried into effect; and (c) maintaining records of and, whenever necessary, certifying all proceedings of the trustees and the shareholders.
S-26
Compensation
The following table shows, for each independent trustee, (1) the aggregate compensation, including deferred amounts, paid by the Trust for its fiscal year ended July 31, 2008, (2) the amount of total compensation each trustee elected to defer from the Trust for its fiscal year ended July 31, 2008, and (3) the total compensation paid to each trustee by the Nuveen fund complex during the fiscal year ended July 31, 2008. The Trust has no retirement or pension plans.
| | | | | | | | | |
Name of Trustee | | Aggregate
Compensation
From the Trust1 | | Amount of Total
Compensation
that Has Been
Deferred2 | | Total Compensation
From Funds and
Fund Complex
Paid to Trustees3 |
Robert P. Bremner | | $ | 4,199 | | $ | 542 | | $ | 218,335 |
Jack B. Evans | | | 3,897 | | | 848 | | | 203,555 |
William C. Hunter | | | 3,099 | | | 2,883 | | | 163,030 |
David J. Kundert | | | 3,303 | | | 3,059 | | | 172,721 |
William J. Schneider | | | 3,536 | | | 3,296 | | | 184,024 |
Judith M. Stockdale | | | 3,497 | | | 1,132 | | | 182,601 |
Carole E. Stone | | | 3,349 | | | — | | | 176,500 |
Terence J. Toth4 | | | — | | | — | | | — |
1 | | The compensation paid, including deferred amounts, to the independent trustees for the fiscal year ended July 31, 2008 for services to the Trust. |
2 | | Pursuant to a deferred compensation agreement with the Trust, deferred amounts are treated as though an equivalent dollar amount has been invested in shares of one or more eligible Nuveen Funds. The amounts provided are the total deferred fees (including the return from the assumed investment in the eligible Nuveen Funds) payable from the Trust. |
3 | | Based on the compensation paid (including any amounts deferred) to the trustees for the one year period ending July 31, 2008 for services to the Nuveen Funds. |
4 | | Mr. Toth was appointed to the Board of Trustees of the Trust effective July 1, 2008. |
Prior to January 1, 2008, for their services with respect to all Nuveen Funds, independent trustees received a $95,000 annual retainer plus (a) a fee of $3,000 per day for attendance in person or by telephone at a regularly scheduled meeting of the Board of Trustees; (b) a fee of $2,000 per meeting for attendance in person or by telephone where in-person attendance was required and $1,500 per meeting for attendance by telephone or in person where in-person attendance was not required at a special, non-regularly scheduled board meeting; (c) a fee of $1,500 per meeting for attendance in person or by telephone at an Audit Committee meeting; (d) a fee of $1,500 per meeting for attendance in person or by telephone at a regularly scheduled Compliance, Risk Management and Regulatory Oversight Committee meeting; (e) a fee of $1,500 per meeting for attendance in person at a non-regularly scheduled Compliance, Risk Management and Regulatory Oversight Committee meeting where in-person attendance was required and $1,000 per meeting for attendance by telephone or in person where in-person attendance was not required, except that the chairperson of the Compliance, Risk Management and Regulatory Oversight Committee could at any time designate a non-regularly scheduled meeting of the committee as an in-person meeting for the purposes of fees to be paid; (f) a fee of $1,000 per meeting for attendance in person or by telephone for a meeting of the Dividend Committee; and (g) a fee of $500 per meeting for attendance in person at all other committee meetings (including shareholder meetings) on a day on which no regularly scheduled board meeting was held in which in-person attendance was required and $250 per meeting for attendance by telephone or in person at such committee meetings (excluding shareholder meetings) where in-person attendance is not required and $100 per meeting when the Executive Committee acted as pricing committee for IPOs, plus, in each case, expenses incurred in attending such meetings. In addition to the payments described above, the Lead Independent Trustee (whose position was changed to Chairman of the Board of Trustees subsequent to January 1, 2008) received $25,000, the chairpersons of the Audit Committee and the Compliance, Risk Management and Regulatory Oversight Committee received $7,500 and the chairperson of the Nominating and Governance Committee received $5,000 as additional retainers to the annual retainer paid to such individuals. Independent trustees also received a fee of $2,000 per day for site visits to entities that provide services to the Nuveen Funds on days on which no regularly scheduled board
S-27
meeting was held. When ad hoc committees were organized, the Nominating and Governance Committee at the time of formation determined compensation to be paid to the members of such committee; however, in general, such fees were $1,000 per meeting for attendance in person at any ad hoc committee meeting where in-person attendance was required and $500 per meeting for attendance by telephone or in person at such meetings where in-person attendance was not required. The annual retainer, fees and expenses were allocated among the Nuveen Funds on the basis of relative net asset sizes, although fund management could, in its discretion, establish a minimum amount to be allocated to each fund.
Effective January 1, 2008, independent trustees receive a $100,000 annual retainer plus (a) a fee of $3,250 per day for attendance in person or by telephone at a regularly scheduled meeting of the Board of Trustees; (b) a fee of $2,500 per meeting for attendance in person where such in-person attendance is required and $1,500 per meeting for attendance by telephone or in person where in-person attendance is not required at a special, non-regularly scheduled board meeting; (c) a fee of $2,000 per meeting for attendance in person or by telephone at an Audit Committee meeting; (d) a fee of $2,000 per meeting for attendance in person at a Compliance, Risk Management and Regulatory Oversight Committee meeting where in-person attendance is required and $1,000 per meeting for attendance by telephone where in-person attendance is not required (e) a fee of $1,000 per meeting for attendance in person or by telephone for a meeting of the Dividend Committee; and (f) a fee of $500 per meeting for attendance in person at all other committee meetings ($1,000 for shareholder meetings) on a day on which no regularly scheduled board meeting is held in which in-person attendance is required and $250 per meeting for attendance by telephone or in person at such committee meetings (excluding shareholder meetings) where in-person attendance is not required and $100 per meeting when the Executive Committee acts as pricing committee for IPOs, plus, in each case, expenses incurred in attending such meetings. In addition to the payments described above, the Chairman of the Board of Trustees receives $50,000, the chairpersons of the Audit Committee, the Dividend Committee and the Compliance, Risk Management and Regulatory Oversight Committee receive $7,500 and the chairperson of the Nominating and Governance Committee receives $5,000 as additional retainers. Independent trustees also receive a fee of $2,500 per day for site visits to entities that provide services to the Nuveen Funds on days on which no regularly scheduled board meeting is held. When ad hoc committees are organized, the Nominating and Governance Committee will at the time of formation determine compensation to be paid to the members of such committee; however, in general, such fees will be $1,000 per meeting for attendance in person at any ad hoc committee meeting where in-person attendance is required and $500 per meeting for attendance by telephone or in person at such meetings where in-person attendance is not required. The annual retainer, fees and expenses are allocated among the Nuveen Funds on the basis of relative net asset, although fund management may, in its discretion, establish a minimum amount to be allocated to each fund.
The Trust does not have a retirement or pension plan. The Trust has a deferred compensation plan (the “Plan”) that permits any independent trustee to elect to defer receipt of all or a portion of his or her compensation as an independent trustee. The deferred compensation of a participating trustee is credited to a book reserve account of the Trust when the compensation would otherwise have been paid to the trustee. The value of the trustee’s deferral account at any time is equal to the value that the account would have had if contributions to the account had been invested and reinvested in shares of one or more of the eligible Nuveen Funds. At the time for commencing distributions from a trustee’s deferral account, the independent trustee may elect to receive distributions in a lump sum or over a period of five years. The Trust will not be liable for any other fund’s obligations to make distributions under the Plan.
The Funds have no employees. The officers of the Trust and the trustee of the Trust who is not an independent trustee serve without any compensation from the Funds.
S-28
Share Ownership
The following table sets forth the dollar range of equity securities beneficially owned by each trustee as of December 31, 2007:
| | | | | | | | | | |
| | | Dollar Range of Equity Securities
in the Funds | | Aggregate Dollar Range of
Equity Securities in All
Registered Investment
Companies Overseen by
Trustee in Family of
Investment Companies |
Name of Trustee | | Dividend
Growth Fund | | Growth
Fund | | Growth
Opportunities
Fund | | Rittenhouse
Fund | |
John P. Amboian* | | $0 | | $0 | | $0 | | $0 | | Over $100,000 |
Robert P. Bremner | | $0 | | $0 | | $0 | | $0 | | Over $100,000 |
Jack B. Evans | | $0 | | $0 | | $0 | | Over $100,000 | | Over $100,000 |
William C. Hunter | | $0 | | $0 | | $0 | | $50,001-$100,000 | | Over $100,000 |
David J. Kundert | | $0 | | $0 | | $0 | | $0 | | Over $100,000 |
William S. Schneider | | $0 | | $0 | | $0 | | $0 | | Over $100,000 |
Judith M. Stockdale | | $0 | | $0 | | $0 | | $50,001-$100,000 | | Over $100,000 |
Carole E. Stone | | $0 | | $0 | | $0 | | $0 | | $10,001-$50,000 |
Terence J. Toth* | | $0 | | $0 | | $0 | | $0 | | $0 |
| * | | Mr. Amboian and Mr. Toth were appointed to the Board of Trustees of the Nuveen Mutual Funds effective July 1, 2008. |
As of November 6, 2008, the officers and trustees of each Fund, in the aggregate, owned less than 1% of the shares of each Fund. As of November 6, 2008, Nuveen Investments owned a considerable portion of the Growth Opportunities Fund. Accordingly, as of that date, it may have controlled the Fund. A party that controls a Fund may be able to significantly influence the outcome of any item presented to shareholders for approval.
The following table sets forth the percentage ownership of each person, who, as of November 6, 2008, owned of record, or is known by the Trust to have owned of record or beneficially, 5% or more of any class of a Fund’s shares.
| | | | | |
Name of Fund and Class | | Name and Address of Owner | | Percentage
of Record
Ownership | |
Nuveen Santa Barbara Growth Fund
Class A Shares | |
MERRILL, LYNCH, PIERCE, FENNER & SMITH FOR THE BENEFIT OF ITS CUSTOMERS ATTN: FUND ADMN/97NB2 4800 DEER LAKE DR E FL 3 JACKSONVILLE, FL 32246-6484 | | 63.51 | % |
| | |
| | FIRST CLEARING, LLC GARVIE O. CHAMBERS TTEE PO BOX 16166 GREENSBORO, NC 27416 | | 8.44 | % |
| | |
| | FIRST CLEARING, LLC KATHLEEN S. CHAMBERS TTEE PO BOX 16166 GREENSBORO, NC 27416 | | 7.49 | % |
| | |
Nuveen Santa Barbara Growth Fund Class B Shares | |
NUVEEN INVESTMENTS, INC. ATTN: DARLENE CRAMER 333 W WACKER DR CHICAGO, IL 60606-1220 | | 62.36 | % |
S-29
| | | | | |
Name of Fund and Class | | Name and Address of Owner | | Percentage
of Record
Ownership | |
| | MERRILL, LYNCH, PIERCE, FENNER & SMITH FOR THE BENEFIT OF ITS CUSTOMERS ATTN: FUND ADMN/97NB2 4800 DEER LAKE DR E FL 3 JACKSONVILLE, FL 32246-6484 | | 16.40 | % |
| | |
| | LPL FINANCIAL SERVICES 9785 TOWNE CENTRE DR SAN DIEGO, CA 92121 | | 5.43 | % |
| | |
Nuveen Santa Barbara Growth Fund Class C Shares | |
MERRILL, LYNCH, PIERCE, FENNER & SMITH FOR THE BENEFIT OF ITS CUSTOMERS ATTN: FUND ADMN/97NB2 4800 DEER LAKE DR E FL 3 JACKSONVILLE, FL 32246-6484 | | 76.87 | % |
| | |
| | NUVEEN INVESTMENTS, INC. ATTN: DARLENE CRAMER 333 W WACKER DR CHICAGO, IL 60606-1220 | | 10.01 | % |
| | |
Nuveen Santa Barbara Growth Fund Class I Shares | |
CHARLES SCHWAB & CO INC. FOR THE BENEFIT OF THEIR CUSTOMERS 4500 CHERRY CREEK DR S DENVER, CO 80018 | | 79.06 | % |
| | |
| | NFS LLC FEBO R DAVID SCHELZI TTEE WAKEFIELD INVESTMENTS COMPANY U/A 12/23/99 PO BOX 540 WAKEFIELD, MA 01880 | | 5.72 | % |
| | |
Nuveen Santa Barbara Growth Opportunities Fund
Class A Shares | |
NUVEEN INVESTMENTS, INC. ATTN: DARLENE CRAMER 333 W WACKER DR CHICAGO, IL 60606-1220 | | 65.71 | % |
| | |
Nuveen Santa Barbara Growth Opportunities Fund
Class B Shares | |
NUVEEN INVESTMENTS, INC. ATTN: DARLENE CRAMER 333 W WACKER DR CHICAGO, IL 60606-1220 | | 93.78 | % |
S-30
| | | | | |
Name of Fund and Class | | Name and Address of Owner | | Percentage
of Record
Ownership | |
Nuveen Santa Barbara Growth Opportunities Fund
Class C Shares | |
NUVEEN INVESTMENTS, INC. ATTN: DARLENE CRAMER 333 W WACKER DR CHICAGO, IL 60606-1220 | | 76.17 | % |
| | |
| | MORGAN STANLEY DW ATTN: MUTUAL FUNDS OPERATIONS HARBORSIDE FINANCIAL CENTER PLAZA TWO 2ND FLOOR JERSEY CITY, NJ 07311 | | 11.41 | % |
| | |
| | RBC CAPITAL MARKETS CORP FBO LANCE J WATKINS TTEE, BLAINE E WATKINS & LANCE J WATKINS FAM LIV TR DTD 2/13/07 5120 EDINA INDUSTRIAL BLVD EDINA, MN 55439 | | 8.09 | % |
| | |
Nuveen Santa Barbara Growth Opportunities Fund
Class I Shares | |
NUVEEN INVESTMENTS, INC. ATTN: DARLENE CRAMER 333 W WACKER DR CHICAGO, IL 60606-1220 | | 46.63 | % |
| | |
| | CHARLES SCHWAB & CO INC. SPECIAL CUSTODY ACCT FBO CUSTOMERS ATTN: MUTUAL FUNDS 101 MONTGOMERY ST SAN FRANCISCO, CA 94104 | | 36.63 | % |
| | |
| | WACHOVIA BANK FBO VARIOUS
RETIREMENT PLANS 1525 WEST WT HARRIS BLVD CHARLOTTE, NC 28288 | | 16.74 | % |
| | |
Nuveen Santa Barbara Dividend
Growth Fund
Class A Shares | |
FIRST CLEARING, LLC DONALD L CARANO PO BOX 2540 RENO, NV 89505 | | 20.79 | % |
| | |
| | CHARLES SCHWAB & CO INC. SPECIAL CUSTODY ACCT FBO CUSTOMERS ATTN: MUTUAL FUNDS 101 MONTGOMERY ST SAN FRANCISCO, CA 94104 | | 19.53 | % |
S-31
| | | | | |
Name of Fund and Class | | Name and Address of Owner | | Percentage
of Record
Ownership | |
| | MERRILL, LYNCH, PIERCE, FENNER & SMITH
FOR THE BENEFIT OF ITS CUSTOMERS ATTN: FUND ADMN/97NB2 4800 DEER LAKE DR E FL 3 JACKSONVILLE, FL 32246-6484 | | 14.01 | % |
| | |
Nuveen Santa Barbara Dividend
Growth Fund
Class B Shares | |
NUVEEN INVESTMENTS, INC. ATTN: DARLENE CRAMER 333 W WACKER DR CHICAGO, IL 60606-1220 | | 40.57 | % |
| | |
| | MERRILL, LYNCH, PIERCE, FENNER & SMITH
FOR THE BENEFIT OF ITS CUSTOMERS ATTN: FUND ADMN/97NB2 4800 DEER LAKE DR E FL 3 JACKSONVILLE, FL 32246-6484 | | 19.17 | % |
| | |
Nuveen Santa Barbara Dividend
Growth Fund
Class C Shares | |
MERRILL, LYNCH, PIERCE, FENNER & SMITH FOR THE BENEFIT OF ITS CUSTOMERS ATTN: FUND ADMN/97NB2 4800 DEER LAKE DR E FL 3 JACKSONVILLE, FL 32246-6484 | | 59.76 | % |
| | |
| | NUVEEN INVESTMENTS, INC. ATTN: DARLENE CRAMER 333 W WACKER DR CHICAGO, IL 60606-1220 | | 9.69 | % |
| | |
Nuveen Santa Barbara Dividend
Growth Fund
Class I Shares | |
CHARLES SCHWAB & CO INC. FOR THE BENEFIT OF THEIR CUSTOMERS 4500 CHERRY CREEK DR S DENVER, CO 80018 | | 45.65 | % |
| | |
| | WACHOVIA BANK FBO VARIOUS
RETIREMENT PLANS 1525 WEST WT HARRIS BLVD CHARLOTTE, NC 28288 | | 13.31 | % |
| | |
Nuveen Rittenhouse Growth Fund
Class A Shares | |
MERRILL, LYNCH, PIERCE, FENNER & SMITH
FOR THE BENEFIT OF ITS CUSTOMERS ATTN: FUND ADMIN 4800 DEER LAKE DR E FL 3 JACKSONVILLE, FL 32246-6484 | | 31.70 | % |
| | |
| | CITIGROUP GLOBAL MARKETS INC. HOUSE ACCOUNT ATTN: PETER BOOTH 7TH FLOOR 333 WEST 34TH STREET NEW YORK, NY 10001-2402 | | 8.33 | % |
S-32
| | | | | |
Name of Fund and Class | | Name and Address of Owner | | Percentage
of Record
Ownership | |
Nuveen Rittenhouse Growth Fund
Class B Shares | |
MERRILL, LYNCH, PIERCE, FENNER & SMITH
FOR THE BENEFIT OF ITS CUSTOMERS
ATTN: FUND ADMIN 4800 DEER LAKE DR E FL 3 JACKSONVILLE, FL 32246-6484 | | 27.51 | % |
| | |
| | CITIGROUP GLOBAL MARKETS INC. HOUSE ACCOUNT ATTN: PETER BOOTH 7TH FLOOR 333 WEST 34TH STREET NEW YORK, NY 10001-2402 | | 8.84 | % |
| | |
| | MORGAN STANLEY DW ATTN: MUTUAL FUNDS OPERATIONS HARBORSIDE FINANCIAL CENTER PLAZA TWO 2ND FLOOR JERSEY CITY, NJ 07311 | | 5.70 | % |
| | |
Nuveen Rittenhouse Growth Fund
Class C Shares | |
MERRILL, LYNCH, PIERCE, FENNER & SMITH
FOR THE BENEFIT OF ITS CUSTOMERS
ATTN: FUND ADMIN 4800 DEER LAKE DR E FL 3 JACKSONVILLE, FL 32246-6484 | | 34.90 | % |
| | |
| | CITIGROUP GLOBAL MARKETS INC. HOUSE ACCOUNT ATTN: PETER BOOTH 7TH FLOOR 333 WEST 34TH STREET NEW YORK, NY 10001-2402 | | 11.49 | % |
| | |
Nuveen Rittenhouse Growth Fund
Class I Shares | |
WACHOVIA BANK FBO NUVEEN INVESTMENTS 401(k) 1525 WEST WT HARRIS BLVD. CHARLOTTE, NC 28288-0001 | | 50.78 | % |
| | |
| | NUVEEN MODERATE ALLOCATION FUND ATTN: DARLENE CRAMER 333 WEST WACKER DRIVE CHICAGO, IL 60606 | | 7.33 | % |
| | |
| | NUVEEN CONSERVATIVE ALLOCATION FUND ATTN: DARLENE CRAMER 333 WEST WACKER DRIVE CHICAGO, IL 60606 | | 6.40 | % |
FUND MANAGER AND SUB-ADVISERS
Fund Manager
NAM acts as the manager of each Fund, with responsibility for the overall management of each Fund. NAM is a Delaware corporation and its address is 333 West Wacker Drive, Chicago, Illinois 60606. NAM has selected Santa Barbara Asset Management (“SBAM”) 200 E. Carrillo St., Santa Barbara, California 93101, an affiliate of NAM, as sub-adviser to manage the investment portfolios of the Dividend Growth Fund, Growth Fund and Growth Opportunities Fund. NAM has selected Rittenhouse Asset Management,
S-33
Inc. (“Rittenhouse”), Five Radnor Corporate Center, Suite 300, Radnor, Pennsylvania 19087-9570, an affiliate of NAM, as sub-adviser to manage the investment portfolio of the Rittenhouse Fund. NAM is also responsible for managing the Funds’ business affairs and providing day-to-day administrative services to the Funds. For additional information regarding the management services performed by NAM, SBAM and Rittenhouse, see “Who Manages the Funds” in the Prospectus.
NAM is an affiliate of Nuveen, 333 West Wacker Drive, Chicago, Illinois 60606, which is also the principal underwriter of the Funds’ shares. Nuveen is the principal underwriter for the Nuveen Mutual Funds, and has served as co-managing underwriter for the shares of the Nuveen Closed-End Funds. Nuveen and NAM are subsidiaries of Nuveen Investments.
On November 13, 2007, Nuveen Investments was acquired by investors led by Madison Dearborn Partners, LLC, which is a private equity investment firm based in Chicago, Illinois. The investor group includes affiliates of Merrill Lynch & Co., Inc. (“Merrill Lynch”). In connection with the transaction, Merrill Lynch became an indirect “affiliated person” (as that term is defined in the 1940 Act) of NAM and the Funds. As a result, the Funds are prohibited from entering into principal transactions with Merrill Lynch and certain of its affiliates and are subject to other limitations in transacting with Merrill Lynch. NAM and the Funds do not believe that any such prohibition or limitations will have a materially adverse effect on a Fund’s ability to pursue its investment objective and policies.
For the management services and facilities furnished by NAM, each of the Funds has agreed to pay an annual management fee at rates set forth in the Prospectus under “Who Manages the Funds.” In addition, NAM has agreed to waive all or a portion of its management fee or reimburse certain expenses of the Funds. The Prospectus includes current fee waivers and expense reimbursements for the Funds.
Each Fund’s management fee is divided into two components—a complex-level fee, based on the aggregate amount of all fund assets managed by NAM and its affiliates, and a specific fund-level fee, based only on the amount of assets within each Fund. This pricing structure enables Fund shareholders to benefit from growth in the assets within each individual Fund as well as from growth in the amount of complex-wide assets managed by NAM and its affiliates. Under no circumstances will this pricing structure result in a Fund paying management fees at a rate higher than would otherwise have been applicable had the complex-wide management fee structure not been implemented.
Each Fund has agreed to pay an annual fund-level fee, payable monthly, based upon the average daily net assets of each Fund as set forth in the Prospectus.
The annual complex-level fee for the Funds, payable monthly, which is additive to the fund-level fee, is based on the aggregate amount of total assets managed for all Nuveen Funds as stated in the table below. As of September 30, 2008, the complex-level fee rate was 0.1947%.
| | | |
Complex-Level Asset Breakpoint Level* | | Effective Rate at
Breakpoint Level | |
$55 billion | | 0.2000 | % |
$56 billion | | 0.1996 | % |
$57 billion | | 0.1989 | % |
$60 billion | | 0.1961 | % |
$63 billion | | 0.1931 | % |
$66 billion | | 0.1900 | % |
$71 billion | | 0.1851 | % |
$76 billion | | 0.1806 | % |
$80 billion | | 0.1773 | % |
$91 billion | | 0.1691 | % |
$125 billion | | 0.1599 | % |
$200 billion | | 0.1505 | % |
$250 billion | | 0.1469 | % |
$300 billion | | 0.1445 | % |
| * | The complex-level component of the management fee for the Funds is calculated based upon the aggregate daily net assets of all Nuveen Funds, with such daily net assets to include assets attributable to preferred stock issued by or borrowings by such Funds but to exclude assets attributable to investments in other Nuveen Funds. |
S-34
The following tables set forth the management fees (net of expense reimbursements) paid by the Funds and the fees waived and expenses reimbursed by NAM for the specified periods.
| | | | | | | | | | | | | | | | | | |
| | | Amount of Management Fees (Net of
Expense Reimbursements by NAM) | | Amount of Fees Waived and
Expenses Reimbursed by NAM |
| | | 3/28/06-
7/31/06 | | 8/01/06-
7/31/07 | | 8/01/07-
7/31/08 | | 3/28/06-
7/31/06 | | 8/01/06-
7/31/07 | | 8/01/07-
7/31/08 |
Dividend Growth Fund | | $ | — | | $ | — | | $ | 4,606 | | $ | 15,593 | | $ | 50,267 | | $ | 75,465 |
Growth Fund | | | — | | | — | | | 14,980 | | | 22,213 | | | 76,738 | | | 85,062 |
Growth Opportunities Fund | | | — | | | — | | | — | | | 16,246 | | | 52,346 | | | 61,172 |
| | | | | | | | | | | | | | | | | | |
| | | Amount of Management Fees (Net of
Expense Reimbursements by NAM) | | Amount of Fees Waived and
Expenses Reimbursed by NAM |
| | | 8/01/05-
7/31/06 | | 8/01/06-
7/31/07 | | 8/01/07-
7/31/08 | | 8/01/05-
7/31/06 | | 8/01/06-
7/31/07 | | 8/01/07-
7/31/08 |
Rittenhouse Fund | | $ | 1,372,781 | | $ | 988,384 | | $ | 725,434 | | $ | 75 | | $ | 64,972 | | $ | 168,190 |
In addition to NAM’s management fee, each Fund also pays a portion of the Trust’s general administrative expenses allocated in proportion to the net assets of each Fund. All fees and expenses are accrued daily and deducted before payment of dividends to investors.
The Funds, the other Nuveen Funds, NAM and other related entities have adopted codes of ethics which essentially prohibit all Nuveen Fund management personnel, including Nuveen Fund portfolio managers, from engaging in personal investments which compete or interfere with, or attempt to take advantage of, a Fund’s anticipated or actual portfolio transactions, and are designed to assure that the interests of shareholders are placed before the interests of Nuveen personnel in connection with personal investment transactions.
Sub-Advisers
NAM has selected SBAM to serve as sub-adviser to manage the investment portfolios of the Santa Barbara Funds. Nuveen Investments purchased SBAM in October 2005. SBAM is organized as a Delaware member-managed limited liability company, and its sole managing member is Nuveen Investments. NAM pays SBAM a portfolio management fee equal to 50% of the advisory fee paid to NAM for its services to the Funds (net of any waivers, reimbursement payments, supermarket fees and alliance fees waived, reimbursed or paid by NAM in respect of the Funds).
NAM has selected Rittenhouse to serve as sub-adviser to manage the investment portfolio of the Rittenhouse Fund. Rittenhouse is a wholly-owned subsidiary of Nuveen Investments. NAM pays Rittenhouse a portfolio management fee based on the daily net assets of the Rittenhouse Fund at an annual rate as set forth below:
| | | |
Daily Net Assets | | Nuveen
Rittenhouse
Growth Fund | |
For the first $500 million. | | 0.35 | % |
For assets over $500 million | | 0.30 | % |
The following table sets forth the fees paid by NAM to each Fund’s sub-adviser for its services for the specified periods:
| | | | | | | | | |
| | | Amount Paid by NAM to SBAM |
| | | 3/28/06-
7/31/06 | | 8/01/06-
7/31/07 | | 8/01/07-
7/31/08 |
Dividend Growth Fund | | $ | — | | $ | — | | $ | 22,864 |
Growth Fund | | | — | | | 435 | | | 29,410 |
Growth Opportunities Fund | | | — | | | 482 | | | — |
| | | | | | | | | |
| | | Amount Paid by NAM to Rittenhouse |
| | | 8/01/05-
7/31/06 | | 8/01/06-
7/31/07 | | 8/01/07-
7/31/08 |
Rittenhouse Fund | | $ | 574,491 | | $ | 442,211 | | $ | 374,259 |
S-35
Portfolio Managers
The following individuals have primary responsibility for the day-to-day implementation of investment strategies of the Funds:
| | |
| Name | | Fund |
| James Boothe, CFA | | Growth Fund, Dividend Growth Fund |
| Michael Mayfield | | Growth Fund |
| Britton Smith, CFA | | Growth Fund |
| George Tharakan, CFA | | Growth Fund, Growth Opportunities Fund |
| Nancy M. Crouse, CFA | | Rittenhouse Fund |
| James J. Jolinger | | Rittenhouse Fund |
| Robert A. Norton, Jr., CFA | | Rittenhouse Fund |
| Daniel C. Roarty, CFA | | Rittenhouse Fund |
Other Accounts Managed. In addition to managing the Funds, certain portfolio managers are also primarily responsible for the day-to-day portfolio management of the following accounts. Information is provided as of July 31, 2008:
| | | | | | |
Portfolio Manager | | Type of Account Managed | | Number of
Accounts | | Assets* |
George Tharakan | | Registered Investment Companies Other Pooled Investment Vehicles Other Accounts | | 1
0 220 | | $1.28 Million
0 $993.9 Million |
Michael Mayfield | | Registered Investment Companies Other Pooled Investment Vehicles Other Accounts | | 1
0 161 | | $84.1 Million
0 $501.2 Million |
James Boothe | | Registered Investment Companies Other Pooled Investment Vehicles Other Accounts | | 2
0 132 | | $261.0 Million
0 $151.2 Million |
Britton Smith | | Registered Investment Companies Other Pooled Investment Vehicles Other Accounts | | 0
0 347 | | 0
0 $248.7 Million |
Nancy M. Crouse | | Registered Investment Companies | | 3 | | $6.26 Million** |
| | Other Pooled Investment Vehicles | | 4 | | $16.23 Million** |
| | Other Accounts | | 8,697 | | $1.87 Billion** |
James J. Jolinger | | Registered Investment Companies | | 3 | | $6.26 Million** |
| | Other Pooled Investment Vehicles | | 4 | | $16.23 Million** |
| | Other Accounts | | 8,699 | | $1.87 Billion** |
Robert A. Norton, Jr. | | Registered Investment Companies | | 3 | | $6.26 Million** |
| | Other Pooled Investment Vehicles | | 4 | | $16.23 Million** |
| | Other Accounts | | 8,696 | | $1.86 Billion** |
Daniel C. Roarty | | Registered Investment Companies | | 3 | | $6.26 Million** |
| | Other Pooled Investment Vehicles | | 4 | | $16.23 Million** |
| | Other Accounts | | 8,696 | | $1.87 Billion** |
| * | | None of the assets in these accounts are subject to an advisory fee based on performance. |
| ** | | Assets are as of September 30, 2008. |
SBAM
Compensation. SBAM’s portfolio managers participate in a highly competitive compensation structure with the purpose of attracting and retaining the most talented investment professionals and rewarding them through a total compensation program as determined by the firm’s executive committee. The total compensation program consists of both a base salary and an annual bonus that can be a multiple of the base salary. The portfolio manager’s performance is formally evaluated annually and based on a variety of factors. Bonus compensation is primarily a function of the firm’s overall annual
S-36
profitability and the individual portfolio manager’s contribution as measured by the overall investment performance of client portfolios in the strategy they manage relative to the strategy’s general benchmark for multiyear periods (as applicable), as well as an objective review of stock recommendations and the quality of primary research, and subjective review of the professional’s contributions to portfolio strategy, teamwork, collaboration and work ethic.
The total compensation package includes the availability of an equity like incentive for purchase (whose value is determined by the increase in profitability of SBAM over time) made to most investment professionals. SBAM is a subsidiary of Nuveen Investments, Inc., which has augmented this incentive compensation annually through individual awards of a stock option pool, as determined through a collaborative process between Nuveen Investments, Inc., and the SBAM executive committee.
Conflicts of Interest. SBAM’s portfolio management team’s simultaneous management of the Portfolio and the other accounts noted above may present actual or apparent conflicts of interest with respect to the allocation and aggregation of securities orders placed on behalf of the Portfolio and the other accounts. SBAM has adopted several policies that it believes addresses and mitigates potential conflicts of interest, including Best Execution Policy and Trading Policy and Procedures (including allocation) that are designed (1) to ensure that portfolio management is seeking the best price for portfolio securities under the circumstances, (2) to promote fair and equitable allocation of investment opportunities among accounts over time and (3) to comply with applicable regulatory requirements. All accounts are to be treated in a non-preferential manner, such that allocations are not based upon account performance, fee structure or preference of the portfolio manager. In addition, SBAM has adopted a Code of Conduct that sets forth policies regarding conflicts of interest. The code contains provisions reasonably necessary to prevent access persons, investment personnel, and SBAM’s portfolio management team from engaging in any conduct prohibited by paragraph (b) of Rule 17j-1 under the ICA (such as fraud, material misstatements or omissions and manipulative practices).
Rittenhouse
Compensation. Compensation for the investment team consists of three basic elements—base salary, cash bonus, and long-term incentive compensation. The Sub-Adviser’s compensation strategy is to annually compare overall compensation including these three elements, to the market in order to create a compensation structure that is competitive and consistent with similar financial services companies. As discussed below, several factors are considered in determining the team’s compensation. In any year these factors may include, among others, the effectiveness of the investment strategies recommended by the team, the investment performance of the accounts managed by the team, and the overall performance of Nuveen Investments, (the parent company of the Sub-Adviser). Although investment performance and assets under management are factors in determining the team’s compensation, they are not necessarily decisive factors. Additionally, although the Sub-Adviser will use certain benchmarks to evaluate the team’s performance, (specifically the composite of the Rittenhouse Large-Cap Growth Portfolio; the composite of the Russell 1000 Growth Index; and the Rittenhouse Strategy Portfolio, a proprietary benchmark consisting of certain equity securities in Rittenhouse’s universe that reflect Rittenhouse’s conservative large-cap growth equity strategy) these benchmarks are only some of the factors considered in determining compensation.
Base Salary. Each member of the investment team is paid a base salary that is set at a level determined by the Sub-Adviser in accordance with its overall compensation strategy discussed above. The Sub-Adviser is not under any current contractual obligation to increase the base salaries of any team members.
Cash Bonus. Each member of the investment team is eligible to receive an annual cash bonus. The level of these bonuses are based upon evaluations and determinations made by the team’s direct management, including the CEO and President of the Sub-Adviser’s parent company, Nuveen Investments. These reviews and evaluations take into account a number of factors, including the effectiveness of the team’s investment strategies, the performance of the accounts for which the team serves as portfolio management relative to any benchmarks established for the accounts, the team’s effectiveness in communicating investment performance to shareholders and their representatives, and the team’s contribution to the Sub-Adviser’s investment process and execution of investment strategies. The cash bonus component is also impacted by the overall performance of the parent company in
S-37
achieving its business objectives. The Sub-Adviser is not under any current contractual obligation with respect to the payment of cash bonuses to any of the team members.
Long-Term Incentive Compensation. Each member of the investment team is eligible to receive bonus compensation in the form of equity-based awards issued in securities issued by Nuveen Investments. The amount of such compensation is dependent upon the same factors articulated for cash bonus awards but also factors in long-term potential with the firm. The Sub-Adviser is not under any current contractual obligation with respect to the granting of equity-based compensation to any of the team members.
Deferred Retention Program. Certain members of the investment team, Daniel Roarty, James Jolinger, Robert Norton and Nancy Crouse, also participate in a Deferred Retention Award program, as part of their compensation for the management of the Rittenhouse Large-Cap Growth Portfolio. Awards granted under this program cliff vest over five years, and are adjusted over the vesting period on a quarterly basis for investment gains/losses to reflect the actual performance of the composite of the Rittenhouse Large-Cap Growth Portfolio, thereby linking compensation with the portfolio’s success.
Conflicts of Interest. Rittenhouse’s portfolio management team’s simultaneous management of the Portfolio and the other accounts noted above may present actual or apparent conflicts of interest with respect to the allocation and aggregation of securities orders placed on behalf of the Portfolio and the other accounts. Rittenhouse has adopted several policies that it believes addresses and mitigates potential conflicts of interest, including Best Execution Policy and Trading Policy and Procedures (including allocation and rotation) that are designed (1) to ensure that portfolio management is seeking the best price for portfolio securities under the circumstances, (2) to promote fair and equitable allocation of investment opportunities among accounts over time and (3) to comply with applicable regulatory requirements. All accounts are to be treated in a non-preferential manner, such that allocations are not based upon account performance, fee structure or preference of the portfolio manager. In addition, Rittenhouse has adopted a Code of Ethics that establishes Standards of Business Conduct that sets forth policies regarding conflicts of interest. The code contains provisions reasonably necessary to prevent access persons, investment personnel, and the Rittenhouse’s portfolio management team from engaging in any conduct prohibited by paragraph (b) of Rule 17j-1 under the ICA (such as fraud, material misstatements or omissions and manipulative practices).
Beneficial Ownership of Securities
As of November 1, 2008, each portfolio manager beneficially owned the following dollar range of equity securities issued by the Fund he or she manages or co-manages:
| | | | | |
Name of Portfolio Manager | |
Fund | | Dollar Range of
Equity Securities
Beneficially Owned in
Fund Managed |
James Boothe | | Dividend Growth Fund | | $ | 500,001-$1,000,000 |
| | Growth Fund | | $ | 0 |
Michael Mayfield | | Growth Fund | | $ | 500,001-$1,000,000 |
Britton Smith | | Growth Fund | | $ | 500,001-$1,000,000 |
Nancy C. Crouse | | Rittenhouse Fund | | $ | 100,001-$500,000 |
James J. Jolinger | | Rittenhouse Fund | | $ | 10,001-$50,000 |
Robert A. Norton, Jr. | | Rittenhouse Fund | | $ | 100,001-$500,000 |
Daniel C. Roarty | | Rittenhouse Fund | | $ | 50,001-$100,000 |
Proxy Voting Policies
Each Fund has adopted a proxy voting policy that seeks to ensure that proxies for securities held by the Fund are voted consistently and solely in the best economic interests of the Fund. For each Fund’s sub-adviser, a member of each Fund’s management team is responsible for oversight of the Fund’s proxy voting process.
SBAM
With regard to equity securities and taxable-fixed income securities, SBAM has engaged the services of RiskMetrics Group, Inc. (“RMG”) to make recommendations on the voting of proxies relating to
S-38
securities held by the Funds and managed by SBAM. RMG provides voting recommendations based upon established guidelines and practices. SBAM reviews and frequently follows RMG recommendations. However, on selected issues, SBAM may not vote in accordance with the RMG recommendations when it believes that specific RMG recommendations are not in the best economic interest of the applicable Fund. If SBAM manages the assets of a company or its pension plan and any of SBAM’s clients hold any securities of that company, SBAM will vote proxies relating to such company’s securities in accordance with the RMG recommendations to avoid any conflict of interest. Where a material conflict of interest has been identified by SBAM and RMG does not offer a recommendation on the matter, SBAM shall disclose the conflict and the Proxy Voting Committee shall determine the manner in which to vote to the Fund’s Board or its designated committee.
Although SBAM has affiliates that provide investment advisory, broker-dealer, insurance or other financial services, they do not receive non-public information about the business arrangements of such affiliates (except with regard to major distribution partners of their investment products) or the directors, officers and employees of such affiliates. Therefore, SBAM is unable to consider such information when determining whether there are material conflicts of interests.
Rittenhouse
Rittenhouse votes proxies in a manner that, in its judgment, is in the best interest of clients. Rittenhouse has adopted proxy voting guidelines that are designed to provide guidance on how to address specific proposals as they arise. Rittenhouse developed its guidelines internally, with the assistance of third party consultants. Rittenhouse has established a Corporate Governance Committee for oversight of the proxy voting process.
Rittenhouse’s Corporate Governance Committee supervises the proxy voting process, including determining how to vote proxies relating to issues not covered by the Guidelines, determining when Rittenhouse may deviate from the Guidelines and identifying material conflicts of interest involving Rittenhouse in connection with voting proxies of securities owned by Rittenhouse’s clients. The Corporate Governance Committee also authorizes the voting of proxies, reviews and approves any amendments to the Proxy Voting Policy and Guidelines and oversees recordkeeping and reporting in accordance applicable law.
Unless the Corporate Governance Committee otherwise determines (and documents the basis for its decision) or as otherwise provided below, proxies shall be voted in a manner consistent with the guidelines contained therein. Where a material conflict of interest has been identified and the matter is addressed in the Guidelines, the proxies shall be voted in accordance with the Guidelines. Where a material conflict of interest has been identified and the matter is not covered in the Guidelines, the Corporate Governance Committee shall follow the recommendation of, or delegate voting to, a third party proxy service provider, or disclose the conflict to the client and advise the client that its securities will be voted upon the client’s written direction.
When required by applicable regulations, information regarding how each Fund voted proxies relating to portfolio securities will be available without charge by calling (800) 257-8787 or by accessing the Securities and Exchange Commission’s website at http://www.sec.gov.
PORTFOLIO TRANSACTIONS
The Funds’ sub-advisers are responsible for decisions to buy and sell securities for the Funds and for the placement of the Funds’ securities business, the negotiation of the commissions to be paid on brokered transactions, the prices for principal trades in securities, and the allocation of portfolio brokerage and principal business. It is the policy of the sub-advisers to seek the best execution at the best security price available with respect to each transaction, and with respect to brokered transactions, in light of the overall quality of brokerage and research services provided to the respective adviser and its advisees. The best price to the Funds means the best net price without regard to the mix between purchase or sale price and commission, if any. Purchases may be made from underwriters, dealers, and, on occasion, the issuers.
Commissions will be paid on a Fund’s futures and options transactions, if any. The purchase price of portfolio securities purchased from an underwriter or dealer may include underwriting commissions
S-39
and dealer spreads. The Funds may pay mark-ups on principal transactions. In selecting broker-dealers and in negotiating commissions, the portfolio manager considers, among other things, the firm’s reliability, the quality of its execution services on a continuing basis and its financial condition. Brokerage will not be allocated based on the sale of a Fund’s shares.
Section 28(e) of the 1934 Act permits an investment adviser, under certain circumstances, to cause an account to pay a broker or dealer who supplies brokerage and research services a commission for effecting a transaction in excess of the amount of commission another broker or dealer would have charged for effecting the transaction. Brokerage and research services include (a) furnishing advice as to the value of securities, the advisability of investing, purchasing or selling securities, and the availability of securities or purchasers or sellers of securities; (b) furnishing analyses and reports concerning issuers, industries, securities, economic factors and trends, portfolio strategy, and the performance of accounts; and (c) effecting securities transactions and performing functions incidental thereto (such as clearance, settlement, and custody).
In light of the above, in selecting brokers, the sub-advisers may consider investment and market information and other research, such as economic, securities and performance measurement research, provided by such brokers, and the quality and reliability of brokerage services, including execution capability, performance and financial responsibility. Accordingly, the commissions charged by any such broker may be greater than the amount another firm might charge if the sub-advisers determine in good faith that the amount of such commissions is reasonable in relation to the value of the research information and brokerage services provided by such broker to a sub-adviser or a Fund. The sub-advisers believe that the research information received in this manner provides a Fund with benefits by supplementing the research otherwise available to the Fund. The Management Agreement and the Sub-Advisory Agreement, if applicable, provide that such higher commissions will not be paid by a Fund unless the applicable adviser determines in good faith that the amount is reasonable in relation to the services provided. The investment advisory fees paid by a Fund to NAM under the Management Agreement or the sub-advisory fees paid by NAM to the sub-advisers under the Sub-Advisory Agreement are not reduced as a result of receipt by either NAM or the sub-advisers of research services.
Each sub-adviser places portfolio transactions for other advisory accounts managed by it. Research services furnished by firms through which the Funds effect their securities transactions may be used by the sub-advisers in servicing all of their accounts; not all of such services may be used by the sub-advisers in connection with the Funds. The sub-advisers believe it is not possible to measure separately the benefits from research services to each of the accounts (including the Funds) managed by them. Because the volume and nature of the trading activities of the accounts are not uniform, the amount of commissions in excess of those charged by another broker paid by each account for brokerage and research services will vary. However, the sub-advisers believe such costs to each Fund will not be disproportionate to the benefits received by the Funds on a continuing basis. The sub-advisers seek to allocate portfolio transactions equitably whenever concurrent decisions are made to purchase or sell securities by the Funds and another advisory account. In some cases, this procedure could have an adverse effect on the price or the amount of securities available to the Funds. In making such allocations between the Funds and other advisory accounts, the main factors considered by the sub-advisers are the respective investment objectives, the relative size of portfolio holdings of the same or comparable securities, the availability of cash for investment and the size of investment commitments generally held.
The following table sets forth the aggregate amount of brokerage commissions paid by the Funds for the specified periods:
| | | | | | | | | |
| | | Aggregate Amount of
Brokerage Commissions |
| | | 3/28/06-
7/31/06 | | 8/01/06-
7/31/07 | | 8/01/07-
7/31/08 |
Dividend Growth Fund | | $ | 1,524 | | $ | 1,850 | | $ | 11,413 |
Growth Fund | | | 2,394 | | | 5,215 | | | 12,788 |
Growth Opportunities Fund | | | 2,725 | | | 2,375 | | | 2,181 |
S-40
| | | | | | | | | |
| | | Aggregate Amount of
Brokerage Commissions |
| | | 8/01/05-
7/31/06 | | 8/01/06-
7/31/07 | | 8/01/07-
7/31/08 |
Rittenhouse Fund | | $ | 241,527 | | $ | 105,109 | | $ | 113,137 |
During the fiscal year ended July 31, 2008, the Growth Fund, the Growth Opportunities Fund and the Rittenhouse Fund paid to brokers as commissions in return for research services $15, $23 and $95,062, respectively, and the aggregate amount of those transactions per Fund on which such commissions were paid was $18,065, $50,506 and $81,511,061, respectively. The Dividend Growth Fund did not pay to brokers commissions in return for research services for the year ended July 31, 2008. The brokerage commissions paid by the Dividend Growth Fund and Growth Fund were higher for the fiscal year ended July 31, 2008 than in the previous fiscal year due to a significant increase in net assets under management and resulting increase in portfolio activity.
The Funds did not hold during the fiscal year ended July 31, 2008 any securities of their regular brokers or dealers as defined in Rule 10b-1 under the 1940 Act or of the parents of the brokers or dealers.
Under the 1940 Act, a Fund may not purchase portfolio securities from any underwriting syndicate of which Nuveen is a member except under certain limited conditions set forth in Rule 10f-3. The Rule sets forth requirements relating to, among other things, the terms of a security purchased by a Fund, the amount of securities that may be purchased in any one issue and the assets of a Fund that may be invested in a particular issue. In addition, purchases of securities made pursuant to the terms of the Rule must be approved at least quarterly by the Board of Trustees, including a majority of the trustees who are not interested persons of the Trust.
NET ASSET VALUE
Each Fund’s net asset value per share is determined separately for each class of the applicable Fund’s shares as of the close of trading (normally 4:00 p.m. New York time) on each day the New York Stock Exchange (the “NYSE”) is open for business. The NYSE is not open for trading on New Year’s Day, Washington’s Birthday, Martin Luther King’s Birthday, Good Friday, Memorial Day, Independence Day, Labor Day, Thanksgiving Day and Christmas Day. A Fund’s net asset value may not be calculated on days during which the Fund receives no orders to purchase shares and no shares are tendered for redemption. Net asset value per share of a class of a Fund is calculated by taking the value of the pro rata portion of the Fund’s total assets attributable to that class, including interest or dividends accrued but not yet collected, less all liabilities attributable to that class (including the class’s pro rata portion of the Fund’s liabilities) and dividing by the total number of shares of that class outstanding. The result, rounded to the nearest cent, is the net asset value per share of that class. In determining net asset value, expenses are accrued and applied daily and securities and other assets for which market quotations are available, including ETFs in which a Fund invests, are valued at market value. Common stocks and other equity-type securities are valued at the last sales price on the securities exchange on which such securities are primarily traded. Securities primarily traded on the NASDAQ National Market are valued, except as indicated below, at the NASDAQ Official Closing Price. However, securities traded on a securities exchange or NASDAQ for which there were no transactions on a given day or securities not listed on a securities exchange or NASDAQ are valued at the mean between the quoted bid and asked prices. Prices of certain ADRs held by the Funds that trade in only limited volume in the United States are valued based on the mean between the most recent bid and ask price of the underlying non-U.S.-traded stock, adjusted as appropriate for underlying-to-ADR conversion ratio and non-U.S. exchange rate, and from time to time may also be adjusted further to take into account material events that may take place after the close of the local non-U.S. market but before the close of the NYSE. Fixed-income securities are valued by a pricing service that values portfolio securities at the mean between the quoted bid and asked prices or the yield equivalent when quotations are readily available. Securities for which quotations are not readily available are valued at fair value as determined by the pricing service using methods that include consideration of the following: yields or prices of securities or bonds of comparable quality, type of issue, coupon, maturity and rating; indications as to value from securities dealers; and general market conditions. The pricing service may employ electronic data processing
S-41
techniques and/or a matrix system to determine valuations. Debt securities having remaining maturities of 60 days or less when purchased are valued by the amortized cost method when the Board of Trustees determines that the fair market value of such securities is their amortized cost. Under this method of valuation, a security is initially valued at its acquisition cost, and thereafter amortization of any discount or premium is assumed each day, regardless of the impact of fluctuating interest rates on the market value of the security.
Certain securities may not be able to be priced by pre-established pricing methods. Such securities may be valued by the Board of Trustees or its delegate at fair value. These securities generally include, but are not limited to, restricted securities (securities which may not be publicly sold without registration under the Securities Act of 1933, as amended) for which a pricing service is unable to provide a market price; securities whose trading has been formally suspended; debt securities that have gone into default and for which there is no current market quotation; a security whose market price is not available from a pre-established pricing source; a security with respect to which an event has occurred that is likely to materially affect the value of the security after the market has closed but before the calculation of a Fund’s net asset value (as may be the case in non-U.S. markets on which the security is primarily traded) or make it difficult or impossible to obtain a reliable market quotation; and, a security whose price, as provided by the pricing service, does not reflect the security’s “fair value.” As a general principle, the current “fair value” of an issue of securities would appear to be the amount which the owner might reasonably expect to receive for them upon their current sale. A variety of factors may be considered in determining the fair value of such securities.
Regardless of the method employed to value a particular security, all valuations are subject to review by a Fund’s Board of Trustees or its delegate who may determine the appropriate value of a security whenever the value as calculated is significantly different from the previous day’s calculated value.
If a Fund holds securities that are primarily listed on non-U.S. exchanges, the net asset value of the Fund’s shares may change on days when shareholders will not be able to purchase or redeem the Fund’s shares.
TAX MATTERS
Federal Income Tax Matters
The following discussion of federal income tax matters is based upon the advice of Chapman and Cutler LLP, counsel to the Trust.
This section summarizes some of the main U.S. federal income tax consequences of owning shares of a Fund. This section is current as of the date of this Statement of Additional Information. Tax laws and interpretations change frequently, and this summary does not describe all of the tax consequences to all taxpayers. For example, this summary generally does not describe your situation if you are a corporation, a non-U.S. person, a broker-dealer, or other investor with special circumstances. In addition, this section does not describe your state, local or non-U.S. taxes. The Internal Revenue Service could disagree with any conclusions set forth in this section. In addition, counsel to the Trust was not asked to review, and has not reached a conclusion with respect to the federal income tax treatment of the assets to be deposited in the Funds. This may not be sufficient for you to use for the purpose of avoiding penalties under federal tax law. As with any investment, you should seek advice based on your individual circumstances from your own tax advisor.
Fund Status. Each Fund intends to qualify as a “regulated investment company” under the federal tax laws. If a Fund qualifies as a regulated investment company and distributes its income as required by the tax law, the Fund generally will not pay federal income taxes.
Distributions. Fund distributions are generally taxable. After the end of each year, you will receive a tax statement that separates your Fund’s distributions into two categories, ordinary income distributions and capital gains dividends. Ordinary income distributions are generally taxed at your ordinary tax rate, however, as further discussed below, certain ordinary income distributions received from the Fund may be taxed at the capital gains tax rates. Generally, you will treat all capital gains dividends as long-term
S-42
capital gains regardless of how long you have owned your shares. To determine your actual tax liability for your capital gains dividends, you must calculate your total net capital gain or loss for the tax year after considering all of your other taxable transactions, as described below. In addition, a Fund may make distributions that represent a return of capital for tax purposes and thus will generally not be taxable to you. The tax status of your distributions from your Fund is not affected by whether you reinvest your distributions in additional shares or receive them in cash. The income from your Fund that you must take into account for federal income tax purposes is not reduced by amounts used to pay a deferred sales fee, if any. The tax laws may require you to treat distributions made to you in January as if you had received them on December 31 of the previous year.
Dividends Received Deduction. A corporation that owns shares generally will not be entitled to the dividends received deduction with respect to many dividends received from the Funds, because the dividends received deduction is generally not available for distributions from regulated investment companies. However, certain ordinary income dividends on shares that are attributable to qualifying dividends received by a Fund from certain corporations may be designated by the Fund as being eligible for the dividends received deduction.
If You Sell or Redeem Shares. If you sell or redeem your shares, you will generally recognize a taxable gain or loss. To determine the amount of this gain or loss, you must subtract your tax basis in your shares from the amount you receive in the transaction. Your tax basis in your shares is generally equal to the cost of your shares, generally including sales charges. In some cases, however, you may have to adjust your tax basis after you purchase your shares.
Taxation of Capital Gains and Losses. If you are an individual, the maximum marginal federal tax rate for net capital gain is generally 15% (generally 5% for certain taxpayers in the 10% and 15% tax brackets). These capital gains rates are generally effective for taxable years beginning before January 1, 2011. For later periods, if you are an individual, the maximum marginal federal tax rate for net capital gain is generally 20% (10% for certain taxpayers in the 10% and 15% tax brackets). The 20% rate is reduced to 18% and the 10% rate is reduced to 8% for long-term gains from most property acquired after December 31, 2000, with a holding period of more than five years. Net capital gain equals net long-term capital gain minus net short-term capital loss for the taxable year. Capital gain or loss is long-term if the holding period for the asset is more than one year and is short-term if the holding period for the asset is one year or less. You must exclude the date you purchase your shares to determine your holding period. However, if you receive a capital gain dividend from your Fund and sell your share at a loss after holding it for six months or less, the loss will be recharacterized as long-term capital loss to the extent of the capital gain dividend received. The tax rates for capital gains realized from assets held for one year or less are generally the same as for ordinary income. In addition, the Code treats certain capital gains as ordinary income in special situations.
Taxation of Certain Ordinary Income Dividends. Ordinary income dividends received by an individual shareholder from a regulated investment company such as the Fund are generally taxed at the same rates that apply to net capital gain (as discussed above), provided certain holding period requirements are satisfied and provided the dividends are attributable to qualifying dividends received by the Fund itself. These special rules relating to the taxation of ordinary income dividends from regulated investment companies generally apply to taxable years beginning before January 1, 2011. The Fund will provide notice to its shareholders of the amount of any distribution which may be taken into account as a dividend which is eligible for the new capital gains tax rates.
In-Kind Distributions. Under certain circumstances, as described in this Statement of Additional Information, you may receive an in-kind distribution of your Fund securities when you redeem shares or when your Fund terminates. This distribution will be treated as a sale for federal income tax purposes and you will generally recognize gain or loss, generally based on the value at that time of the securities and the amount of cash received. The Internal Revenue Service could however assert that a loss could not be currently deducted.
Deductibility of Fund Expenses. Expenses incurred and deducted by your Fund will generally not be treated as income taxable to you. In some cases, however, you may be required to treat your portion of these Fund expenses as income. In these cases you may be able to take a deduction for these expenses. However, certain miscellaneous itemized deductions, such as investment expenses, may be deducted by individuals only to the extent that all of these deductions exceed 2% of the individual’s adjusted gross income.
S-43
Non-U.S. Tax Credit. If your Fund invests in any non-U.S. securities, the tax statement that you receive may include an item showing non-U.S. taxes your Fund paid to other countries. In this case, dividends taxed to you will include your share of the taxes your Fund paid to other countries. You may be able to deduct or receive a tax credit for your share of these taxes.
Investments in Certain Non-U.S. Corporations. If a Fund holds an equity interest in any “passive foreign investment companies” (“PFICs”), which are generally certain foreign corporations that receive at least 75% of their annual gross income from passive sources (such as interest, dividends, certain rents and royalties or capital gains) or that hold at least 50% of their assets in investments producing such passive income, a Fund could be subject to U.S. federal income tax and additional interest charges on gains and certain distributions with respect to those equity interests, even if all the income or gain is timely distributed to its shareholders. A Fund will not be able to pass through to its shareholders any credit or deduction for such taxes. A Fund may be able to make an election that could ameliorate these adverse tax consequences. In this case, a Fund would recognize as ordinary income any increase in the value of such PFIC shares, and as ordinary loss any decrease in such value to the extent it did not exceed prior increases included in income. Under this election, a Fund might be required to recognize in a year income in excess of its distributions from PFICs and its proceeds from dispositions of PFIC stock during that year, and such income would nevertheless be subject to the distribution requirement and would be taken into account for purposes of the 4% excise tax. Dividends paid by PFICs will not be treated as qualified dividend income.
Non-U.S. Investors. If you are a non-U.S. investor (i.e., an investor other than a U.S. citizen or resident or a U.S. corporation, partnership, estate or trust), you should be aware that, generally, subject to applicable tax treaties, distributions from a Fund will be characterized as dividends for federal income tax purposes (other than dividends which a Fund designates as capital gain dividends) and will be subject to U.S. income taxes, including withholding taxes, subject to certain exceptions described below. However, distributions received by a non-U.S. investor from a Fund that are properly designated by a Fund as capital gain dividends may not be subject to U.S. federal income taxes, including withholding taxes, provided that a Fund makes certain elections and certain other conditions are met. In the case of dividends with respect to taxable years of a Fund beginning prior to 2010, distributions from a Fund that are properly designated by a Fund as an interest-related dividend attributable to certain interest income received by a Fund or as a short-term capital gain dividend attributable to certain net short-term capital gain income received by a Fund may not be subject to U.S. federal income taxes, including withholding taxes when received by certain non-U.S. investors, provided that a Fund makes certain elections and certain other conditions are met.
ADDITIONAL INFORMATION ON THE PURCHASE AND REDEMPTION OF FUND SHARES AND SHAREHOLDER PROGRAMS
As described in the Prospectus, the Funds provide you with alternative ways of purchasing Fund shares based upon your individual investment needs and preferences.
Each class of shares of a Fund represents an interest in the same portfolio of investments. Each class of shares is identical in all respects except that each class bears its own class expenses, including distribution and administration expenses, and each class has exclusive voting rights with respect to any distribution or service plan applicable to its shares. As a result of the differences in the expenses borne by each class of shares, net income per share, dividends per share and net asset value per share will vary among a Fund’s classes of shares. There are no conversion, preemptive or other subscription rights, except that Class B shares automatically convert into Class A shares as described below.
Shareholders of each class will share expenses proportionately for services that are received equally by all shareholders. A particular class of shares will bear only those expenses that are directly attributable to that class, where the type or amount of services received by a class varies from one class to another. For example, class-specific expenses generally will include distribution and service fees for those classes that pay such fees.
S-44
The minimum initial investment is $3,000 per Fund share class ($1,000 for individual retirement accounts, $500 for educational individual retirement accounts, $50 if you establish a systematic investment plan, and $250 for accounts opened through fee-based programs). The Funds reserve the right to reject purchase orders and to waive or increase the minimum investment requirements.
The expenses to be borne by specific classes of shares may include (i) transfer agency fees attributable to a specific class of shares, (ii) printing and postage expenses related to preparing and distributing materials such as shareholder reports, prospectuses and proxy statements to current shareholders of a specific class of shares, (iii) SEC and state securities registration fees incurred by a specific class of shares, (iv) the expense of administrative personnel and services required to support the shareholders of a specific class of shares, (v) litigation or other legal expenses relating to a specific class of shares, (vi) directors’ fees or expenses incurred as a result of issues relating to a specific class of shares, (vii) accounting expenses relating to a specific class of shares and (viii) any additional incremental expenses subsequently identified and determined to be properly allocated to one or more classes of shares.
Class A Shares
Class A shares may be purchased at a public offering price equal to the applicable net asset value per share plus an up-front sales charge imposed at the time of purchase as set forth in the Prospectus. Shareholders may qualify for a reduced sales charge, or the sales charge may be waived in its entirety, as described below. Class A shares are also subject to an annual service fee of 0.25%. See “Distribution and Service Plans.” Set forth below is an example of the method of computing the offering price of the Class A shares of each of the Funds. The example assumes a purchase on July 31, 2008 of Class A shares of a Fund aggregating less than $50,000 subject to the schedule of sales charges set forth in the Prospectus at a price based upon the net asset value of the Class A shares.
| | | | | | | | | | | | |
| | | Dividend
Growth
Fund | | Growth
Fund | | Growth
Opportunities
Fund | | Rittenhouse
Fund |
Net Asset Value per share | | $ | 22.82 | | $ | 20.09 | | $ | 17.94 | | $ | 22.18 |
Per Share Sales Charge—5.75% of public offering price (6.09%, 6.12%, 6.08% and 6.09%
of net asset value per share) | | | 1.39 | | | 1.23 | | | 1.09 | | | 1.35 |
| | | | | | | | | | | | |
Per Share Offering Price to the Public | | $ | 24.21 | | $ | 21.32 | | $ | 19.03 | | $ | 23.53 |
| | | | | | | | | | | | |
Each Fund receives the entire net asset value of all Class A shares that are sold. Nuveen retains the full applicable sales charge from which it pays the uniform reallowances shown in the Prospectus to financial intermediaries.
Reduction or Elimination of Up-Front Sales Charge on Class A Shares
Rights of Accumulation
You may qualify for a reduced sales charge on a purchase of Class A shares of any Fund if the amount of your purchase, when added to the value that day of all of your shares of any Nuveen Mutual Fund, falls within the amounts stated in the Class A Sales Charges and Commissions table in “How You Can Buy and Sell Shares” in the Prospectus. You or your financial advisor must notify Nuveen or the Fund’s transfer agent of any cumulative discount whenever you plan to purchase Class A shares of a Fund that you wish to qualify for a reduced sales charge.
Letter of Intent
You may qualify for a reduced sales charge on a purchase of Class A shares of any Fund if you plan to purchase Class A shares of Nuveen Mutual Funds over the next 13 months and the total amount of your purchases would, if purchased at one time, qualify you for one of the reduced sales charges shown in the Class A Sales Charges and Commissions table in “How You Can Buy and Sell Shares” in the Prospectus. In order to take advantage of this option, you must complete the applicable section of the Application Form or sign and deliver either to a financial intermediary or to the Fund’s transfer agent a
S-45
written Letter of Intent in a form acceptable to Nuveen. A Letter of Intent states that you intend, but are not obligated, to purchase over the next 13 months a stated total amount of Class A shares that would qualify you for a reduced sales charge shown above. You may count shares of all Nuveen Mutual Funds that you already own and any Class B and Class C shares of a Nuveen Mutual Fund that you purchase over the next 13 months towards completion of your investment program, but you will receive a reduced sales charge only on new Class A shares you purchase with a sales charge over the 13 months. You cannot count towards completion of your investment program Class A shares that you purchase without a sales charge through investment of distributions from a Nuveen Mutual Fund or a Nuveen Defined Portfolio, or otherwise.
By establishing a Letter of Intent, you agree that your first purchase of Class A shares of a Fund following execution of the Letter of Intent will be at least 5% of the total amount of your intended purchases. You further agree that shares representing 5% of the total amount of your intended purchases will be held in escrow pending completion of these purchases. All dividends and capital gains distributions on Class A shares held in escrow will be credited to your account. If total purchases, less redemptions, prior to the expiration of the 13 month period equal or exceed the amount specified in your Letter of Intent, the Class A shares held in escrow will be transferred to your account. If the total purchases, less redemptions, exceed the amount specified in your Letter of Intent and thereby qualify for a lower sales charge than the sales charge specified in your Letter of Intent, you will receive this lower sales charge retroactively, and the difference between it and the higher sales charge paid will be used to purchase additional Class A shares on your behalf. If the total purchases, less redemptions, are less than the amount specified, you must pay Nuveen an amount equal to the difference between the amounts paid for these purchases and the amounts which would have been paid if the higher sales charge had been applied. If you do not pay the additional amount within 20 days after written request by Nuveen or your financial advisor, Nuveen will redeem an appropriate number of your escrowed Class A shares to meet the required payment. By establishing a Letter of Intent, you irrevocably appoint Nuveen as attorney to give instructions to redeem any or all of your escrowed shares, with full power of substitution in the premises.
You or your financial advisor must notify Nuveen or the Funds’ transfer agent whenever you make a purchase of Fund shares that you wish to be covered under the Letter of Intent option.
For purposes of determining whether you qualify for a reduced sales charge as described under Rights of Accumulation and Letter of Intent, you may include together with your own purchases those made by your spouse (or equivalent if recognized under local law) and your children under 21 years of age, whether these purchases are made through a taxable or non-taxable account. You may also include purchases made by a corporation, partnership or sole proprietorship which is 100% owned, either alone or in combination, by any of the foregoing. In addition, a trustee or other fiduciary can count all shares purchased for a single trust, estate or other single fiduciary account that has multiple accounts (including one or more employee benefit plans of the same employer).
Reinvestment of Nuveen Defined Portfolio Distributions
You may purchase Class A shares without an up-front sales charge by reinvestment of distributions from any of the various Defined Portfolios sponsored by Nuveen. There is no initial or subsequent minimum investment requirement for such reinvestment purchases. Nuveen is no longer sponsoring new Defined Portfolios.
Also, investors will be able to buy Class A shares at net asset value by using the termination/maturity proceeds from Nuveen Defined Portfolios. You must provide Nuveen appropriate documentation that the Defined Portfolio termination/maturity occurred not more than 90 days prior to reinvestment.
Elimination of Sales Charge on Class A Shares
Class A shares of a Fund may be purchased at net asset value without a sales charge, and may be purchased by the following categories of investors:
| | • | | investors purchasing $1,000,000 or more (Nuveen may pay financial intermediaries on Class A sales of $1 million and above up to an additional 0.25% of the purchase amounts); |
| | • | | officers, trustees and former trustees of the Nuveen Funds; |
S-46
| | • | | bona fide, full-time and retired employees of Nuveen, and subsidiaries thereof, or their immediate family members (immediate family members are defined as their spouses, parents, children, grandparents, grandchildren, parents-in-law, sons- and daughters-in-law, siblings, a sibling’s spouse, and a spouse’s siblings); |
| | • | | any person who, for at least the last 90 days, has been an officer, director or bona fide employee of any financial intermediary, or their immediate family members; |
| | • | | bank or broker-affiliated trust departments investing funds over which they exercise exclusive discretionary investment authority and that are held in a fiduciary, agency, advisory, custodial or similar capacity; |
| | • | | investors purchasing on a periodic fee, asset-based fee or no transaction fee basis through a broker-dealer sponsored mutual fund purchase program; |
| | • | | clients of investment advisers, financial planners or other financial intermediaries that charge periodic or asset-based fees for their services; |
| | • | | employer-sponsored retirement plans except SEPs, SAR-SEPs, SIMPLE IRAs and KEOGH plans; and |
| | • | | with respect to purchases by employer-sponsored retirement plans with at least 25 employees and that either (a) make an initial purchase of one or more Nuveen Mutual Funds aggregating $500,000 or more; or (b) execute a Letter of Intent to purchase in the aggregate $500,000 or more of fund shares. Nuveen will pay financial intermediaries a sales commission on these purchases equal to 1% of the first $2.5 million, plus 0.50% of the next $2.5 million, plus 0.25% of any amount purchased over $5.0 million. Unless the financial intermediary elects to waive the commission, a contingent deferred sales charge of 1% will be assessed on redemptions within 12 months of purchase, unless waived. |
Any Class A shares purchased pursuant to a special sales charge waiver must be acquired for investment purposes and on the condition that they will not be transferred or resold except through redemption by the Funds. You or your financial advisor must notify Nuveen or your Fund’s transfer agent whenever you make a purchase of Class A shares of any Fund that you wish to be covered under these special sales charge waivers.
Class A shares of any Fund may be issued at net asset value without a sales charge in connection with the acquisition by a Fund of another investment company. All purchases under the special sales charge waivers will be subject to minimum purchase requirements as established by the Funds.
If you are eligible to purchase either Class A shares or Class I shares without a sales charge at net asset value, you should be aware of the differences between these two classes of shares. Class A shares are subject to an annual service fee to compensate financial intermediaries for providing you with ongoing account services. Class I shares are not subject to a distribution or service fee and, consequently, holders of Class I shares may not receive the same types or levels of services from financial intermediaries. In choosing between Class A shares and Class I shares, you should weigh the benefits of the services to be provided by financial intermediaries against the annual service fee imposed upon the Class A shares.
The reduced sales charge programs may be modified or discontinued by the Funds at any time.
For more information about the purchase of Class A shares or the reduced sales charge program, or to obtain the required application forms, call Nuveen Investor Services toll-free at (800) 257-8787.
Class B Shares
Class B shares are not available for new accounts or for additional investment into existing accounts. Class B shares will only be issued (i) upon the exchange of Class B shares from another Nuveen Mutual Fund, (ii) for purposes of dividend reinvestment, and (iii) through December 31, 2008, for defined contribution plans and investors using automatic investment plans with investments in Class B shares as of March 31, 2008.
Eligible investors may purchase Class B shares at a public offering price equal to the applicable net asset value per share without any up-front sales charge. Since Class B shares are sold without an initial
S-47
sales charge, the full amount of your purchase payment will be invested in Class B shares. Class B shares are subject to an annual distribution fee to compensate Nuveen for its costs in connection with the sale of Class B shares, and are also subject to an annual service fee to compensate financial intermediaries for providing you with ongoing financial advice and other account services. Each Fund has established a maximum purchase amount for the Class B shares of the Funds. Class B shares purchase orders equaling or exceeding $100,000 will not be accepted. In addition, purchase orders for a single purchaser that, when added to the value that day of all such purchaser’s shares of any class of any Nuveen Mutual Fund, cause the purchaser’s cumulative total of shares in Nuveen Mutual Funds to equal or exceed the aforementioned limit will not be accepted. Purchase orders for a single purchaser equal to or exceeding the foregoing limit should be placed only for Class A or Class C shares, unless such purchase has been reviewed and approved as suitable for the client by the appropriate compliance personnel of the financial intermediaries, and the Fund receives written confirmation of such approval.
You may be subject to a Contingent Deferred Sales Charge (“CDSC”) if you redeem your Class B shares prior to the end of the sixth year after purchase. See “Reduction or Elimination of Contingent Deferred Sales Charge” below. Nuveen compensates financial intermediaries for sales of Class B shares at the time of sale at the rate of 4.00% of the amount of Class B shares purchased, which represents a sales commission of 3.75% plus an advance on the first year’s annual service fee of 0.25%.
Class B shares acquired through the reinvestment of dividends are not subject to a CDSC. Any CDSC will be imposed on the lower of the redeemed shares’ cost or net asset value at the time of redemption.
Class B shares will automatically convert to Class A shares eight years after purchase. The purpose of the conversion is to limit the distribution fees you pay over the life of your investment. All conversions will be done at net asset value without the imposition of any sales load, fee, or other charge, so that the value of each shareholder’s account immediately before conversion will be the same as the value of the account immediately after conversion. Class B shares acquired through reinvestment of distributions will convert into Class A shares based on the date of the initial purchase to which such shares relate. For this purpose, Class B shares acquired through reinvestment of distributions will be attributed to particular purchases of Class B shares in accordance with such procedures as the Board of Trustees may determine from time to time. Class B shares that are converted to Class A shares will remain subject to an annual service fee that is identical in amount for both Class B shares and Class A shares. Since net asset value per share of the Class B shares and the Class A shares may differ at the time of conversion, a shareholder may receive more or fewer Class A shares than the number of Class B shares converted. Any conversion of Class B shares into Class A shares will be subject to the continuing availability of an opinion of counsel or a private letter ruling from the Internal Revenue Service to the effect that the conversion of shares would not constitute a taxable event under federal income tax law. Conversion of Class B shares into Class A shares might be suspended if such an opinion or ruling were no longer available.
Class C Shares
You may purchase Class C shares at a public offering price equal to the applicable net asset value per share without any up-front sales charge. Class C shares are subject to an annual distribution fee of 0.75% to compensate Nuveen for paying your financial advisor an ongoing sales commission. Class C shares are also subject to an annual service fee of 0.25% to compensate financial intermediaries for providing you with ongoing financial advice and other account services. Nuveen compensates financial intermediaries for sales of Class C shares at the time of the sale at a rate of 1% of the amount of Class C shares purchased, which represents an advance of the first year’s distribution fee of 0.75% plus an advance on the first year’s annual service fee of 0.25%. See “Distribution and Service Plans.”
Class C share purchase orders equaling or exceeding $1,000,000 will not be accepted. In addition, purchase orders for a single purchaser that, when added to the value that day of all of such purchaser’s shares of any class of any Nuveen Mutual Fund, cause the purchaser’s cumulative total of shares in Nuveen Mutual Funds to equal or exceed the aforementioned limit will not be accepted. Purchase orders for a single purchaser equal to or exceeding the foregoing limit should be placed only for Class A shares, unless such purchase has been reviewed and approved as suitable for the client by the appropriate compliance personnel of the financial intermediary, and the Fund receives written confirmation of such approval.
S-48
Redemptions of Class C shares within 12 months of purchase may be subject to a CDSC of 1% of the lower of the purchase price or redemption proceeds. Because Class C shares do not convert to Class A shares and continue to pay an annual distribution fee indefinitely, Class C shares should normally not be purchased by an investor who expects to hold shares for significantly longer than eight years.
Reduction or Elimination of Contingent Deferred Sales Charge
Class A shares are normally redeemed at net asset value, without any CDSC. However, in the case of Class A shares purchased at net asset value because the purchase amount exceeded $1 million, where the financial intermediary did not waive the sales commission, a CDSC of 1% is imposed on any redemption within 12 months of purchase. In the case of Class B shares redeemed within six years of purchase, a CDSC is imposed, beginning at 5% for redemptions within the first year, declining to 4% for redemptions within years two and three, and declining by 1% each year thereafter until disappearing after the sixth year. Class C shares are redeemed at net asset value, without any CDSC, except that a CDSC of 1% is imposed upon redemption of Class C shares that are redeemed within 12 months of purchase (except in cases where the shareholder’s financial advisor agreed to waive the right to receive an advance of the first year’s distribution and service fee).
In determining whether a CDSC is payable, a Fund will first redeem shares not subject to any charge and then will redeem shares held for the longest period, unless the shareholder specifies another order. No CDSC is charged on shares purchased as a result of automatic reinvestment of dividends or capital gains paid. In addition, no CDSC will be charged on exchanges of shares into another Nuveen Mutual Fund. The holding period is calculated on a monthly basis and begins on the date of purchase. The CDSC is assessed on an amount equal to the lower of the then current market value or the cost of the shares being redeemed. Accordingly, no sales charge is imposed on increases of net asset value above the initial purchase price. Nuveen receives the amount of any CDSC shareholders pay.
The CDSC may be waived or reduced under the following circumstances: (i) in the event of total disability (as evidenced by a determination by the federal Social Security Administration) of the shareholder (including a registered joint owner) occurring after the purchase of the shares being redeemed; (ii) in the event of the death of the shareholder (including a registered joint owner); (iii) for redemptions made pursuant to a systematic withdrawal plan, up to 1% monthly, 3% quarterly, 6% semiannually or 12% annually of an account’s net asset value depending on the frequency of the plan as designated by the shareholder; (iv) involuntary redemptions caused by operation of law; (v) redemptions in connection with a payment of account or plan fees; (vi) redemptions in connection with the exercise of a reinstatement privilege whereby the proceeds of a redemption of a Fund’s shares subject to a sales charge are reinvested in shares of certain Funds within a specified number of days; (vii) redemptions in connection with the exercise of a Fund’s right to redeem all shares in an account that does not maintain a certain minimum balance or that the Board of Trustees has determined may have material adverse consequences to the shareholders of a Fund; (viii) in whole or in part for redemptions of shares by shareholders with accounts in excess of specified breakpoints that correspond to the breakpoints under which the up-front sales charge on Class A shares is reduced pursuant to Rule 22d-1 under the Act; (ix) redemptions of shares purchased under circumstances or by a category of investors for which Class A shares could be purchased at net asset value without a sales charge; (x) redemptions of Class A, Class B or Class C shares if the proceeds are transferred to an account managed by another Nuveen adviser and the adviser refunds the advanced service and distribution fees to Nuveen; and (xi) redemptions of Class C shares in cases where (a) you purchase shares after committing to hold the shares for less than one year and (b) your advisor consents up front to receiving the appropriate service and distribution fee on the Class C shares on an ongoing basis instead of having the first year’s fees advanced by Nuveen. If a Fund waives or reduces the CDSC, such waiver or reduction would be uniformly applied to all Fund shares in the particular category. In waiving or reducing a CDSC, the Funds will comply with the requirements of Rule 22d-1 under the 1940 Act.
In addition, the CDSC will be waived in connection with the following redemptions of shares held by an employer-sponsored qualified defined contribution retirement plan: (i) partial or complete redemptions in connection with a distribution without penalty under Section 72(t) of the Code from a retirement plan: (a) upon attaining age 59 1/2, (b) as part of a series of substantially equal periodic payments, or (c) upon separation from service and attaining age 55; (ii) partial or complete redemptions in connection with a qualifying loan or hardship withdrawal; (iii) complete redemptions in connection
S-49
with termination of employment, plan termination or transfer to another employer’s plan or IRA; and (iv) redemptions resulting from the return of an excess contribution. The CDSC will also be waived in connection with the following redemptions of shares held in an IRA account: (i) for redemptions made pursuant to an IRA systematic withdrawal based on the shareholder’s life expectancy including, but not limited to, substantially equal periodic payments described in Code Section 72(t)(A)(iv) prior to age 59 1/2; and (ii) for redemptions to satisfy required minimum distributions after age 70 1/2 from an IRA account (with the maximum amount subject to this waiver being based only upon the shareholder’s Nuveen IRA accounts).
Class R3 Shares
The Dividend Growth Fund, Growth Fund and Growth Opportunities Fund expect to offer Class R3 shares beginning on or about March 30, 2009. Class R3 shares are available for purchase at the offering price, which is the net asset value per share without any up-front sales charge. Class R3 shares are subject to annual distribution and service fees of 0.50% of the Funds’ average daily net assets. The annual 0.25% service fee compensates your financial advisor and/or associated financial intermediaries for providing ongoing service to you. The annual 0.25% distribution fee compensates Nuveen for paying your financial advisor and/or associated financial intermediaries an ongoing sales commission.
Class R3 shares are only available for purchase by certain retirement plans that have an agreement with Nuveen to utilize R3 shares in certain investment products or programs (collectively, “retirement plans”). Eligible retirement plans include, but are not limited to, 401(k) plans, 457 plans, employer-sponsored 403(b) plans, profit sharing and money purchase pension plans, defined benefit plans, non-qualified deferred compensation plans and health care benefit funding plans. In addition, Class R3 shares are available only to retirement plans where Class R3 shares are held on the books of the Funds through omnibus accounts (either at the retirement plan level or at the level of the retirement plan’s financial intermediary). Class R3 shares are not available to traditional and Roth IRAs, Coverdell Education Savings Accounts, SEPs, SAR-SEPs, SIMPLE IRAs, or individual 403(b) plans.
The administrator of a retirement plan or employee benefits office can provide plan participants with detailed information on how to participate in the retirement plan and how to elect a Fund as an investment option. Retirement plan participants may be permitted to elect different investment options, alter the amounts contributed to the retirement plan, or change how contributions are allocated among investment options in accordance with the retirement plan’s specific provisions. The retirement plan administrator or employee benefits office should be consulted for details. For questions about their accounts, participants should contact their employee benefits office, the retirement plan administrator, or the organization that provides recordkeeping services for the retirement plan.
Eligible retirement plans may open an account and purchase Class R3 shares directly from the Funds or by contacting any financial intermediary authorized to sell Class R3 shares of the Funds. Financial intermediaries may provide or arrange for the provision of some or all of the shareholder servicing and account maintenance services required by retirement plan accounts and their retirement plan participants, including, without limitation, transfers of registration and dividend payee changes. Financial intermediaries may also perform other functions, including generating confirmation statements, and may arrange with retirement plan administrators for other investment or administrative services. Financial intermediaries may independently establish and charge retirement plans and retirement plan participants transaction fees and/or other additional amounts for such services, which may change over time. Similarly, retirement plans may charge retirement plan participants for certain expenses. These fees and additional amounts could reduce investment returns in Class R3 shares of the Funds.
Financial intermediaries and retirement plans may have omnibus accounts and similar arrangements with a Fund and may be paid for providing shareholder servicing and other services. A financial intermediary or retirement plan may be paid for its services directly or indirectly by the Funds or Nuveen. Nuveen may pay a financial intermediary an additional amount for sub-transfer agency or other administrative services. Such sub-transfer agency or other administrative services may include, but are not limited to, the following: processing and mailing trade confirmations, monthly statements, prospectuses, annual reports, semiannual reports and shareholder notices and other required communications; capturing and processing tax data; issuing and mailing dividend checks to shareholders who have selected cash distributions; preparing record date shareholder lists for proxy solicitations; collecting and posting
S-50
distributions to shareholder accounts; and establishing and maintaining systematic withdrawals, automated investment plans and shareholder account registrations. Your retirement plan may establish various minimum investment requirements for Class R3 shares of the Funds and may also establish certain privileges with respect to purchases, redemptions and exchanges of Class R3 shares or the reinvestment of dividends. Retirement plan participants should contact their retirement plan administrator with respect to these issues. This Statement of Additional Information should be read in conjunction with the retirement plan’s and/or the financial intermediary’s materials regarding their fees and services.
Class I Share Purchase Eligibility
Class R shares were renamed Class I shares effective May 1, 2008. Class I shares are available for purchases of $1 million or more and for purchases using dividends and capital gains distributions on Class I shares. Class I shares also are available for the following categories of investors:
| | • | | officers, trustees and former trustees of the Trust or any Nuveen-sponsored registered investment company and their immediate family members or trustees/directors of any fund sponsored by Nuveen, any parent company of Nuveen and subsidiaries thereof and their immediate family members (immediate family members are defined as their spouses, parents, children, grandparents, grandchildren, parents-in-law, sons- and daughters-in-law, siblings, a sibling’s spouse, and a spouse’s siblings); |
| | • | | bona fide, full-time and retired employees of Nuveen, and subsidiaries thereof, or their immediate family members; |
| | • | | any person who, for at least the last 90 days, has been an officer, director or bona fide employee of any financial intermediary, or their immediate family members; |
(Any shares purchased by investors falling within any of the first three categories listed above must be acquired for investment purposes and on the condition that they will not be transferred or resold except through redemption by a Fund.)
| | • | | bank or broker-affiliated trust departments investing funds over which they exercise exclusive discretionary investment authority and that are held in a fiduciary, agency, advisory, custodial or similar capacity; |
| | • | | investors purchasing on a periodic fee or asset-based fee program which is sponsored by a registered broker-dealer or other financial institution that has entered into an agreement with Nuveen; |
| | • | | fee-paying clients of a registered investment advisor (“RIA”) who initially invests for clients an aggregate of at least $100,000 in Nuveen Funds through a fund “supermarket” or other mutual fund trading platform sponsored by a broker-dealer or trust company of which the RIA is not an affiliated or associated person and which has entered into an agreement with Nuveen; |
| | • | | employer-sponsored retirement plans except SEPs, SAR-SEPs, SIMPLE IRAs and KEOGH plans; and |
| | • | | other Nuveen Funds whose investment policies allow investments in other investment companies. |
In addition, purchasers of Nuveen Defined Portfolios may reinvest their distributions from such Nuveen Defined Portfolios in Class I shares, if, before September 6, 1994 (or before June 13, 1995 for Nuveen Intermediate Duration Municipal Bond Fund), such purchasers of Nuveen Defined Portfolios had elected to reinvest distributions in Nuveen Fund shares.
Shareholder Programs
Exchange Privilege
You may exchange shares of a Fund for shares of the same class of any other Nuveen Mutual Fund with reciprocal exchange privileges, at net asset value without a sales charge, by either sending a written request to the applicable Fund, c/o Nuveen Investor Services, P.O. Box 8530, Boston, Massachusetts 02266-8530 or by calling Nuveen Investor Services toll free at (800) 257-8787. You may also exchange Class A shares to Class I shares of a Fund if, after you purchased Class A shares, you became eligible to purchase Class I shares. An exchange between Class A shares and Class I shares of a Fund is not considered a taxable event. This may be done in writing to the address stated above.
S-51
If you exchange shares between different Nuveen Mutual Funds and your shares are subject to a CDSC, no CDSC will be charged at the time of the exchange. However, if you subsequently redeem the shares acquired through the exchange, the redemption may be subject to a CDSC, depending on when you purchased your original shares and the CDSC schedule of the fund from which you exchanged your shares. If you exchange from Class A shares to Class I shares of a Fund and your Class A shares are subject to a CDSC, the CDSC will be assessed at the time of the exchange.
The shares to be purchased must be offered in your state of residence. The total value of exchanged shares must at least equal the minimum investment requirement of the Nuveen Mutual Fund being purchased. For federal income tax purposes, any exchange (except for exchanges between Class A shares and Class I shares of the same Fund) constitutes a sale and purchase of shares and may result in capital gain or loss. Before making any exchange, you should obtain the Prospectus for the Nuveen Mutual Fund you are purchasing and read it carefully. If the registration of the account for the Fund you are purchasing is not exactly the same as that of the fund account from which the exchange is made, written instructions from all holders of the account from which the exchange is being made must be received, with signatures guaranteed by a member of an approved Medallion Guarantee Program or in such other manner as may be acceptable to the Fund. You may also exchange shares by telephone if you authorize telephone exchanges by checking the applicable box on the Application Form or by calling Nuveen Investor Services toll-free at (800) 257-8787 to obtain an authorization form. The exchange privilege may be modified or discontinued by a Fund at any time.
The exchange privilege is not intended to permit a Fund to be used as a vehicle for short-term trading. Excessive exchange activity may interfere with portfolio management, raise expenses, and otherwise have an adverse effect on all shareholders. In order to limit excessive exchange activity and in other circumstances where Fund management believes doing so would be in the best interest of the Fund, each Fund reserves the right to revise or terminate the exchange privilege, or limit the amount or number of exchanges or reject any exchange. Shareholders would be notified of any such action to the extent required by law. See “Frequent Trading Policy” below.
Reinstatement Privilege
If you redeemed Class A, Class B or Class C shares of a Fund or any other Nuveen Mutual Fund that were subject to a sales charge or a CDSC, you have up to one year to reinvest all or part of the full amount of the redemption in the same class of shares of the Fund at net asset value. The reinstatement privilege for Class B shares will no longer be available as of December 31, 2008. This reinstatement privilege can be exercised only once for any redemption, and reinvestment will be made at the net asset value next calculated after reinstatement of the appropriate class of Fund shares. If you reinstate shares that were subject to a CDSC, your holding period as of the redemption date also will be reinstated for purposes of calculating a CDSC and the CDSC paid at redemption will be refunded. The federal income tax consequences of any capital gain realized on a redemption will not be affected by reinstatement, but a capital loss may be disallowed in whole or in part depending on the timing, the amount of the reinvestment and the fund from which the redemption occurred.
Suspension of Right of Redemption
Each Fund may suspend the right of redemption of Fund shares or delay payment more than seven days (a) during any period when the NYSE is closed (other than customary weekend and holiday closings), (b) when trading in the markets the Fund normally utilizes is restricted, or an emergency exists as determined by the SEC so that trading of the Fund’s investments or determination of its net asset value is not reasonably practicable, or (c) for any other periods that the SEC by order may permit for protection of Fund shareholders.
Redemption In-Kind
The Funds have reserved the right to redeem in-kind (that is, to pay redemption requests in cash and portfolio securities, or wholly in portfolio securities), although the Funds have no present intention to redeem in-kind. The Funds voluntarily have committed to pay in cash all requests for redemption by any shareholder, limited as to each shareholder during any 90-day period to the lesser of $250,000 or 1% of the net asset value of a Fund at the beginning of the 90-day period.
S-52
Frequent Trading Policy
The Funds’ Frequent Trading Policy is as follows:
Nuveen Mutual Funds are intended as long-term investments and not as short-term trading vehicles. At the same time, the Funds recognize the need of investors to periodically make purchases and redemptions of Fund shares when rebalancing their portfolios and as their financial needs or circumstances change. Nuveen Mutual Funds have adopted the following Frequent Trading Policy that seeks to balance these needs against the potential for higher operating costs, portfolio management disruption and other inefficiencies that can be caused by excessive trading of Fund shares.
1. Definition of Round Trip
A Round Trip trade is the purchase and subsequent redemption of Fund shares, including by exchange. Each side of a Round Trip trade may be comprised of either a single transaction or a series of closely-spaced transactions.
2. Round Trip Trade Limitations
Nuveen Mutual Funds limit the frequency of Round Trip trades that may be placed in a Fund. Subject to certain exceptions noted below, the Funds limit an investor to four Round Trips per trailing 12-month period and may also restrict the trading privileges of an investor who makes a Round Trip within a 30-day period if the purchase and redemption are of substantially similar dollar amounts and represent at least 25% of the value of the investor’s account.
3. Enforcement
Trades placed in violation of the foregoing policies are subject to rejection or cancellation by Nuveen Mutual Funds. Nuveen Mutual Funds may also bar an investor (and/or the investor’s financial advisor) who has violated these policies from opening new accounts with the Funds and may restrict the investor’s existing account(s) to redemptions only. Nuveen Mutual Funds reserve the right, in their sole discretion, to (a) interpret the terms and application of these policies, (b) waive unintentional or minor violations (including transactions below certain dollar thresholds) if Nuveen Mutual Funds determine that doing so does not harm the interests of Fund shareholders, and (c) exclude certain classes of redemptions from the application of the trading restrictions set forth above.
Nuveen Mutual Funds reserve the right to impose restrictions on purchases or exchanges that are more restrictive than those stated above if they determine, in their sole discretion, that a proposed transaction or series of transactions involve market timing or excessive trading that is likely to be detrimental to the Funds. The Funds may also modify or suspend the Frequent Trading Policy without notice during periods of market stress or other unusual circumstances.
The ability of Nuveen Mutual Funds to implement the Frequent Trading Policy for omnibus accounts at certain financial intermediaries may be dependent on receiving from those intermediaries sufficient shareholder information to permit monitoring of trade activity and enforcement of the Funds’ Frequent Trading Policy. In addition, the Funds may rely on a financial intermediary’s policy to restrict market timing and excessive trading if the Funds believe that the policy is reasonably designed to prevent market timing that is detrimental to the Funds. Such policy may be more or less restrictive than the Funds’ Policy. The Funds cannot ensure that these financial intermediaries will in all cases apply the Funds’ policy or their own policies, as the case may be, to accounts under their control.
Exclusions from the Frequent Trading Policy
As stated above, certain redemptions are eligible for exclusion from the Frequent Trading Policy, including: (i) redemptions or exchanges by shareholders investing through the fee-based platforms of certain financial intermediaries (where the intermediary charges an asset-based or comprehensive “wrap” fee for its services) that are effected by the financial intermediaries in connection with systematic portfolio rebalancing; (ii) when there is a verified trade error correction, which occurs when a dealer firm sends a trade to correct an earlier trade made in error and then the firm sends an explanation to the Nuveen Mutual Funds confirming that the trade is actually an error correction; (iii) in the event of total disability (as evidenced by a determination by the federal Social Security Administration) of the
S-53
shareholder (including a registered joint owner) occurring after the purchase of the shares being redeemed; (iv) in the event of the death of the shareholder (including a registered joint owner); (v) redemptions made pursuant to a systematic withdrawal plan, up to 1% monthly, 3% quarterly, 6% semiannually or 12% annually of an account’s net asset value depending on the frequency of the plan as designated by the shareholder; (vi) redemptions of shares that were purchased through a systematic investment program; (vii) involuntary redemptions caused by operation of law; (viii) redemptions in connection with a payment of account or plan fees; (ix) redemption or exchanges by any “fund of funds” advised by NAM; and (x) redemptions in connection with the exercise of a Fund’s right to redeem all shares in an account that does not maintain a certain minimum balance or that the applicable board has determined may have material adverse consequences to the shareholders of a Fund.
In addition, the following redemptions of shares by an employer-sponsored qualified defined contribution retirement plan are excluded from the Frequent Trading Policy: (i) partial or complete redemptions in connection with a distribution without penalty under Section 72(t) of the Code from a retirement plan: (a) upon attaining age 59 1/2; (b) as part of a series of substantially equal periodic payments, or (c) upon separation from service and attaining age 55; (ii) partial or complete redemptions in connection with a qualifying loan or hardship withdrawal; (iii) complete redemptions in connection with termination of employment, plan termination, transfer to another employer’s plan or IRA or changes in a plan’s recordkeeper; and (iv) redemptions resulting from the return of an excess contribution. Also, the following redemptions of shares held in an IRA account are excluded from the application of the Frequent Trading Policy: (i) redemptions made pursuant to an IRA systematic withdrawal based on the shareholder’s life expectancy including, but not limited to, substantially equal periodic payments described in Code Section 72(t)(A)(iv) prior to age 59 1/2; and (ii) redemptions to satisfy required minimum distributions after age 70 1/2 from an IRA account.
General Matters
The Funds may encourage registered representatives and their firms to help apportion their assets among bonds, stocks and cash, and may seek to participate in programs that recommend a portion of their assets be invested in equity securities, equity and debt securities, or equity and municipal securities.
To help advisors and investors better understand and more efficiently use the Funds to reach their investment goals, the Funds may advertise and create specific investment programs and systems. For example, this may include information on how to use the Funds to accumulate assets for future education needs or periodic payments such as insurance premiums. The Funds may produce software, electronic information sites, or the additional sales literature to promote the advantages of using the Funds to meet these and other specific investor needs.
The Funds have authorized one or more brokers to accept on their behalf purchase and redemption orders. Such brokers are authorized to designate other intermediaries to accept purchase and redemption orders on the Funds’ behalf. The Funds will be deemed to have received a purchase or redemption order when an authorized broker or, if applicable, a broker’s authorized designee accepts the order. Customer orders received by such broker (or their designee) will be priced at the Funds’ net asset value next computed after they are accepted by an authorized broker (or their designee). Orders accepted by an authorized broker (or their designee) before the close of regular trading on the NYSE will receive that day’s share price; orders accepted after the close of trading will receive the next business day’s share price.
In addition, you may exchange Class I shares of any Fund for Class A shares of the same Fund without a sales charge if the current net asset value of those Class I shares is at least $3,000 or you already own Class A shares of that Fund.
For more information on the procedure for purchasing shares of a Fund and on the special purchase programs available thereunder, see “How to Buy Shares” and “Special Services” in the applicable Prospectus.
If you choose to invest in a Fund, an account will be opened and maintained for you by Boston Financial Data Services (“BFDS”), the Funds’ shareholder services agent. Shares will be registered in the name of the investor or the investor’s financial advisor. A change in registration or transfer of shares held in the name of a financial advisor may only be made by an order in good standing form from the financial advisor acting on the investor’s behalf. Each Fund reserves the right to reject any purchase order and to waive or increase minimum investment requirements.
S-54
The Funds do not issue share certificates. For certificated shares previously issued, a fee of 1% of the current market value will be charged if the certificate is lost, stolen or destroyed. The fee is paid to Seaboard Surety Company for insurance of the lost, stolen or destroyed certificate.
Nuveen serves as the principal underwriter of the shares of the Funds pursuant to a “best efforts” arrangement as provided by a distribution agreement with the Trust (the “Distribution Agreement”). Pursuant to the Distribution Agreement, the Trust appointed Nuveen to be its agent for the distribution of the Funds’ shares on a continuous offering basis. Nuveen sells shares to or through brokers, dealers, banks or other qualified financial intermediaries (collectively referred to as “Dealers”), or others, in a manner consistent with the then effective registration statement of the Trust. Pursuant to the Distribution Agreement, Nuveen, at its own expense, finances certain activities incident to the sale and distribution of the Funds’ shares, including printing and distributing of prospectuses and statements of additional information to other than existing shareholders, the printing and distributing of sales literature, advertising and payment of compensation and giving of concessions to Dealers. Nuveen receives for its services the excess, if any, of the sales price of a Fund’s shares less the net asset value of those shares, and reallows a majority or all of such amounts to the Dealers who sold the shares; Nuveen may act as such a Dealer. Nuveen also receives compensation pursuant to a distribution plan adopted by the Trust pursuant to Rule 12b-1 and described herein under “Distribution and Service Plans.” Nuveen receives any CDSCs imposed on redemptions of Fund shares, but any amounts as to which a reinstatement privilege is not exercised are set off against and reduce amounts otherwise payable to Nuveen pursuant to the Distribution Agreement.
The following tables set forth the aggregate amount of underwriting commissions with respect to the sale of Fund shares, the amount thereof retained by Nuveen and the compensation on redemptions and repurchases received by Nuveen for each of the Funds for the specified periods. All figures are to the nearest thousand.
| | | | | | | | | | | | | | | | | | | | | | | | | | | |
| | | Amount of Underwriting
Commissions | | Amount Retained by Nuveen | | Amount of Compensation on
Redemptions and Repurchases |
| | | 3/28/06-
7/31/06 | | 8/01/06-
7/31/07 | | 8/01/07-
7/31/08 | | 3/28/06-
7/31/06 | | 8/01/06-
7/31/07 | | 8/01/07-
7/31/08 | | 3/28/06-
7/31/06 | | 8/01/06-
7/31/07 | | 8/01/07-
7/31/08 |
Dividend Growth Fund | | $ | — | | $ | 4 | | $ | 52 | | $ | — | | $ | — | | $ | 6 | | $ | — | | $ | — | | $ | 12 |
Growth Fund | | | — | | | 3 | | | 7 | | | — | | | — | | | — | | | — | | | — | | | 7 |
Growth Opportunities Fund | | | — | | | — | | | 2 | | | — | | | — | | | — | | | — | | | — | | | — |
| | | | | | | | | | | | | | | | | | | | | | | | | | | |
| | | Amount of Underwriting
Commissions | | Amount Retained by Nuveen | | Amount of Compensation on
Redemptions and Repurchases |
| | | 8/01/05-
7/31/06 | | 8/01/06-
7/31/07 | | 8/01/07-
7/31/08 | | 8/01/05-
7/31/06 | | 8/01/06-
7/31/07 | | 8/01/07-
7/31/08 | | 8/01/05-
7/31/06 | | 8/01/06-
7/31/07 | | 8/01/07-
7/31/08 |
Rittenhouse Fund | | $ | 38 | | $ | 49 | | $ | 31 | | $ | 3 | | $ | 4 | | $ | 4 | | $ | 194 | | $ | 69 | | $ | 39 |
Other Compensation to Certain Dealers
NAM, at its own expense, currently provides additional compensation to Dealers who distribute shares of the Nuveen Mutual Funds. The level of payments made to a particular Dealer in any given year will vary and will comprise an amount equal to (a) up to 0.25% of fund sales by that Dealer; and/or (b) up to 0.12% of assets attributable to that Dealer. A number of factors will be considered in determining the level of payments as enumerated in the Prospectus. NAM makes these payments to help defray marketing and distribution costs incurred by particular Dealers in connection with the sale of Nuveen Mutual Funds, including costs associated with educating a firm’s financial advisors about the features and benefits of Nuveen Mutual Funds. NAM will, on an annual basis, determine the advisability of continuing these payments. Additionally, NAM may also directly sponsor various meetings that facilitate educating financial advisors and shareholders about the Nuveen Mutual Funds.
In 2008, NAM expects that it will pay additional compensation to the following Dealers:
A.G. Edwards (a division of Wachovia Securities, LLC)
Ameriprise Financial
Banc of America Investment Services, Inc.
Merrill Lynch, Pierce, Fenner & Smith, Inc.
Morgan Stanley DW Inc.
Raymond James Financial
Smith Barney
UBS Financial Services Inc.
Wachovia Securities LLC
S-55
DISCLOSURE OF PORTFOLIO HOLDINGS
The Nuveen Mutual Funds have adopted a portfolio holdings disclosure policy which governs the dissemination of the Funds’ portfolio holdings. In accordance with this policy, the Funds may provide portfolio holdings information to third parties no earlier than the time a report is filed with the SEC that is required to contain such information or one day after the information is posted on the Fund’s publicly accessible website, www.nuveen.com. Currently, the Funds generally make available complete portfolio holdings information on the Funds’ website following the end of each month with an approximately one-month lag. Additionally, the Funds publish on the website a list of its top ten holdings as of the end of each month, approximately 2-5 business days after the end of the month for which the information is current. This information will remain available on the website at least until the Funds file with the SEC their Forms N-CSR or Forms N-Q for the period that includes the date as of which the website information is current.
Additionally, the Funds may disclose portfolio holdings information that has not been included in a filing with the SEC or posted on the Funds’ website (i.e., non-public portfolio holdings information) only if there is a legitimate business purpose for doing so and if the recipient is required, either by explicit agreement or by virtue of the recipient’s duties to the Funds as an agent or service provider, to maintain the confidentiality of the information and to not use the information in an improper manner (e.g., personal trading). In this connection, the Funds may disclose on an ongoing basis non-public portfolio holdings information in the normal course of their investment and administrative operations to various service providers, including their investment adviser and/or subadviser(s), independent registered public accounting firm, custodian, financial printer (R.R. Donnelley Financial and Financial Graphic Services), proxy voting service(s) (including RMG, ADP Investor Communication Services, and Glass, Lewis & Co.), and to the legal counsel for the Funds’ independent trustees (Chapman and Cutler LLP). Also, the Funds’ investment adviser may transmit to Vestek Systems, Inc. daily non-public portfolio holdings information on a next-day basis to enable the investment adviser to perform portfolio attribution analysis using Vestek’s systems and software programs. Vestek is also provided with non-public portfolio holdings information on a monthly basis approximately 2-3 business days after the end of each month so that Vestek may calculate and provide certain statistical information (but not the non-public holdings information itself) to its clients (including retirement plan sponsors or their consultants). The Funds’ investment adviser and/or sub-adviser may also provide certain portfolio holdings information to broker-dealers from time to time in connection with the purchase or sale of securities or requests for price quotations or bids on one or more securities. In providing this information, reasonable precautions, including limitations on the scope of the portfolio holdings information disclosed, are taken in an effort to avoid potential misuse of the disclosed information.
Non-public portfolio holdings information may be provided to other persons if approved by the Funds’ Chief Administrative Officer or Secretary upon a determination that there is a legitimate business purpose for doing so, the disclosure is consistent with the interests of the Funds, and the recipient is obligated to maintain the confidentiality of the information and not misuse it.
Compliance officers of the Funds and their investment adviser and sub-adviser periodically monitor overall compliance with the policy to ascertain whether portfolio holdings information is disclosed in a manner that is consistent with the Funds’ policy. Reports are made to the Funds’ Board of Trustees on an annual basis.
There is no assurance that the Funds’ policies on portfolio holdings information will protect the Funds from the potential misuse of portfolio holdings information by individuals or firms in possession of such information.
DISTRIBUTION AND SERVICE PLANS
The Funds have adopted a plan (the “Plan”) pursuant to Rule 12b-1 under the 1940 Act, which provides that Class B, Class C and Class R3 shares are subject to an annual distribution fee, and that Class A, Class B, Class C and Class R3 shares are subject to an annual service fee. Class I shares are not subject to either distribution or service fees.
S-56
The distribution fee applicable to Class B, Class C and Class R3 shares under each Fund’s Plan will be payable to compensate Nuveen for services and expenses incurred in connection with the distribution of Class B, Class C and Class R3 shares, respectively. These expenses include payments to financial intermediaries, including Nuveen, who are brokers of record with respect to the Class B and Class C shares, as well as, without limitation, expenses of printing and distributing Prospectuses to persons other than shareholders of each Fund, expenses of preparing, printing and distributing advertising and sales literature and reports to shareholders used in connection with the sale of Class B, Class C and Class R3 shares, certain other expenses associated with the distribution of Class B, Class C and Class R3 shares, and any distribution-related expenses that may be authorized from time to time by the Board of Trustees.
The service fee applicable to Class A, Class B, Class C and Class R3 shares under each Fund’s Plan will be payable to financial intermediaries in connection with the provision of ongoing account services to shareholders. These services may include establishing and maintaining shareholder accounts, answering shareholder inquiries and providing other personal services to shareholders.
Each Fund may spend up to 0.25 of 1% per year of the average daily net assets of Class A shares as a service fee under the Plan as applicable to Class A shares. Each Fund may spend up to 0.75 of 1% per year of the average daily net assets of each of the Class B shares and Class C shares and 0.25 of 1% per year of the average daily net assets of Class R3 shares as a distribution fee which constitutes an asset-based sales charge whose purpose is the same as an up-front sales charge and up to 0.25 of 1% per year of the average daily net assets of each of the Class B, Class C and Class R3 shares as a service fee under the Plan as applicable to such classes.
During the fiscal year ended July 31, 2008, the Funds incurred 12b-1 fees pursuant to their respective Plan in the amounts set forth in the table below. For this period, all or substantially all of the 12b-1 service fees on Class A shares were paid out as compensation to financial intermediaries for providing services to shareholders relating to their investments. To compensate for commissions advanced to financial intermediaries, all 12b-1 service fees collected on Class B shares during the first year following a purchase, all 12b-1 distribution fees on Class B shares, and all 12b-1 service and distribution fees on Class C shares during the first year following a purchase are retained by Nuveen. After the first year following a purchase, 12b-1 service fees on Class B shares and 12b-1 service and distribution fees on Class C shares are paid to financial intermediaries. Class R3 shares were not offered during the fiscal year ended July 31, 2008.
| | | |
| | | 12b-1 Fees
Incurred by
each Fund
for the fiscal
year ended
July 31, 2008 |
Dividend Growth Fund | | | |
Class A | | $ | 5,886 |
Class B | | | 8,633 |
Class C | | | 25,432 |
| | | |
Total | | $ | 39,951 |
| | | |
Growth Fund | | | |
Class A | | $ | 10,341 |
Class B | | | 3,252 |
Class C | | | 24,188 |
| | | |
Total | | $ | 37,781 |
| | | |
Growth Opportunities Fund | | | |
Class A | | $ | 758 |
Class B | | | 2,523 |
Class C | | | 3,069 |
| | | |
Total | | $ | 6,350 |
| | | |
S-57
| | | |
| | | 12b-1 Fees
Incurred by
each Fund
for the fiscal
year ended
July 31, 2008 |
| |
Rittenhouse Fund | | | |
Class A | | $ | 116,080 |
Class B | | | 158,423 |
Class C | | | 319,755 |
| | | |
Total | | $ | 594,258 |
| | | |
Under each Fund’s Plan, the Fund will report quarterly to the Board of Trustees for its review all amounts expended per class of shares under the Plan. The Plan may be terminated at any time with respect to any class of shares, without the payment of any penalty, by a vote of a majority of the independent trustees who have no direct or indirect financial interest in the Plan or by vote of a majority of the outstanding voting securities of such class. The Plan may be renewed from year to year if approved by a vote of the Board of Trustees and a vote of the independent trustees who have no direct or indirect financial interest in the Plan cast in person at a meeting called for the purpose of voting on the Plan. The Plan may be continued only if the trustees who vote to approve such continuance conclude, in the exercise of reasonable business judgment and in light of their fiduciary duties under applicable law, that there is a reasonable likelihood that the Plan will benefit the Fund and its shareholders. The Plan may not be amended to increase materially the cost which a class of shares may bear under the Plan without the approval of the shareholders of the affected class, and any other material amendments of the Plan must be approved by the independent trustees by a vote cast in person at a meeting called for the purpose of considering such amendments. During the continuance of the Plan, the selection and nomination of the independent trustees of the Trust will be committed to the discretion of the independent trustees then in office.
INDEPENDENT REGISTERED PUBLIC ACCOUNTING FIRM, CUSTODIAN AND TRANSFER AGENT
PricewaterhouseCoopers, LLP (“PWC”), One North Wacker Drive, Chicago, Illinois 60606, independent registered public accounting firm, has been selected as auditors for the Trust. In addition to audit services, PWC provides assistance on accounting, internal control, tax and related matters.
The custodian of the assets of the Funds is State Street Bank & Trust Company, P.O. Box 5043, Boston, Massachusetts 02206-5043. The custodian performs custodial, fund accounting and portfolio accounting services.
The Funds’ transfer, shareholder services, and dividend paying agent is Boston Financial Data Services, P.O. Box 8530, Boston, Massachusetts 02266-8530.
FINANCIAL STATEMENTS
The audited financial statements for each Fund’s most recent fiscal year appear in each Fund’s Annual Report, dated July 31, 2008. Each Fund’s Annual Report is incorporated by reference into this Statement of Additional Information and is available without charge by calling (800) 257-8787.
GENERAL TRUST INFORMATION
Each Fund is a series of the Trust. The Trust is an open-end management investment company under the 1940 Act. The Trust was organized as a Massachusetts business trust on June 27, 1997. The Board of Trustees of the Trust is authorized to issue an unlimited number of shares in one or more series, which may be divided into classes of shares. Currently, there are 23 series authorized and outstanding, each of which may be generally divided into different classes of shares designated as
S-58
Class A shares, Class B shares, Class C shares, Class R3 shares and Class I shares. Each class of shares represents an interest in the same portfolio of investments of a Fund. Each class of shares has equal rights as to voting, redemption, dividends and liquidation, except that each bears different class expenses, including different distribution and service fees, and each has exclusive voting rights with respect to any distribution or service plan applicable to its shares. There are no conversion, preemptive or other subscription rights, except that Class B shares automatically convert into Class A shares. The Board of Trustees of the Trust has the right to establish additional series and classes of shares in the future, to change those series or classes and to determine the preferences, voting powers, rights and privileges thereof.
The Trust is not required and does not intend to hold annual meetings of shareholders. Shareholders owning more than 10% of the outstanding shares of a Fund have the right to call a special meeting to remove trustees or for any other purpose.
Under Massachusetts law applicable to Massachusetts business trusts, shareholders of such a trust may, under certain circumstances, be held personally liable as partners for its obligations. However, the Declaration of Trust of the Trust contains an express disclaimer of shareholder liability for acts or obligations of the Trust and requires that notice of this disclaimer be given in each agreement, obligation or instrument entered into or executed by the Trust or the trustees. The Trust’s Declaration of Trust further provides for indemnification out of the assets and property of the Trust for all losses and expenses of any shareholder held personally liable for the obligations of the Trust. Thus, the risk of a shareholder incurring financial loss on account of shareholder liability is limited to circumstances in which both inadequate insurance existed and the Trust or a Fund itself was unable to meet its obligations. The Trust believes the likelihood of the occurrence of these circumstances is remote.
S-59
MAI-SANTB-1108D
NUVEEN INVESTMENTS MUTUAL FUNDS
| | |
| | |
Annual Report July 31, 2008 | | For investors seeking long-term
capital appreciation. |

Nuveen Investments
Equity Funds
Nuveen Santa Barbara Dividend Growth Fund
Nuveen Santa Barbara Growth Fund
Nuveen Santa Barbara Growth Opportunities Fund
Nuveen Rittenhouse Growth Fund


NOW YOU CAN RECEIVE YOUR
NUVEEN INVESTMENTS FUND REPORTS FASTER.
NO MORE WAITING.
SIGN UP TODAY TO RECEIVE NUVEEN INVESTMENTS FUND INFORMATION BY E-MAIL.
It only takes a minute to sign up for E-Reports. Once enrolled, you’ll receive an e-mail as soon as your Nuveen Investments Fund information is ready — no more waiting for delivery by regular mail. Just click on the link within the e-mail to see the report, and save it on your computer if your wish.

IT’S FAST, EASY & FREE:
www.investordelivery.com
if you get your Nuveen Investments Fund dividends and statements from your financial advisor or brokerage account.
(Be sure to have the address sheet that accompanied this report handy. You’ll need it to complete the enrollment process.)
OR
www.nuveen.com/accountaccess
if you get your Nuveen Investments Fund dividends and statements directly from Nuveen Investments.

| | | | | | |
| Must be preceded by or accompanied by a prospectus. | | NOT FDIC INSURED | | MAY LOSE VALUE | | NO BANK GUARANTEE |
Dear Shareholders,
I’d like to use my initial letter to you to accomplish several things. First, I want to report that after fourteen years of service on your Fund’s Board, including the last twelve as chairman, Tim Schwertfeger retired from the Board in June. The Board has elected me to replace him as the chairman, the first time this role has been filled by someone who is not an employee of Nuveen Investments. Electing an independent chairman marks a significant milestone in the management of your Fund, and it aligns us with what is now considered a “best practice” in the fund industry. Further, it demonstrates the independence with which your Board has always acted on your behalf.
Following Tim will not be easy. During my eleven previous years on the Nuveen Fund Board, I found that Tim always set a very high standard by combining insightful industry and market knowledge and sound, clear judgment. While the Board will miss his wise counsel, I am certain we will retain the primary commitment Tim shared with all of us – an unceasing dedication to creating and retaining value for Nuveen Fund shareholders. This focus on value over time is a touchstone that I and all the other Board members will continue to use when making decisions on your behalf.
Second, I also want to report that we are very fortunate to be welcoming two new Board members to our team. John Amboian, the current chairman and CEO of Nuveen Investments, has agreed to replace Tim as Nuveen’s representative on the Board. John’s presence will allow the independent Board members to benefit not only from his leadership role at Nuveen but also his broad understanding of the fund industry and Nuveen’s role within it. We also are adding Terry Toth as an independent director. A former CEO of the Northern Trust Company’s asset management group, Terry will bring extensive experience in the fund industry to our deliberations.
Finally, I urge you to take the time to review the Portfolio Managers’ Comments and Fund Spotlight sections of this report. All of us are grateful that you have chosen Nuveen Investments as a partner as you pursue your financial goals, and, on behalf of myself and the other members of your Fund’s Board, let me say we look forward to continuing to earn your trust in the months and years ahead.
Sincerely,

Robert P. Bremner
Chairman of the Board
September 19, 2008

Robert P. Bremner
Chairman of the Board
Annual Report Page 1
Portfolio Managers’ Comments
The Nuveen Santa Barbara Dividend Growth Fund, Nuveen Santa Barbara Growth Fund and Nuveen Santa Barbara Growth Opportunities Fund feature management by Santa Barbara Asset Management, (Santa Barbara) while the Nuveen Rittenhouse Growth Fund is managed by Rittenhouse Asset Management, Inc. (Rittenhouse). Santa Barbara and Rittenhouse are both affiliates of Nuveen Investments, Inc. We recently spoke with James Boothe, CFA, portfolio manager for the Nuveen Santa Barbara Dividend Growth Fund; Michael Mayfield, co-portfolio manager for the Nuveen Santa Barbara Growth Fund; George Tharakan, CFA, portfolio manager of the Nuveen Santa Barbara Growth Opportunities Fund and Nancy Crouse, CFA, co-portfolio manager with James Jolinger, Daniel Roarty, CFA and Robert Norton of the Nuveen Rittenhouse Growth Fund, about the key investment strategies and performance of the Funds for the twelve-month period ended July 31, 2008.
What were the general market conditions during the reporting period?
Equity market conditions during the last months of the reporting period can best be described as bearish. The decline in the equity market was precipitated by the deflation of U.S. housing values after prices had been driven up by relatively easy access to affordable and unrestricted credit. The degree to which declining home prices were to disrupt the repayment of the underlying mortgages began to become apparent in July 2007 with the revelation from Countrywide Financial that potential mortgage losses, beyond those in their sub-prime portfolio, were increasing dramatically. The negative impact of increasing residential loan losses was exacerbated by the widespread use of these mortgage loans in the creation of structured investments held by a wide range of investors globally. The high level of leverage across the financial system combined with an inability to accurately value securities containing layers of re-packaged loans resulted in a cascade of forced selling. The process of unwinding leverage, raising capital and selling off or marking down asset values took on a momentum of its own. This led to weak consumer spending and restrictive credit standards. Additionally, rising commodity prices driven by the industrialization and urbanization of emerging Asian economies caused further economic stress. Equity and bond investors reacted by increasing the premiums required to assume risk, reducing expectations for corporate earnings and adjusting lower the level of valuations to compensate for higher inflation.
How did the Funds perform during the period ended July 31, 2008?
The table on page three provides performance information for the four Funds (Class A shares at net asset value) for the one-year, five-year, ten-year and since inception periods ended July 31, 2008. The table also compares the Funds’ performance to appropriate benchmarks. A more detailed account of each Funds’ relative performance is provided later in this report.
What strategies were used to manage the Funds during the reporting period? How did these strategies influence performance?
Nuveen Santa Barbara Dividend Growth Fund
Class A shares at net asset value for the Nuveen Santa Barbara Dividend Growth Fund outperformed both of its comparative indexes for the twelve month period ended July 31, 2008. The Fund’s sector weightings and security selection were the primary drivers of performance during the period. For example, our relative overweight of utilities and underweight of consumer discretionary sectors were key factors that added to performance. Our security selection in financials and information technology also contributed to performance.
We maintained our core strategy during the reporting period, which is focusing on owning
Discussions of specific investments are for illustration only and are not intended as recommendations of individual investments. The views expressed herein represent those of the portfolio managers as of the date of this report and are subject to change at any time, based on market conditions and other factors. The Funds disclaim any obligation to advise shareholders of such changes.
Annual Report Page 2
Class A Shares—
Average Annual Total Returns as of 7/31/08
| | | | | | | | |
| | | Average Annual |
| | | 1-Year | | 5-Year | | 10-Year | | Since
Inception* |
Nuveen Santa Barbara Dividend Growth Fund
A Shares at NAV | | -1.77% | | NA | | NA | | 7.94% |
A Shares at Offer | | -7.42% | | NA | | NA | | 5.24% |
Lipper Equity Income Funds Index1 | | -13.21% | | NA | | NA | | 1.35% |
S&P 500 Index2 | | -11.09% | | NA | | NA | | 2.54% |
| | | | |
Nuveen Santa Barbara Growth Fund
A Shares at NAV | | -4.46% | | NA | | NA | | 0.30% |
A Shares at Offer | | -9.97% | | NA | | NA | | -2.20% |
Lipper Multi-Cap Core Funds Index3 | | -11.11% | | NA | | NA | | 2.07% |
Russell 1000 Growth Index4 | | -6.29% | | NA | | NA | | 6.13% |
| | | | |
Nuveen Santa Barbara Growth Opportunities Fund A Shares at NAV | | -13.07% | | NA | | NA | | -0.67% |
A Shares at Offer | | -18.06% | | NA | | NA | | -3.15% |
Lipper Mid-Cap Core Funds Index5 | | -8.83% | | NA | | NA | | 3.39% |
Russell 2500 Growth Index6 | | -8.42% | | NA | | NA | | -0.58% |
| | | | | | | | |
| | | Average Annual |
| | | 1-Year | | 5-Year | | 10-Year | | Since
Inception* |
Nuveen Rittenhouse Growth Fund
A Shares at NAV | | -7.08% | | 3.66% | | -0.22% | | 1.01% |
A Shares at Offer | | -12.44% | | 2.44% | | -0.81% | | 0.45% |
Lipper Large-Cap Growth Funds Index7 | | -4.89% | | 6.20% | | 0.43% | | 2.18% |
Russell 1000 Growth Index4 | | -6.29% | | 6.39% | | 0.83% | | 2.50% |
Russell Top 200 Growth Index8 | | -5.55% | | 5.10% | | -0.37% | | 1.66% |
Returns quoted represent past performance, which is no guarantee of future results. Returns at NAV would be lower if the sales charge were included. Current performance may be higher or lower than the performance shown. Investment returns and principal value will fluctuate so that when shares are redeemed, they may be worth more or less than their original cost. Class A shares have a 5.75% maximum sales charge. Returns do not reflect the deduction of taxes that a shareholder would pay on Fund distributions or the redemption of shares. For the most recent month-end performance, visit www.nuveen.com or call (800) 257-8787.
Please see each Fund’s Spotlight Page later in this report for more complete performance data and expense ratios.
| * | Since inception returns for the Nuveen Santa Barbara Dividend Growth Fund, Nuveen Santa Barbara Growth Fund and Nuveen Santa Barbara Growth Opportunities Fund are as of 3/28/2006 and for the Nuveen Rittenhouse Growth Fund are as of 12/31/1997. |
| 1 | The Lipper Equity Income Funds Index is a managed index that represents the average annualized returns of the 30 largest funds in the Lipper Equity Income Funds category. The returns assume reinvestment of dividends, but do not reflect any applicable sales charges. You cannot invest directly in an index. |
| 2 | The S&P 500 Index is an unmanaged index generally considered representative of the U.S. stock market. The index returns assume reinvestment of dividends, but do not reflect any applicable sales charges. You cannot invest directly in an index. |
| 3 | The Lipper Multi-Cap Core Funds Index is a managed index that represents the average annualized returns of the 30 largest funds in the Lipper Multi-Cap Core Funds category. The returns assume reinvestment of dividends, but do not reflect any applicable sales charges. You cannot invest directly in an index. |
| 4 | The Russell 1000 Growth Index measures the performance of those Russell 1000 companies with higher price-to-book ratios and higher forecasted growth values. The index returns assume reinvestment of dividends and do not reflect any applicable sales charges. You cannot invest directly in an index. |
| 5 | The Lipper Mid-Cap Core Funds Index is a managed index that represents the average annualized returns of the 30 largest funds in the Lipper Mid-Cap Core Funds category. The returns assume reinvestment of dividends, but do not reflect any applicable sales charges. You cannot invest directly in an index. |
| 6 | The Russell 2500 Growth Index measures the performance of the small to mid-cap growth segment of the U.S. equity universe. The index returns assume reinvestment of dividends and do not reflect any applicable sales charges. You cannot invest directly in an index. |
| 7 | The Lipper Large-Cap Growth Funds Index is a managed index that represents the average annualized returns of the 30 largest funds in the Lipper Large-Cap Growth Funds category. The returns assume reinvestment of dividends, but do not reflect any applicable sales charges. You cannot invest directly in an index. |
| 8 | The Russell Top 200 Growth Index measures the performance of those Russell Top 200 companies with higher price-to-book ratios and higher forecasted growth values. The stocks are also members of the Russell 1000 Growth index. The index returns assume reinvestment of dividends, but do not reflect any applicable sales charges. You cannot invest directly in an index. |
Annual Report Page 3
companies that are growing their dividends. This theme worked particularly well for our financial holdings, which held up well in a period where many financial stocks sustained declines. We also found information technology stock opportunities that had good dividend growth prospects, but more importantly were less volatile than the market. Our core positions in utilities and consumer staples sectors were favored during an environment of sluggish economic growth. We remained cautious on consumer discretionary stocks as the consumer was being stretched with rising debt loads, falling home equity, and rising gasoline prices.
Hudson City Bancorp was one of the top performing stocks during the period because its credit quality held up well during the financial turmoil. Abbot Laboratories also did well as they received FDA approval for a stent in the U.S. market and the company’s diverse product lines were performing well. Qualcomm, a purchase made during the reporting period, was a major contributor to performance as they settled an ongoing legal battle with Nokia which lifted a major uncertainty surrounding the company. We still own all three stocks.
Washington Mutual and Citicorp were detractors from performance. We sold both, anticipating a dividend cut which did occur, and our sales of both mitigated our losses. General Electric posted disappointing earnings and we decided to sell it as we were not convinced a turnaround was imminent in their industrial divisions.
Nuveen Santa Barbara Growth Fund
The Nuveen Santa Barbara Growth Fund (Class A shares at net asset value) outperformed both of its comparative indexes during the twelve-month reporting period ending July 31, 2008. In general, the Fund benefited from overall market volatility. As investor sentiment shifted, high-quality growth companies fared better on a relative basis. From a sector standpoint, our recent inclusion of materials stocks was beneficial to the overall portfolio. Additionally, the overweight position in industrials was accentuated by strong stock selection. Finally, the Fund’s exposure to harder hit sectors such as financials and consumer discretionary was minimized during the period.
Overall, the portfolio has been tilting away from “consumer” driven companies. It is our opinion that the U.S. consumer will need to moderate spending. As a direct result of this thesis, we have been broadening out the Fund to include multi-national companies which derive growth from multiple economies around the world. Procter and Gamble, Schlumberger Ltd., Bunge Ltd., and Nike are some recent purchases which all derive over 50% of their revenues from outside the U.S. Finally, we also have sought out companies that have strong pricing power, such as U.S. Steel, Praxair, and Burlington Northern. Each of these companies have been increasing prices to their respective clients.
The Fund maintained a significant exposure in the industrials, information technology and health care sectors, and we continued to monitor our remaining financial names and reduced our exposure to this sector. Varian Medical Systems has been a strong contributor to the portfolio during the past year. The company makes advanced cancer treatment and x-ray systems. During the 2006-2007 timeframe, Varian had faced delayed commitment for new equipment purchases, causing its shares to under-perform the broad market. This past year, the company has seen several large orders for new systems, thereby alleviating concerns about product development. In addition, U.S. Steel was a strong performer because of the pricing dynamics they are currently facing. Given that global demand was strong, supply for finished steel products remained tight. Additionally, a couple of larger emerging market economies implemented export tariffs on domestically produced steel, thereby removing those supplies from the world market. Finally, due to energy prices, increased shipping costs hindered foreign steel producers from sending product to the U.S. thereby leaving U.S. Steel with a very captive end user market.
The Fund’s biggest detractors were Chicos FAS and Legg Mason. Chicos, a retailer of women’s fashion,
Annual Report Page 4
was an early casualty in the declining spending by U.S. consumers. The company issued several disappointing earnings outlooks and offered a pessimistic outlook. The Fund had originally purchased the company’s shares based on the consistent nature of its earnings. Ultimately, we sold Chicos from the portfolio in the fourth quarter of 2007. Another detractor from the portfolio’s performance was Legg Mason. Initially we purchased Legg Mason because of its diversified asset management business. The company had products in each major asset class. As the credit crisis began to gain momentum, Legg Mason started to see several asset classes falter. Their fixed income group, Western Asset Management, had significant exposure to asset-backed securities, commercial mortgage-backed securities and structured investment vehicle backed commercial paper within their strategies and money markets. Additionally, renowned equity manager, Bill Miller, faced increased performance challenges as he too became mired in financial names. Ultimately, we sold Legg Mason from the portfolio in the beginning of the second quarter of 2008.
Nuveen Santa Barbara Growth Opportunities Fund
Class A shares at net asset value for the Nuveen Santa Barbara Growth Opportunities Fund underperformed both of its comparative indexes for the twelve month period ended July 31, 2008. The Fund’s absolute performance was hurt by its relative overweight position in the consumer discretionary sector, as investors moved away from these stocks due to the anticipated slowdown in consumer spending. The Fund’s underperformance during the period also was partially due to its relative underweight position in the volatile energy and utility sectors, which experienced erratic return patterns and steep valuations. Additionally, poor returns from the financial sector also contributed to negative performance, as financial stocks reacted to the ongoing economic crisis.
The Fund benefited from our stock selection in the industrials sector and our overweight position in the materials sector, as global demand for natural resources remains strong. Additionally, our stock selection in the consumer staples sector was a positive during the period.
The Fund maintained significant exposure in the consumer discretionary and information technology sectors, and maintained underweight positions in industrials and health care sectors. However, due to the looming economic slowdown in the U.S., we re-weighted sector allocations and altered specific stock selections and by the end of the period had one of the smallest allocations to the consumer discretionary sector since the inception of the Fund. We increased our weighting in the materials and industrial sectors to benefit from the strong demand for natural resources, while we continued to maintain an underweight position in the energy and utility sectors. Furthermore, we remained highly selective with investments in the financial sector given the ongoing U.S. economic concerns.
The best performing stocks during the period were Kansas City Southern, CF Industries Holdings, Inc., QLogic and Express Scripts. We are positive on Kansas City Southern due to its ongoing pricing power and leverage to non-economically sensitive goods. CF Industries has significant exposure to the nitrogen and phosphate fertilizer markets, which coupled with our outlook for increased grain prices, should lead to sustained strong fertilizer demand. QLogic should benefit from greater growth in its markets and more rapid transition to higher speed products. Express Scripts benefited from continued strong demand for its prescription services, resulting in continued revenue and earnings growth.
The worst performing stocks during the reporting period were Infogroup Inc., Corporate Executive Board, and GFI Group. Infogroup Inc. shares declined due to slowdowns in the marketing services environment, which was negatively impacted by the weakening U.S. economy. We continue to own shares of Infogroup Inc., which has recently been experiencing improved results and has replaced top management at the company. Corporate Executive Board was negatively
Annual Report Page 5
impacted by decelerating contract values and the slowing U.S. economy. We sold our position in shares of Corporate Executive Board based on these deteriorating fundamentals. GFI Group shares were negatively impacted by reduced trading revenues due to the increased uncertainty in the credit markets. We continue to own shares of GFI Group given our outlook for better comparables going forward and solid fundamental performance from other asset classes.
Nuveen Rittenhouse Growth Fund
The Nuveen Rittenhouse Growth Fund (Class A shares at net asset value) underperformed its comparative indexes during the twelve-month reporting period ending July 31, 2008. Overall, stock selection in the technology, health care, consumer discretionary and energy sectors contributed to performance as compared to the Russell Growth indices. However, our holdings in the financial and industrial sectors detracted from performance. In addition, our sector exposures, which are driven by our bottom-up stock selection process, had a negative impact on performance, resulting from having less exposure to the energy and materials sectors and modestly higher exposure to the financial sector.
With the consumer discretionary sector facing many headwinds as consumers were forced to rein in spending, we continued to focus on retailers which have proven execution success and strategies which enable them to gain market share. Examples include Staples and Kohl’s. Health care and technology holdings contributed positively to the Fund’s performance during the reporting period. Our health care selections performed well as investors positively reassessed the potential sales growth and profitability for companies such as Celgene and Gilead Sciences, Inc. In both cases, our assessment of the market dynamics and market share potential for their products were more positive and accurate than what others had forecasted. Baxter International continued to exhibit strong fundamentals, the result of successful efforts to improve product and business mix by the current management team and to fund research and development with the incremental cash flow generated through organic growth and efficiencies. Baxter’s bioscience segment continued to generate strong growth with potential pipeline compounds for pandemic flu and enhanced drug delivery still in the research phase. In technology, Qualcomm and Nokia were two outstanding holdings during the period. Qualcomm is the major source for software for increasingly sophisticated cell phone applications and benefits therefore from the rising adoption rate of smart phones in addition to core mobile handset growth globally. With Nokia, we were able to capitalize on excessive investor pessimism surrounding their ability to innovate and capture share in the handset market.
Stocks which detracted from performance included Lehman Brothers. Lehman was affected by the turmoil in the real estate market through their holdings in securities such as residential mortgage backed securities (RMBS). These holdings had to be written down in the mark-to-market process as mortgage loan losses and widespread liquidation by financial institutions as they remediated their balance sheets and depressed their value. The position was sold due to the risk that the extended deterioration in housing and other real estate markets globally would have a greater impact on book value and capital needs than previously anticipated. While it seemed that the financial system had been stabilized through the actions of the Fed and the Treasury over the last several months, the size and exposures of the balance sheets of Fannie Mae and Freddie Mac resulted in further mortgage market instability in July 2008. General Electric also detracted from performance during the period as its strength in the infrastructure businesses was discounted by investors concerned about the impact on the half of the company that is exposed to the financial industry. While the GE Credit segment resulted in a modest reduction in expected earnings, the negative adjustment to sentiment and valuation were more extreme.
Annual Report Page 6
Nuveen Santa Barbara Dividend Growth Fund
Growth of an Assumed $10,000 Investment
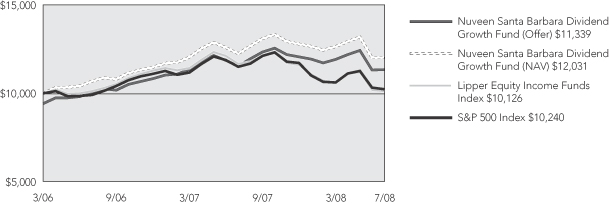
Nuveen Santa Barbara Growth Fund
Growth of an Assumed $10,000 Investment
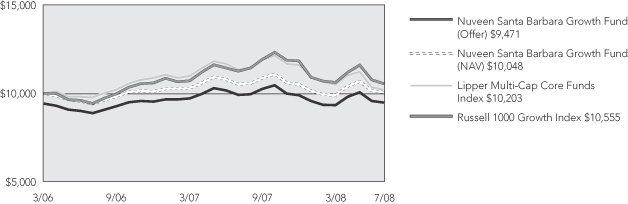
The graph does not reflect the deduction of taxes that a shareholder may pay on Fund distributions or the redemption of shares.
The index comparisons show the change in value of a $10,000 investment in the Class A shares of the Nuveen Funds compared with the corresponding indexes. The Lipper Equity Income Funds Index is a managed index that represents the average annualized returns of the 30 largest funds in the Lipper Equity Income Funds category. The S&P 500 Index is an unmanaged index generally considered representative of the U.S. stock market. The Lipper Multi-Cap Core Funds Index is a managed index that represents the average annualized returns of the 30 largest funds in the Lipper Multi-Cap Core Funds category. The Russell 1000 Growth Index measures the performance of those Russell 1000 companies with higher price-to-book ratios and higher forecasted growth values. The index returns assume reinvestment of dividends and do not reflect any initial or ongoing expenses. You cannot invest directly in an index. The Nuveen Investments Fund returns include reinvestment of all dividends and distributions, and the Fund’s return at the offer price depicted in the chart reflects the initial maximum sales charge applicable to Class A shares (5.75%) and all ongoing Fund expenses. The performance data quoted represents past performance, which is not indicative of future results. Current performance may be lower or higher than the performance shown.
Annual Report Page 7
Nuveen Santa Barbara Growth Opportunities Fund
Growth of an Assumed $10,000 Investment
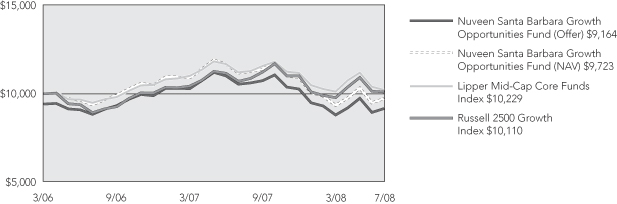
Nuveen Rittenhouse Growth Fund
Growth of an Assumed $10,000 Investment
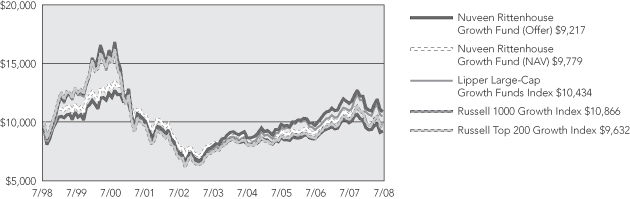
The graph does not reflect the deduction of taxes that a shareholder may pay on Fund distributions or the redemption of shares.
The index comparisons show the change in value of a $10,000 investment in the Class A shares of the Nuveen Funds compared with the corresponding indexes. The Lipper Mid-Cap Core Funds Index is a managed index that represents the average annualized returns of the 30 largest funds in the Lipper Mid-Cap Core Funds category. The Russell 2500 Growth Index measures the performance of the small to mid-cap growth segment of the U.S. equity universe. The Lipper Large-Cap Growth Funds Index is a managed index that represents the average annualized returns of the 30 largest funds in the Lipper Large-Cap Growth Funds category. The Russell 1000 Growth Index measures the performance of those Russell 1000 companies with higher price-to-book ratios and higher forecasted growth values. The Russell Top 200 Growth Index measures the performance of those Russell Top 200 companies with higher price-to-book ratios and higher forecasted growth values. The stocks are also members of the Russell 1000 Growth index. The index returns assume reinvestment of dividends and do not reflect any initial or ongoing expenses. You cannot invest directly in an index. The Nuveen Investments Fund returns include reinvestment of all dividends and distributions, and the Fund’s return at the offer price depicted in the chart reflects the initial maximum sales charge applicable to Class A shares (5.75%) and all ongoing Fund expenses. The performance data quoted represents past performance, which is not indicative of future results. Current performance may be lower or higher than the performance shown.
Annual Report Page 8
Fund Spotlight as of 7/31/08 Nuveen Santa Barbara Dividend Growth Fund
| | | | | | | | |
| Quick Facts | | | | | | | | |
| | | A Shares | | B Shares1 | | C Shares | | I Shares1 |
Fund Symbols | | NSBAX | | NSBBX | | NSBCX | | NSBRX |
NAV | | $22.82 | | $22.81 | | $22.80 | | $22.83 |
Latest Capital Gain Distribution2 | | $0.0685 | | $0.0685 | | $0.0685 | | $0.0685 |
Latest Ordinary Income Distribution3 | | $0.1835 | | $0.1373 | | $0.1373 | | $0.1989 |
Inception Date | | 3/28/06 | | 3/28/06 | | 3/28/06 | | 3/28/06 |
Returns quoted represent past performance which is no guarantee of future results. Returns without sales charges would be lower if the sales charge were included. Current performance may be higher or lower than the performance shown. Investment returns and principal value will fluctuate so that when shares are redeemed, they may be worth more or less than their original cost. Returns do not reflect the deduction of taxes that a shareholder would pay on Fund distributions or the redemption of shares. For the most recent month-end performance visit www.nuveen.com or call (800) 257-8787.
Fund returns assume reinvestment of dividends and capital gains. Class A shares have a 5.75% maximum sales charge. Class B shares have a contingent deferred sales charge (CDSC), also known as a back-end sales charge, that for redemptions begins at 5% and declines periodically until after 6 years when the charge becomes 0%. Class B shares automatically convert to Class A shares eight years after purchase. Class C shares have a 1% CDSC for redemptions within less than one year. Class I shares have no sales charge and may be purchased under limited circumstances or by specified classes of investors. Returns may reflect a voluntary expense limitation by the Fund’s investment adviser which may be modified or discontinued at any time without notice.
| | | | | | |
| Average Annual Total Returns as of 7/31/08 |
| | | |
| A Shares | | | | NAV | | Offer |
1-Year | | | | -1.77% | | -7.42% |
Since Inception | | | | 7.94% | | 5.24% |
| | | |
| B Shares | | | | w/o CDSC | | w/CDSC |
1-Year | | | | -2.51% | | -6.35% |
Since Inception | | | | 7.15% | | 5.58% |
| | | |
| C Shares | | | | NAV | | |
1-Year | | | | -2.51% | | |
Since Inception | | | | 7.13% | | |
| | | |
| I Shares | | | | NAV | | |
1-Year | | | | -1.52% | | |
Since Inception | | | | 8.21% | | |
| Expense Ratios | | | | | | |
| | | |
| Share Class | | Gross
Expense
Ratios | | Net
Expense
Ratios | | As of
Date |
Class A | | 4.61% | | 1.10% | | 7/31/07 |
Class B | | 5.78% | | 1.85% | | 7/31/07 |
Class C | | 5.34% | | 1.85% | | 7/31/07 |
Class I | | 4.14% | | 0.85% | | 7/31/07 |
The expense ratios shown factor in Total Annual Fund Operating Expenses including management fees and other fees and expenses. The Net Expense Ratios reflect a contractual commitment by the Fund’s investment adviser to waive fees and reimburse expenses through November 30, 2009. The Net Expense Ratios also reflect a custodian fee credit whereby certain fees and expenses are reduced by credits earned on the Fund’s cash on deposit with the bank. There is no guarantee that the Fund will earn such credits in the future. Absent the waiver, reimbursement and custodian fee credit, the Net Expense Ratios would be higher and total returns would be less.
| | | | |
| Average Annual Total Returns as of 6/30/08 |
| | |
| A Shares | | NAV | | Offer |
1-Year | | -4.58% | | -10.06% |
Since Inception | | 8.22% | | 5.42% |
| | |
| B Shares | | w/o CDSC | | w/CDSC |
1-Year | | -5.22% | | -8.95% |
Since Inception | | 7.45% | | 5.82% |
| | |
| C Shares | | NAV | | |
1-Year | | -5.26% | | |
Since Inception | | 7.43% | | |
| | |
| I Shares | | NAV | | |
1-Year | | -4.34% | | |
Since Inception | | 8.49% | | |
Portfolio Allocation4
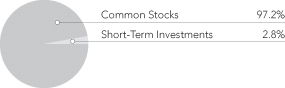
| | |
| Portfolio Statistics | | |
Net Assets ($000) | | $18,384 |
Number of Common Stocks | | 35 |
| | |
| Top Five Common Stock Holdings4 | | |
QUALCOMM Inc. | | 3.4% |
PNC Financial Services Group, Inc. | | 3.3% |
U.S. Bancorp | | 3.2% |
Becton, Dickinson & Company | | 3.2% |
Abbott Laboratories | | 3.1% |
| 1 | Effective May 1, 2008, Class B Shares will only be issued upon exchange of Class B Shares from another Nuveen Fund or for purposes of dividend reinvestment. Effective December 31, 2008, the reinvestment privilege for Class B will no longer be available. Effective May 1, 2008, Class R Shares were renamed Class I Shares. See the Fund’s prospectus for more information. |
| 3 | Ordinary income distribution consists of short-term capital gains paid on December 17, 2007, and ordinary income paid on July 1, 2008, if any. |
| 4 | As a percentage of total investments as of July 31, 2008. Holdings are subject to change. |
Annual Report Page 9
Fund Spotlight as of 7/31/08 Nuveen Santa Barbara Dividend Growth Fund
| | |
| Industries1 |
Commercial Banks | | 9.3% |
Oil, Gas & Consumable Fuels | | 7.3% |
Electric Utilities | | 7.3% |
Communications Equipment | | 6.5% |
Pharmaceuticals | | 6.0% |
Tobacco | | 5.5% |
Thrifts & Mortgage Finance | | 5.4% |
Diversified Telecommunication Services | | 5.4% |
Insurance | | 5.3% |
Health Care Equipment & Supplies | | 3.2% |
Construction Materials | | 3.1% |
Hotels, Restaurants & Leisure | | 3.0% |
Semiconductors & Equipment | | 3.0% |
IT Services | | 2.9% |
Aerospace & Defense | | 2.9% |
Beverages | | 2.9% |
Commercial Services & Supplies | | 2.8% |
Electrical Equipment | | 2.7% |
Short-Term Investments | | 2.8% |
Other | | 12.7% |
| 1 | As a percentage of total investments as of July 31, 2008. Holdings are subject to change. |
Expense Example (Unaudited)
As a shareholder of the Fund, you incur two types of costs: (1) transaction costs, including front and back end sales charges (loads) or redemption fees, where applicable; and (2) ongoing costs, including management fees; distribution and service (12b-1) fees, where applicable; and other Fund expenses. This Example is intended to help you understand your ongoing costs (in dollars) of investing in the Fund and to compare these costs with the ongoing costs of investing in other mutual funds.
The Example below is based on an investment of $1,000 invested at the beginning of the period and held for the period.
The information under “Actual Performance,” together with the amount you invested, allows you to estimate actual expenses incurred over the reporting period. Simply divide your account value by $1,000 (for example, an $8,600 account value divided by $1,000 = 8.60) and multiply the result by the cost shown for your share class, in the row entitled “Expenses Incurred During Period” to estimate the expenses incurred on your account during this period.
The information under “Hypothetical Performance,” provides information about hypothetical account values and hypothetical expenses based on the Fund’s actual expense ratio and an assumed rate of return of 5% per year before expenses, which is not the Fund’s actual return. The hypothetical account values and expenses may not be used to estimate the actual ending account balance or expense you incurred for the period. You may use this information to compare the ongoing costs of investing in the Fund and other Funds. To do so, compare this 5% hypothetical example with the 5% hypothetical examples that appear in the shareholder reports of the other funds.
Please note that the expenses shown in the table are meant to highlight your ongoing costs only and do not reflect any transactional costs, such as front and back end sales charges (loads) or redemption fees, where applicable. Therefore, the hypothetical information is useful in comparing ongoing costs only, and will not help you determine the relative total costs of owning different funds or share classes. In addition, if these transactional costs were included, your costs would have been higher.
| | | | | | | | | | | | | | | | | | | | | | | | |
| | | | | Hypothetical Performance |
| | | Actual Performance | | (5% return before expenses) |
| | | | | | | | |
| | | A Shares | | B Shares | | C Shares | | I Shares | | A Shares | | B Shares | | C Shares | | I Shares |
Beginning Account Value (2/01/08) | | $ | 1,000.00 | | $ | 1,000.00 | | $ | 1,000.00 | | $ | 1,000.00 | | $ | 1,000.00 | | $ | 1,000.00 | | $ | 1,000.00 | | $ | 1,000.00 |
Ending Account Value (7/31/08) | | $ | 949.30 | | $ | 945.60 | | $ | 945.60 | | $ | 950.50 | | $ | 1,018.60 | | $ | 1,014.62 | | $ | 1,014.67 | | $ | 1,019.89 |
Expenses Incurred During Period | | $ | 6.11 | | $ | 9.97 | | $ | 9.92 | | $ | 4.85 | | $ | 6.32 | | $ | 10.32 | | $ | 10.27 | | $ | 5.02 |
For each class of the Fund, expenses are equal to the Fund’s annualized expense ratio of 1.26%, 2.06%, 2.05% and 1.00% for Classes A, B, C and I, respectively, multiplied by the average account value over the period, multiplied by 182/366 (to reflect the one-half year period).
Annual Report Page 10
Fund Spotlight as of 7/31/08 Nuveen Santa Barbara Growth Fund
| | | | | | | | |
| Quick Facts | | | | | | | | |
| | | A Shares | | B Shares1 | | C Shares | | I Shares1 |
Fund Symbols | | NSAGX | | NSGBX | | NSRCX | | NSRGX |
NAV | | $20.09 | | $19.75 | | $19.74 | | $20.19 |
Latest Capital Gain Distribution2 | | $0.0021 | | $0.0021 | | $0.0021 | | $0.0021 |
Latest Ordinary Income Distribution3 | | $0.0494 | | $0.0494 | | $0.0494 | | $0.0494 |
Inception Date | | 3/28/06 | | 3/28/06 | | 3/28/06 | | 3/28/06 |
Returns quoted represent past performance which is no guarantee of future results. Returns without sales charges would be lower if the sales charge were included. Current performance may be higher or lower than the performance shown. Investment returns and principal value will fluctuate so that when shares are redeemed, they may be worth more or less than their original cost. Returns do not reflect the deduction of taxes that a shareholder would pay on Fund distributions or the redemption of shares. For the most recent month-end performance visit www.nuveen.com or call (800) 257-8787.
Fund returns assume reinvestment of dividends and capital gains. Class A shares have a 5.75% maximum sales charge. Class B shares have a contingent deferred sales charge (CDSC), also known as a back-end sales charge, that for redemptions begins at 5% and declines periodically until after 6 years when the charge becomes 0%. Class B shares automatically convert to Class A shares eight years after purchase. Class C shares have a 1% CDSC for redemptions within less than one year. Class I shares have no sales charge and may be purchased under limited circumstances or by specified classes of investors. Returns may reflect a voluntary expense limitation by the Fund’s investment adviser which may be modified or discontinued at any time without notice.
| | | | | | |
| Average Annual Total Returns as of 7/31/08 |
| | | |
| A Shares | | | | NAV | | Offer |
1-Year | | | | -4.46% | | -9.97% |
Since Inception | | | | 0.30% | | -2.20% |
| | | |
| B Shares | | | | w/o CDSC | | w/CDSC |
1-Year | | | | -5.17% | | -8.96% |
Since Inception | | | | -0.43% | | -2.14% |
| | | |
| C Shares | | | | NAV | | |
1-Year | | | | -5.18% | | |
Since Inception | | | | -0.45% | | |
| | | |
| I Shares | | | | NAV | | |
1-Year | | | | -4.21% | | |
Since Inception | | | | 0.56% | | |
| Expense Ratios | | | | | | |
| | | |
| Share Class | | Gross
Expense
Ratios | | Net
Expense
Ratios | | As of
Date |
Class A | | 3.48% | | 1.15% | | 7/31/07 |
Class B | | 4.90% | | 1.89% | | 7/31/07 |
Class C | | 4.15% | | 1.91% | | 7/31/07 |
Class I | | 3.79% | | 0.89% | | 7/31/07 |
The expense ratios shown factor in Total Annual Fund Operating Expenses including management fees and other fees and expenses. The Net Expense Ratios reflect a contractual commitment by the Fund’s investment adviser to waive fees and reimburse expenses through November 30, 2009. The Net Expense Ratios also reflect a custodian fee credit whereby certain fees and expenses are reduced by credits earned on the Fund’s cash on deposit with the bank. There is no guarantee that the Fund will earn such credits in the future. Absent the waiver, reimbursement and custodian fee credit, the Net Expense Ratios would be higher and total returns would be less.
| | | | |
| Average Annual Total Returns as of 6/30/08 |
| | |
| A Shares | | NAV | | Offer |
1-Year | | -5.87% | | -11.29% |
Since Inception | | 0.75% | | -1.86% |
| | |
| B Shares | | w/o CDSC | | w/CDSC |
1-Year | | -6.54% | | -10.27% |
Since Inception | | 0.02% | | -1.76% |
| | |
| C Shares | | NAV | | |
1-Year | | -6.58% | | |
Since Inception | | —% | | |
| | |
| I Shares | | NAV | | |
1-Year | | -5.67% | | |
Since Inception | | 1.00% | | |
Portfolio Allocation4

| | |
| Portfolio Statistics | | |
Net Assets ($000) | | $30,907 |
Number of Common Stocks | | 41 |
| | |
| Top Five Common Stock Holdings4 | | |
QUALCOMM Inc. | | 3.2% |
Schlumberger Limited | | 2.9% |
United States Steel Corporation | | 2.8% |
Raytheon Company | | 2.8% |
Burlington Northern Santa Fe Corporation | | 2.7% |
| 1 | Effective May 1, 2008, Class B Shares will only be issued upon exchange of Class B Shares from another Nuveen Fund or for purposes of dividend reinvestment. Effective December 31, 2008, the reinvestment privilege for Class B will no longer be available. Effective May 1, 2008, Class R Shares were renamed Class I Shares. See the Fund’s prospectus for more information. |
| 3 | Ordinary income distribution consists of short-term capital gains paid on December 17, 2007, and ordinary income paid on December 31, 2007, if any. |
| 4 | As a percentage of total investments as of July 31, 2008. Holdings are subject to change. |
Annual Report Page 11
Fund Spotlight as of 7/31/08 Nuveen Santa Barbara Growth Fund
| | |
| Industries1 | | |
Health Care Equipment & Supplies | | 12.1% |
Machinery | | 5.7% |
IT Services | | 5.0% |
Insurance | | 4.6% |
Health Care Providers & Services | | 4.3% |
Aerospace & Defense | | 4.3% |
Road & Rail | | 4.2% |
Diversified Financial Services | | 3.4% |
Media | | 3.4% |
Communication Equipment | | 3.2% |
Energy Equipment & Services | | 2.9% |
Metals & Mining | | 2.8% |
Chemicals | | 2.6% |
Oil, Gas & Consumable Fuels | | 2.6% |
Construction & Engineering | | 2.5% |
Biotechnology | | 2.5% |
Commercial Services & Supplies | | 2.4% |
Office Electronics | | 2.2% |
Textiles, Apparel & Luxury Goods | | 2.1% |
Short-Term Investments | | 13.1% |
Other | | 14.1% |
| 1 | As a percentage of total investments as of July 31, 2008. Holdings are subject to change. |
Expense Example (Unaudited)
As a shareholder of the Fund, you incur two types of costs: (1) transaction costs, including front and back end sales charges (loads) or redemption fees, where applicable; and (2) ongoing costs, including management fees; distribution and service (12b-1) fees, where applicable; and other Fund expenses. This Example is intended to help you understand your ongoing costs (in dollars) of investing in the Fund and to compare these costs with the ongoing costs of investing in other mutual funds.
The Example below is based on an investment of $1,000 invested at the beginning of the period and held for the period.
The information under “Actual Performance,” together with the amount you invested, allows you to estimate actual expenses incurred over the reporting period. Simply divide your account value by $1,000 (for example, an $8,600 account value divided by $1,000 = 8.60) and multiply the result by the cost shown for your share class, in the row entitled “Expenses Incurred During Period” to estimate the expenses incurred on your account during this period.
The information under “Hypothetical Performance,” provides information about hypothetical account values and hypothetical expenses based on the Fund’s actual expense ratio and an assumed rate of return of 5% per year before expenses, which is not the Fund’s actual return. The hypothetical account values and expenses may not be used to estimate the actual ending account balance or expense you incurred for the period. You may use this information to compare the ongoing costs of investing in the Fund and other Funds. To do so, compare this 5% hypothetical example with the 5% hypothetical examples that appear in the shareholder reports of the other funds.
Please note that the expenses shown in the table are meant to highlight your ongoing costs only and do not reflect any transactional costs, such as front and back end sales charges (loads) or redemption fees, where applicable. Therefore, the hypothetical information is useful in comparing ongoing costs only, and will not help you determine the relative total costs of owning different funds or share classes. In addition, if these transactional costs were included, your costs would have been higher.
| | | | | | | | | | | | | | | | | | | | | | | | |
| | | | | Hypothetical Performance |
| | | Actual Performance | | (5% return before expenses) |
| | | | | | | | |
| | | A Shares | | B Shares | | C Shares | | I Shares | | A Shares | | B Shares | | C Shares | | I Shares |
Beginning Account Value (2/01/08) | | $ | 1,000.00 | | $ | 1,000.00 | | $ | 1,000.00 | | $ | 1,000.00 | | $ | 1,000.00 | | $ | 1,000.00 | | $ | 1,000.00 | | $ | 1,000.00 |
Ending Account Value (7/31/08) | | $ | 989.70 | | $ | 986.00 | | $ | 986.00 | | $ | 991.20 | | $ | 1,018.05 | | $ | 1,014.12 | | $ | 1,014.12 | | $ | 1,019.29 |
Expenses Incurred During Period | | $ | 6.78 | | $ | 10.67 | | $ | 10.67 | | $ | 5.54 | | $ | 6.87 | | $ | 10.82 | | $ | 10.82 | | $ | 5.62 |
For each class of the Fund, expenses are equal to the Fund’s annualized expense ratio of 1.37%, 2.16%, 2.16% and 1.12% for Classes A, B, C and I, respectively, multiplied by the average account value over the period, multiplied by 182/366 (to reflect the one-half year period).
Annual Report Page 12
Fund Spotlight as of 7/31/08 Nuveen Santa Barbara Growth Opportunities Fund
| | | | | | | | |
| Quick Facts | | | | | | | | |
| | | A Shares | | B Shares1 | | C Shares | | I Shares1 |
Fund Symbols | | NSOAX | | NSOBX | | NSOCX | | NSORX |
NAV | | $17.94 | | $17.61 | | $17.60 | | $18.00 |
Latest Capital Gain Distribution2 | | $0.6530 | | $0.6530 | | $0.6530 | | $0.6530 |
Latest Ordinary Income Distribution3 | | $0.9303 | | $0.9303 | | $0.9303 | | $0.9509 |
Inception Date | | 3/28/06 | | 3/28/06 | | 3/28/06 | | 3/28/06 |
Returns quoted represent past performance which is no guarantee of future results. Returns without sales charges would be lower if the sales charge were included. Current performance may be higher or lower than the performance shown. Investment returns and principal value will fluctuate so that when shares are redeemed, they may be worth more or less than their original cost. Returns do not reflect the deduction of taxes that a shareholder would pay on Fund distributions or the redemption of shares. For the most recent month-end performance visit www.nuveen.com or call (800) 257-8787.
Fund returns assume reinvestment of dividends and capital gains. Class A shares have a 5.75% maximum sales charge. Class B shares have a contingent deferred sales charge (CDSC), also known as a back-end sales charge, that for redemptions begins at 5% and declines periodically until after 6 years when the charge becomes 0%. Class B shares automatically convert to Class A shares eight years after purchase. Class C shares have a 1% CDSC for redemptions within less than one year. Class I shares have no sales charge and may be purchased under limited circumstances or by specified classes of investors. Returns may reflect a voluntary expense limitation by the Fund’s investment adviser which may be modified or discontinued at any time without notice.
| | | | | | |
| Average Annual Total Returns as of 7/31/08 |
| | | |
| A Shares | | | | NAV | | Offer |
1-Year | | | | -13.07% | | -18.06% |
Since Inception | | | | -0.67% | | -3.15% |
| | | |
| B Shares | | | | w/o CDSC | | w/CDSC |
1-Year | | | | -13.72% | | -16.91% |
Since Inception | | | | -1.40% | | -2.95% |
| | | |
| C Shares | | | | NAV | | |
1-Year | | | | -13.77% | | |
Since Inception | | | | -1.43% | | |
| | | |
| I Shares | | | | NAV | | |
1-Year | | | | -12.90% | | |
Since Inception | | | | -0.44% | | |
| Expense Ratios | | | | | | |
| | | |
| Share Class | | Gross
Expense
Ratios | | Net
Expense
Ratios | | As of
Date |
Class A | | 6.34% | | 1.30% | | 7/31/07 |
Class B | | 7.08% | | 2.05% | | 7/31/07 |
Class C | | 7.08% | | 2.05% | | 7/31/07 |
Class I | | 6.09% | | 1.04% | | 7/31/07 |
The expense ratios shown factor in Total Annual Fund Operating Expenses including management fees and other fees and expenses. The Net Expense Ratios reflect a contractual commitment by the Fund’s investment adviser to waive fees and reimburse expenses through November 30, 2009. The Net Expense Ratios also reflect a custodian fee credit whereby certain fees and expenses are reduced by credits earned on the Fund’s cash on deposit with the bank. There is no guarantee that the Fund will earn such credits in the future. Absent the waiver, reimbursement and custodian fee credit, the Net Expense Ratios would be higher and total returns would be less.
| | | | |
| Average Annual Total Returns as of 6/30/08 |
| | |
| A Shares | | NAV | | Offer |
1-Year | | -18.85% | | -23.51% |
Since Inception | | -1.73% | | -4.27% |
| | |
| B Shares | | w/o CDSC | | w/CDSC |
1-Year | | -19.44% | | -22.42% |
Since Inception | | -2.45% | | -4.04% |
| | |
| C Shares | | NAV | | |
1-Year | | -19.44% | | |
Since Inception | | -2.45% | | |
| | |
| I Shares | | NAV | | |
1-Year | | -18.65% | | |
Since Inception | | -1.49% | | |
Portfolio Allocation4

| | |
| Portfolio Statistics | | |
Net Assets ($000) | | $1,282 |
Number of Common Stocks | | 43 |
| | |
| Top Five Common Stock Holdings4 | | |
Kansas City Southern Industries | | 5.1% |
CF Industries Holdings, Inc. | | 4.1% |
Embarq Corporation | | 3.5% |
Shaw Group Inc. | | 3.4% |
Kirby Corporation | | 3.2% |
| 1 | Effective May 1, 2008, Class B Shares will only be issued upon exchange of Class B Shares from another Nuveen Fund or for purposes of dividend reinvestment. Effective December 31, 2008, the reinvestment privilege for Class B will no longer be available. Effective May 1, 2008, Class R Shares were renamed Class I Shares. See the Fund’s prospectus for more information. |
| 3 | Ordinary income distribution consists of short-term capital gains paid on December 17, 2007, and ordinary income paid on December 31, 2007, if any. |
| 4 | As a percentage of total investments as of July 31, 2008. Holdings are subject to change. |
Annual Report Page 13
Fund Spotlight as of 7/31/08 Nuveen Santa Barbara Growth Opportunities Fund
| | |
| Industries1 |
Chemicals | | 15.0% |
Computers & Peripherals | | 7.4% |
Construction & Engineering | | 6.5% |
Semiconductors & Equipment | | 6.2% |
Energy Equipment & Services | | 5.9% |
Road & Rail | | 5.1% |
Health Care Providers & Services | | 5.0% |
Pharmaceuticals | | 4.9% |
Food Products | | 4.4% |
Capital Markets | | 4.0% |
IT Services | | 3.7% |
Diversified Telecommunicatons Services | | 3.5% |
Marine | | 3.2% |
Industrial Conglomerates | | 2.6% |
Aerospace & Defense | | 2.5% |
Interenet Software & Services | | 2.5% |
Auto Components | | 2.5% |
Commercial Services & Supplies | | 2.4% |
Other | | 12.7% |
| 1 | As a percentage of total investments as of July 31, 2008. Holdings are subject to change. |
Expense Example (Unaudited)
As a shareholder of the Fund, you incur two types of costs: (1) transaction costs, including front and back end sales charges (loads) or redemption fees, where applicable; and (2) ongoing costs, including management fees; distribution and service (12b-1) fees, where applicable; and other Fund expenses. This Example is intended to help you understand your ongoing costs (in dollars) of investing in the Fund and to compare these costs with the ongoing costs of investing in other mutual funds.
The Example below is based on an investment of $1,000 invested at the beginning of the period and held for the period.
The information under “Actual Performance,” together with the amount you invested, allows you to estimate actual expenses incurred over the reporting period. Simply divide your account value by $1,000 (for example, an $8,600 account value divided by $1,000 = 8.60) and multiply the result by the cost shown for your share class, in the row entitled “Expenses Incurred During Period” to estimate the expenses incurred on your account during this period.
The information under “Hypothetical Performance,” provides information about hypothetical account values and hypothetical expenses based on the Fund’s actual expense ratio and an assumed rate of return of 5% per year before expenses, which is not the Fund’s actual return. The hypothetical account values and expenses may not be used to estimate the actual ending account balance or expense you incurred for the period. You may use this information to compare the ongoing costs of investing in the Fund and other Funds. To do so, compare this 5% hypothetical example with the 5% hypothetical examples that appear in the shareholder reports of the other funds.
Please note that the expenses shown in the table are meant to highlight your ongoing costs only and do not reflect any transactional costs, such as front and back end sales charges (loads) or redemption fees, where applicable. Therefore, the hypothetical information is useful in comparing ongoing costs only, and will not help you determine the relative total costs of owning different funds or share classes. In addition, if these transactional costs were included, your costs would have been higher.
| | | | | | | | | | | | | | | | | | | | | | | | |
| | | | | | | | | | | Hypothetical Performance |
| | | Actual Performance | | (5% return before expenses) |
| | | | | | | | |
| | | A Shares | | B Shares | | C Shares | | I Shares | | A Shares | | B Shares | | C Shares | | I Shares |
Beginning Account Value (2/01/08) | | $ | 1,000.00 | | $ | 1,000.00 | | $ | 1,000.00 | | $ | 1,000.00 | | $ | 1,000.00 | | $ | 1,000.00 | | $ | 1,000.00 | | $ | 1,000.00 |
Ending Account Value (7/31/08) | | $ | 964.50 | | $ | 961.20 | | $ | 960.70 | | $ | 965.70 | | $ | 1,018.10 | | $ | 1,014.37 | | $ | 1,014.42 | | $ | 1,019.49 |
Expenses Incurred During Period | | $ | 6.64 | | $ | 10.29 | | $ | 10.24 | | $ | 5.28 | | $ | 6.82 | | $ | 10.57 | | $ | 10.52 | | $ | 5.42 |
For each class of the Fund, expenses are equal to the Fund’s annualized expense ratio of 1.36%, 2.11%, 2.10% and 1.08% for Classes A, B, C and I, respectively, multiplied by the average account value over the period, multiplied by 182/366 (to reflect the one-half year period).
Annual Report Page 14
Fund Spotlight as of 7/31/08 Nuveen Rittenhouse Growth Fund
| | | | | | | | |
| Quick Facts | | | | | | | | |
| | | A Shares | | B Shares1 | | C Shares | | I Shares1 |
Fund Symbols | | NRGAX | | NRGBX | | NRGCX | | NRGRX |
NAV | | $22.18 | | $20.48 | | $20.50 | | $22.76 |
Inception Date | | 12/31/97 | | 12/31/97 | | 12/31/97 | | 12/31/97 |
Returns quoted represent past performance which is no guarantee of future results. Returns without sales charges would be lower if the sales charge were included. Current performance may be higher or lower than the performance shown. Investment returns and principal value will fluctuate so that when shares are redeemed, they may be worth more or less than their original cost. Returns do not reflect the deduction of taxes that a shareholder would pay on Fund distributions or the redemption of shares. For the most recent month-end performance visit www.nuveen.com or call (800) 257-8787.
Fund returns assume reinvestment of dividends and capital gains. Class A shares have a 5.75% maximum sales charge. Class B shares have a contingent deferred sales charge (CDSC), also known as a back-end sales charge, that for redemptions begins at 5% and declines periodically until after 6 years when the charge becomes 0%. Class B shares automatically convert to Class A shares eight years after purchase. Class C shares have a 1% CDSC for redemptions within less than one year, which is not reflected in the one-year total return. Class I shares have no sales charge and may be purchased under limited circumstances or by specified classes of investors. Returns may reflect a voluntary expense limitation by the Fund’s investment adviser which may be modified or discontinued at any time without notice.
| | | | | | |
| Average Annual Total Returns as of 7/31/08 |
| | | |
| A Shares | | | | NAV | | Offer |
1-Year | | | | -7.08% | | -12.44% |
5-Year | | | | 3.66% | | 2.44% |
10-Year | | | | -0.22% | | -0.81% |
| | | |
| B Shares | | | | w/o CDSC | | w/CDSC |
1-Year | | | | -7.79% | | -11.48% |
5-Year | | | | 2.87% | | 2.69% |
10-Year | | | | -0.82% | | -0.82% |
| | | |
| C Shares | | | | NAV | | |
1-Year | | | | -7.78% | | |
5-Year | | | | 2.88% | | |
10-Year | | | | -0.97% | | |
| | | |
| I Shares | | | | NAV | | |
1-Year | | | | -6.87% | | |
5-Year | | | | 3.91% | | |
10-Year | | | | 0.02% | | |
| Expense Ratios | | | | | | |
| | | |
| Share Class | | Gross
Expense
Ratios | | Net
Expense
Ratios | | As of
Date |
Class A | | 1.50% | | 1.45% | | 7/31/07 |
Class B | | 2.26% | | 2.20% | | 7/31/07 |
Class C | | 2.26% | | 2.21% | | 7/31/07 |
Class I | | 1.25% | | 1.20% | | 7/31/07 |
The expense ratios shown factor in Total Annual Fund Operating Expenses including management fees and other fees and expenses. The Net Expense Ratios reflect a contractual commitment by the Fund’s investment adviser to waive fees and reimburse expenses through November 30, 2008. Absent the waiver and reimbursement, the Net Expense Ratios would be higher and the total returns would be less.
| | | | |
| Average Annual Total Returns as of 6/30/08 |
| | |
| A Shares | | NAV | | Offer |
1-Year | | -10.04% | | -15.22% |
5-Year | | 3.99% | | 2.77% |
10-Year | | -0.52% | | -1.11% |
| | |
| B Shares | | w/o CDSC | | w/CDSC |
1-Year | | -10.70% | | -14.27% |
5-Year | | 3.20% | | 3.03% |
10-Year | | -1.11% | | -1.11% |
| | |
| C Shares | | NAV | | |
1-Year | | -10.73% | | |
5-Year | | 3.20% | | |
10-Year | | -1.26% | | |
| | |
| I Shares | | NAV | | |
1-Year | | -9.81% | | |
5-Year | | 4.24% | | |
10-Year | | -0.28% | | |
Portfolio Allocation2
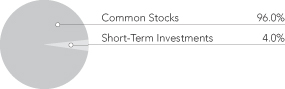
| | |
| Portfolio Statistics | | |
Net Assets ($000) | | $92,196 |
Number of Common Stocks | | 48 |
| | |
| Top Five Common Stock Holdings2 | | |
Microsoft Corporation | | 4.6% |
QUALCOMM Inc. | | 3.7% |
International Business Machines Corporation (IBM) | | 3.6% |
Cisco Systems, Inc. | | 3.5% |
General Electric Company | | 3.4% |
| 1 | Effective May 1, 2008, Class B Shares will only be issued upon exchange of Class B Shares from another Nuveen Fund or for purposes of dividend reinvestment. Effective December 31, 2008, the reinvestment privilege for Class B will no longer be available. Effective May 1, 2008, Class R Shares were renamed Class I Shares. See the Fund’s prospectus for more information. |
| 2 | As a percentage of total investments as of July 31, 2008. Holdings are subject to change. |
Annual Report Page 15
Fund Spotlight as of 7/31/08 Nuveen Rittenhouse Growth Fund
| | |
| Industries1 | | |
Software | | 10.2% |
Communications Equipment | | 9.3% |
Energy Equipment & Services | | 5.8% |
Biotechnology | | 5.3% |
Media | | 4.9% |
Pharmaceuticals | | 4.8% |
Computers & Peripherals | | 4.6% |
Semiconductors & Equipment | | 4.5% |
Industrial Conglomerates | | 4.5% |
Capital Markets | | 3.5% |
Machinery | | 3.3% |
Textiles, Apparel & Luxury Goods | | 3.2% |
Household Products | | 3.1% |
Health Care Equipment & Supplies | | 3.1% |
Food Products | | 2.8% |
Personal Products | | 2.4% |
Beverages | | 2.3% |
Food & Staples Retailing | | 2.3% |
Oil, Gas & Consumable Fuels | | 2.3% |
Short-Term Investments | | 4.0% |
Other | | 13.8% |
| 1 | As a percentage of total investments as of July 31, 2008. Holdings are subject to change. |
Expense Example (Unaudited)
As a shareholder of the Fund, you incur two types of costs: (1) transaction costs, including front and back end sales charges (loads) or redemption fees, where applicable; and (2) ongoing costs, including management fees; distribution and service (12b-1) fees, where applicable; and other Fund expenses. This Example is intended to help you understand your ongoing costs (in dollars) of investing in the Fund and to compare these costs with the ongoing costs of investing in other mutual funds.
The Example below is based on an investment of $1,000 invested at the beginning of the period and held for the period.
The information under “Actual Performance,” together with the amount you invested, allows you to estimate actual expenses incurred over the reporting period. Simply divide your account value by $1,000 (for example, an $8,600 account value divided by $1,000 = 8.60) and multiply the result by the cost shown for your share class, in the row entitled “Expenses Incurred During Period” to estimate the expenses incurred on your account during this period.
The information under “Hypothetical Performance,” provides information about hypothetical account values and hypothetical expenses based on the Fund’s actual expense ratio and an assumed rate of return of 5% per year before expenses, which is not the Fund’s actual return. The hypothetical account values and expenses may not be used to estimate the actual ending account balance or expense you incurred for the period. You may use this information to compare the ongoing costs of investing in the Fund and other Funds. To do so, compare this 5% hypothetical example with the 5% hypothetical examples that appear in the shareholder reports of the other funds.
Please note that the expenses shown in the table are meant to highlight your ongoing costs only and do not reflect any transactional costs, such as front and back end sales charges (loads) or redemption fees, where applicable. Therefore, the hypothetical information is useful in comparing ongoing costs only, and will not help you determine the relative total costs of owning different funds or share classes. In addition, if these transactional costs were included, your costs would have been higher.
| | | | | | | | | | | | | | | | | | | | | | | | |
| | | | | Hypothetical Performance |
| | | Actual Performance | | (5% return before expenses) |
| | | | | | | | |
| | | A Shares | | B Shares | | C Shares | | I Shares | | A Shares | | B Shares | | C Shares | | I Shares |
Beginning Account Value (2/01/08) | | $ | 1,000.00 | | $ | 1,000.00 | | $ | 1,000.00 | | $ | 1,000.00 | | $ | 1,000.00 | | $ | 1,000.00 | | $ | 1,000.00 | | $ | 1,000.00 |
Ending Account Value (7/31/08) | | $ | 969.00 | | $ | 965.10 | | $ | 965.60 | | $ | 970.20 | | $ | 1,017.60 | | $ | 1,013.87 | | $ | 1,013.87 | | $ | 1,018.85 |
Expenses Incurred During Period | | $ | 7.15 | | $ | 10.80 | | $ | 10.80 | | $ | 5.93 | | $ | 7.32 | | $ | 11.07 | | $ | 11.07 | | $ | 6.07 |
For each class of the Fund, expenses are equal to the Fund’s annualized expense ratio of 1.46%, 2.21%, 2.21%, and 1.21% for Classes A, B, C and I, respectively, multiplied by the average account value over the period, multiplied by 182/366 (to reflect the one-half year period).
Annual Report Page 16
Portfolio of Investments
Nuveen Santa Barbara Dividend Growth Fund
July 31, 2008
| | | | | |
| Shares | | Description (1) | | Value |
| | | | | |
| | COMMON STOCKS – 95.9% | | | |
| | |
| | Aerospace & Defense – 2.9% | | | |
| | |
| 9,305 | | Raytheon Company | | $ | 529,734 |
| | Beverages – 2.8% | | | |
| | |
| 10,070 | | Coca-Cola Company | | | 518,605 |
| | Commercial Banks – 9.2% | | | |
| | |
| 9,600 | | Cullen/Frost Bankers, Inc. | | | 506,304 |
| | |
| 8,470 | | PNC Financial Services Group, Inc. | | | 603,826 |
| | |
| 19,000 | | U.S. Bancorp | | | 581,590 |
| | Total Commercial Banks | | | 1,691,720 |
| | |
| | Commercial Services & Supplies – 2.7% | | | |
| | |
| 14,050 | | Waste Management, Inc. | | | 499,337 |
| | Communications Equipment – 6.4% | | | |
| | |
| 20,505 | | Nokia Oyj, Sponsored ADR | | | 560,197 |
| | |
| 11,055 | | QUALCOMM Inc. | | | 611,782 |
| | Total Communications Equipment | | | 1,171,979 |
| | |
| | Construction Materials – 3.0% | | | |
| | |
| 8,695 | | Vulcan Materials Company | | | 558,132 |
| | Diversified Telecommunication Services – 5.3% | | | |
| | |
| 16,200 | | AT&T Inc. | | | 499,122 |
| | |
| 6,195 | | Telefonica SA | | | 482,157 |
| | Total Diversified Telecommunication Services | | | 981,279 |
| | |
| | Electric Utilities – 7.2% | | | |
| | |
| 5,470 | | Exelon Corporation | | | 430,051 |
| | |
| 7,405 | | FPL Group, Inc. | | | 477,845 |
| | |
| 8,865 | | PPL Corporation | | | 416,300 |
| | Total Electric Utilities | | | 1,324,196 |
| | |
| | Electrical Equipment – 2.7% | | | |
| | |
| 10,225 | | Emerson Electric Co. | | | 497,958 |
| | Gas Utilities – 2.4% | | | |
| | |
| 8,085 | | Equitable Resources Inc. | | | 422,441 |
| | Health Care Equipment & Supplies – 3.2% | | | |
| | |
| 6,840 | | Becton, Dickinson and Company | | | 580,784 |
| | Hotels, Restaurants & Leisure – 3.0% | | | |
| | |
| 15,280 | | YUM! Brands, Inc. | | | 547,330 |
| | Household Products – 2.6% | | | |
| | |
| 7,430 | | Procter & Gamble Company | | | 486,516 |
| | Insurance – 5.2% | | | |
| | |
| 35,388 | | Fidelity National Title Group Inc., Class A | | | 472,784 |
| | |
| 13,090 | | Manulife Financial Corporation | | | 482,105 |
| | Total Insurance | | | 954,889 |
| | |
| | IT Services – 2.9% | | | |
| | |
| 16,240 | | Paychex, Inc. | | | 534,621 |
17
Portfolio of Investments
Nuveen Santa Barbara Dividend Growth Fund (continued)
July 31, 2008
| | | | | |
| Shares | | Description (1) | | Value |
| | | | | |
| | Machinery – 2.5% | | | |
| | |
| 10,892 | | PACCAR Inc. | | $ | 458,118 |
| | Media – 2.6% | | | |
| | |
| 37,925 | | Pearson Public Limited Company | | | 486,199 |
| | Metals & Mining – 2.5% | | | |
| | |
| 16,515 | | Southern Copper Corporation | | | 458,787 |
| | Oil, Gas & Consumable Fuels – 7.2% | | | |
| | |
| 5,320 | | Chevron Corporation | | | 449,859 |
| | |
| 5,500 | | EnCana Corporation | | | 397,045 |
| | |
| 6,760 | | Royal Dutch Shell PLC, Class A | | | 478,540 |
| | Total Oil, Gas & Consumable Fuels | | | 1,325,444 |
| | |
| | Pharmaceuticals – 5.9% | | | |
| | |
| 10,115 | | Abbott Laboratories | | | 569,879 |
| | |
| 10,850 | | Eli Lilly and Company | | | 511,144 |
| | Total Pharmaceuticals | | | 1,081,023 |
| | |
| | Semiconductors & Equipment – 2.9% | | | |
| | |
| 16,910 | | Microchip Technology Incorporated | | | 539,936 |
| | Thrifts & Mortgage Finance – 5.4% | | | |
| | |
| 31,170 | | Hudson City Bancorp, Inc. | | | 569,164 |
| | |
| 24,985 | | New York Community Bancorp, Inc. | | | 415,251 |
| | Total Thrifts & Mortgage Finance | | | 984,415 |
| | |
| | Tobacco – 5.4% | | | |
| | |
| 7,680 | | Lorillard Inc. | | | 515,405 |
| | |
| 9,385 | | Philip Morris International, (2) | | | 484,735 |
| | Total Tobacco | | | 1,000,140 |
| | |
| | Total Common Stocks (cost $18,321,456) | | | 17,633,583 |
| | |
| | | | | | | | | | |
Principal
Amount (000) | | Description (1) | | Coupon | | Maturity | | Value |
| | | | | | | | | | |
| | | SHORT-TERM INVESTMENTS – 2.8% | | | | | | | |
| | | | |
| $ | 516 | | Repurchase Agreement with Fixed Income Clearing Corporation, dated 7/31/08, repurchase price $515,727, collateralized by $505,000 U.S. Treasury Notes, 4.000%, due 2/15/15, value $527,725 | | 1.840% | | 8/01/08 | | $ | 515,701 |
| | | Total Short-Term Investments (cost $515,701) | | | | | | | 515,701 |
| | | |
| | | Total Investments (cost $18,837,157) – 98.7% | | | | | | | 18,149,284 |
| | | |
| | | Other Assets Less Liabilities – 1.3% | | | | | | | 235,199 |
| | | |
| | | Net Assets – 100% | | | | | | $ | 18,384,483 |
| | | |
| | (1) | | All percentages shown in the Portfolio of Investments are based on net assets. |
| | (2) | | Non-income producing. |
| | ADR | | American Depositary Receipt. |
See accompanying notes to financial statements.
18
Portfolio of Investments
Nuveen Santa Barbara Growth Fund
July 31, 2008
| | | | | |
| Shares | | Description (1) | | Value |
| | | | | |
| | COMMON STOCKS – 89.7% | | | |
| | |
| | Aerospace & Defense – 4.5% | | | |
| | |
| 15,425 | | Raytheon Company | | $ | 878,145 |
| | |
| 7,840 | | United Technologies Corporation | | | 501,603 |
| | Total Aerospace & Defense | | | 1,379,748 |
| | |
| | Air Freight & Logistics – 1.3% | | | |
| | |
| 11,800 | | Expeditors International of Washington Inc. | | | 419,018 |
| | Biotechnology – 2.5% | | | |
| | |
| 14,580 | | Gilead Sciences, Inc., (2) | | | 787,028 |
| | Chemicals – 2.7% | | | |
| | |
| 9,000 | | Praxair, Inc. | | | 843,570 |
| | Commercial Services & Supplies – 2.4% | | | |
| | |
| 21,225 | | Waste Management, Inc. | | | 754,337 |
| | Communication Equipment – 3.4% | | | |
| | |
| 18,715 | | QUALCOMM Inc. | | | 1,035,688 |
| | Construction & Engineering – 2.6% | | | |
| | |
| 10,490 | | Jacobs Engineering Group Inc., (2) | | | 811,297 |
| | Diversified Financial Services – 3.5% | | | |
| | |
| 735 | | CME Group, Inc. | | | 264,696 |
| | |
| 29,470 | | Western Union Company | | | 814,551 |
| | Total Diversified Financial Services | | | 1,079,247 |
| | |
| | Electrical Equipment – 1.9% | | | |
| | |
| 12,000 | | Emerson Electric Co. | | | 584,400 |
| | Energy Equipment & Services – 3.0% | | | |
| | |
| 9,075 | | Schlumberger Limited | | | 922,020 |
| | Food Products – 2.0% | | | |
| | |
| 6,325 | | Bunge Limited, (2) | | | 625,669 |
| | Health Care Equipment & Supplies – 12.5% | | | |
| | |
| 4,455 | | Alcon Inc. | | | 768,176 |
| | |
| 6,200 | | Becton, Dickinson and Company | | | 526,442 |
| | |
| 6,825 | | C. R. Bard, Inc. | | | 633,633 |
| | |
| 13,815 | | Patterson Companies Inc., (2) | | | 431,442 |
| | |
| 10,450 | | Stryker Corporation | | | 670,786 |
| | |
| 13,845 | | Varian Medical Systems, Inc., (2) | | | 830,700 |
| | Total Health Care Equipment & Supplies | | | 3,861,179 |
| | |
| | Health Care Providers & Services – 4.5% | | | |
| 8,030 | | Express Scripts, Inc., (2) | | | 566,436 |
| | |
| 15,365 | | Quest Diagnostics Incorporated | | | 816,803 |
| | Total Health Care Providers & Services | | | 1,383,239 |
| | |
| | Household Durables – 2.1% | | | |
| | |
| 14,300 | | Stanley Works | | | 636,064 |
| | Household Products – 1.9% | | | |
| | |
| 9,050 | | Procter & Gamble Company | | | 592,594 |
19
Portfolio of Investments
Nuveen Santa Barbara Growth Fund (continued)
July��31, 2008
| | | | | |
| Shares | | Description (1) | | Value |
| | | | | |
| | Insurance – 4.8% | | | |
| | |
| 13,440 | | AFLAC Incorporated | | $ | 747,398 |
| | |
| 12,200 | | Assurant Inc. | | | 733,464 |
| | Total Insurance | | | 1,480,862 |
| | |
| | IT Services – 5.2% | | | |
| | |
| 19,860 | | Accenture Limited | | | 829,354 |
| | |
| 15,950 | | Affiliated Computer Services Inc., (2) | | | 768,790 |
| | Total IT Services | | | 1,598,144 |
| | |
| | Machinery – 5.9% | | | |
| | |
| 9,430 | | Illinois Tool Works Inc. | | | 441,796 |
| | |
| 10,980 | | ITT Industries Inc. | | | 735,221 |
| | |
| 10,570 | | Parker Hannifin Corporation | | | 651,958 |
| | Total Machinery | | | 1,828,975 |
| | |
| | Media – 3.5% | | | |
| | |
| 10,220 | | McGraw-Hill Companies, Inc. | | | 415,647 |
| | |
| 15,530 | | Omnicom Group Inc. | | | 662,976 |
| | Total Media | | | 1,078,623 |
| | |
| | Metals & Mining – 2.9% | | | |
| | |
| 5,515 | | United States Steel Corporation | | | 884,385 |
| | Office Electronics – 2.2% | | | |
| | |
| 50,315 | | Xerox Corporation | | | 686,297 |
| | Oil, Gas & Consumable Fuels – 2.7% | | | |
| | |
| 17,483 | | XTO Energy, Inc. | | | 825,722 |
| | Pharmaceuticals – 1.5% | | | |
| | |
| 8,855 | | Allergan, Inc. | | | 459,840 |
| | Road & Rail – 4.3% | | | |
| | |
| 8,365 | | Burlington Northern Santa Fe Corporation | | | 871,047 |
| | |
| 6,400 | | Norfolk Southern Corporation | | | 460,288 |
| | Total Road & Rail | | | 1,331,335 |
| | |
| | Semiconductors & Equipment – 1.9% | | | |
| | |
| 26,290 | | Intel Corporation | | | 583,375 |
| | Software – 1.9% | | | |
| | |
| 20,990 | | Intuit Inc., (2) | | | 573,657 |
| | Textiles, Apparel & Luxury Goods – 2.1% | | | |
| | |
| 11,315 | | Nike, Inc., Class B | | | 663,963 |
| | Total Common Stocks (cost $26,991,453) | | | 27,710,276 |
| | |
20
| | | | | | | | | | |
Principal
Amount (000) | | Description (1) | | Coupon | | Maturity | | Value |
| | | SHORT-TERM INVESTMENTS – 13.5% | | | | | | | |
| | | | |
| $ | 4,187 | | Repurchase Agreement with Fixed Income Clearing Corporation, dated 7/31/08, repurchase price $4,186,784, collateralized by $3,575,000 U.S. Treasury Bonds, 6.000%, due 2/15/26, value $4,272,125 | | 1.840% | | 8/01/08 | | $ | 4,186,570 |
| | | Total Short-Term Investments (cost $4,186,570) | | | | | | | 4,186,570 |
| | | |
| | | Total Investments (cost $31,178,023) – 103.2% | | | | | | | 31,896,846 |
| | | |
| | | Other Assets Less Liabilities – (3.2)% | | | | | | | (990,310) |
| | | |
| | | Net Assets – 100% | | | | | | $ | 30,906,536 |
| | | |
| | (1) | | All percentages shown in the Portfolio of Investments are based on net assets. |
| | (2) | | Non-income producing. |
See accompanying notes to financial statements.
21
Portfolio of Investments
Nuveen Santa Barbara Growth Opportunities Fund
July 31, 2008
| | | | | |
| Shares | | Description (1) | | Value |
| | | | | |
| | COMMON STOCKS – 92.4% | | | |
| | |
| | Aerospace & Defense – 2.3% | | | |
| | |
| 1,200 | | Orbital Sciences Corporation, (2) | | $ | 30,012 |
| | Auto Components – 2.3% | | | |
| | |
| 500 | | Magna International Inc., Class A | | | 29,550 |
| | Capital Markets – 3.7% | | | |
| | |
| 300 | | Affiliated Managers Group Inc., (2) | | | 25,920 |
| | |
| 2,100 | | GFI Group, Inc. | | | 21,189 |
| | Total Capital Markets | | | 47,109 |
| | |
| | Chemicals – 13.9% | | | |
| | |
| 300 | | CF Industries Holdings, Inc. | | | 49,038 |
| | |
| 1,400 | | Ferro Corporation | | | 30,464 |
| | |
| 600 | | H.B. Fuller Company | | | 15,000 |
| | |
| 700 | | Lubrizol Corporation | | | 34,860 |
| | |
| 400 | | Methanex Corporation | | | 10,832 |
| | |
| 700 | | Terra Industries, Inc., (2) | | | 37,800 |
| | Total Chemicals | | | 177,994 |
| | |
| | Commercial Services & Supplies – 2.2% | | | |
| | |
| 1,600 | | Korn Ferry International, (2) | | | 28,000 |
| | Computers & Peripherals – 6.9% | | | |
| | |
| 900 | | Lexmark International, Inc., Class A, (2) | | | 31,572 |
| | |
| 1,000 | | Network Appliance Inc., (2) | | | 25,550 |
| | |
| 4,700 | | Palm Inc., (2) | | | 30,926 |
| | Total Computers & Peripherals | | | 88,048 |
| | |
| | Construction & Engineering – 6.0% | | | |
| | |
| 1,100 | | Chicago Bridge & Iron Company N.V. | | | 36,047 |
| | |
| 700 | | Shaw Group Inc., (2) | | | 40,460 |
| | Total Construction & Engineering | | | 76,507 |
| | |
| | Diversified Telecommunication Services – 3.2% | | | |
| | |
| 900 | | Embarq Corporation | | | 41,193 |
| | Energy Equipment & Services – 5.5% | | | |
| | |
| 500 | | ENSCO International Incorporated | | | 34,570 |
| | |
| 900 | | Rowan Companies Inc. | | | 35,820 |
| | Total Energy Equipment & Services | | | 70,390 |
| | |
| | Food Products – 4.0% | | | |
| | |
| 1,000 | | Flowers Foods Inc. | | | 30,070 |
| | |
| 600 | | Hormel Foods Corporation | | | 21,702 |
| | Total Food Products | | | 51,772 |
| | |
| | Health Care Providers & Services – 4.6% | | | |
| | |
| 1,400 | | Centene Corporation, (2) | | | 31,234 |
| | |
| 400 | | Express Scripts, Inc., (2) | | | 28,216 |
| | Total Health Care Providers & Services | | | 59,450 |
| | |
| | Hotels, Restaurants & Leisure – 1.4% | | | |
| | |
| 900 | | Speedway Motorsports Inc. | | | 17,379 |
22
| | | | | |
| Shares | | Description (1) | | Value |
| | | | | |
| | Household Durables – 1.7% | | | |
| | |
| 500 | | Stanley Works | | $ | 22,240 |
| | Industrial Conglomerates – 2.4% | | | |
| | |
| 500 | | Teleflex Inc. | | | 30,660 |
| | Insurance – 1.9% | | | |
| | |
| 400 | | Assurant Inc. | | | 24,048 |
| | Internet Software & Services – 2.3% | | | |
| | |
| 1,300 | | Check Point Software Technology Limited, (2) | | | 29,679 |
| | IT Services – 3.4% | | | |
| | |
| 4,600 | | Infogroup Inc. | | | 23,552 |
| | |
| 3,400 | | SonicWALL, Inc., (2) | | | 19,856 |
| | Total IT Services | | | 43,408 |
| | |
| | Machinery – 1.0% | | | |
| | |
| 400 | | Pentair, Inc. | | | 13,848 |
| | Marine – 3.0% | | | |
| | |
| 800 | | Kirby Corporation, (2) | | | 38,176 |
| | Metals & Mining – 1.9% | | | |
| | |
| 700 | | Ternium SA | | | 24,423 |
| | Pharmaceuticals – 4.6% | | | |
| | |
| 1,000 | | Biovail Corporation | | | 10,150 |
| | |
| 2,300 | | King Pharmaceuticals Inc., (2) | | | 26,473 |
| | |
| 1,200 | | Medicis Pharmaceutical Corporation | | | 22,032 |
| | Total Pharmaceuticals | | | 58,655 |
| | |
| | Road & Rail – 4.7% | | | |
| | |
| 1,100 | | Kansas City Southern Industries, (2) | | | 60,500 |
| | Semiconductors & Equipment – 5.7% | | | |
| | |
| 500 | | Analog Devices, Inc. | | | 15,255 |
| | |
| 2,100 | | Micrel, Incorporated | | | 19,992 |
| | |
| 2,000 | | QLogic Corporation, (2) | | | 37,680 |
| | Total Semiconductors & Equipment | | | 72,927 |
| | |
| | Software – 1.7% | | | |
| | |
| 700 | | Autodesk, Inc., (2) | | | 22,323 |
| | Specialty Retail – 2.1% | | | |
| | |
| 1,000 | | Charlotte Russe Holdings Inc., (2) | | | 12,960 |
| | |
| 500 | | Regis Corporation | | | 13,995 |
| | Total Specialty Retail | | | 26,955 |
| | |
| | Total Investments (cost $1,252,334) – 92.4% | | | 1,185,246 |
| | |
| | Other Assets Less Liabilities – 7.6% | | | 97,074 |
| | |
| | Net Assets – 100% | | $ | 1,282,320 |
| | |
| | (1) | | All percentages shown in the Portfolio of Investments are based on net assets. |
| | (2) | | Non-income producing. |
See accompanying notes to financial statements.
23
Portfolio of Investments
Nuveen Rittenhouse Growth Fund
July 31, 2008
| | | | | |
| Shares | | Description (1) | | Value |
| | | | | |
| | COMMON STOCKS – 95.7% | | | |
| | |
| | Aerospace & Defense – 2.2% | | | |
| | |
| 32,000 | | United Technologies Corporation | | $ | 2,047,360 |
| | Beverages – 2.3% | | | |
| | |
| 32,000 | | PepsiCo, Inc. | | | 2,129,920 |
| | Biotechnology – 5.3% | | | |
| | |
| 37,000 | | Celgene Corporation, (2) | | | 2,793,130 |
| | |
| 39,000 | | Gilead Sciences, Inc., (2) | | | 2,105,220 |
| | Total Biotechnology | | | 4,898,350 |
| | |
| | Capital Markets – 3.5% | | | |
| | |
| 7,500 | | Goldman Sachs Group, Inc. | | | 1,380,300 |
| | |
| 24,000 | | SEI Investments Company | | | 552,720 |
| | |
| 18,000 | | State Street Corporation | | | 1,289,520 |
| | Total Capital Markets | | | 3,222,540 |
| | |
| | Communications Equipment – 9.3% | | | |
| | |
| 147,000 | | Cisco Systems, Inc., (2) | | | 3,232,530 |
| | |
| 70,000 | | Nokia Oyj, Sponsored ADR | | | 1,912,400 |
| | |
| 62,000 | | QUALCOMM Inc. | | | 3,431,080 |
| | Total Communications Equipment | | | 8,576,010 |
| | |
| | Computers & Peripherals – 4.6% | | | |
| | |
| 21,000 | | Hewlett-Packard Company | | | 940,800 |
| | |
| 26,000 | | International Business Machines Corporation (IBM) | | | 3,327,480 |
| | Total Computers & Peripherals | | | 4,268,280 |
| | |
| | Consumer Finance – 1.1% | | | |
| | |
| 28,000 | | American Express Company | | | 1,039,360 |
| | Diversified Financial Services – 1.0% | | | |
| | |
| 43,000 | | Citigroup Inc. | | | 803,670 |
| | Electrical Equipment – 1.4% | | | |
| | |
| 30,000 | | Rockwell Automation, Inc. | | | 1,335,300 |
| | Electronic Equipment & Instruments – 2.2% | | | |
| | |
| 33,000 | | Thermo Fisher Scientific, Inc., (2) | | | 1,997,160 |
| | Energy Equipment & Services – 5.8% | | | |
| | |
| 25,000 | | Baker Hughes Incorporated | | | 2,072,750 |
| | |
| 28,000 | | Halliburton Company | | | 1,254,960 |
| | |
| 19,500 | | Schlumberger Limited | | | 1,981,200 |
| | Total Energy Equipment & Services | | | 5,308,910 |
| | |
| | Food & Staples Retailing – 2.3% | | | |
| | |
| 61,000 | | Walgreen Co. | | | 2,094,740 |
| | Food Products – 2.8% | | | |
| | |
| 40,000 | | Archer-Daniels-Midland Company | | | 1,145,200 |
| | |
| 12,000 | | Monsanto Company | | | 1,429,320 |
| | Total Food Products | | | 2,574,520 |
| | |
| | Health Care Equipment & Supplies – 3.1% | | | |
| | |
| 41,500 | | Baxter International Inc. | | | 2,847,315 |
24
| | | | | |
| Shares | | Description (1) | | Value |
| | | | | |
| | Household Products – 3.1% | | | |
| | |
| 44,000 | | Procter & Gamble Company | | $ | 2,881,120 |
| | Industrial Conglomerates – 4.4% | | | |
| | |
| 111,000 | | General Electric Company | | | 3,140,190 |
| | |
| 22,000 | | Textron Inc. | | | 956,340 |
| | Total Industrial Conglomerates | | | 4,096,530 |
| | |
| | Insurance – 1.0% | | | |
| | |
| 14,000 | | Prudential Financial, Inc. | | | 965,580 |
| | Machinery – 3.3% | | | |
| | |
| 13,500 | | Caterpillar Inc. | | | 938,520 |
| | |
| 31,000 | | ITT Industries Inc. | | | 2,075,760 |
| | Total Machinery | | | 3,014,280 |
| | |
| | Media – 4.9% | | | |
| | |
| 56,000 | | McGraw-Hill Companies, Inc. | | | 2,277,520 |
| | |
| 74,000 | | Walt Disney Company | | | 2,245,900 |
| | Total Media | | | 4,523,420 |
| | |
| | Metals & Mining – 2.2% | | | |
| | |
| 15,000 | | BHP Billiton PLC | | | 1,119,900 |
| | |
| 9,000 | | Freeport-McMoRan Copper & Gold, Inc. | | | 870,750 |
| | Total Metals & Mining | | | 1,990,650 |
| | |
| | Multiline Retail – 1.4% | | | |
| | |
| 31,000 | | Kohl’s Corporation, (2) | | | 1,299,210 |
| | Oil, Gas & Consumable Fuels – 2.3% | | | |
| | |
| 6,000 | | Apache Corporation | | | 673,020 |
| | |
| 18,000 | | Occidental Petroleum Corporation | | | 1,418,940 |
| | Total Oil, Gas & Consumable Fuels | | | 2,091,960 |
| | |
| | Personal Products – 2.3% | | | |
| | |
| 49,000 | | Estee Lauder Companies Inc., Class A | | | 2,160,900 |
| | Pharmaceuticals – 4.8% | | | |
| | |
| 51,000 | | Abbott Laboratories | | | 2,873,340 |
| | |
| 29,000 | | Allergan, Inc. | | | 1,505,970 |
| | Total Pharmaceuticals | | | 4,379,310 |
| | |
| | Semiconductors & Equipment – 4.5% | | | |
| | |
| 133,000 | | Intel Corporation | | | 2,951,270 |
| | |
| 50,000 | | Texas Instruments Incorporated | | | 1,219,000 |
| | Total Semiconductors & Equipment | | | 4,170,270 |
| | |
| | Software – 10.2% | | | |
| | |
| 35,000 | | Electronic Arts Inc. (EA), (2) | | | 1,511,300 |
| | |
| 165,000 | | Microsoft Corporation | | | 4,243,800 |
| | |
| 122,000 | | Oracle Corporation, (2) | | | 2,626,660 |
| | |
| 18,000 | | SAP AG, Sponsored ADR | | | 1,040,580 |
| | Total Software | | | 9,422,340 |
| | |
| | Specialty Retail – 1.2% | | | |
| | |
| 50,000 | | Staples, Inc. | | | 1,125,000 |
25
Portfolio of Investments
Nuveen Rittenhouse Growth Fund (continued)
July 31, 2008
| | | | | |
| Shares | | Description (1) | | Value |
| | | | | |
| | Textiles, Apparel & Luxury Goods – 3.2% | | | |
| | |
| 42,000 | | Coach, Inc., (2) | | $ | 1,071,420 |
| | |
| 32,000 | | Nike, Inc., Class B | | | 1,877,760 |
| | Total Textiles, Apparel & Luxury Goods | | | 2,949,180 |
| | |
| | Total Common Stocks (cost $93,506,208) | | | 88,213,185 |
| | |
| | | | | | | | | | |
Principal
Amount (000) | | Description (1) | | Coupon | | Maturity | | Value |
| | | SHORT-TERM INVESTMENTS – 4.0% | | | | | | | |
| | | | |
| $ | 3,717 | | Repurchase Agreement with Fixed Income Clearing Corporation, dated 7/31/08, repurchase price $3,716,708, collateralized by $3,345,000 U.S. Treasury Bonds, 5.500%, due 8/15/28, value $3,792,394 | | 1.840% | | 8/01/08 | | $ | 3,716,518 |
| | | Total Short-Term Investments (cost $3,716,518) | | | | | | | 3,716,518 |
| | | |
| | | Total Investments (cost $97,222,726) – 99.7% | | | | | | | 91,929,703 |
| | | |
| | | Other Assets Less Liabilities – 0.3% | | | | | | | 265,882 |
| | | |
| | | Net Assets – 100% | | | | | | $ | 92,195,585 |
| | | |
| | (1) | | All percentages shown in the Portfolio of Investments are based on net assets. |
| | (2) | | Non-income producing. |
| | ADR | | American Depositary Receipt. |
See accompanying notes to financial statements.
26
Statement of Assets and Liabilities
July 31, 2008
| | | | | | | | | | | | | | | | |
| | | Santa Barbara
Dividend
Growth | | | Santa Barbara
Growth | | | Santa Barbara
Growth
Opportunities | | | Rittenhouse
Growth | |
Assets | | | | | | | | | | | | | | | | |
Investments, at value (cost $18,321,456, $26,991,453, $1,252,334 and $93,506,208, respectively) | | $ | 17,633,583 | | | $ | 27,710,276 | | | $ | 1,185,246 | | | $ | 88,213,185 | |
Short-term investments (at cost, which approximates value) | | | 515,701 | | | | 4,186,570 | | | | — | | | | 3,716,518 | |
Cash | | | — | | | | 54,952 | | | | 94,769 | | | | — | |
Receivables: | | | | | | | | | | | | | | | | |
Dividends and interest | | | 22,842 | | | | 8,601 | | | | 287 | | | | 76,833 | |
From Adviser | | | — | | | | — | | | | 16,968 | | | | — | |
Investments sold | | | — | | | | 23,842 | | | | 42,949 | | | | 2,012,078 | |
Reclaims | | | 302 | | | | 1,112 | | | | — | | | | 14,464 | |
Shares sold | | | 325,400 | | | | 96,096 | | | | 1,330 | | | | 47,248 | |
Other assets | | | — | | | | — | | | | — | | | | 93,380 | |
Total assets | | | 18,497,828 | | | | 32,081,449 | | | | 1,341,549 | | | | 94,173,706 | |
Liabilities | | | | | | | | | | | | | | | | |
Payables: | | | | | | | | | | | | | | | | |
Investments purchased | | | — | | | | 1,096,703 | | | | 39,854 | | | | 1,351,478 | |
Shares redeemed | | | 72,745 | | | | 24,737 | | | | — | | | | 321,958 | |
Accrued expenses: | | | | | | | | | | | | | | | | |
Management fees | | | 14,607 | | | | 29,316 | | | | — | | | | 9,651 | |
12b-1 distribution and service fees | | | 3,829 | | | | 3,733 | | | | 477 | | | | 40,240 | |
Other | | | 22,164 | | | | 20,424 | | | | 18,898 | | | | 254,794 | |
Total liabilities | | | 113,345 | | | | 1,174,913 | | | | 59,229 | | | | 1,978,121 | |
Net assets | | $ | 18,384,483 | | | $ | 30,906,536 | | | $ | 1,282,320 | | | $ | 92,195,585 | |
Class A Shares | | | | | | | | | | | | | | | | |
Net assets | | $ | 4,225,994 | | | $ | 7,131,043 | | | $ | 280,442 | | | $ | 43,708,192 | |
Shares outstanding | | | 185,159 | | | | 354,986 | | | | 15,634 | | | | 1,970,822 | |
Net asset value per share | | $ | 22.82 | | | $ | 20.09 | | | $ | 17.94 | | | $ | 22.18 | |
Offering price per share (net asset value per share plus
maximum sales charge of 5.75% of offering price) | | $ | 24.21 | | | $ | 21.32 | | | $ | 19.03 | | | $ | 23.53 | |
Class B Shares | | | | | | | | | | | | | | | | |
Net assets | | $ | 724,899 | | | $ | 370,987 | | | $ | 223,310 | | | $ | 10,440,342 | |
Shares outstanding | | | 31,780 | | | | 18,789 | | | | 12,684 | | | | 509,676 | |
Net asset value and offering price per share | | $ | 22.81 | | | $ | 19.75 | | | $ | 17.61 | | | $ | 20.48 | |
Class C Shares | | | | | | | | | | | | | | | | |
Net assets | | $ | 2,870,237 | | | $ | 2,321,186 | | | $ | 291,135 | | | $ | 26,478,966 | |
Shares outstanding | | | 125,892 | | | | 117,615 | | | | 16,538 | | | | 1,291,813 | |
Net asset value and offering price per share | | $ | 22.80 | | | $ | 19.74 | | | $ | 17.60 | | | $ | 20.50 | |
Class I Shares(1) | | | | | | | | | | | | | | | | |
Net assets | | $ | 10,563,353 | | | $ | 21,083,320 | | | $ | 487,433 | | | $ | 11,568,085 | |
Shares outstanding | | | 462,724 | | | | 1,044,002 | | | | 27,080 | | | | 508,239 | |
Net asset value and offering price per share | | $ | 22.83 | | | $ | 20.19 | | | $ | 18.00 | | | $ | 22.76 | |
| | | | |
Net Assets Consist of: | | | | | | | | | | | | | | | | |
Capital paid-in | | $ | 19,554,606 | | | $ | 30,960,596 | | | $ | 1,467,674 | | | $ | 176,226,284 | |
Undistributed (Over-distribution of) net investment income | | | 6,971 | | | | — | | | | — | | | | — | |
Accumulated net realized gain (loss) from investments | | | (489,221 | ) | | | (772,883 | ) | | | (118,266 | ) | | | (78,737,676 | ) |
Net unrealized appreciation (depreciation) of investments | | | (687,873 | ) | | | 718,823 | | | | (67,088 | ) | | | (5,293,023 | ) |
Net assets | | $ | 18,384,483 | | | $ | 30,906,536 | | | $ | 1,282,320 | | | $ | 92,195,585 | |
| (1) | Effective May 1, 2008, Class R Shares were renamed Class I Shares. |
See accompanying notes to financial statements.
27
Statement of Operations
Year Ended July 31, 2008
| | | | | | | | | | | | | | | | |
| | | Santa Barbara
Dividend
Growth | | | Santa Barbara
Growth | | | Santa Barbara
Growth
Opportunities | | | Rittenhouse
Growth | |
Dividend and Interest Income (net of foreign tax withheld of $6,371, $667, $369 and $33,927, respectively) | | $ | 316,659 | | | $ | 135,962 | | | $ | 16,440 | | | $ | 1,617,627 | |
Expenses | | | | | | | | | | | | | | | | |
Management fees | | | 80,071 | | | | 100,042 | | | | 12,399 | | | | 893,624 | |
12b-1 service fees – Class A | | | 5,886 | | | | 10,341 | | | | 758 | | | | 116,080 | |
12b-1 distribution and service fees – Class B | | | 8,633 | | | | 3,252 | | | | 2,523 | | | | 158,423 | |
12b-1 distribution and service fees – Class C | | | 25,432 | | | | 24,188 | | | | 3,069 | | | | 319,755 | |
Shareholders’ servicing agent fees and expenses | | | 10,450 | | | | 6,597 | | | | 1,086 | | | | 299,470 | |
Custodian’s fees and expenses | | | 14,086 | | | | 36,378 | | | | 4,440 | | | | 19,621 | |
Trustees’ fees and expenses | | | 293 | | | | 272 | | | | 111 | | | | 2,659 | |
Professional fees | | | 14,426 | | | | 10,239 | | | | 17,637 | | | | 21,276 | |
Shareholders’ reports – printing and mailing expenses | | | 6,381 | | | | 6,280 | | | | — | | | | 142,756 | |
Federal and state registration fees | | | 53,168 | | | | 51,825 | | | | 41,020 | | | | 71,873 | |
Other expenses | | | 2,077 | | | | 2,216 | | | | 22 | | | | 6,422 | |
Total expenses before custodian fee credit and expense reimbursement | | | 220,903 | | | | 251,630 | | | | 83,065 | | | | 2,051,959 | |
Custodian fee credit | | | (4,588 | ) | | | (7,890 | ) | | | (2,556 | ) | | | (125 | ) |
Expense reimbursement | | | (75,465 | ) | | | (85,062 | ) | | | (61,172 | ) | | | (168,190 | ) |
Net expenses | | | 140,850 | | | | 159,735 | | | | 19,337 | | | | 1,883,644 | |
Net investment income (loss) | | | 175,809 | | | | (22,716 | ) | | | (2,897 | ) | | | (266,017 | ) |
Realized and Unrealized Gain (Loss) | | | | | | | | | | | | | | | | |
Net realized gain (loss) from investments | | | (489,284 | ) | | | (759,731 | ) | | | (77,888 | ) | | | 260,757 | |
Change in net unrealized appreciation (depreciation) of investments | | | (776,220 | ) | | | 651,720 | | | | (110,934 | ) | | | (7,598,797 | ) |
Net realized and unrealized gain (loss) | | | (1,265,504 | ) | | | (108,011 | ) | | | (188,822 | ) | | | (7,338,040 | ) |
Net increase (decrease) in net assets from operations | | $ | (1,089,695 | ) | | $ | (130,727 | ) | | $ | (191,719 | ) | | $ | (7,604,057 | ) |
See accompanying notes to financial statements.
28
Statement of Changes in Net Assets
| | | | | | | | | | | | | | | | |
| | | Santa Barbara
Dividend Growth | | | Santa Barbara Growth | |
| | | Year Ended
7/31/08 | | | Year Ended
7/31/07 | | | Year Ended
7/31/08 | | | Year Ended
7/31/07 | |
Operations | | | | | | | | | | | | | | | | |
Net investment income (loss) | | $ | 175,809 | | | $ | 23,040 | | | $ | (22,716 | ) | | $ | (10,124 | ) |
Net realized gain (loss) from investments | | | (489,284 | ) | | | 36,042 | | | | (759,731 | ) | | | 19,214 | |
Change in net unrealized appreciation (depreciation) of investments | | | (776,220 | ) | | | 32,635 | | | | 651,720 | | | | 179,433 | |
Net increase (decrease) in net assets from operations | | | (1,089,695 | ) | | | 91,717 | | | | (130,727 | ) | | | 188,523 | |
Distributions to Shareholders | | | | | | | | | | | | | | | | |
From net investment income: | | | | | | | | | | | | | | | | |
Class A | | | (39,580 | ) | | | (8,438 | ) | | | — | | | | — | |
Class B | | | (8,870 | ) | | | (4,198 | ) | | | — | | | | — | |
Class C | | | (28,252 | ) | | | (4,831 | ) | | | — | | | | — | |
Class I (1) | | | (94,569 | ) | | | (10,767 | ) | | | — | | | | (963 | ) |
From accumulated net realized gains: | | | | | | | | | | | | | | | | |
Class A | | | (8,033 | ) | | | (96 | ) | | | (8,058 | ) | | | — | |
Class B | | | (5,266 | ) | | | (90 | ) | | | (768 | ) | | | — | |
Class C | | | (15,832 | ) | | | (90 | ) | | | (5,989 | ) | | | — | |
Class I (1) | | | (7,147 | ) | | | (91 | ) | | | (6,007 | ) | | | — | |
Tax return of capital | | | | | | | | | | | | | | | | |
Class A | | | — | | | | — | | | | — | | | | — | |
Class B | | | — | | | | — | | | | — | | | | — | |
Class C | | | — | | | | — | | | | — | | | | — | |
Class I (1) | | | — | | | | — | | | | — | | | | — | |
Decrease in net assets from distributions to shareholders | | | (207,549 | ) | | | (28,601 | ) | | | (20,822 | ) | | | (963 | ) |
Fund Share Transactions | | | | | | | | | | | | | | | | |
Proceeds from sale of shares | | | 22,123,454 | | | | 2,005,051 | | | | 27,255,704 | | | | 5,216,355 | |
Proceeds from shares issued to shareholders due
to reinvestment of distributions | | | 141,373 | | | | 5,070 | | | | 6,501 | | | | — | |
| | | 22,264,827 | | | | 2,010,121 | | | | 27,262,205 | | | | 5,216,355 | |
Cost of shares redeemed | | | (5,694,987 | ) | | | (23,855 | ) | | | (2,912,760 | ) | | | (581,081 | ) |
Net increase (decrease) in net assets from Fund share transactions | | | 16,569,840 | | | | 1,986,266 | | | | 24,349,445 | | | | 4,635,274 | |
Net increase (decrease) in net assets | | | 15,272,596 | | | | 2,049,382 | | | | 24,197,896 | | | | 4,822,834 | |
Net assets at the beginning of year | | | 3,111,887 | | | | 1,062,505 | | | | 6,708,640 | | | | 1,885,806 | |
Net assets at the end of year | | $ | 18,384,483 | | | $ | 3,111,887 | | | $ | 30,906,536 | | | $ | 6,708,640 | |
Undistributed (Over-distribution of) net investment income at the end of year | | $ | 6,971 | | | $ | 2,644 | | | $ | — | | | $ | — | |
| (1) | Effective May 1, 2008, Class R Shares were renamed Class I Shares. |
See accompanying notes to financial statements.
29
Statement of Changes in Net Assets (continued)
| | | | | | | | | | | | | | | | |
| | | Santa Barbara
Growth Opportunities | | | Rittenhouse Growth | |
| | | Year Ended
7/31/08 | | | Year Ended
7/31/07 | | | Year Ended
7/31/08 | | | Year Ended
7/31/07 | |
Operations | | | | | | | | | | | | | | | | |
Net investment income (loss) | | $ | (2,897 | ) | | $ | 460 | | | $ | (266,017 | ) | | $ | (319,589 | ) |
Net realized gain (loss) from investments | | | (77,888 | ) | | | 79,527 | | | | 260,757 | | | | 6,305,658 | |
Change in net unrealized appreciation (depreciation) of investments | | | (110,934 | ) | | | 97,840 | | | | (7,598,797 | ) | | | 12,675,820 | |
Net increase (decrease) in net assets from operations | | | (191,719 | ) | | | 177,827 | | | | (7,604,057 | ) | | | 18,661,889 | |
Distributions to Shareholders | | | | | | | | | | | | | | | | |
From net investment income: | | | | | | | | | | | | | | | | |
Class A | | | — | | | | — | | | | — | | | | — | |
Class B | | | — | | | | — | | | | — | | | | — | |
Class C | | | — | | | | — | | | | — | | | | — | |
Class I (1) | | | (460 | ) | | | (358 | ) | | | — | | | | — | |
From accumulated net realized gains: | | | | | | | | | | | | | | | | |
Class A | | | (25,001 | ) | | | (4,060 | ) | | | — | | | | — | |
Class B | | | (20,452 | ) | | | (4,060 | ) | | | — | | | | — | |
Class C | | | (25,988 | ) | | | (4,060 | ) | | | — | | | | — | |
Class I (1) | | | (33,243 | ) | | | (4,060 | ) | | | — | | | | — | |
Tax return of capital | | | | | | | | | | | | | | | | |
Class A | | | (693 | ) | | | — | | | | — | | | | — | |
Class B | | | (567 | ) | | | — | | | | — | | | | — | |
Class C | | | (721 | ) | | | — | | | | — | | | | — | |
Class I (1) | | | (922 | ) | | | — | | | | — | | | | — | |
Decrease in net assets from distributions to shareholders | | | (108,047 | ) | | | (16,598 | ) | | | — | | | | — | |
Fund Share Transactions | | | | | | | | | | | | | | | | |
Proceeds from sale of shares | | | 532,458 | | | | — | | | | 20,770,529 | | | | 21,856,128 | |
Proceeds from shares issued to shareholders due
to reinvestment of distributions | | | 27,960 | | | | — | | | | — | | | | — | |
| | | 560,418 | | | | — | | | | 20,770,529 | | | | 21,856,128 | |
Cost of shares redeemed | | | (88,463 | ) | | | — | | | | (35,988,510 | ) | | | (57,975,381 | ) |
Net increase (decrease) in net assets from Fund share transactions | | | 471,955 | | | | — | | | | (15,217,981 | ) | | | (36,119,253 | ) |
Net increase (decrease) in net assets | | | 172,189 | | | | 161,229 | | | | (22,822,038 | ) | | | (17,457,364 | ) |
Net assets at the beginning of year | | | 1,110,131 | | | | 948,902 | | | | 115,017,623 | | | | 132,474,987 | |
Net assets at the end of year | | $ | 1,282,320 | | | $ | 1,110,131 | | | $ | 92,195,585 | | | $ | 115,017,623 | |
Undistributed (Over-distribution of) net investment income at the end of year | | $ | — | | | $ | 459 | | | $ | — | | | $ | — | |
| (1) | Effective May 1, 2008, Class R Shares were renamed Class I Shares. |
See accompanying notes to financial statements.
30
Notes to Financial Statements
1. General Information and Significant Accounting Policies
The Nuveen Investment Trust II (the “Trust”) is an open-end management investment company registered under the Investment Company Act of 1940, as amended. The Trust is comprised of Nuveen Santa Barbara Dividend Growth Fund (“Santa Barbara Dividend Growth”), Nuveen Santa Barbara Growth Fund (“Santa Barbara Growth”), Nuveen Santa Barbara Growth Opportunities Fund (“Santa Barbara Growth Opportunities”) and Nuveen Rittenhouse Growth Fund (“Rittenhouse Growth”) (collectively, the “Funds”), among others. The Trust was organized as a Massachusetts business trust in 1997.
Santa Barbara Dividend Growth ordinarily invests 80% of its net assets in dividend-paying common and preferred stocks in an attempt to provide income from dividends that is tax-advantaged and to provide long-term capital appreciation. The Fund may also invest up to 25% of its net assets in U.S. dollar-denominated equity securities of non-U.S. companies, including ADRs and other types of dollar-denominated depositary receipts of such companies.
Santa Barbara Growth ordinarily invests in equity securities of companies with mid- to large-sized market capitalizations at the time of purchase (within the range of the largest and smallest companies in the Russell 1000 Index) in an attempt to provide long-term capital appreciation. The Fund may also invest up to 25% of its net assets in U.S. dollar-denominated equity securities of non-U.S. companies, including ADRs and other types of dollar-denominated depositary receipts of such companies.
Santa Barbara Growth Opportunities ordinarily invests in equity securities of companies with small- to mid-sized market capitalizations at the time of purchase (currently from $50 million to $20 billion) in an attempt to provide long-term capital appreciation. The Fund may also invest up to 25% of its net assets in U.S. dollar-denominated equity securities of non-U.S. companies, including ADRs and other types of dollar-denominated depositary receipts of such companies.
Rittenhouse Growth ordinarily invests at least 65% of its total assets in equity securities of large-capitalization companies with a high financial strength rating and a history of consistent and predictable earnings growth in an attempt to provide long-term growth of capital.
On March 31, 2008, the Nuveen Mutual Funds announced the following policy changes applicable to the Funds, effective May 1, 2008:
| • | | Class A Share purchases at net asset value of $1 million or more that are subject to a contingent deferred sales charge (“CDSC”), the period over which the CDSC will apply has been reduced from eighteen months to twelve months for all purchases occurring on or after May 1, 2007. Class A Shares purchased prior to May 1, 2007 that have not been redeemed are no longer subject to a CDSC; |
| • | | Class B Shares will only be issued (i) upon the exchange of Class B Shares from another Nuveen fund, (ii) for purposes of dividend reinvestment, and (iii) through December 31, 2008, for defined contribution plans and investors using automatic investment plans with investments in Class B Shares as of March 31, 2008. The reinstatement privilege for Class B Shares will no longer be available as of December 31, 2008; |
| • | | Class R Shares have been renamed Class I Shares and are available for (i) purchases of $1 million or more, (ii) purchases using dividends and capital gains distributions on Class I Shares and (iii) purchase by limited categories of investors. |
The following is a summary of significant accounting policies followed by the Funds in the preparation of their financial statements in accordance with accounting principles generally accepted in the United States.
Investment Valuation
Exchange-listed securities are generally valued at the last sales price on the securities exchange on which such securities are primarily traded. Securities traded on a securities exchange for which there are no transactions on a given day or securities not listed on a securities exchange are valued at the mean of the closing bid and asked prices. Securities traded on Nasdaq are valued at the Nasdaq Official Closing Price. If it is determined that the market price for an investment is unavailable or inappropriate, the Board of Trustees of the Funds, or its designee, may establish fair value in accordance with procedures established in good faith by the Board of Trustees. Short-term investments are valued at amortized cost, which approximates value.
Investment Transactions
Investment transactions are recorded on a trade date basis. Realized gains and losses from investment transactions are determined on the specific identification method.
Investment Income
Dividend income is recorded on the ex-dividend date or, for foreign securities, when information is available. Interest income is recorded on an accrual basis.
Dividends and Distributions to Shareholders
Dividends from net investment income are declared and distributed to shareholders annually for Santa Barbara Growth, Santa Barbara Growth Opportunities and Rittenhouse Growth, and quarterly for Santa Barbara Dividend Growth. Dividends from net realized capital gains from investment transactions, if any, are declared and distributed to shareholders at least annually. Furthermore, capital gains are distributed only to the extent they exceed available capital loss carryforwards.
31
Notes to Financial Statements (continued)
Distributions to shareholders are recorded on the ex-dividend date. The amount and timing of distributions are determined in accordance with federal income tax regulations, which may differ from accounting principles generally accepted in the United States.
Income Taxes
Each Fund is a separate taxpayer for federal income tax purposes. Each Fund intends to distribute substantially all of its net investment income and net capital gains to shareholders and to otherwise comply with the requirements of Subchapter M of the Internal Revenue Code applicable to regulated investment companies. Therefore, no federal income tax provision is required.
Effective January 31, 2008, the Funds adopted Financial Accounting Standards Board (FASB) Interpretation No. 48 “Accounting for Uncertainty in Income Taxes” (FIN 48). FIN 48 provides guidance for how uncertain tax positions should be recognized, measured, presented and disclosed in the financial statements. FIN 48 requires the affirmative evaluation of tax positions taken or expected to be taken in the course of preparing the Funds’ tax returns to determine whether it is “more-likely-than-not” (i.e., a greater than 50-percent likelihood) of being sustained by the applicable tax authority. Tax positions not deemed to meet the more-likely-than-not threshold may result in a tax expense in the current year.
Implementation of FIN 48 required management of the Funds to analyze all open tax years, as defined by the statute of limitations, for all major jurisdictions, which includes federal and certain states. Open tax years are those that are open for examination by taxing authorities (i.e., generally the last four tax year ends and the interim tax period since then). The Funds have no examinations in progress.
For all open tax years and all major taxing jurisdictions through the end of the reporting period, management of the Funds has reviewed all tax positions taken or expected to be taken in the preparation of the Funds’ tax returns and concluded the adoption of FIN 48 resulted in no impact to the Funds’ net assets or results of operations as of and during the fiscal year ended July 31, 2008.
The Funds are also not aware of any tax positions for which it is reasonably possible that the total amounts of unrecognized tax benefits will significantly change in the next twelve months.
Flexible Sales Charge Program
Each Fund offers Class A, C and I Shares. During the period August 1, 2007 through April 30, 2008, each Fund offered Class B Shares. Class A Shares are generally sold with an up-front sales charge and incur a .25% annual 12b-1 service fee. Class A Share purchases of $1 million or more are sold at net asset value without an up-front sales charge but may be subject to a CDSC if redeemed within twelve months of purchase. Class B Shares are sold without an up-front sales charge but incur a .75% annual 12b-1 distribution fee and a .25% annual 12b-1 service fee. Class B Shares are subject to a CDSC of up to 5% depending upon the length of time the shares are held by the investor (CDSC is reduced to 0% at the end of six years). Class B Shares convert to Class A Shares eight years after purchase. Class C Shares are sold without an up-front sales charge but incur a .75% annual 12b-1 distribution fee and a .25% annual 12b-1 service fee. Class C Shares are subject to a CDSC of 1% if redeemed within one year of purchase. Class I Shares are not subject to any sales charge or 12b-1 distribution or service fees.
Foreign Currency Transactions
Each Fund is authorized to engage in foreign currency exchange transactions, including foreign currency futures, forward, options and swap contracts. To the extent that the Funds invest in securities and/or contracts that are denominated in a currency other than U.S. dollars, the Funds will be subject to currency risk, which is the risk that an increase in the U.S. dollar relative to the foreign currency will reduce returns or portfolio value. Generally, when the U.S. dollar rises in value against a foreign currency, the Funds’ investments denominated in that currency will lose value because its currency is worth fewer U.S. dollars; the opposite effect occurs if the U.S. dollar falls in relative value. Investments and other assets and liabilities denominated in foreign currencies are converted into U.S. dollars on a spot (i.e. cash) basis at the spot rate prevailing in the foreign currency exchange market at the time of valuation. Purchases and sales of investments and income denominated in foreign currencies are translated into U.S. dollars on the respective dates of such transactions. The gains or losses resulting from changes in foreign exchange rates, if any, are included in “Realized gain (loss) from investments” on the Statement of Operations.
The books and records of the Funds are maintained in U.S. dollars. Foreign currencies, investments and other assets and liabilities are translated into U.S. dollars at 4:00 p.m. Eastern time. Investments and income and expenses are translated on the respective dates of such transactions. Net realized foreign currency gains and losses resulting from changes in exchange rates include foreign currency gains and losses between trade date and settlement date of the transactions, foreign currency transactions, and the difference between the amounts of interest and dividends recorded on the books of a Fund and the amounts actually received.
Derivative Financial Instruments
The Funds are authorized to invest in certain derivative financial instruments, including futures, forwards, options and swap transactions. Although the Funds are authorized to invest in such financial instruments, and may do so in the future, they did not make any such investments during the fiscal year ended July 31, 2008.
Repurchase Agreements
In connection with transactions in repurchase agreements, it is the Funds’ policy that its custodian take possession of the underlying collateral securities, the fair value of which exceeds the principal amount of the repurchase transaction, including accrued interest, at all times. If the seller defaults, and the fair value of the collateral declines, realization of the collateral may be delayed or limited.
32
Expense Allocation
Expenses of the Funds that are not directly attributable to a specific class of shares are prorated among the classes based on the relative net assets of each class. Expenses directly attributable to a class of shares, which presently only include 12b-1 distribution and service fees, are recorded to the specific class.
Custodian Fee Credit
Each Fund has an arrangement with the custodian bank whereby certain custodian fees and expenses are reduced by net credits earned on each Fund’s cash on deposit with the bank. Such deposit arrangements are an alternative to overnight investments. Credits for cash balances may be offset by charges for any days on which a Fund overdraws its account at the custodian bank.
Indemnifications
Under the Trust’s organizational documents, its Officers and Trustees are indemnified against certain liabilities arising out of the performance of their duties to the Trust. In addition, in the normal course of business, the Trust enters into contracts that provide general indemnifications to other parties. The Trust’s maximum exposure under these arrangements is unknown as this would involve future claims that may be made against the Trust that have not yet occurred. However, the Trust has not had prior claims or losses pursuant to these contracts and expects the risk of loss to be remote.
Use of Estimates
The preparation of financial statements in conformity with accounting principles generally accepted in the United States requires management to make estimates and assumptions that affect the reported amounts of assets and liabilities at the date of the financial statements and the reported amounts of increases and decreases in net assets from operations during the reporting period. Actual results may differ from those estimates.
2. Fund Shares
Transactions in Fund shares were as follows:
| | | | | | | | | | | | | | |
| | | Santa Barbara Dividend Growth | |
| | | Year Ended
7/31/08 | | | Year Ended
7/31/07 | |
| | | Shares | | | Amount | | | Shares | | | Amount | |
Shares sold: | | | | | | | | | | | | | | |
Class A | | 270,674 | | | $ | 6,620,997 | | | 20,557 | | | $ | 502,892 | |
Class A – automatic conversion of Class B shares | | 1,103 | | | | 27,258 | | | — | | | | — | |
Class B | | 31,619 | | | | 794,425 | | | 2,915 | | | | 71,284 | |
Class C | | 144,617 | | | | 3,579,610 | | | 21,422 | | | | 521,797 | |
Class I | | 459,405 | | | | 11,101,164 | | | 36,778 | | | | 909,078 | |
Shares issued to shareholders due to reinvestment
of distributions: | | | | | | | | | | | | | | |
Class A | | 1,129 | | | | 26,837 | | | 58 | | | | 1,411 | |
Class B | | 316 | | | | 7,682 | | | 1 | | | | 26 | |
Class C | | 631 | | | | 15,265 | | | 25 | | | | 606 | |
Class I | | 3,916 | | | | 91,589 | | | 122 | | | | 3,027 | |
| | | 913,410 | | | | 22,264,827 | | | 81,878 | | | | 2,010,121 | |
Shares redeemed: | | | | | | | | | | | | | | |
Class A | | (120,382 | ) | | | (2,863,615 | ) | | (480 | ) | | | (11,081 | ) |
Class B | | (14,464 | ) | | | (357,079 | ) | | (3 | ) | | | (70 | ) |
Class B – automatic conversion to Class A shares | | (1,104 | ) | | | (27,258 | ) | | — | | | | — | |
Class C | | (53,294 | ) | | | (1,278,268 | ) | | (9 | ) | | | (230 | ) |
Class I | | (49,484 | ) | | | (1,168,767 | ) | | (513 | ) | | | (12,474 | ) |
| | | (238,728 | ) | | | (5,694,987 | ) | | (1,005 | ) | | | (23,855 | ) |
Net increase (decrease) | | 674,682 | | | $ | 16,569,840 | | | 80,873 | | | $ | 1,986,266 | |
33
Notes to Financial Statements (continued)
| | | | | | | | | | | | | | |
| | | Santa Barbara Growth | |
| | | Year Ended
7/31/08 | | | Year Ended
7/31/07 | |
| | | Shares | | | Amount | | | Shares | | | Amount | |
Shares sold: | | | | | | | | | | | | | | |
Class A | | 318,987 | | | $ | 6,466,550 | | | 108,530 | | | $ | 2,300,077 | |
Class A – automatic conversion of Class B shares | | 17 | | | | 339 | | | — | | | | — | |
Class B | | 4,097 | | | | 81,836 | | | 2,777 | | | | 57,990 | |
Class C | | 45,767 | | | | 944,906 | | | 92,632 | | | | 1,946,766 | |
Class I | | 988,785 | | | | 19,762,073 | | | 42,365 | | | | 911,522 | |
Shares issued to shareholders due to reinvestment
of distributions: | | | | | | | | | | | | | | |
Class A | | 191 | | | | 3,956 | | | — | | | | — | |
Class B | | 2 | | | | 35 | | | — | | | | — | |
Class C | | 35 | | | | 712 | | | — | | | | — | |
Class I | | 87 | | | | 1,798 | | | — | | | | — | |
| | | 1,357,968 | | | | 27,262,205 | | | 246,304 | | | | 5,216,355 | |
Shares redeemed: | | | | | | | | | | | | | | |
Class A | | (58,677 | ) | | | (1,214,754 | ) | | (26,562 | ) | | | (568,859 | ) |
Class B | | (567 | ) | | | (11,968 | ) | | (3 | ) | | | (70 | ) |
Class B – automatic conversion to Class A shares | | (17 | ) | | | (339 | ) | | — | | | | — | |
Class C | | (32,748 | ) | | | (664,110 | ) | | (571 | ) | | | (12,109 | ) |
Class I | | (49,733 | ) | | | (1,021,589 | ) | | (2 | ) | | | (43 | ) |
| | | (141,742 | ) | | | (2,912,760 | ) | | (27,138 | ) | | | (581,081 | ) |
Net increase (decrease) | | 1,216,226 | | | $ | 24,349,445 | | | 219,166 | | | $ | 4,635,274 | |
| |
| | | Santa Barbara Growth Opportunities | |
| | | Year Ended
7/31/08 | | | Year Ended
7/31/07 | |
| | | Shares | | | Amount | | | Shares | | | Amount | |
Shares sold: | | | | | | | | | | | | | | |
Class A | | 3,863 | | | $ | 87,222 | | | — | | | $ | — | |
Class B | | 787 | | | | 17,167 | | | — | | | | — | |
Class C | | 6,107 | | | | 130,715 | | | — | | | | — | |
Class I | | 14,402 | | | | 297,354 | | | — | | | | — | |
Shares issued to shareholders due to reinvestment
of distributions: | | | | | | | | | | | | | | |
Class A | | 267 | | | | 5,239 | | | — | | | | — | |
Class B | | 63 | | | | 1,227 | | | — | | | | — | |
Class C | | 357 | | | | 6,918 | | | — | | | | — | |
Class I | | 740 | | | | 14,576 | | | — | | | | — | |
| | | 26,586 | | | | 560,418 | | | — | | | | — | |
Shares redeemed: | | | | | | | | | | | | | | |
Class A | | (996 | ) | | | (17,764 | ) | | — | | | | — | |
Class B | | (666 | ) | | | (12,075 | ) | | — | | | | — | |
Class C | | (2,426 | ) | | | (48,729 | ) | | — | | | | — | |
Class I | | (562 | ) | | | (9,895 | ) | | — | | | | — | |
| | | (4,650 | ) | | | (88,463 | ) | | — | | | | — | |
Net increase (decrease) | | 21,936 | | | $ | 471,955 | | | — | | | $ | — | |
34
| | | | | | | | | | | | | | |
| | | Rittenhouse Growth | |
| | | Year Ended
7/31/08 | | | Year Ended
7/31/07 | |
| | | Shares | | | Amount | | | Shares | | | Amount | |
Shares sold: | | | | | | | | | | | | | | |
Class A | | 481,632 | | | $ | 11,354,079 | | | 283,548 | | | $ | 6,572,178 | |
Class A – automatic conversion of Class B shares | | 148,347 | | | | 3,496,261 | | | 542,188 | | | | 12,180,481 | |
Class B | | 68,400 | | | | 1,524,653 | | | 21,765 | | | | 469,598 | |
Class C | | 99,426 | | | | 2,234,881 | | | 58,202 | | | | 1,262,742 | |
Class I | | 92,125 | | | | 2,160,655 | | | 58,195 | | | | 1,371,129 | |
| | | 889,930 | | | | 20,770,529 | | | 963,898 | | | | 21,856,128 | |
Shares redeemed: | | | | | | | | | | | | | | |
Class A | | (516,360 | ) | | | (12,062,124 | ) | | (771,479 | ) | | | (17,623,248 | ) |
Class B | | (344,257 | ) | | | (7,557,299 | ) | | (641,952 | ) | | | (13,658,594 | ) |
Class B – automatic conversion to Class A shares | | (159,932 | ) | | | (3,496,261 | ) | | (579,879 | ) | | | (12,180,481 | ) |
Class C | | (376,331 | ) | | | (8,181,576 | ) | | (602,901 | ) | | | (12,816,890 | ) |
Class I | | (190,454 | ) | | | (4,691,250 | ) | | (72,059 | ) | | | (1,696,168 | ) |
| | | (1,587,334 | ) | | | (35,988,510 | ) | | (2,668,270 | ) | | | (57,975,381 | ) |
Net increase (decrease) | | (697,404 | ) | | $ | (15,217,981 | ) | | (1,704,372 | ) | | $ | (36,119,253 | ) |
3. Investment Transactions
Purchases and sales (excluding short-term investments) during the fiscal year ended July 31, 2008, were as follows:
| | | | | | | | | | | | |
| | | Santa Barbara
Dividend
Growth | | Santa Barbara
Growth | | Santa Barbara
Growth
Opportunities | | Rittenhouse
Growth |
Purchases | | $ | 19,752,084 | | $ | 26,022,477 | | $ | 1,260,121 | | $ | 57,381,645 |
Sales | | | 3,793,738 | | | 4,121,632 | | | 895,404 | | | 75,063,676 |
4. Income Tax Information
The following information is presented on an income tax basis. Differences between amounts for financial statement and federal income tax purposes are primarily due to timing differences in recognizing certain gains and losses on investment transactions. To the extent that differences arise that are permanent in nature, such amounts are reclassified within the capital accounts on the Statement of Assets and Liabilities presented in the annual report, based on their federal tax basis treatment; temporary differences do not require reclassification. Temporary and permanent differences do not impact the net asset values of the Funds.
At July 31, 2008, the cost of investments was as follows:
| | | | | | | | | | | | |
| | | Santa Barbara
Dividend
Growth | | Santa Barbara
Growth | | Santa Barbara
Growth
Opportunities | | Rittenhouse
Growth |
Cost of investments | | $ | 19,039,908 | | $ | 31,268,428 | | $ | 1,257,386 | | $ | 97,222,726 |
Gross unrealized appreciation and gross unrealized depreciation of investments at July 31, 2008, were as follows:
| | | | | | | | | | | | | | | | |
| | | Santa Barbara
Dividend
Growth | | | Santa Barbara
Growth | | | Santa Barbara
Growth
Opportunities | | | Rittenhouse
Growth | |
Gross unrealized: | | | | | | | | | | | | | | | | |
Appreciation | | $ | 388,917 | | | $ | 1,510,187 | | | $ | 98,401 | | | $ | 9,476,058 | |
Depreciation | | | (1,279,541 | ) | | | (881,769 | ) | | | (170,541 | ) | | | (14,769,081 | ) |
Net unrealized appreciation (depreciation) of investments | | $ | (890,624 | ) | | $ | 628,418 | | | $ | (72,140 | ) | | $ | (5,293,023 | ) |
The tax components of undistributed net ordinary income and net long-term capital gains at July 31, 2008, the Funds’ tax year end, were as follows:
| | | | | | | | | |
| | | Santa Barbara
Dividend
Growth | | Santa Barbara
Growth | | Santa Barbara
Growth
Opportunities | | Rittenhouse
Growth |
Undistributed net ordinary income* | | $ | 7,034 | | — | | — | | — |
Undistributed net long-term capital gains | | | — | | — | | — | | — |
* Net ordinary income consists of net taxable income derived from dividends, interest, and net short-term capital gains, if any.
35
Notes to Financial Statements (continued)
The tax character of distributions paid during the Funds’ tax years ended July 31, 2008 and July 31, 2007, was designated for purposes of the dividends paid deduction as follows:
| | | | | | | | | | | | |
| 2008 | | Santa Barbara
Dividend
Growth | | Santa Barbara
Growth | | Santa Barbara
Growth
Opportunities | | Rittenhouse
Growth |
Distributions from net ordinary income* | | $ | 188,722 | | $ | 19,973 | | $ | 60,774 | | $ | — |
Distributions from net long-term capital gains** | | | 18,827 | | | 849 | | | 44,370 | | | — |
Tax return of capital | | | — | | | — | | | 2,903 | | | — |
| | | | | | | | | | | | |
| 2007 | | Santa Barbara
Dividend
Growth | | Santa Barbara
Growth | | Santa Barbara
Growth
Opportunities | | Rittenhouse
Growth |
Distributions from net ordinary income * | | $ | 28,601 | | $ | 963 | | $ | 16,598 | | $ | — |
Distributions from net long-term capital gains | | | — | | | — | | | — | | | — |
* Net ordinary income consists of net taxable income derived from dividends, interest, and net short-term capital gains, if any.
** The Funds designated as a long-term capital gain dividend, pursuant to the Internal Revenue Code Section 852(b)(3), the amount necessary to
reduce earnings and profits of the Funds related to net capital gain to zero for the tax year ended July 31, 2008.
At July 31, 2008, the Funds’ tax year end, the following Funds had unused capital loss carryforwards available for federal income tax purposes to be applied against future capital gains, if any. If not applied, the carryforwards will expire as follows:
| | | | | | | | | |
| | | Santa Barbara
Dividend
Growth | | Santa Barbara
Growth | | Rittenhouse
Growth |
Expiration: | | | | | | | | | |
July 31, 2010 | | $ | — | | $ | — | | $ | 7,067,416 |
July 31, 2011 | | | — | | | — | | | 57,624,742 |
July 31, 2012 | | | — | | | — | | | 10,576,243 |
July 31, 2016 | | | 40,459 | | | 1,823 | | | — |
Total | | $ | 40,459 | | $ | 1,823 | | $ | 75,268,401 |
The Funds have elected to defer net realized losses from investments incurred from November 1, 2007 through July 31, 2008, the Funds’ tax year end, (“post-October losses”) in accordance with federal income tax regulations. Post-October losses are treated as having arisen on the first day of the following fiscal year:
| | | | | | | | | | | | |
| | | Santa Barbara
Dividend
Growth | | Santa Barbara
Growth | | Santa Barbara
Growth
Opportunities | | Rittenhouse
Growth |
Post-October capital losses | | $ | 246,010 | | $ | 680,655 | | $ | 113,215 | | $ | 3,469,277 |
5. Management Fees and Other Transactions with Affiliates
Each Fund’s management fee is separated into two components – a complex-level component, based on the aggregate amount of all fund assets managed by Nuveen Asset Management (the “Adviser”), a wholly owned subsidiary of Nuveen Investments, Inc. (“Nuveen”), and a specific fund-level component, based only on the amount of assets within each individual Fund. This pricing structure enables Nuveen fund shareholders to benefit from growth in the assets within each individual fund as well as from growth in the amount of complex-wide assets managed by the Adviser.
36
The annual fund-level fee, payable monthly, for each Fund is based upon the average daily net assets of each Fund as follows:
| | | | | | | | | | | | |
| Average Daily Net Assets | | Santa Barbara
Dividend
Growth
Fund-Level
Fee Rate | | | Santa Barbara
Growth
Fund-Level
Fee Rate | | | Santa Barbara
Growth Opportunities Fund-Level Fee Rate | | | Rittenhouse
Growth
Fund-Level
Fee Rate | |
For the first $125 million | | .6000 | % | | .7000 | % | | .8000 | % | | .6500 | % |
For the next $125 million | | .5875 | | | .6875 | | | .7875 | | | .6375 | |
For the next $250 million | | .5750 | | | .6750 | | | .7750 | | | .6250 | |
For the next $500 million | | .5625 | | | .6625 | | | .7625 | | | .6125 | |
For the next $1 billion | | .5500 | | | .6500 | | | .7500 | | | .6000 | |
For net assets over $2 billion | | .5250 | | | .6250 | | | .7250 | | | .5750 | |
The annual complex-level fee, payable monthly, which is additive to the fund-level fee, for all Nuveen sponsored funds in the U.S., is based on the aggregate amount of total fund assets managed as stated in the tables below. As of July 31, 2008, the complex-level fee rate was .1878%.
Effective August 20, 2007, the complex-level fee schedule is as follows:
| | | |
| Complex-Level Asset Breakpoint Level (1) | | Effective Rate at Breakpoint Level | |
$55 billion | | .2000 | % |
$56 billion | | .1996 | |
$57 billion | | .1989 | |
$60 billion | | .1961 | |
$63 billion | | .1931 | |
$66 billion | | .1900 | |
$71 billion | | .1851 | |
$76 billion | | .1806 | |
$80 billion | | .1773 | |
$91 billion | | .1691 | |
$125 billion | | .1599 | |
$200 billion | | .1505 | |
$250 billion | | .1469 | |
$300 billion | | .1445 | |
Prior to August 20, 2007, the complex-level fee schedule was as follows:
| | | |
| Complex-Level Asset Breakpoint Level (1) | | Effective Rate at Breakpoint Level | |
$55 billion | | .2000 | % |
$56 billion | | .1996 | |
$57 billion | | .1989 | |
$60 billion | | .1961 | |
$63 billion | | .1931 | |
$66 billion | | .1900 | |
$71 billion | | .1851 | |
$76 billion | | .1806 | |
$80 billion | | .1773 | |
$91 billion | | .1698 | |
$125 billion | | .1617 | |
$200 billion | | .1536 | |
$250 billion | | .1509 | |
$300 billion | | .1490 | |
| (1) | The complex-level fee component of the management fee for the funds is calculated based upon the aggregate Managed Assets (‘‘Managed Assets’’ means the average daily net assets of each fund including assets attributable to preferred stock issued by or borrowings by the Nuveen funds) of Nuveen sponsored funds in the U.S. |
The management fee compensates the Adviser for overall investment advisory and administrative services and general office facilities. The Adviser has entered into Sub-Advisory Agreements with Santa Barbara Asset Management (“Santa Barbara”) and Rittenhouse Asset Management, Inc. (“Rittenhouse”), both wholly owned subsidiaries of Nuveen. Santa Barbara and Rittenhouse are compensated for their services to the Funds from the management fee paid to the Adviser.
The Adviser agreed to waive part of its management fees or reimburse certain expenses of Santa Barbara Dividend Growth, Santa Barbara Growth and Santa Barbara Growth Opportunities through November 30, 2009, in order to limit total operating expenses (excluding 12b-1 distribution and service fees, interest expense, taxes, fees incurred in acquiring and disposing of portfolio securities
37
Notes to Financial Statements (continued)
and extraordinary expenses) from exceeding 1.05%, 1.15% and 1.25%, respectively, of the average daily net assets and from exceeding 1.30%, 1.40% and 1.50%, respectively, after November 30, 2009.
The Adviser also agreed to waive part of its management fees or reimburse certain expenses of Rittenhouse Growth through November 30, 2008, in order to limit total operating expenses (excluding 12b-1 distribution and service fees, interest expense, taxes, fees incurred in acquiring and disposing of portfolio securities and extraordinary expenses) from exceeding 1.22% of the average daily net assets. Rittenhouse has also reimbursed Rittenhouse Growth for certain portions of fund brokerage commissions paid with respect to portfolio trades effected by certain brokers that provided securities research to Rittenhouse, as permitted by the federal securities laws. For the fiscal year ended July 31, 2008, Rittenhouse reimbursements to the Fund were $42,936, which the Fund included in “Realized gain (loss) from investments and foreign currencies” for financial reporting purposes.
The Adviser may also voluntarily reimburse additional expenses from time to time in any of the Funds. Voluntary reimbursements may be terminated at any time at the Adviser’s discretion.
The Trusts pays no compensation directly to those of its Trustees who are affiliated with the Adviser or to its Officers, all of whom receive remuneration for their services to the Trust from the Adviser or its affiliates. The Board of Trustees has adopted a deferred compensation plan for independent Trustees that enables Trustees to elect to defer receipt of all or a portion of the annual compensation they are entitled to receive from certain Nuveen advised funds. Under the plan, deferred amounts are treated as though equal dollar amounts had been invested in shares of select Nuveen advised funds.
During the fiscal year ended July 31, 2008, Nuveen Investments, LLC (the “Distributor”), a wholly owned subsidiary of Nuveen, collected sales charges on purchases of Class A Shares, the majority of which were paid out as concessions to financial intermediaries as follows:
| | | | | | | | | | | | |
| | | Santa
Barbara
Dividend
Growth | | Santa
Barbara
Growth | | Santa
Barbara
Growth
Opportunities | | Rittenhouse
Growth |
Sales charges collected (Unaudited) | | $ | 52,107 | | $ | 7,026 | | $ | 1,651 | | $ | 31,331 |
Paid to financial intermediaries (Unaudited) | | | 46,182 | | | 6,654 | | | 1,436 | | | 27,346 |
The Distributor also received 12b-1 service fees on Class A Shares, substantially all of which were paid to compensate financial intermediaries for providing services to shareholders relating to their investments.
During the fiscal year ended July 31, 2008, the Distributor compensated financial intermediaries directly with commission advances at the time of purchase as follows:
| | | | | | | | | | | | |
| | | Santa
Barbara
Dividend
Growth | | Santa
Barbara
Growth | | Santa
Barbara
Growth
Opportunities | | Rittenhouse
Growth |
Commission advances (Unaudited) | | $ | 23,883 | | $ | 15,147 | | $ | 988 | | $ | 20,562 |
To compensate for commissions advanced to financial intermediaries, all 12b-1 service fees collected on Class B Shares during the first year following a purchase, all 12b-1 distribution fees collected on Class B Shares, and all 12b-1 service and distribution fees collected on Class C Shares during the first year following a purchase are retained by the Distributor. During the fiscal year ended July 31, 2008, the Distributor retained such 12b-1 fees as follows:
| | | | | | | | | | | | |
| | | Santa
Barbara
Dividend
Growth | | Santa
Barbara
Growth | | Santa
Barbara
Growth
Opportunities | | Rittenhouse
Growth |
12b-1 fees retained (Unaudited) | | $ | 24,299 | | $ | 25,252 | | $ | 5,911 | | $ | 152,821 |
The remaining 12b-1 fees charged to the Funds were paid to compensate financial intermediaries for providing services to shareholders relating to their investments.
The Distributor also collected and retained CDSC on share redemptions during the fiscal year ended July 31, 2008, as follows:
| | | | | | | | | | | | |
| | | Santa
Barbara
Dividend
Growth | | Santa
Barbara
Growth | | Santa
Barbara
Growth
Opportunities | | Rittenhouse
Growth |
CDSC retained (Unaudited) | | $ | 11,824 | | $ | 6,723 | | $ | 10 | | $ | 39,270 |
38
At July 31, 2008, Nuveen owned 12,500 shares of Classes A, B, C and I of Santa Barbara Dividend Growth, 12,500 shares of Class A, 12,500 shares of Class B, 12,500 shares of Class C and 62,500 shares of Class I of Santa Barbara Growth and 12,500 shares of Classes A, B, C and I of Santa Barbara Growth Opportunities. At July 31, 2008, the Adviser also owned 2,429 shares of Class A, 1,250 shares of Class C and 1,250 shares of Class I of Rittenhouse Growth.
Agreement and Plan of Merger
On June 20, 2007, Nuveen announced that it had entered into a definitive Agreement and Plan of Merger (“Merger Agreement”) with Windy City Investments, Inc. (“Windy City”), a corporation formed by investors led by Madison Dearborn Partners, LLC (“Madison Dearborn”), pursuant to which Windy City would acquire Nuveen. Madison Dearborn is a private equity investment firm based in Chicago, Illinois. The merger was consummated on November 13, 2007.
The consummation of the merger was deemed to be an “assignment” (as that term is defined in the Investment Company Act of 1940) of the investment management agreement between each Fund and the Adviser and, if applicable, each sub-advisory agreement between the Adviser and any sub-adviser of the Funds, and resulted in the automatic termination of each such agreement. The Board of Trustees of each Fund considered and approved a new investment management agreement with the Adviser, and, if applicable, a new sub-advisory agreement between the Adviser and any sub-adviser on the same terms as the previous agreements. Each new ongoing investment management agreement and sub-advisory agreement, if applicable, was approved by the shareholders of each Fund and took effect on November 13, 2007.
The investors led by Madison Dearborn includes an affiliate of Merrill Lynch. As a result, Merrill Lynch is an indirect “affiliated person” (as that term is defined in the Investment Company Act of 1940) of each Fund. Certain conflicts of interest may arise as a result of such indirect affiliation. For example, the Funds are generally prohibited from entering into principal transactions with Merrill Lynch and its affiliates. The Adviser does not believe that any such prohibitions or limitations as a result of Merrill Lynch’s affiliation will significantly impact the ability of the Funds to pursue their investment objectives and policies.
6. New Accounting Pronouncements
Financial Accounting Standards Board Statement of Financial Accounting Standards (SFAS) No. 157
In September 2006, the FASB issued SFAS No. 157, “Fair Value Measurements.” This standard establishes a single authoritative definition of fair value, sets out a framework for measuring fair value and requires additional disclosures about fair value measurements. SFAS No. 157 applies to fair value measurements already required or permitted by existing standards. SFAS No. 157 is effective for financial statements issued for fiscal years beginning after November 15, 2007, and interim periods within those fiscal years. The changes to current generally accepted accounting principles from the application of this standard relate to the definition of fair value, the methods used to measure fair value, and the expanded disclosures about fair value measurements. As of July 31, 2008, management does not believe the adoption of SFAS No. 157 will impact the financial statement amounts; however, additional disclosures may be required about the inputs used to develop the measurements and the effect of certain of the measurements included within the Statement of Operations for the period.
Financial Accounting Standards Board Statement of Financial Accounting Standards No. 161
In March 2008, the FASB issued SFAS No. 161, “Disclosures about Derivative Instruments and Hedging Activities.” This standard is intended to enhance financial statement disclosures for derivative instruments and hedging activities and enable investors to understand: a) how and why a fund uses derivative instruments, b) how derivative instruments and related hedge items are accounted for, and c) how derivative instruments and related hedge items affect a fund’s financial position, results of operations and cash flows. SFAS No. 161 is effective for financial statements issued for fiscal years and interim periods beginning after November 15, 2008. As of July 31, 2008, management does not believe the adoption of SFAS No. 161 will impact the financial statement amounts; however, additional footnote disclosures may be required about the use of derivative instruments and hedging items.
39
Financial Highlights
Selected data for a share outstanding throughout each period:
| | | | | | | | | | | | | | | | | | | | | | | | | | | | | | | | | | | | | | | | | | | | | | | | | | | | | | | | |
| Class (Commencement Date) | | | | | | | | | | | | | | | | | | | | | | | | | | | | | | | | | | | | | | | | | | | | | |
| | | | | Investment Operations | | | Less Distributions | | | | | | Ratios/Supplemental Data | |
SANTA BARBARA DIVIDEND GROWTH | | | | | | | | | | | | | | | | | | | | | | | | | | Ratios to Average
Net Assets
Before Credit/
Reimbursement | | | Ratios to Average
Net Assets
After
Reimbursement(c) | | | Ratios to Average
Net Assets
After Credit/
Reimbursement(d) | | | | |
Year Ended
July 31, | | Beginning
Net
Asset
Value | | Net
Invest-
ment
Income(a) | | Net
Realized/
Unrealized
Gain (Loss) | | | Total | | | Net
Invest-
ment
Income | | | Capital
Gains | | | Total | | | Ending
Net
Asset
Value | | Total
Return(b) | | | Ending
Net
Assets
(000) | | Expenses | | | Net
Invest-
ment
Income
(Loss) | | | Expenses | | | Net
Invest-
ment
Income
(Loss) | | | Expenses | | | Net
Invest-
ment
Income
(Loss) | | | Portfolio
Turnover
Rate | |
| Class A (3/06) | | | | | | | | | | | | | | | | | | | | | | | | | | | | | | | | | | | | | | | | | | | | | | | | | | | | | |
2008 | | $ | 23.78 | | $ | .47 | | $ | (.86 | ) | | $ | (.39 | ) | | $ | (.44 | ) | | $ | (.13 | ) | | $ | (.57 | ) | | $ | 22.82 | | (1.77 | )% | | $ | 4,226 | | 2.02 | % | | 1.15 | % | | 1.28 | % | | 1.89 | % | | 1.24 | % | | 1.93 | % | | 39 | % |
2007 | | | 21.27 | | | .43 | | | 2.63 | | | | 3.06 | | | | (.54 | ) | | | (.01 | ) | | | (.55 | ) | | | 23.78 | | 14.49 | | | | 776 | | 4.61 | | | (1.67 | ) | | 1.28 | | | 1.66 | | | 1.10 | | | 1.84 | | | 21 | |
2006(e) | | | 20.00 | | | .15 | | | 1.12 | | | | 1.27 | | | | — | | | | — | | | | — | | | | 21.27 | | 6.35 | | | | 266 | | 5.71 | * | | (2.32 | )* | | 1.29 | * | | 2.10 | * | | 1.25 | * | | 2.13 | * | | 4 | |
| Class B (3/06) | | | | | | | | | | | | | | | | | | | | | | | | | | | | | | | | | | | | | | | | | | | | | | | | | | | | | |
2008 | | | 23.77 | | | .29 | | | (.87 | ) | | | (.58 | ) | | | (.25 | ) | | | (.13 | ) | | | (.38 | ) | | | 22.81 | | (2.51 | ) | | | 725 | | 3.06 | | | .10 | | | 2.04 | | | 1.12 | | | 1.99 | | | 1.17 | | | 39 | |
2007 | | | 21.22 | | | .28 | | | 2.61 | | | | 2.89 | | | | (.33 | ) | | | (.01 | ) | | | (.34 | ) | | | 23.77 | | 13.68 | | | | 366 | | 5.78 | | | (2.71 | ) | | 2.03 | | | 1.04 | | | 1.85 | | | 1.22 | | | 21 | |
2006(e) | | | 20.00 | | | .10 | | | 1.12 | | | | 1.22 | | | | — | | | | — | | | | — | | | | 21.22 | | 6.10 | | | | 265 | | 6.46 | * | | (3.07 | )* | | 2.04 | * | | 1.35 | * | | 2.00 | * | | 1.38 | * | | 4 | |
| Class C (3/06) | | | | | | | | | | | | | | | | | | | | | | | | | | | | | | | | | | | | | | | | | | | | | | | | | | | | | |
2008 | | | 23.76 | | | .27 | | | (.85 | ) | | | (.58 | ) | | | (.25 | ) | | | (.13 | ) | | | (.38 | ) | | | 22.80 | | (2.51 | ) | | | 2,870 | | 3.07 | | | .04 | | | 2.04 | | | 1.07 | | | 1.99 | | | 1.11 | | | 39 | |
2007 | | | 21.22 | | | .24 | | | 2.64 | | | | 2.88 | | | | (.33 | ) | | | (.01 | ) | | | (.34 | ) | | | 23.76 | | 13.63 | | | | 806 | | 5.34 | | | (2.46 | ) | | 2.04 | | | .84 | | | 1.85 | | | 1.03 | | | 21 | |
2006(e) | | | 20.00 | | | .10 | | | 1.12 | | | | 1.22 | | | | — | | | | — | | | | — | | | | 21.22 | | 6.10 | | | | 265 | | 6.46 | * | | (3.07 | )* | | 2.04 | * | | 1.35 | * | | 2.00 | * | | 1.38 | * | | 4 | |
| Class I (3/06) (f) | | | | | | | | | | | | | | | | | | | | | | | | | | | | | | | | | | | | | | | | | | | | | | | | | | | | | |
2008 | | | 23.79 | | | .50 | | | (.83 | ) | | | (.33 | ) | | | (.50 | ) | | | (.13 | ) | | | (.63 | ) | | | 22.83 | | (1.52 | ) | | | 10,563 | | 1.56 | | | 1.51 | | | 1.03 | | | 2.03 | | | .99 | | | 2.07 | | | 39 | |
2007 | | | 21.29 | | | .46 | | | 2.66 | | | | 3.12 | | | | (.61 | ) | | | (.01 | ) | | | (.62 | ) | | | 23.79 | | 14.77 | | | | 1,163 | | 4.14 | | | (1.33 | ) | | 1.04 | | | 1.77 | | | .85 | | | 1.96 | | | 21 | |
2006(e) | | | 20.00 | | | .17 | | | 1.12 | | | | 1.29 | | | | — | | | | — | | | | — | | | | 21.29 | | 6.45 | | | | 266 | | 5.45 | * | | (2.07 | )* | | 1.04 | * | | 2.35 | * | | 1.00 | * | | 2.39 | * | | 4 | |
| (a) | Per share Net Investment Income is calculated using the average daily shares method. |
| (b) | Total return is the combination of changes in net asset value without any sales charge, reinvested dividend income at net asset value and reinvested capital gains distributions at net asset value, if any. Total returns are not annualized. |
| (c) | After expense reimbursement from the Adviser, where applicable. |
| (d) | After custodian fee credit and expense reimbursement, where applicable. |
| (e) | For the period ended March 28, 2006 (commencement of operations) through July 31, 2006. |
| (f) | Effective May 1, 2008, Class R Shares were renamed Class I Shares. |
See accompanying notes to financial statements.
40
| | | | | | | | | | | | | | | | | | | | | | | | | | | | | | | | | | | | | | | | | | | | | | | | | | | | | | | | | |
| Class (Commencement Date) | | | | | | | | | | | | | | | | | | | | | | | | | | | | | | | | | | | | | | | | | | | | | | |
| | | | | Investment Operations | | | Less Distributions | | | | | | | | Ratios/Supplemental Data | |
| SANTA BARBARA GROWTH | | | | | | | | | | | | | | | | | | | | | | | | | Ratios to Average
Net Assets
Before Credit/
Reimbursement | | | Ratios to Average
Net Assets
After
Reimbursement(c) | | | Ratios to Average
Net Assets
After Credit/
Reimbursement(d) | | | | |
Year
Ended
July 31, | | Beginning
Net
Asset
Value | | Net
Invest-
ment
Income
(Loss)(a) | | | Net
Realized/
Unrealized
Gain
(Loss) | | | Total | | | Net
Invest-
ment
Income | | | Capital
Gains | | | Total | | | Ending
Net
Asset
Value | | Total
Return(b) | | | Ending
Net
Assets
(000) | | Expenses | | | Net
Invest-
ment
Income
(Loss) | | | Expenses | | | Net
Invest-
ment
Income
(Loss) | | | Expenses | | | Net
Invest-
ment
Income
(Loss) | | | Portfolio
Turnover
Rate | |
| Class A (3/06) | | | | | | | | | | | | | | | | | | | | | | | | | | | | | | | | | | | | | | | | | | | | | | | | | | | | | | |
2008 | | $ | 21.08 | | $ | (.02 | ) | | $ | (.92 | ) | | $ | (.94 | ) | | $ | — | | | $ | (.05 | ) | | $ | (.05 | ) | | $ | 20.09 | | (4.46 | )% | | $ | 7,131 | | 2.26 | % | | (1.01 | )% | | 1.39 | % | | (.15 | )% | | 1.32 | % | | (.08 | )% | | 37 | % |
2007 | | | 18.86 | | | (.04 | ) | | | 2.26 | | | | 2.22 | | | | — | | | | — | | | | — | | | | 21.08 | | 11.77 | | | | 1,991 | | 3.48 | | | (2.52 | ) | | 1.39 | | | (.43 | ) | | 1.15 | | | (.19 | ) | | 48 | |
2006(e) | | | 20.00 | | | — | ** | | | (1.14 | ) | | | (1.14 | ) | | | — | | | | — | | | | — | | | | 18.86 | | (5.70 | ) | | | 236 | | 4.71 | * | | (3.44 | )* | | 1.39 | * | | (.12 | )* | | 1.30 | * | | (.03 | )* | | 6 | |
| Class B (3/06) | | | | | | | | | | | | | | | | | | | | | | | | | | | | | | | | | | | | | | | | | | | | | | | | | | | | | | |
2008 | | | 20.88 | | | (.16 | ) | | | (.92 | ) | | | (1.08 | ) | | | — | | | | (.05 | ) | | | (.05 | ) | | | 19.75 | | (5.17 | ) | | | 371 | | 3.03 | | | (1.76 | ) | | 2.14 | | | (.87 | ) | | 2.07 | | | (.80 | ) | | 37 | |
2007 | | | 18.81 | | | (.18 | ) | | | 2.25 | | | | 2.07 | | | | — | | | | — | | | | — | | | | 20.88 | | 11.00 | | | | 319 | | 4.90 | | | (3.90 | ) | | 2.14 | | | (1.14 | ) | | 1.89 | | | (.89 | ) | | 48 | |
2006(e) | | | 20.00 | | | (.05 | ) | | | (1.14 | ) | | | (1.19 | ) | | | — | | | | — | | | | — | | | | 18.81 | | (5.95 | ) | | | 235 | | 5.46 | * | | (4.19 | )* | | 2.14 | * | | (.87 | )* | | 2.05 | * | | (.78 | )* | | 6 | |
| Class C (3/06) | | | | | | | | | | | | | | | | | | | | | | | | | | | | | | | | | | | | | | | | | | | | | | | | | | | | | | |
2008 | | | 20.87 | | | (.16 | ) | | | (.92 | ) | | | (1.08 | ) | | | — | | | | (.05 | ) | | | (.05 | ) | | | 19.74 | | (5.18 | ) | | | 2,321 | | 3.07 | | | (1.80 | ) | | 2.14 | | | (.87 | ) | | 2.07 | | | (.80 | ) | | 37 | |
2007 | | | 18.81 | | | (.19 | ) | | | 2.25 | | | | 2.06 | | | | — | | | | — | | | | — | | | | 20.87 | | 10.95 | | | | 2,182 | | 4.15 | | | (3.17 | ) | | 2.15 | | | (1.18 | ) | | 1.91 | | | (.93 | ) | | 48 | |
2006(e) | | | 20.00 | | | (.05 | ) | | | (1.14 | ) | | | (1.19 | ) | | | — | | | | — | | | | — | | | | 18.81 | | (5.95 | ) | | | 235 | | 5.46 | * | | (4.19 | )* | | 2.14 | * | | (.87 | )* | | 2.05 | * | | (.78 | )* | | 6 | |
| Class I (3/06) (f) | | | | | | | | | | | | | | | | | | | | | | | | | | | | | | | | | | | | | | | | | | | | | | | | | | | | | | |
2008 | | | 21.14 | | | .01 | | | | (.91 | ) | | | (.90 | ) | | | — | | | | (.05 | ) | | | (.05 | ) | | | 20.19 | | (4.21 | ) | | | 21,083 | | 1.68 | | | (.56 | ) | | 1.14 | | | (.02 | ) | | 1.07 | | | .05 | | | 37 | |
2007 | | | 18.88 | | | .02 | | | | 2.26 | | | | 2.28 | | | | (.02 | ) | | | — | | | | (.02 | ) | | | 21.14 | | 12.06 | | | | 2,217 | | 3.79 | | | (2.81 | ) | | 1.13 | | | (.15 | ) | | .89 | | | .09 | | | 48 | |
2006(e) | | | 20.00 | | | .01 | | | | (1.13 | ) | | | (1.12 | ) | | | — | | | | — | | | | — | | | | 18.88 | | (5.60 | ) | | | 1,180 | | 4.46 | * | | (3.19 | )* | | 1.14 | * | | .13 | * | | 1.05 | * | | .22 | * | | 6 | |
| ** | Rounds to less than $.01 per share. |
| (a) | Per share Net Investment Income (Loss) is calculated using the average daily shares method. |
| (b) | Total return is the combination of changes in net asset value without any sales charge, reinvested dividend income at net asset value and reinvested capital gains distributions at net asset value, if any. Total returns are not annualized. |
| (c) | After expense reimbursement from the Adviser, where applicable. |
| (d) | After custodian fee credit and expense reimbursement, where applicable. |
| (e) | For the period ended March 28, 2006 (commencement of operations) through July 31, 2006. |
| (f) | Effective May 1, 2008, Class R Shares were renamed Class I Shares. |
See accompanying notes to financial statements.
41
Financial Highlights (continued)
Selected data for a share outstanding throughout each period:
| | | | | | | | | | | | | | | | | | | | | | | | | | | | | | | | | | | | | | | | | | | | | | | | | | | | | | | | | | | | | |
| Class (Commencement Date) | | | | | | | | | | | | | | | | | | | | | | | | | | | | | | | | | | | | | | | | | | | | | | | |
| | | | | Investment Operations | | | Less Distributions | | | | | | Ratios/Supplemental Data | |
SANTA BARBARA
GROWTH OPPORTUNITIES | | | | | | | | | | | | | | | | | | | | | | | | | | | | Ratios to Average
Net Assets
Before Credit/
Reimbursement | | | Ratios to Average
Net Assets
After
Reimbursement(c) | | | Ratios to Average
Net Assets
After Credit/
Reimbursement(d) | | | | |
Year
Ended
July 31, | | Beginning
Net
Asset
Value | | Net
Invest-
ment
Income
(Loss)(a) | | | Net
Realized/
Unrealized
Gain
(Loss) | | | Total | | | Net
Invest-
ment
Income | | | Capital
Gains | | | Tax
Return
of
Capital | | | Total | | | Ending
Net
Asset
Value | | Total
Return(b) | | | Ending
Net
Assets
(000) | | Expenses | | | Net
Invest-
ment
Income
(Loss) | | | Expenses | | | Net
Invest-
ment
Income
(Loss) | | | Expenses | | | Net
Invest-
ment
Income
(Loss) | | | Portfolio
Turnover
Rate | |
| Class A (3/06) | | | | | | | | | | | | | | | | | | | | | | | | | | | | | | | | | | | | | | | | | | | | | | | | | | | | | | | | | | |
2008 | | $ | 22.30 | | $ | — | ** | | $ | (2.78 | ) | | $ | (2.78 | ) | | $ | — | | | $ | (1.54 | ) | | $ | (.04 | ) | | $ | (1.58 | ) | | $ | 17.94 | | (13.07 | )% | | $ | 280 | | 6.11 | % | | (4.81 | )% | | 1.48 | % | | (.18 | )% | | 1.28 | % | | .02 | % | | 76 | % |
2007 | | | 19.00 | | | .08 | | | | 3.54 | | | | 3.62 | | | | — | | | | (.32 | ) | | | — | | | | (.32 | ) | | | 22.30 | | 19.20 | | | | 279 | | 6.34 | | | (4.69 | ) | | 1.48 | | | .17 | | | 1.30 | | | .36 | | | 71 | |
2006(e) | | | 20.00 | | | — | ** | | | (1.00 | ) | | | (1.00 | ) | | | — | | | | — | | | | — | | | | — | | | | 19.00 | | (5.00 | ) | | | 237 | | 6.29 | * | | (4.93 | )* | | 1.49 | * | | (.13 | )* | | 1.35 | * | | .01 | * | | 14 | |
| Class B (3/06) | | | | | | | | | | | | | | | | | | | | | | | | | | | | | | | | | | | | | | | | | | | | | | | | | | | | | | | | | | |
2008 | | | 22.08 | | | (.14 | ) | | | (2.75 | ) | | | (2.89 | ) | | | — | | | | (1.54 | ) | | | (.04 | ) | | | (1.58 | ) | | | 17.61 | | (13.72 | ) | | | 223 | | 6.75 | | | (5.44 | ) | | 2.24 | | | (.92 | ) | | 2.03 | | | (.71 | ) | | 76 | |
2007 | | | 18.95 | | | (.09 | ) | | | 3.54 | | | | 3.45 | | | | — | | | | (.32 | ) | | | — | | | | (.32 | ) | | | 22.08 | | 18.34 | | | | 276 | | 7.08 | | | (5.43 | ) | | 2.24 | | | (.59 | ) | | 2.05 | | | (.40 | ) | | 71 | |
2006(e) | | | 20.00 | | | (.05 | ) | | | (1.00 | ) | | | (1.05 | ) | | | — | | | | — | | | | — | | | | — | | | | 18.95 | | (5.25 | ) | | | 237 | | 7.04 | * | | (5.68 | )* | | 2.24 | * | | (.88 | )* | | 2.10 | * | | (.74 | )* | | 14 | |
| Class C (3/06) | | | | | | | | | | | | | | | | | | | | | | | | | | | | | | | | | | | | | | | | | | | | | | | | | | | | | | | | | | |
2008 | | | 22.08 | | | (.14 | ) | | | (2.76 | ) | | | (2.90 | ) | | | — | | | | (1.54 | ) | | | (.04 | ) | | | (1.58 | ) | | | 17.60 | | (13.77 | ) | | | 291 | | 6.92 | | | (5.61 | ) | | 2.24 | | | (.92 | ) | | 2.03 | | | (.72 | ) | | 76 | |
2007 | | | 18.95 | | | (.09 | ) | | | 3.54 | | | | 3.45 | | | | — | | | | (.32 | ) | | | — | | | | (.32 | ) | | | 22.08 | | 18.34 | | | | 276 | | 7.08 | | | (5.43 | ) | | 2.24 | | | (.59 | ) | | 2.05 | | | (.40 | ) | | 71 | |
2006(e) | | | 20.00 | | | (.05 | ) | | | (1.00 | ) | | | (1.05 | ) | | | — | | | | — | | | | — | | | | — | | | | 18.95 | | (5.25 | ) | | | 237 | | 7.04 | * | | (5.68 | )* | | 2.24 | * | | (.88 | )* | | 2.10 | * | | (.74 | )* | | 14 | |
| Class I (3/06) (f) | | | | | | | | | | | | | | | | | | | | | | | | | | | | | | | | | | | | | | | | | | | | | | | | | | | | | | | | | | |
2008 | | | 22.35 | | | .05 | | | | (2.80 | ) | | | (2.75 | ) | | | (.02 | ) | | | (1.54 | ) | | | (.04 | ) | | | (1.60 | ) | | | 18.00 | | (12.90 | ) | | | 487 | | 6.62 | | | (5.33 | ) | | 1.23 | | | .06 | | | 1.03 | | | .26 | | | 76 | |
2007 | | | 19.02 | | | .13 | | | | 3.55 | | | | 3.68 | | | | (.03 | ) | | | (.32 | ) | | | — | | | | (.35 | ) | | | 22.35 | | 19.50 | | | | 279 | | 6.09 | | | (4.44 | ) | | 1.23 | | | .42 | | | 1.04 | | | .61 | | | 71 | |
2006(e) | | | 20.00 | | | .02 | | | | (1.00 | ) | | | (.98 | ) | | | — | | | | — | | | | — | | | | — | | | | 19.02 | | (4.90 | ) | | | 238 | | 6.03 | * | | (4.67 | )* | | 1.24 | * | | .13 | * | | 1.10 | * | | .26 | * | | 14 | |
| ** | Rounds to less than $.01 per share. |
| (a) | Per share Net Investment Income (Loss) is calculated using the average daily shares method. |
| (b) | Total return is the combination of changes in net asset value without any sales charge, reinvested dividend income at net asset value and reinvested capital gains distributions at net asset value, if any. Total returns are not annualized. |
| (c) | After expense reimbursement from the Adviser, where applicable. |
| (d) | After custodian fee credit and expense reimbursement, where applicable. |
| (e) | For the period ended March 28, 2006 (commencement of operations) through July 31, 2006. |
| (f) | Effective May 1, 2008, Class R Shares were renamed Class I Shares. |
See accompanying notes to financial statements.
42
| | | | | | | | | | | | | | | | | | | | | | | | | | | | | | | | | | | | | | | | | | | | | | | | | | | | | | |
| Class (Commencement Date) | | | | | | | | | | | | | | | | | | | | | | | | | | | | | | | | | | | | | | | | | |
| | | | | Investment Operations | | | Less Distributions | | | | | | | Ratios/Supplemental Data | |
| RITTENHOUSE GROWTH | | | | | | | | | | | | | | | | | | | | | | Ratios to Average
Net Assets
Before Credit/
Reimbursement | | | Ratios to Average
Net Assets
After
Reimbursement(c) | | | Ratios to Average
Net Assets
After Credit/
Reimbursement(d) | | | | |
Year
Ended
July 31, | | Beginning
Net
Asset
Value | | Net
Invest-
ment
Income
(Loss)(a) | | | Net
Realized/
Unrealized
Gain
(Loss) | | | Total | | | Net
Invest-
ment
Income | | Capital
Gains | | Total | | Ending
Net
Asset
Value | | Total
Return(b) | | | Ending
Net
Assets
(000) | | Expenses | | | Net
Invest-
ment
Income
(Loss) | | | Expenses | | | Net
Invest-
ment
Income
(Loss) | | | Expenses | | | Net
Invest-
ment
Income
(Loss) | | | Portfolio
Turnover
Rate | |
| Class A (12/97) | | | | | | | | | | | | | | | | | | | | | | | | | | | | | | | | | | | | | | | | | | | | | | | | | | | |
2008 | | $ | 23.87 | | $ | .01 | | | $ | (1.70 | ) | | $ | (1.69 | ) | | $ | — | | $ | — | | $ | — | | $ | 22.18 | | (7.08 | )% | | $ | 43,708 | | 1.62 | % | | (.11 | )% | | 1.45 | % | | .05 | % | | 1.45 | % | | .05 | % | | 55 | % |
2007 | | | 20.59 | | | .03 | | | | 3.25 | | | | 3.28 | | | | — | | | — | | | — | | | 23.87 | | 15.93 | | | | 44,322 | | 1.50 | | | .06 | | | 1.45 | | | .11 | | | 1.45 | | | .11 | | | 37 | |
2006 | | | 20.92 | | | (.02 | ) | | | (.31 | ) | | | (.33 | ) | | | — | | | — | | | — | | | 20.59 | | (1.58 | ) | | | 37,129 | | 1.51 | | | (.07 | ) | | 1.51 | | | (.07 | ) | | 1.51 | | | (.07 | ) | | 73 | |
2005 | | | 19.43 | | | .06 | | | | 1.43 | | | | 1.49 | | | | — | | | — | | | — | | | 20.92 | | 7.67 | | | | 41,139 | | 1.48 | | | .32 | | | 1.48 | | | .32 | | | 1.48 | | | .32 | | | 25 | |
2004 | | | 18.53 | | | (.06 | ) | | | .96 | | | | .90 | | | | — | | | — | | | — | | | 19.43 | | 4.86 | | | | 53,804 | | 1.48 | | | (.33 | ) | | 1.43 | | | (.28 | ) | | 1.43 | | | (.28 | ) | | 19 | |
| Class B (12/97) | | | | | | | | | | | | | | | | | | | | | | | | | | | | | | | | | | | | | | | | | | | | | | | | | | | |
2008 | | | 22.21 | | | (.15 | ) | | | (1.58 | ) | | | (1.73 | ) | | | — | | | — | | | — | | | 20.48 | | (7.79 | ) | | | 10,440 | | 2.35 | | | (.83 | ) | | 2.20 | | | (.68 | ) | | 2.20 | | | (.68 | ) | | 55 | |
2007 | | | 19.32 | | | (.13 | ) | | | 3.02 | | | | 2.89 | | | | — | | | — | | | — | | | 22.21 | | 14.96 | | | | 21,002 | | 2.26 | | | (.65 | ) | | 2.20 | | | (.59 | ) | | 2.20 | | | (.59 | ) | | 37 | |
2006 | | | 19.77 | | | (.16 | ) | | | (.29 | ) | | | (.45 | ) | | | — | | | — | | | — | | | 19.32 | | (2.28 | ) | | | 41,445 | | 2.27 | | | (.82 | ) | | 2.27 | | | (.82 | ) | | 2.27 | | | (.82 | ) | | 73 | |
2005 | | | 18.50 | | | (.08 | ) | | | 1.35 | | | | 1.27 | | | | — | | | — | | | — | | | 19.77 | | 6.86 | | | | 80,600 | | 2.23 | | | (.43 | ) | | 2.23 | | | (.43 | ) | | 2.23 | | | (.43 | ) | | 25 | |
2004 | | | 17.78 | | | (.19 | ) | | | .91 | | | | .72 | | | | — | | | — | | | — | | | 18.50 | | 4.05 | | | | 114,954 | | 2.23 | | | (1.09 | ) | | 2.18 | | | (1.04 | ) | | 2.18 | | | (1.04 | ) | | 19 | |
| Class C (12/97) | | | | | | | | | | | | | | | | | | | | | | | | | | | | | | | | | | | | | | | | | | | | | | | | | | | |
2008 | | | 22.23 | | | (.15 | ) | | | (1.58 | ) | | | (1.73 | ) | | | — | | | — | | | — | | | 20.50 | | (7.78 | ) | | | 26,479 | | 2.36 | | | (.85 | ) | | 2.21 | | | (.69 | ) | | 2.21 | | | (.69 | ) | | 55 | |
2007 | | | 19.33 | | | (.13 | ) | | | 3.03 | | | | 2.90 | | | | — | | | — | | | — | | | 22.23 | | 15.00 | | | | 34,870 | | 2.26 | | | (.67 | ) | | 2.21 | | | (.62 | ) | | 2.21 | | | (.62 | ) | | 37 | |
2006 | | | 19.79 | | | (.16 | ) | | | (.30 | ) | | | (.46 | ) | | | — | | | — | | | — | | | 19.33 | | (2.32 | ) | | | 40,849 | | 2.27 | | | (.82 | ) | | 2.27 | | | (.82 | ) | | 2.27 | | | (.82 | ) | | 73 | |
2005 | | | 18.51 | | | (.08 | ) | | | 1.36 | | | | 1.28 | | | | — | | | — | | | — | | | 19.79 | | 6.92 | | | | 64,103 | | 2.23 | | | (.43 | ) | | 2.23 | | | (.43 | ) | | 2.23 | | | (.43 | ) | | 25 | |
2004 | | | 17.79 | | | (.19 | ) | | | .91 | | | | .72 | | | | — | | | — | | | — | | | 18.51 | | 4.05 | | | | 86,376 | | 2.23 | | | (1.09 | ) | | 2.18 | | | (1.04 | ) | | 2.18 | | | (1.04 | ) | | 19 | |
| Class I (12/97) (e) | | | | | | | | | | | | | | | | | | | | | | | | | | | | | | | | | | | | | | | | | | | | | | | | | | | |
2008 | | | 24.44 | | | .07 | | | | (1.75 | ) | | | (1.68 | ) | | | — | | | — | | | — | | | 22.76 | | (6.87 | ) | | | 11,568 | | 1.36 | | | .15 | | | 1.20 | | | .31 | | | 1.20 | | | .31 | | | 55 | |
2007 | | | 21.04 | | | .09 | | | | 3.31 | | | | 3.40 | | | | — | | | — | | | — | | | 24.44 | | 16.16 | | | | 14,823 | | 1.25 | | | .32 | | | 1.20 | | | .37 | | | 1.20 | | | .37 | | | 37 | |
2006 | | | 21.32 | | | .04 | | | | (.32 | ) | | | (.28 | ) | | | — | | | — | | | — | | | 21.04 | | (1.31 | ) | | | 13,052 | | 1.26 | | | .18 | | | 1.26 | | | .18 | | | 1.26 | | | .18 | | | 73 | |
2005 | | | 19.75 | | | .11 | | | | 1.46 | | | | 1.57 | | | | — | | | — | | | — | | | 21.32 | | 7.95 | | | | 16,082 | | 1.22 | | | .55 | | | 1.22 | | | .55 | | | 1.22 | | | .55 | | | 25 | |
2004 | | | 18.79 | | | — | * | | | .96 | | | | .96 | | | | — | | | — | | | — | | | 19.75 | | 5.11 | | | | 16,052 | | 1.23 | | | (.07 | ) | | 1.17 | | | (.02 | ) | | 1.17 | | | (.02 | ) | | 19 | |
| * | Rounds to less than $.01 per share. |
| (a) | Per share Net Investment Income (Loss) is calculated using the average daily shares method. |
| (b) | Total return is the combination of changes in net asset value without any sales charge, reinvested dividend income at net asset value and reinvested capital gains distributions at net asset value, if any. Total returns are not annualized. |
| (c) | After expense reimbursement from the Adviser, where applicable. |
| (d) | After custodian fee credit and expense reimbursement, where applicable. |
| (e) | Effective May 1, 2008, Class R Shares were renamed Class I Shares. |
See accompanying notes to financial statements.
43
Report of Independent Registered Public Accounting Firm
To the Board of Trustees and Shareholders of
Nuveen Investment Trust II:
In our opinion, the accompanying statements of assets and liabilities, including the portfolios of investments, and the related statements of operations and of changes in net assets and the financial highlights present fairly, in all material respects, the financial position of Nuveen Santa Barbara Dividend Growth Fund, Nuveen Santa Barbara Growth Fund, Nuveen Santa Barbara Growth Opportunities Fund and Nuveen Rittenhouse Growth Fund (each a series of the Nuveen Investment Trust II, hereafter referred to as the “Funds”) at July 31, 2008, the results of each of their operations for the year then ended, the changes in each of their net assets for each of the two years in the period then ended and the financial highlights for each of the periods indicated, in conformity with accounting principles generally accepted in the United States of America. These financial statements and financial highlights (hereafter referred to as “financial statements”) are the responsibility of the Funds’ management; our responsibility is to express an opinion on these financial statements based on our audits. We conducted our audits of these financial statements in accordance with the standards of the Public Company Accounting Oversight Board (United States). Those standards require that we plan and perform the audit to obtain reasonable assurance about whether the financial statements are free of material misstatement. An audit includes examining, on a test basis, evidence supporting the amounts and disclosures in the financial statements, assessing the accounting principles used and significant estimates made by management, and evaluating the overall financial statement presentation. We believe that our audits, which included confirmation of securities at July 31, 2008 by correspondence with the custodian and brokers, provide a reasonable basis for our opinion.
PRICEWATERHOUSECOOPERS LLP
Chicago, IL
September 22, 2008
44
Annual Investment Management Agreement Approval Process
The Investment Company Act of 1940, as amended (the “1940 Act”), provides, in substance, that each investment advisory agreement between a fund and its investment adviser (including sub-advisers) will continue in effect from year to year only if its continuance is approved at least annually by the fund’s board members, including by a vote of a majority of the board members who are not parties to the advisory agreement or “interested persons” of any parties (the “Independent Board Members”), cast in person at a meeting called for the purpose of considering such approval. In connection with such approvals, the fund’s board members must request and evaluate, and the investment adviser is required to furnish, such information as may be reasonably necessary to evaluate the terms of the advisory agreement. Accordingly, at a meeting held on May 28-29, 2008 (the “May Meeting”), the Boards of Trustees (each, a “Board” and each Trustee, a “Board Member”) of the Funds, including a majority of the Independent Board Members, considered and approved the continuation of the advisory and sub-advisory agreements of the Funds for an additional one-year period. These agreements include the investment advisory agreements between Nuveen Asset Management (“NAM”) and each of the Funds; the sub-advisory agreement between NAM and Santa Barbara Asset Management (“Santa Barbara”) on behalf of each of the following funds: the Nuveen Santa Barbara Growth Fund; the Nuveen Santa Barbara Dividend Growth Fund; and the Nuveen Santa Barbara Growth Opportunities Fund; and the sub-advisory agreement between NAM and Rittenhouse Asset Management, Inc. (“Rittenhouse”) on behalf of the Nuveen Rittenhouse Growth Fund. In preparation for their considerations at the May Meeting, the Board also held a separate meeting on April 23, 2008 (the “April Meeting”). Accordingly, the factors considered and determinations made regarding the renewals by the Independent Board Members include those made at the April Meeting.
In addition, in evaluating the applicable advisory agreements (each an “Investment Management Agreement”) and sub-advisory agreements (each a “Sub-Advisory Agreement,” and each Investment Management Agreement and Sub-Advisory Agreement, an “Advisory Agreement”), as described in further detail below, the Independent Board Members reviewed a broad range of information relating to the Funds, NAM, Santa Barbara and Rittenhouse (Santa Barbara and Rittenhouse are each a “Sub-Adviser” and NAM and the Sub-Advisers are each a “Fund Adviser”), including absolute performance, fee and expense information for the Funds as well as comparative performance, fee and expense information for a comparable peer group of funds, the performance information of recognized and/or customized benchmarks (as applicable), the profitability of Nuveen for its advisory activities (which includes its wholly owned subsidiaries), and other information regarding the organization, personnel, and services provided by the respective Fund Adviser. The Independent Board Members also met quarterly as well as at other times as the need arose during the year and took into account the information provided at such meetings and the knowledge gained therefrom. Prior to approving the renewal of the Advisory Agreements, the Independent Board Members reviewed the foregoing information with their independent legal counsel and with management, reviewed materials from independent legal counsel describing applicable law and their duties in reviewing advisory contracts, and met with independent legal counsel in private sessions without management present. The Independent Board Members considered the legal advice provided by independent legal counsel and relied upon their knowledge of the Fund Adviser, its services and the Funds resulting from their meetings and other interactions throughout the year and their own business judgment in determining the factors to be considered in evaluating the Advisory Agreements. Each Board Member may have accorded different weight to the various factors in reaching his or her conclusions with respect to a Fund’s Advisory Agreements. The Independent Board Members did not identify any single factor as all-important or controlling. The Independent Board Members’ considerations were instead based on a comprehensive consideration of all the information presented. The principal factors considered by the Board and its conclusions are described below.
A. Nature, Extent and Quality of Services
In considering the renewal of the Investment Management Agreements, the Independent Board Members considered the nature, extent and quality of the Fund Adviser’s services, including advisory services and administrative services. The Independent Board Members reviewed materials outlining, among other things, NAM’s organization and business; the types of services that NAM or its affiliates provide and are expected to provide to the Funds; the performance record of the applicable Fund (as described in further detail below); and any initiatives Nuveen had taken for the applicable fund product line. With respect to personnel, the Independent Board Members evaluated the background, experience and track record of the Fund Adviser’s investment personnel. In this regard, the Independent Board Members considered the additional investment in personnel to support Nuveen fund advisory activities, including in operations, product management and marketing as well as related fund support functions, including sales, executive, finance, human resources and information technology. The Independent Board Members also reviewed information regarding portfolio manager compensation arrangements to evaluate NAM’s ability to attract and retain high quality investment personnel.
In evaluating the services of NAM, the Independent Board Members also considered NAM’s oversight of the performance, business activities and compliance of the Sub-Advisers, the ability to supervise the Funds’ other service providers and given the importance of compliance, NAM’s compliance program. Among other things, the Independent Board Members considered the report of the chief compliance officer regarding the Funds’ compliance policies and procedures.
In addition to advisory services, the Independent Board Members considered the quality of administrative services provided by NAM and its affiliates including product management, fund administration, oversight of service providers, shareholder services, administration of Board relations, regulatory and portfolio compliance and legal support.
In considering the renewal of the Sub-Advisory Agreements, the Independent Board Members reviewed an evaluation of each Sub-Adviser from NAM, including information as to the process followed by NAM in evaluating sub-advisers. The evaluation also included information relating to each Sub-Adviser’s organization, operations, personnel, assets under management, investment
45
Annual Investment Management Agreement Approval Process (continued)
philosophy, strategies and techniques in managing the Funds, developments affecting each Sub-Adviser, and an analysis of each Sub-Adviser. As described in further detail below, the Board considered the performance of the Fund sub-advised by the respective Sub-Adviser. The Board also recognized that the Sub-Advisory Agreements were essentially agreements for portfolio management services only and the respective Sub-Adviser was not expected to supply other significant administrative services to the Funds. During the last year, the Independent Board Members noted that they visited several sub-advisers to the Nuveen funds, meeting their key investment and business personnel. In this regard, during 2007, the Independent Board Members visited Santa Barbara. The Independent Board Members also noted that they anticipate visiting each sub-adviser to the Nuveen funds at least once over the course of a multiple-year rotation. The Independent Board Members further noted that NAM recommended the renewal of the applicable Sub-Advisory Agreements and considered the basis for such recommendations and any qualifications in connection therewith.
Based on their review, the Independent Board Members found that, overall, the nature, extent and quality of services provided (and expected to be provided) to the respective Funds under the Investment Management Agreement or Sub-Advisory Agreement, as applicable, were satisfactory.
B. The Investment Performance of the Funds and Fund Advisers
The Board considered the investment performance of each Fund, including the Fund’s historic performance as well as its performance compared to funds with similar investment objectives (the “Performance Peer Group”) based on data provided by an independent third party (as described below). In addition, the Independent Board Members reviewed the respective Fund’s historic performance compared to recognized and/or customized benchmarks (as applicable).
In evaluating the performance information, the Board considered whether the Fund has operated within its investment objectives and parameters and the impact that the investment mandates may have had on performance. In addition, in comparing a Fund’s performance with that of its Performance Peer Group, the Independent Board Members took into account that the closest Performance Peer Group in certain instances may not adequately reflect the respective fund’s investment objectives and strategies thereby hindering a meaningful comparison of the fund’s performance with that of the Performance Peer Group. These Performance Peer Groups include those for the Nuveen Santa Barbara Growth Fund and the Nuveen Santa Barbara Growth Opportunities Fund.
The Independent Board Members reviewed performance information including, among other things, total return information compared with the Fund’s Performance Peer Group as well as recognized and/or customized benchmarks (as appropriate) for the one-, three- and five-year periods (as applicable) ending December 31, 2007 and with the Fund’s Performance Peer Group for the quarter, one-, three-, and five- year periods ending March 31, 2008 (as applicable). This information supplemented the Fund performance information provided to the Board at each of its quarterly meetings. Based on their review, the Independent Board Members determined that the respective Fund’s investment performance over time had been satisfactory.
C. Fees, Expenses and Profitability
1. Fees and Expenses
The Board evaluated the management fees and expenses of each Fund reviewing, among other things, such Fund’s gross management fees (which take into account breakpoints), net management fees (which take into account fee waivers or reimbursements) and total expense ratios (before and after expense reimbursements and/or waivers) in absolute terms as well as compared to the gross management fees, net management fees (after waivers and/or reimbursements) and total expense ratios (before and after waivers) of a comparable universe of unaffiliated funds based on data provided by an independent data provider (the “Peer Universe”) and/or a more focused subset of funds therein (the “Peer Group”). The Independent Board Members further reviewed data regarding the construction of Peer Groups as well as the methods of measurement for the fee and expense analysis and the performance analysis. In reviewing the comparisons of fee and expense information, the Independent Board Members took into account that in certain instances various factors such as the size of the Fund relative to peers, the size and particular composition of the Peer Group, the investment objectives of the peers, expense anomalies, and the timing of information used may impact the comparative data, thereby limiting the ability to make a meaningful comparison. In reviewing the fee schedule for a Fund, the Independent Board Members also considered the fund-level and complex-wide breakpoint schedules (described in further detail below) and any fee waivers and reimbursements provided by Nuveen. Based on their review of the fee and expense information provided, the Independent Board Members determined that each Fund’s management fees and net total expense ratio were reasonable in light of the nature, extent and quality of services provided to the Fund.
2. Comparisons with the Fees of Other Clients
The Independent Board Members further reviewed information regarding the nature of services and fee rates offered by NAM to other clients. Such clients include separately managed accounts (both retail and institutional accounts) and funds that are not offered by Nuveen but are sub-advised by one of Nuveen’s investment management teams. In evaluating the comparisons of fees, the Independent Board Members noted that the fee rates charged to the Funds and other clients vary, among other things, because of the different services involved and the additional regulatory and compliance requirements associated with registered investment companies, such as the Funds. Accordingly, the Independent Board Members considered the differences in the product types, including, but not limited to, the services provided, the structure and operations, product distribution and costs thereof, portfolio investment policies, investor profiles, account sizes and regulatory requirements. The Independent Board Members noted, in particular, that the range of services provided to the Funds (as discussed above) is much more extensive than
46
that provided to separately managed accounts. Given the inherent differences in the products, particularly the extensive services provided to the Funds, the Independent Board Members believe such facts justify the different levels of fees.
In considering the fees of a Sub-Adviser, the Independent Board Members also considered the pricing schedule or fees that the Sub-Adviser charges for similar investment management services for other fund sponsors or clients (such as retail and/or institutional managed accounts) as applicable.
3. Profitability of Fund Advisers
In conjunction with its review of fees, the Independent Board Members also considered the profitability of Nuveen for its advisory activities (which incorporated Nuveen’s wholly-owned affiliated sub-advisers) and its financial condition. The Independent Board Members reviewed the revenues and expenses of Nuveen’s advisory activities for the last two years and the allocation methodology used in preparing the profitability data. The Independent Board Members noted this information supplemented the profitability information requested and received during the year to help keep them apprised of developments affecting profitability (such as changes in fee waivers and expense reimbursement commitments). In this regard, the Independent Board Members noted that they had also appointed an Independent Board Member as a point person to review and keep them apprised of changes to the profitability analysis and/or methodologies during the year. The Independent Board Members considered Nuveen’s profitability compared with other fund sponsors prepared by two independent third party service providers as well as comparisons of the revenues, expenses and profit margins of various unaffiliated management firms with similar amounts of assets under management prepared by Nuveen.
In reviewing profitability, the Independent Board Members recognized the subjective nature of determining profitability which may be affected by numerous factors including the allocation of expenses. Further, the Independent Board Members recognized the difficulties in making comparisons as the profitability of other advisers generally is not publicly available and the profitability information that is available for certain advisers or management firms may not be representative of the industry and may be affected by, among other things, the adviser’s particular business mix, capital costs, types of funds managed and expense allocations.
Notwithstanding the foregoing, the Independent Board Members reviewed Nuveen’s methodology and assumptions for allocating expenses across product lines to determine profitability. In reviewing profitability, the Independent Board Members recognized Nuveen’s investment in its fund business.
Based on its review, the Independent Board Members concluded that Nuveen’s level of profitability for its advisory activities was reasonable in light of the services provided.
In evaluating the reasonableness of the compensation, the Independent Board Members also considered other amounts paid to a Fund Adviser by the Funds as well as any indirect benefits (such as soft dollar arrangements, if any) the Fund Adviser and its affiliates receive, or are expected to receive, that are directly attributable to the management of the Funds, if any. See Section E below for additional information on indirect benefits the Fund Adviser may receive as a result of its relationship with the Funds. Based on their review of the overall fee arrangements of each Fund, the Independent Board Members determined that the advisory fees and expenses of the respective Fund were reasonable.
D. Economies of Scale and Whether Fee Levels Reflect these Economies of Scale
With respect to economies of scale, the Independent Board Members recognized the potential benefits resulting from the costs of a fund being spread over a larger asset base. The Independent Board Members therefore considered whether the Funds have appropriately benefited from any economies of scale and whether there is potential realization of any further economies of scale. In considering economies of scale, the Independent Board Members have recognized that economies of scale are difficult to measure and predict with precision, particularly on a fund-by-fund basis. Notwithstanding the foregoing, one method to help ensure the shareholders share in these benefits is to include breakpoints in the advisory fee schedule. Accordingly, the Independent Board Members reviewed and considered the fund-level breakpoints in the advisory fee schedules that reduce advisory fees.
In addition to fund-level advisory fee breakpoints, the Board also considered the Funds’ complex-wide fee arrangement. Pursuant to the complex-wide fee arrangement, the fees of the funds in the Nuveen complex, including the Funds, are reduced as the assets in the fund complex reach certain levels. In evaluating the complex-wide fee arrangement, the Independent Board Members recognized that the complex-wide fee schedule was recently revised in 2007 to provide for additional fee savings to shareholders and considered the amended schedule. The Independent Board Members further considered that the complex-wide fee arrangement seeks to provide the benefits of economies of scale to fund shareholders when total fund complex assets increase, even if assets of a particular fund are unchanged or have decreased. The approach reflects the notion that some of Nuveen’s costs are attributable to services provided to all its funds in the complex and therefore all funds benefit if these costs are spread over a larger asset base. Based on their review, the Independent Board Members concluded that the breakpoint schedule and complex-wide fee arrangement were acceptable and desirable in providing benefits from economies of scale to shareholders.
E. Indirect Benefits
In evaluating fees, the Independent Board Members received and considered information regarding potential “fall out” or ancillary benefits the respective Fund Adviser or its affiliates may receive as a result of its relationship with each Fund. In this regard, the
47
Annual Investment Management Agreement Approval Process (continued)
Independent Board Members considered, among other things, any sales charges, distribution fees and shareholder services fees received and retained by the Funds’ principal underwriter, an affiliate of NAM, which includes fees received pursuant to any 12b-1 plan. The Independent Board Members, therefore, considered the 12b-1 fees retained by Nuveen during the last calendar year.
In addition to the above, the Independent Board Members considered whether the Fund Adviser received any benefits from soft dollar arrangements whereby a portion of the commissions paid by a Fund for brokerage may be used to acquire research that may be useful to the Fund Adviser in managing the assets of the Funds and other clients. With respect to NAM, the Independent Board Members noted that NAM does not currently have any soft dollar arrangements; however, to the extent certain bona fide agency transactions that occur on markets that traditionally trade on a principal basis and riskless principal transactions are considered as generating “commissions,” NAM intends to comply with the applicable safe harbor provisions.
In addition, the Independent Board Members considered that the Sub-Advisers may benefit from their soft dollar arrangements pursuant to which the respective Sub-Adviser receives research from brokers that execute the applicable Fund’s portfolio transactions. The Independent Board Members noted that the Sub-Advisers’ profitability may be lower if they were required to pay for this research with hard dollars.
Based on their review, the Independent Board Members concluded that any indirect benefits received by a Fund Adviser as a result of its relationship with the Funds were reasonable and within acceptable parameters.
F. Other Considerations
The Independent Board Members did not identify any single factor discussed previously as all-important or controlling. The Board Members, including the Independent Board Members, unanimously concluded that the terms of the Investment Management Agreements and Sub-Advisory Agreements are fair and reasonable, that the respective Fund Adviser’s fees are reasonable in light of the services provided to each Fund and that the Investment Management Agreements and the Sub-Advisory Agreements be renewed.
48
Notes
49
Notes
50
Notes
51
Trustees and Officers
The management of the Funds, including general supervision of the duties performed for the Funds by the Adviser, is the responsibility of the Board of Trustees of the Funds. The number of trustees of the Funds is currently set at nine. None of the trustees who are not “interested” persons of the Funds (referred to herein as “independent trustees”) has ever been a director or employee of, or consultant to, Nuveen or its affiliates. The names and business addresses of the trustees and officers of the Funds, their principal occupations and other affiliations during the past five years, the number of portfolios each oversees and other directorships they hold are set forth below.
The Funds’ Statement of Additional Information (“SAI”) includes more information about the trustees. To request a free copy, call Nuveen Investments at (800) 257-8787 or visit the Funds’ website at www.nuveen.com.
| | | | | | | | |
Name, Birthdate and Address | | Position(s) Held with the Funds | | Year First Elected or Appointed (1) | | Principal Occupation(s) Including other Directorships During Past 5 Years | | Number of Portfolios in Fund Complex Overseen by Trustee |
| | |
| Independent Trustees: | | | | |
| | | | |
| | | | | | | | | |
Robert P. Bremner 8/22/40 333 W. Wacker Drive Chicago, IL 60606 | | Chairman of the Board and Trustee | | 1997 | | Private Investor and Management Consultant. | | 186 |
| | | | |
| | | | | | | | | |
Jack B. Evans 10/22/48 333 W. Wacker Drive Chicago, IL 60606 | | Trustee | | 1999 | | President, The Hall-Perrine Foundation, a private philanthropic corporation (since 1996); Director and Vice Chairman, United Fire Group, a publicly held company; Member of the Board of Regents for the State of Iowa University System; Director, Gazette Companies; Life Trustee of Coe College and Iowa College Foundation; Member of the Advisory Council of the Department of Finance in the Tippie College of Business, University of lowa; formerly, Director, Alliant Energy; formerly, Director, Federal Reserve Bank of Chicago; formerly, President and Chief Operating Officer, SCI Financial Group, Inc., a regional financial services firm. | | 186 |
| | | | |
| | | | | | | | | |
William C. Hunter 3/6/48 333 W. Wacker Drive Chicago, IL 60606 | | Trustee | | 2004 | | Dean, Tippie College of Business, University of Iowa (since July 2006); formerly, Dean and Distinguished Professor of Finance, School of Business at the University of Connecticut (2003-2006); previously, Senior Vice President and Director of Research at the Federal Reserve Bank of Chicago (1995-2003); Director (since 1997), Credit Research Center at George Washington University; Director (since 2004) of Xerox Corporation; Director (since 2005), Beta Gamma Sigma International Honor Society; Director, SS&C Technologies, Inc. (May 2005-October 2005). | | 186 |
| | | | |
| | | | | | | | | |
David J. Kundert 10/28/42 333 W. Wacker Drive Chicago, IL 60606 | | Trustee | | 2005 | | Director, Northwestern Mutual Wealth Management Company; Retired (since 2004) as Chairman, JPMorgan Fleming Asset Management, President and CEO, Banc One Investment Advisors Corporation, and President, One Group Mutual Funds; prior thereto, Executive Vice President, Banc One Corporation and Chairman and CEO, Banc One Investment Management Group; Member, Board of Regents, Luther College; member of the Wisconsin Bar Association; member of Board of Directors, Friends of Boerner Botanical Gardens; member of Investment Committee, Greater Milwaukee Foundation. | | 186 |
| | | | |
| | | | | | | | | |
William J. Schneider 9/24/44 333 W. Wacker Drive Chicago, IL 60606 | | Trustee | | 1997 | | Chairman, formerly, Senior Partner and Chief Operating Officer (retired, 2004) of Miller-Valentine Partners Ltd., a real estate investment company; Director, Dayton Development Coalition; formerly, Member, Business Advisory Council, Cleveland Federal Reserve Bank. | | 186 |
| | | | |
| | | | | | | | | |
Judith M. Stockdale 12/29/47 333 W. Wacker Drive Chicago, IL 60606 | | Trustee | | 1997 | | Executive Director, Gaylord and Dorothy Donnelley Foundation (since 1994); prior thereto, Executive Director, Great Lakes Protection Fund (from 1990 to 1994). | | 186 |
52
| | | | | | | | |
Name, Birthdate and Address | | Position(s) Held with the Funds | | Year First Elected or Appointed (1) | | Principal Occupation(s) Including other Directorships During Past 5 Years | | Number of Portfolios in Fund Complex Overseen by Trustee |
Carole E. Stone 6/28/47 333 W. Wacker Drive Chicago, IL 60606 | | Trustee | | 2007 | | Director, Chicago Board Options Exchange (since 2006); Commissioner, New York State Commission on Public Authority Reform (since 2005); formerly, Chair New York Racing Association Oversight Board (2005-2007); formerly, Director, New York State Division of the Budget (2000-2004), Chair, Public Authorities Control Board (2000-2004) and Director, Local Government Assistance Corporation (2000-2004). | | 186 |
| | | | |
| | | | | | | | | |
Terence J. Toth (2) 9/29/59 333 W. Wacker Drive Chicago, IL 60606 | | Trustee | | 2008 | | Private Investor (since 2007); CEO and President, Northern Trust Investments (2004-2007); Executive Vice President, Quantitative Management & Securities Lending (2000-2004); prior thereto, various positions with Northern Trust Company (since 1994); Member: Goodman Theatre Board (since 2004); Chicago Fellowship Board (since 2005), University of Illinois Leadership Council Board (since 2007) and Catalyst Schools of Chicago Board (since 2008); formerly Member: Northern Trust Mutual Funds Board (2005-2007), Northern Trust Japan Board (2004-2007), Northern Trust Securities Inc. Board (2003-2007) and Northern Trust Hong Kong Board (1997-2004). | | 186 |
| | |
| Interested Trustee: | | | | |
| | | | |
| | | | | | | | | |
John P. Amboian (2)(3) 6/14/61 333 W. Wacker Drive Chicago, IL 60606 | | Trustee | | 2008 | | Chief Executive Officer (since July 2007) and Director (since 1999) of Nuveen Investments, Inc.; Chief Executive Officer (since 2007) of Nuveen Asset Management, Rittenhouse Asset Management, Nuveen Investments Advisors, Inc. formerly, President (1999-2004) of Nuveen Advisory Corp. and Nuveen Institutional Advisory Corp.(5) | | 186 |
| | | | |
| | | | | | | | | |
Name, Birthdate and Address | | Position(s) Held with the Funds | | Year First Elected or Appointed (4) | | Principal Occupation(s) During Past 5 Years | | Number of Portfolios in Fund Complex Overseen by Officer |
| | |
| Officers of the Funds: | | | | |
| | | | |
| | | | | | | | | |
Gifford R. Zimmerman 9/9/56 333 W. Wacker Drive Chicago, IL 60606 | | Chief Administrative Officer | | 1988 | | Managing Director (since 2002), Assistant Secretary and Associate General Counsel, formerly, Vice President and Assistant General Counsel, of Nuveen Investments, LLC; Managing Director (since 2002), Associate General Counsel and Assistant Secretary, of Nuveen Asset Management; Vice President and Assistant Secretary of NWQ Investment Management Company, LLC. (since 2002), Nuveen Investments Advisers Inc. (since 2002), Symphony Asset Management LLC, and NWQ Investment Management Company, LLC (since 2003), Tradewinds Global Investors, LLC, and Santa Barbara Asset Management, LLC (since 2006), Nuveen HydePark Group LLC and Richards & Tierney, Inc. (since 2007); Managing Director, Associate General Counsel and Assistant Secretary of Rittenhouse Asset Management, Inc. (since 2003); Managing Director (since 2004) and Assistant Secretary (since 1994) of Nuveen Investments, Inc.; formerly, Managing Director (2002-2004), General Counsel (1998-2004) and Assistant Secretary of Nuveen Advisory Corp. and Nuveen Institutional Advisory Corp. (5); Chartered Financial Analyst. | | 186 |
| | | | |
| | | | | | | | | |
Michael T. Atkinson 2/3/66 333 W. Wacker Drive Chicago, IL 60606 | | Vice President and Assistant Secretary | | 2000 | | Vice President (since 2002) of Nuveen Investments, LLC. | | 186 |
| | | | |
| | | | | | | | | |
Alan A. Brown 8/1/62 333 W. Wacker Drive Chicago, IL 60606 | | Vice President | | 2007 | | Executive Vice President, Mutual Funds, Nuveen Investments, LLC, (since 2005), previously, Managing Director and Chief Marketing Officer (2001-2005). | | 66 |
53
Trustees and Officers (continued)
| | | | | | | | |
Name, Birthdate and Address | | Position(s) Held with the Funds | | Year First Elected or Appointed (4) | | Principal Occupation(s) Including other Directorships During Past 5 Years | | Number of Portfolios in Fund Complex Overseen by Officer |
Lorna C. Ferguson 10/24/45 333 W. Wacker Drive Chicago, IL 60606 | | Vice President | | 1998 | | Managing Director (since 2004), formerly, Vice President of Nuveen Investments, LLC, Managing Director (2004) formerly, Vice President (1998-2004) of Nuveen Advisory Corp. and Nuveen Institutional Advisory Corp. (5); Managing Director (since 2005) of Nuveen Asset Management. | | 186 |
| | | | |
| | | | | | | | | |
Stephen D. Foy 5/31/54 333 W. Wacker Drive Chicago, IL 60606 | | Vice President and Controller | | 1998 | | Vice President (since 1993) and Funds Controller (since 1998) of Nuveen Investments, LLC; Vice President (since 2005) of Nuveen Asset Management; formerly, Vice President and Funds Controller (1998-2004) of Nuveen Investments, Inc.; Certified Public Accountant. | | 186 |
| | | | |
| | | | | | | | | |
Walter M. Kelly 2/24/70 333 W. Wacker Drive Chicago, IL 60606 | | Chief Compliance Officer and Vice President | | 2003 | | Senior Vice President (since 2008), Vice President (2006- 2008) formerly, Assistant Vice President and Assistant General Counsel (2003-2006) of Nuveen Investments, LLC; Vice President (since 2006) and Assistant Secretary (since 2003) of Nuveen Asset Management. | | 186 |
| | | | |
| | | | | | | | | |
David J. Lamb 3/22/63 333 W. Wacker Drive Chicago, IL 60606 | | Vice President | | 2000 | | Vice President (since 2000) of Nuveen Investments, LLC; Certified Public Accountant. | | 186 |
| | | | |
| | | | | | | | | |
Tina M. Lazar 8/27/61 333 W. Wacker Drive Chicago, IL 60606 | | Vice President | | 2002 | | Vice President of Nuveen Investments, LLC (since 1999). | | 186 |
| | | | |
| | | | | | | | | |
Larry W. Martin 7/27/51 333 W. Wacker Drive Chicago, IL 60606 | | Vice President and Assistant Secretary | | 1988 | | Vice President, Assistant Secretary and Assistant General Counsel of Nuveen Investments, LLC; formerly, Vice President and Assistant Secretary of Nuveen Advisory Corp. and Nuveen Institutional Advisory Corp. (4); Vice President (since 2005) and Assistant Secretary of Nuveen Investments, Inc.; Vice President (since 2005) and Assistant Secretary (since 1997) of Nuveen Asset Management; Vice President (since 2000), Assistant Secretary and Assistant General Counsel (since 1998) of Rittenhouse Asset Management, Inc.; Vice President and Assistant Secretary of Nuveen Investments Advisers Inc. (since 2002), NWQ Investment Management Company, LLC (since 2002), Symphony Asset Management LLC (since 2003), Tradewinds NWQ Global Investors, LLC, Santa Barbara Asset Management, LLC (since 2006) and of Nuveen HydePark Group, LLC and Richards & Tierney, Inc. (since 2007); formerly, Vice President and Assistant Secretary of Nuveen Advisory Corp. and Nuveen Institutional Advisory Corp. (5) | | 186 |
| | | | |
| | | | | | | | | |
Kevin J. McCarthy 3/26/66 333 W. Wacker Drive Chicago, IL 60606 | | Vice President and Secretary | | 2007 | | Managing Director (since 2008), formerly, Vice President (2007-2008), Nuveen Investments, LLC; Managing Director (since 2008) Vice President and Assistant Secretary (since 2007), Nuveen Asset Management, Rittenhouse Asset Management, Inc., Nuveen Investment Advisers Inc., Nuveen Investment Institutional Services Group LLC, NWQ Investment Management Company, LLC, Tradewinds Global Investors LLC, NWQ Holdings, LLC, Symphony Asset Management LLC, Santa Barbara Asset Management LLC, Nuveen HydePark Group, LLC and Richards & Tierney, Inc, (since 2007); Managing Director (since 2008), Vice President (2007-2008) and Assistant General Counsel, Nuveen Investments, Inc., prior thereto, Partner, Bell, Boyd & Lloyd LLP (1997-2007). | | 186 |
54
| | | | | | | | |
Name, Birthdate and Address | | Position(s) Held with the Funds | | Year First Elected or Appointed (4) | | Principal Occupation(s) Including other Directorships During Past 5 Years | | Number of Portfolios in Fund Complex Overseen by Officer |
John V. Miller 4/10/67 333 W. Wacker Drive Chicago, IL 60606 | | Vice President | | 2007 | | Managing Director (since 2007), formerly, Vice President (2002-2007) of Nuveen Investments, LLC; Chartered Financial Analyst. | | 186 |
| | | | |
| | | | | | | | | |
Christopher M. Rohrbacher 8/1/71 333 W. Wacker Drive Chicago, IL 60606 | | Vice President and Assistant Secretary | | 2008 | | Vice President, Nuveen Investments, LLC (since 2008); Vice President and Assistant Secretary, Nuveen Asset Management (since 2008); Vice President and Assistant General Counsel, Nuveen Investments, Inc. (since 2008); prior thereto, Associate, Skadden, Arps, Slate Meagher & Flom LLP (2002-2008) | | 186 |
| | | | |
| | | | | | | | | |
James F. Ruane 7/3/62 333 W. Wacker Drive Chicago, IL 60606 | | Vice President and Assistant Secretary | | 2007 | | Vice President, Nuveen Investments (since 2007); prior thereto, Partner, Deloitte & Touche USA LLP (since 2005), formerly, senior tax manager (since 2002); Certified Public Accountant. | | 186 |
| | | | |
| | | | | | | | | |
John S. White 5/12/67 333 W. Wacker Drive Chicago, IL 60606 | | Vice President | | 2007 | | Vice President (since 2006) of Nuveen Investments, LLC, formerly, Assistant Vice President (since 2002); Lieutenant Colonel (since 2007), United States Marine Corps Reserve, formerly, Major (since 2001). | | 66 |
| | | | |
| | | | | | | | | |
Mark L. Winget 12/21/68 333 W. Wacker Drive Chicago, IL 60606 | | Vice President and Assistant Secretary | | 2008 | | Vice President, Nuveen Investments, LLC (since 2008); Vice President and Assistant Secretary, Nuveen Asset Management (since 2008); Vice President and Assistant General Counsel, Nuveen Investments Inc. (since 2008); prior thereto, Counsel, VedderPrice P.C. (1997-2007). | | 186 |
| (1) | Trustees serve an indefinite term until his/her successor is elected or appointed. The year first elected or appointed represents the year in which the trustee was first elected or appointed to any fund in the Nuveen Fund Complex. |
| (2) | Mr. Amboian and Mr. Toth were appointed to the Board of Trustees of certain Nuveen Funds, effective July 1, 2008. Mr. Amboian and Mr. Toth were subsequently elected to the Board of Trustees of the remainder of the funds in the Nuveen Fund Complex on July 28, 2008. In connection with the appointment of Mr. Amboian as trustee, Timothy R. Schwertfeger, an interested trustee, resigned from the Board of Trustees, effective July 1, 2008. |
| (3) | Mr. Amboian is an interested trustee because of his position with Nuveen Investments, Inc. and certain of its subsidiaries, which are affiliates of the Nuveen Funds. |
| (4) | Officers serve one year terms through July of each year. The year first elected or appointed represents the year in which the officer was first elected or appointed to any fund in the Nuveen Fund Complex. |
| (5) | Nuveen Advisory Corp. and Nuveen Institutional Advisory Corp. were reorganized into Nuveen Asset Management, effective January 1, 2005. |
55
Glossary of Terms Used in this Report
Asset-Backed Securities (ABS): a type of debt security that is based on pools of assets, or collateralized by the cash flows from a specified pool of underlying assets.
Average Annual Total Return: This is a commonly used method to express an investment’s performance over a particular, usually multi-year time period. It expresses the return that would have been necessary each year to equal the investment’s actual cumulative performance (including change in NAV or offer price and reinvested dividends and capital gains distributions, if any) over the time period being considered.
Commercial Mortgage-Backed Securities (CMBS): A type of bond commonly issued in American security markets. They are a type of mortgage-backed security backed by mortgages on commercial rather than residential real estate.
Net Asset Value (NAV): A Fund’s NAV is the dollar value of one share in the Fund. It is calculated by subtracting the liabilities of the Fund from its total assets and then dividing the remainder by the number of shares outstanding. Fund NAVs are calculated at the end of each business day.
Structured Investment Vehicle (SIV): A fund which borrows money by issuing short-term securities at low interest rates and then lends that money by buying long-term securities at higher interest rates, potentially making a profit for investors from the difference.
56
Fund Information
| | | | |
| | |
Fund Manager Nuveen Asset Management 333 West Wacker Drive Chicago, IL 60606 Sub-Advisers Santa Barbara Asset Management 200 East Carrillo Street Suite 300 Santa Barbara, CA 93101 Rittenhouse Asset Management, Inc. Five Radnor Corporate Center Radnor, PA 19087 | | Legal Counsel Chapman and Cutler LLP Chicago, IL Independent Registered Public Accounting Firm PricewaterhouseCoopers LLP Chicago, IL Custodian State Street Bank & Trust Company Boston, MA | | Transfer Agent and Shareholder Services Boston Financial Data Services, Inc. Nuveen Investor Services P.O. Box 8530 Boston, MA 02266-8530 (800) 257-8787 |
Quarterly Portfolio of Investments and Proxy Voting Information: You may obtain (i) each Fund’s quarterly portfolio of investments, (ii) information regarding how the Funds voted proxies relating to portfolio securities held during the most recent twelve-month period ended June 30, 2008, and (iii) a description of the policies and procedures that the Funds used to determine how to vote proxies relating to portfolio securities are available without charge, upon request, by calling Nuveen Investments at (800) 257-8787 or on Nuveen’s website at www.nuveen.com.
You may also obtain this and other Fund information directly from the Securities and Exchange Commission (“SEC”). The SEC may charge a copying fee for this information. Visit the SEC on-line at http://www.sec.gov or in person at the SEC’s Public Reference Room in Washington, D.C. Call the SEC at (202) 942-8090 for room hours and operation. You may also request Fund information by sending an e-mail request to publicinfo@sec.gov or by writing to the SEC’s Public Reference Section at 100 F Street NE, Washington, D.C. 20549.
The Financial Industry Regulatory Authority (FINRA) provides a Public Disclosure Program which supplies certain information regarding the disciplinary history of FINRA members and their associated persons in response to either telephone inquiries at (800) 289-9999 or written inquiries at www.finra.org. Financial Industry Regulatory Authority also provides an investor brochure that includes information describing the Public Disclosure Program.
57
Distribution Information: Santa Barbara Dividend Growth, Santa Barbara Growth and Santa Barbara Growth Opportunities hereby designate 100.00%, 100.00% and 28.26%, respectively, of dividends paid from net ordinary income as dividends qualifying for the 70% dividends received deduction for corporations and 100.00%, 100.00% and 31.93%, respectively, as qualified dividend income for individuals under Section 1 (h)(11) of the Internal Revenue Code. The actual qualified dividend income distributions will be reported to shareholders on Form 1099-DIV which will be sent to shareholders shortly after calendar year end.
Learn more
about Nuveen Funds at
www.nuveen.com/mf
Nuveen Investments:
SERVING Investors
For GENERATIONS
Since 1898, financial advisors and their clients have relied on Nuveen Investments to provide dependable investment solutions. Over this time, Nuveen Investments has adhered to the belief that the best approach to investing is to apply conservative risk-management principles to help minimize volatility.
Building on this tradition, we today offer a range of high quality equity and fixed-income solutions that can be integral parts of a well-diversified core portfolio. Our clients have come to appreciate this diversity, as well as our continued adherence to proven, long-term investing principles.
We offer many different investing solutions for our clients’ different needs.
Nuveen Investments is a global investment management firm that seeks to help secure the long-term goals of institutions and high net worth investors as well as the consultants and financial advisors who serve them. Nuveen Investments markets its growing range of specialized investment solutions under the high-quality brands of HydePark, NWQ, Nuveen, Rittenhouse, Santa Barbara, Symphony and Tradewinds. In total, the Company managed $152 billion of assets on June 30, 2008.
Find out how we can help you reach your financial goals.
An investor should carefully consider the Fund’s objectives, risks, charges and expenses before investing. For a prospectus containing this and other information about the Fund, please contact your financial advisor or Nuveen Investments at (800) 257-8787. Read the prospectus carefully before you invest or send money.
MAN-SANTB-0708D
Part C — Other Information
Item 15. Indemnification
Section 4 of Article XII of Registrant’s Declaration of Trust provides as follows:
Subject to the exceptions and limitations contained in this Section 4, every person who is, or has been, a Trustee, officer, employee or agent of the Trust, including persons who serve at the request of the Trust as directors, trustees, officers, employees or agents of another organization in which the Trust has an interest as a shareholder, creditor or otherwise (hereinafter referred to as a “Covered Person”), shall be indemnified by the Trust to the fullest extent permitted by law against liability and against all expenses reasonably incurred or paid by him in connection with any claim, action, suit or proceeding in which he becomes involved as a party or otherwise by virtue of his being or having been such a Trustee, director, officer, employee or agent and against amounts paid or incurred by him in settlement thereof.
No indemnification shall be provided hereunder to a Covered Person:
(a) against any liability to the Trust or its Shareholders by reason of a final adjudication by the court or other body before which the proceeding was brought that he engaged in willful misfeasance, bad faith, gross negligence or reckless disregard of the duties involved in the conduct of his office;
(b) with respect to any matter as to which he shall have been finally adjudicated not to have acted in good faith in the reasonable belief that his action was in the best interests of the Trust; or
(c) in the event of a settlement or other disposition not involving a final adjudication (as provided in paragraph (a) or (b)) and resulting in a payment by a Covered Person, unless there has been either a determination that such Covered Person did not engage in willful misfeasance, bad faith, gross negligence or reckless disregard of the duties involved in the conduct of his office by the court or other body approving the settlement or other disposition or a reasonable determination, based on a review of readily available facts (as opposed to a full trial-type inquiry), that he did not engage in such conduct:
(i) by a vote of a majority of the Disinterested Trustees acting on the matter (provided that a majority of the Disinterested Trustees then in office act on the matter); or
(ii) by written opinion of independent legal counsel.
The rights of indemnification herein provided may be insured against by policies maintained by the Trust, shall be severable, shall not affect any other rights to which any Covered Person may now or hereafter be entitled, shall continue as to a person who has ceased to be such a Covered Person and shall inure to the benefit of the heirs, executors and administrators of such a person. Nothing contained herein shall affect any rights to indemnification to which Trust personnel other than Covered Persons may be entitled by contract or otherwise under law.
Expenses of preparation and presentation of a defense to any claim, action, suit or proceeding subject to a claim for indemnification under this Section 4 shall be advanced by the Trust prior to final disposition thereof upon receipt of an undertaking by or on behalf of the recipient to repay such amount if it is ultimately determined that he is not entitled to indemnification under this Section 4, provided that either:
(a) such undertaking is secured by a surety bond or some other appropriate security or the Trust shall be insured against losses arising out of any such advances; or
(b) a majority of the Disinterested Trustees acting on the matter (provided that a majority of the Disinterested Trustees then in office act on the matter) or independent legal counsel in a written opinion shall determine, based upon a review of the readily available facts (as opposed to a full trial-type inquiry), that there is reason to believe that the recipient ultimately will be found entitled to indemnification.
As used in this Section 4, a “Disinterested Trustee” is one (x) who is not an Interested Person of the Trust (including, as such Disinterested Trustee, anyone who has been exempted from being an Interested Person by any rule, regulation or order of the Commission), and (y) against whom none of such actions, suits or other proceedings or another action, suit or other proceeding on the same or similar grounds is then or has been pending.
As used in this Section 4, the words “claim,” “action,” “suit” or “proceeding” shall apply to all claims, actions, suits, proceedings (civil, criminal, administrative or other, including appeals), actual or threatened; and the word “liability” and “expenses” shall include without limitation, attorneys’ fees, costs, judgments, amounts paid in settlement, fines, penalties and other liabilities.
C-1
The trustees and officers of the Registrant are covered by Investment Trust Errors and Omission policies in the aggregate amount of $50,000,000 (with a maximum deductible of $500,000) against liability and expenses of claims of wrongful acts arising out of their position with the Registrant, except for matters which involved willful acts, bad faith, gross negligence and willful disregard of duty (i.e., where the insured did not act in good faith for a purpose he or she reasonably believed to be in the best interest of Registrant or where he or she shall have had reasonable cause to believe this conduct was unlawful).
Insofar as indemnification for liabilities arising under the Securities Act of 1933 may be permitted to the officers, trustees or controlling persons of the Registrant pursuant to the Declaration of Trust of the Registrant or otherwise, the Registrant has been advised that in the opinion of the Securities and Exchange Commission such indemnification is against public policy as expressed in the Act and is, therefore, unenforceable. In the event that a claim for indemnification against such liabilities (other than the payment by the Registrant of expenses incurred or paid by an officer or trustee or controlling person of the Registrant in the successful defense of any action, suit or proceeding) is asserted by such officer, trustee or controlling person in connection with the securities being registered, the Registrant will, unless in the opinion of its counsel the matter has been settled by controlling precedent, submit to a court of appropriate jurisdiction the question of whether such indemnification by it is against public policy as expressed in the Act and will be governed by the final adjudication of such issue.
Item 16. Exhibits
| | |
| (1)(a) | | Declaration of Trust of Registrant, dated June 27, 1997.(1) |
| |
| (1)(b) | | Certificate for the Establishment and Designation of Classes, dated June 27, 1997.(1) |
| |
| (1)(c) | | Amended Establishment and Designation of Classes, dated April 23, 2008.(8) |
| |
| (1)(d) | | Amended and Restated Designation of Series, dated January 20, 2008.(13) |
| |
| (2) | | Amended and Restated By-Laws of Registrant, dated November 18, 2002.(6) |
| |
| (3) | | Not applicable. |
| |
| (4) | | Form of Agreement and Plan of Reorganization is filed herein as Appendix I to Part A of this Registration Statement. |
| |
| (5) | | Specimen Certificate of Shares of the Registrant.(2) |
| |
| (6)(a) | | Investment Management Agreement between Registrant and Nuveen Asset Management, dated November 13, 2007.(7) |
| |
| (6)(b) | | Renewal of Investment Management Agreement between Registrant and Nuveen Asset Management, dated July 31, 2008.(10) |
| |
| (6)(c) | | Amended Schedule A and B of Investment Management Agreement between Registrant and Nuveen Asset Management, dated December 19, 2008.(12) |
| |
| (6)(d) | | Investment Sub-Advisory Agreement between Nuveen Asset Management and Santa Barbara Asset Management, LLC, dated November 13, 2007.(7) |
| |
| (6)(e) | | Renewal of Investment Sub-Advisory Agreement between Nuveen Asset Management and Santa Barbara Asset Management, LLC, dated July 31, 2008.(13) |
| |
| (6)(f) | | Investment Sub-Advisory Agreement between Nuveen Asset Management and Rittenhouse Asset Management, Inc. with respect to Nuveen Rittenhouse Growth Fund, dated November 13, 2007.(9) |
| |
| (6)(g) | | Renewal of Investment Sub-Advisory Agreement between Nuveen Asset Management and Rittenhouse Asset Management, Inc., dated July 31, 2008.(13) |
| |
| (7)(a) | | Distribution Agreement between Registrant and Nuveen Investments, LLC, dated August 1, 1998.(3) |
| |
| (7)(b) | | Form of Dealer Distribution, Shareholder Servicing and Fee-Based Program Agreement.(5) |
| |
| (7)(c) | | Form of Nuveen Funds Rule 22c-2 Agreement, dated October 16, 2006.(5) |
| |
| (7)(d) | | Renewal of Distribution Agreement between Registrant and Nuveen Investments, LLC, dated August 1, 2008.(11) |
| |
| (8) | | Not applicable. |
| |
| (9)(a) | | Amended and Restated Master Custodian Agreement between certain Nuveen Funds and State Street Bank and Trust Company, dated February 25, 2005.(4) |
| |
| (9)(b) | | Appendix A to the Custodian Agreement, dated December 17, 2008.(12) |
| |
| (10)(a) | | Plan of Distribution and Service Pursuant to Rule 12b-1, dated February 28, 2008.(8) |
C-2
| | |
| (10)(b) | | Multiple Class Plan, effective May 1, 2008.(8) |
| |
| (11) | | Opinion and Consent of Vedder Price P.C., dated January 30, 2009.(13) |
| |
| (12) | | Form of Opinion and Consent of Vedder Price P.C. supporting tax matters and consequences.(13) |
| |
| (13) | | Not applicable. |
| |
| (14) | | Consent of Independent Public Accountants, dated January 30, 2009.(13) |
| |
| (15) | | Not applicable. |
| |
| (16) | | Original Powers of Attorney for Messrs. Amboian, Bremner, Evans, Hunter, Kundert, Schneider and Toth and Mss. Stockdale and Stone, dated January 13, 2009.(13) |
| |
| (17) | | Form of Proxy.(13) |
| (1) | Incorporated by reference to Registrant’s initial registration statement on Form N-1A, as filed on August 14, 1997. |
| (2) | Incorporated by reference to pre-effective amendment no. 1 to Registrant’s registration statement on Form N-1A, as filed on November 13, 1997. |
| (3) | Incorporated by reference to post-effective amendment no. 2 to Registrant’s registration statement on Form N-1A , as filed on November 25, 1998. |
| (4) | Incorporated by reference to post-effective amendment no. 18 to Registrant’s registration statement on Form N-1A, as filed on March 28, 2006. |
| (5) | Incorporated by reference to post-effective amendment no. 23 to Registrant’s registration statement on Form N-1A, as filed on October 19, 2006. |
| (6) | Incorporated by reference to post-effective amendment no. 24 to Registrant’s registration statement on Form N-1A, as filed on November 28, 2006. |
| (7) | Incorporated by reference to post-effective amendment no. 37 to Registrant’s registration statement on Form N-1A, as filed on November 28, 2007. |
| (8) | Incorporated by reference to post-effective amendment no. 44 to Registrant’s registration statement on Form N-1A, as filed on May 30, 2008. |
| (9) | Incorporated by reference to post-effective amendment no. 45 to Registrant’s registration statement on Form N-1A, as filed on August 1, 2008. |
| (10) | Incorporated by reference to post-effective amendment no. 46 to Registrant’s registration statement on Form N-1A, as filed on September 9, 2008. |
| (11) | Incorporated by reference to post-effective amendment no. 51 to Registrant’s registration statement on Form N-1A, as filed on November 26, 2008. |
| (12) | Incorporated by reference to post-effective amendment no. 53 to Registrant’s registration statement on Form N-1A, as filed on December 19, 2008. |
Item 17. Undertakings
(1) The undersigned registrant agrees that prior to any public reoffering of the securities registered through the use of a prospectus which is a part of this registration statement by any person or party who is deemed to be an underwriter within the meaning of Rule 145(c) of the Securities Act, the reoffering prospectus will contain the information called for by the applicable registration form for reofferings by persons who may be deemed underwriters, in addition to the information called for by the other items o the applicable form.
(2) The undersigned registrant agrees that every prospectus that is filled under paragraph (1) above will be filed as a part of an amendment to the registration statement and will not be used until the amendment is effective, and that, in determining any liability under the 1933 Act, each post-effective amendment shall be deemed to be a new registration statement for the securities offered therein, and the offering of the securities at that time shall be deemed to be the initial bona fide offering of them.
C-3
Signatures
As required by the Securities Act of 1933, this registration statement has been signed on behalf of the registrant, in the City of Chicago, and State of Illinois, on the 30th day of January, 2009.
|
| NUVEEN INVESTMENT TRUST II |
|
| /S/ KEVIN J. MCCARTHY |
Kevin J. McCarthy Vice President and Secretary |
As required by the Securities Act of 1933, this registration statement has been signed by the following persons in the capacities and on the date indicated.
| | | | |
Signature | | Title | | Date |
| | |
/S/ STEPHEN D. FOY Stephen D. Foy | | Vice President and Controller
(principal financial and accounting officer) | | January 30, 2009 |
| | |
/S/ GIFFORD R. ZIMMERMAN Gifford R. Zimmerman | | Chief Administrative Officer
(principal executive officer) | | January 30, 2009 |
| | | | | | |
| | | |
| ROBERT P. BREMNER* | | Chairman and Trustee | | | | |
| | | |
| JOHN P. AMBOIAN* | | Trustee | | | | |
| | | |
| JACK B. EVANS* | | Trustee | | | | |
| | | |
| WILLIAM C. HUNTER* | | Trustee | | By: | | /S/ KEVIN J. MCCARTHY |
| DAVID J. KUNDERT* | | Trustee | | | | Kevin J. McCarthy Attorney-in-Fact January 30, 2009 |
| WILLIAM J. SCHNEIDER* | | Trustee | | | | |
| | | |
| JUDITH M. STOCKDALE* | | Trustee | | | | |
| | | |
| CAROLE E. STONE* | | Trustee | | | | |
| | | |
| TERENCE J. TOTH* | | Trustee | | | | |
| * | An original power of attorney authorizing, among others, Kevin J. McCarthy, Larry W. Martin and Gifford R. Zimmerman to execute this registration statement, and amendments thereto, for each of the trustees of the Registrant on whose behalf this registration statement is filed, has been executed and is filed herein as Exhibit 16 Securities and Exchange Commission and is incorporated by reference herein. |
Exhibit Index
| | |
Exhibit Number | | Exhibit |
| |
| (1)(d) | | Amended and Restated Designation of Series |
| |
| (6)(e) | | Renewal of Investment Sub-Advisory Agreement between Nuveen Asset Management and Santa Barbara Asset Management, LLC. |
| |
| (6)(g) | | Renewal of Investment Sub-Advisory Agreement between Nuveen Asset Management and Rittenhouse Asset Management, Inc. |
| |
| (11) | | Opinion and Consent of Vedder Price P.C. |
| |
| (12) | | Form of Opinion and Consent of Vedder Price P.C. |
| |
| (14) | | Consent of Independent Public Accountants. |
| |
| (16) | | Powers of Attorney for Messrs. Amboian, Bremner, Evans, Hunter, Kundert, Schneider and Toth and Mss. Stockdale and Stone. |
| |
| (17) | | Form of Proxy. |