As filed with the Securities and Exchange Commission on April 18, 2018
File No. 333-
UNITED STATES
SECURITIES AND EXCHANGE COMMISSION
Washington, D.C. 20549
FORM N-14
REGISTRATION STATEMENT
UNDER
THE SECURITIES ACT OF 1933
☐ Pre-Effective Amendment No.
☐ Post-Effective Amendment No.
NUVEEN INVESTMENT TRUST II
(Exact Name of Registrant as Specified in Charter)
333 West Wacker Drive
Chicago, Illinois 60606
(Address of Principal Executive Offices: Number, Street, City, State, Zip Code)
(800) 257-8787
(Area Code and Telephone Number)
Christopher M. Rohrbacher
Vice President and Secretary
333 West Wacker Drive
Chicago, Illinois 60606
(Name and Address of Agent for Service)
Copy to:
| | |
Deborah Bielicke Eades
Vedder Price P.C.
222 North LaSalle Street
Chicago, Illinois 60601 | | Eric F. Fess
Chapman and Cutler LLP
111 West Monroe Street
Chicago, Illinois 60603 |
Approximate date of proposed public offering: As soon as practicable after the effective date of this Registration Statement.
Title of securities being registered: Shares of beneficial interest, par value $0.01 per share, of the Registrant.
It is proposed that this filing will become effective on May 18, 2018 pursuant to Rule 488 under the Securities Act of 1933, as amended.
No filing fee is required because of reliance on Section 24(f) and an indefinite number of shares have previously been registered pursuant to Rule 24f-2 under the Investment Company Act of 1940, as amended.

IMPORTANT INFORMATION FOR SHAREHOLDERS OF
NUVEEN SYMPHONY LOW VOLATILITY EQUITY FUND
At a special meeting of shareholders of Nuveen Symphony Low Volatility Equity Fund (the “Target Fund”), a series of Nuveen Investment Trust II (the “Trust”), you will be asked to vote on the reorganization of your fund into Nuveen Santa Barbara Dividend Growth Fund (the “Acquiring Fund”), also a series of the Trust (the “Reorganization”). The Target Fund and the Acquiring Fund are collectively referred to herein as the “Funds” and individually as a “Fund.”
The Board of Trustees of the Trust (the “Board”), including the independent board members, unanimously recommends that you vote FOR the proposal.
Although we recommend that you read the complete Proxy Statement/Prospectus, for your convenience we have provided the following brief overview of the matter to be voted on.
| Q. | Why is the Reorganization being proposed? |
| A. | Nuveen Fund Advisors, LLC (“Nuveen Fund Advisors” or the “Adviser”) serves as each Fund’s investment adviser. The Adviser proposed the Reorganization as part of a strategic decision to end its support of the retail equity fund line of business of Symphony Asset Management LLC (“Symphony”), the Target Fund’s sub-adviser. The proposed Reorganization will allow Target Fund shareholders to continue their investment in an equity fund with a similar performance and risk profile as the Target Fund. In addition, the Adviser and the Board believe that Target Fund shareholders (as shareholders of the Acquiring Fund following the Reorganization) will recognize operating cost savings and operational efficiencies because the fixed costs involved with operating a fund will be spread across a larger asset base following the Reorganization, and the need for certain duplicative services for separate stand-alone funds will be eliminated. This is expected to result in a decrease in total annual fund operating expenses for shareholders of the Target Fund following the Reorganization. In addition to considering the benefits to shareholders expected to result from the Reorganization, the Board considered that the Adviser may realize certain efficiencies by no longer providing certain services to separate stand-alone funds. See “Reorganization of the Target Fund into the Acquiring Fund—Approval of the Proposed Reorganization by the Board of Trustees” at page 23 of the Proxy Statement/Prospectus. |
| Q. | How will the Reorganization affect my shares? |
| A. | Upon the closing of the Reorganization, each Target Fund shareholder will receive shares of the Acquiring Fund in an amount equal in total net asset value to the total net asset value of the Target Fund shares surrendered by such shareholder. Holders of Class A shares, Class C shares, Class R6 shares and Class I shares of the Target Fund will receive the same class of shares of the Acquiring Fund. |
| Q. | Will Target Fund shareholders incur sales loads or contingent deferred sales charges on Acquiring Fund shares received in the Reorganization? |
| A. | The front-end sales load on Class A shares received in the Reorganization will be waived. If your Target Fund shares are subject to a contingent deferred sales charge (“CDSC”), which may be the case for either Class A share purchases of $1 million or more that were not subject to a front-end sales load or Class C shares, the Acquiring Fund shares that you receive in the Reorganization will be subject to a CDSC if they are redeemed within 18 months of the date you purchased your Target Fund Class A shares subject to a CDSC and within 12 months of the date you purchased your Target Fund Class C shares. |
| Q. | Are the Funds managed by the same sub-adviser? |
| A. | The Target Fund is sub-advised by Symphony and is managed by Gunther Stein, Ross Sakamoto, CFA, and Marc Snyder. The Acquiring Fund is sub-advised by Santa Barbara Asset Management, LLC (“Santa Barbara”) and is managed by James R. Boothe, CFA. Santa Barbara will continue to serve as sub-adviser to the Acquiring Fund, and Mr. Boothe will continue to serve as the portfolio manager for the Acquiring Fund, following the Reorganization. |
| Q. | How do the Funds’ investment objectives, principal investment strategies and principal risks compare? |
| A. | Although both Funds invest significantly in dividend-paying common stocks, the Funds’ investment objectives, principal investment strategies and principal risks differ in certain respects, as summarized below. |
| | The investment objective of the Target Fund is to seek long-term capital appreciation with lower absolute volatility than the broad equity market. The investment objective of the Acquiring Fund is to seek an attractive total return comprised of income from dividends and long-term capital appreciation. |
| | Under normal market conditions, the Target Fund invests at least 80% of the sum of its net assets and the amount of any borrowings for investment purposes in equity securities (which are defined to include, among other things, common stocks and preferred securities). The goal of the Target Fund’s portfolio construction process is to produce long-term returns superior to the broad equity market with lower absolute volatility. The Target Fund’s sub-adviser seeks a “beta” (i.e., a measure of a portfolio’s sensitivity to market movements) that is approximately 90% of the beta of the Russell 1000® Index, the Target Fund’s primary benchmark index, although there is no guarantee that this can be achieved. In seeking to lower absolute volatility, the Target Fund historically has invested a high percentage of its assets (approximately 77% of net assets as of February 28, 2018) in dividend-paying common stocks. |
| | Under normal market conditions, the Acquiring Fund invests at least 80% of its net assets in dividend-paying common stocks and preferred securities. Historically, the Acquiring Fund has invested substantially all of its net assets in dividend-paying common stocks. Unlike the Target Fund, as a principal investment strategy, the Acquiring Fund may invest up to 25% of its net assets in non-U.S. equity securities that are U.S. dollar-denominated. |
ii
| | Although an investment in each Fund is subject to substantially similar risks (i.e., active management risk, equity security risk and small- and mid-cap stock risk), an investment in the Acquiring Fund is subject to certain additional principal risks (i.e., currency risk and non-U.S. investment risk) related to investments in non-U.S. equity securities, which is not a principal investment strategy of the Target Fund. See the section of the Proxy Statement/Prospectus entitled “Risk Factors” for a comparison of and additional information regarding each Fund’s principal investment risks. |
| | A more detailed comparison of the investment objectives, strategies and risks of the Funds is contained in the Proxy Statement/Prospectus. |
| Q. | Will the portfolio of the Target Fund be repositioned prior to the Reorganization? |
| A. | Yes. If the Reorganization had occurred as of February 28, 2018, it is estimated that approximately 78% (or $105.4 million) of the Target Fund’s investment portfolio would have been sold. If such sales had occurred as of February 28, 2018, it is estimated that such portfolio repositioning would have resulted in brokerage commissions or other transaction costs for the Target Fund of approximately $47,900 (0.04% of the Target Fund’s net assets), based on average commission rates normally paid by the Target Fund. These transaction costs represent expenses of the Target Fund that will not be subject to the Target Fund’s expense cap and will be borne by the Target Fund and indirectly borne by the Target Fund’s shareholders. Capital gains from such portfolio sales may result in increased distributions of net capital gain and net investment income. If such sales had occurred as of February 28, 2018, the sales would have resulted in realized gains of approximately $24.2 million (approximately $5.75 per share or 18% of the Target Fund’s net assets). |
| | Taking into account the repositioning of the Target Fund, the Acquiring Fund is not expected to sell a material portion (i.e., 5% or more of net assets) of the Target Fund’s assets received in the Reorganization in order to meet its investment policies and restrictions. |
| Q. | How will the Reorganization impact fees and expenses? |
| A. | If the Reorganization had taken place as of January 31, 2018, the date in the Fees and Expenses table in the Proxy Statement/Prospectus, the pro forma total net and gross operating expenses of the Acquiring Fund following the Reorganization would have been lower than the total net and gross operating expenses of the Target Fund for all share classes. Pro forma amounts are estimated; actual operating expenses will vary based on asset size and other factors. See the section entitled “Further Comparison of the Funds—Fees and Expenses” in the Proxy Statement/Prospectus for additional information. |
| Q. | Will the Reorganization create a taxable event for me? |
| A. | No. The Reorganization is intended to qualify as a tax-free reorganization for federal income tax purposes. It is expected that you will recognize no gain or loss for federal income tax purposes as a direct result of the Reorganization. Prior to the closing of the Reorganization, the Target Fund expects to distribute all of its net investment income and net capital gains, if any. All or a portion of such a distribution may be taxable to Target Fund shareholders and will generally be taxed as ordinary income or capital gains for federal income tax purposes, unless |
iii
| | you are investing through a tax-advantaged account such as an IRA or 401(k) plan (in which case you may be taxed upon withdrawal of your investment from such account). These distributions will be reinvested in additional shares of the Target Fund unless a shareholder has made an election to receive distributions in cash. The tax character of such distributions will be the same regardless of whether they are paid in cash or reinvested in additional shares. In addition, the Target Fund may recognize gains or losses as a result of portfolio sales effected prior to the Reorganization, including sales anticipated in connection with the repositioning described above. Such gains or losses may increase or decrease the net capital gains or net investment income to be distributed by the Target Fund to its shareholders, and may increase or decrease the Target Fund’s capital loss carryforwards, if any. |
| Q. | Who will bear the costs of the Reorganization? |
| A. | Nuveen Fund Advisors or its affiliates (collectively, “Nuveen”) will absorb the costs of the Reorganization, which are estimated to be approximately $230,000. |
| Q. | What is the timetable for the Reorganization? |
| A. | If approved by the Target Fund’s shareholders at the special meeting of shareholders on July 16, 2018, the Reorganization of the Target Fund is expected to occur at the close of business on August 24, 2018 or as soon as practicable thereafter. |
General
| Q. | Whom do I call if I have questions? |
| A. | If you need any assistance, or have any questions regarding the proposals or how to vote your shares, please call Computershare Fund Services, the proxy solicitor hired by the Target Fund, at [•] weekdays during its business hours of 9:00 a.m. to 11:00 p.m. and Saturdays 12:00 p.m. to 6:00 p.m. Eastern time. Please have your proxy materials available when you call. |
| Q. | How do I vote my shares? |
| A. | You may vote in person, by mail, by telephone or over the Internet: |
| | • | | To vote in person, please attend the special meeting of shareholders and bring your photographic identification. If you hold your Target Fund shares through a bank, broker or other nominee, you must also bring satisfactory proof of ownership of those shares and a “legal proxy” from the nominee. |
| | • | | To vote by mail, please mark, sign, date and mail the enclosed proxy card. No postage is required if mailed in the United States. |
| | • | | To vote by telephone, please call the toll-free number located on your proxy card and follow the recorded instructions, using your proxy card as a guide. |
| | • | | To vote over the Internet, go to the Internet address provided on your proxy card and follow the instructions, using your proxy card as a guide. |
iv
| Q. | Will anyone contact me? |
| A. | You may receive a call from Computershare Fund Services, the proxy solicitor hired by the Target Fund, to verify that you received your proxy materials, to answer any questions you may have about the proposals and to encourage you to vote your proxy. |
| | We recognize the inconvenience of the proxy solicitation process and would not impose on you if we did not believe that the matters being proposed were important. Once your vote has been registered with the proxy solicitor, your name will be removed from the solicitor’s follow-up contact list. |
| Q. | How does the Board suggest that I vote? |
| A. | After careful consideration, the Board has agreed unanimously that the proposed Reorganization is in the best interests of the Target Fund and recommends that you vote “FOR” the proposal. If shareholders do not approve the Reorganization, the Board will take such action as it deems to be in the best interests of the Target Fund, including continuing to operate the Target Fund as a stand-alone fund, liquidating the Target Fund, or such other options the Board may consider. |
| | Your vote is very important. We encourage you as a shareholder to participate in your Fund’s governance by returning your vote as soon as possible. If enough shareholders fail to cast their votes, your Fund may not be able to hold its shareholder meeting or the vote on the issue, and your Fund will be required to incur additional solicitation costs in order to obtain sufficient shareholder participation. |
v
[•], 2018
Dear Shareholders:
We are pleased to invite you to the special meeting of shareholders of Nuveen Symphony Low Volatility Equity Fund (the “Target Fund”) (the “Special Meeting”). The Special Meeting is scheduled for July 16, 2018, at 2:00 p.m., Central time, at the offices of Nuveen, LLC, 333 West Wacker Drive, Chicago, Illinois 60606.
At the Special Meeting, you will be asked to consider and approve a very important proposal for your fund. You are being asked to consider the reorganization of your fund into Nuveen Santa Barbara Dividend Growth Fund (the “Acquiring Fund” and together with the Target Fund, the “Funds” and each a “Fund”) (the “Reorganization”). The Funds are each a series of Nuveen Investment Trust II (the “Trust”).
Nuveen Fund Advisors, LLC (the “Adviser”) serves as each Fund’s investment adviser. The Adviser proposed the Reorganization as part of a strategic decision to end its support of the equity fund line of business of Symphony Asset Management LLC, the Target Fund’s sub-adviser. The proposed Reorganization will allow Target Fund shareholders to continue their investment in an equity fund with a similar performance and risk profile as the Target Fund. In addition, the Adviser and the Board of Trustees of the Trust (the “Board”) believe that Target Fund shareholders (as shareholders of the Acquiring Fund following the Reorganization) will recognize operating cost savings and operational efficiencies because the fixed costs involved with operating a fund will be spread across a larger asset base following the Reorganization, and the need for certain duplicative services for separate stand-alone funds will be eliminated. This is expected to result in a decrease in total annual fund operating expenses for shareholders of the Target Fund following the Reorganization. The Board believes the Reorganization is in the best interests of the Target Fund and recommends that you vote “FOR” the proposed Reorganization.
The attached Proxy Statement/Prospectus has been prepared to give you information about the proposal.
All shareholders are cordially invited to attend the Special Meeting. In order to avoid delay and additional expense and to assure that your shares are represented, please vote as promptly as possible, whether or not you plan to attend the Special Meeting. You may vote by mail, by telephone or over the Internet. To vote by mail, please mark, sign, date and mail the enclosed proxy card. No postage is required if mailed in the United States. To vote by telephone, please call the toll-free number located on your proxy card and follow the recorded instructions, using your proxy card as a guide. To vote over the Internet, go to the Internet address provided on your proxy card and follow the instructions, using your proxy card as a guide.
If you intend to attend the Special Meeting in person and you are a record holder of the Target Fund’s shares, in order to gain admission you must show photographic identification, such as your driver’s license. If you intend to attend the Special Meeting in person and you hold your shares through a bank, broker or other nominee, in order to gain admission you must show photographic identification, such as your driver’s license, and satisfactory proof of ownership of shares of the Target Fund, such as your voting instruction form (or a copy thereof) or broker’s statement indicating ownership as of a
1
recent date. If you hold your shares in a brokerage account or through a bank or other nominee, you will not be able to vote in person at the Special Meeting unless you have previously requested and obtained a “legal proxy” from your broker, bank or other nominee and present it at the Special Meeting.
We appreciate your continued support and confidence in Nuveen and our family of funds.
Very truly yours,
Christopher M. Rohrbacher
Vice President and Secretary
2
[•], 2018
NUVEEN SYMPHONY LOW VOLATILITY EQUITY FUND
NOTICE OF SPECIAL MEETING OF SHAREHOLDERS
TO BE HELD ON JULY 16, 2018
To the Shareholders:
Notice is hereby given that a special meeting of shareholders of Nuveen Symphony Low Volatility Equity Fund (the “Target Fund”), a series of Nuveen Investment Trust II (the “Trust”), a Massachusetts business trust, will be held at the offices of Nuveen, LLC, 333 West Wacker Drive, Chicago, Illinois 60606, on July 16, 2018 at 2:00 p.m., Central time (the “Special Meeting”), for the purposes described below.
| | 1. | To approve an Agreement and Plan of Reorganization (and the related transactions), which provides for (i) the transfer of all the assets of the Target Fund to Nuveen Santa Barbara Dividend Growth Fund (the “Acquiring Fund”) in exchange solely for Class A, Class C, Class R6 and Class I shares of beneficial interest of the Acquiring Fund and the assumption by the Acquiring Fund of all the liabilities of the Target Fund; and (ii) the pro rata distribution of Class A, Class C, Class R6 and Class I shares of the Acquiring Fund to the holders of Class A, Class C, Class R6 and Class I shares of the Target Fund, respectively, in complete liquidation and termination of the Target Fund (the “Reorganization”). |
| | 2. | To transact such other business as may properly come before the Special Meeting. |
Only shareholders of record as of the close of business on May 11, 2018 are entitled to vote at the Special Meeting or any adjournments or postponements thereof.
All shareholders are cordially invited to attend the Special Meeting. In order to avoid delay and additional expense and to assure that your shares are represented, please vote as promptly as possible, whether or not you plan to attend the Special Meeting. You may vote by mail, by telephone or over the Internet. To vote by mail, please mark, sign, date and mail the enclosed proxy card. No postage is required if mailed in the United States. To vote by telephone, please call the toll-free number located on your proxy card and follow the recorded instructions, using your proxy card as a guide. To vote over the Internet, go to the Internet address provided on your proxy card and follow the instructions, using your proxy card as a guide.
If you intend to attend the Special Meeting in person and you are a record holder of the Target Fund’s shares, in order to gain admission you must show photographic identification, such as your driver’s license. If you intend to attend the Special Meeting in person and you hold your shares through a bank, broker or other nominee, in order to gain admission you must show photographic identification, such as your driver’s license, and satisfactory proof of ownership of shares of the Target Fund, such as your voting instruction form (or a copy thereof) or broker’s statement indicating ownership as of a recent date. If you hold your shares in a brokerage account or through a bank or other nominee, you will not be able to vote in person at the Special Meeting unless you have previously requested and obtained a “legal proxy” from your broker, bank or other nominee and present it at the Special Meeting.
Very truly yours,
Christopher M. Rohrbacher
Vice President and Secretary
The information contained in this Proxy Statement/Prospectus is not complete and may be changed. We may not sell these securities until the registration statement filed with the Securities and Exchange Commission is effective. This Proxy Statement/Prospectus is not an offer to sell these securities, and it is not a solicitation of an offer to buy these securities, in any jurisdiction where the offer or sale is not permitted.
SUBJECT TO COMPLETION,
DATED APRIL 18, 2018
PROXY STATEMENT/PROSPECTUS
DATED [•], 2018
Relating to the Acquisition of the Assets and Liabilities of
NUVEEN SYMPHONY LOW VOLATILITY EQUITY FUND
by
NUVEEN SANTA BARBARA DIVIDEND GROWTH FUND
This Proxy Statement/Prospectus is being furnished to shareholders of Nuveen Symphony Low Volatility Fund (the “Target Fund”), a series of Nuveen Investment Trust II, a Massachusetts business trust (the “Trust”) and an open-end investment company registered under the Investment Company Act of 1940 Act, as amended (the “1940 Act”), and relates to the special meeting of shareholders of the Target Fund to be held at the offices of Nuveen, LLC, 333 West Wacker Drive, Chicago, Illinois 60606, on July 16, 2018 at 2:00 p.m., Central time, and at any and all adjournments and postponements thereof (the “Special Meeting”). This Proxy Statement/Prospectus is provided in connection with the solicitation by the Board of Trustees of the Trust (the “Board of Trustees” or the “Trustees”) of proxies to be voted at the Special Meeting. The purpose of the Special Meeting is to allow the shareholders of the Target Fund to consider and vote on the proposed reorganization (the “Reorganization”) of the Target Fund into Nuveen Santa Barbara Dividend Growth Fund (the “Acquiring Fund”), also a series of the Trust. The Target Fund and the Acquiring Fund are collectively referred to herein as the “Funds” and individually as a “Fund.”
If shareholders approve the Reorganization and it is completed, each Target Fund shareholder will receive shares of the Acquiring Fund in an amount equal in total net asset value to the total net asset value of the Target Fund shares surrendered by such shareholder. Holders of shares of the Target Fund will receive the same class of shares of the Acquiring Fund as they currently hold. The Board of Trustees has determined that the Reorganization is in the best interests of the Target Fund. The address and telephone number of the principal executive office of the Funds and the Trust is 333 West Wacker Drive, Chicago, Illinois 60606, (800) 257-8787.
The enclosed proxy and this Proxy Statement/Prospectus are first being sent to shareholders of the Target Fund on or about [•], 2018. Shareholders of record as of the close of business on May 11, 2018 are entitled to vote at the Special Meeting.
The Securities and Exchange Commission has not approved or disapproved these securities or determined whether the information in this Proxy Statement/Prospectus is truthful or complete. Any representation to the contrary is a criminal offense.
This Proxy Statement/Prospectus concisely sets forth the information shareholders of the Target Fund should know before voting on the Reorganization (in effect, investing in Class A, Class C, Class R6 and Class I shares of the Acquiring Fund, as applicable) and constitutes an offering of Class A, Class C, Class R6 and Class I shares of beneficial interest, par value $0.01 per share, of the Acquiring Fund. Please read it carefully and retain it for future reference.
The following documents have been filed with the Securities and Exchange Commission (“SEC”) and are incorporated into this Proxy Statement/Prospectus by reference and also accompany this Proxy Statement/Prospectus:
| | (i) | the Acquiring Fund’s prospectus dated November 30, 2017, as supplemented through the date of this Proxy Statement/Prospectus, only insofar as it relates to the Acquiring Fund (File Nos. 333-33607 and 811-08333); and |
| | (ii) | the unaudited financial statements contained in the Acquiring Fund’s Semi-Annual Report, only insofar as they relate to the Acquiring Fund, for the six months ended January 31, 2018 (File No. 811-08333). |
The following documents contain additional information about the Funds and have been filed with the SEC and are incorporated into this Proxy Statement/Prospectus by reference:
| | (i) | the Statement of Additional Information relating to the Reorganization, dated [•], 2018 (the “Reorganization SAI”); |
| | (ii) | the Target Fund’s prospectus dated January 31, 2018, as supplemented through the date of this Proxy Statement/Prospectus, only insofar as it relates to the Target Fund (File Nos. 333-33607 and 811-08333); |
| | (iii) | The Target Fund’s statement of additional information dated January 31, 2018, as supplemented through the date of this Proxy Statement/Prospectus, only insofar as it relates to the Target Fund (File Nos. 333-33607 and 811-08333); |
| | (iv) | the audited financial statements contained in the Target Fund’s Annual Report, only insofar as they relate to the Target Fund, for the fiscal year ended September 30, 2017 (File No. 811-08333); |
| | (v) | the Acquiring Fund’s statement of additional information dated November 30, 2017, as supplemented through the date of this Proxy Statement/Prospectus, only insofar as it relates to the Acquiring Fund (File Nos. 333-33607 and 811-08333); and |
| | (vi) | the audited financial statements contained in the Acquiring Fund’s Annual Report, only insofar as they relate to the Acquiring Fund, for the fiscal year ended July 31, 2017 (File No. 811-08333). |
No other parts of the Funds’ Annual Reports or Semi-Annual Reports are incorporated by reference herein.
Copies of the foregoing may be obtained without charge by calling or writing the Funds at the telephone number or address shown above. If you wish to request the Reorganization SAI, please ask for the “Santa Barbara Dividend Growth Fund Reorganization SAI.” In addition, the Acquiring Fund will furnish, without charge, a copy of its most recent annual report and subsequent semi-annual report to a shareholder upon request. Any such request should be directed to the Acquiring Fund by calling (800) 257-8787 or by writing the Acquiring Fund at 333 West Wacker Drive, Chicago, Illinois 60606.
ii
The Trust is subject to the informational requirements of the Securities Exchange Act of 1934, as amended (the “Exchange Act”), and the 1940 Act, and in accordance therewith files reports and other information with the SEC. Reports, proxy statements, registration statements and other information filed by the Trust (including the Registration Statement relating to the Acquiring Fund on Form N-14 of which this Proxy Statement/Prospectus is a part) may be inspected without charge and copied (for a duplication fee at prescribed rates) at the SEC’s Public Reference Room at 100 F Street, N.E., Washington, D.C. 20549 or at the SEC’s Northeast Regional Office (3 World Financial Center, New York, New York 10281) or Midwest Regional Office (175 W. Jackson Boulevard, Suite 900, Chicago, Illinois 60604). You may call the SEC at (202) 551-8090 for information about the operation of the Public Reference Room. You may obtain copies of this information, with payment of a duplication fee, by electronic request at the following e-mail address: publicinfo@sec.gov, or by writing the SEC’s Public Reference Branch, Office of Consumer Affairs and Information Services, Securities and Exchange Commission, Washington, D.C. 20549. You may also access reports and other information about the Funds on the EDGAR database on the SEC’s Internet site at http://www.sec.gov.
iii
TABLE OF CONTENTS
iv
REORGANIZATION OF THE TARGET FUND INTO THE ACQUIRING FUND
Summary
The following is a summary of, and should be read in conjunction with, the more complete information contained in this Proxy Statement/Prospectus and the information attached hereto or incorporated herein by reference, including the form of Agreement and Plan of Reorganization. As discussed more fully below and elsewhere in this Proxy Statement/Prospectus, the Board of Trustees believes the proposed Reorganization is in the best interests of the Target Fund and that the interests of the Target Fund’s existing shareholders would not be diluted as a result of the Reorganization. If shareholders of the Target Fund approve the Reorganization and it is completed, the Target Fund shareholders will become shareholders of the Acquiring Fund and will cease to be shareholders of the Target Fund.
Shareholders should read the entire Proxy Statement/Prospectus carefully together with the Acquiring Fund’s prospectus that accompanies this Proxy Statement/Prospectus, which is incorporated herein by reference. See the section entitled “Further Comparison of the Funds” below for a comparison of investment policies, fees and expenses, and other matters. This Proxy Statement/Prospectus constitutes an offering of Class A, Class C, Class R6 and Class I shares of the Acquiring Fund.
Background
Nuveen Fund Advisors, LLC (“Nuveen Fund Advisors” or the “Adviser”) serves as each Fund’s investment adviser. The Adviser proposed the Reorganization of the Target Fund into the Acquiring Fund as part of a strategic decision to end its support of the retail equity fund line of business of Symphony Asset Management LLC (“Symphony”), the Target Fund’s sub-adviser. The proposed Reorganization will allow Target Fund shareholders to continue their investment in an equity fund with a similar performance and risk profile as the Target Fund. In addition, the Adviser and the Board of Trustees believe that Target Fund shareholders (as shareholders of the Acquiring Fund following the Reorganization) will recognize operating cost savings and operational efficiencies because the fixed costs involved with operating a fund will be spread across a larger asset base following the Reorganization, and the need for certain duplicative services for separate stand-alone funds will be eliminated. This is expected to result in a decrease in total annual fund operating expenses for shareholders of the Target Fund following the Reorganization.
The Reorganization
This Proxy Statement/Prospectus is being furnished to shareholders of the Target Fund in connection with the proposed combination of the Target Fund into the Acquiring Fund pursuant to the terms and conditions of the Agreement and Plan of Reorganization entered into by (i) the Trust, on behalf of each Fund, and (ii) the Adviser (the “Agreement”).
The Agreement provides for (i) the transfer of all the assets of the Target Fund to the Acquiring Fund in exchange solely for Class A, Class C, Class R6 and Class I shares of beneficial interest, par value $0.01 per share, of the Acquiring Fund and the assumption by the Acquiring Fund of all the liabilities of the Target Fund; and (ii) the pro rata distribution of Class A, Class C, Class R6 and Class I shares of the Acquiring Fund to the holders of Class A, Class C, Class R6 and Class I shares of the Target Fund, respectively, in complete liquidation and termination of the Target Fund.
If shareholders of the Target Fund approve the Reorganization and it is completed, Target Fund shareholders will become shareholders of the Acquiring Fund. The Board of Trustees has determined that the Reorganization is in the best interests of the Target Fund and that the interests of existing Target Fund shareholders would not be diluted as a result of the Reorganization. The Board of Trustees unanimously approved the Reorganization and the Agreement at a meeting held on April 10–11, 2018. The Board of Trustees recommends a vote “FOR” the Reorganization.
Nuveen Fund Advisors or its affiliates (collectively, “Nuveen”) will absorb the costs of the Reorganization, which are estimated to be approximately $230,000.
The Board of Trustees is asking shareholders of the Target Fund to approve the Reorganization at the Special Meeting to be held on July 16, 2018. Approval of the Reorganization requires the affirmative vote of the holders of a majority of the total number of the Target Fund’s shares outstanding and entitled to vote, voting as a single class. See “Voting Information and Requirements” below.
If shareholders of the Target Fund approve the Reorganization, it is expected that the Reorganization will occur at the close of business on August 24, 2018 or such other date as agreed to by the parties (the “Closing Date”). If the Reorganization is not approved, the Board of Trustees will take such action as it deems to be in the best interests of the Target Fund, including continuing to operate the Target Fund as a stand-alone fund, liquidating the Target Fund, or other options the Board of Trustees may consider. The Closing Date may be delayed and the Reorganization may be abandoned at any time by the mutual agreement of the parties. In addition, either Fund may at its option terminate the Agreement at or before the closing of the Reorganization due to (i) a breach by the other Fund of any representation, warranty or agreement contained in the Agreement to be performed at or before the closing, if not cured within 30 days of notification to the breaching party and prior to the closing, (ii) a condition precedent to the obligations of the terminating party that has not been met and it reasonably appears that it will not or cannot be met or (iii) a determination by the Board of Trustees that the consummation of the transactions contemplated by the Agreement is not in the best interests of such Fund.
Comparison of Investment Objectives and Principal Investment Strategies
Although both Funds invest significantly in dividend-paying common stocks, the Funds’ investment objectives and principal investment strategies differ in certain respects, as summarized below.
The investment objective of the Target Fund is to seek long-term capital appreciation with lower absolute volatility than the broad equity market. The investment objective of the Acquiring Fund is to seek an attractive total return comprised of income from dividends and long-term capital appreciation.
Under normal market conditions, the Target Fund invests at least 80% of the sum of its net assets and the amount of any borrowings for investment purposes in equity securities (which are defined to include, among other things, common stocks and preferred securities). The goal of the Target Fund’s portfolio construction process is to produce long-term returns superior to the broad equity market with lower absolute volatility. The Target Fund’s sub-adviser seeks a “beta” (i.e., a measure of a portfolio’s sensitivity to market movements) that is approximately 90% of the beta of the Russell 1000® Index, the Target Fund’s primary benchmark index, although there is no guarantee that
2
this can be achieved. In seeking to lower absolute volatility, the Target Fund historically has invested a high percentage of its assets (approximately 77% of net assets as of February 28, 2018) in dividend-paying common stocks.
Under normal market conditions, the Acquiring Fund invests at least 80% of its net assets in dividend-paying common stocks and preferred securities. Historically, the Acquiring Fund has invested substantially all of its net assets in dividend-paying common stocks. Unlike the Target Fund, as a principal investment strategy, the Acquiring Fund may invest up to 25% of its net assets in non-U.S. equity securities that are U.S. dollar-denominated.
Each Fund may invest in companies of any size, including small-, mid- and large-cap companies.
Distribution, Purchase, Redemption, Exchange of Shares and Dividends
The Funds have identical procedures for purchasing, exchanging and redeeming shares for each share class except Class R3 shares, which are offered by the Acquiring Fund but not by the Target Fund. The Target Fund offers four classes of shares: Class A, Class C, Class R6 and Class I shares. The Acquiring Fund offers five classes of shares: Class A, Class C, Class R3, Class R6 and Class I shares. Each Fund has also established and designated (but is not currently offering) Class T shares. The Adviser is currently the sole holder of all outstanding Class T shares of the Acquiring Fund; the Adviser has not yet seeded Class T shares of the Target Fund. The corresponding classes of each Fund have the same investment eligibility criteria. The Target Fund normally pays dividends from net investment income annually, and the Acquiring Fund normally pays dividends from net investment income quarterly. For each Fund, any net capital gains are normally distributed at least once a year. See “Further Comparison of the Funds—Distribution, Purchase, Redemption, Exchange of Shares and Dividends” below for a more detailed discussion.
Material Federal Income Tax Consequences of the Reorganization
As a condition to closing the Reorganization, the Target Fund and the Acquiring Fund will receive an opinion from Vedder Price P.C., subject to certain representations, assumptions and conditions, substantially to the effect that the Reorganization will qualify as a tax-free reorganization under Section 368(a) of the Internal Revenue Code of 1986, as amended (the “Code”). Accordingly, it is expected that neither Fund will recognize any gain or loss for federal income tax purposes as a direct result of the Reorganization. Prior to the close of regular trading on the New York Stock Exchange on the Closing Date, the Target Fund will declare a distribution of all of its net investment income and net capital gains, if any. All or a portion of such a distribution may be taxable to the Target Fund’s shareholders for federal income tax purposes.
If the Reorganization had occurred as of February 28, 2018, it is estimated that approximately 78% (or $105.4 million) of the Target Fund’s portfolio would have been sold. It is estimated that such portfolio repositioning would have resulted in brokerage commissions or other transaction costs for the Target Fund of approximately $47,900 (0.04% of the Target Fund’s net assets), based on average commission rates normally paid by the Target Fund. These transaction costs represent expenses of the Target Fund that will not be subject to the Target Fund’s expense cap and will be borne by the Target Fund and indirectly borne by the Target Fund’s shareholders. Capital gains from such portfolio sales may result in increased distributions of net capital gain and net investment income. If such sales had occurred as of February 28, 2018, the sales would have resulted in realized gains of approximately $24.2 million (approximately $5.75 per share or 18% of the Target Fund’s net assets).
3
Taking into account the repositioning of the Target Fund, the Acquiring Fund is not expected to sell a material portion (i.e., 5% or more of net assets) of the Target Fund’s assets received in the Reorganization in order to meet its investment policies and restrictions.
For a more detailed discussion of the federal income tax consequences of the Reorganization, please see “The Proposed Reorganization—Material Federal Income Tax Consequences” below.
Risk Factors
In evaluating the Reorganization, you should consider carefully the risks of the Acquiring Fund to which you will be subject if the Reorganization is approved and completed. Investing in a mutual fund involves risk, including the risk that you may receive little or no return on your investment or even that you may lose part or all of your investment. Because of these and other risks, you should consider an investment in the Acquiring Fund to be a long-term investment. An investment in the Acquiring Fund may not be appropriate for all shareholders. For a complete description of the risks of an investment in the Acquiring Fund, see the section in the Acquiring Fund’s prospectus entitled “Principal Risks.”
Although an investment in each Fund is subject to substantially similar risks (i.e., Active Management Risk, Equity Security Risk and Small- and Mid-Cap Stock Risk), an investment in the Acquiring Fund is subject to certain additional principal risks (i.e., Currency Risk and Non-U.S. Investment Risk) related to investments in non-U.S. equity securities, which is not a principal investment strategy of the Target Fund.
The following table provides a comparison of the types of investment risks associated with an investment in each Fund.
| | | | |
Principal Investment Risks | | Target Fund | | Acquiring Fund |
Active Management Risk | | X | | X |
Currency Risk | | — | | X |
Cybersecurity Risk | | X | | X |
Dividend-Paying Security Risk | | — | | X |
Equity Security Risk | | X | | X |
Low Volatility Investment Strategy Risk | | X | | — |
Non-U.S. Investment Risk | | — | | X |
Preferred Security Risk(1) | | — | | X |
Smaller Company Risk(2) | | X | | X |
| (1) | Both Funds are subject to Preferred Security Risk, however, it is a principal risk for the Acquiring Fund. |
| (2) | The Target Fund’s prospectus identifies this risk as Small- and Mid-Cap Stock Risk. Each Fund may invest in companies of any size, meaning an investment in each Fund is subject to the risks of small- and mid-cap stocks. |
A description of these principal investment risks is also provided below.
Active Management Risk—The Fund’s sub-adviser actively manages the Fund’s investments. Consequently, the Fund is subject to the risk that the investment techniques and risk analyses employed by the Fund’s sub-adviser may not produce the desired results. This could cause the Fund to lose value or its investment results to lag relevant benchmarks or other funds with similar objectives.
Currency Risk—Even though the non-U.S. securities held by the Fund are traded in U.S. dollars, their prices are typically indirectly influenced by currency fluctuations. Changes in currency
4
exchange rates may affect the Fund’s net asset value, the value of dividends and interest earned, and gains or losses realized on the sale of securities.
Cybersecurity Risk—Cybersecurity risk is the risk of an unauthorized breach and access to Fund assets, customer data (including private shareholder information), or proprietary information, or the risk of an incident occurring that causes the Fund, its investment adviser or sub-adviser, custodian, transfer agent, distributor or other service provider or a financial intermediary to suffer a data breach, data corruption or lose operational functionality. Successful cyber-attacks or other cyber-failures or events affecting the Fund or its service providers may adversely impact the Fund or its shareholders. Additionally, a cybersecurity breach could affect the issuers in which the Fund invests, which may cause the Fund’s investments to lose value.
Dividend-Paying Security Risk—The Fund’s investment in dividend-paying stocks could cause the Fund to underperform similar funds that invest without consideration of a company’s track record of paying dividends. Stocks of companies with a history of paying dividends may not participate in a broad market advance to the same degree as most other stocks, and a sharp rise in interest rates or economic downturn could cause a company to unexpectedly reduce or eliminate its dividend.
Equity Security Risk—Equity securities in the Fund’s portfolio may decline significantly in price over short or extended periods of time, and such declines may occur because of declines in the equity market as a whole, or because of declines in only a particular country, company, industry, or sector of the market. Holders of common stock generally are subject to more risks than holders of preferred securities because the status of common stockholders upon the bankruptcy of the issuer is subordinated to that of preferred security holders. From time to time, the Fund may invest a significant portion of its assets in companies in one or more related sectors or industries which would make the Fund more vulnerable to adverse developments affecting such sectors or industries.
Low Volatility Investment Strategy Risk—In an attempt to construct a portfolio with lower absolute volatility than the broad equity market, historical data is used to produce a portfolio expected to have a defined level of market risk and the highest projected return for the risk taken. However, individual stock behavior may change in the future, and therefore there is no guarantee that this strategy will be successful.
Non-U.S. Investment Risk—Non-U.S. issuers or U.S. issuers with significant non-U.S. operations may be subject to risks in addition to those of issuers located in or that principally operate in the United States as a result of, among other things, political, social and economic developments abroad and different legal, regulatory and tax environments.
Preferred Security Risk—Preferred securities generally are subordinated to bonds and other debt instruments in a company’s capital structure and therefore will be subject to greater credit risk than those debt instruments. In addition, preferred securities are subject to other risks, such as having no or limited voting rights, being subject to special redemption rights, having distributions deferred or skipped, having floating interest rates or dividends, which may result in a decline in value in a falling interest rate environment, having limited liquidity, changing or unfavorable tax treatments and possibly being issued by companies in heavily regulated industries.
Smaller Company Risk—Small-cap stocks involve substantial risk. Prices of small-cap stocks may be subject to more abrupt or erratic movements, and to wider fluctuations, than stock prices of
5
larger, more established companies or the market averages in general. It may be difficult to sell small-cap stocks at the desired time and price. While mid-cap stocks may be slightly less volatile than small-cap stocks, they still involve similar risks.
Further Comparison of the Funds
Investment Objectives
The investment objective of the Target Fund is to seek long-term capital appreciation with lower absolute volatility than the broad equity market. The investment objective of the Acquiring Fund is to seek an attractive total return comprised of income from dividends and long-term capital appreciation.
Principal Investment Strategies
Although both Funds invest significantly in dividend-paying common stocks, the Funds’ principal investment strategies differ in certain respects, as summarized below.
Under normal market conditions, the Target Fund invests at least 80% of the sum of its net assets and the amount of any borrowings for investment purposes in equity securities (which are defined to include, among other things, common stocks and preferred securities). The goal of the Target Fund’s portfolio construction process is to produce long-term returns superior to the broad equity market with lower absolute volatility. The Target Fund’s sub-adviser seeks a “beta” (i.e., a measure of a portfolio’s sensitivity to market movements) that is approximately 90% of the beta of the Russell 1000® Index, the Target Fund’s primary benchmark index, although there is no guarantee that this can be achieved. In seeking to lower absolute volatility, the Target Fund historically has invested a high percentage of its assets (approximately 77% of net assets as of February 28, 2018) in dividend-paying common stocks.
Under normal market conditions, the Acquiring Fund invests at least 80% of its net assets in dividend-paying common stocks and preferred securities. Historically, the Acquiring Fund has invested substantially all of its net assets in dividend-paying common stocks. Unlike the Target Fund, as a principal investment strategy, the Acquiring Fund may invest up to 25% of its net assets in non-U.S. equity securities that are U.S. dollar-denominated.
6
The table below summarizes each Fund’s principal investment strategies and highlights relevant differences.
| | | | |
Target Fund | | Acquiring Fund | | Differences |
Principal Strategy: | | Principal Strategy: | | |
| | |
Under normal market conditions, the Target Fund invests at least 80% of the sum of its net assets and the amount of any borrowings for investment purposes in equity securities. The Target Fund seeks to limit its volatility by limiting its portfolio’s sensitivity to market movements, sometimes referred to as “beta.” The Target Fund’s sub-adviser targets a beta that is approximately 90% of the beta of the Russell 1000® Index, the Target Fund’s primary benchmark index, although there is no guarantee that this can be achieved. | | Under normal market conditions, the Acquiring Fund invests at least 80% of its net assets in dividend-paying common stocks and preferred securities. | | The Funds have different sub-advisers that employ principal investment strategies that differ in certain respects. |
| | |
Capitalization: | | Capitalization: | | |
| | |
| The Target Fund may invest in companies of any size. | | The Acquiring Fund may invest in small-, mid- and large-cap companies. | | Substantially the same. |
| | |
Non-U.S. Investments: | | Non-U.S. Investments: | | |
| | |
| Not a principal investment strategy. | | The Acquiring Fund may invest up to 25% of its net assets in non-U.S. equity securities that are U.S. dollar-denominated. | | Unlike the Target Fund, the Acquiring Fund may invest in non-U.S. equity securities as a principal investment strategy. |
| | |
Diversification: | | Diversification: | | |
| | |
| The Target Fund is a diversified company under the 1940 Act. | | The Acquiring Fund is a diversified company under the 1940 Act. | | No differences. |
In evaluating the Reorganization, Target Fund shareholders should consider the risks of investing in the Acquiring Fund. The principal risks of investing in the Acquiring Fund are described in the section above entitled “Risk Factors.”
Additional Information Regarding the Funds’ Portfolio Management Styles
Target Fund: The goal of the portfolio construction process is to produce long-term returns superior to the broad equity market with lower absolute volatility. Through security selection and the use of risk controls, and by maintaining a broadly diversified portfolio, the Target Fund’s sub-adviser believes it can reduce volatility while preserving the Target Fund’s potential to generate returns in excess of the market over the long term.
7
The Target Fund’s sub-adviser utilizes a multi-faceted investment process that incorporates fundamental research, comprehensive market views and proactive risk management. Industry-focused analysts draw upon a broad range of resources to identify potential investments, including a top down macro-framework, fundamental bottom-up insights, quantitative analysis, valuation assessment and catalyst identification. Through this stock selection process, the Target Fund’s portfolio management team seeks to identify equity ideas with a favorable risk-adjusted return potential across diverse sectors of the market. With the assistance of quantitative tools, the Target Fund’s sub-adviser monitors the levels and types of risks in the portfolio and positions the portfolio based on its macroeconomic and market outlook.
Acquiring Fund: Companies in certain economic sectors of the market have historically provided higher dividend yields than companies in other sectors and industries. As a result, given the Acquiring Fund’s focus on dividend-paying securities, the Acquiring Fund may, from time to time, have a greater exposure to higher dividend-yield sectors and industries than the broad equity market.
Fees and Expenses
The tables below provide information about the fees and expenses attributable to each class of shares of the Funds and the pro forma fees and expenses of the Acquiring Fund following the Reorganization. Shareholder fees reflect the fees currently in effect for each Fund. Annual fund operating expenses reflect the actual expenses of the Target Fund for its fiscal year ended September 30, 2017 and the actual expenses of the Acquiring Fund for the six months ended January 31, 2018, annualized. The Acquiring Fund Pro Forma fees and expenses are based on the amounts shown in the table for each Fund, assuming the Reorganization occurred as of January 31, 2018.
Shareholder Fees
(fees paid directly from your investment)
| | | | | | | | | | | | |
| | | Target Fund | | | Acquiring Fund | | | Acquiring Fund
Pro Forma | |
Maximum Sales Charge (Load) Imposed on Purchases (as a percentage of Offering Price) | | | | | | | | | | | | |
Class A(1) | | | 5.75 | % | | | 5.75 | % | | | 5.75 | % |
Class C | | | None | | | | None | | | | None | |
Class R6 | | | None | | | | None | | | | None | |
Class I | | | None | | | | None | | | | None | |
Maximum Deferred Sales Charge (Load) (as a percentage of the lesser of purchase price or redemption proceeds)(2) | | | | | | | | | | | | |
Class A | | | None | | | | None | | | | None | |
Class C | | | 1.00 | % | | | 1.00 | % | | | 1.00 | % |
Class R6 | | | None | | | | None | | | | None | |
Class I | | | None | | | | None | | | | None | |
Maximum Sales Charge (Load) Imposed on Reinvested Dividends | | | | | | | | | | | | |
Class A | | | None | | | | None | | | | None | |
Class C | | | None | | | | None | | | | None | |
Class R6 | | | None | | | | None | | | | None | |
Class I | | | None | | | | None | | | | None | |
8
| | | | | | | | | | | | |
| | | Target Fund | | | Acquiring Fund | | | Acquiring Fund
Pro Forma | |
Exchange Fee | | | | | | | | | | | | |
Class A | | | None | | | | None | | | | None | |
Class C | | | None | | | | None | | | | None | |
Class R6 | | | None | | | | None | | | | None | |
Class I | | | None | | | | None | | | | None | |
Annual Low Balance Account Fee (for accounts under $1,000)(3) | | | | | | | | | | | | |
Class A | | | $15 | | | | $15 | | | | $15 | |
Class C | | | $15 | | | | $15 | | | | $15 | |
Class R6 | | | None | | | | None | | | | None | |
Class I | | | $15 | | | | $15 | | | | $15 | |
| (1) | No front-end sales charge will be imposed on the Class A shares of the Acquiring Fund received in connection with the Reorganization. Additional information regarding sales load waivers for Class A shares can be found in the Acquiring Fund’s prospectus under “How to Reduce Your Sales Charge—Class A Sales Charge Waivers.” |
| (2) | Class C shares are subject to a contingent deferred sales charge if redeemed within 12 months of purchase. Class A share purchases of $1 million or more that were not subject to a front-end sales load are subject to a contingent deferred sales charge if redeemed within 18 months of purchase. For shares received in the Reorganization, such charge will be applied to Class C and Class A shares redeemed within 12 months and 18 months, respectively, of purchase of your Target Fund shares. |
| (3) | Fee applies to the following types of accounts under $1,000 held directly with a Fund: individual retirement accounts (IRAs), Coverdell Education Savings Accounts, and accounts established pursuant to the Uniform Transfers to Minors Act (UTMA) or the Uniform Gifts to Minors Act (UGMA). |
Annual Fund Operating Expenses
(expenses that you pay each year as a percentage of the value of your investment)
| | | | | | | | | | | | |
| | | Target Fund | | | Acquiring Fund | | | Acquiring Fund
Pro Forma | |
Management Fees | | | | | | | | | | | | |
Class A | | | 0.68 | % | | | 0.61 | % | | | 0.61 | % |
Class C | | | 0.68 | % | | | 0.61 | % | | | 0.61 | % |
Class R6 | | | 0.68 | % | | | 0.61 | % | | | 0.61 | % |
Class I | | | 0.68 | % | | | 0.61 | % | | | 0.61 | % |
Distribution and Service (12b-1) Fees | | | | | | | | | | | | |
Class A | | | 0.25 | % | | | 0.25 | % | | | 0.25 | % |
Class C | | | 1.00 | % | | | 1.00 | % | | | 1.00 | % |
Class R6 | | | 0.00 | % | | | 0.00 | % | | | 0.00 | % |
Class I | | | 0.00 | % | | | 0.00 | % | | | 0.00 | % |
Other Expenses | | | | | | | | | | | | |
Class A | | | 0.29 | % | | | 0.10 | % | | | 0.10 | % |
Class C | | | 0.29 | % | | | 0.10 | % | | | 0.10 | % |
Class R6 | | | 0.19 | % | | | 0.03 | % | | | 0.03 | % |
Class I | | | 0.29 | % | | | 0.10 | % | | | 0.10 | % |
Total Annual Fund Operating Expenses | | | | | | | | | | | | |
Class A | | | 1.22 | % | | | 0.96 | % | | | 0.96 | % |
Class C | | | 1.97 | % | | | 1.71 | % | | | 1.71 | % |
Class R6 | | | 0.87 | % | | | 0.64 | % | | | 0.64 | % |
Class I | | | 0.97 | % | | | 0.71 | % | | | 0.71 | % |
Fee Waivers and/or Expense Reimbursements | | | | | | | | | | | | |
Class A | | | (0.21 | )%(1) | | | — | (2) | | | — | (2) |
Class C | | | (0.21 | )%(1) | | | — | (2) | | | — | (2) |
Class R6 | | | (0.21 | )%(1) | | | — | (2) | | | — | (2) |
Class I | | | (0.21 | )%(1) | | | — | (2) | | | — | (2) |
9
| | | | | | | | | | | | |
| | | Target Fund | | | Acquiring Fund | | | Acquiring Fund
Pro Forma | |
Total Annual Fund Operating Expenses – After Fee Waivers and/or Expense Reimbursements | | | | | | | | | | | | |
Class A | | | 1.01 | % | | | 0.96 | % | | | 0.96 | % |
Class C | | | 1.76 | % | | | 1.71 | % | | | 1.71 | % |
Class R6 | | | 0.66 | % | | | 0.64 | % | | | 0.64 | % |
Class I | | | 0.76 | % | | | 0.71 | % | | | 0.71 | % |
| (1) | Nuveen Fund Advisors has agreed to waive fees and/or reimburse expenses through July 31, 2019 so that the total annual fund operating expenses (excluding 12b-1 distribution and/or service fees, interest expenses, taxes, acquired fund fees and expenses, fees incurred in acquiring and disposing of portfolio securities and extraordinary expenses) do not exceed 0.78% (1.45% after July 31, 2019) of the average daily net assets of any class of Target Fund shares. However, because Class R6 shares are not subject to sub-transfer agent and similar fees, the total annual fund operating expenses for the Class R6 shares will be less than the expense limitation. The expense limitation that expires on July 31, 2019 may be terminated or modified prior to that date only with the approval of the Board of Trustees. The permanent expense limitation in effect thereafter may be terminated or modified only with the approval of shareholders of the Target Fund. |
| (2) | Nuveen Fund Advisors has agreed to waive fees and/or reimburse expenses so that the total annual fund operating expenses (excluding 12b-1 distribution and/or service fees, interest expenses, taxes, acquired fund fees and expenses, fees incurred in acquiring and disposing of portfolio securities and extraordinary expenses) do not exceed 1.25% of the average daily net assets of any class of Acquiring Fund shares. However, because Class R6 shares are not subject to sub-transfer agent and similar fees, the total annual fund operating expenses for the Class R6 shares will be less than the expense limitation. This permanent expense limitation may be terminated or modified only with the approval of shareholders of the Acquiring Fund. |
Examples
The examples below are intended to help you compare the cost of investing in each Fund and the pro forma cost of investing in the Acquiring Fund following the Reorganization. The examples assume you invest $10,000 in a Fund for the time periods indicated (based on information in the tables above) and then either redeem or do not redeem your shares at the end of a period. The examples assume that your investment has a 5% return each year and that a Fund’s expenses remain at the level shown in the table above. For presentation purposes, the examples below assume the Reorganization is effective as of September 1, 2018, the first day of the month following the actual expected closing of the Reorganization. These amounts are estimated; actual operating expenses will vary based on asset size and other factors.
The examples below assume that you sell your shares at the end of a period, but the estimated costs are the same if you do not sell your shares at the end of a period. Although your actual costs may be higher or lower, based on these assumptions your costs would be:
| | | | | | | | | | | | |
| | | Target Fund | | | Acquiring Fund | | | Acquiring Fund
Pro Forma | |
1 Year | | | | | | | | | | | | |
Class A | | $ | 674 | | | $ | 667 | | | $ | 667 | |
Class C | | $ | 181 | | | $ | 174 | | | $ | 174 | |
Class R6 | | $ | 69 | | | $ | 65 | | | $ | 65 | |
Class I | | $ | 79 | | | $ | 73 | | | $ | 73 | |
3 Years | | | | | | | | | | | | |
Class A | | $ | 922 | | | $ | 863 | | | $ | 863 | |
Class C | | $ | 600 | | | $ | 539 | | | $ | 539 | |
Class R6 | | $ | 258 | | | $ | 205 | | | $ | 205 | |
Class I | | $ | 290 | | | $ | 227 | | | $ | 227 | |
10
| | | | | | | | | | | | |
| | | Target Fund | | | Acquiring Fund | | | Acquiring Fund
Pro Forma | |
5 Years | | | | | | | | | | | | |
Class A | | $ | 1,189 | | | $ | 1,075 | | | $ | 1,075 | |
Class C | | $ | 1,045 | | | $ | 928 | | | $ | 928 | |
Class R6 | | $ | 463 | | | $ | 357 | | | $ | 357 | |
Class I | | $ | 518 | | | $ | 395 | | | $ | 395 | |
10 Years | | | | | | | | | | | | |
Class A | | $ | 1,951 | | | $ | 1,685 | | | $ | 1,685 | |
Class C | | $ | 2,280 | | | $ | 2,019 | | | $ | 2,019 | |
Class R6 | | $ | 1,055 | | | $ | 798 | | | $ | 798 | |
Class I | | $ | 1,172 | | | $ | 883 | | | $ | 883 | |
The expense example figures above reflect the imposition of the maximum sales charge (load) imposed on purchases of Class A shares, and these figures are applicable to purchases of Acquiring Fund shares made after completion of the Reorganization. However, no sales charge will be imposed on Class A shares of the Acquiring Fund that are received in connection with the Reorganization. Based on the assumptions described above, and removing the effect of the sales charge, your costs of investing in Class A shares received in connection with the Reorganization would be:
| | | | |
Class A Shares | | Acquiring Fund Pro Forma | |
1 Year | | $ | 98 | |
3 Years | | $ | 306 | |
5 Years | | $ | 531 | |
10 Years | | $ | 1,178 | |
Performance Information
The total returns of each Fund for the periods ended December 31, 2017, based on historical fees and expenses for each period, are set forth in the bar charts and tables below.
The bar charts below illustrate calendar year returns for each Fund’s Class A shares. The performance of the other share classes will differ due to their different expense structures. The bar charts and the highest/lowest quarterly return information that follow do not reflect sales charges, and if these charges were reflected, the returns would be less than those shown.
The tables below illustrate average annual total returns for the one-year, five-year and ten-year periods ended December 31, 2017 for Class A, Class C and Class I shares of each Fund and for the one-year and since inception periods ended December 31, 2017 for Class R6 shares of each Fund. The tables also show how each Fund’s performance compares with the returns of a broad measure of market performance and an index of funds with similar investment objectives. This information is intended to help you assess the variability of Fund returns (and, consequently, the potential risks of a Fund investment).
All after-tax returns are calculated using the historical highest individual federal marginal income tax rates and do not reflect the impact of state and local taxes. After-tax returns are shown for Class A shares only; after-tax returns for other share classes will vary. Returns for market indices do not include operating expenses, which are deducted from Fund returns, or taxes. Your own actual after-tax returns will depend on your specific tax situation and may differ from what is shown here. After-tax returns are not relevant to investors who hold Fund shares in tax-advantaged accounts, such as IRAs or employer-sponsored retirement plans; but such investors generally are subject to tax on withdrawals from such accounts.
11
Both the bar charts and the tables assume that all distributions have been reinvested. Performance reflects fee waivers and operating expense limitations, if any, in effect during the periods presented. If any such fee waivers and expense limitations were not in place, performance would be reduced. A Fund’s past performance (before and after taxes) is not necessarily an indication of how the Fund will perform in the future. Current performance information for the Funds is available at www.nuveen.com/performance or by calling (800) 257-8787.
Target Fund—Class A Annual Total Return*
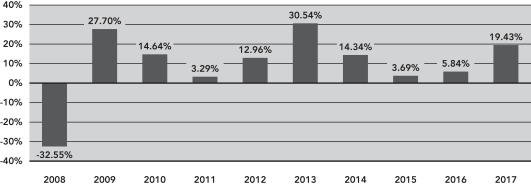
| * | Class A year-to-date total return as of March 31, 2018 was 0.63%. The performance of the other share classes will differ due to their different expense structures. |
During the ten-year period ended December 31, 2017, the Target Fund’s Class A highest and lowest quarterly returns were 12.19% and -20.65%, respectively, for the quarters ended June 30, 2009 and December 31, 2008.
Acquiring Fund—Class A Annual Total Return*
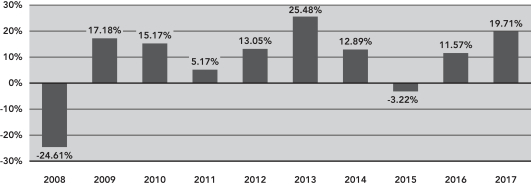
| * | Class A year-to-date total return as of March 31, 2018 was -2.27%. The performance of the other share classes will differ due to their different expense structures. |
During the ten-year period ended December 31, 2017, the Acquiring Fund’s Class A highest and lowest quarterly returns were 14.44% and -13.94%, respectively, for the quarters ended September 30, 2010 and December 31, 2008.
12
| | | | | | | | | | | | | | | | | | | | |
| | | Average Annual Total Returns for the Periods
Ended December 31, 2017 | |
Target Fund | | Inception
Date | | | 1 Year | | | 5 Years | | | 10 Years | | | Since
Inception
(Class R6) | |
Class A (return before taxes) | | | 9/28/07 | | | | 12.58 | % | | | 13.01 | % | | | 7.82 | % | | | N/A | |
Class A (return after taxes on distributions) | | | | | | | 11.31 | % | | | 11.19 | % | | | 6.86 | % | | | N/A | |
Class A (return after taxes on distributions and sale of Fund shares) | | | | | | | 8.17 | % | | | 9.82 | % | | | 6.07 | % | | | N/A | |
Class C (return before taxes) | | | 9/28/07 | | | | 18.51 | % | | | 13.51 | % | | | 7.65 | % | | | N/A | |
Class R6 (return before taxes) | | | 6/30/16 | | | | 19.83 | % | | | N/A | | | | N/A | | | | 14.92 | % |
Class I (return before taxes) | | | 9/28/07 | | | | 19.72 | % | | | 14.65 | % | | | 8.73 | % | | | N/A | |
Russell 1000® Index(1) (reflects no deduction for fees, expenses or taxes) | | | | | | | 21.69 | % | | | 15.71 | % | | | 8.59 | % | | | 20.99 | % |
S&P 500® Index(2) (reflects no deduction for fees, expenses or taxes) | | | | | | | 21.83 | % | | | 15.79 | % | | | 8.50 | % | | | 20.94 | % |
Lipper Multi-Cap Core Funds Category Average (reflects no deduction for taxes or sales loads)(3) | | | | | | | 19.47 | % | | | 13.74 | % | | | 7.13 | % | | | 20.95 | % |
| (1) | An index that measures the performance of the large-cap segment of the U.S. equity universe which includes approximately 1,000 of the largest securities based on a contribution of their market cap and current index measurement. |
| (2) | An unmanaged index generally considered representative of the U.S. stock market. |
| (3) | Represents the average annualized returns for all reporting funds in the Lipper Multi-Cap Core Funds Category. |
| | | | | | | | | | | | | | | | | | | | |
| | | Average Annual Total Returns for the Periods
Ended December 31, 2017 | |
Acquiring Fund | | Inception
Date | | | 1 Year | | | 5 Years | | | 10 Years | | | Since
Inception
(Class R6) | |
Class A (return before taxes) | | | 3/28/06 | | | | 12.82 | % | | | 11.53 | % | | | 7.64 | % | | | N/A | |
Class A (return after taxes on distributions) | | | | | | | 11.67 | % | | | 10.56 | % | | | 7.02 | % | | | N/A | |
Class A (return after taxes on distributions and sale of Fund shares) | | | | | | | 8.16 | % | | | 9.03 | % | | | 6.11 | % | | | N/A | |
Class C (return before taxes) | | | 3/28/06 | | | | 18.83 | % | | | 12.02 | % | | | 7.47 | % | | | N/A | |
Class R6 (return before taxes) | | | 3/25/13 | | | | 20.08 | % | | | N/A | | | | N/A | | | | 12.11 | % |
Class I (return before taxes) | | | 3/28/06 | | | | 20.03 | % | | | 13.14 | % | | | 8.55 | % | | | N/A | |
S&P 500® Index(1) (reflects no deduction for fees, expenses or taxes) | | | | | | | 21.83 | % | | | 15.79 | % | | | 8.50 | % | | | 14.36 | % |
Lipper Equity Income Funds Category Average(2) (reflects no deduction for taxes or sales loads) | | | | | | | 15.45 | % | | | 12.31 | % | | | 6.99 | % | | | 10.76 | % |
| (1) | An unmanaged index generally considered representative of the U.S. stock market. |
| (2) | Represents the average annualized returns for all reporting funds in the Lipper Equity Income Funds Category. |
Portfolio Turnover
Each Fund pays transaction costs, such as commissions, when it buys and sells securities (or “turns over” its portfolio). A higher portfolio turnover rate may indicate higher transaction costs and may result in higher taxes when Fund shares are held in a taxable account. These costs, which are not reflected in annual fund operating expenses or in the example, affect a Fund’s performance. During their most recent fiscal years, the Funds had the following portfolio turnover rates:
| | | | | | | | |
Fund | | Fiscal Year Ended | | | Rate | |
Target Fund | | | 9/30/17 | | | | 67 | % |
Acquiring Fund | | | 7/31/17 | | | | 22 | % |
13
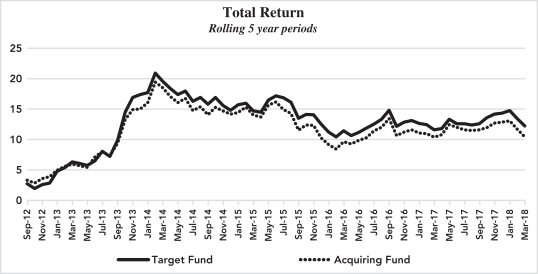
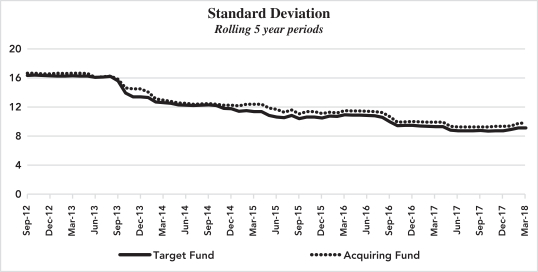
The charts below compare the performance (measured as total return) and risk (measured as standard deviation) of the Funds’ Class A shares on a three-month rolling basis for the five-year period ended January 31, 2018. As reflected in the charts, the Funds have similar performance and risk profiles over this period.
14
Fundamental Investment Restrictions
The Funds have fundamental investment restrictions, set forth below, that are identical. These fundamental investment restrictions, together with the investment objective of each of the Funds, may not be changed for a Fund without the approval of the holders of a majority of the Fund’s outstanding voting shares. For this purpose, a majority of a Fund’s outstanding voting shares means the vote of (1) 67% or more of the Fund’s shares, voting as a single class, present at a meeting, if the holders of more than 50% of the Fund’s outstanding shares are present or represented by proxy; or (2) more than 50% of the Fund’s shares, voting as a single class, whichever is less.
As a fundamental policy, each Fund is diversified, as set forth in number (1) below. Each Fund has adopted a policy of not concentrating its investments in any industry, as set forth in number (8) below.
Fundamental Investment Restrictions (Both Funds)
Each of the Funds, as a fundamental policy, may not, without the approval of the holders of a majority of the Fund’s outstanding voting shares:
(1) With respect to 75% of the total assets of the Fund, individually, purchase the securities of any issuer (except securities issued or guaranteed by the United States government or any agency or instrumentality thereof) if, as a result, (i) more than 5% of the Fund’s total assets would be invested in securities of that issuer, or (ii) the Fund would hold more than 10% of the outstanding voting securities of that issuer.
(2) Borrow money, except as permitted by the 1940 Act and exemptive orders granted under the 1940 Act.
(3) Act as an underwriter of another issuer’s securities, except to the extent that the Fund may be deemed to be an underwriter within the meaning of the Securities Act of 1933 in connection with the purchase and sale of portfolio securities.
(4) Make loans, except as permitted by the 1940 Act and exemptive orders granted under the 1940 Act.
(5) Purchase or sell physical commodities, unless acquired as a result of ownership of securities or other instruments; but this restriction shall not prohibit the Fund from investing in options on commodity indices, commodity futures contracts and options thereon, commodity-related swap agreements, other commodity-related derivative instruments, and investment companies that provide exposure to commodities.
(6) Purchase or sell real estate unless acquired as a result of ownership of securities or other instruments (but this shall not prohibit the Fund from purchasing or selling securities or other instruments backed by real estate or of issuers engaged in real estate activities).
(7) Issue senior securities, except as permitted under the 1940 Act.
(8) Purchase the securities of any issuer if, as a result, 25% or more of the Fund’s total assets would be invested in the securities of issuers whose principal business activities are in the same industry; except that this restriction shall not be applicable to securities issued or guaranteed by the U.S. government or any agency or instrumentality thereof.
15
For each Fund, except with respect to the limitation set forth in number (2) above, the foregoing restrictions and limitations will apply only at the time of purchase of securities, and the percentage limitations will not be considered violated unless an excess or deficiency occurs or exists immediately after and as a result of an acquisition of securities, unless otherwise indicated.
For each Fund, for purposes of applying the limitations set forth in numbers (2) and (7) above, under the 1940 Act as currently in effect, a Fund is not permitted to issue senior securities, except that the Fund may borrow from any bank if immediately after such borrowing the value of the Fund’s total assets is at least 300% of the principal amount of all of the Fund’s borrowings (i.e., the principal amount of the borrowings may not exceed 33 1/3% of the Fund’s total assets). In the event that such asset coverage shall at any time fall below 300%, the Fund shall, within three calendar days thereafter (not including Sundays and holidays), reduce the amount of its borrowings to an extent that the asset coverage of such borrowing shall be at least 300%. No exemptive orders have been issued with respect to the limitation set forth in number (2).
For each Fund, for purposes of applying the limitation set forth in number (4) above, there are no limitations with respect to unsecured loans made by a Fund to an unaffiliated party. However, if the Fund loans its portfolio securities, the obligation on the part of the Fund to return collateral upon termination of the loan could be deemed to involve the issuance of a senior security within the meaning of Section 18(f) of the 1940 Act. In order to avoid violation of Section 18(f), the Fund may not make a loan of portfolio securities if, as a result, more than one-third of its total asset value (at market value computed at the time of making a loan) would be on loan. No exemptive orders have been issued with respect to the limitation set forth in number (4).
For each Fund, for purposes of applying the limitation set forth in number (8) above, issuers of the following securities will not be considered to be members of any industry: securities of the U.S. government and its agencies or instrumentalities; except as set forth in the following sentence, tax-exempt securities of state, territory, possession or municipal governments and their authorities, agencies, instrumentalities or political subdivisions; and repurchase agreements collateralized by any such obligations. To the extent that the income from a municipal bond is derived principally from the assets and revenues of non-governmental users, the securities will be deemed to be from the industry of that non-governmental user. To the extent a Fund invests in other investment companies, it will consider the investments of the underlying investment companies when determining compliance with the limitation set forth in number (8) above, to the extent the Fund has sufficient information about such investments. For purposes of this limitation, all sovereign debt of a single country will be considered investments in a single industry.
Where a security is guaranteed by a governmental entity or some other facility, such as a bank guarantee or letter of credit, such a guarantee or letter of credit would be considered a separate security and would be treated as an issue of such government, other entity or bank.
Investment Adviser and Sub-Advisers
Each Fund is managed by Nuveen Fund Advisors, LLC (previously defined as “Nuveen Fund Advisors” or the “Adviser”), which offers advisory and investment management services to a broad range of investment company clients. Nuveen Fund Advisors has overall responsibility for management of the Funds, oversees the management of the Funds’ portfolios, manages the Funds’ business affairs and provides certain clerical, bookkeeping and other administrative services. Nuveen
16
Fund Advisors is located at 333 West Wacker Drive, Chicago, Illinois 60606. Nuveen Fund Advisors is a subsidiary of Nuveen, LLC, the investment management arm of Teachers Insurance and Annuity Association of America (“TIAA”). TIAA is a life insurance company founded in 1918 by the Carnegie Foundation for the Advancement of Teaching and is the companion organization of College Retirement Equities Fund. As of December 31, 2017, Nuveen, LLC managed approximately $970 billion in assets, of which approximately $139 billion was managed by Nuveen Fund Advisors.
Nuveen Fund Advisors has selected its affiliate, Symphony Asset Management LLC (previously defined as “Symphony”), located at 555 California Street, Suite 2975, San Francisco, California 94104, to serve as the sub-adviser to the Target Fund. Symphony manages the investment of the Fund’s assets on a discretionary basis, subject to the supervision of Nuveen Fund Advisors.
Nuveen Fund Advisors has selected its affiliate, Santa Barbara Asset Management, LLC (“Santa Barbara”), located at 2049 Century Park East, 17th Floor, Los Angeles, California 90067, to serve as sub-adviser to the Acquiring Fund. Santa Barbara manages the investment of the Fund’s assets on a discretionary basis, subject to the supervision of Nuveen Fund Advisors. Santa Barbara will continue to serve as the sub-adviser to the Acquiring Fund following the Reorganization.
Portfolio Managers
Portfolio Managers of the Target Fund. Gunther Stein has served as a portfolio manager of the Target Fund since June 2010, Ross Sakamoto, CFA, has served as a portfolio manager of the Target Fund since July 2010, and Marc Snyder has served as a portfolio manager of the Target Fund since July 2014.
Gunther Stein is Chief Investment Officer, Chief Executive Officer and Co-Portfolio Manager at Symphony and has over 30 years of investment experience. Mr. Stein is responsible for leading Symphony’s fixed-income and equity investments strategies and research efforts, and overseeing firm trading.
Ross Sakamoto, CFA, Co-Director of Equity and Co-Portfolio Manager, has been responsible for co-heading Symphony’s equity investment strategies since 2010.
Marc Snyder, Co-Director of Equity and Co-Portfolio Manager, is a member of the equity team at Symphony. His responsibilities include portfolio management and fundamental research for Symphony’s equity strategies, concentrating on the financial sector.
Portfolio Manager of the Acquiring Fund. James R. Boothe, CFA, has served as a portfolio manager of the Acquiring Fund since March 2006. Mr. Boothe will continue to manage the Acquiring Fund following the Reorganization.
James R. Boothe, CFA, is Chief Investment Officer and Portfolio Manager for Santa Barbara. He joined the firm in 2002.
For a complete description of the advisory services provided to each Fund, see the section of each Fund’s prospectus entitled “Who Manages the Funds” and the sections of each Fund’s statement of additional information entitled “Investment Adviser” and “Sub-Adviser.” Additional information
17
about the portfolio manager compensation structure, other accounts managed by the portfolio managers and the portfolio managers’ ownership of securities in the Funds is provided in each Fund’s statement of additional information.
Advisory and Other Fees
Pursuant to an investment management agreement between Nuveen Fund Advisors and the Trust, on behalf of the Funds, each Fund pays Nuveen Fund Advisors a fund-level fee, payable monthly, at the annual rates set forth below:
Current Fund-Level Fee Schedule for each Fund
| | | | |
Average Daily Net Assets | | Annual Fee Rate | |
For the first $125 million | | | 0.5000 | % |
For the next $125 million | | | 0.4875 | % |
For the next $250 million | | | 0.4750 | % |
For the next $500 million | | | 0.4625 | % |
For the next $1 billion | | | 0.4500 | % |
For the next $3 billion | | | 0.4250 | % |
For the next $2.5 billion | | | 0.4000 | % |
For the next $2.5 billion | | | 0.3875 | % |
For net assets over $10 billion | | | 0.3750 | % |
In addition to the fund-level fee, each Fund pays Nuveen Fund Advisors a complex-level fee based on the aggregate amount of all “eligible assets” managed by Nuveen Fund Advisors. The complex-level fee begins at a maximum annual rate of 0.2000% of the Fund’s average daily net assets, based upon complex-level eligible assets of up to $55 billion, with breakpoints for eligible assets above that level. Except as described below, eligible assets consist of the assets of all open-end and closed-end registered investment companies managed by Nuveen Fund Advisors. Eligible assets include assets of the Nuveen closed-end funds that are attributable to financial leverage. For this purpose, financial leverage includes the closed-end funds’ use of preferred shares and borrowings and certain investments in the residual interest certificates (also called inverse floating rate securities) in tender option bond (TOB) trusts, including the portion of assets held by a TOB trust that has been effectively financed by the trust’s issuance of floating rate securities, subject to an agreement by the Adviser as to certain funds to limit the amount of such assets for determining eligible assets in certain circumstances. Eligible assets do not include assets attributable to investments in (i) other Nuveen funds or (ii) assets in excess of a determined amount (originally $2 billion) added to the Nuveen fund complex in connection with Nuveen Fund Advisors’ assumption of the management of the former First American Funds effective January 1, 2011 (“FAF Ineligible Assets”).
The Acquiring Fund’s complex-level fee rate is currently the overall complex-level fee rate. The Target Fund’s complex-level fee rate is determined by taking the current overall complex-level fee rate and making, as appropriate, an upward adjustment to that rate based upon the percentage of the Target Fund’s assets that are FAF Ineligible Assets. As of January 31, 2018, the effective complex-level fee rate was 0.1767% for the Target Fund and 0.1591% for the Acquiring Fund. Because the Acquiring Fund would acquire the Target Fund’s FAF Ineligible Assets in connection with the Reorganization, the Acquiring Fund’s complex-level fee rate following the Reorganization would be determined by taking the current overall complex-level fee rate and making, as appropriate, an upward adjustment to that rate based upon the percentage of the Acquiring Fund’s assets that are FAF
18
Ineligible Assets. As such, assuming the Reorganization was completed as of January 31, 2018, the complex-level fee rate for the Acquiring Fund would have increased by 0.0007%; however, this increase in the Acquiring Fund’s complex-level fee rate would have been offset by a larger decrease of 0.0022% in the Acquiring Fund’s fund-level fee rate, such that the Acquiring Fund’s overall management fee rate would have decreased as of that date. This slight decrease is not apparent in the expense table set forth on page 9 due to rounding conventions.
Each Fund’s investment management agreement and sub-advisory agreement were last approved for continuance by the Board of Trustees at an in-person meeting held on May 23–25, 2017. Information regarding the Board of Trustees’ considerations in determining to approve continuation of the investment management agreement and sub-advisory agreement (i) for the Target Fund are available in the Target Fund’s Annual Report for the fiscal year ended September 30, 2017, and (ii) for the Acquiring Fund are available in the Acquiring Fund’s Annual Report for the fiscal year ended July 31, 2017.
Nuveen Fund Advisors has agreed to waive fees and/or reimburse expenses of the Target Fund through July 31, 2019 so that the total annual fund operating expenses (excluding 12b-1 distribution and/or service fees, interest expenses, taxes, acquired fund fees and expenses, fees incurred in acquiring and disposing of portfolio securities and extraordinary expenses) do not exceed 0.78% of the average daily net assets of any class of Target Fund shares. However, because Class R6 shares are not subject to sub-transfer agent and similar fees, the total annual fund operating expenses for the Class R6 shares will be less than the expense limitation. The expense limitation that expires on July 31, 2019 may be terminated or modified prior to that date only with the approval of the Board of Trustees. There is also a permanent expense limitation for the Target Fund of 1.45%, which may be terminated or modified only with the approval of shareholders of the Target Fund.
Nuveen Fund Advisors has agreed to waive fees and/or reimburse expenses of the Acquiring Fund so that the total annual fund operating expenses (excluding 12b-1 distribution and/or service fees, interest expenses, taxes, acquired fund fees and expenses, fees incurred in acquiring and disposing of portfolio securities and extraordinary expenses) do not exceed 1.25% of the average daily net assets of any class of Acquiring Fund shares. However, because Class R6 shares are not subject to sub-transfer agent and similar fees, the total annual fund operating expenses for the Class R6 shares will be less than the expense limitation. This permanent expense limitation for the Acquiring Fund may be terminated or modified only with the approval of shareholders of the Acquiring Fund.
For the Target Fund’s fiscal year ended September 30, 2017 and for the Acquiring Fund’s fiscal year ended July 31, 2017, each Fund paid Nuveen Fund Advisors the following management fees (net of fee waivers and expense reimbursements, where applicable), as a percentage of the Fund’s average daily net assets:
| | | | |
| | | Management Fee Rate | |
Target Fund | | | 0.46 | % |
Acquiring Fund | | | 0.61 | % |
Each Fund has adopted a distribution and service plan pursuant to Rule 12b-1 under the 1940 Act (the “Rule 12b-1 Plans”). Under the Rule 12b-1 Plans, for each Fund (a) Class A shares are subject to an annual service fee of 0.25% of the average daily net assets of its Class A shares, and (b) Class C shares are subject to (i) an annual distribution fee of 0.75% and (ii) an annual service fee of 0.25%, of the average daily net assets of its Class C shares. For each Fund, Class R6 and Class I shares are not subject to either distribution or service fees.
19
For a complete description of each Fund’s distribution and service arrangements, see the section of each Fund’s prospectus entitled “What Share Classes We Offer” and the section of each Fund’s statement of additional information entitled “Distribution and Service Plan.”
Board Members and Officers
The management of each Fund, including general oversight of the duties performed by Nuveen Fund Advisors under the investment management agreement for each Fund, is the responsibility of the Board of Trustees. Each Fund has the same individuals serving as Trustees and officers. As of the date of this Proxy Statement/Prospectus, there are eleven members of the Board of Trustees, one of whom is an “interested person” (as defined in the 1940 Act) and ten of whom are not interested persons (the “Independent Board Members”). The names and business addresses of the Trustees and officers of each Fund and their principal occupations and other affiliations during the past five years are set forth under “Management” in each Fund’s statement of additional information, as supplemented, which is incorporated herein by reference.
Distribution, Purchase, Redemption, Exchange of Shares and Dividends
The Target Fund currently offers four classes of shares: Class A, Class C, Class R6 and Class I. The Acquiring Fund currently offers five classes of shares: Class A, Class C, Class R3, Class R6 and Class I. Each Fund has also established and designated (but is not currently offering) Class T shares. The Adviser is currently the sole holder of all outstanding Class T shares of the Acquiring Fund; the Adviser has not yet seeded Class T shares of the Target Fund. You may purchase, redeem or exchange shares of the Funds on any business day, which is any day on which the New York Stock Exchange is open for business. You may purchase, redeem or exchange shares of the Funds through a financial advisor or other financial intermediary or, with respect to Class R3, Class R6 and Class I shares only, directly from the respective Fund. No initial sales charge or contingent deferred sales charges will be imposed on shares of the Acquiring Fund received or shares of the Target Fund exchanged in connection with the Reorganization. Any Acquiring Fund shares received in exchange for Target Fund shares pursuant to the Reorganization will be subject to the Acquiring Fund’s standard fee structure applicable to the class of Acquiring Fund shares received. Class A shares of the Acquiring Fund are subject to a sales load, which will apply to purchases of Acquiring Fund shares made after completion of the Reorganization; however, the sales load will be waived for shares issued in the Reorganization. Class C shares of the Acquiring Fund, as well as Acquiring Fund Class A share purchases of $1 million or more, which are not subject to a front-end sales load, are subject to a contingent deferred sales charge that will apply to purchases of Acquiring Fund shares made after completion of the Reorganization. With respect to Class A and Class C shares of the Target Fund that are subject to a contingent deferred sales charge, shares of the corresponding class of the Acquiring Fund received in the Reorganization will be subject to the Acquiring Fund’s contingent deferred sales charge if they are redeemed within 12 months of the date you purchased your Target Fund Class C shares and within 18 months of the date you purchased your Target Fund Class A shares. Class R6 shares, which are available to certain qualified retirement plans and other investors, and Class I shares are not subject to sales charges or ongoing service or distribution fees. The Acquiring Fund’s initial and subsequent investment minimums generally are as set forth in the table below, although the Fund may reduce or waive the minimums in some cases. The Acquiring Fund will waive the initial investment minimum for Target Fund shareholders who receive shares in connection with the Reorganization. The Target Fund’s investment minimums are identical to those of the Acquiring Fund for each respective share class as outlined below.
20
| | | | | | |
| | | Class A and Class C | | Class R6 | | Class I |
Eligibility and
Minimum Initial Investment | | $3,000 for all accounts except: • $2,500 for Traditional/Roth IRA accounts. • $2,000 for Coverdell Education Savings Accounts. • $250 for accounts through fee-based programs. • No minimum for retirement plans. | | Available only to certain qualified retirement plans and other investors as described in the prospectus and through fee-based programs. $1 million for all accounts except: • $100,000 for clients of financial intermediaries who charge such clients an ongoing fee for advisory, investment, consulting or related services. • No minimum for certain qualified retirement plans and certain other categories of eligible investors as described in the prospectus. | | Available only through fee-based programs and certain retirement plans, and to other limited categories of investors as described in the prospectus. $100,000 for all accounts except: • $250 for clients of financial intermediaries and family offices that have accounts holding Class I shares with an aggregate value of at least $100,000 (or that are expected to reach this level). • No minimum for eligible retirement plans and certain other categories of eligible investors as described in the prospectus. |
| | | |
Minimum
Additional Investment | | $100 | | No minimum. | | No minimum. |
Shareholders of each Fund are eligible to exchange their shares for shares of the same class of another Nuveen mutual fund available in the shareholder’s state. Such exchanges may result in taxable gain or loss to the shareholder. The exchange of Target Fund shares for Acquiring Fund shares in the Reorganization will not result in taxable gain or loss to the shareholder for federal income tax purposes.
Each Fund typically will pay redemption proceeds using cash reserves maintained in the Fund’s portfolio, or using the proceeds from sales of portfolio securities. The Funds also may meet redemption requests through overdrafts at the Funds’ custodian, by borrowing under a credit agreement to which the Funds are parties, or by borrowing from another Nuveen Fund under an inter-fund lending program
21
maintained by the Nuveen Funds pursuant to exemptive relief granted by the SEC. These additional methods are more likely to be used to meet large redemption requests or in times of stressed market conditions.
Although the Funds generally pay redemption proceeds in cash, if a Fund determines that it would be detrimental to its remaining shareholders to make payment of a redemption order wholly in cash, that Fund may pay a portion of your redemption proceeds in securities or other Fund assets. Although it is unlikely that your shares would be redeemed in-kind, you would probably have to pay brokerage costs to sell the securities or other assets distributed to you, as well as taxes on any capital gains from that sale. Until they are sold, any securities or other assets distributed to you as part of a redemption in-kind may be subject to market risk.
The Funds will normally mail your check the next business day after a redemption request is received, but in no event more than seven days after your request is received. If you are selling shares purchased recently with a check, your redemption proceeds will not be mailed until your check has cleared, which may take up to ten business days from your purchase date.
For a complete description of purchase, redemption and exchange options, see the section of each Fund’s prospectus entitled “How You Can Buy and Sell Shares” and “General Information,” and the section of each Fund’s statement of additional information entitled “Purchase and Redemption of Fund Shares.”
The Target Fund normally pays dividends from net investment income annually, and the Acquiring Fund normally pays dividends from net investment income quarterly. For each Fund, any net capital gains are normally distributed at least once a year. If the Reorganization is approved by the Target Fund shareholders, the Target Fund intends to distribute to its shareholders, prior to the closing of the Reorganization, all of its net investment income and net capital gains, if any, for the period ending on the Closing Date. See the section of the Proxy Statement/Prospectus entitled “Material Federal Income Tax Consequences,” which discusses such distributions in more detail.
Tax Information
The tax character of dividends and distributions will be the same regardless of whether they are paid in cash or reinvested in additional shares. The Funds’ dividends and distributions are taxable and will generally be taxed as ordinary income or capital gains, unless you are investing through a tax-advantaged account, such as an IRA or 401(k) plan (in which case you may be taxed upon withdrawal of your investment from such account).
Payments to Broker-Dealers and Other Financial Intermediaries
If you purchase shares of a Fund through a broker-dealer or other financial intermediary (such as a bank or financial advisor), the Fund, its distributor or its investment adviser may pay the intermediary for the sale of Fund shares and related services. These payments may create a conflict of interest by influencing the broker-dealer or other financial intermediary and your salesperson to recommend the Fund over another investment. Ask your financial advisor or visit your financial intermediary’s website for more information. See the section entitled “Distribution and Service Payments” in each Fund’s prospectus for additional information.
22
Further Information
Additional information concerning the Acquiring Fund and the Target Fund is contained in the Reorganization SAI, and additional information regarding the Acquiring Fund is contained in the accompanying Acquiring Fund prospectus. The cover page of this Proxy Statement/Prospectus describes how you may obtain further information.
Approval of the Proposed Reorganization by the Board of Trustees
Based on the considerations described below, the Board of Trustees, including the Independent Board Members, has determined that the Reorganization would be in the best interests of the Target Fund and that the interests of the Target Fund’s existing shareholders would not be diluted as a result of the Reorganization. The Board of Trustees, including the Independent Board Members, has also determined that the Reorganization would be in the best interests of the Acquiring Fund and that the interests of the Acquiring Fund’s existing shareholders would not be diluted as a result of the Reorganization. At a meeting held on April 10–11, 2018 (the “April Meeting”), the Board of Trustees approved the Reorganization and recommended that the shareholders of the Target Fund vote in favor of the Reorganization.
The Adviser has proposed the Reorganization as part of a strategic decision to end its support of the retail equity fund line of business of Symphony. The Adviser and the Board believe that the Target Fund shareholders (as shareholders of the Acquiring Fund following the Reorganization) will recognize operating cost savings and operational efficiencies because the fixed costs involved with operating a fund will be spread across a larger asset base following the Reorganization, and the need for certain duplicative services for separate stand-alone funds will be eliminated.
At the April Meeting, the Adviser provided the Board of Trustees with information regarding the proposed Reorganization and potential alternatives to the proposed Reorganization. Prior to approving the Reorganization, the Independent Board Members reviewed and discussed the foregoing information with their independent legal counsel and with management, reviewed with independent legal counsel applicable law and their duties in considering such matters, and met with independent legal counsel in a private session without management present. Based on the foregoing, the Board of Trustees considered the following factors, among others, in approving the Reorganization and recommending that shareholders of the Target Fund approve the Reorganization:
| | • | | the compatibility of the Funds’ investment objectives, principal investment strategies and related risks; |
| | • | | the consistency of portfolio management; |
| | • | | the Funds’ relative sizes; |
| | • | | the relative investment performance of the Funds; |
| | • | | the relative fees and expense ratios of the Funds; |
| | • | | the anticipated federal income tax-free nature of the Reorganization; |
23
| | • | | the expected costs of the Reorganization and the extent to which the Funds would bear any such costs; |
| | • | | the terms of the Reorganization and whether the Reorganization would dilute the interests of the existing shareholders of the Funds; |
| | • | | the effect of the Reorganization on shareholder rights; |
| | • | | alternatives to the Reorganization; and |
| | • | | any potential benefits of the Reorganization to the Adviser and its affiliates as a result of the Reorganization. |
Compatibility of Investment Objectives, Principal Investment Strategies and Related Risks
Based on the information presented, the Board of Trustees noted that the investment objective of the Target Fund is to seek long-term capital appreciation with lower absolute volatility than the broad equity market, while the investment objective of the Acquiring Fund is to seek an attractive total return comprised of income from dividends and long-term capital appreciation. The Board of Trustees also considered the similarities and differences in the Funds’ principal investment strategies. In this regard, under normal market conditions, the Target Fund invests at least 80% of the sum of its net assets and the amount of any borrowings for investment purposes in equity securities. The goal of the Target Fund’s portfolio construction process is to produce long-term returns superior to the broad equity market with lower absolute volatility. With respect to the Acquiring Fund, under normal market conditions, such Fund invests at least 80% of its net assets in dividend-paying common stocks and preferred securities. Unlike the Target Fund, as a principal investment strategy, the Acquiring Fund may invest up to 25% of its net assets in non-U.S. equity securities. The Board of Trustees considered the Adviser’s representations that, while not required to invest in dividend-paying common stocks, the Target Fund may do so in seeking to lower absolute volatility, and that, as of February 28, 2018, a high percentage of the Target Fund’s portfolio was comprised of dividend-paying common stocks. With respect to compatibility of risks, among other things, the Board of Trustees recognized that each Fund is subject to certain risks associated with its investments in equity securities. However, an investment in the Acquiring Fund is subject to certain additional principal risks (i.e., currency risk and non-U.S. investment risk) related to investments in non-U.S. equity securities. Further, although both Funds may invest in preferred securities, only the Acquiring Fund invests in preferred securities as a principal investment strategy and is, therefore, subject to preferred security risk as a principal risk.
Consistency of Portfolio Management
The Board of Trustees noted that the Funds have the same investment adviser but different sub-advisers and portfolio managers. The Board of Trustees considered that the portfolio manager of the Acquiring Fund would continue to serve as the portfolio manager of the Acquiring Fund following the Reorganization.
Relative Sizes
The Board of Trustees noted that the Acquiring Fund was larger than the Target Fund and that combining the Funds will create a larger fund which should provide additional benefits to shareholders of the Target Fund, as fixed operating expenses of the Acquiring Fund following the Reorganization will be spread over a larger asset base. See “Fees and Expense Ratios” below.
24
Relative Investment Performance
The Board of Trustees considered the relative investment performance of the Funds over various periods (i.e., the one-year, three-year, five-year and since inception periods ended February 28, 2018 and the 2014 through 2017 calendar years). The Board of Trustees observed, among other things, that with respect to Class A shares, the Acquiring Fund outperformed the Target Fund for the 2016 and 2017 calendar years and the since inception period for such Fund ended February 28, 2018, although the Target Fund outperformed the Acquiring Fund for the 2014 and 2015 calendar years and the one-year, three-year and five-year periods ended February 28, 2018. In this regard, the Board of Trustees noted the Adviser’s observation that differences in the Funds’ investment objectives and strategies had contributed to differences in performance. However, the Board recognized that although the Target Fund outperformed the Acquiring Fund over various periods, the Acquiring Fund was still a strong performer when compared to peers in its own Lipper category.
Fees and Expense Ratios
The Board of Trustees considered the fees and expense ratios of the Funds (including estimated expenses of the Acquiring Fund following the Reorganization). In this regard, the Independent Board Members noted that after closing the Reorganization, the gross and net annual operating expense ratios of the Acquiring Fund were expected to be lower than the gross and net annual operating expense ratios, respectively, of the Target Fund for all share classes. The Independent Board Members also noted that the contractual management fee was lower for the Acquiring Fund than for the Target Fund.
Tax Consequences of the Reorganization
The Board of Trustees considered the tax implications of the Reorganization. The Board of Trustees noted that the Reorganization will be structured with the intention that it qualify as a tax-free reorganization for federal income tax purposes. The Board of Trustees recognized that with fund reorganizations, applicable tax laws could impose limits on the amount of capital loss carryforwards, if any, that an acquiring fund may use in any one year. The Board of Trustees further noted that there may be some gains resulting from portfolio realignment prior to the Reorganization that could result in less of the Target Fund’s unrealized capital gains being transferred to the Acquiring Fund and in increased distributions of net capital gains and net investment income to Target Fund shareholders prior to the Reorganization. Target Fund shareholders may also recognize additional capital gains in the future as shareholders of the Acquiring Fund.
Costs of the Reorganization
The Board of Trustees noted that Nuveen would absorb the costs of the Reorganization.
Dilution
The terms of the Reorganization are intended to avoid dilution of the interests of the existing shareholders of the Funds. In this regard, shareholders of the Target Fund will receive shares of the Acquiring Fund in an amount equal in total net asset value to the total net asset value of the shares of the Target Fund surrendered. Holders of Class A, Class C, Class R6 and Class I shares of the Target Fund will receive the same class of shares of the Acquiring Fund.
25
Effect on Shareholder Rights
The Board of Trustees noted that holders of Class A, Class C, Class R6 and Class I shares of the Target Fund will receive the same class of shares of the Acquiring Fund, which are subject to the same distribution and service fees. The Board of Trustees also considered that each Fund is a series of the Trust, a Massachusetts business trust. In this regard, the rights of each Fund’s shareholders are the same under the Trust’s declaration of trust.
Alternatives to the Reorganization
As indicated above, the Adviser has proposed the Reorganization as part of a strategic decision to end its support of the retail equity fund line of business of Symphony. In considering any available alternatives, the Board of Trustees noted that it could have decided to liquidate the Target Fund; however, the Board of Trustees did not believe this option was in the best interests of shareholders of the Target Fund, as liquidation is a taxable event.
Potential Benefits to the Adviser and Its Affiliates
The Board of Trustees recognized that the Reorganization may result in some benefits and economies for the Adviser and its affiliates. These may include, for example, cost savings as a result of the elimination of the Target Fund as a separate fund in the Nuveen complex.
Conclusion
The Board of Trustees, including the Independent Board Members, approved the Reorganization, concluding that the Reorganization is in the best interests of each Fund and that the interests of existing shareholders of each Fund would not be diluted as a result of the Reorganization. The Board of Trustees did not identify any single factor discussed above as all-important or controlling, but considered all such factors together in approving the Reorganization.
The Proposed Reorganization
The proposed Reorganization will be governed by the Agreement, a form of which is attached as Appendix I. The Agreement provides that the Target Fund will transfer all its assets to the Acquiring Fund solely in exchange for the issuance of full and fractional shares of beneficial interest of the Acquiring Fund and the assumption by the Acquiring Fund of all the liabilities of the Target Fund. The closing of the Reorganization will take place at the close of business on the Closing Date.
The Target Fund will transfer all of its assets to the Acquiring Fund, and in exchange, the Acquiring Fund will assume all the liabilities of the Target Fund and deliver to the Target Fund a number of full and fractional shares of the Acquiring Fund having a net asset value equal to the value of the assets of the Target Fund less the liabilities of the Target Fund assumed by the Acquiring Fund, with such values determined in each case as of the close of regular trading on the New York Stock Exchange on the Closing Date. At the designated time on the Closing Date as set forth in the Agreement, the Target Fund will distribute in complete liquidation of the Target Fund, pro rata to its shareholders of record, by class, all Acquiring Fund shares received by the Target Fund. This distribution will be accomplished by the transfer of the Acquiring Fund shares credited to the account of the Target Fund on the books of the Acquiring Fund to open accounts on the share records of the Acquiring Fund in the name of such Target Fund shareholders, and representing the respective pro rata
26
number, by class, of Acquiring Fund shares due each such shareholder. All issued and outstanding shares of the Target Fund will simultaneously be canceled on the books of the Target Fund.
As a result of the Reorganization, each Target Fund Class A, Class C, Class R6 and Class I shareholder will receive a number of Acquiring Fund Class A, Class C, Class R6 and Class I shares, respectively, equal in value, as of the close of regular trading on the New York Stock Exchange on the Closing Date, to the value of the Target Fund Class A, Class C, Class R6 and Class I shares surrendered by such shareholder.
The Board of Trustees determined that the Reorganization is in the best interests of each Fund, and the Board of Trustees has further determined that the interests of the existing shareholders of such Funds would not be diluted as a result of the transactions contemplated by the Agreement.
The consummation of the Reorganization is subject to the terms and conditions of, and the representations and warranties being true as set forth in, the Agreement. The Agreement may be terminated by mutual agreement of the Funds. In addition, either Fund may at its option terminate the Agreement at or before the closing of the Reorganization due to (i) a breach by the other Fund of any representation, warranty, or agreement to be performed at or before the closing, if not cured within 30 days of notification to the breaching party and prior to the closing, (ii) a condition precedent to the obligations of the terminating party that has not been met and it reasonably appears that it will not or cannot be met, or (iii) a determination by the Board of Trustees that the consummation of the transactions contemplated by the Agreement is not in the best interests of such Fund.
The Target Fund will, within a reasonable period of time before the Closing Date, furnish the Acquiring Fund with a list of the Target Fund’s portfolio securities and other investments. The Acquiring Fund will, within a reasonable period of time before the Closing Date of the Reorganization, furnish the Target Fund with a list of the securities, if any, on the Target Fund’s list referred to above that do not conform to the Acquiring Fund’s investment objective, policies, or restrictions. The Target Fund, if requested by the Acquiring Fund, will dispose of securities on the list provided by the Acquiring Fund before the closing. In addition, if it is determined that the portfolios of the Funds, when aggregated, would contain investments exceeding certain percentage limitations imposed upon the Acquiring Fund with respect to such investments, the Target Fund, if requested by the Acquiring Fund, will dispose of a sufficient amount of such investments as may be necessary to avoid violating such limitations as of the closing of the Reorganization. The sale of such investments could result in taxable distributions to shareholders of the Target Fund prior to the Reorganization. Notwithstanding the foregoing, nothing in the Agreement will require the Target Fund to dispose of any investments or securities if, in the reasonable judgment of the Board of Trustees or the Adviser, such disposition would adversely affect the tax-free nature of the Reorganization for federal income tax purposes or would otherwise not be in the best interests of the Target Fund. See “Material Federal Income Tax Consequences” below.
Description of Securities to Be Issued
Shares of Beneficial Interest. Each Fund has established and designated eight classes of shares, par value $0.01 per share, consisting of Class A, Class B, Class C, Class D, Class R3, Class R6, Class I and Class T. With respect to the Target Fund, there are no Class B, Class D, Class R3 or Class T shares currently outstanding. With respect to the Acquiring Fund, there are no Class B or Class D shares currently outstanding, and the Adviser is the sole holder of all outstanding Class T shares of the Acquiring Fund. Class A, Class C, Class R6 and Class I shares of the Acquiring Fund to be issued to
27
Target Fund shareholders in the Reorganization are offered through this Proxy Statement/Prospectus. The Trust’s declaration of trust permits the Board of Trustees, in its sole discretion and subject to compliance with the 1940 Act, to further subdivide the shares of the Acquiring Fund into one or more other classes of shares.
Voting Rights of Shareholders. Holders of shares of each Fund are entitled to one vote per share on matters as to which they are entitled to vote, with fractional shares voting proportionally. Each Fund operates as a series of the Trust, an open-end management investment company registered with the SEC under the 1940 Act. The Trust currently has ten series, including the Acquiring Fund and the Target Fund, and the Board of Trustees may, in its sole discretion, create additional series from time to time. Each class of shares of a Fund represents an interest in the same portfolio of investments of the Fund. Each class of shares has equal rights as to voting, redemption, dividends and liquidation, except that each bears different class expenses, including different distribution and service fees, and each has exclusive voting rights with respect to any distribution or service plan applicable to its shares. There are no conversion, preemptive or other subscription rights. In addition to the specific voting rights described above, shareholders of each Fund are entitled, under current law, to vote with respect to certain other matters, including changes in fundamental investment policies and restrictions. Moreover, shareholders owning at least 10% of the outstanding shares entitled to vote may request that the Board of Trustees call a special shareholders’ meeting to remove Trustees or for any other purpose. The Board of Trustees has the right to establish additional series and classes of shares in the future, to change in any manner those series or classes and to determine the preferences, voting powers, rights and privileges thereof.
Under Massachusetts law applicable to Massachusetts business trusts, shareholders of such a trust may, under certain circumstances, be held personally liable as partners for its obligations. However, the declaration of trust of the Trust contains an express disclaimer of shareholder liability for acts or obligations of the Trust and requires that notice of this disclaimer be given in each agreement, obligation or instrument entered into or executed by the Trust or the Trustees. The Trust’s declaration of trust further provides for indemnification out of the assets and property of the Trust for all losses and expenses of any shareholder held personally liable for the obligations of the Trust. Thus, the risk of a shareholder incurring financial loss on account of shareholder liability is limited to circumstances in which both inadequate insurance existed and the Trust or a Fund itself was unable to meet its obligations. The Trust believes the likelihood of the occurrence of these circumstances is remote.
Continuation of Shareholder Accounts, Plans and Privileges; Share Certificates
If the Reorganization is approved and completed, the Acquiring Fund will establish an account for each Target Fund shareholder containing the appropriate number of shares of the appropriate class of the Acquiring Fund. The shareholder services and shareholder programs of the Funds are substantially the same. Shareholders of the Target Fund who are accumulating shares through systematic investing, or who are receiving payments under the systematic withdrawal plan, will retain the same rights and privileges after the Reorganization through plans maintained by the Acquiring Fund. No certificates for Acquiring Fund shares will be issued as part of the Reorganization.
Service Providers
State Street Bank and Trust Company, One Lincoln Street, Boston, Massachusetts 02111, serves as the custodian for the assets of each Fund. DST Asset Manager Solutions, Inc. serves as the transfer agent, shareholder services agent and dividend paying agent for each Fund.
28
PricewaterhouseCoopers LLP serves as the independent auditors for each Fund. Nuveen Securities, LLC, located at 333 West Wacker Drive, Chicago, Illinois 60606, serves as principal underwriter for each Fund.
Material Federal Income Tax Consequences
As a condition to each Fund’s obligation to consummate the Reorganization, the Fund will receive a tax opinion from Vedder Price P.C. (which opinion will be based on certain factual representations and certain customary assumptions and exclusions) with respect to the Reorganization substantially to the effect that, on the basis of the existing provisions of the Code, current administrative rules and court decisions, for federal income tax purposes:
| | 1. | The transfer of all the assets of the Target Fund to the Acquiring Fund in exchange solely for Acquiring Fund shares and the assumption by the Acquiring Fund of all the liabilities of the Target Fund, immediately followed by the pro rata, by class, distribution to the Target Fund shareholders of all the Acquiring Fund shares received by the Target Fund in complete liquidation of the Target Fund and the termination of the Target Fund as soon as practicable thereafter, will constitute a “reorganization” within the meaning of Section 368(a)(1) of the Code, and the Acquiring Fund and the Target Fund will each be a “party to a reorganization” within the meaning of Section 368(b) of the Code with respect to the Reorganization. |
| | 2. | No gain or loss will be recognized by the Acquiring Fund upon the receipt of all the assets of the Target Fund solely in exchange for Acquiring Fund shares and the assumption by the Acquiring Fund of all the liabilities of the Target Fund. |
| | 3. | No gain or loss will be recognized by the Target Fund upon the transfer of all the Target Fund’s assets to the Acquiring Fund solely in exchange for Acquiring Fund shares and the assumption by the Acquiring Fund of all the liabilities of the Target Fund or upon the distribution (whether actual or constructive) of all such Acquiring Fund shares to Target Fund shareholders solely in exchange for such shareholders’ shares of the Target Fund in complete liquidation of the Target Fund. |
| | 4. | No gain or loss will be recognized by the Target Fund shareholders upon the exchange, pursuant to the Reorganization, of their Target Fund shares solely for Acquiring Fund shares. |
| | 5. | The aggregate basis of the Acquiring Fund shares received by each Target Fund shareholder pursuant to the Reorganization will be the same as the aggregate basis of the Target Fund shares exchanged therefor by such shareholder. |
| | 6. | The holding period of the Acquiring Fund shares received by each Target Fund shareholder in the Reorganization will include the period during which the Target Fund shares exchanged therefor were held by such shareholder, provided such Target Fund shares are held as capital assets at the effective time of the Reorganization. |
| | 7. | The basis of the Target Fund’s assets acquired by the Acquiring Fund will be the same as the basis of such assets in the hands of the Target Fund immediately before the effective time of the Reorganization. |
29
| | 8. | The holding period of the assets of the Target Fund received by the Acquiring Fund will include the period during which such assets were held by the Target Fund. |
No opinion will be expressed as to (1) the effect of the Reorganization on the Target Fund, the Acquiring Fund or any Target Fund shareholder with respect to any asset (including, without limitation, any stock held in a passive foreign investment company as defined in Section 1297(a) of the Code) as to which any unrealized gain or loss is required to be recognized under federal income tax principles (a) at the end of a taxable year (or on the termination thereof) or (b) upon the transfer of such asset regardless of whether such transfer would otherwise be a non-taxable transaction under the Code, or (2) any other federal tax issues (except those set forth above) and all state, local or foreign tax issues of any kind.
The opinion will be based on certain factual representations and assumptions. The opinion will rely on such representations and will assume the accuracy of such representations. If such representations and assumptions are incorrect, the Reorganization may not qualify as a tax-free reorganization for federal income tax purposes, and the Target Fund and Target Fund shareholders may recognize taxable gain or loss as a result of the Reorganization.
Prior to the close of regular trading on the New York Stock Exchange on the Closing Date, the Target Fund will declare a distribution to its shareholders, which, together with all previous distributions, will have the effect of distributing to shareholders all of the Target Fund’s net investment income and realized net capital gains (after reduction by any available capital loss carryforwards and excluding any net capital gain on which the Target Fund paid federal income tax), if any, through the Closing Date. To the extent distributions are attributable to ordinary taxable income or capital gains, the distribution will be taxable to shareholders for federal income tax purposes and may include net capital gains resulting from the sale of portfolio assets discussed below. Additional distributions may be made if necessary. All dividends and distributions will be reinvested in additional shares of the Target Fund unless a shareholder has made an election to receive dividends and distributions in cash. Dividends and distributions are treated the same for federal income tax purposes whether received in cash or additional shares.
To the extent that a portion of the Target Fund’s portfolio assets are sold prior to the Reorganization, including sales anticipated in connection with the repositioning described below, the federal income tax effect of such sales will depend on the holding periods of such assets and the difference between the price at which such portfolio assets were sold and the Fund’s basis in such assets. Any net capital gains (net long-term capital gain in excess of any net short-term capital loss) recognized in these sales, after the application of any available capital loss carryforwards (capital losses from prior taxable years that may be used to offset future capital gains), would be distributed to the Target Fund’s shareholders as capital gain dividends. Any net short-term capital gains (net short-term capital gain in excess of any net long-term capital loss and after application of any available capital loss carryforwards) would be distributed as ordinary dividends. All such distributions would be made during or with respect to the Target Fund’s taxable year in which the sale occurs and would be taxable to shareholders for federal income tax purposes.
The Target Fund will experience portfolio turnover due to portfolio repositioning prior to the Reorganization. To the extent the Target Fund realizes net losses from the sale of portfolio securities as part of such portfolio repositioning, the net capital gain or net investment income to be distributed by the Target Fund prior to the closing of the Reorganization will be reduced. In the event the Target Fund
30
realizes income or gain as a result of such sales, the net capital gain or net investment income to be distributed by the Target Fund prior to the closing of the Reorganization will be increased if such income or gain cannot be offset by available capital loss carryforwards, if any.
If the Reorganization had occurred as of February 28, 2018, it is estimated that approximately 78% (or $105.4 million) of the Target Fund’s portfolio would have been sold. If such sales had occurred as of February 28, 2018, the sales would have resulted in realized gains of approximately $24.2 million (approximately $5.75 per share or 18% of the Target Fund’s net assets).
After the Reorganization, the Acquiring Fund’s ability to use the Target Fund’s or the Acquiring Fund’s pre-Reorganization capital losses, if any, may be limited under certain federal income tax rules applicable to reorganizations of this type. Therefore, in certain circumstances, shareholders may pay federal income tax sooner, or may pay more federal income taxes, than they would have had the Reorganization not occurred. The effect of these potential limitations, however, will depend on a number of factors, including the amount of the losses, the amount of gains to be offset, the exact timing of the Reorganization and the amount of unrealized capital gains in the Funds at the time of the Reorganization. As of January 31, 2018, the Funds had no unused capital loss carryforwards available for federal income tax purposes to be applied against capital gains.
Shareholders of the Target Fund will receive a proportionate share of any taxable income and gains realized by the Acquiring Fund and not distributed to its shareholders prior to the Reorganization when such income and gains are eventually distributed by the Acquiring Fund. Furthermore, any gain the Acquiring Fund realizes after the Reorganization, including any built-in gain in the portfolio investments of the Target Fund or the Acquiring Fund that was unrealized at the time of the Reorganization, may result in taxable distributions to shareholders holding shares of the Acquiring Fund (including former shareholders of the Target Fund who hold shares of the Acquiring Fund following the Reorganization). As a result, shareholders of the Target Fund may receive a greater amount of taxable distributions than they would have had the Reorganization not occurred.
This description of the federal income tax consequences of the Reorganization is made without regard to the particular facts and circumstances of any shareholder. Shareholders are urged to consult their own tax advisors as to the specific consequences to them of the Reorganization, including the applicability and effect of state, local, non-U.S. and other tax laws.
Reorganization Expenses
Nuveen will absorb the costs of the Reorganization, which are estimated to be approximately $230,000.
The Target Fund has engaged Computershare Fund Services to assist in the solicitation of proxies at an estimated cost of $4,200 plus reasonable expenses, which is included in the expense estimate above.
Description of Massachusetts Business Trusts
Each Fund is a series of the Trust, a Massachusetts business trust organized on June 27, 1997. The following description is based on relevant provisions of applicable Massachusetts law and the Funds’ operative documents. This summary does not purport to be complete, and we refer you to applicable Massachusetts law and the Funds’ operative documents.
31
Each Fund is a series of a Massachusetts business trust. A fund organized as a series of a Massachusetts business trust is governed by the trust’s declaration of trust or similar instrument. Massachusetts law allows the trustees of a business trust to set the terms of a fund’s governance in its declaration of trust. All power and authority to manage the fund and its affairs generally reside with the trustees, and shareholder voting and other rights are limited to those provided to the shareholders in the declaration of trust. Because Massachusetts law governing business trusts provides more flexibility compared to typical state corporate statutes, the Massachusetts business trust has become a common form of organization for mutual funds. However, some consider it less desirable than other entities because it relies on the terms of the applicable declaration of trust and judicial interpretations rather than statutory provisions for substantive issues, such as the personal liability of shareholders and trustees, and does not provide the level of certitude that corporate laws, or newer statutory trust laws, such as those of Delaware, provide.
Shareholders of a Massachusetts business trust are not afforded the statutory limitation of personal liability generally afforded to shareholders of a corporation from the trust’s liabilities. Instead, the declaration of trust of a fund organized as a Massachusetts business trust typically provides that a shareholder will not be personally liable, and further provides for indemnification to the extent that a shareholder is found personally liable, for the fund’s acts or obligations. The Trust’s declaration of trust (the “Declaration of Trust”) contains such provisions.
Similarly, the trustees of a Massachusetts business trust are not afforded statutory protection from personal liability for the obligations of the trust. Courts in Massachusetts have, however, recognized limitations of a trustee’s personal liability in contract actions for the obligations of a trust contained in the trust’s declaration, and declarations may also provide that trustees may be indemnified out of the assets of the trust to the extent held personally liable. The Declaration of Trust contains such provisions.
The Trust, of which each Fund is a series, is governed by its Declaration of Trust and by-laws. Under the Trust’s Declaration of Trust, any determination made by the Trustees in good faith is conclusive, and in construing the provisions of the Declaration of Trust, there is a presumption in favor of a grant of power to the Trustees. Further, the Declaration of Trust provides that certain determinations made in good faith by the Trustees are binding upon the Trust’s series and its shareholders, and shares of the Trust are issued and sold on the condition and understanding, evidenced by the purchase of shares, that any and all such determinations will be so binding. The following is a summary of some of the key provisions of the Trust’s governing documents.
Shareholder Voting. The 1940 Act requires a vote of shareholders on matters that Congress has determined might have a material effect on shareholders and their investments. For example, shareholder consent is required under the 1940 Act to approve new investment advisory agreements in many cases, an increase in an advisory fee or a 12b-1 fee, changes to fundamental policies, the election of directors or trustees in certain circumstances, and the merger or reorganization of a fund in certain circumstances, particularly where the merger or consolidation involves an affiliated party. The Declaration of Trust requires a shareholder vote on matters in addition to those required under the 1940 Act, such as certain mergers, consolidations and sales of assets, derivative actions (to the same extent as shareholders of a Massachusetts business corporation) and certain amendments to the Declaration of Trust. Shareholders have no power to vote on any matter except as required by applicable law, the governing documents, or as otherwise determined by the Trustees.
32
There are ordinarily no annual meetings of shareholders, but special meetings may be called by the Chairman of the Board of Trustees, the Chief Administrative Officer or two or more Trustees and must be called at the written request of shareholders owning at least 10% of the outstanding shares entitled to be cast at the meeting. The by-laws of the Trust provide that the holders of a majority of the voting power of the shares of beneficial interest of the Trust entitled to vote at a meeting will constitute a quorum for the transaction of business. Except as may otherwise be required by the 1940 Act, the Declaration of Trust or the by-laws, the Declaration of Trust and by-laws of the Trust provide that the affirmative vote of the holders of a majority (more than 50%) of the shares present in person or by proxy and entitled to vote at a meeting of shareholders at which a quorum is present is required to approve a matter, except in the case of the election of Trustees, which requires only a plurality vote, and for events to which other voting provisions apply under the 1940 Act or the Declaration of Trust and by-laws, such as the super-majority voting provisions applicable in certain circumstances with respect to a merger, consolidation or dissolution of, or sale of substantially all of the assets by, a fund. Shareholders have no power to vote on any matter except as required by applicable law or the governing documents, or as is otherwise determined by the Trustees.
Election and Removal of Trustees. The Declaration of Trust provides that the Trustees determine the size of the Board of Trustees, subject to a minimum of two and a maximum of 12. Under the Declaration of Trust, each Trustee holds office until the next meeting of shareholders called for the purpose of considering the election or re-election of such Trustee or of a successor to such Trustee, and until the Trustee’s successor is elected and qualified, and Trustees may serve terms of unlimited duration. The Declaration of Trust also provides that vacancies on the Board of Trustees may be filled by the remaining Trustees, except when election by the shareholders is required under the 1940 Act. Therefore, there will normally be no meetings of shareholders for the purpose of electing Trustees unless and until such time as required by law. Trustees are then elected by a plurality vote of the shareholders. A Trustee may be removed only for cause and only by written instrument signed by at least two-thirds of the remaining Trustees, or by action of at least two-thirds of the outstanding shares.
Issuance of Shares. Under the Declaration of Trust, the Trustees are permitted to issue an unlimited number of shares for such consideration and on such terms as the Trustees may determine. Shareholders are not entitled to any preemptive rights or other rights to subscribe to additional shares, except as the Trustees may determine. Shares are subject to such other preferences, conversion, exchange or similar rights, as the Trustees may determine.
Series and Classes. The Declaration of Trust gives broad authority to the Trustees to establish series and classes in addition to those currently established and to determine the rights and preferences, conversion rights, voting powers, restrictions, limitations, qualifications or terms or conditions of redemptions of the shares of the series and classes. The Trustees are also authorized to terminate a series or a class without a vote of shareholders under certain circumstances.
Amendments to Declarations of Trust. Amendments to the Declaration of Trust generally require the consent of shareholders owning more than 50% of shares entitled to vote, voting in the aggregate and not by series or class, unless the amendment affects the holders of one or more series or classes of shares but not the holders of all outstanding series or classes of shares, in which case the holders of the affected series or classes of shares will vote separately. Certain amendments may be made by the Trustees without a shareholder vote. Any amendment to the provisions relating to the qualification and number, term and election, resignation and removal, or certain other provisions regarding the Trustees contained in its Declaration of Trust requires the approval of two-thirds of the
33
outstanding shares, voting in the aggregate and not by series or class, except to the extent that applicable law or the Declaration of Trust may require voting by series or class.
Shareholder, Trustee and Officer Liability. The Declaration of Trust provides that shareholders have no personal liability for any debt or obligation of the Trust and require the Trust to indemnify a shareholder from any loss or expense arising solely by reason of his or her being or having been a shareholder and not because of his or her acts or omissions or for some other reasons. In addition, the Trust will assume the defense of any claim against its shareholder for personal liability at the request of the shareholder. Similarly, the Declaration of Trust provides that any person who is a Trustee, officer or employee of the Trust is not personally liable to any person in connection with the affairs of the Trust, other than to the Trust and its shareholders arising from bad faith, willful misfeasance, gross negligence or reckless disregard for his or her duty. The Declaration of Trust further provides for indemnification of such persons and advancement of the expenses of defending any such actions for which indemnification might be sought. The Declaration of Trust also provides that the Trustees may rely in good faith on expert advice.
Preemptive Rights. Pursuant to the Declaration of Trust, shareholders have no preemptive rights or other rights to subscribe to additional shares except as the Trustees may determine.
Derivative Actions. Massachusetts has what is commonly referred to as a “universal demand statute,” which requires that a shareholder make a written demand on the board, requesting the board members to bring an action, before the shareholder is entitled to bring or maintain a court action or claim on behalf of the entity.
The foregoing is only a summary of certain rights of shareholders under the governing documents of the Trust and under applicable state law and is not a complete description of provisions contained in those sources. Shareholders should refer to the provisions of those documents and state law directly for a more thorough description.
Capitalization
The following tables set forth the capitalization of the Target Fund and the Acquiring Fund as of January 31, 2018, and the pro forma capitalization of the Acquiring Fund after the Reorganization. There is no assurance that the Reorganization will occur. These numbers may differ at the Closing Date of the Reorganization.
Capitalization Table as of January 31, 2018
| | | | | | | | | | | | | | | | |
| | | Target Fund | | | Acquiring Fund | | | Pro Forma
Adjustments(1) | | | Acquiring Fund
Pro Forma | |
Net Assets | | | | | | | | | | | | | | | | |
Class A | | $ | 25,919,795 | | | $ | 498,445,325 | | | $ | (161,405 | )(1) | | $ | 524,203,715 | |
Class C | | | 19,172,167 | | | | 544,405,810 | | | | (25,583 | )(1) | | | 563,552,394 | |
Class R3 | | | — | | | | 24,681,421 | | | | — | | | | 24,681,421 | |
Class R6 | | | 19,106,967 | | | | 64,955,774 | | | | — | (1) | | | 84,062,741 | |
Class I | | | 78,086,476 | | | | 2,204,342,024 | | | | (1,146,163 | )(1) | | | 2,281,282,337 | |
Class T | | | — | | | | 28,390 | | | | — | | | | 28,390 | |
| | | | | | | | | | | | | | | | |
Total | | $ | 142,285,405 | | | $ | 3,336,858,744 | | | $ | (1,333,151 | ) | | $ | 3,477,810,998 | |
| | | | | | | | | | | | | | | | |
34
| | | | | | | | | | | | | | | | |
| | | Target Fund | | | Acquiring
Fund | | | Pro Forma
Adjustments(1) | | | Acquiring
Fund
Pro Forma | |
Shares Outstanding | | | | | | | | | | | | | | | | |
Class A | | $ | 772,852 | | | $ | 11,532,351 | | | $ | (176,890 | )(2) | | $ | 12,128,313 | |
Class C | | | 590,252 | | | | 12,619,950 | | | | (146,412 | )(2) | | | 13,063,790 | |
Class R3 | | | — | | | | 567,363 | | | | — | | | | 567,363 | |
Class R6 | | | 568,170 | | | | 1,488,455 | | | | (130,335 | )(2) | | | 1,926,290 | |
Class I | | | 2,325,455 | | | | 50,962,330 | | | | (546,665 | )(2) | | | 52,741,120 | |
Class T | | | — | | | | 656 | | | | — | | | | 656 | |
| | | | | | | | | | | | | | | | |
Total | | | 4,256,729 | | | | 77,171,105 | | | | (1,000,302 | ) | | | 80,427,532 | |
| | | | | | | | | | | | | | | | |
Net Asset Value Per Share | | | | | | | | | | | | | | | | |
Class A | | | $33.54 | | | | $43.22 | | | | | | | | $43.22 | |
Class C | | | $32.48 | | | | $43.14 | | | | | | | | $43.14 | |
Class R3 | | | — | | | | $43.50 | | | | | | | | $43.50 | |
Class R6 | | | $33.63 | | | | $43.64 | | | | | | | | $43.64 | |
Class I | | | $33.58 | | | | $43.25 | | | | | | | | $43.25 | |
Class T | | | — | | | | $43.26 | | | | | | | | $43.26 | |
Shares Authorized | | | | | | | | | | | | | | | | |
Class A | | | Unlimited | | | | Unlimited | | | | | | | | Unlimited | |
Class C | | | Unlimited | | | | Unlimited | | | | | | | | Unlimited | |
Class R3 | | | N/A | | | | Unlimited | | | | | | | | Unlimited | |
Class R6 | | | Unlimited | | | | Unlimited | | | | | | | | Unlimited | |
Class I | | | Unlimited | | | | Unlimited | | | | | | | | Unlimited | |
Class T | | | N/A | | | | Unlimited | | | | | | | | Unlimited | |
| (1) | The pro forma balances are presented as if the Reorganization was effective as of January 31, 2018, and are presented for informational purposes only. The actual Closing Date of the Reorganization is expected to be on or about August 24, 2018 or such later time agreed to by the parties, at which time the results would be reflective of the actual composition of shareholders’ equity as of that date. All pro forma adjustments are directly attributable to the Reorganization. |
| (2) | The expenses associated with the proposed Reorganization are estimated to be approximately $230,000. Nuveen will absorb all costs of the Reorganization. These figures assume the Target Fund will be required to distribute its tax basis undistributed net investment income of $1,097,341 and tax basis accumulated net realized gains of $5,231,394 to its shareholders prior to the Reorganization. The Acquiring Fund Pro Forma assumes that such distributions were reinvested in Target Fund shares using estimated reinvestment rates of 86%, 97%, 100% and 67% for Class A, Class C, Class R6 and Class I, respectively, resulting in total cash distribution for the Target Fund of $1,333,151. |
| (3) | Reflects the issuance by the Acquiring Fund of approximately 595,962 Class A shares, 443,840 Class C shares, 437,835 Class R6 shares and 1,778,790 Class I shares shares to Class A, Class C, Class R6 and Class I shareholders, respectively, of the Target Fund in connection with the Reorganization. |
Legal Matters
Certain legal matters concerning the issuance of Class A, Class C, Class R6 and Class I shares of the Acquiring Fund pursuant to the Agreement will be passed on by Vedder Price P.C., 222 North LaSalle Street, Chicago, Illinois.
Information Filed with the Securities and Exchange Commission
This Proxy Statement/Prospectus and the related Statement of Additional Information do not contain all of the information set forth in the registration statements and the exhibits relating thereto and the annual and semi-annual reports that the Funds have filed with the SEC pursuant to the applicable requirements of the Securities Act of 1933, as amended, and the 1940 Act, to which reference is hereby made. The SEC file number for the registration statement containing the current
35
prospectus and statement of additional information for each Fund is Registration No. 811-08333. Such prospectus and statement of additional information relating to the Funds are incorporated herein by reference, only insofar as they relate to the Funds.
OTHER INFORMATION
Shareholders of the Funds
For each Fund, the following tables set forth the percentage of ownership of each person who, as of May 11, 2018, the record date with respect to the Special Meeting of the Target Fund, owns of record, or is known by the Fund to own of record or beneficially, 5% or more of any class of shares of the Fund. The tables also set forth the estimated pro forma percentage of shares of the Acquiring Fund that would have been owned by such parties assuming the Reorganization occurred on May 11, 2018. These amounts may differ on the Closing Date. Shareholders who have the power to vote a larger percentage of shares (at least 25% of the shares) of the Target Fund may be able to control the Target Fund and determine the outcome of a shareholder meeting.
| | | | | | | | | | |
Target Fund | |
Class | | Name and Address of Owner | | Percentage of
Ownership | | | Estimated Pro Forma Percentage of
Ownership of Acquiring Fund After
Reorganization of Target Fund into
Acquiring Fund | |
| | | |
A | | | | | | | | | | |
| | | |
C | | | | | | | | | | |
| | | |
R6 | | | | | | | | | | |
| | | |
I | | | | | | | | | | |
| | | | | | | | | | |
Acquiring Fund | |
Class | | Name and Address of Owner | | Percentage of
Ownership | | | Estimated Pro Forma Percentage of
Ownership of Acquiring Fund After
Reorganization of Target Fund into
Acquiring Fund | |
| | | |
A | | | | | | | | | | |
| | | |
C | | | | | | | | | | |
| | | |
R3 | | | | | | | | | | |
| | | |
R6 | | | | | | | | | | |
| | | |
I | | | | | | | | | | |
| | | |
T | | | | | | | | | | |
At the close of business on May 11, 2018, there were [•] Class A shares, [•] Class C shares, [•] Class R6 shares and [•] Class I shares of the Target Fund outstanding. [As of [•], 2018 the Trustees and officers of the Target Fund as a group owned less than 1% of the total outstanding shares of the Target Fund and as a group owned less than 1% of each class of shares of the Target Fund.]
At the close of business on May 11, 2018, there were [•] Class A shares, [•] Class C shares, [•] Class R3 shares, [•] Class R6 shares, [•] Class I shares and [•] Class T shares of the Acquiring Fund
36
outstanding. [As of [•], 2018, the Trustees and officers of the Acquiring Fund as a group owned less than 1% of the total outstanding shares of the Acquiring Fund and as a group owned less than 1% of each class of shares of the Acquiring Fund.]
Shareholder Proposals
The Funds generally do not hold annual shareholders’ meetings but will hold a special meeting as required or deemed desirable. Because the Funds do not hold regular meetings of shareholders, the anticipated date of a Fund’s next shareholder meeting cannot be provided. To be considered for inclusion in the proxy statement for any meeting of a Fund’s shareholders, a shareholder proposal must be submitted a reasonable time before the proxy statement for the meeting is mailed. Whether a proposal is included in the proxy statement will be determined in accordance with applicable federal and state laws. The timely submission of a proposal does not guarantee its inclusion. Shareholders wishing to submit proposals for inclusion in a proxy statement for a shareholder meeting should send their written proposal to the respective Fund at 333 West Wacker Drive, Chicago, Illinois 60606.
Shareholder Communications
Shareholders who want to communicate with the Board of Trustees or any individual Trustee should write to their Fund, to the attention of William Siffermann, Manager of Fund Board Relations, Nuveen, 333 West Wacker Drive, Chicago, Illinois 60606. The letter should indicate that you are a Fund shareholder and identify the Fund or Funds that you own and with respect to which Fund or Funds your letter is concerned. If the communication is intended for a specific Trustee and so indicates, it will be sent only to that Trustee. If a communication does not indicate a specific Trustee, it will be sent to the chair of the nominating and governance committee and to the Board of Trustees’ independent legal counsel for further distribution as deemed appropriate by such persons.
Proxy Statement/Prospectus Delivery
Please note that only one Proxy Statement/Prospectus may be delivered to two or more shareholders of the Target Fund who share an address, unless the Target Fund has received instructions to the contrary. To request a separate copy of the Proxy Statement/Prospectus, or for instructions as to how to request a separate copy of such document or how to request a single copy if multiple copies of such document are received, shareholders should contact the Target Fund at 333 West Wacker Drive, Chicago, Illinois 60606 or by calling (800) 257-8787.
VOTING INFORMATION AND REQUIREMENTS
Holders of shares of the Target Fund are entitled to one vote per share on matters as to which they are entitled to vote, with fractional shares voting proportionally.
Shareholder Approval of the Reorganization
Approval of the Reorganization will require the affirmative vote of the holders of a majority of the total number of shares outstanding and entitled to vote of the Target Fund, voting as a single class.
37
Voting by Proxy
Each valid proxy given by a shareholder of the Target Fund will be voted by the persons named in the proxy in accordance with the instructions marked thereon and as the persons named in the proxy may determine on such other business as may come before the Special Meeting on which shareholders are entitled to vote. If no designation is made, the proxy will be voted by the persons named in the proxy, as recommended by the Board of Trustees, “FOR” approval of the Reorganization. Abstentions and broker non-votes (i.e., shares held by brokers or nominees, typically in “street name,” as to which (i) instructions have not been received from beneficial owners or persons entitled to vote and (ii) the broker or nominee does not have discretionary voting power on a particular matter) count as present for purposes of determining quorum but do not count as votes “FOR” the Reorganization and thus have the same effect as a vote “AGAINST” the Reorganization.
Shareholders who execute proxies may revoke their proxy at any time before the proxy is voted by filing with the Target Fund a written notice of revocation, by delivering a duly executed proxy bearing a later date, or by attending the Special Meeting and voting in person. The giving of a proxy will not affect your right to vote in person if you attend the Special Meeting and wish to do so. If you intend to attend and vote your shares at the Special Meeting, you must comply with the procedural requirements set forth in the accompanying Notice of Special Meeting of Shareholders.
Quorum and Other Voting Requirements
The presence in person or by proxy of the holders of a majority of the voting power of the shares of beneficial interest of the Target Fund entitled to vote at the Special Meeting will constitute a quorum for the transaction of any business.
If a quorum is not obtained or if a quorum is present but sufficient votes in favor of a proposal are not received by the scheduled time of the Special Meeting, the holders of a majority of shares present in person or by proxy and entitled to vote will have the power to adjourn the Special Meeting to permit further solicitation of proxies. The Special Meeting of shareholders may be adjourned by announcement to a designated time and place by the vote of the holders of a majority of the shares present and entitled to vote at the Special Meeting even though less than a quorum may be present. An adjourned meeting may reconvene as designated, and when a quorum is present any business may be transacted which might have been transacted at the meeting as originally called.
Proxies of shareholders of the Target Fund are solicited by the Board of Trustees. Additional solicitation may be made by mail, telephone, telegraph or personal interview by representatives of the Adviser or Nuveen, or by dealers or their representatives.
It is not anticipated that any action will be asked of the shareholders of the Target Fund other than as indicated above, but if other matters are properly brought before the Special Meeting, it is intended that the persons named in the proxy will vote in accordance with their judgment.
[•], 2018
Please sign and return your proxy promptly.
Your vote is important, and your participation
in the affairs of your Fund does make a difference.
38
APPENDIX I
FORM OF AGREEMENT AND PLAN OF REORGANIZATION
THIS AGREEMENT AND PLAN OF REORGANIZATION (the “Agreement”) is made as of this [•] day of [•], 2018 by Nuveen Investment Trust II, a Massachusetts business trust (the “Trust”), on behalf of and between Nuveen Santa Barbara Dividend Growth Fund, a series of the Trust (the “Acquiring Fund”), and Nuveen Symphony Low Volatility Equity Fund, a series of the Trust (the “Target Fund”), and Nuveen Fund Advisors, LLC (for purposes of Section 9.1 of the Agreement only), the investment adviser to each of the Acquiring Fund and the Target Fund (the “Adviser”). The Acquiring Fund and the Target Fund may each be referred to herein as a “Fund” and may collectively be referred to herein as the “Funds.”
This Agreement is intended to be, and is adopted as, a plan of reorganization within the meaning of Section 368(a) of the Internal Revenue Code of 1986, as amended (the “Code”), and the Treasury Regulations promulgated thereunder. The reorganization will consist of: (i) the transfer of all the assets of the Target Fund to the Acquiring Fund in exchange solely for shares of beneficial interest, par value $0.01 per share, of the corresponding class of shares of the Acquiring Fund as set forth on Exhibit A (“Acquiring Fund Shares”) and the assumption by the Acquiring Fund of all the liabilities of the Target Fund; and (ii) the pro rata distribution, by class, of all the Acquiring Fund Shares to the shareholders of each corresponding class of the Target Fund, in complete liquidation and termination of the Target Fund as provided herein, all upon the terms and conditions set forth in this Agreement (the “Reorganization”).
WHEREAS, each Fund is a separate series of the Trust, and the Trust is an open-end, management investment company registered under the Investment Company Act of 1940, as amended (the “1940 Act”);
WHEREAS, the Target Fund owns securities that generally are assets of the character in which the Acquiring Fund is permitted to invest;
WHEREAS, the Acquiring Fund is authorized to issue the Acquiring Fund Shares; and
WHEREAS, the Board of Trustees of the Trust (the “Board”) has made the determinations required by Rule 17a-8 under the 1940 Act with respect to the Target Fund and Acquiring Fund, respectively.
NOW, THEREFORE, in consideration of the premises and of the covenants and agreements hereinafter set forth, the parties hereto covenant and agree as follows:
ARTICLE I
TRANSFER OF ASSETS OF THE TARGET FUND IN EXCHANGE FOR ACQUIRING FUND SHARES AND THE ASSUMPTION OF THE TARGET FUND LIABILITIES AND TERMINATION AND LIQUIDATION OF THE TARGET FUND
1.1 THE EXCHANGE. Subject to the terms and conditions contained herein and on the basis of the representations and warranties contained herein, the Target Fund agrees to transfer all of its
I-1
assets, as set forth in Section 1.2, to the Acquiring Fund. In consideration therefor, the Acquiring Fund agrees: (i) to deliver to the Target Fund the number of full and fractional Acquiring Fund Shares, computed in the manner set forth in Section 2.3; and (ii) to assume all the liabilities of the Target Fund, as set forth in Section 1.3. All Acquiring Fund Shares delivered to the Target Fund shall be delivered at net asset value without a sales load, commission or other similar fee being imposed. In the event that Class A shares of the Acquiring Fund are transferred in the Reorganization to former holders of Class A shares of the Target Fund with respect to which the front-end sales charge was waived due to a purchase of $1 million or more, the Acquiring Fund agrees that, in determining whether a deferred sales charge is payable upon the sale of such Class A shares of the Acquiring Fund, it shall give credit for the period during which the holder thereof held such Target Fund shares. With respect to Class C shares of the Acquiring Fund that are transferred in the Reorganization to former holders of Class C shares of the Target Fund, the Acquiring Fund agrees that, in determining whether a deferred sales charge is payable upon the sale of such Class C shares of the Acquiring Fund, it shall give credit for the period during which the holder thereof held such Target Fund shares. Such transactions shall take place at the closing provided for in Section 3.1 (the “Closing”).
1.2 ASSETS TO BE TRANSFERRED. The Target Fund shall transfer all of its assets to the Acquiring Fund, including, without limitation, all cash, securities, commodities, interests in futures, dividends or interest receivables owned by the Target Fund and any deferred or prepaid expenses shown as an asset on the books of the Target Fund as of the Closing.
The Target Fund will, within a reasonable period of time before the Closing Date, as such term is defined in Section 3.1, furnish the Acquiring Fund with a list of the Target Fund’s portfolio securities and other investments. The Acquiring Fund will, within a reasonable period of time before the Closing Date, furnish the Target Fund with a list of the securities, if any, on the Target Fund’s list referred to above that do not conform to the Acquiring Fund’s investment objective, policies, and restrictions. The Target Fund, if requested by the Acquiring Fund, will dispose of securities on the list provided by the Acquiring Fund before the Closing. In addition, if it is determined that the portfolios of the Target Fund and the Acquiring Fund, when aggregated, would contain investments exceeding certain percentage limitations imposed upon the Acquiring Fund with respect to such investments, the Target Fund, if requested by the Acquiring Fund, will dispose of a sufficient amount of such investments as may be necessary to avoid violating such limitations as of the Closing. Notwithstanding the foregoing, nothing herein will require the Target Fund to dispose of any investments or securities if, in the reasonable judgment of the Board or the Adviser, such disposition would adversely affect the status of the Reorganization as a “reorganization” as such term is used in the Code or would otherwise not be in the best interests of the Target Fund.
1.3 LIABILITIES TO BE ASSUMED. The Target Fund will endeavor to discharge all of its known liabilities and obligations to the extent possible before the Closing Date. Notwithstanding the foregoing, any liabilities not so discharged shall be assumed by the Acquiring Fund, which assumed liabilities shall include all of the Target Fund’s liabilities, debts, obligations, and duties of whatever kind or nature, whether absolute, accrued, contingent, or otherwise, whether or not arising in the ordinary course of business, whether or not determinable at the Closing, and whether or not specifically referred to in this Agreement.
1.4 LIQUIDATING DISTRIBUTION. As of the Effective Time, as such term is defined in Section 3.1, the Target Fund will distribute in complete liquidation of the Target Fund each class of the Acquiring Fund Shares received pursuant to Section 1.1 to its shareholders of record with respect to
I-2
each corresponding class of shares, determined as of the time of such distribution (each a “Target Fund Shareholder” and collectively, the “Target Fund Shareholders”), on a pro rata basis within that class. Such distribution will be accomplished with respect to each class of shares of the Target Fund by the transfer of the Acquiring Fund Shares of the corresponding class then credited to the account of the Target Fund on the books of the Acquiring Fund to open accounts on the share records of the Acquiring Fund in the names of the Target Fund Shareholders of such class. All issued and outstanding shares of the Target Fund will simultaneously be cancelled on the books of the Target Fund and retired. The Acquiring Fund shall not issue certificates representing Acquiring Fund Shares in connection with such transfers.
1.5 OWNERSHIP OF SHARES. Ownership of Acquiring Fund Shares will be shown on the books of the Acquiring Fund’s transfer agent. Acquiring Fund Shares will be issued to the Target Fund, in an amount computed in the manner set forth in Section 2.3, to be distributed to the Target Fund Shareholders.
1.6 TRANSFER TAXES. Any transfer taxes payable upon the issuance of Acquiring Fund Shares due a Target Fund Shareholder pursuant to Section 1.4 that result from such issuance being made to an account in a name other than the registered holder of such Target Fund shares on the books of the Target Fund as of that time shall, as a condition of such issuance and transfer, be paid by the person to whom such Acquiring Fund Shares are to be issued and transferred.
1.7 LIQUIDATION AND TERMINATION. The Target Fund shall completely liquidate and be dissolved, terminated and have its affairs wound up in accordance with Massachusetts state law promptly following the Closing and the making of all distributions pursuant to Section 1.4, but in no event later than 12 months following the Closing Date.
1.8 REPORTING. Any reporting responsibility of the Target Fund including, without limitation, the responsibility for filing of regulatory reports, tax returns or other documents with the Securities and Exchange Commission (the “Commission”), any state securities commission and any federal, state or local tax authorities or any other relevant regulatory authority, is and shall remain the responsibility of the Target Fund.
1.9 BOOKS AND RECORDS. All books and records of the Target Fund, including all books and records required to be maintained under the 1940 Act, and the rules and regulations thereunder, shall be available to the Acquiring Fund from and after the Closing Date and shall be turned over to the Acquiring Fund as soon as practicable following the Closing.
ARTICLE II
VALUATION
2.1 VALUATION OF ASSETS. The value of the Target Fund’s assets and liabilities shall be computed as of the close of regular trading on the New York Stock Exchange (“NYSE”) on the Closing Date (such time and date being hereinafter called the “Valuation Time”), using the valuation procedures set forth in the Acquiring Fund’s Prospectus and Statement of Additional Information (in effect as of the Closing Date) or such other valuation procedures as shall be mutually agreed upon by the parties.
I-3
2.2 VALUATION OF SHARES. The net asset value per share per class of Acquiring Fund Shares shall be the net asset value per share for such class computed as of the Valuation Time, using the valuation procedures set forth in Section 2.1.
2.3 SHARES TO BE ISSUED. The number of Acquiring Fund Shares to be issued (including fractional shares, if any) in consideration for the net assets as described in Article I shall be determined with respect to each class by dividing the value of the assets (net of liabilities) with respect to each class of shares of the Target Fund, determined in accordance with Section 2.1, by the net asset value of an Acquiring Fund Share of the corresponding class, determined in accordance with Section 2.2.
2.4 EFFECT OF SUSPENSION IN TRADING. In the event that on the Closing Date, either: (a) the NYSE or another primary exchange on which the portfolio securities of the Acquiring Fund or the Target Fund are purchased or sold shall be closed to trading or trading on such exchange shall be restricted; or (b) trading or the reporting of trading on the NYSE or elsewhere shall be disrupted so that accurate appraisal of the value of the net assets of the Acquiring Fund or the Target Fund is impracticable, the Closing Date shall be postponed until at least the first business day when trading is fully resumed and reporting is restored.
ARTICLE III
CLOSING AND CLOSING DATE
3.1 CLOSING. The Closing shall occur on August 24, 2018 or such other date as the parties may agree (the “Closing Date”). Unless otherwise provided, all acts taking place at the Closing shall be deemed to take place as of immediately after the Valuation Time on the Closing Date (the “Effective Time”). The Closing shall be held as of the close of business at the offices of Vedder Price P.C. in Chicago, Illinois or at such other time and/or place as the parties may agree.
3.2 CUSTODIAN’S CERTIFICATE. The Target Fund shall cause its custodian to deliver to the Acquiring Fund at the Closing a certificate of an authorized officer stating that: (a) the Target Fund’s portfolio securities, cash, and any other assets shall have been delivered in proper form to the Acquiring Fund’s custodian on behalf of the Acquiring Fund on the Closing Date; and (b) all necessary taxes, including all applicable federal and state stock transfer stamps, if any, shall have been paid, or provision for payment shall have been made, in conjunction with the delivery of portfolio securities by the Target Fund.
3.3 TRANSFER AGENT’S CERTIFICATE. The Target Fund shall cause its transfer agent to deliver to the Acquiring Fund at the Closing a certificate of an authorized officer stating that such transfer agent’s records contain the names and addresses of all the Target Fund Shareholders, and the number and percentage ownership of outstanding shares per class owned by each such shareholder as of the Closing. The Acquiring Fund shall issue and deliver or cause its transfer agent to issue and deliver to the Target Fund a confirmation evidencing the Acquiring Fund Shares to be credited at the Closing to the Secretary of the Trust or provide evidence satisfactory to the Target Fund that such Acquiring Fund Shares have been credited to the Target Fund’s account on the books of the Acquiring Fund.
I-4
3.4 DELIVERY OF ADDITIONAL ITEMS. At the Closing, each party shall deliver to the other such bills of sale, checks, assignments, share certificates, receipts and other documents, if any, as such other party or its counsel may reasonably request to effect the transactions contemplated by this Agreement.
ARTICLE IV
REPRESENTATIONS AND WARRANTIES
4.1 REPRESENTATIONS OF THE TARGET FUND. The Trust, on behalf of the Target Fund, represents and warrants as follows:
(a) The Trust is a business trust duly organized, validly existing and in good standing under the laws of the Commonwealth of Massachusetts.
(b) The Target Fund is a separate series of the Trust duly authorized in accordance with the applicable provisions of the Trust’s Declaration of Trust.
(c) The Trust is registered as an open-end management investment company under the 1940 Act, and such registration is in full force and effect.
(d) The Target Fund is not, and the execution, delivery, and performance of this Agreement (subject to shareholder approval) will not result in, the violation of any provision of the Trust’s Declaration of Trust or By-Laws or of any material agreement, indenture, instrument, contract, lease, or other undertaking to which the Target Fund is a party or by which it is bound.
(e) Except as otherwise disclosed in writing to and accepted by the Acquiring Fund, the Target Fund has no material contracts or other commitments that will be terminated with liability to the Target Fund before the Closing.
(f) No litigation, administrative proceeding, or investigation of or before any court or governmental body is presently pending or to its knowledge threatened against the Target Fund or any of its properties or assets, which, if adversely determined, would materially and adversely affect the Target Fund’s financial condition, the conduct of its business, or the ability of the Target Fund to carry out the transactions contemplated by this Agreement. The Target Fund knows of no facts that might form the basis for the institution of such proceedings and is not a party to or subject to the provisions of any order, decree, or judgment of any court or governmental body that materially and adversely affects its business or its ability to consummate the transactions contemplated herein.
(g) The financial statements of the Target Fund as of September 30, 2017, and for the year then ended have been prepared in accordance with generally accepted accounting principles and have been audited by an independent registered public accounting firm, and such statements (copies of which have been furnished to the Acquiring Fund) fairly reflect the financial condition of the Target Fund as of September 30, 2017, and there are no known liabilities, contingent or otherwise, of the Target Fund as of such date that are not disclosed in such statements.
(h) Since the date of the financial statements referred to in subsection (g) above, there have been no material adverse changes in the Target Fund’s financial condition, assets, liabilities
I-5
or business (other than changes occurring in the ordinary course of business) and there are no known contingent liabilities of the Target Fund arising after such date. For the purposes of this subsection (h), a decline in the net asset value of the Target Fund shall not constitute a material adverse change.
(i) All federal, state, local and other tax returns and reports of the Target Fund required by law to be filed by it (taking into account permitted extensions for filing) have been timely filed and are complete and correct in all material respects. All federal, state, local and other taxes of the Target Fund required to be paid (whether or not shown on any such return or report) have been paid, or provision shall have been made for the payment thereof and any such unpaid taxes, as of the date of the financial statements referred to above, are properly reflected thereon. To the best of the Target Fund’s knowledge, no tax authority is currently auditing or preparing to audit the Target Fund, and no assessment for taxes, interest, additions to tax or penalties has been asserted against the Target Fund.
(j) All issued and outstanding shares of the Target Fund are, and as of the Closing will be, duly and validly issued and outstanding, fully paid and non-assessable by the Target Fund (recognizing that under Massachusetts law, Target Fund shareholders, under certain circumstances, could be held personally liable for the obligations of the Target Fund). All the issued and outstanding shares of the Target Fund will, at the time of the Closing, be held by the persons and in the amounts set forth in the records of the Target Fund’s transfer agent as provided in Section 3.3. The Target Fund has no outstanding options, warrants or other rights to subscribe for or purchase any shares of the Target Fund, and has no outstanding securities convertible into shares of the Target Fund.
(k) At the Closing, the Target Fund will have good and marketable title to the Target Fund’s assets to be transferred to the Acquiring Fund pursuant to Section 1.2, and full right, power, and authority to sell, assign, transfer, and deliver such assets free and clear of any liens, encumbrances and restrictions on transfer, except those liens, encumbrances and restrictions for which the Acquiring Fund has received written notice of prior to the Closing and not objected to, and the Acquiring Fund will acquire good and marketable title thereto, subject to no other restrictions on the full transfer thereof, including such restrictions as might arise under the Securities Act of 1933, as amended (the “1933 Act”).
(l) The execution, delivery and performance of this Agreement have been duly authorized by all necessary action on the part of the Target Fund, including the determinations of the Board required by Rule 17a-8(a) under the 1940 Act. This Agreement constitutes a valid and binding obligation of the Target Fund, enforceable in accordance with its terms, subject as to enforcement, to bankruptcy, insolvency, reorganization, moratorium, and other laws relating to or affecting creditors’ rights and to general equity principles.
(m) The information to be furnished by the Target Fund for use in no-action letters, applications for orders, registration statements, proxy materials and other documents that may be necessary in connection with the transactions contemplated herein shall be accurate and complete in all material respects and shall comply in all material respects with federal securities and other laws and regulations.
(n) From the effective date of the Registration Statement (as defined in Section 5.7), through the time of the meeting of the Target Fund shareholders and on the Closing Date, any written information furnished by the Trust with respect to the Target Fund for use in the Registration Statement, Proxy Materials (as defined in Section 5.7) and any supplement or amendment thereto or to
I-6
the documents included or incorporated by reference therein, or any other materials provided in connection with the Reorganization, does not and will not contain any untrue statement of a material fact or omit to state a material fact required to be stated or necessary to make the statements, in light of the circumstances under which such statements were made, not misleading.
(o) For each taxable year of its operations (including the taxable year ending on the Closing Date), the Target Fund (i) has elected to qualify, and has qualified or will qualify (in the case of the taxable year ending on the Closing Date), as a “regulated investment company” under the Code (a “RIC”); (ii) has been eligible to compute and has computed its federal income tax under Section 852 of the Code, and on or prior to the Closing Date will have declared and paid a distribution with respect to all of its investment company taxable income (determined without regard to the deduction for dividends paid), the excess of its interest income excludible from gross income under Section 103(a) of the Code over its deductions disallowed under Sections 265 and 171(a)(2) of the Code and its net capital gain (after reduction for any available capital loss carryforward and excluding any net capital gain on which the Target Fund paid tax under Section 852(b)(3)(A) of the Code) (as such terms are defined in the Code) that has accrued or will accrue on or prior to the Closing Date; and (iii) has been, and will be (in the case of the taxable year ending on the Closing Date), treated as a separate corporation for federal income tax purposes pursuant to Section 851(g) of the Code.
4.2 REPRESENTATIONS OF THE ACQUIRING FUND. The Trust, on behalf of the Acquiring Fund, represents and warrants as follows:
(a) The Trust is a business trust duly organized, validly existing and in good standing under the laws of the Commonwealth of Massachusetts.
(b) The Acquiring Fund is a separate series of the Trust duly authorized in accordance with the applicable provisions of the Trust’s Declaration of Trust.
(c) The Trust is registered as an open-end management investment company under the 1940 Act, and such registration is in full force and effect.
(d) The Acquiring Fund is not, and the execution, delivery and performance of this Agreement will not result, in a violation of the Trust’s Declaration of Trust or By-Laws or of any material agreement, indenture, instrument, contract, lease, or other undertaking to which the Acquiring Fund is a party or by which it is bound.
(e) No litigation, administrative proceeding or investigation of or before any court or governmental body is presently pending or to its knowledge threatened against the Acquiring Fund or any of its properties or assets, which, if adversely determined, would materially and adversely affect the Acquiring Fund’s financial condition, the conduct of its business or the ability of the Acquiring Fund to carry out the transactions contemplated by this Agreement. The Acquiring Fund knows of no facts that might form the basis for the institution of such proceedings and it is not a party to or subject to the provisions of any order, decree, or judgment of any court or governmental body that materially and adversely affects its business or its ability to consummate the transaction contemplated herein.
(f) The financial statements of the Acquiring Fund as of July 31, 2017 and for the fiscal year then ended have been prepared in accordance with generally accepted accounting principles and have been audited by an independent registered public accounting firm, and such statements
I-7
(copies of which have been furnished to the Target Fund) fairly reflect the financial condition of the Acquiring Fund as of July 31, 2017, and there are no known liabilities, contingent or otherwise, of the Acquiring Fund as of such date that are not disclosed in such statements.
(g) The financial statements of the Acquiring Fund as of January 31, 2018 and for the six-month period then ended have been prepared in accordance with generally accepted accounting principles, and such statements (copies of which have been furnished to the Target Fund) fairly reflect the financial condition of the Acquiring Fund as of January 31, 2018, and there are no known liabilities, contingent or otherwise, of the Acquiring Fund as of such date that are not disclosed in such statements.
(h) Since the date of the financial statements referred to in subsection (g) above, there have been no material adverse changes in the Acquiring Fund’s financial condition, assets, liabilities or business (other than changes occurring in the ordinary course of business) and there are no known contingent liabilities of the Acquiring Fund arising after such date. For the purposes of this subsection (h), a decline in the net asset value of the Acquiring Fund shall not constitute a material adverse change.
(i) All federal, state, local and other tax returns and reports of the Acquiring Fund required by law to be filed by it (taking into account permitted extensions for filing) have been timely filed and are complete and correct in all material respects. All federal, state, local and other taxes of the Acquiring Fund required to be paid (whether or not shown on any such return or report) have been paid or provision shall have been made for their payment and any such unpaid taxes, as of the date of the financial statements referred to above, are properly reflected thereon. To the best of the Acquiring Fund’s knowledge, no tax authority is currently auditing or preparing to audit the Acquiring Fund, and no assessment for taxes, interest, additions to tax or penalties has been asserted against the Acquiring Fund.
(j) All issued and outstanding shares of the Acquiring Fund are, and, as of the Closing will be, duly and validly issued, fully paid and non-assessable by the Acquiring Fund (recognizing that under Massachusetts law, Acquiring Fund shareholders, under certain circumstances, could be held personally liable for the obligations of the Acquiring Fund). The Acquiring Fund has no outstanding options, warrants, or other rights to subscribe for or purchase shares of the Acquiring Fund, and there are no outstanding securities convertible into shares of the Acquiring Fund.
(k) The execution, delivery and performance of this Agreement have been duly authorized by all necessary action on the part of the Acquiring Fund, including the determination of the Board required pursuant to Rule 17a-8(a) under the 1940 Act. This Agreement constitutes a valid and binding obligation of the Acquiring Fund, enforceable in accordance with its terms, subject as to enforcement, to bankruptcy, insolvency, reorganization, moratorium, and other laws relating to or affecting creditors’ rights and to general equity principles.
(l) The Acquiring Fund Shares to be issued and delivered to the Target Fund for the account of the Target Fund Shareholders pursuant to the terms of this Agreement will, at the time of the Closing, have been duly authorized. When so issued and delivered, such shares will be duly and validly issued shares of the Acquiring Fund, and will be fully paid and non-assessable (recognizing that under Massachusetts law, Acquiring Fund shareholders, under certain circumstances, could be held personally liable for the obligations of the Acquiring Fund).
I-8
(m) The information to be furnished by the Acquiring Fund for use in no-action letters, applications for orders, registration statements, proxy materials, and other documents that may be necessary in connection with the transactions contemplated herein shall be accurate and complete in all material respects and shall comply in all material respects with federal securities laws and other laws and regulations.
(n) From the effective date of the Registration Statement (as defined in Section 5.7), through the time of the meeting of the Target Fund shareholders and on the Closing Date, any written information furnished by the Trust with respect to the Acquiring Fund for use in the Registration Statement, Proxy Materials and any supplement or amendment thereto or to the documents included or incorporated by reference therein, or any other materials provided in connection with the Reorganization, does not and will not contain any untrue statement of a material fact or omit to state a material fact required to be stated or necessary to make the statements, in light of the circumstances under which such statements were made, not misleading.
(o) For each taxable year of its operations, including the taxable year that includes the Closing Date, the Acquiring Fund (i) has elected to qualify, has qualified or will qualify (in the case of the year that includes the Closing Date) and intends to continue to qualify as a RIC under the Code; (ii) has been eligible to and has computed its federal income tax under Section 852 of the Code, and will do so for the taxable year that includes the Closing Date; and (iii) has been, and will be (in the case of the taxable year that includes the Closing Date), treated as a separate corporation for federal income tax purposes pursuant to Section 851(g) of the Code.
ARTICLE V
COVENANTS OF THE FUNDS
5.1 OPERATION IN ORDINARY COURSE. Subject to Sections 1.2 and 7.3, each of the Acquiring Fund and the Target Fund will operate its respective business in the ordinary course between the date of this Agreement and the Closing, it being understood that such ordinary course of business will include customary dividends and distributions, any other distribution necessary or desirable to avoid federal income or excise taxes, and shareholder purchases and redemptions.
5.2 APPROVAL OF SHAREHOLDERS. The Trust will call a special meeting of the Target Fund shareholders to consider and act upon this Agreement (and the transactions contemplated thereby) and to take all other appropriate action necessary to obtain approval of the transactions contemplated herein.
5.3 INVESTMENT REPRESENTATION. The Target Fund covenants that the Acquiring Fund Shares to be issued pursuant to this Agreement are not being acquired for the purpose of making any distribution, other than in connection with the Reorganization and in accordance with the terms of this Agreement.
5.4 ADDITIONAL INFORMATION. The Target Fund will assist the Acquiring Fund in obtaining such information as the Acquiring Fund reasonably requests concerning the beneficial ownership of the Target Fund’s shares.
I-9
5.5 FURTHER ACTION. Subject to the provisions of this Agreement, each Fund will take or cause to be taken all action and do or cause to be done all things reasonably necessary, proper or advisable to consummate and make effective the transactions contemplated by this Agreement, including any actions required to be taken after the Closing Date. The Acquiring Fund agrees to use all reasonable efforts to obtain the approvals and authorizations required by the 1933 Act, the 1940 Act, and any state securities laws as it may deem appropriate in order to continue its operations after the Closing Date.
5.6 STATEMENT OF EARNINGS AND PROFITS. As promptly as practicable, but in any case within 60 days after the Closing Date, the Target Fund shall furnish the Acquiring Fund, in such form as is reasonably satisfactory to the Acquiring Fund and which shall be certified by the Trust’s Controller or Treasurer, a statement of the earnings and profits of the Target Fund for federal income tax purposes, as well as any net operating loss carryovers and capital loss carryovers, that will be carried over to the Acquiring Fund pursuant to Section 381 of the Code.
5.7 PREPARATION OF REGISTRATION STATEMENT AND PROXY MATERIALS. The Trust will prepare and file with the Commission a registration statement on Form N-14 relating to the Acquiring Fund Shares to be issued to the Target Fund for distribution to Target Fund Shareholders (the “Registration Statement”). The Registration Statement shall include a proxy statement of the Target Fund and a prospectus of the Acquiring Fund relating to the transactions contemplated by this Agreement. The Registration Statement shall be in compliance with the 1933 Act, the Securities Exchange Act of 1934, as amended, and the 1940 Act, as applicable. Each party will provide the other party with the materials and information necessary to prepare the proxy statement and related materials (the “Proxy Materials”), for inclusion therein, in connection with the meeting of the Target Fund’s shareholders to consider the approval of this Agreement and the transactions contemplated herein.
5.8 TAX STATUS OF REORGANIZATION. The intention of the parties is that the Reorganization will qualify as a reorganization within the meaning of Section 368(a) of the Code. None of the Target Fund, the Acquiring Fund or the Trust shall take any action, or cause any action to be taken (including, without limitation, the filing of any tax return), that is inconsistent with such treatment or results in the failure of the transaction to qualify as a reorganization within the meaning of Section 368(a) of the Code. At or prior to the Closing, the Target Fund, the Acquiring Fund and the Trust will take such action, or cause such action to be taken, as is reasonably necessary to enable counsel to render the tax opinion contemplated in Section 8.6 herein.
ARTICLE VI
CONDITION PRECEDENT TO OBLIGATIONS OF THE TARGET FUND
The obligations of the Target Fund to consummate the transactions provided for herein shall be subject to the fulfillment or waiver of the following conditions:
6.1 The Acquiring Fund shall have delivered to the Target Fund on the Closing Date a certificate executed in its name by the Trust’s Chief Administrative Officer or any Vice President, in a form reasonably satisfactory to the Target Fund and dated as of the Closing Date, to the effect that the representations, covenants, and warranties of the Trust, on behalf of the Acquiring Fund, made in this
I-10
Agreement are true and correct in all material respects as of the Closing, with the same force and effect as if made as of the Closing, and as to such other matters as the Target Fund shall reasonably request.
6.2 The Acquiring Fund shall have performed and complied in all material respects with all terms, conditions, covenants, obligations, agreements and restrictions required by this Agreement to be performed or complied with by the Acquiring Fund prior to or at the Closing.
ARTICLE VII
CONDITIONS PRECEDENT TO OBLIGATIONS OF THE ACQUIRING FUND
The obligations of the Acquiring Fund to consummate the transactions provided for herein shall be subject to the fulfillment or waiver of the following conditions:
7.1 The Target Fund shall have delivered to the Acquiring Fund on the Closing Date a certificate executed in its name by the Trust’s Chief Administrative Officer or any Vice President, in a form reasonably satisfactory to the Acquiring Fund and dated as of the Closing Date, to the effect that the representations, covenants, and warranties of the Trust, on behalf of the Target Fund, made in this Agreement are true and correct in all material respects as of the Closing, with the same force and effect as if made as of the Closing, and as to such other matters as the Acquiring Fund shall reasonably request.
7.2 The Target Fund shall have delivered to the Acquiring Fund a statement of the Target Fund’s assets and liabilities, together with a list of the Target Fund’s portfolio securities showing the tax basis of such securities by lot and the holding periods of such securities, as of the Closing, certified by the Controller or Treasurer of the Trust.
7.3 The Target Fund shall have declared and paid prior to the Valuation Time a dividend or dividends which, together with all previous such dividends, shall have the effect of distributing to its shareholders at least all of the Target Fund’s investment company taxable income for all taxable periods ending on or before the Closing Date (computed without regard to any deduction for dividends paid), if any, plus the excess of its interest income excludible from gross income under Section 103(a) of the Code, if any, over its deductions disallowed under Sections 265 and 171(a)(2) of the Code for all taxable periods ending on or before the Closing Date and all of its net capital gains realized in all taxable periods ending on or before the Closing Date (after reduction for any available capital loss carry forward and excluding any net capital gain on which the Target Fund paid tax under Section 852(b)(3)(A) of the Code).
7.4 The Target Fund shall have performed and complied in all material respects with all terms, conditions, covenants, obligations, agreements and restrictions required by this Agreement to be performed or complied with by the Target Fund prior to or at the Closing.
7.5 The Target Fund shall have delivered to the Acquiring Fund such records, agreements, certificates, instruments and such other documents as the Acquiring Fund shall reasonably request.
I-11
ARTICLE VIII
FURTHER CONDITIONS PRECEDENT
The obligations of the Target Fund and the Acquiring Fund to consummate the transactions provided for herein shall also be subject to the fulfillment (or waiver by the affected parties) of the following conditions:
8.1 This Agreement and the transactions contemplated herein, with respect to the Target Fund, shall have been approved by the requisite vote of the holders of the outstanding shares of the Target Fund in accordance with applicable law and the provisions of the Trust’s Declaration of Trust and By-Laws. Notwithstanding anything herein to the contrary, neither the Acquiring Fund nor the Target Fund may waive the conditions set forth in this Section 8.1.
8.2 On the Closing Date, the Commission shall not have issued an unfavorable report under Section 25(b) of the 1940 Act, or instituted any proceeding seeking to enjoin the consummation of the transactions contemplated by this Agreement under Section 25(c) of the 1940 Act. Furthermore, no action, suit or other proceeding shall be threatened or pending before any court or governmental agency in which it is sought to restrain or prohibit, or obtain damages or other relief in connection with this Agreement or the transactions contemplated herein.
8.3 All required consents of other parties and all other consents, orders, and permits of federal, state and local regulatory authorities (including those of the Commission and of state securities authorities, including any necessary “no-action” positions and exemptive orders from such federal and state authorities) to permit consummation of the transactions contemplated herein shall have been obtained.
8.4 The Registration Statement shall have become effective under the 1933 Act, and no stop orders suspending the effectiveness thereof shall have been issued. To the best knowledge of the parties to this Agreement, no investigation or proceeding for that purpose shall have been instituted or be pending, threatened or contemplated under the 1933 Act.
8.5 The Funds shall have received on the Closing Date an opinion from Vedder Price P.C., dated as of the Closing Date, substantially to the effect that:
(a) The Trust is a validly existing voluntary association with shares of beneficial interest commonly referred to as a “Massachusetts business trust,” and is existing under the laws of the Commonwealth of Massachusetts.
(b) The execution and delivery of the Agreement by the Trust, on behalf of the Funds, did not, and the exchange of the Target Fund’s assets for Acquiring Fund Shares pursuant to the Agreement and the issuance of Acquiring Fund Shares pursuant to the Agreement will not, violate the Trust’s Declaration of Trust or By-Laws.
(c) To the knowledge of such counsel, (i) the Trust is registered with the Commission as an open-end management investment company under the 1940 Act, and such registration under the 1940 Act is in full force and effect and is not subject to any stop order; and (ii) all regulatory consents, authorizations, orders, approvals or filings required to be obtained or made by a Fund under the federal laws of the United States of America or the laws of the Commonwealth of
I-12
Massachusetts for the transfer of the Target Fund’s assets and liabilities in exchange for Acquiring Fund Shares, and for the issuance of Acquiring Fund Shares, as applicable, and all other transactions pursuant to the Agreement have been obtained or made.
8.6 The Funds shall have received on the Closing Date an opinion of Vedder Price P.C. addressed to the Acquiring Fund and the Target Fund substantially to the effect that for federal income tax purposes:
(a) The transfer of all the Target Fund’s assets to the Acquiring Fund in exchange solely for Acquiring Fund Shares and the assumption by the Acquiring Fund of all the liabilities of the Target Fund immediately followed by the pro rata, by class, distribution to the Target Fund Shareholders of all the Acquiring Fund Shares received by the Target Fund in complete liquidation of the Target Fund and the termination of the Target Fund as soon as practicable thereafter will constitute a “reorganization” within the meaning of Section 368(a)(1) of the Code and the Acquiring Fund and the Target Fund will each be a “party to a reorganization,” within the meaning of Section 368(b) of the Code, with respect to the Reorganization.
(b) No gain or loss will be recognized by the Acquiring Fund upon the receipt of all the assets of the Target Fund solely in exchange for Acquiring Fund Shares and the assumption by the Acquiring Fund of all the liabilities of the Target Fund.
(c) No gain or loss will be recognized by the Target Fund upon the transfer of all the Target Fund’s assets to the Acquiring Fund solely in exchange for Acquiring Fund Shares and the assumption by the Acquiring Fund of all the liabilities of the Target Fund or upon the distribution (whether actual or constructive) of such Acquiring Fund Shares to the Target Fund Shareholders solely in exchange for such shareholders’ shares of the Target Fund in complete liquidation of the Target Fund.
(d) No gain or loss will be recognized by the Target Fund Shareholders upon the exchange of their Target Fund shares solely for Acquiring Fund Shares in the Reorganization.
(e) The aggregate basis of the Acquiring Fund Shares received by each Target Fund Shareholder pursuant to the Reorganization will be the same as the aggregate basis of the Target Fund shares exchanged therefor by such shareholder. The holding period of the Acquiring Fund Shares received by each Target Fund Shareholder in the Reorganization will include the period during which the Target Fund shares exchanged therefor were held by such shareholder, provided such Target Fund shares are held as capital assets at the effective time of the Reorganization.
(f) The basis of the Target Fund’s assets transferred to the Acquiring Fund will be the same as the basis of such assets in the hands of the Target Fund immediately before the effective time of the Reorganization. The holding period of the assets of the Target Fund received by the Acquiring Fund will include the period during which such assets were held by the Target Fund.
No opinion will be expressed as to (1) the effect of the Reorganization on the Target Fund, the Acquiring Fund or any Target Fund Shareholder with respect to any asset (including, without limitation, any stock held in a passive foreign investment company as defined in Section 1297(a) of the Code) as to which any unrealized gain or loss is required to be recognized under federal income tax principles (a) at the end of a taxable year (or on the termination thereof) or (b) upon the transfer of such
I-13
asset regardless of whether such transfer would otherwise be a non-taxable transaction under the Code, or (2) any other federal tax issues (except those set forth above) and all state, local or foreign tax issues of any kind.
Such opinion shall be based on certain factual representations, reasonable assumptions and such other representations as Vedder Price P.C. may request of the Funds, and the Target Fund and the Acquiring Fund will cooperate to make and certify the accuracy of such representations. Notwithstanding anything herein to the contrary, neither the Acquiring Fund nor the Target Fund may waive the conditions set forth in this Section 8.6.
ARTICLE IX
EXPENSES
9.1 The expenses incurred in connection with the Reorganization (“Reorganization Expenses”) will be borne by the Adviser or an affiliate thereof. Reorganization Expenses include, without limitation: (a) expenses associated with the preparation and filing of the Registration Statement and other Proxy Materials; (b) postage; (c) printing; (d) accounting fees; (e) legal fees incurred by each Fund; (f) solicitation costs of the transaction; and (g) other related administrative or operational costs. For the purposes of this Section 9.1, Reorganization Expenses do not include commissions or other transaction costs in connection with any repositioning of the portfolios of the Funds, and each Fund shall bear such costs.
9.2 Each Fund represents and warrants to the other Fund that there is no person or entity entitled to receive any broker’s fees or similar fees or commission payments in connection with the transactions provided for herein.
9.3 Notwithstanding the foregoing, Reorganization Expenses will in any event be paid by the party directly incurring such Reorganization Expenses if and to the extent that the payment by another party of such Reorganization Expenses would result in the disqualification of the Target Fund or the Acquiring Fund, as the case may be, as a RIC under the Code.
ARTICLE X
ENTIRE AGREEMENT
10.1 The parties agree that no party has made to the other parties any representation, warranty and/or covenant not set forth herein, and that this Agreement constitutes the entire agreement between and among the parties.
I-14
ARTICLE XI
TERMINATION
11.1 This Agreement may be terminated by the mutual agreement of the parties and such termination may be effected by the Trust’s Chief Administrative Officer or any Vice President without further action by the Board. In addition, either Fund may, at its option, terminate this Agreement at or before the Closing due to:
(a) a breach by any other party of any representation, warranty, or agreement contained herein to be performed at or before the Closing, if not cured within 30 days of notification to the breaching party and prior to the Closing;
(b) a condition precedent to the obligations of the terminating party that has not been met or waived and it reasonably appears that it will not or cannot be met; or
(c) a determination by the Board that the consummation of the transactions contemplated herein is not in the best interests of the Target Fund or Acquiring Fund, respectively.
11.2 In the event of any such termination, in the absence of willful default, there shall be no liability for damages on the part of the Trust or the Funds.
ARTICLE XII
AMENDMENTS
12.1 This Agreement may be amended, modified, or supplemented in such manner as may be mutually agreed upon in writing by the officers of the Trust as specifically authorized by the Board; provided, however, that following the meeting of the Target Fund shareholders called by the Target Fund pursuant to Section 5.2 of this Agreement, no such amendment, modification or supplement may have the effect of changing the provisions for determining the number of Acquiring Fund Shares to be issued to the Target Fund Shareholders under this Agreement to the detriment of such shareholders without their further approval.
ARTICLE XIII
HEADINGS; COUNTERPARTS; GOVERNING LAW; ASSIGNMENT;
LIMITATION OF LIABILITY
13.1 The article and section headings contained in this Agreement are for reference purposes only and shall not affect in any way the meaning or interpretation of this Agreement.
13.2 This Agreement may be executed in any number of counterparts, each of which shall be deemed an original.
13.3 This Agreement shall be governed by and construed in accordance with the laws of the Commonwealth of Massachusetts.
I-15
13.4 This Agreement shall bind and inure to the benefit of the parties hereto and their respective successors and assigns, but, except as provided in this section, no assignment or transfer hereof or of any rights or obligations hereunder shall be made by any party without the written consent of the other parties. Nothing herein expressed or implied is intended or shall be construed to confer upon or give any person, firm, or corporation, other than the parties hereto and their respective successors and assigns, any rights or remedies under or by reason of this Agreement.
13.5 It is expressly agreed that the obligations of each Fund hereunder shall not be binding upon any of the Trustees, shareholders, nominees, officers, agents, or employees of the Trust personally, but shall bind only the property of such Fund, as provided in the Trust’s Declaration of Trust, which is on file with the Secretary of the Commonwealth of Massachusetts. The execution and delivery of this Agreement have been authorized by the Trustees of the Trust, on behalf of each Fund, and signed by authorized officers of the Trust acting as such. Neither the authorization by such Trustees nor the execution and delivery by such officers shall be deemed to have been made by any of them individually or to impose any liability on any of them personally, but shall bind only the property of such Fund as provided in the Trust’s Declaration of Trust.
[SIGNATURE PAGE FOLLOWS]
I-16
IN WITNESS WHEREOF, the parties have duly executed this Agreement, all as of the date first written above.
| | | | | | |
| | | | NUVEEN INVESTMENT TRUST II,
on behalf of Nuveen Santa Barbara Dividend Growth Fund |
| | |
| | | | By: |
| | | | Name: | | Christopher M. Rohrbacher |
| | | | Title: | | Vice President and Secretary |
| | |
| | | | NUVEEN INVESTMENT TRUST II,
on behalf of Nuveen Symphony Low Volatility Equity Fund |
| | |
| | | | By: |
| | | | Name: | | Christopher M. Rohrbacher |
| | | | Title: | | Vice President and Secretary |
| | |
| | | | The undersigned is a party to this Agreement for the purposes of Section 9.1 only: |
| | |
| | | | NUVEEN FUND ADVISORS, LLC |
| | |
| | | | By: |
| | | | Name: | | Kevin J. McCarthy |
| | | | Title: | | Executive Vice President and Secretary |
| | |
| | | | |
| | |
| | | | |
| | | | | | |
[Signature Page to Agreement and Plan of Reorganization—
Reorganization of Nuveen Investment Trust II/Nuveen Symphony Low Volatility Equity Fund
into Nuveen Investment Trust II/Nuveen Santa Barbara Dividend Growth Fund]
I-17
EXHIBIT A
SHARE CLASSES
| | |
Nuveen Symphony Low Volatility Equity Fund (Target Fund) – Share Classes | | Nuveen Santa Barbara Dividend Growth Fund (Acquiring Fund) – Corresponding Share Classes |
A | | A |
C | | C |
R6 | | R6 |
I | | I |
I-18
Nuveen, LLC
333 West Wacker Drive
Chicago, Illinois 60606-1286
(800) 257-8787
[FORM OF PROXY]
EVERY SHAREHOLDER’S VOTE IS IMPORTANT
| | | | |
| | EASY VOTING OPTIONS: |
| |  | | VOTE ON THE INTERNET Log on to: www.proxy-direct.com or scan the QR code Follow the on-screen instructions available 24 hours |
| | |
| | |
| | |
| | |
| | |
| | |
| |  | | VOTE BY PHONE Call [ ] Follow the recorded instructions available 24 hours |
| | |
| | |
| | |
| | |
| |  | | VOTE BY MAIL Vote, sign and date this Proxy Card and return in the postage-paid envelope |
| | |
| | |
| | |
| | |
| |  | | VOTE IN PERSON Attend Shareholder Meeting 333 West Wacker Dr. Chicago, IL 60606 on July 16, 2018 |
| | |
| | |
| | |
| | |
Please detach at perforation before mailing.
| | | | |
 | | NUVEEN SYMPHONY LOW VOLATILITY EQUITY FUND SPECIAL MEETING OF SHAREHOLDERS TO BE HELD ON July 16, 2018 | | PROXY |
THIS PROXY IS BEING SOLICITED BY THE BOARD OF TRUSTEES. The undersigned shareholder(s) of Nuveen Symphony Low Volatility Equity Fund, revoking previous proxies, hereby appoints Mark Czarniecki, Diana R. Gonzalez, Kevin J. McCarthy, Christopher M. Rohrbacher, Mark L. Winget, Gifford R. Zimmerman and Eric F. Fess, or any one of them true and lawful attorneys with power of substitution of each, to vote all shares of Nuveen Symphony Low Volatility Equity Fund that the undersigned is entitled to vote at the Special Meeting of Shareholders to be held on July 16, 2018, at 2:00 p.m., Central time, at the offices of Nuveen, LLC, 333 West Wacker Drive, Chicago, Illinois 60606, and at any adjournment or postponement thereof as indicated on the reverse side. In their discretion, the proxy holders named above are authorized to vote upon such other matters as may properly come before the meeting or any adjournment or postponement thereof.
Receipt of the Notice of the Special Meeting and the accompanying Proxy Statement/Prospectus is hereby acknowledged. The shares of Nuveen Symphony Low Volatility Equity Fund represented hereby will be voted as indicated or FOR the proposal if no choice is indicated.
| | | | | | | | |
| | | | VOTE VIA THE INTERNET: www.proxy-direct.com |
| | | | VOTE VIA THE TELEPHONE: [ ] |
| | | | | | | | |
| | |
| | | | Note: Please sign exactly as your name(s) appear(s) on this card. When signing as attorney, executor, administrator, trustee, guardian or as custodian for a minor, please sign your name and give your full title as such. If signing on behalf of a corporation, please sign the full corporate name and your name and indicate your title. If you are a partner signing for a partnership, please sign the partnership name, your name and indicate your title. Joint owners should each sign these instructions. Please sign, date and return. |
| | | | |
| | | | Signature and Title, if applicable |
| | | | |
| | | | Signature (if held jointly) |
| | | | |
| | | | Date | | | | [CFS Code] |
EVERY SHAREHOLDER’S VOTE IS IMPORTANT
Important Notice Regarding the Availability of Proxy Materials for
Nuveen Symphony Low Volatility Equity Fund
Special Meeting of Shareholders to Be Held on July 16, 2018.
The Proxy Statement/Prospectus for this meeting is available at:
http://www.nuveenproxy.com/Mutual-Fund-Proxy-Information/
IF YOU VOTE ON THE INTERNET OR BY TELEPHONE,
YOU NEED NOT RETURN THIS PROXY CARD
Please detach at perforation before mailing.
In their discretion, the proxy holders are authorized to vote upon such other matters as may properly come before the meeting or any adjournments or postponements thereof.
| | | | | | | | |
| Properly executed proxies will be voted as specified. If no other specification is made, such shares will be voted “FOR” the proposal. |
TO VOTE, MARK BLOCKS BELOW IN BLUE OR BLACK INK. Example: ⬛
| | | | | | | | | | | | | | | | |
| | | | | | | | | | FOR | | AGAINST | | ABSTAIN | | |
| | | | | |
| 1. | | To approve an Agreement and Plan of Reorganization (and the related transactions) which provides for (i) the transfer of all the assets of Nuveen Symphony Low Volatility Equity Fund (the “Target Fund”) to Nuveen Santa Barbara Dividend Growth Fund (the “Acquiring Fund”), each a series of Nuveen Investment Trust II, in exchange solely for Class A, Class C, Class R6 and Class I shares of beneficial interest of the Acquiring Fund and the assumption by the Acquiring Fund of all the liabilities of the Target Fund; and (ii) the pro rata distribution of Class A, Class C, Class R6 and Class I shares of the Acquiring Fund to the shareholders of Class A, Class C, Class R6 and Class I shares of the Target Fund, respectively, in complete liquidation and termination of the Target Fund. | | ☐ | | ☐ | | ☐ | | |
WE URGE YOU TO SIGN, DATE AND MAIL THIS PROXY PROMPTLY
[CFS Code]
The information contained in this Statement of Additional Information is not complete and may be changed. We may not sell these securities until the registration statement filed with the Securities and Exchange Commission is effective. This Statement of Additional Information is not an offer to sell these securities, and it is not a solicitation of an offer to buy these securities, in any jurisdiction where the offer or sale is not permitted.
SUBJECT TO COMPLETION,
DATED APRIL 18, 2018
STATEMENT OF ADDITIONAL INFORMATION
NUVEEN SANTA BARBARA DIVIDEND GROWTH FUND
Relating to the Acquisition of the Assets and Liabilities of
NUVEEN SYMPHONY LOW VOLATILITY EQUITY FUND
333 West Wacker Drive
Chicago, Illinois 60606
Telephone: (312) 917-7700
This Statement of Additional Information (“SAI”) is not a prospectus but should be read in conjunction with the Proxy Statement/Prospectus dated [•], 2018 for use in connection with the special meeting of shareholders of Nuveen Symphony Low Volatility Equity Fund (the “Target Fund”), a series of Nuveen Investment Trust II (the “Trust”), to be held on July 16, 2018 at 2:00 p.m., Central time, and at any and all adjournments and postponements thereof (the “Special Meeting”). At the Special Meeting, shareholders of the Target Fund will be asked to approve the reorganization (the “Reorganization”) of the Target Fund into Nuveen Santa Barbara Dividend Growth Fund (the “Acquiring Fund”), also a series of the Trust, as described in the Proxy Statement/Prospectus. The Target Fund and the Acquiring Fund are referred to herein individually as a “Fund” and collectively as the “Funds.” Copies of the Proxy Statement/Prospectus may be obtained at no charge by writing to the Trust at the address shown above or by calling (800) 257-8787.
Further information about the Funds is contained in each Fund’s statement of additional information. The Target Fund’s statement of additional information dated January 31, 2018 (as filed January 26, 2018) (File Nos. 333-33607 and 811-08333), as supplemented through the date of this SAI, is incorporated herein by reference only insofar as it relates to the Target Fund. The Acquiring Fund’s statement of additional information dated November 30, 2017 (as filed November 28, 2017) (File Nos. 333-33607 and 811-08333), as supplemented through the date of this SAI, is incorporated herein by reference only insofar as it relates to the Acquiring Fund. No other parts are incorporated herein by reference.
The unaudited pro forma financial information, attached hereto as Appendix A, is intended to present the financial condition of the Acquiring Fund as if the Reorganization had been consummated on January 31, 2018 and the results of operations of the Acquiring Fund as if the Reorganization had taken place on the first day of the 12-month period ended January 31, 2018.
The audited financial statements and related independent registered public accounting firm’s report for the Target Fund are contained in the Target Fund’s Annual Report for the fiscal year ended September 30, 2017 (as filed December 7, 2017) (File No. 811-08333), which is incorporated herein by reference only insofar as it relates to the Target Fund. The audited financial statements and related independent registered public accounting firm’s report for the Acquiring Fund are contained in the Acquiring Fund’s Annual Report for the fiscal year ended July 31, 2017 (as filed October 6, 2017) (File No. 811-08333), which is incorporated herein by reference only insofar as it relates to the Acquiring Fund. The unaudited financial statements for the Acquiring Fund are contained in the Acquiring Fund’s Semi-Annual Report for the six months ended January 31, 2018 (as filed April 5, 2018) (File No. 811-08333), which is incorporated herein by reference only insofar as it relates to the Acquiring Fund. No other parts of the Funds’ Annual Reports or Semi-Annual Reports are incorporated by reference herein.
The date of this SAI is [•], 2018.
APPENDIX A
PRO FORMA FINANCIAL INFORMATION
Pro Forma Financial Statements for the Reorganization of Nuveen Symphony Low Volatility Equity Fund (the “Target Fund”) into Nuveen Santa Barbara Dividend Growth Fund (the “Acquiring Fund”)
Pro Forma Portfolio of Investments (Unaudited)
January 31, 2018
| | | | | | | | | | | | | | | | | | | | | | | | | | | | |
| Shares | | | | | Value | |
Target Fund | | | Acquiring
Fund | | | Acquiring Fund
Pro Forma | | | Description (1) | | Target
Fund | | | Acquiring
Fund | | | Pro Forma
Adjustments | | | Acquiring Fund
Pro Forma | |
| | | | | | | | | | | | LONG-TERM INVESTMENTS - 97.8% COMMON STOCKS - 97.8% Aerospace & Defense - 2.2% | | | | | | | | | | | | | | | | |
| | 6,983 | | | | - | | | | 6,983 | | | Boeing Company, (3) | | $ | 2,474,566 | | | $ | - | | | | | | | $ | 2,474,566 | |
| | - | | | | 208,367 | | | | 208,367 | | | Lockheed Martin Corporation | | | - | | | | 73,939,030 | | | | | | | | 73,939,030 | |
| | 3,390 | | | | - | | | | 3,390 | | | Northrop Grumman Corporation, (3) | | | 1,154,397 | | | | - | | | | | | | | 1,154,397 | |
| | | | | | | | | | | | | | | | | | | | | | | | | | | | |
| | | | | | | | | | | | Total Aerospace & Defense | | | 3,628,963 | | | | 73,939,030 | | | | | | | | 77,567,993 | |
| | | | | | | | | | | | | | | | | | | | | | | | | | | | |
| | | | | | | | | | | | Air Freight & Logistics - 0.0% | | | | | | | | | | | | | | | | |
| | 4,978 | | | | - | | | | 4,978 | | | FedEx Corporation, (3) | | | 1,306,625 | | | | - | | | | | | | | 1,306,625 | |
| | | | | | | | | | | | | | | | | | | | | | | | | | | | |
| | | | | | | | | | | | Auto Components - 0.0% | | | | | | | | | | | | | | | | |
| | 12,883 | | | | - | | | | 12,883 | | | Aptiv PLC, (3) | | | 1,222,339 | | | | - | | | | | | | | 1,222,339 | |
| | | | | | | | | | | | | | | | | | | | | | | | | | | | |
| | | | | | | | | | | | Banks - 6.1% | | | | | | | | | | | | | | | | |
| | 50,701 | | | | - | | | | 50,701 | | | Citizens Financial Group Inc., (3) | | | 2,327,176 | | | | - | | | | | | | | 2,327,176 | |
| | 24,698 | | | | - | | | | 24,698 | | | Comerica Incorporated, (3) | | | 2,351,744 | | | | - | | | | | | | | 2,351,744 | |
| | 15,061 | | | | - | | | | 15,061 | | | Hancock Holding Company, (3) | | | 808,776 | | | | - | | | | | | | | 808,776 | |
| | 26,506 | | | | 876,838 | | | | 903,344 | | | JPMorgan Chase & Co. | | | 3,065,949 | | | | 101,423,852 | | | | | | | | 104,489,801 | |
| | 2,990 | | | | - | | | | 2,990 | | | SVB Financial Group, (2), (3) | | | 737,185 | | | | - | | | | | | | | 737,185 | |
| | - | | | | 1,551,401 | | | | 1,551,401 | | | Wells Fargo & Company | | | - | | | | 102,051,158 | | | | | | | | 102,051,158 | |
| | | | | | | | | | | | | | | | | | | | | | | | | | | | |
| | | | | | | | | | | | Total Banks | | | 9,290,830 | | | | 203,475,010 | | | | | | | | 212,765,840 | |
| | | | | | | | | | | | | | | | | | | | | | | | | | | | |
| | | | | | | | | | | | Beverages - 2.4% | | | | | | | | | | | | | | | | |
| | - | | | | 694,886 | | | | 694,886 | | | PepsiCo, Inc. | | | - | | | | 83,594,786 | | | | | | | | 83,594,786 | |
| | | | | | | | | | | | | | | | | | | | | | | | | | | | |
| | | | | | | | | | | | Biotechnology - 2.2% | | | | | | | | | | | | | | | | |
| | - | | | | 646,192 | | | | 646,192 | | | AbbVie Inc. | | | - | | | | 72,515,666 | | | | | | | | 72,515,666 | |
| | 5,328 | | | | - | | | | 5,328 | | | Amgen Inc., (3) | | | 991,274 | | | | - | | | | | | | | 991,274 | |
| | 4,098 | | | | - | | | | 4,098 | | | Biogen Inc., (2), (3) | | | 1,425,325 | | | | - | | | | | | | | 1,425,325 | |
| | 6,290 | | | | - | | | | 6,290 | | | Celgene Corporation, (2), (3) | | | 636,296 | | | | - | | | | | | | | 636,296 | |
| | 7,322 | | | | - | | | | 7,322 | | | Gilead Sciences, Inc., (3) | | | 613,584 | | | | - | | | | | | | | 613,584 | |
| | | | | | | | | | | | | | | | | | | | | | | | | | | | |
| | | | | | | | | | | | Total Biotechnology | | | 3,666,479 | | | | 72,515,666 | | | | | | | | 76,182,145 | |
| | | | | | | | | | | | | | | | | | | | | | | | | | | | |
See accompanying notes to pro forma financial statements.
A-1
| | | | | | | | | | | | | | | | | | | | | | | | | | | | |
| Shares | | | | | Value | |
Target Fund | | | Acquiring
Fund | | | Acquiring Fund
Pro Forma | | | Description (1) | | Target
Fund | | | Acquiring
Fund | | | Pro Forma
Adjustments | | | Acquiring Fund
Pro Forma | |
| | | | | | | | | | | | Building Products - 0.1% | | | | | | | | | | | | | | | | |
| | 18,622 | | | | - | | | | 18,622 | | | Jeld-Wen Holding, Inc, (2), (3) | | $ | 731,472 | | | $ | - | | | | | | | $ | 731,472 | |
| | 25,890 | | | | - | | | | 25,890 | | | Masco Corporation, (3) | | | 1,156,247 | | | | - | | | | | | | | 1,156,247 | |
| | | | | | | | | | | | | | | | | | | | | | | | | | | | |
| | | | | | | | | | | | Total Building Products | | | 1,887,719 | | | | - | | | | | | | | 1,887,719 | |
| | | | | | | | | | | | | | | | | | | | | | | | | | | | |
| | | | | | | | | | | | Capital Markets - 2.4% | | | | | | | | | | | | | | | | |
| | - | | | | 147,057 | | | | 147,057 | | | BlackRock Inc. | | | - | | | | 82,616,623 | | | | | | | | 82,616,623 | |
| | 20,633 | | | | - | | | | 20,633 | | | Charles Schwab Corporation, (3) | | | 1,100,564 | | | | - | | | | | | | | 1,100,564 | |
| | | | | | | | | | | | | | | | | | | | | | | | | | | | |
| | | | | | | | | | | | Total Capital Markets | | | 1,100,564 | | | | 82,616,623 | | | | | | | | 83,717,187 | |
| | | | | | | | | | | | | | | | | | | | | | | | | | | | |
| | | | | | | | | | | | Chemicals - 3.7% | | | | | | | | | | | | | | | | |
| | 5,227 | | | | - | | | | 5,227 | | | Air Products & Chemicals Inc, (3) | | | 880,070 | | | | - | | | | | | | | 880,070 | |
| | - | | | | 497,712 | | | | 497,712 | | | Monsanto Company | | | - | | | | 60,621,322 | | | | | | | | 60,621,322 | |
| | 28,024 | | | | - | | | | 28,024 | | | Olin Corporation, (3) | | | 1,044,735 | | | | - | | | | | | | | 1,044,735 | |
| | 5,721 | | | | 402,963 | | | | 408,684 | | | Praxair, Inc. | | | 923,884 | | | | 65,074,495 | | | | | | | | 65,998,379 | |
| | 15,572 | | | | - | | | | 15,572 | | | Westlake Chemical Corporation, (3) | | | 1,753,407 | | | | - | | | | | | | | 1,753,407 | |
| | | | | | | | | | | | | | | | | | | | | | | | | | | | |
| | | | | | | | | | | | Total Chemicals | | | 4,602,096 | | | | 125,695,817 | | | | | | | | 130,297,913 | |
| | | | | | | | | | | | | | | | | | | | | | | | | | | | |
| | | | | | | | | | | | Commercial Banks - 0.0% | | | | | | | | | | | | | | | | |
| | 14,368 | | | | - | | | | 14,368 | | | BB&T Corp, (3) | | | 792,970 | | | | - | | | | | | | | 792,970 | |
| | | | | | | | | | | | | | | | | | | | | | | | | | | | |
| | | | | | | | | | | | Commercial Services & Supplies - 0.1% | | | | | | | | | | | | | | | | |
| | 7,225 | | | | - | | | | 7,225 | | | Cintas Corporation, (3) | | | 1,217,051 | | | | - | | | | | | | | 1,217,051 | |
| | 20,148 | | | | - | | | | 20,148 | | | Waste Connections Inc, (3) | | | 1,447,029 | | | | - | | | | | | | | 1,447,029 | |
| | 27,755 | | | | - | | | | 27,755 | | | Waste Management, Inc., (3) | | | 2,454,375 | | | | - | | | | | | | | 2,454,375 | |
| | | | | | | | | | | | | | | | | | | | | | | | | | | | |
| | | | | | | | | | | | Total Commercial Services & Supplies | | | 5,118,455 | | | | - | | | | | | | | 5,118,455 | |
| | | | | | | | | | | | | | | | | | | | | | | | | | | | |
| | | | | | | | | | | | Communications Equipment - 2.7% | | | | | | | | | | | | | | | | |
| | - | | | | 2,265,382 | | | | 2,265,382 | | | Cisco Systems, Inc. | | | - | | | | 94,103,968 | | | | | | | | 94,103,968 | |
| | | | | | | | | | | | | | | | | | | | | | | | | | | | |
| | | | | | | | | | | | Containers & Packaging - 2.5% | | | | | | | | | | | | | | | | |
| | - | | | | 683,873 | | | | 683,873 | | | Packaging Corp. of America | | | - | | | | 85,914,965 | | | | | | | | 85,914,965 | |
| | | | | | | | | | | | | | | | | | | | | | | | | | | | |
| | | | | | | | | | | | Diversified Financial Services - 0.0% | | | | | | | | | | | | | | | | |
| | 22,866 | | | | - | | | | 22,866 | | | Voya Financial Inc., (3) | | | 1,186,974 | | | | - | | | | | | | | 1,186,974 | |
| | | | | | | | | | | | | | | | | | | | | | | | | | | | |
| | | | | | | | | | | | Diversified Telecommunication Services - 2.0% | | | | | | | | | | | | | | | | |
| | - | | | | 1,830,871 | | | | 1,830,871 | | | AT&T Inc. | | | - | | | | 68,566,119 | | | | | | | | 68,566,119 | |
| | | | | | | | | | | | | | | | | | | | | | | | | | | | |
| | | | | | | | | | | | Electric Utilities - 2.7% | | | | | | | | | | | | | | | | |
| | 4,738 | | | | 580,664 | | | | 585,402 | | | NextEra Energy Inc. | | | 750,594 | | | | 91,988,791 | | | | | | | | 92,739,385 | |
| | | | | | | | | | | | | | | | | | | | | | | | | | | | |
| | | | | | | | | | | | Energy Equipment & Services - 1.4% | | | | | | | | | | | | | | | | |
| | - | | | | 685,342 | | | | 685,342 | | | Schlumberger Limited | | | - | | | | 50,427,464 | | | | | | | | 50,427,464 | |
| | | | | | | | | | | | | | | | | | | | | | | | | | | | |
See accompanying notes to pro forma financial statements.
A-2
| | | | | | | | | | | | | | | | | | | | | | | | | | | | |
| Shares | | | | | Value | |
Target Fund | | | Acquiring
Fund | | | Acquiring Fund
Pro Forma | | | Description (1) | | Target
Fund | | | Acquiring
Fund | | | Pro Forma
Adjustments | | | Acquiring Fund
Pro Forma | |
| | | | | | | | | | | | Equity Real Estate Investment Trust - 1.5% | | | | | | | | | | | | | | | | |
| | 12,922 | | | | 771,257 | | | | 784,179 | | | CyrusOne Inc. | | $ | 745,470 | | | $ | 44,493,816 | | | | | | | $ | 45,239,286 | |
| | 25,424 | | | | - | | | | 25,424 | | | DCT Industrial Trust Inc, (3) | | | 1,504,847 | | | | - | | | | | | | | 1,504,847 | |
| | 42,562 | | | | - | | | | 42,562 | | | Duke Realty Corporation, (3) | | | 1,124,062 | | | | - | | | | | | | | 1,124,062 | |
| | 2,295 | | | | - | | | | 2,295 | | | Equinix Inc., (3) | | | 1,044,661 | | | | - | | | | | | | | 1,044,661 | |
| | 6,228 | | | | - | | | | 6,228 | | | SBA Communications Corporation, (2), (3) | | | 1,086,786 | | | | - | | | | | | | | 1,086,786 | |
| | 11,037 | | | | - | | | | 11,037 | | | Sun Communities Inc, (3) | | | 980,527 | | | | - | | | | | | | | 980,527 | |
| | | | | | | | | | | | | | | | | | | | | | | | | | | | |
| | | | | | | | | | | | Total Equity Real Estate Investment Trust | | | 6,486,353 | | | | 44,493,816 | | | | | | | | 50,980,169 | |
| | | | | | | | | | | | | | | | | | | | | | | | | | | | |
| | | | | | | | | | | | Food & Staples Retailing - 2.3% | | | | | | | | | | | | | | | | |
| | - | | | | 1,007,275 | | | | 1,007,275 | | | CVS Health Corporation | | | - | | | | 79,262,470 | | | | | | | | 79,262,470 | |
| | | | | | | | | | | | | | | | | | | | | | | | | | | | |
| | | | | | | | | | | | Food Products - 2.0% | | | | | | | | | | | | | | | | |
| | 12,120 | | | | - | | | | 12,120 | | | Kraft Heinz Company, (3) | | | 950,087 | | | | - | | | | | | | | 950,087 | |
| | 30,285 | | | | - | | | | 30,285 | | | Lamb Weston Holding, Inc, (3) | | | 1,774,701 | | | | - | | | | | | | | 1,774,701 | |
| | - | | | | 1,501,037 | | | | 1,501,037 | | | Mondelez International Inc. | | | - | | | | 66,646,043 | | | | | | | | 66,646,043 | |
| | | | | | | | | | | | | | | | | | | | | | | | | | | | |
| | | | | | | | | | | | Total Food Products | | | 2,724,788 | | | | 66,646,043 | | | | | | | | 69,370,831 | |
| | | | | | | | | | | | | | | | | | | | | | | | | | | | |
| | | | | | | | | | | | Health Care Equipment & Supplies - 5.0% | | | | | | | | | | | | | | | | |
| | 35,791 | | | | - | | | | 35,791 | | | Abbott Laboratories, (3) | | | 2,224,769 | | | | - | | | | | | | | 2,224,769 | |
| | 5,984 | | | | 367,359 | | | | 373,343 | | | Becton, Dickinson and Company | | | 1,453,753 | | | | 89,246,195 | | | | | | | | 90,699,948 | |
| | 15,570 | | | | - | | | | 15,570 | | | Danaher Corporation, (3) | | | 1,576,930 | | | | - | | | | | | | | 1,576,930 | |
| | 26,387 | | | | 890,747 | | | | 917,134 | | | Medtronic, PLC | | | 2,266,379 | | | | 76,506,260 | | | | | | | | 78,772,639 | |
| | 4,107 | | | | - | | | | 4,107 | | | Teleflex Inc, (3) | | | 1,140,719 | | | | - | | | | | | | | 1,140,719 | |
| | 8,944 | | | | - | | | | 8,944 | | | Zimmer Biomet Holdings, Inc., (3) | | | 1,136,961 | | | | - | | | | | | | | 1,136,961 | |
| | | | | | | | | | | | | | | | | | | | | | | | | | | | |
| | | | | | | | | | | | Total Health Care Equipment & Supplies | | | 9,799,511 | | | | 165,752,455 | | | | | | | | 175,551,966 | |
| | | | | | | | | | | | | | | | | | | | | | | | | | | | |
| | | | | | | | | | | | Health Care Providers & Services - 3.2% | | | | | | | | | | | | | | | | |
| | 9,466 | | | | - | | | | 9,466 | | | CIGNA Corporation, (3) | | | 1,972,241 | | | | - | | | | | | | | 1,972,241 | |
| | 6,596 | | | | - | | | | 6,596 | | | Humana Inc., (3) | | | 1,858,951 | | | | - | | | | | | | | 1,858,951 | |
| | - | | | | 456,236 | | | | 456,236 | | | UnitedHealth Group Incorporated | | | - | | | | 108,027,560 | | | | | | | | 108,027,560 | |
| | | | | | | | | | | | | | | | | | | | | | | | | | | | |
| | | | | | | | | | | | Total Health Care Providers & Services | | | 3,831,192 | | | | 108,027,560 | | | | | | | | 111,858,752 | |
| | | | | | | | | | | | | | | | | | | | | | | | | | | | |
| | | | | | | | | | | | Hotels, Restaurants & Leisure - 0.2% | | | | | | | | | | | | | | | | |
| | 10,410 | | | | - | | | | 10,410 | | | Hilton Worldwide Holdings Inc, (3) | | | 891,617 | | | | - | | | | | | | | 891,617 | |
| | 34,478 | | | | - | | | | 34,478 | | | La Quinta Holdings Inc, (2), (3) | | | 687,147 | | | | - | | | | | | | | 687,147 | |
| | 9,210 | | | | - | | | | 9,210 | | | Marriott International, Inc., Class A, (3) | | | 1,357,001 | | | | - | | | | | | | | 1,357,001 | |
| | 8,434 | | | | - | | | | 8,434 | | | McDonald’s Corporation, (3) | | | 1,443,395 | | | | - | | | | | | | | 1,443,395 | |
| | 8,631 | | | | - | | | | 8,631 | | | Wyndham Worldwide Corp, (3) | | | 1,071,366 | | | | - | | | | | | | | 1,071,366 | |
| | | | | | | | | | | | | | | | | | | | | | | | | | | | |
| | | | | | | | | | | | Total Hotels, Restaurants & Leisure | | | 5,450,526 | | | | - | | | | | | | | 5,450,526 | |
| | | | | | | | | | | | | | | | | | | | | | | | | | | | |
See accompanying notes to pro forma financial statements.
A-3
| | | | | | | | | | | | | | | | | | | | | | | | | | | | |
| Shares | | | | | Value | |
Target Fund | | | Acquiring
Fund | | | Acquiring Fund
Pro Forma | | | Description (1) | | Target
Fund | | | Acquiring
Fund | | | Pro Forma
Adjustments | | | Acquiring Fund
Pro Forma | |
| | | | | | | | | | | | Household Durables - 1.6% | | | | | | | | | | | | | | | | |
| | - | | | | 303,170 | | | | 303,170 | | | Whirlpool Corporation | | $ | - | | | $ | 55,001,101 | | | | | | | $ | 55,001,101 | |
| | | | | | | | | | | | | | | | | | | | | | | | | | | | |
| | | | | | | | | | | | Household Products - 2.0% | | | | | | | | | | | | | | | | |
| | 22,154 | | | | - | | | | 22,154 | | | Church & Dwight Company Inc., (3) | | | 1,082,223 | | | | - | | | | | | | | 1,082,223 | |
| | 6,654 | | | | - | | | | 6,654 | | | Clorox Company, (3) | | | 942,805 | | | | - | | | | | | | | 942,805 | |
| | 8,959 | | | | 900,991 | | | | 909,950 | | | Colgate-Palmolive Company | | | 665,116 | | | | 66,889,572 | | | | | | | | 67,554,688 | |
| | | | | | | | | | | | | | | | | | | | | | | | | | | | |
| | | | | | | | | | | | Total Household Products | | | 2,690,144 | | | | 66,889,572 | | | | | | | | 69,579,716 | |
| | | | | | | | | | | | | | | | | | | | | | | | | | | | |
| | | | | | | | | | | | Industrial Conglomerates - 2.6% | | | | | | | | | | | | | | | | |
| | 18,916 | | | | 540,176 | | | | 559,092 | | | Honeywell International Inc. | | | 3,020,318 | | | | 86,249,902 | | | | | | | | 89,270,220 | |
| | | | | | | | | | | | | | | | | | | | | | | | | | | | |
| | | | | | | | | | | | Insurance - 4.3% | | | | | | | | | | | | | | | | |
| | 11,061 | | | | 447,348 | | | | 458,409 | | | Ace Limited | | | 1,727,175 | | | | 69,853,390 | | | | | | | | 71,580,565 | |
| | 8,060 | | | | - | | | | 8,060 | | | AFLAC Incorporated, (3) | | | 710,892 | | | | - | | | | | | | | 710,892 | |
| | 23,324 | | | | 832,483 | | | | 855,807 | | | Marsh & McLennan Companies, Inc. | | | 1,948,020 | | | | 69,528,980 | | | | | | | | 71,477,000 | |
| | 44,880 | | | | - | | | | 44,880 | | | Progressive Corporation, (3) | | | 2,428,008 | | | | - | | | | | | | | 2,428,008 | |
| | 13,110 | | | | - | | | | 13,110 | | | Prudential Financial, Inc., (3) | | | 1,557,730 | | | | - | | | | | | | | 1,557,730 | |
| | 4,077 | | | | - | | | | 4,077 | | | Reinsurance Group of America Inc, (3) | | | 638,662 | | | | - | | | | | | | | 638,662 | |
| | | | | | | | | | | | | | | | | | | | | | | | | | | | |
| | | | | | | | | | | | Total Insurance | | | 9,010,487 | | | | 139,382,370 | | | | | | | | 148,392,857 | |
| | | | | | | | | | | | | | | | | | | | | | | | | | | | |
| | | | | | | | | | | | Internet & Direct Marketing Retail - 0.2% | | | | | | | | | | | | | | | | |
| | 3,305 | | | | - | | | | 3,305 | | | Amazon.com, Inc., (2), (3) | | | 4,795,191 | | | | - | | | | | | | | 4,795,191 | |
| | 381 | | | | - | | | | 381 | | | Booking Holdings Inc, (2), (3) | | | 728,491 | | | | - | | | | | | | | 728,491 | |
| | | | | | | | | | | | | | | | | | | | | | | | | | | | |
| | | | | | | | | | | | Total Internet & Direct Marketing Retail | | | 5,523,682 | | | | - | | | | | | | | 5,523,682 | |
| | | | | | | | | | | | | | | | | | | | | | | | | | | | |
| | | | | | | | | | | | Internet Software & Services - 0.2% | | | | | | | | | | | | | | | | |
| | 4,124 | | | | - | | | | 4,124 | | | Alphabet Inc., Class A, (2), (3) | | | 4,875,475 | | | | - | | | | | | | | 4,875,475 | |
| | 33,197 | | | | - | | | | 33,197 | | | eBay Inc., (2), (3) | | | 1,347,134 | | | | - | | | | | | | | 1,347,134 | |
| | | | | | | | | | | | | | | | | | | | | | | | | | | | |
| | | | | | | | | | | | Total Internet Software & Services | | | 6,222,609 | | | | - | | | | | | | | 6,222,609 | |
| | | | | | | | | | | | | | | | | | | | | | | | | | | | |
| | | | | | | | | | | | IT Services - 5.7% | | | | | | | | | | | | | | | | |
| | - | | | | 567,826 | | | | 567,826 | | | Accenture Limited | | | - | | | | 91,249,638 | | | | | | | | 91,249,638 | |
| | 17,053 | | | | - | | | | 17,053 | | | DXC Technology Company, (3) | | | 1,697,626 | | | | - | | | | | | | | 1,697,626 | |
| | 9,570 | | | | 922,348 | | | | 931,918 | | | Fidelity National Information Services | | | 979,585 | | | | 94,411,541 | | | | | | | | 95,391,126 | |
| | 82,600 | | | | - | | | | 82,600 | | | First Data Corporation, Class A, (2), (3) | | | 1,462,020 | | | | - | | | | | | | | 1,462,020 | |
| | 7,394 | | | | - | | | | 7,394 | | | Fiserv, Inc., (2), (3) | | | 1,041,371 | | | | - | | | | | | | | 1,041,371 | |
| | 16,137 | | | | - | | | | 16,137 | | | MasterCard, Inc., Class A, (3) | | | 2,727,153 | | | | - | | | | | | | | 2,727,153 | |
| | 25,248 | | | | - | | | | 25,248 | | | Visa Inc., Class A, (3) | | | 3,136,559 | | | | - | | | | | | | | 3,136,559 | |
| | 19,195 | | | | - | | | | 19,195 | | | Worldpay Inc, (2), (3) | | | 1,541,550 | | | | - | | | | | | | | 1,541,550 | |
| | | | | | | | | | | | | | | | | | | | | | | | | | | | |
| | | | | | | | | | | | Total IT Services | | | 12,585,864 | | | | 185,661,179 | | | | | | | | 198,247,043 | |
| | | | | | | | | | | | | | | | | | | | | | | | | | | | |
See accompanying notes to pro forma financial statements.
A-4
| | | | | | | | | | | | | | | | | | | | | | | | | | | | |
| Shares | | | | | Value | |
Target Fund | | | Acquiring
Fund | | | Acquiring Fund
Pro Forma | | | Description (1) | | Target
Fund | | | Acquiring
Fund | | | Pro Forma
Adjustments | | | Acquiring Fund
Pro Forma | |
| | | | | | | | | | | | Life Sciences Tools & Services - 0.0% | | | | | | | | | | | | | | | | |
| | 4,819 | | | | - | | | | 4,819 | | | Waters Corporation, (2), (3) | | $ | 1,039,025 | | | $ | - | | | | | | | $ | 1,039,025 | |
| | | | | | | | | | | | | | | | | | | | | | | | | | | | |
| | | | | | | | | | | | Machinery - 2.0% | | | | | | | | | | | | | | | | |
| | 17,446 | | | | - | | | | 17,446 | | | Caterpillar Inc., (3) | | | 2,839,860 | | | | - | | | | | | | | 2,839,860 | |
| | - | | | | 719,155 | | | | 719,155 | | | Ingersoll Rand Company Limited, Class A | | | - | | | | 68,053,638 | | | | | | | | 68,053,638 | |
| | | | | | | | | | | | | | | | | | | | | | | | | | | | |
| | | | | | | | | | | | Total Machinery | | | 2,839,860 | | | | 68,053,638 | | | | | | | | 70,893,498 | |
| | | | | | | | | | | | | | | | | | | | | | | | | | | | |
| | | | | | | | | | | | Media - 5.5% | | | | | | | | | | | | | | | | |
| | - | | | | 2,124,166 | | | | 2,124,166 | | | Comcast Corporation, Class A | | | - | | | | 90,340,780 | | | | | | | | 90,340,780 | |
| | - | | | | 2,016,526 | | | | 2,016,526 | | | Interpublic Group of Companies, Inc. | | | - | | | | 44,141,754 | | | | | | | | 44,141,754 | |
| | 10,376 | | | | 503,637 | | | | 514,013 | | | Walt Disney Company | | | 1,127,560 | | | | 54,730,233 | | | | | | | | 55,857,793 | |
| | | | | | | | | | | | | | | | | | | | | | | | | | | | |
| | | | | | | | | | | | Total Media | | | 1,127,560 | | | | 189,212,767 | | | | | | | | 190,340,327 | |
| | | | | | | | | | | | | | | | | | | | | | | | | | | | |
| | | | | | | | | | | | Multi-Utilities - 2.0% | | | | | | | | | | | | | | | | |
| | 23,392 | | | | - | | | | 23,392 | | | CenterPoint Energy, Inc., (3) | | | 659,187 | | | | - | | | | | | | | 659,187 | |
| | 35,058 | | | | - | | | | 35,058 | | | CMS Energy Corporation, (3) | | | 1,568,846 | | | | - | | | | | | | | 1,568,846 | |
| | - | | | | 1,038,876 | | | | 1,038,876 | | | WEC Energy Group, Inc. | | | - | | | | 66,799,727 | | | | | | | | 66,799,727 | |
| | | | | | | | | | | | | | | | | | | | | | | | | | | | |
| | | | | | | | | | | | Total Multi-Utilities | | | 2,228,033 | | | | 66,799,727 | | | | | | | | 69,027,760 | |
| | | | | | | | | | | | | | | | | | | | | | | | | | | | |
| | | | | | | | | | | | Oil, Gas & Consumable Fuels - 5.2% | | | | | | | | | | | | | | | | |
| | 6,080 | | | | 562,889 | | | | 568,969 | | | Chevron Corporation | | | 762,128 | | | | 70,558,136 | | | | | | | | 71,320,264 | |
| | 10,359 | | | | - | | | | 10,359 | | | EOG Resources, Inc., (3) | | | 1,191,285 | | | | - | | | | | | | | 1,191,285 | |
| | 17,604 | | | | - | | | | 17,604 | | | ONEOK, Inc, (3) | | | 1,036,171 | | | | - | | | | | | | | 1,036,171 | |
| | 12,401 | | | | 1,042,826 | | | | 1,055,227 | | | Phillips 66 | | | 1,269,862 | | | | 106,785,382 | | | | | | | | 108,055,244 | |
| | | | | | | | | | | | | | | | | | | | | | | | | | | | |
| | | | | | | | | | | | Total Oil, Gas & Consumable Fuels | | | 4,259,446 | | | | 177,343,518 | | | | | | | | 181,602,964 | |
| | | | | | | | | | | | | | | | | | | | | | | | | | | | |
| | | | | | | | | | | | Pharmaceuticals - 6.3% | | | | | | | | | | | | | | | | |
| | - | | | | 372,296 | | | | 372,296 | | | Allergan PLC | | | - | | | | 67,110,077 | | | | | | | | 67,110,077 | |
| | 11,296 | | | | - | | | | 11,296 | | | Bristol-Myers Squibb Company, (3) | | | 707,130 | | | | - | | | | | | | | 707,130 | |
| | 24,080 | | | | 515,488 | | | | 539,568 | | | Johnson & Johnson | | | 3,327,615 | | | | 71,235,287 | | | | | | | | 74,562,902 | |
| | - | | | | 2,059,977 | | | | 2,059,977 | | | Pfizer Inc. | | | - | | | | 76,301,548 | | | | | | | | 76,301,548 | |
| | | | | | | | | | | | | | | | | | | | | | | | | | | | |
| | | | | | | | | | | | Total Pharmaceuticals | | | 4,034,745 | | | | 214,646,912 | | | | | | | | 218,681,657 | |
| | | | | | | | | | | | | | | | | | | | | | | | | | | | |
| | | | | | | | | | | | Professional Services - 1.4% | | | | | | | | | | | | | | | | |
| | - | | | | 1,294,645 | | | | 1,294,645 | | | Nielsen Holdings PLC | | | - | | | | 48,432,669 | | | | | | | | 48,432,669 | |
| | | | | | | | | | | | | | | | | | | | | | | | | | | | |
| | | | | | | | | | | | Road & Rail - 2.5% | | | | | | | | | | | | | | | | |
| | 9,357 | | | | - | | | | 9,357 | | | Landstar System, (3) | | | 1,039,095 | | | | - | | | | | | | | 1,039,095 | |
| | 12,017 | | | | - | | | | 12,017 | | | Norfolk Southern Corporation, (3) | | | 1,813,125 | | | | - | | | | | | | | 1,813,125 | |
| | 12,059 | | | | 613,989 | | | | 626,048 | | | Union Pacific Corporation | | | 1,609,877 | | | | 81,967,532 | | | | | | | | 83,577,409 | |
| | | | | | | | | | | | | | | | | | | | | | | | | | | | |
| | | | | | | | | | | | Total Road & Rail | | | 4,462,097 | | | | 81,967,532 | | | | | | | | 86,429,629 | |
| | | | | | | | | | | | | | | | | | | | | | | | | | | | |
See accompanying notes to pro forma financial statements.
A-5
| | | | | | | | | | | | | | | | | | | | | | | | | | | | |
| Shares | | | | | Value | |
Target Fund | | | Acquiring
Fund | | | Acquiring Fund
Pro Forma | | | Description (1) | | Target
Fund | | | Acquiring
Fund | | | Pro Forma
Adjustments | | | Acquiring Fund
Pro Forma | |
| | | | | | | | | | | | Semiconductors & Semiconductor Equipment - 0.1% | | | | | | | | | | | | | | | | |
| | 14,056 | | | | - | | | | 14,056 | | | Analog Devices, Inc., (3) | | $ | 1,291,465 | | | $ | - | | | | | | | $ | 1,291,465 | |
| | 1,765 | | | | - | | | | 1,765 | | | Broadcom Limited, (3) | | | 437,773 | | | | - | | | | | | | | 437,773 | |
| | 11,329 | | | | - | | | | 11,329 | | | KLA-Tencor Corporation, (3) | | | 1,243,924 | | | | - | | | | | | | | 1,243,924 | |
| | | | | | | | | | | | | | | | | | | | | | | | | | | | |
| | | | | | | | | | | | Total Semiconductors & Semiconductor Equipment | | | 2,973,162 | | | | - | | | | | | | | 2,973,162 | |
| | | | | | | | | | | | | | | | | | | | | | | | | | | | |
| | | | | | | | | | | | Software - 4.4% | | | | | | | | | | | | | | | | |
| | 11,716 | | | | - | | | | 11,716 | | | Electronic Arts Inc., (2), (3) | | | 1,487,463 | | | | - | | | | | | | | 1,487,463 | |
| | 7,865 | | | | - | | | | 7,865 | | | Intuit, Inc., (3) | | | 1,320,534 | | | | - | | | | | | | | 1,320,534 | |
| | 55,419 | | | | 1,481,287 | | | | 1,536,706 | | | Microsoft Corporation | | | 5,265,359 | | | | 140,737,078 | | | | | | | | 146,002,437 | |
| | 43,169 | | | | - | | | | 43,169 | | | Oracle Corporation, (3) | | | 2,227,089 | | | | - | | | | | | | | 2,227,089 | |
| | 12,457 | | | | - | | | | 12,457 | | | ServiceNow Inc, (2), (3) | | | 1,854,474 | | | | - | | | | | | | | 1,854,474 | |
| | | | | | | | | | | | | | | | | | | | | | | | | | | | |
| | | | | | | | | | | | Total Software | | | 12,154,919 | | | | 140,737,078 | | | | | | | | 152,891,997 | |
| | | | | | | | | | | | | | | | | | | | | | | | | | | | |
| | | | | | | | | | | | Specialty Retail - 3.2% | | | | | | | | | | | | | | | | |
| | 8,695 | | | | - | | | | 8,695 | | | Home Depot, Inc., (3) | | | 1,746,826 | | | | - | | | | | | | | 1,746,826 | |
| | - | | | | 1,033,938 | | | | 1,033,938 | | | Lowe’s Companies, Inc. | | | - | | | | 108,284,327 | | | | | | | | 108,284,327 | |
| | | | | | | | | | | | | | | | | | | | | | | | | | | | |
| | | | | | | | | | | | Total Specialty Retail | | | 1,746,826 | | | | 108,284,327 | | | | | | | | 110,031,153 | |
| | | | | | | | | | | | | | | | | | | | | | | | | | | | |
| | | | | | | | | | | | Technology Hardware, Storage & Peripherals — 3.8% | | | | | | | | | | | | | | | | |
| | - | | | | 792,982 | | | | 792,982 | | | Apple, Inc. | | | - | | | | 132,768,976 | | | | | | | | 132,768,976 | |
| | | | | | | | | | | | | | | | | | | | | | | | | | | | |
| | | | | | | | | | | | Tobacco - 0.1% | | | | | | | | | | | | | | | | |
| | 27,323 | | | | - | | | | 27,323 | | | Altria Group, Inc., (3) | | | 1,921,900 | | | | - | | | | | | | | 1,921,900 | |
| | 12,636 | | | | - | | | | 12,636 | | | Philip Morris International, (3) | | | 1,354,958 | | | | - | | | | | | | | 1,354,958 | |
| | | | | | | | | | | | | | | | | | | | | | | | | | | | |
| | | | | | | | | | | | Total Tobacco | | | 3,276,858 | | | | - | | | | | | | | 3,276,858 | |
| | | | | | | | | | | | | | | | | | | | | | | | | | | | |
| | | | | | | | | | | | Total Long-Term Investments (cost $104,396,080, $2,054,397,867
and $2,158,793,947, respectively) | | | 142,042,613 | | | | 3,258,451,851 | | | | | | | | 3,400,494,464 | |
| | | | | | | | | | | | | | | | | | | | | | | | | | | | |
See accompanying notes to pro forma financial statements.
A-6
| | | | | | | | | | | | | | | | | | | | | | | | | | | | | | | | | | | | |
| Principal Amount (000) | | | | | | | | | | | Value | |
Target Fund | | | Acquiring
Fund | | | Acquiring Fund
Pro Forma | | | Description (1) | | Coupon | | | Maturity | | | Target
Fund | | | Acquiring
Fund | | | Pro Forma
Adjustments | | | Acquiring Fund
Pro Forma | |
| | | | | | | | | | | | Short-Term Investments - 2.1% | | | | | | | | | | | | | | | | | | | | | | | | |
| | | | | | | | | | | | Repurchase Agreements - 2.1% | | | | | | | | | | | | | | | | | | | | | | | | |
| | $- | | | $ | 72,717 | | | $ | 72,717 | | | Repurchase Agreement with Fixed Income Clearing Corporation, dated 1/31/18, repurchase price $72,718,262, collateralized by $75,375,000 U.S. Treasury Notes, 1.875%, due 3/31/22, value $74,171,563 | | | 0.540 | % | | | 2/1/2018 | | | $ | - | | | $ | 72,717,171 | | | | | | | $ | 72,717,171 | |
| | | | | | | | | | | | | | | | | | | | | | | | | | | | | | | | | | | | |
| | | | | | | | | | | | Total Short-Term Investments (cost $-, $72,717,171
and $72,717,171, respectively) | | | | | | | | - | | | | 72,717,171 | | | | | | | | 72,717,171 | |
| | | | | | | | | | | | | | | | | | | | | | | | | | | | | | | | | | | | |
| | | | | | | | | | | | Total Investments (cost $104,396,080, $2,127,115,038 and $2,231,511,118, respectively) - 100.0% | | | | 142,042,613 | | | | 3,331,169,022 | | | | | | | | 3,473,211,635 | |
| | | | | | | | | | | | | | | | | | | | | | | | | | | | | | | | | | | | |
| | | | | | | | | | | | Other Assets Less Liabilities - 0.1% | | | | | | | | 242,792 | | | | 5,689,722 | | | | (1,333,151 | ) (4) | | | 4,599,363 | |
| | | | | | | | | | | | | | | | | | | | | | | | | | | | | | | | | | | | |
| | | | | | | | | | | | Net Assets - 100% | | | | | | | | | | $ | 142,285,405 | | | $ | 3,336,858,744 | | | $ | (1,333,151 | ) | | $ | 3,477,810,998 | |
| | | | | | | | | | | | | | | | | | | | | | | | | | | | | | | | | | | | |
| | | For Fund portfolio compliance purposes, the Fund’s industry classifications refer to any one or more of the industry sub-classifications used by one or more widely recognized market indexes or ratings group indexes, and/or as defined by Fund management. This definition may not apply for purposes of the Pro Forma Portfolio of Investments, which may combine industry sub-classifications into sectors for reporting ease. |
| (1) | | All percentages shown in the Portfolio of Investments are based on the Acquiring Fund Pro Forma’s net assets. |
| (2) | | Non-income producing; issuer has not declared a dividend within the past twelve months. |
| (3) | | It is currently anticipated that the security, or a portion of the security, may be disposed following the Reorganization. Actual portfolio sales will depend on portfolio composition, market conditions and other factors at the time of the Reorganization. |
| (4) | | The Pro Forma Portfolio of Investments assumes the Target Fund will be required to distribute its tax basis undistributed net investment income of $1,097,341 and tax basis accumulated net realized gains of $5,231,394 to its shareholders prior to the Reorganization. The Acquiring Fund Pro Forma also assumes that such distributions were reinvested in Target Fund shares using estimated reinvestment rates of 86%, 97%, 100% and 67% for Class A, Class C, Class R6, and Class I, respectively, resulting in total cash distribution for the Target Fund of $1,333,151. |
See accompanying notes to pro forma financial statements
A-7
Pro Forma Statement of Assets and Liabilities
As of January 31, 2018 (Unaudited)
| | | | | | | | | | | | | | | | |
| | | Target
Fund | | | Acquiring
Fund | | | Pro Forma
Adjustments | | | Acquiring Fund
Pro Forma | |
Assets | | | | | | | | | | | | | | | | |
Long-term investments, at value ($104,396,080, $2,054,397,867, and $2,158,793,947, respectively) | | $ | 142,042,613 | | | $ | 3,258,451,851 | | | | | | | $ | 3,400,494,464 | |
Short-term investments, at value (cost approximates value) | | | — | | | | 72,717,171 | | | | | | | | 72,717,171 | |
Receivable for: | | | | | | | | | | | | | | | | |
Dividends | | | 84,030 | | | | 3,034,538 | | | | | | | | 3,118,568 | |
Interest | | | 15 | | | | 1,091 | | | | | | | | 1,106 | |
Investments sold | | | 2,087,404 | | | | 32,351,429 | | | | | | | | 34,438,833 | |
Reclaims | | | — | | | | 262,251 | | | | | | | | 262,251 | |
Shares sold | | | 106,249 | | | | 5,866,383 | | | | | | | | 5,972,632 | |
Other assets | | | 30,442 | | | | 256,939 | | | | | | | | 287,381 | |
Total assets | | | 144,350,753 | | | | 3,372,941,653 | | | | | | | | 3,517,292,406 | |
Liabilities | | | | | | | | | | | | | | | | |
Cash overdraft | | | 294,424 | | | | — | | | | | | | | 294,424 | |
Payable for: | | | | | | | | | | | | | | | | |
Investments purchased | | | 1,467,452 | | | | 28,281,653 | | | | | | | | 29,749,105 | |
Shares redeemed | | | 108,775 | | | | 4,509,062 | | | | | | | | 4,617,837 | |
Dividends | | | — | | | | — | | | | 1,333,151 | (a) | | | 1,333,151 | |
Accrued expenses: | | | | | | | | | | | | | | | | |
Custodian fees | | | 34,869 | | | | 182,368 | | | | | | | | 217,237 | |
Management fees | | | 62,888 | | | | 1,681,754 | | | | | | | | 1,744,642 | |
Professional fees | | | 12,446 | | | | 39,752 | | | | | | | | 52,198 | |
Shareholder reporting expenses | | | 32,889 | | | | 129,920 | | | | | | | | 162,809 | |
Shareholder servicing agent fees | | | 25,993 | | | | 475,427 | | | | | | | | 501,420 | |
Trustees fees | | | 1,229 | | | | 208,576 | | | | | | | | 209,805 | |
12b-1 distribution and service fees | | | 21,566 | | | | 570,808 | | | | | | | | 592,374 | |
Other | | | 2,817 | | | | 3,589 | | | | | | | | 6,406 | |
Total liabilities | | | 2,065,348 | | | | 36,082,909 | | | | 1,333,151 | | | | 39,481,408 | |
Net assets | | $ | 142,285,405 | | | $ | 3,336,858,744 | | | $ | (1,333,151 | ) | | $ | 3,477,810,998 | |
Class A Shares | | | | | | | | | | | | | | | | |
Net assets | | $ | 25,919,795 | | | $ | 498,445,325 | | | $ | (161,405 | )(a) | | | 524,203,715 | |
Shares outstanding | | | 772,852 | | | | 11,532,351 | | | | (176,890 | )(b) | | | 12,128,313 | |
Net asset value (“NAV”) per share | | $ | 33.54 | | | $ | 43.22 | | | | | | | $ | 43.22 | |
Offering price per share (NAV per share plus maximum sales charge of 5.75% of offering price) | | $ | 35.59 | | | $ | 45.86 | | | | | | | $ | 45.86 | |
Class C Shares | | | | | | | | | | | | | | | | |
Net assets | | $ | 19,172,167 | | | $ | 544,405,810 | | | $ | (25,583 | )(a) | | | 563,552,394 | |
Shares outstanding | | | 590,252 | | | | 12,619,950 | | | | (146,412 | )(b) | | | 13,063,790 | |
NAV and offering price per share | | $ | 32.48 | | | $ | 43.14 | | | | | | | $ | 43.14 | |
See accompanying notes to pro forma financial statements.
A-8
| | | | | | | | | | | | | | | | |
| | | Target
Fund | | | Acquiring
Fund | | | Pro Forma
Adjustments | | | Acquiring Fund
Pro Forma | |
Class R3 Shares | | | | | | | | | | | | | | | | |
Net assets | | | | | | $ | 24,681,421 | | | | | | | $ | 24,681,421 | |
Shares outstanding | | | | | | | 567,363 | | | | | | | | 567,363 | |
NAV and offering price per share | | | | | | $ | 43.50 | | | | | | | $ | 43.50 | |
Class R6 Shares | | | | | | | | | | | | | | | | |
Net assets | | $ | 19,106,967 | | | $ | 64,955,774 | | | $ | — | (a) | | | 84,062,741 | |
Shares outstanding | | | 568,170 | | | | 1,488,455 | | | | (130,335 | )(b) | | | 1,926,290 | |
NAV and offering price per share | | $ | 33.63 | | | $ | 43.64 | | | | | | | $ | 43.64 | |
Class I Shares | | | | | | | | | | | | | | | | |
Net assets | | $ | 78,086,476 | | | $ | 2,204,342,024 | | | $ | (1,146,163 | )(a) | | | 2,281,282,337 | |
Shares outstanding | | | 2,325,455 | | | | 50,962,330 | | | | (546,665 | )(b) | | | 52,741,120 | |
NAV and offering price per share | | $ | 33.58 | | | $ | 43.25 | | | | | | | $ | 43.25 | |
Class T Shares(c) | | | | | | | | | | | | | | | | |
Net assets | | | | | | $ | 28,390 | | | | | | | $ | 28,390 | |
Shares outstanding | | | | | | | 656 | | | | | | | | 656 | |
NAV per share | | | | | | $ | 43.26 | | | | | | | $ | 43.26 | |
Offering price per share (NAV per share plus maximum sales charge of 2.50% of offering price) | | | | | | $ | 44.37 | | | | | | | $ | 44.37 | |
| | | | |
Net assets consist of: | | | | | | | | | | | | | | | | |
Capital paid-in | | $ | 98,379,132 | | | $ | 2,069,927,026 | | | $ | 4,995,584 | (a) | | $ | 2,173,301,742 | |
Undistributed (Over-distribution of) net investment income | | | (45,418 | ) | | | 4,007,761 | | | | (1,097,341 | )(a) | | | 2,865,002 | |
Accumulated net realized gain (loss) | | | 6,305,158 | | | | 58,869,973 | | | | (5,231,394 | )(a) | | | 59,943,737 | |
Net unrealized appreciation (depreciation) | | | 37,646,533 | | | | 1,204,053,984 | | | | | | | | 1,241,700,517 | |
Net assets | | $ | 142,285,405 | | | $ | 3,336,858,744 | | | $ | (1,333,151 | ) | | $ | 3,477,810,998 | |
Authorized shares – per class | | | Unlimited | | | | Unlimited | | | | | | | | Unlimited | |
Par value per share | | $ | 0.01 | | | $ | 0.01 | | | | | | | $ | 0.01 | |
| (a) | Assumes the Target Fund will be required to distribute its tax basis undistributed net investment income of $1,097,341 and tax basis accumulated net realized gains of $5,231,394 to its shareholders prior to the Reorganization. The Acquiring Fund Pro Forma also assumes that such distributions were reinvested in Target Fund shares using estimated reinvestment rates of 86%, 97%, 100% and 67% for Class A, Class C, Class R6, and Class I, respectively, resulting in a total cash distribution for the Target Fund of $1,333,151. |
| (b) | Reflects the issuance by the Acquiring Fund of approximately 595,962 Class A shares, 443,840 Class C shares, 437,835 Class R6 shares, and 1,778,790 Class I shares to Class A, Class C, Class R6, and Class I shareholders, respectively, of the Target Fund in connection with the Reorganization. |
| (c) | Class T shares are not available for public offering. |
See accompanying notes to pro forma financial statements.
A-9
Pro Forma Statement of Operations
Year ended January 31, 2018 (Unaudited)
| | | | | | | | | | | | | | | | |
| | | Target
Fund | | | Acquiring
Fund | | | Pro Forma Adjustments | | | Acquiring Fund
Pro Forma | |
Investment Income (net of foreign tax withheld of $1,406, $113,380 and $114,786, respectively) | | $ | 2,341,183 | | | $ | 71,276,728 | | | | | | | $ | 73,617,911 | |
Expenses | | | | | | | | | | | | | | | | |
Management fees | | | 935,773 | | | | 17,902,039 | | | | (102,114 | )(a) | | | 18,735,698 | |
12b-1 service fees – Class A Shares | | | 63,700 | | | | 1,203,789 | | | | | | | | 1,267,489 | |
12b-1 distribution and service fees – Class C Shares | | | 187,168 | | | | 5,204,534 | | | | | | | | 5,391,702 | |
12b-1 distribution and service fees – Class R3 Shares | | | — | | | | 116,789 | | | | | | | | 116,789 | |
12b-1 distribution and service fees – Class T Shares(b) | | | — | | | | 44 | | | | | | | | 44 | |
Shareholder servicing agent fees | | | 127,671 | | | | 2,165,210 | | | | | | | | 2,292,881 | |
Custodian fees | | | 47,064 | | | | 233,391 | | | | (19,072 | )(c) | | | 261,383 | |
Trustees fees | | | 4,303 | | | | 91,706 | | | | | | | | 96,009 | |
Professional fees | | | 46,385 | | | | 131,742 | | | | (22,310 | )(c) | | | 155,817 | |
Shareholder reporting expenses | | | 52,326 | | | | 229,867 | | | | (70,886 | )(c) | | | 211,307 | |
Federal and state registration fees | | | 67,352 | | | | 137,412 | | | | (6,210 | )(c) | | | 198,554 | |
Other | | | 14,900 | | | | 45,607 | | | | (5,875 | )(c) | | | 54,632 | |
Total expenses before fee waiver/expense reimbursement | | | 1,546,642 | | | | 27,462,130 | | | | (226,467 | ) | | | 28,782,305 | |
Fee waiver/expense reimbursement | | | (259,731 | ) | | | — | | | | 259,731 | (d) | | | — | |
Net expenses | | | 1,286,911 | | | | 27,462,130 | | | | 33,264 | | | | 28,782,305 | |
Net investment income (loss) | | | 1,054,272 | | | | 43,814,598 | | | | (33,264 | ) | | | 44,835,606 | |
Realized and Unrealized Gain (Loss) | | | | | | | | | | | | | | | | |
Net realized gain (loss) from investments and foreign currency | | | 11,711,146 | | | | 139,720,158 | | | | | | | | 151,431,304 | |
Change in net unrealized appreciation (depreciation) of investments and foreign currency | | | 17,940,386 | | | | 488,680,039 | | | | | | | | 506,620,425 | |
Net realized and unrealized gain (loss) | | | 29,651,532 | | | | 628,400,197 | | | | | | | | 658,051,729 | |
Net increase (decrease) in net assets from operations | | $ | 30,705,804 | | | $ | 672,214,795 | | | $ | (33,264 | ) | | $ | 702,887,335 | |
| (a) | Reflects the impact of applying the Acquiring Fund’s fund-level fee schedule to the Acquiring Fund Pro Forma’s average net assets. |
| (b) | Class T shares are not available for public offering. |
| (c) | Reflects the anticipated reduction of certain duplicative expenses eliminated as a result of the Reorganization. |
| (d) | Reflects the reduction in expense reimbursement payments the Adviser would have made to the Acquiring Fund Pro Forma if the Reorganization had occurred on the first day of the 12-month period ended January 31, 2018. |
See accompanying notes to pro forma financial statements.
A-10
Notes to Pro Forma Financial Statements (Unaudited)
1. Basis of Combination
The accompanying unaudited pro forma financial statements are presented to show the effect of the proposed reorganization of the Nuveen Symphony Low Volatility Equity Fund (the “Target Fund”) into the Nuveen Santa Barbara Dividend Growth Fund (the “Acquiring Fund”) (the “Reorganization”). The Acquiring Fund and the Target Fund are series of open-end management investment companies registered under the Investment Company Act of 1940, as amended. The unaudited pro forma financial information is for informational purposes only and does not purport to be indicative of the financial condition that actually would have resulted if the Reorganization had been consummated. These pro forma numbers have been estimated in good faith based on information regarding the Acquiring Fund and the Target Fund as of January 31, 2018.
Under the terms of the Reorganization, the combination of the Acquiring Fund and the Target Fund (the “Acquiring Fund Pro Forma” or the “Fund”) will be accounted for as a tax-free reorganization for federal income tax purposes; therefore, no gain or loss will be recognized by the Acquiring Fund or its shareholders as a result of the Reorganization. For financial reporting purposes, the historical cost basis of investment securities will be carried forward to the surviving fund to align ongoing reporting of the realized and unrealized gains and losses of the surviving fund. The Reorganization will be accomplished by an acquisition of all the assets and the assumption of all the liabilities of the Target Fund by the Acquiring Fund in exchange for shares of the Acquiring Fund and the distribution of such shares to the Target Fund’s shareholders in complete liquidation of the Target Fund. The Pro Forma Portfolio of Investments and the Pro Forma Statement of Assets and Liabilities are presented for the Target Fund, the Acquiring Fund and the Acquiring Fund Pro Forma as of January 31, 2018. The Pro Forma Statement of Operations is presented for the Target Fund, the Acquiring Fund and the Acquiring Fund Pro Forma for the period from February 1, 2017 through January 31, 2018 (the “Reporting Period”).
Following the Reorganization, the Acquiring Fund will be the surviving fund. The surviving fund will have the portfolio management team, portfolio composition, strategies and investment objectives, policies and restrictions of the Acquiring Fund. No significant accounting policies will change as a result of the Reorganization, specifically policies regarding security valuation or compliance with Subchapter M of the Internal Revenue Code of 1986, as amended. No significant changes to any existing contracts of the Acquiring Fund are expected as a result of the Reorganization.
If the Reorganization had occurred as of January 31, 2018, the Target Fund would have been required to dispose of some of its securities in order to comply with the Acquiring Fund’s investment policies and restrictions. It is estimated that the Target Fund would have been required to dispose of approximately 18% of its portfolio as of January 31, 2018 to comply with the Acquiring Fund’s investment policies and restrictions. It is also estimated that such portfolio repositioning would have resulted in realized gains of approximately $7.0 million (approximately $1.65 per share) and brokerage commission or other transaction costs of approximately $10,100, based on average commission rates normally paid by the Target Fund, if such sales occurred on January 31, 2018.
Additionally, if the Reorganization had occurred as of January 31, 2018, additional securities held by the Target Fund would have been disposed of due to the different investment styles used in managing the investment portfolios of the Acquiring Fund and the Target Fund. As a result of these sales, together with the required sales described in the paragraph immediately above, it is estimated that approximately 78% of the Target Fund’s portfolio as of January 31, 2018 would have been sold if the Reorganization had occurred on that date. It is also estimated that such portfolio repositioning would have resulted in realized gains of approximately $29.7 million (approximately $6.98 per share) and brokerage commission or other transaction costs of approximately $49,300 for the Target Fund, based on average commission rates normally paid by the Target Fund, if such sales occurred on January 31, 2018.
The total costs of the Reorganization are estimated to be $230,000. Nuveen will pay all expenses associated with the Reorganization.
A-11
The accompanying pro forma financial statements and notes to the pro forma financial statements should be read in conjunction with the September 30, 2017 annual report of the Target Fund and the July 31, 2017 annual report and the January 31, 2018 semi-annual report of the Acquiring Fund.
2. General Information and Significant Accounting Policies
General Information
Trust and Fund Information
The Fund is a series of the Nuveen Investment Trust II (the “Trust”), an open-end management investment company registered under the Investment Company Act of 1940, as amended. The Trust was organized as a Massachusetts business trust on June 27, 1997.
Investment Adviser
The Fund’s investment adviser is Nuveen Fund Advisors, LLC (the “Adviser”), a subsidiary of Nuveen, LLC (“Nuveen”). Nuveen is the investment management arm of Teachers Insurance and Annuity Association of America (“TIAA”). The Adviser has overall responsibility for management of the Fund, oversees the management of the Fund’s portfolio, manages the Fund’s business affairs and provides certain clerical, bookkeeping and other administrative services, and, if necessary, asset allocation decisions. The Adviser has entered into a sub-advisory agreement with Santa Barbara Asset Management, LLC (the “Sub-Adviser”), an affiliate of Nuveen, under which the Sub-Adviser manages the investment portfolio of the Fund.
Investment Objectives
The investment objective of the Fund is to seek an attractive total return comprised of income from dividends and long-term capital appreciation.
The Acquiring Fund’s most recent prospectus provides further description of the investment objective, principal investment strategies and principal risks.
Significant Accounting Policies
The Fund is an investment company and follows accounting and reporting guidance under Financial Accounting Standards Board (FASB) Accounting Standards Codification (ASC) Topic 946 “Financial Services – Investment Companies.” The following is a summary of significant accounting policies followed by the Fund in the preparation of its financial statements in accordance accounting principles generally accepted in the United States of America (“U.S. GAAP”).
Investment Transactions
Investment transactions are recorded on a trade date basis. Realized gains and losses from investment transactions are determined on the specific identification method, which is the same basis used for federal income tax purposes. Investments purchased on a when-issued/delayed delivery basis may have extended settlement periods. Any investments so purchased are subject to market fluctuation during this period. The Fund has earmarked securities in its portfolio with a current value at least equal to the amount of the when-issued/delayed delivery purchase commitments.
As of the end of the reporting period, the Fund did not have any outstanding when-issued/delayed delivery purchase commitments.
A-12
Investment Income
Dividend income is recorded on the ex-dividend date or, for foreign securities, when information is available. Non-cash dividends received in the form of stock, if any, are recognized on the ex-dividend date and recorded at fair value. Interest income, which reflects the amortization of premiums and accretion of discounts for financial reporting purposes, is recorded on an accrual basis. Interest income also reflects paydown gains and losses, if any.
Professional Fees
Professional fees presented on the Pro Forma Statement of Operations consist of legal fees incurred in the normal course of operations, audit fees, tax consulting fees and, in some cases, workout expenditures.
Dividends and Distributions to Shareholders
Dividends from net investment income, if any, are declared and distributed to shareholders quarterly. Net realized capital gains from investment transactions, if any, are declared and distributed to shareholders at least annually. Furthermore, capital gains are distributed only to the extent they exceed available capital loss carryforwards.
Distributions to shareholders are recorded on the ex-dividend date. The amount and timing of distributions are determined in accordance with federal income tax regulations, which may differ from U.S. GAAP.
Share Classes and Sales Charges
Class A Shares are generally sold with an up-front sales charge and incur a 0.25% annual 12b-1 service fee. Class A Share purchases of $1 million or more are sold at net asset value (“NAV”) without an up-front sales charge but may be subject to a contingent deferred sales charge (“CDSC”) of 1% if redeemed within eighteen months of purchase. Class C Shares are sold without an up-front sales charge but incur a 0.75% annual 12b-1 distribution fee and a 0.25% annual 12b-1 service fee. Class C Shares are subject to a CDSC of 1% if redeemed within twelve months of purchase. Class R3 Shares are sold without an up-front sales charge but incur a 0.25% annual 12b-1 distribution fee and a 0.25% annual 12b-1 service fee. Class R6 Shares and Class I Shares are not subject to any sales charge or 12b-1 distribution or service fees. Class T Shares are generally sold with an up-front sales charge and incur a 0.25% annual 12b-1 service fee.
Multiclass Operations and Allocations
Income and expenses of the Fund that are not directly attributable to a specific class of shares are prorated among the classes based on the relative net assets of each class. Expenses directly attributable to a class of shares are recorded to the specific class. Currently, the only expenses that are allocated on a class-specific basis are 12b-1 distribution and service fees.
Sub-transfer agent fees, which are recognized as a component of “Shareholder servicing agent fees” on the Pro Forma Statement of Operations, are not charged to Class R6 Shares and are prorated among the other classes based on their relative net assets.
Realized and unrealized capital gains and losses of the Fund are prorated among the classes based on the relative net assets of each class.
Indemnifications
Under the Trust’s organizational documents, its officers and trustees are indemnified against certain liabilities arising out of the performance of their duties to the Trust. In addition, in the normal course of business, the Trust enters into contracts that provide general indemnifications to other parties. The Trust’s maximum exposure under these arrangements is unknown as this would involve future claims that may be made against the Trust that have not yet occurred. However, the Trust has not had prior claims or losses pursuant to these contracts and expects the risk of loss to be remote.
A-13
Compensation
The Trust pays no compensation directly to those of its trustees who are affiliated with the Adviser or to its officers, all of whom receive remuneration for their services to the Trust from the Adviser or its affiliates. The The Fund’s Board of Trustees (the “Board”) has adopted a deferred compensation plan for independent trustees that enables trustees to elect to defer receipt of all or a portion of the annual compensation they are entitled to receive from certain Nuveen-advised funds. Under the plan, deferred amounts are treated as though equal dollar amounts had been invested in shares of select Nuveen-advised funds.
Netting Agreements
In the ordinary course of business, the Fund may enter into transactions subject to enforceable master repurchase agreements, International Swaps and Derivative Association, Inc. (“ISDA”) master agreements or other similar arrangements (“netting agreements”). Generally, the right to offset in netting agreements allows the Fund to offset certain securities and derivatives with a specific counterparty, when applicable, as well as any collateral received or delivered to that counterparty based on the terms of the agreements. Generally, the Fund manages its cash collateral and securities collateral on a counterparty basis.
The Fund’s investments subject to netting agreements as of the end of the reporting period, if any, are further described in Note 4 –Portfolio Securities and Investments in Derivatives.
Use of Estimates
The preparation of financial statements in conformity with U.S. GAAP requires management to make estimates and assumptions that affect the reported amounts of assets and liabilities at the date of the pro forma financial statements and the reported amounts of increases and decreases in net assets from operations during the current fiscal period. Actual results may differ from those estimates.
3. Investment Valuation and Fair Value Measurements
The fair valuation input levels as described below are for fair value measurement purposes.
Fair value is defined as the price that would be received upon selling an investment or transferring a liability in an orderly transaction to an independent buyer in the principal or most advantageous market for the investment. A three-tier hierarchy is used to maximize the use of observable market data and minimize the use of unobservable inputs and to establish classification of fair value measurements for disclosure purposes. Observable inputs reflect the assumptions market participants would use in pricing the asset or liability. Observable inputs are based on market data obtained from sources independent of the reporting entity. Unobservable inputs reflect the reporting entity’s own assumptions about the assumptions market participants would use in pricing the asset or liability. Unobservable inputs are based on the best information available in the circumstances. The following is a summary of the three-tiered hierarchy of valuation input levels.
| | |
| Level 1 – | | Inputs are unadjusted and prices are determined using quoted prices in active markets for identical securities. |
| |
| Level 2 – | | Prices are determined using other significant observable inputs (including quoted prices for similar securities, interest rates, prepayment speeds, credit risk, etc.). |
| |
| Level 3 – | | Prices are determined using significant unobservable inputs (including management’s assumptions in determining the fair value of investments). |
Common stocks and other equity-type securities are valued at the last sales price on the securities exchange on which such securities are primarily traded and are generally classified as Level 1. Securities primarily traded on
A-14
the NASDAQ National Market (“NASDAQ”) are valued at the NASDAQ Official Closing Price and are generally classified as Level 1. However, securities traded on a securities exchange or NASDAQ for which there were no transactions on a given day or securities not listed on a securities exchange or NASDAQ are valued at the quoted bid price and are generally classified as Level 2.
Repurchase agreements are valued at contract amount plus accrued interest, which approximates market value. These securities are generally classified as Level 2.
Certain securities may not be able to be priced by the pre-established pricing methods as described above. Such securities may be valued by the Board and/or its appointee at fair value. These securities generally include, but are not limited to, restricted securities (securities which may not be publicly sold without registration under the Securities Act of 1933, as amended) for which a pricing service is unable to provide a market price; securities whose trading has been formally suspended; debt securities that have gone into default and for which there is no current market quotation; a security whose market price is not available from a pre-established pricing source; a security with respect to which an event has occurred that is likely to materially affect the value of the security after the market has closed but before the calculation of the Fund’s NAV (as may be the case in non-U.S. markets on which the security is primarily traded) or make it difficult or impossible to obtain a reliable market quotation; and a security whose price, as provided by the pricing service, is not deemed to reflect the security’s fair value. As a general principle, the fair value of a security would appear to be the amount that the owner might reasonably expect to receive for it in a current sale. A variety of factors may be considered in determining the fair value of such securities, which may include consideration of the following: yields or prices of investments of comparable quality, type of issue, coupon, maturity and rating, market quotes or indications of value from security dealers, evaluations of anticipated cash flows or collateral, general market conditions and other information and analysis, including the obligor’s credit characteristics considered relevant. These securities are generally classified as Level 2 or Level 3 depending on the observability of the significant inputs. Regardless of the method employed to value a particular security, all valuations are subject to review by the Board and/or its appointee.
The inputs or methodologies used for valuing securities are not an indication of the risks associated with investing in those securities. The following is a summary of the Fund’s fair value measurements as of the end of the reporting period:
| | | | | | | | | | | | | | | | |
| | �� | Level 1 | | | Level 2 | | | Level 3 | | | Total | |
Long-Term Investments*: | | | | | | | | | | | | | | | | |
Common Stocks | | $ | 3,400,494,464 | | | $ | — | | | $ | — | | | $ | 3,400,494,464 | |
Short-Term Investments: | | | | | | | | | | | | | | | | |
Repurchase Agreements | | | — | | | | 72,717,171 | | | | — | | | | 72,717,171 | |
Total | | $ | 3,400,494,464 | | | $ | 72,717,171 | | | $ | — | | | $ | 3,473,211,635 | |
| * | Refer to the Fund’s Pro Forma Portfolio of Investments for industry classifications. |
The Board is responsible for the valuation process and has appointed the oversight of the daily valuation process to the Adviser’s Valuation Committee. The Valuation Committee, pursuant to the valuation policies and procedures adopted by the Board, is responsible for making fair value determinations, evaluating the effectiveness of the Fund’s pricing policies and reporting to the Board. The Valuation Committee is aided in its efforts by the Adviser’s dedicated Securities Valuation Team, which is responsible for administering the daily valuation process and applying fair value methodologies as approved by the Valuation Committee. When determining the reliability of independent pricing services for investments owned by the Fund, the Valuation Committee, among other things, conducts due diligence reviews of the pricing services and monitors the quality of security prices received through various testing reports conducted by the Securities Valuation Team.
A-15
The Valuation Committee will consider pricing methodologies it deems relevant and appropriate when making a fair value determination, based on the facts and circumstances specific to the portfolio instrument. Fair value determinations generally will be derived as follows, using public or private market information:
| | (i) | If available, fair value determinations shall be derived by extrapolating from recent transactions or quoted prices for identical or comparable securities. |
| | (ii) | If such information is not available, an analytical valuation methodology may be used based on other available information including, but not limited to: analyst appraisals, research reports, corporate action information, issuer financial statements and shelf registration statements. Such analytical valuation methodologies may include, but are not limited to: multiple of earnings, discount from market value of a similar freely-traded security, discounted cash flow analysis, book value or a multiple thereof, risk premium/yield analysis, yield to maturity and/or fundamental investment analysis. |
The purchase price of a portfolio instrument will be used to fair value the instrument only if no other valuation methodology is available or deemed appropriate, and it is determined that the purchase price fairly reflects the instrument’s current value.
For each portfolio security that has been fair valued pursuant to the policies adopted by the Board, the fair value price is compared against the last available and next available market quotations. The Valuation Committee reviews the results of such testing and fair valuation occurrences are reported to the Board.
4. Portfolio Securities and Investments in Derivatives
Portfolio Securities
Repurchase Agreements
In connection with transactions in repurchase agreements, it is the Fund’s policy that its custodian take possession of the underlying collateral securities, the fair value of which exceeds the principal amount of the repurchase transaction, including accrued interest, at all times. If the counterparty defaults, and the fair value of the collateral declines, realization of the collateral may be delayed or limited.
The following table presents the repurchase agreements for the Funds that are subject to netting agreements as of the end of the reporting period, and the collateral delivered related to those repurchase agreements.
| | | | | | | | | | |
| Counterparty | | Short-Term
Investments, at Value | | | Collateral Pledged (From)
Counterparty* | | | Net
Exposure |
Fixed Income Clearing Corporation | | $ | 72,717,171 | | | $ | (72,717,171 | ) | | $ — |
| * | As of the end of the Reporting Period, the value of the collateral pledged from the counterparty exceeded the value of the repurchase agreement. Refer to the Pro Forma Portfolio of Investments for details on the repurchase agreements. |
Investments in Derivatives
The Fund is authorized to invest in certain derivative instruments. The Fund records derivative instruments at fair value, with changes in fair value recognized on the Pro Forma Statement of Operations, when applicable. Even though the Fund’s investments in derivatives may represent economic hedges, they are not considered to be hedge transactions for financial reporting purposes.
Although the Fund is authorized to invest in derivative instruments, and may do so in the future, it did not make any such investments during the Reporting Period.
A-16
Market and Counterparty Credit Risk
In the normal course of business the Fund may invest in financial instruments and enter into financial transactions where risk of potential loss exists due to changes in the market (market risk) or failure of the other party to the transaction to perform (counterparty credit risk). The potential loss could exceed the value of the financial assets recorded on the financial statements. Financial assets, which potentially expose the Fund to counterparty credit risk, consist principally of cash due from counterparties on forward, option and swap transactions, when applicable. The extent of the Fund’s exposure to counterparty credit risk in respect to these financial assets approximates their carrying value as recorded on the Pro Forma Statement of Assets and Liabilities.
The Fund helps manage counterparty credit risk by entering into agreements only with counterparties the Adviser believes have the financial resources to honor their obligations and by having the Adviser monitor the financial stability of the counterparties. Additionally, counterparties may be required to pledge collateral daily (based on the daily valuation of the financial asset) on behalf of the Fund with a value approximately equal to the amount of any unrealized gain above a pre-determined threshold. Reciprocally, when the Fund has an unrealized loss, the Fund has instructed the custodian to pledge assets of the Fund as collateral with a value approximately equal to the amount of the unrealized loss above a pre-determined threshold. Collateral pledges are monitored and subsequently adjusted if and when the valuations fluctuate, either up or down, by at least the pre-determined threshold amount.
5. Income Tax Information
The Fund intends to distribute substantially all of its net investment income and net capital gains to shareholders and to otherwise comply with the requirements of Subchapter M of the Internal Revenue Code applicable to regulated investment companies. Therefore, no federal income tax provision is required.
For all open tax years and all major taxing jurisdictions, management of the Fund has concluded that there are no significant uncertain tax positions that would require recognition in the financial statements. Open tax years are those that are open for examination by taxing authorities (i.e., generally the last four tax year ends and the interim tax period since then). Furthermore, management of the Fund is also not aware of any tax positions for which it is reasonably possible that the total amounts of unrecognized tax benefits will significantly change in the next twelve months.
As of January 31, 2018, the Fund had no unused capital loss carryforwards available for federal income tax purposes to be applied against future capital gains, if any.
6. Management Fees and Other Transactions with Affiliates
Management Fees
The Fund’s management fee compensates the Adviser for overall investment advisory and administrative services and general office facilities. The Sub-Adviser is compensated for its services to the Fund from the management fees paid to the Adviser.
The Fund’s management fee consists of two components – a fund-level fee, based only on the amount of assets within the Fund, and a complex-level fee, based on the aggregate amount of all eligible fund assets managed by the Adviser. This pricing structure enables the Fund’s shareholders to benefit from growth in the assets within the Fund as well as from growth in the amount of complex-wide assets managed by the Adviser.
A-17
The annual Fund-level fee, payable monthly, for the Fund is calculated according to the following schedule:
| | | | |
| Average Daily Net Assets | | | |
For the first $125 million | | | 0.5000 | % |
For the next $125 million | | | 0.4875 | |
For the next $250 million | | | 0.4750 | |
For the next $500 million | | | 0.4625 | |
For the next $1 billion | | | 0.4500 | |
For the next $3 billion | | | 0.4250 | |
For the next $2.5 billion | | | 0.4000 | |
For the next $2.5 billion | | | 0.3875 | |
For net assets over $10 billion | | | 0.3750 | |
The annual complex-level fee, payable monthly, is calculated according to the following schedule:
| | | | |
| Complex-Level Eligible Asset Breakpoint Level* | | Effective Rate at Breakpoint Level | |
$55 billion | | | 0.2000 | % |
$56 billion | | | 0.1996 | |
$57 billion | | | 0.1989 | |
$60 billion | | | 0.1961 | |
$63 billion | | | 0.1931 | |
$66 billion | | | 0.1900 | |
$71 billion | | | 0.1851 | |
$76 billion | | | 0.1806 | |
$80 billion | | | 0.1773 | |
$91 billion | | | 0.1691 | |
$125 billion | | | 0.1599 | |
$200 billion | | | 0.1505 | |
$250 billion | | | 0.1469 | |
$300 billion | | | 0.1445 | |
| * | The complex-level fee is calculated based upon the aggregate daily “eligible assets” of all Nuveen funds. Eligible assets do not include assets attributable to investments in other Nuveen funds or assets in excess of a determined amount (originally $2 billion) added to the Nuveen fund complex in connection with the Adviser’s assumption of the management of the former First American Funds effective January 1, 2011. Eligible assets include closed-end fund assets managed by the Adviser that are attributable to certain types of leverage. For these purposes, leverage includes the closed-end funds’ use of preferred stock and borrowings and certain investments in the residual interest certificates (also called inverse floating rate securities) in tender option bond (TOB) trusts, including the portion of assets held by a TOB trust that has been effectively financed by the trust’s issuance of floating rate securities, subject to an agreement by the Adviser as to certain funds to limit the amount of such assets for determining eligible assets in certain circumstances. |
The Adviser has agreed to waive fees and/or reimburse expenses (“Expense Cap”) of the Fund so that total annual Fund operating expenses (excluding 12b-1 distribution and/or service fees, interest expenses, taxes, acquired fund fees and expenses, fees incurred in acquiring and disposing of portfolio securities and extraordinary expenses) do not exceed 1.25% of the average daily net assets of any class of Fund shares. However, because Class R6 shares are not subject to sub-transfer agent and similar fees, the total annual fund operating expenses of the Class R6 shares will be less than the expense limitation. This expense limitation may be terminated or modified only with the approval of shareholders of the Fund.
A-18
7. Borrowing Arrangements
Committed Line of Credit
The Fund, along with certain other funds managed by the Adviser (“Participating Funds”), have established a 364-day, approximately $3 billion standby credit facility with a group of lenders, under which the Participating Funds may borrow for various purposes other than leveraging for investment purposes. A large portion of this facility’s capacity (and its associated costs as described below) is currently dedicated for use by a small number of Participating Funds, which does not include the Fund. The remaining capacity under the facility (and the corresponding portion of the facility’s annual costs) is separately dedicated to most of the other open-end funds in the Nuveen fund family, including the Fund, along with a number of Nuveen closed-end funds. The credit facility expires in July 2018 unless extended or renewed.
The credit facility has the following terms: a fee of 0.15% per annum on unused commitment amounts, and interest at a rate equal to the higher of (a) one-month LIBOR (London Inter-Bank Offered Rate) plus 1.25% per annum or (b) the Fed Funds rate plus 1.25% per annum on amounts borrowed. Participating Funds paid administration, legal and arrangement fees, which are recognized as a component of “Other expenses” on the Pro Forma Statement of Operations, and along with commitment fees, have been allocated among such Participating Funds based upon the relative proportions of the facility’s aggregate capacity reserved for them and other factors deemed relevant by the Adviser and the Board of each Participating Fund.
During the Reporting Period, the Fund did not utilize this facility.
8. Subsequent Events
Effective July 2018, Class C Shares will automatically convert to Class A Shares after 10 years. Conversions will occur during the month in which the 10-year anniversary of the purchase occurs. Class C Shares that have been held for longer than 10 years as of July 1, 2018 will also convert to Class A Shares in July 2018. The automatic conversion will be based on the relative net asset values of the two share classes without the imposition of a sales charge or fee. The automatic conversion of Class C Shares to Class A Shares will not apply to shares held through group retirement plan recordkeeping platforms of certain financial intermediaries who hold such shares in an omnibus account and do not track participant level share lot aging to facilitate such a conversion.
A-19
| | |
| | |  |
| Mutual Funds | |
Prospectus
| | | | | | | | | | | | | | | | | | |
| | | | | | | Class / Ticker Symbol |
| | | Fund Name | | | | Class A | | Class C | | Class R3 | | Class R6 | | Class I | | Class T | | |
|
| | Nuveen Santa Barbara Dividend Growth Fund | | | | NSBAX | | NSBCX | | NBDRX | | NSBFX | | NSBRX | | NSBUX | | |
| | Nuveen Santa Barbara Global Dividend Growth Fund | | | | NUGAX | | NUGCX | | NUGRX | | — | | NUGIX | | NUGTX | | |
| | Nuveen Santa Barbara International Dividend Growth Fund | | | | NUIAX | | NUICX | | NUIRX | | — | | NUIIX | | NUITX | | |
The Securities and Exchange Commission has not approved or disapproved these securities or passed upon the adequacy of this prospectus. Any representation to the contrary is a criminal offense.
Table of Contents
NOT FDIC OR GOVERNMENT INSURED MAY LOSE VALUE NO BANK GUARANTEE
Section 1 Fund Summaries
Nuveen Santa Barbara Dividend Growth Fund
Investment Objective
The investment objective of the Fund is to seek an attractive total return comprised of income from dividends and long-term capital appreciation.
Fees and Expenses of the Fund
This table describes the fees and expenses that you may pay if you buy and hold shares of the Fund. You may qualify for sales charge discounts if you and your family invest, or agree to invest in the future, at least $50,000 in the Fund or in other Nuveen Mutual Funds. More information about these and other discounts, as well as eligibility requirements for each share class, is available from your financial advisor and in “What Share Classes We Offer” on page 27 of the Fund’s prospectus, “How to Reduce Your Sales Charge” on page 31 of the prospectus, in the appendix to this prospectus titled “Variations in Sales Charge Reductions and Waivers Available Through Certain Intermediaries,” and “Purchase and Redemption of Fund Shares” on page S-63 of the Fund’s statement of additional information.
Shareholder Fees
(fees paid directly from your investment)
| | | | | | | | | | | | | | | | | | | | | | | | |
| | | Class A | | | Class C | | | Class R3 | | | Class R6 | | | Class I | | | Class T | |
Maximum Sales Charge (Load) Imposed on Purchases
(as a percentage of offering price) | | | 5.75% | | | | None | | | | None | | | | None | | | | None | | | | 2.50% | |
Maximum Deferred Sales Charge (Load)
(as a percentage of the lesser of purchase price or redemption proceeds)1 | | | None | | | | 1.00% | | | | None | | | | None | | | | None | | | | None | |
| Maximum Sales Charge (Load) Imposed on Reinvested Dividends | | | None | | | | None | | | | None | | | | None | | | | None | | | | None | |
| Exchange Fee | | | None | | | | None | | | | None | | | | None | | | | None | | | | None | |
| Annual Low Balance Account Fee (for accounts under $1,000)2 | | | $15 | | | | $15 | | | | None | | | | None | | | | $15 | | | | $15 | |
| | | | | | |
| Annual Fund Operating Expenses | | | | | | | | | | | | | | | | | | |
(expenses that you pay each year as a percentage of the value of your
investment) | | | | | | | | | | | | | | | | | | |
| | | Class A | | | Class C | | | Class R3 | | | Class R6 | | | Class I | | | Class T | |
| Management Fees | | | 0.61% | | | | 0.61% | | | | 0.61% | | | | 0.61% | | | | 0.61% | | | | 0.61% | |
| Distribution and/or Service (12b-1) Fees | | | 0.25% | | | | 1.00% | | | | 0.50% | | | | 0.00% | | | | 0.00% | | | | 0.25% | |
| Other Expenses | | | 0.11% | | | | 0.11% | | | | 0.11% | | | | 0.04% | | | | 0.11% | | | | 0.11% | |
| Total Annual Fund Operating Expenses | | | 0.97% | | | | 1.72% | | | | 1.22% | | | | 0.65% | | | | 0.72% | | | | 0.97% | |
| 1 | The contingent deferred sales charge on Class C shares applies only to redemptions within 12 months of purchase. |
| 2 | Fee applies to the following types of accounts under $1,000 held directly with the Fund: individual retirement accounts (IRAs), Coverdell Education Savings Accounts and accounts established pursuant to the Uniform Transfers to Minors Act (UTMA) or Uniform Gifts to Minors Act (UGMA). |
Example
The following example is intended to help you compare the cost of investing in the Fund with the cost of investing in other mutual funds. The example assumes that you invest $10,000 in the Fund for the time periods indicated and then either redeem or do not redeem your shares at the end of a period. The example also assumes that your investment has a 5% return each year and that the Fund’s operating expenses remain the same. Although your actual costs may be higher or lower, based on these assumptions your costs would be:
| | | | | | | | | | | | | | | | | | | | | | | | |
| | | Class A | | | Class C | | | Class R3 | | | Class R6 | | | Class I | | | Class T | |
| 1 Year | | $ | 668 | | | $ | 175 | | | $ | 124 | | | $ | 66 | | | $ | 74 | | | $ | 346 | |
| 3 Years | | $ | 866 | | | $ | 542 | | | $ | 387 | | | $ | 208 | | | $ | 230 | | | $ | 551 | |
| 5 Years | | $ | 1,080 | | | $ | 933 | | | $ | 670 | | | $ | 362 | | | $ | 401 | | | $ | 773 | |
| 10 Years | | $ | 1,696 | | | $ | 2,030 | | | $ | 1,477 | | | $ | 810 | | | $ | 894 | | | $ | 1,410 | |
2
Section 1 Fund Summaries
Portfolio Turnover
The Fund pays transaction costs, such as commissions, when it buys and sells securities (or “turns over” its portfolio). A higher portfolio turnover rate may indicate higher transaction costs and may result in higher taxes when Fund shares are held in a taxable account. These costs, which are not reflected in annual fund operating expenses or in the example, affect the Fund’s performance. During the most recent fiscal year, the Fund’s portfolio turnover rate was 22% of the average value of its portfolio.
Principal Investment Strategies
Under normal market conditions, the Fund invests at least 80% of its net assets in dividend-paying common stocks and preferred securities. Companies in certain economic sectors of the market have historically provided higher dividend yields than companies in other sectors and industries. As a result, given the Fund’s focus on dividend-paying securities, the Fund may, from time to time, have a greater exposure to these higher dividend-yield sectors and industries than the broad equity market.
The Fund may invest in small-, mid- and large-cap companies. The Fund may invest up to 25% of its net assets in non-U.S. equity securities that are U.S. dollar-denominated.
Principal Risks
The value of your investment in this Fund will change daily. You could lose money by investing in the Fund. An investment in the Fund is not a deposit of a bank and is not insured or guaranteed by the Federal Deposit Insurance Corporation or any other government agency. The principal risks of investing in the Fund, listed alphabetically, include:
Active Management Risk—The Fund’s sub-adviser actively manages the Fund’s investments. Consequently, the Fund is subject to the risk that the investment techniques and risk analyses employed by the Fund’s sub-adviser may not produce the desired results. This could cause the Fund to lose value or its investment results to lag relevant benchmarks or other funds with similar objectives.
Currency Risk—Even though the non-U.S. securities held by the Fund are traded in U.S. dollars, their prices are typically indirectly influenced by currency fluctuations. Changes in currency exchange rates may affect the Fund’s net asset value, the value of dividends and interest earned, and gains or losses realized on the sale of securities.
Cybersecurity Risk—Cybersecurity risk is the risk of an unauthorized breach and access to Fund assets, customer data (including private shareholder information), or proprietary information, or the risk of an incident occurring that causes the Fund, its investment adviser or sub-adviser, custodian, transfer agent, distributor or other service provider or a financial intermediary to suffer a data breach, data corruption or lose operational functionality. Successful cyber-attacks or other cyber-failures or events affecting the Fund or its service providers may adversely impact the Fund or its shareholders. Additionally, a cybersecurity breach could affect the issuers in which the Fund invests, which may cause the Fund’s investments to lose value.
Dividend-Paying Security Risk—The Fund’s investment in dividend-paying stocks could cause the Fund to underperform similar funds that invest without consideration of a company’s track record of paying dividends. Stocks of companies with a history of paying dividends may not participate in a broad market advance to the same degree as most other stocks, and a sharp rise in interest rates or economic downturn could cause a company to unexpectedly reduce or eliminate its dividend.
Equity Security Risk—Equity securities in the Fund’s portfolio, including common stocks and preferred securities, may decline significantly in price over short or extended periods of time, and such declines may occur because of declines in the equity market as a whole, or because of declines in only a particular country, company, industry, or sector of the market. Holders of common stock generally are subject to more risks than holders of preferred securities because the status of common stockholders upon the bankruptcy of the issuer is subordinated to that of preferred security holders. Given the Fund’s focus on dividend-paying securities, the Fund may, from time to time, have a greater exposure to higher dividend-yield sectors and industries than the broad equity market which would make the Fund more vulnerable to adverse developments affecting such sectors or industries.
Growth Stock Risk—Growth stocks tend to be more volatile than certain other types of stocks and their prices usually fluctuate more dramatically than the overall stock market. A stock with growth characteristics can have sharp price declines due to decreases in current earnings or the failure to meet expected earnings and may lack dividends that can help cushion its share price in a declining market.
Non-U.S. Investment Risk—Non-U.S. issuers or U.S. issuers with significant non-U.S. operations may be subject to risks in addition to those of issuers located in or that principally operate in the United States as a result of, among
Section 1 Fund Summaries
3
other things, political, social and economic developments abroad and different legal, regulatory and tax environments.
Preferred Security Risk—Preferred securities generally are subordinated to bonds and other debt instruments in a company’s capital structure and therefore will be subject to greater credit risk than those debt instruments. In addition, preferred securities are subject to other risks, such as having no or limited voting rights, being subject to special redemption rights, having distributions deferred or skipped, having floating interest rates or dividends, which may result in a decline in value in a falling interest rate environment, having limited liquidity, changing or unfavorable tax treatments and possibly being issued by companies in heavily regulated industries.
Smaller Company Risk—Small-cap stocks involve substantial risk. Prices of small-cap stocks may be subject to more abrupt or erratic movements, and to wider fluctuations, than stock prices of larger, more established companies or the market averages in general. It may be difficult to sell small-cap stocks at the desired time and price. While mid-cap stocks may be slightly less volatile than small-cap stocks, they still involve similar risks.
Fund Performance
The following bar chart and table provide some indication of the potential risks of investing in the Fund. The Fund’s past performance (before and after taxes) is not necessarily an indication of how the Fund will perform in the future. Updated performance information is available at www.nuveen.com/performance or by calling (800) 257-8787.
The bar chart below shows the variability of the Fund’s performance from year to year for Class A shares. The bar chart and highest/lowest quarterly returns that follow do not reflect sales charges, and if these charges were reflected, the returns would be less than those shown.
Class A Annual Total Return*
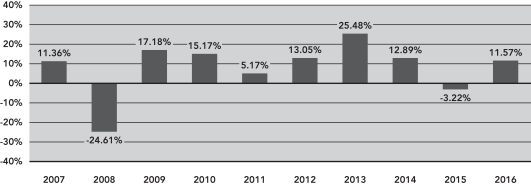
| | * | Class A year-to-date total return as of September 30, 2017 was 12.60%. The performance of the other share classes will differ due
to their different expense structures. |
During the ten-year period ended December 31, 2016, the Fund’s highest and lowest quarterly returns were 14.44% and -13.94%, respectively, for the quarters ended September 30, 2010 and December 31, 2008.
The table below shows the variability of the Fund’s average annual returns and how they compare over the time periods indicated with those of a broad measure of market performance and an index of funds with similar investment objectives. All after-tax returns are calculated using the historical highest individual federal marginal income tax rates and do not reflect the impact of state and local taxes. After-tax returns are shown for Class A shares only; after-tax returns for other share classes will vary. Your own actual after-tax returns will depend on your specific tax situation and may differ from what is shown here. After-tax returns are not relevant to investors who hold Fund shares in tax-deferred accounts such as IRAs or employer-sponsored retirement plans.
Both the bar chart and the table assume that all distributions have been reinvested. Performance reflects fee waivers, if any, in effect during the periods presented. If any such waivers had not been in place, returns would have been reduced.
4
Section 1 Fund Summaries
Performance is not shown for Class T shares, which have not been offered for a full calendar year.
| | | | | | | | | | | | | | | | | | | | | | | | |
| | | | | | Average Annual Total Returns
for the Periods Ended
December 31, 2016 | |
| | | Inception
Date | | | 1 Year | | | 5 Years | | | 10 Years | | | Since
Inception
(Class R3) | | | Since
Inception
(Class R6) | |
| Class A (return before taxes) | | | 3/28/06 | | | | 5.15 | % | | | 10.26 | % | | | 6.86 | % | | | N/A | | | | N/A | |
| Class A (return after taxes on distributions) | | | | | | | 4.76 | % | | | 9.46 | % | | | 6.32 | % | | | N/A | | | | N/A | |
| Class A (return after taxes on distributions and sale of Fund shares) | | | | | | | 3.22 | % | | | 8.09 | % | | | 5.51 | % | | | N/A | | | | N/A | |
| Class C (return before taxes) | | | 3/28/06 | | | | 10.73 | % | | | 10.75 | % | | | 6.69 | % | | | N/A | | | | N/A | |
| Class R3 (return before taxes) | | | 3/03/09 | | | | 11.29 | % | | | 11.30 | % | | | N/A | | | | 15.27 | % | | | N/A | |
| Class R6 (return before taxes) | | | 3/25/13 | | | | 11.95 | % | | | N/A | | | | N/A | | | | N/A | | | | 10.10 | % |
| Class I (return before taxes) | | | 3/28/06 | | | | 11.84 | % | | | 11.85 | % | | | 7.77 | % | | | N/A | | | | N/A | |
| S&P 500® Index1 (reflects no deduction for fees, expenses or taxes) | | | | | | | 11.96 | % | | | 14.66 | % | | | 6.95 | % | | | 18.59 | % | | | 12.57 | % |
| Lipper Equity Income Funds Category Average2 (reflects no deduction for taxes or sales loads) | | | | | | | 13.86 | % | | | 11.53 | % | | | 5.95 | % | | | 16.21 | % | | | 9.50 | % |
| 1 | An unmanaged index generally considered representative of the U.S. stock market. |
| 2 | Represents the average annualized returns for all reporting funds in the Lipper Equity Income Funds Category. |
Management
Investment Adviser
Nuveen Fund Advisors, LLC
Sub-Adviser
Santa Barbara Asset Management, LLC
Portfolio Manager
| | | | |
Name | | Title | | Portfolio Manager of Fund Since |
| James R. Boothe, CFA | | Chief Investment Officer, Portfolio Manager | | March 2006 |
Section 1 Fund Summaries
5
Purchase and Sale of Fund Shares
You may purchase, redeem or exchange shares of the Fund on any business day, which is any day the New York Stock Exchange is open for business. You may purchase, redeem or exchange shares of the Fund either through a financial advisor or other financial intermediary or directly from the Fund. Class A, Class C and Class T shares may not be purchased directly from the Fund. In addition, the availability of Class A, Class C and Class T shares through a financial intermediary will depend on the policies of the intermediary. The Fund’s initial and subsequent investment minimums generally are as follows, although certain financial intermediaries may impose their own investment minimums and the Fund may reduce or waive the minimums in some cases:
| | | | | | | | |
| | | Class A, Class C and Class T | | Class R3 | | Class R6 | | Class I |
| Eligibility and Minimum Initial Investment | | $3,000 for all accounts except: • $2,500 for Traditional/Roth IRA accounts. • $2,000 for Coverdell Education Savings Accounts. • $250 for accounts opened through fee-based programs. (Class T shares are not available through fee-based programs.) • No minimum for retirement plans. | | Available only through certain retirement plans. No minimum. | | Available only to certain qualified retirement plans and other investors as described in the prospectus and through fee-based programs. $1 million for all accounts except: • $100,000 for clients of financial intermediaries who charge such clients an ongoing fee for advisory, investment, consulting or related services. • No minimum for certain qualified retirement plans and certain other categories of eligible investors as described in the prospectus. | | Available only through fee-based programs and certain retirement plans, and to other limited categories of investors as described in the prospectus. $100,000 for all accounts except: • $250 for clients of financial intermediaries and family offices that have accounts holding Class I shares with an aggregate value of at least $100,000 (or that are expected to reach this level). • No minimum for eligible retirement plans and certain other categories of eligible investors as described in the prospectus. |
| Minimum Additional Investment | | $100 | | No minimum. | | No minimum. | | No minimum. |
Tax Information
The Fund’s distributions are taxable and will generally be taxed as ordinary income or capital gains, unless you are investing through a tax-deferred account, such as an IRA or 401(k) plan (in which case you may be taxed upon withdrawal of your investment from such account).
Payments to Broker-Dealers and Other Financial Intermediaries
If you purchase shares of the Fund through a broker-dealer or other financial intermediary (such as a bank or financial advisor), the Fund, its distributor or its investment adviser may pay the intermediary for the sale of Fund shares and related services. These payments may create a conflict of interest by influencing the broker-dealer or other financial intermediary and your salesperson to recommend the Fund over another investment. Ask your financial advisor or visit your financial intermediary’s website for more information.
6
Section 1 Fund Summaries
Nuveen Santa Barbara Global Dividend Growth Fund
Investment Objective
The investment objective of the Fund is to seek an attractive total return comprised of income from dividends and long-term capital appreciation.
Fees and Expenses of the Fund
This table describes the fees and expenses that you may pay if you buy and hold shares of the Fund. You may qualify for sales charge discounts if you and your family invest, or agree to invest in the future, at least $50,000 in the Fund or in other Nuveen Mutual Funds. More information about these and other discounts, as well as eligibility requirements for each share class, is available from your financial advisor and in “What Share Classes We Offer” on page 27 of the Fund’s prospectus, “How to Reduce Your Sales Charge” on page 31 of the prospectus, in the appendix to this prospectus titled “Variations in Sales Charge Reductions and Waivers Available Through Certain Intermediaries,” and “Purchase and Redemption of Fund Shares” on page S-63 of the Fund’s statement of additional information.
Shareholder Fees
(fees paid directly from your investment)
| | | | | | | | | | | | | | | | | | | | |
| | | Class A | | | Class C | | | Class R3 | | | Class I | | | Class T | |
Maximum Sales Charge (Load) Imposed on Purchases
(as a percentage of offering price) | | | 5.75% | | | | None | | | | None | | | | None | | | | 2.50% | |
Maximum Deferred Sales Charge (Load)
(as a percentage of the lesser of purchase price or redemption proceeds)1 | | | None | | | | 1.00% | | | | None | | | | None | | | | None | |
| Maximum Sales Charge (Load) Imposed on Reinvested Dividends | | | None | | | | None | | | | None | | | | None | | | | None | |
| Exchange Fee | | | None | | | | None | | | | None | | | | None | | | | None | |
| Annual Low Balance Account Fee (for accounts under $1,000)2 | | | $15 | | | | $15 | | | | None | | | | $15 | | | | $15 | |
| |
| Annual Fund Operating Expenses | | | | |
| (expenses that you pay each year as a percentage of the value of your investment) | | | | | | | | | | | | | | | |
| | | Class A | | | Class C | | | Class R3 | | | Class I | | | Class T | |
| Management Fees | | | 0.71% | | | | 0.71% | | | | 0.71% | | | | 0.71% | | | | 0.71% | |
| Distribution and/or Service (12b-1) Fees | | | 0.25% | | | | 1.00% | | | | 0.50% | | | | 0.00% | | | | 0.25% | |
| Other Expenses | | | 0.29% | | | | 0.29% | | | | 0.29% | | | | 0.30% | | | | 0.29% | |
| Total Annual Fund Operating Expenses | | | 1.25% | | | | 2.00% | | | | 1.50% | | | | 1.01% | | | | 1.25% | |
| Fee Waivers and/or Expense Reimbursements3 | | | (0.10)% | | | | (0.10)% | | | | (0.10)% | | | | (0.11)% | | | | (0.10)% | |
| Total Annual Fund Operating Expenses After Fee Waivers and/or Expense Reimbursements | | | 1.15% | | | | 1.90% | | | | 1.40% | | | | 0.90% | | | | 1.15% | |
| 1 | The contingent deferred sales charge on Class C shares applies only to redemptions within 12 months of purchase. |
| 2 | Fee applies to the following types of accounts under $1,000 held directly with the Fund: individual retirement accounts (IRAs), Coverdell Education Savings Accounts and accounts established pursuant to the Uniform Transfers to Minors Act (UTMA) or Uniform Gifts to Minors Act (UGMA). |
| 3 | The Fund’s investment adviser has agreed to waive fees and/or reimburse expenses through July 31, 2019 so that Total Annual Fund Operating Expenses (excluding 12b-1 distribution and/or service fees, interest expenses, taxes, acquired fund fees and expenses, fees incurred in acquiring and disposing of portfolio securities and extraordinary expenses) do not exceed 0.94% of the average daily net assets of any class of Fund shares. This expense limitation may be terminated or modified prior to that date only with the approval of the Board of Trustees of the Fund. |
Section 1 Fund Summaries
7
Example
The following example is intended to help you compare the cost of investing in the Fund with the cost of investing in other mutual funds. The example assumes that you invest $10,000 in the Fund for the time periods indicated and then either redeem or do not redeem your shares at the end of a period. The example also assumes that your investment has a 5% return each year, that the Fund’s operating expenses remain the same and that the fee waivers currently in place are not renewed beyond July 31, 2019. Although your actual costs may be higher or lower, based on these assumptions your costs would be:
| | | | | | | | | | | | | | | | | | | | |
| | | Class A | | | Class C | | | Class R3 | | | Class I | | | Class T | |
| 1 Year | | $ | 685 | | | $ | 193 | | | $ | 143 | | | $ | 92 | | | $ | 364 | |
| 3 Years | | $ | 933 | | | $ | 611 | | | $ | 457 | | | $ | 303 | | | $ | 620 | |
| 5 Years | | $ | 1,206 | | | $ | 1,062 | | | $ | 802 | | | $ | 540 | | | $ | 903 | |
| 10 Years | | $ | 1,985 | | | $ | 2,314 | | | $ | 1,776 | | | $ | 1,219 | | | $ | 1,709 | |
Portfolio Turnover
The Fund pays transaction costs, such as commissions, when it buys and sells securities (or “turns over” its portfolio). A higher portfolio turnover rate may indicate higher transaction costs and may result in higher taxes when Fund shares are held in a taxable account. These costs, which are not reflected in annual fund operating expenses or in the example, affect the Fund’s performance. During the most recent fiscal year, the Fund’s portfolio turnover rate was 33% of the average value of its portfolio.
Principal Investment Strategies
Under normal market conditions, the Fund invests at least 80% of its net assets in dividend-paying equity securities, which include preferred securities. Under normal market conditions, the Fund invests between 40% and 75% of its net assets in non-U.S. securities. The Fund may invest up to 10% of its net assets in companies located in emerging market countries. The Fund may invest in small-, mid- and large-cap companies.
Principal Risks
The value of your investment in this Fund will change daily. You could lose money by investing in the Fund. An investment in the Fund is not a deposit of a bank and is not insured or guaranteed by the Federal Deposit Insurance Corporation or any other government agency. The principal risks of investing in the Fund, listed alphabetically, include:
Active Management Risk—The Fund’s sub-adviser actively manages the Fund’s investments. Consequently, the Fund is subject to the risk that the investment techniques and risk analyses employed by the Fund’s sub-adviser may not produce the desired results. This could cause the Fund to lose value or its investment results to lag relevant benchmarks or other funds with similar objectives.
Currency Risk—Changes in currency exchange rates will affect the value of non-U.S. dollar denominated securities, the value of dividends and interest earned from such securities, and gains and losses realized on the sale of such securities. A strong U.S. dollar relative to these other currencies will adversely affect the value of the Fund’s portfolio.
Cybersecurity Risk—Cybersecurity risk is the risk of an unauthorized breach and access to Fund assets, customer data (including private shareholder information), or proprietary information, or the risk of an incident occurring that causes the Fund, its investment adviser or sub-adviser, custodian, transfer agent, distributor or other service provider or a financial intermediary to suffer a data breach, data corruption or lose operational functionality. Successful cyber-attacks or other cyber-failures or events affecting the Fund or its service providers may adversely impact the Fund or its shareholders. Additionally, a cybersecurity breach could affect the issuers in which the Fund invests, which may cause the Fund’s investments to lose value.
Dividend-Paying Security Risk—The Fund’s investment in dividend-paying stocks could cause the Fund to underperform similar funds that invest without consideration of a company’s track record of paying dividends. Stocks of companies with a history of paying dividends may not participate in a broad market advance to the same degree as most other stocks, and a sharp rise in interest rates or economic downturn could cause a company to unexpectedly reduce or eliminate its dividend.
Equity Security Risk—Equity securities in the Fund’s portfolio may decline significantly in price over short or extended periods of time, and such declines may occur because of declines in the equity market as a whole, or because of declines in only a particular country, company, industry, or sector of the market. Holders of common stock generally are subject to more risks than holders of preferred securities because the status of common stockholders upon the
8
Section 1 Fund Summaries
bankruptcy of the issuer is subordinated to that of preferred security holders. Given the Fund’s focus on dividend-paying securities, the Fund may, from time to time, have a greater exposure to higher dividend-yield sectors and industries than the broad equity market which would make the Fund more vulnerable to adverse developments affecting such sectors or industries.
Growth Stock Risk—Growth stocks tend to be more volatile than certain other types of stocks and their prices usually fluctuate more dramatically than the overall stock market. A stock with growth characteristics can have sharp price declines due to decreases in current earnings or the failure to meet expected earnings and may lack dividends that can help cushion its share price in a declining market.
Non-U.S./Emerging Markets Risk—Non-U.S. issuers or U.S. issuers with significant non-U.S. operations may be subject to risks in addition to those of issuers located in or that principally operate in the United States as a result of, among other things, political, social and economic developments abroad and different legal, regulatory and tax environments. These additional risks may be heightened for securities of issuers located in, or with significant operations in, emerging market countries as such countries may have a higher degree of economic instability, unsettled securities laws and inconsistent regulatory systems.
Preferred Security Risk—Preferred securities generally are subordinated to bonds and other debt instruments in a company’s capital structure and therefore will be subject to greater credit risk than those debt instruments. In addition, preferred securities are subject to other risks, such as having no or limited voting rights, being subject to special redemption rights, having distributions deferred or skipped, having floating interest rates or dividends, which may result in a decline in value in a falling interest rate environment, having limited liquidity, changing or unfavorable tax treatments and possibly being issued by companies in heavily regulated industries.
Smaller Company Risk—Small-cap stocks involve substantial risk. Prices of small-cap stocks may be subject to more abrupt or erratic movements, and to wider fluctuations, than stock prices of larger, more established companies or the market averages in general. It may be difficult to sell small-cap stocks at the desired time and price. While mid-cap stocks may be slightly less volatile than small-cap stocks, they still involve similar risks.
Fund Performance
The following bar chart and table provide some indication of the potential risks of investing in the Fund. The Fund’s past performance (before and after taxes) is not necessarily an indication of how the Fund will perform in the future. Updated performance information is available at www.nuveen.com/performance or by calling (800) 257-8787.
The bar chart below shows the variability of the Fund’s performance from year to year for Class A shares. The bar chart and highest/lowest quarterly returns that follow do not reflect sales charges, and if these charges were reflected, the returns would be less than those shown.
Class A Annual Total Return*
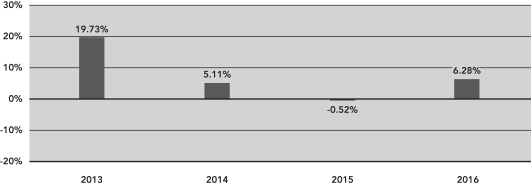
| | * | Class A year-to-date total return as of September 30, 2017 was 14.50%. The performance of the other share classes will differ due
to their different expense structures. |
During the four-year period ended December 31, 2016, the Fund’s highest and lowest quarterly returns were 6.63% and
-7.64%, respectively, for the quarters ended March 31, 2013 and September 30, 2015.
The table below shows the variability of the Fund’s average annual returns and how they compare over the time periods indicated with those of a broad measure of market performance and an index of funds with similar investment objectives. All after-tax returns are calculated using the historical highest individual federal marginal income tax rates and do not reflect the impact of state and local taxes. After-tax returns are shown for Class A shares only; after-tax returns for other share classes will vary. Your own actual after-tax returns will depend on your specific tax situation and
Section 1 Fund Summaries
9
may differ from what is shown here. After-tax returns are not relevant to investors who hold Fund shares in tax-deferred accounts such as IRAs or employer-sponsored retirement plans.
Both the bar chart and the table assume that all distributions have been reinvested. Performance reflects fee waivers, if any, in effect during the periods presented. If any such waivers had not been in place, returns would have been reduced.
Performance is not shown for Class T shares, which have not commenced operations as of the date of this prospectus.
| | | | | | | | | | | | |
| | | | | | Average Annual Total Returns
for the Periods Ended
December 31, 2016 | |
| | | Inception
Date | | | 1 Year | | | Since
Inception | |
| Class A (return before taxes) | | | 6/11/12 | | | | 0.17 | % | | | 7.76 | % |
| Class A (return after taxes on distributions) | | | | | | | (0.26 | )% | | | 7.09 | % |
| Class A (return after taxes on distributions and sale of Fund shares) | | | | | | | 0.44 | % | | | 6.03 | % |
| Class C (return before taxes) | | | 6/11/12 | | | | 5.47 | % | | | 8.36 | % |
| Class R3 (return before taxes) | | | 6/11/12 | | | | 5.99 | % | | | 8.89 | % |
| Class I (return before taxes) | | | 6/11/12 | | | | 6.55 | % | | | 9.43 | % |
| MSCI World Index1 (reflects no deduction for fees, expenses or taxes) | | | | | | | 7.51 | % | | | 11.15 | % |
| Lipper Global Equity Income Funds Category Average2 (reflects no deduction for taxes or sales loads) | | | | | | | 7.28 | % | | | 8.36 | % |
| 1 | A free float-adjusted market capitalization weighted index designed to track the equity market performance of developed markets. |
| 2 | Represents the average annualized returns for all reporting funds in the Lipper Global Equity Income Funds Category. |
Management
Investment Adviser
Nuveen Fund Advisors, LLC
Sub-Adviser
Santa Barbara Asset Management, LLC
Portfolio Manager
| | | | |
Name | | Title | | Portfolio Manager of Fund Since |
| James R. Boothe, CFA | | Chief Investment Officer, Portfolio Manager | | June 2012 |
10
Section 1 Fund Summaries
Purchase and Sale of Fund Shares
You may purchase, redeem or exchange shares of the Fund on any business day, which is any day the New York Stock Exchange is open for business. You may purchase, redeem or exchange shares of the Fund either through a financial advisor or other financial intermediary or directly from the Fund. Class A, Class C and Class T shares may not be purchased directly from the Fund. In addition, the availability of Class A, Class C and Class T shares through a financial intermediary will depend on the policies of the intermediary. The Fund’s initial and subsequent investment minimums generally are as follows, although certain financial intermediaries may impose their own investment minimums and the Fund may reduce or waive the minimums in some cases:
| | | | | | |
| | | Class A, Class C and Class T | | Class R3 | | Class I |
| Eligibility and Minimum Initial Investment | | $3,000 for all accounts except: • $2,500 for Traditional/Roth IRA accounts. • $2,000 for Coverdell Education Savings Accounts. • $250 for accounts opened through fee-based programs. (Class T shares are not available through fee-based programs.) • No minimum for retirement plans. | | Available only
through certain retirement plans. No minimum. | | Available only through fee-based programs and certain retirement plans, and to other limited categories of investors as described in the prospectus. $100,000 for all accounts except: • $250 for clients of financial intermediaries and family offices that have accounts holding Class I shares with an aggregate value of at least $100,000 (or that are expected to reach this level). • No minimum for eligible retirement plans and certain other categories of eligible investors as described in the prospectus. |
| Minimum Additional Investment | | $100 | | No minimum. | | No minimum. |
Tax Information
The Fund’s distributions are taxable and will generally be taxed as ordinary income or capital gains, unless you are investing through a tax-deferred account, such as an IRA or 401(k) plan (in which case you may be taxed upon withdrawal of your investment from such account).
Payments to Broker-Dealers and Other Financial Intermediaries
If you purchase shares of the Fund through a broker-dealer or other financial intermediary (such as a bank or financial advisor), the Fund, its distributor or its investment adviser may pay the intermediary for the sale of Fund shares and related services. These payments may create a conflict of interest by influencing the broker-dealer or other financial intermediary and your salesperson to recommend the Fund over another investment. Ask your financial advisor or visit your financial intermediary’s website for more information.
Section 1 Fund Summaries
11
Nuveen Santa Barbara International Dividend Growth Fund
Investment Objective
The investment objective of the Fund is to seek an attractive total return comprised of income from dividends and long-term capital appreciation.
Fees and Expenses of the Fund
This table describes the fees and expenses that you may pay if you buy and hold shares of the Fund. You may qualify for sales charge discounts if you and your family invest, or agree to invest in the future, at least $50,000 in the Fund or in other Nuveen Mutual Funds. More information about these and other discounts, as well as eligibility requirements for each share class, is available from your financial advisor and in “What Share Classes We Offer” on page 27 of the Fund’s prospectus, “How to Reduce Your Sales Charge” on page 31 of the prospectus, in the appendix to this prospectus titled “Variations in Sales Charge Reductions and Waivers Available Through Certain Intermediaries,” and “Purchase and Redemption of Fund Shares” on page S-63 of the Fund’s statement of additional information.
Shareholder Fees
(fees paid directly from your investment)
| | | | | | | | | | | | | | | | | | | | |
| | | Class A | | | Class C | | | Class R3 | | | Class I | | | Class T | |
Maximum Sales Charge (Load) Imposed on Purchases
(as a percentage of offering price) | | | 5.75% | | | | None | | | | None | | | | None | | | | 2.50% | |
Maximum Deferred Sales Charge (Load)
(as a percentage of the lesser of purchase price or redemption proceeds)1 | | | None | | | | 1.00% | | | | None | | | | None | | | | None | |
| Maximum Sales Charge (Load) Imposed on Reinvested Dividends | | | None | | | | None | | | | None | | | | None | | | | None | |
| Exchange Fee | | | None | | | | None | | | | None | | | | None | | | | None | |
| Annual Low Balance Account Fee (for accounts under $1,000)2 | | | $15 | | | | $15 | | | | None | | | | $15 | | | | $15 | |
| | | | | |
| Annual Fund Operating Expenses | | | | | | | | | | | | | | | |
| (expenses that you pay each year as a percentage of the value of your investment) | | | | | | | | | | | | | | | |
| | | Class A | | | Class C | | | Class R3 | | | Class I | | | Class T | |
| Management Fees | | | 0.71% | | | | 0.71% | | | | 0.71% | | | | 0.71% | | | | 0.71% | |
| Distribution and/or Service (12b-1) Fees | | | 0.25% | | | | 1.00% | | | | 0.50% | | | | 0.00% | | | | 0.25% | |
| Other Expenses | | | 3.57% | | | | 3.48% | | | | 3.55% | | | | 3.43% | | | | 3.57% | |
| Total Annual Fund Operating Expenses | | | 4.53% | | | | 5.19% | | | | 4.76% | | | | 4.14% | | | | 4.53% | |
| Fee Waivers and/or Expense Reimbursements3 | | | (3.38)% | | | | (3.29)% | | | | (3.36)% | | | | (3.24)% | | | | (3.38)% | |
| Total Annual Fund Operating Expenses After Fee Waivers and/or Expense Reimbursements | | | 1.15% | | | | 1.90% | | | | 1.40% | | | | 0.90% | | | | 1.15% | |
| 1 | The contingent deferred sales charge on Class C shares applies only to redemptions within 12 months of purchase. |
| 2 | Fee applies to the following types of accounts under $1,000 held directly with the Fund: individual retirement accounts (IRAs), Coverdell Education Savings Accounts and accounts established pursuant to the Uniform Transfers to Minors Act (UTMA) or Uniform Gifts to Minors Act (UGMA). |
| 3 | The Fund’s investment adviser has agreed to waive fees and/or reimburse expenses through July 31, 2019 so that Total Annual Fund Operating Expenses (excluding 12b-1 distribution and/or service fees, interest expenses, taxes, acquired fund fees and expenses, fees incurred in acquiring and disposing of portfolio securities and extraordinary expenses) do not exceed 0.94% of the average daily net assets of any class of Fund shares. This expense limitation may be terminated or modified prior to that date only with the approval of the Board of Trustees of the Fund. |
12
Section 1 Fund Summaries
Example
The following example is intended to help you compare the cost of investing in the Fund with the cost of investing in other mutual funds. The example assumes that you invest $10,000 in the Fund for the time periods indicated and then either redeem or do not redeem your shares at the end of a period. The example also assumes that your investment has a 5% return each year, that the Fund’s operating expenses remain the same and that the fee waivers currently in place are not renewed beyond July 31, 2019. Although your actual costs may be higher or lower, based on these assumptions your costs would be:
| | | | | | | | | | | | | | | | | | | | |
| | | Class A | | | Class C | | | Class R3 | | | Class I | | | Class T | |
| 1 Year | | $ | 685 | | | $ | 193 | | | $ | 143 | | | $ | 92 | | | $ | 364 | |
| 3 Years | | $ | 1,370 | | | $ | 1,052 | | | $ | 915 | | | $ | 749 | | | $ | 1,072 | |
| 5 Years | | $ | 2,289 | | | $ | 2,140 | | | $ | 1,930 | | | $ | 1,652 | | | $ | 2,023 | |
| 10 Years | | $ | 4,626 | | | $ | 4,840 | | | $ | 4,491 | | | $ | 3,979 | | | $ | 4,441 | |
Portfolio Turnover
The Fund pays transaction costs, such as commissions, when it buys and sells securities (or “turns over” its portfolio). A higher portfolio turnover rate may indicate higher transaction costs and may result in higher taxes when Fund shares are held in a taxable account. These costs, which are not reflected in annual fund operating expenses or in the example, affect the Fund’s performance. During the most recent fiscal year, the Fund’s portfolio turnover rate was 25% of the average value of its portfolio.
Principal Investment Strategies
Under normal market conditions, the Fund invests at least 80% of its net assets in dividend-paying equity securities, which include preferred securities. Under normal market conditions, the Fund invests at least 80% of its net assets in non-U.S. securities. The Fund may invest up to 10% of its net assets in companies located in emerging market countries. The Fund may invest in small-, mid- and large-cap companies.
Principal Risks
The value of your investment in this Fund will change daily. You could lose money by investing in the Fund. An investment in the Fund is not a deposit of a bank and is not insured or guaranteed by the Federal Deposit Insurance Corporation or any other government agency. The principal risks of investing in the Fund, listed alphabetically, include:
Active Management Risk—The Fund’s sub-adviser actively manages the Fund’s investments. Consequently, the Fund is subject to the risk that the investment techniques and risk analyses employed by the Fund’s sub-adviser may not produce the desired results. This could cause the Fund to lose value or its investment results to lag relevant benchmarks or other funds with similar objectives.
Currency Risk—Changes in currency exchange rates will affect the value of non-U.S. dollar denominated securities, the value of dividends and interest earned from such securities, and gains and losses realized on the sale of such securities. A strong U.S. dollar relative to these other currencies will adversely affect the value of the Fund’s portfolio.
Cybersecurity Risk—Cybersecurity risk is the risk of an unauthorized breach and access to Fund assets, customer data (including private shareholder information), or proprietary information, or the risk of an incident occurring that causes the Fund, its investment adviser or sub-adviser, custodian, transfer agent, distributor or other service provider or a financial intermediary to suffer a data breach, data corruption or lose operational functionality. Successful cyber-attacks or other cyber-failures or events affecting the Fund or its service providers may adversely impact the Fund or its shareholders. Additionally, a cybersecurity breach could affect the issuers in which the Fund invests, which may cause the Fund’s investments to lose value.
Dividend-Paying Security Risk—The Fund’s investment in dividend-paying stocks could cause the Fund to underperform similar funds that invest without consideration of a company’s track record of paying dividends. Stocks of companies with a history of paying dividends may not participate in a broad market advance to the same degree as most other stocks, and a sharp rise in interest rates or economic downturn could cause a company to unexpectedly reduce or eliminate its dividend.
Equity Security Risk—Equity securities in the Fund’s portfolio may decline significantly in price over short or extended periods of time, and such declines may occur because of declines in the equity market as a whole, or because of declines in only a particular country, company, industry, or sector of the market. Holders of common stock generally are subject to more risks than holders of preferred securities because the status of common stockholders upon the
Section 1 Fund Summaries
13
bankruptcy of the issuer is subordinated to that of preferred security holders. Given the Fund’s focus on dividend-paying securities, the Fund may, from time to time, have a greater exposure to higher dividend-yield sectors and industries than the broad equity market which would make the Fund more vulnerable to adverse developments affecting such sectors or industries.
Growth Stock Risk—Growth stocks tend to be more volatile than certain other types of stocks and their prices usually fluctuate more dramatically than the overall stock market. A stock with growth characteristics can have sharp price declines due to decreases in current earnings or the failure to meet expected earnings and may lack dividends that can help cushion its share price in a declining market.
Non-U.S./Emerging Markets Risk—Non-U.S. issuers or U.S. issuers with significant non-U.S. operations may be subject to risks in addition to those of issuers located in or that principally operate in the United States as a result of, among other things, political, social and economic developments abroad and different legal, regulatory and tax environments. These additional risks may be heightened for securities of issuers located in, or with significant operations in, emerging market countries as such countries may have a higher degree of economic instability, unsettled securities laws and inconsistent regulatory systems.
Preferred Security Risk—Preferred securities generally are subordinated to bonds and other debt instruments in a company’s capital structure and therefore will be subject to greater credit risk than those debt instruments. In addition, preferred securities are subject to other risks, such as having no or limited voting rights, being subject to special redemption rights, having distributions deferred or skipped, having floating interest rates or dividends, which may result in a decline in value in a falling interest rate environment, having limited liquidity, changing or unfavorable tax treatments and possibly being issued by companies in heavily regulated industries.
Smaller Company Risk—Small-cap stocks involve substantial risk. Prices of small-cap stocks may be subject to more abrupt or erratic movements, and to wider fluctuations, than stock prices of larger, more established companies or the market averages in general. It may be difficult to sell small-cap stocks at the desired time and price. While mid-cap stocks may be slightly less volatile than small-cap stocks, they still involve similar risks.
Fund Performance
The following bar chart and table provide some indication of the potential risks of investing in the Fund. The Fund’s past performance (before and after taxes) is not necessarily an indication of how the Fund will perform in the future. Updated performance information is available at www.nuveen.com/performance or by calling (800) 257-8787.
The bar chart below shows the variability of the Fund’s performance from year to year for Class A shares. The bar chart and highest/lowest quarterly returns that follow do not reflect sales charges, and if these charges were reflected, the returns would be less than those shown.
Class A Annual Total Return*
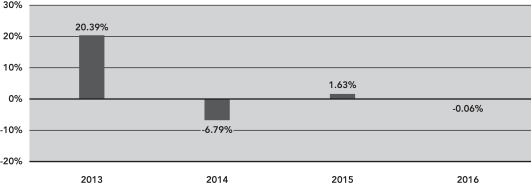
| | * | Class A year-to-date total return as of September 30, 2017 was 17.61%. The performance of the other share classes will differ due
to their different expense structures. |
During the four-year period ended December 31, 2016, the Fund’s highest and lowest quarterly returns were 8.94% and
-7.50%, respectively, for the quarters ended September 30, 2013 and September 30, 2015.
The table below shows the variability of the Fund’s average annual returns and how they compare over the time periods indicated with those of a broad measure of market performance and an index of funds with similar investment objectives. All after-tax returns are calculated using the historical highest individual federal marginal income tax rates and do not reflect the impact of state and local taxes. After-tax returns are shown for Class A shares only; after-tax returns for other share classes will vary. Your own actual after-tax returns will depend on your specific tax situation and
14
Section 1 Fund Summaries
may differ from what is shown here. After-tax returns are not relevant to investors who hold Fund shares in tax-deferred accounts such as IRAs or employer-sponsored retirement plans.
Both the bar chart and the table assume that all distributions have been reinvested. Performance reflects fee waivers, if any, in effect during the periods presented. If any such waivers had not been in place, returns would have been reduced.
Performance is not shown for Class T shares, which have not commenced operations as of the date of this prospectus.
| | | | | | | | | | | | |
| | | | | | Average Annual Total Returns
for the Periods Ended
December 31, 2016 | |
| | | Inception
Date | | | 1 Year | | | Since
Inception | |
| Class A (return before taxes) | | | 6/11/12 | | | | (5.81 | )% | | | 5.21 | % |
| Class A (return after taxes on distributions) | | | | | | | (6.37 | )% | | | 4.54 | % |
| Class A (return after taxes on distributions and sale of Fund shares) | | | | | | | (2.82 | )% | | | 4.01 | % |
| Class C (return before taxes) | | | 6/11/12 | | | | (0.82 | )% | | | 5.79 | % |
| Class R3 (return before taxes) | | | 6/11/12 | | | | (0.31 | )% | | | 6.32 | % |
| Class I (return before taxes) | | | 6/11/12 | | | | 0.19 | % | | | 6.85 | % |
| MSCI EAFE Index1 (reflects no deduction for fees, expenses or taxes) | | | | | | | 1.00 | % | | | 7.67 | % |
| Lipper International Equity Income Funds Category Average2 (reflects no deduction for taxes or sales loads) | | | | | | | 3.14 | % | | | 5.34 | % |
| 1 | The MSCI (Morgan Stanley Capital International) EAFE (Europe, Australasia, Far East) Index is a free float-adjusted market capitalization weighted index designed to measure developed market equity performance, excluding the U.S. and Canada. |
| 2 | Represents the average annualized returns for all reporting funds in the Lipper International Equity Income Funds Category. |
Management
Investment Adviser
Nuveen Fund Advisors, LLC
Sub-Adviser
Santa Barbara Asset Management, LLC
Portfolio Manager
| | | | |
Name | | Title | | Portfolio Manager of Fund Since |
| James R. Boothe, CFA | | Chief Investment Officer, Portfolio Manager | | June 2012 |
Section 1 Fund Summaries
15
Purchase and Sale of Fund Shares
You may purchase, redeem or exchange shares of the Fund on any business day, which is any day the New York Stock Exchange is open for business. You may purchase, redeem or exchange shares of the Fund either through a financial advisor or other financial intermediary or directly from the Fund. Class A, Class C and Class T shares may not be purchased directly from the Fund. In addition, the availability of Class A, Class C and Class T shares through a financial intermediary will depend on the policies of the intermediary. The Fund’s initial and subsequent investment minimums generally are as follows, although certain financial intermediaries may impose their own investment minimums and the Fund may reduce or waive the minimums in some cases:
| | | | | | |
| | | Class A, Class C and Class T | | Class R3 | | Class I |
Eligibility and
Minimum Initial Investment | | $3,000 for all accounts except: • $2,500 for Traditional/Roth IRA accounts. • $2,000 for Coverdell Education Savings Accounts. • $250 for accounts opened through fee-based programs. (Class T shares are not available through fee-based programs.) • No minimum for retirement plans. | | Available only
through certain retirement plans. No minimum. | | Available only through fee-based programs and certain retirement plans, and to other limited categories of investors as described in the prospectus. $100,000 for all accounts except: • $250 for clients of financial intermediaries and family offices that have accounts holding Class I shares with an aggregate value of at least $100,000 (or that are expected to reach this level). • No minimum for eligible retirement plans and certain other categories of eligible investors as described in the prospectus. |
Minimum
Additional
Investment | | $100 | | No minimum. | | No minimum. |
Tax Information
The Fund’s distributions are taxable and will generally be taxed as ordinary income or capital gains, unless you are investing through a tax-deferred account, such as an IRA or 401(k) plan (in which case you may be taxed upon withdrawal of your investment from such account).
Payments to Broker-Dealers and Other Financial Intermediaries
If you purchase shares of the Fund through a broker-dealer or other financial intermediary (such as a bank or financial advisor), the Fund, its distributor or its investment adviser may pay the intermediary for the sale of Fund shares and related services. These payments may create a conflict of interest by influencing the broker-dealer or other financial intermediary and your salesperson to recommend the Fund over another investment. Ask your financial advisor or visit your financial intermediary’s website for more information.
16
Section 1 Fund Summaries
Section 2 How We Manage Your Money
To help you better understand the Funds, this section includes a detailed discussion of the Funds’ investment and risk management strategies. For a more complete discussion of these matters, please see the statement of additional information, which is available by calling (800) 257-8787 or by visiting Nuveen’s website at www.nuveen.com.

Nuveen Fund Advisors, LLC (“Nuveen Fund Advisors”), the Funds’ investment adviser, offers advisory and investment management services to a broad range of investment company clients. Nuveen Fund Advisors has overall responsibility for management of the Funds, oversees the management of the Funds’ portfolios, manages the Funds’ business affairs and provides certain clerical, bookkeeping and other administrative services. Nuveen Fund Advisors is located at 333 West Wacker Drive, Chicago, Illinois 60606. Nuveen Fund Advisors is a subsidiary of Nuveen, LLC, the investment management arm of Teachers Insurance and Annuity Association of America (“TIAA”). TIAA is a life insurance company founded in 1918 by the Carnegie Foundation for the Advancement of Teaching and is the companion organization of College Retirement Equities Fund. As of September 30, 2017, Nuveen, LLC managed approximately $948 billion in assets, of which approximately $137 billion was managed by Nuveen Fund Advisors.
Nuveen Fund Advisors has selected its affiliate, Santa Barbara Asset Management, LLC (“SBAM”), located at 2049 Century Park East, 17th Floor, Los Angeles, California 90067, to serve as sub-adviser to each Fund. SBAM manages the investment of the Funds’ assets on a discretionary basis, subject to the supervision of Nuveen Fund Advisors.
The portfolio manager for the Funds is James R. Boothe. His business experience for the last five years is set forth below.
| | • | | James R. Boothe, CFA, is Chief Investment Officer and Portfolio Manager for SBAM. He joined the firm in 2002. |
Additional information about the portfolio manager’s compensation, other accounts managed by the portfolio manager and the portfolio manager’s ownership of securities in the Funds is provided in the statement of additional information.
Management Fees
The management fee schedule for each Fund consists of two components: a Fund-level fee, based only on the amount of assets within a Fund, and a complex-level fee, based on the aggregate amount of all eligible fund assets managed by Nuveen Fund Advisors.
Section 2 How We Manage Your Money
17
The annual Fund-level fee, payable monthly, is based upon the average daily net assets of each Fund as follows:
| | | | | | | | | | | | |
| Average Daily Net Assets | | Nuveen Santa Barbara
Dividend
Growth Fund | | | Nuveen Santa Barbara
Global Dividend
Growth Fund | | | Nuveen
Santa Barbara
International
Dividend
Growth Fund | |
| For the first $125 million | | | 0.5000 | % | | | 0.5500 | % | | | 0.5500 | % |
| For the next $125 million | | | 0.4875 | % | | | 0.5375 | % | | | 0.5375 | % |
| For the next $250 million | | | 0.4750 | % | | | 0.5250 | % | | | 0.5250 | % |
| For the next $500 million | | | 0.4625 | % | | | 0.5125 | % | | | 0.5125 | % |
| For the next $1 billion | | | 0.4500 | % | | | 0.5000 | % | | | 0.5000 | % |
| For the next $3 billion | | | 0.4250 | % | | | 0.4750 | % | | | 0.4750 | % |
| For the next $2.5 billion | | | 0.4000 | % | | | 0.4500 | % | | | 0.4500 | % |
| For the next $2.5 billion | | | 0.3875 | % | | | 0.4375 | % | | | 0.4375 | % |
| For net assets over $10 billion | | | 0.3750 | % | | | 0.4250 | % | | | 0.4250 | % |
The complex-level fee is the same for each Fund. It begins at a maximum rate of 0.2000% of each Fund’s average daily net assets, based upon complex-level assets of $55 billion, with breakpoints for eligible assets above that level. Therefore, the maximum management fee rate for each Fund is the Fund-level fee plus 0.2000%. As of September 30, 2017, the effective complex-level fee for each Fund was 0.1599% of the Fund’s average daily net assets.
For the most recent fiscal year, each Fund paid Nuveen Fund Advisors the following management fees (net of fee waivers and expense reimbursements, where applicable) as a percentage of average daily net assets:
| | |
| Nuveen Santa Barbara Dividend Growth Fund | | 0.61% |
| Nuveen Santa Barbara Global Dividend Growth Fund | | 0.60% |
| Nuveen Santa Barbara International Dividend Growth Fund | | —* |
| | * | For the most recent fiscal year, Nuveen Fund Advisors reimbursed in excess of management fees. |
Nuveen Fund Advisors has agreed to waive fees and/or reimburse expenses so that Total Annual Fund Operating Expenses (excluding 12b-1 distribution and/or service fees, interest expenses, taxes, acquired fund fees and expenses, fees incurred in acquiring and disposing of portfolio securities and extraordinary expenses) for the Funds do not exceed the percentages of the average daily net assets listed below of any class of Fund shares. However, because Class R6 shares are not subject to sub-transfer agent and similar fees, the Total Annual Fund Operating Expenses for the Class R6 shares will be less than the expense limitation.
| | |
| Nuveen Santa Barbara Dividend Growth Fund | | 1.25% |
| Nuveen Santa Barbara Global Dividend Growth Fund | | 0.94% through July 31, 2019 |
| Nuveen Santa Barbara International Dividend Growth Fund | | 0.94% through July 31, 2019 |
The expense limitations expiring July 31, 2019 may be terminated or modified prior to that date only with the approval of the Board of Trustees of the Funds. The permanent expense limitation for Nuveen Santa Barbara Dividend Growth Fund may be terminated or modified only with the approval of shareholders of the Fund.
Information regarding the Board of Trustees’ approval of the investment management agreements is available in the Funds’ annual report for the fiscal year ended July 31, 2017.
18
Section 2 How We Manage Your Money

Nuveen Santa Barbara Dividend Growth Fund’s investment objective, which is described in the “Fund Summaries” section, may not be changed without shareholder approval. Nuveen Santa Barbara Global Dividend Growth Fund’s investment objective and Nuveen Santa Barbara International Dividend Growth Fund’s investment objective, which are described in the “Fund Summaries” section, may be changed without shareholder approval. If Nuveen Santa Barbara Global Dividend Growth Fund’s investment objective changes or if Nuveen Santa Barbara International Dividend Growth Fund’s investment objective changes, you will be notified at least 60 days in advance.
The Funds’ investment policies may be changed by the Board of Trustees without shareholder approval unless otherwise noted in this prospectus or the statement of additional information.
The Funds’ principal investment strategies are discussed in the “Fund Summaries” section. These are the strategies that the Funds’ investment adviser and sub-adviser believe are most likely to be important in trying to achieve the Funds’ investment objectives. This section provides more information about these strategies, as well as information about some additional strategies that the Funds’ sub-adviser uses, or may use, to achieve the Funds’ objectives. The strategies described below are principal investment strategies unless otherwise noted. You should be aware that each Fund may also use strategies and invest in securities that are not described in this prospectus, but that are described in the statement of additional information. For a copy of the statement of additional information, call Nuveen Investor Services at (800) 257-8787 or visit Nuveen’s website at www.nuveen.com.
Equity Securities
Nuveen Santa Barbara Dividend Growth Fund invests primarily in common stocks and preferred securities. Nuveen Santa Barbara Global Dividend Growth Fund and Nuveen Santa Barbara International Dividend Growth Fund invest primarily in equity securities. Equity securities generally include common stocks; preferred securities; warrants to purchase common stocks and preferred securities; convertible debt securities that are either in the money or immediately convertible into common stocks or preferred securities; common and preferred securities issued by master limited partnerships and real estate investment trusts; depositary receipts; and other securities with equity characteristics.
Non-U.S. Investments
The Funds may invest in securities of non-U.S. issuers. The Funds will classify an issuer of a security as being a U.S. or non-U.S. issuer based on the determination of an unaffiliated, recognized financial data provider. Such determinations are based on a number of criteria, such as the issuer’s country of domicile, the primary exchange on which the security trades, the location from which the majority of the issuer’s revenue comes, and the issuer’s reporting currency.
Nuveen Santa Barbara Global Dividend Growth Fund and Nuveen Santa Barbara International Dividend Growth Fund may invest in issuers located in emerging markets as a principal strategy. Emerging market countries include any country other than Canada, the United States and the countries comprising the MSCI EAFE® Index (currently, Australia, Austria, Belgium,
Section 2 How We Manage Your Money
19
Denmark, Finland, France, Germany, Hong Kong, Ireland, Israel, Italy, Japan, the Netherlands, New Zealand, Norway, Portugal, Singapore, Spain, Sweden, Switzerland and the United Kingdom).
Preferred Securities
The Funds may invest in preferred securities. Preferred securities, which generally pay fixed or adjustable rate dividends or interest to investors, have preference over common stock in the payment of dividends or interest and the liquidation of a company’s assets, which means that a company typically must pay dividends or interest on its preferred securities before paying any dividends on its common stock. On the other hand, preferred securities are junior to most other forms of the company’s debt, including both senior and subordinated debt. Because of their subordinated position in the capital structure of an issuer, the ability to defer dividend or interest payments for extended periods of time without triggering an event of default for the issuer, and certain other features, preferred securities are often treated as equity-like instruments by both issuers and investors, as their quality and value are heavily dependent on the profitability and cash flows of the issuer rather than on any legal claims to specific assets.
Cash Equivalents and Short-Term Investments
As a non-principal investment strategy, the Funds may invest in cash and in U.S. dollar-denominated high-quality money market instruments and other short-term securities, including money market funds, in such proportions as warranted by prevailing market conditions and the Funds’ principal investment strategies. The Funds may temporarily invest without limit in such holdings for liquidity purposes, or in an attempt to respond to adverse market, economic, political or other conditions. Being invested in these securities may keep a Fund from participating in a market upswing and prevent a Fund from achieving its investment objective.
Investment Companies and Other Pooled Investment Vehicles
As a non-principal investment strategy, the Funds may invest in securities of other open-end or closed-end investment companies, including exchange-traded funds (“ETFs”), that invest primarily in securities of the types in which the Funds may invest directly. In addition, the Funds may invest a portion of their assets in pooled investment vehicles (other than investment companies) that invest primarily in securities of the types in which the Funds may invest directly.
An ETF is an investment company that holds a portfolio of securities generally designed to track the performance of a securities index, including industry, sector, country and region indexes. ETFs trade on a securities exchange and their shares may, at times, trade at a premium or discount to their net asset value.
As a shareholder in an investment company or other pooled investment vehicle, the Funds will bear their ratable share of that vehicle’s expenses, and would remain subject to payment of the Funds’ advisory and administrative fees with respect to assets so invested. Shareholders would therefore be subject to duplicative expenses to the extent the Funds invest in an investment company or other pooled investment vehicle. In addition, the Funds will incur brokerage costs when purchasing and selling shares of ETFs. Securities of investment companies or other pooled investment vehicles may be leveraged, in which case the value and/or yield of such securities will tend to be more volatile than securities of unleveraged vehicles.
20
Section 2 How We Manage Your Money
Generally, investments in other investment companies (including ETFs) are subject to statutory limitations prescribed by the Investment Company Act of 1940, as amended (the “1940 Act”). These limitations include a prohibition on a Fund acquiring more than 3% of the voting shares of any other investment company, and a prohibition on investing more than 5% of the Fund’s total assets in the securities of any one investment company or more than 10% of its total assets, in the aggregate, in investment company securities. Many ETFs, however, have obtained exemptive relief from the Securities and Exchange Commission to permit unaffiliated funds to invest in the ETFs’ shares beyond these statutory limitations, subject to certain conditions and pursuant to a contractual arrangement between the ETFs and the investing Fund. The Funds may rely on these exemptive orders in order to invest in unaffiliated ETFs beyond the foregoing statutory limitations. Subject to certain conditions, a Fund also may invest in money market funds beyond the statutory limits described above.
Disclosure of Portfolio Holdings
A description of the Funds’ policies and procedures with respect to the disclosure of the Funds’ portfolio holdings is available in the Funds’ statement of additional information. A list of each Fund’s portfolio holdings is available on the Funds’ website—www.nuveen.com/mf—by navigating to your Fund using the “Mutual Fund Finder” and clicking on the “Holdings & Detail” tab. By following these links, you can obtain a list of your Fund’s top ten holdings as of the end of the most recent month. A complete list of portfolio holdings information is generally made available on the Funds’ website ten business days after the end of the month. This information will remain available on the website until the Funds file with the Securities and Exchange Commission their annual, semi-annual or quarterly holdings report for the fiscal period that includes the date(s) as of which the website information is current.

SBAM’s investment philosophy is based on the premise that dividend growth constitutes a significant, and often overlooked, component of long-term total return. SBAM uses a unique investment approach whereby dividend paying companies are viewed and researched from the perspective of a growth manager. SBAM believes that, generally speaking, dividends are a sign of capital discipline, financial well-being and business sustainability and that they are the hallmark of a high-quality company that is suitable for long-term investment.
SBAM is focused on bottom-up fundamental analysis to identify what it believes to be the highest quality companies that meet the investment criteria. While macroeconomic issues are taken into consideration and may have an impact over the short term, they are not a meaningfully important part of SBAM’s investment process given its long term focus. When selecting companies, SBAM evaluates certain factors, including a sound business model, strong overall financial position, earnings growth, return on equity, quality of management, potential for dividend growth, market valuation and the commitment to return cash to shareholders.
For Nuveen Santa Barbara Global Dividend Growth Fund and Nuveen Santa Barbara International Dividend Growth Fund, SBAM also considers individual country factors, including macroeconomic and political risk factors. SBAM also identifies secular global themes which have the potential to drive market earnings growth.
Section 2 How We Manage Your Money
21

Risk is inherent in all investing. Investing in a mutual fund involves risk, including the risk that you may receive little or no return on your investment or even that you may lose part or all of your investment. Therefore, before investing you should consider carefully the principal risks and certain other risks that you assume when you invest in the Funds. See the “Fund Summaries” section for a description of the principal risks of investing in a particular Fund. Additional information about these risks is listed alphabetically below. Because of these risks, you should consider an investment in the Funds to be a long-term investment.
Principal Risks
Active management risk: The funds’ sub-adviser actively manages each fund’s investments. Consequently, the funds are subject to the risk that the investment techniques and risk analyses employed by the funds’ sub-adviser may not produce the desired results. This could cause a fund to lose value or its investment results to lag relevant benchmarks or other funds with similar objectives. Additionally, legislative, regulatory or tax developments may affect the investment techniques available to the funds’ sub-adviser in connection with managing a fund and may also adversely affect the ability of a fund to achieve its investment goal.
Currency risk: Changes in currency exchange rates will affect the value of non-U.S. dollar denominated securities, the value of dividends and interest earned from such securities, and gains and losses realized on the sale of such securities, and hence will affect the net asset value of a fund that invests in such securities. A strong U.S. dollar relative to these other currencies will adversely affect the value of a fund to the extent it invests in such non-U.S. dollar denominated securities. Even though the non-U.S. securities held by Nuveen Santa Barbara Dividend Growth Fund are traded in U.S. dollars, their prices are typically indirectly influenced by currency fluctuations.
Cybersecurity risk: Intentional cybersecurity breaches include: unauthorized access to systems, networks or devices (such as through “hacking” activity); infection from computer viruses or other malicious software code; and attacks that shut down, disable, slow, or otherwise disrupt operations, business processes, or website access or functionality. In addition, unintentional incidents can occur, such as the inadvertent release of confidential information (possibly resulting in the violation of applicable privacy laws).
A cybersecurity breach could result in the loss or theft of customer data or funds, the inability to access electronic systems (“denial of services”), loss or theft of proprietary information or corporate data, physical damage to a computer or network system, or costs associated with system repairs. Such incidents could cause a fund, a fund’s adviser or sub-adviser, a financial intermediary, or other service providers to incur regulatory penalties, reputational damage, additional compliance costs or financial loss. In addition, such incidents could affect issuers in which a fund invests, and thereby cause the fund’s investments to lose value.
Dividend-paying security risk: A fund’s investment in dividend-paying stocks could cause the fund to underperform similar funds that invest without consideration of a company’s track record of paying dividends. Stocks of companies with a history of paying dividends may not participate in a broad market advance to the same degree as most other stocks, and a sharp rise in
22
Section 2 How We Manage Your Money
interest rates or economic downturn could cause a company to unexpectedly reduce or eliminate its dividend.
Equity security risk: Equity securities in a fund’s portfolio may decline significantly in price over short or extended periods of time. Price changes may occur in the market as a whole, or they may occur in only a particular country, company, industry, or sector of the market. Given the funds’ focus on dividend-paying securities, the funds may, from time to time, have a greater exposure to higher dividend-yield sectors and industries than the broad equity market which would make the fund more vulnerable to adverse developments affecting such sectors or industries.
Growth stock risk: The growth stocks in which a fund invests tend to be more volatile than certain other types of stocks and their prices usually fluctuate more dramatically than the overall stock market. A stock with growth characteristics can have sharp price declines due to decreases in current earnings or the failure to meet expected earnings and may lack dividends that can help cushion its share price in a declining market.
Non-U.S./emerging markets risk: Non-U.S. issuers or U.S. issuers with significant non-U.S. operations may be subject to risks in addition to or different than those of issuers that are located in or principally operated in the United States due to political, social and economic developments abroad, different regulatory environments and laws, potential seizure by the government of company assets, higher taxation, withholding taxes on dividends and interest and limitations on the use or transfer of portfolio assets.
To the extent a fund invests in depositary receipts, the fund will be subject to many of the same risks as when investing directly in non-U.S. securities. The holder of an unsponsored depositary receipt may have limited voting rights and may not receive as much information about the issuer of the underlying securities as would the holder of a sponsored depositary receipt.
Other non-U.S. investment risks include the following:
| | • | | Enforcing legal rights may be difficult, costly and slow in non-U.S. countries, and there may be special problems enforcing claims against non-U.S. governments. |
| | • | | Non-U.S. companies may not be subject to accounting standards or governmental supervision comparable to U.S. companies, and there may be less public information about their operations. |
| | • | | Non-U.S. markets may be less liquid and more volatile than U.S. markets. |
| | • | | The U.S. and non-U.S. markets often rise and fall at different times or by different amounts due to economic or other developments particular to a given country or region. This phenomenon would tend to lower the overall price volatility of a portfolio that included both U.S. and non-U.S. securities. Sometimes, however, global trends will cause the U.S. and non-U.S. markets to move in the same direction, reducing or eliminating the risk reduction benefit of international investing. |
| | • | | Non-U.S. securities traded on foreign exchanges, particularly in emerging markets countries, may be subject to further risks due to the inexperience of local investment professionals and financial institutions, the possibility of permanent or temporary termination of trading, and greater spreads between bid and asked prices for securities. In addition, non-U.S. exchanges and investment |
Section 2 How We Manage Your Money
23
| | professionals are subject to less governmental regulation, and commissions may be higher than in the United States. Also, there may be delays in the settlement of non-U.S. exchange transactions. |
| | • | | A fund’s income from non-U.S. issuers may be subject to non-U.S. withholding taxes. In some countries, the fund also may be subject to taxes on trading profits and, on certain securities transactions, transfer or stamp duties tax. To the extent non-U.S. income taxes are paid by the fund, U.S. shareholders may be entitled to a credit or deduction for U.S. tax purposes. |
| | • | | Some countries, particularly in emerging markets, restrict to varying degrees foreign investment in their securities markets. In some circumstances, these restrictions may limit or preclude investment in certain countries or may increase the cost of investing in securities of particular companies. |
| | • | | Emerging markets generally do not have the level of market efficiency and strict standards in accounting and securities regulation to be on par with advanced economies. Investments in emerging markets come with much greater risk due to political instability, domestic infrastructure problems and currency volatility. |
Preferred security risk: There are special risks associated with investing in preferred securities:
Limited voting rights. Generally, preferred security holders have no voting rights with respect to the issuing company unless preferred dividends have been in arrears for a specified number of periods, at which time the preferred security holders may elect a number of directors to the issuer’s board. Generally, once all the arrearages have been paid, the preferred security holders no longer have voting rights.
In the case of certain preferred securities issued by trusts or special purpose entities, holders generally have no voting rights except if a declaration of default occurs and is continuing. In such an event, preferred security holders generally would have the right to appoint and authorize a trustee to enforce the trust’s or special purpose entity’s rights as a creditor under the agreement with its operating company.
Special redemption rights. In certain circumstances, an issuer of preferred securities may redeem the securities prior to their stated maturity date. For instance, for certain types of preferred securities, a redemption may be triggered by a change in federal income tax or securities laws or by regulatory or major corporate action. As with call provisions, a redemption by the issuer may negatively impact the return of the security held by a fund.
Payment deferral. Generally, preferred securities may be subject to provisions that allow an issuer, under certain conditions, to skip (“non-cumulative” preferred securities) or defer (“cumulative” preferred securities) distributions without any adverse consequences to the issuer. Non-cumulative preferred securities can skip distributions indefinitely. Cumulative preferred securities typically contain provisions that allow an issuer, at its discretion, to defer distributions payments for up to 10 years. If a fund owns a preferred security that is deferring its distribution, the fund may be required to report income for tax purposes although it has not yet received such income. In addition, recent changes in bank regulations may increase the likelihood of issuers deferring or skipping distributions.
24
Section 2 How We Manage Your Money
Subordination. Preferred securities generally are subordinated to bonds and other debt instruments in a company’s capital structure and therefore are subject to greater credit risk than those debt instruments.
Floating Rate Payments. The dividend or interest rates on preferred securities may be floating, or convert from fixed to floating at a specified future time. The market value of floating rate securities may fall in a declining interest rate environment and may also fall in a rising interest rate environment if there is a lag between the rise in interest rates and the reset. This risk may also be present with respect to fixed rate securities that will convert to a floating rate at a future time. A secondary risk associated with declining interest rates is the risk that income earned by a fund on floating rate securities may decline due to lower coupon payments on the floating-rate securities.
Liquidity. Preferred securities may be substantially less liquid than many other securities, such as U.S. government securities or common stock. Less liquid securities involve the risk that the securities will not be able to be sold at the time desired by a fund or at prices approximating the values at which a fund is carrying the securities on its books.
Financial services industry. The preferred securities market is comprised predominately of securities issued by companies in the financial services industry. Therefore, preferred securities present substantially increased risks at times of financial turmoil, which could affect financial services companies more than companies in other sectors and industries.
Tax risk. A fund may invest in preferred securities or other securities the federal income tax treatment of which may not be clear or may be subject to recharacterization by the Internal Revenue Service. It could be more difficult for a fund to comply with the tax requirements applicable to regulated investment companies if the tax characterization of the fund’s investments or the tax treatment of the income from such investments were successfully challenged by the Internal Revenue Service.
Regulatory risk. Issuers of preferred securities may be in industries that are heavily regulated and that may receive government funding. The value of preferred securities issued by these companies may be affected by changes in government policy, such as increased regulation, ownership restrictions, deregulation or reduced government funding.
Smaller company risk: Stocks of small-cap companies involve substantial risk. These companies may lack the management expertise, product diversification, and competitive strengths of larger companies. They may have limited access to financial resources and may not have the financial strength to sustain them through business downturns or adverse market conditions. Since small-cap companies typically reinvest a high proportion of their earnings in their business, they may not pay dividends for some time, particularly if they are newer companies. Prices of small-cap stocks may be subject to more abrupt or erratic movements than stock prices of larger, more established companies or the market averages in general. In addition, the frequency and volume of their trading may be less than is typical of larger companies, making them subject to wider price fluctuations. In some cases, there could be difficulties in selling the stocks of small-cap companies at the desired time and price, especially in situations of increased market volatility where a fund may experience high levels of shareholder redemptions. Stocks at the bottom end of the capitalization range of small-cap companies sometimes are referred to as “micro-cap” stocks. These
Section 2 How We Manage Your Money
25
stocks may be subject to extreme price volatility, as well as limited liquidity and limited research. While mid-cap stocks may be slightly less volatile than small-cap stocks, they still involve similar risks.
Non-Principal Risks
Global economic risk: Global economies and financial markets are becoming increasingly interconnected, which increases the possibilities that conditions in one country, region or market might adversely impact issuers in a different country, region or market. Changes in legal, political, regulatory, tax and economic conditions may cause fluctuations in markets and securities prices around the world, which could negatively impact the value of a fund’s investments. For example, the United Kingdom’s referendum to leave the European Union resulted in the depreciation in value of the British pound, short term declines in the stock markets and ongoing economic and political uncertainty concerning the consequences of the exit. Similar major economic or political disruptions, particularly in large economies like China’s, may have global negative economic and market repercussions. Additionally, geopolitical events, such as war, terrorism, natural and environmental disasters, and market manipulation, may disrupt securities markets and adversely affect global economics and markets. Examples of such events include recent hurricanes in the Caribbean Sea and southern United States and heightened concerns regarding North Korea’s nuclear weapons and long-range ballistic missile programs. Governmental and quasi-governmental authorities and regulators throughout the world have responded to turmoil with a variety of significant fiscal and monetary policy changes, including but not limited to, direct capital infusions into companies, new monetary programs and dramatically lower interest rates. An unexpected or quick reversal of these policies, or if these policies are ineffective, could increase volatility in securities markets, which could adversely affect a fund’s investments.
Large transactions risk: A fund may experience adverse effects due to large purchases or redemptions of fund shares. A large redemption by an individual shareholder, or an increase in redemptions generally by fund shareholders, may cause a fund to sell portfolio securities at times when it would not otherwise do so, which may negatively impact the fund’s net asset value and liquidity. If a fund has difficulty selling portfolio securities in a timely manner to meet redemption requests, the fund may have to borrow money to do so. In such an instance, a fund’s remaining shareholders would bear the costs of such borrowings, and such costs could reduce the fund’s returns. In addition, until a fund is able to sell securities to meet redemption requests, the fund’s market exposure may be greater than it ordinarily would be, which would magnify the impact of any market movements on the fund’s performance. Similarly, large fund share purchases may adversely affect a fund’s performance to the extent that the fund is delayed in investing new cash and is required to maintain a larger cash position than it ordinarily would, reducing the fund’s market exposure. Increased redemption activity may also result in unexpected taxable distributions to shareholders if such sales of investments resulted in gains and thereby accelerated the realization of taxable income. In addition, large redemptions could result in a fund’s current expenses being allocated over a smaller asset base, leading to an increase in the fund’s expense ratio.
26
Section 2 How We Manage Your Money
Section 3 How You Can Buy and Sell Shares
The Funds offer multiple classes of shares, each with a different combination of sales charges, fees, eligibility requirements and other features. Your financial advisor can help you determine which class is best for you. For further details, please see the statement of additional information. Because the prospectus and the statement of additional information are available free of charge on Nuveen’s website at www.nuveen.com, we do not disclose the following share class information separately on the website.

The different share classes offered by the Funds are described below. You will pay up-front or contingent deferred sales charges on some of these share classes. In addition, some share classes are subject to annual distribution and/or service fees in the amounts described below, which are paid out of a Fund’s assets. These fees are paid to Nuveen Securities, LLC (the “Distributor”), a subsidiary of Nuveen, LLC and the distributor of the Funds, and are used primarily for providing compensation to financial intermediaries in connection with the distribution of Fund shares and for providing ongoing account services to shareholders. The Funds have adopted a distribution and service plan under Rule 12b-1 under the 1940 Act that allows each Fund to pay these distribution and service fees. More information on this plan can be found under “Distribution and Service Payments—Distribution and Service Plan.” Because fees paid under the plan are paid out of a Fund’s assets on an ongoing basis, over time these fees will increase the cost of your investment and may cost you more than paying other types of sales charges.
Class A Shares
You can purchase Class A shares at the offering price, which is the net asset value per share plus an up-front sales charge. You may qualify for a reduced sales charge, or the sales charge may be waived, as described in “How to Reduce Your Sales Charge.” Class A shares are also subject to an annual service fee of 0.25% of your Fund’s average daily net assets, which compensates your financial advisor or other financial intermediary for providing ongoing service to you. The Distributor retains the service fee on accounts with no financial intermediary of record. The up-front Class A sales charges for the Funds are as follows:
| | | | | | | | | | | | |
| Amount of Purchase | | Sales Charge as
% of Public
Offering Price | | | Sales Charge as %
of Net Amount
Invested | | | Maximum
Financial Intermediary
Commission as % of
Public Offering Price | |
| Less than $50,000 | | | 5.75 | % | | | 6.10 | % | | | 5.00 | % |
| $50,000 but less than $100,000 | | | 4.50 | | | | 4.71 | | | | 4.00 | |
| $100,000 but less than $250,000 | | | 3.75 | | | | 3.90 | | | | 3.25 | |
| $250,000 but less than $500,000 | | | 2.75 | | | | 2.83 | | | | 2.50 | |
| $500,000 but less than $1,000,000 | | | 2.00 | | | | 2.04 | | | | 1.75 | |
| $1,000,000 and over* | | | — | | | | — | | | | 1.00 | |
| | * | You can purchase $1 million or more of Class A shares at net asset value without an up-front sales charge. The Distributor pays financial intermediaries of record at a rate of 1.00% of the first $2.5 million, plus 0.75% of the next $2.5 million, plus 0.50% of the amount over $5 million, which includes an advance of the first year’s service fee. Unless you are eligible for a waiver, you may be assessed a contingent deferred sales charge (“CDSC”) of 1.00% if you redeem any of your shares within 18 months of purchase. See “Contingent Deferred Sales Charges” below for information concerning the CDSC and “How to Reduce Your Sales Charge—CDSC Waivers and Reductions” below for information concerning CDSC waivers and reductions. |
Section 3 How You Can Buy and Sell Shares
27
Investors may purchase Class A shares only for Fund accounts held with a financial advisor or other financial intermediary, and not directly with a Fund. In addition, Class A shares may not be available through certain financial intermediaries. Please consult with your financial intermediary to determine whether their policies allow for an investment in Class A shares.
Class C Shares
You can purchase Class C shares at the offering price, which is the net asset value per share without any up-front sales charge. Class C shares are subject to annual distribution and service fees of 1.00% of your Fund’s average daily net assets. The annual 0.25% service fee compensates your financial advisor or other financial intermediary for providing ongoing service to you. The annual 0.75% distribution fee compensates the Distributor for paying your financial advisor or other financial intermediary an ongoing sales commission as well as an advance of the first year’s service and distribution fees. The Distributor retains the service and distribution fees on accounts with no financial intermediary of record. If you redeem your shares within 12 months of purchase, you will normally pay a 1.00% CDSC, which is calculated on the lower of your purchase price or redemption proceeds. You do not pay a CDSC on any Class C shares you purchase by reinvesting dividends. You may qualify for a reduced CDSC, or the CDSC may be waived, as described in “How to Reduce Your Sales Charge” below.
Investors purchasing Class C shares should consider whether they would qualify for a reduced or eliminated sales charge on Class A shares that would make purchasing Class A shares a better choice. Class A share sales charges can be reduced or eliminated based on the size of the purchase, or pursuant to a letter of intent or rights of accumulation. See “How to Reduce Your Sales Charge” below.
Class C share purchase orders equaling or exceeding $1,000,000 will not be accepted. In addition, the Funds limit the cumulative amount of Class C shares that may be purchased by a single purchaser. Your financial intermediary may set lower maximum purchase limits for Class C shares. See the statement of additional information for more information.
Investors may purchase Class C shares only for Fund accounts held with a financial advisor or other financial intermediary, and not directly with a Fund. In addition, Class C shares may not be available through certain financial intermediaries. Please consult with your financial intermediary to determine whether their policies allow for an investment in Class C shares.
Class R3 Shares
You can purchase Class R3 shares at the offering price, which is the net asset value per share without any up-front sales charge. Class R3 shares are subject to annual distribution and service fees of 0.50% of your Fund’s average daily net assets.
Investors may purchase Class R3 shares only for Fund accounts held with a financial advisor or other financial intermediary, and not directly with a Fund.
Class R3 shares are only available for purchase by eligible retirement plans. Class R3 shares are not available to traditional and Roth IRAs, Coverdell Education Savings Accounts, SEPs, SAR-SEPs, SIMPLE IRAs or individual 403(b) plans. See the statement of additional information for more information.
Class R6 Shares
Eligible investors can purchase Class R6 shares at the offering price, which is the net asset value per share without any up-front sales charge. As Class R6
28
Section 3 How You Can Buy and Sell Shares
shares are not subject to sales charges or ongoing service or distribution fees, they have lower ongoing expenses than the other classes.
Class R6 shares are available to certain qualified retirement plans and other investors. There is no minimum initial investment for qualified retirement plans; however, the shares must be held through plan-level or omnibus accounts held on the books of a Fund. Class R6 shares are also available for purchase by clients of financial intermediaries who charge such clients an ongoing fee for advisory, investment, consulting or related services. Such clients may include individuals, corporations, endowments and foundations. The minimum initial investment for such clients is $100,000, but this minimum will be waived for clients of financial intermediaries that have accounts holding Class R6 shares with an aggregate value of at least $100,000. The Distributor may also waive the minimum for clients of financial intermediaries anticipated to reach this Class R6 share holdings level. All other eligible investors must meet a minimum initial investment of at least $1 million in a Fund. Such minimum investment requirement may be applied collectively to affiliated accounts, in the discretion of the Distributor. Class R6 shares may be purchased through financial intermediaries only if such intermediaries have entered into an agreement with the Distributor to offer Class R6 shares. Class R6 shares are only available in cases where neither the investor nor the intermediary will receive any commission payments, account servicing fees, record keeping fees, 12b-1 fees, sub-transfer agent fees, so called “finder’s fees,” administration fees or similar fees with respect to Class R6 shares. Provided they meet the minimum investment and other eligibility requirements, eligible investors include:
| | • | | Qualified retirement plans; |
| | • | | Foundations and endowment funds; |
| | • | | Any state, county, or city, or its instrumentality, department, authority or agency; |
| | • | | 457 plans, including 457(b) governmental entity plans and tax exempt plans; |
| | • | | Omnibus or other pooled accounts registered to insurance companies, trust companies, bank trust departments, registered investment advisor firms and family offices; |
| | • | | Investment companies, both affiliated and not affiliated with Nuveen Fund Advisors; |
| | • | | Corporations, including corporate non-qualified deferred compensation plans of such corporations; |
| | • | | Collective investment trusts; |
| | • | | Discretionary accounts managed by Nuveen Fund Advisors or its affiliates; and |
| | • | | 529 savings plans held in plan-level omnibus accounts. |
Class R6 shares are not available directly to traditional or Roth IRAs, Coverdell Savings Accounts, Keoghs, SEPs, SARSEPs, or SIMPLE IRAs.
Only Nuveen Santa Barbara Dividend Growth Fund issues Class R6 shares.
Class I Shares
You can purchase Class I shares at the offering price, which is the net asset value per share without any up-front sales charge. As Class I shares are not subject to sales charges or ongoing service or distribution fees, they have lower ongoing expenses than the other classes.
Section 3 How You Can Buy and Sell Shares
29
Class I shares are available for purchase by clients of financial intermediaries who charge such clients an ongoing fee for advisory, investment, consulting or related services. Such clients may include individuals, corporations, endowments and foundations. The minimum initial investment for such clients is $100,000, but this minimum will be lowered to $250 for clients of financial intermediaries that have accounts holding Class I shares with an aggregate value of at least $100,000. The Distributor may also lower the minimum to $250 for clients of financial intermediaries anticipated to reach this Class I share holdings level.
Class I shares are also available for purchase by family offices and their clients. A family office is a company that provides certain financial and other services to a high net worth family or families. The minimum initial investment for family offices and their clients is $100,000, but this minimum will be lowered to $250 for clients of family offices that have accounts holding Class I shares with an aggregate value of at least $100,000. The Distributor may also lower the minimum to $250 for clients of family offices anticipated to reach this Class I share holdings level.
Class I shares are also available for purchase, with no minimum initial investment, by the following categories of investors:
| | • | | Certain employer-sponsored retirement plans. |
| | • | | Certain bank or broker-affiliated trust departments. |
| | • | | Advisory accounts of Nuveen Fund Advisors and its affiliates. |
| | • | | Current and former trustees/directors of any Nuveen Fund, and their immediate family members (as defined in the statement of additional information). |
| | • | | Officers of Nuveen, LLC and its affiliates, and their immediate family members. |
| | • | | Full-time and retired employees of Nuveen, LLC and its affiliates, and their immediate family members. |
| | • | | Certain financial intermediary personnel, and their immediate family members. |
| | • | | Certain other institutional investors described in the statement of additional information. |
Class T Shares
You can purchase Class T shares at the offering price, which is the net asset value per share plus an up-front sales charge. Class T shares are also subject to an annual service fee of 0.25% of the Fund’s average daily net assets, which compensates your financial advisor or other financial intermediary for providing ongoing service to you. The Distributor retains the service fee on accounts with no financial intermediary of record. The up-front Class T sales charges for a Fund are as follows:
| | | | | | | | | | | | |
| Amount of Purchase | | Sales Charge as
% of Public
Offering Price | | | Sales Charge as %
of Net Amount
Invested | | | Maximum
Financial Intermediary
Commission as % of
Public Offering Price | |
| Less than $250,000 | | | 2.50 | % | | | 2.56 | % | | | 2.50 | % |
| $250,000 but less than $500,000 | | | 2.00 | | | | 2.04 | | | | 2.00 | |
| $500,000 but less than $1,000,000 | | | 1.50 | | | | 1.52 | | | | 1.50 | |
| $1,000,000 and over | | | 1.00 | | | | 1.01 | | | | 1.00 | |
Class T shares purchased through the reinvestment of dividends and capital gain distributions from the same Fund are not subject to a sales charge. In
30
Section 3 How You Can Buy and Sell Shares
addition, Class T shares may be available at net asset value without a sales charge under certain other circumstances, as determined by the policies and procedures of your financial intermediary. See the appendix to this Prospectus, “Variations in Sales Charge Reductions and Waivers Available Through Certain Intermediaries,” for information on available Class T share sales charge waivers.
Investors may purchase Class T shares only for Fund accounts held with a financial advisor or other financial intermediary, and not directly with a Fund. In addition, Class T shares may not be available through certain financial intermediaries. Please consult with your financial intermediary to determine whether their policies allow for an investment in Class T shares.
Please refer to the statement of additional information for more information about Class A, Class C, Class R3, Class R6, Class I and Class T shares, including more detailed program descriptions and eligibility requirements. Additional information is also available from your financial advisor, who can also help you prepare any necessary application forms.
Contingent Deferred Sales Charges
If you redeem Class A or Class C shares that are subject to a CDSC, you may be assessed a CDSC upon redemption. When you redeem Class A or Class C shares subject to a CDSC, your Fund will first redeem any shares that are not subject to a CDSC, and then redeem the shares you have owned for the longest period of time, unless you ask the Fund to redeem your shares in a different order. No CDSC is imposed on shares you buy through the reinvestment of dividends and capital gains. The CDSC holding period is calculated on a monthly basis and begins on the first day of the month in which the purchase was made. When you redeem shares subject to a CDSC, the CDSC is calculated on the lower of your purchase price or redemption proceeds, deducted from your redemption proceeds, and paid to the Distributor. The CDSC may be waived under certain special circumstances as described below under “How You Can Buy and Sell Shares—How to Reduce Your Sales Charge—CDSC Waivers and Reductions,” in the appendix to this prospectus titled “Variations in Sales Charge Reductions and Waivers Available Through Certain Intermediaries,” and in the statement of additional information.

The Funds offer a number of ways to reduce or eliminate the up-front sales charge on Class A shares. In addition, under certain circumstances, the Funds will waive or reduce the CDSC imposed on redemptions of Class C shares and certain Class A shares purchased at net asset value. The availability of the sales charge reductions and waivers discussed below will depend on the policies of the financial intermediary through which you purchase your shares. Information on intermediaries’ variations from the reductions and waivers discussed below are disclosed in the appendix to this prospectus, “Variations in Sales Charge Reductions and Waivers Available Through Certain Intermediaries.” In all instances, it is your responsibility to notify your financial intermediary at the time of purchase of any relationship or other facts qualifying you for sales charge waivers or discounts. In order to obtain waivers and discounts that are not available through your intermediary, you will have to purchase Fund shares through another intermediary.
Section 3 How You Can Buy and Sell Shares
31
Class A Sales Charge Reductions
| | • | | Rights of Accumulation. In calculating the appropriate sales charge on a purchase of Class A shares of a Fund, you may be able to add the amount of your purchase to the value, based on the current net asset value per share, of all of your prior purchases of any Nuveen Mutual Fund. |
| | • | | Letter of Intent. Subject to certain requirements, you may purchase Class A shares of a Fund at the sales charge rate applicable to the total amount of the purchases you intend to make over a 13-month period. |
For purposes of calculating the appropriate sales charge as described under Rights of Accumulation and Letter of Intent above, you may include purchases by (i) you, (ii) your spouse or domestic partner and children under the age of 21 years, and (iii) a corporation, partnership or sole proprietorship that is 100% owned by any of the persons in (i) or (ii). In addition, a trustee or other fiduciary can count all shares purchased for a single trust, estate or other single fiduciary account that has multiple accounts (including one or more employee benefit plans of the same employer).
Class A Sales Charge Waivers
Class A shares of a Fund may be purchased at net asset value without a sales charge as follows:
| | • | | Purchases of $1,000,000 or more (although such purchases may be subject to a CDSC in certain circumstances, see “What Share Classes We Offer—Contingent Deferred Sales Charges” above). |
| | • | | Shares purchased through the reinvestment of Nuveen Mutual Fund dividends and capital gain distributions. |
| | • | | Shares purchased for accounts held directly with a Fund that do not have a financial intermediary of record. |
| | • | | Certain employer-sponsored retirement plans. Purchases by employer-sponsored retirement plans (“ESRPs”) as defined below, except that, in the case of ESRPs held through a brokerage account, Class A shares will be available at net asset value without a sales charge only if the broker-dealer has entered into an agreement with the Distributor that allows for such purchases. Intermediaries that have entered into such an agreement are listed in the appendix to this prospectus, “Variations in Sales Charge Reductions and Waivers Available Through Certain Intermediaries.” |
For this purpose, ESRPs include, but are not limited to, 401(k) plans, 457 plans, employer-sponsored 403(b) plans, profit sharing and money purchase pension plans, health savings accounts, defined benefit plans, participant directed non-qualified deferred compensation plans, Roth 401(k) plans and Roth 403(b) plans, and do not include SEPs, SAR-SEPs, SIMPLE IRAs (other than SIMPLE IRAs opened before January 1, 2011 where the Distributor is the broker of record), SIMPLE 401(k) plans, Solo 401(k) plans, KEOGH plans, non-qualified deferred compensation plans and single defined benefit plans.
| | • | | Employees of Nuveen, LLC and its affiliates. Purchases by current and retired employees of Nuveen, LLC and its affiliates and such employees’ immediate family members (as defined in the statement of additional information). |
32
Section 3 How You Can Buy and Sell Shares
| | • | | Current and former trustees/directors of the Nuveen Funds. |
| | • | | Financial intermediary personnel. Purchases by any person who, for at least the last 90 days, has been an officer, director, or employee of any financial intermediary or any such person’s immediate family member. |
| | • | | Certain trust departments. Purchases by bank or broker-affiliated trust departments investing funds over which they exercise exclusive discretionary investment authority and that are held in a fiduciary, agency, advisory, custodial or similar capacity. |
| | • | | Additional categories of investors. Purchases made (i) by investors purchasing on a periodic fee, asset-based fee or no transaction fee basis through a broker-dealer sponsored mutual fund purchase program; (ii) by clients of investment advisers, financial planners or other financial intermediaries that charge periodic or asset-based fees for their services; and (iii) through a financial intermediary that has entered into an agreement with the Distributor to offer the Funds’ shares to self-directed investment brokerage accounts and that may or may not charge a transaction fee to its customers. Intermediaries that have entered into such an agreement are listed in the appendix to this prospectus, “Variations in Sales Charge Reductions and Waivers Available Through Certain Intermediaries.” |
In order to obtain a sales charge reduction or waiver on Class A share purchases, it may be necessary at the time of purchase for you to inform the Funds or your financial advisor of the existence of other accounts in which there are holdings eligible to be aggregated for such purposes. You may need to provide the Funds or your financial advisor information or records, such as account statements, in order to verify your eligibility for a sales charge reduction or waiver. This may include account statements of family members and information regarding Nuveen Mutual Fund shares held in accounts with other financial advisors. You or your financial advisor must notify the Distributor at the time of each purchase if you are eligible for any of these programs. The Funds may modify or discontinue these programs at any time.
CDSC Waivers and Reductions
The CDSC payable upon the redemption of Class C shares, and on Class A shares that were purchased at net asset value without a sales charge because the purchase amount exceeded $1 million, may be waived or reduced under certain circumstances, including the following:
| | • | | In the event of total disability of the shareholder. |
| | • | | In the event of death of the shareholder. |
| | • | | For certain redemptions made pursuant to a systematic withdrawal plan. |
| | • | | For redemptions in connection with a payment of account or plan fees. |
| | • | | For redemptions of accounts not meeting required minimum balances. |
| | • | | Upon an optional conversion by a Fund of Class C shares held in an account which no longer has a financial intermediary of record into Class A shares. |
| | • | | For redemptions of Class C shares where the Distributor did not advance the first year’s service and distribution fees to the intermediary. |
| | • | | For redemptions of Class A shares where the Distributor did not pay a sales charge to the intermediary when the shares were purchased. |
Section 3 How You Can Buy and Sell Shares
33
| | • | | For certain redemptions of shares held by an employer-sponsored qualified defined contribution plan. |
| | • | | For certain redemptions of shares held in an IRA account, including redemptions to satisfy required minimum distributions from the account after age 70 1⁄2. |
More information on these and other available CDSC waivers and reductions can be found in the appendix to this prospectus, “Variations in Sales Charge Reductions and Waivers Available Through Certain Intermediaries,” and in the statement of additional information.

Fund shares may be purchased on any business day, which is any day the New York Stock Exchange (the “NYSE”) is open for business. Generally, the NYSE is closed on weekends and national holidays. The share price you pay depends on when the Distributor receives your order and on the share class you are purchasing. Orders received before the close of trading on a business day (normally, 4:00 p.m. New York time) will receive that day’s closing share price; otherwise, you will receive the next business day’s price.
You may purchase Fund shares (1) through a financial advisor or other financial intermediary or (2) directly from the Funds. Class A, Class C and Class T shares may not be purchased directly from a Fund. In addition, the availability of Class A, Class C and Class T shares through a financial intermediary will depend on the policies of the intermediary.
Through a Financial Advisor
You may buy shares through your financial advisor, who can handle all the details for you, including opening a new account. Financial advisors can also help you review your financial needs and formulate long-term investment goals and objectives. In addition, financial advisors generally can help you develop a customized financial plan, select investments and monitor and review your portfolio on an ongoing basis to help assure your investments continue to meet your needs as circumstances change. Financial advisors (including brokers or agents) are paid for providing ongoing investment advice and services, either from Fund sales charges and fees or by charging you a separate fee in lieu of a sales charge.
Financial advisors or other dealer firms may charge their customers a processing or service fee in connection with the purchase or redemption of Fund shares. The amount and applicability of such a fee is determined and disclosed to customers by each individual dealer. Processing or service fees typically are fixed, nominal dollar amounts and are in addition to the sales and other charges described in this prospectus and the statement of additional information. Your dealer will provide you with specific information about any processing or service fees you will be charged. Shares you purchase through your financial advisor or other intermediary will normally be held with that firm. For more information, please contact your financial advisor.
Directly from the Funds
Eligible investors may purchase shares directly from the Funds.
| | • | | By wire. You can purchase shares by making a wire transfer from your bank. Before making an initial investment by wire, you must submit a new account form to a Fund. After receiving your form, a service |
34
Section 3 How You Can Buy and Sell Shares
| | representative will contact you with your account number and wiring instructions. Your order will be priced at the next closing share price based on the share class of your Fund, calculated after your Fund’s custodian receives your payment by wire. Wired funds must be received prior to 4:00 p.m. New York time to be eligible for same day pricing. Neither your Fund nor the transfer agent is responsible for the consequences of delays resulting from the banking or Federal Reserve wire system, or from incomplete wiring instructions. Before making any additional purchases by wire, you should call Nuveen Investor Services at (800) 257-8787. You cannot purchase shares by wire on days when federally chartered banks are closed. |
| | • | | By mail. You may open an account directly with the Funds and buy shares by completing an application and mailing it along with your check to: Nuveen Investor Services, P.O. Box 8530, Boston, Massachusetts 02266-8530. Applications may be obtained at www.nuveen.com or by calling (800) 257-8787. No third party checks will be accepted. |
Purchase orders and redemption requests are not processed until received in proper form by the transfer agent of a Fund.
| | • | | On-line. Existing shareholders with direct accounts may process certain account transactions on-line. You may purchase additional shares or exchange shares between existing, identically registered direct accounts. You can also look up your account balance, history and dividend information, as well as order duplicate account statements and tax forms from the Funds’ website. To access your account, click the “Individual Investors” link on www.nuveen.com and then choose “Account Access” under the “Resources” tab. The system will walk you through the log-in process. To purchase shares on-line, you must have established Fund Direct privileges on your account prior to the requested transaction. See “Special Services—Fund Direct” below. |
| | • | | By telephone. Existing shareholders with direct accounts may also process account transactions via the Funds’ automated information line. Simply call (800) 257-8787, press 1 for mutual funds and the voice menu will walk you through the process. To purchase shares by telephone, you must have established Fund Direct privileges on your account prior to the requested transaction. See “Special Services—Fund Direct” below. |

To help make your investing with us easy and efficient, we offer you the following services at no extra cost. Your financial advisor can help you complete the forms for these services, or you can call Nuveen Investor Services at (800) 257-8787 for copies of the necessary forms.
Systematic Investing
Once you have opened an account satisfying the applicable investment minimum, systematic investing allows you to make regular additional investments through automatic deductions from your bank account, directly from your paycheck or from exchanging shares from another mutual fund account. The minimum automatic deduction is $100 per month. There is no charge to participate in your Fund’s systematic investment plan. You can stop the deductions at any time by notifying your Fund in writing.
| | • | | From your bank account. You can make systematic investments of $100 or more per month by authorizing your Fund to draw pre-authorized checks on your bank account. |
Section 3 How You Can Buy and Sell Shares
35
| | • | | From your paycheck. With your employer’s consent, you can make systematic investments each pay period (collectively meeting the monthly minimum of $100) by authorizing your employer to deduct monies from your paycheck. |
| | • | | Systematic exchanging. You can make systematic investments by authorizing the Distributor to exchange shares from one Nuveen Mutual Fund account into another identically registered Nuveen Mutual Fund account of the same share class. |
Your Fund may cancel your participation in its systematic investment plan if it is unable to deliver a current prospectus to you because of an incorrect or invalid mailing address.
Systematic Withdrawal
If the value of your Fund account is at least $10,000, you may request to have $50 or more withdrawn automatically from your account. You may elect to receive payments monthly, quarterly, semi-annually or annually, and may choose to receive a check, have the monies transferred directly into your bank account (see “Fund Direct” below), paid to a third party or sent payable to you at an address other than your address of record. You must complete the appropriate section of the account application or Account Update Form to participate in each Fund’s systematic withdrawal plan.
You should not establish systematic withdrawals if you intend to make concurrent purchases of Class A or Class C shares because you may unnecessarily pay a sales charge or CDSC on these purchases.
Exchanging Shares
You may exchange Fund shares into an identically registered account for the same class of another Nuveen Mutual Fund available in your state, except that there are no exchange privileges for Class T shares. Your exchange must meet the minimum purchase requirements of the fund into which you are exchanging. You may also, under certain limited circumstances, exchange between certain classes of shares of the same fund, subject to the payment of any applicable CDSC. Please consult the statement of additional information for details.
Each Fund reserves the right to revise or suspend the exchange privilege, limit the amount or number of exchanges, or reject any exchange. In the event that a Fund rejects an exchange request, neither the redemption nor the purchase side of the exchange will be processed. If you would like the redemption request to be processed even if the purchase order is rejected, you may submit a separate redemption request (see “How to Sell Shares” below). Shareholders will be provided with at least 60 days’ notice of any material revision to or termination of the exchange privilege.
Because an exchange between funds is treated for tax purposes as a purchase and sale, any gain may be subject to tax. An exchange between classes of shares of the same fund may not be considered a taxable event. You should consult your tax advisor about the tax consequences of exchanging your shares.
Fund DirectSM
The Fund Direct Program allows you to link your Fund account to your bank account, transfer money electronically between these accounts and perform a variety of account transactions, including purchasing shares by telephone and investing through a systematic investment plan. You may also have dividends, distributions, redemption payments or systematic withdrawal plan payments sent directly to your bank account.
36
Section 3 How You Can Buy and Sell Shares
Reinstatement Privilege
If you redeem Fund shares, you may reinvest all or part of your redemption proceeds up to one year later without incurring any additional charges. You may only reinvest into the same share class you redeemed. If you paid a CDSC, any shares purchased pursuant to the reinstatement privilege will not be subject to a CDSC. You may use this reinstatement privilege only once for any redemption.

You may sell (redeem) your shares on any business day, which is any day the NYSE is open for business. You will receive the share price next determined after your Fund has received your properly completed redemption request. Your redemption request must be received before the close of trading (normally, 4:00 p.m. New York time) for you to receive that day’s price. The Fund will normally mail your check the next business day after a redemption request is received, but in no event more than seven days after your request is received. If you are selling shares purchased recently with a check, your redemption proceeds will not be mailed until your check has cleared, which may take up to ten business days from your purchase date.
You may sell your shares (1) through a financial advisor or (2) directly to the Funds.
Through a Financial Advisor
You may sell your shares through your financial advisor, who can prepare the necessary documentation. Your financial advisor may charge for this service.
Directly to the Funds
| | • | | By mail. You can sell your shares at any time by sending a written request to the appropriate Fund, c/o Nuveen Investor Services, P.O. Box 8530, Boston, Massachusetts 02266-8530. Your request must include the following information: |
| | • | | Your name and account number; |
| | • | | The dollar or share amount you wish to redeem; |
| | • | | The signature of each owner exactly as it appears on the account; |
| | • | | The name of the person to whom you want your redemption proceeds paid (if other than to the shareholder of record); |
| | • | | The address where you want your redemption proceeds sent (if other than the address of record); and |
| | • | | Any required signature guarantees. |
After you have established your account, signatures on a written request must be guaranteed if:
| | • | | You would like redemption proceeds payable or sent to any person, address or bank account other than that on record; |
| | • | | You have changed the address on your Fund’s records within the last 30 days; |
| | • | | Your redemption request is in excess of $50,000; or |
| | • | | You are requesting a change in ownership on your account. |
Non-financial transactions, including establishing or modifying certain services such as changing bank information on an account, will require a
Section 3 How You Can Buy and Sell Shares
37
signature guarantee or signature verification from a Medallion Signature Guarantee Program member or other acceptable form of authentication from a financial institution source. In addition to the situations described above, the Funds reserve the right to require a signature guarantee, or another acceptable form of signature verification, in other instances based on the circumstances of a particular situation.
A signature guarantee assures that a signature is genuine and protects shareholders from unauthorized account transfers. Banks, savings and loan associations, trust companies, credit unions, broker-dealers and member firms of a national securities exchange may guarantee signatures. Call your financial intermediary to determine if it has this capability. A notary public is not an acceptable signature guarantor. Proceeds from a written redemption request will be sent to you by check unless another form of payment is requested.
| | • | | On-line. You may redeem shares or exchange shares between existing, identically registered accounts on-line. To access your account, click the “Individual Investors” link on www.nuveen.com and then choose “Account Access” under the “Resources” tab. The system will walk you through the log-in process. Redemptions where the proceeds are payable by check may not exceed $50,000. Checks will only be issued to you as the shareholder of record and mailed to your address of record. If you have established Fund Direct privileges, you may have redemption proceeds transferred electronically to your bank account. In this case, the redemption proceeds will be transferred to your bank on the next business day after the redemption request is received. You should contact your bank for further information concerning the timing of the credit of the redemption proceeds in your bank account. |
| | • | | By telephone. If your account is held with your Fund and not in your brokerage account, and you have authorized telephone redemption privileges, call (800) 257-8787 to redeem your shares, press 1 for mutual funds and the voice menu will walk you through the process. Redemptions where the proceeds are payable by check may not exceed $50,000. Checks will only be issued to you as the shareholder of record and mailed to your address of record, normally the next business day after the redemption request is received. If you have established Fund Direct privileges, you may have redemption proceeds transferred electronically to your bank account. In this case, the redemption proceeds will be transferred to your bank on the next business day after the redemption request is received. You should contact your bank for further information concerning the timing of the credit of the redemption proceeds in your bank account. |
Accounts with Low Balances
A Fund reserves the right to liquidate or assess a low balance fee on any account (other than accounts holding Class R3 or Class R6 shares) held directly with the Fund that has a balance that has fallen below the account balance minimum of $1,000 for any reason, including market fluctuations.
If a Fund elects to exercise the right to assess a low balance fee, then annually the Fund will assess a $15 low balance account fee on certain accounts with balances under the account balance minimum that are IRAs, Coverdell Education Savings Accounts or accounts established pursuant to the UTMA or UGMA. At the same time, other accounts with balances under the account balance minimum will be liquidated, with proceeds being mailed to the address of record. Prior to the assessment of any low balance fee or
38
Section 3 How You Can Buy and Sell Shares
An Important Note About Telephone Transactions
Although Nuveen Investor Services has certain safeguards and procedures to confirm the identity of callers, it will not be liable for losses resulting from following telephone instructions it reasonably believes to be genuine. Also, you should verify your trade confirmations immediately upon receipt.
liquidation of low balance accounts, affected shareholders will receive a communication notifying them of the pending action, thereby providing time for shareholders to bring their accounts up to the account balance minimum prior to any fee assessment or account liquidation. You will not be assessed a CDSC if your account is liquidated.
Meeting Redemption Requests
Each Fund typically will pay redemption proceeds using cash reserves maintained in the Fund’s portfolio, or using the proceeds from sales of portfolio securities. The Funds also may meet redemption requests through overdrafts at the Funds’ custodian, by borrowing under a credit agreement to which the Funds are parties, or by borrowing from another Nuveen Fund under an inter-fund lending program maintained by the Nuveen Funds pursuant to exemptive relief granted by the Securities and Exchange Commission. See “Investment Policies and Techniques—Borrowing” in the statement of additional information. These additional methods are more likely to be used to meet large redemption requests or in times of stressed market conditions.
Although the Funds generally pay redemption proceeds in cash, if a Fund determines that it would be detrimental to its remaining shareholders to make payment of a redemption order wholly in cash, that Fund may pay a portion of your redemption proceeds in securities or other Fund assets. Although it is unlikely that your shares would be redeemed in-kind, you would probably have to pay brokerage costs to sell the securities or other assets distributed to you, as well as taxes on any capital gains from that sale. Until they are sold, any securities or other assets distributed to you as part of a redemption in-kind may be subject to market risk.
Section 3 How You Can Buy and Sell Shares
39
Section 4 General Information
To help you understand the tax implications of investing in the Funds, this section includes important details about how the Funds make distributions to shareholders. We discuss some other Fund policies as well. Please consult the statement of additional information and your tax advisor for more information about taxes.

The Funds intend to pay income dividends quarterly and any taxable gains annually.
Payment and Reinvestment Options
The Funds automatically reinvest your dividends in additional Fund shares unless you request otherwise. You may request to have your dividends paid to you by check, sent via electronic funds transfer through Automated Clearing House network or reinvested in shares of another Nuveen Mutual Fund. For further information, contact your financial advisor or call Nuveen Investor Services at (800) 257-8787. If you request that your distributions be paid by check but those distributions cannot be delivered because of an incorrect mailing address, or if a distribution check remains uncashed for six months, the undelivered or uncashed distributions and all future distributions will be reinvested in Fund shares at the current net asset value.
Non-U.S. Income Tax Considerations
Investment income that a Fund receives from its non-U.S. investments may be subject to non-U.S. income taxes, which generally will reduce Fund distributions. However, the United States has entered into tax treaties with many non-U.S. countries that may entitle you to certain tax benefits.
Taxes and Tax Reporting
The Funds will make distributions that may be taxed as ordinary income (which may be taxable at different rates, depending on the sources of the distributions) or capital gains (which may be taxable at different rates, depending on the length of time a Fund holds its assets). Distributions from a Fund’s long-term capital gains are generally taxable as capital gains, while distributions from short-term capital gains and net investment income are generally taxable as ordinary income. However, certain ordinary income distributions received from a Fund that are determined to be qualified dividend income may be taxed at tax rates equal to those applicable to long-term capital gains. The tax you pay on a given capital gains distribution depends generally on how long the Fund has held the portfolio securities it sold and not on how long you have owned your Fund shares. Distributions generally do not qualify for a dividends received deduction if you are a corporate shareholder.
Early in each year, you will receive a statement detailing the amount and nature of all distributions that you were paid during the prior year. If you hold your investment at the firm where you purchased your Fund shares, you will receive the statement from that firm. If you hold your shares directly with the Fund, the Distributor will send you the statement. The tax status of your distributions is the same whether you reinvest them or elect to receive them
40
Section 4 General Information
in cash. The sale of shares in your account may produce a gain or loss, and is a taxable event. For tax purposes, an exchange of shares between funds is generally the same as a sale.
Please note that if you do not furnish your Fund with your correct Social Security number or employer identification number, you fail to provide certain certifications to your Fund, you fail to certify whether you are a U.S. citizen or a U.S. resident alien, or the Internal Revenue Service notifies the Fund to withhold, federal law requires your Fund to withhold federal income tax from your distributions and redemption proceeds at the applicable withholding rate.
Buying or Selling Shares Close to a Record Date
Buying Fund shares shortly before the record date for a taxable dividend or capital gain distribution is commonly known as “buying the dividend.” The entire distribution may be taxable to you even though a portion of the distribution effectively represents a return of your purchase price.
Non-U.S. Tax Credits
A regulated investment company with more than 50% of the value of its assets in stock or other securities of non-U.S. corporations at the close of a taxable year may, for such taxable year, elect to pass the regulated investment company’s non-U.S. tax credits through to its investors.
Cost Basis Method
For shares acquired on or after January 1, 2012, you may elect a cost basis method to apply to all existing and future accounts you may establish. The cost basis method you select will determine the order in which shares are redeemed and how your cost basis information is calculated and subsequently reported to you and to the Internal Revenue Service. Please consult your tax advisor to determine which cost basis method best suits your specific situation. If you hold your account directly with a Fund, please contact Nuveen Investor Services at (800) 257-8787 for instructions on how to make your election. If you hold your account with a financial intermediary, please contact that financial intermediary for instructions on how to make your election. If you hold your account directly with a Fund and do not elect a cost basis method, your account will default to the average cost basis method. The average cost basis method generally calculates cost basis by determining the average price paid for Fund shares that may have been purchased at different times for different prices. Financial intermediaries choose their own default cost basis method.

Distribution and Service Plan
The Distributor serves as the selling agent and distributor of the Funds’ shares. In this capacity, the Distributor manages the offering of the Funds’ shares and is responsible for all sales and promotional activities. In order to reimburse the Distributor for its costs in connection with these activities, including compensation paid to financial intermediaries, each Fund has adopted a distribution and service plan under Rule 12b-1 under the 1940 Act (the “Plan”). See “How You Can Buy and Sell Shares—What Share Classes We Offer” for a description of the distribution and service fees paid under the Plan.
Section 4 General Information
41
Under the Plan, the Distributor receives a distribution fee for Class C and Class R3 shares primarily for providing compensation to financial intermediaries, including the Distributor, in connection with the distribution of shares. The Distributor receives a service fee for Class A, Class C, Class R3 and Class T shares to compensate financial intermediaries, including the Distributor, for providing ongoing account services to shareholders. These services may include establishing and maintaining shareholder accounts, answering shareholder inquiries and providing other personal services to shareholders. Fees paid under the Plan also compensate the Distributor for other expenses, including printing and distributing prospectuses to persons other than shareholders, and preparing, printing, and distributing advertising materials, sales literature and reports to shareholders used in connection with the sale of shares. Because fees paid under the Plan are paid out of a Fund’s assets on an ongoing basis, over time these fees will increase the cost of your investment and may cost you more than paying other types of sales charges. Long-term holders of Class C and Class R3 shares may pay more in distribution and service fees and CDSCs (Class C shares only) than the economic equivalent of the maximum front-end sales charge permitted under the Financial Industry Regulatory Authority Conduct Rules.
Other Payments by the Funds
In addition to the distribution and service fees the Funds pay under the Plan and fees the Funds pay to their transfer agent, the Distributor or Nuveen Fund Advisors, on behalf of the Funds, may enter into non-Plan agreements with financial intermediaries pursuant to which the Funds will pay financial intermediaries for administrative, networking, recordkeeping, sub-transfer agency and shareholder services. These non-Plan payments are generally based on either (1) a percentage of the average daily net assets of Fund shareholders serviced by a financial intermediary or (2) a fixed dollar amount for each account serviced by a financial intermediary. The aggregate amount of these payments may be substantial and may vary significantly among intermediaries.
Other Payments by the Distributor and Nuveen Fund Advisors
In addition to the sales commissions and payments from distribution and service fees made to financial intermediaries as previously described, the Distributor and Nuveen Fund Advisors may from time to time make additional payments, out of their own resources, to certain financial intermediaries that sell shares of Nuveen Mutual Funds in order to promote the sales and retention of Fund shares by those firms and their customers. The amounts of these payments vary by financial intermediary and, with respect to a given firm, are typically calculated by reference to the amount of the firm’s recent gross sales of Nuveen Mutual Fund shares and/or total assets of Nuveen Mutual Funds held by the firm’s customers. The level of payments that the Distributor and/or Nuveen Fund Advisors is willing to provide to a particular financial intermediary may be affected by, among other factors, the firm’s total assets held in and recent net investments into Nuveen Mutual Funds, the firm’s level of participation in Nuveen Mutual Fund sales and marketing programs, the firm’s compensation program for its registered representatives who sell Nuveen Mutual Fund shares and provide services to Nuveen Mutual Fund shareholders, and the asset class of the Nuveen Mutual Funds for which these payments are provided. The statement of additional information contains additional information about these payments, including the names of the firms to which payments are made. The Distributor may also make payments to financial intermediaries in
42
Section 4 General Information
connection with sales meetings, due diligence meetings, prospecting seminars and other meetings at which the Distributor promotes its products and services.
In connection with the availability of Nuveen Mutual Funds within selected mutual fund no-transaction fee institutional platforms and fee-based wrap programs at certain financial intermediaries, the Distributor and Nuveen Fund Advisors also make payments out of their own assets to those firms as compensation for certain recordkeeping, shareholder communications and other account administration services provided to Nuveen Mutual Fund shareholders who own their Fund shares through these platforms or programs. These payments are in addition to the service fee and any applicable sub-transfer agency or similar fees paid to these firms with respect to these services by the Nuveen Mutual Funds out of Fund assets.
The amounts of payments to a financial intermediary could be significant, and may create an incentive for the intermediary or its representatives to recommend or offer shares of the Funds to you. The intermediary may elevate the prominence or profile of the Funds within the intermediary’s organization by, for example, placing the Funds on a list of preferred or recommended funds and/or granting the Distributor and/or its affiliates preferential or enhanced opportunities to promote the Funds in various ways within the intermediary’s organization.

The price you pay for your shares or the amount you receive upon redemption of your shares is based on your Fund’s net asset value per share, which is determined as of the close of trading (normally 4:00 p.m. New York time) on each day the NYSE is open for business. Each Fund’s latest net asset value per share is available on the Funds’ website at www.nuveen.com. Net asset value is calculated for each class of each Fund by taking the value of the class’s total assets, including interest or dividends accrued but not yet collected, less all liabilities, and dividing by the total number of shares outstanding. The result, rounded to the nearest cent, is the net asset value per share.
In determining net asset value, portfolio instruments generally are valued using prices provided by independent pricing services or obtained from other sources, such as broker-dealer quotations. Exchange-traded instruments generally are valued at the last reported sales price or official closing price on an exchange, if available. Independent pricing services typically value non-exchange-traded instruments utilizing a range of market-based inputs and assumptions. For example, when available, pricing services may utilize inputs such as benchmark yields, reported trades, broker-dealer quotes, spreads, and transactions for comparable instruments. In pricing certain instruments, the pricing services may consider information about an instrument’s issuer or market activity provided by the Funds’ investment adviser or sub-adviser. Pricing service valuations of non-exchange-traded instruments represent the service’s good faith opinion as to what the holder of an instrument would receive in an orderly transaction for an institutional round lot position under current market conditions. It is possible that these valuations could be materially different from the value that a Fund realizes upon the sale of an instrument. Non-U.S. securities and currency are valued in U.S. dollars based on non-U.S. currency exchange rate quotations supplied by an independent quotation service.
Section 4 General Information
43
For non-U.S. traded securities whose principal local markets close before the close of the NYSE, a Fund may adjust the local closing price based upon such factors as developments in non-U.S. markets, the performance of U.S. securities markets and the performance of instruments trading in U.S. markets that represent non-U.S. securities. A Fund may rely on an independent fair valuation service in making any such fair value determinations. If a Fund holds portfolio instruments that are primarily listed on non-U.S. exchanges, the value of such instruments may change on days when shareholders will not be able to purchase or redeem the Fund’s shares.
If a price cannot be obtained from a pricing service or other pre-approved source, or if, in the judgment of Nuveen Fund Advisors, a price is unreliable, a portfolio instrument will be valued at its fair value as determined in good faith by the Board of Trustees or its appointee. Nuveen Fund Advisors may determine that a price is unreliable in various circumstances. For example, a price may be deemed unreliable if it has not changed for an identified period of time, or has changed from the previous day’s price by more than a threshold amount, and recent transactions and/or broker dealer price quotations differ materially from the price in question.
The Board of Trustees has adopted valuation procedures for the Funds and has appointed the Nuveen Fund Advisors’ Valuation Committee with the day-to-day responsibility for fair value determinations. All fair value determinations made by the Valuation Committee are subject to review and ratification by the Board of Trustees. As a general principle, the fair value of a portfolio instrument is the amount that an owner might reasonably expect to receive upon the instrument’s current sale. A range of factors and analysis may be considered when determining fair value, including relevant market data, interest rates, credit considerations and/or issuer specific news. However, fair valuation involves subjective judgments and it is possible that the fair value determined for a portfolio instrument may be materially different from the value that could be realized upon the sale of that instrument.

The Funds are intended for long-term investment and should not be used for excessive trading. Excessive trading in the Funds’ shares can disrupt portfolio management, lead to higher operating costs, and cause other operating inefficiencies for the Funds. However, the Funds are also mindful that shareholders may have valid reasons for periodically purchasing and redeeming Fund shares.
Accordingly, the Funds have adopted a Frequent Trading Policy that seeks to balance the Funds’ need to prevent excessive trading in Fund shares while offering investors the flexibility in managing their financial affairs to make periodic purchases and redemptions of Fund shares.
The Funds’ Frequent Trading Policy generally limits an investor to two “round trip” trades in a 60-day period. A “round trip” is the purchase and subsequent redemption of Fund shares, including by exchange. Each side of a round trip may be comprised of either a single transaction or a series of closely-spaced transactions.
The Funds primarily receive share purchase and redemption orders through third-party financial intermediaries, some of whom rely on the use of omnibus accounts. An omnibus account typically includes multiple investors
44
Section 4 General Information
and provides the Funds only with a net purchase or redemption amount on any given day where multiple purchases, redemptions and exchanges of shares occur in the account. The identity of individual purchasers, redeemers and exchangers whose orders are aggregated in omnibus accounts, and the size of their orders, will generally not be known by the Funds. Despite the Funds’ efforts to detect and prevent frequent trading, the Funds may be unable to identify frequent trading because the netting effect in omnibus accounts often makes it more difficult to identify frequent traders. The Distributor has entered into agreements with financial intermediaries that maintain omnibus accounts with the Funds’ transfer agent. Under the terms of these agreements, the financial intermediaries undertake to cooperate with the Distributor in monitoring purchase, exchange and redemption orders by their customers in order to detect and prevent frequent trading in the Funds through such accounts. Pursuant to these agreements, financial intermediaries may disclose to a Fund an investor’s taxpayer identification number and a record of the investor’s transactions at the request of the Fund. Technical limitations in operational systems at such intermediaries or at the Distributor may also limit the Funds’ ability to detect and prevent frequent trading. In addition, the Funds may permit certain financial intermediaries, including broker-dealer and retirement plan administrators, among others, to enforce their own internal policies and procedures concerning frequent trading. Such policies may differ from the Funds’ Frequent Trading Policy and may be approved for use in instances where the Funds reasonably believe that the intermediary’s policies and procedures effectively discourage inappropriate trading activity. Shareholders holding their accounts with such intermediaries may wish to contact the intermediary for information regarding its frequent trading policy. Although the Funds do not knowingly permit frequent trading, they cannot guarantee that they will be able to identify and restrict all frequent trading activity.
The Funds reserve the right in their sole discretion to waive unintentional or minor violations (including transactions below certain dollar thresholds) if they determine that doing so would not harm the interests of Fund shareholders. In addition, certain categories of redemptions may be excluded from the application of the Frequent Trading Policy, as described in more detail in the statement of additional information. These include, among others, redemptions pursuant to systematic withdrawal plans, redemptions in connection with the total disability or death of the investor, involuntary redemptions by operation of law, redemptions in payment of account or plan fees, and certain redemptions by retirement plans, including redemptions in connection with qualifying loans or hardship withdrawals, termination of plan participation, return of excess contributions, and required minimum distributions. The Funds may also modify or suspend the Frequent Trading Policy without notice during periods of market stress or other unusual circumstances.
The Funds reserve the right to impose restrictions on purchases or exchanges that are more restrictive than those stated above if they determine, in their sole discretion, that a transaction or a series of transactions involves market timing or excessive trading that may be detrimental to Fund shareholders. The Funds also reserve the right to reject any purchase order, including exchange purchases, for any reason. For example, a Fund may refuse purchase orders if the Fund would be unable to invest the proceeds from the purchase order in accordance with the Fund’s investment policies and/or objective, or if the Fund would be adversely
Section 4 General Information
45
affected by the size of the transaction, the frequency of trading in the account or various other factors. For more information about the Funds’ Frequent Trading Policy and its enforcement, see “Purchase and Redemption of Fund Shares—Frequent Trading Policy” in the statement of additional information.

The custodian of the assets of the Funds is State Street Bank and Trust Company, One Lincoln Street, Boston, Massachusetts 02111. The custodian also provides certain accounting services to the Funds. The Funds’ transfer, shareholder services and dividend paying agent, Boston Financial Data Services, Inc., P.O. Box 8530, Boston, Massachusetts 02266-8530, performs bookkeeping, data processing and administrative services for the maintenance of shareholder accounts.
46
Section 4 General Information
Section 5 Financial Highlights
The financial highlights table is intended to help you understand a Fund’s financial performance for the past five fiscal years or, if shorter, the period of operations for the class of shares. Certain information reflects financial results for a single Fund share. The total returns in the table represent the rate that an investor would have earned (or lost) on an investment in a Fund (assuming reinvestment of all dividends and distributions). The information has been audited by PricewaterhouseCoopers LLP, whose report for the most recent fiscal year, along with the Funds’ financial statements, are included in the annual report, which is available upon request.
Nuveen Santa Barbara Dividend Growth Fund
| | | | | | | | | | | | | | | | | | | | | | | | | | | | | | | | | | | | | | | | | | | | | | | | | | | | |
Class
(Commencement
Date) | | | | | Investment Operations | | | Less Distributions | | | | | | | | | Ratios/Supplemental Data | |
Year Ended
July 31, | | Beginning
NAV | | | Net
Investment
Income
(Loss)(a) | | | Net
Realized/
Unrealized
Gain (Loss) | | | Total | | | From Net
Investment
Income | | | From
Accumulated
Net Realized
Gains | | | Total | | | Ending
NAV | | | Total
Return(b) | | | Ending
Net
Assets
(000) | | | Ratios of
Expenses
to Average
Net
Assets(c) | | | Ratios of Net
Investment
Income (Loss)
to Average
Net Assets(c) | | | Portfolio
Turnover
Rate(d) | |
| | | | | | | | | | | | |
| Class A (3/06) | | | | | | | | | | | | | | | | | | | | | | | | | | | | | | | | | | | | | | | | | | | | | | | | | |
| 2017 | | $ | 35.52 | | | $ | .58 | | | $ | 3.30 | | | $ | 3.88 | | | $ | (.56 | ) | | $ | — | | | $ | (.56 | ) | | $ | 38.84 | | | | 11.04 | % | | $ | 449,109 | | | | .97 | % | | | 1.61 | % | | | 22 | % |
| 2016 | | | 36.39 | | | | .53 | | | | .55 | | | | 1.08 | | | | (.53 | ) | | | (1.42 | ) | | | (1.95 | ) | | | 35.52 | | | | 3.47 | | | | 667,299 | | | | .99 | | | | 1.57 | | | | 28 | |
| 2015 | | | 34.21 | | | | .49 | | | | 3.25 | | | | 3.74 | | | | (.50 | ) | | | (1.06 | ) | | | (1.56 | ) | | | 36.39 | | | | 11.21 | | | | 700,058 | | | | 1.00 | | | | 1.37 | | | | 28 | |
| 2014 | | | 30.54 | | | | .54 | | | | 3.85 | | | | 4.39 | | | | (.53 | ) | | | (.19 | ) | | | (.72 | ) | | | 34.21 | | | | 14.50 | | | | 691,389 | | | | 1.01 | | | | 1.64 | | | | 29 | |
| 2013 | | | 26.32 | | | | .59 | | | | 4.19 | | | | 4.78 | | | | (.56 | ) | | | — | | | | (.56 | ) | | | 30.54 | | | | 18.41 | | | | 602,575 | | | | 1.03 | | | | 2.09 | | | | 23 | |
| | | | | | | | | | | | |
| Class C (3/06) | | | | | | | | | | | | | | | | | | | | | | | | | | | | | | | | | | | | | | | | | | | | | | | | | |
| 2017 | | | 35.46 | | | | .30 | | | | 3.30 | | | | 3.60 | | | | (.29 | ) | | | — | | | | (.29 | ) | | | 38.77 | | | | 10.21 | | | | 507,089 | | | | 1.72 | | | | .83 | | | | 22 | |
| 2016 | | | 36.33 | | | | .27 | | | | .55 | | | | .82 | | | | (.27 | ) | | | (1.42 | ) | | | (1.69 | ) | | | 35.46 | | | | 2.69 | | | | 556,889 | | | | 1.74 | | | | .81 | | | | 28 | |
| 2015 | | | 34.16 | | | | .22 | | | | 3.24 | | | | 3.46 | | | | (.23 | ) | | | (1.06 | ) | | | (1.29 | ) | | | 36.33 | | | | 10.37 | | | | 533,430 | | | | 1.75 | | | | .62 | | | | 28 | |
| 2014 | | | 30.49 | | | | .29 | | | | 3.85 | | | | 4.14 | | | | (.28 | ) | | | (.19 | ) | | | (.47 | ) | | | 34.16 | | | | 13.65 | | | | 449,211 | | | | 1.76 | | | | .89 | | | | 29 | |
| 2013 | | | 26.29 | | | | .37 | | | | 4.18 | | | | 4.55 | | | | (.35 | ) | | | — | | | | (.35 | ) | | | 30.49 | | | | 17.51 | | | | 331,702 | | | | 1.78 | | | | 1.31 | | | | 23 | |
| | | | | | | | | | | | |
| Class R3 (3/09) | | | | | | | | | | | | | | | | | | | | | | | | | | | | | | | | | | | | | | | | | | | | | | | | | |
| 2017 | | | 35.79 | | | | .49 | | | | 3.33 | | | | 3.82 | | | | (.52 | ) | | | — | | | | (.52 | ) | | | 39.09 | | | | 10.77 | | | | 22,881 | | | | 1.22 | | | | 1.33 | | | | 22 | |
| 2016 | | | 36.65 | | | | .44 | | | | .57 | | | | 1.01 | | | | (.45 | ) | | | (1.42 | ) | | | (1.87 | ) | | | 35.79 | | | | 3.22 | | | | 21,662 | | | | 1.24 | | | | 1.30 | | | | 28 | |
| 2015 | | | 34.45 | | | | .41 | | | | 3.26 | | | | 3.67 | | | | (.41 | ) | | | (1.06 | ) | | | (1.47 | ) | | | 36.65 | | | | 10.92 | | | | 17,046 | | | | 1.25 | | | | 1.14 | | | | 28 | |
| 2014 | | | 30.75 | | | | .45 | | | | 3.89 | | | | 4.34 | | | | (.45 | ) | | | (.19 | ) | | | (.64 | ) | | | 34.45 | | | | 14.23 | | | | 21,565 | | | | 1.26 | | | | 1.38 | | | | 29 | |
| 2013 | | | 26.50 | | | | .45 | | | | 4.30 | | | | 4.75 | | | | (.50 | ) | | | — | | | | (.50 | ) | | | 30.75 | | | | 18.12 | | | | 17,312 | | | | 1.29 | | | | 1.56 | | | | 23 | |
| | | | | | | | | | | | |
| Class R6 (3/13) | | | | | | | | | | | | | | | | | | | | | | | | | | | | | | | | | | | | | | | | | | | | | | | | | |
| 2017 | | | 35.81 | | | | .70 | | | | 3.34 | | | | 4.04 | | | | (.66 | ) | | | — | | | | (.66 | ) | | | 39.19 | | | | 11.41 | | | | 26,984 | | | | .65 | | | | 1.91 | | | | 22 | |
| 2016 | | | 36.64 | | | | .64 | | | | .57 | | | | 1.21 | | | | (.62 | ) | | | (1.42 | ) | | | (2.04 | ) | | | 35.81 | | | | 3.80 | | | | 35,219 | | | | .66 | | | | 1.89 | | | | 28 | |
| 2015 | | | 34.42 | | | | .61 | | | | 3.26 | | | | 3.87 | | | | (.59 | ) | | | (1.06 | ) | | | (1.65 | ) | | | 36.64 | | | | 11.57 | | | | 32,186 | | | | .67 | | | | 1.70 | | | | 28 | |
| 2014 | | | 30.69 | | | | .64 | | | | 3.89 | | | | 4.53 | | | | (.61 | ) | | | (.19 | ) | | | (.80 | ) | | | 34.42 | | | | 14.92 | | | | 36,352 | | | | .68 | | | | 1.94 | | | | 29 | |
| 2013(e) | | | 29.09 | | | | .19 | | | | 1.55 | | | | 1.74 | | | | (.14 | ) | | | — | | | | (.14 | ) | | | 30.69 | | | | 6.01 | | | | 43,893 | | | | .72 | * | | | 1.78 | * | | | 23 | |
| | | | | | | | | | | | |
| Class I (3/06) | | | | | | | | | | | | | | | | | | | | | | | | | | | | | | | | | | | | | | | | | | | | | | | | | |
| 2017 | | | 35.54 | | | | .66 | | | | 3.32 | | | | 3.98 | | | | (.65 | ) | | | — | | | | (.65 | ) | | | 38.87 | | | | 11.34 | | | | 1,853,930 | | | | .72 | | | | 1.81 | | | | 22 | |
| 2016 | | | 36.41 | | | | .61 | | | | .55 | | | | 1.16 | | | | (.61 | ) | | | (1.42 | ) | | | (2.03 | ) | | | 35.54 | | | | 3.73 | | | | 1,483,520 | | | | .74 | | | | 1.82 | | | | 28 | |
| 2015 | | | 34.23 | | | | .58 | | | | 3.25 | | | | 3.83 | | | | (.59 | ) | | | (1.06 | ) | | | (1.65 | ) | | | 36.41 | | | | 11.48 | | | | 1,483,962 | | | | .75 | | | | 1.62 | | | | 28 | |
| 2014 | | | 30.55 | | | | .62 | | | | 3.86 | | | | 4.48 | | | | (.61 | ) | | | (.19 | ) | | | (.80 | ) | | | 34.23 | | | | 14.81 | | | | 1,236,645 | | | | .76 | | | | 1.89 | | | | 29 | |
| 2013 | | | 26.33 | | | | .66 | | | | 4.19 | | | | 4.85 | | | | (.63 | ) | | | — | | | | (.63 | ) | | | 30.55 | | | | 18.69 | | | | 1,205,829 | | | | .78 | | | | 2.34 | | | | 23 | |
| | | | | | | | | | | | |
| Class T (5/18)(f) | | | | | | | | | | | | | | | | | | | | | | | | | | | | | | | | | | | | | | | | | | | | | | | | | |
| 2017(g) | | | 38.09 | | | | .06 | | | | .85 | | | | .91 | | | | (.13 | ) | | | — | | | | (.13 | ) | | | 38.87 | | | | 2.40 | | | | 26 | | | | .98 | * | | | .90 | * | | | 22 | |
| (a) | Per share Net Investment Income (Loss) is calculated using the average daily shares method. |
| (b) | Total Return is the combination of changes in NAV without any sales charge, reinvested dividend income at NAV and reinvested capital gains distributions at NAV, if any. Total Return is not annualized. |
| (c) | The Fund has a contractual fee waiver/expense reimbursement agreement with Nuveen Fund Advisors, but did not receive a fee waiver and/or expense reimbursement during the periods presented herein. |
| (d) | Portfolio Turnover Rate is calculated based on the lesser of long-term purchases or sales (as disclosed in Note 5 – Investment Transactions, in the most recent shareholder report) divided by the average long-term market value during the period. |
| (e) | For the period March 25, 2013 (commencement of operations) through July 31, 2013. |
| (f) | Class T Shares are not available for public offering. |
| (g) | For the period May 31, 2017 (commencement of operations) through July 31, 2017. |
Section 5 Financial Highlights
47
Nuveen Santa Barbara Global Dividend Growth Fund
| | | | | | | | | | | | | | | | | | | | | | | | | | | | | | | | | | | | | | | | | | | | | | | | | | | | |
Class
(Commencement
Date) | | | | | Investment Operations | | | Less Distributions | | | | | | | | | Ratios/Supplemental Data | |
Year Ended
July 31, | | Beginning
NAV | | | Net
Investment
Income
(Loss)(a) | | | Net
Realized/
Unrealized
Gain (Loss) | | | Total | | | From Net
Investment
Income | | | From
Accumulated
Net Realized
Gains | | | Total | | | Ending
NAV | | | Total
Return(b) | | | Ending
Net
Assets
(000) | | | Ratios of
Expenses
to Average
Net
Assets(c) | | | Ratios of Net
Investment
Income (Loss)
to Average
Net Assets(c) | | | Portfolio
Turnover
Rate(d) | |
| | | | | | | | | | | | |
| Class A (6/12) | | | | | | | | | | | | | | | | | | | | | | | | | | | | | | | | | | | | | | | | | | | | | | | | | |
| 2017 | | $ | 26.65 | | | $ | .51 | | | $ | 2.53 | | | $ | 3.04 | | | $ | (.99 | ) | | $ | (.03 | ) | | $ | (1.02 | ) | | $ | 28.67 | | | | 11.55 | % | | $ | 6,188 | | | | 1.15 | % | | | 1.88 | % | | | 33 | % |
| 2016 | | | 26.90 | | | | .43 | | | | (.31 | ) | | | .12 | | | | (.37 | ) | | | — | | | | (.37 | ) | | | 26.65 | | | | .51 | | | | 6,861 | | | | 1.27 | | | | 1.71 | | | | 19 | |
| 2015 | | | 25.63 | | | | .48 | | | | 1.60 | | | | 2.08 | | | | (.51 | ) | | | (.30 | ) | | | (.81 | ) | | | 26.90 | | | | 8.28 | | | | 5,330 | | | | 1.38 | | | | 1.81 | | | | 24 | |
| 2014 | | | 24.20 | | | | .99 | | | | 1.46 | | | | 2.45 | | | | (.85 | ) | | | (.17 | ) | | | (1.02 | ) | | | 25.63 | | | | 10.21 | | | | 3,618 | | | | 1.42 | | | | 3.91 | | | | 42 | |
| 2013 | | | 21.49 | | | | .73 | | | | 2.61 | | | | 3.34 | | | | (.63 | ) | | | — | | | | (.63 | ) | | | 24.20 | | | | 15.76 | | | | 2,163 | | | | 1.42 | | | | 3.15 | | | | 25 | |
| | | | | | | | | | | | |
| Class C (6/12) | | | | | | | | | | | | | | | | | | | | | | | | | | | | | | | | | | | | | | | | | | | | | | | | | |
| 2017 | | | 26.57 | | | | .32 | | | | 2.51 | | | | 2.83 | | | | (.78 | ) | | | (.03 | ) | | | (.81 | ) | | | 28.59 | | | | 10.75 | | | | 2,856 | | | | 1.90 | | | | 1.18 | | | | 33 | |
| 2016 | | | 26.87 | | | | .25 | | | | (.33 | ) | | | (.08 | ) | | | (.22 | ) | | | — | | | | (.22 | ) | | | 26.57 | | | | (.25 | ) | | | 2,116 | | | | 2.02 | | | | 1.00 | | | | 19 | |
| 2015 | | | 25.61 | | | | .28 | | | | 1.60 | | | | 1.88 | | | | (.32 | ) | | | (.30 | ) | | | (.62 | ) | | | 26.87 | | | | 7.47 | | | | 1,512 | | | | 2.13 | | | | 1.06 | | | | 24 | |
| 2014 | | | 24.18 | | | | .78 | | | | 1.48 | | | | 2.26 | | | | (.66 | ) | | | (.17 | ) | | | (.83 | ) | | | 25.61 | | | | 9.41 | | | | 810 | | | | 2.17 | | | | 3.09 | | | | 42 | |
| 2013 | | | 21.47 | | | | .52 | | | | 2.64 | | | | 3.16 | | | | (.45 | ) | | | — | | | | (.45 | ) | | | 24.18 | | | | 14.87 | | | | 414 | | | | 2.17 | | | | 2.27 | | | | 25 | |
| | | | | | | | | | | | |
| Class R3 (6/12) | | | | | | | | | | | | | | | | | | | | | | | | | | | | | | | | | | | | | | | | | | | | | | | | | |
| 2017 | | | 26.62 | | | | .45 | | | | 2.52 | | | | 2.97 | | | | (.95 | ) | | | (.03 | ) | | | (.98 | ) | | | 28.61 | | | | 11.30 | | | | 100 | | | | 1.40 | | | | 1.67 | | | | 33 | |
| 2016 | | | 26.89 | | | | .37 | | | | (.32 | ) | | | .05 | | | | (.32 | ) | | | — | | | | (.32 | ) | | | 26.62 | | | | .24 | | | | 80 | | | | 1.52 | | | | 1.46 | | | | 19 | |
| 2015 | | | 25.62 | | | | .39 | | | | 1.62 | | | | 2.01 | | | | (.44 | ) | | | (.30 | ) | | | (.74 | ) | | | 26.89 | | | | 8.01 | | | | 69 | | | | 1.63 | | | | 1.47 | | | | 24 | |
| 2014 | | | 24.19 | | | | .89 | | | | 1.49 | | | | 2.38 | | | | (.78 | ) | | | (.17 | ) | | | (.95 | ) | | | 25.62 | | | | 9.94 | | | | 64 | | | | 1.67 | | | | 3.53 | | | | 42 | |
| 2013 | | | 21.48 | | | | .70 | | | | 2.58 | | | | 3.28 | | | | (.57 | ) | | | — | | | | (.57 | ) | | | 24.19 | | | | 15.46 | | | | 60 | | | | 1.67 | | | | 3.05 | | | | 25 | |
| | | | | | | | | | | | |
| Class I (6/12) | | | | | | | | | | | | | | | | | | | | | | | | | | | | | | | | | | | | | | | | | | | | | | | | | |
| 2017 | | | 26.65 | | | | .60 | | | | 2.50 | | | | 3.10 | | | | (1.05 | ) | | | (.03 | ) | | | (1.08 | ) | | | 28.67 | | | | 11.83 | | | | 8,813 | | | | .90 | | | | 2.20 | | | | 33 | |
| 2016 | | | 26.91 | | | | .55 | | | | (.38 | ) | | | .17 | | | | (.43 | ) | | | — | | | | (.43 | ) | | | 26.65 | | | | .73 | | | | 53,796 | | | | 1.01 | | | | 2.16 | | | | 19 | |
| 2015 | | | 25.64 | | | | .50 | | | | 1.64 | | | | 2.14 | | | | (.57 | ) | | | (.30 | ) | | | (.87 | ) | | | 26.91 | | | | 8.55 | | | | 2,581 | | | | 1.14 | | | | 1.91 | | | | 24 | |
| 2014 | | | 24.20 | | | | 1.02 | | | | 1.50 | | | | 2.52 | | | | (.91 | ) | | | (.17 | ) | | | (1.08 | ) | | | 25.64 | | | | 10.52 | | | | 3,020 | | | | 1.17 | | | | 4.03 | | | | 42 | |
| 2013 | | | 21.50 | | | | .82 | | | | 2.57 | | | | 3.39 | | | | (.69 | ) | | | — | | | | (.69 | ) | | | 24.20 | | | | 16.01 | | | | 2,711 | | | | 1.17 | | | | 3.56 | | | | 25 | |
| (a) | Per share Net Investment Income (Loss) is calculated using the average daily shares method. |
| (b) | Total Return is the combination of changes in NAV without any sales charge, reinvested dividend income at NAV and reinvested capital gains distributions at NAV, if any. Total Return is not annualized. |
| (c) | After fee waiver and/or expense reimbursement from Nuveen Fund Advisors, where applicable. |
| (d) | Portfolio Turnover Rate is calculated based on the lesser of long-term purchases or sales (as disclosed in Note 5 – Investment Transactions, in the most recent shareholder report) divided by the average long-term market value during the period. |
48
Section 5 Financial Highlights
Nuveen Santa Barbara International Dividend Growth Fund
| | | | | | | | | | | | | | | | | | | | | | | | | | | | | | | | | | | | | | | | | | | | | | | | | | | | | | | | |
Class
(Commencement
Date) | | | | | Investment Operations | | | Less Distributions | | | | | | | | | Ratios/Supplemental Data | |
Year Ended
July 31, | | Beginning
NAV | | | Net
Investment
Income (Loss)(a) | | | Net
Realized/
Unrealized
Gain (Loss) | | | Total | | | From Net
Investment
Income | | | From
Accumulated
Net Realized
Gains | | | Return
of Capital | | | Total | | | Ending
NAV | | | Total
Return(b) | | | Ending
Net
Assets
(000) | | | Ratios of
Expenses
to Average
Net
Assets(c) | | | Ratios of Net
Investment
Income (Loss)
to Average
Net Assets(c) | | | Portfolio
Turnover
Rate(d) | |
| | | | | | | | | | | | | |
| Class A (6/12) | | | | | | | | | | | | | | | | | | | | | | | | | | | | | | | | | | | | | | | | | | | | | | | | | | | | | |
| 2017 | | $ | 24.85 | | | $ | .73 | | | $ | 2.10 | | | $ | 2.83 | | | $ | (.78 | ) | | $ | — | | | $ | — | | | $ | (.78 | ) | | $ | 26.90 | | | | 11.65 | % | | $ | 2,132 | | | | 1.15 | % | | | 2.92 | % | | | 25 | % |
| 2016 | | | 26.35 | | | | .51 | | | | (1.55 | ) | | | (1.04 | ) | | | (.46 | ) | | | — | | | | — | | | | (.46 | ) | | | 24.85 | | | | (3.87 | ) | | | 1,885 | | | | 1.27 | | | | 2.08 | | | | 53 | |
| 2015 | | | 26.46 | | | | .49 | | | | (.03 | ) | | | .46 | | | | (.49 | ) | | | (.06 | ) | | | (.02 | ) | | | (.57 | ) | | | 26.35 | | | | 1.86 | | | | 1,077 | | | | 1.37 | | | | 1.91 | | | | 15 | |
| 2014 | | | 25.59 | | | | 1.07 | | | | 1.11 | | | | 2.18 | | | | (.81 | ) | | | (.50 | ) | | | — | | | | (1.31 | ) | | | 26.46 | | | | 8.55 | | | | 469 | | | | 1.42 | | | | 4.00 | | | | 23 | |
| 2013 | | | 21.23 | | | | .39 | | | | 4.30 | | | | 4.69 | | | | (.31 | ) | | | (.02 | ) | | | — | | | | (.33 | ) | | | 25.59 | | | | 22.20 | | | | 123 | | | | 1.42 | | | | 1.64 | | | | 23 | |
| | | | | | | | | | | | | |
| Class C (6/12) | | | | | | | | | | | | | | | | | | | | | | | | | | | | | | | | | | | | | | | | | | | | | | | | | | | | | |
| 2017 | | | 24.64 | | | | .58 | | | | 2.04 | | | | 2.62 | | | | (.59 | ) | | | — | | | | — | | | | (.59 | ) | | | 26.67 | | | | 10.81 | | | | 785 | | | | 1.90 | | | | 2.31 | | | | 25 | |
| 2016 | | | 26.18 | | | | .30 | | | | (1.52 | ) | | | (1.22 | ) | | | (.32 | ) | | | — | | | | — | | | | (.32 | ) | | | 24.64 | | | | (4.60 | ) | | | 580 | | | | 2.02 | | | | 1.25 | | | | 53 | |
| 2015 | | | 26.33 | | | | .27 | | | | — | * | | | .27 | | | | (.34 | ) | | | (.06 | ) | | | (.02 | ) | | | (.42 | ) | | | 26.18 | | | | 1.12 | | | | 419 | | | | 2.13 | | | | 1.05 | | | | 15 | |
| 2014 | | | 25.51 | | | | .84 | | | | 1.13 | | | | 1.97 | | | | (.65 | ) | | | (.50 | ) | | | — | | | | (1.15 | ) | | | 26.33 | | | | 7.77 | | | | 309 | | | | 2.17 | | | | 3.17 | | | | 23 | |
| 2013 | | | 21.21 | | | | .18 | | | | 4.31 | | | | 4.49 | | | | (.17 | ) | | | (.02 | ) | | | — | | | | (.19 | ) | | | 25.51 | | | | 21.23 | | | | 64 | | | | 2.17 | | | | .78 | | | | 23 | |
| | | | | | | | | | | | | |
| Class R3 (6/12) | | | | | | | | | | | | | | | | | | | | | | | | | | | | | | | | | | | | | | | | | | | | | | | | | | | | | |
| 2017 | | | 24.80 | | | | .70 | | | | 2.06 | | | | 2.76 | | | | (.75 | ) | | | — | | | | — | | | | (.75 | ) | | | 26.81 | | | | 11.36 | | | | 102 | | | | 1.40 | | | | 2.79 | | | | 25 | |
| 2016 | | | 26.31 | | | | .42 | | | | (1.51 | ) | | | (1.09 | ) | | | (.42 | ) | | | — | | | | — | | | | (.42 | ) | | | 24.80 | | | | (4.10 | ) | | | 93 | | | | 1.52 | | | | 1.72 | | | | 53 | |
| 2015 | | | 26.44 | | | | .38 | | | | .01 | | | | .39 | | | | (.44 | ) | | | (.06 | ) | | | (.02 | ) | | | (.52 | ) | | | 26.31 | | | | 1.59 | | | | 66 | | | | 1.63 | | | | 1.47 | | | | 15 | |
| 2014 | | | 25.58 | | | | .85 | | | | 1.26 | | | | 2.11 | | | | (.75 | ) | | | (.50 | ) | | | — | | | | (1.25 | ) | | | 26.44 | | | | 8.29 | | | | 66 | | | | 1.67 | | | | 3.18 | | | | 23 | |
| 2013 | | | 21.23 | | | | .30 | | | | 4.32 | | | | 4.62 | | | | (.25 | ) | | | (.02 | ) | | | — | | | | (.27 | ) | | | 25.58 | | | | 21.84 | | | | 64 | | | | 1.67 | | | | 1.28 | | | | 23 | |
| | | | | | | | | | | | | |
| Class I (6/12) | | | | | | | | | | | | | | | | | | | | | | | | | | | | | | | | | | | | | | | | | | | | | | | | | | | | | |
| 2017 | | | 24.88 | | | | .89 | | | | 2.01 | | | | 2.90 | | | | (.85 | ) | | | — | | | | — | | | | (.85 | ) | | | 26.93 | | | | 11.92 | | | | 2,431 | | | | .90 | | | | 3.52 | | | | 25 | |
| 2016 | | | 26.37 | | | | .47 | | | | (1.45 | ) | | | (.98 | ) | | | (.51 | ) | | | — | | | | — | | | | (.51 | ) | | | 24.88 | | | | (3.64 | ) | | | 1,310 | | | | 1.03 | | | | 1.93 | | | | 53 | |
| 2015 | | | 26.47 | | | | .52 | | | | — | * | | | .52 | | | | (.54 | ) | | | (.06 | ) | | | (.02 | ) | | | (.62 | ) | | | 26.37 | | | | 2.09 | | | | 2,165 | | | | 1.13 | | | | 2.00 | | | | 15 | |
| 2014 | | | 25.59 | | | | 1.04 | | | | 1.21 | | | | 2.25 | | | | (.87 | ) | | | (.50 | ) | | | — | | | | (1.37 | ) | | | 26.47 | | | | 8.86 | | | | 1,979 | | | | 1.17 | | | | 3.88 | | | | 23 | |
| 2013 | | | 21.24 | | | | .45 | | | | 4.29 | | | | 4.74 | | | | (.37 | ) | | | (.02 | ) | | | — | | | | (.39 | ) | | | 25.59 | | | | 22.46 | | | | 1,289 | | | | 1.17 | | | | 1.89 | | | | 23 | |
| (a) | Per share Net Investment Income (Loss) is calculated using the average daily shares method. |
| (b) | Total Return is the combination of changes in NAV without any sales charge, reinvested dividend income at NAV and reinvested capital gains distributions at NAV, if any. Total Return is not annualized. |
| (c) | After fee waiver and/or expense reimbursement from Nuveen Fund Advisors, where applicable. |
| (d) | Portfolio Turnover Rate is calculated based on the lesser of long-term purchases or sales (as disclosed in Note 5 – Investment Transactions, in the most recent shareholder report) divided by the average long-term market value during the period. |
| * | Rounds to less than $.01 per share. |
Section 5 Financial Highlights
49
November 30, 2017
Appendix to the Prospectus of
Nuveen Santa Barbara Dividend Growth Fund
Nuveen Santa Barbara Global Dividend Growth Fund
Nuveen Santa Barbara International Dividend Growth Fund
VARIATIONS IN SALES CHARGE REDUCTIONS AND WAIVERS
AVAILABLE THROUGH CERTAIN INTERMEDIARIES
A-1
The Funds offer a number of ways to reduce or eliminate the up-front sales charge on Class A and Class T shares, which are set forth in the Prospectus. The Prospectus also sets forth certain circumstances under which the Funds will waive or reduce the contingent deferred sales charge (“CDSC”) imposed on redemptions of Class C shares and certain Class A shares purchased at net asset value. The availability of the sales charge reductions and waivers discussed in the Prospectus will depend on the policies of the financial intermediary through which you purchase your shares, which are set forth below.
Class A and Class C Share Sales Charge Reductions and Waivers Available Through Merrill Lynch
Effective April 10, 2017, shareholders purchasing Fund shares through a Merrill Lynch platform or account will be eligible only for the following load waivers (front-end sales charge waivers and contingent deferred sales charge waivers) and discounts, which may differ from those disclosed in the Funds’ prospectus or SAI. Shareholders should contact Merrill Lynch to determine their eligibility for these waivers and discounts.
Front-End Sales Load Waivers on Class A Shares Available at Merrill Lynch
| | • | | Employer-sponsored retirement, deferred compensation and employee benefit plans (including health savings accounts) and trusts used to fund those plans, provided that the shares are not held in a commission-based brokerage account and shares are held for the benefit of the plan |
| | • | | Shares purchased by or through a 529 Plan |
| | • | | Shares purchased through a Merrill Lynch affiliated investment advisory program |
| | • | | Shares purchased by third party investment advisors on behalf of their advisory clients through Merrill Lynch’s platform |
| | • | | Shares of funds purchased through the Merrill Edge Self-Directed platform |
| | • | | Shares purchased through reinvestment of capital gain distributions and dividend reinvestment when purchasing shares of the same fund (but not any other fund within the fund family) |
| | • | | Shares exchanged from Class C shares of the same fund in the month of or following the 10-year anniversary of the purchase date |
| | • | | Employees and registered representatives of Merrill Lynch or its affiliates and their family members |
| | • | | Directors or Trustees of the Funds, and employees of the Funds’ investment adviser or any of its affiliates, as described in the Prospectus |
| | • | | Shares purchased from the proceeds of redemptions within the same fund family, provided (1) the repurchase occurs within 90 days following the redemption, (2) the redemption and purchase occur in the same account, and (3) redeemed shares were subject to a front-end or deferred sales load (known as Rights of Reinstatement) |
CDSC Waivers on A and C Shares Available at Merrill Lynch
| | • | | Death or disability of the shareholder |
| | • | | Shares sold as part of a systematic withdrawal plan as described in the Prospectus |
| | • | | Return of excess contributions from an IRA Account |
| | • | | Shares sold as part of a required minimum distribution for IRA and retirement accounts due to the shareholder reaching age 70 1⁄2 |
| | • | | Shares sold to pay Merrill Lynch fees but only if the transaction is initiated by Merrill Lynch |
| | • | | Shares acquired through a Right of Reinstatement |
| | • | | Shares purchased through reinvestment of capital gain distributions and dividend reinvestment when purchasing shares of the same fund (but not any other fund within the fund family) |
| | • | | Shares held in retirement brokerage accounts, that are exchanged for a lower cost share class due to transfer to a fee based account or platform |
A-2
Front-End Load Discounts Available at Merrill Lynch: Breakpoints, Rights of Accumulation & Letters of Intent
| | • | | Breakpoints as described in the Prospectus |
| | • | | Rights of Accumulation (“ROA”) which entitle shareholders to breakpoint discounts will be automatically calculated based on the aggregated holding of fund family assets held by accounts within the purchaser’s household at Merrill Lynch. Eligible fund family assets not held at Merrill Lynch may be included in the ROA calculation only if the shareholder notifies his or her financial advisor about such assets |
| | • | �� | Letters of Intent (“LOI”) which allow for breakpoint discounts using the same criteria as ROA above, but based on anticipated purchases within a fund family over a 13-month period of time |
Class A Sales Charge Waivers Available Only Through Specified Intermediaries
As described in the Prospectus, Class A shares may be purchased at net asset without a sales charge by employer-sponsored retirement plans (“ESRPs”) as defined in the prospectus, except that, in the case of ESRPs held through a brokerage account, Class A shares will be available at net asset value without a sales charge only if the broker-dealer has entered into an agreement with the Distributor that allows for such purchases.
The following intermediaries have entered into such an agreement:
Baker & Co., Inc.
Cetera Advisor Networks LLC
Cetera Advisors LLC
Cetera Financial Specialists LLC
Cetera Investment Services LLC
Country Club Financial Services, Inc.
Cutter & Co. Brokerage Inc.
Davenport & Co. LLC
Devenir Investment Advisors, LLC
Fintrust Brokerage Services
First Kentucky Securities Corp.
First Western Securities
Gold Coast Securities, Inc.
Hewitt Financial Services LLC
Hilltop Securities Inc.
Infinex Investments, Inc.
J.P. Morgan Securities LLC
KMS Financial Services, Inc.
Mid-Atlantic Capital Corp.
OFG Financial Services, Inc.
Principal Securities Inc.
Raymond James & Associates Inc.
RDM Investment Services, Inc.
Register Financial Associates, Inc.
Shareholders Service Group Inc.
Southeast Investments, NC, Inc.
Stifel, Nicolaus & Co., Inc.
Waddell & Reed Inc.
As described in the Prospectus, Class A shares may be purchased at net asset value without a sales charge through a financial intermediary that has entered into an agreement with the Distributor to offer the Funds’ shares to self-directed investment brokerage accounts and that may or may not charge a transaction fee to its customers.
A-3
The following intermediaries have entered into such an agreement:
J.P. Morgan Securities LLC
Merrill Lynch, Pierce, Fenner & Smith Inc.
TD Ameritrade, Inc.
TD Ameritrade Clearing, Inc.
Class T Share Sales Charge Waivers Available Only Through Specified Intermediaries
As set forth in the Prospectus, Class T shares are generally subject to an up-front sales charge, except for shares purchased through the reinvestment of dividends and capital gain distributions from the same fund. However, Class T shares may be available at net asset value without a sales charge under limited circumstances through certain financial intermediaries. Currently no intermediaries are offering such waivers.
A-4
Nuveen Mutual Funds
Nuveen offers a variety of mutual funds designed to help you reach your financial goals. The funds below are grouped by category.
Municipal-National
All-American Municipal Bond
High Yield Municipal Bond
Inflation Protected Municipal Bond
Intermediate Duration Municipal Bond
Limited Term Municipal Bond
Short Duration High Yield Municipal Bond
Short Term Municipal Bond
Strategic Municipal Opportunities
Municipal-State
Arizona Municipal Bond
California High Yield Municipal Bond
California Intermediate Municipal Bond
California Municipal Bond
Colorado Municipal Bond
Connecticut Municipal Bond
Georgia Municipal Bond
Kansas Municipal Bond
Kentucky Municipal Bond
Louisiana Municipal Bond
Maryland Municipal Bond
Massachusetts Municipal Bond
Michigan Municipal Bond
Minnesota Intermediate Municipal Bond
Minnesota Municipal Bond
Missouri Municipal Bond
Nebraska Municipal Bond
New Jersey Municipal Bond
Municipal-State (continued)
New Mexico Municipal Bond
New York Municipal Bond
North Carolina Municipal Bond
Ohio Municipal Bond
Oregon Intermediate Municipal Bond
Pennsylvania Municipal Bond
Tennessee Municipal Bond
Virginia Municipal Bond
Wisconsin Municipal Bond
Taxable Fixed Income
Core Bond
Core Plus Bond
High Income Bond
Inflation Protected Securities
Intermediate Government Bond
NWQ Flexible Income
Preferred Securities and Income
Short Term Bond
Strategic Income
Symphony Credit Opportunities
Symphony Floating Rate Income
Symphony High Yield Bond
Global/International
International Growth
NWQ Global All-Cap
NWQ Global Equity Income
NWQ International Value
Santa Barbara Global Dividend Growth
Global/International (continued)
Santa Barbara International Dividend Growth
Symphony International Equity
Value
Dividend Value
Large Cap Value
Mid Cap Value
NWQ Large-Cap Value
NWQ Multi-Cap Value
NWQ Small-Cap Value
NWQ Small/Mid-Cap Value
Small Cap Value
Growth
Growth
Large Cap Growth
Mid Cap Growth Opportunities
Small Cap Growth Opportunities
Symphony Large-Cap Growth
Winslow Large-Cap Growth
Core
Concentrated Core
Large Cap Core
Large Cap Select
Santa Barbara Dividend Growth
Small Cap Select
Symphony Low Volatility Equity
Core (continued)
Symphony Mid-Cap Core
Symphony Small Cap Core
Real Assets
Global Infrastructure
Gresham Diversified Commodity Strategy
Real Asset Income
Real Estate Securities
Asset Allocation
Multi-Asset Income
Multi-Asset Income Tax-Aware
Strategy Aggressive Growth Allocation
Strategy Balanced Allocation
Strategy Conservative Allocation
Strategy Growth Allocation
Alternative Strategies
Equity Long/Short
Equity Market Neutral
Several additional sources of information are available to you, including the codes of ethics adopted by the Funds, Nuveen, LLC, Nuveen Fund Advisors and SBAM. The appendix to this prospectus, “Variations in Sales Charge Reductions and Waivers Available Through Certain Intermediaries,” contains information on sales charge reductions and waivers available through certain financial intermediaries that differ from the sales charge reductions and waivers disclosed in this prospectus and the related statement of additional information. The statement of additional information, incorporated by reference into this prospectus, contains detailed information on the policies and operation of the Funds included in this prospectus. Additional information about the Funds’ investments is available in the annual and semi-annual reports to shareholders. In the Funds’ annual report, you will find a discussion of the market conditions and investment strategies that significantly affected the Funds’ performance during their last fiscal year. The Funds’ most recent statement of additional information, annual and semi-annual reports and certain other information are available, free of charge, by calling Nuveen Investor Services at (800) 257-8787, on the Funds’ website at www.nuveen.com, or through your financial advisor. Shareholders may call the toll free number above with any inquiries.
You may also obtain this and other Fund information directly from the Securities and Exchange Commission (“SEC”). Reports and other information about the Funds are available on the EDGAR Database on the SEC’s website at http://www.sec.gov or in person at the SEC’s Public Reference Room in Washington, D.C. Call the SEC at (202) 551-8090 for room hours and operation. You may also request Fund information by sending an e-mail request to publicinfo@sec.gov or by writing to the SEC’s Public Reference Section at 100 F Street, NE, Washington, D.C. 20549-1520. The SEC may charge a copying fee for this information.
The Funds are series of Nuveen Investment Trust II, whose Investment Company Act file number is 811-08333.
Distributed by
Nuveen Securities, LLC
333 West Wacker Drive
Chicago, Illinois 60606
(800) 257-8787
www.nuveen.com
MPR-SBGDG-1117P
Semi-Annual Report January 31, 2018
| | | Class / Ticker Symbol |
| | | Fund Name | | Class A | Class C | Class R3 | Class R6 | Class I | Class T |
| | | Nuveen Santa Barbara Dividend Growth Fund | | NSBAX | NSBCX | NBDRX | NSBFX | NSBRX | NSBUX |
| | | Nuveen Santa Barbara Global Dividend Growth Fund | | NUGAX | NUGCX | NUGRX | — | NUGIX | NUGTX |
| | | Nuveen Santa Barbara International Dividend Growth Fund | | NUIAX | NUICX | NUIRX | — | NUIIX | NUITX |
Nuveen makes things e-simple.
It only takes a minute to sign up for e-Reports. Once enrolled, you’ll receive an e-mail as soon as your Nuveen Fund information is ready. No more waiting for delivery by regular mail. Just click on the link within the e-mail to see the report and save it on your computer if you wish.
Free e-Reports right to your e-mail!
www.investordelivery.com
If you receive your Nuveen Fund distributions and statements from your financial advisor or brokerage account.
www.nuveen.com/accountaccess
If you receive your Nuveen Fund distributions and statements directly from Nuveen.
Must be preceded by or accompanied by a prospectus.
NOT FDIC INSURED MAY LOSE VALUE
NO BANK GUARANTEE
Chairman’s Letter
to Shareholders
Dear Shareholders,
Financial markets ended 2017 on a high note. Concurrent growth across the world’s major economies, strong corporate profits, low inflation and accommodative central banks provided an optimal environment for rising asset prices with remarkably low volatility. Political risks, which were expected to be a wildcard in 2017, did not materialize. The Trump administration achieved one of its major policy goals with the passage of the Tax Cuts and Jobs Act, the European Union (EU) member governments elected EU-friendly leadership, Brexit negotiations moved forward and China’s 19th Party Congress concluded with no major surprises in its economic policy objectives.
Conditions have turned more volatile in 2018, but the positive fundamentals underpinning the markets’ rise over the past year remain intact. In early February, fears of rising inflation, which could prompt more aggressive action by the Federal Reserve (Fed), trigged a widespread sell-off across U.S. and global equity markets. Yet, global economies are still expanding and corporate earnings look healthy, which helped markets stabilize and partially recover the losses.
We do believe volatility will continue to feature more prominently in 2018. Interest rates have been rising and inflation pressures are mounting. Jerome Powell’s first testimony as Fed Chairman increased the likelihood of four rate hikes in 2018, up from three projected at the end of 2017, while also emphasizing the gradual pace of rate hikes established by his predecessor will continue. Investors are uncertain about how markets will react amid tighter financial conditions. After the relative calm of the past few years, it’s anticipated that price fluctuations will begin trending toward a more historically normal range. But we also note that signs foreshadowing recession are lacking at this point.
Maintaining perspective can be difficult with daily headlines focused predominantly on short-term news. Nuveen believes this can be an opportune time to check in with your financial advisor. Strong market appreciation such as that in 2017 may create an imbalance in a diversified portfolio. Your advisor can help you reexamine your investment goals and risk tolerance, and realign your portfolio’s investment mix, if appropriate. On behalf of the other members of the Nuveen Fund Board, we look forward to continuing to earn your trust in the months and years ahead.
Sincerely,
William J. Schneider
Chairman of the Board
March 22, 2018
Portfolio Manager's
Comments
Nuveen Santa Barbara Dividend Growth Fund
Nuveen Santa Barbara Global Dividend Growth Fund
Nuveen Santa Barbara International Dividend Growth Fund
All of these Funds are managed by Santa Barbara Asset Management (SBAM), an affiliate of Nuveen, LLC. James R. Boothe, CFA, serves as portfolio manager for all three Funds and has managed the Funds since their inception.
Here he discusses key investment strategies and performance of the Funds for the six-month reporting period ended January 31, 2018.
How did the Funds perform during the six-month reporting period ended January 31, 2018?
The tables in the Fund Performance and Expense Ratios section of this report provide total return performance for the Funds for the six-month, one-year, five-year, ten-year and/or since inception periods ended January 31, 2018. Each Fund’s Class A Share total returns at net asset value (NAV) are compared with the performance of a corresponding market index and Lipper classification average. A more detailed account of each Fund’s performance is provided later in this report.
What strategies were used to manage the Funds during the six-month reporting period ended January 31, 2018 and how did these strategies influence performance?
Nuveen Santa Barbara Dividend Growth Fund
The Fund’s Class A Shares at NAV performed in line with the S&P 500® Index, and outperformed its Lipper classification average for the six-month reporting period ended January 31, 2018.
Santa Barbara’s investment objective for this Fund is to seek an attractive total return comprised of income from dividends and long-term capital appreciation by focusing on mid- to large-capitalization companies that have the potential for high dividend income and dividend growth. The security selection process is based on bottom-up fundamental analysis. Initially, companies are screened based on their dividend yields to identify potential candidates for investment. The fundamental research is then geared to identify those companies that appear positioned to grow their dividends over time. We strive to balance the portfolio across different sector and industry groups. However, due to the overarching focus on dividend paying securities, it is common for the portfolio to have the greatest exposure to industries with traditionally higher dividend yields, such as the utility, financial and energy sectors. The portfolio is structured with three key elements in mind: 1) a target dividend yield higher than that of the S&P 500® Index, 2) lower volatility than the S&P 500® Index, and 3) a focus on companies with growing dividends.
Under normal market conditions, the Fund invests at least 80% of its net assets in dividend-paying equity securities, which include preferred securities. The Fund may invest in small-, mid- and large-cap companies. The Fund may invest up to 25% of its net assets in non-U.S. equity securities that are U.S. dollar-denominated.
Stock selection was the key driver of this benchmark performance, while sector allocation was negative. Health care and energy holdings notably contributed to Fund performance. Selections in the consumer discretionary sector were a leading detractor of performance as well as our underweight to the information technology sector. Our cash position also detracted from performance.
This material is not intended to be a recommendation or investment advice, does not constitute a solicitation to buy or sell securities, and is not provided in a fiduciary capacity. The information provided does not take into account the specific objectives or circumstances of any particular investor, or suggest any specific course of action. Investment decisions should be made based on an investor’s objectives and circumstances and in consultation with his or her advisors.
Certain statements in this report are forward-looking statements. Discussions of specific investments are for illustration only and are not intended as recommendations of individual investments. The forward-looking statements and other views expressed herein are those of the portfolio manager as of the date of this report. Actual future results or occurrences may differ significantly from those anticipated in any forward-looking statements and the views expressed herein are subject to change at any time, due to numerous market and other factors. The Funds disclaim any obligation to update publicly or revise any forward-looking statements or views expressed herein.
Refer to the Glossary of Terms Used in this Report for further definition of the terms used within this section.
Portfolio Manager's Comments (continued)
Several individual holdings positively contributed to the Fund’s performance, health care holding AbbVie Inc. The manufacturer of a potential Humira biosimilar announced that their petition to invalidate one of the drug’s important patents was denied by the U.S. Patent and Trademark Office. This news reinforced investors’ hopes that Humira’s patents would protect it from generic competition for another several years. This gives management additional time to continue developing their pipeline and leverage sales from other drugs. Also contributing to performance was consumer discretionary holding Lowe’s Companies, Inc. The stock benefited from strong fundamental performance and a positive bump in sales during the second half of 2017, driven by hurricane recovery efforts. Lastly, information technology sector holding, Microsoft Corporation contributed to performance. The company announced better than expected sales and earnings related to improving margins. Margins continue to benefit from the change in product mix and also the fast growing and improving cloud businesses. Management also indicated an increasing share of enterprise IT spending budgets. We believe the company’s unique suite of products and enterprise relationships will continue to support a strong operating model and dividend growth.
Several holdings detracted from the Fund’s performance, including consumer discretionary holding Nielsen Holdings PLC. The company missed expectations for revenue and earnings in the reporting period. The consumer purchasing segment of the business remains challenged as clients cut costs in a slow growth environment. The audience measurement segment of the business, however, continues to grow with strength in digital initiatives. We believe the company has a competitive advantage in both areas and will drive earnings in an improving market. Also detracting from performance was telecommunication sector holding AT&T Inc. The company announced that the hurricanes would have a materially negative impact on subscriber numbers and earnings. They further revised video subscriber estimates based on increased competition. Management did however maintain their guidance for earnings growth and free cash flow, both of which were reassuring. However, news broke that the Department of Justice was building an antitrust case against AT&T Inc. regarding their planned merger with Time Warner Inc. We believe that the company will continue to execute in a disciplined manner while navigating the changing dynamics of the sector and we will monitor the developments around a governmental law suit. Lastly, consumer discretionary sector holding Walt Disney Company detracted from performance. During the reporting period, management reported disappointing sales, but earnings were strong. Management announced plans for proprietary streaming services for their Disney branded content and for ESPN to address the declining Pay TV video market. The announced termination of their relationship with Netflix at the end of 2018 worried investors. Based on the strong performance of studios and parks driven by enduring brands and content portfolio, we believe that management has a strong long-term strategy to steer the various aspects of the business.
Nuveen Santa Barbara Global Dividend Growth Fund
The Fund’s Class A Shares at NAV underperformed the MSCI World Index, but outperformed its Lipper classification average for the six-month reporting period ended January 31, 2018.
Santa Barbara’s investment objective for this Fund is to seek an attractive total return comprised of income from dividends and long-term capital appreciation. The security selection process is based on bottom-up fundamental analysis. Initially, companies are screened based on their dividend yields to identify potential candidates for investment. The fundamental research is then geared to identify those companies that appear positioned to grow their dividends over time. We strive to balance the portfolio across different sector and industry groups. However, due to the overarching focus on dividend paying securities, it is common for the portfolio to have the greatest exposure to industries with traditionally higher dividend yields, such as the utility, financial and energy sectors.
The Fund seeks capital appreciation by investing in companies with the potential for earnings growth. Secondarily, the strategy has an income component by limiting investments to companies that not only pay dividends, but are committed to growing them. This two-part philosophy of earnings growth combined with dividend growth is based on the belief that even growth companies should return capital in the form of dividends. Dividends may be a sign of capital discipline, financial well-being and business sustainability, three hallmarks of a high quality company. The income produced by dividends is a necessary adjunct to a sound capital appreciation strategy because it may limit volatility and potentially become a meaningful contributor to total return over time.
Under normal market conditions, the Fund invests at least 80% of its net assets in dividend-paying equity securities, which include preferred securities. Under normal market conditions, the Fund invests between 40% and 75% of its net assets in non-U.S. securities. The Fund may invest up to 10% of its net assets in companies located in emerging market countries. The Fund may invest in small-, mid and large-cap companies.
Sector allocation was the key driver of this benchmark underperformance. Stock selections and an unfavorable overweight position in the information technology and telecommunications services sector were the leading sources of negative relative performance. Health care and financial sector holdings notably contributed to performance.
Several individual holdings positively contributed to the Fund’s performance, health care holding AbbVie Inc. The manufacturer of a potential Humira biosimilar announced that their petition to invalidate one of the drug’s important patents was denied by the U.S. Patent and Trademark Office. This news reinforced investors’ hopes that Humira’s patents would protect it from generic competition for another several years. This gives management additional time to continue developing their pipeline and leverage sales from other drugs. Also contributing to performance was consumer discretionary holding Lowe’s Companies, Inc. The stock benefited from strong fundamental performance and a positive bump in sales during the second half of 2017, driven by hurricane recovery efforts. Lastly, information technology sector holding, Microsoft Corporation contributed to performance. The company announced better than expected sales and earnings related to improving margins. Margins continue to benefit from the change in product mix and also the fast growing and improving cloud businesses. Management also indicated an increasing share of enterprise IT spending budgets. We believe the company’s unique suite of products and enterprise relationships will continue to support a strong operating model and dividend growth.
Several holdings detracted from the Fund’s performance, including energy holding Enbridge Inc. Enbridge reduced its distribution and as a result was among the largest detractors from performance during the reporting period. Also detracting from performance was WPP PLC, the U.K. media and advertising agency. While results for the third quarter were in line with expectations, management revised topline growth down in the face of a spending pause from U.S. clients who are digesting legislative and monetary policy risks. In particular, consumer product management teams are re-examining all line items, especially marketing budgets, after increased investor scrutiny. We continue to monitor the entire industry for any fundamental changes to business dynamics, but we are confident that management’s long-term strategy and execution track record will drive long-term performance. Lastly, consumer discretionary holding Nielsen Holdings PLC. detracted from performance. The company missed expectations for revenue and earnings in the reporting period. The consumer purchasing segment of the business remains challenged as clients cut costs in a slow growth environment. The audience measurement segment of the business, however, continues to grow with strength in digital initiatives. We believe the company has a competitive advantage in both areas and will drive earnings in an improving market.
Nuveen Santa Barbara International Dividend Growth Fund
The Fund’s Class A Shares at NAV underperformed both the MSCI EAFE Index and its Lipper classification average during the six-month reporting period ended January 31, 2018.
Santa Barbara’s investment objective for this Fund is to seek an attractive total return comprised of income from dividends and long-term capital appreciation. The security selection process is based on bottom-up fundamental analysis. Initially, companies are screened based on their dividend yields to identify potential candidates for investment. The fundamental research is then geared to identify those companies that appear positioned to grow their dividends over time. We strive to balance the portfolio across different sector and industry groups. However, due to the overarching focus on dividend paying securities, it is common for the portfolio to have the greatest exposure to industries with traditionally higher dividend yields, such as the utility, financial and energy sectors. The Fund’s portfolio focuses on global equity securities of companies that have potential for dividend income and dividend growth in an effort to provide an attractive total return comprised of dividends and long-term capital appreciation.
Under normal market conditions, the Fund invests at least 80% of its net assets in dividend paying equity securities, which include preferred securities. Also, under normal market conditions, the Fund invests at least 80% of its net assets in non-U.S. securities. Although the Fund will concentrate its investments in developed markets, it may invest up to 10% of its net assets in companies located in emerging market countries. The Fund may invest in small-, mid- and large-cap companies. The Fund’s portfolio is structured with three key elements in mind: maintaining an aggregate dividend yield higher than that of the MSCI EAFE Index; seeking lower volatility than the MSCI EAFE Index; and investing in companies with a track record of increasing their dividends.
Stock selection was the key driver of this underperformance. Allocation effects were negative as well. Selections in the consumer discretionary and energy sectors were a leading source of negative relative performance, driven by a lack of exposure to some of the companies benefiting most from expectations for improved global growth. Holdings in the financial sector helped to limit relative underperformance.
Portfolio Manager's Comments (continued)
Several individual holdings positively contributed to the Fund’s performance, including consumer discretionary sector holding Daimler AG. The company announced record sales in all three of its units. Further, their Mercedes-Benz U.S. division announced strong sales in the last month of the 2017. In addition, material sector holding Koninklijke DSM NV contributed to performance. Koninklijke DSM is a leading player in highly attractive segments such as eubiotics and enzymes. Its pipeline of larger-scale innovations supports the view that it can grow its nutrition business by over 5% organically. The stock did well due to better than expected results in third quarter 2017, and higher prices for vitamin A and E. Moreover, with its underlevered balance sheet following the sale of Patheon to Thermo Fisher, the company is now well positioned for deploying its cash into higher growth opportunities. Lastly, industrials sector holding, Itochu Corporation contributed to performance. Management has performed well despite low guidance, analyst expectations and continued slow global economic growth. Weakness in the Yen has also contributed to the bottom line. Additionally, management has worked toward achieving strong dividend growth over the next year.
Several holdings detracted from the Fund’s performance, including energy holding Enbridge Inc. They reduced their distribution and as a result were among the largest detractors from performance during the reporting period. Also detracting from performance was WPP PLC, the U.K. media and advertising agency. While results for the third quarter were in line with expectations, management revised topline growth down in the face of a spending pause from U.S. clients who are digesting legislative and monetary policy risks. In particular, consumer product management teams are re-examining all line items, especially marketing budgets, after increased investor scrutiny. We continue to monitor the entire industry for any fundamental changes to business dynamics, but we are confident that management’s long-term strategy and execution track record will drive long-term performance. Lastly, consumer discretionary holding Nielsen Holdings PLC. detracted from performance. The company missed expectations for revenue and earnings in the reporting period. The Buy business remains challenged as clients cut costs in a slow growth environment. The Watch business, however, continues to grow with strength in digital initiatives. We believe the company has a competitive advantage in both areas and will drive earnings in an improving market.
Nuveen Santa Barbara Dividend Growth Fund
Mutual fund investing involves risk; principal loss is possible. Dividend-paying stocks, such as those held by the fund, are subject to market risk, concentration or sector risk, preferred security risk, and common stock risk. Smaller company stocks are subject to greater volatility. Foreign investments involve additional risks including currency fluctuations, political and economic instability, and lack of liquidity.
Nuveen Santa Barbara Global Dividend Growth Fund
Mutual fund investing involves risk; principal loss is possible. There is no guarantee the Fund’s investment objectives will be achieved. Dividends are not guaranteed. Prices of equity securities may decline significantly over short or extended periods of time. Non-U.S. investments involve risks such as currency fluctuation, political and economic instability, lack of liquidity and differing legal and accounting standards. These risks are magnified in emerging markets. These and other risk considerations, such as currency, growth stock, preferred security, and smaller company risks, are described in detail in the Fund’s prospectus.
Nuveen Santa Barbara International Dividend Growth Fund
Mutual fund investing involves risk; principal loss is possible. There is no guarantee the Fund’s investment objectives will be achieved. Dividends are not guaranteed. Prices of equity securities may decline significantly over short or extended periods of time. Non-U.S. investments involve risks such as currency fluctuation, political and economic instability, lack of liquidity and differing legal and accounting standards. These risks are magnified in emerging markets. These and other risk considerations, such as currency, growth stock, preferred security, and smaller company risks, are described in detail in the Fund’s prospectus.
THIS PAGE INTENTIONALLY LEFT BLANK
Fund Performance
and Expense Ratios
The Fund Performance and Expense Ratios for each Fund are shown within this section of the report.
Returns quoted represent past performance, which is no guarantee of future results. Investment returns and principal value will fluctuate so that when shares are redeemed, they may be worth more or less than their original cost. Current performance may be higher or lower than the performance shown. Total returns for a period of less than one year are not annualized. Returns at net asset value (NAV) would be lower if the sales charge were included. Returns assume reinvestment of dividends and capital gains. For performance, current to the most recent month-end visit nuveen.com or call (800) 257-8787.
Returns do not reflect the deduction of taxes that a shareholder would pay on Fund distributions or the redemption of Fund shares.
Returns may reflect fee waivers and/or expense reimbursements by the investment adviser during the periods presented. If any such waivers and/or reimbursements had not been in place, returns would have been reduced. See Notes to Financial Statements, Note 7—Management Fees and Other Transactions with Affiliates for more information.
Returns reflect differences in sales charges and expenses, which are primarily differences in distribution and service fees, and assume reinvestment of dividends and capital gains.
Comparative index and Lipper return information is provided for Class A Shares at NAV only.
The expense ratios shown reflect total operating expenses (before fee waivers and/or expense reimbursements, if any) as shown in the most recent prospectus. The expense ratios include management fees and other fees and expenses.
Effective July 2018, subsequent to the close of the reporting period, Class C Shares will automatically convert to Class A Shares after 10 years. Conversions will occur during the month in which the 10-year anniversary of the purchase occurs. Class C Shares that have been held for longer than 10 years as of July 1, 2018 will also convert to Class A Shares in July 2018. The automatic conversion will be based on the relative net asset values of the two share classes without the imposition of a sales charge or fee. The automatic conversion of Class C Shares to Class A Shares will not apply to shares held through group retirement plan recordkeeping platforms of certain financial intermediaries who hold such shares in an omnibus account and do not track participant level share lot aging to facilitate such a conversion.
Fund Performance and Expense Ratios (continued)
Nuveen Santa Barbara Dividend Growth Fund
Refer to the first page of this Fund Performance and Expense Ratios section for further explanation of the information included within this section. Refer to the Glossary of Terms Used in this Report for definitions of terms used within this section.
Fund Performance
Average Annual Total Returns as of January 31, 2018
| | Cumulative | | Average Annual |
| | 6-Month | | 1-Year | 5-Year | 10-Year |
| Class A Shares at NAV | 15.37% | | 25.15% | 13.07% | 8.94% |
| Class A Shares at maximum Offering Price | 8.74% | | 17.95% | 11.75% | 8.30% |
| S&P 500® Index | 15.43% | | 26.41% | 15.91% | 9.78% |
| Lipper Equity Income Funds Classification Average | 11.97% | | 18.80% | 12.00% | 7.95% |
| Class C Shares | 14.95% | | 24.25% | 12.23% | 8.12% |
| Class I Shares | 15.50% | | 25.47% | 13.35% | 9.21% |
| | Cumulative | | Average Annual |
| | 6-Month | | 1-Year | 5-Year | Since
Inception |
| Class R3 Shares | 15.22% | | 24.86% | 12.79% | 16.22% |
| Class R6 Shares | 15.56% | | 25.56% | N/A | 13.07% |
| Class T Shares at NAV* | 15.39% | | N/A | N/A | 18.16% |
| Class T Shares at maximum Offering Price* | 12.49% | | N/A | N/A | 15.20% |
Average Annual Total Returns as of December 31, 2017 (Most Recent Calendar Quarter)
| | Cumulative | | Average Annual |
| | 6-Month | | 1-Year | 5-Year | 10-Year |
| Class A Shares at NAV | 10.54% | | 19.71% | 12.86% | 8.28% |
| Class A Shares at maximum Offering Price | 4.19% | | 12.82% | 11.53% | 7.64% |
| Class C Shares | 10.13% | | 18.83% | 12.02% | 7.47% |
| Class I Shares | 10.67% | | 20.03% | 13.14% | 8.55% |
| | Cumulative | | Average Annual |
| | 6-Month | | 1-Year | 5-Year | Since
Inception |
| Class R3 Shares | 10.40% | | 19.41% | 12.57% | 15.73% |
| Class R6 Shares | 10.72% | | 20.08% | N/A | 12.11% |
| Class T Shares at NAV* | 10.54% | | N/A | N/A | 12.29% |
| Class T Shares at maximum Offering Price* | 7.77% | | N/A | N/A | 9.47% |
Since inception returns for Class R3 Shares, Class R6 Shares and Class T Shares are from 3/3/09, 3/25/13 and 5/31/17, respectively. Since inception returns for Class T Shares are cumulative. Indexes and Lipper averages are not available for direct investment.
Class A Shares have a maximum 5.75% sales charge (Offering Price). Class A Share purchases of $1 million or more are sold at net asset value without an up-front sales charge but may be subject to a contingent deferred sales charge (CDSC) of 1% if redeemed within eighteen months of purchase. Class C Shares have a 1% CDSC for redemptions within less than twelve months, which is not reflected in the total returns. Class R3 Shares have no sales charge and are only available for purchase by eligible retirement plans.
Class R6 Shares have no sales charge and are available only to certain limited categories of investors as described in the prospectus. Class I Shares have no sales charge and may be purchased under limited circumstances or by specified classes of investors. Class T Shares have a maximum 2.50% sales charge (Offering Price).
Expense Ratios as of Most Recent Prospectus
| | Share Class |
| | Class A | Class C | Class R3 | Class R6 | Class I | Class T* |
| Expense Ratios | 0.97% | 1.72% | 1.22% | 0.65% | 0.72% | 0.97% |
| * | Class T Shares are not available for public offering. | |
Fund Performance and Expense Ratios (continued)
Nuveen Santa Barbara Global Dividend Growth Fund
Refer to the first page of this Fund Performance and Expense Ratios section for further explanation of the information included within this section. Refer to the Glossary of Terms Used in this Report for definitions of terms used within this section.
Fund Performance
Average Annual Total Returns as of January 31, 2018
| | Cumulative | | Average Annual |
| | 6-Month | | 1-Year | 5-Year | Since
Inception |
| Class A Shares at NAV | 11.74% | | 23.09% | 9.82% | 11.62% |
| Class A Shares at maximum Offering Price | 5.32% | | 16.01% | 8.53% | 10.45% |
| MSCI World Index | 13.73% | | 25.83% | 11.68% | 13.92% |
| Lipper Global Equity Income Funds Classification Average | 9.51% | | 19.51% | 8.50% | 10.58% |
| Class C Shares | 11.32% | | 22.16% | 9.01% | 10.79% |
| Class R3 Shares | 11.59% | | 22.80% | 9.55% | 11.34% |
| Class I Shares | 11.84% | | 23.31% | 10.09% | 11.89% |
Average Annual Total Returns as of December 31, 2017 (Most Recent Calendar Quarter)
| | Cumulative | | Average Annual |
| | 6-Month | | 1-Year | 5-Year | Since
Inception |
| Class A Shares at NAV | 8.28% | | 19.50% | 9.72% | 10.96% |
| Class A Shares at maximum Offering Price | 2.05% | | 12.63% | 8.43% | 9.78% |
| Class C Shares | 7.90% | | 18.67% | 8.91% | 10.14% |
| Class R3 Shares | 8.16% | | 19.25% | 9.45% | 10.68% |
| Class I Shares | 8.45% | | 19.85% | 9.99% | 11.23% |
Since inception returns are from 6/11/12. Indexes and Lipper averages are not available for direct investment.
Class A Shares have a maximum 5.75% sales charge (Offering Price). Class A Share purchases of $1 million or more are sold at net asset value without an up-front sales charge but may be subject to a contingent deferred sales charge (CDSC) of 1% if redeemed within eighteen months of purchase. Class C Shares have a 1% CDSC for redemptions within less than twelve months, which is not reflected in the total returns. Class R3 Shares have no sales charge and are only available for purchase by eligible retirement plans. Class I Shares have no sales charge and may be purchased under limited circumstances or by specified classes of investors.
Expense Ratios as of Most Recent Prospectus
| | Share Class |
| | Class A | Class C | Class R3 | Class I |
| Gross Expense Ratios | 1.25% | 2.00% | 1.50% | 1.01% |
| Net Expense Ratios | 1.15% | 1.90% | 1.40% | 0.90% |
The Fund’s investment adviser has contractually agreed to waive fees and/or reimburse expenses through July 31, 2019 so that total annual Fund operating expenses (excluding 12b-1 distribution and/or service fees, interest expenses, taxes, acquired fund fees and expenses, fees incurred in acquiring and disposing of portfolio securities and extraordinary expenses) do not exceed 0.94% of the average daily net assets of any class of Fund shares. This expense limitation may be terminated or modified prior to that date only with the approval of the Board of Trustees of the Fund.
Nuveen Santa Barbara International Dividend Growth Fund
Refer to the first page of this Fund Performance and Expense Ratios section for further explanation of the information included within this section. Refer to the Glossary of Terms Used in this Report for definitions of terms used within this section.
Fund Performance
Average Annual Total Returns as of January 31, 2018
| | Cumulative | | Average Annual |
| | 6-Month | | 1-Year | 5-Year | Since
Inception |
| Class A Shares at NAV | 7.88% | | 21.37% | 6.22% | 9.40% |
| Class A Shares at maximum Offering Price | 1.68% | | 14.40% | 4.97% | 8.26% |
| MSCI EAFE Index | 12.14% | | 27.60% | 7.85% | 11.41% |
| Lipper International Equity Income Funds Classification Average | 10.26% | | 24.73% | 5.23% | 8.45% |
| Class C Shares | 7.45% | | 20.46% | 5.42% | 8.58% |
| Class R3 Shares | 7.74% | | 21.05% | 5.95% | 9.13% |
| Class I Shares | 8.00% | | 21.65% | 6.47% | 9.67% |
Average Annual Total Returns as of December 31, 2017 (Most Recent Calendar Quarter)
| | Cumulative | | Average Annual |
| | 6-Month | | 1-Year | 5-Year | Since
Inception |
| Class A Shares at NAV | 5.56% | | 19.96% | 6.46% | 8.88% |
| Class A Shares at maximum Offering Price | (0.51)% | | 13.06% | 5.20% | 7.72% |
| Class C Shares | 5.18% | | 19.11% | 5.66% | 8.07% |
| Class R3 Shares | 5.40% | | 19.63% | 6.18% | 8.60% |
| Class I Shares | 5.68% | | 20.23% | 6.71% | 9.14% |
Since inception returns are from 6/11/12. Indexes and Lipper averages are not available for direct investment.
Class A Shares have a maximum 5.75% sales charge (Offering Price). Class A Share purchases of $1 million or more are sold at net asset value without an up-front sales charge but may be subject to a contingent deferred sales charge (CDSC) of 1% if redeemed within eighteen months of purchase. Class C Shares have a 1% CDSC for redemptions within less than twelve months, which is not reflected in the total returns. Class R3 Shares have no sales charge and are only available for purchase by eligible retirement plans. Class I Shares have no sales charge and may be purchased under limited circumstances or by specified classes of investors.
Expense Ratios as of Most Recent Prospectus
| | Share Class |
| | Class A | Class C | Class R3 | Class I |
| Gross Expense Ratios | 4.53% | 5.19% | 4.76% | 4.14% |
| Net Expense Ratios | 1.15% | 1.90% | 1.40% | 0.90% |
The Fund’s investment adviser has contractually agreed to waive fees and/or reimburse expenses through July 31, 2019 so that total annual Fund operating expenses (excluding 12b-1 distribution and/or service fees, interest expenses, taxes, acquired fund fees and expenses, fees incurred in acquiring and disposing of portfolio securities and extraordinary expenses) do not exceed 0.94% of the average daily net assets of any class of Fund shares. This expense limitation may be terminated or modified prior to that date only with the approval of the Board of Trustees of the Fund.
Holding
Summaries as of January 31, 2018
This data relates to the securities held in each Fund's portfolio of investments as of the end of this reporting period. It should not be construed as a measure of performance for the Fund itself. Holdings are subject to change.
Nuveen Santa Barbara Dividend Growth Fund
Fund Allocation
(% of net assets) | |
| Common Stocks | 97.6% |
| Repurchase Agreements | 2.2% |
| Other Assets Less Liabilities | 0.2% |
| Net Assets | 100% |
Portfolio Composition
(% of net assets) | |
| Pharmaceuticals | 6.4% |
| Banks | 6.1% |
| Media | 5.7% |
| IT Services | 5.6% |
| Oil, Gas & Consumable Fuels | 5.3% |
| Health Care Equipment & Supplies | 5.0% |
| Software | 4.2% |
| Insurance | 4.2% |
| Technology Hardware, Storage & Peripherals | 4.0% |
| Chemicals | 3.8% |
| Specialty Retail | 3.2% |
| Health Care Providers & Services | 3.2% |
| Communications Equipment | 2.8% |
| Electric Utilities | 2.8% |
| Industrial Conglomerates | 2.6% |
| Containers & Packaging | 2.6% |
| Beverages | 2.5% |
| Capital Markets | 2.5% |
| Road & Rail | 2.5% |
| Food & Staples Retailing | 2.4% |
| Aerospace & Defense | 2.2% |
| Other | 18.0% |
| Repurchase Agreements | 2.2% |
| Other Assets Less Liabilities | 0.2% |
| Net Assets | 100% |
Top Five Common Stock Holdings
(% of net assets) | |
| Microsoft Corporation | 4.2% |
| Apple, Inc. | 4.0% |
| Lowe's Companies, Inc. | 3.2% |
| UnitedHealth Group Incorporated | 3.2% |
| Phillips 66 | 3.2% |
Nuveen Santa Barbara Global Dividend Growth Fund
Fund Allocation
(% of net assets) | |
| Common Stocks | 97.3% |
| Repurchase Agreements | 2.4% |
| Other Assets Less Liabilities | 0.3% |
| Net Assets | 100% |
Top Five Common Stock Holdings
(% of net assets) | |
| Microsoft Corporation | 3.4% |
| Macquarie Group Limited | 3.1% |
| Apple, Inc. | 2.9% |
| BOC Hong Kong Holdings Limited | 2.8% |
| UnitedHealth Group Incorporated | 2.8% |
Portfolio Composition
(% of net assets) | |
| Banks | 11.2% |
| Oil, Gas & Consumable Fuels | 6.5% |
| Software | 5.9% |
| Electric Utilities | 4.5% |
| Containers & Packaging | 4.5% |
| Pharmaceuticals | 4.4% |
| Aerospace & Defense | 4.4% |
| Health Care Equipment & Supplies | 3.9% |
| Personal Products | 3.6% |
| Wireless Telecommunication Services | 3.4% |
| Beverages | 3.4% |
| Capital Markets | 3.1% |
| Technology Hardware, Storage & Peripherals | 2.9% |
| Professional Services | 2.9% |
| Health Care Providers & Services | 2.8% |
| Media | 2.8% |
| Diversified Telecommunication Services | 2.8% |
| Industrial Conglomerates | 2.4% |
| Biotechnology | 2.1% |
| Other | 19.8% |
| Repurchase Agreements | 2.4% |
| Other Assets Less Liabilities | 0.3% |
| Net Assets | 100% |
Country Allocation1
(% of net assets) | |
| United States | 53.0% |
| United Kingdom | 13.5% |
| France | 9.6% |
| Australia | 5.3% |
| Japan | 5.3% |
| Germany | 4.4% |
| Canada | 3.0% |
| China | 2.8% |
| Netherlands | 1.4% |
| Hong Kong | 1.4% |
| Other Assets Less Liabilities | 0.3% |
| Net Assets | 100% |
| 1 | Includes 2.8% (as a percentage of net assets) in emerging market countries. | |
Holding Summaries as of January 31, 2018 (continued)
Nuveen Santa Barbara International Dividend Growth Fund
Fund Allocation
(% of net assets) | |
| Common Stocks | 99.3% |
| Other Assets Less Liabilities | 0.7% |
| Net Assets | 100% |
Top Five Common Stock Holdings
(% of net assets) | |
| Itochu Corporation | 4.1% |
| Danske Bank A/S | 4.0% |
| Macquarie Group Limited | 3.8% |
| BOC Hong Kong Holdings Limited | 3.8% |
| Safran SA | 3.7% |
Portfolio Composition
(% of net assets) | |
| Banks | 17.8% |
| Chemicals | 6.7% |
| Electric Utilities | 5.9% |
| Oil, Gas & Consumable Fuels | 5.9% |
| Wireless Telecommunication Services | 5.7% |
| Personal Products | 4.3% |
| Trading Companies & Distributors | 4.1% |
| Professional Services | 3.9% |
| Capital Markets | 3.8% |
| Aerospace & Defense | 3.7% |
| Automobiles | 3.6% |
| Software | 3.1% |
| Diversified Financial Services | 3.1% |
| Containers & Packaging | 3.0% |
| Hotels, Restaurants & Leisure | 3.0% |
| Diversified Telecommunication Services | 2.9% |
| Other | 18.8% |
| Other Assets Less Liabilities | 0.7% |
| Net Assets | 100% |
Country Allocation1
(% of net assets) | |
| United Kingdom | 21.6% |
| France | 14.5% |
| Japan | 11.2% |
| Germany | 10.3% |
| Australia | 6.8% |
| Canada | 6.3% |
| Spain | 5.6% |
| Netherlands | 5.6% |
| Denmark | 4.0% |
| China | 3.8% |
| Other | 9.6% |
| Other Assets Less Liabilities | 0.7% |
| Net Assets | 100% |
| 1 | Includes 3.8% (as a percentage of net assets) in emerging market countries. | |
As a shareholder of one or more of the Funds, you incur two types of costs: (1) transaction costs, including up-front and back-end sales charges (loads) or redemption fees, where applicable; and (2) ongoing costs, including management fees; distribution and service (12b-1) fees, where applicable; and other Fund expenses. The Examples below are intended to help you understand your ongoing costs (in dollars) of investing in the Funds and to compare these costs with the ongoing costs of investing in other mutual funds.
The Examples below are based on an investment of $1,000 invested at the beginning of the period and held through the period ended January 31, 2018.
The beginning of the period is August 1, 2017.
The information under “Actual Performance,” together with the amount you invested, allows you to estimate actual expenses incurred over the reporting period. Simply divide your account value by $1,000 (for example, an $8,600 account value divided by $1,000 = 8.60) and multiply the result by the cost shown for your share class, in the row entitled “Expenses Incurred During Period” to estimate the expenses incurred on your account during this period.
The information under “Hypothetical Performance,” provides information about hypothetical account values and hypothetical expenses based on each Fund’s actual expense ratio and an assumed rate of return of 5% per year before expenses, which is not the Fund’s actual return. The hypothetical account values and expenses may not be used to estimate the actual ending account balance or expense you incurred for the period. You may use this information to compare the ongoing costs of investing in the Fund and other funds. To do so, compare this 5% hypothetical example with the 5% hypothetical examples that appear in the shareholder reports of the other funds.
Please note that the expenses shown in the following tables are meant to highlight your ongoing costs only and do not reflect any transaction costs. Therefore, the hypothetical information is useful in comparing ongoing costs only, and will not help you determine the relative total costs of owning different funds or share classes. In addition, if these transaction costs were included, your costs would have been higher.
Nuveen Santa Barbara Dividend Growth Fund
| | Share Class |
| | Class A | Class C | Class R3 | Class R6 | Class I | Class T* |
| Actual Performance | | | | | | |
| Beginning Account Value | $1,000.00 | $1,000.00 | $1,000.00 | $1,000.00 | $1,000.00 | $1,000.00 |
| Ending Account Value | $1,153.70 | $1,149.50 | $1,152.20 | $1,155.60 | $1,155.00 | $1,153.90 |
| Expenses Incurred During the Period | $ 5.21 | $ 9.26 | $ 6.56 | $ 3.48 | $ 3.86 | $ 5.21 |
Hypothetical Performance
(5% annualized return before expenses) | | | | | | |
| Beginning Account Value | $1,000.00 | $1,000.00 | $1,000.00 | $1,000.00 | $1,000.00 | $1,000.00 |
| Ending Account Value | $1,020.37 | $1,016.59 | $1,019.11 | $1,021.98 | $1,021.63 | $1,020.37 |
| Expenses Incurred During the Period | $ 4.89 | $ 8.69 | $ 6.16 | $ 3.26 | $ 3.62 | $ 4.89 |
For each class of the Fund, expenses are equal to the Fund’s annualized net expense ratio of 0.96%, 1.71%, 1.21%, 0.64%, 0.71% and 0.96% for Classes A, C, R3, R6, I and T, respectively, multiplied by the average account value over the period, multiplied by 184/365 (to reflect the one-half year period).
| * | Class T Shares are not available for public offering. | |
Expense Examples (continued)
Nuveen Santa Barbara Global Dividend Growth Fund
| | Share Class |
| | Class A | Class C | Class R3 | Class I |
| Actual Performance | | | | |
| Beginning Account Value | $1,000.00 | $1,000.00 | $1,000.00 | $1,000.00 |
| Ending Account Value | $1,117.40 | $1,113.20 | $1,115.90 | $1,118.40 |
| Expenses Incurred During the Period | $ 6.14 | $ 10.12 | $ 7.47 | $ 4.81 |
Hypothetical Performance
(5% annualized return before expenses) | | | | |
| Beginning Account Value | $1,000.00 | $1,000.00 | $1,000.00 | $1,000.00 |
| Ending Account Value | $1,019.41 | $1,015.63 | $1,018.15 | $1,020.67 |
| Expenses Incurred During the Period | $ 5.85 | $ 9.65 | $ 7.12 | $ 4.58 |
For each class of the Fund, expenses are equal to the Fund’s annualized net expense ratio of 1.15%, 1.90%, 1.40% and 0.90% for Classes A, C, R3 and I, respectively, multiplied by the average account value over the period, multiplied by 184/365 (to reflect the one-half year period).
Nuveen Santa Barbara International Dividend Growth Fund
| | Share Class |
| | Class A | Class C | Class R3 | Class I |
| Actual Performance | | | | |
| Beginning Account Value | $1,000.00 | $1,000.00 | $1,000.00 | $1,000.00 |
| Ending Account Value | $1,078.80 | $1,074.50 | $1,077.40 | $1,080.00 |
| Expenses Incurred During the Period | $ 6.03 | $ 9.93 | $ 7.33 | $ 4.72 |
Hypothetical Performance
(5% annualized return before expenses) | | | | |
| Beginning Account Value | $1,000.00 | $1,000.00 | $1,000.00 | $1,000.00 |
| Ending Account Value | $1,019.41 | $1,015.63 | $1,018.15 | $1,020.67 |
| Expenses Incurred During the Period | $ 5.85 | $ 9.65 | $ 7.12 | $ 4.58 |
For each class of the Fund, expenses are equal to the Fund’s annualized net expense ratio of 1.15%, 1.90%, 1.40% and 0.90% for Classes A, C, R3 and I, respectively, multiplied by the average account value over the period, multiplied by 184/365 (to reflect the one-half year period).
Nuveen Santa Barbara Dividend Growth Fund
| Portfolio of Investments | January 31, 2018 (Unaudited) |
| Shares | | Description (1) | | | | Value |
| | | LONG-TERM INVESTMENTS – 97.6% | | | | |
| | | COMMON STOCKS – 97.6% | | | | |
| | | Aerospace & Defense – 2.2% | | | | |
| 208,367 | | Lockheed Martin Corporation | | | | $ 73,939,030 |
| | | Banks – 6.1% | | | | |
| 876,838 | | JPMorgan Chase & Co. | | | | 101,423,852 |
| 1,551,401 | | Wells Fargo & Company | | | | 102,051,158 |
| | | Total Banks | | | | 203,475,010 |
| | | Beverages – 2.5% | | | | |
| 694,886 | | PepsiCo, Inc. | | | | 83,594,786 |
| | | Biotechnology – 2.2% | | | | |
| 646,192 | | AbbVie Inc. | | | | 72,515,666 |
| | | Capital Markets – 2.5% | | | | |
| 147,057 | | BlackRock Inc | | | | 82,616,623 |
| | | Chemicals – 3.8% | | | | |
| 497,712 | | Monsanto Company | | | | 60,621,322 |
| 402,963 | | Praxair, Inc. | | | | 65,074,495 |
| | | Total Chemicals | | | | 125,695,817 |
| | | Communications Equipment – 2.8% | | | | |
| 2,265,382 | | Cisco Systems, Inc. | | | | 94,103,968 |
| | | Containers & Packaging – 2.6% | | | | |
| 683,873 | | Packaging Corp. of America | | | | 85,914,965 |
| | | Diversified Telecommunication Services – 2.0% | | | | |
| 1,830,871 | | AT&T Inc. | | | | 68,566,119 |
| | | Electric Utilities – 2.8% | | | | |
| 580,664 | | NextEra Energy Inc. | | | | 91,988,791 |
| | | Energy Equipment & Services – 1.5% | | | | |
| 685,342 | | Schlumberger Limited | | | | 50,427,464 |
| | | Equity Real Estate Investment Trust – 1.3% | | | | |
| 771,257 | | CyrusOne Inc. | | | | 44,493,816 |
| | | Food & Staples Retailing – 2.4% | | | | |
| 1,007,275 | | CVS Health Corporation | | | | 79,262,470 |
Nuveen Santa Barbara Dividend Growth Fund (continued)
| Portfolio of Investments | January 31, 2018 (Unaudited) |
| Shares | | Description (1) | | | | Value |
| | | Food Products – 2.0% | | | | |
| 1,501,037 | | Mondelez International Inc. | | | | $ 66,646,043 |
| | | Health Care Equipment & Supplies – 5.0% | | | | |
| 367,359 | | Becton, Dickinson and Company | | | | 89,246,195 |
| 890,747 | | Medtronic, PLC | | | | 76,506,260 |
| | | Total Health Care Equipment & Supplies | | | | 165,752,455 |
| | | Health Care Providers & Services – 3.2% | | | | |
| 456,236 | | UnitedHealth Group Incorporated | | | | 108,027,560 |
| | | Household Durables – 1.6% | | | | |
| 303,170 | | Whirlpool Corporation | | | | 55,001,101 |
| | | Household Products – 2.0% | | | | |
| 900,991 | | Colgate-Palmolive Company | | | | 66,889,572 |
| | | Industrial Conglomerates – 2.6% | | | | |
| 540,176 | | Honeywell International Inc. | | | | 86,249,902 |
| | | Insurance – 4.2% | | | | |
| 447,348 | | Ace Limited | | | | 69,853,390 |
| 832,483 | | Marsh & McLennan Companies, Inc. | | | | 69,528,980 |
| | | Total Insurance | | | | 139,382,370 |
| | | IT Services – 5.6% | | | | |
| 567,826 | | Accenture Limited | | | | 91,249,638 |
| 922,348 | | Fidelity National Information Services | | | | 94,411,541 |
| | | Total IT Services | | | | 185,661,179 |
| | | Machinery – 2.0% | | | | |
| 719,155 | | Ingersoll Rand Company Limited, Class A | | | | 68,053,638 |
| | | Media – 5.7% | | | | |
| 2,124,166 | | Comcast Corporation, Class A | | | | 90,340,780 |
| 2,016,526 | | Interpublic Group of Companies, Inc. | | | | 44,141,754 |
| 503,637 | | Walt Disney Company | | | | 54,730,233 |
| | | Total Media | | | | 189,212,767 |
| | | Multi-Utilities – 2.0% | | | | |
| 1,038,876 | | WEC Energy Group, Inc. | | | | 66,799,727 |
| | | Oil, Gas & Consumable Fuels – 5.3% | | | | |
| 562,889 | | Chevron Corporation | | | | 70,558,136 |
| 1,042,826 | | Phillips 66 | | | | 106,785,382 |
| | | Total Oil, Gas & Consumable Fuels | | | | 177,343,518 |
| | | Pharmaceuticals – 6.4% | | | | |
| 372,296 | | Allergan PLC | | | | 67,110,077 |
| 515,488 | | Johnson & Johnson | | | | 71,235,287 |
| Shares | | Description (1) | | | | Value |
| | | Pharmaceuticals (continued) | | | | |
| 2,059,977 | | Pfizer Inc. | | | | $ 76,301,548 |
| | | Total Pharmaceuticals | | | | 214,646,912 |
| | | Professional Services – 1.4% | | | | |
| 1,294,645 | | Nielsen Holdings PLC | | | | 48,432,669 |
| | | Road & Rail – 2.5% | | | | |
| 613,989 | | Union Pacific Corporation | | | | 81,967,532 |
| | | Software – 4.2% | | | | |
| 1,481,287 | | Microsoft Corporation | | | | 140,737,078 |
| | | Specialty Retail – 3.2% | | | | |
| 1,033,938 | | Lowe's Companies, Inc. | | | | 108,284,327 |
| | | Technology Hardware, Storage & Peripherals – 4.0% | | | | |
| 792,982 | | Apple, Inc. | | | | 132,768,976 |
| |
| | | Total Long-Term Investments (cost $2,054,397,867) | | | | 3,258,451,851 |
| Principal Amount (000) | | Description (1) | Coupon | Maturity | | Value |
| | | SHORT-TERM INVESTMENTS – 2.2% | | | | |
| | | REPURCHASE AGREEMENTS – 2.2% | | | | |
| $ 72,717 | | Repurchase Agreement with Fixed Income Clearing Corporation, dated 1/31/18, repurchase price $72,718,262, collateralized by $75,375,000 U.S. Treasury Notes, 1.875%, due 3/31/22, value $74,171,563 | 0.540% | 2/01/18 | | $ 72,717,171 |
| | | Total Short-Term Investments (cost $72,717,171) | | | | 72,717,171 |
| | | Total Investments (cost $2,127,115,038) – 99.8% | | | | 3,331,169,022 |
| | | Other Assets Less Liabilities – 0.2% | | | | 5,689,722 |
| | | Net Assets – 100% | | | | $ 3,336,858,744 |
| | For Fund portfolio compliance purposes, the Fund’s industry classifications refer to any one or more of the industry sub-classifications used by one or more widely recognized market indexes or ratings group indexes, and/or as defined by Fund management. This definition may not apply for purposes of this report, which may combine industry sub-classifications into sectors for reporting ease. | |
| (1) | All percentages shown in the Portfolio of Investments are based on net assets. | |
See accompanying notes to financial statements.
Nuveen Santa Barbara Global Dividend Growth Fund
| Portfolio of Investments | January 31, 2018 (Unaudited) |
| Shares | | Description (1) | | | | Value |
| | | LONG-TERM INVESTMENTS – 97.3% | | | | |
| | | COMMON STOCKS – 97.3% | | | | |
| | | Aerospace & Defense – 4.4% | | | | |
| 1,058 | | Lockheed Martin Corporation | | | | $375,431 |
| 5,148 | | Safran SA, (2) | | | | 581,627 |
| | | Total Aerospace & Defense | | | | 957,058 |
| | | Automobiles – 1.9% | | | | |
| 4,438 | | Daimler AG, (2) | | | | 406,462 |
| | | Banks – 11.2% | | | | |
| 121,700 | | BOC Hong Kong Holdings Limited, (2) | | | | 620,677 |
| 5,150 | | JPMorgan Chase & Co. | | | | 595,701 |
| 449,482 | | Lloyds Banking Group PLC, (2) | | | | 444,087 |
| 5,800 | | Toronto-Dominion Bank | | | | 352,810 |
| 6,499 | | Wells Fargo & Company | | | | 427,504 |
| | | Total Banks | | | | 2,440,779 |
| | | Beverages – 3.4% | | | | |
| 2,839 | | Heineken NV, (2) | | | | 319,073 |
| 3,448 | | PepsiCo, Inc. | | | | 414,794 |
| | | Total Beverages | | | | 733,867 |
| | | Biotechnology – 2.1% | | | | |
| 4,128 | | AbbVie Inc. | | | | 463,244 |
| | | Capital Markets – 3.1% | | | | |
| 8,120 | | Macquarie Group Limited, (2) | | | | 673,774 |
| | | Containers & Packaging – 4.5% | | | | |
| 41,903 | | Amcor Limited, (2) | | | | 489,978 |
| 3,903 | | Packaging Corp. of America | | | | 490,334 |
| | | Total Containers & Packaging | | | | 980,312 |
| | | Diversified Financial Services – 2.0% | | | | |
| 23,500 | | Orix Corporation, (2) | | | | 440,194 |
| | | Diversified Telecommunication Services – 2.8% | | | | |
| 8,153 | | AT&T Inc. | | | | 305,330 |
| 248,487 | | HKT Trust and HKT Limited | | | | 310,980 |
| | | Total Diversified Telecommunication Services | | | | 616,310 |
| | | Electric Utilities – 4.5% | | | | |
| 3,502 | | NextEra Energy Inc. | | | | 554,787 |
| Shares | | Description (1) | | | | Value |
| | | Electric Utilities (continued) | | | | |
| 23,559 | | Scottish and Southern Energy PLC, (2) | | | | $ 436,901 |
| | | Total Electric Utilities | | | | 991,688 |
| | | Energy Equipment & Services – 1.4% | | | | |
| 4,313 | | Schlumberger Limited | | | | 317,351 |
| | | Equity Real Estate Investment Trust – 1.3% | | | | |
| 4,990 | | CyrusOne Inc. | | | | 287,873 |
| | | Food Products – 2.0% | | | | |
| 5,056 | | Groupe Danone, (2) | | | | 435,152 |
| | | Health Care Equipment & Supplies – 3.9% | | | | |
| 1,965 | | Becton, Dickinson and Company | | | | 477,377 |
| 4,355 | | Medtronic, PLC | | | | 374,051 |
| | | Total Health Care Equipment & Supplies | | | | 851,428 |
| | | Health Care Providers & Services – 2.8% | | | | |
| 2,619 | | UnitedHealth Group Incorporated | | | | 620,127 |
| | | Hotels, Restaurants & Leisure – 1.3% | | | | |
| 13,198 | | Compass Group PLC, (2) | | | | 277,882 |
| | | Household Durables – 1.1% | | | | |
| 1,370 | | Whirlpool Corporation | | | | 248,545 |
| | | Household Products – 1.6% | | | | |
| 3,552 | | Reckitt and Benckiser, (2) | | | | 343,017 |
| | | Industrial Conglomerates – 2.4% | | | | |
| 3,279 | | Honeywell International Inc. | | | | 523,558 |
| | | IT Services – 2.0% | | | | |
| 4,364 | | Fidelity National Information Services | | | | 446,699 |
| | | Media – 2.8% | | | | |
| 9,128 | | Comcast Corporation, Class A | | | | 388,214 |
| 12,753 | | WPP PLC, (2) | | | | 230,957 |
| | | Total Media | | | | 619,171 |
| | | Oil, Gas & Consumable Fuels – 6.5% | | | | |
| 2,978 | | Chevron Corporation | | | | 373,292 |
| 8,100 | | Enbridge Inc. | | | | 296,539 |
| 3,220 | | Phillips 66 | | | | 329,728 |
| 7,237 | | Total SA, (2) | | | | 419,601 |
| | | Total Oil, Gas & Consumable Fuels | | | | 1,419,160 |
| | | Personal Products – 3.6% | | | | |
| 1,322 | | L'Oreal, (2) | | | | 300,430 |
Nuveen Santa Barbara Global Dividend Growth Fund (continued)
| Portfolio of Investments | January 31, 2018 (Unaudited) |
| Shares | | Description (1) | | | | Value |
| | | Personal Products (continued) | | | | |
| 8,736 | | Unilever NV, (2) | | | | $ 494,425 |
| | | Total Personal Products | | | | 794,855 |
| | | Pharmaceuticals – 4.4% | | | | |
| 1,222 | | Allergan PLC | | | | 220,278 |
| 10,480 | | Pfizer Inc. | | | | 388,179 |
| 4,043 | | Sanofi-Synthelabo, SA, (2) | | | | 356,801 |
| | | Total Pharmaceuticals | | | | 965,258 |
| | | Professional Services – 2.9% | | | | |
| 14,024 | | Experian PLC, (2) | | | | 323,222 |
| 8,236 | | Nielsen Holdings PLC | | | | 308,109 |
| | | Total Professional Services | | | | 631,331 |
| | | Road & Rail – 1.8% | | | | |
| 2,994 | | Union Pacific Corporation | | | | 399,699 |
| | | Software – 5.9% | | | | |
| 7,761 | | Microsoft Corporation | | | | 737,373 |
| 4,878 | | SAP SE, (2) | | | | 551,899 |
| | | Total Software | | | | 1,289,272 |
| | | Specialty Retail – 1.7% | | | | |
| 3,554 | | Lowe's Companies, Inc. | | | | 372,211 |
| | | Technology Hardware, Storage & Peripherals – 2.9% | | | | |
| 3,852 | | Apple, Inc. | | | | 644,940 |
| | | Trading Companies & Distributors – 1.7% | | | | |
| 18,625 | | Itochu Corporation, (2) | | | | 366,478 |
| | | Wireless Telecommunication Services – 3.4% | | | | |
| 13,800 | | KDDI Corporation, (2) | | | | 350,220 |
| 124,674 | | Vodafone Group PLC, (2) | | | | 397,440 |
| | | Total Wireless Telecommunication Services | | | | 747,660 |
| |
| | | Total Long-Term Investments (cost $16,025,613) | | | | 21,305,355 |
| Principal Amount (000) | | Description (1) | Coupon | Maturity | | Value |
| | | SHORT-TERM INVESTMENTS – 2.4% | | | | |
| | | REPURCHASE AGREEMENTS – 2.4% | | | | |
| $ 515 | | Repurchase Agreement with Fixed Income Clearing Corporation, dated 1/31/18, repurchase price $514,869, collateralized by $535,000 U.S. Treasury Notes, 1.875%, due 3/31/22, value $526,458 | 0.540% | 2/01/18 | | $ 514,861 |
| | | Total Short-Term Investments (cost $514,861) | | | | 514,861 |
| | | Total Investments (cost $16,540,474) – 99.7% | | | | 21,820,216 |
| | | Other Assets Less Liabilities – 0.3% | | | | 65,024 |
| | | Net Assets – 100% | | | | $ 21,885,240 |
| | For Fund portfolio compliance purposes, the Fund’s industry classifications refer to any one or more of the industry sub-classifications used by one or more widely recognized market indexes or ratings group indexes, and/or as defined by Fund management. This definition may not apply for purposes of this report, which may combine industry sub-classifications into sectors for reporting ease. | |
| (1) | All percentages shown in the Portfolio of Investments are based on net assets. | |
| (2) | For fair value measurement disclosure purposes, investment classified as Level 2. See Notes to Financial Statements, Note 2 - Investment Valuation and Fair Value Measurements for more information. | |
See accompanying notes to financial statements.
Nuveen Santa Barbara International Dividend Growth Fund
| Portfolio of Investments | January 31, 2018 (Unaudited) |
| Shares | | Description (1) | | | | Value |
| | | LONG-TERM INVESTMENTS – 99.3% | | | | |
| | | COMMON STOCKS – 99.3% | | | | |
| | | Aerospace & Defense – 3.7% | | | | |
| 2,057 | | Safran SA, (2) | | | | $ 232,402 |
| | | Automobiles – 3.6% | | | | |
| 2,452 | | Daimler AG, (2) | | | | 224,571 |
| | | Banks – 17.8% | | | | |
| 46,500 | | BOC Hong Kong Holdings Limited, (2) | | | | 237,153 |
| 6,218 | | Danske Bank A/S, (2) | | | | 252,494 |
| 7,606 | | ForeningsSparbanken AB, (2) | | | | 194,520 |
| 208,923 | | Lloyds Banking Group PLC, (2) | | | | 206,415 |
| 3,778 | | Toronto-Dominion Bank | | | | 229,813 |
| | | Total Banks | | | | 1,120,395 |
| | | Beverages – 2.5% | | | | |
| 1,378 | | Heineken NV, (2) | | | | 154,872 |
| | | Biotechnology – 2.4% | | | | |
| 6,081 | | Grifols SA., Class B Shares, (2) | | | | 150,828 |
| | | Capital Markets – 3.8% | | | | |
| 2,864 | | Macquarie Group Limited, (2) | | | | 237,646 |
| | | Chemicals – 6.7% | | | | |
| 1,901 | | Koninklijke DSM NV, (2) | | | | 196,549 |
| 923 | | Linde AG, (3) | | | | 225,294 |
| | | Total Chemicals | | | | 421,843 |
| | | Containers & Packaging – 3.0% | | | | |
| 16,380 | | Amcor Limited, (2) | | | | 191,534 |
| | | Diversified Financial Services – 3.1% | | | | |
| 10,300 | | Orix Corporation, (2) | | | | 192,936 |
| | | Diversified Telecommunication Services – 2.9% | | | | |
| 145,000 | | HKT Trust and HKT Limited | | | | 181,467 |
| | | Electric Utilities – 5.9% | | | | |
| 9,519 | | Red Electrica Corporacion SA, (2), (3) | | | | 200,779 |
| 9,101 | | Scottish and Southern Energy PLC, (2) | | | | 168,778 |
| | | Total Electric Utilities | | | | 369,557 |
| | | Electronic Equipment, Instruments & Components – 1.5% | | | | |
| 3,200 | | Alps Electric Company, Limited, (2) | | | | 92,472 |
| Shares | | Description (1) | | | | Value |
| | | Food Products – 2.8% | | | | |
| 2,058 | | Groupe Danone, (2) | | | | $ 177,125 |
| | | Hotels, Restaurants & Leisure – 3.0% | | | | |
| 9,071 | | Compass Group PLC, (2) | | | | 190,989 |
| | | Household Products – 2.0% | | | | |
| 1,281 | | Reckitt and Benckiser, (2) | | | | 123,706 |
| | | Media – 2.9% | | | | |
| 9,886 | | WPP PLC, (2) | | | | 179,035 |
| | | Oil, Gas & Consumable Fuels – 5.9% | | | | |
| 4,420 | | Enbridge Inc. | | | | 161,815 |
| 3,561 | | Total SA, (2) | | | | 206,467 |
| | | Total Oil, Gas & Consumable Fuels | | | | 368,282 |
| | | Personal Products – 4.3% | | | | |
| 564 | | L'Oreal, (2) | | | | 128,172 |
| 2,556 | | Unilever NV, (2) | | | | 144,660 |
| | | Total Personal Products | | | | 272,832 |
| | | Pharmaceuticals – 2.7% | | | | |
| 1,899 | | Sanofi-Synthelabo, SA, (2) | | | | 167,590 |
| | | Professional Services – 3.9% | | | | |
| 6,219 | | Experian PLC, (2) | | | | 143,334 |
| 2,688 | | Nielsen Holdings PLC | | | | 100,558 |
| | | Total Professional Services | | | | 243,892 |
| | | Real Estate Management & Development – 2.0% | | | | |
| 42,800 | | Capitaland Limited, (2) | | | | 124,961 |
| | | Software – 3.1% | | | | |
| 1,742 | | SAP SE, (2) | | | | 197,091 |
| | | Trading Companies & Distributors – 4.1% | | | | |
| 13,100 | | Itochu Corporation, (2) | | | | 257,765 |
| | | Wireless Telecommunication Services – 5.7% | | | | |
| 6,200 | | KDDI Corporation, (2) | | | | 157,345 |
| 62,763 | | Vodafone Group PLC, (2) | | | | 200,078 |
| | | Total Wireless Telecommunication Services | | | | 357,423 |
| |
| | | Total Long-Term Investments (cost $5,005,194) | | | | 6,231,214 |
| | | Other Assets Less Liabilities – 0.7% | | | | 45,585 |
| | | Net Assets – 100% | | | | $ 6,276,799 |
Nuveen Santa Barbara International Dividend Growth Fund (continued)
| Portfolio of Investments | January 31, 2018 (Unaudited) |
| | For Fund portfolio compliance purposes, the Fund’s industry classifications refer to any one or more of the industry sub-classifications used by one or more widely recognized market indexes or ratings group indexes, and/or as defined by Fund management. This definition may not apply for purposes of this report, which may combine industry sub-classifications into sectors for reporting ease. | |
| (1) | All percentages shown in the Portfolio of Investments are based on net assets. | |
| (2) | For fair value measurement disclosure purposes, investment classified as Level 2. See Notes to Financial Statements, Note 2 - Investment Valuation and Fair Value Measurements for more information. | |
| (3) | Non-income producing; issuer has not declared a dividend within the past twelve months. | |
See accompanying notes to financial statements.
Statement of
Assets and Liabilities
January 31, 2018 (Unaudited)
| | Santa Barbara
Dividend
Growth | Santa Barbara
Global Dividend
Growth | Santa Barbara
International
Dividend Growth |
| Assets | | | |
| Long-term investments, at value (cost $2,054,397,867, $16,025,613 and $5,005,194, respectively) | $3,258,451,851 | $21,305,355 | $6,231,214 |
| Short-term investments, at value (cost approximates value) | 72,717,171 | 514,861 | — |
| Cash | — | — | 2,310 |
| Cash denominated in foreign currencies (cost $—, $2,408 and $1,585, respectively) | — | 2,414 | 1,588 |
| Receivable for: | | | |
| Dividends | 3,034,538 | 30,537 | 10,926 |
| Interest | 1,091 | 8 | — |
| Investments sold | 32,351,429 | — | 58,791 |
| From Adviser | — | — | 6,520 |
| Reclaims | 262,251 | 23,371 | 7,789 |
| Shares sold | 5,866,383 | 11,929 | 15,069 |
| Other assets | 256,939 | 53,377 | 12,781 |
| Total assets | 3,372,941,653 | 21,941,852 | 6,346,988 |
| Liabilities | | | |
| Payable for: | | | |
| Investments purchased | 28,281,653 | — | — |
| Shares redeemed | 4,509,062 | — | — |
| Accrued expenses: | | | |
| Custodian fees | 182,368 | 34,203 | 41,856 |
| Management fees | 1,681,754 | 904 | — |
| Professional fees | 39,752 | 9,575 | 9,035 |
| Shareholder reporting expenses | 129,920 | 3,800 | 16,348 |
| Shareholder servicing agent fees | 475,427 | 3,116 | 1,242 |
| Trustees fees | 208,576 | 181 | 52 |
| 12b-1 distribution and service fees | 570,808 | 4,529 | 1,388 |
| Other | 3,589 | 304 | 268 |
| Total liabilities | 36,082,909 | 56,612 | 70,189 |
| Net assets | $3,336,858,744 | $21,885,240 | $6,276,799 |
See accompanying notes to financial statements.
Statement of Assets and Liabilities (Unaudited) (continued)
| | Santa Barbara
Dividend
Growth | Santa Barbara
Global Dividend
Growth | Santa Barbara
International
Dividend Growth |
| Class A Shares | | | |
| Net assets | $ 498,445,325 | $ 7,743,675 | $2,754,403 |
| Shares outstanding | 11,532,351 | 272,203 | 95,319 |
| Net asset value ("NAV") per share | $ 43.22 | $ 28.45 | $ 28.90 |
| Offering price per share (NAV per share plus maximum sales charge of 5.75% of offering price) | $ 45.86 | $ 30.19 | $ 30.66 |
| Class C Shares | | | |
| Net assets | $ 544,405,810 | $ 3,446,539 | $ 880,272 |
| Shares outstanding | 12,619,950 | 121,537 | 30,779 |
| NAV and offering price per share | $ 43.14 | $ 28.36 | $ 28.60 |
| Class R3 Shares | | | |
| Net assets | $ 24,681,421 | $ 110,031 | $ 109,382 |
| Shares outstanding | 567,363 | 3,878 | 3,800 |
| NAV and offering price per share | $ 43.50 | $ 28.38 | $ 28.79 |
| Class R6 Shares | | | |
| Net assets | $ 64,955,774 | $ — | $ — |
| Shares outstanding | 1,488,455 | — | — |
| NAV and offering price per share | $ 43.64 | $ — | $ — |
| Class I Shares | | | |
| Net assets | $2,204,342,024 | $10,584,995 | $2,532,742 |
| Shares outstanding | 50,962,330 | 372,129 | 87,538 |
| NAV and offering price per share | $ 43.25 | $ 28.44 | $ 28.93 |
| Class T Shares(1) | | | |
| Net assets | $ 28,390 | $ — | $ — |
| Shares outstanding | 656 | — | — |
| NAV and offering price per share | $ 43.26 | $ — | $ — |
| Offering price per share (NAV per share plus maximum sales charge of 2.50% of offering price) | $ 44.37 | $ — | $ — |
| Net assets consist of: | | | |
| Capital paid-in | $2,069,927,026 | $16,658,981 | $5,348,060 |
| Undistributed (Over-distribution of) net investment income | 4,007,761 | (7,402) | (4,318) |
| Accumulated net realized gain (loss) | 58,869,973 | (49,861) | (294,151) |
| Net unrealized appreciation (depreciation) | 1,204,053,984 | 5,283,522 | 1,227,208 |
| Net assets | $3,336,858,744 | $21,885,240 | $6,276,799 |
| Authorized shares - per class | Unlimited | Unlimited | Unlimited |
| Par value per share | $ 0.01 | $ 0.01 | $ 0.01 |
| (1) | Class T Shares are not available for public offering. |
See accompanying notes to financial statements.
Statement of
Operations
Six Months Ended January 31, 2018 (Unaudited)
| | Santa Barbara
Dividend
Growth | Santa Barbara
Global Dividend
Growth | Santa Barbara
International
Dividend Growth |
| Investment Income | | | |
| Dividends | $ 35,874,862 | $ 255,583 | $ 63,951 |
| Foreign tax withheld on dividend income | — | (8,887) | (4,389) |
| Total investment Income | $ 35,874,862 | $ 246,696 | $ 59,562 |
| Expenses | | | |
| Management fees | 9,305,000 | 76,047 | 21,001 |
| 12b-1 service fees - Class A Shares | 586,522 | 8,550 | 3,193 |
| 12b-1 distibution and service fees - Class C Shares | 2,589,940 | 15,713 | 4,240 |
| 12b-1 distibution and service fees - Class R3 Shares | 58,421 | 268 | 263 |
| 12b-1 distibution and service fees - Class T Shares(1) | 34 | — | — |
| Shareholder servicing agent fees | 1,109,593 | 7,104 | 2,835 |
| Custodian fees | 122,367 | 24,201 | 25,450 |
| Trustees fees | 49,959 | 403 | 97 |
| Professional fees | 72,884 | 14,652 | 13,994 |
| Shareholder reporting expenses | 103,051 | 3,744 | 2,622 |
| Federal and state registration fees | 67,978 | 39,584 | 24,550 |
| Other | 19,817 | 3,541 | 3,294 |
| Total expenses before fee waiver/expense reimbursement | 14,085,566 | 193,807 | 101,539 |
| Fee waiver/expense reimbursement | — | (72,797) | (67,216) |
| Net expenses | 14,085,566 | 121,010 | 34,323 |
| Net investment income (loss) | 21,789,296 | 125,686 | 25,239 |
| Realized and Unrealized Gain (Loss) | | | |
| Net realized gain (loss) from investments and foreign currency | 83,494,773 | 105,159 | (5,045) |
| Change in net unrealized appreciation (depreciation) of investments and foreign currency | 336,832,490 | 2,065,160 | 427,131 |
| Net realized and unrealized gain (loss) | 420,327,263 | 2,170,319 | 422,086 |
| Net increase (decrease) in net assets from operations | $442,116,559 | $2,296,005 | $447,325 |
| (1) | Class T Shares are not available for public offering. |
See accompanying notes to financial statements.
Statement of
Changes in Net Assets
(Unaudited)
| | Santa Barbara Dividend Growth | | Santa Barbara Global Dividend Growth |
| | Six Months Ended
1/31/18 | Year Ended
7/31/17 | | Six Months Ended
1/31/18 | Year Ended
7/31/17 |
| Operations | | | | | |
| Net investment income (loss) | $ 21,789,296 | $ 43,647,625 | | $ 125,686 | $ 1,163,384 |
| Net realized gain (loss) from investments and foreign currency | 83,494,773 | 95,308,214 | | 105,159 | 5,848,596 |
| Change in net unrealized appreciation (depreciation) of investments and foreign currency | 336,832,490 | 150,102,597 | | 2,065,160 | (899,911) |
| Net increase (decrease) in net assets from operations | 442,116,559 | 289,058,436 | | 2,296,005 | 6,112,069 |
| Distributions to Shareholders | | | | | |
| From net investment income: | | | | | |
| Class A Shares | (3,143,731) | (8,250,474) | | (36,456) | (212,658) |
| Class C Shares | (1,570,752) | (4,256,691) | | (4,857) | (75,950) |
| Class R3 Shares | (128,337) | (319,716) | | (431) | (3,282) |
| Class R6 Shares | (439,814) | (591,448) | | — | — |
| Class I Shares | (15,840,498) | (29,400,073) | | (82,064) | (954,450) |
| Class T Shares(1) | (180) | (88) | | — | — |
| From Accumulated Net Realized Gains: | | | | | |
| Class A Shares | (13,850,045) | — | | (734,290) | (5,884) |
| Class C Shares | (15,203,700) | — | | (344,063) | (2,258) |
| Class R3 Shares | (680,419) | — | | (12,122) | (85) |
| Class R6 Shares | (1,732,195) | — | | — | — |
| Class I Shares | (59,314,479) | — | | (1,095,504) | (43,120) |
| Class T Shares(1) | (806) | — | | — | — |
| Decrease in net assets from distributions to shareholders | (111,904,956) | (42,818,490) | | (2,309,787) | (1,297,687) |
| Fund Share Transactions | | | | | |
| Proceeds from sale of shares | 436,864,130 | 849,829,614 | | 8,296,231 | 7,832,144 |
| Proceeds from shares issued to shareholders due to reinvestment of distributions | 66,322,769 | 24,681,578 | | 2,132,248 | 547,996 |
| | 503,186,899 | 874,511,192 | | 10,428,479 | 8,380,140 |
| Cost of shares redeemed | (356,558,306) | (1,025,320,724) | | (6,487,153) | (58,089,998) |
| Net increase (decrease) in net assets from Fund share transactions | 146,628,593 | (150,809,532) | | 3,941,326 | (49,709,858) |
| Net increase (decrease) in net assets | 476,840,196 | 95,430,414 | | 3,927,544 | (44,895,476) |
| Net assets at the beginning of period | 2,860,018,548 | 2,764,588,134 | | 17,957,696 | 62,853,172 |
| Net assets at the end of period | $3,336,858,744 | $ 2,860,018,548 | | $21,885,240 | $ 17,957,696 |
| Undistributed (Over-distribution of) net investment income at the end of period | $ 4,007,761 | $ 3,341,777 | | $ (7,402) | $ (9,280) |
| (1) | Class T Shares are not available for public offering. |
See accompanying notes to financial statements.
| | Santa Barbara International Dividend Growth |
| | Six Months Ended
1/31/18 | Year Ended
7/31/17 |
| Operations | | |
| Net investment income (loss) | $ 25,239 | $ 138,299 |
| Net realized gain (loss) from investments and foreign currency | (5,045) | 16,097 |
| Change in net unrealized appreciation (depreciation) of investments and foreign currency | 427,131 | 385,589 |
| Net increase (decrease) in net assets from operations | 447,325 | 539,985 |
| Distributions to Shareholders | | |
| From net investment income: | | |
| Class A Shares | (9,899) | (52,110) |
| Class C Shares | (1,763) | (15,858) |
| Class R3 Shares | (338) | (2,819) |
| Class R6 Shares | — | — |
| Class I Shares | (13,582) | (71,993) |
| Class T Shares(1) | — | — |
| From Accumulated Net Realized Gains: | | |
| Class A Shares | — | — |
| Class C Shares | — | — |
| Class R3 Shares | — | — |
| Class R6 Shares | — | — |
| Class I Shares | — | — |
| Class T Shares(1) | — | — |
| Decrease in net assets from distributions to shareholders | (25,582) | (142,780) |
| Fund Share Transactions | | |
| Proceeds from sale of shares | 1,936,758 | 2,901,100 |
| Proceeds from shares issued to shareholders due to reinvestment of distributions | 18,559 | 100,394 |
| | 1,955,317 | 3,001,494 |
| Cost of shares redeemed | (1,550,358) | (1,817,072) |
| Net increase (decrease) in net assets from Fund share transactions | 404,959 | 1,184,422 |
| Net increase (decrease) in net assets | 826,702 | 1,581,627 |
| Net assets at the beginning of period | 5,450,097 | 3,868,470 |
| Net assets at the end of period | $ 6,276,799 | $ 5,450,097 |
| Undistributed (Over-distribution of) net investment income at the end of period | $ (4,318) | $ (3,975) |
| (1) | Class T Shares are not available for public offering. |
See accompanying notes to financial statements.
Financial
Highlights (Unaudited)
Santa Barbara Dividend Growth
Selected data for a share outstanding throughout each period:
| | | | | | | | | |
| | | | | | | | | |
| | | Investment Operations | | Less Distributions | |
| Class (Commencement Date) Year Ended July 31, | Beginning
NAV | Net
Investment
Income
(Loss)(a) | Net
Realized/
Unrealized
Gain (Loss) | Total | | From
Net
Investment
Income | From
Accumulated
Net Realized
Gains | Total | Ending
NAV |
| Class A (03/06) | | | | | | | | | |
| 2018(e) | $38.84 | $0.28 | $5.60 | $5.88 | | $(0.27) | $(1.23) | $(1.50) | $43.22 |
| 2017 | 35.52 | 0.58 | 3.30 | 3.88 | | (0.56) | — | (0.56) | 38.84 |
| 2016 | 36.39 | 0.53 | 0.55 | 1.08 | | (0.53) | (1.42) | (1.95) | 35.52 |
| 2015 | 34.21 | 0.49 | 3.25 | 3.74 | | (0.50) | (1.06) | (1.56) | 36.39 |
| 2014 | 30.54 | 0.54 | 3.85 | 4.39 | | (0.53) | (0.19) | (0.72) | 34.21 |
| 2013 | 26.32 | 0.59 | 4.19 | 4.78 | | (0.56) | — | (0.56) | 30.54 |
| Class C (03/06) | | | | | | | | | |
| 2018(e) | 38.77 | 0.13 | 5.59 | 5.72 | | (0.12) | (1.23) | (1.35) | 43.14 |
| 2017 | 35.46 | 0.30 | 3.30 | 3.60 | | (0.29) | — | (0.29) | 38.77 |
| 2016 | 36.33 | 0.27 | 0.55 | 0.82 | | (0.27) | (1.42) | (1.69) | 35.46 |
| 2015 | 34.16 | 0.22 | 3.24 | 3.46 | | (0.23) | (1.06) | (1.29) | 36.33 |
| 2014 | 30.49 | 0.29 | 3.85 | 4.14 | | (0.28) | (0.19) | (0.47) | 34.16 |
| 2013 | 26.29 | 0.37 | 4.18 | 4.55 | | (0.35) | — | (0.35) | 30.49 |
| Class R3 (03/09) | | | | | | | | | |
| 2018(e) | 39.09 | 0.24 | 5.63 | 5.87 | | (0.23) | (1.23) | (1.46) | 43.50 |
| 2017 | 35.79 | 0.49 | 3.33 | 3.82 | | (0.52) | — | (0.52) | 39.09 |
| 2016 | 36.65 | 0.44 | 0.57 | 1.01 | | (0.45) | (1.42) | (1.87) | 35.79 |
| 2015 | 34.45 | 0.41 | 3.26 | 3.67 | | (0.41) | (1.06) | (1.47) | 36.65 |
| 2014 | 30.75 | 0.45 | 3.89 | 4.34 | | (0.45) | (0.19) | (0.64) | 34.45 |
| 2013 | 26.50 | 0.45 | 4.30 | 4.75 | | (0.50) | — | (0.50) | 30.75 |
| Class R6 (03/13) | | | | | | | | | |
| 2018(e) | 39.19 | 0.33 | 5.68 | 6.01 | | (0.33) | (1.23) | (1.56) | 43.64 |
| 2017 | 35.81 | 0.70 | 3.34 | 4.04 | | (0.66) | — | (0.66) | 39.19 |
| 2016 | 36.64 | 0.64 | 0.57 | 1.21 | | (0.62) | (1.42) | (2.04) | 35.81 |
| 2015 | 34.42 | 0.61 | 3.26 | 3.87 | | (0.59) | (1.06) | (1.65) | 36.64 |
| 2014 | 30.69 | 0.64 | 3.89 | 4.53 | | (0.61) | (0.19) | (0.80) | 34.42 |
| 2013(f) | 29.09 | 0.19 | 1.55 | 1.74 | | (0.14) | — | (0.14) | 30.69 |
| Class I (03/06) | | | | | | | | | |
| 2018(e) | 38.87 | 0.34 | 5.59 | 5.93 | | (0.32) | (1.23) | (1.55) | 43.25 |
| 2017 | 35.54 | 0.66 | 3.32 | 3.98 | | (0.65) | — | (0.65) | 38.87 |
| 2016 | 36.41 | 0.61 | 0.55 | 1.16 | | (0.61) | (1.42) | (2.03) | 35.54 |
| 2015 | 34.23 | 0.58 | 3.25 | 3.83 | | (0.59) | (1.06) | (1.65) | 36.41 |
| 2014 | 30.55 | 0.62 | 3.86 | 4.48 | | (0.61) | (0.19) | (0.80) | 34.23 |
| 2013 | 26.33 | 0.66 | 4.19 | 4.85 | | (0.63) | — | (0.63) | 30.55 |
| Class T (05/17)(g) | | | | | | | | | |
| 2018(e) | 38.87 | 0.28 | 5.61 | 5.89 | | (0.27) | (1.23) | (1.50) | 43.26 |
| 2017(h) | 38.09 | 0.06 | 0.85 | 0.91 | | (0.13) | — | (0.13) | 38.87 |
| | | | | |
| | Ratios/Supplemental Data |
| | | Ratios to Average
Net Assets(c) | |
Total
Return(b) | Ending
Net
Assets
(000) | Expenses | Net
Investment
Income
(Loss) | Portfolio
Turnover
Rate(d) |
| | | | | |
| 15.37% | $ 498,445 | 0.96%* | 1.39%* | 11% |
| 11.04 | 449,109 | 0.97 | 1.61 | 22 |
| 3.47 | 667,299 | 0.99 | 1.57 | 28 |
| 11.21 | 700,058 | 1.00 | 1.37 | 28 |
| 14.50 | 691,389 | 1.01 | 1.64 | 29 |
| 18.41 | 602,575 | 1.03 | 2.09 | 23 |
| | | | | |
| 14.95 | 544,406 | 1.71* | 0.64* | 11 |
| 10.21 | 507,089 | 1.72 | 0.83 | 22 |
| 2.69 | 556,889 | 1.74 | 0.81 | 28 |
| 10.37 | 533,430 | 1.75 | 0.62 | 28 |
| 13.65 | 449,211 | 1.76 | 0.89 | 29 |
| 17.51 | 331,702 | 1.78 | 1.31 | 23 |
| | | | | |
| 15.22 | 24,681 | 1.21* | 1.15* | 11 |
| 10.77 | 22,881 | 1.22 | 1.33 | 22 |
| 3.22 | 21,662 | 1.24 | 1.30 | 28 |
| 10.92 | 17,046 | 1.25 | 1.14 | 28 |
| 14.23 | 21,565 | 1.26 | 1.38 | 29 |
| 18.12 | 17,312 | 1.29 | 1.56 | 23 |
| | | | | |
| 15.56 | 64,956 | 0.64* | 1.59* | 11 |
| 11.41 | 26,984 | 0.65 | 1.91 | 22 |
| 3.80 | 35,219 | 0.66 | 1.89 | 28 |
| 11.57 | 32,186 | 0.67 | 1.70 | 28 |
| 14.92 | 36,352 | 0.68 | 1.94 | 29 |
| 6.01 | 43,893 | 0.72* | 1.78* | 23 |
| | | | | |
| 15.50 | 2,204,342 | 0.71* | 1.64* | 11 |
| 11.34 | 1,853,930 | 0.72 | 1.81 | 22 |
| 3.73 | 1,483,520 | 0.74 | 1.82 | 28 |
| 11.48 | 1,483,962 | 0.75 | 1.62 | 28 |
| 14.81 | 1,236,645 | 0.76 | 1.89 | 29 |
| 18.69 | 1,205,829 | 0.78 | 2.34 | 23 |
| | | | | |
| 15.39 | 28 | 0.96* | 1.39* | 11 |
| 2.40 | 26 | 0.98* | 0.90* | 22 |
| (a) | Per share Net Investment Income (Loss) is calculated using the average daily shares method. |
| (b) | Total return is the combination of changes in NAV without any sales charge, reinvested dividend income at NAV and reinvested capital gains distributions at NAV, if any. Total returns are not annualized. |
| (c) | The Fund has a contractual fee waiver/expense reimbursement agreement with the Adviser, but did not receive a fee waiver/expense reimbursement during the periods presented herein. See Note 7 - Management Fees and Other Transactions with Affiliates, Management Fees for more information. |
| (d) | Portfolio Turnover Rate is calculated based on the lesser of long-term purchases or sales (as disclosed in Note 5 – Investment Transactions) divided by the average long-term market value during the period. |
| (e) | For the six months ended January 31, 2018. |
| (f) | For the period March 25, 2013 (commencement of operations) through July 31, 2013. |
| (g) | Class T Shares are not available for public offering. |
| (h) | For the period May 31, 2017 (commencement of operations) through July 31, 2017. |
| * | Annualized. |
See accompanying notes to financial statements.
Financial Highlights (Unaudited) (continued)
Santa Barbara Global Dividend Growth
Selected data for a share outstanding throughout each period:
| | | | | | | | | |
| | | | | | | | | |
| | | Investment Operations | | Less Distributions | |
| Class (Commencement Date) Year Ended July 31, | Beginning
NAV | Net
Investment
Income
(Loss)(a) | Net
Realized/
Unrealized
Gain (Loss) | Total | | From
Net
Investment
Income | From
Accumulated
Net Realized
Gains | Total | Ending
NAV |
| Class A (06/12) | | | | | | | | | |
| 2018(e) | $28.67 | $0.17 | $ 3.02 | $ 3.19 | | $(0.16) | $(3.25) | $(3.41) | $28.45 |
| 2017 | 26.65 | 0.51 | 2.53 | 3.04 | | (0.99) | (0.03) | (1.02) | 28.67 |
| 2016 | 26.90 | 0.43 | (0.31) | 0.12 | | (0.37) | — | (0.37) | 26.65 |
| 2015 | 25.63 | 0.48 | 1.60 | 2.08 | | (0.51) | (0.30) | (0.81) | 26.90 |
| 2014 | 24.20 | 0.99 | 1.46 | 2.45 | | (0.85) | (0.17) | (1.02) | 25.63 |
| 2013 | 21.49 | 0.73 | 2.61 | 3.34 | | (0.63) | — | (0.63) | 24.20 |
| Class C (06/12) | | | | | | | | | |
| 2018(e) | 28.59 | 0.06 | 3.01 | 3.07 | | (0.05) | (3.25) | (3.30) | 28.36 |
| 2017 | 26.57 | 0.32 | 2.51 | 2.83 | | (0.78) | (0.03) | (0.81) | 28.59 |
| 2016 | 26.87 | 0.25 | (0.33) | (0.08) | | (0.22) | — | (0.22) | 26.57 |
| 2015 | 25.61 | 0.28 | 1.60 | 1.88 | | (0.32) | (0.30) | (0.62) | 26.87 |
| 2014 | 24.18 | 0.78 | 1.48 | 2.26 | | (0.66) | (0.17) | (0.83) | 25.61 |
| 2013 | 21.47 | 0.52 | 2.64 | 3.16 | | (0.45) | — | (0.45) | 24.18 |
| Class R3 (06/12) | | | | | | | | | |
| 2018(e) | 28.61 | 0.13 | 3.01 | 3.14 | | (0.12) | (3.25) | (3.37) | 28.38 |
| 2017 | 26.62 | 0.45 | 2.52 | 2.97 | | (0.95) | (0.03) | (0.98) | 28.61 |
| 2016 | 26.89 | 0.37 | (0.32) | 0.05 | | (0.32) | — | (0.32) | 26.62 |
| 2015 | 25.62 | 0.39 | 1.62 | 2.01 | | (0.44) | (0.30) | (0.74) | 26.89 |
| 2014 | 24.19 | 0.89 | 1.49 | 2.38 | | (0.78) | (0.17) | (0.95) | 25.62 |
| 2013 | 21.48 | 0.70 | 2.58 | 3.28 | | (0.57) | — | (0.57) | 24.19 |
| Class I (06/12) | | | | | | | | | |
| 2018(e) | 28.67 | 0.21 | 3.00 | 3.21 | | (0.19) | (3.25) | (3.44) | 28.44 |
| 2017 | 26.65 | 0.60 | 2.50 | 3.10 | | (1.05) | (0.03) | (1.08) | 28.67 |
| 2016 | 26.91 | 0.55 | (0.38) | 0.17 | | (0.43) | — | (0.43) | 26.65 |
| 2015 | 25.64 | 0.50 | 1.64 | 2.14 | | (0.57) | (0.30) | (0.87) | 26.91 |
| 2014 | 24.20 | 1.02 | 1.50 | 2.52 | | (0.91) | (0.17) | (1.08) | 25.64 |
| 2013 | 21.50 | 0.82 | 2.57 | 3.39 | | (0.69) | — | (0.69) | 24.20 |
| | | | | | | |
| | Ratios/Supplemental Data |
| | | Ratios to Average
Net Assets Before
Waiver/Reimbursement | | Ratios to Average
Net Assets After
Waiver/Reimbursement(c) | |
Total
Return(b) | Ending
Net
Assets
(000) | Expenses | Net
Investment
Income
(Loss) | | Expenses | Net
Investment
Income
(Loss) | Portfolio
Turnover
Rate(d) |
| | | | | | | | |
| 11.74% | $ 7,744 | 1.85%* | 0.44%* | | 1.15%* | 1.14%* | 29% |
| 11.55 | 6,188 | 1.25 | 1.78 | | 1.15 | 1.88 | 33 |
| 0.51 | 6,861 | 1.81 | 1.16 | | 1.27 | 1.71 | 19 |
| 8.28 | 5,330 | 2.94 | 0.24 | | 1.38 | 1.81 | 24 |
| 10.21 | 3,618 | 2.69 | 2.64 | | 1.42 | 3.91 | 42 |
| 15.76 | 2,163 | 4.43 | 0.14 | | 1.42 | 3.15 | 25 |
| | | | | | | | |
| 11.32 | 3,447 | 2.60* | (0.30)* | | 1.90* | 0.40* | 29 |
| 10.75 | 2,856 | 2.00 | 1.08 | | 1.90 | 1.18 | 33 |
| (0.25) | 2,116 | 2.55 | 0.47 | | 2.02 | 1.00 | 19 |
| 7.47 | 1,512 | 3.69 | (0.51) | | 2.13 | 1.06 | 24 |
| 9.41 | 810 | 3.39 | 1.86 | | 2.17 | 3.09 | 42 |
| 14.87 | 414 | 5.07 | (0.63) | | 2.17 | 2.27 | 25 |
| | | | | | | | |
| 11.59 | 110 | 2.10* | 0.20* | | 1.40* | 0.90* | 29 |
| 11.30 | 100 | 1.50 | 1.57 | | 1.40 | 1.67 | 33 |
| 0.24 | 80 | 2.07 | 0.91 | | 1.52 | 1.46 | 19 |
| 8.01 | 69 | 3.16 | (0.06) | | 1.63 | 1.47 | 24 |
| 9.94 | 64 | 3.01 | 2.19 | | 1.67 | 3.53 | 42 |
| 15.46 | 60 | 4.53 | 0.19 | | 1.67 | 3.05 | 25 |
| | | | | | | | |
| 11.84 | 10,585 | 1.56* | 0.74* | | 0.90* | 1.41* | 29 |
| 11.83 | 8,813 | 1.01 | 2.09 | | 0.90 | 2.20 | 33 |
| 0.73 | 53,796 | 1.13 | 2.04 | | 1.01 | 2.16 | 19 |
| 8.55 | 2,581 | 2.64 | 0.40 | | 1.14 | 1.91 | 24 |
| 10.52 | 3,020 | 2.50 | 2.70 | | 1.17 | 4.03 | 42 |
| 16.01 | 2,711 | 4.12 | 0.61 | | 1.17 | 3.56 | 25 |
| (a) | Per share Net Investment Income (Loss) is calculated using the average daily shares method. |
| (b) | Total return is the combination of changes in NAV without any sales charge, reinvested dividend income at NAV and reinvested capital gains distributions at NAV, if any. Total returns are not annualized. |
| (c) | After fee waiver and/or expense reimbursement from the Adviser, when applicable. See Note 7 – Management Fees and Other Transactions with Affiliates, Management Fees for more information. |
| (d) | Portfolio Turnover Rate is calculated based on the lesser of long-term purchases or sales (as disclosed in Note 5 – Investment Transactions) divided by the average long-term market value during the period. |
| (e) | For the six months ended January 31, 2018. |
| * | Annualized. |
See accompanying notes to financial statements.
Financial Highlights (Unaudited) (continued)
Santa Barbara International Dividend Growth
Selected data for a share outstanding throughout each period:
| | | | | | | | | | |
| | | | | | | | | | |
| | | Investment Operations | | Less Distributions | |
| Class (Commencement Date) Year Ended July 31, | Beginning
NAV | Net
Investment
Income
(Loss)(a) | Net
Realized/
Unrealized
Gain (Loss) | Total | | From
Net
Investment
Income | From
Accumulated
Net Realized
Gains | Return of
Capital | Total | Ending
NAV |
| Class A (06/12) | | | | | | | | | | |
| 2018(e) | $26.90 | $0.12 | $ 1.99 | $ 2.11 | | $(0.11) | $ — | $ — | $(0.11) | $28.90 |
| 2017 | 24.85 | 0.73 | 2.10 | 2.83 | | (0.78) | — | — | (0.78) | 26.90 |
| 2016 | 26.35 | 0.51 | (1.55) | (1.04) | | (0.46) | — | — | (0.46) | 24.85 |
| 2015 | 26.46 | 0.49 | (0.03) | 0.46 | | (0.49) | (0.06) | (0.02) | (0.57) | 26.35 |
| 2014 | 25.59 | 1.07 | 1.11 | 2.18 | | (0.81) | (0.50) | — | (1.31) | 26.46 |
| 2013 | 21.23 | 0.39 | 4.30 | 4.69 | | (0.31) | (0.02) | — | (0.33) | 25.59 |
| Class C (06/12) | | | | | | | | | | |
| 2018(e) | 26.67 | 0.02 | 1.97 | 1.99 | | (0.06) | — | — | (0.06) | 28.60 |
| 2017 | 24.64 | 0.58 | 2.04 | 2.62 | | (0.59) | — | — | (0.59) | 26.67 |
| 2016 | 26.18 | 0.30 | (1.52) | (1.22) | | (0.32) | — | — | (0.32) | 24.64 |
| 2015 | 26.33 | 0.27 | —* | 0.27 | | (0.34) | (0.06) | (0.02) | (0.42) | 26.18 |
| 2014 | 25.51 | 0.84 | 1.13 | 1.97 | | (0.65) | (0.50) | — | (1.15) | 26.33 |
| 2013 | 21.21 | 0.18 | 4.31 | 4.49 | | (0.17) | (0.02) | — | (0.19) | 25.51 |
| Class R3 (06/12) | | | | | | | | | | |
| 2018(e) | 26.81 | 0.08 | 1.99 | 2.07 | | (0.09) | — | — | (0.09) | 28.79 |
| 2017 | 24.80 | 0.70 | 2.06 | 2.76 | | (0.75) | — | — | (0.75) | 26.81 |
| 2016 | 26.31 | 0.42 | (1.51) | (1.09) | | (0.42) | — | — | (0.42) | 24.80 |
| 2015 | 26.44 | 0.38 | 0.01 | 0.39 | | (0.44) | (0.06) | (0.02) | (0.52) | 26.31 |
| 2014 | 25.58 | 0.85 | 1.26 | 2.11 | | (0.75) | (0.50) | — | (1.25) | 26.44 |
| 2013 | 21.23 | 0.30 | 4.32 | 4.62 | | (0.25) | (0.02) | — | (0.27) | 25.58 |
| Class I (06/12) | | | | | | | | | | |
| 2018(e) | 26.93 | 0.16 | 1.99 | 2.15 | | (0.15) | — | — | (0.15) | 28.93 |
| 2017 | 24.88 | 0.89 | 2.01 | 2.90 | | (0.85) | — | — | (0.85) | 26.93 |
| 2016 | 26.37 | 0.47 | (1.45) | (0.98) | | (0.51) | — | — | (0.51) | 24.88 |
| 2015 | 26.47 | 0.52 | —* | 0.52 | | (0.54) | (0.06) | (0.02) | (0.62) | 26.37 |
| 2014 | 25.59 | 1.04 | 1.21 | 2.25 | | (0.87) | (0.50) | — | (1.37) | 26.47 |
| 2013 | 21.24 | 0.45 | 4.29 | 4.74 | | (0.37) | (0.02) | — | (0.39) | 25.59 |
| | | | | | | |
| | Ratios/Supplemental Data |
| | | Ratios to Average
Net Assets Before
Waiver/Reimbursement | | Ratios to Average
Net Assets After
Waiver/Reimbursement(c) | |
Total
Return(b) | Ending
Net
Assets
(000) | Expenses | Net
Investment
Income
(Loss) | | Expenses | Net
Investment
Income
(Loss) | Portfolio
Turnover
Rate(d) |
| | | | | | | | |
| 7.88% | $2,754 | 3.43%** | (1.44)%** | | 1.15%** | 0.84%** | 14% |
| 11.65 | 2,132 | 4.53 | (0.45) | | 1.15 | 2.92 | 25 |
| (3.87) | 1,885 | 5.61 | (2.26) | | 1.27 | 2.08 | 53 |
| 1.86 | 1,077 | 5.58 | (2.29) | | 1.37 | 1.91 | 15 |
| 8.55 | 469 | 6.08 | (0.66) | | 1.42 | 4.00 | 23 |
| 22.20 | 123 | 8.89 | (5.83) | | 1.42 | 1.64 | 23 |
| | | | | | | | |
| 7.45 | 880 | 4.17** | (2.16)** | | 1.90** | 0.11** | 14 |
| 10.81 | 785 | 5.19 | (0.98) | | 1.90 | 2.31 | 25 |
| (4.60) | 580 | 6.33 | (3.06) | | 2.02 | 1.25 | 53 |
| 1.12 | 419 | 6.30 | (3.12) | | 2.13 | 1.05 | 15 |
| 7.77 | 309 | 6.61 | (1.27) | | 2.17 | 3.17 | 23 |
| 21.23 | 64 | 8.15 | (5.20) | | 2.17 | 0.78 | 23 |
| | | | | | | | |
| 7.74 | 109 | 3.67** | (1.66)** | | 1.40** | 0.61** | 14 |
| 11.36 | 102 | 4.76 | (0.57) | | 1.40 | 2.79 | 25 |
| (4.10) | 93 | 5.96 | (2.72) | | 1.52 | 1.72 | 53 |
| 1.59 | 66 | 5.85 | (2.75) | | 1.63 | 1.47 | 15 |
| 8.29 | 66 | 6.51 | (1.66) | | 1.67 | 3.18 | 23 |
| 21.84 | 64 | 7.66 | (4.71) | | 1.67 | 1.28 | 23 |
| | | | | | | | |
| 8.00 | 2,533 | 3.16** | (1.12)** | | 0.90** | 1.14** | 14 |
| 11.92 | 2,431 | 4.14 | 0.28 | | 0.90 | 3.52 | 25 |
| (3.64) | 1,310 | 5.43 | (2.47) | | 1.03 | 1.93 | 53 |
| 2.09 | 2,165 | 5.35 | (2.22) | | 1.13 | 2.00 | 15 |
| 8.86 | 1,979 | 5.94 | (0.90) | | 1.17 | 3.88 | 23 |
| 22.46 | 1,289 | 7.44 | (4.38) | | 1.17 | 1.89 | 23 |
| (a) | Per share Net Investment Income (Loss) is calculated using the average daily shares method. |
| (b) | Total return is the combination of changes in NAV without any sales charge, reinvested dividend income at NAV and reinvested capital gains distributions at NAV, if any. Total returns are not annualized. |
| (c) | After fee waiver and/or expense reimbursement from the Adviser, when applicable. See Note 7 – Management Fees and Other Transactions with Affiliates, Management Fees for more information. |
| (d) | Portfolio Turnover Rate is calculated based on the lesser of long-term purchases or sales (as disclosed in Note 5 – Investment Transactions) divided by the average long-term market value during the period. |
| (e) | For the six months ended January 31, 2018. |
| * | Rounds to less than $.01 per share. |
| ** | Annualized. |
See accompanying notes to financial statements.
Notes to
Financial Statements (Unaudited)
1. General Information and Significant Accounting Policies
General Information
Trust and Fund Information
The Nuveen Investment Trust II (the “Trust”), is an open-end management investment company registered under the Investment Company Act of 1940, as amended. The Trust is comprised of Nuveen Santa Barbara Dividend Growth Fund (“Santa Barbara Dividend Growth”), Nuveen Santa Barbara Global Dividend Growth Fund (“Santa Barbara Global Dividend Growth”) and Nuveen Santa Barbara International Dividend Growth Fund (“Santa Barbara International Dividend Growth”) (each a “Fund” and collectively, the “Funds”), as diversified funds, among others. The Trust was organized as a Massachusetts business trust on June 27, 1997.
The end of the reporting period for the Funds is January 31, 2018, and the period covered by these Notes to Financial Statements is the six months ended January 31, 2018 (“the current fiscal period”).
Investment Adviser
The Funds’ investment adviser is Nuveen Fund Advisors, LLC (the “Adviser”), a subsidiary of Nuveen, LLC (“Nuveen”). Nuveen is the investment management arm of Teachers Insurance and Annuity Association of America (TIAA). The Adviser has overall responsibility for management of the Funds, oversees the management of the Funds' portfolios, manages the Funds' business affairs and provides certain clerical, bookkeeping and other administrative services, and, if necessary, asset allocation decisions. The Adviser has entered into sub-advisory agreements with Santa Barbara Asset Management, LLC ("Santa Barbara"), an affiliate of Nuveen, under which Santa Barbara manages the investment portfolios of the Funds.
Investment Objectives
Each Fund's investment objective is to seek an attractive total return comprised of income from dividends and long-term capital appreciation.
The Funds' most recent prospectus provides further descriptions of each Fund's investment objective, principal strategies and principal risks.
Significant Accounting Policies
Each Fund is an investment company and follows accounting and reporting guidance under Financial Accounting Standards Board ("FASB") Accounting Standards Codification (ASC) Topic 946 "Financial Services-Investment Companies." The following is a summary of significant accounting policies followed by the Funds in the preparation of their financial statements in accordance with accounting principles generally accepted in the United States of America (“U.S. GAAP”).
Investment Transactions
Investment transactions are recorded on a trade date basis. Realized gains and losses from investment transactions are determined on the specific identification method, which is the same basis used for federal income tax purposes. Investments purchased on a when-issued/delayed delivery basis may have extended settlement periods. Any investments so purchased are subject to market fluctuation during this period. The Funds have earmarked securities in their portfolios with a current value at least equal to the amount of the when-issued/delayed delivery purchase commitments.
As of the end of the reporting period, the Funds did not have any outstanding when-issued/delayed delivery purchase commitments.
Investment Income
Dividend income is recorded on the ex-dividend date or, for foreign securities, when information is available. Non-cash dividends received in the form of stock, if any, are recognized on the ex-dividend date and recorded at fair value. Interest income, which reflects the amortization of premiums and accretion of discounts for financial reporting purposes, is recorded on an accrual basis. Interest income also reflects paydown gains and losses, if any.
Professional Fees
Professional fees presented on the Statement of Operations consist of legal fees incurred in the normal course of operations, audit fees, tax consulting fees and, in some cases, workout expenditures. Workout expenditures are incurred in an attempt to protect or enhance an investment or to pursue other claims or legal actions on behalf of Fund shareholders. If a refund is received for workout expenditures paid in a prior reporting period, such amounts will be recognized as “Legal fee refund” on the Statement of Operations.
Dividends and Distributions to Shareholders
Dividends from net investment income, if any, are declared and distributed to shareholders quarterly. Net realized capital gains from investment transactions, if any, are declared and distributed to shareholders at least annually. Furthermore, capital gains are distributed only to the extent they exceed available capital loss carryforwards.
Distributions to shareholders are recorded on the ex-dividend date. The amount and timing of distributions are determined in accordance with federal income tax regulations, which may differ from U.S. GAAP.
Share Classes and Sales Charges
Class A Shares are generally sold with an up-front sales charge and incur a 0.25% annual 12b-1 service fee. Class A Share purchases of $1 million or more are sold at net asset value (“NAV”) without an up-front sales charge but may be subject to a contingent deferred sales charge (“CDSC”) of 1% if redeemed within eighteen months of purchase. Class C Shares are sold without an up-front sales charge but incur a 0.75% annual 12b-1 distribution fee and a 0.25% annual 12b-1 service fee. Class C Shares are subject to a CDSC of 1% if redeemed within twelve months of purchase. Class R3 Shares are sold without an up-front sales charge but incur a 0.25% annual 12b-1 distribution fee and a 0.25% annual 12b-1 service fee. Class R6 Shares and Class I Shares are not subject to any sales charge or 12b-1 distribution or service fees. Class T Shares are generally sold with an up-front sales charge and incur a 0.25% annual 12b-1 service fee.
Multiclass Operations and Allocations
Income and expenses of the Funds that are not directly attributable to a specific class of shares are prorated among the classes based on the relative net assets of each class. Expenses directly attributable to a class of shares are recorded to the specific class. Currently, the only expenses that are allocated on a class-specific basis are 12b-1 distribution and service fees.
Sub-transfer agent fees and similar fees, which are recognized as a component of “Shareholder servicing agent fees” on the Statement of Operations, are not charged to Class R6 Shares and are prorated among the other classes based on their relative net assets.
Realized and unrealized capital gains and losses of the Funds are prorated among the classes based on the relative net assets of each class.
Compensation
The Trust pays no compensation directly to those of its trustees who are affiliated with the Adviser or to its officers, all of whom receive remuneration for their services to the Trust from the Adviser or its affiliates. The Funds' Board of Trustees ("the "Board") has adopted a deferred compensation plan for independent trustees that enables trustees to elect to defer receipt of all or a portion of the annual compensation they are entitled to receive from certain Nuveen-advised funds. Under the plan, deferred amounts are treated as though equal dollar amounts had been invested in shares of select Nuveen-advised funds.
Indemnifications
Under the Trust's organizational documents, its officers and trustees are indemnified against certain liabilities arising out of the performance of their duties to the Trust. In addition, in the normal course of business, the Trust enters into contracts that provide general indemnifications to other parties. The Trust’s maximum exposure under these arrangements is unknown as this would involve future claims that may be made against the Trust that have not yet occurred. However, the Trust has not had prior claims or losses pursuant to these contracts and expects the risk of loss to be remote.
Netting Agreements
In the ordinary course of business, the Funds may enter into transactions subject to enforceable master repurchase agreements, International Swaps and Derivative Association, Inc. (ISDA) master agreements or other similar arrangements (“netting agreements”). Generally, the right to offset in netting agreements allows each Fund to offset certain securities and derivatives with a specific counterparty, when applicable, as well as any collateral received or delivered to that counterparty based on the terms of the agreements. Generally, each Fund manages its cash collateral and securities collateral on a counterparty basis.
The Funds' investments subject to netting agreements as of the end of the reporting period, if any, are further described in Note 3 – Portfolio Securities and Investments in Derivatives.
Use of Estimates
The preparation of financial statements in conformity with U.S. GAAP requires management to make estimates and assumptions that affect the reported amounts of assets and liabilities at the date of the financial statements and the reported amounts of increases and decreases in net assets from operations during the current fiscal period. Actual results may differ from those estimates.
2. Investment Valuation and Fair Value Measurements
The fair valuation input levels as described below are for fair value measurement purposes.
Fair value is defined as the price that would be received upon selling an investment or transferring a liability in an orderly transaction to an independent buyer in the principal or most advantageous market for the investment. A three-tier hierarchy is used to maximize the use of observable market
Notes to Financial Statements (Unaudited) (continued)
data and minimize the use of unobservable inputs and to establish classification of fair value measurements for disclosure purposes. Observable inputs reflect the assumptions market participants would use in pricing the asset or liability. Observable inputs are based on market data obtained from sources independent of the reporting entity. Unobservable inputs reflect the reporting entity’s own assumptions about the assumptions market participants would use in pricing the asset or liability. Unobservable inputs are based on the best information available in the circumstances. The following is a summary of the three-tiered hierarchy of valuation input levels.
Level 1 – Inputs are unadjusted and prices are determined using quoted prices in active markets for identical securities.
Level 2 – Prices are determined using other significant observable inputs (including quoted prices for similar securities, interest rates, prepayment speeds, credit risk, etc.).
Level 3 – Prices are determined using significant unobservable inputs (including management’s assumptions in determining the fair value of investments).
Common stocks and other equity-type securities are valued at the last sales price on the securities exchange on which such securities are primarily traded and are generally classified as Level 1. Securities primarily traded on the NASDAQ National Market (“NASDAQ”) are valued, at the NASDAQ Official Closing Price and are generally classified as Level 1. However, securities traded on a securities exchange or NASDAQ for which there were no transactions on a given day or securities not listed on a securities exchange or NASDAQ are valued at the quoted bid price and are generally classified as Level 2. Prices of certain American Depositary Receipts (“ADR”) held by the Funds that trade in the United States are valued based on the last traded price, official closing price or the most recent bid price of the underlying non-U.S.-traded stock, adjusted as appropriate for the underlying-to-ADR conversion ratio and foreign exchange rate, and from time-to-time may also be adjusted further to take into account material events that may take place after the close of the local non-U.S. market but before the close of the New York Stock Exchange (“NYSE”), which may represent a transfer from a Level 1 to a Level 2 security.
Repurchase agreements are valued at contract amount plus accrued interest, which approximates market value. These securities are generally classified as Level 2.
Investments initially valued in currencies other than the U.S. dollar are converted to the U.S. dollar using exchange rates obtained from pricing services. As a result, the NAV of a Fund’s shares may be affected by changes in the value of currencies in relation to the U.S. dollar. The value of securities traded in markets outside the United States or denominated in currencies other than the U.S. dollar may be affected significantly on a day that the NYSE is closed and an investor is not able to purchase, redeem or exchange shares. If significant market events occur between the time of determination of the closing price of a foreign security on an exchange and the time that the Fund’s NAV is determined, or if under the Fund’s procedures, the closing price of a foreign security is not deemed to be reliable, the security would be valued at fair value as determined in accordance with procedures established in good faith by the Board. These securities are generally classified as Level 2 or Level 3 depending on the observability of the significant inputs.
Certain securities may not be able to be priced by the pre-established pricing methods as described above. Such securities may be valued by the Board and/or its appointee at fair value. These securities generally include, but are not limited to, restricted securities (securities which may not be publicly sold without registration under the Securities Act of 1933, as amended) for which a pricing service is unable to provide a market price; securities whose trading has been formally suspended; debt securities that have gone into default and for which there is no current market quotation; a security whose market price is not available from a pre-established pricing source; a security with respect to which an event has occurred that is likely to materially affect the value of the security after the market has closed but before the calculation of a Fund’s NAV (as may be the case in non-U.S. markets on which the security is primarily traded) or make it difficult or impossible to obtain a reliable market quotation; and a security whose price, as provided by the pricing service, is not deemed to reflect the security’s fair value. As a general principle, the fair value of a security would appear to be the amount that the owner might reasonably expect to receive for it in a current sale. A variety of factors may be considered in determining the fair value of such securities, which may include consideration of the following: yields or prices of investments of comparable quality, type of issue, coupon, maturity and rating, market quotes or indications of value from security dealers, evaluations of anticipated cash flows or collateral, general market conditions and other information and analysis, including the obligor’s credit characteristics considered relevant. These securities are generally classified as Level 2 or Level 3 depending on the observability of the significant inputs. Regardless of the method employed to value a particular security, all valuations are subject to review by the Board and/or its appointee.
The inputs or methodologies used for valuing securities are not an indication of the risks associated with investing in those securities. The following is a summary of each Fund’s fair value measurements as of the end of the reporting period:
| Santa Barbara Dividend Growth | Level 1 | Level 2 | Level 3 | Total |
| Long-Term Investments*: | | | | |
| Common Stocks | $3,258,451,851 | $ — | $ — | $3,258,451,851 |
| Short-Term Investments: | | | | |
| Repurchase Agreements | — | 72,717,171 | — | 72,717,171 |
| Total | $3,258,451,851 | $72,717,171 | $ — | $3,331,169,022 |
| Santa Barbara Global Dividend Growth | Level 1 | Level 2 | Level 3 | Total |
| Long-Term Investments*: | | | | |
| Common Stocks | $12,045,058 | $9,260,297** | $ — | $21,305,355 |
| Short-Term Investments: | | | | |
| Repurchase Agreements | — | 514,861 | — | 514,861 |
| Total | $12,045,058 | $9,775,158 | $ — | $21,820,216 |
| Santa Barbara International Dividend Growth | Level 1 | Level 2 | Level 3 | Total |
| Long-Term Investments*: | | | | |
| Common Stocks | $898,947 | $5,332,267** | $ — | $6,231,214 |
| * | Refer to the Fund's Portfolio of Investments for industry classifications. |
| ** | Refer to the Fund's Portfolio of Investments for securities classified as Level 2. |
The Board is responsible for the valuation process and has appointed the oversight of the daily valuation process to the Adviser’s Valuation Committee. The Valuation Committee, pursuant to the valuation policies and procedures adopted by the Board, is responsible for making fair value determinations, evaluating the effectiveness of the Funds' pricing policies and reporting to the Board. The Valuation Committee is aided in its efforts by the Adviser’s dedicated Securities Valuation Team, which is responsible for administering the daily valuation process and applying fair value methodologies as approved by the Valuation Committee. When determining the reliability of independent pricing services for investments owned by the Funds, the Valuation Committee, among other things, conducts due diligence reviews of the pricing services and monitors the quality of security prices received through various testing reports conducted by the Securities Valuation Team.
The Valuation Committee will consider pricing methodologies it deems relevant and appropriate when making a fair value determination, based on the facts and circumstances specific to the portfolio instrument. Fair value determinations generally will be derived as follows, using public or private market information:
| (i) | If available, fair value determinations shall be derived by extrapolating from recent transactions or quoted prices for identical or comparable securities.
|
| (ii) | If such information is not available, an analytical valuation methodology may be used based on other available information including, but not limited to: analyst appraisals, research reports, corporate action information, issuer financial statements and shelf registration statements. Such analytical valuation methodologies may include, but are not limited to: multiple of earnings, discount from market value of a similar freely- traded security, discounted cash flow analysis, book value or a multiple thereof, risk premium/yield analysis, yield to maturity and/or fundamental investment analysis. |
The purchase price of a portfolio instrument will be used to fair value the instrument only if no other valuation methodology is available or deemed appropriate, and it is determined that the purchase price fairly reflects the instrument’s current value.
For each portfolio security that has been fair valued pursuant to the policies adopted by the Board, the fair value price is compared against the last available and next available market quotations. The Valuation Committee reviews the results of such testing and fair valuation occurrences are reported to the Board.
3. Portfolio Securities and Investments in Derivatives
Portfolio Securities
Foreign Currency Transactions
To the extent that the Funds invest in securities and/or contracts that are denominated in a currency other than U.S. dollars, the Funds will be subject to currency risk, which is the risk that an increase in the U.S. dollar relative to the foreign currency will reduce returns or portfolio value. Generally, when the U.S. dollar rises in value against a foreign currency, the Funds' investments denominated in that currency will lose value because their currency is worth fewer U.S. dollars; the opposite effect occurs if the U.S. dollar falls in relative value. Investments and other assets and liabilities denominated in foreign currencies are converted into U.S. dollars on a spot (i.e. cash) basis at the spot rate prevailing in the foreign currency exchange market at the time of valuation. Purchases and sales of investments and income denominated in foreign currencies are translated into U.S. dollars on the respective dates of such transactions.
As of the end of the reporting period, the following Funds' investments in non-U.S. securities were as follows:
Notes to Financial Statements (Unaudited) (continued)
| Santa Barbara Global Dividend Growth | Value | % of
Net Assets |
| Country: | | |
| United Kingdom | $ 2,947,931 | 13.5% |
| France | 2,093,611 | 9.6 |
| Australia | 1,163,752 | 5.3 |
| Japan | 1,156,892 | 5.3 |
| Germany | 958,361 | 4.4 |
| Canada | 649,349 | 3.0 |
| China | 620,677 | 2.8 |
| Netherlands | 319,073 | 1.4 |
| Hong Kong | 310,980 | 1.4 |
| Total non-U.S. securities | $10,220,626 | 46.7% |
| Santa Barbara International Dividend Growth | Value | % of
Net Assets |
| Country: | | |
| United Kingdom | $1,356,995 | 21.6% |
| France | 911,756 | 14.5 |
| Japan | 700,518 | 11.2 |
| Germany | 646,956 | 10.3 |
| Australia | 429,180 | 6.8 |
| Canada | 391,628 | 6.3 |
| Spain | 351,607 | 5.6 |
| Netherlands | 351,421 | 5.6 |
| Denmark | 252,494 | 4.0 |
| China | 237,153 | 3.8 |
| Other | 500,948 | 8.0 |
| Total non-U.S. securities | $6,130,656 | 97.7% |
The books and records of the Funds are maintained in U.S. dollars. Foreign currencies, assets and liabilities are translated into U.S. dollars at 4:00 p.m. Eastern Time. Investment transactions, income and expenses are translated on the respective dates of such transactions. Net realized foreign currency gains and losses resulting from changes in exchange rates include foreign currency gains and losses between trade date and settlement date of the transactions, foreign currency transactions, and the difference between the amounts of interest and dividends recorded on the books of the Funds and the amounts actually received.
The realized gains and losses resulting from changes in foreign currency exchange rates and changes in foreign exchange rates associated with (i) foreign currency, (ii) investments (iii) investments in derivatives and (iv) other assets and liabilities are recognized as a component of “Net realized gain (loss) from investments and foreign currency” on the Statement of Operations, when applicable.
The unrealized gains and losses resulting from changes in foreign currency exchange rates and changes in foreign exchange rates associated with (i) investments and (ii) other assets and liabilities are recognized as a component of “Change in net unrealized appreciation (depreciation) of investments and foreign currency” on the Statement of Operations, when applicable. The unrealized gains and losses resulting from changes in foreign exchange rates associated with investments in derivatives are recognized as a component of the respective derivative’s related “Change in net unrealized appreciation (depreciation)” on the Statement of Operations, when applicable.
Repurchase Agreements
In connection with transactions in repurchase agreements, it is each Fund policy that its custodian take possession of the underlying collateral securities, the fair value of which exceeds the principal amount of the repurchase transaction, including accrued interest, at all times. If the counterparty defaults, and the fair value of the collateral declines, realization of the collateral may be delayed or limited.
The following table presents the repurchase agreements for the Funds that are subject to netting agreements as of the end of the reporting period, and the collateral delivered related to those repurchase agreements.
| Fund | Counterparty | Short-Term
Investments, at Value | Collateral
Pledged (From)
Counterparty* | Net
Exposure |
| Santa Barbara Dividend Growth | Fixed Income Clearing Corporation | $72,717,171 | $(72,717,171) | $ — |
| Fund | Counterparty | Short-Term
Investments, at Value | Collateral
Pledged (From)
Counterparty* | Net
Exposure |
| Santa Barbara Global Dividend Growth | Fixed Income Clearing Corporation | 514,861 | (514,861) | — |
* As of the end of the reporting period, the value of the collateral pledged from the counterparty exceeded the value of the repurchase agreements. Refer to the Fund’s Portfolio of Investments for details on the repurchase agreements.
Investments in Derivatives
Each Fund is authorized to invest in certain derivative instruments. The Funds record derivative instruments at fair value, with changes in fair value recognized on the Statement of Operations, when applicable. Even though the Funds’ investments in derivatives may represent economic hedges, they are not considered to be hedge transactions for financial reporting purposes.
Although the Funds are authorized to invest in derivative instruments, and may do so in the future, they did not make any such investments during the current fiscal period.
Market and Counterparty Credit Risk
In the normal course of business each Fund may invest in financial instruments and enter into financial transactions where risk of potential loss exists due to changes in the market (market risk) or failure of the other party to the transaction to perform (counterparty credit risk). The potential loss could exceed the value of the financial assets recorded on the financial statements. Financial assets, which potentially expose each Fund to counterparty credit risk, consist principally of cash due from counterparties on forward, option and swap transactions, when applicable. The extent of each Fund’s exposure to counterparty credit risk in respect to these financial assets approximates their carrying value as recorded on the Statement of Assets and Liabilities.
Each Fund helps manage counterparty credit risk by entering into agreements only with counterparties the Adviser believes have the financial resources to honor their obligations and by having the Adviser monitor the financial stability of the counterparties. Additionally, counterparties may be required to pledge collateral daily (based on the daily valuation of the financial asset) on behalf of each Fund with a value approximately equal to the amount of any unrealized gain above a pre-determined threshold. Reciprocally, when each Fund has an unrealized loss, the Funds have instructed the custodian to pledge assets of the Funds as collateral with a value approximately equal to the amount of the unrealized loss above a pre-determined threshold. Collateral pledges are monitored and subsequently adjusted if and when the valuations fluctuate, either up or down, by at least the pre-determined threshold amount.
4. Fund Shares
Each Fund has an effective registration statement on file with the Securities and Exchange Commission (SEC) to issue Class T Shares, which were not yet available for public offering at the time this report was issued.
Santa Barbara Dividend Growth has issued Class T Shares; however, these Shares were also not available for public offering.
Notes to Financial Statements (Unaudited) (continued)
Transactions in Fund shares during the current and prior fiscal period were as follows:
| | Six Months Ended
1/31/18 | | Year Ended
7/31/17 |
| Santa Barbara Dividend Growth | Shares | Amount | | Shares | Amount |
| Shares sold: | | | | | |
| Class A | 1,163,547 | $ 47,422,927 | | 5,076,029 | $ 184,258,810 |
| Class C | 744,987 | 30,421,147 | | 1,843,528 | 66,586,420 |
| Class R3 | 56,845 | 2,351,709 | | 167,900 | 6,117,048 |
| Class R6 | 812,539 | 32,659,298 | | 49,612 | 1,803,717 |
| Class I | 7,934,911 | 324,009,049 | | 16,066,720 | 591,038,619 |
| Class T | — | — | | 656 | 25,000 |
| Shares issued to shareholders due to reinvestment of distributions: | | | | | |
| Class A | 281,035 | 11,535,860 | | 166,637 | 6,035,037 |
| Class C | 258,426 | 10,593,949 | | 66,421 | 2,418,521 |
| Class R3 | 14,037 | 580,046 | | 6,122 | 224,851 |
| Class R6 | 51,211 | 2,122,712 | | 15,302 | 561,742 |
| Class I | 1,010,040 | 41,490,202 | | 420,855 | 15,441,427 |
| Class T | — | — | | — | — |
| | 12,327,578 | 503,186,899 | | 23,879,782 | 874,511,192 |
| Shares redeemed: | | | | | |
| Class A | (1,474,455) | (59,968,966) | | (12,466,143) | (453,082,996) |
| Class C | (1,461,302) | (59,056,827) | | (4,535,766) | (166,005,616) |
| Class R3 | (88,876) | (3,628,748) | | (193,913) | (7,197,756) |
| Class R6 | (63,821) | (2,611,902) | | (359,804) | (13,606,823) |
| Class I | (5,678,493) | (231,291,863) | | (10,529,206) | (385,427,533) |
| Class T | — | — | | — | — |
| | (8,766,947) | (356,558,306) | | (28,084,832) | (1,025,320,724) |
| Net increase (decrease) | 3,560,631 | $ 146,628,593 | | (4,205,050) | $ (150,809,532) |
| | Six Months Ended
1/31/18 | | Year Ended
7/31/17 |
| Santa Barbara Global Dividend Growth | Shares | Amount | | Shares | Amount |
| Shares sold: | | | | | |
| Class A | 57,759 | $ 1,639,491 | | 55,864 | $ 1,518,198 |
| Class C | 20,018 | 570,759 | | 38,050 | 1,033,975 |
| Class R3 | 242 | 7,097 | | 462 | 12,139 |
| Class I | 209,171 | 6,078,884 | | 193,977 | 5,267,832 |
| Shares issued to shareholders due to reinvestment of distributions: | | | | | |
| Class A | 28,065 | 762,233 | | 7,787 | 216,003 |
| Class C | 12,488 | 337,236 | | 2,703 | 75,542 |
| Class R3 | 153 | 4,131 | | 33 | 920 |
| Class I | 37,805 | 1,028,648 | | 9,167 | 255,531 |
| | 365,701 | 10,428,479 | | 308,043 | 8,380,140 |
| Shares redeemed: | | | | | |
| Class A | (29,442) | (849,584) | | (105,329) | (2,845,766) |
| Class C | (10,870) | (310,248) | | (20,466) | (556,781) |
| Class R3 | (13) | (362) | | (19) | (518) |
| Class I | (182,256) | (5,326,959) | | (1,914,535) | (54,686,933) |
| | (222,581) | (6,487,153) | | (2,040,349) | (58,089,998) |
| Net increase (decrease) | 143,120 | $ 3,941,326 | | (1,732,306) | $(49,709,858) |
| | Six Months Ended
1/31/18 | | Year Ended
7/31/17 |
| Santa Barbara International Dividend Growth | Shares | Amount | | Shares | Amount |
| Shares sold: | | | | | |
| Class A | 29,697 | $ 823,366 | | 45,059 | $ 1,161,987 |
| Class C | 7,399 | 200,962 | | 9,069 | 225,417 |
| Class R3 | — | — | | — | — |
| Class I | 33,216 | 912,430 | | 61,256 | 1,513,696 |
| Shares issued to shareholders due to reinvestment of distributions: | | | | | |
| Class A | 351 | 9,615 | | 1,975 | 49,777 |
| Class C | 58 | 1,576 | | 553 | 13,860 |
| Class R3 | 4 | 115 | | 38 | 950 |
| Class I | 264 | 7,253 | | 1,413 | 35,807 |
| | 70,989 | 1,955,317 | | 119,363 | 3,001,494 |
| Shares redeemed: | | | | | |
| Class A | (13,995) | (395,593) | | (43,615) | (1,085,687) |
| Class C | (6,123) | (167,338) | | (3,699) | (93,578) |
| Class R3 | — | — | | — | — |
| Class I | (36,189) | (987,427) | | (25,085) | (637,807) |
| | (56,307) | (1,550,358) | | (72,399) | (1,817,072) |
| Net increase (decrease) | 14,682 | $ 404,959 | | 46,964 | $ 1,184,422 |
5. Investment Transactions
Long-term purchases and sales during the current fiscal period were as follows:
| | Santa Barbara
Dividend
Growth | Santa Barbara
Global Dividend
Growth | Santa Barbara
International
Dividend Growth |
| Purchases | $389,649,961 | $7,751,005 | $1,252,071 |
| Sales | 320,100,327 | 5,884,292 | 817,200 |
6. Income Tax Information
Each Fund is a separate taxpayer for federal income tax purposes. Each Fund intends to distribute substantially all of its net investment income and net capital gains to shareholders and to otherwise comply with the requirements of Subchapter M of the Internal Revenue Code applicable to regulated investment companies. Therefore, no federal income tax provision is required.
For all open tax years and all major taxing jurisdictions, management of the Funds has concluded that there are no significant uncertain tax positions that would require recognition in the financial statements. Open tax years are those that are open for examination by taxing authorities (i.e., generally the last four tax year ends and the interim tax period since then). Furthermore, management of the Funds is also not aware of any tax positions for which it is reasonably possible that the total amounts of unrecognized tax benefits will significantly change in the next twelve months.
The following information is presented on an income tax basis. Differences between amounts for financial statement and federal income tax purposes are primarily due to timing differences in recognizing certain gains and losses on investment transactions. To the extent that differences arise that are permanent in nature, such amounts are reclassified within the capital accounts as detailed below. Temporary differences do not require reclassification. Temporary and permanent differences do not impact the NAVs of the Funds.
The table below presents the cost and unrealized appreciation (depreciation) of each Fund’s investment portfolio, as determined on a federal income tax basis, as of January 31, 2018.
| | Santa Barbara
Dividend
Growth | Santa Barbara
Global Dividend
Growth | Santa Barbara
International
Dividend Growth |
| Tax cost of investments | $2,134,701,533 | $16,633,691 | $5,159,679 |
| Gross unrealized: | | | |
| Appreciation | $1,218,409,192 | $ 5,438,753 | $1,269,746 |
| Depreciation | (21,941,703) | (252,228) | (198,211) |
| Net unrealized appreciation (depreciation) of investments | $1,196,467,489 | $ 5,186,525 | $1,071,535 |
Notes to Financial Statements (Unaudited) (continued)
Permanent differences, primarily due to tax equalization, foreign currency transactions and investments in passive foreign investment companies, resulted in reclassifications among the Funds’ components of net assets as of July 31, 2017, the Funds’ last tax year end, as follows:
| | Santa Barbara
Dividend
Growth | Santa Barbara
Global Dividend
Growth | Santa Barbara
International
Dividend Growth |
| Capital paid-in | $ 8,230,278 | $ 3,421,459 | $ — |
| Undistributed (Over-distribution of) net investment income | — | 19,200 | (1,859) |
| Accumulated net realized gain (loss) | (8,230,278) | (3,440,659) | 1,859 |
The tax components of undistributed net ordinary income and net long-term capital gains as of July 31, 2017, the Funds’ last tax year end, were as follows:
| | Santa Barbara
Dividend
Growth | Santa Barbara
Global Dividend
Growth | Santa Barbara
International
Dividend Growth |
| Undistributed net ordinary income1 | $ 3,341,777 | $ 537,851 | $15,152 |
| Undistributed net long-term capital gains | 73,743,339 | 1,577,045 | — |
| 1 | Net ordinary income consists of net taxable income derived from dividends, interest, and net short-term capital gains, if any. |
The tax character of distributions paid during the Funds’ last tax year ended July 31, 2017, was designated for purposes of the dividends paid deduction as follows:
| | Santa Barbara
Dividend
Growth | Santa Barbara
Global Dividend
Growth | Santa Barbara
International
Dividend Growth |
| Distributions from net ordinary income1 | $42,818,490 | $1,297,687 | $142,780 |
| Distributions from net long-term capital gains | — | — | — |
| 1 | Net ordinary income consists of net taxable income derived from dividends, interest, and net short-term capital gains, if any. |
As of July 31, 2017, the Funds' last tax year end, the following Fund had unused capital losses carrying forward available for federal income tax purposes to be applied against future capital gains, if any. The capital losses are not subject to expiration.
| | Santa Barbara
International
Dividend Growth |
| Capital losses to be carried forward - not subject to expiration | $153,748 |
During the Funds’ last tax year ended July 31, 2017, the following Funds utilized capital loss carryforwards as follows:
| | Santa Barbara
Global Dividend
Growth | Santa Barbara
International
Dividend Growth |
| Utilized capital loss carryforwards | $189,338 | $18,351 |
7. Management Fees and Other Transactions with Affiliates
Management Fees
Each Fund’s management fee compensates the Adviser for the overall investment advisory and administrative services and general office facilities. Santa Barbara is compensated for its services to the Funds from the management fees paid to the Adviser.
Each Fund’s management fee consists of two components – a fund-level fee, based only on the amount of assets within each individual Fund, and a complex-level fee, based on the aggregate amount of all eligible fund assets managed by the Adviser. This pricing structure enables each Fund’s shareholders to benefit from growth in the assets within their respective Fund as well as from growth in the amount of complex-wide assets managed by the Adviser.
The annual fund-level fee, payable monthly, for each Fund, is calculated according to the following schedule:
| Average Daily Net Assets | Santa Barbara
Dividend
Growth | Santa Barbara
Global Dividend
Growth | Santa Barbara
International
Dividend Growth |
| For the first $125 million | 0.5000% | 0.5500% | 0.5500% |
| For the next $125 million | 0.4875 | 0.5375 | 0.5375 |
| For the next $250 million | 0.4750 | 0.5250 | 0.5250 |
| For the next $500 million | 0.4625 | 0.5125 | 0.5125 |
| For the next $1 billion | 0.4500 | 0.5000 | 0.5000 |
| For the next $3 billion | 0.4250 | 0.4750 | 0.4750 |
| For the next $2.5 billion | 0.4000 | 0.4500 | 0.4500 |
| For the next $2.5 billion | 0.3875 | 0.4375 | 0.4375 |
| For net assets over $10 billion | 0.3750 | 0.4250 | 0.4250 |
The annual complex-level fee, payable monthly, is calculated according to the following schedule:
| Complex-Level Eligible Asset Breakpoint Level* | Effective Complex-Level Fee Rate at Breakpoint Level |
| $55 billion | 0.2000% |
| $56 billion | 0.1996 |
| $57 billion | 0.1989 |
| $60 billion | 0.1961 |
| $63 billion | 0.1931 |
| $66 billion | 0.1900 |
| $71 billion | 0.1851 |
| $76 billion | 0.1806 |
| $80 billion | 0.1773 |
| $91 billion | 0.1691 |
| $125 billion | 0.1599 |
| $200 billion | 0.1505 |
| $250 billion | 0.1469 |
| $300 billion | 0.1445 |
* The complex-level fee is calculated based upon the aggregate daily “eligible assets” of all Nuveen open-end and closed-end funds. Eligible assets do not include assets attributable to investments in other Nuveen funds or assets in excess a determined amount (originally $2 billion) added to the Nuveen fund complex in connection with the Adviser’s assumption of the management of the former First American Funds effective January 1, 2011. Eligible assets include closed-end fund assets managed by the Adviser that are attributable to certain types of leverage. For these purposes, leverage includes the closed-end funds’ use of preferred stock and borrowings and certain investments in the residual interest certificates (also called inverse floating rate securities) in tender option bond (TOB) trusts, including the portion of assets held by a TOB trust that has been effectively financed by the trust’s issuance of floating rate securities, subject to an agreement by the Adviser as to certain funds to limit the amount of such assets for determining eligible assets in certain circumstances. As of January 31, 2018, the complex-level fee rate for each Fund was 0.1591%.
The Adviser has agreed to waive fees and/or reimburse expenses (“Expense Cap”) of each Fund so that total annual Fund operating expenses (excluding 12b-1 distribution and/or service fees, interest expenses, taxes, acquired fund fees and expenses, fees incurred in acquiring and disposing of portfolio securities and extraordinary expenses) do not exceed the average daily net assets of any class of Fund shares in the amounts and for the time periods stated in the following table. However, because Class R6 Shares are not subject to sub-transfer agent and similar fees, the total annual fund operating expense for the Class R6 Shares will be less than the expense limitation. The temporary expense limitations may be terminated or modified prior to expiration date only with the approval of the Board. The expense limitations in effect thereafter may be terminated or modified only with the approval of shareholders of the Funds.
| Fund | Temporary
Expense Cap | Temporary
Expense Cap
Expiration Date | Permanent
Expense Cap |
| Santa Barbara Dividend Growth | N/A | N/A | 1.25% |
| Santa Barbara Global Dividend Growth | 0.94% | July 31, 2019 | N/A |
| Santa Barbara International Dividend Growth | 0.94% | July 31, 2019 | N/A |
Other Transactions with Affiliates
During the current fiscal period, Nuveen Securities, LLC, (the “Distributor”), a wholly-owned subsidiary of Nuveen, collected sales charges on purchases of Class A Shares, the majority of which were paid out as concessions to financial intermediaries as follows:
Notes to Financial Statements (Unaudited) (continued)
| | Santa Barbara
Dividend
Growth | Santa Barbara
Global Dividend
Growth | Santa Barbara
International
Dividend Growth |
| Sales charges collected | $580,059 | $17,734 | $7,845 |
| Paid to financial intermediaries | 514,930 | 16,527 | 7,259 |
The Distributor also received 12b-1 service fees on Class A Shares, substantially all of which were paid to compensate financial intermediaries for providing services to shareholders relating to their investments.
During the current fiscal period, the Distributor compensated financial intermediaries directly with commission advances at the time of purchase as follows:
| | Santa Barbara
Dividend
Growth | Santa Barbara
Global Dividend
Growth | Santa Barbara
International
Dividend Growth |
| Commission advances | $264,345 | $10,954 | $2,355 |
To compensate for commissions advanced to financial intermediaries, all 12b-1 service and distribution fees collected on Class C Shares during the first year following a purchase are retained by the Distributor. During the current fiscal period, the Distributor retained such 12b-1 fees as follows:
| | Santa Barbara
Dividend
Growth | Santa Barbara
Global Dividend
Growth | Santa Barbara
International
Dividend Growth |
| 12b-1 fees retained | $235,686 | $4,879 | $1,115 |
The remaining 12b-1 fees charged to each Fund were paid to compensate financial intermediaries for providing services to shareholders relating to their investments.
The Distributor also collected and retained CDSC on share redemptions during the current fiscal period, as follows:
| | Santa Barbara
Dividend
Growth | Santa Barbara
Global Dividend
Growth | Santa Barbara
International
Dividend Growth |
| CDSC retained | $14,458 | $1,067 | $268 |
As of the end of the reporting period, Nuveen owned shares of the Fund as follows:
| | Santa Barbara
Dividend
Growth | Santa Barbara
Global Dividend
Growth | Santa Barbara
International
Dividend Growth |
| Class A Shares | — | 2,500 | 2,500 |
| Class C Shares | — | 2,500 | 2,500 |
| Class R3 Shares | — | 2,500 | 2,500 |
| Class I Shares | — | 42,500 | 42,500 |
| Class T Shares | 656 | — | — |
8. Borrowing Arrangements
Committed Line of Credit
The Funds, along with certain other funds managed by the Adviser (“Participating Funds”), have established a 364-day, approximately $3 billion standby credit facility with a group of lenders, under which the Participating Funds may borrow for various purposes other than leveraging for investment purposes. A large portion of this facility’s capacity (and its associated costs as described below) is currently dedicated for use by a small number of Participating Funds, which does not include any of the Funds covered by this shareholder report. The remaining capacity under the facility (and the corresponding portion of the facility’s annual costs) is separately dedicated to most of the other open-end funds in the Nuveen fund family, including all of the Funds covered by this shareholder report, along with a number of Nuveen closed-end funds. The credit facility expires in July 2018 unless extended or renewed.
The credit facility has the following terms: a fee of 0.15% per annum on unused commitment amounts, and interest at a rate equal to the higher of (a) one-month LIBOR (London Inter-Bank Offered Rate) plus 1.25% per annum or (b) the Fed Funds rate plus 1.25% per annum on amounts borrowed. Par-
ticipating Funds paid administration, legal and arrangement fees, which are recognized as a component of “Other expenses” on the Statement of Operations, and along with commitment fees, have been allocated among such Participating Funds based upon the relative proportions of the facility’s aggregate capacity reserved for them and other factors deemed relevant by the Adviser and the Board of each Participating Fund.
During the current fiscal period, none of the Funds utilized this facility.
9. Subsequent Events
Effective July 2018, Class C Shares will automatically convert to Class A Shares after 10 years. Conversions will occur during the month in which the 10-year anniversary of the purchase occurs. Class C Shares that have been held for longer than 10 years as of July 1, 2018 will also convert to Class A Shares in July 2018. The automatic conversion will be based on the relative net asset values of the two share classes without the imposition of a sales charge or fee. The automatic conversion of Class C Shares to Class A Shares will not apply to shares held through group retirement plan recordkeeping platforms of certain financial intermediaries who hold such shares in an omnibus account and do not track participant level share lot aging to facilitate such a conversion.
Additional
Fund Information
Fund Manager
Nuveen Fund Advisors, LLC
333 West Wacker Drive
Chicago, IL 60606
Sub-Adviser
Santa Barbara Asset
Management, LLC
2049 Century Park East
17th Floor
Los Angeles, CA 90067
Independent Registered
Public Accounting Firm
PricewaterhouseCoopers LLP
One North Wacker Drive
Chicago, IL 60606
Custodian
State Street Bank & Trust Company
One Lincoln Street
Boston, MA 02111
Legal Counsel
Chapman and Cutler LLP
Chicago, IL 60603
Transfer Agent and
Shareholder Services
DST Asset Manager
Solutions, Inc. (DST)
P.O. Box 8530
Boston, MA 02266-8530
(800) 257-8787
Quarterly Form N-Q Portfolio of Investments Information: Each Fund is required to file its complete schedule of portfolio holdings with the Securities and Exchange Commission (SEC) for the first and third quarters of each fiscal year on Form N-Q. You may obtain this information directly from the SEC. Visit the SEC on-line at http://www.sec.gov or in person at the SEC’s Public Reference Room in Washington, D.C. Call the SEC toll-free at (800) SEC-0330 for room hours and operation.
Nuveen Funds’ Proxy Voting Information: You may obtain (i) information regarding how each fund voted proxies relating to portfolio securities held during the most recent twelve-month period ended June 30, without charge, upon request, by calling Nuveen toll-free at (800) 257-8787 or on Nuveen’s website at www.nuveen.com and (ii) a description of the policies and procedures that each fund used to determine how to vote proxies relating to portfolio securities without charge, upon request, by calling Nuveen toll-free at (800) 257-8787. You may also obtain this information directly from the SEC. Visit the SEC on-line at http://www.sec.gov.
FINRA BrokerCheck: The Financial Industry Regulatory Authority (FINRA) provides information regarding the disciplinary history of FINRA member firms and associated investment professionals. This information as well as an investor brochure describing FINRA BrokerCheck is available to the public by calling the FINRA BrokerCheck Hotline number at (800) 289-9999 or by visiting www.FINRA.org.
Glossary of Terms
Used in this Report
Average Annual Total Return: This is a commonly used method to express an investment’s performance over a particular, usually multi-year time period. It expresses the return that would have been necessary each year to equal the investment’s actual cumulative performance (including change in NAV or offer price and reinvested dividends and capital gains distributions, if any) over the time period being considered.
Lipper Equity Income Funds Classification Average: Represents the average annualized returns for all reporting funds in the Lipper Equity Income Funds Classification. Lipper returns account for the effects of management fees and assume reinvestment of distributions, but do not reflect any applicable sales charge.
Lipper Global Equity Income Funds Classification Average: Represents the average annualized returns for all reporting funds in the Lipper Global Equity Income Funds Classification. Lipper returns account for the effects of management fees and assume reinvestment of distributions, but do not reflect any applicable sales charge.
Lipper International Equity Income Funds Classification Average: Represents the average annualized returns for all reporting funds in the Lipper International Equity Income Funds Classification. Lipper returns account for the effects of management fees and assume reinvestment of distributions, but do not reflect any applicable sales charge.
MSCI EAFE Index: The MSCI (Morgan Stanley Capital International) EAFE (Europe, Australasia, Far East) Index is a free float-adjusted market capitalization weighted index designed to measure developed market equity performance, excluding the U.S. and Canada. The index returns assume reinvestment of distributions, but do not reflect any applicable sales charges or management fees.
MSCI World Index: The MSCI (Morgan Stanley Capital International) World Index is a free float-adjusted market capitalization weighted index that is designed to measure the equity market performance of developed markets. The MSCI World Index consists of the following 23 developed market country indexes: Australia, Austria, Belgium, Canada, Denmark, Finland, France, Germany, Hong Kong, Ireland, Israel, Italy, Japan, Netherlands, New Zealand, Norway, Portugal, Singapore, Spain, Sweden, Switzerland, the U.K. and the U.S. Index returns assume reinvestment of distributions, but do not reflect any applicable sales charges or management fees.
Net Asset Value (NAV) Per Share: A fund’s Net Assets is equal to its total assets (securities, cash and accrued earnings) less its total liabilities. For funds with multiple classes, Net Assets are determined separately for each share class. NAV per share is equal to the fund’s (or share class’) Net Assets divided by its number of shares outstanding.
S&P 500® Index: An unmanaged index generally considered representative of the U.S. stock market. Index returns assume reinvestment of distributions, but do not include the effects of any applicable sales charges or management fees.
Nuveen:
Serving Investors for Generations
Since 1898, financial advisors and their clients have relied on Nuveen to provide dependable investment solutions through continued adherence to proven, long-term investing principles. Today, we offer a range of high quality solutions designed to be integral components of a well-diversified core portfolio.
Focused on meeting investor needs.
Nuveen is the investment manager of TIAA. We have grown into one of the world’s premier global asset managers, with specialist knowledge across all major asset classes and particular strength in solutions that provide income for investors and that draw on our expertise in alternatives and responsible investing. Nuveen is driven not only by the independent investment processes across the firm, but also the insights, risk management, analytics and other tools and resources that a truly world-class platform provides. As a global asset manager, our mission is to work in partnership with our clients to create solutions which help them secure their financial future.
Find out how we can help you.
To learn more about how the products and services of Nuveen may be able to help you meet your financial goals, talk to your financial advisor, or call us at (800) 257-8787. Please read the information provided carefully before you invest. Investors should consider the investment objective and policies, risk considerations, charges and expenses of any investment carefully. Where applicable, be sure to obtain a prospectus, which contains this and other relevant information. To obtain a prospectus, please contact your securities representative or Nuveen, 333 W. Wacker Dr., Chicago, IL 60606. Please read the prospectus carefully before you invest or send money.
Learn more about Nuveen Funds at: www.nuveen.com/mf
Securities offered through Nuveen Securities, LLC, member FINRA and SIPC | 333 West Wacker Drive Chicago, IL 60606 | www.nuveen.com
MSA-SBGDG-0118P445046-INV-B-03/19
PART C
OTHER INFORMATION
Item 15. Indemnification
Section 4 of Article XII of the Registrant’s Declaration of Trust provides as follows:
Subject to the exceptions and limitations contained in this Section 4, every person who is, or has been, a Trustee, officer, employee or agent of the Trust, including persons who serve at the request of the Trust as directors, trustees, officers, employees or agents of another organization in which the Trust has an interest as a shareholder, creditor or otherwise (hereinafter referred to as a “Covered Person”), shall be indemnified by the Trust to the fullest extent permitted by law against liability and against all expenses reasonably incurred or paid by him in connection with any claim, action, suit or proceeding in which he becomes involved as a party or otherwise by virtue of his being or having been such a Trustee, director, officer, employee or agent and against amounts paid or incurred by him in settlement thereof.
No indemnification shall be provided hereunder to a Covered Person:
(a) against any liability to the Trust or its Shareholders by reason of a final adjudication by the court or other body before which the proceeding was brought that he engaged in willful misfeasance, bad faith, gross negligence or reckless disregard of the duties involved in the conduct of his office;
(b) with respect to any matter as to which he shall have been finally adjudicated not to have acted in good faith in the reasonable belief that his action was in the best interests of the Trust; or
(c) in the event of a settlement or other disposition not involving a final adjudication (as provided in paragraph (a) or (b)) and resulting in a payment by a Covered Person, unless there has been either a determination that such Covered Person did not engage in willful misfeasance, bad faith, gross negligence or reckless disregard of the duties involved in the conduct of his office by the court or other body approving the settlement or other disposition or a reasonable determination, based on a review of readily available facts (as opposed to a full trial-type inquiry), that he did not engage in such conduct:
(i) by a vote of a majority of the Disinterested Trustees acting on the matter (provided that a majority of the Disinterested Trustees then in office act on the matter); or
(ii) by written opinion of independent legal counsel.
The rights of indemnification herein provided may be insured against by policies maintained by the Trust, shall be severable, shall not affect any other rights to which any Covered Person may now or hereafter be entitled, shall continue as to a person who has ceased to be such a Covered Person and shall inure to the benefit of the heirs, executors and administrators of such a person. Nothing contained herein shall affect any rights to indemnification to which Trust personnel other than Covered Persons may be entitled by contract or otherwise under law.
Expenses of preparation and presentation of a defense to any claim, action, suit or proceeding subject to a claim for indemnification under this Section 4 shall be advanced by the Trust prior to final disposition thereof upon receipt of an undertaking by or on behalf of the recipient to repay such amount if it is ultimately determined that he is not entitled to indemnification under this Section 4, provided that either:
(a) such undertaking is secured by a surety bond or some other appropriate security or the Trust shall be insured against losses arising out of any such advances; or
(b) a majority of the Disinterested Trustees acting on the matter (provided that a majority of the Disinterested Trustees then in office act on the matter) or independent legal counsel in a written opinion shall determine, based upon a review of the readily available facts (as opposed to a full trial-type inquiry), that there is reason to believe that the recipient ultimately will be found entitled to indemnification.
C-1
As used in this Section 4, a “Disinterested Trustee” is one (x) who is not an Interested Person of the Trust (including anyone, as such Disinterested Trustee, who has been exempted from being an Interested Person by any rule, regulation or order of the Commission), and (y) against whom none of such actions, suits or other proceedings or another action, suit or other proceeding on the same or similar grounds is then or has been pending.
As used in this Section 4, the words “claim,” “action,” “suit” or “proceeding” shall apply to all claims, actions, suits, proceedings (civil, criminal, administrative or other, including appeals), actual or threatened; and the words “liability” and “expenses” shall include without limitation, attorneys’ fees, costs, judgments, amounts paid in settlement, fines, penalties and other liabilities.
The trustees and officers of the Registrant are covered by the Mutual Fund Professional Liability policy in the aggregate amount of $70,000,000 against liability and expenses of claims of wrongful acts arising out of their position with the Registrant and other Nuveen funds, except for matters that involve willful acts, bad faith, gross negligence and willful disregard of duty (i.e., where the insured did not act in good faith for a purpose he or she reasonably believed to be in the best interest of the Registrant or where he or she had reasonable cause to believe this conduct was unlawful). The policy has a $1,000,000 deductible for operational failures and a $1,000,000 deductible for all other claims.
Insofar as indemnification for liability arising under the Securities Act of 1933, as amended (the “Securities Act”), may be permitted to trustees, officers and controlling persons of the Registrant pursuant to the foregoing provisions, or otherwise, the Registrant has been advised that, in the opinion of the Securities and Exchange Commission, such indemnification is against public policy as expressed in the Securities Act and is, therefore, unenforceable. In the event that a claim for indemnification against such liabilities (other than the payment by the Registrant of expenses incurred or paid by a trustee, officer or controlling person of the Registrant in the successful defense of any action, suit or proceeding) is asserted by such trustee, officer or controlling person in connection with the securities being registered, the Registrant will, unless in the opinion of its counsel the matter has been settled by controlling precedent, submit to a court of appropriate jurisdiction the question whether such indemnification by it is against public policy as expressed in the Securities Act and will be governed by the final adjudication of such issue.
Item 16. Exhibits
| | |
| (1)(a) | | Declaration of Trust of the Registrant, dated as of June 27, 1997.(1) |
| |
| (1)(b) | | Amended Establishment and Designation of Classes, dated as of November 16, 2016.(9) |
| |
| (1)(c) | | Amended and Restated Designation of Series, dated as of August 2, 2017.(13) |
| |
| (2)(a) | | By-Laws of the Registrant, amended and restated as of November 18, 2009.(5) |
| |
| (2)(b) | | Specimen Certificate of Shares of the Registrant.(2) |
| |
| (3) | | Not applicable. |
| |
| (4) | | Form of Agreement and Plan of Reorganization is filed herewith as Appendix I to Part A of this Registration Statement. |
| |
| (5) | | Not applicable. |
| |
| (6)(a) | | Management Agreement between the Registrant and Nuveen Fund Advisors, LLC, dated October 1, 2014.(7) |
| |
| (6)(b) | | Amended Schedules A and B of Management Agreement between the Registrant and Nuveen Fund Advisors, LLC, dated December 1, 2017.(13) |
C-2
| | |
| |
| (6)(c) | | Renewal and Amendment of Investment Management Agreement between the Registrant and Nuveen Fund Advisors, LLC, dated July 24, 2017.(11) |
| |
| (6)(d) | | Investment Sub-Advisory Agreement between Nuveen Fund Advisors, LLC and Santa Barbara Asset Management LLC, dated October 1, 2014.(7) |
| |
| (6)(e) | | Notice of Continuance of Sub-Advisory Agreement between Nuveen Fund Advisors, LLC and Santa Barbara Asset Management, LLC, dated July 24, 2017. (12) |
| |
| (7)(a) | | Distribution Agreement between the Registrant and John Nuveen & Co. Incorporated, dated as of August 1, 1998.(3) |
| |
| (7)(b) | | Form of Dealer Distribution, Shareholder Servicing and Fee-Based Program Agreement.(4) |
| |
| (7)(c) | | Form of Nuveen Funds Rule 22c-2 Agreement.(4) |
| |
| (7)(d) | | Renewal of Distribution Agreement between the Registrant and Nuveen Securities, LLC (f/k/a Nuveen Investments, LLC), dated August 4, 2017.(11) |
| |
| (8) | | Not applicable. |
| |
| (9)(a) | | Amended and Restated Master Custodian Agreement between the Nuveen Funds and State Street Bank and Trust Company, dated as of July 15, 2015.(8) |
| |
| (9)(b) | | Appendix A to the Amended and Restated Master Custodian Agreement, updated as of August 1, 2017.(14) |
| |
| (10)(a) | | Amended and Restated Plan of Distribution and Service Pursuant to Rule 12b-1, effective January 26, 2017.(10) |
| |
| (10)(b) | | Multiple Class Plan Adopted Pursuant to Rule 18f-3, as amended January 26, 2017.(10) |
| |
| (11) | | Opinion and Consent of Counsel is filed herewith. |
| |
| (12) | | Form of Opinion and Consent of Vedder Price P.C. supporting the tax matters discussed in the Proxy Statement/Prospectus is filed herewith. |
| |
| (13)(a) | | Transfer Agency and Service Agreement between the Nuveen Mutual Funds and Boston Financial Data Services, Inc., dated as of May 11, 2012.(6) |
| |
| (13)(b) | | Amendment and Schedule A to Transfer Agency and Service Agreement, effective as of December 18, 2017.(14) |
| |
| (13)(c) | | Amendment to Transfer Agency and Service Agreement, dated as of May 1, 2017.(10) |
| |
| (14) | | Consent of PricewaterhouseCoopers LLP is filed herewith. |
| |
| (15) | | Not applicable. |
| |
| (16) | | Powers of Attorney are filed herewith. |
| |
| (17) | | Form of Proxy Card is filed herein and appears following the Proxy Statement/Prospectus constituting Part A of this Registration Statement. |
| (1) | Filed on August 13, 1997 as an exhibit to the Registrant’s initial Registration Statement on Form N-1A (File No. 333-33607) and incorporated by reference herein. |
| (2) | Filed on November 13, 1997 as an exhibit to Post-Effective Amendment No. 1 to the Registrant’s Registration Statement on Form N-1A (File No. 333-33607) and incorporated by reference herein. |
| (3) | Filed on November 25, 1998 as an exhibit to Post-Effective Amendment No. 2 to the Registrant’s Registration Statement on Form N-1A (File No. 333-33607) and incorporated by reference herein. |
| (4) | Filed on October 19, 2006 as an exhibit to Post-Effective Amendment No. 23 to the Registrant’s Registration Statement on Form N-1A (File No. 333-33607) and incorporated by reference herein. |
C-3
| (5) | Filed on May 27, 2010 as an exhibit to Post-Effective Amendment No. 69 to the Registrant’s Registration Statement on Form N-1A (File No. 333-33607) and incorporated by reference herein. |
| (6) | Filed on June 11, 2012 as an exhibit to Post-Effective Amendment No. 84 to the Registrant’s Registration Statement on Form N-1A (File No. 333-33607) and incorporated by reference herein. |
| (7) | Filed on November 28, 2014 as an exhibit to Post-Effective Amendment No. 108 to the Registrant’s Registration Statement on Form N-1A (File No. 333-33607) and incorporated by reference herein. |
| (8) | Filed on September 28, 2015 as an exhibit to Post-Effective Amendment No. 115 to the Registrant’s Registration Statement on Form N-1A (File No. 333-33607) and incorporated by reference herein. |
| (9) | Filed on November 21, 2016 as an exhibit to Post-Effective Amendment No. 131 to the Registrant’s Registration Statement on Form N-1A (File No. 333-33607) and incorporated by reference herein. |
| (10) | Filed on May 12, 2017 as an exhibit to Post-Effective Amendment No. 149 to the Registrant’s Registration Statement on Form N-1A (File No. 333-33607) and incorporated by reference herein. |
| (11) | Filed on October 4, 2017 as an exhibit to Post-Effective Amendment No. 153 to the Registrant’s Registration Statement on Form N-1A (File No. 333-33607) and incorporated by reference herein. |
| (12) | Filed on November 28, 2017 as an exhibit to Post-Effective Amendment No. 156 to the Registrant’s Registration Statement on Form N-1A (File No. 333-33607) and incorporated by reference herein. |
| (13) | Filed on December 18, 2017 as an exhibit to Post-Effective Amendment No. 157 to the Registrant’s Registration Statement on Form N-1A (File No. 333-33607) and incorporated by reference herein. |
| (14) | Filed on January 26, 2018 as an exhibit to Post-Effective Amendment No. 162 to the Registrant’s Registration Statement on Form N-1A (File No. 333-33607) and incorporated by reference herein. |
Item 17. Undertakings
(1) The undersigned Registrant agrees that prior to any public reoffering of the securities registered through the use of a prospectus which is a part of this registration statement by any person or party who is deemed to be an underwriter within the meaning of Rule 145(c) of the Securities Act, the reoffering prospectus will contain the information called for by the applicable registration form for reofferings by persons who may be deemed underwriters, in addition to the information called for by the other items of the applicable form.
(2) The undersigned Registrant agrees that every prospectus that is filed under paragraph (1) above will be filed as a part of an amendment to the registration statement and will not be used until the amendment is effective, and that, in determining any liability under the Securities Act, each post-effective amendment shall be deemed to be a new registration statement for the securities offered therein, and the offering of the securities at that time shall be deemed to be the initial bona fide offering of them.
(3) The undersigned Registrant agrees that executed opinion of counsel supporting the tax matters discussed in the Proxy Statement/Prospectus will be filed with the Securities and Exchange Commission following the closing of the Reorganization.
C-4
SIGNATURES
As required by the Securities Act of 1933, this registration statement has been signed on behalf of the Registrant, in the City of Chicago and State of Illinois, on the 18th day of April, 2018.
| | |
| NUVEEN INVESTMENT TRUST II |
| |
| By: | | /s/ Christopher M. Rohrbacher |
| | Christopher M. Rohrbacher |
| | Vice President and Secretary |
As required by the Securities Act of 1933, this registration statement has been signed by the following persons in the capacities and on the dates indicated:
| | | | | | |
Signature | | Capacity | | | | Date |
| | | |
/s/ Greg A. Bottjer | | Chief Administrative Officer | | | | April 18, 2018 |
Greg A. Bottjer | | (principal executive officer) | | | | |
| | | |
/s/ Stephen D. Foy | | Vice President and Controller | | | | April 18, 2018 |
Stephen D. Foy | | (principal financial and accounting officer) | | | | |
| | | |
| | Chairman of the Board and Trustee | | ) | | |
William J. Schneider* | | | | ) | | |
| | | | ) | | |
| | Trustee | | ) | | |
Margo L. Cook* | | | | ) | | |
| | | | ) | | |
| | Trustee | | ) | | |
Jack B. Evans* | | | | ) | | By: /s/ Christopher M. Rohrbacher |
| | | | ) | | Christopher M. Rohrbacher |
| | Trustee | | ) | | Attorney-in-Fact |
William C. Hunter* | | | | ) | | April 18, 2018 |
| | | | ) | | |
| | Trustee | | ) | | |
Albin F. Moschner* | | | | ) | | |
| | | | | ) | | |
| | Trustee | | ) | | |
John K. Nelson* | | | | ) | | |
| | | | | ) | | |
| | Trustee | | ) | | |
Judith M. Stockdale* | | | | ) | | |
| | | | | ) | | |
| | Trustee | | ) | | |
Carole E. Stone* | | | | ) | | |
| | | | | ) | | |
| | Trustee | | ) | | |
Terence J. Toth* | | | | ) | | |
| | | | | ) | | |
| | | | | | |
Signature | | Capacity | | | | Date |
| | Trustee | | ) | | |
Margaret L. Wolff* | | | | ) | | |
| | | | | ) | | |
| | Trustee | | ) | | |
Robert L. Young* | | | | ) | | |
| | | | | ) | | |
| * | An original power of attorney authorizing Mark Czarniecki, Diana R. Gonzalez, Kevin J. McCarthy, Christopher M. Rohrbacher, Mark L. Winget, Gifford R. Zimmerman and Eric F. Fess to execute this registration statement, and amendments thereto, for each of the trustees of the Registrant on whose behalf this registration statement is filed has been executed and is filed herewith as Exhibit 16. |
EXHIBIT INDEX
| | |
Exhibit No. | | Name of Exhibit |
| |
| (11) | | Opinion and Consent of Counsel. |
| |
| (12) | | Form of Opinion and Consent of Vedder Price P.C. supporting the tax matters discussed in the Proxy Statement/Prospectus. |
| |
| (14) | | Consent of PricewaterhouseCoopers LLP. |
| |
| (16) | | Powers of Attorney. |


