EXHIBIT 13
Eleven-Year Financial Summary
Wal-Mart Stores, Inc.
(Dollar amounts in millions except per share data)
| | | | | | | | | | | | |
Fiscal Year Ended January 31, | | 2007 | | | 2006 | | | 2005 | |
Operating Results | | | | | | | | | | | | |
Net sales | | $ | 344,992 | | | $ | 308,945 | | | $ | 281,488 | |
Net sales increase | | | 11.7 | % | | | 9.8 | % | | | 11.4 | % |
Comparable store sales increase in the United States(1) | | | 2 | % | | | 3 | % | | | 3 | % |
Cost of sales | | $ | 264,152 | | | $ | 237,649 | | | $ | 216,832 | |
Operating, selling, general and administrative expenses | | | 64,001 | | | | 55,739 | | | | 50,178 | |
Interest expense, net | | | 1,529 | | | | 1,178 | | | | 980 | |
Effective tax rate | | | 33.6 | % | | | 33.1 | % | | | 34.2 | % |
Income from continuing operations | | $ | 12,178 | | | $ | 11,408 | | | $ | 10,482 | |
Net income | | | 11,284 | | | | 11,231 | | | | 10,267 | |
Per share of common stock: | | | | | | | | | | | | |
Income from continuing operations, diluted | | $ | 2.92 | | | $ | 2.72 | | | $ | 2.46 | |
Net income, diluted | | | 2.71 | | | | 2.68 | | | | 2.41 | |
Dividends | | | 0.67 | | | | 0.60 | | | | 0.52 | |
Financial Position | | | | | | | | | | | | |
Current assets of continuing operations | | $ | 46,588 | | | $ | 43,146 | | | $ | 37,913 | |
Inventories | | | 33,685 | | | | 31,910 | | | | 29,419 | |
Property, equipment and capital lease assets, net | | | 88,440 | | | | 77,865 | | | | 66,549 | |
Total assets of continuing operations | | | 151,193 | | | | 135,624 | | | | 117,139 | |
Current liabilities of continuing operations | | | 51,754 | | | | 48,348 | | | | 42,609 | |
Long-term debt | | | 27,222 | | | | 26,429 | | | | 20,087 | |
Long-term obligations under capital leases | | | 3,513 | | | | 3,667 | | | | 3,073 | |
Shareholders’ equity | | | 61,573 | | | | 53,171 | | | | 49,396 | |
Financial Ratios | | | | | | | | | | | | |
Current ratio | | | 0.9 | | | | 0.9 | | | | 0.9 | |
Return on assets(2) | | | 8.8 | % | | | 9.3 | % | | | 9.8 | % |
Return on shareholders’ equity(3) | | | 22.0 | % | | | 22.9 | % | | | 23.1 | % |
Other Year-End Data | | | | | | | | | | | | |
Discount stores in the United States | | | 1,075 | | | | 1,209 | | | | 1,353 | |
Supercenters in the United States | | | 2,256 | | | | 1,980 | | | | 1,713 | |
Sam’s Clubs in the United States | | | 579 | | | | 567 | | | | 551 | |
Neighborhood Markets in the United States | | | 112 | | | | 100 | | | | 85 | |
Units outside the United States | | | 2,757 | | | | 2,181 | | | | 1,480 | |
(1) | Beginning in fiscal 2007, comparable store sales includes all stores and clubs that have been open for at least the previous 12 months. Additionally, stores and clubs that are relocated, converted or expanded are excluded from comparable store sales for the first 12 months following the relocation, conversion or expansion. For fiscal 2006 and prior years, we considered comparable store sales to be sales at stores that were open as of February 1st of the prior fiscal year and which had not been converted, expanded or relocated since that date. |
(2) | Income from continuing operations before minority interest divided by average total assets from continuing operations. |
(3) | Income from continuing operations before minority interest divided by average shareholders’ equity. |
Financial information for all years has been restated to reflect the sale of McLane Company, Inc. (“McLane”) that occurred in fiscal 2004 and the disposition of our South Korean and German operations that occurred in fiscal 2007. McLane and the South Korean and German operations are presented as discontinued operations. All years have been restated for the fiscal 2004 adoption of the expense recognition provisions of Statement of Financial Accounting Standards No. 123, “Accounting and Disclosure of Stock-Based Compensation.” In fiscal 2005, we adopted Statement of Financial Accounting Standards No. 123R, “Share-Based Payment,” which did not result in a material impact to our financial statements.
In fiscal 2003, the Company adopted Financial Accounting Standards Board Statement No. 142, “Goodwill and Other Intangible Assets.” In years prior to adoption, the Company recorded amortization expense related to goodwill.
1
| | | | | | | | | | | | | | | | | | | | | | | | | | | | | | |
| 2004 | | | 2003 | | | 2002 | | | 2001 | | | 2000 | | | 1999 | | | 1998 | | | 1997 | |
| | | | | | | | | | | | | | | | | | | | | | | | | | | | | | |
| $ | 252,792 | | | $ | 226,479 | | | $ | 201,166 | | | $ | 178,028 | | | $ | 153,345 | | | $ | 129,161 | | | $ | 112,005 | | | $ | 99,627 | |
| | 11.6 | % | | | 12.6 | % | | | 13.0 | % | | | 16.1 | % | | | 18.7 | % | | | 15.3 | % | | | 12.4 | % | | | 11.9 | % |
| | 4 | % | | | 5 | % | | | 6 | % | | | 5 | % | | | 8 | % | | | 9 | % | | | 6 | % | | | 5 | % |
| $ | 195,922 | | | $ | 175,769 | | | $ | 156,807 | | | $ | 138,438 | | | $ | 119,526 | | | $ | 101,456 | | | $ | 88,163 | | | $ | 78,897 | |
| | 43,877 | | | | 39,178 | | | | 34,275 | | | | 29,942 | | | | 25,182 | | | | 21,469 | | | | 18,831 | | | | 16,437 | |
| | 825 | | | | 930 | | | | 1,183 | | | | 1,194 | | | | 837 | | | | 595 | | | | 716 | | | | 807 | |
| | 34.4 | % | | | 34.9 | % | | | 36.4 | % | | | 36.6 | % | | | 37.4 | % | | | 37.7 | % | | | 37.0 | % | | | 36.8 | % |
| $ | 9,096 | | | $ | 7,940 | | | $ | 6,718 | | | $ | 6,446 | | | $ | 5,582 | | | $ | 4,209 | | | $ | 3,424 | | | $ | 2,978 | |
| | 9,054 | | | | 7,955 | | | | 6,592 | | | | 6,235 | | | | 5,324 | | | | 4,397 | | | | 3,504 | | | | 3,042 | |
| | | | | | | | | | | | | | | | | | | | | | | | | | | | | | |
| $ | 2.08 | | | $ | 1.79 | | | $ | 1.50 | | | $ | 1.44 | | | $ | 1.25 | | | $ | 0.94 | | | $ | 0.76 | | | $ | 0.65 | |
| | 2.07 | | | | 1.79 | | | | 1.47 | | | | 1.39 | | | | 1.19 | | | | 0.98 | | | | 0.77 | | | | 0.66 | |
| | 0.36 | | | | 0.30 | | | | 0.28 | | | | 0.24 | | | | 0.20 | | | | 0.16 | | | | 0.14 | | | | 0.11 | |
| | | | | | | | | | | | | | | | | | | | | | | | | | | | | | |
| $ | 33,548 | | | $ | 28,867 | | | $ | 25,915 | | | $ | 24,796 | | | $ | 22,982 | | | $ | 19,503 | | | $ | 18,589 | | | $ | 17,385 | |
| | 26,263 | | | | 24,098 | | | | 21,793 | | | | 20,710 | | | | 18,961 | | | | 16,058 | | | | 16,005 | | | | 15,556 | |
| | 57,591 | | | | 50,053 | | | | 44,172 | | | | 39,439 | | | | 34,570 | | | | 24,824 | | | | 23,237 | | | | 19,935 | |
| | 102,455 | | | | 90,229 | | | | 79,301 | | | | 74,317 | | | | 67,290 | | | | 47,066 | | | | 44,221 | | | | 38,571 | |
| | 37,308 | | | | 31,752 | | | | 26,309 | | | | 28,096 | | | | 25,058 | | | | 15,848 | | | | 13,930 | | | | 10,432 | |
| | 17,088 | | | | 16,545 | | | | 15,632 | | | | 12,453 | | | | 13,650 | | | | 6,875 | | | | 7,169 | | | | 7,685 | |
| | 2,888 | | | | 2,903 | | | | 2,956 | | | | 3,054 | | | | 2,852 | | | | 2,697 | | | | 2,480 | | | | 2,304 | |
| | 43,623 | | | | 39,461 | | | | 35,192 | | | | 31,407 | | | | 25,878 | | | | 21,141 | | | | 18,519 | | | | 17,151 | |
| | | | | | | | | | | | | | | | | | | | | | | | | | | | | | |
| | 0.9 | | | | 0.9 | | | | 1.0 | | | | 0.9 | | | | 0.9 | | | | 1.2 | | | | 1.3 | | | | 1.7 | |
| | 9.7 | % | | | 9.6 | % | | | 9.0 | % | | | 9.3 | % | | | 10.1 | % | | | 9.6 | % | | | 8.5 | % | | | 8.0 | % |
| | 22.4 | % | | | 21.8 | % | | | 20.7 | % | | | 23.0 | % | | | 24.5 | % | | | 22.0 | % | | | 19.6 | % | | | 18.8 | % |
| | | | | | | | | | | | | | | | | | | | | | | | | | | | | | |
| | 1,478 | | | | 1,568 | | | | 1,647 | | | | 1,736 | | | | 1,801 | | | | 1,869 | | | | 1,921 | | | | 1,960 | |
| | 1,471 | | | | 1,258 | | | | 1,066 | | | | 888 | | | | 721 | | | | 564 | | | | 441 | | | | 344 | |
| | 538 | | | | 525 | | | | 500 | | | | 475 | | | | 463 | | | | 451 | | | | 443 | | | | 436 | |
| | 64 | | | | 49 | | | | 31 | | | | 19 | | | | 7 | | | | 4 | | | | — | | | | — | |
| | 1,248 | | | | 1,163 | | | | 1,050 | | | | 955 | | | | 892 | | | | 605 | | | | 568 | | | | 314 | |
The consolidation of The Seiyu, Ltd., had a significant impact on the fiscal 2006 financial position amounts in this summary. The acquisition of the Asda Group PLC and the Company’s related debt issuance had a significant impact on the fiscal 2000 amounts in this summary.
Years prior to 1998 have not been restated for the effects of the change in accounting method for Sam’s Club membership revenue recognition as the effects of this change would not have a material impact on this summary. The cumulative effect for this accounting change recorded in fiscal 2000 amounted to $198 million net of tax.
Certain reclassifications have been made to prior periods to conform to current presentations.
2
Table of contents
| | |
Management’s discussion and analysis of financial condition and results of operations | | 4 |
| |
Consolidated Statements of Income | | 17 |
| |
Consolidated Balance Sheets | | 18 |
| |
Consolidated Statements of Shareholders’ Equity | | 19 |
| |
Consolidated Statements of Cash Flows | | 20 |
| |
Notes to Consolidated Financial Statements | | 21 |
| |
Report of independent registered public accounting firm | | 41 |
| |
Report of independent registered public accounting firm on internal control over financial reporting | | 42 |
| |
Management’s report to our shareholders | | 44 |
| |
Fiscal 2007 end-of-year store count | | 46 |
| |
Board of directors | | 48 |
| |
Corporate and stock information | | 50 |
3
Wal-Mart Stores, Inc.
Management’s Discussion and Analysis of
Financial Condition and Results of Operations
Overview
Wal-Mart Stores, Inc. (“Wal-Mart,” the “Company” or “we”) operates retail stores in various formats around the world and is committed to saving people money so they can live better. We earn the trust of our customers every day by providing a broad assortment of quality merchandise and services at every day low prices (“EDLP”), while fostering a culture that rewards and embraces mutual respect, integrity and diversity. EDLP is our pricing philosophy under which we price items at a low price every day so that our customers trust that our prices will not change erratically under frequent promotional activity. Our focus for Sam’s Club is to provide exceptional value on brand-name merchandise at “members only” prices for both business and personal use. Internationally, we operate with similar philosophies. Our fiscal year ends on January 31.
We intend for this discussion to provide the reader with information that will assist in understanding our financial statements, the changes in certain key items in those financial statements from year to year, and the primary factors that accounted for those changes, as well as how certain accounting principles affect our financial statements. The discussion also provides information about the financial results of the various segments of our business to provide a better understanding of how those segments and their results affect the financial condition and results of operations of the Company as a whole. This discussion should be read in conjunction with our financial statements and accompanying notes as of January 31, 2007, and the year then ended.
Throughout this Management’s Discussion and Analysis of Financial Condition and Results of Operations, we discuss segment operating income and comparable store sales. Segment operating income refers to income from continuing operations before net interest expense, income taxes and minority interest. Segment operating income does not include unallocated corporate overhead and discontinued operations. Comparable store sales is a measure which indicates the performance of our existing stores by measuring the growth in sales for such stores for a particular period over the corresponding period in the prior year. Beginning in fiscal 2007, we changed our method of calculating comparable store sales. We now include in our measure of comparable store sales all stores and clubs that have been open for at least the previous 12 months. Additionally, stores and clubs that are relocated, converted or expanded are excluded from comparable store sales for the first 12 months following the relocation, conversion or expansion. For fiscal 2006 and prior years, we considered comparable store sales to be sales at stores that were open as of February 1st of the prior fiscal year and had not been expanded, converted or relocated since that date. Stores that were expanded, converted or relocated during that period are not included in the calculation. Comparable store sales is also referred to as “same-store” sales by others within the retail industry. The method of calculating comparable store sales varies across the retail industry. As a result, our calculation of comparable store sales is not necessarily comparable to similarly titled measures reported by other companies.
Operations
Our operations are comprised of three business segments: Wal-Mart Stores, Sam’s Club and International.
Our Wal-Mart Stores segment is the largest segment of our business, accounting for 65.6% of our fiscal 2007 net sales. This segment consists of three different traditional retail formats, all of which operate in the United States, and Wal-Mart’s online retail format, walmart.com. Our traditional Wal-Mart Stores retail formats include:
| | • | | Supercenters, which average approximately 187,000 square feet in size and offer a wide assortment of general merchandise and a full-line supermarket; |
| | • | | Discount stores, which average approximately 107,000 square feet in size and offer a wide assortment of general merchandise and a limited variety of food products; and |
| | • | | Neighborhood Markets, which average approximately 42,000 square feet in size and offer a full-line supermarket and a limited assortment of general merchandise. |
Our Sam’s Club segment consists of membership warehouse clubs, which operate in the United States, and the segment’s online retail format, samsclub.com. Sam’s Club accounted for 12.1% of our fiscal 2007 net sales. Our focus for Sam’s Club is to provide exceptional value on brand-name merchandise at “members only” prices for both business and personal use. Our Sam’s Clubs average approximately 132,000 square feet in size.
At January 31, 2007, our International segment consisted of retail operations in 12 countries and Puerto Rico. This segment generated 22.3% of our fiscal 2007 net sales. The International segment includes several different formats of retail stores and
4
restaurants, including discount stores, supercenters and Sam’s Clubs that operate outside the United States. For certain financial information relating to our operating segments, see Note 11 to our Consolidated Financial Statements.
The Retail Industry
We operate in the highly competitive retail industry in both the United States and the countries we serve internationally. We face strong sales competition from other discount, department, drug, variety and specialty stores and supermarkets, many of which are national, regional or international chains, as well as internet-based retailers and catalog businesses. Additionally, we compete with a number of companies for prime retail site locations, as well as in attracting and retaining quality employees (“associates”). We, along with other retail companies, are influenced by a number of factors including, but not limited to: cost of goods, consumer debt levels and buying patterns, economic conditions, interest rates, customer preferences, unemployment, labor costs, inflation, currency exchange fluctuations, fuel prices, weather patterns, catastrophic events, competitive pressures and insurance costs. Our Sam’s Club segment faces strong sales competition from other wholesale club operators, catalogs businesses, internet-based and other retailers. Further information on risks to our Company can be located in “Item 1A, Risk Factors,” in our Annual Report on Form 10-K for the year ended January 31, 2007.
Key Items in Fiscal 2007
Significant financial items during fiscal 2007 include:
| | • | | Net sales increased 11.7% to $345.0 billion in fiscal 2007, and income from continuing operations increased 6.7% to $12.2 billion. Foreign currency exchange rates favorably impacted sales and operating income by $1.5 billion and $90 million, respectively, in fiscal 2007. |
| | • | | Net cash provided by operating activities of continuing operations was $20.2 billion for fiscal 2007. During fiscal 2007, we paid $1.7 billion in cash to repurchase our common stock and paid dividends of $2.8 billion. Additionally during fiscal 2007, we issued $7.2 billion in long-term debt, repaid $5.8 billion of long-term debt and funded a decrease in commercial paper of $1.2 billion (net of issuances). |
| | • | | Total assets increased 9.4%, to $151.2 billion at January 31, 2007, when compared to January 31, 2006. During fiscal 2007, we made $15.7 billion of capital expenditures which was an increase of 7.8% over capital expenditures of $14.5 billion in fiscal 2006. |
| | • | | When compared to fiscal 2006, our Wal-Mart Stores segment experienced an 11.1% increase in operating income and a 7.8% increase in net sales in fiscal 2007. |
| | • | | Sam’s Club’s continued focus on the needs of each individual member helped drive a 9.2% increase in operating income on a 4.5% increase in net sales when comparing fiscal 2007 with fiscal 2006. |
| | • | | Our International segment generated an operating income increase of 21.5% and a 30.2% increase in net sales compared to fiscal 2006. Fiscal 2007 sales in the International segment include sales from the consolidation of The Seiyu, Ltd. (“Seiyu”) and Central American Retail Holding Company (“CARHCO”), now known as Wal-Mart Central America, and the acquisition of Sonae Distribuição Brasil S.A. (“Sonae”). These entities contributed 17.1 percentage points to the increase in the International segment net sales in fiscal 2007. |
| | • | | During fiscal 2007, we disposed of our South Korean and German operations. Both dispositions have been presented as discontinued operations in our Consolidated Financial Statements for all periods. For further details of these transactions, see Note 6 to our Consolidated Financial Statements. |
Company Performance Measures
Management uses a number of metrics to assess the Company’s performance including:
| | • | | comparable store sales, |
| | • | | operating income growth greater than net sales growth, |
| | • | | inventory growth less than net sales growth and |
| | • | | return on average assets. |
5
Comparable store sales is a measure which indicates the performance of our existing stores by measuring the growth in sales for such stores for a particular period over the corresponding period in the prior year. Our Wal-Mart Stores segment’s comparable store sales were 1.9% for fiscal 2007 versus 3.0% for fiscal 2006. Our Sam’s Club segment’s comparable club sales were 2.5% in fiscal 2007 versus 5.0% in fiscal 2006, including the impact of fuel sales.
Operating income growth greater than net sales growth has long been a measure of success for us. For fiscal 2007, our operating income increased by 9.5% when compared to fiscal 2006, while net sales increased by 11.7% over the same period. Our Wal-Mart Stores and Sam’s Club segments met this target; however, the International segment did not due to the impact of the newly acquired and consolidated entities.
Inventory growth at a rate less than that of net sales is a key measure of our efficiency. Total inventories at January 31, 2007, were up 5.6% over levels at January 31, 2006, and net sales were up 11.7% when comparing fiscal 2007 with fiscal 2006.
With an asset base as large as ours, we are focused on continuing to make certain our assets are productive. It is important for us to sustain our return on assets. Return on assets is defined as income from continuing operations before minority interest divided by average total assets from continuing operations. Return on assets for fiscal 2007, 2006 and 2005 was 8.8%, 9.3% and 9.8%, respectively. Return on assets in fiscal 2007 and 2006 was impacted by acquisition and consolidation of entities with lower asset returns.
Results of Operations
The Company and each of its operating segments had net sales (in millions), as follows:
| | | | | | | | | | | | | | | | | | | | | | | | |
| | | 2007 | | | 2006 | | | 2005 | |
Fiscal Year Ended January 31, | | Net sales | | Percent
of total | | | Percent
increase | | | Net sales | | Percent
of total | | | Percent increase | | | Net sales | | Percent
of total | |
Wal-Mart Stores | | $ | 226,294 | | 65.6 | % | | 7.8 | % | | $ | 209,910 | | 67.9 | % | | 9.4 | % | | $ | 191,826 | | 68.1 | % |
Sam’s Club | | | 41,582 | | 12.1 | % | | 4.5 | % | | | 39,798 | | 12.9 | % | | 7.2 | % | | | 37,119 | | 13.2 | % |
International | | | 77,116 | | 22.3 | % | | 30.2 | % | | | 59,237 | | 19.2 | % | | 12.7 | % | | | 52,543 | | 18.7 | % |
| | | | | | | | | | | | | | | | | | | | | | | | |
Total net sales | | $ | 344,992 | | 100.0 | % | | 11.7 | % | | $ | 308,945 | | 100.0 | % | | 9.8 | % | | $ | 281,488 | | 100.0 | % |
| | | | | | | | | | | | | | | | | | | | | | | | |
Our total net sales increased by 11.7% and 9.8% in fiscal 2007 and 2006 when compared to the previous fiscal year. Those increases resulted from our acquisitions, global store expansion programs and comparable store sales increases. Comparable store sales increased 2.0% in fiscal 2007 and 3.4% in fiscal 2006 in the United States. The decrease in comparable store sales is due to a difficult benchmark set in the prior year as a result of hurricane recovery sales activity, softness in the home and apparel categories and pressure from new store expansions within the trade area of established stores. As we continue to add new stores in the United States, we do so with an understanding that additional stores may take sales away from existing units. We estimate that comparable store sales in fiscal 2007, 2006 and 2005 were negatively impacted by the opening of new stores by approximately 1% in fiscal years 2007, 2006 and 2005. We expect that this effect of opening new stores on comparable store sales will continue during fiscal 2008 at a similar rate.
During fiscal 2007 and 2006, foreign currency exchange rates had a $1.5 billion and $1.4 billion favorable impact, respectively, on the International segment’s net sales, causing an increase in the International segment’s net sales as a percentage of total net sales relative to the Wal-Mart Stores and Sam’s Club segments. The acquisition of Sonae and consolidation of Seiyu and CARHCO resulted in a 3.2% increase in net sales for fiscal 2007. Additionally, the decrease in the Sam’s Club segment’s net sales as a percent of total Company sales in fiscal 2007, when compared to the previous fiscal years resulted from the more rapid development of new stores in the International and Wal-Mart Stores segments than the Sam’s Club segment. We expect this trend to continue for the foreseeable future.
Our total gross profit as a percentage of net sales (our “gross margin”) was 23.4%, 23.1% and 23.0% in fiscal 2007, 2006 and 2005, respectively. Our Wal-Mart Stores and International segment sales yield higher gross margins than our Sam’s Club segment. Accordingly, the greater increases in net sales for the Wal-Mart Stores and International segments in fiscal 2007 and 2006 had a favorable impact on the Company’s total gross margin.
Operating, selling, general and administrative expenses (“operating expenses”) as a percentage of net sales were 18.6%, 18.0% and 17.8% for fiscal 2007, 2006 and 2005, respectively. Half the increase in operating expenses as a percentage of total net sales was primarily due to the consolidated operations of Seiyu and Sonae, which are entities with less favorable operating expense leverage than our other International operations. The remainder of the increase in operating expenses as a percentage of total net sales was due to faster growth rates in our International segment relative to our Wal-Mart stores and Sam’s Club segments and slightly higher corporate-level general and administrative expenses.
6
Operating expenses in fiscal 2006 were higher as a percentage of net sales because of increases in utilities, maintenance and repairs and advertising. Increases in these expenses in fiscal 2006 were partially offset by reduced payroll costs as a percentage of net sales.
Interest, net, as a percentage of net sales was essentially flat from fiscal 2005 through fiscal 2007. The increase in interest, net, of $351 million in fiscal 2007 primarily resulted from increased borrowing levels and higher interest rates on our floating rate debt.
The increase in interest, net, of $198 million in fiscal 2006 was due to increased borrowing levels and higher interest rates, partially offset by a benefit from refund of IRS interest paid, reversal of interest on income tax accruals for prior years, and reduced levels of interest on fiscal 2006 income tax accruals.
Our effective income tax rates for fiscal 2007, 2006 and 2005 were 33.6%, 33.1% and 34.2%, respectively. The fiscal 2007 rate was higher than the fiscal 2006 rate due primarily to resolutions of certain federal and state tax contingencies in fiscal 2006 in excess of those in fiscal 2007. The fiscal 2006 rate was less than the fiscal 2005 rate, due primarily to adjustments in deferred income taxes and resolutions of certain federal and state tax contingencies.
Wal-Mart Stores Segment
| | | | | | | | | | | | |
Fiscal Year | | Segment Net
Sales Increase
from Prior
Fiscal Year | | | Segment
Operating
Income
(in millions) | | Segment
Operating
Income
Increase from
Prior Fiscal Year | | | Operating
Income as a
Percentage of
Segment Net Sales | |
2007 | | 7.8 | % | | $ | 17,029 | | 11.1 | % | | 7.5 | % |
2006 | | 9.4 | % | | | 15,324 | | 8.2 | % | | 7.3 | % |
2005 | | 10.1 | % | | | 14,163 | | 9.7 | % | | 7.4 | % |
The segment net sales increases in fiscal 2007 and fiscal 2006 from the prior fiscal years resulted from comparable store sales increases of 1.9% in fiscal 2007 and 3.0% in fiscal 2006, in addition to our expansion program. The decrease in comparable store sales is due to a difficult benchmark set in the prior year as a result of hurricane recovery sales activity, softness in the home and apparel categories and pressure from new store expansion within the trade area of established stores. We have developed several initiatives to help mitigate new store expansion pressure and to grow comparable store sales. These initiatives include becoming more relevant to the customer by creating a better store shopping experience and continuing to improve our merchandise assortment.
Our expansion programs consist of opening new units, converting discount stores to supercenters, relocations that result in more square footage, as well as expansions of existing stores. Segment expansion during fiscal 2007 included the opening of 15 discount stores, 12 Neighborhood Markets and 276 supercenters (including the conversion and/or relocation of 147 existing discount stores into supercenters). Two discount stores closed in fiscal 2007. During fiscal 2007, our total expansion program added approximately 42 million of store square footage, an 8.4% increase. Segment expansion during fiscal 2006 included the opening of 24 discount stores, 15 Neighborhood Markets and 267 supercenters (including the conversion and/or relocation of 166 existing discount stores into supercenters). Two discount stores closed in fiscal 2006. During fiscal 2006, our total expansion program added approximately 39 million of store square footage, an 8.6% increase.
Fiscal 2007 segment operating income as a percentage of segment net sales was up 0.2 percentage points over fiscal 2006. This increase was driven by a 0.2 percentage point increase in gross margin. The gross margin increase from fiscal 2006 can be attributed to improved initial margin rates in the general merchandise and food areas of our business and a fiscal 2006 adjustment to our product warranty liabilities which had an unfavorable impact on last year’s gross margin. Our gross margin increased despite our competitive pricing expansion and our increase in the cost of markdowns as a percentage of segment net sales, which primarily occurred in our home and apparel merchandise assortments. Segment operating expenses as a percentage of segment net sales in fiscal 2007 were essentially flat from fiscal 2006, primarily due to improved labor productivity in the stores, which was offset by higher costs associated with our store maintenance and remodel programs.
Fiscal 2006 segment operating income was down 0.1 percentage points as a percentage of segment net sales. This decrease was driven by a slight decline in gross margin and a 0.1 percentage point increase in operating expenses from fiscal 2006 levels, partially offset by a slight increase in other income as a percentage of segment net sales. The gross margin decrease from fiscal 2005 can be attributed to the continued increase in sales of our lower-margin food items as a percentage of total segment net sales, rising transportation costs, and the unfavorable impact of an adjustment to our product warranty liabilities in fiscal 2006. The segment’s operating expenses as a percentage of segment net sales in fiscal 2006 were higher than fiscal 2005 primarily due to expense pressures from utilities and advertising costs.
7
Sam’s Club Segment
| | | | | | | | | | | | |
Fiscal Year | | Segment Net
Sales Increase
from Prior
Fiscal Year | | | Segment
Operating
Income
(in millions) | | Segment
Operating
Income
Increase from
Prior Fiscal Year | | | Operating
Income as a
Percentage of
Segment Net Sales | |
2007 | | 4.5 | % | | $ | 1,512 | | 9.2 | % | | 3.6 | % |
2006 | | 7.2 | % | | | 1,385 | | 8.2 | % | | 3.5 | % |
2005 | | 7.5 | % | | | 1,280 | | 13.7 | % | | 3.4 | % |
Growth in net sales for the Sam’s Club segment in fiscal 2007 and fiscal 2006 resulted from comparable club sales increases of 2.5% in fiscal 2007 and 5.0% in fiscal 2006, along with our club expansion program. Comparable club sales in fiscal 2007 increased at a slower rate than in fiscal 2006 primarily due to lower growth rates in fuel and certain food-related categories and media categories. Fuel sales had a negative impact of 0.4 percentage points on comparable club sales in fiscal 2007, while contributing 1.3 percentage points to fiscal 2006 comparable club sales. Sam’s Club segment expansion consisted of the opening of 15 new clubs in fiscal 2007 and 17 clubs in fiscal 2006. Three clubs were closed in fiscal 2007 and one club was closed in fiscal 2006. Our total expansion program added 2.9 million of additional club square footage, or 3.9%, in fiscal 2007 and 2.7 million, or 3.8%, of additional club square footage in fiscal 2006.
Consistent with past periods, segment operating income as a percentage of segment net sales increased slightly in fiscal 2007 when compared to fiscal 2006. The increase was due to an improvement in gross margin and membership revenue as a percentage of segment net sales, partially offset by an increase in operating expenses as a percentage of segment net sales. Gross margin as a percentage of segment net sales increased due to strong sales in certain higher margin categories, including pharmacy and jewelry, during fiscal 2007. Operating expenses as a percentage of segment net sales increased primarily due to a slight increase in employee-related costs in fiscal 2007 when compared to fiscal 2006. Fiscal 2007 also included an $11 million charge related to the closing of three clubs during the year.
Segment operating income as a percentage of segment net sales increased slightly in fiscal 2006 when compared to fiscal 2005. The increase was due to an improvement in operating expenses and other income as a percentage of segment net sales, partially offset by a slight decrease in gross margin as a percentage of segment net sales. Operating expenses as a percentage of segment net sales improved primarily due to lower wage and accident costs as a percentage of segment net sales in fiscal 2006 when compared to fiscal 2005, partially offset by increased utility costs. The increase in other income as a percentage of segment net sales was primarily the result of income recognized from higher membership sales in fiscal 2006. Gross margin as a percentage of segment net sales decreased due to strong segment net sales in certain lower margin categories, including fuel and tobacco, during fiscal 2006.
8
International Segment
| | | | | | | | | | | | |
Fiscal Year | | Segment Net
Sales Increase
from Prior
Fiscal Year | | | Segment
Operating Income
(in millions) | | Segment
Operating
Income
Increase from
Prior Fiscal Year | | | Operating
income as a
Percentage of
Segment Net Sales | |
2007 | | 30.2 | % | | $ | 4,259 | | 21.5 | % | | 5.5 | % |
2006 | | 12.7 | % | | | 3,506 | | 9.7 | % | | 5.9 | % |
2005 | | 19.3 | % | | | 3,197 | | 22.8 | % | | 6.1 | % |
At January 31, 2007, our International segment was comprised of wholly-owned operations in Argentina, Brazil, Canada, Puerto Rico and the United Kingdom, the operation of joint ventures in China and the operations of majority-owned subsidiaries in Central America, Japan and Mexico.
The fiscal 2007 increase in the International segment’s net sales primarily resulted from:
| | • | | the consolidation of Seiyu and CARHCO and the acquisition of Sonae, all of which added 17.1 percentage points to the increase in fiscal 2007 net sales, |
| | • | | net sales growth from existing units, |
| | • | | our international expansion program which added 576 units, net of relocations and closings, consisting of 20.4 million, or 12.0%, of additional unit square footage (this includes the consolidation of CARHCO, which added 372 stores and 6.5 million square feet in February 2006) and |
| | • | | the $1.5 billion favorable impact of changes in foreign currency exchange rates during fiscal 2007. |
The fiscal 2006 increase in the International segment’s net sales primarily resulted from improved operating execution, our international expansion program and the impact of changes in foreign currency exchange rates. In fiscal 2006, the International segment added 701 units, net of relocations and closings, which added 53 million, or 45.1%, of additional unit square footage. This includes the acquisition of Sonae in Southern Brazil, which added 139 stores and 11 million square feet in December 2005, and the consolidation of Seiyu in Japan, which added 398 stores and 29 million square feet in December 2005. Additionally, the impact of changes in foreign currency exchange rates favorably affected the translation of International segment net sales into U.S. dollars by an aggregate of $1.4 billion in fiscal 2006.
Fiscal 2007 net sales at our United Kingdom subsidiary, Asda, were 37.4% of the International segment net sales. Net sales for Asda included in our Consolidated Statements of Income during fiscal 2007, 2006 and 2005 were $28.9 billion, $26.8 billion and $26.0 billion, respectively.
Fiscal 2007 International segment operating income as a percentage of segment net sales was down from fiscal 2006, primarily due to the impact of the acquisition of Sonae and the consolidation of Seiyu and CARHCO. These acquisitions and consolidations increased gross margin by 0.4 percentage points, increased operating expenses as a percentage of segment net sales by 1.2 percentage points, and reduced operating income as a percent of segment net sales by approximately 0.6 percentage points. The impact of the acquisitions was partially offset by an increase in operating income as a percentage of segment net sales in our other businesses in this segment. Overall, the International segment’s gross margin of our other businesses was up 0.2 percentage points in fiscal 2007, primarily driven by improvements in Mexico and Canada resulting from a favorable shift in the mix of products sold toward general merchandise categories which carry a higher margin. Fiscal 2007 operating expenses as a percentage of segment net sales of our other businesses were essentially flat when compared to fiscal 2006. Fiscal 2007 operating income includes a favorable impact of $90 million from changes in foreign currency exchange rates.
While fiscal 2006 International segment operating income as a percentage of segment net sales was down slightly from fiscal 2005, segment gross margin was up 0.5 percentage points. This improvement in segment gross margin was offset by an increase in operating expenses and a decrease in other income, both as a percentage of segment net sales. The International segment’s fiscal 2006 improvement in gross margin was primarily due to a favorable shift in the mix of products sold toward general merchandise categories which carry a higher margin. The 0.5 percentage point increase in operating expenses as a percentage of segment net sales in fiscal 2006 was driven primarily by increased advertising, utility and insurance expenditures. Other income as a percentage of segment net sales declined 0.2 percentage points in fiscal 2006 primarily due to a reduction in rental income in Canada and a payroll tax recovery in Mexico in fiscal 2005. Fiscal 2006 operating income includes a favorable impact of $68 million from changes in foreign currency exchange rates.
9
Liquidity and Capital Resources
Overview
Cash flows provided by operating activities supply us with a significant source of liquidity. Our cash flows from operating activities of continuing operations were $20.2 billion, $17.7 billion and $15.2 billion in fiscal 2007, 2006 and 2005, respectively. The increases in cash flows provided by operating activities for each fiscal year were primarily attributable to improved income from continuing operations and improved management of inventory procurement resulting in accounts payable growing at a faster rate than inventory.
In fiscal 2007, we paid dividends of $2.8 billion, made $15.7 billion in capital expenditures, paid $1.7 billion in cash to repurchase shares of our common stock, received $7.2 billion from the issuance of long-term debt, repaid $5.8 billion of long-term debt and repaid $1.2 million of commercial paper (net of issuances).
Working Capital
Current liabilities exceeded current assets at January 31, 2007, by $5.2 billion, an increase of $166 million from January 31, 2006. Our ratio of current assets to current liabilities was 0.9 to 1 at January 31, 2007 and 2006. At January 31, 2007, we had total assets of $151.2 billion, compared with total assets of $138.2 billion at January 31, 2006. We generally have a working capital deficit due to our efficient use of cash in funding operations and in providing returns to shareholders in the form of stock repurchases and payment of dividends.
Company Share Repurchase Program
From time to time, we repurchase shares of our common stock under a $10.0 billion share repurchase program authorized by our Board of Directors in September 2004. During the first half of fiscal 2006, we repurchased $3.6 billion of shares under this repurchase program. During the fourth quarter of fiscal 2007, we repurchased $1.8 billion of shares under this repurchase program. At January 31, 2007, approximately $4.3 billion of additional shares may be repurchased under this program.
There is no expiration date for or other restriction limiting the period over which we can make our share repurchases under the program, which will expire only when and if we have repurchased $10.0 billion of our shares under the program. Under the program, repurchased shares are constructively retired and returned to unissued status. We consider several factors in determining when to make share repurchases, including among other things, our current cash needs, our capacity for leverage, our cost of borrowings, and the market price of the stock.
Common Stock Dividends
We paid dividends totaling approximately $2.8 billion or $0.67 per share in fiscal 2007. The dividends paid in fiscal 2007 represent an 11.7% increase over fiscal 2006. The fiscal 2006 dividend of $0.60 per share represented a 15.4% increase over fiscal 2005. We have increased our dividend every year since the first dividend was declared in March 1974.
On March 8, 2007, the Company’s Board of Directors approved an increase in annual dividends to $0.88 per share, an increase of 31.3% over the dividends paid in fiscal 2007. The annual dividend will be paid in four quarterly installments on April 2, 2007, June 4, 2007, September 4, 2007, and January 2, 2008 to holders of record on March 16, May 18, August 17 and December 14, 2007, respectively.
10
Contractual Obligations and Other Commercial Commitments
The following table sets forth certain information concerning our obligations and commitments to make contractual future payments, such as debt and lease agreements, and contingent commitments:
| | | | | | | | | | | | | | | |
| | | Payments due during fiscal years ending January 31, |
(In millions) | | Total | | 2008 | | 2009-2010 | | 2011-2012 | | Thereafter |
Recorded Contractual Obligations: | | | | | | | | | | | | | | | |
Long-term debt | | $ | 32,650 | | $ | 5,428 | | $ | 9,120 | | $ | 5,398 | | $ | 12,704 |
Commercial paper | | | 2,570 | | | 2,570 | | | — | | | — | | | — |
Capital lease obligations | | | 5,715 | | | 538 | | | 1,060 | | | 985 | | | 3,132 |
| | | | | |
Unrecorded Contractual Obligations: | | | | | | | | | | | | | | | |
Non-cancelable operating leases | | | 10,446 | | | 842 | | | 1,594 | | | 1,332 | | | 6,678 |
Interest on long-term debt | | | 17,626 | | | 1,479 | | | 2,482 | | | 1,705 | | | 11,960 |
Undrawn lines of credit | | | 6,890 | | | 3,390 | | | — | | | 3,500 | | | — |
Trade letters of credit | | | 2,986 | | | 2,986 | | | — | | | — | | | — |
Standby letters of credit | | | 2,247 | | | 2,247 | | | — | | | — | | | — |
Purchase obligations | | | 15,168 | | | 11,252 | | | 3,567 | | | 126 | | | 223 |
| | | | | | | | | | | | | | | |
Total commercial commitments | | $ | 96,298 | | $ | 30,732 | | $ | 17,823 | | $ | 13,046 | | $ | 34,697 |
| | | | | | | | | | | | | | | |
Purchase obligations include all legally binding contracts such as firm commitments for inventory and utility purchases, as well as commitments to make capital expenditures, software acquisition/license commitments and legally binding service contracts. Purchase orders for the purchase of inventory and other services are not included in the table above. Purchase orders represent authorizations to purchase rather than binding agreements. For the purposes of this table, contractual obligations for purchase of goods or services are defined as agreements that are enforceable and legally binding and that specify all significant terms, including: fixed or minimum quantities to be purchased; fixed, minimum or variable price provisions; and the approximate timing of the transaction. Our purchase orders are based on our current inventory needs and are fulfilled by our suppliers within short time periods. We also enter into contracts for outsourced services; however, the obligations under these contracts are not significant and the contracts generally contain clauses allowing for cancellation without significant penalty.
The expected timing for payment of the obligations discussed above is estimated based on current information. Timing of payments and actual amounts paid of some unrecorded contractual commitments may be different depending on the timing of receipt of goods or services or changes to agreed-upon amounts for some obligations.
Off Balance Sheet Arrangements
In addition to the unrecorded contractual obligations discussed and presented above, the Company has made certain guarantees as discussed below for which the timing of payment, if any,is unknown.
In connection with certain debt financing, we could be liable for early termination payments if certain unlikely events were to occur. At January 31, 2007, the aggregate termination payment was $69 million. These two arrangements expire in fiscal 2011 and fiscal 2019.
In connection with the development of our grocery distribution network in the United States, we have agreements with third parties which would require us to purchase or assume the leases on certain unique equipment in the event the agreements are terminated. These agreements, which can be terminated by either party at will, cover up to a five-year period and obligate the Company to pay up to approximately $150 million upon termination of some or all of these agreements.
The Company has entered into lease commitments for land and buildings for 141 future locations. These lease commitments with real estate developers provide for minimum rentals ranging from 4 to 30 years, which, if consummated based on current cost estimates, will approximate $72 million annually over the lease terms.
Capital Resources
During fiscal 2007, we issued $7.2 billion of long-term debt. The net proceeds from the issuance of such long-term debt were used to repay outstanding commercial paper indebtedness and for other general corporate purposes.
11
Management believes that cash flows from operations and proceeds from the sale of commercial paper will be sufficient to finance any seasonal buildups in merchandise inventories and meet other cash requirements. If our operating cash flows are not sufficient to pay dividends and to fund our capital expenditures, we anticipate funding any shortfall in these expenditures with a combination of commercial paper and long-term debt. We plan to refinance existing long-term debt as it matures and may desire to obtain additional long-term financing for other corporate purposes. We anticipate no difficulty in obtaining long-term financing in view of our credit rating and favorable experiences in the debt market in the recent past. The following table details the ratings of the credit rating agencies that rated our outstanding indebtedness at January 31, 2007.
| | | | |
Rating agency | | Commercial paper | | Long-term debt |
Standard & Poor’s | | A-1 + | | AA |
Moody’s Investors Service | | P-1 | | Aa2 |
Fitch Ratings | | F1 + | | AA |
Dominion Bond Rating Service | | R-1(middle) | | AA |
In the past we have utilized total debt to total capitalization as the primary metric to monitor our leverage. We now use the ratio of adjusted cash flow from operations to adjusted average debt as our primary leverage metric, which is also consistent with methods commonly used by credit rating agencies to determine our credit rating. Adjusted cash flow from operations as the numerator is defined as cash flow from operations of continuing operations for the current year plus two-thirds of the current year operating rent expense less current year capitalized interest expense. Adjusted average debt as the denominator is defined as average debt plus eight times average operating rent expense. Average debt is the simple average of beginning and ending commercial paper, long-term debt due within one year, obligations under capital leases due in one year, long-term debt, and long-term obligations under capital leases. Average operating rent expense is the simple average of current year and prior year operating rent expense. We believe this metric is useful to investors as it provides them with a tool to measure our leverage. The ratio, as calculated below, exceeds the published threshold requirements to maintain our current credit ratings.
| | | | |
Amounts in millions except for the calculated ratio | | Fiscal Year Ended January 31, 2007 | |
Cash flows from operating activities of continuing operations | | $ | 20,209 | |
+ Two-thirds current year operating rent expense (1) | | | 961 | |
– Current year capitalized interest expense | | | 182 | |
| | | | |
Numerator | | $ | 20,988 | |
Average debt (2) | | $ | 38,874 | |
Eight times average operating rent expense (3) | | | 9,604 | |
| | | | |
Denominator | | $ | 48,478 | |
Adjusted cash flow from operations to adjusted average debt (4) | | | 43 | % |
Cash flow from operations to average debt | | | 52 | % |
Selected Financial Information | | | | |
Fiscal year 2007 operating rent expense | | $ | 1,441 | |
Fiscal year 2006 operating rent expense | | | 960 | |
Fiscal year 2007 capitalized interest | | | 182 | |
| | | | | | |
| | | January 31, 2007 | | January 31, 2006 |
Commercial paper | | $ | 2,570 | | $ | 3,754 |
Long-term debt due in one year | | | 5,428 | | | 4,595 |
Obligations under capital leases due within one year | | | 285 | | | 284 |
Long-term debt | | | 27,222 | | | 26,429 |
Long-term obligations under capital leases | | | 3,513 | | | 3,667 |
| | | | | | |
Total debt | | $ | 39,018 | | $ | 38,729 |
| | | | | | |
| (3) | 8 X (($1,441 + $960)/2) |
| (4) | The calculation of the ratio as defined. |
The most recognized directly comparable GAAP measure is the ratio of cash flow from operations of continuing operations for the current year to average total debt (which excludes any affect of operating leases or capitalized interest) and for which fiscal 2007 was 52%.
12
Future Expansion
Capital expenditures for fiscal 2008 are expected to be approximately $17 billion, including additions of capital leases. These fiscal 2008 expenditures will include the construction of 5 to 10 new discount stores, 265 to 270 new supercenters (with relocations, conversions or expansions accounting for approximately 145 of those supercenters), 15 to 20 new Neighborhood Markets, 20 to 30 new Sam’s Clubs (with relocations or expansions accounting for 15 of those Sam’s Clubs) and 320 to 330 new units in our International segment (with relocations or expansions accounting for approximately 30 of those units). We plan to finance this expansion, and any acquisitions of other operations that we may make during fiscal 2008, primarily out of cash flows from operations.
Market Risk
In addition to the risks inherent in our operations, we are exposed to certain market risks, including changes in interest rates and changes in foreign currency exchange rates.
The analysis presented for each of our market risk sensitive instruments is based on a 10% change in interest or foreign currency exchange rates. These changes are hypothetical scenarios used to calibrate potential risk and do not represent our view of future market changes. As the hypothetical figures discussed below indicate, changes in fair value based on the assumed change in rates generally cannot be extrapolated because the relationship of the change in assumption to the change in fair value may not be linear. The effect of a variation in a particular assumption is calculated without changing any other assumption. In reality, changes in one factor may result in changes in another, which may magnify or counteract the sensitivities.
At January 31, 2007 and 2006, we had $32.7 billion and $31.0 billion, respectively, of long-term debt outstanding. Our weighted average effective interest rate on long-term debt, after considering the effect of interest rate swaps, was 4.9% and 4.8% at January 31, 2007 and 2006, respectively. A hypothetical 10% increase in interest rates in effect at January 31, 2007 and 2006, would have increased annual interest expense on borrowings outstanding at those dates by $47 million and $48 million, respectively.
At January 31, 2007 and 2006, we had $2.6 billion and $3.8 billion of outstanding commercial paper obligations. The weighted average interest rate, including fees, on these obligations at January 31, 2007 and 2006, was 5.3% and 3.9%, respectively. A hypothetical 10% increase in commercial paper rates in effect at January 31, 2007 and 2006, would have increased annual interest expense on the outstanding balances on those dates by $14 million.
13
We enter into interest rate swaps to minimize the risks and costs associated with financing activities, as well as to maintain an appropriate mix of fixed- and floating-rate debt. Our preference is to maintain approximately 50% of our debt portfolio, including interest rate swaps, in floating-rate debt. The swap agreements are contracts to exchange fixed- or variable-rates for variable- or fixed-interest rate payments periodically over the life of the instruments. The aggregate fair value of these swaps represented a loss of $1 million at January 31, 2007 and a gain of $133 million at January 31, 2006. A hypothetical increase (or decrease) of 10% in interest rates from the level in effect at January 31, 2007, would result in a (loss) or gain in value of the swaps of ($95 million) or $103 million, respectively. A hypothetical increase (or decrease) of 10% in interest rates from the level in effect at January 31, 2006, would have resulted in a (loss) or gain in value of the swaps of ($103 million) or $104 million, respectively.
We hold currency swaps to hedge the foreign currency exchange component of our net investments in the United Kingdom and Japan. In addition, we hold a cross-currency swap which hedges the foreign currency risk of debt denominated in currencies other than the local currency. The aggregate fair value of these swaps at January 31, 2007 and 2006, represented a loss of $181 million and $124 million, respectively. A hypothetical 10% increase (or decrease) in the foreign currency exchange rates underlying these swaps from the market rate would result in a (loss) or gain in the value of the swaps of ($178 million) and $196 million at January 31, 2007, and ($96 million) and $78 million at January 31, 2006. A hypothetical 10% change in interest rates underlying these swaps from the market rates in effect at January 31, 2007 and 2006, would have an insignificant impact on the value of the swaps.
In addition to currency swaps, we have designated debt of approximately £3.0 billion and £2.0 billion as of January 31, 2007 and 2006, respectively, as a hedge of our net investment in the United Kingdom. At January 31, 2007, a hypothetical 10% increase (or decrease) in value of the U.S. dollar relative to the British pound would result in a gain (or loss) in the value of the debt of $594 million. At January 31, 2006, a hypothetical 10% increase (or decrease) in value of the U.S. dollar relative to the British pound would result in a gain (or loss) in the value of the debt of $359 million. In addition, we have designated debt of approximately ¥142.1 billion and ¥87.1 billion as of January 31, 2007 and 2006, respectively, as a hedge of our net investment in Japan. At January 31, 2007, a hypothetical 10% increase (or decrease) in value of the U.S. dollar relative to the Japanese yen would result in a gain (or loss) in the value of the debt of $103 million. At January 31, 2006, a hypothetical 10% increase (or decrease) in value of the U.S. dollar relative to the Japanese yen would result in a gain (or loss) in the value of the debt of $75 million.
Summary of Critical Accounting Policies
Management strives to report the financial results of the Company in a clear and understandable manner, although in some cases accounting and disclosure rules are complex and require us to use technical terminology. In preparing our Consolidated Financial Statements, we follow accounting principles generally accepted in the United States. These principles require us to make certain estimates and apply judgments that affect our financial position and results of operations as reflected in our financial statements. These judgments and estimates are based on past events and expectations of future outcomes. Actual results may differ from our estimates.
Management continually reviews its accounting policies, how they are applied and how they are reported and disclosed in our financial statements. Following is a summary of our more significant accounting policies and how they are applied in preparation of the financial statements.
Inventories
We value our inventories at the lower of cost or market as determined primarily by the retail method of accounting, using the last-in, first-out (“LIFO”) method for substantially all our Wal-Mart Stores segment’s merchandise. Sam’s Club merchandise and merchandise in our distribution warehouses are valued based on weighted average cost using the LIFO method. Inventories for international operations are primarily valued by the retail method of accounting and are stated using the first-in, first-out (“FIFO”) method.
Under the retail method, inventory is stated at cost, which is determined by applying a cost-to-retail ratio to each merchandise grouping’s retail value. The FIFO cost-to-retail ratio is based on the initial margin of the fiscal year purchase activity. The cost-to-retail ratio for measuring any LIFO reserves is based on the initial margin of the fiscal year purchase activity less the impact of any markdowns. The retail method requires management to make certain judgments and estimates that may significantly impact the ending inventory valuation at cost as well as the amount of gross margin recognized. Judgments made include recording markdowns used to sell through inventory and shrinkage. When management determines the salability of inventory has diminished, markdowns for clearance activity and the related cost impact are recorded at the time the price change decision is made. Factors considered in the determination of markdowns include current and anticipated demand, customer preferences and age of merchandise, as well as seasonal and fashion trends. Changes in weather patterns and customer preferences related to fashion trends could cause material changes in the amount and timing of markdowns from year to year.
14
When necessary, the Company records a LIFO provision for a quarter for the estimated annual effect of inflation, and these estimates are adjusted to actual results determined at year-end. Our LIFO provision is calculated based on inventory levels, markup rates and internally generated retail price indices except for grocery items, for which we use a consumer price index. At January 31, 2007 and 2006, our inventories valued at LIFO approximated those inventories as if they were valued at FIFO.
The Company provides for estimated inventory losses (“shrinkage”) between physical inventory counts on the basis of a percentage of sales. The provision is adjusted annually to reflect the historical trend of the actual physical inventory count results. Historically, shrinkage has not been volatile.
Impairment of Assets
We evaluate long-lived assets other than goodwill and assets with indefinite lives for indicators of impairment whenever events or changes in circumstances indicate their carrying values may not be recoverable. Management’s judgments regarding the existence of impairment indicators are based on market conditions and our operational performance, such as operating income and cash flows. The evaluation is performed at the lowest level of identifiable cash flows, which is generally at the individual store level or, in certain circumstances, at the market group level. The variability of these factors depends on a number of conditions, including uncertainty about future events and changes in demographics, and thus our accounting estimates may change from period to period. These factors could cause management to conclude that impairment indicators exist and require that impairment tests be performed, which could result in management determining that the value of long-lived assets is impaired, resulting in a writedown of the long-lived assets.
Goodwill and indefinite-lived other acquired intangible assets are not amortized, but are evaluated for impairment annually or whenever events or changes in circumstances indicate that the value of a certain asset may be impaired. This evaluation requires management to make judgments relating to future cash flows, growth rates, and economic and market conditions. These evaluations are based on determining the fair value of a reporting unit or asset using a valuation method such as discounted cash flow or a relative, market-based approach. Historically, the Company has generated sufficient returns to recover the cost of goodwill and indefinite-lived other acquired intangible assets. Because of the nature of the factors used in these tests, if different conditions occur in future periods, future operating results could be materially impacted.
Income Taxes
The determination of our provision for income taxes requires significant judgment, the use of estimates, and the interpretation and application of complex tax laws. Significant judgment is required in assessing the timing and amounts of deductible and taxable items. We establish reserves when, despite our belief that our tax return positions are fully supportable, we believe that certain positions may be successfully challenged. When facts and circumstances change, we adjust these reserves through our provision for income taxes. The Financial Accounting Standards Board issued Interpretation No. 48, “Accounting for Uncertainty in Income Taxes”, which will require us to adjust our past methods of judgment in assessing the timing and amounts of deductible and taxable items commencing fiscal year 2008.
Self-Insurance
We use a combination of insurance, self-insured retention and self-insurance for a number of risks, including, without limitation, workers’ compensation, general liability, vehicle liability and the Company’s obligation for employee-related health care benefits. Liabilities associated with the risks that we retain are estimated by considering historical claims experience, including frequency, severity, demographic factors, and other actuarial assumptions. In calculating our liability, we analyze our historical trends, including loss development, and apply appropriate loss development factors to the incurred costs associated with the claims made against our self-insured program. The estimated accruals for these liabilities could be significantly affected if future occurrences or loss development differ from these assumptions. For example, for our workers’ compensation and general liability, a 1% increase or decrease to the assumptions for claims costs or loss development factors would increase or decrease our self-insurance accrual by $25 million or $72 million, respectively.
For a summary of our significant accounting policies, please see Note 1 to our Consolidated Financial Statements that appear after this discussion.
Forward-Looking Statements
This Annual Report contains statements that Wal-Mart believes are “forward-looking statements” within the meaning of the Private Securities Litigation Reform Act of 1995. Those statements are intended to enjoy the protection of the safe harbor for
15
forward-looking statements provided by that Act. These forward-looking statements include statements under the caption “Results of Operations” in Management’s Discussion and Analysis of Financial Condition and Results of Operations regarding the effect of the opening of new stores on existing stores sales and the trend in the percentages that the net sales of certain of our business segments represent of our total net sales, and under the caption “Liquidity and Capital Resources” in Management’s Discussion and Analysis of Financial Condition and Results of Operations with respect to our capital expenditures, our ability to fund certain cash flow shortfalls by the sale of commercial paper and long-term debt securities, our ability to sell our long-term securities and our anticipated reasons for repurchasing shares of our common stock and in Note 5 to our Consolidated Financial Statements regarding the possible tax treatment and effect of the loss recorded in connection with the disposition of our German operations in fiscal year 2007. These statements are identified by the use of the words “anticipate,” “believe,” “could increase,” “could result,” “expect,” “will result,” “may result,” “plan,” “will be” and other, similar words or phrases. Similarly, descriptions of our objectives, strategies, plans, goals or targets are also forward-looking statements. These statements discuss, among other things, expected growth, future revenues, future cash flows, future capital expenditures, future performance and the anticipation and expectations of Wal-Mart and its management as to future occurrences and trends. These forward-looking statements are subject to certain factors, in the United States and internationally, that could affect our financial performance, business strategy, plans, goals and objectives. Those factors include, but are not limited to, the cost of goods, information security costs, labor costs, the cost of fuel and electricity, the cost of healthcare benefits, insurance costs, cost of construction materials, catastrophic events, competitive pressures, inflation, accident-related costs, consumer buying patterns and debt levels, weather patterns, transport of goods from foreign suppliers, currency exchange fluctuations, trade restrictions, changes in tariff and freight rates, changes in tax and other laws and regulations that affect our business, the outcome of legal proceedings to which we are a party, unemployment levels, interest rate fluctuations, changes in employment legislation and other capital market, economic and geo-political conditions and events. Moreover, we typically earn a disproportionate part of our annual operating income in the fourth quarter as a result of the seasonal buying patterns. Those buying patterns are difficult to forecast with certainty. The foregoing list of factors that may affect our performance is not exclusive. Other factors and unanticipated events could adversely affect our business operations and financial performance. We discuss certain of these matters more fully, as well as certain risk factors that may affect our business operations, financial condition, results of operations and liquidity in other of our filings with the Securities and Exchange Commission (“SEC”), including our Annual Report on Form 10-K. We filed our Annual Report on Form 10-K for the year ended January 31, 2007, with the SEC on or about March 27, 2007. The forward-looking statements described above are made based on a knowledge of our business and the environment in which we operate. However, because of the factors described and listed above, as well as other factors, or as a result of changes in facts, assumptions not being realized or other circumstance, actual results may materially differ from anticipated results described or implied in these forward-looking statements. We cannot assure the reader that the results or developments expected or anticipated by us will be realized or, even if substantially realized, that those results or developments will result in the expected consequences for us or affect us, our business or our operations in the way we expect. You are urged to consider all of these risks, uncertainties and other factors carefully in evaluating the forward-looking statements and not to place undue reliance on such forward-looking statements. The forward-looking statements included in this Annual Report speak only as of the date of this report, and we undertake no obligation to update these forward-looking statements to reflect subsequent events or circumstances, except as may be required by applicable law.
16
Consolidated Statements of Income
Wal-Mart Stores, Inc.
| | | | | | | | | | | | |
(Amounts in millions except per share data) Fiscal Year Ended January 31, | | 2007 | | | 2006 | | | 2005 | |
Revenues: | | | | | | | | | | | | |
Net sales | | $ | 344,992 | | | $ | 308,945 | | | $ | 281,488 | |
Membership and other income | | | 3,658 | | | | 3,156 | | | | 2,822 | |
| | | | | | | | | | | | |
| | | 348,650 | | | | 312,101 | | | | 284,310 | |
Costs and expenses: | | | | | | | | | | | | |
Cost of sales | | | 264,152 | | | | 237,649 | | | | 216,832 | |
Operating, selling, general and administrative expenses | | | 64,001 | | | | 55,739 | | | | 50,178 | |
| | | | | | | | | | | | |
Operating income | | | 20,497 | | | | 18,713 | | | | 17,300 | |
Interest: | | | | | | | | | | | | |
Debt | | | 1,549 | | | | 1,171 | | | | 931 | |
Capital leases | | | 260 | | | | 249 | | | | 253 | |
Interest income | | | (280 | ) | | | (242 | ) | | | (204 | ) |
| | | | | | | | | | | | |
Interest, net | | | 1,529 | | | | 1,178 | | | | 980 | |
| | | | | | | | | | | | |
Income from continuing operations before income taxes and minority interest | | | 18,968 | | | | 17,535 | | | | 16,320 | |
Provision for income taxes: | | | | | | | | | | | | |
Current | | | 6,276 | | | | 5,932 | | | | 5,326 | |
Deferred | | | 89 | | | | (129 | ) | | | 263 | |
| | | | | | | | | | | | |
| | | 6,365 | | | | 5,803 | | | | 5,589 | |
| | | | | | | | | | | | |
Income from continuing operations before minority interest | | | 12,603 | | | | 11,732 | | | | 10,731 | |
Minority interest | | | (425 | ) | | | (324 | ) | | | (249 | ) |
| | | | | | | | | | | | |
Income from continuing operations | | | 12,178 | | | | 11,408 | | | | 10,482 | |
Loss from discontinued operations, net of tax | | | (894 | ) | | | (177 | ) | | | (215 | ) |
| | | | | | | | | | | | |
Net income | | $ | 11,284 | | | $ | 11,231 | | | $ | 10,267 | |
| | | | | | | | | | | | |
Basic net income per common share: | | | | | | | | | | | | |
Basic income per share from continuing operations | | $ | 2.92 | | | $ | 2.73 | | | $ | 2.46 | |
Basic loss per share from discontinued operations | | | (0.21 | ) | | | (0.05 | ) | | | (0.05 | ) |
| | | | | | | | | | | | |
Basic net income per share | | $ | 2.71 | | | $ | 2.68 | | | $ | 2.41 | |
| | | | | | | | | | | | |
Diluted net income per common share: | | | | | | | | | | | | |
Diluted income per share from continuing operations | | $ | 2.92 | | | $ | 2.72 | | | $ | 2.46 | |
Diluted loss per share from discontinued operations | | | (0.21 | ) | | | (0.04 | ) | | | (0.05 | ) |
| | | | | | | | | | | | |
Diluted net income per share | | $ | 2.71 | | | $ | 2.68 | | | $ | 2.41 | |
| | | | | | | | | | | | |
Weighted-average number of common shares: | | | | | | | | | | | | |
Basic | | | 4,164 | | | | 4,183 | | | | 4,259 | |
Diluted | | | 4,168 | | | | 4,188 | | | | 4,266 | |
Dividends per common share | | $ | 0.67 | | | $ | 0.60 | | | $ | 0.52 | |
See accompanying notes.
17
Consolidated Balance Sheets
Wal-Mart Stores, Inc.
| | | | | | | | |
(Amounts in millions except per share data) January 31, | | 2007 | | | 2006 | |
Assets | | | | | | | | |
Current assets: | | | | | | | | |
Cash and cash equivalents | | $ | 7,373 | | | $ | 6,193 | |
Receivables | | | 2,840 | | | | 2,575 | |
Inventories | | | 33,685 | | | | 31,910 | |
Prepaid expenses and other | | | 2,690 | | | | 2,468 | |
Current assets of discontinued operations | | | — | | | | 679 | |
| | | | | | | | |
Total current assets | | | 46,588 | | | | 43,825 | |
Property and equipment, at cost: | | | | | | | | |
Land | | | 18,612 | | | | 16,174 | |
Buildings and improvements | | | 64,052 | | | | 55,206 | |
Fixtures and equipment | | | 25,168 | | | | 22,413 | |
Transportation equipment | | | 1,966 | | | | 1,744 | |
| | | | | | | | |
Property and equipment, at cost | | | 109,798 | | | | 95,537 | |
Less accumulated depreciation | | | (24,408 | ) | | | (20,937 | ) |
| | | | | | | | |
Property and equipment, net | | | 85,390 | | | | 74,600 | |
Property under capital lease: | | | | | | | | |
Property under capital lease | | | 5,392 | | | | 5,392 | |
Less accumulated amortization | | | (2,342 | ) | | | (2,127 | ) |
| | | | | | | | |
Property under capital lease, net | | | 3,050 | | | | 3,265 | |
Goodwill | | | 13,759 | | | | 12,097 | |
Other assets and deferred charges | | | 2,406 | | | | 2,516 | |
Non-current assets of discontinued operations | | | — | | | | 1,884 | |
| | | | | | | | |
Total assets | | $ | 151,193 | | | $ | 138,187 | |
| | | | | | | | |
Liabilities and shareholders’ equity | | | | | | | | |
Current liabilities: | | | | | | | | |
Commercial paper | | $ | 2,570 | | | $ | 3,754 | |
Accounts payable | | | 28,090 | | | | 25,101 | |
Accrued liabilities | | | 14,675 | | | | 13,274 | |
Accrued income taxes | | | 706 | | | | 1,340 | |
Long-term debt due within one year | | | 5,428 | | | | 4,595 | |
Obligations under capital leases due within one year | | | 285 | | | | 284 | |
Current liabilities of discontinued operations | | | — | | | | 477 | |
| | | | | | | | |
Total current liabilities | | | 51,754 | | | | 48,825 | |
Long-term debt | | | 27,222 | | | | 26,429 | |
Long-term obligations under capital leases | | | 3,513 | | | | 3,667 | |
Non-current liabilities of discontinued operations | | | — | | | | 129 | |
Deferred income taxes and other | | | 4,971 | | | | 4,501 | |
Minority interest | | | 2,160 | | | | 1,465 | |
Commitments and contingencies | | | | | | | | |
Shareholders’ equity: | | | | | | | | |
Preferred stock ($0.10 par value; 100 shares authorized, none issued) | | | — | | | | — | |
Common stock ($0.10 par value; 11,000 shares authorized, 4,131 and 4,165 issued and outstanding at January 31, 2007 and January 31, 2006, respectively) | | | 413 | | | | 417 | |
Capital in excess of par value | | | 2,834 | | | | 2,596 | |
Retained earnings | | | 55,818 | | | | 49,105 | |
Accumulated other comprehensive income | | | 2,508 | | | | 1,053 | |
| | | | | | | | |
Total shareholders’ equity | | | 61,573 | | | | 53,171 | |
| | | | | | | | |
Total liabilities and shareholders’ equity | | $ | 151,193 | | | $ | 138,187 | |
| | | | | | | | |
See accompanying notes.
18
Consolidated Statements of Shareholders’ Equity
Wal-Mart Stores, Inc.
| | | | | | | | | | | | | | | | | | | | | | | |
(Amounts in millions except per share data) | | Number of
Shares | | | Common
Stock | | | Capital in
Excess of
Par Value | | | Accumulated
Other
Comprehensive
Income | | | Retained
Earnings | | | Total | |
Balance – January 31, 2004 | | 4,311 | | | $ | 431 | | | $ | 2,135 | | | $ | 851 | | | $ | 40,206 | | | $ | 43,623 | |
Comprehensive income | | | | | | | | | | | | | | | | | | | | | | | |
Net income from continuing operations | | | | | | | | | | | | | | | | | | 10,267 | | | | 10,267 | |
Other comprehensive income: | | | | | | | | | | | | | | | | | | | | | | | |
Foreign currency translation | | | | | | | | | | | | | | 1,938 | | | | | | | | 1,938 | |
Net changes in fair values of derivatives | | | | | | | | | | | | | | (2 | ) | | | | | | | (2 | ) |
Minimum pension liability | | | | | | | | | | | | | | (93 | ) | | | | | | | (93 | ) |
| | | | | | | | | | | | | | | | | | | | | | | |
Total comprehensive income | | | | | | | | | | | | | | | | | | | | | | 12,110 | |
Cash dividends ($0.52 per share) | | | | | | | | | | | | | | | | | | (2,214 | ) | | | (2,214 | ) |
Purchase of Company stock | | (81 | ) | | | (8 | ) | | | (136 | ) | | | | | | | (4,405 | ) | | | (4,549 | ) |
Stock options exercised and other | | 4 | | | | | | | | 426 | | | | | | | | | | | | 426 | |
| | | | | | | | | | | | | | | | | | | | | | | |
Balance – January 31, 2005 | | 4,234 | | | | 423 | | | | 2,425 | | | | 2,694 | | | | 43,854 | | | | 49,396 | |
Comprehensive income: | | | | | | | | | | | | | | | | | | | | | | | |
Net income from continuing operations | | | | | | | | | | | | | | | | | | 11,231 | | | | 11,231 | |
Other comprehensive income: | | | | | | | | | | | | | | | | | | | | | | | |
Foreign currency translation | | | | | | | | | | | | | | (1,691 | ) | | | | | | | (1,691 | ) |
Net changes in fair values of derivatives | | | | | | | | | | | | | | (1 | ) | | | | | | | (1 | ) |
Minimum pension liability | | | | | | | | | | | | | | 51 | | | | | | | | 51 | |
| | | | | | | | | | | | | | | | | | | | | | | |
Total comprehensive income | | | | | | | | | | | | | | | | | | | | | | 9,590 | |
Cash dividends ($0.60 per share) | | | | | | | | | | | | | | | | | | (2,511 | ) | | | (2,511 | ) |
Purchase of Company stock | | (74 | ) | | | (7 | ) | | | (104 | ) | | | | | | | (3,469 | ) | | | (3,580 | ) |
Stock options exercised and other | | 5 | | | | 1 | | | | 275 | | | | | | | | | | | | 276 | |
| | | | | | | | | | | | | | | | | | | | | | | |
Balance – January 31, 2006 | | 4,165 | | | | 417 | | | | 2,596 | | | | 1,053 | | | | 49,105 | | | | 53,171 | |
Comprehensive income: | | | | | | | | | | | | | | | | | | | | | | | |
Net income from continuing operations | | | | | | | | | | | | | | | | | | 11,284 | | | | 11,284 | |
Other comprehensive income: | | | | | | | | | | | | | | | | | | | | | | | |
Foreign currency translation | | | | | | | | | | | | | | 1,584 | | | | | | | | 1,584 | |
Net changes in fair values of derivatives | | | | | | | | | | | | | | 6 | | | | | | | | 6 | |
Minimum pension liability | | | | | | | | | | | | | | (15 | ) | | | | | | | (15 | ) |
| | | | | | | | | | | | | | | | | | | | | | | |
Total comprehensive income | | | | | | | | | | | | | | | | | | | | | | 12,859 | |
Adjustment for initial application of SFAS 158, net of tax | | | | | | | | | | | | | | (120 | ) | | | | | | | (120 | ) |
Cash dividends ($0.67 per share) | | | | | | | | | | | | | | | | | | (2,802 | ) | | | (2,802 | ) |
Purchase of Company stock | | (39 | ) | | | (4 | ) | | | (52 | ) | | | | | | | (1,769 | ) | | | (1,825 | ) |
Stock options exercised and other | | 5 | | | | | | | | 290 | | | | | | | | | | | | 290 | |
| | | | | | | | | | | | | | | | | | | | | | | |
Balance – January 31, 2007 | | 4,131 | | | $ | 413 | | | $ | 2,834 | | | $ | 2,508 | | | $ | 55,818 | | | $ | 61,573 | |
| | | | | | | | | | | | | | | | | | | | | | | |
See accompanying notes.
19
Consolidated Statements of Cash Flows
Wal-Mart Stores, Inc.
| | | | | | | | | | | | |
(Amounts in millions) Fiscal Year Ended January 31, | | 2007 | | | 2006 | | | 2005 | |
Cash flows from operating activities | | | | | | | | | | | | |
Net income | | $ | 11,284 | | | $ | 11,231 | | | $ | 10,267 | |
Loss from discontinued operations, net of tax | | | 894 | | | | 177 | | | | 215 | |
| | | | | | | | | | | | |
Income from continuing operations | | | 12,178 | | | | 11,408 | | | | 10,482 | |
Adjustments to reconcile income from continuing operations to net cash provided by operating activities: | | | | | | | | | | | | |
Depreciation and amortization | | | 5,459 | | | | 4,645 | | | | 4,185 | |
Deferred income taxes | | | 89 | | | | (129 | ) | | | 263 | |
Other operating activities | | | 1,039 | | | | 613 | | | | 388 | |
Changes in certain assets and liabilities, net of effects of acquisitions: | | | | | | | | | | | | |
Increase in accounts receivable | | | (214 | ) | | | (466 | ) | | | (302 | ) |
Increase in inventories | | | (1,274 | ) | | | (1,761 | ) | | | (2,515 | ) |
Increase in accounts payable | | | 2,344 | | | | 2,425 | | | | 1,681 | |
Increase in accrued liabilities | | | 588 | | | | 1,002 | | | | 997 | |
| | | | | | | | | | | | |
Net cash provided by operating activities of continuing operations | | | 20,209 | | | | 17,737 | | | | 15,179 | |
Net cash used in operating activities of discontinued operations | | | (45 | ) | | | (102 | ) | | | (135 | ) |
| | | | | | | | | | | | |
Net cash provided by operating activities | | | 20,164 | | | | 17,635 | | | | 15,044 | |
| | | | | | | | | | | | |
Cash flows from investing activities | | | | | | | | | | | | |
Payments for property and equipment | | | (15,666 | ) | | | (14,530 | ) | | | (12,803 | ) |
Proceeds from disposal of property and equipment | | | 394 | | | | 1,042 | | | | 925 | |
Proceeds from disposal of certain international operations, net | | | 610 | | | | — | | | | — | |
Investment in international operations, net of cash acquired | | | (68 | ) | | | (601 | ) | | | (315 | ) |
Other investing activities | | | 223 | | | | (67 | ) | | | (99 | ) |
| | | | | | | | | | | | |
Net cash used in investing activities of continuing operations | | | (14,507 | ) | | | (14,156 | ) | | | (12,292 | ) |
Net cash provided by (used in) investing activities of discontinued operations | | | 44 | | | | (30 | ) | | | (59 | ) |
| | | | | | | | | | | | |
Net cash used in investing activities | | | (14,463 | ) | | | (14,186 | ) | | | (12,351 | ) |
| | | | | | | | | | | | |
Cash flows from financing activities | | | | | | | | | | | | |
(Decrease) increase in commercial paper | | | (1,193 | ) | | | (704 | ) | | | 544 | |
Proceeds from issuance of long-term debt | | | 7,199 | | | | 7,691 | | | | 5,832 | |
Dividends paid | | | (2,802 | ) | | | (2,511 | ) | | | (2,214 | ) |
Payment of long-term debt | | | (5,758 | ) | | | (2,724 | ) | | | (2,131 | ) |
Purchase of Company stock | | | (1,718 | ) | | | (3,580 | ) | | | (4,549 | ) |
Payment of capital lease obligations | | | (340 | ) | | | (245 | ) | | | (204 | ) |
Other financing activities | | | (227 | ) | | | (349 | ) | | | 113 | |
| | | | | | | | | | | | |
Net cash used in financing activities | | | (4,839 | ) | | | (2,422 | ) | | | (2,609 | ) |
| | | | | | | | | | | | |
Effect of exchange rate changes on cash | | | 97 | | | | (101 | ) | | | 205 | |
| | | | | | | | | | | | |
Net increase in cash and cash equivalents | | | 959 | | | | 926 | | | | 289 | |
Cash and cash equivalents at beginning of year (1) | | | 6,414 | | | | 5,488 | | | | 5,199 | |
| | | | | | | | | | | | |
Cash and cash equivalents at end of year (2) | | $ | 7,373 | | | $ | 6,414 | | | $ | 5,488 | |
| | | | | | | | | | | | |
Supplemental disclosure of cash flow information | | | | | | | | | | | | |
Income tax paid | | $ | 6,665 | | | $ | 5,962 | | | $ | 5,593 | |
Interest paid | | | 1,553 | | | | 1,390 | | | | 1,163 | |
Capital lease obligations incurred | | | 159 | | | | 286 | | | | 377 | |
| (1) | Includes cash and cash equivalents of discontinued operations of $221 million, $383 million and $336 million at January 31, 2007, 2006 and 2005, respectively. |
| (2) | Includes cash and cash equivalents of discontinued operations of $221 million and $383 million at January 31, 2006 and 2005, respectively. |
See accompanying notes.
20
Notes to Consolidated Financial Statements
Wal-Mart Stores, Inc.
1 Summary of Significant Accounting Policies
Consolidation
The Consolidated Financial Statements include the accounts of Wal-Mart Stores, Inc. and its subsidiaries (“Wal-Mart” or the “Company”). Significant intercompany transactions have been eliminated in consolidation. Investments in which the Company has a 20% to 50% voting interest and where the Company exercises significant influence over the investee are accounted for using the equity method.
The Company’s operations in Argentina, Brazil, China, Costa Rica, El Salvador, Guatemala, Honduras, Japan, Mexico, Nicaragua and the United Kingdom are consolidated using a December 31 fiscal year-end, generally due to statutory reporting requirements. There were no significant intervening events which materially affected the financial statements. The Company’s operations in Canada and Puerto Rico are consolidated using a January 31 fiscal year-end.
The Company consolidates the accounts of certain variable interest entities where it has been determined that Wal-Mart is the primary beneficiary of those entities’ operations. The assets, liabilities and results of operations of these entities are not material to the Company.
Cash and Cash Equivalents
The Company considers investments with a maturity of three months or less when purchased to be cash equivalents. The majority of payments due from banks for third-party credit card, debit card and electronic benefit transactions (“EBT”) process within 24-48 hours, except for transactions occurring on a Friday, which are generally processed the following Monday. All credit card, debit card and EBT transactions that process in less than seven days are classified as cash and cash equivalents. Amounts due from banks for these transactions classified as cash totaled $882 million and $561 million at January 31, 2007 and 2006, respectively.
Receivables
Accounts receivable consist primarily of receivables from insurance companies resulting from our pharmacy sales, receivables from suppliers for marketing or incentive programs, receivables from real estate transactions and receivables from property insurance claims. Additionally, amounts due from banks for customer credit card, debit card and EBT transactions that take in excess of seven days to process are classified as accounts receivable.
Inventories
The Company values inventories at the lower of cost or market as determined primarily by the retail method of accounting, using the last-in, first-out (“LIFO”) method for substantially all of the Wal-Mart Stores segment’s merchandise inventories. Sam’s Club merchandise and merchandise in our distribution warehouses are valued based on the weighted average cost using the LIFO method. Inventories of foreign operations are primarily valued by the retail method of accounting, using the first-in, first-out (“FIFO”) method. At January 31, 2007 and 2006, our inventories valued at LIFO approximate those inventories as if they were valued at FIFO.
Financial Instruments
The Company uses derivative financial instruments for purposes other than trading to manage its exposure to interest and foreign exchange rates, as well as to maintain an appropriate mix of fixed and floating-rate debt. Contract terms of a hedge instrument closely mirror those of the hedged item, providing a high degree of risk reduction and correlation. Contracts that are effective at meeting the risk reduction and correlation criteria are recorded using hedge accounting. If a derivative instrument is a hedge, depending on the nature of the hedge, changes in the fair value of the instrument will either be offset against the change in fair value of the hedged assets, liabilities or firm commitments through earnings or be recognized in other comprehensive income until the hedged item is recognized in earnings. The ineffective portion of an instrument’s change in fair value will be immediately recognized in earnings. Instruments that do not meet the criteria for hedge accounting, or contracts for which the Company has not elected hedge accounting, are valued at fair value with unrealized gains or losses reported in earnings during the period of change.
Capitalized Interest
Interest costs capitalized on construction projects were $182 million, $157 million, and $120 million in fiscal 2007, 2006 and 2005, respectively.
21
Long-Lived Assets
Long-lived assets are stated at cost. Management reviews long-lived assets for indicators of impairment whenever events or changes in circumstances indicate that the carrying value may not be recoverable. The evaluation is performed at the lowest level of identifiable cash flows, which is at the individual store level or in certain circumstances a market group of stores. Cash flows expected to be generated by the related assets are estimated over the asset’s useful life based on updated projections. If the evaluation indicates that the carrying amount of the asset may not be recoverable, any potential impairment is measured based upon the fair value of the related asset or asset group as determined by an appropriate market appraisal or other valuation technique.
Goodwill and Other Acquired Intangible Assets
Goodwill represents the excess of purchase price over fair value of net assets acquired, and is allocated to the appropriate reporting unit when acquired. Other acquired intangible assets are stated at the fair value acquired as determined by a valuation technique commensurate with the intended use of the related asset. Goodwill and indefinite-lived other acquired intangible assets are not amortized; rather they are evaluated for impairment annually or whenever events or changes in circumstances indicate that the value of the asset may be impaired. Definite-lived other acquired intangible assets are considered long-lived assets and are amortized on a straight-line basis over the periods that expected economic benefits will be provided.
Indefinite-lived other acquired intangible assets are evaluated for impairment based on their fair values using valuation techniques which are updated annually based on the most recent variables and assumptions.
Goodwill is evaluated for impairment by determining the fair value of the related reporting unit. Fair value is measured based on a discounted cash flow method or relative market-based approach, which utilizes multiples of earnings or revenue of comparable entities. The analyses require significant management judgment to evaluate the capacity of an acquired business to perform within projections. Historically, the Company has generated sufficient returns to recover the cost of the goodwill.
Goodwill is recorded on the balance sheet in the operating segments as follows (in millions):
| | | | | | |
January 31, | | 2007 | | 2006 |
International | | $ | 13,454 | | $ | 11,792 |
Sam’s Club | | | 305 | | | 305 |
| | | | | | |
Total goodwill | | $ | 13,759 | | $ | 12,097 |
| | | | | | |
The change in the International segment’s goodwill since fiscal 2006 resulted primarily from the consolidation of Central American Retail Holding Company (“CARHCO”), foreign currency exchange rate fluctuations and the allocation of goodwill to our South Korean operation upon its disposal in October 2006.
Leases
The Company estimates the expected term of a lease by assuming the exercise of renewal options where an economic penalty exists that would preclude the abandonment of the lease at the end of the initial non-cancelable term and the exercise of such renewal is at the sole discretion of the Company. This expected term is used in the determination of whether a store lease is a capital or operating lease and in the calculation of straight-line rent expense. Additionally, the useful life of leasehold improvements is limited by the expected lease term or the economic life of the asset. If significant expenditures are made for leasehold improvements late in the expected term of a lease and renewal is reasonably assumed, the useful life of the leasehold improvement is limited to the end of the renewal period or economic life of the asset.
Rent abatements and escalations are considered in the calculation of minimum lease payments in the Company’s capital lease tests and in determining straight-line rent expense for operating leases.
Foreign Currency Translation
The assets and liabilities of all foreign subsidiaries are translated using exchange rates at the balance sheet date. The income statements of foreign subsidiaries are translated using average exchange rates for the period. Related translation adjustments are recorded as a component of accumulated other comprehensive income.
22
Revenue Recognition
The Company recognizes sales revenue net of sales taxes and estimated sales returns at the time it sells merchandise to the customer, except for layaway transactions. The Company recognizes revenue from layaway transactions when the customer satisfies all payment obligations and takes possession of the merchandise. Customer purchases of Wal-Mart and Sam’s Club shopping cards are not recognized as revenue until the card is redeemed and the customer purchases merchandise by using the shopping card.
Sam’s Club Membership Fee Revenue Recognition
The Company recognizes Sam’s Club membership fee revenues both in the United States and internationally over the term of the membership, which is 12 months. The following table details unearned revenues, membership fees received from members and the amount of revenues recognized in earnings for each of the fiscal years 2007, 2006 and 2005 (in millions):
| | | | | | | | | | | | |
Fiscal Year Ended January 31, | | 2007 | | | 2006 | | | 2005 | |
Deferred membership fee revenue, beginning of year | | $ | 490 | | | $ | 458 | | | $ | 449 | |
Membership fees received | | | 1,030 | | | | 940 | | | | 890 | |
Membership fee revenue recognized | | | (985 | ) | | | (908 | ) | | | (881 | ) |
| | | | | | | | | | | | |
Deferred membership fee revenue, end of year | | $ | 535 | | | $ | 490 | | | $ | 458 | |
| | | | | | | | | | | | |
Sam’s Club membership fee revenue is included in membership and other income in the revenues section of the Consolidated Statements of Income.
The Company’s deferred membership fee revenue is included in accrued liabilities in the Consolidated Balance Sheets. The Company’s analysis of historical membership fee refunds indicates that such refunds have been nominal. Accordingly, no reserve existed for membership fee refunds at January 31, 2007 and 2006.
Cost of Sales
Cost of sales includes actual product cost, the cost of transportation to the Company’s warehouses, stores and clubs from suppliers, the cost of transportation from the Company’s warehouses to the stores and clubs and the cost of warehousing for our Sam’s Club segment.
Payments from Suppliers
Wal-Mart receives money from suppliers for various programs, primarily volume incentives, warehouse allowances and reimbursements for specific programs such as markdowns, margin protection and advertising. Substantially all payments from suppliers are accounted for as a reduction of purchases and recognized in our Consolidated Statements of Income when the related inventory is sold.
Operating, Selling, General and Administrative Expenses
Operating, selling, general and administrative expenses include all operating costs of the Company except those costs related to the transportation of products from the supplier to the warehouses, stores or clubs, the costs related to the transportation of products from the warehouses to the stores or clubs and the cost of warehousing for our Sam’s Club segment. As a result, the cost of warehousing and occupancy for our Wal-Mart Stores and International segments distribution facilities are included in operating, selling, general and administrative expenses. Because we do not include the cost of our Wal-Mart Stores and International segments distribution facilities in cost of sales, our gross profit and gross margin may not be comparable to those of other retailers that may include all costs related to their distribution facilities in costs of sales and in the calculation of gross profit and gross margin.
23
Advertising Costs
Advertising costs are expensed as incurred and were $1.9 billion, $1.6 billion and $1.4 billion in fiscal 2007, 2006 and 2005, respectively. Advertising costs consist primarily of print and television advertisements.
Pre-Opening Costs
The costs of start-up activities, including organization costs and new store openings, are expensed as incurred.
Share-Based Compensation
The Company recognizes expense for its share-based compensation based on the fair value of the awards that are granted. The fair value of stock options is estimated at the date of grant using the Black-Scholes-Merton option valuation model which was developed for use in estimating the fair value of exchange traded options that have no vesting restrictions and are fully transferable. Option valuation methods require the input of highly subjective assumptions, including the expected stock price volatility. Measured compensation cost, net of estimated forfeitures, is recognized ratably over the vesting period of the related share-based compensation award.
Share-based compensation awards that may be settled in cash are accounted for as liabilities and marked to market each period. Measured compensation cost for performance-based awards is recognized only if it is probable that the performance condition will be achieved.
Insurance/Self-lnsurance
The Company uses a combination of insurance, self-insured retention and self-insurance for a number of risks, including, without limitation, workers’ compensation, general liability, vehicle liability and the Company’s obligation for employee-related health care benefits. Liabilities associated with these risks are estimated by considering historical claims experience, demographic factors, frequency and severity factors and other actuarial assumptions.
Depreciation and Amortization
Depreciation and amortization for financial statement purposes are provided on the straight-line method over the estimated useful lives of the various assets. Depreciation expense, including amortization of property under capital leases for fiscal years 2007, 2006 and 2005 was $5.5 billion, $4.6 billion and $4.2 billion, respectively. For income tax purposes, accelerated methods of depreciation are used with recognition of deferred income taxes for the resulting temporary differences. Leasehold improvements are depreciated over the shorter of the estimated useful life of the asset or the remaining expected lease term. Estimated useful lives for financial statement purposes are as follows:
| | |
Buildings and improvements | | 5–50 years |
Fixtures and equipment | | 3–12 years |
Transportation equipment | | 3–15 years |
Income Taxes
Income taxes are accounted for under the asset and liability method. Deferred tax assets and liabilities are recognized for the estimated future tax consequences attributable to differences between the financial statement carrying amounts of existing assets and liabilities and their respective tax bases. Deferred tax assets and liabilities are measured using enacted tax rates in effect for the year in which those temporary differences are expected to be recovered or settled. The effect on deferred tax assets and liabilities of a change in tax rate is recognized in income in the period that includes the enactment date. Valuation allowances are established when necessary to reduce deferred tax assets to the amounts more likely than not to be realized.
In determining the quarterly provision for income taxes, the Company uses an annual effective tax rate based on expected annual income and statutory tax rates. The effective tax rate also reflects the Company’s assessment of the ultimate outcome of tax audits. Significant discrete items are separately recognized in the income tax provision in the quarter in which they occur.
The determination of the Company’s provision for income taxes requires significant judgment, the use of estimates, and the interpretation and application of complex tax laws. Significant judgment is required in assessing the timing and amounts of deductible and taxable items. Reserves are established when, despite management’s belief that the Company’s tax return positions are fully supportable, management believes that certain positions may be successfully challenged. When facts and circumstances change, these reserves are adjusted through the provision for income taxes.
24
Accrued Liabilities
Accrued liabilities consist of the following (dollars in millions):
| | | | | | |
Fiscal Year Ended January 31, | | 2007 | | 2006 |
Accrued wages and benefits | | $ | 5,347 | | $ | 4,414 |
Self-insurance | | | 2,954 | | | 2,583 |
Other | | | 6,374 | | | 6,277 |
| | | | | | |
Total accrued liabilities | | $ | 14,675 | | $ | 13,274 |
| | | | | | |
Net Income Per Common Share
Basic net income per common share is based on the weighted-average number of outstanding common shares. Diluted net income per common share is based on the weighted-average number of outstanding shares adjusted for the dilutive effect of stock options and restricted stock grants. The dilutive effect of stock options and restricted stock was 4 million, 5 million and 7 million shares in fiscal 2007, 2006 and 2005, respectively. The Company had approximately 62 million, 57 million and 59 million option shares outstanding at January 31, 2007, 2006 and 2005, respectively, which were not included in the diluted net income per share calculation because their effect would be antidilutive.
Estimates and Assumptions
The preparation of our Consolidated Financial Statements in conformity with generally accepted accounting principles requires management to make estimates and assumptions. These estimates and assumptions affect the reported amounts of assets and liabilities. They also affect the disclosure of contingent assets and liabilities at the date of the Consolidated Financial Statements and the reported amounts of revenues and expenses during the reporting period. Actual results may differ from those estimates.
Reclassifications
Certain reclassifications have been made to prior periods to conform to current presentations.
2 Commercial Paper and Long-term Debt
Information on short-term borrowings and interest rates is as follows (dollars in millions):
| | | | | | | | | | | | |
Fiscal Year | | 2007 | | | 2006 | | | 2005 | |
Maximum amount outstanding at any month-end | | $ | 7,968 | | | $ | 9,054 | | | $ | 7,782 | |
Average daily short-term borrowings | | | 4,741 | | | | 5,719 | | | | 4,823 | |
Weighted-average interest rate | | | 4.7 | % | | | 3.4 | % | | | 1.6 | % |
Short-term borrowings consisted of $2.6 billion and $3.8 billion of commercial paper at January 31, 2007 and 2006, respectively. At January 31, 2007, the Company had committed lines of credit of $6.5 billion with 54 firms and banks, which were used to support commercial paper. The committed lines of credit mature at varying times starting between June 2008 and June 2011, carry interest rates of LIBOR plus 11 to 13 basis points and at prime plus zero to 50 basis points, and incur commitment fees of 2 to 7.5 basis points on undrawn amounts.
25
Long-term debt at January 31, consists of (in millions):
| | | | | | | | |
Interest Rate | | Due by Fiscal Year | | 2007 | | 2006 |
1.200 – 6.875% | | Notes due 2010 | | $ | 4,614 | | $ | 4,527 |
5.250% | | Notes due 2036 | | | 4,465 | | | 4,279 |
0.310 – 9.200%, LIBOR less 0.10% | | Notes due 2009 | | | 4,372 | | | 2,800 |
0.1838 – 10.880% | | Notes due 2011(1) | | | 3,292 | | | 3,308 |
2.875 – 13.750%, LIBOR less 0.1025% | | Notes due 2008 | | | 3,141 | | | 3,311 |
0.750 – 7.250% | | Notes due 2014 | | | 2,970 | | | 2,885 |
1.200 – 4.125% | | Notes due 2012 | | | 2,426 | | | 2,015 |
5.750 – 7.550% | | Notes due 2031 | | | 1,983 | | | 1,890 |
4.875% | | Notes due 2039 | | | 1,966 | | | — |
5.502% | | Notes due 2027(1) | | | 1,000 | | | — |
3.150 – 6.630% | | Notes due 2016 | | | 769 | | | 767 |
2.950 – 5.006% | | Notes due 2019(1) | | | 515 | | | 516 |
6.750% | | Notes due 2024 | | | 250 | | | 266 |
2.100 – 2.875% | | Notes due 2015 | | | 45 | | | 53 |
2.000 – 2.500% | | Notes due 2017 | | | 37 | | | 41 |
3.750 – 5.000% | | Notes due 2018 | | | 28 | | | 31 |
1.600 – 2.300% | | Notes due 2013 | | | 18 | | | 23 |
1.100 – 13.250%, LIBOR less 0.140% | | Notes due 2007 | | | — | | | 3,415 |
5.170% | | Notes due 2021 | | | — | | | 25 |
| Other(2) | | | | | 759 | | | 872 |
| | | | | | | | |
Total | | | | $ | 32,650 | | $ | 31,024 |
| | | | | | | | |
(1) | Notes due in 2011 and 2019 both include $500 million put options. Notes due in 2027 include $1.0 billion put options. |
(2) | Includes adjustments to debt hedged by derivatives. |
The Company has $2.0 billion in debt with embedded put options. The holders of one $500 million debt issuance may require the Company to repurchase the debt at par plus accrued interest at any time. Two issues of money market puttable reset securities, one in the amount of $500 million and the second in the amount of $1.0 billion, are structured to be remarketed in connection with the annual reset of the interest rate. If, for any reason, the remarketing of the notes does not occur at the time of any interest rate reset, the holders of the notes must sell, and the Company must repurchase, the notes at par. All of these issuances have been classified as long-term debt due within one year in the Consolidated Balance Sheets.
In connection with the Company’s borrowing arrangements, the Company is not required to observe financial covenants. However, under certain lines of credit totaling $6.0 billion, which were undrawn as of January 31, 2007, the Company has agreed to observe certain covenants, the most restrictive of which relates to minimum amounts of additional secured debt and long-term leases. In addition, one of our subsidiaries has restrictive financial covenants on $2.0 billion of long-term debt that requires it to maintain certain equity, sales, and profit levels. The Company was in compliance with these covenants at January 31, 2007.
Long-term debt is unsecured except for $333 million, which is collateralized by property with an aggregate carrying value of approximately $1.3 billion. Annual maturities of long-term debt during the next five years and thereafter are (in millions):
| | | |
Fiscal Year Ended January 31, | | Annual
Maturity |
2008 | | $ | 5,428 |
2009 | | | 4,499 |
2010 | | | 4,621 |
2011 | | | 2,875 |
2012 | | | 2,523 |
Thereafter | | | 12,704 |
| | | |
Total | | $ | 32,650 |
| | | |
26
The Company has entered into sale/leaseback transactions involving buildings while retaining title to the underlying land. These transactions were accounted for as financings and are included in long-term debt and the annual maturities schedule above. The resulting obligations mature as follows during the next five years and thereafter (in millions):
| | | |
Fiscal Year Ended January 31, | | Annual
Maturities |
2007 | | $ | 10 |
2008 | | | 10 |
2009 | | | 10 |
2010 | | | 10 |
2011 | | | 10 |
Thereafter | | | 300 |
| | | |
Total | | $ | 350 |
| | | |
The Company had trade letters of credit outstanding totaling $3.0 billion and $2.6 billion at January 31, 2007 and 2006, respectively. At January 31, 2007 and 2006, the Company had standby letters of credit outstanding totaling $2.2 billion and $2.3 billion, respectively. These letters of credit were issued primarily for the purchase of inventory and self-insurance purposes.
3 Financial Instruments
The Company uses derivative financial instruments for hedging and non-trading purposes to manage its exposure to changes in interest and foreign exchange rates. Use of derivative financial instruments in hedging programs subjects the Company to certain risks, such as market and credit risks. Market risk represents the possibility that the value of the derivative instrument will change. In a hedging relationship, the change in the value of the derivative is offset to a great extent by the change in the value of the underlying hedged item. Credit risk related to derivatives represents the possibility that the counterparty will not fulfill the terms of the contract. The notional, or contractual, amount of the Company’s derivative financial instruments is used to measure interest to be paid or received and does not represent the Company’s exposure due to credit risk. Credit risk is monitored through established approval procedures, including setting concentration limits by counterparty, reviewing credit ratings and requiring collateral (generally cash) when appropriate. The majority of the Company’s transactions are with counterparties rated “AA-” or better by nationally recognized credit rating agencies.
Fair Value Instruments
The Company enters into interest rate swaps to minimize the risks and costs associated with its financing activities. Under the swap agreements, the Company pays variable-rate interest and receives fixed-rate interest payments periodically over the life of the instruments. The notional amounts are used to measure interest to be paid or received and do not represent the exposure due to credit loss. All of the Company’s interest rate swaps that receive fixed interest rate payments and pay variable interest rate payments are designated as fair value hedges. As the specific terms and notional amounts of the derivative instruments exactly match those of the instruments being hedged, the derivative instruments were assumed to be perfectly effective hedges and all changes in fair value of the hedges were recorded on the balance sheet with no net impact on the income statement.
Net Investment Instruments
At January 31, 2007, the Company is party to cross-currency interest rate swaps that hedge its net investment in the United Kingdom. At January 31, 2006, the Company was party to cross-currency interest rate swaps that hedge its net investments in the United Kingdom and Japan. The agreements are contracts to exchange fixed-rate payments in one currency for fixed-rate payments in another currency.
The Company has outstanding approximately £3.0 billion and £2.0 billion of debt that is designated as a hedge of the Company’s net investment in the United Kingdom as of January 31, 2007 and 2006, respectively. The Company also has outstanding approximately ¥142.1 billion and ¥87.1 billion of debt that is designated as a hedge of the Company’s net investment in Japan at January 31, 2007 and 2006, respectively. All changes in the fair value of these instruments are recorded in accumulated other comprehensive income, offsetting the foreign currency translation adjustment that is also recorded in accumulated other comprehensive income.
27
Cash Flow Instruments
The Company was party to a cross-currency interest rate swap to hedge the foreign currency risk of certain foreign-denominated debt. The swap was designated as a cash flow hedge of foreign currency exchange risk. The agreement was a contract to exchange fixed-rate payments in one currency for fixed-rate payments in another currency. Changes in the foreign currency spot exchange rate resulted in reclassification of amounts from accumulated other comprehensive income to earnings to offset transaction gains or losses on foreign-denominated debt. The instruments matured in fiscal 2007.
Fair Value of Financial Instruments
| | | | | | | | | | | | | | |
Instrument Fiscal Year Ended January 31, (in millions) | | Notional Amount | | Fair Value | |
| | 2007 | | 2006 | | 2007 | | | 2006 | |
Derivative financial instruments designated for hedging: | | | | | | | | | | | | | | |
Receive fixed-rate, pay floating rate interest rate swaps designated as fair value hedges | | $ | 5,195 | | $ | 6,945 | | $ | (1 | ) | | $ | 133 | |
Receive fixed-rate, pay fixed-rate cross-currency interest rate swaps designated as net investment hedges (Cross-currency notional amount: GBP 795 at 1/31/2007 and 1/31/2006) | | | 1,250 | | | 1,250 | | | (181 | ) | | | (107 | ) |
Receive fixed-rate, pay fixed-rate cross-currency interest rate swap designated as a cash flow hedge (Cross-currency notional amount: CAD 0 and CAD 503 at 1/31/2007 and 1/31/2006, respectively) | | | — | | | 325 | | | — | | | | (120 | ) |
Receive fixed-rate, pay fixed-rate cross-currency interest rate swap designated as a net investment hedge (Cross-currency notional amount: ¥0 and ¥52,056 at 1/31/2007 and 1/31/2006, respectively) | | | — | | | 432 | | | — | | | | (17 | ) |
| | | | | | | | | | | | | | |
Total | | $ | 6,445 | | $ | 8,952 | | $ | (182 | ) | | $ | (111 | ) |
| | | | | | | | | | | | | | |
Non-derivative financial instruments: | | | | | | | | | | | | | | |
Long-term debt | | $ | 32,650 | | $ | 31,024 | | $ | 32,521 | | | $ | 31,580 | |
| | | | | | | | | | | | | | |
Hedging instruments with an unrealized gain are recorded on the Consolidated Balance Sheets in other current assets or other assets and deferred charges, based on maturity date. Those instruments with an unrealized loss are recorded in accrued liabilities or deferred income taxes and other, based on maturity date.
Cash and cash equivalents:The carrying amount approximates fair value due to the short maturity of these instruments.
Long-term debt:Fair value is based on the Company’s current incremental borrowing rate for similar types of borrowing arrangements.
Fair value instruments and net investment instruments:The fair values are estimated amounts the Company would receive or pay to terminate the agreements as of the reporting dates.
28
4 Accumulated Other Comprehensive Income
Comprehensive income is net income plus certain other items that are recorded directly to shareholders’ equity. Amounts included in accumulated other comprehensive income for the Company’s derivative instruments and minimum pension liabilities are recorded net of the related income tax effects. The following table gives further detail regarding changes in the composition of accumulated other comprehensive income during fiscal 2007, 2006 and 2005 (in millions):
| | | | | | | | | | | | | | | | |
| | | Foreign
Currency
Translation | | | Derivative
Instruments | | | Minimum
Pension liability | | | Total | |
Balance at January 31, 2004 | | $ | 1,044 | | | $ | (3 | ) | | $ | (190 | ) | | $ | 851 | |
Foreign currency translation adjustment | | | 1,938 | | | | | | | | | | | | 1,938 | |
Change in fair value of hedge instruments | | | | | | | (43 | ) | | | | | | | (43 | ) |
Reclassification to earnings | | | | | | | 41 | | | | | | | | 41 | |
Subsidiary minimum pension liability | | | | | | | | | | | (93 | ) | | | (93 | ) |
| | | | | | | | | | | | | | | | |
Balance at January 31, 2005 | | $ | 2,982 | | | $ | (5 | ) | | $ | (283 | ) | | $ | 2,694 | |
Foreign currency translation adjustment | | | (1,691 | ) | | | | | | | | | | | (1,691 | ) |
Change in fair value of hedge instruments | | | | | | | (31 | ) | | | | | | | (31 | ) |
Reclassification to earnings | | | | | | | 30 | | | | | | | | 30 | |
Subsidiary minimum pension liability | | | | | | | | | | | 51 | | | | 51 | |
| | | | | | | | | | | | | | | | |
Balance at January 31, 2006 | | $ | 1,291 | | | $ | (6 | ) | | $ | (232 | ) | | $ | 1,053 | |
Foreign currency translation adjustment | | | 1,584 | | | | | | | | | | | | 1,584 | |
Change in fair value of hedge instruments | | | | | | | 123 | | | | | | | | 123 | |
Reclassification to earnings | | | | | | | (117 | ) | | | | | | | (117 | ) |
Subsidiary minimum pension liability | | | | | | | | | | | (15 | ) | | | (15 | ) |
Adjustment for initial application of SFAS 158, net of tax | | | | | | | | | | | (120 | ) | | | (120 | ) |
| | | | | | | | | | | | | | | | |
Balance at January 31, 2007 | | $ | 2,875 | | | $ | — | | | $ | (367 | ) | | $ | 2,508 | |
| | | | | | | | | | | | | | | | |
The foreign currency translation amount includes translation gains of $143 million, $521 million, and $292 million at January 31, 2007, 2006 and 2005, respectively, related to net investment hedges of our operations in the United Kingdom and Japan.
In conjunction with the disposition of our operations in South Korea and Germany, the Company reclassified $603 million from foreign currency translation amounts included in accumulated other comprehensive income into discontinued operations within our Consolidated Statements of Income for fiscal year 2007.
5 Income Taxes
The income tax provision consists of the following (in millions):
| | | | | | | | | | | | |
Fiscal Year Ended January 31, | | 2007 | | | 2006 | | | 2005 | |
Current: | | | | | | | | | | | | |
Federal | | $ | 4,871 | | | $ | 4,646 | | | $ | 4,116 | |
State and local | | | 522 | | | | 449 | | | | 640 | |
International | | | 883 | | | | 837 | | | | 570 | |
| | | | | | | | | | | | |
Total current tax provision | | | 6,276 | | | | 5,932 | | | | 5,326 | |
| | | | | | | | | | | | |
Deferred: | | | | | | | | | | | | |
Federal | | | (15 | ) | | | (62 | ) | | | 311 | |
State and local | | | 4 | | | | 56 | | | | (71 | ) |
International | | | 100 | | | | (123 | ) | | | 23 | |
| | | | | | | | | | | | |
Total deferred tax provision | | | 89 | | | | (129 | ) | | | 263 | |
| | | | | | | | | | | | |
Total provision for income taxes | | $ | 6,365 | | | $ | 5,803 | | | $ | 5,589 | |
| | | | | | | | | | | | |
29
Income from continuing operations before income taxes and minority interest by jurisdiction is as follows (in millions):
| | | | | | | | | |
Fiscal Year Ended January 31, | | 2007 | | 2006 | | 2005 |
United States | | $ | 15,158 | | $ | 14,447 | | $ | 13,599 |
Outside the United States | | | 3,810 | | | 3,088 | | | 2,721 |
| | | | | | | | | |
Total income from continuing operations before income taxes and minority interest | | $ | 18,968 | | $ | 17,535 | | $ | 16,320 |
| | | | | | | | | |
Items that give rise to significant portions of the deferred tax accounts are as follows (in millions):
| | | | | | | | |
January 31, | | 2007 | | | 2006 | |
Deferred tax liabilities | | | | | | | | |
Property and equipment | | $ | 3,153 | | | $ | 2,816 | |
Inventory | | | 600 | | | | 551 | |
Other | | | 282 | | | | 392 | |
| | | | | | | | |
Total deferred tax liabilities | | $ | 4,035 | | | $ | 3,759 | |
| | | | | | | | |
Deferred tax assets | | | | | | | | |
Net operating loss carryforwards | | $ | 865 | | | $ | 892 | |
Amounts accrued for financial reporting purposes not yet deductible for tax purposes | | | 1,847 | | | | 1,668 | |
Share-based compensation | | | 300 | | | | 248 | |
Other | | | 846 | | | | 737 | |
| | | | | | | | |
Total deferred tax assets | | | 3,858 | | | | 3,545 | |
Valuation allowance | | | (921 | ) | | | (912 | ) |
| | | | | | | | |
Total deferred tax assets, net of valuation allowance | | $ | 2,937 | | | $ | 2,633 | |
| | | | | | | | |
Net deferred tax liabilities | | $ | 1,098 | | | $ | 1,126 | |
| | | | | | | | |
The change in the Company’s net deferred tax liability is impacted by foreign currency translation.
A reconciliation of the significant differences between the effective income tax rate and the federal statutory rate on pretax income is as follows:
| | | | | | | | | |
Fiscal Year Ended January 31, | | 2007 | | | 2006 | | | 2005 | |
Statutory tax rate | | 35.00 | % | | 35.00 | % | | 35.00 | % |
State income taxes, net of federal income tax benefit | | 1.80 | % | | 1.85 | % | | 2.27 | % |
Income taxes outside the United States | | (1.84 | %) | | (2.09 | %) | | (2.21 | %) |
Other | | (1.40 | %) | | (1.67 | %) | | (0.81 | %) |
| | | | | | | | | |
Effective income tax rate | | 33.56 | % | | 33.09 | % | | 34.25 | % |
| | | | | | | | | |
Federal and state income taxes have not been provided on accumulated but undistributed earnings of foreign subsidiaries aggregating approximately $8.7 billion at January 31, 2007 and $6.8 billion at January 31, 2006, as such earnings have been permanently reinvested in the business. The determination of the amount of the unrecognized deferred tax liability related to the undistributed earnings is not practicable.
The Company had foreign net operating loss carryforwards of $2.3 billion and $2.4 billion at January 31, 2007 and 2006, respectively. Of these amounts, $2.0 billion relate to pre-acquisition losses at January 31, 2007 and 2006. Any tax benefit ultimately realized from these pre-acquisition net operating loss carryforwards will adjust goodwill. Net operating loss carryforwards of $1.3 billion expire in various years through 2014. Prior year amounts have been restated for losses of the discontinued operations and for certain pre-acquisition losses now included.
During fiscal 2007, the Company recorded a pretax loss of $918 million on the disposition of its German operations. In addition, the Company recognized a tax benefit of $126 million related to this transaction. See Note 6, Acquisitions and Disposals, for additional information about this transaction. The Company plans to deduct the tax loss realized on the disposition of its German operations as an ordinary worthless stock deduction. Final resolution of the amount and character of the deduction may result in the recognition of additional tax benefits of up to $1.6 billion which may be included in discontinued operations in future periods. The Internal Revenue Service often challenges the characterization of such deductions. If the loss is recharacterized as a capital loss, any such capital loss could only be realized by offset against future
30
capital gains and would expire in 2012. Any deferred tax asset, net of its related valuation allowance, resulting from the characterization of the loss as capital may be included with the Company’s non-current assets of discontinued operations.
6 Acquisitions and Disposals
Acquisitions
During December 2005, the Company purchased an additional interest in The Seiyu, Ltd. (“Seiyu”), for approximately $570 million, bringing the Company’s total investment in Seiyu, including adjustments arising from the equity method of accounting, to $1.2 billion. Seiyu is a retailer in Japan, that currently operates 392 stores selling apparel, general merchandise, food and certain services. Following this additional purchase, the Company owned approximately 53.3% of Seiyu common shares. Beginning on the date of the controlling interest purchase, the Company began consolidating Seiyu as a majority-owned subsidiary using a December 31 fiscal year-end. Seiyu’s results of operations from the date of consolidation through January 31, 2007, were not material to the Company. As a result of the initial consolidation of Seiyu, total assets and liabilities of $6.7 billion and $5.6 billion, respectively, were recorded in our Consolidated Financial Statements. Goodwill recorded in the consolidation amounted to approximately $1.5 billion.
The minority interest in Seiyu is represented, in part, by shares of Seiyu’s preferred stock that are convertible into shares of Seiyu common stock. If the minority holder of Seiyu’s preferred stock proposes to sell or convert its shares of preferred stock, the Company has the right to purchase those shares at a predetermined price. In June 2006, the Company purchased certain of the minority holder’s Seiyu preferred shares for approximately $45 million. None of the Seiyu preferred shares owned by the Company, including the preferred shares purchased in June, have been converted into Seiyu common shares. If converted, the Company would own approximately 55.3% of Seiyu’s common shares.
Through a warrant exercisable through December 2007, the Company can contribute approximately ¥154.6 billion for approximately 539 million additional common shares of Seiyu stock. If the warrant is exercised, the Company would own approximately 71% of the common shares of Seiyu. These percentages assume no conversion of Seiyu’s preferred stock into common shares and no other issuances of Seiyu common shares.
In December 2005, the Company completed the purchase of Sonae Distribuição Brasil S.A. (“Sonae”), a retail operation in Southern Brazil, which currently operates 139 hypermarkets, supermarkets and warehouse units. The purchase price was approximately $720 million including transaction costs. Assets recorded in the acquisition of Sonae were $1.3 billion and liabilities assumed were $566 million. As a result of the Sonae acquisition, we recorded goodwill of $305 million and other identifiable intangible assets of $89 million. Sonae’s results of operations, which were not material to the Company, are included in our Consolidated Financial Statements following the date of acquisition through January 31, 2007, using a December 31 fiscal year-end.
In September 2005, the Company acquired a 33.3% interest in CARHCO, a retailer which currently operates 413 supermarkets and other stores in Costa Rica, El Salvador, Guatemala, Honduras and Nicaragua. The purchase price was approximately $318 million, including transaction costs. In fiscal 2006, the Company accounted for its investment in CARHCO under the equity method. Concurrent with the purchase of the investment in CARHCO, the Company entered into an agreement to purchase an additional 17.7% of CARHCO in the first quarter of fiscal 2007 and an option agreement that will allow the Company to purchase up to an additional 24% beginning in September 2010 from the shareholders of CARHCO. To the extent that the Company does not exercise its option to purchase the additional 24% of CARHCO, the minority shareholders will have certain put rights that could require the Company to purchase the additional 24% of CARHCO after September 2012.
In February 2006, the Company purchased the additional 17.7% of CARHCO for a purchase price of approximately $212 million. Following this purchase, the Company began consolidating CARHCO as a majority-owned subsidiary using a December 31 fiscal year-end. CARHCO’s results of operations from the date of consolidation through January 31, 2007, were not material to the Company. As a result of the consolidation of CARHCO, total assets and liabilities of $1.3 billion and $576 million, respectively, were recorded in our Consolidated Financial Statements. Goodwill and identifiable intangible assets recorded in the consolidation amounted to approximately $412 million and $97 million, respectively. During fiscal 2007, CARHCO was renamed Wal-Mart Central America.
Disposals
During fiscal 2007, the Company entered into definitive agreements to dispose of our operations in South Korea and Germany, which were included in our International segment. Consequently, the net losses related to these operations, our
31
gain on the disposition of our South Korea operations, and the loss on the disposition of our German operations are presented as discontinued operations in our Consolidated Statements of Income and our Consolidated Statements of Cash Flows for all periods presented. Additionally, the asset groups disposed of are reported as assets and liabilities of discontinued operations in our Consolidated Balance Sheets as of January 31, 2006.
In May 2006, the Company announced the sale of its retail business in South Korea, which operated 16 stores, to Shinsegae Co., Ltd., for Won 825 billion, subject to certain closing adjustments. This transaction was approved by the Korea Fair Trade Commission in September 2006 and closed during the third quarter of fiscal 2007. The Company recorded a pretax gain on the sale of $103 million, and tax expense of $63 million during fiscal 2007. In determining the gain on the disposition of our South Korean operations, the Company allocated $206 million of goodwill from the reporting unit. The transaction continues to be subject to certain indemnification obligations. In the event there are any additional charges associated with this divestiture, we will record and report such amounts through discontinued operations in future periods.
In July 2006, the Company agreed to dispose of its German operations, which operated 85 stores, to Metro AG, and recorded a pretax loss of $918 million during fiscal 2007. The transaction was approved by the European competition authorities and closed during the third quarter of fiscal 2007. In addition, the Company recognized a tax benefit of $126 million related to this transaction in fiscal 2007. The transaction continues to be subject to a post-closing adjustment and other indemnification obligations. In the event there are any additional charges associated with this divestiture, we will record and report such amounts through discontinued operations in future periods.
In addition to the gain and loss on the dispositions noted above, discontinued operations as presented in the Company’s Consolidated Statements of Income also include net sales and net operating losses from our South Korean and German operations as follows:
| | | | | | | | | | | | |
Fiscal Year Ended January 31, | | 2007 | | | 2006 | | | 2005 | |
Net sales | | $ | 2,489 | | | $ | 3,482 | | | $ | 3,734 | |
Net losses | | | (142 | ) | | | (177 | ) | | | (215 | ) |
7 Share-Based Compensation Plans
As of January 31, 2007, the Company has awarded share-based compensation to executives and other associates of the Company through various share-based compensation plans. The compensation cost recognized for all plans was $271 million, $244 million, and $204 million for fiscal 2007, 2006, and 2005, respectively. The total income tax benefit recognized for all share-based compensation plans was $101 million, $82 million, and $71 million for fiscal 2007, 2006, and 2005, respectively.
On February 1, 2003, the Company adopted the expense recognition provisions of Statement of Financial Accounting Standards No. 123 (“SFAS 123”), restating results for prior periods. In December 2004, the Financial Accounting Standards Board issued a revision of SFAS 123 (“SFAS 123(R)”). The Company adopted the provisions of SFAS 123(R) upon its release. The adoption of SFAS 123(R) did not have a material impact on our results of operations, financial position or cash flows. All share-based compensation is accounted for in accordance with the fair-value based method of SFAS 123(R).
The Company’s Stock Incentive Plan of 2005 (the “Plan”), which is shareholder-approved, was established to grant stock options, restricted (non-vested) stock and performance share compensation awards to its associates, and 210 million shares of common stock to be issued under the Plan have been registered under the Securities Act of 1933. The Company believes that such awards better align the interests of its associates with those of its shareholders.
Under the Plan and prior plans, substantially all stock option awards have been granted with an exercise price equal to the market price of the Company’s stock at the date of grant. Generally, outstanding options granted before fiscal 2001 vest over seven years. Options granted after fiscal 2001 generally vest over five years. Shares issued upon the exercise of options are newly issued. Options granted generally have a contractual term of 10 years.
The Company’s United Kingdom subsidiary, Asda, also offers two other stock option plans to its associates. The first plan, The Asda Colleague Share Ownership Plan 1999 (“CSOP”), grants options to certain associates. Options granted under the CSOP Plan generally expire six years from the date of grant, with half vesting on the third anniversary of the grant and the other half on the sixth anniversary of the date of grant. Shares in the money at the vesting date are exercised while shares out of the money at the vesting date expire. The second plan, The Asda Sharesave Plan 2000 (“Sharesave”), grants options to certain associates at 80% of market value on the date of grant. Sharesave options become exercisable after either a three-year or five-year period and generally lapse six months after becoming exercisable. The Asda Colleague Share Ownership Plan 1999 and The Asda ShareSave Plan 2000 were registered to grant stock options to its colleagues for up to 34 million shares of common stock.
32
The fair value of each stock option award is estimated on the date of grant using the Black-Scholes-Merton option valuation model that uses various assumptions for inputs, which are noted in the following table. Generally, the Company uses expected volatilities and risk-free interest rates that correlate with the expected term of the option when estimating an option’s fair value. To determine the expected life of the option, the Company bases its estimates on historical exercise and expiration activity of grants with similar vesting periods. Expected volatility is based on historical volatility of our stock and the expected risk-free interest rate is based on the U.S. Treasury yield curve at the time of the grant. The expected dividend yield is based on the annual dividend rate at the time of grant. The following tables represent a weighted-average of the assumptions used by the Company to estimate the fair values of the Company’s stock options at the grant dates:
| | | | | | | | | |
Fiscal Year Ended January 31, | | 2007 | | | 2006 | | | 2005 | |
Dividend yield | | 2.3 | % | | 1.6 | % | | 1.1 | % |
Volatility | | 19.4 | % | | 20.8 | % | | 25.7 | % |
Risk-free interest rate | | 4.8 | % | | 4.0 | % | | 3.3 | % |
Expected life in years | | 5.3 | | | 4.1 | | | 4.9 | |
A summary of the stock option award activity for fiscal 2007 is presented below:
| | | | | | | | | | | |
Options | | Shares | | | Weighted-Average
Exercise Price | | Weighted-Average
Remaining Life in Years | | Aggregate Intrinsic Value |
Outstanding at January 31, 2006 | | 71,911,000 | | | $ | 49.69 | | | | | |
Granted | | 12,451,000 | | | | 43.74 | | | | | |
Exercised | | (5,015,000 | ) | | | 26.31 | | | | | |
Forfeited or expired | | (7,971,000 | ) | | | 47.36 | | | | | |
| | | | | | | | | | | |
Outstanding at January 31, 2007 | | 71,376,000 | | | $ | 48.65 | | 6.6 | | $ | 130,266,000 |
| | | | | | | | | | | |
Exercisable at January 31, 2007 | | 36,917,000 | | | $ | 48.82 | | 5.1 | | $ | 82,447,000 |
| | | | | | | | | | | |
As of January 31, 2007, there was $310 million of total unrecognized compensation cost related to stock options granted under the Plan, which is expected to be recognized over a weighted-average period of 3.0 years. The total fair value of options vested during the fiscal years ended January 31, 2007, 2006, and 2005, was $160 million, $197 million and $161 million, respectively.
The weighted-average grant-date fair value of options granted during the fiscal years ended January 31, 2007, 2006 and 2005, was $9.20, $11.82 and $11.39, respectively. The total intrinsic value of options exercised during the years ended January 31, 2007, 2006 and 2005, was $103 million, $125 million and $235 million, respectively.
Under the Plan, the Company grants various types of awards of restricted (non-vested) stock to certain associates. These grants include awards for shares that vest based on the passage of time, performance criteria, or both. Vesting periods vary. The restricted stock awards may be settled in stock, or deferred as stock or cash, based upon the associate’s election. Consequently, these awards are classified as liabilities in the accompanying balance sheets unless the associate has elected for the award to be settled or deferred in stock. The restricted stock rights awards are settled in stock.
During fiscal 2005, the Company began issuing performance share awards under the Plan which vesting is based on the passage of time and achievement of performance criteria. These awards accrue to the associate based on the extent to which revenue growth and return on investment goals are attained or exceeded over a one to three-year period. Based on the extent to which the targets are achieved, vested shares may range from 0% to 150% of the original award amount. Because the performance shares may be settled in stock or cash, the performance shares are accounted for as liabilities in the accompanying balance sheets.
The fair value of the restricted stock liabilities is remeasured each reporting period. The total liability for restricted stock and performance share awards at January 31, 2007, was $153 million.
33
A summary of the Company’s non-vested restricted stock and performance share award activity for fiscal 2007 is presented below represent the maximum number of shares that could be earned or vested under the Plan:
| | | | | | |
Non-Vested Restricted Stock and Performance Share Awards | | Shares | | | Weighted-Average
Grant-Date Fair Value |
Restricted Stock and Performance Share Awards at January 31, 2006 | | 7,899,000 | | | $ | 48.28 |
Granted | | 8,022,000 | | | | 45.95 |
Vested | | (833,000 | ) | | | 49.05 |
Forfeited | | (1,042,000 | ) | | | 48.95 |
| | | | | | |
Restricted Stock and Performance Share Awards at January 31, 2007 | | 14,046,000 | | | $ | 46.85 |
| | | | | | |
As of January 31, 2007, there was $360 million of total unrecognized compensation cost related to restricted stock and performance share awards granted under the Plan, which is expected to be recognized over a weighted-average period of 3.9 years. The total fair value of shares vested during the fiscal years ended January 31, 2007, 2006, and 2005, was $38 million, $20 million and $34 million, respectively.
8 Litigation
The Company is involved in a number of legal proceedings. In accordance with Statement of Financial Accounting Standards No. 5, “Accounting for Contingencies,” the Company has made accruals with respect to these matters, where appropriate, which are reflected in the Company’s Consolidated Financial Statements. The Company may enter into discussions regarding settlement of these matters, and may enter into settlement agreements, if it believes settlement is in the best interests of the Company’s shareholders. The matters, or groups of related matters, discussed below, if decided adversely to or settled by the Company, individually or in the aggregate, may result in liability material to the Company’s financial condition or results of operations.
The Company is a defendant in numerous cases containing class-action allegations in which the plaintiffs are current and former hourly associates who allege that the Company forced them to work “off the clock” or failed to provide work breaks, or otherwise that they were not paid for work performed. The complaints generally seek unspecified monetary damages, injunctive relief, or both. Class or collective-action certification has yet to be addressed by the court in a majority of these cases. Where it has been addressed, certification has been denied in fourteen of these cases; has been granted in whole or in part in eight of these cases; and has been conditionally granted for notice purposes only in two of these cases. In another five such cases, certification was denied and the case was then dismissed, and in one additional such case, certification was granted and the case was then dismissed. The Company cannot reasonably estimate the possible loss or range of loss which may arise from these lawsuits.
One of the class-action lawsuits described above isSavaglio v. Wal-Mart Stores, Inc., a class-action lawsuit in which the plaintiffs allege that they were not provided meal and rest breaks in accordance with California law, and seek monetary damages and injunctive relief. A jury trial on the plaintiffs’ claims for monetary damages concluded on December 22, 2005. The jury returned a verdict of approximately $57 million in statutory penalties and $115 million in punitive damages. Following a bench trial in June 2006, the judge entered an order allowing some, but not all, of the injunctive relief sought by the plaintiffs. On December 27, 2006, the judge entered an order awarding the plaintiffs an additional amount of approximately $26 million in costs and attorneys’ fees. The Company believes it has substantial defenses to the claims at issue, and on January 31, 2007, the Company filed its Notice of Appeal.
In another of the class-action lawsuits described above,Braun/Hummel v. Wal-Mart Stores, Inc., a jury trial was commenced on September 5, 2006, in Philadelphia, Pennsylvania. The plaintiffs allege that the Company failed to pay class members for all hours worked and prevented class members from taking their full meal and rest breaks. On October 13, 2006, the jury awarded back-pay damages to the plaintiffs of approximately $78 million on their claims for off-the-clock work and missed rest breaks. The jury found in favor of the Company on the plaintiffs’ meal-period claims. The plaintiffs are now seeking an additional award of approximately $62 million in statutory penalties, plus prejudgment interest and attorneys’ fees. The Company believes it has substantial defenses to the claims at issue, and intends to challenge the verdict in post-trial motions and, if necessary, on appeal.
Another of the class-action lawsuits described above,Salvas v. Wal-Mart Stores, Inc., had been scheduled to go to trial on October 2, 2006, before a jury in Cambridge, Massachusetts. The plaintiffs alleged that the Company failed to pay class members for all hours worked and prevented class members from taking their full meal and rest breaks, and were seeking approximately $90 million in back pay, plus statutory treble damages, interest and attorneys’ fees. Shortly before the scheduled trial date, however, the judge took the case off the trial docket in order to consider Wal-Mart’s motion to decertify the class, and on November 7, 2006, the judge entered an order decertifying the class entirely. It is anticipated that the judge will certify his ruling for an immediate appeal.
34
A putative class action is pending in California challenging the methodology of payments made under various associate incentive bonus plans. The court has made no decision on class certification in this case. The Company cannot reasonably estimate the possible loss or range of loss which may result from this lawsuit.
The Company is currently a defendant in five putative class actions brought on behalf of salaried managers who challenge their exempt status under state and federal laws, which are pending in California, Michigan, New Mexico and Tennessee. Conditional certification for notice purposes under the FLSA has been granted in one of these cases (Comer v. Wal-Mart Stores, Inc.). In another, class certification has been denied (Sepulveda v. Wal-Mart Stores, Inc.). The Company cannot reasonably estimate the possible loss or range of loss which may arise from these lawsuits.
The Company is a defendant inDukes v. Wal-Mart Stores, Inc., a class-action lawsuit commenced in June 2001 and pending in the United States District Court for the Northern District of California. The case was brought on behalf of all past and present female employees in all of the Company’s retail stores and warehouse clubs in the United States. The complaint alleges that the Company has engaged in a pattern and practice of discriminating against women in promotions, pay, training and job assignments. The complaint seeks, among other things, injunctive relief, front pay, back pay, punitive damages, and attorneys’ fees. On June 21, 2004, the district court issued an order granting in part and denying in part the plaintiffs’ motion for class certification. The class, which was certified by the district court for purposes of liability, injunctive and declaratory relief, punitive damages, and lost pay, subject to certain exceptions, includes all women employed at any Wal-Mart domestic retail store at any time since December 26, 1998, who have been or may be subjected to the pay and management track promotions policies and practices challenged by the plaintiffs. The class as certified currently includes approximately 1.6 million present and former female associates.
The Company believes that the district court’s ruling is incorrect. On August 31, 2004, the United States Court of Appeals for the Ninth Circuit granted the Company’s petition for discretionary review of the ruling. On February 6, 2007, a divided three-judge panel of the United States Court of Appeals for the Ninth Circuit issued a decision affirming the district court’s certification order. On February 20, 2007, the Company filed a petition asking that the decision be reconsidered by a larger panel of the court. If the Company is not successful in its appeal of class certification, or an appellate court issues a ruling that allows for the certification of a class or classes with a different size or scope, and if there is a subsequent adverse verdict on the merits from which there is no successful appeal, or in the event of a negotiated settlement of the litigation, the resulting liability could be material to the Company. The plaintiffs also seek punitive damages which, if awarded, could result in the payment of additional amounts material to the Company. However, because of the uncertainty of the outcome of the appeal from the district court’s certification decision, because of the uncertainty of the balance of the proceedings contemplated by the district court, and because the Company’s liability, if any, arising from the litigation, including the size of any damages award if plaintiffs are successful in the litigation or any negotiated settlement, could vary widely, the Company cannot reasonably estimate the possible loss or range of loss which may arise from the litigation.
Until recently, the Company was a defendant inMauldin v. Wal-Mart Stores, Inc., a class-action lawsuit that was filed on October 16, 2001, in the United States District Court for the Northern District of Georgia, Atlanta Division. A class was certified on August 23, 2002, consisting of female Wal-Mart associates who were participants in the Associates Health and Welfare Plan at any time from March 8, 2001, to the present and who were using prescription contraceptives. The class sought amendment of the Plan to include coverage for prescription contraceptives, back pay for all members in the form of reimbursement of the cost of prescription contraceptives, pre-judgment interest and attorneys’ fees. On December 8, 2006, the plaintiffs filed an unopposed motion to dismiss the case voluntarily in light of the Company’s recent amendment of the Plan to provide such coverage beginning January 1, 2007. On December 20, the Court entered an order granting the motion and dismissing the case.
The Company is a defendant in a lawsuit that was filed on August 24, 2001, in the United States District Court for the Eastern District of Kentucky.EEOC (Janice Smith) v. Wal-Mart Stores, Inc. is an action brought by the EEOC on behalf of Janice Smith and all other females who made application or transfer requests at the London, Kentucky, distribution center from 1995 to the present, and who were not hired or transferred into the warehouse positions for which they applied. The class seeks back pay for those females not selected for hire or transfer during the relevant time period. The class also seeks injunctive and prospective affirmative relief. The complaint alleges that the Company based hiring decisions on gender in violation of Title VII of the 1964 Civil Rights Act as amended. The EEOC can maintain this action as a class without certification. The Company cannot reasonably estimate the possible loss or range of loss which may arise from this litigation.
On November 8, 2005, the Company received a grand jury subpoena from the United States Attorney’s Office for the Central District of California, seeking documents and information relating to the Company’s receipt, transportation, handling, identification, recycling, treatment, storage and disposal of certain merchandise that constitutes hazardous materials or
35
hazardous waste. The Company has been informed by the U.S. Attorney’s Office for the Central District of California that it is a target of a criminal investigation into potential violations of the Resource Conservation and Recovery Act (“RCRA”), the Clean Water Act, and the Hazardous Materials Transportation Statute. This U.S. Attorney’s Office contends, among other things, that the use of Company trucks to transport certain returned merchandise from the Company’s stores to its return centers is prohibited by RCRA because those materials may be considered hazardous waste. The government alleges that, to comply with RCRA, the Company must ship from the store certain materials as “hazardous waste” directly to a certified disposal facility using a certified hazardous waste carrier. The Company contends that the practice of transporting returned merchandise to its return centers for subsequent disposition, including disposal by certified facilities, is compliant with applicable laws and regulations. The Company cannot reasonably estimate the possible loss or range of loss which may arise from this matter.
Additionally, the U.S. Attorney’s Office in the Northern District of California has initiated its own investigation regarding the Company’s handling of hazardous materials and hazardous waste and the Company has received administrative document requests from the California Department of Toxic Substances Control requesting documents and information with respect to two of the Company’s distribution facilities. Further, the Company also received a subpoena from the Los Angeles County District Attorney’s Office for documents and administrative interrogatories requesting information, among other things, regarding the Company’s handling of materials and hazardous waste. California state and local government authorities and the State of Nevada have also initiated investigations into these matters. The Company is cooperating fully with the respective authorities. The Company cannot reasonably estimate the possible loss or range of loss which may arise from this matter.
9 Commitments
The Company and certain of its subsidiaries have long-term leases for stores and equipment. Rentals (including, for certain leases, amounts applicable to taxes, insurance, maintenance, other operating expenses and contingent rentals) under operating leases and other short-term rental arrangements were $1.4 billion, $1.0 billion and $1.1 billion in 2007, 2006 and 2005, respectively. Aggregate minimum annual rentals at January 31, 2007, under non-cancelable leases are as follows (in millions):
| | | | | | |
Fiscal Year | | Operating
Leases | | Capital
Leases |
2008 | | $ | 842 | | $ | 538 |
2009 | | | 826 | | | 540 |
2010 | | | 768 | | | 520 |
2011 | | | 698 | | | 505 |
2012 | | | 634 | | | 480 |
Thereafter | | | 6,678 | | | 3,132 |
| | | | | | |
Total minimum rentals | | $ | 10,446 | | | 5,715 |
| | | | | | |
Less estimated executory costs | | | | | | 29 |
| | | | | | |
Net minimum lease payments | | | | | | 5,686 |
Less imputed interest at rates ranging from 3.0% to 15.6% | | | | | | 1,888 |
| | | | | | |
Present value of minimum lease payments | | | | | $ | 3,798 |
| | | | | | |
The Company has entered into sale/leaseback transactions involving buildings and the underlying land that were accounted for as capital and operating leases. Included in the annual maturities schedule above are $601 million of capital leases and $22 million of operating leases.
Certain of the Company’s leases provide for the payment of contingent rentals based on a percentage of sales. Such contingent rentals amounted to $41 million, $27 million and $32 million in 2007, 2006 and 2005, respectively. Substantially all of the Company’s store leases have renewal options, some of which may trigger an escalation in rentals.
In connection with certain debt financing, we could be liable for early termination payments if certain unlikely events were to occur. At January 31, 2007, the aggregate termination payment was $69 million. These two arrangements expire in fiscal 2011 and fiscal 2019.
In connection with the development of our grocery distribution network in the United States, we have agreements with third parties which would require us to purchase or assume the leases on certain unique equipment in the event the agreements are terminated. These agreements, which can be terminated by either party at will, cover up to a five-year period and obligate the Company to pay up to approximately $150 million upon termination of some or all of these agreements.
36
The Company has entered into lease commitments for land and buildings for 141 future locations. These underlying leases with real estate developers will provide for minimum rentals ranging from 4 to 30 years and will approximate $72 million annually over the lease terms based on current cost estimates.
10 Retirement-related Benefits
In the United States, the Company maintains a Profit Sharing and 401(k) Plan under which most full-time and many part-time Associates become participants following one year of employment. The Profit Sharing component of the plan is entirely funded by the Company, and the Company makes an additional contribution to the associates’ 401(k) component of the plan. In addition to the Company contributions to the 401(k) component of the plan, associates may elect to contribute a percentage of their earnings. During fiscal 2007, participants could contribute up to 25% of their pretax earnings, but not more than statutory limits.
Associates may choose from among 13 different investment options for the 401(k) component of the plan. For associates who did not make an election, their 401(k) balance in the plan is placed in a balanced fund. Associates’ 401(k) funds immediately vest, and associates may change their investment options at any time. Additionally, after January 31, 2007, associates with three years of service have full diversification rights with the same 13 investment options for the Profit Sharing component of the plan. Associates are fully vested in the Profit Sharing component of the plan after seven years of service.
Annual contributions made by the Company to the United States and Puerto Rico Profit Sharing and 401(k) Plans are made at the sole discretion of the Company. Expense associated with these plans was $890 million, $827 million and $756 million in fiscal 2007, 2006, and 2005, respectively.
Employees in foreign countries who are not U.S. citizens are covered by various post-employment benefit arrangements. These plans are administered based upon the legislative and tax requirements in the country in which they are established. Annual contributions to foreign retirement savings and profit sharing plans are made at the discretion of the Company, and were $274 million, $244 million and $199 million in fiscal 2007, 2006 and 2005, respectively.
The Company’s subsidiaries in the United Kingdom and Japan have defined benefit pension plans. The plan in the United Kingdom was underfunded by $251 million and $332 million at January 31, 2007 and 2006, respectively. The plan in Japan was underfunded by $208 million and $228 million at January 31, 2007 and 2006, respectively. These underfunded amounts have been recorded in our Consolidated Balance Sheets upon the adoption of SFAS 158. Certain other foreign operations have defined benefit arrangements that are not significant.
37
11 Segments
The Company and its subsidiaries are principally engaged in the continuing operations of retail stores located in all 50 states of the United States, Argentina, Brazil, Canada, Puerto Rico and the United Kingdom, through joint ventures in China, and through majority-owned subsidiaries in Central America, Japan and Mexico. The Company identifies segments based on the information used by our chief operating decision maker to analyze performance and to allocate resources among each business unit of the Company.
The Wal-Mart Stores segment includes the Company’s supercenters, discount stores and Neighborhood Markets in the United States, as well as walmart.com. The Sam’s Club segment includes the warehouse membership clubs in the United States as well as samsclub.com. The International segment consists of the Company’s operations outside of the United States. The amounts under the caption “Other” in the table below are unallocated corporate assets and overhead. For the periods prior to the Company’s majority ownership of Seiyu and CARHCO, the Company’s portion of the results of our unconsolidated minority interest in those entities was also included under the caption “Other.”
The Company measures the profit of its segments as “segment operating income,” which is defined as income from continuing operations before net interest expense, income taxes and minority interest and excludes unallocated corporate overhead and results of discontinued operations. Information on segments and the reconciliation to income from continuing operations before income taxes, minority interest and discontinued operations are as follows (in millions):
| | | | | | | | | | | | | | | | | |
Fiscal Year Ended January 31, 2007 | | Wal-Mart Stores | | Sam’s Club | | International | | Other | | | Consolidated | |
Revenues from external customers | | $ | 226,294 | | $ | 41,582 | | $ | 77,116 | | $ | — | | | $ | 344,992 | |
Intercompany real estate charge (income) | | | 3,896 | | | 587 | | | — | | | (4,483 | ) | | | — | |
Depreciation and amortization | | | 2,212 | | | 312 | | | 1,286 | | | 1,649 | | | | 5,459 | |
Operating income (loss) | | | 17,029 | | | 1,512 | | | 4,259 | | | (2,303 | ) | | | 20,497 | |
Interest expense, net | | | | | | | | | | | | | | | | (1,529 | ) |
| | | | | | | | | | | | | | | | | |
Income from continuing operations before income taxes and minority interest | | | | | | | | | | | | | | | $ | 18,968 | |
Total assets of continuing operations | | $ | 34,649 | | $ | 6,345 | | $ | 55,989 | | $ | 54,210 | | | $ | 151,193 | |
| | | | | |
Fiscal Year Ended January 31, 2006 | | Wal-Mart Stores | | Sam’s Club | | International | | Other | | | Consolidated | |
Revenues from external customers | | $ | 209,910 | | $ | 39,798 | | $ | 59,237 | | $ | — | | | $ | 308,945 | |
Intercompany real estate charge (income) | | | 3,454 | | | 547 | | | — | | | (4,001 | ) | | | — | |
Depreciation and amortization | | | 1,922 | | | 296 | | | 971 | | | 1,456 | | | | 4,645 | |
Operating income (loss) | | | 15,324 | | | 1,385 | | | 3,506 | | | (1,502 | ) | | | 18,713 | |
Interest expense, net | | | | | | | | | | | | | | | | (1,178 | ) |
| | | | | | | | | | | | | | | | | |
Income from continuing operations before income taxes and minority interest | | | | | | | | | | | | | | | $ | 17,535 | |
Total assets of continuing operations | | $ | 32,809 | | $ | 5,686 | | $ | 49,018 | | $ | 48,111 | | | $ | 135,624 | |
| | | | | |
Fiscal Year Ended January 31, 2005 | | Wal-Mart Stores | | Sam’s Club | | International | | Other | | | Consolidated | |
Revenues from external customers | | $ | 191,826 | | $ | 37,119 | | $ | 52,543 | | $ | — | | | $ | 281,488 | |
Intercompany real estate charge (income) | | | 2,754 | | | 513 | | | — | | | (3,267 | ) | | | — | |
Depreciation and amortization | | | 1,561 | | | 274 | | | 840 | | | 1,510 | | | | 4,185 | |
Operating income (loss) | | | 14,163 | | | 1,280 | | | 3,197 | | | (1,340 | ) | | | 17,300 | |
Interest expense, net | | | | | | | | | | | | | | | | (980 | ) |
| | | | | | | | | | | | | | | | | |
Income from continuing operations before income taxes and minority interest | | | | | | | | | | | | | | | $ | 16,320 | |
Total assets of continuing operations | | $ | 29,489 | | $ | 5,685 | | $ | 37,966 | | $ | 43,999 | | | $ | 117,139 | |
38
Certain information for fiscal years 2006 and 2005 has been reclassified to conform to current-year presentation.
In the United States, long-lived assets, net, excluding goodwill and other assets and deferred charges were $62.3 billion, $55.5 billion and $48.4 billion as of January 31, 2007, 2006 and 2005, respectively. In the United States, additions to long-lived assets were $12.2 billion, $11.8 billion and $9.8 billion in fiscal 2007, 2006 and 2005, respectively. Outside of the United States, long-lived assets, net, excluding goodwill and other assets and deferred charges were $26.1 billion, $22.4 billion and $18.1 billion in fiscal 2007, 2006 and 2005, respectively. Outside of the United States, additions to long-lived assets were $3.5 billion, $2.7 billion and $3.0 billion in fiscal 2007, 2006 and 2005, respectively. The International segment includes all real estate outside the United States. The operations of the Company’s Asda subsidiary are significant in comparison to the total operations of the International segment. Asda sales during fiscal 2007, 2006 and 2005 were $28.9 billion, $26.8 billion and $26.0 billion, respectively. Asda long-lived assets, consisting primarily of property and equipment, net, totaled $13.3 billion, $11.0 billion, and $11.3 billion at January 31, 2007, 2006 and 2005, respectively.
12 Quarterly Financial Data (Unaudited)
| | | | | | | | | | | | | | | | |
| | | Quarters ended | |
(Amounts in millions except per share information) | | April 30, | | | July 31, | | | October 31, | | | January 31, | |
Fiscal 2007 | | | | | | | | | | | | | | | | |
Net sales | | $ | 78,834 | | | $ | 84,524 | | | $ | 83,543 | | | $ | 98,090 | |
Cost of sales | | | 60,237 | | | | 64,585 | | | | 63,765 | | | | 75,565 | |
| | | | | | | | | | | | | | | | |
Gross profit | | $ | 18,597 | | | $ | 19,939 | | | $ | 19,778 | | | $ | 22,525 | |
Income from continuing operations | | $ | 2,660 | | | $ | 2,984 | | | $ | 2,594 | | | $ | 3,940 | |
(Loss) income from discontinued operations, net of tax | | | (45 | ) | | | (901 | ) | | | 53 | | | | — | |
| | | | | | | | | | | | | | | | |
Net income | | $ | 2,615 | | | $ | 2,083 | | | $ | 2,647 | | | $ | 3,940 | |
Basic and diluted net income per common share: | | | | | | | | | | | | | | | | |
Basic and diluted income per share from continuing operations | | $ | 0.64 | | | $ | 0.72 | | | $ | 0.62 | | | $ | 0.95 | |
Basic and diluted (loss) income per share from discontinued operations | | $ | (0.01 | ) | | | (0.22 | ) | | | 0.01 | | | | — | |
| | | | | | | | | | | | | | | | |
Basic and diluted net income per share | | $ | 0.63 | | | $ | 0.50 | | | $ | 0.63 | | | $ | 0.95 | |
| | | | | | | | | | | | | | | | |
Fiscal 2006 | | | | | | | | | | | | | | | | |
Net sales | | $ | 69,999 | | | $ | 75,932 | | | $ | 74,596 | | | $ | 88,418 | |
Cost of sales | | | 53,852 | | | | 58,089 | | | | 57,325 | | | | 68,382 | |
| | | | | | | | | | | | | | | | |
Gross profit | | $ | 16,147 | | | $ | 17,843 | | | $ | 17,271 | | | $ | 20,036 | |
Income from continuing operations | | $ | 2,511 | | | $ | 2,853 | | | $ | 2,422 | | | $ | 3,621 | |
Loss from discontinued operations, net of tax | | | (50 | ) | | | (48 | ) | | | (48 | ) | | | (32 | ) |
| | | | | | | | | | | | | | | | |
Net income | | $ | 2,461 | | | $ | 2,805 | | | $ | 2,374 | | | $ | 3,589 | |
Basic and diluted net income per common share: | | | | | | | | | | | | | | | | |
Basic and diluted income per share from continuing operations | | $ | 0.59 | | | $ | 0.68 | | | $ | 0.58 | | | $ | 0.87 | |
Basic and diluted loss per share from discontinued operations | | | (0.01 | ) | | | (0.01 | ) | | | (0.01 | ) | | | (0.01 | ) |
| | | | | | | | | | | | | | | | |
Basic and diluted net income per share | | $ | 0.58 | | | $ | 0.67 | | | $ | 0.57 | | | $ | 0.86 | |
| | | | | | | | | | | | | | | | |
The sum of quarterly financial data may not agree to annual amounts due to rounding.
39
13 Recent Accounting Pronouncements
In June 2006, the Emerging Issues Task Force reached a consensus on Issue No. 06-3 (“EITF 06-3”), “Disclosure Requirements for Taxes Assessed by a Governmental Authority on Revenue-Producing Transactions.” The consensus allows an entity to choose between two acceptable alternatives based on their accounting policies for transactions in which the entity collects taxes on behalf of a governmental authority, such as sales taxes. Under the gross method, taxes collected are accounted for as a component of sales revenue with an offsetting expense. Conversely, the net method allows a reduction to sales revenue. Entities should disclose the method selected pursuant to APB No. 22, “Disclosure of Accounting Policies.” If such taxes are reported gross and are significant, entities should disclose the amount of those taxes. The guidance should be applied to financial reports through retrospective application for all periods presented, if amounts are significant, for interim and annual reporting beginning February 1, 2007. Historically, the Company has presented sales net of tax collected.
In July 2006, the Financial Accounting Standards Board (“FASB”) issued Interpretation No. 48, “Accounting for Uncertainty in Income Taxes” (“FIN 48”). FIN 48 clarifies the accounting for income taxes, by prescribing a minimum recognition threshold a tax position is required to meet before being recognized in the financial statements. FIN 48 also provides guidance on derecognition, measurement, classification, interest and penalties, accounting in interim periods, disclosure and transition. The Company will adopt FIN 48 on February 1, 2007, as required and for which the cumulative effect will be recorded in retained earnings. The Company is currently evaluating the Interpretation to determine the impact the Interpretation will have on its financial condition, results of operations or liquidity.
In September 2006, the FASB issued Statement of Financial Accounting Standards No. 157, “Fair Value Measurements” (“SFAS 157”). This standard defines fair value, establishes a framework for measuring fair value in generally accepted accounting principles and expands disclosures about fair value measurements. The Company will adopt SFAS 157 on February 1, 2008, as required. The adoption of SFAS 157 is not expected to have a material impact on the Company’s financial condition, results of operations or liquidity.
In September 2006, the FASB also issued Statement of Financial Accounting Standards No. 158 “Employers’ Accounting for Defined Benefit Pension and Other Postretirement Plans – an amendment of FASB Statements No. 87, 88, 106 and 132(R)” (“SFAS 158”). This standard requires recognition of the funded status of a benefit plan in the statement of financial position. The Standard also requires recognition in other comprehensive income certain gains and losses that arise during the period but are deferred under pension accounting rules, as well as modifies the timing of reporting and adds certain disclosures. The Company adopted the funded status recognition and disclosure elements as of January 31, 2007, and will adopt measurement elements as of January 31, 2009, as required by SFAS 158. The adoption of SFAS 158 did not have a material impact on the Company’s financial condition, results of operations or liquidity.
In September 2006, the Securities and Exchange Commission (“SEC”) issued Staff Accounting Bulletin No. 108 “Considering the Effects of Prior Year Misstatements when Quantifying Misstatements in Current Year Financial Statements” (“SAB 108”), in which the Staff provides guidance on the consideration of the effects of prior year misstatements in quantifying current year misstatements for the purpose of assessing materiality. The Company adopted SAB 108 as of January 31, 2007, as required. The adoption of SAB 108 did not have a material impact on the Company’s financial condition, results of operations or liquidity.
In February 2007, the FASB issued Financial Accounting Standards No. 159 “The Fair Value Option for Financial Assets and Financial Liabilities–Including an amendment of FASB Statement No. 115” (“SFAS 159”). SFAS 159 permits companies to measure many financial instruments and certain other items at fair value at specified election dates. SFAS 159 will be effective beginning February 1, 2008. The Company is currently assessing the impact of SFAS 159 on its financial statements.
14 Subsequent Events
On March 8, 2007, the Company’s Board of Directors approved an increase in the Company’s annual dividend to $0.88 per share. The annual dividend will be paid in four quarterly installments on April 2, 2007, June 4, 2007, September 4, 2007, and January 2, 2008 to holders of record on March 16, May 18, August 17 and December 14, 2007, respectively.
In February 2007, the Company announced the purchase of a 35% interest in Bounteous Company Ltd. (“BCL”). BCL operates 101 hypermarkets in 34 cities in China under the Trust-Mart banner. The purchase price for the 35% interest was $264 million. Also in February 2007, the Company paid $376 million to purchase a loan issued to the selling BCL shareholders which is securitized by the remaining equity of BCL. Concurrent with the initial investment in BCL, the Company entered into a stockholders agreement which provides the Company with voting rights associated with a portion of the common stock of BCL secured by the loan, amounting to an additional 30% of the aggregate outstanding shares. Pursuant to the purchase agreement, the Company is committed to purchase the remaining interest in BCL on or before February 2010 subject to certain conditions. The final purchase price for the remaining interest will be approximately $320 million, net of loan repayments and subject to reduction under certain circumstances.
40
Report of Independent Registered Public Accounting Firm
The Board of Directors and Shareholders,
Wal-Mart Stores, Inc.
We have audited the accompanying consolidated balance sheets of Wal-Mart Stores, Inc. as of January 31, 2007 and 2006, and the related consolidated statements of income, shareholders’ equity, and cash flows for each of the three years in the period ended January 31, 2007. These financial statements are the responsibility of the Company’s management. Our responsibility is to express an opinion on these financial statements based on our audits.
We conducted our audits in accordance with the standards of the Public Company Accounting Oversight Board (United States). Those standards require that we plan and perform the audit to obtain reasonable assurance about whether the financial statements are free of material misstatement. An audit includes examining, on a test basis, evidence supporting the amounts and disclosures in the financial statements. An audit also includes assessing the accounting principles used and significant estimates made by management, as well as evaluating the overall financial statement presentation. We believe that our audits provide a reasonable basis for our opinion.
In our opinion, the financial statements referred to above present fairly, in all material respects, the consolidated financial position of Wal-Mart Stores, Inc. at January 31, 2007 and 2006, and the consolidated results of its operations and its cash flows for each of the three years in the period ended January 31, 2007, in conformity with U.S. generally accepted accounting principles.
As discussed in Note 13 to the consolidated financial statements, effective January 31, 2007, the Company adopted Statement of Financial Accounting Standards No. 158,Employers’ Accounting for Defined Benefit Pension and Other Postretirement Plans.
We also have audited, in accordance with the standards of the Public Company Accounting Oversight Board (United States), the effectiveness of Wal-Mart Stores, Inc.’s internal control over financial reporting as of January 31, 2007, based on criteria established inInternal Control – Integrated Framework issued by the Committee of Sponsoring Organizations of the Treadway Commission and our report dated March 26, 2007 expressed an unqualified opinion thereon.
/s/ Ernst & Young LLP
Rogers, Arkansas
March 26, 2007
41
Report of Independent Registered Public Accounting Firm
on Internal Control Over Financial Reporting
The Board of Directors and Shareholders,
Wal-Mart Stores, Inc.
We have audited management’s assessment, included in the accompanying “Management’s Report to our Shareholders” under the caption “Report on Internal Control Over Financial Reporting”, that Wal-Mart Stores, Inc. maintained effective internal control over financial reporting as of January 31, 2007, based on criteria established inInternal Control – Integrated Framework issued by the Committee of Sponsoring Organizations of the Treadway Commission (the COSO criteria). Wal-Mart Stores, Inc.’s management is responsible for maintaining effective internal control over financial reporting and for its assessment of the effectiveness of internal control over financial reporting. Our responsibility is to express an opinion on management’s assessment and an opinion on the effectiveness of the company’s internal control over financial reporting based on our audit.
We conducted our audit in accordance with the standards of the Public Company Accounting Oversight Board (United States). Those standards require that we plan and perform the audit to obtain reasonable assurance about whether effective internal control over financial reporting was maintained in all material respects. Our audit included obtaining an understanding of internal control over financial reporting, evaluating management’s assessment, testing and evaluating the design and operating effectiveness of internal control, and performing such other procedures as we considered necessary in the circumstances. We believe that our audit provides a reasonable basis for our opinion.
A company’s internal control over financial reporting is a process designed to provide reasonable assurance regarding the reliability of financial reporting and the preparation of financial statements for external purposes in accordance with generally accepted accounting principles. A company’s internal control over financial reporting includes those policies and procedures that (1) pertain to the maintenance of records that, in reasonable detail, accurately and fairly reflect the transactions and dispositions of the assets of the company; (2) provide reasonable assurance that transactions are recorded as necessary to permit preparation of financial statements in accordance with generally accepted accounting principles, and that receipts and expenditures of the company are being made only in accordance with authorizations of management and directors of the company; and (3) provide reasonable assurance regarding prevention or timely detection of unauthorized acquisition, use, or disposition of the company’s assets that could have a material effect on the financial statements.
Because of its inherent limitations, internal control over financial reporting may not prevent or detect misstatements. Also, projections of any evaluation of effectiveness to future periods are subject to the risk that controls may become inadequate because of changes in conditions, or that the degree of compliance with the policies or procedures may deteriorate.
As indicated in the accompanying “Management’s Report to Our Shareholders”, management’s assessment of and conclusion on the effectiveness of internal control over financial reporting did not include the internal controls of Central American Retail Holding Company, of which the Company acquired majority ownership in fiscal 2007 and is included in the fiscal 2007 Consolidated Financial Statements of Wal-Mart Stores, Inc. This entity, now known as Wal-Mart Central America, represented, in the aggregate, 0.9% and 0.6% of consolidated total assets and consolidated net sales, respectively, of the Company as of, and for the year ended, January 31, 2007. This acquisition is more fully discussed in Note 6 to the Consolidated Financial Statements for fiscal 2007. Our audit of internal control over financial reporting of Wal-Mart Stores, Inc. also did not include an evaluation of the internal control over financial reporting for this fiscal 2007 acquisition.
In our opinion, management’s assessment that Wal-Mart Stores, Inc. maintained effective internal control over financial reporting as of January 31, 2007, is fairly stated, in all material respects, based on the COSO criteria. Also, in our opinion, Wal-Mart Stores, Inc. maintained, in all material respects, effective internal control over financial reporting as of January 31, 2007, based on the COSO criteria.
42
We also have audited, in accordance with the standards of the Public Company Accounting Oversight Board (United States), the consolidated balance sheets of Wal-Mart Stores, Inc. as of January 31, 2007 and 2006, and the related consolidated statements of income, shareholders’ equity, and cash flows for each of the three years in the period ended January 31, 2007 and our report dated March 26, 2007 expressed an unqualified opinion thereon.
/s/ Ernst & Young LLP
Rogers, Arkansas
March 26, 2007
43
Management’s Report to Our Shareholders
Wal-Mart Stores, Inc.
Management of Wal-Mart Stores, Inc. (“Wal-Mart” or the “Company”) is responsible for the preparation, integrity and objectivity of Wal-Mart’s Consolidated Financial Statements and other financial information contained in this Annual Report to Shareholders. Those Consolidated Financial Statements were prepared in conformity with accounting principles generally accepted in the United States. In preparing those Consolidated Financial Statements, management was required to make certain estimates and judgments, which are based upon currently available information and management’s view of current conditions and circumstances.
The Audit Committee of the Board of Directors, which consists solely of independent directors, oversees our process of reporting financial information and the audit of our Consolidated Financial Statements. The Audit Committee stays informed of the financial condition of Wal-Mart and regularly reviews management’s financial policies and procedures, the independence of our independent auditors, our internal control and the objectivity of our financial reporting. Both the independent auditors and the internal auditors have free access to the Audit Committee and meet with the Audit Committee periodically, both with and without management present.
Acting through our Audit Committee, we have retained Ernst & Young LLP, an independent registered public accounting firm, to audit our Consolidated Financial Statements found in this annual report. We have made available to Ernst & Young LLP all of our financial records and related data in connection with their audit of our Consolidated Financial Statements.
We have filed with the Securities and Exchange Commission (“SEC”) the required certifications related to our Consolidated Financial Statements as of and for the year ended January 31, 2007. These certifications are attached as exhibits to our Annual Report on Form 10-K for the year ended January 31, 2007. Additionally, we have also provided to the New York Stock Exchange the required annual certification of our Chief Executive Officer regarding our compliance with the New York Stock Exchange’s corporate governance listing standards.
Report on Internal Control Over Financial Reporting
Management has responsibility for establishing and maintaining adequate internal control over financial reporting. Internal control over financial reporting is a process designed to provide reasonable assurance regarding the reliability of financial reporting and the preparation of financial statements for external reporting purposes in accordance with accounting principles generally accepted in the United States. Because of its inherent limitations, internal control over financial reporting may not prevent or detect misstatements. Management has assessed the effectiveness of the Company’s internal control over financial reporting as of January 31, 2007. In making its assessment, management has utilized the criteria set forth by the Committee of Sponsoring Organizations (“COSO”) of the Treadway Commission inInternal Control — Integrated Framework. Management concluded that based on its assessment, Wal-Mart’s internal control over financial reporting was effective as of January 31, 2007. Management’s assessment of the effectiveness of the Company’s internal control over financial reporting as of January 31, 2007, has been audited by Ernst & Young LLP, an independent registered public accounting firm, as stated in their report which appears in this Annual Report to Shareholders.
Management’s assessment of the effectiveness of the Company’s internal control over financial reporting excluded Central American Retail Holding Company, of which the Company acquired majority ownership in fiscal 2007. This entity, now known as Wal-Mart Central America, represented, in the aggregate, 0.9% and 0.6% of consolidated total assets and consolidated net sales, respectively, of the Company as of and for the year ended January 31, 2007. This acquisition is more fully discussed in Note 6 to our Consolidated Financial Statements for fiscal 2007. Under guidelines established by the SEC, companies are allowed to exclude acquisitions from their first assessment of internal control over financial reporting following the date of the acquisition.
Evaluation of Disclosure Controls and Procedures
We maintain disclosure controls and procedures designed to provide reasonable assurance that information required to be timely disclosed is accumulated and communicated to management in a timely fashion. Management has assessed the effectiveness of these disclosure controls and procedures as of January 31, 2007, and determined they were effective as of that date to provide reasonable assurance that information required to be disclosed by us in the reports we file or submit under the Securities Exchange Act of 1934, as amended, was accumulated and communicated to management, as appropriate, to allow timely decisions regarding required disclosure and were effective to provide reasonable assurance that such information is recorded, processed, summarized and reported within the time periods specified by the SEC’s rules and forms.
44
Report on Ethical Standards
Our Company was founded on the belief that open communications and the highest standards of ethics are necessary to be successful. Our long-standing “Open Door” communication policy helps management be aware of and address issues in a timely and effective manner. Through the open door policy all associates are encouraged to inform management at the appropriate level when they are concerned about any matter pertaining to Wal-Mart.
Wal-Mart has adopted a Statement of Ethics to guide our associates in the continued observance of high ethical standards such as honesty, integrity and compliance with the law in the conduct of Wal-Mart’s business. Familiarity and compliance with the Statement of Ethics is required of all associates who are part of management. The Company also maintains a separate Code of Ethics for our senior financial officers. Wal-Mart also has in place a Related-Party Transaction Policy. This policy applies to Wal-Mart’s senior officers and directors and requires material related-party transactions to be reviewed by the Audit Committee. The senior officers and directors are required to report material related-party transactions to Wal-Mart. We maintain an ethics office which oversees and administers an ethics hotline. The ethics hotline provides a channel for associates to make confidential and anonymous complaints regarding potential violations of our statements of ethics, including violations related to financial or accounting matters.
|
|
| /s/ H. Lee Scott, Jr. |
| H. Lee Scott, Jr. |
| President and Chief Executive Officer |
|
| /s/ Thomas M. Schoewe |
| Thomas M. Schoewe |
| Executive Vice President and Chief Financial Officer |
45
Fiscal 2007 End-of-Year Store Count
Wal-Mart Stores, Inc.
| | | | | | | | |
State | | Discount
Stores | | Supercenters | | Sam’s
Clubs | | Neighborhood
Markets |
Alabama | | 11 | | 79 | | 11 | | 2 |
Alaska | | 7 | | — | | 3 | | — |
Arizona | | 13 | | 49 | | 13 | | 11 |
Arkansas | | 18 | | 62 | | 6 | | 6 |
California | | 145 | | 22 | | 36 | | — |
Colorado | | 13 | | 48 | | 15 | | — |
Connecticut | | 28 | | 4 | | 3 | | — |
Delaware | | 4 | | 4 | | 1 | | — |
Florida | | 45 | | 146 | | 39 | | 12 |
Georgia | | 12 | | 114 | | 22 | | — |
Hawaii | | 8 | | — | | 2 | | — |
Idaho | | 3 | | 16 | | 2 | | — |
Illinois | | 78 | | 59 | | 28 | | — |
Indiana | | 19 | | 76 | | 16 | | 4 |
Iowa | | 14 | | 42 | | 8 | | — |
Kansas | | 13 | | 42 | | 6 | | 3 |
Kentucky | | 17 | | 65 | | 7 | | 2 |
Louisiana | | 10 | | 71 | | 12 | | 2 |
Maine | | 10 | | 12 | | 3 | | — |
Maryland | | 32 | | 9 | | 12 | | — |
Massachusetts | | 41 | | 3 | | 3 | | — |
Michigan | | 34 | | 45 | | 25 | | — |
Minnesota | | 28 | | 26 | | 13 | | — |
Mississippi | | 9 | | 55 | | 6 | | 1 |
Missouri | | 33 | | 84 | | 15 | | — |
Montana | | 3 | | 9 | | 1 | | — |
Nebraska | | — | | 27 | | 3 | | — |
Nevada | | 6 | | 20 | | 5 | | 10 |
New Hampshire | | 19 | | 7 | | 4 | | — |
New Jersey | | 44 | | 1 | | 9 | | — |
New Mexico | | 3 | | 28 | | 7 | | 2 |
New York | | 45 | | 43 | | 17 | | — |
North Carolina | | 31 | | 87 | | 21 | | — |
North Dakota | | 2 | | 7 | | 3 | | — |
Ohio | | 38 | | 98 | | 30 | | — |
Oklahoma | | 23 | | 61 | | 8 | | 16 |
Oregon | | 15 | | 14 | | — | | — |
Pennsylvania | | 46 | | 73 | | 23 | | — |
Rhode Island | | 7 | | 2 | | 1 | | — |
South Carolina | | 12 | | 51 | | 9 | | — |
South Dakota | | — | | 12 | | 2 | | — |
Tennessee | | 8 | | 96 | | 16 | | 6 |
Texas | | 50 | | 279 | | 71 | | 30 |
Utah | | 2 | | 27 | | 7 | | 5 |
Vermont | | 4 | | — | | — | | — |
Virginia | | 19 | | 68 | | 13 | | — |
Washington | | 21 | | 24 | | 3 | | — |
West Virginia | | 4 | | 30 | | 5 | | — |
Wisconsin | | 28 | | 49 | | 12 | | — |
Wyoming | | — | | 10 | | 2 | | — |
| | | | | | | | |
U.S. Totals | | 1,075 | | 2,256 | | 579 | | 112 |
| | | | | | | | |
46
International(1)(2)
| | |
Country | | Units |
Argentina | | 13 |
Brazil | | 299 |
Canada | | 289 |
Central America | | 413 |
China | | 73 |
Japan | | 392 |
Mexico | | 889 |
Puerto Rico | | 54 |
United Kingdom | | 335 |
| | |
International Totals | | 2,757 |
| | |
Grand Totals | | 6,779 |
| | |
| (1) | Unit counts are as of December 31, of the years shown for all countries except Canada and Puerto Rico, which are as of January 31. |
| (2) | At January 31, 2007, our international operating formats varied by market and included: |
| | • | | Argentina - 13 supercenters |
| | • | | Brazil - 26 supercenters, 19 Sam’s Clubs, 66 hypermarkets (Hiper Bompreço, Big), 157 supermarkets (Bompreço, Mercadorama, Nacional), 11 cash-n-carry stores (Maxxi Alacado), 15 combination discount and grocery stores (Todo Dia), 3 general merchandise stores (Magazine) and 2 discount stores (Mini Bompreço) |
| | • | | Canada - 7 supercenters, 276 discount stores and 6 Sam’s Clubs |
| | • | | China - 68 supercenters, 2 Neighborhood Markets and 3 Sam’s Clubs |
| | • | | Costa Rica - 4 hypermarkets (Hiper Mas), 23 supermarkets (Más por Menos), 8 warehouse stores (Maxi Bodega) and 102 discount stores (Pali) |
| | • | | El Salvador - 2 hypermarkets (Hiper Paiz), 32 supermarkets (La Despensa de Don Juan) and 29 discount stores (Despensa Familiar) |
| | • | | Guatemala - 6 hypermarkets (Hiper Paiz), 28 supermarkets (Paiz), 8 warehouse stores (Maxi Bodega), 2 membership clubs (Club Co) and 88 discount stores (Despensa Familiar) |
| | • | | Honduras - 1 hypermarket (Hiper Paiz), 6 supermarkets (Paiz), 5 warehouse stores (Maxi Bodega) and 29 discount stores (Despensa Familiar) |
| | • | | Japan - 97 hypermarkets (Livin, Seiyu), 293 supermarkets (Seiyu, Sunny) and 2 general merchandise stores (Seiyu) |
| | • | | Mexico - 118 supercenters, 77 Sam’s Clubs, 100 supermarkets (Superama, Mi Bodega), 219 combination discount and grocery stores (Bodega), 61 department stores (Suburbia), 312 restaurants and 2 discount stores (Mi Bodega Express) |
| | • | | Nicaragua - 5 supermarkets (La Unión) and 35 discount stores (Pali) |
| | • | | Puerto Rico - 6 supercenters, 8 discount stores, 9 Sam’s Clubs and 31 supermarkets (Amigo) |
| | • | | United Kingdom - 23 supercenters (Asda), 291 supermarkets (Asda), 7 general merchandise stores (Asda Living), 12 apparel stores (George) and 2 discount stores (Asda Essentials) |
47
Board of directors
Aida M. Alvarez
Ms. Alvarez is the former Administrator of the U.S. Small Business Administration and was a member of President Clinton’s Cabinet from 1997 to 2001.
James W. Breyer
Mr. Breyer is a Managing Partner of Accel Partners, a venture capital firm.
M. Michele Burns
Ms. Burns is the Executive Vice President and Chief Executive Officer of Mercer Human Resource Consulting, a subsidiary of Marsh and McLennan Companies, Inc.
Dr. James I. Cash, Jr.
Dr. Cash is the retired James E. Robison Professor of Business Administration at Harvard Business School, where he served from July 1976 to October 2003.
Roger C. Corbett
Mr. Corbett is the retired Chief Executive Officer and Group Managing Director of Woolworths Limited, the largest retail company in Australia.
Douglas N. Daft
Mr. Daft is the retired Chairman of the Board of Directors and Chief Executive Officer of The Coca-Cola Company.
48
David D. Glass
Mr. Glass is former Chairman of the Executive Committee of the Board of Directors of Wal-Mart Stores, Inc. and the former President and Chief Executive Officer of Wal-Mart Stores, Inc.
Roland A. Hernandez
Mr. Hernandez is the retired Chairman of the Board of Directors and Chief Executive Officer of Telemundo Group, Inc., a Spanish-language television station company.
H. Lee Scott, Jr.
Mr. Scott is the President and Chief Executive Officer of Wal-Mart Stores, Inc.
Jack C. Shewmaker
Mr. Shewmaker is the President of J-COM, Inc., a consulting company, a retired Wal-Mart executive and a rancher.
Jim C. Walton
Mr. Walton is the Chairman of the Board of Directors and Chief Executive Officer of Arvest Bank Group, Inc., a group of banks operating in 91 communities in the states of Arkansas, Kansas, Missouri and Oklahoma.
S. Robson Walton
Mr. Walton is Chairman of the Board of Directors of Wal-Mart Stores, Inc.
Christopher J. Williams
Mr. Williams is the Chairman of the Board of Directors and Chief Executive Officer of The Williams Capital Group, L.P., an investment bank.
Linda S. Wolf
Ms. Wolf is the retired Chairman of the Board of Directors and Chief Executive Officer of Leo Burnett Worldwide, Inc., an advertising agency and division of Publicis Groupe S.A.
49
Corporate and Stock Information
Wal-Mart Stores, Inc.
Corporate information
Registrar and Transfer Agent:
Computershare Trust Company, N.A.
P.O. Box 43069
Providence, Rhode Island 02940-3069
1-800-438-6278
TDD for hearing-impaired inside the U.S. 1-800-952-9245
Internet: http//www.computershare.com
Dividend reinvestment and direct stock purchase available
Listing – Stock Symbol: WMT
New York Stock Exchange
Annual meeting:
Our Annual Meeting of Shareholders will be held on Friday, June 1, 2007, in Bud Walton Arena on the University of Arkansas campus, Fayetteville, Arkansas.
Communication with shareholders:
Wal-Mart Stores, Inc. periodically communicates with its shareholders and other members of the investment community about our operations. For further information regarding our policy on shareholder and investor communications refer to our websitewww.walmartstores.com/investors.
Independent registered public accounting firm:
Ernst & Young LLP
5414 Pinnacle Point Dr., Suite 102
Rogers, AR 72758
The following reports are available without charge upon request by writing the Company c/o Investor Relations or by calling 479-273-8446. These reports are also available via the corporate website.
Annual Report on Form 10-K
Quarterly Reports on Form 10-Q
Current Sales and Earnings Releases
Current Reports on Form 8-K
Copy of Proxy Statement
Supplier Standards Report
50
Market price of common stock
Fiscal year ended January 31,
| | | | | | | | | | | | |
| | | 2007 | | 2006 |
| | | High | | Low | | High | | Low |
1st Quarter | | $ | 48.87 | | $ | 44.52 | | $ | 53.51 | | $ | 46.81 |
2nd Quarter | | $ | 50.00 | | $ | 42.31 | | $ | 50.51 | | $ | 47.00 |
3rd Quarter | | $ | 52.15 | | $ | 43.48 | | $ | 49.80 | | $ | 42.49 |
4th Quarter | | $ | 49.70 | | $ | 44.80 | | $ | 50.57 | | $ | 44.95 |
Fiscal year ended January 31,
| | | | | | |
| | | 2008 |
| | | High | | Low |
1st Quarter* | | $ | 50.42 | | $ | 45.06 |
Dividends payable per share
Fiscal year ended January 31, 2008
| | | |
April 2, 2007 | | $ | 0.22 |
June 4, 2007 | | $ | 0.22 |
September 4, 2007 | | $ | 0.22 |
January 2, 2008 | | $ | 0.22 |
Dividends paid per share
Fiscal year ended January 31, 2007
| | | |
April 3, 2006 | | $ | 0.1675 |
June 5, 2006 | | $ | 0.1675 |
September 5, 2006 | | $ | 0.1675 |
January 2, 2007 | | $ | 0.1675 |
Fiscal year ended January 31, 2006
| | | |
April 4, 2005 | | $ | 0.150 |
June 6, 2005 | | $ | 0.150 |
September 6, 2005 | | $ | 0.150 |
January 3, 2006 | | $ | 0.150 |
51
Stock Performance Chart
This graph compares the cumulative total shareholder return on Wal-Mart’s common stock during the five fiscal years ending with fiscal 2007 to the cumulative total returns on the S&P 500 Retailing Index and the S&P 500 Index. The comparison assumes $100 was invested on February 1, 2002 in shares of our common stock and in each of the indices shown and assumes that all of the dividends were reinvested.
COMPARATIVE 5-YEAR CUMULATIVE TOTAL RETURN
AMONG WAL-MART STORES, INC.
S&P 500 INDEX AND S&P 500 RETAILING INDEX
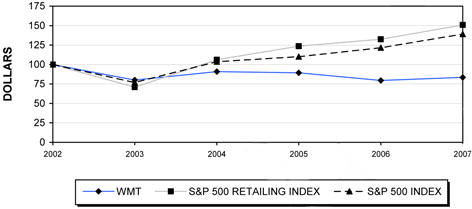
ASSUMES $100 INVESTED ON FEB. 1, 2002
ASSUMES DIVIDEND REINVESTED
FISCAL YEAR ENDING JAN. 31, 2007
Shareholders
As of March 16, 2007, there were 312,423 holders of record of Wal-Mart’s common stock.
Certifications
The Company’s Chief Executive Officer and Chief Financial Officer have filed their certifications as required by the Securities and Exchange Commission (the “SEC”) regarding the quality of the Company’s public disclosure for each of the periods ended during the Company’s fiscal year ended January 31, 2007 and the effectiveness of internal control over financial reporting as of January 31, 2007 and 2006. Further the Company’s Chief Executive Officer has certified to the New York Stock Exchange (“NYSE”) that he is not aware of any violation by the Company of the NYSE corporate governance listing standards, as required by Section 303A.12(a) of the NYSE listing standards.
52