SECURITIES AND EXCHANGE COMMISSION
Washington, D.C. 20549
FORM 6-K
Report of Foreign Private Issuer
Pursuant to Rule 13a-16 or 15d-16 of the
Securities Exchange Act of 1934
For the month of September, 2016
Commission File Number 1-14668
COMPANHIA PARANAENSE DE ENERGIA
(Exact name of registrant as specified in its charter)
Energy Company of Paraná
(Translation of Registrant's name into English)
Rua Coronel Dulcídio, 800
80420-170 Curitiba, Paraná
Federative Republic of Brazil
(5541) 3222-2027
(Address of principal executive offices)
Indicate by check mark whether the registrant files or will file annual reports under cover Form 20-F or Form 40-F. Form 20-F ___X___ Form 40-F _______
Indicate by check mark whether the registrant by furnishing the information contained in this Form is also thereby furnishing the information to the Commission pursuant to Rule 12g3-2(b) under the Securities Exchange Act of 1934.
Yes _______ No ___X____

Companhia Paranaense de Energia
Corporate Taxpayer’s ID (CNPJ/MF) 76.483.817/0001-20
State Registration 10146326-50
Publicly-Held Company - CVM 1431-1
www.copel.com copel@copel.com
Rua Coronel Dulcídio, 800, Batel - Curitiba - PR
CEP 80420-170
QUARTERLY INFORMATION
ITR
June / 2016
CONTENTSFINANCIAL STATEMENTS | 3 |
NOTES TO THE FINANCIAL STATEMENTS | 13 |
| 1 | Operations | 13 |
| 2 | Concessions and Authorizations | 15 |
| 3 | Basis of Preparation | 17 |
| 4 | Significant Accounting Policies | 19 |
| 5 | Cash and Cash Equivalents | 19 |
| 6 | Bonds and Securities | 19 |
| 7 | Customers | 20 |
| 8 | CRC Transferred to the State of Paraná | 22 |
| 9 | Sectorial Financial Assets and Liabilities | 23 |
| 10 | Accounts Receivable Related to the Concession | 26 |
| 11 | Accounts Receivable related to the Concession Compensation | 28 |
| 12 | Other Current Receivables | 28 |
| 13 | Taxes | 29 |
| 14 | Prepaid Expenses | 33 |
| 15 | Related Parties | 33 |
| 16 | Judicial Deposits | 35 |
| 17 | Investments | 35 |
| 18 | Property, plant and equipment | 39 |
| 19 | Intangible assets | 42 |
| 20 | Social and Labor Liabilities | 43 |
| 21 | Suppliers | 43 |
| 22 | Loans and financing | 45 |
| 23 | Debentures | 50 |
| 24 | Post-employment benefits | 51 |
| 25 | Consumer Charges Due | 53 |
| 26 | Research and Development and Energy Efficiency | 54 |
| 27 | Accounts Payable Related to Concession | 54 |
| 28 | Other Accounts Payable | 56 |
| 29 | Provision for Litigation and Contingent Liabilities | 56 |
| 30 | Shareholders’ equity | 65 |
| 31 | Net Operating Revenues | 66 |
| 32 | Operating Costs and Expenses | 71 |
| 33 | Financial income | 77 |
| 34 | Operating segments | 78 |
| 35 | Financial Instruments | 82 |
| 36 | Related Party Transactions | 92 |
| 37 | Insurance | 96 |
| 38 | Subsequent Events | 97 |
COMMENTS ON PERFORMANCE | 98 |
COMPOSITION OF GROUPS RESPONSIBLE FOR GOVERNANCE | 106 |
REVIEW REPORT ON QUARTERLY INFORMATION | 106 |
FINANCIAL STATEMENTS
Statement of Financial Position
as of June 30, 2016 and December 31, 2015
in thousands of Reais
| | | | | | |
| ASSETS | Note | | Parent Company | | Consolidated |
| | | 06.30.2016 | 12.31.2015 | 06.30.2016 | 12.31.2015 |
| | | | | |
| CURRENT ASSETS | | | | | |
| Cash and cash equivalents | 5 | 9,874 | 25,653 | 828,317 | 1,480,727 |
| Bonds and securities | 6 | 177 | 168 | 392,484 | 406,274 |
| Collaterals and escrow accounts | | 127 | 132 | 322 | 2,000 |
| Trade accounts receivable | 7 | - | - | 2,543,217 | 3,032,827 |
| Dividends receivable | | 796,371 | 488,187 | 27,926 | 40,345 |
| CRC transferred to the State Government of Paraná | 8 | - | 111,663 | - | 111,663 |
| Sectorial financial assets | 9 | - | - | - | 910,759 |
| Accounts receivable related to the concession | 10 | - | - | 22,174 | 9,162 |
| Accounts receivable related to the concession compensation | 11 | - | - | - | - |
| Other current receivables | 12 | 12,187 | 13,018 | 330,203 | 474,889 |
| Inventories | | - | - | 142,384 | 131,018 |
| Income Tax and Social Contribution | 13.1 | 46,293 | 154,077 | 67,128 | 194,244 |
| Other current recoverable taxes | 13.3 | 111 | - | 77,256 | 70,725 |
| Prepaid expenses | 14 | - | - | 40,418 | 49,282 |
| Receivable from Related parties | 15 | 25,293 | 447 | 40,575 | 19,482 |
| | | 890,433 | 793,345 | 4,512,404 | 6,933,397 |
| | | | | |
| NONCURRENT ASSETS | | | | | |
| Long Term Assets | | | | | |
| Bonds and securities | 6 | - | - | 178,596 | 91,117 |
| Collaterals and escrow accounts | 22.1 | - | - | 76,362 | 86,137 |
| Trade accounts receivable | 7 | - | - | 75,049 | 75,062 |
| CRC transferred to the State Government of Paraná | 8 | 1,454,304 | 1,271,579 | 1,454,304 | 1,271,579 |
| Judicial deposits | 16 | 86,658 | 267,411 | 610,904 | 719,927 |
| Sectorial financial assets | 9 | - | - | - | 134,903 |
| Accounts receivable related to the concession | 10 | - | - | 3,617,100 | 1,358,451 |
| Accounts receivable related to the concession compensation | 11 | - | - | 59,339 | 219,556 |
| Other noncurrent receivables | 12 | - | - | 47,282 | 31,614 |
| Income Tax and Social Contribution | 13.1 | 144,844 | 79,144 | 160,985 | 94,686 |
| Deferred Income Tax and Social Contribution | 13.2 | 34,491 | 100,919 | 847,484 | 537,562 |
| Other noncurrent recoverable taxes | 13.3 | 14 | 15 | 120,505 | 112,902 |
| Prepaid expenses | 14 | - | - | 22,101 | 25,493 |
| Receivable from Related parties | 15 | 259,990 | 297,237 | 167,566 | 192,803 |
| | | 1,980,301 | 2,016,305 | 7,437,577 | 4,951,792 |
| | | | | | |
| Investments | 17 | 14,677,798 | 14,140,573 | 2,592,484 | 2,224,710 |
| Property, Plant and Equipment, net | 18 | 499 | 455 | 8,941,072 | 8,692,682 |
| Intangible Assets | 19 | 3,163 | 3,046 | 6,286,683 | 6,145,076 |
| | | | | | |
| | | 16,661,761 | 16,160,379 | 25,257,816 | 22,014,260 |
| | | | | | |
| TOTAL ASSETS | | 17,552,194 | 16,953,724 | 29,770,220 | 28,947,657 |
| |
| Notes are an integral part of this quarterly information. |
Statement of Financial Position
as of June 30, 2016 and December 31, 2015 (continued)
in thousands of Reais
| | | | | | |
| LIABILITIES | Note | | Parent Company | | Consolidated |
| | | 06.30.2016 | 12.31.2015 | 06.30.2016 | 12.31.2015 |
| | | | | | |
| CURRENT LIABILITIES | | | | | |
| Payroll, social charges and accruals | 20 | 4,814 | 15,436 | 222,667 | 258,401 |
| Suppliers | 21 | 7,333 | 2,602 | 1,229,617 | 1,613,126 |
| Income Tax and Social Contribution Payable | 13.1 | - | - | 161,919 | 311,916 |
| Other taxes due | 13.3 | 2,661 | 32,617 | 215,831 | 340,948 |
| Loans and financing | 22 | 137,202 | 61,788 | 464,480 | 308,558 |
| Debentures | 23 | 351,344 | 19,497 | 1,180,279 | 924,005 |
| Dividend payable | | 3,319 | 310,020 | 24,834 | 346,007 |
| Post-employment benefits | 24 | 161 | 21 | 43,467 | 43,323 |
| Customer charges due | 25 | - | - | 144,290 | 277,458 |
| Research and Development and Energy Efficiency | 26 | - | - | 157,070 | 167,881 |
| Accounts payable related to concession | 27 | - | - | 276,707 | 61,786 |
| Sectorial financial liabilities | 9 | - | - | 209,705 | - |
| Other accounts payable | 28 | 211 | 232 | 125,091 | 135,709 |
| | | 507,045 | 442,213 | 4,455,957 | 4,789,118 |
| | | | | | |
| NONCURRENT LIABILITIES | | | | | |
| Suppliers | 21 | - | - | 5,923 | 5,923 |
| Deferred Income Tax and Social Contribution | 13.2 | - | - | 286,031 | 214 |
| Other taxes due | 13.3 | 1,609 | 1,466 | 244,119 | 257,273 |
| Loans and financing | 22 | 883,560 | 969,412 | 3,599,078 | 3,768,502 |
| Debentures | 23 | 665,503 | 996,590 | 2,431,996 | 2,759,923 |
| Post-employment benefits | 24 | 11,659 | 7,795 | 594,430 | 551,337 |
| Research and Development and Energy Efficiency | 26 | - | - | 279,774 | 231,112 |
| Accounts payable related to concession | 27 | - | - | 500,922 | 473,879 |
| Sectorial financial liabilities | 9 | - | - | 215,235 | - |
| Other accounts payable | 28 | 34 | - | 34,518 | 30,962 |
| Provisions for legal claims | 29 | 111,334 | 290,520 | 1,438,249 | 1,494,936 |
| | | 1,673,699 | 2,265,783 | 9,630,275 | 9,574,061 |
| EQUITY | | | | | |
| Attributable to controlling shareholder's | | | | | |
| Capital | 30.1.1 | 6,910,000 | 6,910,000 | 6,910,000 | 6,910,000 |
| Equity valuation adjustments | 30.1.2 | 1,081,618 | 1,177,372 | 1,081,618 | 1,177,372 |
| Legal reserve | | 744,784 | 744,784 | 744,784 | 744,784 |
| Profit retention reserve | | 5,413,572 | 5,413,572 | 5,413,572 | 5,413,572 |
| Accumulated Profit | | 1,221,476 | - | 1,221,476 | - |
| | | 15,371,450 | 14,245,728 | 15,371,450 | 14,245,728 |
| | | | | | |
| Attributable to non-controlling interest | 30.2 | - | - | 312,538 | 338,750 |
| | | | | | |
| | | 15,371,450 | 14,245,728 | 15,683,988 | 14,584,478 |
| | | | | | |
| TOTAL LIABILITIES & EQUITY | | 17,552,194 | 16,953,724 | 29,770,220 | 28,947,657 |
| |
| Notes are an integral part of this quarterly information. |
Statement of Income
for the six-month periods ended June 30, 2016 and 2015
in thousands of Reais
| | | | | | |
| | Note | Parent Company | | Consolidated |
| | | 06.30.2016 | 06.30.2015 | 06.30.2016 | 06.30.2015 |
| | | | | | |
| NET OPERATING REVENUES | 31 | - | - | 6,768,194 | 8,145,940 |
| | | | | | |
| OPERATING COSTS | 32 | - | - | (4,701,403) | (6,394,084) |
| | | | | | |
| GROSS PROFIT | | - | - | 2,066,791 | 1,751,856 |
| | | | | | |
| Operational expenses / income | | | | | |
| Selling expenses | 32 | - | - | (121,587) | (186,005) |
| General and administrative expenses | 32 | (48,783) | (49,057) | (312,596) | (283,687) |
| Other operational income (expenses) | 32 | 179,025 | (22,469) | (19,572) | (370,968) |
| Equity in earnings of investees | 17 | 982,408 | 767,946 | 104,709 | 91,809 |
| | | 1,112,650 | 696,420 | (349,046) | (748,851) |
| | | | | | |
| PROFIT BEFORE FINANCIAL RESULTS AND TAXES | | 1,112,650 | 696,420 | 1,717,745 | 1,003,005 |
| | | | | | |
| Financial results | 33 | | | | |
| Financial income | | 238,361 | 111,008 | 660,189 | 528,511 |
| Financial expenses | | (144,812) | (123,992) | (690,302) | (366,997) |
| | | 93,549 | (12,984) | (30,113) | 161,514 |
| | | | | | |
| OPERATING PROFIT BEFORE INCOME TAX AND | | | | | |
| SOCIAL CONTRIBUTION | | 1,206,199 | 683,436 | 1,687,632 | 1,164,519 |
| | | | | | |
| INCOME TAX AND SOCIAL CONTRIBUTION | 13.4 | | | | |
| Current | | (13,364) | (217) | (579,128) | (470,374) |
| Deferred | | (66,370) | 26,088 | 24,163 | 77,861 |
| | | (79,734) | 25,871 | (554,965) | (392,513) |
| | | | | | |
| NET INCOME | | 1,126,465 | 709,307 | 1,132,667 | 772,006 |
| Attributed to controlling shareholders | | - | - | 1,126,465 | 709,307 |
| Attributed to non-controlling interest | 30.2 | - | - | 6,202 | 62,699 |
| | | | | | |
| BASIC AND DILUTED NET EARNING PER SHARE ATTRIBUTED | | | | | |
| TO PARENT COMPANY SHAREHOLDERS - IN REAIS | | | | | |
| Ordinary shares | 30.1.3 | 3.93157 | 2.47561 | 3.93157 | 2.47561 |
| Class "A" Preferred shares | 30.1.3 | 4.32473 | 2.72423 | 4.32473 | 2.72423 |
| Class "B" Preferred shares | 30.1.3 | 4.32473 | 2.72318 | 4.32473 | 2.72318 |
| |
| Notes are an integral part of this quarterly information. |
Statement of Income - Second quarter changes
for the quarters ended June 30, 2016 and 2015
in thousands of Reais
| | | | | | |
| | Note | | Parent Company | | Consolidated |
| | | 04.01.2016 | 04.01.2015 | 04.01.2016 | 04.01.2015 |
| | | to 06.30.2016 | to 06.30.2015 | to 06.30.2016 | to 06.30.2015 |
| | | | | | |
| OPERATING REVENUES | 31 | - | - | 3,694,556 | 3,908,838 |
| COST OF SALES AND SERVICES PROVIDED | 32 | - | - | (2,231,913) | (3,244,007) |
| GROSS PROFIT | | - | - | 1,462,643 | 664,831 |
| | | | | | |
| Operational expenses / income | | | | | |
| Selling expenses | 32 | - | - | (73,894) | (82,893) |
| General and administrative expenses | 32 | (25,121) | (25,380) | (161,177) | (143,867) |
| Other operational income (expenses) | 32 | 190,699 | (4,178) | 84,049 | (156,166) |
| Equity in earnings of investees | 17 | 820,042 | 304,726 | 56,815 | 45,447 |
| | | 985,620 | 275,168 | (94,207) | (337,479) |
| | | | | | |
| PROFIT BEFORE FINANCIAL RESULTS AND TAXES | | 985,620 | 275,168 | 1,368,436 | 327,352 |
| | | | | | |
| Financial results | 33 | | | | |
| Financial income | | 173,234 | 54,850 | 446,220 | 308,635 |
| Financial expenses | | (71,301) | (65,504) | (318,472) | (188,006) |
| | | 101,933 | (10,654) | 127,748 | 120,629 |
| | | | | | |
| PROFIT BEFORE INCOME TAX AND SOCIAL CONTRIBUTION | | 1,087,553 | 264,514 | 1,496,184 | 447,981 |
| | | | | | |
| INCOME TAX AND SOCIAL CONTRIBUTION ON PROFIT | 13.4 | | | | |
| Current | | (13,364) | - | (225,977) | (161,814) |
| Deferred | | (81,230) | 10,825 | (273,629) | 15,848 |
| | | (94,594) | 10,825 | (499,606) | (145,966) |
| | | | | | |
| NET INCOME | | 992,959 | 275,339 | 996,578 | 302,015 |
| Attributed to controlling shareholders | | - | - | 992,959 | 275,339 |
| Attributed to non-controlling interest | 30.2 | - | - | 3,619 | 26,676 |
| | | | | | |
| BASIC AND DILUTED NET EARNING PER SHARE ATTRIBUTED | | | | | |
| TO PARENT COMPANY SHAREHOLDERS - IN REAIS | | | | | |
| Ordinary shares | 30.1.3 | 3.46561 | 0.96098 | 3.46561 | 0.96098 |
| Class "A" Preferred shares | 30.1.3 | 3.81217 | 1.05709 | 3.81217 | 1.05709 |
| Class "B" Preferred shares | 30.1.3 | 3.81217 | 1.05709 | 3.81217 | 1.05709 |
Statements of Comprehensive Income
for the six-month periods ended June 30, 2016 and 2015
in thousands of Reais
| | | | | | |
| | Note | Parent Company | Consolidated |
| | | 06.30.2016 | 06.30.2015 | 06.30.2016 | 06.30.2015 |
| | | | | | |
| NET INCOME | | 1,126,465 | 709,307 | 1,132,667 | 772,006 |
| Other comprehensive income | | | | | |
| Items that will never be reclassified to profit or loss | | | | | |
| Losses on actuarial liabilities | | | | | |
| Post employment benefits - equity | 30.1.2 | (854) | - | (854) | - |
| Items that are or maybe reclassified to profit or loss | | | | | |
| Adjustments related to financial assets classified as available for sale | 30.1.2 | 169 | 459 | 169 | 675 |
| Taxes on other comprehensive income | 30.1.2 | (58) | (15) | (58) | (231) |
| Total comprehensive income, net of taxes | | (743) | 444 | (743) | 444 |
| TOTAL COMPREHENSIVE INCOME | | 1,125,722 | 709,751 | 1,131,924 | 772,450 |
| Attributed to controlling shareholders | | | | 1,125,722 | 709,751 |
| Attributed to non-controlling interest | | | | 6,202 | 62,699 |
| |
| Notes are an integral part of this quarterly information. |
Statement of Comprehensive Income - Second quarter changes
for the quarters ended June 30, 2016 and 2015
in thousands of Reais
| | | | | |
| | Parent Company | | Consolidated |
| | 04.01.2016 | 04.01.2015 | 04.01.2016 | 04.01.2015 |
| | to 06.30.2016 | to 06.30.2015 | to 06.30.2016 | to 06.30.2015 |
| | | | | |
| NET INCOME | 992,959 | 275,339 | 996,578 | 302,015 |
| Other comprehensive income | | | | |
| Items that are or maybe reclassified to profit or loss | | | | |
| Adjustments related to financial assets classified as available for sale | 498 | (251) | 498 | (155) |
| Taxes on other comprehensive income | (170) | 148 | (170) | 52 |
| Total comprehensive income, net of taxes | 328 | (103) | 328 | (103) |
| TOTAL COMPREHENSIVE INCOME | 993,287 | 275,236 | 996,906 | 301,912 |
| Attributed to controlling shareholders | - | - | 993,287 | 275,236 |
| Attributed to non-controlling interest | - | - | 3,619 | 26,676 |
Statement of Changes in Equity
for the six-month periods ended June 30, 2016 and 2015
in thousands of Reais
| | Note | Attributable to Parent Company | Shareholders’
equity | Attributable
to
non -
controlling
interests |
Equity
Consolidated |
| Capital | Equity valuation
adjustments | Profit reserves |
| | Legal
reserve | Profit
retention
reserve | Accumulated
profit |
| | Deemed
cost | Other
comprehensive
income |
| |
| Balance as of January 1, 2016 | | 6,910,000 | 1,046,663 | 130,709 | 744,784 | 5,413,572 | - | 14,245,728 | 338,750 | 14,584,478 |
| Net Income | | - | - | - | - | - | 1,126,465 | 1,126,465 | 6,202 | 1,132,667 |
| Other comprehensive income | | | | | | | | | | |
| Gain on financial assets, net of taxes | 30.1.2 | - | - | 111 | - | - | - | 111 | - | 111 |
| Actuarial losses, net of taxes | 30.1.2 | - | - | (854) | - | - | - | (854) | - | (854) |
| Total comprehensive income | | - | - | (743) | - | - | 1,126,465 | 1,125,722 | 6,202 | 1,131,924 |
| Realization - deemed cost, net of taxes | 30.1.2 | - | (95,011) | - | - | - | 95,011 | - | - | - |
| Deliberation of additional dividends proposed | 30.2 | - | - | - | - | - | - | - | (23,072) | (23,072) |
| Distribution of dividends with retained earnings | 30.2 | - | - | - | - | - | - | - | (9,342) | (9,342) |
| Balance as of June 30, 2016 | | 6,910,000 | 951,652 | 129,966 | 744,784 | 5,413,572 | 1,221,476 | 15,371,450 | 312,538 | 15,683,988 |
| Notes are an integral part of this quarterly information. |
| | Attributable to Parent Company | Shareholders’
equity | Attributable
to
non -
controlling
interests |
Equity
Consolidated
|
| | Capital | Equity valuation
adjustments | Profit reserves |
| | Legal
reserve | Profit
retention
reserve | Additional
proposed
dividends | Accumulated
profit |
| | Cost
assigned | Other
comprehensive
income |
| |
| Balance as of January 1, 2015 | 6,910,000 | 1,137,104 | (160,140) | 685,147 | 4,516,825 | 241,753 | - | 13,330,689 | 352,091 | 13,682,780 |
| Net Income | - | - | - | - | - | - | 709,307 | 709,307 | 62,699 | 772,006 |
| Other comprehensive income | | | | | | | | | | |
| Gain on financial assets, net of taxes | - | - | 444 | - | - | - | - | 444 | - | 444 |
| Total comprehensive income | - | - | 444 | - | - | - | 709,307 | 709,751 | 62,699 | 772,450 |
| Realization - deemed cost, net of taxes | - | (51,751) | - | - | - | - | 51,751 | - | - | - |
| Deliberation of additional dividends proposed | - | - | - | - | - | (241,753) | - | (241,753) | (8,733) | (250,486) |
| Distribution of dividends with retained earnings | - | - | - | - | - | - | - | - | (48,601) | (48,601) |
| Balance as of June 30, 2015 | 6,910,000 | 1,085,353 | (159,696) 685,147 | 4,516,825 | - | 761,058 | 13,798,687 | 357,456 | 14,156,143 |
| Notes are an integral part of this quarterly information. |
Statements of Cash Flow
for the six-month periods ended June 30, 2016 and 2015
in thousands of Reais
| | Note | Parent Company | Consolidated |
| | 06.30.2016 | 06.30.2015 | 06.30.2016 | 06.30.2015 |
| | | | | | |
| CASH FLOWS FROM OPERATIONAL ACTIVITIES | | | | | |
| Net income for the period | | 1,126,465 | 709,307 | 1,132,667 | 772,006 |
| | | | | | |
| Adjustments to reconcile net income for the period with cash generated from | | | | | |
| operating activities | | | | | |
| Unrealized monetary and exchange variations - net | | 22,225 | 24,518 | 281,466 | 47,724 |
| Sectorial financial assets and liabilities result | 9.3 | - | - | 1,254,487 | (585,966) |
| Result of the remeasurement of the cash flow of the assets RBSE | 10.1 | - | - | (977,777) | - |
| Remuneration of accounts receivable related to concession | 10.1 | - | - | (69,530) | (52,115) |
| Income tax and social contribution | 13.4 | 13,364 | 217 | 579,128 | 470,374 |
| Deferred income tax and social contribution | 13.4 | 66,370 | (26,088) | (24,163) | (77,861) |
| Result of renegotiation of hydrological risk | | - | - | (7,486) | - |
| Equity in earnings of subsidiaries | 17.1 | (982,408) | (767,946) | (104,709) | (91,809) |
| Appropriation of acturial calculation of post-employment benefits | 24.4 | 4,100 | 772 | 64,424 | 71,184 |
| Appropriation of pension and healthcare contributions | 24.4 | 1,379 | 3,219 | 66,957 | 63,542 |
| Creation for research and development programs and energy efficiency | 26.2 | - | - | 48,507 | 69,313 |
| Depreciation and amortization | | 577 | - | 352,747 | 325,110 |
| Net operational provisions and reversals | 32.4 | (179,147) | 18,949 | 56,816 | 403,692 |
| Impairment of accounts receivable related to concession | 10.1 | - | - | 52 | 13,407 |
| Loss on disposal of property, plant and equipment | | - | - | 22,239 | 12,481 |
| Loss on disposal of intangible assets | 19.1 | - | - | 19,964 | 16,339 |
| | | 72,925 | (37,052) | 2,695,789 | 1,457,421 |
| | | | | | |
| Decrease (increase) in assets | | | | | |
| Trade accounts receivable | | - | - | 467,314 | (631,073) |
| Dividends and interest on own capital received | 8.1 | 742,816 | 1,318,579 | 38,361 | 36,684 |
| CRC transferred to the Government of the State of Paraná | | 49,425 | 89,295 | 49,425 | 89,295 |
| Judicial deposits | 9.3 | 180,753 | (369) | 109,023 | 33,430 |
| Accounts receivable related to the concession extension | | - | - | - | 142,418 |
| Other receivables | | 831 | (523) | 109,437 | (95,101) |
| Inventories | | - | - | (11,366) | 15,910 |
| Income tax and social contribution | | 42,084 | (2,967) | 60,817 | (9,836) |
| Other current taxes recoverable | | (110) | (14) | (6,413) | 36,380 |
| Prepaid expenses | | - | 34 | 12,256 | 3,417 |
| Related Parties | | (3,753) | (18,999) | - | (16,163) |
| | | | | | |
| Increase (decrease) in liabilities | | | | | |
| Payroll, social charges and accruals | | (10,622) | 333 | (35,734) | (56,819) |
| Suppliers | | 4,731 | 1,722 | (559,312) | 96,674 |
| Other taxes | | (29,813) | (4,356) | (138,271) | 232,182 |
| Post-employment benefits | 24.4 | (1,475) | (3,212) | (88,144) | (81,995) |
| Customer charges due | | - | - | (133,168) | 194,773 |
| Research and development and energy efficiency | 26.2 | - | - | (30,630) | (41,180) |
| Payable related to the concession | 27.3 | - | - | (403,476) | (27,415) |
| Other accounts payable | | 13 | 4,057 | (7,062) | 84,508 |
| Provisions for legal claims | 29.1.1 | (39) | - | (29,469) | (100,158) |
| | | | | | |
| CASH GENERATED BY OPERATING ACTIVITIES | | 1,047,766 | 1,346,528 | 2,322,877 | 1,363,352 |
| | | | | | |
| Income tax and social contribution paid | | (13,364) | (2,659) | (729,125) | (458,140) |
| Loans and financing - interest due and paid | 22.4 | (65,998) | (52,028) | (172,767) | (207,108) |
| Debentures - interest due and paid | 23.2 | (75,350) | (63,479) | (337,524) | (182,674) |
| | | | | | |
| NET CASH GENERATED IN OPERATING ACTIVITIES | | 893,054 | 1,228,362 | 1,083,461 | 515,430 |
| | | | | | |
| (continued) | | | | | |
Statements of Cash Flow
for the six-month periods ended June 30, 2016 and 2015 (continued)
in thousands of Reais
| | Note | Parent Company | Consolidated |
| | 06.30.2016 | 06.30.2015 | 06.30.2016 | 06.30.2015 |
| | | | | | |
| CASH FLOWS FROM INVESTMENT ACTIVITIES | | | | | |
| Financial investments | | (4) | (7) | (62,237) | 43,311 |
| Loans and financing granted to third parties | | - | (29,400) | - | (29,400) |
| Receipt of loans and financing granted to third parties | | 5,112 | - | 5,112 | - |
| Additions in investments | 17.1 | (607,063) | (972,215) | (289,875) | (149,691) |
| Additions to property, plant and equipment | | (60) | (41) | (603,887) | (522,185) |
| Customers contributions - property, plant and equipment | | - | - | 40 | - |
| Additions to intangible assets | 19.1 | (117) | (157) | (411,744) | (505,032) |
| Customers contributions - intangible assets | 19.1 | - | - | 54,682 | 118,071 |
| | | | | | |
| NET CASH USED IN INVESTING ACTIVITIES | | (602,132) | (1,001,820) | (1,307,909) | (1,044,926) |
| | | | | | |
| CASH FLOWS FROM FINANCING ACTIVITIES | | | | | |
| Loans and financing obtained from third parties | | - | - | 24,854 | 465,095 |
| Issue of Debentures | 23.2 | - | - | 23,532 | 1,008,633 |
| Amortization of principal - loans and financing | 22.4 | - | - | (93,089) | (501,404) |
| Amortization of principal - debentures | 23.2 | - | - | (29,672) | (20,304) |
| Dividends and interest on own capital paid | | (306,701) | (241,441) | (353,587) | (294,850) |
| | | | | | |
| NET CASH GENERATED FROM (USED IN) FINANCING ACTIVITIES | | (306,701) | (241,441) | (427,962) | 657,170 |
| | | | | | |
| TOTAL EFFECTS ON CASH AND CASH EQUIVALENTS | | (15,779) | (14,899) | (652,410) | 127,674 |
| | | | | | |
| Cash and cash equivalents at the beginning of the period | 5 | 25,653 | 34,862 | 1,480,727 | 740,131 |
| Cash and cash equivalents at the end of the period | 5 | 9,874 | 19,963 | 828,317 | 867,805 |
| | | | | | |
| CHANGE IN CASH AND CASH EQUIVALENTS | | (15,779) | (14,899) | (652,410) | 127,674 |
| |
| Notes are an integral part of this quarterly information. |
Statements of Value Added
for the six-month periods ended June 30, 2016 and 2015
in thousands of Reais
| VALUE ADDED TO DISTRIBUTE | Parent Company | Consolidated |
| | 06.30.2016 | 06.30.2015 | 06.30.2016 | 06.30.2015 |
| | | | | |
| Income | | | | |
| Sale of energy, services and other income | - | - | 11,875,616 | 10,840,250 |
| Construction income | - | - | 838,509 | 796,959 |
| Sectorial financial assets and liabilities result | - | - | (1,254,487) | 1,039,021 |
| Other income | - | - | 4,007 | 4,596 |
| Allowance for doubtful debts | - | - | (93,886) | (158,565) |
| | - | - | 11,369,759 | 12,522,261 |
| | | | | |
| ( - ) Supplies acquired from third parties | | | | |
| Energy purchased for resale | - | - | 2,469,654 | 3,854,712 |
| Charges for use of the main transmission grid ( - ) ESS and ER | - | - | 344,978 | 352,179 |
| Materials, supplies and third parties services | 8,129 | 5,498 | 331,372 | 408,108 |
| Natural gas and supplies for gas operations | - | - | 145,873 | 552,017 |
| Construction costs | - | - | 735,625 | 692,013 |
| Loss / Recovery of assets | - | 194 | 28,388 | 47,666 |
| Other supplies | (160,452) | 27,619 | 50,322 | 281,918 |
| | (152,323) | 33,311 | 4,106,212 | 6,188,613 |
| | | | | |
| ( = ) GROSS ADDED VALUE | 152,323 | (33,311) | 7,263,547 | 6,333,648 |
| | | | | |
| ( - ) Depreciation and amortization | 577 | 2,164 | 352,747 | 325,110 |
| | | | | |
| ( = ) NET ADDED VALUE | 151,746 | (35,475) | 6,910,800 | 6,008,538 |
| | | | | |
| ( + ) Transferred added value | | | | |
| Financial income | 238,361 | 111,008 | 660,189 | 528,511 |
| Results from investment interests | 982,846 | 769,262 | 105,148 | 93,125 |
| Other Income | - | - | 49,388 | 42,728 |
| | 1,221,207 | 880,270 | 814,725 | 664,364 |
| | | | | |
| | 1,372,953 | 844,795 | 7,725,525 | 6,672,902 |
| (continued) | | | | |
Statements of Value Added
for the six-month periods ended June 30, 2016 and 2015 (continued)
in thousands of Reais
| | | | | | | | |
| DISTRIBUTION OF ADDED VALUE | Parent Company | Consolidated |
| | 06.30.2016 | % | 06.30.2015 | % | 06.30.2016 | % | 06.30.2015 | % |
| | | | | | | | | |
| Personnel | | | | | | | | |
| Remuneration and fees | 11,252 | | 21,961 | | 411,547 | | 368,053 | |
| Private pension and health plans | 5,405 | | 3,991 | | 136,266 | | 134,726 | |
| Meal and education assistance | 651 | | 1,730 | | 56,692 | | 50,503 | |
| Social security charges - FGTS | 912 | | 1,750 | | 32,872 | | 29,539 | |
| Labor indemnities (reversals) | 22 | | 14 | | 8,164 | | 3,897 | |
| Profit sharing | 257 | | 1,254 | | 23,001 | | 20,080 | |
| Transfers to property, plant and equipment in progres | - | | (31) | | (24,138) | | (29,356) | |
| | 18,499 | 1.3 | 30,669 | 3.6 | 644,404 | 8.3 | 577,442 | 8.7 |
| | | | | | | | | |
| Government | | | | | | | | |
| Federal | | | | | | | | |
| Tax | 83,731 | | (18,958) | | 1,430,500 | | 1,243,764 | |
| Sectorial charges | - | | - | | 1,407,563 | | 1,534,381 | |
| State | 1 | | - | | 2,390,399 | | 2,085,688 | |
| Municipal | 78 | | 29 | | 4,298 | | 5,530 | |
| | 83,810 | 6.1 | (18,929) | (2.2) | 5,232,760 | 67.7 | 4,869,363 | 73.0 |
| | | | | | | | | |
| Third Parties | | | | | | | | |
| Interest | 143,706 | | 123,025 | | 696,371 | | 435,249 | |
| Leasing and rent | 473 | | 723 | | 16,839 | | 15,479 | |
| Donations, subsidies and contributions | - | | - | | 2,484 | | 3,363 | |
| | 144,179 | 10.5 | 123,748 | 14.6 | 715,694 | 9.3 | 454,091 | 6.8 |
| | | | | | | | | |
| Shareholders | | | | | | | | |
| Non controlling interests | - | | - | | 6,202 | | 62,699 | |
| Retained profits | 1,126,465 | | 709,307 | | 1,126,465 | | 709,307 | |
| | 1,126,465 | 82.1 | 709,307 | 84.0 | 1,132,667 | 14.7 | 772,006 | 11.5 |
| | | | | | | | | |
| | 1,372,953 | 100.0 | 844,795 | 100.0 | 7,725,525 | 100.0 | 6,672,902 | 100.0 |
| |
| Notes are an integral part of this quarterly information. |
NOTES TO THE FINANCIAL STATEMENTS
for the six-month period ended June 30, 2016
in thousands of Reais
1 Operations
Companhia Paranaense de Energia (Copel, Company or Parent Company), with its principal place of business at Rua Coronel Dulcídio, 800, Curitiba - PR, a publicly-held mixed capital company controlled by the State of Paraná, whose shares are traded on Corporate Governance Level 1 of the Special Segments Listing of the BM&FBOVESPA - Securities, Commodities and Futures Exchange, on the New York Stock Exchange (NYSE) and on the Madrid Stock Exchange in the Latin American segment (Latibex).
The core activities of Copel and its subsidiaries, regulated by the Brazilian Electricity Regulatory Agency (Aneel), linked to the Ministry of Mines and Energy (MME), is to research, study, plan, build and explore the production, transformation, distribution and commercialization of energy in any of its forms, primarily electricity. Furthermore, Copel participates in consortiums and in private sector and mixed-capital companies for the purpose of engaging in activities, primarily in the fields of energy, telecommunications, natural gas and basic sanitation.
1.1 Copel’s Equity Interests
Copel has direct and indirect interests in subsidiaries (1.1.1), joint ventures (1.1.2), associanted companies (1.1.3) and joint operations (1.1.4).
1.1.1 Subsidiaries
| | | | |
| | | | |
| | Headquarters | Main activity | Interest |
| Subsidiaries | | | % | Investor |
| Copel Geração e Transmissão S.A. (Copel GeT) | Curitiba/PR | Production and transmission of electricity | 100.0 | Copel |
| Copel Distribuição S.A. | Curitiba/PR | Distribution and marketing of electricity | 100.0 | Copel |
| Copel Telecomunicações S.A. | Curitiba/PR | Telecommunication and communication | 100.0 | Copel |
| Copel Renováveis S.A. (Copel REN) | Curitiba/PR | Control and management of interests | 100.0 | Copel |
| Copel Comercialização S.A.(Copel COM) | Curitiba/PR | Commercialization of electricity | 100.0 | Copel |
| Companhia Paranaense de Gás - Compagás | Curitiba/PR | Distribution of pipeline gas | 51.0 | Copel |
| Elejor - Centrais Elétricas do Rio Jordão S.A. | Curitiba/PR | Production of electricity | 70.0 | Copel |
| UEG Araucária Ltda. | Curitiba/PR | Production of electricity from natural gas | 20.0 | Copel |
| | | | 60.0 | Copel GeT |
| São Bento Energia, Investimentos e Participações S.A. (São Bento) | Curitiba/PR | Control and management of interests | 100.0 | Copel GeT |
| Nova Asa Branca I Energias Renováveis S.A. | S. Miguel do Gostoso/RN | Production of electricity from w ind sources | 100.0 | Copel GeT |
| Nova Asa Branca II Energias Renováveis S.A. | Parazinho/RN | Production of electricity from w ind sources | 100.0 | Copel GeT |
| Nova Asa Branca III Energias Renováveis S.A. | Parazinho/RN | Production of electricity from w ind sources | 100.0 | Copel GeT |
| Nova Eurus IV Energias Renováveis S.A. | Touros/RN | Production of electricity from w ind sources | 100.0 | Copel GeT |
| Santa Maria Energias Renováveis S.A. | Maracanaú/CE | Production of electricity from w ind sources | 100.0 | Copel GeT |
| Santa Helena Energias Renováveis S.A. | Maracanaú/CE | Production of electricity from w ind sources | 100.0 | Copel GeT |
| Ventos de Santo Uriel S.A. | João Câmara/RN | Production of electricity from w ind sources | 100.0 | Copel GeT |
| Cutia Empreendimentos Eólicos S.A. (Cutia) | Curitiba/PR | Control and management of interests | 100.0 | Copel GeT |
| Copel Brisa Potiguar S.A. (a) | Curitiba/PR | Control and management of interests | 100.0 | Copel REN |
| GE Olho D’Água S.A. | São Bento do Norte/RN | Production of electricity from w ind sources | 100.0 | São Bento |
| GE Boa Vista S.A. | São Bento do Norte/RN | Production of electricity from w ind sources | 100.0 | São Bento |
| GE Farol S.A. | São Bento do Norte/RN | Production of electricity from w ind sources | 100.0 | São Bento |
| GE São Bento do Norte S.A. | São Bento do Norte/RN | Production of electricity from w ind sources | 100.0 | São Bento |
| Central Geradora Eólica São Bento do Norte I S.A. (a) | Goiânia/GO | Production of electricity from w ind sources | 100.0 | Cutia |
| Central Geradora Eólica São Bento do Norte II S.A. (a) | Goiânia/GO | Production of electricity from w ind sources | 100.0 | Cutia |
| Central Geradora Eólica São Bento do Norte III S.A. (a) | Goiânia/GO | Production of electricity from w ind sources | 100.0 | Cutia |
| Central Geradora Eólica São Miguel I S.A. (a) | Goiânia/GO | Production of electricity from w ind sources | 100.0 | Cutia |
| Central Geradora Eólica São Miguel II S.A. (a) | Goiânia/GO | Production of electricity from w ind sources | 100.0 | Cutia |
| Central Geradora Eólica São Miguel III S.A. (a) | Goiânia/GO | Production of electricity from w ind sources | 100.0 | Cutia |
| Usina de Energia Eólica Guajiru S.A. (a) | Curitiba/PR | Production of electricity from w ind sources | 100.0 | Cutia |
| Usina de Energia Eólica Jangada S.A. (a) | Curitiba/PR | Production of electricity from w ind sources | 100.0 | Cutia |
| Usina de Energia Eólica Potiguar S.A. (a) | Curitiba/PR | Production of electricity from w ind sources | 100.0 | Cutia |
| Usina de Energia Eólica Cutia S.A. (a) | Curitiba/PR | Production of electricity from w ind sources | 100.0 | Cutia |
| Usina de Energia Eólica Maria Helena S.A. (a) | Curitiba/PR | Production of electricity from w ind sources | 100.0 | Cutia |
| Usina de Energia Eólica Esperança do Nordeste S.A.(a) | Curitiba/PR | Production of electricity from w ind sources | 100.0 | Cutia |
| Usina de Energia Eólica Paraíso dos Ventos do Nordeste S.A. (a) | Curitiba/PR | Production of electricity from w ind sources | 100.0 | Cutia |
| (a) Pre-operating stage. |
1.1.2 Joint Ventures
| | | | |
| | | | |
| | Headquarters | Main activity | Interest |
| Joint ventures | | | % | Investor |
| Voltalia São Miguel do Gostoso I Participações S.A. | São Paulo/SP | Interests in companies | 49.0 | Copel |
| Paraná Gás Exploração e Produção S.A. (a) | Curitiba/PR | Exploration of natural gas | 30.0 | Copel |
| Costa Oeste Transmissora de Energia S.A. | Curitiba/PR | Transmission of electricity | 51.0 | Copel GeT |
| Marumbi Transmissora de Energia S.A. | Curitiba/PR | Transmission of electricity | 80.0 | Copel GeT |
| Transmissora Sul Brasileira de Energia S.A. | Florianópolis/SC | Transmission of electricity | 20.0 | Copel GeT |
| Caiuá Transmissora de Energia S.A. | Rio de Janeiro/RJ | Transmission of electricity | 49.0 | Copel GeT |
| Integração Maranhense Transmissora de Energia S.A. | Rio de Janeiro/RJ | Transmission of electricity | 49.0 | Copel GeT |
| Matrinchã Transmissora de Energia (TP NORTE) S.A.(a) | Rio de Janeiro/RJ | Transmission of electricity | 49.0 | Copel GeT |
| Guaraciaba Transmissora de Energia (TP SUL) S.A. (a) | Rio de Janeiro/RJ | Transmission of electricity | 49.0 | Copel GeT |
| Paranaíba Transmissora de Energia S.A. (a) | Rio de Janeiro/RJ | Transmission of electricity | 24.5 | Copel GeT |
| Mata de Santa Genebra Transmissão S.A. (a) | Rio de Janeiro/RJ | Transmission of electricity | 50.1 | Copel GeT |
| Cantareira Transmissora de Energia S.A. (a) | Rio de Janeiro/RJ | Transmission of electricity | 49.0 | Copel GeT |
| Dominó Holdings S.A. | Curitiba/PR | Interest in sew age treatment | 49.0 | Copel COM |
| (a) Pre-operating stage. | | | | |
1.1.3 Associated companies
| | | |
| | Headquarters | Main activity | Interest % |
| Associated companies | | | |
| Cia. de Saneamento do Paraná - Sanepar (a) | Curitiba/PR | Basic sanitation | 7.6252 |
| Dona Francisca Energética S.A. | Agudo/RS | Electric Pow er | 23.0303 |
| Foz do Chopim Energética Ltda. | Curitiba/PR | Electric Pow er | 35.77 |
| Carbocampel S.A. | Figueira/PR | Coal exploration | 49.0 |
| Dois Saltos Empreendimentos de Geração de Energia Elétrica Ltda. (b) | Curitiba/PR | Electric Pow er | 30.0 |
| Copel Amec S/C Ltda.- in liquidation | Curitiba/PR | Services | 48.0 |
| Escoelectric Ltda. (c) | Curitiba/PR | Services | 40.0 |
| Sercomtel S.A. Telecomunicações (d) | Londrina/PR | Telecommunications | 45.0 |
| (a) Despite only having a direct 7.6252% interest in Sanepar, the Company has the ability to exercise significant influence through a shareholders agreement from |
| Dominó Holdings S.A. joint venture, of its w holly ow ned subsidiary Copel Comercialização S.A. | | |
| (b) Pre-operating stage. | | | |
| (c) Extinct in April 2016. | | | |
| (d) Investment reduced to zero due to the impairment tests. | | | |
1.1.4 Joint operations (consortiums)
| | | |
| Joint operations | Interest (%) | Other consortium members | Interest (%) |
| UHE Mauá | 51.0 | Eletrosul Centrais Elétricas S.A. | 49.0 |
| UHE Baixo Iguaçu (Note 18.5.1) (a) | 30.0 | Geração Céu Azul S.A (Neoenergia) | 70.0 |
| Consórcio Tapajós (Note 18.5.2) (a) | 13.8 | Centrais Elétricas Brasileiras S.A - Eletrobrás | 13.8 |
| | | Centrais Elétricas do Norte do Brasil S.A - Eletronorte | 10.2 |
| | | Construções e Comércio Camargo Corrêa S.A. | 6.7 |
| | | Electricité de France S.A - EDF | 9.3 |
| | | Cemig Geração e Transmissão S.A. | 13.8 |
| | | Endesa Brasil S.A. | 10.8 |
| | | GDF SUEZ Energy Latin America Participações Ltda. | 10.8 |
| | | Neoenergia Investimentos S.A. | 10.8 |
2 Concessions and Authorizations
2.1 Concession/authorization agreements of Copel’s equity interests:
| | | |
| Copel | | Interest % | Maturity |
| Concession agreement / authorization of the equity | | |
| Copel Distribuição | Contract 046/1999, extended by 5th addendum to the contratct | 100 | 07.07.2045 |
| Elejor | Contract 125/2001 - HPP Fundão and Santa Clara | 70 | 05.28.2037 |
| | Authorization - SHP Fundão I and SHP Santa Clara I - 753/2002 and 757/2002 | 70 | 12.18.2032 |
| Dona Francisca Energética | Contract 188/1998 - HPP Dona Francisca | 23 | 08.27.2033 |
| Foz do Chopim | Authorization 114/2000 - SHP Foz do Chopim | 36 | 04.23.2030 |
| UEG Araucária | Authorization 351/1999 - TTP Araucária (60% Copel GET) | 20 | 12.22.2029 |
| Compagás | Concession gas distribution contract | 51 | 07.06.2024 |
| Usina de Energia Eólica São João (a) | MME Ordinance 173 /2012 - WPP São João | 49 | 03.25.2047 |
| Usina de Energia Eólica Carnaúba (a) | MME Ordinance 204 /2012 - WPP Carnaúbas | 49 | 04.08.2047 |
| Usina de Energia Eólica Reduto (a) | MME Ordinance 230 /2012 - WPP Reduto | 49 | 04.15.2047 |
| Usina de Energia Eólica Santo Cristo (a) | MME Ordinance 233/2012 - WPP Santo Cristo | 49 | 04.17.2047 |
| Dois Saltos | Authorization 5204/2015 | 30 | 04.22.2045 |
| Paraná Gás | PART-T-300_R12 4861-.0000.99/2014-00 - ANP | 30 | 05.15.2045 |
| (a) Subsidiaries of Voltália São Miguel do Gostoso I Participações S.A. | | |
2.2 Concession/authorization agreements of Copel Geração e Transmissão and its equityinterests:

| | | |
| Copel Geração e Transmissão | | Interest % | Maturity |
| Generation concession 045/1999 | | | |
| TTP Figueira | | 100 | 03.26.2019 |
| HPP Gov. Bento Munhoz da Rocha Neto (Foz do Areia) | 100 | 05.23.2023 |
| HPP São Jorge | | 100 | 12.03.2024 |
| HPP Guaricana | | 100 | 08.16.2026 |
| HPP Gov. Ney Aminthas de Barros Braga (Segredo) | 100 | 11.15.2029 |
| HPP Gov. José Richa (Salto Caxias) | | 100 | 05.04.2030 |
| Authorization 278/1999- UEE Palmas | | 100 | 09.28.2029 |
| Dispatch 182/2002- SHP Melissa, SHP Pitangui and SHP Salto do Vau (only register w ith ANEEL) | 100 | - |
| Generation Concession 001/2007- HPP Mauá | 51 | 07.02.2042 |
| Generation concession 001/2011- HPP Colíder (a) | 100 | 01.16.2046 |
| Ordinance 133/2011- SHP Cavernoso II | | 100 | 02.27.2046 |
| Use of Public Property Concession - 002/2012- PP Baixo Iguaçu (a) | 30 | 08.19.2047 |
| Generation Concession - Use of Public Property - 007/2013 | | |
| HPP Apucaraninha | | 100 | 10.12.2025 |
| HPP Chaminé | | 100 | 08.16.2026 |
| HPP Derivação do Rio Jordão | | 100 | 11.15.2029 |
| HPP Cavernoso | | 100 | 01.07.2031 |
| Generation concession 002/2016 -HPP Gov. Pedro Viriato Parigot de Souza (GPS) | 100 | 01.05.2046 |
| In progress for homologation from ANEEL- HPP Marumbi | 100 | - |
| Authorization Aneel 5373/2015- HPP Chopim I (only register w ith ANEEL) | 100 | - |
| Concession agreement / authorization of the equity | | |
| UEG Araucária | Authorization 351/1999 - TTP Araucária (20% - Copel) | 60 | 12.22.2029 |
| Nova Asa Branca I | MME Ordinance 267/2011 - WPP Asa Branca I | 100 | 04.24.2046 |
| Nova Asa Branca II | MME Ordinance 333/2011 - WPP Asa Branca II | 100 | 05.30.2046 |
| Nova Asa Branca III | MME Ordinance 334/2011 - WPP Asa Branca III | 100 | 05.30.2046 |
| Nova Eurus IV | MME Ordinance 273/2011 -WPP Eurus IV | 100 | 04.26.2046 |
| Santa Maria | MME Ordinance 274/2012 - WPP SM | 100 | 05.07.2047 |
| Santa Helena | MME Ordinance 207/2012 - WPP Santa Helena | 100 | 04.08.2047 |
| Ventos de Santo Uriel | MME Ordinance 201/2012 - WPP Santo Uriel | 100 | 04.08.2047 |
| GE Boa Vista | MME Ordinance 276 /2011 - WPP Dreen Boa Vista | 100 | 04.27.2046 |
| GE Farol | MME Ordinance 263 /2011 - WPP Farol | 100 | 04.19.2046 |
| GE Olho D’Água | MME Ordinance 343 /2011 - WPP Dreen Olho D'Água | 100 | 05.31.2046 |
| GE São Bento do Norte | MME Ordinance 310 /2011 - WPP Dreen São Bento do Norte | 100 | 05.18.2046 |
| Esperança do Nordeste | MME Ordinance 183/2015 - WPP Esperança do Nordeste (a) | 100 | 05.10.2050 |
| Paraíso dos Ventos do Nordeste | MME Ordinance 182/2015 - WPP Paraíso dos Ventos do Nordeste (a) | 100 | 05.10.2050 |
| Usina de Energia Eólica Jangada | Resolution 3.257/2011 - WPP GE Jangada (a) | 100 | 01.04.2042 |
| Maria Helena | Resolution 3.259/2011 - WPP GE Maria Helena (a) | 100 | 01.04.2042 |
| Usina de Energia Eólica Potiguar | MME Ordinance 179/2015 - WPP Potiguar (a) | 100 | 05.10.2050 |
| Usina de Energia Eólica Guajiru | Resolution 3.256/2011 - WPP Dreen Guajiru (a) | 100 | 01.04.2042 |
| Usina de Energia Eólica Cutia | Resolution 3.258/2011 - WPP Dreen Cutia (a) | 100 | 01.04.2042 |
| São Bento do Norte I | Ordinance 349/2015 - WPP São Bento do Norte I (a) | 100 | 08.03.2050 |
| São Bento do Norte II | Ordinance 348/2015 - WPP São Bento do Norte II (a) | 100 | 08.03.2050 |
| São Bento do Norte III | Ordinance 347/2015 - WPP São Bento do Norte III (a) | 100 | 08.03.2050 |
| São Miguel I | Ordinance 352/2015 - WPP São Miguel I (a) | 100 | 08.03.2050 |
| São MigueI lI | Ordinance 351/2015 - WPP São Miguel II (a) | 100 | 08.03.2050 |
| São Miguel III | Ordinance 350/2015 - WPP São Miguel III (a) | 100 | 08.03.2050 |
| (a) Building under construction. | | | |
| | | |
| Copel Geração e Transmissão | Interest % | Maturity |
| Transmission lines and substations concession agreements | | |
| Contract 060/2001 (extended by 3rd addendum to the contratct) - Transmission facilities – several joint ventures | 100 | 12.31.2042 |
| Contract 075/2001 - Transmission line Bateias - Jaguariaíva | 100 | 08.16.2031 |
| Contract 006/2008 - Transmission line Bateias - Pilarzinho | 100 | 03.16.2038 |
| Contract 027/2009 - Transmission line Foz do Iguaçu - Cascavel Oeste | 100 | 11.18.2039 |
| Contract 010/2010 - Transmission line Araraquara 2 - Taubaté (a) | 100 | 10.05.2040 |
| Contract 015/2010 - Substation Cerquilho III | 100 | 10.05.2040 |
| Contract 022/2012 - Transmission line - Foz do Chopim - Salto Osorio C2; Transmission line 230 kV Londrina - Figueira | 100 | 08.26.2042 |
| Contract 002/2013 - Transmission line - Assis - Paraguaçu Paulista II; Substation 230/88 kV Paraguaçu Paulista II | 100 | 02.24.2043 |
| Contract 005/2014 - Transmission line - Bateias - Curitiba Norte (a); Substation 230/20138 kV Curitiba Norte | 100 | 01.28.2044 |
| Contract 021/2014 - Transmission line Foz do Chopim - Realeza (a); Substation Realeza 230/20138 kV - Pátio novo 230 kV (a) | 100 | 09.04.2044 |
| Contract 022/2014 - Transmission line Assis - Londrina (a) | 100 | 09.04.2044 |
| Contract 006/2016 - Transmission line 525kV Curitiba Leste - Blumenau C1 (a) | 100 | 04.06.2046 |
| Contract 006/2016 - Transmission line 230 kV Uberaba - Curitiba Centro C1 e C2 (Underground) (a) | | |
| Contract 006/2016 -Substation 230/138 kV Curitiba Centro (SF6) - 230/138 kV - 2 x ATF 150 MVA (a) | | |
| Contract 006/2016 -Substation 230/138 kV Medianeira (Pátio novo 230 kV) - 2 x 150 MVA (a) | | |
| Contract 006/2016 -Transmission line 230 kV Baixo Iguaçu - Realeza (a) | | |
| Contract 006/2016 -Substation 230/138 kV Andirá Leste - 2 x ATR 150 MVA (a) | | |
| Concession agreement / authorization of the equity | | |
| Costa Oeste Transmissora | Contract 001/2012 - Transmission line Cascavel Oeste - Umuarama; Substation Umuarama 230/20138 kV | 51 | 01.11.2042 |
| Transmissora Sul Brasileira | Contract 004/2012 - Transmission line Nova Santa Rita - Camaquã 3; | 20 | 05.09.2042 |
| | Transmission line 230 kV Camaquã 3 - Quinta; Transmission line 525 kV Salto Santiago - Itá; | | |
| | Transmission line 525 kV Itá - Nova Santa Rita; Substation Camaquã 3 230/69/2013,8 kV | | |
| Caiuá Transmissora | Contract 007/2012 - Transmission line Umuarama - Guaíra; Transmission line 230 kV Cascavel Oeste - Cascavel Norte; | 49 | 05.09.2042 |
| | Substation Santa Quitéria 230/69-13,8 Kv; Substation Cascavel Norte 230/20138-13,8 kV | | |
| Marumbi Transmissora | Contract 008/2012 - Transmission line Curitiba - Curitiba Leste; Substation Curitiba Leste 525/230 kV | 80 | 05.09.2042 |
| Integração Maranhense | Contract 011/2012 - Transmission line Açailândia - Miranda II | 49 | 05.09.2042 |
| Matrinchã Transmissora | Contract 012/2012 - Transmission line Paranaíta - Ribeirãozinho (a); Transmission line 500 kV Paranaíta - Claúdia (a); | 49 | 05.09.2042 |
| Substation Claúdia 500 kV (a); Transmission line 500 kV Claúdia - Paranatinga (a); Substation Paranatinga 500 kV (a); | | |
| | Transmission line 500 kV Paranatinga - Ribeirãozinho (a) | | |
| Guaraciaba Transmissora | Contract 013/2012 - Transmission line Ribeirãozinho - Marimbondo II (a); | 49 | 05.09.2042 |
| | Transmission line 500 kV Ribeirãozinho - Rio Verde Norte (a); Transmission line 500 Rio Verde Norte - Marimbondo II (a); | | |
| | Sectioning of Transmission lines 500 kV Marimbondo - Araraquara, at Substation Marimbondo II (a); | | |
| | Substation Marimbondo II 500 kV (a) | | |
| Paranaíba Transmissora | Contract 007/2013 - Transmission line - T 500 kV Barreiras II - Rio das Éguas (a); | 24.5 | 05.01.2043 |
| | Transmission line 500 kV Rio Das Éguas - Luziânia (a); Transmission line 500 kV Luziânia - Pirapora 2 (a) | | |
| Mata de Santa Genebra | Contract 001/2014 - Transmission line - Itatiba - Bateias (a); Transmission line 500 kV Itatiba - Bateias (a); | 50.1 | 05.13.2044 |
| | Transmission line 500 kV Araraquara 2 - Itatiba (a); Transmission line 500 kV Araraquara 2 - Fernão Dias (a); | | |
| | Substation Santa Bárbara do D'Oeste 440 kV (a); Substation Itatiba 500 kV (a); | | |
| | Substation 500/440 kV Fernão Dias (a) | | |
| Cantareira Transmissora | Contract 019/2014 - Transmission line - Estreito - Fernão Dias (a) | 49 | 09.04.2044 |
| (a) Buildings under construction. | | |
3 Basis of Preparation
3.1 Declaration of compliance
The quarterly information consists of the individual financial information of the parent company and consolidated financial information prepared in accordance with the International Financial Reporting Standards - IFRS, issued by the International Accounting Standards Board - IASB and also in accordance with the accounting practices adopted in Brazil (BR GAAP), which include the pronouncements, guidelines and interpretations issued by the Accounting Pronouncements Committee - CPC, approved by the Brazilian Securities Commission - CVM and by the Federal Accounting Council - CFC.
The quarterly information is being presented bearing in mind the provisions of CPC 21 (R1) and IAS 34 – Interim Information. Consequently, certain information shown in the notes to the financial statements for the year ended December 31, 2015 and which was not subject to modification in the first half of 2016, is not shown. Therefore, this quarterly information should be read together with the financial statements as at December 31, 2015, available on the sites of the CVM and Copel.
Management warrants that all proprietary material information shown in the individual and consolidated quarterly information, and it alone, is being evidenced, and that it corresponds to that used in managing the company.
Authorization to issue the quarterly information was given by the Executive Board on August 9, 2016.
3.2 Functional and presentation currency
The quarterly information is shown in Reais, which is the Company’s functional currency. The financial information has been rounded up to the nearest thousand, unless otherwise indicated.
3.3 Measurement base
The quarterly information was prepared based on historical cost, with the exception of the following material items recognized in the statement of financial position:
· non-derivative financial instruments shown at fair value through income, which are measured at fair value;
· financial assets available for sale, which are measured at fair value;
· investments in subsidiaries (in the parent company’s individual financial statements), in jointly-controlled entities and in affiliates, which are measured at the equity method; and
· The net amount of the pension plan liability, which is recognized at the present value of the actuarial obligation, calculated by a hired actuary, minus the fair value of the plan’s assets.
3.4 Use of estimates and judgments
In preparing this quarterly information, the management used judgments, estimates and assumptions that affect how the accounting policies are applied and the reported amounts of the assets, liabilities, revenues and expenses of Copel and its subsidiaries. The actual results may differ from these estimates.
The estimates and assumptions are continually revised. The revised estimates are recognized on a prospective basis.
Information about the use of estimates and judgments involving the application of the accounting policies adopted that represent effects on the amounts recognized in the quarterly information are the same as those disclosed in Note 3.4 to the financial statements as of December 31, 2015.
4 Significant Accounting Policies
The Company’s accounting policies are consistent with those shown in Note 4 to the financial statements as of December 31, 2015.
5 Cash and Cash Equivalents
| | | | |
| | | Parent Company | | Consolidated |
| | 06.30.2016 | 12.31.2015 | 06.30.2016 | 12.31.2015 |
| Cash and bank accounts | 219 | 126 | 156,513 | 167,724 |
| Financial investments w ith immediate liquidity | 9,655 | 25,527 | 671,804 | 1,313,003 |
| | 9,874 | 25,653 | 828,317 | 1,480,727 |
The financial investments of the Company and its subsidiaries refer to Bank Deposit Certificates - CDBs and repo transactions characterized by the sale of securities with a commitment by the seller (Bank) to repurchase them from the buyer for re-sale in the future. The average remuneration on the investments is the variance in the Interbank Deposit Certificate (CDI) rate.
6 Bonds and Securities
| | | | |
| | Level
Note 35.1 | Index | 06.30.2016 | Consolidated |
| Category | 12.31.2015 |
| Securities available for sale | | | | |
| Committed Operation | 2 | Fixed rate | 89,744 | 48,085 |
| Committed Operation | 2 | CDI (a) | 1,164 | - |
| Quotas in Funds | 2 | CDI | 78,518 | 64,368 |
| Bank Deposit Certificates - CDB | 2 | CDI | 47,493 | 45,996 |
| Financial Treasury Bills - LFT | 1 | Selic (b) | 1,383 | 2,623 |
| Quotas in Funds | 1 | CDI | 109 | 105 |
| | | | 218,411 | 161,177 |
| Securities held for trading | | | | |
| Multimarket Fund | 2 | CDI | 150,992 | 111,760 |
| Committed Operation | 2 | Fixed rate | 126,944 | 88,594 |
| Financial Bills | 2 | CDI | 48,141 | 26,025 |
| Quotas in Funds | 2 | CDI | 16,640 | 100,282 |
| Time Deposits w ith Special Guarantee from the Credit | | | | |
| Guarantee Fund (FGC) - DPGE | 2 | CDI | 4,542 | 4,515 |
| National Treasury Bills - LTN | 1 | Selic | 2,816 | 2,563 |
| Housing credit | 2 | CDI | 2,316 | 2,316 |
| Treasury | 1 | - | 153 | 2 |
| Debentures | 2 | CDI | 125 | 157 |
| | | | 352,669 | 336,214 |
| | | | 571,080 | 497,391 |
| | | Current | 392,484 | 406,274 |
| | | Noncurrent | 178,596 | 91,117 |
| (a) Interbank Deposit Certificate - CDI | | | | |
| (b) Interest rate equivalent to the reference rate of the Special System for Settlement and Custody - Selic | |
Copel and its subsidiaries hold securities that pay variable interest rates. The term of these securities varies from 1 to 60 months, as from the end of the reporting period. None of these assets has matured or presents problems with impairment at the close of the first half of 2016.
7 Trade Accounts Receivable
| | | | | |
| Consolidated | Balances | Overdue | Overdue for | Total | Total |
| | falling due | up to 90 days | more than 90 days | 06.30.2016 | 12.31.2015 |
| Customers | | | | | |
| Residential | 282,374 | 209,746 | 65,115 | 557,235 | 593,803 |
| Industrial | 219,224 | 62,139 | 43,860 | 325,223 | 386,777 |
| Commercial | 192,159 | 61,491 | 34,281 | 287,931 | 377,310 |
| Rural | 43,925 | 21,962 | 7,725 | 73,612 | 81,772 |
| Public Entities | 33,763 | 16,409 | 14,936 | 65,108 | 66,919 |
| Public lighting | 32,258 | 70 | 129 | 32,457 | 40,599 |
| Public service | 35,069 | 970 | 1,321 | 37,360 | 42,985 |
| Unbilled | 446,487 | - | - | 446,487 | 648,455 |
| Energy installments plan (7.1) | 119,134 | 20,390 | 27,193 | 166,717 | 130,589 |
| Low income subsidy - Eletrobras | 13,134 | - | - | 13,134 | 12,351 |
| Other receivables | 33,875 | 30,507 | 93,100 | 157,482 | 141,481 |
| | 1,451,402 | 423,684 | 287,660 | 2,162,746 | 2,523,041 |
| Concessionaires and Permission holder | | | | | |
| Energy supplies | | | | | |
| Energy purchase agreements in the | | | | | |
| regulated market - CCEAR | 108,018 | 2,192 | 17,687 | 127,897 | 147,809 |
| Bilateral contracts | 99,888 | 464 | 25 | 100,377 | 94,961 |
| CCEE (7.2) | 71,377 | 911 | 191,054 | 263,342 | 434,523 |
| Unbilled | 52,400 | - | - | 52,400 | 49,431 |
| Quota system and Reimbursement to generators | 13,258 | 1,287 | 2,830 | 17,375 | 4,158 |
| | 344,941 | 4,854 | 211,596 | 561,391 | 730,882 |
| Charges from using transmission grid | 73,220 | 5,763 | 6,801 | 85,784 | 83,171 |
| Telecommunications | 11,980 | 19,799 | 37,471 | 69,250 | 49,766 |
| Gas distribution | 53,313 | 2,215 | 4,797 | 60,325 | 60,715 |
| Allow ance for doubtful accounts (7.3) | - | - | (321,230) | (321,230) | (339,686) |
| | 1,934,856 | 456,315 | 227,095 | 2,618,266 | 3,107,889 |
| Current | | | | 2,543,217 | 3,032,827 |
| Noncurrent | | | | 75,049 | 75,062 |
7.1 Payment of debits under installment plans
The balances of debit installment plans are at present value, bearing in mind the amount to be discounted, the realization dates, the settlement dates and the discount rate, which ranges from 0.24% to 3.00%.
7.2 CCEE
Of the balance shown, the most significant amount is R$211,301 which refers to Copel Geração e Transmissão, of which R$181,560 derives from energy sales to be reprocessed by the Electricity Trading Chamber – CCEE, from January to May 2015, as a result of a request to Aneel to exclude responsibility in the delivery of energy to fulfill the commercialization contracts of Colíder HPP (Note 18.4). The Company is currently awaiting the judgement of the request for reconsideration of Aneel Order 1580, of June 14, 2016, which established that the implementation schedule and the energy supply schedules related to the plant should remain unchanged.
7.3 Allowance for doubtful acccounts
| | | | |
| Consolidated | Balance as of | | Reversal | Balance as of |
| | January 1, 2016 | Additions | of write offs | June 30, 2016 |
| Customers | | | | |
| Residential | 104,167 | 47,910 | (72,620) | 79,457 |
| Industrial | 42,176 | 11,952 | (15,636) | 38,492 |
| Commercial | 48,385 | 28,577 | (21,462) | 55,500 |
| Rural | 1,827 | 1,657 | (2,060) | 1,424 |
| Public Entities | 10,651 | 691 | (47) | 11,295 |
| Public lighting | 81 | 3 | - | 84 |
| Public service | 607 | 162 | - | 769 |
| | 207,894 | 90,952 | (111,825) | 187,021 |
| Concessionaries and permission holder | | | | |
| CCEE (7.3.1) | 119,665 | - | - | 119,665 |
| Concessionaries and permission holder | 10,141 | 801 | - | 10,942 |
| | 129,806 | 801 | - | 130,607 |
| Telecommunications | 191 | 962 | - | 1,153 |
| Gas distribution | 1,795 | 676 | (22) | 2,449 |
| | 339,686 | 93,391 | (111,847) | 321,230 |
7.3.1 CCEE
In 2015, the provision of R$119,665 was recorded referring to the differences between the selling price of energy under the commercialization contracts of Colíder HPP and the Difference Settlement Price – PLD – negotiated with the CCEE. The Company is awaiting a definition by Aneel regarding the request for review of the schedule for this plant to come on stream, so as to possibly reverse this provision.
8 CRC Transferred to the State Government of Paraná
Under the fourth addendum signed on January 21, 2015, the Company renegotiated with the State Government of Paraná, the balance at December 31, 2004 of the Income Accounts to be Offset - CRC, of R$1,197,404, in 244 installments recalculated using the price amortization system, restated using the General Price Index – Internal Availability - IGP-DI, plus interest of 6.65% p.a., which are received on a monthly basis, the first installment maturing on January 30, 2005, and the others in subsequent and consecutive maturity dates.
As per the request of the Paraná State Government, approved by the Company’s Board of Directors, the Novation of the CRC Agreement Amendment is under way, comprising, between April and December 2016, a grace period for all payments and, between January and December 2017, a grace period for the principal amount only, without any real loss of the total amount of the agreement, maintaining its net present value. The other clauses in the agreement will be maintained.
Amortizations are guaranteed by dividends.
8.1 Changes to the CRC
| | | |
| Parent Company and Consolidated | Current Assets | Noncurrent Assets | Total |
| Balance as of January 1, 2016 | 111,663 | 1,271,579 | 1,383,242 |
| Interest | 43,917 | - | 43,917 |
| Monetary variations | 1,555 | 75,015 | 76,570 |
| Transfers | 60,559 | (60,559) | - |
| Transfers due to novation | (168,269) | 168,269 | - |
| Amortizations | (49,425) | - | (49,425) |
| Balance as of June 30, 2016 | - | 1,454,304 | 1,454,304 |
8.2 Maturity dates of the long-term installments
| |
| Parent Company and Consolidated | 06.30.2016 |
| 2018 | 160,270 |
| 2019 | 170,929 |
| 2020 | 182,297 |
| 2021 | 194,420 |
| 2022 | 207,350 |
| After 2022 | 539,038 |
| | 1,454,304 |
9 Sectorial Financial Assets and Liabilities
The Sectorial Financial Assets and Liabilities refer to the Portion A Cost Variation Account (CVA) and other financial components representing the non-manageable costs in the tariff cycle without proper tariff cover. These account balances represent the positive and negative variance between the projected and actual amounts, and are restated using an index determined by the Aneel and transferred in the next tariff adjustment.
9.1 Breakdown of the balances of sectorial financial assets
| | | | |
| Consolidated | | Current | | Noncurrent |
| | 06.30.2016 | 12.31.2015 | 06.30.2016 | 12.31.2015 |
| Sectorial financial assets - Electricity rate adjustment | | | | |
| recoverable 2015 | | | | |
| Portion A | | | | |
| Charges for using the transmission system - basic grid | - | 69,781 | - | - |
| Electricity purchased for resale - Itaipu | - | - | - | - |
| ESS | - | (200,644) | - | - |
| CDE | - | 171,008 | - | |
| Proinfa | - | (1,185) | - | - |
| CVA Energ | - | 365,276 | - | - |
| Transport of energy purchased from Itaipu | - | 2,859 | - | - |
| Other financial components | - | - | - | - |
| Deferral IRT 2013 | - | 143,624 | - | - |
| Deferral IRT 2014 | - | 324,003 | - | - |
| Extraordinary Tariff Review | - | (179,763) | - | - |
| Overcontracting | - | 78,778 | - | - |
| Neutrality | - | (7,888) | - | - |
| Financial exposure | - | 9,922 | - | - |
| Guarantees | - | 84 | - | - |
| | - | 775,855 | - | - |
| Sectorial financial assets - Electricity rate adjustment | | | | |
| recoverable 2016 | | | | |
| Portion A | | | | |
| Charges for using the transmission system - basic grid | - | 3,615 | - | 3,615 |
| Electricity purchased for resale - Itaipu | - | 349,704 | - | 349,704 |
| ESS | - | (69,255) | - | (69,255) |
| CDE | - | 231,052 | - | 231,052 |
| Proinfa | - | (40) | - | (40) |
| CVA Energ | - | (190,070) | - | (190,071) |
| Transport of energy purchased from Itaipu | - | 2,432 | - | 2,432 |
| Other financial components | | | | |
| Extraordinary Tariff Review | - | (264,423) | - | (264,423) |
| Overcontracting | - | 20,999 | - | 20,999 |
| Neutrality | - | 36,266 | - | 36,266 |
| Abrace | - | 10,228 | - | 10,228 |
| Financial exposure | - | 4,396 | - | 4,396 |
| | - | 134,904 | - | 134,903 |
| | - | 910,759 | - | 134,903 |
9.2 Breakdown of the sectorial financial liabilities
| | | | |
| Consolidated | | Current | | Noncurrent |
| | 06.30.2016 | 12.31.2015 | 06.30.2016 | 12.31.2015 |
| Sectorial financial liabilities - Electricity rate adjustment | | | | |
| recoverable 2016 | | | | |
| Portion A | | | | |
| Charges for using the transmission system - basic grid | 136 | - | - | - |
| Electricity purchased for resale - Itaipu | (723,652) | - | - | - |
| ESS | 134,084 | - | - | - |
| CDE | (297,919) | - | - | - |
| Proinfa | (30,971) | - | - | - |
| CVA Energ | 650,714 | - | - | - |
| Transport of energy purchased from Itaipu | (7,671) | - | - | - |
| Other financial components | | | | |
| Overcontracting | 9,783 | - | - | - |
| Extraordinary Tariff Review | 525,119 | - | - | - |
| Neutrality | (82,770) | - | - | - |
| Financial exposure | 33,157 | - | - | - |
| Others | (305) | - | - | - |
| | 209,705 | - | - | - |
| Sectorial financial liabilities - Electricity rate adjustment | | | | |
| recoverable 2017 | | | | |
| Portion A | | | | |
| Charges for using the transmission system - basic grid | - | - | 6,421 | - |
| Electricity purchased for resale - Itaipu | - | - | (25,259) | - |
| ESS | - | - | 17,332 | - |
| CDE | - | - | 42,940 | - |
| Proinfa | - | - | (106) | - |
| CVA Energ | - | - | 215,097 | - |
| Transport of energy purchased from Itaipu | - | - | (250) | - |
| Financial components | | | | |
| Overcontracting | - | - | (70,613) | - |
| Neutrality | - | - | (8,298) | - |
| | - | - | 177,264 | - |
| Sectorial financial liabilities - Tariff Review 2021 | | | | |
| Financial components | | | | |
| Tariff returns | - | - | 37,971 | - |
| | - | - | 37,971 | - |
| | 209,705 | - | 215,235 | - |
9.3 Changes to the net sectorial financial assets and liabilities
| | | | | | |
| | | | | Financial | | |
| | Balance as of | Operating revenues | results | | Balance as of |
| | January 1, 2016 | Constitution | Amortization | Updating | Rate flags | June 30, 2016 |
| Portion A | | | | | | |
| Charges for using the transmission system - basic grid | 77,011 | (15,284) | (74,536) | 6,252 | - | (6,557) |
| Electricity purchased for resale - Itaipu | 699,408 | 19,219 | (15,344) | 45,628 | - | 748,911 |
| ESS | (339,154) | 61,569 | 217,215 | (21,148) | (69,898) | (151,416) |
| CDE | 633,112 | (223,891) | (188,999) | 34,757 | - | 254,979 |
| Proinfa | (1,265) | 30,360 | 621 | 1,361 | - | 31,077 |
| CVA Energ | (14,865) | (304,902) | (376,880) | (15,562) | (153,602) | (865,811) |
| Transport of energy purchased f rom Itaipu | 7,723 | 4,015 | (3,217) | (600) | - | 7,921 |
| Other financial components | | | | | | |
| Overcontracting | 120,776 | 32,183 | (78,584) | (13,545) | - | 60,830 |
| Deferral IRT | 467,627 | - | (467,627) | - | - | - |
| Extraordinary Tariff Review | (708,609) | 21,541 | 190,176 | (28,227) | - | (525,119) |
| Neutrality | 64,644 | 18,873 | 6,247 | 1,304 | - | 91,068 |
| Abrace | 20,456 | (19,808) | - | (648) | - | - |
| Financial exposure | 18,714 | (42,000) | (9,264) | (607) | - | (33,157) |
| Tariff returns (9.3.1) | - | (36,490) | - | (1,481) | - | (37,971) |
| Others | 84 | 410 | (90) | (99) | - | 305 |
| | 1,045,662 | (454,205) | (800,282) | 7,385 | (223,500) | (424,940) |
9.3.1 Tariff rebates
Aneel, through Order 245 of January 28, 2016, ruled that the new amounts arising from Excess Demand and Reactive Surplus must be appropriated to Sectorial Financial Liabilities commencing January 1, 2016, restated on a monthly basis by the Selic interest rate.
10 Accounts Receivable Related to the Concession
10.1 Changes to the accounts receivable related to the concession
| | | | |
| | | Noncurrent assets | |
| | Current | | Special | |
| | assets | Assets | liabilities | Consolidated |
| Balance as of January 1, 2016 | 9,162 | 1,434,161 | (75,710) | 1,367,613 |
| Bonus from the grant (10.2) | | | | |
| Bonus from the grant recognition | - | 574,827 | - | 574,827 |
| Transfers from current to noncurrent | 54,867 | (54,867) | - | - |
| Remuneration | - | 56,895 | - | 56,895 |
| Amortizations | (42,453) | - | - | (42,453) |
| Transmission and Distribution Contracts | | | | |
| Capitalization of intangible assets in progress (Note 19.1) | - | 33,533 | - | 33,533 |
| Transfers to intagible - Extension of Copel Distribuição’s Concession (Note 19.1) | - | 2,230 | - | 2,230 |
| Transfers from current to noncurrent | 29,352 | (29,352) | - | - |
| Transfers to electricity grid use charges - customers | (28,629) | - | - | (28,629) |
| Transfer to property, plant and equipment | (125) | (2,732) | - | (2,857) |
| Monetary variations (Note 33) | - | 122,395 | - | 122,395 |
| Remuneration | - | 69,533 | (3) | 69,530 |
| Construction income | - | 192,879 | - | 192,879 |
| Loss on disposal | - | (52) | - | (52) |
| Remeasurement of the cash flow of the assets RBSE (10.3) | - | 977,777 | - | 977,777 |
| Transfer from accounts receivable related to the concession | | | | |
| compensation - recognition RBSE (10.3) | - | 160,217 | - | 160,217 |
| Transfers from property, plant and equipment - recognition RBSE (10.3) | - | 155,369 | - | 155,369 |
| Recognition of RBSE + RBNI evaluation report (indemnified) (10.3) | - | 61,760 | - | 61,760 |
| Recognition RBSE – Financial Assets | - | (61,760) | - | (61,760) |
| Balance as of June 30, 2016 | 22,174 | 3,692,813 | (75,713) | 3,639,274 |
10.2 Bonus from the grant of concession agreements under the quota system
On January 5, 2016, Copel Geração e Transmissão entered into a 30-year concession agreement under the system of allocation of quotas of its physical guarantee of energy and power, in accordance with Law 12783/2013, with payment of the Bonus from the Grant - BO, amounting to R$574,827, stipulated by Resolution 2 the National Energy Policy Council - CNPE, dated September 18, 2015 and in the Aneel Invitation to Bid 12/2015.
The granting authority auctioned the grant of the concession by contracting of electricity generation services, at the lowest sum total of the cost of the Generation Assets Management - GAG and the Return on the Bonus from the Grant - RBO, which comprise the Copel Geração e Transmissão’s remuneration, referred to as Annual Generation Revenue - RAG.
Copel Geração e Transmissão has classified the payment of the Bonus from the Grant as a financial asset by virtue of it being a receivable tied to the concession agreement, consisting of the Return on the Bonus from the Grant, assured by the granting authority for the duration of the concession and with no demand risk. This asset has no active market and its cash flow is fixed and ascertainable; therefore, it has been classified as “loans and receivables”, initially estimated based on the respective fair value and subsequently measured at amortized cost, calculated using the effective interest rate method.
10.3 Remeasurement of RBSE financial assets
Copel Geração e Transmissão extended concession agreement 060/2001, pursuant to Law 12783/2013.
Regarding the amounts receivable for part of the electricity transmission assets of the Existing Basic Network System (RBSE) and for the connecting facilities and Other Transmission Facilities (RPC) prior to May 2000, on March 31, 2015, Copel Geração e Transmissão filed a valuation report for these assets with Aneel in the amount of R$882,300 on December 31, 2012, which is pending approval.
On April 20, 2016, MME Ordinance 120 was published, determining that the amounts of assets arising from electricity transmission infrastructure construction exclusively related to these not yet depreciated and/or amortized assets, shall comprise the Regulatory Remuneration Base (BRR) for electricity transmission concessionaires as of the 2017 tariff review process, in order to define the new Annual Permitted Revenue (APR).
The Ordinance addressed issues related to updating, remunerating and period for receiving the amounts involved, which are subject to Aneel regulations. However, as the means and timing of realization of these assets had been defined, based on information available in the Ordinance and the Tariff Regulation Procedure (Proret), Management remeasured the estimated cash flows for these assets at the restated amount of R$1,355,123 on June 30, 2016, with an impact of R$977,777 on operating revenues and R$645,333 on net income.
10.4 Commitments involving transmission concessions
Commitments assumed with suppliers of equipment and services referring to the following projects:
| |
| Transmission Lines and Substations | Balance |
| Contract 010/2010 - Transmission Line Araraquara 2 - Taubaté | 281,871 |
| Contract 005/2014 - TL 230 kV Bateias - Curitiba Norte and SE 230 kV Curitiba Norte | 11,004 |
| Contract 021/2014 - TL 230 kV Foz do Chopim Realeza Sul and SE 230 kV Realeza Sul | 39,382 |
| Contract 022/2014 - TL 500 kV Londrina - Assis | 96,613 |
| Contract 006/2016 - TL 500kV Blumenau - Curitiba Leste | 18,718 |
| SE 230 kV Medianeira Norte and TL 230 kV SE B. Iguaçu - Realeza Sul | |
| SE 230 kV Curitiba Centro and TL 230kV Curitiba Centro - Uberaba | |
| SE 230 kV Andirá Leste and secc LT 230 kV Assis - Salto Grande | |
11 Accounts Receivable related to the Concession Compensation
| | | |
| | Current | Noncurrent | |
| | Assets | Assets | Consolidated |
| Balance as of January 1, 2016 | - | 219,556 | 219,556 |
| Transfer to accounts receivable related to the concession (Note 10) | - | (160,217) | (160,217) |
| Balance as of June 30, 2016 | - | 59,339 | 59,339 |
The balance of R$59,339 recorded on June 30, 2016 refers to generation assets, and as a result of the expiry of the Rio dos Patos, GPS and Mourão I HPP concessions, Copel Geração e Transmissão depreciated the plants up to the expiry dates of the concessions, and reclassified them to Accounts Receivable Related to Concession Compensation at the residual book value in Property, Plant and Equipment. Copel Geração e Transmissão assessed these assets and, although the Granting Authority has not yet disclosed the means of remunerating these assets and there are uncertainties as to approval or ratification of investments made in this respect, Management believes that compensation for these assets indicates the recoverability of the recorded balance.
Copel Geração e Transmissão submitted to Aneel, in a timely manner, its interest in receiving the amount recoverable. Proof of having made the respective investments was formalized with the regulatory agency on December 17, 2015. The new replacement value methodology was used to prepare the information, as defined in Aneel Normative Resolution 596/2013.
Of the balances on December 31, 2015, the amounts receivable from energy transmission assets of the Existing System Basic Network (RBSE) and connection facilities and other transmission facilities (RPC) were reclassified to Accounts Receivable Related to the Concession, as a result of the recognition of the effects of MME Ordinance 120, as described in Note 10.3.
12 Other Current Receivables
| | | | |
| . | | Parent Company | | Consolidated |
| | 06.30.2016 | 12.31.2015 | 06.30.2016 | 12.31.2015 |
| Services in progress (a) | 11,016 | 11,013 | 141,178 | 128,336 |
| Advance payments to employees | 965 | 1,798 | 41,036 | 24,660 |
| Decommissioning in progress | - | - | 38,449 | 31,159 |
| Advance for severance estate | - | - | 34,186 | 20,277 |
| Advance payments to suppliers (b) | - | 5 | 33,547 | 95,765 |
| CDE Transfer (12.1) | - | - | 28,422 | 119,010 |
| Other receivables | 206 | 202 | 60,667 | 87,296 |
| | 12,187 | 13,018 | 377,485 | 506,503 |
| Current | 12,187 | 13,018 | 330,203 | 474,889 |
| Noncurrent | - | - | 47,282 | 31,614 |
| (a) This item refers to services currently in progress w ithin the Company, most of w hich are related to the Research and Development |
| and Energy Efficiency programs, w hich upon conclusion are offset against the respective liability recorded for this purpose. |
| (b) Refers to advances to suppliers provided on contractual clauses. | | | |
12.1 CDE Transfer
The purposes of the CDE (Note 31.5.1) include providing resources for subsidizing the discounts applied to the tariffs for use of the electricity distribution systems.
The amount transferred to Copel Distribuição between June 2015 and May 2016, ratified by Aneel resolutions 1858/2015 and 1897/2015, was amended by resolution 2094 of June 21, 2016, which ratified the result of Copel Distribuição’s fourth Periodic Tariff Review.
The balance at December 31, 2015 refers to the portions of October and December 2015, received in 2016, while the balance at June 30, 2016 refers to the provisioned portion related to June 2016.
13 Taxes
13.1 Income tax and social contribution
| | | | |
| | Parent Company | | Consolidated |
| | 06.30.2016 | 12.31.2015 | 06.30.2016 | 12.31.2015 |
| Current assets | | | | |
| IR and CSLL paid in advance | 59,656 | 174,987 | 476,093 | 517,206 |
| IR and CSLL to be offset against liability | (13,363) | (20,910) | (408,965) | (322,962) |
| | 46,293 | 154,077 | 67,128 | 194,244 |
| Noncurrent assets | | | | |
| IR and CSLL paid in advance | 144,844 | 79,144 | 160,985 | 94,686 |
| | 144,844 | 79,144 | 160,985 | 94,686 |
| Current liabilities | | | | |
| IR and CSLL due | 13,363 | - | 570,884 | 613,278 |
| IR and CSLL to be offset against asset | (13,363) | - | (408,965) | (301,362) |
| | - | - | 161,919 | 311,916 |
13.2 Deferred income tax and social contribution
| | | | |
| Parent Company | | | Recognized | |
| | | | in other | |
| | Balance as of | Recognized | comprehensive | Balance as of |
| | January 1, 2016 | in income | income | June 30, 2016 |
| Noncurrent assets | | | | |
| Provisions for legal claims | 98,779 | (60,926) | - | 37,853 |
| Amortization - concession | 18,918 | 191 | - | 19,109 |
| Provision for financing | 3,457 | - | - | 3,457 |
| CPC 33 effects - employee benef its | 1,304 | - | - | 1,304 |
| Tax losses and negative tax basis | 6,050 | (5,772) | - | 278 |
| Allow ance for doubtful debts | 1,478 | (1,478) | - | - |
| Others | 6,163 | 438 | - | 6,601 |
| | 136,149 | (67,547) | - | 68,602 |
| (-) Noncurrent liabilities | | | | |
| Provisions for negative goodw ill | 25,297 | - | - | 25,297 |
| CPC 38 effects - financial instruments | 5,850 | - | 58 | 5,908 |
| CPC 08 effects - transaction costs | 4,083 | (1,177) | - | 2,906 |
| | 35,230 | (1,177) | 58 | 34,111 |
| Net | 100,919 | (66,370) | (58) | 34,491 |
| | | | |
| Consolidated | | | Recognized | |
| | | | in other | |
| | Balance as of | Recognized | comprehensive | Balance as of |
| | January 1, 2016 | in income | income | June 30, 2016 |
| Noncurrent assets | | | | |
| Provisions for legal claims | 456,316 | (22,779) | - | 433,537 |
| Private pension and health plans | 256,071 | 14,829 | - | 270,900 |
| CPC 01 effects - impairment of assets | 252,026 | - | - | 252,026 |
| Provision for energy purchases | 184,471 | (39,749) | - | 144,722 |
| Sectoral financial liabilities | | 144,479 | - | 144,479 |
| Provision of Research and Development | 116,671 | 14,667 | - | 131,338 |
| Allow ance for doubtful accounts | 125,941 | (8,289) | - | 117,652 |
| Amortization - concession | 39,539 | 2,296 | - | 41,835 |
| Social security contributions - injunction on judicial deposit | 36,758 | 3,008 | - | 39,766 |
| ICPC 01 effects - concession contracts | 38,009 | (11,153) | - | 26,856 |
| Receivement injunction GSF | 41,308 | (16,749) | - | 24,559 |
| Provision for tax losses | 17,426 | (803) | - | 16,623 |
| Provision for profit sharing | 25,825 | (18,639) | - | 7,186 |
| Tax losses and negative tax basis | 6,050 | (5,772) | - | 278 |
| Rate flag | 16,486 | (16,486) | - | - |
| CPC 33 ef fects - employee benef its | 1,580 | (585) | - | 995 |
| Others | 44,706 | 4,008 | - | 48,714 |
| | 1,659,183 | 42,283 | - | 1,701,466 |
| (-) Noncurrent liabilities | | | | |
| CPC 27 effects - deemed cost | 539,190 | (34,039) | - | 505,151 |
| ICPC 01 effects - concession contracts | 91,126 | 409,330 | - | 500,456 |
| CPC 33 ef fects - employee benef its | 56,700 | - | - | 56,700 |
| Provisions for negative goodw ill | 25,297 | - | - | 25,297 |
| Deferment of capital gains | 11,320 | - | - | 11,320 |
| CPC 38 effects - financial instruments | 5,849 | - | 58 | 5,907 |
| Capitalization of financial charges | 5,357 | - | - | 5,357 |
| Sectoral f inancial assets | 355,525 | (355,525) | - | - |
| Others | 31,471 | (1,646) | - | 29,825 |
| | 1,121,835 | 18,120 | 58 | 1,140,013 |
| Net | 537,348 | 24,163 | (58) | 561,453 |
| Assets presented in the Statement of Financial Position | 537,562 | | | 847,484 |
| (-) Liabilities presented in the Statement of Financial Position | (214) | | | (286,031) |
| Net | 537,348 | | | 561,453 |
13.3 Other taxes recoverable and payable
| | | | |
| . | Parent Company | | Consolidated |
| | 06.30.2016 | 12.31.2015 | 06.30.2016 | 12.31.2015 |
| Current assets | | | | |
| Recoverable ICMS (VAT) | - | - | 73,973 | 66,475 |
| Recoverable PIS/Pasep and Cofins taxes | 111 | 30 | 64,539 | 76,810 |
| PIS/Pasep and Cofins to be offset against liabilities | - | (30) | (61,832) | (73,162) |
| Other recoverable taxes | - | - | 576 | 602 |
| | 111 | - | 77,256 | 70,725 |
| Noncurrent assets | | | | |
| Recoverable ICMS (VAT) | - | - | 24,595 | 20,386 |
| PIS/Pasep and Cofins taxes | - | - | 62,602 | 59,209 |
| Other recoverable taxes | 14 | 15 | 33,308 | 33,307 |
| | 14 | 15 | 120,505 | 112,902 |
| Current liabilities | | | | |
| ICMS (VAT) payable | - | - | 114,914 | 143,561 |
| PIS/Pasep and Cofins payable | 2,589 | 32,578 | 95,662 | 163,840 |
| PIS/Pasep and Cofins to be offset against assets | - | (30) | (61,832) | (73,162) |
| IRRF on JSCP | - | 20,910 | - | 71,662 |
| IRRF on JSCP to be offset against IR and CSLL assets | - | (20,910) | - | (21,600) |
| Ordinary financing of taxes w ith the federal tax authorities | - | - | 56,477 | 45,586 |
| Other taxes | 72 | 69 | 10,610 | 11,061 |
| | 2,661 | 32,617 | 215,831 | 340,948 |
| Noncurrent liabilities | | | | |
| Social security contributions - injunction on judicial deposit | 1,609 | 1,466 | 117,177 | 108,278 |
| Ordinary financing of taxes w ith the federal tax authorities | - | - | 124,776 | 148,153 |
| Other taxes | - | - | 2,166 | 842 |
| | 1,609 | 1,466 | 244,119 | 257,273 |
13.4 Reconciliation of the provision for income tax and social contribution
| | | | |
| . | Parent Company | Consolidated |
| | 06.30.2016 | 12.31.2015 | 06.30.2016 | 12.31.2015 |
| Income before IRPJ and CSLL | 1,206,199 | 683,436 | 1,687,632 | 1,164,519 |
| IRPJ and CSLL (34%) | (410,108) | (232,368) | (573,795) | (395,936) |
| Tax effects on: | | | | |
| Equity in income | 330,131 | 258,054 | 29,173 | 26,465 |
| Dividends | 149 | 208 | 149 | 208 |
| Non deductible expenses | (12) | (23) | (6,615) | (4,147) |
| Tax incentives | 93 | - | 8,192 | 1,981 |
| Unrecognized income and social contribution tax loss carry-forw ards | - | - | (20,651) | (190) |
| Difference betw een the calculation bases of deemed profit and taxable profit | - | - | 8,582 | (34,996) |
| Others | 13 | - | - | 14,102 |
| Current IRPJ and CSLL | (13,364) | (217) | (579,128) | (470,374) |
| Deferred IRPJ and CSLL | (66,370) | 26,088 | 24,163 | 77,861 |
| Effective rate - % | 6.6% | -3.8% | 32.9% | 33.7% |
14 Prepaid Expenses
| | | |
| Consolidated | | 06.30.2016 | 12.31.2015 |
| Risk premium - GSF renegotiation (Note 14.1) | | 39,259 | 48,653 |
| Others | | 23,260 | 26,122 |
| | | 62,519 | 74,775 |
| | Current | 40,418 | 49,282 |
| | Noncurrent | 22,101 | 25,493 |
14.1 Risk Premium – GSF (Generation Scaling Factor) Renegotiation
The balances of the assets and liabilities of the renegotiation of the hydrologic risk are shown as follows:
| | | |
| Consolidated | | 06.30.2016 | 12.31.2015 |
| Risk premium - current asset | | 17,311 | 23,313 |
| Risk premium - noncurrent asset | | 21,948 | 25,340 |
| Intangible | | 36,671 | 30,807 |
| Liability deduction w ith CCEE | | 37,376 | 55,160 |
| | | 113,306 | 134,620 |
| | Risk premium to be amortized | 59,831 | 76,171 |
| | Grant extension period | 53,475 | 58,449 |
15 Related Parties
| | | | | |
| . | | Parent Company | | Consolidated |
| | | 06.30.2016 | 12.31.2015 | 06.30.2016 | 12.31.2015 |
| Controlling shareholders | | | | | |
| State of Paraná (15.1) | | 167,566 | 167,566 | 187,048 | 187,048 |
| Subsidiaries | | | | | |
| Copel Renováveis - Structure Sharing | | 3,362 | 312 | - | - |
| Copel Comercialização - Structure Sharing | | 839 | 135 | - | - |
| Copel Distribuição (15.2) | | 92,423 | 104,434 | - | - |
| Joint Ventures | | | | | |
| Voltalia São Miguel do Gostoso (15.3) | | 21,093 | - | 21,093 | - |
| | | 285,283 | 272,447 | 208,141 | 187,048 |
| | Current | 25,293 | 447 | 40,575 | 19,482 |
| | Noncurrent | 259,990 | 297,237 | 167,566 | 192,803 |
15.1 State of Paraná
15.1.1 Credit referring to theLuz Fraterna Program, R$153,300
Transfers of credit rights from Copel Distribuição’sLuz Fraterna account to Copel were suspended as of the second half of 2015, taking into account Decree 2789/2015, which created the possibility of using presumed ICMS credits to liquidate the invoices involving this program.
15.1.2 Credit referring to projects of the 2014 FIFA World Cup, R$14,266
The 2119th Executive Board Meeting of July 28, 2014 approved the transfer of credit rights involving mobility projects for the 2014 FIFA World Cup concluded by Copel Distribuição under the responsibility of the State of Paraná.
Aneel Order 4483/2015, endorsed the operation, which led to the signing of a Credit Assignment Instrument transferring the rights from Copel Distribuição to Copel.
15.1.3 Credit referring to theMorar Bem Program, R$19,482
TheMorar Bem Program in Paraná, created by Decree 2845/2011, is an arrangement between the State of Paraná, Companhia de Habitação do Paraná – Cohapar (the State Housing Company) and Copel Distribuição, under the management of Cohapar. Copel’s primary responsibilities under the arrangement involve the construction of electricity distribution networks and service entrances of the consumer units in the housing estates.
15.2 Copel Distribuição - Financing transferred - STN
The Company transferred loans and financing to its wholly-owned subsidiaries when they were founded in 2001. Nevertheless, as the agreements on the transfers to the respective subsidiaries were not subject to formalization with the financial institutions, these commitments are also recorded at the parent company.
The balance with Copel Distribuição refers to STN financing STN transferred with the same levy of charges borne by the Company and shown as obligations for loans and financing at Copel Distribuição (Note 22).
15.3 Voltalia São Miguel do Gostoso Participações S.A. - Loan
A loan agreement was signed on May 14, 2015 between Copel (lender) and Voltalia São Miguel do Gostoso Participações S.A. (borrower), retroactive to February 6, 2015, for R$29,400, with a term of two years and remuneration at 111.5% of the CDI rate, for the purpose of providing working capital to finance the borrower’s activities and business.
In the first half of 2016, Voltalia amortized R$5,112 and recorded financial income of R$1,725 (R$1,314 in the first half of 2015).
16 Judicial Deposits
| | | | |
| . | | Parent Company | | Consolidated |
| | 06.30.2016 | 12.31.2015 | 06.30.2016 | 12.31.2015 |
| Taxes claims | 85,882 | 266,692 | 290,925 | 457,449 |
| Labor claims | 383 | 330 | 218,033 | 169,194 |
| Civil | | | | |
| Suppliers | - | - | 2,828 | 2,828 |
| Civil | 393 | 389 | 84,284 | 75,788 |
| Easements | - | - | 7,972 | 7,715 |
| Customers | - | - | 3,537 | 3,628 |
| | 393 | 389 | 98,621 | 89,959 |
| Others | - | - | 3,325 | 3,325 |
| | 86,658 | 267,411 | 610,904 | 719,927 |
17 Investments
17.1 Changes in investments
| | | | | | | |
| Parent Company | | | Equity | Investiment/ | | Proposed | |
| Balance as of | | valuation | Advance for future | | dividends | Balance as of |
| January 1, 2016 | Equity | adjustments | capital increase | Amortization | and JCP | June 30, 2016 |
| Subsidiaries | | | | | | | |
| Copel Geração e Transmissão | 6,905,421 | 1,003,821 | (1) | 602,000 | - | (152,550) | 8,358,691 |
| Copel Distribuição | 5,603,673 | (103,377) | - | - | - | (730,526) | 4,769,770 |
| Copel Telecomunicações | 508,874 | 25,939 | - | - | - | (94,201) | 440,612 |
| Copel Renováveis | 17,889 | (11,723) | - | 5,000 | - | - | 11,166 |
| Copel Comercialização | 252,074 | 15,893 | (375) | - | - | (96) | 267,496 |
| UEG Araucária (17.2) | 171,648 | (8,560) | - | - | - | (23,072) | 140,016 |
| Compagás (17.2) | 150,818 | 11,892 | - | - | - | - | 162,710 |
| Elejor (17.2) | 51,800 | 7,780 | - | - | - | (21,798) | 37,782 |
| Elejor - concession rights | 15,270 | - | - | - | (377) | - | 14,893 |
| | 13,677,467 | 941,665 | (376) | 607,000 | (377) | (1,022,243) | 14,203,136 |
| Joint Ventures | | | | | - | | |
| Voltalia São Miguel do Gostoso I (17.3) | 72,249 | 2,797 | - | - | - | - | 75,046 |
| Voltalia São Miguel do Gostoso - concession rights | 11,507 | - | - | - | (184) | - | 11,323 |
| Paraná Gás | 106 | (26) | - | - | - | - | 80 |
| | 83,862 | 2,771 | - | - | (184) | - | 86,449 |
| Associates | | | | | | | |
| Sanepar (17.4) | 311,679 | 27,678 | (479) | - | - | (19,372) | 319,506 |
| Dona Francisca Energética (17.4) | 32,234 | 4,670 | - | - | - | (2,303) | 34,601 |
| Foz do Chopim Energética (17.4) | 15,574 | 5,904 | - | - | - | (7,082) | 14,396 |
| Carbocampel | 1,539 | (4) | - | 49 | - | - | 1,584 |
| Dois Saltos | 120 | - | - | - | - | - | 120 |
| Copel Amec | 203 | 7 | - | - | - | - | 210 |
| Escoelectric | 269 | (283) | - | 14 | - | - | - |
| | 361,618 | 37,972 | (479) | 63 | - | (28,757) | 370,417 |
| Other investments | | | | | | | |
| Finam | 755 | - | 1 | - | - | - | 756 |
| Finor | 179 | - | (68) | - | - | - | 111 |
| Investco S.A. | 9,447 | - | - | - | - | - | 9,447 |
| Other investments | 7,245 | - | 237 | - | - | - | 7,482 |
| | 17,626 | - | 170 | - | - | - | 17,796 |
| | 14,140,573 | 982,408 | (685) | 607,063 | (561) | (1,051,000) | 14,677,798 |
| | | | | | | |
| Consolidated | | | Equity | Investiment/ | Proposed | | |
| | Balance as of | | valuation | Advance for future | dividends | | Balance as of |
| | January 1, 2016 | Equity | adjustments | capital increase | and JCP | Amortization | June 30, 2016 |
| Joint Ventures (17.3) | | | | | | | |
| Dominó Holdings | 242,652 | 20,046 | (375) | - | - | (7,473) | 254,850 |
| Voltalia São Miguel do Gostoso I | 72,249 | 2,797 | - | - | - | - | 75,046 |
| Voltalia São Miguel do Gostoso - concession rights | 11,507 | - | - | - | (184) | - | 11,323 |
| Paraná Gás | 106 | (26) | - | - | - | - | 80 |
| Costa Oeste | 32,631 | 3,735 | - | - | - | - | 36,366 |
| Marumbi | 75,914 | 6,502 | - | 3,520 | - | 3,101 | 89,037 |
| Transmissora Sul Brasileira | 67,563 | 375 | - | - | - | - | 67,938 |
| Caiuá | 51,271 | 1,649 | - | - | - | 2,546 | 55,466 |
| Integração Maranhense | 104,286 | 2,483 | - | 1,569 | - | 4,248 | 112,586 |
| Matrinchã | 697,912 | 22,292 | - | 67,345 | - | - | 787,549 |
| Guaraciaba | 298,794 | 3,096 | - | 63,700 | - | 4 | 365,594 |
| Paranaíba | 100,726 | 5,562 | - | 7,291 | - | - | 113,579 |
| Mata de Santa Genebra | 26,903 | (3,241) | - | 120,240 | - | - | 143,902 |
| Cantareira | 60,105 | 1,467 | - | 26,147 | - | 389 | 88,108 |
| | 1,842,619 | 66,737 | (375) | 289,812 | (184) | 2,815 | 2,201,424 |
| Associates | | | | | | | |
| Sanepar (17.4) | 311,679 | 27,678 | (479) | - | - | (19,372) | 319,506 |
| Dona Francisca Energética (17.4) | 32,234 | 4,670 | - | - | - | (2,303) | 34,601 |
| Foz do Chopim Energética (17.4) | 15,574 | 5,904 | - | - | - | (7,082) | 14,396 |
| Carbocampel | 1,539 | (4) | - | 49 | - | - | 1,584 |
| Dois Saltos | 120 | - | - | - | - | - | 120 |
| Copel Amec | 203 | 7 | - | - | - | - | 210 |
| Escoelectric | 269 | (283) | - | 14 | - | - | - |
| | 361,618 | 37,972 | (479) | 63 | - | (28,757) | 370,417 |
| Other investments | | | | | | | |
| Finam | 755 | - | 1 | - | - | - | 756 |
| Finor | 179 | - | (68) | - | - | - | 111 |
| Investco S.A. | 9,447 | - | - | - | - | - | 9,447 |
| Assets for future use | 1,652 | - | - | - | - | - | 1,652 |
| Other investments | 8,440 | - | 237 | - | - | - | 8,677 |
| | 20,473 | - | 170 | - | - | - | 20,643 |
| | 2,224,710 | 104,709 | (684) | 289,875 | (184) | (25,942) | 2,592,484 |
17.2 Summarized financial statements of the subsidiaries with non controlling interest
| | | |
| 06.30.2016 | Compagás | Elejor | UEG Araucária |
| ASSETS | 498,008 | 725,966 | 772,419 |
| Current assets | 108,801 | 75,515 | 390,382 |
| Noncurrent assets | 389,207 | 650,451 | 382,037 |
| LIABILITIES | 498,008 | 725,966 | 772,419 |
| Current liabilities | 113,787 | 163,218 | 53,182 |
| Noncurrent liabilities | 65,181 | 508,773 | 19,157 |
| Equity | 319,040 | 53,975 | 700,080 |
| STATEMENT OF INCOME | | | |
| Operating revenues | 305,177 | 124,739 | 57,105 |
| Operating costs and expenses | (268,615) | (49,030) | (117,681) |
| Financial results | (404) | (58,885) | 17,775 |
| Income tax and social contribution | (12,839) | (5,708) | - |
| Net income | 23,319 | 11,116 | (42,801) |
| Other comprehensive income | - | - | - |
| Total comprehensive income | 23,319 | 11,116 | (42,801) |
| | | | |
| STATEMENTS OF CASH FLOWS | | | |
| Cash flow s from operational activities | 2,822 | 32,756 | 109,721 |
| Cash flow s from investiment activities | (13,053) | (818) | (24,160) |
| Cash flow s from financing activities | 8,685 | (34,305) | (200,000) |
| TOTAL EFFECTS ON CASH AND CASH EQUIVALENTS | (1,546) | (2,367) | (114,439) |
| Cash and cash equivalents at the beginning of the period | 29,321 | 41,655 | 132,854 |
| Cash and cash equivalents at the end of the period | 27,775 | 39,288 | 18,415 |
| CHANGE IN CASH AND CASH EQUIVALENTS | (1,546) | (2,367) | (114,439) |
17.3 Complete balances of the groups of assets, liabilities and earnings of the main joint ventures
| | | | | | | | | | | | |
| | | | | | Transmis- | | | | | | Mata de | |
| Dominó | | Costa | | sora Sul | | Integração | | | | Santa | Canta- |
| 06.30.2016 | (a) | Voltalia | Oeste | Marumbi | Brasileira | Caiuá | Maranhense | Matrinchã | Guaraciaba | Paranaíba | Genebra | reira |
| ASSETS | 535,587 | 153,383 | 108,048 | 172,829 | 693,234 | 236,222 | 475,094 | 2,435,025 | 1,238,841 | 1,242,517 | 812,450 | 245,357 |
| Current assets | 25,760 | 515 | 10,179 | 8,333 | 47,832 | 23,059 | 40,659 | 55,695 | 56,987 | 14,040 | 213,020 | 1,715 |
| Cash and cash equivalents | 3,119 | 74 | 4,892 | 2,182 | 19,300 | 1,600 | 462 | 6,310 | 51,258 | 4,936 | 203,979 | 1,590 |
| Other current assets | 22,641 | 441 | 5,287 | 6,151 | 28,532 | 21,459 | 40,197 | 49,385 | 5,729 | 9,104 | 9,041 | 125 |
| Noncurrent assets | 509,827 | 152,868 | 97,869 | 164,496 | 645,402 | 213,163 | 434,435 | 2,379,330 | 1,181,854 | 1,228,477 | 599,430 | 243,642 |
| . | | | | | | | | | | | | |
| LIABILITIES | 535,587 | 153,383 | 108,048 | 172,829 | 693,234 | 236,222 | 475,094 | 2,435,025 | 1,238,841 | 1,242,517 | 812,450 | 245,357 |
| Current liabilities | 15,482 | 230 | 4,229 | 10,495 | 42,470 | 22,275 | 67,651 | 104,584 | 432,673 | 161,450 | 507,547 | 39,896 |
| Financial liabilities | - | - | 3,107 | 5,162 | 31,153 | 7,342 | 13,127 | 47,936 | 401,972 | 38,251 | 497,197 | - |
| Other current liabilities | 15,482 | 230 | 1,122 | 5,333 | 11,317 | 14,933 | 54,524 | 56,648 | 30,701 | 123,199 | 10,350 | 39,896 |
| Noncurrent liabilities | - | - | 32,512 | 55,438 | 311,071 | 100,751 | 177,673 | 955,392 | 60,058 | 617,479 | 17,674 | 60,730 |
| Financial liabilities | - | - | 28,689 | 45,355 | 305,773 | 73,755 | 120,635 | 588,959 | - | 563,904 | - | - |
| Advance for future capital increase | - | - | - | 4,400 | - | - | - | 232,195 | - | - | - | 35,081 |
| Other noncurrent liabilities | - | - | 3,823 | 5,683 | 5,298 | 26,996 | 57,038 | 134,238 | 60,058 | 53,575 | 17,674 | 25,649 |
| Equity | 520,105 | 153,153 | 71,307 | 106,896 | 339,693 | 113,196 | 229,770 | 1,375,049 | 746,110 | 463,588 | 287,229 | 144,731 |
| . | | | | | | | | | | | | |
| STATEMENT OF INCOME | | | | | | | | | | | | |
| Net operating income | - | - | 9,584 | 16,461 | 25,465 | 9,459 | 13,633 | 231,343 | 197,104 | 130,264 | 193,535 | 96,537 |
| Operating costs and expenses | (488) | (80) | (1,147) | (5,691) | (4,189) | (906) | (1,944) | (133,626) | (159,229) | (66,575) | (164,040) | (92,087) |
| Financial results | (16,322) | 2 | (244) | (1,832) | (18,797) | (3,315) | (5,171) | (28,784) | (28,339) | (29,295) | (39,333) | 452 |
| Equity in income of subsidiaries | 57,720 | 5,785 | - | - | - | - | - | - | - | - | - | - |
| Income tax and social contribution | - | - | (870) | (810) | (601) | (2,140) | (1,450) | (23,437) | (3,218) | (11,694) | 3,369 | (1,907) |
| Net income | 40,910 | 5,707 | 7,323 | 8,128 | 1,878 | 3,098 | 5,068 | 45,496 | 6,318 | 22,700 | (6,469) | 2,995 |
| Other comprehensive income | (765) | - | - | - | - | - | - | - | - | - | - | - |
| Total comprehensive income | 40,145 | 5,707 | 7,323 | 8,128 | 1,878 | 3,098 | 5,068 | 45,496 | 6,318 | 22,700 | (6,469) | 2,995 |
| Investment interest - % | 49.0 | 49.0 | 51.0 | 80.0 | 20.0 | 49.0 | 49.0 | 49.0 | 49.0 | 24.5 | 50.1 | 49.0 |
| Investment book value | 254,850 | 75,046 | 36,366 | 89,037 | 67,938 | 55,466 | 112,586 | 787,549 | 365,594 | 113,579 | 143,902 | 88,108 |
| (a) Balances adjusted to accounting practices | | | | | | | | | | | |
17.4 Complete balances of the groups of assets, liabilities and earnings of the principal associates
| | | |
| 06.30.2016 | Sanepar (a) | Dona Francisca | Foz do Chopim |
| ASSETS | 8,447,113 | 158,944 | 47,492 |
| Current assets | 733,838 | 24,362 | 9,907 |
| Noncurrent assets | 7,713,275 | 134,582 | 37,585 |
| LIABILITIES | 8,447,113 | 158,944 | 47,492 |
| Current liabilities | 960,967 | 7,500 | 1,436 |
| Noncurrent liabilities | 3,296,022 | 1,204 | 5,814 |
| Equity | 4,190,124 | 150,240 | 40,242 |
| STATEMENT OF INCOME | | | |
| Net operating income | 1,682,696 | 35,269 | 20,959 |
| Operating costs and expenses | (1,150,688) | (14,250) | (4,028) |
| Financial income (expense) | (71,020) | 678 | 342 |
| Income tax and social contribution | (104,800) | (1,422) | (768) |
| Net income (loss) | 356,188 | 20,275 | 16,505 |
| Other comprehensive income | (6,287) | - | - |
| Total comprehensive income | 349,901 | 20,275 | 16,505 |
| Investment interest - % | 7.6252 | 23.0303 | 35.77 |
| Investment book value | 319,506 | 34,601 | 14,396 |
| |
| (a) Balances adjusted to accounting practices | | | |
18 Property, plant and equipment
18.1 Property, plant and equipment by asset class
| | | | | | |
| Consolidated | | Accumulated | | | Accumulated | |
| | Cost | depreciation | 06.30.2016 | Cost | depreciation | 12.31.2015 |
| In service | | | | | | |
| Reservoirs, dams and aqueducts | 7,614,787 | (4,857,981) | 2,756,806 | 7,621,081 | (4,787,437) | 2,833,644 |
| Machinery and equipment | 5,504,905 | (2,784,333) | 2,720,572 | 5,704,333 | (2,776,182) | 2,928,151 |
| Buildings | 1,652,887 | (1,088,493) | 564,394 | 1,653,693 | (1,068,430) | 585,263 |
| Land | 278,069 | (10,884) | 267,185 | 277,996 | (9,416) | 268,580 |
| Vehicles and aircraft | 62,466 | (43,850) | 18,616 | 63,101 | (42,861) | 20,240 |
| Furniture and tools | 17,013 | (10,994) | 6,019 | 16,910 | (10,578) | 6,332 |
| (-) Concession extension reclassification (Note 11) | (1,462,664) | 1,386,976 | (75,688) | (1,462,686) | 1,381,495 | (81,191) |
| (-) Provision for impairment (a) | (15,096) | - | (15,096) | (15,096) | - | (15,096) |
| (-) Special Obligations | (50) | - | (50) | (14) | - | (14) |
| | 13,652,317 | (7,409,559) | 6,242,758 | 13,859,318 | (7,313,409) | 6,545,909 |
| In progress | | | | | | |
| Cost | 3,402,619 | - | 3,402,619 | 2,851,078 | - | 2,851,078 |
| (-) Provision for impairment (a) | (704,305) | - | (704,305) | (704,305) | - | (704,305) |
| | 2,698,314 | - | 2,698,314 | 2,146,773 | - | 2,146,773 |
| | 16,350,631 | (7,409,559) | 8,941,072 | 16,006,091 | (7,313,409) | 8,692,682 |
| (a) Refers to concession assets for electricity generation. | | | | | |
18.2 Change in property, plant and equipment
| | | | | | |
| Consolidated | Balance as of | | | Loss on | | Balance as of |
| | January 1, 2016 | Additions (a) | Depreciation | disposal | Transfers | June 30, 2016 |
| In service | | | | | | |
| Reservoirs, dams and aqueducts | 2,830,290 | - | (72,780) | (556) | (3,236) | 2,753,718 |
| Machinery and equipment | 2,855,110 | - | (95,207) | (94,599) | (12,914) | 2,652,390 |
| Buildings | 581,554 | - | (18,203) | (2,631) | 321 | 561,041 |
| Land | 267,623 | - | (1,468) | (8) | 81 | 266,228 |
| Vehicles and aircraft | 20,205 | - | (1,940) | (120) | 444 | 18,589 |
| Furniture and tools | 6,236 | - | (425) | (4) | 130 | 5,937 |
| (-) Provision for impairment | (15,095) | - | - | - | - | (15,095) |
| (-) Special Obligations | (14) | - | 4 | - | (40) | (50) |
| | 6,545,909 | - | (190,019) | (97,918) | (15,214) | 6,242,758 |
| In progress | | | | | | |
| Cost | 2,851,078 | 625,306 | - | (8,846) | (64,919) | 3,402,619 |
| (-) Provision for impairment | (704,305) | - | - | - | - | (704,305) |
| | 2,146,773 | 625,306 | - | (8,846) | (64,919) | 2,698,314 |
| | 8,692,682 | 625,306 | (190,019) | (106,764) | (80,133) | 8,941,072 |
| (a) Of the additions total, R$21,419 w ere related to non-cash operations. | | | |
18.3 Costs of loans, financing and capitalized debentures
The costs of loans, financing and capitalized debentures under property, plant and equipment during the first half of 2016 amounted to R$3,437, at an average rate of 0.21% p.y. (R$88,931, at an average rate of 6.41% p.y., in the first half of 2015).
18.4 Colíder HPP
On July 30, 2010, under Aneel New Energy Auction 003/2010, Copel Geração e Transmissão S.A. was awarded the concession to exploit the Colíder HPP for a term of 35 years, commencing January 17, 2011, the signing date of MME - Colíder HPP concession agreement 001/11.
The project is part of the Brazilian Government’s Growth Acceleration Program - PAC, and will consist of a main power house with an installed capacity of 300 MW, sufficient to attend to 1 million inhabitants, based on the energy potential along the Teles Pires river separating the municipalities of Nova Canaã do Norte and Itaúba, in the northern region of the State of Mato Grosso.
The National Bank for Economic and Social Development (BNDES) endorsed the qualification of the Colíder HPP so as to analyze the viability of financial support and the financing agreement amounting to R$1,041,155 (Note 22). The amounts released up to June 30, 2016 total R$907,608.
Acts of God or force majeure and government actions impacted the development schedule, to the effect that commercial generation is expected for the first half of 2017. As a result of these events, this development shows a balance of provisions for the impairment of the assets amounting to R$642,551 as described in Note 18.9 of the financial statements of December 31, 2015.
The energy from the Colíder HPP was sold at an Aneel auction with a final tariff of R$103.40/MWh, at base date July 1, 2010, restated by the variance of the IPCA inflation index to R$155.93 on June 30, 2016. An average of 125 MW were traded, to come on stream beginning January 2015, for 30 years. Copel Geração e Transmissão filed with Aneel a request for exclusion of liability, so that the obligation to supply the energy sold is postponed. Since the request was not accepted, Copel Geração e Transmissão filed an administrative appeal with Aneel, requesting a reconsideration of the decision; it also intends to challenge this decision in court.
Until the merits of the request for exclusion of liability are examined by Aneel, the Company has been meeting its commitments with energy surpluses declined at its other plants and billed at the CCEAR (Electricity Commercialization Agreements in the Regulated Market) price. However, on February 12, 2016, the CCEE received a preliminary decision in the case records of Writ of Mandamus 1005856-20.2015.4.01.3400, filed by Copel Geração e Transmissão, ordering Aneel to refrain from imposing any obligations, penalties and/or restriction of rights arising from extrapolation of the milestones of the original construction schedule, until the request has been vetted. The effects of this decision are prospective to the settlement with the CCEE on October 13, 2015, temporarily suspending fulfilment of the sales contracts and making available an average of 125 MW for settlement at the PLD.
However, after Aneel’s examination of the request for exclusion of liability, the merits of the action will be subserved. The lawsuit will be dismissed after the administrative proceeding filed with that agency is resolved.
The physical guarantee of the development, established in the concession agreement, is 179.6 average MW once the machinery has been fully installed.
As of June 30, 2016, the expenditures with this development showed a balance of R$1,984,116.
Total commitments given to suppliers of equipment and services involving the Colíder HPP amount to R$97,517 on June 30, 2016.
18.5 Joint operations - consortiums
The amounts recorded under property, plant and equipment referring to the participations of Copel Geração e Transmissão in consortiums are shown below:
| | | | |
| | Share | Annual average | | |
| Joint operations | Copel GeT (%) | depreciation rate (%) | 06.30.2016 | 12.31.2015 |
| In service | | | | |
| HPP Mauá (Consórcio Energético Cruzeiro do Sul) | 51.00 | | 859,917 | 859,917 |
| (-) Accumulated depreciation | | 3.43 | (102,895) | (88,165) |
| | | | 757,022 | 771,752 |
| In progress | | | | |
| HPP Baixo Iguaçu (18.5.1) | 30.00 | | 303,709 | 270,097 |
| Consórcio Tapajós (18.5.2) | 13.80 | | 14,359 | 14,359 |
| | | | 318,068 | 284,456 |
| | | | 1,075,090 | 1,056,208 |
18.5.1 Baixo Iguaçu Development Consortium – Cebi
The purpose of the consortium is to build and run the development known as the Baixo Iguaçu Hydroelectric Plant, which has a minimum installed capacity of 350.20 MW, and is located on the Iguaçu River between the municipalities of Capanema and Capitão Leônidas Marques, and between the Governador José Richa HPP and the Iguaçu National Park, in the State of Paraná.
Commercial generation at unit 1 is expected to commence on December 1, 2018, while units 2 and 3 are expected to come on line in January and February 2019, respectively. The previous schedule was altered because the Installation Permit was suspended, as a result of the ruling by the Regional Federal Court of the 4th Region (TRF-RS), handed down on June 16, 2014, which brought the construction work to a halt when it was received on July 7, 2014. In March 2015, a ruling was published authorizing construction work to recommence. Nevertheless, the Chico Mendes Biodiversity Conservation Institute - ICMBio imposed additional caveats on the environmental permit, preventing the construction work from recommencing immediately. Cebi forwarded to the Environmental Institute of - IAP the information required for complying with those caveats, and in August 2015 the permit was issued. In possession of the IAP permit, the consortium is making arrangements for the work to resume at full speed as soon as possible.
On account of government actions, acts of God and force majeure, Aneel, initially under Order 130/216, subsequently amended by Order 1078/2016, acknowledged in favor of Cebi the exclusion of liability for delays in implementing the development for a period of 756 days, recommending that the MME extend the term of the concession and ordering the CCEE to arrange for the postponement of the start of the supply period under the CCEARs for the period during which the recognition of liability is excluded.
18.5.2 Tapajós Consortium
Copel Geração e Transmissão and eight other companies signed a Technical Cooperation Agreement to carry out studies on the Tapajós and Jamanxim rivers in the northern region of Brazil, covering feasibility and environmental studies of five hydroelectric developments with a total installed capacity of 10,682 MW envisaged at the outset of this phase of the studies.
18.6 Commitments of the wind farms
As of June 30, 2016, the total commitments entered into with suppliers of equipment and services for the wind farms under construction totaled R$1,565,218, primarily covering the supply of wind turbines to the subsidiaries of Cutia.
19 Intangible assets
19.1 Changes in Intangible Assets
| | | | | | | | |
| | | Concession contract (a) | Concession and | | Other (b) | |
| | in | in | Special liabilities | authorization | in | in | |
| | service | progress | in service | progress | rights | service | progress | Consolidated |
| Balance as of January 1, 2016 | 7,658,523 | 897,764 | (2,830,995) | (40,763) | 416,272 | 24,399 | 19,876 | 6,145,076 |
| Acquisitions | - | 408,916 | - | - | - | - | 2,828 | 411,744 |
| Customers contributions | - | - | - | (54,682) | - | - | - | (54,682) |
| ANEEL grant - use of public property | - | 502 | - | - | - | - | - | 502 |
| Renegotiation GSF | 7,486 | - | - | - | - | - | - | 7,486 |
| Provision for claims added to the cost of the w orks | - | 2,885 | - | - | - | - | - | 2,885 |
| Transfers to accounts receivable related to concession - | | | | | | | | |
| Extension of Copel Distribuição’s Concession (Note 10.1) | (2,230) | - | - | - | - | - | - | (2,230) |
| Transfers from property, plant and equipment | - | - | - | - | - | - | 30 | 30 |
| Capitalizations for accounts receivable related | | | | | | | | |
| to concession (Note 10.1) | - | (33,533) | - | - | - | - | - | (33,533) |
| Capitalizations for intangible in service | 340,700 | (340,700) | (47,068) | 47,068 | - | 3,416 | (3,416) | - |
| Amortization of quotas - concession and authorization | (210,633) | - | 56,695 | - | (6,569) | (4,339) | - | (164,846) |
| Amortization of quotas - Pasep/Cofins credits | (8,869) | - | 3,110 | - | - | (26) | - | (5,785) |
| Loss on disposal | (13,618) | (6,293) | - | - | - | - | (53) | (19,964) |
| Balance as of June 30, 2016 | 7,771,359 | 929,541 | (2,818,258) | (48,377) | 409,703 | 23,450 | 19,265 | 6,286,683 |
| (a) Amortization during the concession/authorization as of the start of commercial operations of the enterprises. | | | | |
| (b) Annual amortization rate: 20%. | | | | | | | | |
19.2 Costs of loans, financing and capitalized debentures
Costs of loans, financing and debentures capitalized in intangible assets during the first half of 2016 totaled R$6,654, at an average annual rate of 0.35% p.y. (R$19,757, at average annual rate of 1.09% p.y. during the first half of 2015).
20 Payroll, Social charges and Accruals
| | | | |
| . | Parent Company | | Consolidated |
| Consolidated | 06.30.2016 | 12.31.2015 | 06.30.2016 | 12.31.2015 |
| Social security liabilities | | | | |
| Taxes and social contribution | 791 | 3,151 | 34,224 | 43,691 |
| Social security charges on paid vacation and 13th salary | 907 | 2,246 | 40,082 | 32,186 |
| | 1,698 | 5,397 | 74,306 | 75,877 |
| Labor liabilities | | | | |
| Payroll, net | 56 | 195 | 2,279 | 2,568 |
| Vacation | 2,803 | 6,919 | 123,286 | 101,485 |
| Profit sharing | 257 | 2,925 | 22,783 | 78,462 |
| Others | - | - | 13 | 9 |
| | 3,116 | 10,039 | 148,361 | 182,524 |
| | 4,814 | 15,436 | 222,667 | 258,401 |
21 Suppliers
| | | |
| Consolidated | | 06.30.2016 | 12.31.2015 |
| Energy supplies (21.1) | | 614,737 | 917,307 |
| Materials and supplies | | 467,301 | 478,895 |
| Natural gas for resale | | 66,824 | 87,384 |
| Charges for use of grid system | | 86,678 | 135,463 |
| | | 1,235,540 | 1,619,049 |
| | Current | 1,229,617 | 1,613,126 |
| | Noncurrent | 5,923 | 5,923 |
21.1 Electricity - CCEE
On June 30, 2016, liabilities owed CCEE applying the effects of withdrawal of GSF’s preliminary court order due to renegotiation of hydrological risk, amounted to R$138,784, which has been paid as of April 18, 2016, in six monthly installments with interest charges and monetary correction.
21.2 Principal electricity purchasing contracts
Electricity purchasing contracts signed in the regulated market shown at original value and adjusted annually by the IPCA price index:
| | | | |
| . | Supply | Energy purchased | Auction | Average purchase |
| | period | (annual average MW) | date | price (R$/MWh) |
| Auction of pow er from existing facilities | | | | |
| 4thAuction - Product 2009 | 2009 to 2016 | 35.82 | 10.11.2005 | 94.91 |
| 12thAuction-Product 2014 36M | 01.01.2014 to 12.31.2016 | 131.12 | 12.17.2013 | 149.99 |
| 13thAuction-Product 2014 - DIS | 05.01.2014 to 12.31.2019 | 109.35 | 04.30.2014 | 262.00 |
| 13thAuction-Product 2014 - QTD | 05.01.2014 to 12.31.2019 | 221.76 | 04.30.2014 | 271.00 |
| 14thAuction-Product 2015 - 03 DIS | 01.01.2015 to 12.31.2017 | 13.32 | 12.05.2014 | 191.99 |
| 14thAuction-Product 2015 - 03 QTD | 01.01.2015 to 12.31.2017 | 13.76 | 12.05.2014 | 201.00 |
| | | 525.13 | | |
| Auction of pow er from new facilities | | | | |
| 1st Auction- Product 2008 Hydro | 2008 to 2037 | 3.62 | 12.16.2005 | 106.95 |
| 1st Auction- Product 2008 Thermo | 2008 to 2022 | 24.81 | 12.16.2005 | 132.26 |
| 1st Auction- Product 2009 Hydro | 2009 to 2038 | 3.55 | 12.16.2005 | 114.28 |
| 1st Auction- Product 2009 Thermo | 2009 to 2023 | 40.55 | 12.16.2005 | 129.26 |
| 1st Auction- Product 2010 Hydro | 2010 to 2039 | 70.06 | 12.16.2005 | 115.04 |
| 1st Auction- Product 2010 Thermo | 2010 to 2024 | 65.19 | 12.16.2005 | 121.81 |
| 3rd Auction- Product 2011 Hydro | 2011 to 2040 | 57.82 | 10.10.2006 | 120.86 |
| 3rd Auction- Product 2011 Thermo | 2011 to 2025 | 54.37 | 10.10.2006 | 137.44 |
| 4th Auction- Product 2010 Thermo | 2010 to 2024 | 15.49 | 07.26.2007 | 134.67 |
| 5th Auction- Product 2012 Hydro | 2012 to 2041 | 53.39 | 10.16.2007 | 129.14 |
| 5th Auction- Product 2012 Thermo | 2012 to 2026 | 115.69 | 10.16.2007 | 128.37 |
| 6th Auction- Product 2011 Thermo | 2011 to 2025 | 9.92 | 09.17.2008 | 128.42 |
| 7th Auction- Product 2013 Hydro | 2013 to 2042 | 0.15 | 09.30.2008 | 98.98 |
| 7th Auction- Product 2013 Thermo | 2013 to 2027 | 111.27 | 09.30.2008 | 145.23 |
| 8th Auction- Product 2012 Hydro | 2012 to 2041 | 33.85 | 08.27.2009 | 144.00 |
| 8th Auction- Product 2012 Thermo | 2012 to 2026 | 0.01 | 08.27.2009 | 144.60 |
| | | 659.74 | | |
| Structuring projects auction | | | | |
| Santo Antonio | 2012 to 2041 | 138.12 | 12.10.2007 | 78.87 |
| Jirau | 2013 to 2042 | 229.81 | 05.19.2008 | 71.37 |
| | | 367.93 | | |
22 Loans and financing
| | | | | | | | | |
| | | | Issue | Number of | Final | Annual rate p.y. | | Consolidated |
| | Contracts | Company | Date | installment | maturity | (interest + commission) | Principal | 06.30.2016 | 12.31.2015 |
| Foreign currency | | | | | | | | |
| | National Treasury Department | | | | | | | | |
| | (Secretaria do Tesouro Nacional or STN) | | | | | | | | |
| (1) | Par Bond | Copel | 05.20.1998 | 1 | 04.11.2024 | 6.0% + 0.20% | 17,315 | 54,651 | 61,763 |
| (1) | Discount Bond | Copel | 05.20.1998 | 1 | 04.11.2024 | 1.1875%+0.20% | 12,082 | 37,772 | 42,671 |
| Total foreign currency | | | | | | | 92,423 | 104,434 |
| Local currency | | | | | | | | |
| | Banco do Brasil | | | | | | | | |
| (2) | 21/02155-4 | Copel DIS | 09.10.2010 | 2 | 08.15.2018 | 109.0% of DI | 116,667 | 122,607 | 122,353 |
| (3) | 21/02248-8 | Copel DIS | 06.22.2011 | 2 | 05.16.2018 | 109.0% of DI | 150,000 | 152,143 | 151,901 |
| (4) | CCB 21/11062X | Copel DIS | 08.26.2013 | 3 | 07.27.2018 | 106.0% of DI | 151,000 | 211,594 | 196,852 |
| (5) | CCB 330.600.773 | Copel DIS | 07.11.2014 | 3 | 07.11.2019 | 111.8% of DI | 116,667 | 123,769 | 123,478 |
| (5) | NCI 330.600.132 | Copel | 02.28.2007 | 3 | 02.28.2019 | 107.8% of DI | 231,000 | 241,265 | 241,059 |
| (5) | NCI 330.600.151 | Copel | 07.31.2007 | 3 | 07.31.2017 | 111.0% of DI | 18,000 | 12,724 | 12,722 |
| (5) | CCB 306.401.381 | Copel | 07.21.2015 | 2 | 07.21.2018 | 109.41% of DI | 640,005 | 674,350 | 672,985 |
| | | | | | | | | 1,538,452 | 1,521,350 |
| | Eletrobras | | | | | | | | |
| (6) | 1293/94 | Copel GeT | 09.23.1994 | 180 | 06.30.2016 | 5.5% to 6.5% + 2,0% | 307,713 | - | 16,980 |
| (7) | 980/95 | Copel DIS | 12.22.1994 | 80 | 11.15.2018 | 8.0% | 11 | 7 | 8 |
| (7) | 981/95 | Copel DIS | 12.22.1994 | 80 | 08.15.2019 | 8.0% | 1,169 | 213 | 246 |
| (7) | 982/95 | Copel DIS | 12.22.1994 | 80 | 02.15.2020 | 8.0% | 1,283 | 83 | 95 |
| (7) | 983/95 | Copel DIS | 12.22.1994 | 80 | 11.15.2020 | 8.0% | 11 | 115 | 128 |
| (7) | 984/95 | Copel DIS | 12.22.1994 | 80 | 11.15.2020 | 8.0% | 14 | 49 | 55 |
| (7) | 985/95 | Copel DIS | 12.22.1994 | 80 | 08.15.2021 | 8.0% | 61 | 32 | 35 |
| (8) | 002/04 | Copel DIS | 06.07.2004 | 120 | 07.30.2016 | 8.0% | 30,240 | 92 | 643 |
| (8) | 142/06 | Copel DIS | 05.11.2006 | 120 | 09.30.2018 | 5.0% + 1.0% | 74,340 | 8,188 | 10,007 |
| (8) | 206/07 | Copel DIS | 03.03.2008 | 120 | 08.30.2020 | 5.0% + 1.0% | 109,642 | 37,098 | 41,550 |
| (8) | 273/09 | Copel DIS | 02.18.2010 | 120 | 12.30.2022 | 5.0% + 1.0% | 63,944 | 10,688 | 11,510 |
| (8) | 2540/06 | Copel DIS | 05.12.2009 | 60 | 10.30.2016 | 5.0% + 1.5% | 5,095 | 150 | 375 |
| | | | | | | | | 56,715 | 81,632 |
| | Caixa Econônica Federal | | | | | | | | |
| (8) | 415.855-22/14 | Copel DIS | 03.31.2015 | 120 | 12.08.2026 | 6.0% | 2,844 | 5,441 | 5,307 |
| | | | | | | | | 5,441 | 5,307 |
| | Finep | | | | | | | | |
| (9) | 21120105-00 | Copel Tel | 05.17.2012 | 81 | 10.15.2020 | 4.0% | 35,095 | 13,540 | 15,132 |
| (9) | 21120105-00 | Copel Tel | 05.17.2012 | 81 | 10.15.2020 | 3.5% + TR | 17,103 | 11,229 | 12,406 |
| | | | | | | | | 24,769 | 27,538 |
| | BNDES | | | | | | | | |
| (10) | 820989.1 | Copel GeT | 03.17.2009 | 179 | 01.15.2028 | 1.63% above TJLP | 169,500 | 133,540 | 138,347 |
| (11) | 1120952.1-A | Copel GeT | 12.16.2011 | 168 | 04.15.2026 | 1.82% above TJLP | 42,433 | 30,226 | 31,558 |
| (12) | 1120952.1-B | Copel GeT | 12.16.2011 | 168 | 04.15.2026 | 1.42% above TJLP | 2,290 | 1,630 | 1,702 |
| (13) | 1220768.1 | Copel GeT | 09.28.2012 | 192 | 07.15.2029 | 1.36% above TJLP | 73,122 | 61,403 | 63,312 |
| (14) | 13211061 | Copel GeT | 12.04.2013 | 192 | 10.15.2031 | 1.49% above TJLP | 1,041,155 | 880,148 | 902,592 |
| (15) | 13210331 | Copel GeT | 12.03.2013 | 168 | 08.15.2028 | 1.49% and 1.89% above TJLP | 17,644 | 15,543 | 16,077 |
| (16) | 15206041 | Copel GeT | 12.28.2015 | 168 | 06.15.2030 | 2.42% above TJLP | 34,265 | 27,434 | 23,942 |
| (17) | 15205921 | Copel GeT | 12.28.2015 | 168 | 12.15.2029 | 2.32% above TJLP | 21,584 | 17,391 | 14,663 |
| (18) | 14205611-A | Copel DIS | 12.15.2014 | 72 | 01.15.2021 | 2.09% p.y. above TJLP | 41,583 | 31,088 | 34,266 |
| (18) | 14205611-B | Copel DIS | 12.15.2014 | 6 | 02.15.2021 | 2.09 p.y. above TR BNDES | 17,821 | 17,763 | 21,267 |
| (19) | 14205611-C | Copel DIS | 12.15.2014 | 113 | 06.15.2024 | 6% p.y. | 78,921 | 62,698 | 47,353 |
| (20) | 14205611-D | Copel DIS | 12.15.2014 | 57 | 02.15.2021 | TJLP | 750 | 42 | - |
| (21) | 14.2.1271.1 | Santa Maria | 06.01.2015 | 192 | 08.15.2031 | 1.66% p.y. above TJLP | 59,462 | 56,176 | 57,789 |
| (21) | 14.2.1272.1 | Santa Helena | 06.01.2015 | 192 | 08.15.2031 | 1.66% p.y. above TJLP | 64,520 | 60,918 | 62,487 |
| (22) | 11211521 | GE Farol | 03.19.2012 | 192 | 06.15.2030 | 2.34% p.y. above TJLP | 54,100 | 53,572 | 55,087 |
| (22) | 11211531 | GE Boa Vista | 03.19.2012 | 192 | 06.15.2030 | 2.34% p.y. above TJLP | 40,050 | 39,605 | 40,726 |
| (22) | 11211541 | GE S. B. do Norte | 03.19.2012 | 192 | 06.15.2030 | 2.34% p.y. above TJLP | 90,900 | 89,821 | 92,362 |
| (22) | 11211551 | GE Olho D'Água | 03.19.2012 | 192 | 06.15.2030 | 2.34% p.y. above TJLP | 97,000 | 95,506 | 98,228 |
| | | | | | | | | 1,674,504 | 1,701,758 |
| (23) | Promissory notes | Copel GeT | 12.29.2015 | 1 | 12.18.2017 | 117% of DI | 500,000 | 537,716 | 496,694 |
| | | | | | | | | 537,716 | 496,694 |
| | Banco do Brasil | | | | | | | | |
| | BNDES Transfer | | | | | | | | |
| (24) | 21/02000-0 | Copel GeT | 04.16.2009 | 179 | 01.15.2028 | 2,13% above TJLP | 169,500 | 133,538 | 138,347 |
| | | | | | | | | 133,538 | 138,347 |
| Total local currency | | | | | | | 3,971,135 | 3,972,626 |
| | | | | | | | | 4,063,558 | 4,077,060 |
| | | | | | | | Current | 464,480 | 308,558 |
| | | | | | | Noncurrent | 3,599,078 | 3,768,502 |
| | | | | | | | |
| | | Issue | Number of | Final | Annual rate p.y. | | Parent Company |
| | Contracts | Date | installment | maturity | (interest + commission) | Principal | 06.30.2016 12.31.2015 |
| Foreign currency | | | | | | | |
| | STN | | | | | | | |
| (1) | Par Bond | 05.20.1998 | 1 | 04.11.2024 | 6.0% + 0.20% | 17,315 | 54,651 | 61,763 |
| (1) | Discount Bond | 05.20.1998 | 1 | 04.11.2024 | 1.1875%+0.20% | 12,082 | 37,772 | 42,671 |
| | | | | | | | 92,423 | 104,434 |
| Local currency | | | | | | | |
| | Banco do Brasil | | | | | | | |
| (5) | NCI 330.600.132 | 02.28.2007 | 3 | 02.28.2019 | 107.8% of DI | 231,000 | 241,265 | 241,059 |
| (5) | NCI 330.600.151 | 07.31.2007 | 3 | 07.31.2017 | 111.0% of DI | 18,000 | 12,724 | 12,722 |
| (5) | CCB 306.401.381 | 07.21.2015 | 2 | 07.21.2018 | 109.41% of DI | 640,005 | 674,350 | 672,985 |
| | | | | | | | 928,339 | 926,766 |
| | | | | | | | 1,020,762 | 1,031,200 |
| | | | | | | Circulante | 137,202 | 61,788 |
| | | | | | Não circulante | 883,560 | 969,412 |
Banco do Brasil: annual installments
(2) Installments in the amount of R$58,334, falling due on February 2, 2017, and February 2, 2018. The proportional interest is paid half-yearly.
(3) Installments in the amount of R$75,000, falling due on May 16, 2017, and May 16, 2018. The proportional interest is paid half-yearly.
(4) Together w ith the data is the interest accrued on the installments, in the amount of R$50,333, falling due on July 27, 2016, July 27, 2017 and July 27, 2018.
(5) Contract CCB 330600773: Installments in the amount of R$38,889, falling due on July 11, 2017, July 11, 2018 and July 11, 2019. The interest is paid half-yearly.
Contract NCI 330600132: Installments in the amount of R$77,000, falling due on February 28, 2017, February 28, 2018 and February 28, 2019. The interest is paid half-yearly.
Contract NCI 330600151: Installments in the amount of R$6,000, falling due on July 31, 2015, July 31, 2016 and July 31, 2017. The interest is paid half-yearly.
Contract CCB 306401381: Installments in the amount of R$320,003, falling due on July 21, 2017, and July 21, 2018. The interest is paid half-yearly.
Allocation:
(1) The restructuring of medium and long-term debt in connection w ith the financing received under Law nº 4,131/62. (2) (3) (4) Working capital.
(5) Paying the debts.
(6) Financial cover up to 29.14% of the total project of HPP Governador José Richa Implementation and transmission system. (7) National Program for Watering - Proni.
(8) Rural Electricity Program -Luz para Todos.
(9) BEL project - ultra w ide band intranet service (Ultra Wide Band - UWB).
(10) (24) Construction of the Mauá Hydroelectric Pow er Plant and its transmission system, in consortium w ith Eletrosul. (11) Implementation of transmission line betw een substations Foz do Iguaçu and Cascavel Oeste.
(12) Purchase of machinery and equipment for implementation of the transmission line described above. (13) Implementation of Cavernoso II SHP.
(14) Implementation of HPP Colíder and associated transmission system. (15) Implementation of the 230/138kV Cerquilho III Substation.
(16) Implementation of transmission line Assis – Paraguaçu Paulista II.
(17) Implementation of transmission lines Londrina – Figueira and Salto Osório – Foz do Chopim C2.
(18) Investment in preservation of businesses, improvements, operational support and general investments in expansion. (19) National machinery and equipment accredited by BNDES.
(20) Implementation, expansion and consolidation of projects and Enterprises Social Investment Programs (ISE). (21) (22) Construction and implementation of w ind generating plant.
(23) Payment of grant – auction no. 012/2015, relative to HPP GPS.
Guarantees:
(1) Company’s centralized revenues account. Deposited Collateral (Note 22.1).
(2) (3) Pledge until 360 days.
(2) (3) (4) (5) Credit assignment.
(6) (7) (8) Ow n revenue, supported by pow er of attorney granted by a public instrument, and the issue of promissory notes and commercial duplicates equal to the number of installments falling due.
(9) Withhold the amounts from the checking account in w hich revenues are deposited.
(10) (13) (24) Total revenue from the sale and/or transaction of CCEAR energy, related to the project, through Concession Agreement of Attachment of Revenues, Account Management and Other Covenants.
(11) (12) Fiduciary assignment of rights under the Concession Agreement No. 027/2009-ANEEL, Transmission Service Provision Contract no.
(14) Fiduciary assignment of rights under the Concession Agreement no. 01/2011MME-HPP Colíder and fiduciary assignment due to the Purchase and Sale of Energy Eétrica (CCVEE) betw een Copel and Sadia S.A.
(15) Fiduciary assignment of rights under the Public Service Concession Agreement for Electric Pow er Transmission No. 015/2010-ANEEL, signed betw een Copel and the Federal Government.
(16) Assignment of credit rights deriving from Concession Agreement No. 002/2013 - ANEEL. (17) Assignment of credit rights deriving from Concession Agreement No. 022/2012 - ANEEL.
(18) (19) (20) Surety of Companhia Paranaense de Energia; fiduciary assignment of income and indemnity rights of the concession.
(21) Guarantee from Companhia Paranaense de Energia; pledge of shares; assignment of credit rights deriving from Electricity Agreement Reservation No. 153/2011; assignment of revenues arising from the project.
(22) Pledge of shares; assignment of receivables arising from the sale of electricity produced by the project; assignment of machinery and equipment assembled or built w ith the funds pegged to it.
(23) Surety of Companhia Paranaense de Energia.
22.1 Collateral and escrow deposits - STN
Guarantees provided in the form of Par Bondsfor R$44,980 (R$50,689 on December 31, 2015), and Discount Bonds in the amount of R$31,382 (R$35,448 at December 31, 2015), to be used to repay amounts of principal corresponding to STN contracts, when these payments are due on April 11, 2024. The amounts are updated by applying the weighted average percentage changes of United States Treasury Zero Coupon bond prices, by the share of each series of the instrument in the portfolio of collateral for principal, provided in the context of the Brazilian Financing Plan - 1992.
22.2 Breakdown of loans and financing by currency and indexer
| | | | | |
| | Index and change in foreign currencies | | | Consolidated |
| | accumulated in the period (%) | 06.30.2016 | % | 12.31.2015 | % |
| Foreign currency | | | | | |
| U.S. Dolar | (17.80) | 92,423 | 2.27 | 104,434 | 2.56 |
| | | 92,423 | 2.27 | 104,434 | 2.56 |
| Local currency | | | | | |
| CDI | (0.07) | 2,076,168 | 51.09 | 2,018,044 | 49.50 |
| TJLP | 7.14 | 1,727,581 | 42.51 | 1,771,485 | 43.45 |
| Ufir | 0.00 | 62,156 | 1.53 | 69,959 | 1.72 |
| IPCA | 4.42 | 17,763 | 0.44 | 21,267 | 0.52 |
| TR | 0.94 | 11,229 | 0.28 | 12,406 | 0.30 |
| Finel | 1.39 | - | - | 16,980 | 0.42 |
| Without indexer | - | 76,238 | 1.88 | 62,485 | 1.53 |
| | | 3,971,135 | 97.73 | 3,972,626 | 97.44 |
| | | 4,063,558 | 100.00 | 4,077,060 | 100.00 |
| | Current | 464,480 | | 308,558 | |
| | Noncurrent | 3,599,078 | | 3,768,502 | |
22.3 Long-term installment due dates
| | | | | | |
| | | Parent Company | | | Consolidated |
| | Foreign | Local | | Foreign | Local | |
| 06.30.2016 | currency | currency | Total | currency | currency | Total |
| 2017 | - | 322,326 | 322,326 | - | 1,142,380 | 1,142,380 |
| 2018 | - | 392,980 | 392,980 | - | 755,563 | 755,563 |
| 2019 | - | 76,653 | 76,653 | - | 270,321 | 270,321 |
| 2020 | - | - | - | - | 151,235 | 151,235 |
| 2021 | - | - | - | - | 135,989 | 135,989 |
| After 2021 | 91,601 | - | 91,601 | 91,601 | 1,051,989 | 1,143,590 |
| | 91,601 | 791,959 | 883,560 | 91,601 | 3,507,477 | 3,599,078 |
22.4 Changes in loans and financing
| | | | | |
| | Foreign currency | | Local currency | |
| Consolidated | Current | Noncurrent | Current | Noncurrent | Total |
| Balance as of January 1, 2016 | 887 | 103,547 | 307,671 | 3,664,955 | 4,077,060 |
| Funding | - | - | - | 24,854 | 24,854 |
| Charges | 1,975 | - | 180,414 | 43,429 | 225,818 |
| Monetary and exchange variations | - | (11,946) | 2,212 | 11,416 | 1,682 |
| Transfers | - | - | 237,177 | (237,177) | - |
| Amortization - principal | - | - | (93,089) | - | (93,089) |
| Payment - charges | (2,040) | - | (170,727) | - | (172,767) |
| Balance as of June 30, 2016 | 822 | 91,601 | 463,658 | 3,507,477 | 4,063,558 |
22.5 Covenants
The Company and its subsidiaries signed loan and financing agreements containing covenants that require certain economic and financial ratios to remain within pre-determined parameters, requiring annual fulfillment and other conditions to be observed, such as not making any alteration to the Company’s shareholdings in the capital stock of subsidiaries that would alter control without prior consent. Failing to fulfill these conditions may lead to accelerated debt repayment and/or fines.
On June 30, 2016, all the agreed conditions had been fulfilled.
23 Debentures
| | | | | | | | | | |
| | | | Issue | Number of | Maturity | Annual rate p.y. | | Consolidated |
| Issue | Company | Date | installment | initial | final | (interest) | Principal | 06.30.2016 | 12.31.2015 |
| (1) | 5th | Copel | 05.13.2014 | 3 | 05.13.2017 | 05.13.2019 | 111.5% above DI | 1,000,000 | 1,016,847 | 1,016,087 |
| (2) | 1st | Copel GeT | 05.20.2015 | 3 | 05.20.2018 | 05.20.2020 | 113.0% above DI | 1,000,000 | 1,015,066 | 1,090,755 |
| (3) | 1st | Copel DIS | 10.30.2012 | 2 | 10.30.2016 | 10.30.2017 | DI + Spread 0.99% p.y. | 1,000,000 | 1,023,592 | 1,023,378 |
| (4) | 1st | Copel CTE | 11.10.2015 | 5 | 10.15.2020 | 10.15.2024 | IPCA + Spread 7.9633% p.y. | 160,000 | 170,818 | 162,158 |
| (5) | 2nd | Elejor | 09.26.2013 | 60 | 10.26.2013 | 09.26.2018 | DI + Spread 1.00% p.y. | 203,000 | 91,232 | 111,516 |
| (6) | 1st | Compagás | 06.15.2013 | 40 | 09.15.2015 | 12.15.2018 | TJLP+1.7% p.y.+1.0% p.y. | 62,626 | 70,855 | 56,219 |
| (7) | 1st | (a) | 06.10.2014 | 1 | - | 12.10.2016 | 100% CDI + Spread 1,45% p.y. | 222,000 | 223,865 | 223,815 |
| | | | | | | | | | 3,612,275 | 3,683,928 |
| | | | | | | | | Current | 1,180,279 | 924,005 |
| | | | | | | | Noncurrent | 2,431,996 | 2,759,923 |
| (a) | Nova Asa Branca I, Nova Asa Branca II, Nova Asa Branca III, Nova Eurus IV e Ventos de Santo Uriel. | | | |
Characteristics:
The unit value of debentures w ill not be adjusted for inflation.
(1) (2) (3) (4) (5) (7) Simple debentures, single series, not convertible into shares, unsecured, for public distribution w ith restricted placement efforts, according to CVM No. 476.
(6) Simple floating debentures, issued privately in a single series and not convertible into shares.
Finance charges:
(1) Half-yearly interest - May and November. (2) Anuual interest - May.
(3) (4) Half-yearly interest - April and October. (5) Monthly interest.
(6) Quarterly interest - March, June, September and December. (7) Half-yearly interest - June and December.
Allocation:
(1) (2) (3) Working capital or used to make investments in the issuer.
(4) Deployment, expansion and modernization of the telecommunication netw ork. (5) Full settlement of the loan agreement w ith Copel.
(6) Fund investment plan of the issuer.
(7) Redemption of promissory notes and investment in w ind farms.
Collaterals:
(1) (2) (3) (4) (5) (7) Personal guarantee (6) Floating
Guarantor:
(2) (3) (4) (7) Copel.
(5) Copel, at the ratio of 70% and Paineira Participações S.A., at the ratio of 30%. (6) Compagás.
Trustee:
(1) (2) (3) (4) (5) (7) Pentágono S.A. DTVM.
(6) BNDES Participações S.A. - BNDESPAR.
50
23.1 Long-term installment due dates
| | |
| 06.30.2016 | Parent Company | Consolidated |
| 2017 | - | 532,252 |
| 2018 | 332,752 | 719,199 |
| 2019 | 332,751 | 669,954 |
| 2020 | - | 345,610 |
| 2021 | - | 22,045 |
| After 2021 | - | 142,936 |
| | 665,503 | 2,431,996 |
23.2 Changes in debentures
| | | |
| Consolidated | Current | Noncurrent | Total |
| Balance as of January 1, 2016 | 924,005 | 2,759,923 | 3,683,928 |
| Funding | - | 23,532 | 23,532 |
| Charges | 262,701 | 9,310 | 272,011 |
| Transfers | 360,769 | (360,769) | - |
| Amortization - principal | (29,672) | - | (29,672) |
| Payment - charges | (337,524) | - | (337,524) |
| Balance as of June 30, 2016 | 1,180,279 | 2,431,996 | 3,612,275 |
23.3 Covenants
COPEL and its subsidiaries issued debentures containing covenants that require certain economic and financial ratios to be kept within pre-determined parameters, with requiring annual fulfillment and other conditions to be observed, such as not making any alteration to the Company’s shareholdings in capital stock that would alter control without prior consent from the debenture holders; not paying out dividends or interest on own capital if it is in arrears in relation to honoring any of its financial obligations or not keeping the financial ratios as determined without prior written consent of the debenture holders. Failing to fulfill these conditions may lead to accelerated redemption of debentures and regulatory penalties.
On June 30, 2016, all the agreed conditions had been fulfilled.
24 Post-employment benefits
The Company and its subsidiaries sponsor private retirement and pension plans (Unified Plan and Plan III) and medical and dental care (Healthcare Plan) for their active employees and post-employment beneficiaries and their dependents.
24.1 Pension Plan
The unified pension plan is a defined benefit (DB) plan in which income is pre-determined by each individual’s salary level whereas pension plan III is a variable contribution (VC) plan.
The portions of costs borne by these plans’ sponsors are recognized based on an annual actuarial valuation made by independent actuaries in accordance with CPC 33 (R1) as of January 1, 2013, which covers employee benefits correlated to international accounting standard IAS 19 R and IFRIC 14. The economic and financial assumptions made for the purposes of actuarial valuation are discussed with the independent actuaries and approved by the sponsors’ management.
24.2 Healthcare Plan
The Company and its subsidiaries allocate resources to cover health expenses incurred by employees and their dependents within certain rules, limits and conditions set forth in specific regulations. Coverage is lifelong and includes periodic medical check ups and extends to all retirees and pensioners.
24.3 Statement of financial position and statement of income
Consolidated amounts recognized in liabilities, in the Post-employment benefits account, are summarized below:
| | | | | |
| | | | Parent Company | | Consolidated |
| | | 06.30.2016 | 12.31.2015 | 06.30.2016 | 12.31.2015 |
| Pension plan | | 6 | 21 | 1,049 | 1,008 |
| Healthcare plan | | 11,814 | 7,795 | 636,848 | 593,652 |
| | | 11,820 | 7,816 | 637,897 | 594,660 |
| | Current | 161 | 21 | 43,467 | 43,323 |
| | Noncurrent | 11,659 | 7,795 | 594,430 | 551,337 |
Consolidated amounts recognized in the statement of income are summarized below:
| | | | |
| . | | Parent Company | | Consolidated |
| | 06.30.2016 | 06.30.2015 | 06.30.2016 | 06.30.2015 |
| Pension plan (VC) | 943 | 1,956 | 36,627 | 30,813 |
| Pension plan (VC) - management | 234 | 227 | 505 | 1,665 |
| Healthcare plan - post employment | 3,717 | 772 | 64,421 | 71,184 |
| Healthcare plan - active employees | 459 | 997 | 34,574 | 30,996 |
| Healthcare plan - management | 52 | 39 | 138 | 68 |
| (-) Transfers to construction in progress | - | (3) | (10,237) | (8,828) |
| | 5,405 | 3,988 | 126,028 | 125,898 |
| |
| . | | Parent Company | | Consolidated |
| | 04.01.2016 | 04.01.2015 | 04.01.2016 | 04.01.2015 |
| | to 06.30.2016 | to 06.30.2015 | to 06.30.2016 | to 06.30.2015 |
| Pension plan (VC) | 319 | 992 | 17,661 | 14,337 |
| Pension plan (VC) - management | 143 | 148 | 328 | 1,492 |
| Healthcare plan - post employment | 1,677 | 385 | 32,212 | 35,609 |
| Healthcare plan - active employees | 175 | 490 | 17,378 | 14,611 |
| Healthcare plan - management | 29 | 19 | 68 | 33 |
| (-) Transfers to construction in progress | - | - | (5,127) | (4,372) |
| | 2,343 | 2,034 | 62,520 | 61,710 |
24.4 Changes in post-employment benefits
| | | |
| Consolidated | | | |
| | Current | Noncurrent | Total |
| Balance as of January 1, 2016 | 43,323 | 551,337 | 594,660 |
| Appropriation of actuarial calculation | - | 64,424 | 64,424 |
| Pension and healthcare contributions | 66,957 | - | 66,957 |
| Transfers | 21,331 | (21,331) | - |
| Amortizations | (88,144) | - | (88,144) |
| Balance as of June 30, 2016 | 43,467 | 594,430 | 637,897 |
24.5 Actuarial valuation in accordance with CPC 33 (R1)
The Company and its subsidiaries, in accordance with CPC 33 (R1), decided to prepare an annual actuarial report.
The information compiled in accordance with the actuarial valuation report is contained in Note 24 of the financial statements of December 31, 2015.
25 Customer Charges Due
| | |
| Consolidated | 06.30.2016 | 12.31.2015 |
| Energy Development Account (CDE) (a) | 137,908 | 204,309 |
| Global Reversal Reserve (RGR) | 6,382 | 20,768 |
| Tariff flags | - | 52,381 |
| | 144,290 | 277,458 |
| (a) Aneel published Resolutions No. 2,004/2015 and No. 2,077/2016. | | |
26 Research and Development and Energy Efficiency
26.1 Balances made for investment in Research and Development (R&D) and the Energy Efficiency Program (EEP)
| | | | | |
| Consolidated | Amounts payable, | Amounts payable | Other | | |
| | before any related | to regulatory | amounts | Balance as of | Balance as of |
| | prepayments | agencies | payable | 06.30.2016 | 12.31.2015 |
| Research and Development - R&D | | | | | |
| FNDCT (a) | - | 3,662 | - | 3,662 | 5,762 |
| MME | - | 1,831 | - | 1,831 | 2,882 |
| R&D | 72,264 | - | 201,066 | 273,330 | 252,828 |
| | 72,264 | 5,493 | 201,066 | 278,823 | 261,472 |
| Energy efficiency program | - EEP | | | | |
| Procel (b) | - | 961 | - | 961 | - |
| EEP | 32,941 | - | 124,119 | 157,060 | 137,521 |
| | 32,941 | 961 | 124,119 | 158,021 | 137,521 |
| | 105,205 | 6,454 | 325,185 | 436,844 | 398,993 |
| | | | Current | 157,070 | 167,881 |
| | | | Noncurrent | 279,774 | 231,112 |
| (a) National Fund for Scientific and Technological Development | | | | |
| (b) National Program of electricity conservation. | | | | |
26.2 Changes in R&D and EEP balances
| | | | | | | | |
| Consolidated | FNDCT | MME | | R&D Procel | | EEP | |
| | current | current | current | noncurrent | current | current | noncurrent | Total |
| Balance as of January 1, 2016 | 5,762 | 2,882 | 97,981 | 154,847 | - | 61,256 | 76,265 | 398,993 |
| Additions | 12,185 | 6,092 | 499 | 11,686 | 961 | - | 16,024 | 47,447 |
| Performance agreement | - | - | - | - | - | - | 1,060 | 1,060 |
| Selic interest rate (note 33) | - | - | 82 | 12,636 | - | - | 7,256 | 19,974 |
| Payments | (14,285) | (7,143) | - | - | - | - | - | (21,428) |
| Concluded projects | - | - | (4,401) | - | - | (4,801) | - | (9,202) |
| Balance as of June 30, 2016 | 3,662 | 1,831 | 94,161 | 179,169 | 961 | 56,455 | 100,605 | 436,844 |
27 Accounts Payable Related to Concession
| | | |
| Consolidated | | | |
| | | 06.30.2016 | 12.31.2015 |
| Use of public property (27.1) | | 562,902 | - |
| Bonus from the grant (27.2) | | 214,727 | 535,665 |
| | | 777,629 | 535,665 |
| | Circulante | 276,707 | 61,786 |
| | Não circulante | 500,922 | 473,879 |
27.1 Use of public assets
Charges on granting concessions of right to use public assets (UBP).
| | | | | | | | |
| Consolidated | | | | | Discount | Annual | | |
| | Company | Grant | Signature | Closing | Rate | Adjustment | 06.30.2016 | 12.31.2015 |
| (1) HPP Mauá | Copel GeT | 06.29.2007 | 07.03.2007 | 07.2042 | 5.65% p.y. | IPCA | 16,081 | 15,437 |
| (2) HPP Colider | Copel GeT | 12.29.2010 | 01.17.2011 | 01.2046 | 7.74% p.y. | IPCA | 22,478 | 21,493 |
| (3) HPP Baixo Iguaçu | Copel GeT | 07.19.2012 | 08.20.2012 | 01.2047 | 7.74% p.y. | IPCA | 6,060 | 5,557 |
| (4) SHP Cavernoso | Copel GeT | 07.11.2013 | 07.11.2013 | 07.2018 | 7.74% p.y. | IPCA | 83 | 97 |
| (5) SHP Apucaraninha | Copel GeT | 07.11.2013 | 07.11.2013 | 07.2018 | 7.74% p.y. | IPCA | 583 | 676 |
| (6) SHP Chaminé | Copel GeT | 07.11.2013 | 07.11.2013 | 07.2018 | 7.74% p.y. | IPCA | 1,009 | 1,170 |
| (7) SHP Derivação Rio Jordão | Copel GeT | 07.11.2013 | 02.24.2014 | 02.2019 | 7.74% p.y. | IPCA | 632 | 702 |
| (8) HPP Fundão e HPP Santa Clara | Elejor | 10.23.2001 | 10.25.2001 | 10.2036 | 11.00% p.y. | IGPM | 515,976 | 490,533 |
| | | | | | | | 562,902 | 535,665 |
| | | | | | | Current | 61,980 | 61,786 |
| | | | | | | Noncurrent | 500,922 | 473,879 |
Discount rate applied to calculate present value:
Actual net discount rate, in line w ith the estimated long-term rate. It bears no relationship w ith the expected project return.
Payment to the federal government:
(1) Monthly installments equivalent to 1/12 of the proposed annual payment of R$643 (51% of R$1,262), according to clause six of Concession Agreement No. 001/07.
(2) Monthly installments of 1/12 of the proposed annual payment of R$1,256, from the start of commercial operation of HPP, as clause 6 of the Concession Agreement No. 001/11.
(3) (4) (5) (6) (7) Monthly installments equivalent to 1/12 of the proposed annual payment, according to clause 5a of Concession Agreement No. 007/2013 for 5 years.
(8) Monthly installments equivalent to 1/12 from the proposed annual payment of R$19,000, from the 6th to 35th year of grant or w hile in the exploitation of hydropow er facilities, as Terms of Ratification of Bidding and clause six of the Concession Contract No. 125/01.
27.2 Concession bonus
Copel Geração e Transmissão signed the new concession agreement to operate the hydroelectric plant named for Gov. Pedro Viriato Parigot de Souza (GPS) as described in Note 10.3. The Company paid the 1st bonus portion of R$373,637 on January 4, 2016 and the 2nd, updated by the Selic rate, on July 1, 2016, in the restated amount of R$214,727.
27.3 Changes in accounts payable related to concession
| Consolidated | | | |
| | Current | Noncurrent | Total |
| Balance as of January 1, 2016 | 61,786 | 473,879 | 535,665 |
| Additions | 574,827 | 502 | 575,329 |
| Adjust to present value | - | (985) | (985) |
| Monetary variations | 13,538 | 57,558 | 71,096 |
| Transfers | 30,032 | (30,032) | - |
| Payments | (403,476) | - | (403,476) |
| Balance as of June 30, 2016 | 276,707 | 500,922 | 777,629 |
28 Other Accounts Payable
| | | |
| Consolidated | | | |
| | | 06.30.2016 | 12.31.2015 |
| Financial offset for the use of w ater resources | | 27,396 | 31,399 |
| Customers | | 24,890 | 26,391 |
| Public lighting rate collected | | 21,756 | 11,671 |
| Investment acquisition | | 9,571 | 9,571 |
| Reimbursements to customer contributions | | 12,035 | 12,011 |
| Pledges in guarantee | | 8,100 | 8,861 |
| Other liabilities | | 55,861 | 66,767 |
| | | 159,609 | 166,671 |
| | Current | 125,091 | 135,709 |
| | Noncurrent | 34,518 | 30,962 |
29 Provision for Litigation and Contingent Liabilities
The Company and its subsidiaries are defendants in various judicial and administrative proceedings before different courts. Based on assessments made by the Company’s legal counsel, management makes provisions for actions in which losses are rated probable, thus meeting the criteria for recognition of provisioning described in Note 4.11 of the financial statements of December 31, 2015
The Company’s management believes that it is impracticable to provide information about the timing of any cash outflows related to the legal actions in which the Company and its subsidiaries are defendants as of the date of preparing the financial statements, given the unpredictability and dynamics of Brazilian legal, tax and regulatory systems, and since final resolution depends on the conclusions of court proceedings. Therefore, this information is not being provided.
29.1 Provisions for litigation
29.1.1 Changes in provisions for litigation in actions rated as probable losses
| | | | | | | |
| Consolidated | | | | | Additions to | | |
| | Balances as of | | | Construction | fixed assets | | Balances as of |
| | January 1, 2016 | Additions | Reversals | cost | in progress | Discharges | June 30, 2016 |
| Tax | | | | | | | |
| Cofins (a) | 258,715 | 1,959 | (191,347) | - | - | - | 69,327 |
| Others (b) | 68,333 | 3,373 | (6,249) | - | - | (24) | 65,433 |
| | 327,048 | 5,332 | (197,596) | - | - | (24) | 134,760 |
| Labors (c) | 408,133 | 129,587 | (1,274) | - | - | (17,946) | 518,500 |
| Employee benefits (d) | 104,480 | 218 | (34,645) | - | - | (363) | 69,690 |
| Civil | | | | | | | |
| Civil and administrative claims (e) | 325,217 | 65,894 | (22,388) | - | - | (11,087) | 357,636 |
| Easements (f) | 62,869 | 6,132 | - | 2,493 | 2,275 | - | 73,769 |
| Expropriations and property (g) | 196,895 | 9,355 | - | 1,173 | 4,257 | (13) | 211,667 |
| Customers (h) | 13,656 | - | (924) | - | - | (36) | 12,696 |
| | 598,637 | 81,381 | (23,312) | 3,666 | 6,532 | (11,136) | 655,768 |
| Environmental (i) | 868 | 225 | - | - | - | - | 1,093 |
| Regulatory (j) | 55,770 | 2,668 | - | - | - | - | 58,438 |
| | 1,494,936 | 219,411 | (256,827) | 3,666 | 6,532 | (29,469) | 1,438,249 |
| | | | | |
| Parent company | Balance as of | | | | Balance as of |
| | January 1, 2016 | Additions | Reversals | Discharges | June 30, 2016 |
| Tax | | | | | |
| Cofins (a) | 258,715 | 1,959 | (191,347) | - | 69,327 |
| Others (b) | 12,015 | 55 | (99) | - | 11,971 |
| | 270,730 | 2,014 | (191,446) | - | 81,298 |
| Labor (c) | 29 | 24 | - | - | 53 |
| Civil (f) | 5,652 | 10,261 | - | (39) | 15,874 |
| Regulatory (k) | 14,109 | - | - | - | 14,109 |
| | 290,520 | 12,299 | (191,446) | (39) | 111,334 |
29.1.2 Description of nature and/or details of the principal actions
a) Contribution to Social Security Financing (COFINS)
Plaintiff:Federal Tax Authority
Cofins payables and respective interest and fines from August 1995 to December 1996 due to the termination of a judicial decision that had recognized the Company’s exemption from Cofins. This quarter, Copel recorded a provision reversal of R$193,386, given that a final and unappealable decision was issued in favor of the Company on case 10980-720.458/2011-15, related to the period between October 1998 and June 2001, thus cancelling the tax claim.
Current status: awaiting judgment.
b) Other tax provisions
Actions relating to federal, state and municipal taxes, taxes, fees and other charges in which the Company challenges their applicability, calculation bases and amounts due to be collected. The principal action is described below:
Defendant: Brazil’s Federal Tax Authority Estimated amount: R$35,595
Copel Generation and Transmission required payment by installments of the balance owed on the annual adjustment of corporate income tax (IRPJ) and social contribution (CSLL for the 2014 fiscal period. Brazil’s Federal Tax Authority consolidated the amount and applied the maximum fine. An injunction was filed in order to prevent the Tax Authority taking action that failed to obey the limit established in legislation, in Management’s opinion.
Current status: case 5037809-14.2015.4.04.7000. A judgment rendered by the Federal Judge of the 2nd Federal Lower Court dismissed the action and the Company filed an appeal against the decision before the Regional Federal Court.
c) Labor/Employment claims
Actions brought by former employees of Copel and its subsidiaries claiming payment of overtime, danger money, transfer bonus, salary isonomy/reclassification and other claims, and other claims brought by former employees of its contractors and outsourcers (joint liability) involving claims for indemnities and other claims.
d) Employee benefits
Claims brought by retired former employees of Copel and its wholly owned subsidiaries against Fundação Copel, which will consequently affect the Company and its wholly owned subsidiaries to the extent that additional sums may be required.
e) Civil and administrative proceedings
Actions involving billing, irregular procedure, administrative contracts and contractual penalties, compensation for accidents involving electric power grid or vehicles. The principal actions are described below:
Plaintiff: Tradener Ltda. Estimated amount: R$148,641
Class and civil actions against illegal or annullable aspects of the electric power trading contract signed by Tradener and the Company. Class action 588/2006 reached a final and unappealable decision that recognized the validity of commission fees due by the Company to Tradener. In civil action 0000219-78.2003.8.16.0004, filed by the Public Prosecutor’s Office, there is also a decision finding no irregular aspects in the electricity trading contract. Therefore, Tradener filed collection actions in order to be paid its commission fees.
Current status:- case 0005550-26.2012.8.16.0004 - in judgment rendered on September 29, 2014, the Company was ordered to pay commission fees due to Tradener in the amount of R$17,765 on September 30, 2012, plus late penalty at 1% per month as of the date of service of process (October 25, 2012), as well as attorneys’ fees set at 9% of the amount stated in the sentence and court costs totaling R$60,279 as of June 30, 2016. The Company unsuccessfully appealed and Copel filed a special appeal, against which Tradener filed a Special Adhesive Appeal. None of the appeals have been judged.
- case 0005990.22.2012.8.16.0004 - in a judgment on January 27, 2014 the Company was ordered to pay the amount of R$99,102, which is the value updated by the National Consumer Price Index published by the Brazilian Institute of Geography and Statistics (INPC/IBGE) arising from commissions due to Tradener under the trading contract signed with Celesc, plus late payment penalty of 1% per month as of the summons (October 31, 2012), plus attorneys’ fees in the amount of R$55, to be corrected from the date on which judgment was delivered at the INPC/IBGE rate, as of January 27, 2014. The Company filed an appeal against this decision that has not yet been judged.
f) Right of way easements
Actions are brought when the amount assessed by Copel for payment is less than an owner claims and/or when an owner lacks proper documentation or records (inventories in progress, properties lacking registry deeds, among other issues).
They may also involve third-party interventions for adverse possession, whether from owners or occupants of contiguous properties or even in cases of properties where right of way easements are required to preserve limits and boundaries of these areas.
g) Expropriation and possessory actions
Expropriation and possessory actions are brought when the amounts assessed by Copel for payment does not match that claimed by the owner and/or when the owner does not have documentation recording conditions (inventories in progress, without enrollment properties, etc.).
Possessory cases actions include those for repossession of property owned by the concessionaire. Litigation arises when there is a need to repossess properties invaded or occupied by third parties in areas owned by the Company. Cases may also arise from intervention in third-party adverse possession, or owners or occupants of contiguous properties or even in cases of properties to preserve limits and boundaries of expropriated areas. The principal action is described below:
Plaintiff: Ivaí Engenharia de Obras S.A. Estimated amount: R$148,592
Declaratory action brought by the plaintiff in order to recognize the right to economic and financial rebalancing of the contract signed with Copel Geração e Transmissão S.A.
Current status: A final and unappealable decision has been issued on the declaratory action, sentencing Copel to pay attorneys’ fees and court costs. The amounts deriving from the right to the economic and financial rebalancing of the contract involved in the decision issued on the declaratory action are the object of a collection lawsuit under appeal in the Superior Court of Justice (STJ).
h) Consumers
Claims seeking compensation for damaged electrical appliances, compensation for moral damages resulting from failure to provide services (outages), and actions filed by industrial customers to challenge the legality of electricity price hikes during the Cruzado Plan and claiming refunds of the amounts involved.
i) Environmental
Class actions brought to obstruct progress on environmental licensing for new projects or rehabilitation of permanent preservation areas around hydroelectric dam reservoirs misused by individuals. In the event of a conviction, the liability estimated will be only the cost of developing new environmental studies and the cost of recovering areas owned by Copel Geração e Transmissão.
j) Regulatory
In the administrative and judicial spheres, the Company is challenging the Regulator’s notifications of possible breaches of regulatory requirements. The principal action is described below:
Plaintiffs: Companhia Estadual de Energia Elétrica (CEEE) and Dona Francisca Energética S.A.
Estimated amount: R$46,332
Copel, Copel Geração e Transmissão and Copel Distribuição are bringing actions to challenge Aneel Order 288/2002, involving the aforementioned companies.
Current status: awaiting judgment.
29.2 Contingent liabilities
29.2.1 Classification of actions rated as possible losses
Contingent liabilities are present obligations arising from past events for which no provisions are recognized because it is probable that an outflow of resources embodying economic benefits will be required to settle the obligation. The following information concerns the nature of the Company’s contingent liabilities and potential losses arising thereof.
| | | | |
| | Parent company | | Consolidated |
| | 06.30.2016 | 12.31.2015 | 06.30.2016 | 12.31.2015 |
| Tax (a) | 785,883 | 1,252,740 | 990,031 | 1,476,765 |
| Labor (b) | 138 | 222 | 467,185 | 605,095 |
| Employee benefits (c) | - | - | 50,242 | 73,310 |
| Civil (d) | 9,658 | 30,711 | 1,244,350 | 1,170,019 |
| Regulatory (e) | - | - | 716,358 | 646,455 |
| | 795,679 | 1,283,673 | 3,468,166 | 3,971,644 |
29.2.2 Description of nature and/or details of the principal actions
a) Tax
Actions relating to federal, state and municipal taxes, taxes, fees and other charges in which the Company challenges their applicability, calculation bases and amounts due to be collected. The principal actions are described below:
Plaintiff: Federal Tax Authority Estimated amount: R$148,646
Part of the interest related to the same Cofins payables, administrative proceeding 11453-720.001/2011-23, derived from an action for rescission. Given the cogent arguments posed by Copel’s defense, this loss continues to be rated as ‘possible’. This quarter, Copel reversed part of the amount, corresponding to R$635,797, given that a final and unappealable decision was issued in favor of the Company on case 10980-720.458/2011-15, thus cancelling this tax claim.
Current status: awaiting judgment.
Plaintiff: Social Security Institute (INSS) Estimated amount: R$295,340
Tax authority claims against Copel related to tax execution for social security contributions (NFLD 35.273.870-7); it is worth emphasizing that the case has been judged favorably for the Company in two court levels.
Current status: awaiting judgment.
Plaintiff: Social Security Institute (INSS) Estimated amount: R$26,513
Tax claims against Copel related to social security contribution on assignment of manpower (NFLD 35.273.876-6). The case has been awaiting judgment by the Administrative Council of Tax Appeals (CARF) since 2010. The assessment of its possible risk level reflects the existence of various legal defenses, in particular (a) absence of services rendered or assignment of manpower and (b) absence of need for retention of tax charges in the case of service providers being taxed under the “Simples” tax arrangement for small or micro companies.
Current status: awaiting judgment.
Plaintiff: State Tax Authority - SEFA Estimated amount: R$58,091
Copel Distribuição received tax deficiency notice 6587156-4 from the State of Paraná for allegedly failing to pay ICMS tax on the 'metered demand' line in the electricity bills issued to Sadia S.A. between May 2011 and December 2013.
Copel Distribuição claims lack of standing in regard to this tax deficiency notice, given that it derives from Declaratory Action 33.036, currently pending judgement by the 3rd Public Treasury Court of Curitiba, filed by Sadia S.A. in the State of Paraná, which was held valid and considered that ICMS tax should be levied on metered demand only. Note that this sentence was subsequently overturned by the Paraná State Court of Justice (TJ/PR), through Civil Appeal 822.670-2, given Sadia S.A.’s lack of standing to question the levy of ICMS on contracted demand.
The Company believes that, since it was not involved in the lawsuit, it is not subject to the effects from the respective court ruling, which would imply its lack of standing in tax deficiency notice 6.587.156-4.
Current status: awaiting judgment.
b) Labor/Employment claims
Actions brought by former employees of Copel and its subsidiaries claiming payment of overtime, danger money, transfer bonus, salary isonomy/reclassification and other claims, and other claims brought by former employees of its contractors and outsourcers (joint liability) involving claims for indemnities and other claims.
c) Employee benefits
Claims brought by retired former employees of Copel and its wholly owned subsidiaries against Fundação Copel, which will consequently affect the Company and its wholly owned subsidiaries to the extent that additional sums may be required.
d) Civil
Actions involving billing, irregular procedure, administrative contracts and contractual penalties, compensation for accidents involving electric power grid or vehicles. The principal actions are described below:
Plaintiff: Mineradora Tibagiana Ltda. Estimated amount: R$135,944
Action claiming compensation for alleged losses when this mining company was involved in the construction of the Mauá plant by the Energético Cruzeiro do Sul consortium in which Copel Geração e Transmissão has a 51% stake. The action challenges the validity of the mining permit granted Tibagiana for the Mauá job site and the indemnifying effects arising thereof.
Current status: Action suspended in lower court until the conclusion of action no 5013943-50.2010.04.7000 pending before the 6th Federal Court of Curitiba.
Plaintiff: Ivaí Engenharia de Obras S.A. Estimated amount: R$658,166
Action for collection brought by the plaintiff in order to collect amounts arising from economic and financial rebalancing of the contract signed with Copel Geração e Transmissão S.A., recognized in the declaratory action. The principal of this debt is classified as probable loss.
Current status: The judgment of the 2nd motion for clarification filed by Copel Geração e Transmissão S.A. before the Superior Court of Justice (STJ) was published on December 18, 2015, challenging the difference in amounts due arising from cumulative updating of the amount of plaintiff’s credit at the SELIC interest rate as against other interest rates in the period preceding the court’s expert report (October 2005). The judgment prescribes the case´s return to the State of Paraná Court of Justice (TJ-PR) for the latter to render a new judgment on the motion for clarification brought by Copel Geração e Transmissão S.A., thus righting the omission of the previous trial.Ivaí has filed a motion for clarification on February 5, 2016, which is now pending judgment by the Superior Court of Justice (STJ). Therefore the amount to be assessed as probable loss is the amount of the plaintiff’s receivable adjusted on a monthly basis using the TJ-PR’s official price index, which is the average of the IGP-DI/INPC indices, as sought by Copel Geração e Transmissão S.A. in court, plus late payment penalties at 1% per month, plus burden of defeat. However, it is still considered as a possible loss, with reversal of the TJ-PR’s previous judgment, that is, the amount of debt will be adjusted according to the SELIC interest rate cumulative with other interest rates in the period preceding the court’s expert report. At the same time, a provisional execution of the total credit amount sought by Ivaí is currently taking place.
Plaintiffs:Copel branch office /store franchisees Estimated amount: R$46,039
Two individual actions arising from Copel branch office/store franchising contracts, primarily to recognize sub-concession and transfer services rendered, with full pass-through of tariffs, and secondarily to extend the duration of the agreement and compensation, with full pass-through of tariffs, among other amounts, with appeals currently pending judgment.
Current status: awaiting judgements.
e) Regulatory
In the administrative and judicial spheres, the Company is challenging the Regulator’s notifications of possible breaches of regulatory requirements. The principal actions are described below:
Plaintiff: Aneel Estimated amount: R$16,298
Copel Distribuição filed an appeal against the decision issued by Aneel’s Director General in Order 3959 of December 8, 2015, which penalized Copel Distribuição for its part of inefficiency through subcontracting, due to overcontracting the Amount of Use of Distribution System (Musd) with the Electric System National Operator (ONS).
Current status: awaiting judgment.
Plaintiff: Energia Sustentável do Brasil S.A. (ESBR) Estimated amount: R$673,154
The principal objection refers to a trend towards preventing distribution companies being held accountable for losses resulting from delays in construction schedules for the Jirau HPP. ESBR brought action 10426-71.2013.4.01.4100 against Aneel in the Federal Court of Rondonia, whose sentence (i) recognized exclusive responsibility for the 535-day delay affecting the Jirau HPP`s construction schedule; (ii) declared that any obligations, penalties or costs arising from delays that were charged to ESBR were unenforceable and finally, (iii) annulled Aneel Order 1.732/2013, which had acknowledged a delay of only 52 days behind schedule. Aneel filed an appeal, which is currently awaiting judgement in the Regional Federal Court of the 1st Region.
As a practical consequence of the decision, while it exempted ESBR, the distributor companies with which it signed CCEARs, including Copel Distribuição, were exposed to the short-term market and the high Difference Settlement Price (PLD) in the period, because electricity trading rules require all energy consumed to have corresponding contractual coverage.
One of the measures adopted was the filing for writ of mandamus 1001675-88.2015.4.01.0000 submitted to the Regional Federal Court of the 1st Region by the Brazilian Association of Electricity Distributors (Abradee), of which Copel Distribuição is a member, seeking to annul the case brought by ESBR against Aneel since service of process. Although a favorable preliminary decision was obtained, there was an unfavorable judgment of the writ of mandamus, stating that it was not applicable in this case. After the publication of the judgement, Abradee filed an ordinary appeal, currently being judged by the Regional Federal Court of the 1st Region.
However, Aneel´s motion to stay execution 0050083-30.2015.4.01.0000/RO was partly accepted on November 30, 2015 by the presiding judge of the Regional Federal Court of the 1st Region, which upheld the CCEE Board of Directors’ resolution voted at meeting 813 on July 21, 2015, based on the court’s decision in the case of Action for a Provisional Remedy 9500-90.2013.4.01.4100, determining the “obligation to deliver 70% of the physical guarantee provided by the effective start-up of commercial operations by Jirau HPP generators until this amount is equivalent to the original delivery obligation.”An appeal brought by ESBR was rejected. This decision is also subject to appeal.
The risk of loss in this case is rated ‘possible’ (intermediate), considering the amount of R$673,154, on June 30, 2016, relating to CCEE settlement of May 2016. If the actions are judged unfavorably, the amount will be classified as Sectorial Financial Asset to be recovered through tariff rates.
Current status: awaiting judgment.
30 Shareholders’ equity
30.1 Attributable to the parent company’s shareholders
30.1.1 Capital stock
Paid-up capital amounts to R$6,910,000. Its breakdown by shares (no par value) and the principal shareholders are as follows:
| | | | | | | | |
| | | | | | | Number of shares in units |
| Shareholders | Common | Class "A” Preferred | Class “B” preferred | Total | |
| | in share | % | in share | % | in share | % | in share | % |
| State of Paraná | 85,028,598 | 58.63 | - | - | - | - | 85,028,598 | 31.07 |
| BNDES | 38,298,775 | 26.41 | - | - | 27,282,006 | 21.26 | 65,580,781 | 23.96 |
| Eletrobrás | 1,530,774 | 1.06 | - | - | - | - | 1,530,774 | 0.56 |
| Free float: | - | - | - | - | - | - | | - |
| BM&FBOVESPA | 18,567,653 | 12.80 | 76,763 | 23.36 | 62,398,076 | 48.64 | 81,042,492 | 29.62 |
| NYSE | 1,307,134 | 0.90 | - | - | 38,480,198 | 30.00 | 39,787,332 | 14.54 |
| Latibex | - | - | - | - | 87,449 | 0.07 | 87,449 | 0.03 |
| Municipalities | 178,393 | 0.12 | 9,326 | 2.84 | 3,471 | - | 191,190 | 0.07 |
| Other shareholders | 119,753 | 0.08 | 242,538 | 73.80 | 44,468 | 0.03 | 406,759 | 0.15 |
| | 145,031,080 | 100.00 | 328,627 | 100.00 | 128,295,668 | 100.00 | 273,655,375 | 100.00 |
30.1.2 Equity valuation adjustments
| | |
| | Parent company | Consolidated |
| Balance as of January 1, 2016 | 1,177,372 | 1,177,372 |
| Adjustments to financial assets available for sale: | | |
| Financial investments (a) | (1) | (1) |
| Equity interest investments | 170 | 170 |
| Taxes on adjustments | (58) | (58) |
| Adjusts to actuarial liabilities: | | |
| Post employment benefits - equity | (854) | (854) |
| Realization of equity evaluation adjustment: | | |
| Deemed cost of f ixed assets | - | (143,957) |
| Taxes on adjustments | - | 48,946 |
| Deemed cost of f ixed assets - equity (a) | (95,011) | - |
| Balance as of June 30, 2016 | 1,081,618 | 1,081,618 |
| (a) Equity in the parent company, net of taxes. | | |
30.1.3 Earnings per share - basic and diluted
| | |
| Parent company | | |
| | 06.30.2016 | 06.30.2015 |
| Basic and diluted numerator | | |
| Basic and diluted earnings allocated by classes of shares, allocated to shareholders | | |
| controlling shareholders: | | |
| Ordinary shares | 570,200 | 359,040 |
| Class “A” preferred shares | 1,604 | 1,036 |
| Class “B” preferred shares | 554,661 | 349,231 |
| | 1,126,465 | 709,307 |
| Basic and diluted denominator | | |
| Weighted average of shares (in thousands): | | |
| Ordinary shares | 145,031,080 | 145,031,080 |
| Class “A” preferred shares | 370,793 | 380,291 |
| Class “B” preferred shares | 128,253,502 | 128,244,004 |
| | 273,655,375 | 273,655,375 |
| Basic and diluted earnings per share attributable to shareholders of | | |
| parent company: | | |
| Ordinary shares | 3.93157 | 2.47561 |
| Class “A” preferred shares | 4.32473 | 2.72423 |
| Class “B” preferred shares | 4.32473 | 2.72318 |
30.2 Changes in equity attributable to non-controlling interests
| Participation in capital stock | Compagás: 49% | Elejor: 30% | UEG Araucária: 20% | Consolidated |
| Balance as of January 1, 2016 | 144,904 | 22,200 | 171,646 | 338,750 |
| Distribution of dividends w ith retained earnings | - | (9,342) | - | (9,342) |
| Deliberation of additional dividends proposed | - | - | (23,072) | (23,072) |
| Income for the period | 11,426 | 3,335 | (8,559) | 6,202 |
| Balance as of June 30, 2016 | 156,330 | 16,193 | 140,015 | 312,538 |
31 Net Operating Revenues
| Consolidated | Gross revenues | PIS/Pasepand Cofins | ICMS (VAT) | Regulatory charges (31.5) | Service tax (ISSQN) | Net revenues06.30.2016 |
| Electricity sales to final customers (31.1) | 5,607,425 | (517,022) | (1,434,558) | (596,169) | - | 3,059,676 |
| Electricity sales to distribuitors (31.2) | 1,452,388 | (117,411) | - | (24,026) | - | 1,310,951 |
| Use of the main distribution and transmission grid (31.3) | 4,279,394 | (305,809) | (817,250) | (510,790) | - | 2,645,545 |
| Construction income | 572,445 | - | - | - | - | 572,445 |
| Telecommunications | 169,326 | (6,487) | (37,740) | - | (1,109) | 123,990 |
| Distribution of piped gas | 344,152 | (33,644) | (60,340) | - | - | 250,168 |
| Sectorial financial assets and | | | | | | |
| liabilities result | (1,254,487) | - | - | - | - | (1,254,487) |
| Other operating revenue (31.4) | 72,319 | (11,294) | - | - | (1,119) | 59,906 |
| | 11,242,962 | (991,667) | (2,349,888) | (1,130,985) | (2,228) | 6,768,194 |
| Consolidated | Gross revenues | PIS/Pasepand Cofins | ICMS (VAT) | Regulatory charges (31.5) | Service tax(ISSQN ) | Net revenues04.01.2016to 06.30.2016 |
| Electricity sales to final customers (31.1) | 2,580,831 | (236,640) | (665,935) | (197,894) | - | 1,480,362 |
| Electricity sales to distribuitors (31.2) | 696,470 | (55,715) | - | (11,810) | - | 628,945 |
| Use of the main distribution and transmission grid (31.3) | 2,579,501 | (148,147) | (399,076) | (240,950) | - | 1,791,328 |
| Construction income | 301,292 | - | - | - | - | 301,292 |
| Telecommunications | 84,107 | (3,223) | (18,799) | - | (592) | 61,493 |
| Distribution of piped gas | 174,341 | (17,100) | (30,265) | - | - | 126,976 |
| Sectorial financial assets and | | | | | | |
| liabilities result | (727,285) | - | - | - | - | (727,285) |
| Other operating revenue (31.4) | 37,684 | (5,675) | - | - | (564) | 31,445 |
| | 5,726,941 | (466,500) | (1,114,075) | (450,654) | (1,156) | 3,694,556 |
| Consolidated | Grossrevenues | PIS/Pasep
and Cofins | ICMS (VAT) | Regulatory charges (31.5) | Service tax (ISSQN) | Net revenues06.30.2015 |
| Electricity sales to final customers (31.1) | 5,100,849 | (472,418) | (1,247,306) | (631,967) | - | 2,749,158 |
| Electricity sales to distribuitors (31.2) | 2,588,471 | (217,026) | - | (36,819) | - | 2,334,626 |
| Use of the main distribution and transmission grid (31.3) | 2,665,464 | (247,556) | (641,556) | (700,615) | - | 1,075,737 |
| Construction income | 541,194 | - | - | - | - | 541,194 |
| Telecommunications | 130,422 | (6,725) | (23,688) | - | (1,104) | 98,905 |
| Distribution of piped gas | 340,969 | (31,340) | (48,952) | - | - | 260,677 |
| Sectorial financial assets and | - | - | - | - | - | |
| liabilities result | 1,039,021 | - | - | - | - | 1,039,021 |
| Other operating revenue (31.4) | 56,802 | (9,001) | - | - | (1,179) | 46,622 |
| | 12,463,192 | (984,066) | (1,961,502) | (1,369,401) | (2,283) | 8,145,940 |
| Consolidated | Gross revenues | PIS/Pasep and Cofins | ICMS (VAT) | Regulatory charges (31.5) | Service tax(ISSQN ) | Net revenues04.01.2015to 06.30.2015 |
| Electricity sales to final customers (31.1) | 2,767,575 | (256,393) | (691,963) | (398,761) | - | 1,420,458 |
| Electricity sales to distribuitors (31.2) | 1,163,195 | (105,012) | - | (16,577) | - | 1,041,606 |
| Use of the main distribution and transmission grid (31.3) | 1,474,901 | (137,178) | (365,837) | (491,254) | - | 480,632 |
| Construction income | 272,962 | - | - | - | - | 272,962 |
| Telecommunications | 67,165 | (2,983) | (12,364) | - | (515) | 51,303 |
| Distribution of piped gas | 187,492 | (17,218) | (31,072) | - | - | 139,202 |
| Sectorial financial assets and | - | - | - | - | - | - |
| liabilities result | 478,136 | - | - | - | - | 478,136 |
| Other operating revenue (31.4) | 29,515 | (4,325) | - | - | (651) | 24,539 |
| | 6,440,941 | (523,109) | (1,101,236) | (906,592) | (1,166) | 3,908,838 |
31.1 Electricity sales to final customers by category
| | | | |
| Consolidated | | Gross revenue | | Net revenue |
| | 06.30.2016 | 06.30.2015 | 06.30.2016 | 06.30.2015 |
| Residential | 1,850,437 | 1,620,165 | 1,011,859 | 871,453 |
| Industrial | 1,770,188 | 1,736,612 | 1,034,947 | 973,615 |
| Trade, services and other activities | 1,251,821 | 1,134,808 | 622,756 | 553,973 |
| Rural | 309,312 | 246,608 | 175,041 | 169,209 |
| Public entities | 135,732 | 115,140 | 80,053 | 65,557 |
| Public lighting | 130,075 | 116,061 | 65,668 | 56,396 |
| Public service | 159,860 | 131,455 | 69,352 | 58,955 |
| | 5,607,425 | 5,100,849 | 3,059,676 | 2,749,158 |
| | | | |
| Consolidated | | Gross revenue | | Net income |
| | 04.01.2016 | 04.01.2015 | 04.01.2016 | 04.01.2015 |
| | to 06.30.2016 | to 06.30.2015 | to 06.30.2016 | to 06.30.2015 |
| Residential | 855,587 | 868,056 | 492,443 | 446,191 |
| Industrial | 852,634 | 968,183 | 521,475 | 519,526 |
| Trade, services and other activities | 545,427 | 597,355 | 285,980 | 272,834 |
| Rural | 127,931 | 130,749 | 74,116 | 85,591 |
| Public entities | 66,845 | 63,208 | 41,287 | 34,255 |
| Public lighting | 58,360 | 66,574 | 31,296 | 31,106 |
| Public service | 74,047 | 73,450 | 33,765 | 30,955 |
| | 2,580,831 | 2,767,575 | 1,480,362 | 1,420,458 |
31.2 Electricity sales to distributors
| | |
| Consolidated | | Gross revenue |
| | 06.30.2016 | 06.30.2016 |
| Electric Energy Trade Chamber - CCEE | 353,621 | 1,677,764 |
| Bilateral contracts | 659,864 | 576,962 |
| Agreements for Pow er Trade on the Regulated Market - CCEAR (auction) | 345,860 | 333,703 |
| Effective interest income – bonus from grant | 56,895 | - |
| Quota system | 36,148 | 42 |
| | 1,452,388 | 2,588,471 |
| | |
| Consolidated | | Gross revenue |
| | 04.01.2016 | 04.01.2015 |
| | to 06.30.2016 | to 06.30.2015 |
| Electric Energy Trade Chamber - CCEE | 141,353 | 683,630 |
| Bilateral contracts | 335,504 | 298,636 |
| Agreements for Pow er Trade on the Regulated Market - CCEAR (auction) | 165,469 | 180,910 |
| Effective interest income – bonus from grant | 56,895 | - |
| Quota system | (2,751) | 19 |
| | 696,470 | 1,163,195 |
31.3 Use of them main distribution and transmission grid by customer class
| | | | |
| Consolidated | | Gross revenue | | Net revenue |
| | 06.30.2016 | 06.30.2015 | 06.30.2016 | 06.30.2015 |
| Residential | 1,108,721 | 907,197 | 515,095 | 319,304 |
| Industrial | 691,160 | 574,540 | 322,139 | 214,189 |
| Trade, services and other activities | 748,584 | 628,796 | 343,793 | 220,716 |
| Rural | 185,880 | 137,259 | 126,911 | 80,451 |
| Public entities | 88,143 | 69,301 | 48,435 | 29,516 |
| Public lighting | 88,127 | 67,228 | 40,695 | 22,947 |
| Public service | 65,024 | 49,371 | 29,861 | 17,294 |
| Free consumers | 177,545 | 122,367 | 132,682 | 76,797 |
| Basic Netw ork, BN connections, and connection grid | 802 | 550 | 599 | 345 |
| Operating and maintenance income (loss) - O&M | 82,984 | 53,466 | 78,777 | 44,620 |
| Interest income (loss) | 1,042,424 | 55,389 | 1,006,558 | 49,558 |
| | 4,279,394 | 2,665,464 | 2,645,545 | 1,075,737 |
| | | | |
| Consolidated | | Gross revenue | | Net income |
| | 04.01.2016 | 04.01.2015 | 04.01.2016 | 04.01.2015 |
| | to 06.30.2016 | to 06.30.2015 | to 06.30.2016 | to 06.30.2015 |
| Residential | 537,974 | 477,574 | 252,813 | 125,183 |
| Industrial | 327,159 | 341,360 | 145,977 | 100,803 |
| Trade, services and other activities | 364,692 | 348,181 | 173,526 | 96,418 |
| Rural | 81,995 | 67,754 | 58,091 | 33,556 |
| Public entities | 46,028 | 38,371 | 25,754 | 13,258 |
| Public lighting | 43,589 | 37,558 | 20,565 | 10,126 |
| Public service | 31,710 | 28,672 | 14,729 | 7,959 |
| Free consumers | 95,546 | 83,756 | 72,098 | 49,068 |
| Basic Netw ork, BN connections, and connection grid | 401 | 275 | 302 | 147 |
| Operating and maintenance income (loss) - O&M | 43,370 | 18,670 | 49,880 | 14,898 |
| Interest income (loss) | 1,007,037 | 32,730 | 977,593 | 29,216 |
| | 2,579,501 | 1,474,901 | 1,791,328 | 480,632 |
31.4 Other operating revenues
| | |
| Consolidated | | Gross revenue |
| | 06.30.2016 | 06.30.2015 |
| Leasing and rent (31.4.1) | 49,388 | 42,727 |
| Income from rendering of services | 11,283 | 8,090 |
| Charged service | 4,391 | 4,279 |
| Other income | 7,257 | 1,706 |
| | 72,319 | 56,802 |
| | |
| Consolidated | | Gross revenue |
| | 04.01.2016 | 04.01.2015 |
| | to 06.30.2016 | to 06.30.2015 |
| Leasing and rent (31.4.1) | 24,939 | 21,586 |
| Income from rendering of services | 5,885 | 4,884 |
| Charged service | 2,269 | 2,233 |
| Other income | 4,591 | 812 |
| | 37,684 | 29,515 |
31.4.1 Lease and rent revenues
| | |
| Consolidated | | |
| | 06.30.2016 | 06.30.2015 |
| Equipment and framew ork | 49,242 | 42,173 |
| Real estate | 115 | 59 |
| Facilities sharing | 31 | 495 |
| | 49,388 | 42,727 |
| | |
| Consolidated | 04.01.2016 | 04.01.2015 |
| | to 06.30.2016 | to 06.30.2015 |
| Equipment and framew ork | 24,845 | 21,300 |
| Real estate | 63 | 35 |
| Facilities sharing | 31 | 251 |
| | 24,939 | 21,586 |
31.5 Regulatory charges
| | |
| Consolidated | | |
| | 06.30.2016 | 06.30.2015 |
| Energy Development Account - CDE (31.5.1) | 492,559 | 687,422 |
| Energy Development Account - CDE Energy | 387,101 | - |
| Other charges - rate flags | 178,042 | 542,496 |
| Research and development and energy efficiency - R&D and PEE | 47,447 | 68,329 |
| Global Reversion Reserve - RGR quota | 21,513 | 22,624 |
| Inspection fee | 4,323 | 1,892 |
| Energy Development Account - ACR Account | - | 46,638 |
| | 1,130,985 | 1,369,401 |
| |
| |
| Consolidated | 04.01.2016 | 04.01.2015 |
| | to 06.30.2016 | to 06.30.2015 |
| Energy Development Account - CDE | 232,061 | 485,221 |
| Energy Development Account - CDE Energy | 195,825 | - |
| Other charges - rate flags | (11,830) | 329,320 |
| Research and development and energy efficiency - R&D and PEE | 21,679 | 32,209 |
| Global Reversion Reserve - RGR quota | 10,757 | 11,312 |
| Inspection fee | 2,162 | 1,892 |
| Energy Development Account - ACR Account | - | 46,638 |
| | 450,654 | 906,592 |
31.5.1 Energy Development Account (CDE)
The main purposes of the CDE were to: offset tariff discounts applied to use and electricity tariffs for certain users; universalize electricity services; promote the competitiveness of electricity from alternative sources in areas served by the national interconnected system (SIN); offset financial transactions relating to compensation when electricity generating concessions are reverted; and cover costs arising from involuntary exposure to the spot market and thermoelectric dispatching costs in 2013 and January 2014 (CDE Energy).
Among other sources, CDE funds come from the annual dues paid by all agents that sell electricity to final consumers through tariff charges.
From February to December 2014, ACR-account funds (Decree 8221/2014), totally or partly covered the additional costs of involuntary exposure to the spot market and thermoelectric dispatching associated with the Electricity Trading Contracts in the Regulated Market of the availability type (CCEAR-D). These funds minimized the financial impact of rising energy costs for distribution companies.The charge was allocated to distributors in proportion to the supply market and is used to repay loans obtained by CCEE, the amounts of which includes the financial and administrative costs of contracted operations.
For Copel Distribuição, the monthly CDE Energy quota came to R$18,947 as of January 2016 and the monthly CDE Use quota stood at R$83,728 between January and May 2016 and R$71,600 as of June 2016, approved by Resolution 2077 of June 7, 2016. The CDE quota related to the ACR account increased from R$46,638 (Resolution 1863/2015) to R$49,362, also as of June 2016, restated by Resolution 2004/2015; the 45 remaining installments will be restated on an annual basis.
Aneel also approved the calculation of CDE Use and Energy tariff components, in compliance with the preliminary decisions in favor of Abrace (Resolutions 1967/2015 and 1986/2015), the Brazilian Association of Power Consumers (Anace) and other associates (Resolution 2083 of June 14, 2016), pursuant to the preliminary decision in favor of Abradee, which ensures associated distributors the right not to pass through, deducting from the CDE’s portion amounts that were not billed due to the effects of the preliminary decisions. The differences between the tariff coverage for this charge and the quota actually paid were not recorded in Sectorial Financial Assets and Liabilities.
Thus, from the amount of R$492,559 recorded in CDE Use in 2016, R$468,476 is related to Copel Distribuição, R$19,809 of which refers to the unbilled portions related to Abrace’s injunction, still recorded in Current Liabilities; the restated amount of R$21,763, related to discounts in 2015 as a result of said injunction, which was transferred to Eletrobrás by the Company, will be deducted from the next payment, the reversal of which was recorded in June 2016.
31.6 Copel Distribuição periodic tariff review
Aneel’s Resolution 2096 of June 21, 2016 approved the result of Copel Distribuição’s fourth Periodic Tariff Review and authorized a -12.87% average adjustment to be perceived by consumers, consisting of: -1.73% related to the inclusion of financial components; 4.48% from updating Portion B; -2.57% from adjusting Portion A; and -13.05% reflecting the withdrawal of the financial components from the previous tariff process.
This adjustment was fully applied to Copel tariffs as of June 24, 2016, and the amortization of Sectorial Financial Assets and Liabilities balances began in July 2016.
32 Operating Costs and Expenses
| Consolidated | Operational costs | Selling expenses | General and administrative expenses | Other income (expenses), net | 06.30.2016 |
| Electricity purchased for resale (32.1) | (2,253,644) | - | - | - | (2,253,644) |
| Charge of the main distribution and transmission grid | (477,676) | - | - | - | (477,676) |
| Personnel and management (32.2) | (417,808) | (7,782) | (134,913) | - | (560,503) |
| Pension and healthcare plans (Note 24) | (93,329) | (1,300) | (31,399) | - | (126,028) |
| Materials and supplies | (39,307) | (294) | (4,043) | - | (43,644) |
| Materials and supplies for pow er electricity | (18,212) | - | - | - | (18,212) |
| Natural gas and supplies for gas business | (199,765) | - | - | - | (199,765) |
| Third-party services (32.3) | (185,419) | (22,346) | (58,592) | - | (266,357) |
| Depreciation and amortization | (331,604) | (17) | (14,373) | (6,753) | (352,747) |
| Provisions and reversals (32.4) | - | (93,886) | - | 37,070 | (56,816) |
| Construction cost (32.5) | (553,504) | - | - | - | (553,504) |
| Other operating costs and expenses (32.6) | (131,135) | 4,038 | (69,276) | (49,889) | (246,262) |
| | (4,701,403) | (121,587) | (312,596) | (19,572) | (5,155,158) |
| Consolidated | Operational costs | Selling expenses | General and administrative expenses | Other income (expenses), net | 04.01.2016 to 06.30.2016 |
| Electricity purchased for resale (32.1) | (1,053,773) | - | - | - | (1,053,773) |
| Charge of the main distribution and transmission grid | (212,995) | - | - | - | (212,995) |
| Personnel and management (32.2) | (211,546) | (3,951) | (69,875) | - | (285,372) |
| Pension and healthcare plans (Note 24) | (45,974) | (650) | (15,896) | - | (62,520) |
| Materials and supplies | (17,949) | (153) | (2,227) | - | (20,329) |
| Materials and supplies for pow er electricity | (7,718) | - | - | - | (7,718) |
| Natural gas and supplies for gas business | (85,114) | - | - | - | (85,114) |
| Third-party services (32.3) | (89,944) | (14,411) | (31,712) | - | (136,067) |
| Depreciation and amortization | (162,491) | (8) | (7,836) | (3,376) | (173,711) |
| Provisions and reversals (32.4) | - | (56,930) | - | 121,175 | 64,245 |
| Construction cost (32.5) | (294,639) | - | - | - | (294,639) |
| Other operating costs and expenses (32.6) | (49,770) | 2,209 | (33,631) | (33,750) | (114,942) |
| | (2,231,913) | (73,894) | (161,177) | 84,049 | (2,382,935) |
| Consolidated | Operational costs | Selling expenses | General and administrative expenses | Other income (expenses), net | Restated 06.30.2015 |
| Electricity purchased for resale (32.1) | (3,567,370) | - | - | - | (3,567,370) |
| Charge of the main distribution and transmission grid | (406,708) | - | - | - | (406,708) |
| Personnel and management (32.2) | (362,988) | (6,784) | (123,998) | - | (493,770) |
| Pension and healthcare plans (Note 24) | (97,282) | (1,143) | (27,473) | - | (125,898) |
| Materials and supplies | (33,776) | (347) | (4,103) | - | (38,226) |
| Materials and supplies for pow er electricity | (133,054) | - | - | - | (133,054) |
| Natural gas and supplies for gas business | (755,978) | - | - | - | (755,978) |
| Third-party services (32.3) | (163,014) | (21,129) | (49,448) | - | (233,591) |
| Depreciation and amortization | (296,328) | (17) | (26,601) | (2,164) | (325,110) |
| Provisions and reversals (32.4) | - | (158,565) | - | (245,127) | (403,692) |
| Construction cost (32.5) | (562,079) | - | - | - | (562,079) |
| Other operating costs and expenses (32.6) | (15,507) | 1,980 | (52,064) | (123,677) | (189,268) |
| | (6,394,084) | (186,005) | (283,687) | (370,968) | (7,234,744) |
| Consolidated | Operational costs | Selling expenses | General and administrative expenses | Other income (expenses), net | 04.01.2015 to 06.30.2015 |
| Electricity purchased for resale (32.1) | (1,775,618) | - | - | - | (1,775,618) |
| Charge of the main distribution and transmission grid | (196,296) | - | - | - | (196,296) |
| Personnel and management (32.2) | (183,053) | (3,627) | (63,289) | - | (249,969) |
| Pension and healthcare plans (Note 24) | (48,309) | (591) | (12,810) | - | (61,710) |
| Materials and supplies | (15,961) | (189) | (1,373) | - | (17,523) |
| Materials and supplies for pow er electricity | (86,329) | - | - | - | (86,329) |
| Natural gas and supplies for gas business | (405,422) | - | - | - | (405,422) |
| Third-party services (32.3) | (88,150) | (12,190) | (24,015) | - | (124,355) |
| Depreciation and amortization | (146,079) | (10) | (18,481) | (1,269) | (165,839) |
| Provisions and reversals (32.4) | - | (67,289) | - | (115,630) | (182,919) |
| Construction cost (32.5) | (288,893) | - | - | - | (288,893) |
| Other operating costs and expenses (32.6) | (9,897) | 1,003 | (23,899) | (39,267) | (72,060) |
| | (3,244,007) | (82,893) | (143,867) | (156,166) | (3,626,933) |
| | | |
| Parent company | General and | Other income | |
| | administrative | (expenses), | |
| | expenses | net | 06.30.2016 |
| Personnel and management (32.2) | (15,936) | - | (15,936) |
| Pension and healthcare plans (Note 24) | (5,405) | - | (5,405) |
| Materials and supplies | (184) | - | (184) |
| Third party services | (7,945) | - | (7,945) |
| Depreciation and amortization | (16) | (561) | (577) |
| Provisions and reversals (32.4) | - | 179,147 | 179,147 |
| Other operating revenue/expenses | (19,297) | 439 | (18,858) |
| | (48,783) | 179,025 | 130,242 |
| | | |
| Parent company | General and | Other income | |
| | administrative | (expenses), | 04.01.2016 |
| | expenses | net | to 06.30.2016 |
| Personnel and management (32.2) | (6,480) | - | (6,480) |
| Pension and healthcare plans (Note 24) | (2,343) | - | (2,343) |
| Materials and supplies | (119) | - | (119) |
| Third party services | (5,336) | - | (5,336) |
| Depreciation and amortization | (12) | (281) | (293) |
| Provisions and reversals (32.4) | - | 190,541 | 190,541 |
| Other operating revenue/expenses | (10,831) | 439 | (10,392) |
| | (25,121) | 190,699 | 165,578 |
| | | |
| Parent company | General and | Other income | |
| | administrative | (expenses), | |
| | expenses | net | 06.30.2015 |
| Personnel and management (32.2) | (32,579) | - | (32,579) |
| Pension and healthcare plans (Note 24) | (3,988) | - | (3,988) |
| Materials and supplies | (269) | - | (269) |
| Third party services | (5,229) | - | (5,229) |
| Depreciation and amortization | - | (2,164) | (2,164) |
| Provisions and reversals (32.4) | - | (18,949) | (18,949) |
| Other operating revenue/expenses | (6,992) | (1,356) | (8,348) |
| | (49,057) | (22,469) | (71,526) |
| | | |
| Parent company | General and | Other income | |
| | administrative | (expenses), | 04.01.2015 |
| | expenses | net | to 06.30.2015 |
| Personnel and management (32.2) | (17,561) | - | (17,561) |
| Pension and healthcare plans (Note 24) | (2,034) | - | (2,034) |
| Materials and supplies | (205) | - | (205) |
| Third party services | (3,210) | - | (3,210) |
| Depreciation and amortization | - | (1,269) | (1,269) |
| Provisions and reversals (32.4) | - | (3,326) | (3,326) |
| Other operating revenue/expenses | (2,370) | 417 | (1,953) |
| | (25,380) | (4,178) | (29,558) |
32.1 Electricity purchased for resale
| | |
| Consolidated | 06.30.2016 | 06.30.2015 |
| Purchase of Energy in the Regulated Environment - CCEAR | 1,540,536 | 2,168,883 |
| Itaipu Binacional | 578,534 | 727,073 |
| Electric Energy Trade Chamber - CCEE | 220,953 | 846,604 |
| Program for incentive to alternative energy sources - Proinfa | 121,201 | 89,250 |
| Bilateral contracts | 8,430 | 22,902 |
| (-) PIS/Pasep/Cofins taxes on electricity purchased for resale | (216,010) | (287,342) |
| | 2,253,644 | 3,567,370 |
| | |
| Consolidated | 04.01.2016 | 04.01.2015 |
| | to 06.30.2016 | to 06.30.2015 |
| Purchase of Energy in the Regulated Environment - CCEAR | 728,066 | 1,076,635 |
| Itaipu Binacional | 276,950 | 354,472 |
| Electric Energy Trade Chamber - CCEE | 87,890 | 439,353 |
| Program for incentive to alternative energy sources - Proinfa | 60,628 | 45,207 |
| Bilateral contracts | 4,213 | 3,912 |
| (-) PIS/Pasep/Cofins taxes on electricity purchased for resale | (103,974) | (143,961) |
| | 1,053,773 | 1,775,618 |
32.2 Personnel and management
| | | | |
| | Parent company | | Consolidated |
| | 06.30.2016 | 06.30.2015 | 06.30.2016 | 06.30.2015 |
| Personnel | | | | |
| Wages and salaries | 8,337 | 19,108 | 345,232 | 309,208 |
| Social charges on payroll | 3,002 | 6,923 | 124,054 | 106,567 |
| Meal assistance and education allow ance | 651 | 1,729 | 49,574 | 44,236 |
| Provisons for profit sharing (a) | 257 | 1,254 | 22,783 | 19,964 |
| Compensation - Voluntary termination Program/retirement | - | - | 7,099 | 3,041 |
| | 12,247 | 29,014 | 548,742 | 483,016 |
| Management | | | | |
| Wages and salaries | 2,938 | 2,747 | 9,340 | 8,501 |
| Social charges on payroll | 751 | 718 | 2,330 | 2,077 |
| Other expenses | - | 100 | 91 | 176 |
| | 3,689 | 3,565 | 11,761 | 10,754 |
| | 15,936 | 32,579 | 560,503 | 493,770 |
| (a) According to Federal Law No. 10,101/2000, State Decree No. 1,978/2007 and State Law No. 16,560/2010. |
| | | | |
| | Parent company | | Consolidated |
| | 04.01.2016 | 04.01.2015 | 04.01.2016 | 04.01.2015 |
| | to 06.30.2016 | to 06.30.2015 | to 06.30.2016 | to 06.30.2015 |
| Personnel | | | | |
| Wages and salaries | 3,015 | 10,279 | 175,558 | 157,192 |
| Social charges on payroll | 1,090 | 3,570 | 62,243 | 52,277 |
| Meal assistance and education allow ance | 146 | 867 | 24,749 | 22,167 |
| Provisons for profit sharing | 74 | 609 | 12,111 | 10,112 |
| Compensation - Voluntary termination Program/retirement | - | - | 3,804 | 1,582 |
| | 4,325 | 15,325 | 278,465 | 243,330 |
| Management | | | | |
| Wages and salaries | 1,717 | 1,700 | 5,439 | 5,221 |
| Social charges on payroll | 452 | 449 | 1,420 | 1,286 |
| Other expenses | (14) | 87 | 48 | 132 |
| | 2,155 | 2,236 | 6,907 | 6,639 |
| | 6,480 | 17,561 | 285,372 | 249,969 |
32.3 Third party services
| | |
| Consolidated | 06.30.2016 | 06.30.2015 |
| Maintenance of electrical system | 83,947 | 62,389 |
| Maintenance of facilities | 44,769 | 42,796 |
| Communication, processing and transmission of data | 28,252 | 23,531 |
| Meter reading and bill delivery | 24,657 | 21,381 |
| Authorized and registered agents | 17,459 | 17,266 |
| Consumer service | 10,489 | 9,397 |
| Other services | 56,784 | 56,831 |
| | 266,357 | 233,591 |
| | |
| Consolidated | 04.01.2016 | 04.01.2015 |
| | to 06.30.2016 | to 06.30.2015 |
| Maintenance of electrical system | 37,806 | 33,690 |
| Maintenance of facilities | 23,699 | 21,490 |
| Communication, processing and transmission of data | 11,673 | 9,866 |
| Meter reading and bill delivery | 12,254 | 10,953 |
| Authorized and registered agents | 11,539 | 9,562 |
| Consumer service | 5,165 | 4,963 |
| Other services | 33,931 | 33,831 |
| | 136,067 | 124,355 |
32.4 Provisions and reversals
| | | | |
| | Parent company | Consolidated |
| | 06.30.2016 | 06.30.2015 | 06.30.2016 | 06.30.2015 |
| Provision (reversal) for litigations (Note 29) | (179,147) | 14,781 | (37,416) | 246,385 |
| PCLD (Client and Other credits) | - | - | 93,886 | 158,565 |
| Provision for losses on tax credits | - | - | 346 | (1,258) |
| Provision for negative equity in subsidiaries | - | 4,168 | - | - |
| | (179,147) | 18,949 | 56,816 | 403,692 |
| | | | |
| | Parent company | Consolidated |
| | 04.01.2016 | 04.01.2015 | 04.01.2016 | 04.01.2015 |
| | to 06.30.2016 | to 06.30.2015 | to 06.30.2016 | to 06.30.2015 |
| Provision (reversal) for litigations | (190,541) | (842) | (121,129) | 116,624 |
| PCLD (Client and Other credits) | - | - | 56,930 | 67,289 |
| Provision for losses on tax credits | - | - | (46) | (994) |
| Provision for negative equity in subsidiaries | - | 4,168 | - | - |
| | (190,541) | 3,326 | (64,245) | 182,919 |
32.5 Construction cost
| | |
| Consolidated | | |
| | 06.30.2016 | 06.30.2015 |
| Materials and supplies | 279,528 | 255,648 |
| Third party services | 202,384 | 235,789 |
| Personnel | 59,691 | 43,876 |
| Others | 11,901 | 26,766 |
| | 553,504 | 562,079 |
| | |
| Consolidated | 04.01.2016 | 04.01.2015 |
| | to 06.30.2016 | to 06.30.2015 |
| Materials and supplies | 147,921 | 140,582 |
| Third party services | 109,191 | 113,785 |
| Personnel | 30,008 | 26,201 |
| Others | 7,519 | 8,325 |
| | 294,639 | 288,893 |
32.6 Other operating costs and expenses
| | |
| Consolidated | 06.30.2016 | 06.30.2015 |
| Financial offset for the use of w ater resources | 94,200 | 71,195 |
| Compensation | 21,906 | 22,328 |
| Advertising and publicity | 19,057 | 8,458 |
| Losses in the decommissioning and disposal of assets | 16,682 | 26,086 |
| Leasing and rent (32.6.1) | 16,256 | 14,923 |
| Taxes | 15,660 | 16,712 |
| Other net costs and expenses | 62,501 | 29,566 |
| | 246,262 | 189,268 |
| | |
| | 04.01.2016 | 04.01.2015 |
| Consolidated | to 06.30.2016 | to 06.30.2015 |
| Financial offset for the use of w ater resources | 41,655 | 26,618 |
| Compensation | 10,585 | 15,302 |
| Advertising and publicity | 9,729 | 3,016 |
| Losses in the decommissioning and disposal of assets | 6,068 | 4,219 |
| Leasing and rent (32.6.1) | 7,339 | 6,782 |
| Taxes | 4,595 | 6,235 |
| Other net costs and expenses | 34,971 | 9,888 |
| | 114,942 | 72,060 |
32.6.1 Leasing and rent
| | |
| Consolidated | 06.30.2016 | 06.30.2015 |
| Real estate | 14,162 | 12,465 |
| Others | 2,677 | 3,014 |
| (-) PIS and Cofins credits | (583) | (556) |
| | 16,256 | 14,923 |
| |
| Consolidated | 04.01.2016 | 04.01.2015 |
| | to 06.30.2016 | to 06.30.2015 |
| Real estate | 7,022 | 5,340 |
| Others | 677 | 1,692 |
| (-) PIS and Cofins credits | (360) | (250) |
| | 7,339 | 6,782 |
33 Financial Results
| | | | |
| | Parent company | | Consolidated |
| | 06.30.2016 | 06.30.2015 | 06.30.2016 | 06.30.2015 |
| Financial income | | | | |
| Monetary variation of accounts receivable | | | | |
| related to the concession (Note 10.1) | - | - | 122,395 | 93,088 |
| Interest and monetary variation of CRC transfer (Note 8.1) | 120,487 | 98,966 | 120,487 | 98,966 |
| Arrears charges on energy bills | - | - | 116,573 | 73,318 |
| Return on financial investments held for trading | 2,221 | 636 | 89,941 | 57,025 |
| Monetary variation over the Itaipu pow er purchase | - | - | 30,590 | - |
| Remuneration of net sectorial assets and liabilities (Note 9.3) | - | - | 27,733 | 78,142 |
| Return on financial investments held for sale | 10 | 8 | 6,652 | 8,719 |
| Monetary variation and adjust to present value of accounts | | | | |
| payable related to the concession | - | - | 1,078 | 1,387 |
| Monetary variation and interest of accounts receivable | | | | |
| related to the concession compensation | - | - | - | 89,912 |
| Other financial income | 115,643 | 11,398 | 144,740 | 27,954 |
| | 238,361 | 111,008 | 660,189 | 528,511 |
| ( - ) Financial expenses | | | | |
| Monetary and cambial variation and debt charges | 143,688 | 122,941 | 497,207 | 270,373 |
| Monetary variation and adjust to present value of accounts | | | | |
| payable related to the concession | - | - | 57,651 | 46,942 |
| Remuneration of net sectorial assets and liabilities (Note 9.3) | - | - | 20,348 | - |
| Interest on R&D and EEP (Note 26.2) | - | - | 19,974 | 15,170 |
| Monetary variation over the Itaipu pow er purchase | - | - | 10,579 | - |
| Other financial expenses | 1,124 | 1,051 | 84,543 | 34,512 |
| | 144,812 | 123,992 | 690,302 | 366,997 |
| Net | 93,549 | (12,984) | (30,113) | 161,514 |
| | | | |
| | Parent company | | Consolidated |
| | 04.01.2016 | 04.01.2015 | 04.01.2016 | 04.01.2015 |
| | to 06.30.2016 | to 06.30.2015 | to 06.30.2016 | to 06.30.2015 |
| Financial income | | | | |
| Monetary variation of accounts receivable | | | | |
| related to the concession | - | - | 113,369 | 49,521 |
| Interest and monetary variation of CRC transfer | 63,019 | 46,973 | 63,019 | 46,973 |
| Arrears charges on energy bills | - | - | 57,969 | 38,974 |
| Return on financial investments held for trading | 1,605 | 432 | 47,996 | 34,514 |
| Monetary variation over the Itaipu pow er purchase | - | - | 13,285 | - |
| Remuneration of net sectorial assets and liabilities | - | - | 10,830 | 32,813 |
| Return on financial investments held for sale | 5 | 4 | 3,553 | 4,157 |
| Monetary variation and adjust to present value of accounts | | | | |
| payable related to the concession | - | - | 237 | 1,387 |
| Monetary variation and interest of accounts receivable | | | | |
| related to the concession compensation | - | - | - | 81,936 |
| Other financial income | 108,605 | 7,441 | 135,962 | 18,360 |
| | 173,234 | 54,850 | 446,220 | 308,635 |
| ( - ) Financial expenses | | | | |
| Monetary and cambial variation and debt charges | 73,210 | 64,602 | 248,162 | 150,357 |
| Monetary variation and adjust to present value of accounts | | | | |
| payable related to the concession | - | - | 21,916 | 24,790 |
| Remuneration of net sectorial assets and liabilities | - | - | 18,700 | (14,879) |
| Interest on R&D and EEP | - | - | 10,372 | 8,024 |
| Monetary variation over the Itaipu pow er purchase | - | - | 46 | - |
| Other financial expenses | (1,909) | 902 | 19,276 | 19,714 |
| | 71,301 | 65,504 | 318,472 | 188,006 |
| Net | 101,933 | (10,654) | 127,748 | 120,629 |
34 Operating segments
Operating segments are business activities that generate revenues and incur expenses, whose operating results are regularly reviewed by the executive boards of the parent company and subsidiaries and by key strategic decision makers responsible for allocating funds and assessing performance.
34.1 Products and services from which reportable segments obtain their revenues
The Company’s reportable segments are identified by the executives in charge of each business area based on regulatory environments, strategic business units and different products and services. Segments are managed separately because each business and each business requires different technologies and strategies.
In the first half of 2016, all sales took place in Brazil and all non-current assets are located in Brazil.
In the first half of 2016, there was no one single customer identified as individually responsible for over 10% of total net revenues of the Company and its subsidiaries.
The Company evaluates the performance of each segment based on information derived from accounting records.
The operating segments’ accounting policies are the same as those described in the summary of significant accounting policies and inter-segment transactions are carried out on an ‘arm’s length’ basis, meaning at current market prices.
34.2 The Company’s reportable segments
Electricity generation and transmission (GET) - produces electricity from hydro, wind and thermal sources(GER), provides electrical power transport and transformation services, and is in charge of building, operating and maintaining substations and transmission lines(TRA); for managers, the assets and liabilities of the generation and transmission segments are shown on an aggregated basis while their result is shown separately.
Electric power distribution and sale (DIS) - distributes and sells power and is responsible for operating and maintaining infrastructure and for providing related services;
Telecommunications (TEL)- provides telecommunications services and communications services in general;
Gas- operates the public service of distribution of piped natural gas; and
Holding (HOL) -manages equity in other companies
34.3 Assets by reportable segment
| ASSETS | GET | DIS | TEL | GAS | HOL | Eliminations | Consolidated |
| 06.30.2016 | | | | | | | |
| | | | | | | | |
| TOTAL ASSETS | 15,225,832 | 10,119,923 | 814,010 | 498,008 | 3,758,318 | (645,871) | 29,770,220 |
| CURRENT ASSETS | 1,260,356 | 2,902,396 | 170,936 | 108,801 | 962,594 | (892,679) | 4,512,404 |
| Cash and cash equivalents | 151,275 | 505,831 | 88,622 | 27,775 | 54,814 | - | 828,317 |
| Bonds and securities | 391,143 | - | - | - | 1,341 | - | 392,484 |
| Collaterals and escrow accounts | - | 18 | - | 177 | 127 | - | 322 |
| Trade accounts receivable | 483,314 | 2,006,079 | 42,697 | 74,456 | - | (63,329) | 2,543,217 |
| Dividends receivable | 30,791 | - | - | - | 805,090 | (807,955) | 27,926 |
| Accounts receivable related to the concession | 22,174 | - | - | - | - | - | 22,174 |
| Other receivables | 108,665 | 203,727 | 5,080 | 2,754 | 12,779 | (2,802) | 330,203 |
| Inventories | 26,948 | 95,336 | 18,074 | 2,026 | - | - | 142,384 |
| Income Tax and Social Contribution | 6,043 | - | 12,126 | 364 | 48,595 | - | 67,128 |
| Other noncurrent recoverable taxes | 20,333 | 51,843 | 4,325 | 593 | 162 | - | 77,256 |
| Prepaid expenses | 19,670 | 20,080 | 12 | 656 | - | - | 40,418 |
| Related parties | - | 19,482 | - | - | 39,686 | (18,593) | 40,575 |
| NON-CURRENT ASSETS | 13,965,476 | 7,217,527 | 643,074 | 389,207 | 2,795,724 | 246,808 | 25,257,816 |
| Long Term Assets | 3,494,184 | 1,935,275 | 67,587 | 83,420 | 2,020,006 | (162,895) | 7,437,577 |
| Bonds and securities | 131,449 | 1,375 | - | 6,283 | 39,489 | - | 178,596 |
| Collaterals and escrow accounts | - | 76,362 | - | - | - | - | 76,362 |
| Trade accounts receivable | 949 | 37,696 | 36,404 | - | - | - | 75,049 |
| CRC transferred to the State Government of Paraná | - | - | - | - | 1,454,304 | - | 1,454,304 |
| Judicial deposits | 71,828 | 407,819 | 8,776 | 35,607 | 86,874 | - | 610,904 |
| Accounts receivable related to the concession | 3,021,216 | 579,437 | - | 16,447 | - | - | 3,617,100 |
| Accounts receivable related to the concession compensation | 59,339 | - | - | - | - | - | 59,339 |
| Other receivables | 18,539 | 26,802 | 81 | 1,860 | - | - | 47,282 |
| Income Tax and Social Contribution | 591 | 15,550 | - | - | 144,844 | - | 160,985 |
| Other noncurrent recoverable taxes | 71,130 | 42,575 | 6,786 | - | 14 | - | 120,505 |
| Deferred income tax and social contribution | 26,724 | 747,659 | 15,540 | 23,070 | 34,491 | - | 847,484 |
| Prepaid expenses | 21,948 | - | - | 153 | - | - | 22,101 |
| Related parties | 70,471 | - | - | - | 259,990 | (162,895) | 167,566 |
| Investments | 1,861,599 | 1,374 | - | - | 729,511 | - | 2,592,484 |
| Property, plant and equipment | 8,339,565 | - | 559,017 | - | 42,490 | - | 8,941,072 |
| Intangible Assets | 270,128 | 5,280,878 | 16,470 | 305,787 | 3,717 | 409,703 | 6,286,683 |
34.4 Liabilities by reportable segment
| LIABILITIES | GET | DIS | TEL | GAS | HOL | Eliminations | Consolidated |
| 06.30.2016 | | | | | | | |
| | | | | | | |
| TOTAL LIABILITIES | 15,225,832 | 10,119,923 | 814,010 | 498,008 | 3,758,318 | (645,871) | 29,770,220 |
| CURRENT LIABILITIES | 1,979,142 | 2,592,328 | 143,508 | 113,787 | 520,691 | (893,499) | 4,455,957 |
| Payroll, social charges and accruals | 52,032 | 138,548 | 17,625 | 6,979 | 7,483 | - | 222,667 |
| Related parties | 14,394 | - | - | - | 4,200 | (18,594) | - |
| Suppliers | 458,005 | 743,750 | 12,649 | 73,219 | 8,122 | (66,128) | 1,229,617 |
| Income Tax and Social Contribution | 52,702 | 100,759 | 2,871 | 4,404 | 1,183 | - | 161,919 |
| Other taxes due | 80,044 | 119,372 | 4,896 | 8,123 | 3,396 | - | 215,831 |
| Loans and financing | 125,294 | 196,792 | 6,014 | - | 137,202 | (822) | 464,480 |
| Debentures | 283,498 | 523,661 | 2,658 | 19,118 | 351,344 | - | 1,180,279 |
| Dividends payable | 531,358 | 200,000 | 94,201 | - | 7,230 | (807,955) | 24,834 |
| Post-employment benefits | 10,918 | 30,683 | 1,677 | - | 189 | - | 43,467 |
| Customer charges due | 6,382 | 137,908 | - | - | - | - | 144,290 |
| Research and Development and Energy Efficiency | 51,501 | 105,569 | - | - | - | - | 157,070 |
| Accounts Payable related to concession | 276,707 | - | - | - | - | - | 276,707 |
| Sectorial financial liabilities | - | 209,705 | - | - | - | - | 209,705 |
| Other accounts payable | 36,307 | 85,581 | 917 | 1,944 | 342 | - | 125,091 |
| NON-CURRENT LIABILITIES | 5,017,268 | 2,757,825 | 229,890 | 65,181 | 2,084,426 | (524,315) | 9,630,275 |
| Related parties | 34,177 | - | - | - | 398,511 | (432,688) | - |
| Suppliers | 5,923 | - | - | - | - | - | 5,923 |
| Tax liabilities | 151,179 | 85,874 | 5,236 | - | 1,830 | - | 244,119 |
| Deferred income tax and social contribution | 286,031 | - | - | - | - | - | 286,031 |
| Loans and financing | 2,108,873 | 679,491 | 18,755 | - | 883,560 | (91,601) | 3,599,078 |
| Debentures | 1,046,665 | 499,931 | 168,160 | 51,737 | 665,503 | - | 2,431,996 |
| Post-employment benefits | 163,572 | 389,000 | 23,476 | 4,221 | 14,161 | - | 594,430 |
| Research and Development and Energy Efficiency | 77,095 | 202,679 | - | - | - | - | 279,774 |
| Accounts Payable related to concession | 500,922 | - | - | - | - | - | 500,922 |
| Sectorial financial liabilities | - | 215,235 | - | - | - | - | 215,235 |
| Other accounts payable | 16,521 | - | - | 8,517 | 9,506 | (26) | 34,518 |
| Provisions for legal claims | 626,310 | 685,615 | 14,263 | 706 | 111,355 | - | 1,438,249 |
| EQUITY | 8,229,422 | 4,769,770 | 440,612 | 319,040 | 1,153,201 | 771,943 | 15,683,988 |
| Attributable to controlling shareholders | 8,229,422 | 4,769,770 | 440,612 | 319,040 | 1,153,201 | 459,405 | 15,371,450 |
| Attributed to non-controlling interest | | | | | | 312,538 | 312,538 |
34.5 Statement of income by reportable segment
| | | | | | | | |
| STATEMENT OF INCOME | GET | DIS | TEL | GAS | HOL | Eliminations | Consolidated |
| 06.30.2016 | GER | TRA |
| | | | | | | | |
| NET OPERATING REVENUES | 1,472,215 | 1,321,102 | 3,807,700 | 156,461 | 305,177 | - | (294,461) | 6,768,194 |
| Supply of electric pow er - third-parties | 285,844 | - | 2,773,832 | - | - | - | - | 3,059,676 |
| Supply of electric pow er - betw een segments | - | - | 2,163 | - | - | - | (2,163) | - |
| Electricity sales to final customers - third-parties | 1,020,248 | - | 290,703 | - | - | - | - | 1,310,951 |
| Electricity sales to final customers - betw een segments | 148,343 | - | - | - | - | - | (148,343) | - |
| Use of the main distribution and transmission grid - third-parties | - | 1,085,335 | 1,560,210 | - | - | - | - | 2,645,545 |
| Use of the main distribution and transmission grid - betw een s | - | 39,253 | 8,175 | - | - | - | (47,428) | - |
| Construction income | - | 192,879 | 366,194 | - | 13,372 | - | - | 572,445 |
| Telecommunications services - third-parties | - | - | - | 123,990 | - | - | - | 123,990 |
| Telecommunications services - betw een segments | - | - | - | 14,936 | - | - | (14,936) | - |
| Distribution of piped gas - third-parties | - | - | - | - | 250,168 | - | - | 250,168 |
| Distribution of piped gas - betw een segments | - | - | - | - | 41,637 | - | (41,637) | - |
| Sectorial financial assets and liabilities result | - | - | (1,254,487) | - | - | - | - | (1,254,487) |
| Other operating revenues - third-parties | 5,454 | - | 55,731 | (1,279) | - | - | - | 59,906 |
| Other operating revenues - betw een segments | 12,326 | 3,635 | 5,179 | 18,814 | - | - | (39,954) | - |
| OPERATING COSTS AND EXPENSES | (795,152) | (247,361) | (4,140,610) | (111,524) | (268,615) | 113,625 | 294,479 | (5,155,158) |
| Energy purchased for resale | (53,948) | - | (2,348,021) | - | - | - | 148,325 | (2,253,644) |
| Charges for use of the main transmission grid | (153,183) | - | (370,154) | - | - | - | 45,661 | (477,676) |
| Personnel and management | (88,602) | (41,224) | (345,067) | (43,233) | (17,014) | (25,363) | - | (560,503) |
| Pension and healthcare plans | (20,187) | (9,824) | (77,680) | (9,427) | (1,306) | (7,604) | - | (126,028) |
| Materials and supplies | (6,580) | (2,360) | (32,591) | (1,042) | (804) | (267) | - | (43,644) |
| Raw materials and supplies for generation | (59,849) | - | - | - | - | - | 41,637 | (18,212) |
| Natural gas and supplies for gas business | - | - | - | - | (199,765) | - | - | (199,765) |
| Third party services | (96,799) | (10,554) | (172,314) | (20,614) | (8,936) | (10,971) | 53,831 | (266,357) |
| Depreciation and amortization | (186,952) | (1,170) | (135,176) | (16,940) | (11,928) | (581) | - | (352,747) |
| Provision (reversal) for litigations | (5,427) | (2,742) | (127,498) | (6,015) | (29) | 179,126 | - | 37,415 |
| Other provisions and reversals | (1,270) | (431) | (90,892) | (962) | (676) | (20) | 20 | (94,231) |
| Construction cost | - | (173,938) | (366,194) | - | (13,372) | - | - | (553,504) |
| Other operating costs and expenses | (122,355) | (5,118) | (75,023) | (13,291) | (14,785) | (20,695) | 5,005 | (246,262) |
| EQUITY IN EARNINGS OF INVESTEES | - | 43,920 | - | - | - | 60,790 | (1) | 104,709 |
| PROFIT BEFORE FINANCIAL INCOME (LOSS) AND TAX | 677,063 | 1,117,661 | (332,910) | 44,937 | 36,562 | 174,415 | 17 | 1,717,745 |
| Financial income | 58,394 | 4,793 | 339,133 | 8,918 | 7,530 | 242,763 | (1,342) | 660,189 |
| Financial expenses | (296,708) | (64,297) | (161,920) | (15,224) | (7,934) | (145,561) | 1,342 | (690,302) |
| OPERATING PROFIT | 438,749 | 1,058,157 | (155,697) | 38,631 | 36,158 | 271,617 | 17 | 1,687,632 |
| Income Tax and Social Contribution | (154,482) | (344,675) | 52,320 | (12,692) | (12,839) | (82,597) | - | (554,965) |
| NET INCOME | 284,267 | 713,482 | (103,377) | 25,939 | 23,319 | 189,020 | 17 | 1,132,667 |
34.6 Additions to non-current assets by reportable segment
| | | | | | | |
| | | | | | | | |
| | GET | DIS | TEL | GAS | HOL | Consolidated |
| 06.30.2016 | GER | TRA |
| | | | | | | | |
| Property, plant and equipment | | | | | | | |
| Additions | 562,518 | - | - | 62,692 | - | 96 | 625,306 |
| Intangible Assets | | | | | | | |
| Additions | - | 1,823 | 395,729 | 551 | 13,211 | 430 | 411,744 |
35 Financial Instruments
35.1 Categories and determination of fair value of financial instruments
| | | | | | |
| Consolidated | | | | 06.30.2016 | | 12.31.2015 |
| | Note | Level | Book value | Fair value | Book value | Fair value |
| Financial assets | | | | | | |
| Fair value through profit or loss - held for trading | | | | | | |
| Trading securities | | | | | | |
| Cash and cash equivalents (a) | 5 | 1 | 828,317 | 828,317 | 1,480,727 | 1,480,727 |
| Derivative financial instruments (b) | 6 | 1 | 2,969 | 2,969 | 2,565 | 2,565 |
| Derivative financial instruments (b) | 6 | 2 | 349,700 | 349,700 | 333,649 | 333,649 |
| | | | 1,180,986 | 1,180,986 | 1,816,941 | 1,816,941 |
| Loans and receivables | | | | | | |
| Collaterals and escrow accounts STN (c) | 22.1 | | 76,362 | 45,603 | 86,137 | 51,414 |
| Pledges and restricted deposits linked (a) | | | 322 | 322 | 2,000 | 2,000 |
| Trade accounts receivable (a) | 7 | | 2,618,266 | 2,618,266 | 3,107,889 | 3,107,889 |
| CRC Transferred to the State Government of Paraná (d) | 8 | | 1,454,304 | 1,495,883 | 1,383,242 | 1,343,497 |
| Sectorial financial assets (a) | 9 | | - | - | 1,045,662 | 1,045,662 |
| Accounts receivable related to the concession (e) | 10 | | 2,470,568 | 2,470,568 | 943,473 | 943,473 |
| Accounts receivable related to the concession - | | | | | | |
bonus from the grant (f) | 10 | | 589,269 | 675,548 | - | - |
| State of Paraná - Government Programs (a) | 15.1 | | 187,048 | 187,048 | 187,048 | 187,048 |
| | | | 7,396,139 | 7,493,238 | 6,755,451 | 6,680,983 |
| Available for sale | | | | | | |
| Accounts receivable related to the concession (g) | 10 | 3 | 579,437 | 579,437 | 424,140 | 424,140 |
| Accounts receivable related to the concession compensation (h) | 11 | 3 | 59,339 | 59,339 | 219,556 | 219,556 |
| Derivative financial instruments (b) | 6 | 1 | 1,492 | 1,492 | 2,728 | 2,728 |
| Derivative financial instruments (b) | 6 | 2 | 216,919 | 216,919 | 158,449 | 158,449 |
| Other investments (i) | 17 | 1 | 17,796 | 17,796 | 17,626 | 17,626 |
| | | | 874,983 | 874,983 | 822,499 | 822,499 |
| Total financial assets | | | 9,452,108 | 9,549,207 | 9,394,891 | 9,320,423 |
| | | | | | | |
| Financial liabilities | | | | | | |
| Other financial liabilities | | | | | | |
| Ordinary financing of taxes w ith the federal tax authorities (c) | 13.3 | | 181,253 | 162,056 | 193,739 | 171,119 |
| Suppliers (a) | 21 | | 1,235,540 | 1,235,540 | 1,619,049 | 1,619,049 |
| Loans and financing (c) | 22 | | 4,063,558 | 3,590,450 | 4,077,060 | 3,539,257 |
| Debentures (j) | 23 | | 3,612,275 | 3,612,275 | 3,683,928 | 3,683,928 |
| Post employment benefits (k) | 24 | | 637,897 | 637,897 | 594,660 | 594,660 |
| Sectorial financial liabilities (a) | 9 | | 424,940 | 424,940 | - | - |
| Payable related to concession (l) | 27.1 | | 562,902 | 673,995 | 535,665 | 651,403 |
| Payable related to concession - | | | | | | |
bonus from the grant (a) | 27.2 | | 214,727 | 214,727 | - | - |
| | | | 10,933,092 | 10,551,880 | 10,704,101 | 10,259,416 |
| Total financial liabilities | | | 10,933,092 | 10,551,880 | 10,704,101 | 10,259,416 |
Different levels are defined as follow s:
Level 1: Obtained from quoted prices (not adjusted) in active markets for identical assets and liabilities;
Level 2:obtained through other variables in addition to quoted prices included in Level 1, w hich are observable for the assets or liabilities;
Level 3:obtained through assessment techniques w hich include variables for the assets or liabilities, w hich how ever are not based on observable market data.
82
Fair value determination
a) Equivalent to their book value based on their nature and period held
b) Calculated from data provided by financial agents and market values of Brazilian government bonds.
c) Taking the cost of capital from the Company’s most recent funding transaction - 121% of CDI rate - as basic assumption when discounting expected flows of payments.
d) Using as assumption the comparison against long-term floating-rate National Treasury Notes (NTN-Bs), NTN-B Principal maturing on August 15, 2024, which pays around 6.01% p.a. plus IPCA.
e) Criteria and assumptions are disclosed in Note 4.3.10 to the financial statements of December 31, 2015, transmission concession and Note 10.3.
f) Receivables related to the concession agreement for providing electricity generation services under quota arrangements at their fair value calculated by expected cash inflows discounted at the rate established in Aneel auction notice 12/2015 (9.04%), the best market benchmark in this case.
g) Criteria and assumptions disclosed in Note 4.3.10 to the financial statements of December 31, 2015, distribution concession. Changes in the first half of 2016 are shown as follows:
| |
| | Consolidated |
| Balance as of January 1, 2016 | 424,140 |
| Transfer to intagible - Extension of Copel Distribuição’s Concession | 2,230 |
| Capitalization of intangible assets in progress | 31,386 |
| Monetary variations | 121,733 |
| Loss on disposal | (52) |
| Balance as of June 30, 2016 | 579,437 |
h) The fair values of generation assets approximate their book values, given that Management’s best expectation is to receive the undepreciated value of the plant’s assets.
i) Calculated from price quotations published on active markets or by applying the related percentage share of shareholders’ equity in cases of assets for which there is no active market.
j) Calculated from the Unit Price quotation (PU) for June 30, 2016, obtained from the Brazilian Association of Financial and Capital Markets (Anbima), net of financial cost to amortize of R$9,513.
k) Criteria and assumptions disclosed in Note 4.9 to the financial statements of December 31, 2015.
l) Real net discount rate of 7.74% p.a., in line with the Company’s estimated rate for long-term projects.
35.2 Financial risk management
The Company’s Corporate Risk Management Committee is responsible for developing and monitoring risk management policies and using Audit Committee assistance and advisory services to ensure sound management of funds and protection and appreciation of its equity.
The Company’s business is exposed to the following risks arising from financial instruments:
35.2.1 Credit risk
Credit risk is the risk of incurring losses arising from a customer or a financial instrument counterparty resulting from their failing to honor contractual obligations.
| | |
| Consolidated | | |
| Exposure to credit risk | 06.30.2016 | 12.31.2015 |
| Cash and cash equivalents (a) | 828,317 | 1,480,727 |
| Derivative financial instruments (a) | 571,080 | 497,391 |
| Pledges and restricted deposits linked (a) | 76,684 | 88,137 |
| Trade accounts receivable (b) | 2,618,266 | 3,107,889 |
| CRC Transferred to the State Government of Paraná (c) | 1,454,304 | 1,383,242 |
| Sectorial financial assets (d) | - | 1,045,662 |
| Accounts receivable related to the concession (e) | 3,639,274 | 1,367,613 |
| Accounts receivable related to the concession compensation (f) | 59,339 | 219,556 |
| State of Paraná - Government Programs (g) | 187,048 | 187,048 |
| | 9,434,312 | 9,377,265 |
a) The Company manages credit risk for these assets based on its policy of investing almost all finds in federal government controlled banks. Exceptionally, due to legal and/or regulatory requirements, the Company invested finds in first-line private banks.
b) Risk arising from the possibility of the Company incurring losses as a result of difficulty in receiving amounts billed to its customers. This risk relates to both internal and external factors. To reduce this risk, the Company manages receivables and detects customer segments in which default is more likely to then suspend electricity supplies and implement specific collection policies based on property or personal guarantees for debts of over R$200.
Doubtful accounts are adequately covered by provisioning for possible losses on their realization.
c) Management believes this credit risk is low because repayments are secured by funds from dividends.
d) Management believes this credit risk is very low because the contracts signed assure an unconditional right to be reimbursed for any costs not recovered through tariff costs at the end of the concession period, to be paid in cash by the concession granting authority.
e) Management believes this risk is very low because these contracts assure an unconditional right to be paid in cash by the concession granting authority at the end of the concession period for any infrastructure investments not recovered through tariffs by the end of the period, specifically for the transmission business, since Permitted Annual Revenue - APR is guaranteed revenue that does not involve demand risk.
For the amount relating to RBSE assets existing on May 31, 2000, Aneel published Normative Resolution 589/2013, which defines criteria for calculating New Replacement Value (VNR).Given that on April 20, 2016, the Granting Authority defined the means and period for receiving this asset (still to be regulated by Aneel) through MME Ordinance 120, Management believes credit risk is low.
f) For generation concession assets, Aneel published Normative Resolution 596/2013, which defines criteria for calculating NRV for compensation purposes. Although the Granting Authority has not yet disclosed the means of remunerating these assets and there are uncertainties as to approval or ratification of investments made in this respect, Management believes that compensation for these assets will show recoverability of the balances recognized at June 30, 2016.
g) Management believes this credit risk is very low because these are specific programs together with the State Government to highlight theLuz Fraternaprogram (Note 36.a).
35.2.2 Liquidity risk
The Company’s liquidity risk refers to the possibility of having insufficient funds available in cash or other financial assets to honor obligations on due dates.
The Company manages liquidity risk through methodologies, procedures and tools used to constantly control financial processes and ensure adequate risk management.
Investments are financed through medium- and long-term debt funded by financial institutions and capital markets.
Short-, medium- and long-term economic and financial projections are developed and submitted for appraisal by Management bodies. Corporate budgets for subsequent years are reviewed and approved annually.
Medium- and long-term economic and financial projections for monthly periods cover the next five years. The short-term projection is for daily periods covering the coming 90 days.
The Company constantly monitors funds to be paid or settled by controlling cash flow, thus reducing funding costs and rollover risk and ensuring compliance with financial investment policy while maintaining minimum levels of cash holdings.
The following table shows expected settlement amounts not discounted, for each interval of time. The projections were based on financial indicators for the corresponding financial instruments as forecast by the median market expectation as published by the Central Bank of Brazil’s the Focus report, which shows market analysts’ average expectation for these indicators for the current and subsequent years. From 2018 onward, the 2017 indicators have been repeated through to the end of the forecasting horizon, except for the dollar rate, which tracks inflation.
| | | | | | | |
| Consolidated | Interest (a) | Less than | 1 to 3 | 3 months | | Over | Total |
| | | 1 month | months | to 1 year | 1 to 5 years | 5 years | liabilities |
| 06.30.2016 | | | | | | | |
| Loans and financing | Note 22 | 202,823 | 79,846 | 569,124 | 3,061,218 | 1,601,422 | 5,514,433 |
| Debentures | Note 23 | 8,981 | 19,034 | 1,536,109 | 2,747,953 | 254,104 | 4,566,181 |
| Derivatives | Future inter-bank rate | - | - | - | - | - | - |
| Payable related to concession | Rate of return + | | | | | | |
| use of public property | IGP-M and IPCA | 5,021 | 10,054 | 50,351 | 303,284 | 2,103,650 | 2,472,360 |
| Eletrobrás - Itaipu | Dollar | - | 197,300 | 902,379 | 5,381,095 | 3,896,644 | 10,377,418 |
| Other suppliers | - | 875,984 | 145,161 | 192,199 | 22,196 | - | 1,235,540 |
| Purchase obligations | IGP-M and IPCA | - | 1,303,293 | 3,581,421 | 21,134,810 | 114,193,011 | 140,212,535 |
| Ordinary financing of taxes | | | | | | | |
| w ith the federal tax authorities | Selic | 3,986 | 8,079 | 37,145 | 173,566 | - | 222,776 |
| Post-employment benefits | 8.94% | 38,097 | 76,193 | 342,870 | 1,709,345 | 4,684,336 | 6,850,841 |
| | | 1,134,892 | 1,838,960 | 7,211,598 | 34,533,467 | 126,733,167 | 171,452,084 |
| 12.31.2015 | | | | | | | |
| Loans and financing | Note 22 | 78,969 | 86,071 | 473,032 | 3,546,135 | 2,023,379 | 6,207,586 |
| Debentures | Note 23 | 6,277 | 13,735 | 1,313,062 | 3,485,797 | 205,515 | 5,024,386 |
| Derivatives | Future inter-bank rate | - | - | - | - | - | - |
| Payable related to concession | Rate of return + | | | | | | |
use of public property | IGP-M and IPCA | 4,978 | 9,958 | 46,687 | 287,316 | 2,001,514 | 2,350,453 |
| Eletrobrás - Itaipu | Dollar | - | 210,867 | 988,015 | 5,774,563 | 5,047,764 | 12,021,209 |
| Other suppliers | - | 1,138,130 | 228,200 | 230,316 | 22,403 | - | 1,619,049 |
| Purchase obligations | IGP-M and IPCA | - | 1,278,480 | 3,629,110 | 21,371,882 | 112,292,091 | 138,571,563 |
| Ordinary financing of taxes | | | | | | | |
| w ith the federal tax authorities | Selic | 3,764 | 7,641 | 36,228 | 191,659 | - | 239,292 |
| Post-employment benefits | 8.94% | 38,097 | 76,193 | 342,870 | 1,709,345 | 4,684,336 | 6,850,841 |
| | | 1,270,215 | 1,911,145 | 7,059,320 | 36,389,100 | 126,254,599 | 172,884,379 |
| (a) Effective interest rate - w eighted average. |
As disclosed in Notes 22.5 and 23.3, the Company and its subsidiaries have loans, financing and debentures containing covenants that may require payment in advance for these obligations.
35.2.3 Market risk
Market risk is the risk that the fair value or future cash flows of financial instrument will fluctuate due to changing market prices, such as currency exchange rates, interest rates and stock prices. The purpose of managing this risk is to control exposures, within acceptable parameters, while optimizing returns.
a) Currency risk - US dollar
This risk arises from the possibility of losses due to fluctuating exchange rates that may reduce the value of assets denominated in foreign currency or add to liabilities.
The Company’s foreign currency debt is not material and there is no exposure to foreign-currency derivatives. The Company monitors exchange rates.
Exchange-rate variation effects arising from the Eletrobras electricity purchasing agreement (Itaipu) are passed on as part of Copel Distribuição’s subsequent tariff review.
Currency risk related to purchases of gas arise from the possibility of Compagás calculating its losses resulting from fluctuating exchange rates thus increasing the amount in Brazilian reais of accounts payable for gas purchased from Petrobras. This risk is mitigated by monitoring prices and passing on variations to customers via tariff rates whenever possible. Compagás is constantly monitoring these fluctuating exchange rates.
Currency risk sensitivity analysis
The Company developed sensitivity analysis in order to measure the impact of US dollar depreciation on its loans and financing exposed to these risks.
The baseline scenario takes balances in the respective accounts on June 30, 2016; the probable scenario assumes a variation in the EOY exchange rate (R$/US$3.34) based on the median market expectation for 2016 reported in the Central Bank’s Focus report of July 22, 2016. The adverse and remote scenarios assumed levels of deterioration to be 25% and 50% respectively comparing the financial instrument’s key risk factor against the level used for the probable scenario.
| | | | | |
| | | Baseline | Projected scenarios - Dec.2016 |
| Foreign exchange risk | Risk | 06.30.2016 | Probable | Adverse | Remote |
| . | | | | | |
| Financial assets | | | | | |
| Collaterals and escrow accounts - STN | USD depreciation | 76,362 | 3,098 | (16,768) | (36,633) |
| . | | 76,362 | 3,098 | (16,768) | (36,633) |
| Financial liabilities | | | | | |
| Loans and financing | | | | | |
| STN | USD appreciation | (92,423) | (3,749) | (27,792) | (51,835) |
| Suppliers | | | | | |
| Eletrobrás (Itaipu) | USD appreciation | (183,480) | (7,443) | (55,173) | (102,904) |
| Petrobras (acquisition of gas by Compagás) | USD appreciation | (66,824) | (2,711) | (20,094) | (37,478) |
| | | (342,727) | (13,903) | (103,059) | (192,217) |
In addition to the sensitivity analysis required by CVM Instruction 475/2008, the Company evaluates its financial instruments by taking into account possible effects on its results and shareholders’ equity arising from risks assessed by management on financial statements as per CPC 40 and IFRS 7 recommendations. Based on asset position and notional value of financial instruments outstanding on June 30, 2016, it is estimated that these effects would be similar to those mentioned in the ‘probable scenario’ column in the table shown above, since the assumptions made by the Company are similar.
b) Interest rate and monetary variation risk
The Company’s risk of incurring losses due to fluctuating interest rates or other indices that decrease financial income or increase financial expenses related to assets or liabilities funded in the market.
The Company has no derivative trades to hedge this risk, but it has been continually monitoring interest rates and market indicators in order to assess any need for derivatives.
Interest rate and monetary variation risk - sensitivity analysis
The Company has developed sensitivity analysis in order to measure the impact of interest rate and monetary variations on financial assets and liabilities exposed to these risks.
The baseline scenario takes balances existing in the corresponding accounts on June 30, 2016 while the ‘probable’ scenario assumes balances reflecting varying indicators as follows: CDI/Selic - 13.25%, IPCA - 7.21% IGP DI - 8.62% IGP-M - 9.04% and TJLP - 7.50% forecasts from median market expectations for 2016 published in the Central Bank’s Focus report on July 22, 2016.
The adverse and remote scenarios assumed levels of deterioration to be 25% and 50% respectively comparing the financial instrument’s key risk factor against the level used for the probable scenario.
| | | | | |
| | | Baseline | Projected scenarios - Dec.2016 |
| Interest rate risk and monetary variation | Risk | 06.30.2016 | Probable | Adverse | Remote |
| . | | | | | |
| Financial assets | | | | | |
| Bonds and securities | Low CDI/SELIC | 571,080 | 38,946 | 29,434 | 19,799 |
| Collaterals and escrow accounts | Low CDI/SELIC | 322 | 22 | 17 | 11 |
| CRC transferred to the State Government of Paraná | Low IGP-DI | 1,454,304 | 61,385 | 46,274 | 31,010 |
| Accounts receivable related to the concession | Low IPCA | 3,639,274 | 128,913 | 97,101 | 65,017 |
| Accounts receivable related to the concession compensation | Undefined (a) | 59,339 | - | - | - |
| State of Paraná - Government Programs | No risk | 187,048 | - | - | - |
| | | 5,911,367 | 229,266 | 172,826 | 115,837 |
| Financial liabilities | | | | | |
| Loans and financing | | | | | |
| Banco do Brasil | High CDI | (1,538,452) | (98,753) | (122,524) | (145,960) |
| Eletrobrás - RGR | No risk (b) | (56,715) | - | - | - |
| Caixa Econômica Federal | No risk (b) | (5,441) | - | - | - |
| Finep | High TJLP | (24,769) | (912) | (1,135) | (1,356) |
| BNDES | High TJLP | (1,674,504) | (61,659) | (76,734) | (91,681) |
| Promissory notes | High CDI | (537,716) | (34,516) | (42,824) | (51,015) |
| Banco do Brasil - Distribution of Funds from BNDES | High TJLP | (133,538) | (4,917) | (6,119) | (7,311) |
| Debentures | High CDI | (3,370,602) | (216,358) | (268,439) | (319,784) |
| Debentures - CTE | High IPCA | (170,818) | (6,051) | (7,531) | (9,000) |
| Debentures - Compagás | High TJLP | (70,855) | (2,609) | (3,247) | (3,879) |
| Sectorial financial liabilities | High Selic | (424,940) | (27,277) | (33,843) | (40,316) |
| Ordinary financing of taxes w ith the federal tax authorities | High Selic | (181,253) | (11,635) | (14,435) | (17,196) |
| . | | (8,189,603) | (464,687) | (576,831) | (687,498) |
| (a) Risk assessment still requires ruling by the Granting Authority. |
| (b) Loan indexed to UFIR. |
In addition to the sensitivity analysis required by CVM Instruction 475/08, the Company assesses its financial instruments considering the possible effects on income and shareholders’ equity against the risks assessed by management on financial statements dates, as per CPC 40 and IFRS 7 recommendations. Based on asset position and notional value of financial instruments outstanding on June 30, 2016, it is estimated that these effects would be similar to those mentioned in the ‘probable scenario’ column in the table shown above, since the assumptions made by the Company are similar.
35.2.4 Electricity shortage risk
Risk of electricity shortage due to unfavorable weather such as low rainfall, since Brazil´s energy matrix is based on hydro sources.
Prolonged droughts affect volume of water stored in hydroelectric dam reservoirs thus increasing the risk of electricity shortages.
Over the last few years, Brazil’s major river basins and reservoirs in the Southeast, Midwest and Northeast regions have been affected by adverse weather; therefore the entities responsible for the sector have taken measures to optimize hydro resources to ensure that loads are fully covered.
However, at this point in time, these basins have shown clear signs of regaining reservoir levels, especially the Southeast and Midwest, due to the positive evolution of rainfall since mid-2016 (beginning of the rainy season).
This scenario has prompted the Electricity Sector Monitoring Committee (CMSE) to note balance between demand and supply and ensure short-term risk indices remain within the safety margin. The same position is adopted by the ONS for the medium-term shortage risk as shown in the Energy Operation Plan 2015-2019 - PEN 2015.
Although reservoir levels are not ideal from the regulators’ point of view, when combined with other variables, they are sufficient to ensure shortage risk remains within the safety margin set by the National Energy Policy Council (CNPE) (5% maximum risk) for the year 2016 across all subsystems.
35.2.5 Risk of concessions not being extended
Over a five-year horizon through 2020, Copel Geração e Transmissão will have to decide for or against extending its Figueira TPP, Governador Bento Munhoz da Rocha Netto HPP (Foz do Areia) and São Jorge HPP generation concessions due to end March 26, 2017, September 17, 2018 and December 3, 2019, respectively. These hydroelectric plants represent a Physical Guarantee of 587.8 average MW.
Currently, the extension of generation, transmission and distribution concessions covered by Articles 17, 19 and 22 of Law 9.074/1995 is governed by Law 12.783/2013, which states that extension depends on express acceptance of conditions such as: i) revenues determined as per criteria set by Aneel; ii) altering in tariff price remuneration calculated by Aneel for each plant; iii) allocation of physical guarantee quotas and plant power for distribution utility concessionaires and licensees; iv) submission to service quality standards set by Aneel; and, v) agreeing to compensation determined for concession related assets.
Hydroelectric generation, transmission and distribution concession periods may be extended once, at the granting authority’s discretion, for a period of up to 30 years. However, the extension period for thermoelectric generation has been limited to 20 years.
Under current regulatory requirements, concessionaires must apply to extend their concession period 60 months before their ending or concession granting date for hydroelectric plants, generation, transmission and distribution and 24 months for thermoelectric generating plants.
The regulator also state that if a concessionaire wishes to extend its concession period, the Granting Authority may bring forward the effects of extension up to 60 months before the end date or act of granting and may determine the initial tariff rate or revenue.
Based on forthcoming analyses aiming to preserve its levels of profitability, the Company will proceed to decide whether to extend its concessions or not in view of the conditions imposed by the Granting Authority.
If extension is not brought expected or forward, the Granting Authority will hold auctions or competitions to award concessions for up to 30 years, to be adjudicated to bidder offering the lowest tariff and highest bonus payment.
In 2012, Copel Geração e Transmissão extended Transmission Concession Agreement 060/2001 so its principal transmission concession period will end on December 3, 2042.
Recently, in accordance with the amendment to Copel Distribuição’s concession agreement 46/1999, the concession period was extended, subject to quality and efficiency parameters for its distribution services as measured by indicators for outage duration and frequency (DECi and FECi) and efficient economic and financial management.
The concession for the Governador Parigot de Souza HPP, with 260 MW of installed capacity, was also acquired until 2046.
35.2.6 Gas shortage risk
Risk arising from any period of shortage of natural gas supplies required for gas distribution and thermoelectric generation.
A prolonged period of gas shortage could lead to losses by reducing revenues for the Compagás and UEG Araucária subsidiaries.
35.3 Capital management
The Company strives to ensure a solid capital base to maintain investor, creditor and market confidence as well as the future development of its business. It pursues balance between the highest possible returns with appropriate borrowing levels and the advantages and assurances provided by a healthy capital position, thus maximizing returns for all stakeholders in its operations and optimizing its debt and equity levels.
The Company monitors capital using an index based on consolidated numbers for adjusted net debt divided by consolidated EBITDA (earnings before interest, taxes, depreciation and amortization), adjusted for the last twelve months. The corporate target set in its strategic plan is to hold this index below 3.5 on an annual basis, while any expectation of failing to meet this target will prompt administration to take steps to correct its course by the end of each reporting period. On June 30, 2016, the index stood at 2.36.
35.3.1 Equity indebtedness
| | | | |
| | | Parent company | | Consolidated |
| Indebtedness | 06.30.2016 | 12.31.2015 | 06.30.2016 | 12.31.2015 |
| Loans and financing | 1,020,762 | 1,031,200 | 4,063,558 | 4,077,060 |
| Debentures | 1,016,847 | 1,016,087 | 3,612,275 | 3,683,928 |
| (-) Cash and cash equivalents | 9,874 | 25,653 | 828,317 | 1,480,727 |
| (-) Derivative financial instruments | 177 | 168 | 392,484 | 406,274 |
| Net debt | 2,027,558 | 2,021,466 | 6,455,032 | 5,873,987 |
| Equity | 15,371,450 | 14,245,728 | 15,683,988 | 14,584,478 |
| Equity indebtedness | 0.13 | 0.14 | 0.41 | 0.40 |
36 Related Party Transactions
| | | | | | |
| Consolidated | | Assets | | Liabilities | Income (loss) |
| Related parties / Nature of operation | 06.30.2016 | 12.31.2015 | 06.30.2016 | 12.31.2015 | 06.30.2016 | 06.30.2015 |
| Controlling shareholder | | | | | | |
| State of Paraná -dividends payable | - | - | - | 96,691 | - | - |
| CRC Transfer (Note 8) | 1,454,304 | 1,383,242 | - | - | 120,487 | 98,966 |
| "Luz Fraterna" Program (a) | 202,813 | 181,348 | - | - | - | - |
| 2014 World Cup construction w ork (Note 15.1.2) | 14,266 | 14,266 | - | - | - | - |
| Morar Bem Paraná Program (Note 15.1.3) | 19,482 | 19,482 | - | - | - | - |
| Remuneration and employ social security charges assigned (b) | 345 | 407 | - | - | - | - |
| Telecommunication services (c) | 46,797 | 42,634 | - | - | 14,604 | 15,117 |
| Entities with significant influence | | | | | | |
| BNDES and BNDESPAR (d) -dividends payable | - | - | - | 70,722 | - | - |
| Financing (Note 22) | - | - | 1,674,504 | 1,701,758 | (74,818) | (55,289) |
| Debentures - Compagás (Note 23) | - | - | 70,855 | 56,219 | (2,000) | (1,127) |
| Joint ventures | | | | | | |
| Dominó Holdings- dividends | 5,707 | 9,067 | - | - | - | - |
| Voltalia São Miguel do Gostoso- mutual (Note 15.3) | 21,093 | 25,237 | - | - | 1,725 | 1,314 |
| Costa Oeste Transmissora de Energia -dividends | - | 1,783 | - | - | - | - |
| Operating and maintenance services (e) | 70 | - | - | - | 415 | 305 |
| Basic and connecting netw ork (f) (g) | - | - | 24 | 24 | (1,680) | (988) |
| Marumbi Transmissora de Energia -dividends | - | 3,101 | - | - | - | - |
| Basic netw ork (g) | - | - | 15 | 9 | (212) | - |
| Engineering services (h) | 292 | - | - | - | 2,157 | - |
| Caiuá Transmissora de Energia -dividends | 88 | 2,634 | - | - | - | - |
| Basic and connecting netw ork (f) (g) | - | - | 154 | 154 | (7,324) | (5,504) |
| Engineering services (h) | 218 | - | - | - | 437 | - |
| Integração Maranhense Transmissora -dividends | 228 | 4,476 | - | - | - | - |
| Basic netw ork (g) | - | - | - | - | (452) | (580) |
| Transmissora Sul Brasileria de Energia -Basic netw ork (g) | - | - | - | - | (814) | (848) |
| Matrinchã Transmissora de Energia -dividends | 8,115 | 8,115 | - | - | - | - |
| Basic netw ork (g) | - | - | 49 | 55 | (628) | - |
| Paranaíba Transmissora de Energia- Basic netw ork (g) | - | - | - | - | (66) | - |
| Guaraciaba Transmissora de Energia- dividends | 3,930 | 3,930 | - | - | - | - |
| Associates | | | | | | |
| Dona Francisca Energética S.A. (i) | - | - | 1,436 | 1,304 | (8,477) | (28,094) |
| Foz do Chopim Energética Ltda. (j) | 157 | - | - | - | 1,019 | 953 |
| Sercomtel S.A. Telecomunicações | | | | | | |
| Post sharing (k) | 787 | 236 | - | - | 1,516 | 708 |
| Telecommunication leases and services (c) | 1,187 | - | - | - | 2,838 | 2,391 |
| Companhia de Saneamento do Paraná -dividends | 9,718 | 6,202 | - | - | - | - |
| Treated w ater, sew age collection and treatment | - | - | 4 | 3 | (687) | (580) |
| Telecommunications services (c) | 5 | 492 | - | - | 1,496 | 1,408 |
| Key management staff | | | | | | |
| Fees and social security charges (Note 32.2) | - | - | - | - | (11,761) | (10,754) |
| Pension and healthcare plans (Note 24) | - | - | - | - | (643) | (538) |
| Other related parties | | | | | | |
| Fundação Copel | | | | | | |
| Administrative property rental | - | - | 311 | 688 | (6,539) | (6,054) |
| Pension and healthcare plans (Note 24) | - | - | 637,897 | 594,660 | - | - |
| Leasing and telecomunications services (c) | 44 | 44 | - | - | 147 | 146 |
| Lactec (l) | 51,983 | 39,421 | 1,242 | 938 | (6,607) | (5,977) |
a) TheLuz Fraterna program introduced and amended by state laws 491/2003 and 17,639/2013 enables the state of Paraná to pay electricity bills for the state’s (duly registered) low-income families or households provided their monthly consumption does not exceed 120 kWh. The benefit is valid for monophase residential connections, monophasic and biphasic rural connections and biphasic rural connections with circuit breakers rated 50 amps or less. Beneficiaries must not have other utility bills in their name or outstanding debt owed Copel Distribuição. On June 30, 2016, the amount of R$153,300 (R$153,300 at December 31, 2015) is recognized in the parent company’s Related Parties account as per Note 15.1.1.
b) Reimbursement for remuneration and social charges for employees seconded to Paraná State Government. Balances shown are net of provisioning doubtful accounts in the amount of R$1,036 on June 30, 2016 (R$1,040 at December 31, 2015).
c) Telecommunications services provided and equipment and infrastructure leases agreed with Copel Telecomunicações.
d) BNDES is the controlling shareholder of BNDES Participações S.A. (BNDESPAR), which holds 23.96% of Copel’s capital stock (26.41% of common shares and 21.26% of “B” preferred shares).
e) Operation and maintenance contract expiring December 26, 2018 - parties Costa Oeste Transmissora and Copel Geração e Transmissão.
f) Copel Distribuição holds Transmission System Connection contracts (CCT) with two companies - Costa Oeste Transmissora de Energia and Caiuá Transmissora de Energia - due to expire on termination of their distributor or transmitter concession agreement, whichever is first.
g) Copel Distribuição holds a Transmission System Usage contract (Cust) with the ONS and the electricity transmission concessionaires for the purpose of ongoing use of the Amount of Use of Transmission System (MUST) regulated by Aneel Resolution 666/2015. These amounts are determined in advance for 4-year periods and reviewed annually.
h) Engineering services contract between Copel Geração e Transmissão and two companies, Marumbi Transmissora de Energia and Caiuá Transmissora de Energia.
i) Electricity purchase and sale contract agreed between Dona Francisca Energética and Copel Geração e Transmissão expiring March 31, 2025.
j) Contracts between Foz do Chopim Energética Ltda. and Copel Geração e Transmissão for operating and maintenance services expiring May 23, 2019 and for transmission system connection expiring January 1, 2043.
k) Post sharing agreement between Sercomtel S.A. Telecomunicações and Copel Distribuição expiring December 28, 2018.
l) Copel is a member of the Institute of Technology for Development (LACTEC), an officially recognized “civil society organization of public interest” (OSCIP), which provide research and development services under contracts with Copel Geração e Transmissão and Copel Distribuição, subject to Aneel’s previous or subsequent control and approval.
The asset balance refer to R&D and PEE recognized under current assets in the Services in progress account, where they should remain until the project has been concluded, as determined by Aneel.
Copel Distribuição’s proceeds from operating activities with related parties are billed at tariff rates ratified by Aneel.
36.1 Sureties and guarantees provided for related parties
Sureties and guarantees provided by Copel when issuing financing, debentures and for insurance for subsidiaries as reported in Notes 22, 23 and 37.
Sureties and guarantees offered by Copel and Copel Geração e Transmissão when issuing financing, debentures and insurance for joint ventures are shown below:
| | | | | | | | |
| | Company | Operation | Dateissued | Finalmaturity | Amount approved | Balance 06.30.2016 | Interest % | Amount endorsement/ security |
| (1) | Caiuá Transmissora | Financing | 12.23.2013 | 02.15.2029 | 84,600 | 81,097 | 49.0 | 39,738 |
| (2) | Costa Oeste Transmissora | Financing | 12.30.2013 | 11.15.2028 | 36,720 | 31,796 | 51.0 | 16,216 |
| (3) | Guaraciaba Transmissora | Debentures | 06.20.2013 | 12.20.2016 | 400,000 | 401,972 | 49.0 | 196,966 |
| (4) | Integração Maranhense | Financing | 12.30.2013 | 02.15.2029 | 142,150 | 133,762 | 49.0 | 65,543 |
| (5) | Mata de Santa Genebra | Debentures | 09.12.2014 | 09.30.2016 | 469,000 | 497,197 | 50.1 | 249,096 |
| (6) | Matrinchã Transmissora | Financing | 12.27.2013 | 05.15.2029 | 691,440 | 636,895 | 49.0 | 312,079 |
| (7) | Transmissora Sul Brasileira | Financing | 12.12.2013 | 07.15.2028 | 266,572 | 234,554 | 20.0 | 46,911 |
| (8) | Transmissora Sul Brasileira | Debentures | 09.15.2014 | 09.15.2028 | 77,550 | 102,372 | 20.0 | 20,474 |
| (9) | Paranaíba Transmissora | Debentures | 10.21.2015 | 10.15.2030 | 606,241 | 602,155 | 24.5 | 147,528 |
| (10) Marumbi Transmissora | Financing | 10.06.2014 | 07.15.2029 | 55,037 | 50,517 | 80.0 | 40,414 |
| (11) Voltalia São Miguel do Gostoso Part. S.A. (a) | Debentures | 01.15.2016 | 12.15.2028 | 57,000 | 58,274 | 49.0 | 28,554 |
| (12) Usina de Energia Eólica Carnaúba S.A. (a) | Financing | 08.24.2015 | 11.15.2031 | 74,000 | 62,031 | 49.0 | 30,395 |
| (13) Usina de Energia Eólica Reduto S.A. (a) | Financing | 08.24.2015 | 11.15.2031 | 70,000 | 62,140 | 49.0 | 30,449 |
| (14) Usina de Energia Eólica Santo Cristo S.A. (a) | Financing | 08.24.2015 | 11.15.2031 | 74,000 | 59,362 | 49.0 | 29,087 |
| (15) Usina de Energia Eólica São João S.A. (a) | Financing | 08.24.2015 | 11.15.2031 | 68,000 | 59,217 | 49.0 | 29,016 |
| (a) Subsidiaries of Voltália São Miguel do Gostoso I Participações S.A. |
Financial institution (fund provider):
BNDES: (1) (2) (4) (6) (7) (10) (12) (13) (14) (15)
Allocation:
Investment Program and/or Working capital.
Endorsement/Security:
Provided by Copel Geração e Transmissão: (1) (4)
Provided by Copel: (2) (3) (5) (6) (7) (8) (9) (10) (11) (12) (13) (14) (15)
Securities offered for the transaction:
Lien on shares given by Copel Geração e Transmissão, corresponding to: 49% (1) (4) (6); 51% (2); 20% (7) (8); 80% (10)
94
| Performance bond | Final | Amount | % endorsement | Amount |
| Company | maturity | Insured | Copel GeT | endorsement |
| Matrinchã Transmissora | 10.30.2016 | 90,000 | 49.0 | 44,100 |
| Guaraciaba Transmissora | 01.29.2017 | 47,000 | 49.0 | 23,030 |
| Paranaíba Transmissora | In the renew al process | 48,000 | 24.5 | 11,760 |
| Mata de Santa Genebra | 05.26.2018 | 78,300 | 50.1 | 39,228 |
| Cantareira Transmissora | 11.30.2018 | 31,200 | 49.0 | 15,288 |
| Consórcio Empreendedor Baixo Iguaçu | 11.23.2016 | 54,546 | 30.0 | 16,364 |
37 Insurance
Types of risk and principal insurance coverage periods are specified as follows:
| | |
| Consolidated | Final | Amount |
| Policy | maturity | Insured |
| Multi-risk - Compagás | 04.26.2017 | 470 |
| Nominated risks - Elejor | 05.14.2017 | 1,063 |
| Life insurance - Compagás | 08.01.2016 | 36 x employee salary |
| Performance bond - National Department of Infrastructure and Transport - DNIT | 08.15.2016 | 1,063 |
| Nominated Risks | 08.24.2016 | 2,067,793 |
| Fire - Company-ow ned and rented facilities | 08.24.2016 | 535,667 |
| Domestic and international transport - export and import | 08.24.2016 | policy for registration |
| Miscellaneous risks | 08.24.2016 | 1,079 |
| Civil liability - Compagás | 10.30.2016 | 4,200 |
| Participation guarantee - ANEEL | 11.11.2016 | 1,309 |
| Participation guarantee - ANEEL | 11.11.2016 | 437 |
| General civil responsibility - Telecommunication | 11.12.2016 | 2,000 |
| Payment guarantee - Brisa Potiguar | 11.16.2016 | 2,182 |
| Vehicles - Compagás | 11.16.2016 | market value |
| Payment guarantee - São Bento | 11.16.2016 | 627 |
| Operational risks - HPP Mauá - Consórcio Energético Cruzeiro do Sul | 11.23.2016 | 799,290 |
| Operational risks - UEG Araucária (a) | 11.30.2016 | 1,157,796 |
| Multi-risk - Compagás | 12.18.2016 | 21,750 |
| Operational risks - Brisa Potiguar | 12.28.2016 | 672,516 |
| Civil liability - Brisa Potiguar | 12.28.2016 | 20,000 |
| Operational risks - São Bento | 12.28.2016 | 449,928 |
| Civil liability - São Bento | 12.28.2016 | 20,000 |
| Performance bond - CREA - Paraná | 12.31.2016 | 24 |
| Participation guarantee - ANEEL | 01.01.2017 | 4,084 |
| Aviation insurance (hull and civil liability) | 01.30.2017 | 97,945 |
| Participation guarantee - ANEEL | 02.04.2017 | 646 |
| Multi-risk - Elejor | 03.11.2017 | 197,800 |
| D&O Insurance | 03.28.2017 | 80,245 |
| Performance bond - ANEEL | 05.01.2017 | 44,319 |
| Performance bond - ANEEL | 07.31.2017 | 12,500 |
| Performance bond - ANEEL | 11.30.2017 | 2,450 |
| Legal guarantee - Office of the General Counsel to the National Treasury | 03.01.2018 | 20,089 |
| Legal guarantee - Municipality of Cascavel | 03.07.2018 | 91 |
| Legal guarantee - Office of the General Counsel to the National Treasury | 05.11.2018 | 291,396 |
| Performance bond - ANEEL | 06.02.2018 | 6,750 |
| Performance bond - ANEEL | 10.31.2018 | 37,751 |
| Participation guarantee - Brazil's National Oil Agency - ANP | 11.11.2018 | 59,440 |
| Performance bond - CREA - Paraná | 11.24.2018 | 19 |
| Performance w arranty - Ponta Grossa State University | 12.31.2018 | 22 |
| Performance bond - ANEEL | 01.31.2020 | 26,609 |
| Performance bond - ANEEL | 11.29.2021 | 58,060 |
| Performance bond - Justice Ministry - Highw ay Police | 08.31.2017 | 16 |
| Legal guarantee - 2ndtreasury court of the municipality of Curitiba | 07.04.2019 | 135 |
| Performance bond - ANEEL | 02.01.2017 | 2,890 |
| Legal guarantee - labor | 07.12.2017 | 198 |
| (a) The values of the insured of operating risks - UEG Araucária and Seguro Aeronáutico have been translated from USD into BRL, |
| w ith the current rate R$ 3.2098, as of 06.30.2016. |
| (b) The guarantee insurance listed above have Copel as a guarantor, w ithin the limits of their participation in each project. |
38 Subsequent Events
38.1 Approval of financing by the BNDES for Copel’s wind farm complex
On July 27, 2016, the BNDES and BNDESPAR subscribed private debentures totaling R$300,833 as long-term financing for five wind farms in Copel Brisa Potiguar’s wind farm complex, built by Copel in Rio Grande do Norte state, in operation since August 2015. The debentures are divided in up to three series, two of which are pegged to the TJLP long-term interest rate (I and III) and one to the IPCA consumer price index (II). This operation is in compliance with BNDES Finem (Project Finance) characteristics and has a 16-year term, with a six-month grace period and monthly amortization.
38.2 Copel Geração e Transmissão’s 2nd Debenture Issue
On July 21, 2016, Copel Geração e Transmissão’s second debenture issue was subscribed in a single series, totaling R$1,000,000, with compensation pegged to the interbank deposit rate (DI), maturity on July 21, 2018 (50%) and July 21, 2019 (50%), and personal guarantees. This operation has a three-year term, with a 12-month grace period and annual amortizations in the second and third years.
COMMENTS ON PERFORMANCE
for the six-month period ended June 30, 2016
in thousands of Reais, except where otherwise stated
1 Distribution Lines
Compact-Design Distribution Lines–Copel Distribuição has implemented compact-design distribution lines in urban areas with a high concentration of threes surrounding distribution grids. This technology reduces the number of trees cut down or trimmed, and improves the quality of power supply by reducing the number of unplanned outages. The total length of compact-design distribution lines installed as of the end of June 2016 was 8,360 km (against 7,267 km in June 2015), up by 1,093 km year-over-year, a variation of 15.0%.
Secondary Isolated Lines –Copel Distribuição is also investing in low-voltage (127/220V) secondary isolated lines, which offer substantial advantages over regular overhead lines, including: improvement in DEC - Equivalent Time of Interruption per Consumer Unit and FEC - Equivalent Frequency of Interruption per Consumer Unit distribution performance indicators; defense against illegal connections; improved environmental conditions; reduced areas subject to tree trimming; improved safety; reduced voltage drops throughout the grid; and increased transformer useful life due to the reduction of short-circuits, among other advantages. The total length of secondary isolated lines as of the end of June 2016 was 15,511 km (against 13,237 km in June 2015), up by 2,274 year-over-year, a variation of 7.2%.
2 Power Market
Market behavior –Power generation by Copel Geração e Transmissão and wind farms totaled 13,899 GWh in the first half of 2016 (against 11,843 GWh in the same period in 2015). The volume of energy purchased by Copel Distribuição by means of CCEARs (auctions) was 6,745 GWh (against 8,855 GWh in the same period in 2015), while the volume purchased from Itaipu was 2,963 GWh (against 2,947 GWh in the same period in 2015), as described below:
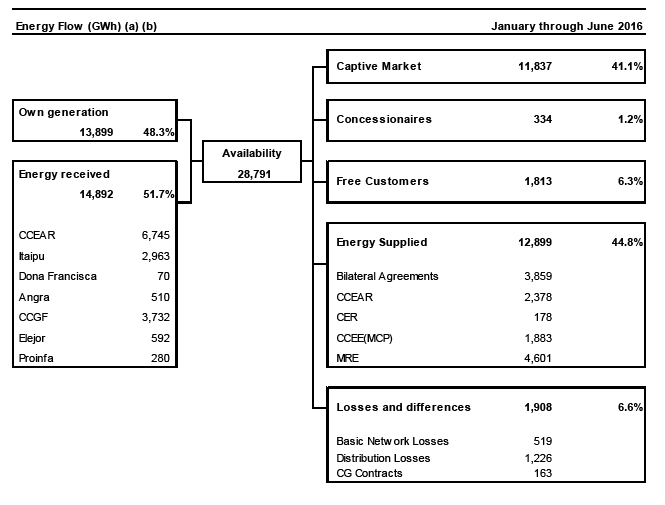
(a) Including energy volumes traded among Copel’s subsidiaries.
(b) Figures subject to change after closing by CCEE.
CCEAR = Energy Purchase Agreements in the Regulated Market CER: Reserve Energy Agreements CCEE (MCP) = Electric Pow er Trade Chamber (Short-Term Market) MRE = Energy Reallocation Mechanism
CG = Center of gravity of the Submarket (difference betw een billed and energy received from CG) – as per the agreement Not considering the energy produced by TPP Araucária w hich w as sold in the short-term market (MCP).
99
Energy Sale –The table below describes Copel’s total energy sales, broken down by Copel Distribuição, Copel Geração e Transmissão and wind farms:
| | | |
| Segment | | | GWh |
| | Jan - Jun 2016 | Jan - Jun 2015 | Var. |
| Copel Distribuição | | | |
| Captive Market | 11,837 | 12,223 | -3.2% |
| Residential | 3,533 | 3,583 | -1.4% |
| Industrial | 3,230 | 3,418 | -5.5% |
| Commercial | 2,702 | 2,851 | -5.2% |
| Rural | 1,166 | 1,203 | -3.1% |
| Other | 1,206 | 1,168 | 3.3% |
| Concessionaries and Licensees | 334 | 351 | -4.8% |
| CCEE (MCP)(a) | 1,000 | 100 | 900.0% |
| Total Copel Distribuição | 13,171 | 12,674 | 3.9% |
| | | |
| Copel Geração e Transmissão | | | |
| CCEAR (Copel Distribuição) (b) | 77 | 122 | -36.9% |
| CCEAR (other concessionaries) (b) | 1,884 | 2,276 | -17.2% |
| Free Customers | 1,812 | 1,965 | -7.8% |
| Bilateral Agreements | 3,858 | 3,402 | 13.4% |
| CCEE (MCP) | 883 | 1,667 | -47.0% |
| Total Copel Geração e Transmissão | 8,514 | 9,432 | -9.7% |
| | | |
| Wind Farms Complex | | | |
| CCEAR (other concessionaries) (b) | 417 | 342 | 21.9% |
| CER (c) | 178 | 89 | 100.0% |
| Total Wind Farms Complex | 595 | 431 | 38.1% |
| Total | 22,280 | 22,537 | -1.1% |
| Note:Not considering the energy from MRE (Energy Relocation Mechanism). |
| (a) CCEE: Electric Pow er Trade Chamber / MCP: Short Term |
| (b) CCEAR: Energy Purchase Agreements in the Regulated Market |
| (c) CER: Agreements Reserve Energy. |
Captive Market - Copel Distribuição –Copel Distribuição’s electricity sales to the captive market totaled 11,837 GWh between January and June 2016, down by 3.2% against the same period in 2015.
The residential segment consumed 3,533 GWh from January through June 2016, down by 1.4%, reflecting the strong decline in the first quarter due to the adverse economic scenario, tariff adjustments that led to the rational use of electricity by this segment, and the lower temperatures recorded earlier this year compared to those recorded in the first half of 2015. At the end of the first half of 2016, this segment accounted for 29.9% of the captive market, totaling 3,572,311 residential consumers.
Consumption by the industrial segment decreased by 5.5% by June 2016, down to 3,230 GWh, in line with the reduction in the industrial production in Paraná, due to the domestic scenario of lower demand and weaker investments. Industrial consumption was also negatively impacted by the migration of captive clients to the free market. In June 2016, the industrial segment totaled 84,457 consumers and accounted for 27.3% of the captive market.
The commercial segment consumed 2,702 GWh in the first half of 2016, or a reduction by 5.2% against the same period in 2015, particularly due to a retraction in retail sales in the State, reflecting the economic crisis, the worsening of the job market and the reduction in household income. By the end of June 2016, this segment accounted for 22.8% of the captive market, totaling 378,733 consumers.
The rural segment recorded a retraction of 3.1% in consumption compared to the first half of 2015, totaling 1,166 GWh, reflecting the negative economic scenario. By the end of June 2016, this segment accounted for 9.9% of Copel’s captive market, totaling 363,680 consumers.
Consumption from other segments (public bodies, public lighting, public services and won consumption) totaled 1,206 GWh, up by 3.3% compared to the same period in 2015. Jointly, these segments accounted for 10.1% of the captive market, totaling 57,145 consumers at the end of June 2016.
Number of consumers –The number of end users (captive of Copel Distribution and free consumers of Copel Geração e Transmissão) billed in June 2016 was 4,456,349, up by 1.8% against the same month in 2015.
| | | |
| Segment | Jun 2016 | Jun 2015 | Var. |
| Residential | 3,572,311 | 3,487,127 | 2.4% |
| Industrial | 84,457 | 90,963 | -7.2% |
| Commercial | 378,733 | 372,543 | 1.7% |
| Rural | 363,680 | 371,632 | -2.1% |
| Other | 57,145 | 56,935 | 0.4% |
| Total Captive Market | 4,456,326 | 4,379,200 | 1.8% |
| Free Customers - Copel Geração e Transmissão | 23 | 27 | -14.8% |
| Total | 4,456,349 | 4,379,227 | 1.8% |
3 Management
Headcount
| | |
| Employees | Jun 2016 | Jun 2015 |
| Copel and subsidiaries | | |
| Copel | 69 | 334 |
| Copel Geração e Transmissão | 1,676 | 1,567 |
| Copel Distribuição | 6,132 | 6,041 |
| Copel Telecomunicações | 619 | 622 |
| Copel Comercialização | 15 | 10 |
| Copel Renováveis | 48 | 43 |
| | 8,559 | 8,617 |
Affiliated Company | | |
| Compagás | 163 | 159 |
| Elejor | 7 | 7 |
| UEG Araucária | 16 | 16 |
| | 186 | 182 |
4 Market Relations
From January to June 2016, Copel’s common (ON – ticker CPLE3) and class B preferred registered shares (PNB - ticker CPLE6) were traded in all trading sessions of Corporate Governance Level 1 of the BM&FBOVESPA - Securities, Commodities and Futures Exchange.
The shares outstanding totaled 44.18% of the Company’s capital stock. At the end of June 2016, Copel’s market value was R$6,649,797, based on quotations of all markets.
Out of the 66 stocks that make up Ibovespa’s theoretical portfolio, Copel’s PNB shares was 0.355%, with a 1,060 Beta index.
Copel’s share in the portfolio of the Electric Power Sector Index – IEE was 6.341%.
COPEL PNB’s share in BM&FBOVESPA’s Corporate Sustainability Index (ISE) was 1.043%.
On the BM&FBOVESPA, common shares closed the period traded at R$20.04, while PNB shares closed at R$29.22, with positive variations of 25.25% and 20.25% respectively. In the same period, the IBOVESPA index recorded a positive variation of 18.86%.
On the New York Stock Exchange (NYSE), PNB shares were traded at “Level 3”, in the form of ADSs, under ticker ELP, and were traded in 98% of the trading sessions, closing the period at US$8.98, with positive variation of 52.98%. Also in this period, the Dow Jones Index recorded a positive variation of 2.90%.
On the Latibex (the Euro market for Latin American Securities), which is connected to the Madrid Stock Exchange), the Company’s PNB shares were traded under the ticker XCOP in 61% of trading sessions, closing the period at €6.50, with a positive variation of 19.05%. In the same period, the Latibex All Shares index recorded a positive variation of 20.27%.
The table below is a summary of Copel’s share trading in the first half of 2016:
| | | | |
| | ON | | PNB | |
| Stock Performance (Jan - Jun/16) | Total | Daily average | Total | Daily average |
| Bovespa | | | | |
| Number of Trades | 14,634 | 119 | 522,247 | 4,246 |
| Volume Traded | 4,551,900 | 37,007 | 94,681,700 | 769,770 |
| Trading Value (R$ thousand) | 76,585 | 623 | 2,415,954 | 19,642 |
| Presence in Trading Sessions | 123 | 100% | 123 | 100% |
| Nyse | | | | |
| Volume Traded | 359,335 | 3,823 | 64,617,612 | 516,941 |
| Trading Value (US$ thousand) | 1,460 | 16 | 464,686 | 3,717 |
| Presence in Trading Sessions | 94 | 74% | 125 | 98% |
| Latibex | | | | |
| Volume Traded | - | - | 182,846 | 2,344 |
| Trading Value (€ thousand) | - | - | 1,014 | 13 |
| Presence in Trading Sessions | - | - | 78 | 61% |
5 Tariffs
Power distribution tariffs
| | | |
| Retail distribution average rate (a) - R$/MWh | Jun 2016 | Jun 2015 | Var. |
| Residential | 491.71 | 430.85 | 14.1% |
| Industrial (b) | 417.12 | 361.91 | 15.3% |
| Commercia | 467.13 | 401.72 | 16.3% |
| Rural | 314.51 | 265.09 | 18.6% |
| Other | 350.98 | 307.95 | 14.0% |
| | 433.87 | 376.65 | 15.2% |
| (a) W ithout ICM S. Does not consider tariff flags. | | | |
| (b) Free customers not included. | | | |
Power purchase tariffs
| | | |
| Tariff Supply* - R$/MWh | Jun 2016 | Jun 2015 | Var. |
| Itaipu (a) | 189.69 | 303.26 | -37.4% |
| Leilão 2008 - 2015 | - | 135.42 | -100.0% |
| Leilão 2010 - H30 | 188.64 | 181.23 | 4.1% |
| Leilão 2010 - T15 (b) | 170.92 | 147.67 | 15.7% |
| Leilão 2011 - H30 | 203.83 | 186.88 | 9.1% |
| Leilão 2011 - T15 (b) | 202.85 | 404.23 | -49.8% |
| Leilão 2012 - T15 (b) | 208.88 | 236.33 | -11.6% |
| Leilão 2016 - T20 (b) | 143.71 | - | - |
| Leilão CCEAR 2014 - 2019 (c) | 138.39 | 379.55 | -63.5% |
| Leilão CCEAR 2014 - 2019 (d) | 320.11 | 292.94 | 9.3% |
| Leilão 2014 - 18M | - | 175.79 | - |
| Leilão 2014 - 36M | 176.64 | 159.60 | 10.7% |
| Bilaterais | 232.69 | 210.32 | 10.6% |
| Angra | 204.39 | 170.38 | 20.0% |
| CCGF (e) | 60.49 | 32.74 | 84.8% |
| Santo Antonio | 126.16 | 375.60 | -66.4% |
| Jirau | 110.97 | 91.76 | 20.9% |
| Other auctions (f) | 201.15 | 322.27 | -37.6% |
| Tariff Average Supply | 157.96 | 248.89 | -36.5% |
| (a) Furnas transport charge not included. | | | |
| (b) Average auction price restated according t o the IPCA inflation index. The price comprises in fact three components: a fixed |
| component, a variable component, and expenses at the Electric Energy Trading Chamber (CCEE). The cost ofthe latter two |
| components is dependent upon the dispatch of facilities according to the schedule set by the National System Operator (ONS). |
| (c) Energy Agreements. |
| (d) Capacity Agreements. |
| (e) Contract of quotas of assured pow er of those HPPs w hich concessions w ere extended pursuant the new rules of Law 12783/13. |
| (f) Products average price. |
| *The table has been updated for all periods as new calculation methodology for average prices, a result of the 4th phase of the Public |
| Hearing 78/2011 Aneel approved on 03.28.2016. |
Energy supply tariffs
| | | |
| Tariff Weighted Average Supply - R$/MWh | Jun 2016 | Jun 2015 | Var. |
| Leilão - CCEAR 2008-2015 | - | 135.98 | - |
| Leilão - CCEAR 2009-2016 | 168.95 | 154.57 | 9.3% |
| Leilão - CCEAR 2011-2040 | 193.20 | 176.46 | 9.5% |
| Leilão - CCEAR 2013-2042 | 207.23 | 189.71 | 9.2% |
| Leilão - CCEAR 2015 - 2045 | 149.32 | 136.06 | 9.7% |
| Concession holders in the State of Paraná | 279.17 | 251.49 | 11.0% |
6 Economic and Financial Results
Revenues (Note 31)
In the first half of 2016, net operating revenues was R$6,768,194, or 16.9% down against R$8,145,940 recorded in the same period in 2015.
This variation was mainly explained by:
a) a 43.8% reduction in Revenues from Electricity sales to distributors due to lower revenues from sales of power generated by TPP Araucária and lower PLD amounts in the first half of 2016 compared to the same period in 2015;
b) a 145.9% increase in Revenues from Use of the main distribution and transmission grid, due to the tariff adjustment in the 2015/2016 cycle and mainly to the recognition of the effects from cash flow remeasurement as a result of MME Ordinance 120, related to RBSE assets;
c) an 11.3% increase in Revenues from Electricity sales to final costumers, mainly due to the adjustment of tariffs in June 2015 and tariff increase by the RTE, effective as from March 2015, offset by a retraction by 1.9% in the captive market; and
d) a 25.4% increase in Revenues from Telecommunications, largely due to the increase in the number of clients, particularly in the retail market, with the BEL Fibra product.
Operating Costs and expenses (Note 32)
In the first half of 2016, operating costs and expenses totaled R$5,155,158, down by 28.7% compared to R$7,234,744 recorded in the same period in 2015. The main highlights were as follows:
a) a 36.8% decrease in electricity purchased for resale, especially given the reduction in power purchased from CCEE, and lower PLD in the first half of 2016 against the same period in 2015;
b) a 17.4% increase in Charge of the main distribution and transmission grid, mainly due to costs with Charges on reserve energy (EER) in 2016 and higher Charges on the use of the system (ESS);
c) a 13.5% increase year over year in the balance of the Personnel and management account, mainly due to salary adjustments, as per the collective bargaining agreement in effect as from October 2015;
d) a 73.6% reduction in natural gas and supplies for gas business, due to the decrease in energy dispatch from TPP Araucária; and
e) a 85.9% decline in Provisions and reversals, primarily due to the allowance for doubtful accounts recorded in 2015 related to the differences between the selling price of energy under the commercialization contracts of Colíder HPP and the Difference Settlement Price – PLD – negotiated with the CCEE, and the reversal of the provision for the lawsuit regarding the Contribution to Social Security Financing (Cofins), as a final and unappealable decision was issued in favor of the Company.
Financial Result (Note 33)
The R$191,627 year-on-year reduction in the financial result in the first half of 2016 was mainly due to:
a) a 24.9% increase in financial income, largely due to higher amounts from currency variation regarding accounts receivable in connection to the concession and late payment charges on electricity bills; and
b) an 88.1% increase in financial expenses, mainly due to the inflow of funds in the period and the increase in the indices used for adjusting the contracts (IPCA, TJLP, DI, dollar).
Ebitda
Ebitda (earnings before interest, taxes, depreciation and amortization) is as follows:
| | |
| Consolidated | 06.30.2016 | 12.31.2015 |
| Net income for the period | 1,132,667 | 772,006 |
| Deferred IRPJ and CSLL | (24,163) | (77,861) |
| Provision for IRPJ and CSLL | 579,128 | 470,374 |
| Financial expenses (income), net | 30,113 | (161,514) |
| Ebit | 1,717,745 | 1,003,005 |
| Depreciation and amortization | 352,747 | 325,110 |
| Ebitda | 2,070,492 | 1,328,115 |
| Net operating revenues - ROL | 6,768,194 | 8,145,940 |
| Ebitda Margin% (Ebitda ÷ ROL) | 30.6% | 16.3% |
COMPOSITION OF GROUPS RESPONSIBLE FOR GOVERNANCE
BOARD OF DIRECTORS |
|
Chairman | Fernando Xavier Ferreira |
Secretary | Luiz Fernando Leone Vianna |
Members | Mauro Ricardo Machado Costa José Richa Filho Carlos Homero Giacomini Marlos Gaio Hélio Marques da Silva VACANT - BNDES VACANT - BNDES |
AUDIT COMMITTEE | |
Chairman | CARLOS HOMERO GIACOMINI |
Members | JOSÉ RICHA FILHO Mauro Ricardo Machado Costa |
FISCAL COUNCIL | |
Chairman | Joaquim Antonio Guimarães de Oliveira Portes |
Sitting Members | George Hermann Rodolfo Tormin Nelson Leal Junior Massao Fabio Oya João Carlos Flor Junior |
Alternate members | OSNI RISTOW ROBERTO BRUNNER GILMAR MENDES LOURENÇO AURÉLIO BELARMINO BARBOSA Vinícius Flor |
EXECUTIVE BOARD | |
CEO | Luiz Fernando Leone Vianna |
Enterprise Management Officer | GILBERTO MENDES FERNANDES |
Chief Financial and Investor Relations Officer | Luiz Eduardo da Veiga Sebastiani |
Business Development Officer | jonel nazareno iurk |
Institutional Relations Officer | Cristiano Hotz |
Assistant Officer | PAULO CESAR KRAUSS |
ACCOUNTANT | |
CRC-PR-041655/O-6 | NANCY ATENALIA ALVES |
| |
Information about this report | |
Investor Relations | Phone: +55 (41) 3222-2027 ri@copel.com |
 | Deloitte Touche Tohmatsu
Rua Pasteur, 463 5º andar – Batel
80250-080 - Curitiba – PR
Brasil
Tel: + 55 (41) 3312-1400
Fax:+ 55 (41) 3312-1470
www.deloitte.com.br |
REVIEW REPORT ON QUARTERLY INFORMATION
To the Shareholders and Management of
Companhia Paranaense de Energia - Copel
Curitiba – State of Paraná
Introduction
We have reviewed the individual and consolidated interim financial statements of Companhia Paranaense de Energia - Copel (“Company”), respectively identified as Parent Company and Consolidated, included in the Quarterly Information Form - ITR for the quarter ended June 30, 2016, which comprise the statement of financial position as of June 30, 2016 and the related statements of income and comprehensive income for the three and six-month periods then ended, and statements of changes in equity and cash flows for the six-month period then ended, including the accompanying notes.
The Company’s management is responsible for the preparation of these individual and consolidated interim financial statements according to Technical Pronouncement CPC 21 (R1) - Interim Statements, and to IAS 34 – Interim Financial Reporting international standard issued by the International Accounting Standards Board (IASB), as well as for the presentation of said statements in compliance with the rules issued by the Brazilian Securities and Exchange Commission and applicable to the preparation of the Quarterly Information – ITR. Our responsibility is to express an opinion on the interim financial statements based on our review.
Scope of the review
We conducted our review in accordance with Brazilian and international standards for reviewing interim financial information (NBC TR 2410 and ISRE 2410 – Review of Interim Financial Information Performed by the Independent Auditor of the Entity). A review of interim financial information consists of making inquiries, primarily to the persons responsible for financial and accounting matters, and applying analytical and other review procedures. A review is substantially more restricted in scope than an audit conducted in accordance with auditing standards and, consequently, we were not able to assure that we were aware of all significant matters that might be identified in an audit. Accordingly, we do not express an audit opinion.
© 2016 Deloitte Touche Tohmatsu. All rights reserved. 1
Conclusion
Based on our review, nothing has come to our attention that leads us to believe that the individual and consolidated interim financial statements included in the quarterly information referred to above were not prepared, in all material respects, in accordance with CPC 21 (R1) and IAS 34 applicable to the preparation of Quarterly Information – ITR and presented in accordance with the standards issued by the Brazilian Securities Commission (CVM).
Other matters
Statements of value added
We also reviewed the individual and consolidated statements of value added (DVA), prepared under management’s responsibility, for the six–month period ended June 30, 2016, whose disclosure in the interim financial statements is required in accordance with the standards issued by the Brazilian Securities Commission (CVM) applicable to the preparation of the Quarterly Information - ITR and considered as supplementary information by IFRS, according to which presentation thereof is not required. These statements were submitted to the same review procedures previously described and based on our review, we are not aware of any fact that leads us to believe that they were not consistent, in all material respects, with the interim financial statements taken as a whole.
Audit and review of amounts for the previous accounting period
The Quarterly Information – ITR mentioned in the first paragraph includes financial information relating to income and comprehensive income for the three and six-month periods ended June 30, 2015 and statements of changes in equity, cash flows and value added for the six-month period ended June 30, 2015, obtained from the Quarterly Information (ITR) for the quarter ended June 30, 2015, and to the statement of financial position as of December 31, 2015, obtained from the financial statements as of December 31, 2015, presented for the purposes of comparison. The review of the Quarterly Information (ITR) for the quarter ended June 30, 2015, and the examination of the financial statements for the year ended December 31, 2015, were carried out under the responsibility of other independent auditors, who issued unqualified review and audit reports dated August 12, 2015 and March 15, 2016, respectively.
Curitiba, August 10, 2016
DELOITTE TOUCHE TOHMATSU | Fernando de Souza Leite |
Auditores Independentes | Accountant |
CRC nº 2 SP-011.609/O-8 F-PR | CRC n.º 1 PR-050.422/O-3 |
© 2016 Deloitte Touche Tohmatsu. All rights reserved. 2
Pursuant to the requirements of the Securities Exchange Act of 1934, the registrant has duly caused this report to be signed on its behalf by the undersigned, thereunto duly authorized.
| COMPANHIA PARANAENSE DE ENERGIA – COPEL |
| | |
| By: | /S/ Luiz Fernando Leone Vianna
| |
| | Luiz Fernando Leone Vianna
Chief Executive Officer | |
FORWARD-LOOKING STATEMENTS
This press release may contain forward-looking statements. These statements are statements that are not historical facts, and are based on management's current view and estimates of future economic circumstances, industry conditions, company performance and financial results. The words "anticipates", "believes", "estimates", "expects", "plans" and similar expressions, as they relate to the company, are intended to identify forward-looking statements. Statements regarding the declaration or payment of dividends, the implementation of principal operating and financing strategies and capital expenditure plans, the direction of future operations and the factors or trends affecting financial condition, liquidity or results of operations are examples of forward-looking statements. Such statements reflect the current views of management and are subject to a number of risks and uncertainties. There is no guarantee that the expected events, trends or results will actually occur. The statements are based on many assumptions and factors, including general economic and market conditions, industry conditions, and operating factors. Any changes in such assumptions or factors could cause actual results to differ materially from current expectations.