Companhia Paranaense de Energia - COPEL (ELP)
Filed: 23 Nov 16, 12:00am
Indicate by check mark whether the registrant by furnishing the information contained in this Form is also thereby furnishing the information to the Commission pursuant to Rule 12g3-2(b) under the Securities Exchange Act of 1934.
Yes _______ No ___X____
3Q16 Results
Copel records EBITDA of R$427.7million in the 3Q16
| 3Q16 | 2Q16 | 3Q15 | Var.% | 9M16 | 9M15 | Var. % | |
| (1) | (2) | (3) | (1/3) | (4) | (5) | (4/5) | |
| Net Operating Revenues (R$ million) | 2,907.2 | 3,694.6 | 3,245.2 | (10.4) | 9,675.4 | 11,391.1 | (15.1) |
| Operating Income (R$ million) | 35.8 | 1,496.2 | 113.7 | (68.5) | 1,723.5 | 1,278.2 | 34.8 |
| Net Income (R$ million) | (75.1) | 996.6 | 91.4 | - | 1,057.6 | 863.4 | 22.5 |
| Earnings per share (R$) | (0.32) | 3.63 | 0.32 | - | 3.80 | 2.91 | 30.4 |
| EBITDA (R$ million) | 427.7 | 1,542.1 | 299.2 | 42.9 | 2,498.1 | 1,627.3 | 53.5 |
| Return on Shareholders' Equity (annualized)¹ | - | 30.3% | 2.7% | - | 9.8% | 8.5% | 15.1 |
| Energy Supply (GWh) | 6,253 | 6,753 | 6,807 | (8.1) | 19,901 | 20,995 | (5.2) |
| Capex² (R$ million) | 911.1 | 935.2 | 534.8 | 70.4 | 2,728.4 | 1,586.4 | 72.0 |
| EBITDA Margin | 14.7% | 41.7% | 9.2% | 59.6 | 25.8% | 14.3% | 80.7 |
| Operating Margin | 1.2% | 40.5% | 3.5% | (64.8) | 17.8% | 11.2% | 58.7 |
| Net Margin | - | 27.0% | 2.8% | - | 10.9% | 7.6% | 44.2 |
| ¹ Calculated according to the initial shareholders' equity for the year. | |||||||
| ² Includes contributions and advances for future investments and capital increases. | |||||||
| Values subject to rounding adjustments. | |||||||
| Average Rates (R$/MWh) | Sep-16 | Jun-16 | Mar-16 | Dec-15 | Sep-15 |
Power Purchase Average Rate - Copel Dis ¹ | 159.79 | 157.74 | 152.05 | 187.06 | 183.18 |
Retail Average Rate - Copel Dis² | 379.04 | 433.87 | 433.82 | 433.91 | 433.92 |
Sales to Distributors Average Rate - Copel GeT³ | 185.79 | 176.93 | 170.92 | 154.59 | 158.10 |
| Indicators | Sep-16 | Jun-16 | Mar-16 | Dec-15 | Sep-15 |
| Equity (R$ Thousand) | 15,609,198 | 15,683,988 | 14,710,154 | 14,584,478 | 14,262,309 |
| Net debt (R$ Thousand)4 | 8,320,840 | 7,558,902 | 7,424,710 | 7,065,159 | 6,877,225 |
| Book Value per Share (R$) | 57.04 | 57.31 | 53.75 | 53.30 | 52.12 |
| Net debt/ Shareholders' Net Equity | 56.1% | 48.9% | 53.2% | 53.2% | 49.7% |
| Current Liquidity | 1.1 | 1.0 | 1.2 | 1.4 | 1.7 |
| ¹ Considers PIS/COFINS. | |||||
| ² Does not consider tariff flags. ICMS net. | |||||
| ³ Included Guarantees and Endorsements. ICMS net. | |||||
| 4Included Guarantees and Endorsements. | |||||
CPLE3 | R$21.15 CPLE6 | R$33.63 | ELP | US$ 10.37 XCOP | € 9.45 | Market value | R$7.4 bi *Quotes 09.30.2016 |
Earnings Release 3Q16 |
LIST OF CONTENTS
| 1. Main Events in the Period | 3 |
| 2. Financial Performance | 7 |
| 2.1 Operating Revenues | 7 |
| 2.2 Operating Costs and Expenses | 8 |
| 2.3 Equity in the Earnings of Subsidiaries | 9 |
| 2.4 EBITDA | 10 |
| 2.5 Financial Result | 11 |
| 2.6 Consolidated Net Income | 11 |
| 2.7 Consolidated Income Statement | 12 |
| 3. Main Account and Changes Balance Sheet | 12 |
| 3.1 Main Accounts | 12 |
| 3.2 Balance Sheet – Assets | 14 |
| 3.3 Debt | 15 |
| 3.4 Balance Sheet – Liabilities | 18 |
| 4. Performance of the Main Companies | 18 |
| 4.1 Copel Geração e Transmissão | 18 |
| 4.2 Copel Distribuição | 20 |
| 4.3 Copel Telecomunicações | 21 |
| 4.4 UEG Araucária | 22 |
| 4.5 Accounting Information | 22 |
| 5. Investment Program | 23 |
| 6. Power Market and Tariffs | 24 |
| 6.1 Captive Market – Copel Distribuição | 24 |
| 6.2 Grid Market (TUSD) | 24 |
| 6.3 Electricity Sales | 24 |
| 6.4 Total Energy Sold | 25 |
| 6.5 Energy Flow | 26 |
| 6.6 Tariffs | 28 |
| 7. Capital Market | 29 |
| 7.1 Capital Stock | 29 |
| 7.2 Stock Performance | 30 |
| 7.3 Dividends and Interest on Own Capital | 31 |
| 8. Operating Performance | 32 |
| 8.1 Power Generation | 32 |
| 8.2 Transmission | 36 |
| 8.3 Distribution | 37 |
| 8.4 Telecommunications | 39 |
| 8.5 Equity Interests | 40 |
| 8.6 New Projects | 40 |
| 9. Other Information | 43 |
| 9.1 Human Resources | 43 |
| 9.2 Main Operational Indicators | 44 |
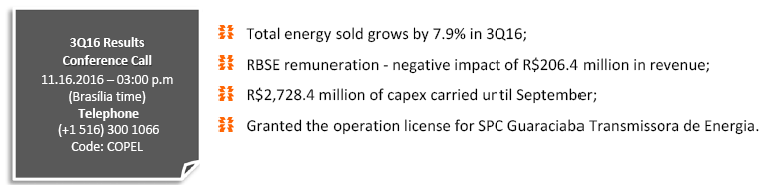
| 9.3 Conference Call 3Q16 Results | 45 |
| Exhibit I – Consolidated Cash Flow Statement | 46 |
| Exhibit II – Financial Statements – Wholly Owned Subsidiaries | 47 |
| Exhibit III – Financial Statements by Company | 50 |
* Amountssubject to rounding.
2
Earnings Release 3Q16 |
Copel’s EBITDA came to R$427.7 million in 3Q16, 42.9% higher than the R$299.2 million recorded in 3Q15. This performance was positively impacted by: (a) Copel Distribuição’s result, due to the 4th Tariff Review Cycle, (b) Copel GeT’s strategy to allocate energy to the short-term market, and (c) the 17.0% growth in equity in earnings of subsidiaries the results of investees, due to the startup of new transmission assets. The result presented was partially offset by: (a) the negative impact of R$206.4 million referring to the cash flow remeasurement of assets related to RBSE, (b) the non-activation of the Araucária TPP, and (c) the 9% decline in captive market consumption, primarily due to the migration of customers to the free market.
Copel presented a loss of R$75.1 million in 3Q16, versus net income of R$91.4 million in 3Q15. This result was impacted by higher financial expenses, due to the increase in debt charges as a result of the higher balance of financing and debentures and the R$121.9 million provision for the non-realization of deferred income tax and social contribution on sectorial financial assets and liabilities.
Copel Distribuição’s results
Copel Distribuição recorded a loss of R$126.6 million and positive EBITDA of R$88.1 million in 3Q16. This result was impacted by the downturn in the energy market in the period, which led to a R$55.4 million revenue reduction as a result of lower revenue recovery related to coverage of manageable costs (Portion B); the R$31.2 million allowance for doubtful accounts, R$19.3 million higher than the tariff coverage for the period; and the R$121.9 million provision for the non-realization of deferred income tax and social contribution onsectorial financial assets and liabilities.
Remeasurement of the transmission asset related to the Existing System Basic Network (RBSE)
On June 30, 2016, based on the information available in Ordinance 120/2016, of April 22, 2016, in the Tariff Adjustment Procedure (PRORET), and on the Company’s best estimate at the moment, the Company recorded R$1,355.1 million in accounts receivables related the concession, with an impact of R$977.8 million on operating revenue.
Based on Aneel’s inspection notes, Copel GeT remeasured the cash flow related to RBSE, which resulted in a reduction of R$206.4 million on the asset balance, and the new balance now totals R$1,148.7 million.
The Company is preparing its appeal, which will be filed within the legal term granted by said agency. For further details, seeitem 3.1.
* Amountssubject to rounding.
3
Earnings Release 3Q16 |
Tapajós Hydroelectric Complex
In 3Q16, a total of R$14.5 million was provisioned as impairment losses, referring to the Tapajós Consortium. The amount reflects all the investments made and arises from the Board of Directors’ decision to remove Copel GeT from the Consortium. For further details, seeitem 8.6.
Litigation – Ivaí Engenharia de Obras S.A.
In October 2016, the Company’s Board of Directors approved a settlement agreement proposed by Ivaí Engenharia de Obras S.A. to the Company, referring to the ongoing administrative discussions and litigation between Companhia Paranaense de Energia, Copel Geração e Transmissão S.A. and Ivaí Engenharia de Obras S.A., whose object is the recognition of the right to economic and financial rebalancing and the respective amounts involved, arising from the contract entered into with Copel Geração e Transmissão S.A. related to the execution of works of the Derivação do Rio Jordão SHP in the 1990s.
In accordance with Note 29 to the Quarterly Information (ITR) of June 30, 2016, the Company recorded R$658.2 million as possible loss and R$148.6 million was provisioned as probable loss, the latter being the basis for said agreement. Consequently, the amounts mentioned above are no longer recorded in provisions for litigation.
On September 30, 2016, the agreement totaled R$152.3 million and is recorded in the Company’s liabilities under “other accounts payables”, which will be paid in fifteen monthly and consecutive installments adjusted by 50% of the monthly IPCA consumer price index (IPCA) disclosed until the maturity date of each installment.
Global Sustainability Index - MSCI
For the third consecutive year, Copel was part of the Morgan Stanley Capital International (MSCI) sustainability index, the global leader in the compilation of benchmark financial indexes for investors. The index evaluates the sustainability performance of publicly-held companies in the social, environmental and governance spheres, identifying situations that may have an impact on their image, and grading them from 0 to 10. Copel obtained the maximum grade in 27 of the 28 analyzed indicators, which include the control of its carbon emissions and the disclosure of administrative and financial management information. In its evaluation, MSCI emphasized the broad participation of renewable sources in Copel’s power plants, its waste management practices and the transparency provided to administrative and financial information. The study and the certification were entirely carried out by means of documents and data available on the Company’s website.
Copel Distribuição is elected the best distributor in Latin America
On August 29, Copel Distribuição was elected the best power distributor in Latin America for the fourth time in the past six years. The announcement was made during the international seminar promoted by the RegionalEnergy Integration Commission (CIER), in Asunción, Paraguay. Copel was also recognized by its clients as a benchmark for honesty, working conditions and transporting energy to the regions it serves.
* Amountssubject to rounding.
4
Earnings Release 3Q16 |
Issue of R$500.0 million in debentures – Copel Distribuição
On November 04, Copel Distribuição completed its 2nd issue of simple, non-convertible debentures, for public distribution with restricted placement efforts, under CVM Instruction 476/2009, in the total amount of R$500.0 million.
Fifty thousand debentures were issued with a nominal unit value of R$10,000, a three-year term and amortization in the 2nd and 3rd years. The debentures will bear interest corresponding to 124.0% of the average daily rates of one-day Interbank Deposits (DI). The funds raised will be used to pay the amortization of the subsidiary’s 1st debenture issue.
Fitch Confirms Copel’s National Rating – ‘AA+(bra)’
On August 18, Fitch Ratings confirmed the National Long-Term Rating of ‘AA+(bra)’ to Copel and its wholly-owned subsidiaries, Copel Geração e Transmissão and Copel Telecomunicações. The corporate rating outlook, which was Stable until now, was revised to Negative. The maintenance of the credit rating remains supported by the Company’s solid financial profile on consolidated basis, benefitting from its hefty operating cash generation, conservative capital structure and strong liquidity position.
Additionally, on October 24, 2016, Fitch Rating assigned the same National Long-Term Rating of ‘AA+(bra)’ with a negative outlook to Copel Distribuição and its proposal for 2nd debenture issue, balanced with the credit risk of the Copel Group.
Copel Telecom wins the 2016 Telecom Yearbook Award
Copel Telecom won the 2016 Telecom Yearbook award, granted by Fórum Editorial, in São Paulo. The Company stood out in the category Convergent Services and was among the ten most profitable telecom companies in 2015. The profitability index on Copel Telecom’s sales was 20.1% in 2015, mainly due to the increase in internet service supply to the residential and SME segment.
Progress of works – Cutia Wind Farm Complex
The Cutia Wind Farm Complex, under construction in Rio Grande do Norte, is starting to take shape with the arrival of equipment to be used in its first wind turbines and the operational startup of the Tower Production Center, which will build the 149 towers that will support said equipment. The towers, made of reinforced concrete, will be 120 meters high and production should last 18 months. The first of the three transformers to be installed in the substation is already being tested. The Cutia complex is divided into thirteen wind farms,which started being built this year. Part of the project should be concluded by 2017. For further details, see item 8.1.
* Amountssubject to rounding.
5
Earnings Release 3Q16 |
2016 Transparency Award
On October 20, 2016, Copel Distribuição received the Transparency Award granted by the National Association of Finance, Administration and Accounting Executives (ANEFAC). After 14 years, Copel is back to the ranking that recognizes the quality and transparency of financial information disclosed to the market and was the only state-owned company among the five electricity sector firms awarded in the 20th edition. During the 20 years of the Transparency Award, Copel received the prize in the 1998, 1999, 2000, 2001 and 2002 editions, and has now rejoined the ranking of the most transparent companies of the market.
Operating license – SPC Guaraciaba
On 30 August, 2016, was granted the Operation License for SPC Guaraciaba Transmissora de Energia (49% Copel GeT and 51% State Grid), allowing its commercial operation. The transmission line adds R$48.7 million to APR Copel GeT.
* Amountssubject to rounding.
6
Earnings Release 3Q16 |
Net operating revenue came to R$2,907.2 million in 3Q16, 10.4% down on 3Q15, chiefly due to the 24.0% decrease in the “electricity sales to final customers” account, as a result of the 9.0% decline in Copel Distribuição’s captive market in 3Q16 plus the average reduction of 12.87% in the tariff as of June 24, 2016.
Changes in revenue were also impacted by: (a) the negative R$206.4 million in the “use of the main distribution and transmission grid” line, due to the remeasurement of the financial asset related to RBSE; (b) the 8.9% decline in “eletricity sales to distributors”, due to lower revenue in the spot market, as a result of the non-activation of the Araucária TPP in 3Q16 and the lower spot price (PLD) in the period (R$112.05/MWh in 3Q16 versus R$192.70/MWh in 3Q15), and (c) the 15.6% decrease in distribution of piped gas revenue, as a result of the non-activation of the Araucária TPP and the reduced consumption of natural gas, mainly in the industrial and co-generation sectors, partially offset by the increase in gas prices. The following variations are also worth mentioning:
(i) the positive R$64.4 million in result of sectorial financial assets and liabilities recorded in 3Q16 versus the negative R$59.7 million recorded in 3Q15;
(ii) the 15.7% increase in “revenues from telecommunications”, due to the expansion of the service to new customers; and
(iii) the 63.0% increase in “other operating revenues”, primarily due to revenue from leases and rentals, provision of maintenance and operation services, and fines paid by captive customers who migrated to the free market.
| R$ '000 | |||||||
| Income Statement | 3Q16 | 2Q16 | 3Q15 | Var.% | 9M16 | 9M15 | Var.% |
| (1) | (2) | (3) | (1/3) | (4) | (5) | (4/5) | |
| Electricity sales to final customers | 1,071,298 | 1,480,362 | 1,409,586 | (24.0) | 4,130,974 | 4,158,744 | (0.7) |
| Electricity sales to distributors | 684,013 | 628,945 | 751,190 | (8.9) | 1,994,964 | 3,085,816 | (35.4) |
| Use of the main distribution and transmission grid | 503,403 | 1,791,328 | 641,614 | (21.5) | 3,148,948 | 1,717,351 | 83.4) |
| Construction revenue | 362,220 | 301,292 | 282,484 | 28.2 | 934,665 | 823,678 | 13.5) |
| Revenues from telecommunications | 63,359 | 61,493 | 54,778 | 15.7 | 187,349 | 153,683 | 21.9) |
| Distribution of piped gas | 118,835 | 126,976 | 140,843 | (15.6) | 369,003 | 401,520 | (8.1) |
| Result of sectorial financial assets and liabilities | 64,355 | (727,285) | (59,678) | - | (1,190,132) | 979,343 | (221.5) |
| Other operating revenues | 39,713 | 31,445 | 24,371 | 63.0 | 99,619 | 70,993 | 40.3 |
| Net Operating Revenue | 2,907,196 | 3,694,556 | 3,245,188 | (10.4 | 9,675,390 | 11,391,128 | (15.1) |
Copel’s year-to-date net operating revenue fell by 15.1% when compared to the same period of last year, mainly due the reduction in the “eletricity sales to distributors”, due the lower volume of energy sold by the Araucária TPP, and the amortization of the balance of sectorial financial assets and liabilities due to the recovery, through tariffs, of the 2013 and 2014 tariff deferral.
* Amountssubject to rounding.
7
Earnings Release 3Q16 |
In 3Q16, operating costs and expenses totaled R$2,728.1 million, 14.3% down on the same period in 2015, chiefly due to: (a) the 18.9% decrease in “electricity purchased for resale”, chiefly due to the reduction in Itaipu energy tariffs (US$25.78/kWh in 2016 versus US$38.07/ kWh in 2015), and lower PLD in the period (R$112.05/MWh in 3Q16 versus R$192.70/MWh in 3Q15), and (b) the 78.4% reduction in costs with natural gas and supplies for the gas business, due to the non-activation of the Araucária TPP in the period.
| R$'000 | |||||||
| Electricity Purchased for Resale | 3Q16 | 2Q16 | 3Q15 | Var.% | 9M16 | 9M15 | Var. % |
| (1) | (2) | (3) | (1/3) | (4)) | (5) | (4/5) | |
| CCEAR (Auction) | 830,208 | 728,066 | 821,588 | 1.0 | 2,370,744 | 2,990,471 | (20.7) |
| Itaipu Binacional | 260,139 | 276,950 | 491,764 | (47.1) | 838,673 | 1,218,837 | (31.2) |
| CCEE | 126,169 | 87,890 | 213,530 | (40.9) | 347,122 | 1,060,134 | (67.3) |
| Proinfa | 61,173 | 60,628 | 44,410 | 37.7 | 182,374 | 133,660 | 36.4 |
| Bilateral | 5,261 | 4,213 | 3,786 | 39.0 | 13,691 | 26,688 | (48.7) |
| (-) PIS/Pasep and Cofins | (109,217) | (103,974) | (127,189 | (14.1) | (325,227) | (414,531) | (21.5) |
| TOTAL | 1,173,733 | 1,053,773 | 1,447,889 | (18.9) | 3,427,377 | 5,015,259 | (31.7) |
It is also worth highlighting:
(i) the R$108.2 million in provisions and reversals, of which consisting of R$49.2 million for administrative and labor litigations, R$33.7 million for allowance doubtful accounts, R$14.5 million for the Tapajós Consortium, R$9.0 million for expropriation and right-of-way and R$1.7 million for regulatory, tax, environmental and other litigations;
(ii) the 12.7% upturn in “personnel and management”, chiefly due to the wage increase as of October 2015 and the R$8.6 million in provision for the voluntary termination and retirement of 54 employees and Voluntary Redundancy Program (PDI);
(iii) the 5.9% reduction in “charges of the main distribution and transmission grid”, due to lower costs with reserve energy charges (ERR), partially offset by the increase in system service charges (ESS);
| R$000 | |||||||
| Charges of the main distribution and transmission grid | 3Q16 | 2Q16 | 3Q15 | Var.% | 9M16 | 9M15 | Var.% |
| (1) | (2) | (3) | (1/3) | (4) | (5) | (4/5) | |
| System usage charges | 158,444 | 152,480 | 147,350 | 7.5 | 461,653 | 459,578 | 0.5 |
| Itaipu transportation charges | 17,390 | 18,037 | 21,498 | (19.1) | 59,158 | 61,451 | (3.7) |
| Charge reserve energy - EER | 9,447 | 39,459 | 31,561 | (70.1) | 66,592 | 31,561 | 111.0 |
| System Service Charges - ESS | 40,701 | 25,488 | 31,961 | 27.3 | 159,606 | 121,215 | 31.7 |
| (-) PIS / Pasep and Cofins taxes on charges for use of power grid | (22,104) | (22,469) | (15,611) | 41.6 | (65,455) | (50,338) | 30.0 |
| TOTAL | 203,878 | 212,995 | 216,759 | (5.9) | 681,554 | 623,467 | 9.3 |
(iv) increase of 9.5% in "third party services" as a result of the adjustment of agreements for the inflation;
(v) the 15.7% decline in “other operating costs and expenses”, mainly reflecting lower costs with asset decommissioning and disposals, due to the “comparison base effect” due to non-recurring events in 3Q15 and the recovery of costs and expenses related to coal and energy bills,partially offset by higher costs with financialcompensation for the use of water resources, as a result of the increased production of hydroelectric power in the period;
* Amountssubject to rounding.
8
Earnings Release 3Q16 |
| R$ '000 | |||||||
| Operating Costs and Expenses | 3Q16 | 2Q16 | 3Q15 | Var.% | 9M16 | 9M15 | Var.% |
| (1) | (2) | (3) | (1/3) | (4) | (5) | (4/5) | |
| Electricity purchased for resale | 1,173,733 | 1,053,773 | 1,447,889 | (18.9) | 3,427,377 | 5,015,259 | (31.7) |
| Charge of the main distribution and transmission grid | 203,878 | 212,995 | 216,759 | (5.9) | 681,554 | 623,467 | 9.3 |
| Personnel and management | 286,010 | 285,372 | 253,890 | 12.7 | 846,513 | 747,660 | 13.2 |
| Pension and healthcare plans | 66,335 | 62,520 | 62,711 | 5.8 | 192,363 | 188,609 | 2.0 |
| Materials and supplies | 19,454 | 20,329 | 19,573 | (0.6) | 63,098 | 57,799 | 9.2 |
| Materials and supplies for power eletricity | 6,365 | 7,718 | 54,966 | (88.4) | 24,577 | 188,020 | (86.9) |
| Natural gas and supplies for the gas business | 64,471 | 85,114 | 298,099 | (78.4) | 264,236 | 1,054,077 | (74.9) |
| Third-party services | 136,200 | 136,067 | 124,373 | 9.5 | 402,557 | 357,964 | 12.5 |
| Depreciation and amortization | 179,361 | 173,711 | 178,245 | 0.6 | 532,108 | 503,355 | 5.7 |
| Provisions and reversals | 108,151 | (64,245) | 93,447 | 15.7 | 164,967 | 497,139 | (66.8) |
| Construction cost | 373,521 | 294,639 | 302,261 | 23.6 | 927,025 | 864,340 | 7.3 |
| Other cost and expenses | 110,586 | 114,942 | 131,150 | (15.7) | 356,848 | 320,418 | 11.4 |
| TOTAL | 2,728,065 | 2,382,935 | 3,183,363 | (14.3) | 7,883,223 | 10,418,107 | (24.3) |
In the nine first months of 2016, operating costs and expenses totaled R$7,883.2 million, 24.3% lower than the same period last year, primarily due to: (a) lower costs with energy purchase, due to the termination of existing energy agreements, the higher volume of the quotas agreement and the reduction in Itaipu’s energy tariff, (b) the decrease in the costs with the purchase of natural gas and raw materials for energy production, reflecting the lower volume of energy dispatched by the Araucária TPP, and (c) the lower balance of provisions, due to the recognition of R$267.1 million in reversals in 9M16.
Equity in the earnings of investees reflects gains and losses from investments in Copel’s investees and is presented in the table below.
| '000 | |||||||
| Company | 3Q16 | 2Q16 | 3Q15 | Var. % | 9M16 | 9M15 | Var. % |
| (1) | (2) | (3) | (1/3) | (4) | (5) | (4/5) | |
| Joint Ventures | 56,388 | 35,129 | 47,511 | 18.7 | 123,125 | 114,570 | 7.5 |
| Dominó Holdings S.A. | 6,938 | 11,354 | 6,038 | 14.9 | 26,984 | 17,220 | 56.7 |
| Voltalia São Miguel do Gostoso I Participações S.A. | 377 | 2,218 | (2,449) | - | 3,174 | (3,988) | - |
| Paraná Gás Exploração e Produção S.A. | (11) | (5) | - | - | (37) | - | - |
| Costa Oeste Transmissora de Energia S.A. | 3,144 | 1,822 | 1,334 | 135.7 | 6,879 | 4,861 | 41.5 |
| Marumbi Transmissora de Energia S.A. | 10,119 | 1,870 | 3,387 | 198.8 | 16,621 | 10,141 | 63.9 |
| Transmissora Sul Brasileira de Energia S.A. | 901 | 485 | 780 | 15.5 | 1,276 | 1,421 | (10.2) |
| Caiuá Transmissora de Energia S.A. | 6,500 | 1,028 | 6,144 | 5.8 | 8,149 | 7,330 | 11.2 |
| Integração Maranhense Transmissora de Energia S.A. | 12,990 | 2,192 | 11,034 | 17.7 | 15,473 | 12,128 | 27.6 |
| Matrinchã Transmissora de Energia (TP NORTE) S.A. | 10,122 | 11,876 | 13,571 | (25.4) | 32,414 | 38,752 | (16.4) |
| Guaraciaba Transmissora de Energia (TP SUL) S.A. | 1,423 | 161 | 2,756 | (48.4) | 4,519 | 16,917 | (73.3) |
| Paranaíba Transmissora de Energia S.A. | 3,233 | 2,843 | 3,952 | (18.2) | 8,795 | 8,670 | 1.4 |
| Mata de Santa Genebra Transmissão S.A. | (947) | (707) | 688 | - | (4,188) | 740 | - |
| Cantareira Transmissora de Energia S.A. | 1,599 | (8) | 276 | 479.3 | 3,066 | 378 | 711.1 |
| Associates | 12,771 | 21,686 | 11,581 | 10.3 | 50,743 | 36,331 | 39.7 |
| Cia. de Saneamento do Paraná - Sanepar | 8,842 | 16,567 | 7,777 | 13.7 | 36,520 | 23,591 | 54.8 |
| Dona Francisca Energética S.A. | 1,355 | 2,014 | 1,497 | (9.5) | 6,025 | 5,740 | 5.0 |
| Foz do Chopim Energética Ltda. | 2,571 | 3,105 | 2,879 | (10.7) | 8,475 | 7,636 | 11.0 |
| Carbocampel S.A. | (2) | (3) | (2) | - | (6) | (2) | 200.0 |
| Copel Amec S/C Ltda. | 5 | 3 | - | - | 12 | 6 | 100.0 |
| Escoelectric Ltda. | - | - | 29 | - | (283) | (41) | 590.2 |
| Dois Saltos Ltda. | - | - | (599) | - | - | (599) | - |
| TOTAL | 69,159 | 56,815 | 59,092 | 17.0 | 173,868 | 150,901 | 15.2 |
* Amountssubject to rounding.
9
Earnings Release 3Q16 |
Earnings before interest, taxes, depreciation and amortization amounted to R$427.7 million in 3Q16, 42.9% higher than the R$299.2 million reported in the same period in 2015, chiefly due to Copel Distribuição’s 4th Tariff Review Cycle and the strategy adopted by Copel GeT to allocate energy to the short-term market, aligned to the lower exposure to GSF in the period. This result was partially offset by: (a) the 9.0% decline in Copel Distribuição’s captive market, (b) the lower volume of energy sold in the short-term market, due to the non-activation of the Araucária TPP in 3Q16, and (c) the remeasurement of RBSE’s indemnification, which had a negative impact of R$206.4 million in revenue from use of the main distribution and transmission grid.
In the first nine months of 2016, EBITDA amounted to R$2,498.1 million, 53.5% up to the R$1,627.3 million recorded in the same period in 2015.
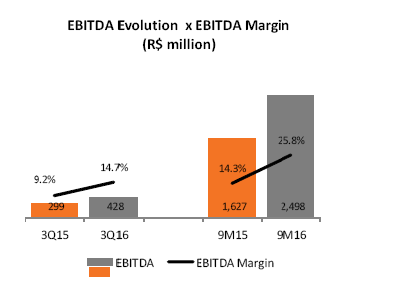
Excluding the non-recurring effects of the period, adjusted EBITDA would have been R$708.8 million in 3Q16, 92.7% up on the same period in 2015. The following table shows the items considered in the calculation of adjusted EBITDA.
| R$ million | ||||||
| Adjusted EBITDA | 3Q16 | 3Q15 | Var.% | 9M16 | 9M15 | Var.% |
| (1) | (2) | (1/2) | (3) | (4) | (3/4) | |
| EBITDA | 427.7 | 299.2 | 42.9 | 2,498.1 | 1,627.3 | 53.5 |
| (-) RBSE Remeasurement | 206.4 | - | - | (771.3) | - | - |
| (-) Reversal of provision for litigation | - | - | - | (193.4) | - | - |
| (+) Revenue frustation (Copel Dis) | 55.4 | - | - | 137.5 | 42.0 | - |
| +/(-) Additional allowance for loan losses (Copel Dis) | 19.3 | 24.1 | (19.9) | 86.2 | 37.9 | 127.4 |
| +/(-) IRT 2015 result | - | - | - | - | (108.3) | - |
| +/(-) Amortization 7/30 days IRT 2015 | - | - | - | 15.1 | (23.5) | - |
| +/(-) IRT 2016 result | - | - | - | 77.8 | - | - |
| +/(-) DIC/FIC | - | (2.5) | - | - | (10.1) | - |
| (+) Provisions for litigation | - | - | - | 44.0 | 46.4 | (5.2) |
| (+) sanitation materials and turning off assets | - | 11.0 | - | 6.5 | 11.0 | - |
| (+) Effective rate differential of PIS/Cofins no lugar de sanitation materials and turning off assets | - | 36.0 | - | - | - | 36.0 |
| Adjusted EBITDA | 708.8 | 367.8 | 92.7 | 1,900.6 | 1,622.7 | 17.1 |
* Amountssubject to rounding.
10
Earnings Release 3Q16 |
In 3Q16, financial income totaled R$164.0 million, 25.5% lower than in the same period of 2015, due to the lower monetary restatement of accounts receivable related to the concession, reflecting the extension of Copel Distribuição’s concession agreement and lower income and monetary variation on CRC transfer, due to the lower IGP-DI rate in the period (0.07% in 3Q16 versus 2.42% in 3Q15). This result was partially offset by the 38.5% increase in late payment charges on electricity bills.
Financial expenses totaled R$376.5 million in 3Q16, 65.5% up on 3Q15, primarily due to the increase in debt charges, mainly arising from the higher balance of financing and debentures.
Thus, the financial result was a negative R$212.5 million in 3Q16 versus a negative R$7.3 million recorded in the same period in 2015.
| R$'000 | |||||||
| | 3Q16 | 2Q16 | 3Q15 | Var.% | 9M16 | 9M15 | Var.% |
| (1) | (2) | (3) | (1/3) | (4 | (5) | (4/5) | |
| Financial Revenues | 164,008 | 446,220 | 220,215 | (25.5) | 824,197 | 748,726 | 10.1 |
| Income and monetary variation on CRC transfer | 27,549 | 63,019 | 52,462 | (47.5) | 148,036 | 151,428 | (2.2) |
| Income from investments held for trading | 49,902 | 47,996 | 44,878 | 11.2 | 139,843 | 101,903 | 37.2 |
| Monetary restatement on indemnifiable assets - concession | 6,916 | 113,478 | 42,868 | (83.9) | 129,311 | 135,956 | (4.9) |
| Late fees on electricity bills | 61,402 | 57,860 | 44,318 | 38.5 | 177,975 | 117,636 | 51.3 |
| Monetary restatement on interest on indemnified assets - compensation of the concession | - | - | 6,988 | - | - | 96,900 | - |
| Income from financial investments available for sale | 3,645 | 3,553 | 3,938 | (7.4) | 10,297 | 12,657 | (18.6) |
| Monetary restatement and adjustment to present value of accounts payable related to concession | 37 | 237 | 250 | (85.2) | 1,115 | 1,637 | (31.9) |
| Income from sectorial assets and liabilities | - | 10,830 | 11,667 | - | 27,733 | 89,809 | (69.1) |
| Exchange variation About Purchase Itaipu Electric Power | 5,694 | 13,285 | - | - | 36,284 | - | - |
| Other financial revenues | 8,863 | 135,962 | 12,846 | (31.0) | 153,603 | 40,800 | 276.5 |
| Financial Expenses | (376,480) | (318,472) | (227,476) | 65.5 | (1,066,782) | (594,473) | 79.5 |
| Monetary variation, foreign exchange and debt service charges | (288,445) | (248,162) | (177,271) | 62.7 | (785,652) | (447,644) | 75.5 |
| Monetary variation and adjustment to present value of accounts payable related to concession | (15,983) | (21,9160) | (21,806) | (26.7) | (73,634) | (68,748) | 7.1 |
| Exchange variation About Purchase Itaipu Electric Power | (1,129) | (46) | - | - | (11,708) | - | - |
| Income from sectorial assets and liabilities | 2,144 | (18,700) | - | - | (18,204) | - | - |
| Interest on R&D and PEE | (10,994) | (10,372) | (9,477) | 16.0 | (30,968) | (24,647) | 25.6 |
| Accounts receivable tied to the concession fair value's update | (5,235) | - | - | - | (5,235) | - | - |
| Other financial expenses | (56,838) | (19,276) | (18,922) | 200.4 | (141,381) | (53,434) | 164.6 |
| Financial income (expenses) | (212,472) | 127,748 | (7,261) | 2,826.2 | (242,585) | 154,253 | - |
In the first nine months of 2016, the financial result was a negative R$242.6 million, versus a positive R$154.3 million in the same period of 2015 and mainly reflects increased debt charges due to the higher balance of financing and debentures.
In 3Q16, Copel posted loss of R$75.1 million, compared net income of R$ 91.4 million in the same period of 2015, while in the first nine months of 2016, this figure came to R$1,057.6 million, 22.5% higher than the R$863.4 million recorded in the same period of 2015.
* Amountssubject to rounding.
11
Earnings Release 3Q16 |
| R$'000 | |||||||
| Income Statement | 3Q16 | 2Q16 | 3Q15 | Var.% | 9M16 | 9M15 | Var.% |
| (1) | (2) | (3) | (1/3) | (4) | (5) | (4/5) | |
| OPERATING REVENUES | 2,907,196 | 3,694,556 | 3,245,188 | (10.4) | 9,675,390 | 11,391,128 | (15.1) |
| Electricity sales to final customers | 1,071,298 | 1,480,362 | 1,409,586 | (24.0) | 4,130,974 | 4,158,744 | (0.7) |
| Electricity sales to distributors | 684,013 | 628,945 | 751,190 | (8.9) | 1,994,964 | 3,085,816 | (35.4) |
| Use of the main distribution and transmission grid | 503,403 | 1,791,328 | 641,614 | (21.5) | 3,148,948 | 1,717,351 | 83.4 |
| Construction revenue | 362,220 | 301,292 | 282,484 | 28.2 | 934,665 | 823,678 | 13.5 |
| Revenues from telecommunications | 63,359 | 61,493 | 54,778 | 15.7 | 187,349 | 153,683 | 21.9 |
| Distribution of piped gas | 118,835 | 126,976 | 140,843 | (15.6) | 369,003 | 401,520 | (8.1) |
| Result of Sectorial financial assets and liabilities | 64,355 | (727,285) | (59,678) | - | (1,190,132) | 979,343 | - |
| Other operating revenues | 39,713 | 31,445 | 24,371 | 63.0 | 99,619 | 70,993 | 40.3 |
| OPERATING COSTS AND EXPENSES | (2,728,065) | (2,382,935) | (3,183,363) | (14.3) | (7,883,223) | (10,418,107) | (24.3) |
| Electricity purchased for resale | (1,173,733) | (1,053,773) | (1,447,889) | (18.9) | (3,427,377) | (5,015,259) | (31.7) |
| Charge of the main distribution and transmission grid | (203,878) | (212,995) | (216,759) | (5.9) | (681,554) | (623,467) | 9.3 |
| Personnel and management | (286,010) | (285,372) | (253,890) | 12.7 | (846,513) | (747,660) | 13.2 |
| Pension and healthcare plans | (66,335) | (62,520) | (62,711) | 5.8 | (192,363) | (188,609) | 2.0 |
| Materials and supplies | (19,454) | (20,329) | (19,573) | (0.6) | (63,098) | (57,799) | 9.2 |
| Materials and supplies for power eletricity | (6,365) | (7,718) | (54,966) | (88.4) | (24,577) | (188,020) | (86.9) |
| Natural gas and supplies for the gas business | (64,471) | (85,114) | (298,099) | (78.4) | (264,236) | (1,054,077) | (74.9) |
| Third-party services | (136,200) | (136,067) | (124,373) | 9.5 | (402,557) | (357,964) | 12.5 |
| Depreciation and amortization | (179,361) | (173,711) | (178,245) | 0.6 | (532,108) | (503,355) | 5.7 |
| Provisions and reversals | (108,151) | 64,245 | (93,447) | 15.7 | (164,967) | (497,139) | (66.8) |
| Construction cost | (373,521) | (294,639) | (302,261) | 23.6 | (927,025) | (864,340) | 7.3 |
| Other cost and expenses | (110,586) | (114,942) | (131,150) | (15.7) | (356,848) | (320,418) | 11.4 |
| EQUITY IN EARNINGS OF SUBSIDIARIES | 69,159 | 56,815 | 59,092 | 17.0 | 173,868 | 150,901 | 15.2 |
| PROFIT BEFORE FINANCIAL RESULTS AND TAXES | 248,290 | 1,368,436 | 120,917 | 105.3 | 1,966,035 | 1,123,922 | 74.9 |
| FINANCIAL RESULTS | (212,472) | 127,748 | (7,261) | - | (242,585) | 154,253 | - |
| Financial income | 164,008 | 446,220 | 220,215 | (25.5) | 824,197 | 748,726 | 10.1 |
| Financial expenses | (376,480) | (318,472) | (227,476) | 65.5 | (1,066,782) | (594,473) | 79.5 |
| OPERATIONAL EXPENSES/ INCOME | 35,818 | 1,496,184 | 113,656 | (68.5) | 1,723,450 | 1,278,175 | 34.8 |
| INCOME TAX AND SOCIAL CONTRIBUTION ON PROFIT | (110,872) | (499,606) | (22,223) | 398.9 | (665,837) | (414,736) | 60.5 |
| Income tax and social contribution on profit | (60,509) | (225,977) | (101,481) | (40.4) | (639,637) | (571,855) | 11.9 |
| Deferred income tax and social contribution on profit | (50,363) | (273,629) | 79,258 | - | (26,200) | 157,119 | - |
| NET INCOME (LOSS) | (75,054) | 996,578 | 91,433 | - | 1,057,613 | 863,439 | 22.5 |
| Attributed to controlling shareholders | (87,116) | 992,959 | 87,609 | - | 1,039,349 | 796,916 | 30.4 |
| Attributed to non-controlling interest | 12,062 | 3,619 | 3,824 | 215.4 | 18,264 | 66,523 | (72.5) |
| EBITDA | 427,651 | 1,542,147 | 299,162 | 42.9 | 2,498,143 | 1,627,277 | 53.5 |
The main accounts and changes in the Balance Sheet in relation to December 2015 are described below. Additional information can be found in the Notes to our Quarterly Financial Information.
Cash, Cash Equivalents and Bonds and Securities
On September 30, 2016, the cash and cash equivalents, bonds and securities of Copel’s wholly owned subsidiaries and controlled companies totaled R$1,944.2 million, 1.7% lower than the R$1,978.1 million recorded on December 2015. These funds were invested, mostly in Bank Deposit Certificates (CDBs) and repo transactions. The investments earned an average yield of the period variation in the Interbank Deposit Certificate (CDI) rate.
* Amountssubject to rounding.
12
Earnings Release 3Q16 |
CRC Transferred to the State of Paraná
Through the fourth addendum signed on January 21, 2005, the Company renegotiated the CRC balance on December 31, 2004 with the State of Paraná at R$1,197.4 million, in 244 monthly installments recalculated by the price amortization system, restated by the IGP-DI inflation index plus annual interest of 6.65%. The first installment was due on January 30, 2005, with subsequent and consecutive maturities until April 2025.
In June 2016 the Company's Board of Directors approved the Novation of the CRC Adjustment Agreement between Copel and the Government of the State of Paraná. The 5th addendum term grants, in the period from April to December 2016, a total grace period for payments and, from January to December 2017, without any real loss of the total amount of the agreement, maintaining its net present value. The other clauses in the agreement will be maintained. The current CRC balance is R$1,476.6 million.
Sectorial Financial Assets and Liabilities
As of December 31, 2014, Copel Distribuição has recognized sectorial financial assets and/or liabilities in its financial statements as a result of an amendment to the concession agreement that guarantees that the residual amounts of items of Portion A and other financial components not recovered or returned via tariffs will be included in, or discounted from, the calculation of the indemnification for non-amortized assets at the expiration of the concession. On September 30, 2016, the Company had a balance of R$358.6 million of sector financial liabilities. More detail in our Quarterly Financial Information (Note 9).
Accounts Receivable Related to the Concession
This line refers to accounts receivable related to the contracts for the concession of electric power generation, transmission and distribution activities. The amounts refer to (a) the concession fee paid as a result of the auction involving the Governador Parigot de Souza Plant – HPP GPS, won by Copel GeT on November 25, 2015 (R$588.7 million), (b) its investments in infrastructure and financial remuneration that have not been or will not be recovered via tariffs and/or APR until the expiration of the concession (R$1,862.5 million) and (c) the amounts receivable from energy transmission assets of the Existing System Basic Network – RBSE and connection facilities and other transmission facilities - RPC, as a result of the recognition of the effects of Ordinance 120 of the Ministry of Mines and Energy (R$1,086.9 million). On September 30, 2016, the balance of this account stood at R$3,538.1 million. For further information, please refer to notes 10 of our Quarterly Financial Information.
Accounts Receivable related to the Concession Indemnification
This account refers to the residual value of the generation assets whose concession expired in 2015 (Rio dos Patos HPP, GPS HPP and Mourão I HPP). On September 30, 2016, the amount registered in this account was R$59.3 million. More details in Notes 11 to our Quarterly Financial Information.
* Amountssubject to rounding.
13
Earnings Release 3Q16 |
Investments, Property, Plant and Equipment and Intangible Assets
"Investments" moved up 23.6% until September 30, 2016, due to equity in the earnings of subsidiaries and capital contributions recorded in the period. “Property, plant and equipment” increased 5.5%, due to the startup of new assets, in accordance with the Company's investment program, net of period depreciation. “Intangible assets” grew 4.5%, reflecting period investments in new assets.
| R$'000 | |||||
| Assets | Sep-16 | Dec-15 | Sep-15 | Var.% | Var.% |
| (1) | (2) | (3) | (1/2) | (1/3) | |
| CURRENT | 4,881,893 | 6,933,397 | 6,720,226 | (29.6) | (27.4) |
| Cash and cash equivalents | 1,417,706 | 1,480,727 | 831,568 | (4.3) | 70.5 |
| Bonds and securities | 337,224 | 406,274 | 384,549 | (17.0) | (12.3) |
| Collaterals and escrow accounts | 1,672 | 2,000 | 1,809 | (16.4) | (7.6) |
| Customers | 2,298,685 | 3,032,827 | 2,980,017 | (24.2) | (22.9) |
| Dividends receivable | 27,796 | 40,345 | 24,687 | (31.1) | 12.6 |
| CRC transferred to the State of Paraná | - | 111,663 | 104,534 | - | - |
| Net sectorial financial assets | - | 910,759 | 1,236,253 | - | - |
| Account receivable related to concession | 17,585 | 9,162 | 8,351 | 91.9 | 110.6 |
| Accounts receivable related to the concession compensation | - | - | 130,243 | - | - |
| Other current receivables | 336,150 | 474,889 | 627,949 | (29.2) | (46.5) |
| Inventories | 138,964 | 131,018 | 135,951 | 6.1 | 2.2 |
| Income tax and social contribution | 139,808 | 194,244 | 168,976 | (28.0) | (17.3) |
| Other current recoverable taxes | 81,662 | 70,725 | 62,955 | 15.5 | 29.7 |
| Prepaid expenses | 41,126 | 49,282 | 22,384 | (16.5) | 83.7 |
| Related parties | 43,515 | 19,482 | - | 123.4 | - |
| NON-CURRENT | 25,615,690 | 22,014,260 | 21,694,098 | 16.4 | 18.1 |
| Long Term Assets | 7,276,307 | 4,951,792 | 9,460,136 | 46.9 | (23.1) |
| Bonds and securities | 189,241 | 91,117 | 100,435 | 107.7 | 88.4 |
| Collaterals and escrow accounts | 77,101 | 86,137 | 84,024 | (10.5) | (8.2) |
| Customers | 103,321 | 75,062 | 85,159 | 37.6 | 21.3 |
| Net sectoral financial assets | 1,476,618 | 1,271,579 | 1,257,061 | 16.1 | 17.5 |
| CRC transferred to the State of Paraná | 592,359 | 719,927 | 714,812 | (17.7) | (17.1) |
| Judicial deposits | - | 134,903 | 217,408 | - | - |
| Account receivable related to concession | 3,520,473 | 1,358,451 | 5,687,594 | 159.2 | (38.1) |
| Accounts receivable related to the concession compensation | 59,339 | 219,556 | 218,871 | (73.0) | (72.9) |
| Other non-current receivables | 43,708 | 31,614 | 35,353 | 38.3 | 23.6 |
| Income tax and social contribution | 165,671 | 94,686 | 92,074 | 75.0 | 79.9 |
| Deferred income tax and social contribution | 723,125 | 537,562 | 667,853 | 34.5 | 8.3 |
| Other non-current recoverable taxes | 128,318 | 112,902 | 121,788 | 13.7 | 5.4 |
| Prepaid expenses | 29,467 | 25,493 | 175 | 15.6 | - |
| Related parties | 167,566 | 192,803 | 177,529 | (13.1) | (5.6) |
| Investments | 2,750,672 | 2,224,710 | 2,050,406 | 23.6 | 34.2 |
| Property, plant and equipment, net | 9,169,506 | 8,692,682 | 8,699,629 | 5.5 | 5.4 |
| Intangible assets | 6,419,205 | 6,145,076 | 1,483,927 | 4.5 | 332.6 |
| TOTAL | 30,497,583 | 28,947,657 | 28,414,324 | 5.4 | 7.3 |
* Amountssubject to rounding.
14
Earnings Release 3Q16 |
Gross Debt
Copel’s consolidated debt totaled R$8,761.4 million on September 30, 2016, 12.9% higher than the R$7,761.0 million recorded in 2015, due to the debenture issue of Copel GeT in the amount of R$1,000.0 million in July and the Nova Asa Branca I, Nova Asa Branca II, Nova Asa Branca III, Nova Eurus IV and Ventos de Santo Uriel wind farms, which are part of the Brisa Potiguar Wind Farm complex, in the amount of R$302.2 million, partially offset by amortizations and payments of charges in the period.
On September 30, 2016, Copel’s gross debt represented 56.1% of consolidated shareholders’ equity, which at the end of the period was R$15,609.2 million, equivalent to R$57.04 per share (book value per share). The breakdown of the balance of loans, financing and debentures is shown in the table below:
| R$'000 | ||||
| Total | composition | |||
| % | ||||
| Domestic Currency | Eletrobras - COPEL | 52,936 | 0.6 | |
FINEP | 23,408 | 0.3 | ||
BNDES | 1,650,223 | 18.8 | ||
Banco do Brasil S/A and other | 1,570,575 | 17.9 | ||
Debentures and Promissory Notes | 5,375,389 | 61.4 | ||
Total | 8,672,531 | 99.0 | ||
| Foreign Currency | National Treasury | 88,839 | 1.0 | |
Total | 88,839 | 1.0 | ||
| TOTAL | 8,761,370 | 100.0 |
Loans, financing and debentures maturities are presented below:
| R$'000 | ||||||||
| Short Term | Long Term | Total | ||||||
| Oct-16 - Sep-17 | Oct-17 - Dec-17 | 2018 | 2019 | 2020 | 2021 | From 2022 | ||
| Domestic Currency | 1,976,668 | 1,118,855 | 2,030,070 | 1,453,425 | 516,425 | 177,541 | 1,399,547 | 8,672,531 |
| Foreign Currency | 1,721 | - | - | - | - | - | 87,118 | 88,839 |
| TOTAL | 1,978,389 | 1,118,855 | 2,030,070 | 1,453,425 | 516,425 | 177,541 | 1,486,665 | 8,761,370 |
Endorsements and Guarantees
At the end of September 2016, the Company had R$1,503.6 million in guarantees and endorsements, as shown below.
| R$'000 | |||||
| Guarantees and Endorsements¹ | Sep-16 | Dec-15 | Sep-15 | Var.% | Var.% |
| (1) | (2) | (3) | (1/2) | (1/3) | |
| Transmissora Sul Brasileira de Energia S.A. | 67,190 | 67,559 | 67,650 | (0.5) | (0.7) |
| Caiuá Transmissora de Energia S.A. | 38,982 | 41,246 | 42,021 | (5.5) | (7.2) |
| Integração Maranhense Transmissora de Energia S.A. | 64,146 | 68,514 | 69,812 | (6.4) | (8.1) |
| Matrinchã Transmissora de Energia (TP NORTE) S.A. | 395,367 | 322,784 | 328,361 | 22.5 | 20.4 |
| Guaraciaba Transmissora de Energia (TP SUL) S.A. | 204,995 | 196,846 | 203,274 | 4.1 | 0.8 |
| Costa Oeste Transmissora de Energia S.A. | 15,894 | 16,859 | 17,190 | (5.7) | (7.5) |
| Mata de Santa Genebra Transmissão S.A. | 234,926 | 245,356 | 236,335 | (4.3) | (0.6) |
| Paranaíba Transmissora de Energia S.A. | 148,118 | 134,263 | 96,303 | 10.3 | 53.8 |
| Marumbi Transmissora de Energia S.A. | 39,549 | 42,143 | 43,000 | (6.2) | (8.0) |
| Voltalia São Miguel do Gostoso I Participações S.A. | 147,237 | 146,719 | - | 0.4 | - |
| TOTAL | 1,503,641 | 1,282,289 | 1,103,946 | 17.3 | 36.2 |
| ¹ Adjusted for Copel’s stake. |
* Amountssubject to rounding.
15
Earnings Release 3Q16 |
Copel’s consolidated net debt (loans, financing and debentures less cash and cash equivalents) and the netdebt/EBITDA ratio are shown in the following chart:
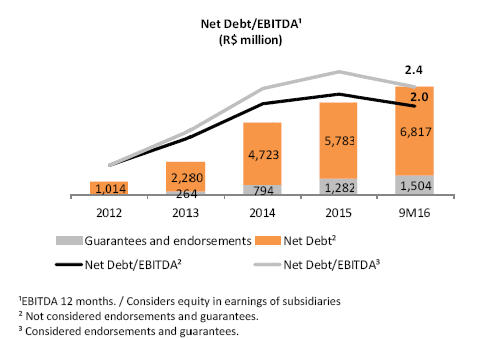
| R$'000 | |||||
| 2012 | 2013 | 2014 | 2015 | 9M16 | |
| Net Debt Total | 1,014,402 | 2,544,509 | 5,517,138 | 7,065,159 | 8,320,840 |
Net Debt by Subsidiary
The following table shows the gross debt and net debt of the subsidiaries:
| R$'000 | ||||||
| GeT | DIS | Telecom | Holding | Other | Total | |
| Total debt | 3,916,551 | 1,860,055 | 200,006 | 2,037,265 | 747,493 | 8,761,370 |
| Endorsements and Guarantees | 103,128 | - | - | 1,400,513 | - | 1,503,641 |
| Availability | 854,080 | 309,394 | 6,827 | 10,260 | 763,610 | 1,944,171 |
| Net debt | 3,165,599 | 1,550,661 | 193,179 | 3,427,518 | (16,117 | 8,320,840 |
Accounts Payables related to the Concession
Use of Public Property
It refers to the concession charges for the use of public property incurred since the execution of the project’s concession agreement until the end of the concession.
| R$'000 | |||||
| Mauá | Colíder | Baixo Iguaçu | SHP¹ | Elejor | Total |
| 16,222 | 22,720 | 6,151 | 2,093 | 516,812 | 563,998 |
| ¹Relative to SPP Cavernoso, Apucaraninha, Chopim I , Chaminé and Derivação do Rio Jordão. | |||||
* Amountssubject to rounding.
16
Earnings Release 3Q16 |
Provisions for Legal Claims
The Company is involved in a series of lawsuits in different courts and instances. Copel’s management, based on its legal advisors’ opinion, maintains a provision for legal claims for those cases assessed as probable losses. The balances of provisions for legal claims are as follows:
| R$ '000 | |||||
| Probable Losses - Consolidated | Sep-16 | Dec-15 | Sep-15 | Var % | Var % |
| (1) | (2) | (3) | (1/2) | (1/3) | |
| Tax | 175,398 | 327,048 | 327,294 | (46.4) | (46.4) |
| Labor suits | 512,289 | 408,133 | 393,595 | 25.5 | 30.2 |
| Employees and Benefits | 76,360 | 104,480 | 104,671 | (26.9) | (27.0) |
| Civil | 540,891 | 598,637 | 841,048 | (9.6) | (35.7) |
| Suppliers | - | - | 34,950 | - | - |
| Civil and administrative claims | 368,053 | 325,217 | 301,554 | 13.2 | 22.1 |
| Easements | 96,287 | 62,869 | 43,791 | 53.2 | 119.9 |
| Condemnations and property | 70,449 | 196,895 | 444,904 | (64.2) | (84.2) |
| Customers | 6,102 | 13,656 | 15,849 | (55.3) | (61.5) |
| Environmental claims | 1,134 | 868 | 563 | 30.6 | 101.4 |
| Regulatory | 58,583 | 55,770 | 51,295 | 5.0 | 14.2 |
| TOTAL | 1,364,655 | 1,494,936 | 1,718,466 | (8.7) | (20.6) |
The lawsuits classified as possible losses, as estimated by the Company and its controlled companies at the end of 9M16, totaled R$2,614.5 million, 34.2% down on December 2015 (R$3,971.6 million), distributed in lawsuits of the following natures: tax (R$815.9 million); regulatory (R$717.7 million); civil (R$571.6 million); labor (R$458.3 million) and employee benefits (R$51.0 million).
* Amountssubject to rounding.
17
Earnings Release 3Q16 |
| R$'000 | |||||
| Liabilities | Sep-16 | Dec-15 | Sep-15 | Var.% | Var.% |
| (1) | (2) | (3) | (1/2) | (1/3) | |
| CURRENT | 4,632,126 | 4,789,118 | 4,046,369 | (3.3) | 14.5 |
| Payroll, social charges and accruals | 261,331 | 258,401 | 227,844 | 1.1 | 14.7 |
| Suppliers | 1,206,386 | 1,613,126 | 1,811,769 | (25.2) | (33.4) |
| Income tax and social contribution payable | 97,773 | 311,916 | 326,468 | (68.7) | (70.1) |
| Other taxes due | 211,305 | 340,948 | 244,124 | (38.0) | (13.4) |
| Loans, financing and debentures | 1,978,389 | 1,232,563 | 629,521 | 60.5 | 214.3 |
| Minimum compulsory dividend payable | 19,133 | 346,007 | 18,495 | (94.5) | 3.4 |
| Post employment benefits | 43,221 | 43,323 | 36,814 | (0.2) | 17.4 |
| Customer charges due | 144,357 | 277,458 | 394,930 | (48.0) | (63.4) |
| Research and development and energy efficiency | 159,552 | 167,881 | 158,050 | (5.0) | 1.0 |
| Accounts Payable related to concession | 62,033 | 61,786 | 55,196 | 0.4 | 12.4 |
| Net sectorial financial liabilities | 193,402 | - | - | - | - |
| Other accounts payable | 255,244 | 135,709 | 143,158 | 88.1 | 78.3 |
| NON-CURRENT | 10,256,259 | 9,574,061 | 10,105,646 | 7.1 | 1.5 |
| Suppliers | 5,923 | 5,923 | 14,249 | - | (58.4) |
| Deferred income tax and social contribution | 212,171 | 214 | - | - | - |
| Other taxes due | 237,529 | 257,273 | 256,226 | (7.7) | (7.3) |
| Loans, financing and debentures | 6,782,981 | 6,528,425 | 6,460,310 | 3.9 | 5.0 |
| Post employment benefits | 616,053 | 551,337 | 940,866 | 11.7 | (34.5) |
| Research and development and energy efficiency | 304,883 | 231,112 | 240,085 | 31.9 | 27.0 |
| Accounts Payable related to concession | 501,965 | 473,879 | 463,339 | 5.9 | 8.3 |
| Net sectorial financial liabilities | 165,205 | - | - | - | - |
| Other accounts payable | 64,894 | 30,962 | 12,105 | 109.6 | - |
| Tax, social security, labor and civil provisions | 1,364,655 | 1,494,936 | 1,718,466 | (8.7) | (20.6) |
| EQUITY | 15,609,198 | 14,584,478 | 14,262,309 | 7.0 | 9.4 |
| Attributed to controlling shareholders | 15,284,598 | 14,245,728 | 13,901,029 | 7.3 | 10.0 |
| Share capital | 6,910,000 | 6,910,000 | 6,910,000 | - | - |
| Equity valuation adjustments | 1,063,223 | 1,177,372 | 920,829 | (9.7) | 15.5 |
| Legal reserves | 744,784 | 744,784 | 685,147 | - | 8.7 |
| Retained earnings | 5,413,572 | 5,413,572 | 4,516,825 | - | 19.9 |
| Accrued earnings | 1,153,019 | - | 868,228 | - | 32.8 |
| Attributable to non-controlling interest | 324,600 | 338,750 | 361,280 | (4.2) | (10.2) |
| TOTAL | 30,497,583 | 28,947,657 | 28,414,324 | 5.4 | 7.3 |
In 3Q16, Copel GeT’s operating revenue came to R$554.4 million, 7.0% lower than the R$596.0 million recorded in the same period last year, primarily due to the negative impact of R$206.4 million, due to of the cash flow remeasurement of the amounts related to RBSE based on new Aneel’s inspection note, which showed an amount receivable lower than the amount estimated in 2Q16. This result was partially offset by its strategyto allocate energy in the short term (951 GWh in 3Q16 versus 139 GWh in 3Q15), the startup of new transmission assets and the APR readjustment in July 2016 related to the effective contracts.
* Amountssubject to rounding.
18
Earnings Release 3Q16 |
Operating costs and expenses totaled R$460.5 million in 3Q16, 12.5% up on 3Q15, primarily due to: (a) the R$30.8 million in provisions and reversals, (b) the 23.6% increase in personnel and management costs, due to wage increase as of October 2015, the corporate reorganization in February 2016, and the provision of R$3.8 million related to the adhesion of 14 employees to the Voluntary Redundancy Program - PDI, and (c) the 23.8% growth in outsourced services, due to higher costs with maintenance of the electrical system. The increases were partially offset by reduced expenses with energy acquisition, due to lower energy exposed to GSF and lower PLD in the period (R$112.05/MWh in 3Q16 versus R$192.70/MWh in 3Q15).
The equity ernings of subsidiaries was R$53.7 million in 3Q16 versus R$57.8 million in the same period in 2015, mainly due to the negative result of the Araucária TPP (loss of R$23.0 million in 3Q16 versus R$23.1 million profit in 3Q15). In 3Q16, Copel GeT posted net income of R$44.9 million and EBITDA of R$216.5 million.
| Main Indicators | 3Q16 | 2Q16 | 3Q15 | Var.% | 9M16 | 9M15 | Var.% |
| (1) | (2) | (3) | (1/3) | (4) | (5) | (4/5) | |
| Net Operating Revenue (R$ million) | 554.4 | 1,753.1 | 596.0 | (7.0) | 3,059.2 | 2,164.5 | 41.3 |
| Operating Costs and Expenses (R$ million) | (460.5) | (440.4) | (409.2) | 12.5 | (1,291.7) | (1,568.3) | (17.6) |
| Operating Income (R$ million) | 35.8 | 1,255.5 | 230.2 | (84.5) | 1,529.2 | 926.2 | 65.1 |
| Net Income (R$ million) | 44.9 | 838.6 | 172.1 | (73.9) | 1,048.7 | 704.5 | 48.9 |
| EBITDA (R$ million) | 216.5 | 1,404.6 | 312.2 | (30.6) | 2,076.7 | 1,073.8 | 93.4 |
| Operating Margin | 6.5% | 71.6% | 38.6% | (83.3) | 50.0% | 42.8% | 16.8 |
| Net Margin | 8.1% | 47.8% | 28.9% | (72.0) | 34.3% | 32.5% | 5.3 |
| EBITDA Margin | 39.1% | 80.1% | 52.4% | (25.4) | 67.9% | 49.6% | 36.8 |
| Investment Program (R$ million) | 486.3 | 469.9 | 353.6 | 37.5 | 1,565.6 | 861.3 | 81.8 |
In the first nine months of 2016, Copel GeT registered operating revenue of R$3,059.2 million, up 41.3% when compared to the same period last year, while operating costs and expenses showed a 17.6% reduction, totaling R$1,291.7 million in the period. Net Income reached R$1,048.7million and EBITDA totaled R$2,076.7 million, up 48.9% and 93.4%, respectively, when compared with the same period 2015.
Copel GeT’s - Adjusted EBITDA
Excluding non-recurring effects of the period, EBITDA Copel GeT would be R$422.9 million, 35.5% higher than recorded in 3T15.
| R$ million | ||||||
| Adjusted EBITDA | 3Q16 | 3Q15 | Var.% | 9M16 | 9M15 | Var.% |
| (1) | (2) | (1/2) | (3) | (4) | (3/4) | |
| EBITDA | 216.5 | 312.2 | (30.6) | 2,076.7 | 1,073.8 | 93.4 |
| (+/-) Remeasurement of financial assets RBSE | 206.4 | - | - | (771.3) | - | - |
| Adjusted EBITDA | 422.9 | 312.2 | 35.5 | 1,305.4 | 1,073.8 | 21.6 |
* Amountssubject to rounding.
19
Earnings Release 3Q16 |
In 3Q16, Copel Distribuição’s operating revenue came to R$2,164.0 million, 1.3% up on the R$2,136.5 million recorded in the same period in 2015, primarily due to: (a) the 184.8% increase in eletricity sales to distributors, due to higher volume of energy sold in the short-term market (1,250 GWh in 3Q16 versus 202 GWh in 3Q15), (b) the positive R$64.4 million in financial assets and liabilities in 3Q16 versus a negative R$59.7 million in 3Q15, (c) 14.4% increase in use of the main distribution grid, due to the increase in Parcel B, which increased from R$1,850.8 million to $2,222.4 million, reflecting the result of the 4th tariff review cycle, partially offset by the 9.0% decline in Copel Distribuição’s captive market.
Operating costs and expenses fell by 6.3% to R$2,145.9 million in the period, mainly reflecting: (a) lower costs with energy purchased in the regulated market, due to the termination of existing energy agreements, which were replaced by energy agreements arising from the quotas system and the reduction in Itaipu’s energy tariff, and (b) the 8.9% decrease in charges of the main distribution and transmission grid, due to reduced costs with reserve energy charges (ERR) and transportation in Itaipu, partially offset by (a) the 15.9% upturn in personnel and management costs, due to the wage increase in October 2015, the corporate reorganization in February 2016 and the R$4.6 million provision related to the adhesion of 39 employees to the Voluntary Redundancy Program (PDI), and (b) the R$73.0 million in provisions and reversals, comprised of R$24.4 million from labor litigations, R$31.2 million from allowance for doubtful accounts (PCLD), R$14.5 million from civil litigations, and R$2.9 millions to other litigations.
The financial result was a negative R$29.6 million, compared to a positive result of R$43.7 million in 3Q15, mostly impacted by the lower revenue with the financial asset’s monetary variation, due to the reclassification of Accounts Receivable related to the Concession to intangible asset at the end of 2015, due to the renewal of the concession, and higher costs with debt charges. The result was also impacted by the R$121.9 million provision for the non-realization of deferred income tax and social contribution on sectorial assets and liabilities, due to the discussion on the criterion for the calculation of federal taxes based on recent pronouncements. As a result, Copel Distribuição recorded a loss of R$126.6 million and EBITDA of R$88.1 million in 3Q16.
* Amountssubject to rounding.
20
Earnings Release 3Q16 |
| Main Indicators | 3Q16 | 2Q16 | 3Q15 | Var.% | 9M16 | 9M15 | Var.% |
| (1) | (2) | (3) | (1/3) | (4) | (5) | (4/5) | |
| Net Operating Revenue (R$ million) | 2,164.0 | 1,730.4 | 2,136.5 | 1.3 | 5,971.7 | 7,217.3 | (17.3) |
| Operating Costs and Expenses (R$ million) | (2,145.9) | (1,968.4) | (2,289.5) | (6.3) | (6,286.5) | (7,241.2) | (13.2) |
| Operating Income (R$ million) | (11.5) | (98.8) | (109.3) | (89.5) | (167.1) | 155.6 | - |
| Net Income (R$ million) | (126.6) | (64.2) | (73.1) | 73.2 | (230.0) | 98.2 | - |
| EBITDA (R$ million) | 88.1 | (169.1) | (85.5) | - | (109.6) | 159.1 | - |
| Operating Margin | - | - | - | - | - | 2.2% | - |
| Net Margin | - | - | - | - | - | 1.4% | - |
| EBITDA Margin | 4.1% | - | - | - | - | 2.2% | - |
| Investment Program (R$ million) | 208.8 | 186.3 | 151.0 | 38.3 | 552.7 | 486.3 | 13.7 |
In the first nine months of 2016, Copel Distribuição recorded net income of R$5,971.7 million, 17.3% down on the same period in 2015. Operating costs and expenses fell 13.2% to R$6,286.5 million in 9M16. Thus, the Company recorded a loss of R$230.0 million versus an income of R$98.2 million in the same period in 2015. EBITDA was a negative R$109.6 million in 3Q16 versus R$159.1 million in the first nine months of 2015. The worsening of the 2016 figures was due the market downturn, higher provisions recorded and the negative result in the line of "financial assets and liabilities" in the period.
Copel Distribuição – EBITDA adjusted
Excluding non-recurring effects of the period, EBITDA Copel Distribuição would be R$172.3 million against the R$25.1 million recorded in 3Q15.
| R$ million | ||||||
| Adjusted EBITDA | 3Q16 | 3Q15 | Var.% | 9M16 | 9M15 | Var.% |
| (1) | (2) | (1/2) | (3) | (4) | (3/4) | |
| EBITDA | 88.1 | (85.5) | - | (109.6) | 159.1 | - |
| (+) Revenue frustation (gain) | 55.4 | 42.0 | - | 137.5 | 42.0 | - |
| +/(-) Allowance for doubtful accounts | 19.3 | 24.1 | (19.9) | 86.2 | 37.9 | 127.4 |
| +/(-) IRT 2015 result | - | - | - | - | (108.3) | - |
| +/(-) Amortization 7/30 days IRT 2015 | - | - | - | 15.1 | (23.5 | - |
| +/(-) IRT 2016 result | - | - | - | 77.8 | - | - |
| +/(-) DIC/FIC | - | (2.5) | - | - | (10.1) | - |
| (+) Provisions for litigation | - | - | - | 44.0 | 46.4 | (5.2) |
| (+) Corporate reorganization | 9.5 | - | - | 24.5 | - | - |
| (+) sanitation materials and turning off assets | - | 11 | - | 6.5 | 11.0 | (40.9) |
| (+) Effective rate differential of PIS/Cofins | - | 36 | - | - | 36.0 | - |
| Adjusted EBITDA | 172.3 | 25.1 | 585.2 | 282.0 | 190.5 | 48.0 |
Copel Telecomunicações’ operating revenue came to R$80.3 million in 3Q16, 12.3% more than the R$71.5 million recorded in the same period of the previous year, mainly due to the expansion of the area of operation and service to new customers. Operating costs and expenses increased by 13.4% to R$57.4 million in 3Q16,influenced by the 21.0% growth in personnel costs and administrators, reflecting the corporate reorganization carried out in February 2016 and the salary increase implemented in October 2015 and 33.6% in the cost of third party services, which are necessary for the expansion of the area of operation. Net income for the period was R$12.7 million, a decrease of 11.2% compared to 3T15, while EBITDA reached R$31.5 million, 8.6% higher than the R$29.0 million recorded in the same period last year.
* Amountssubject to rounding.
21
Earnings Release 3Q16 |
| Main Indicators | 3Q16 | 2Q16 | 3Q15 | Var.% | 9M16 | 9M15 | Var.% |
| (1) | (2) | (3) | (1/3) | (4) | (5) | (4/5) | |
| Net Operating Revenue (R$ million) | 80.3 | 78.4 | 71.5 | 12.3 | 236.8 | 204.1 | 16.0 |
| Operating Costs and Expenses (R$ million) | (57.4) | (54.1) | (50.6) | 13.4 | (168.9) | (139.7) | 20.9 |
| Operating Income (R$ million) | 18.9 | 22.0 | 21.4 | (11.7) | 57.5 | 65.4 | (12.1) |
| Net Income (R$ million) | 12.7 | 14.8 | 14.3 | (11.2) | 38.6 | 43.4 | (11.1) |
| EBITDA (R$ million) | 31.5 | 32.8 | 29.0 | 8.6 | 93.4 | 87.5 | 6.7 |
| Operating Margin | 23.5% | 28.0% | 29.9% | (21.4) | 0.2 | 0.3 | (24.2) |
| Net Margin | 15.8% | 18.8% | 19.9% | (21.0) | 0.2 | 0.2 | (23.4) |
| EBITDA Margin | 39.2% | 41.9% | 40.6% | (3.3) | 0.4 | 0.4 | (8.0) |
| Investment Program (R$ million) | 85.6 | 37.0 | 28.8 | 197.2 | 148.9 | 79.5 | 87.3 |
Until September 2016, Copel Telecom recorded 16.0% year-on-year increase in operating revenue, totaling R$236.8 million. Operating costs and expenses stood at R$168.9 million, 20.9% up in the period. Copel Telecom recorded net income of R$38.6 million to September 2016, 11.1% lower than in the same period in 2015 (R$43.4 million), while EBITDA moved up 6.7% to R$93.4 million.
In 3Q16, UEG Araucária was not active and presented operating costs and expenses of R$27.6 million, reflecting the plant’s fixed costs in the quarter. Thus, UEG Araucária recorded loss of R$23.0 million versus net income of R$23.1 million in 3Q15. EBITDA was a negative R$20.6 million, while in the same period of 2015 it totaled a positive R$16.4 million. See more details in Exhibit III.
| Main Indicators | 3Q16 | 2Q16 | 3Q15 | Var.% | 9M16 | 9M15 | Var.% |
| (1) | (2) | (3) | (1/3) | (4) | (5) | (4/5) | |
| Net Operating Revenue (R$ million) | 0.3 | 1.4 | 286.6 | (99.9) | 57.4 | 1,406.8 | (95.9) |
| Operating Costs and Expenses (R$ million) | (27.6) | (42.6) | (277.7) | (90.1) | (145.3) | (1,029.2) | (85.9) |
| Operating Income (R$ million) | (23.0) | (28.5) | 32.9 | (170.2) | (65.9) | 419.3 | (115.7) |
| Net Income (R$ million) | (23.0) | (28.5) | 23.1 | (199.6) | (65.9) | 278.4 | (123.7) |
| EBITDA (R$ million) | (20.6) | (35.9) | 16.4 | (225.8) | (70.3) | 402.4 | (117.5) |
| Operating Margin | - | - | 11.5% | - | - | 29.8% | - |
| Net Margin | - | - | 8.1% | - | - | 19.8% | - |
| EBITDA Margin | - | - | 5.7% | - | - | 28.6% | - |
Accounting information concerning Copel’s interests in other companies in 3Q16 is shown in the following table:
* Amountssubject to rounding.
22
Earnings Release 3Q16 |
| R$'000 | ||||
| Partnerships -Sep-16 | Total Assets | Shareholders' | Net Oper. | Net Income |
| Equity | Revenues | |||
| Parent Company (Consolidated) | ||||
| Compagas S.A. | 498,190 | 341,997 | 432,210 | 46,276 |
| Elejor S.A. | 723,332 | 72,052 | 193,536 | 29,193 |
| UEG Araucária Ltda | 751,658 | 677,032 | 57,432 | (65,849) |
| Jointly-controlled entities (Equity in earning) |
|
|
|
|
| Costa Oeste Transmissora de Energia S.A. | 111,375 | 75,471 | 17,214 | 13,488 |
| Caiuá Transmissora de Energia S.A. | 257,369 | 126,463 | 32,863 | 16,364 |
| Cantareira Transmissora S.A | 419,500 | 297,480 | 215,135 | 6,258 |
| Dominó Holdings S.A. | 545,927 | 534,261 | - | 55,066 |
| Guaraciaba Transmissora de Energia (TP Sul) S.A. | 1,275,219 | 760,040 | 255,926 | 9,223 |
| Integração Maranhense Transmissora de Energia S.A. | 516,989 | 256,278 | 57,747 | 31,576 |
| Marumbi Transmissora de Energia S.A. | 183,996 | 119,545 | 32,184 | 20,778 |
| Mata de Santa Genebra Transmissão S.A. | 796,716 | 285,339 | 344,871 | (8,360) |
| Matrinchã Transmissora de Energia (TP Norte) S.A. | 2,628,730 | 1,395,705 | 309,056 | 66,152 |
| Paranaíba Transmissora de Energia S.A. | 1,272,313 | 476,788 | 266,886 | 35,902 |
| Transmissora Sul Brasileira de Energia S.A. | 695,692 | 344,198 | 41,654 | 6,381 |
| Voltalia São Miguel do Gostoso I Participações S.A. | 154,030 | 153,925 | - | 6,479 |
| Associates (Equity in erarning) |
|
|
|
|
| Sanepar | 8,885,513 | 4,306,084 | 2,550,911 | 472,148 |
| Dona Francisca Energética S.A. | 156,021 | 146,125 | 53,092 | 26,161 |
| Foz do Chopim Energética Ltda | 49,028 | 40,393 | 30,778 | 23,692 |
| 1This data was adjusted to Copel's practices. | ||||
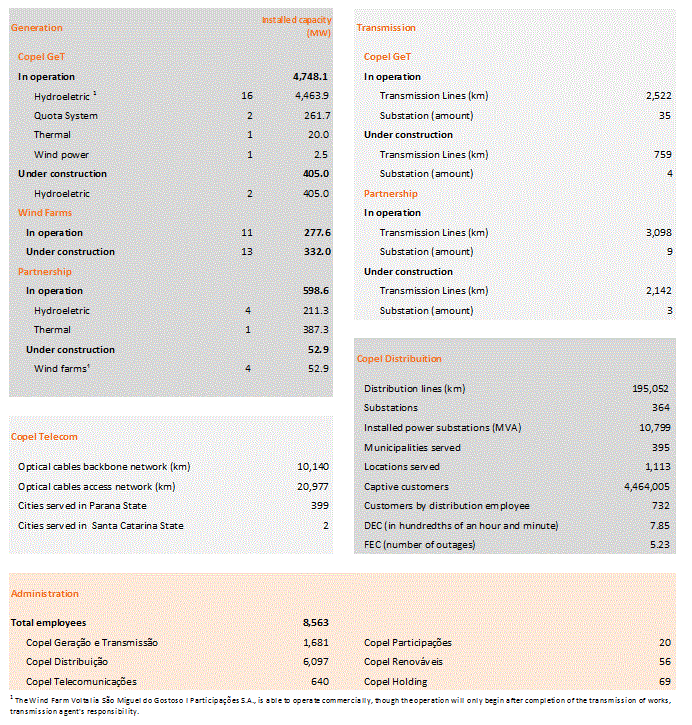
In 9M16 the Company carried out 84.3% of the investments planned for 2016. The following chart shows the investment program carried:
| R$ million | |||
| Subsidiary / SPC | Carried | Carried | Scheduled |
| 3Q16 | 9M16 | 2016 | |
| Copel Geração e Transmissão | 486.3 | 1,565.6 | 1,695.1 |
| HPP Colíder | 46.8 | 153.4 | 120.0 |
| HPP Baixo Iguaçu | 39.7 | 73.8 | 85.6 |
| HPP Gov. Parigot de Souza (GPS) - Leilão nº 12/2015 | 201.2 | 574.8 | 574.8 |
| TL Araraquara / Taubaté | 8.9 | 78.8 | 161.6 |
| SE Paraguaçu Paulista | 0.8 | 8.0 | 6.7 |
| TL Bateias - Curitiba Norte | 0.7 | 29.0 | 11.3 |
| TL Foz do Chopim - Realeza | 17.2 | 44.6 | 34.7 |
| TL Assis - Londrina | 51.3 | 119.9 | 82.8 |
| TL Curitiba Leste / Blumenau | 2.3 | 3.1 | 11.1 |
| Matrinchã Transmissora¹ | - | 67.3 | 21.6 |
| Guaraciaba Transmissora¹ | 11.0 | 74.7 | 74.7 |
| Mata de Santa Genebra Transmissão¹ | - | 120.2 | 190.7 |
| Cantareira Transmissora¹ | 62.3 | 97.4 | 94.3 |
| Paranaíba Transmissora¹ | 12.3 | 19.5 | 7.3 |
| Others | 31.9 | 100.9 | 217.9 |
| Copel Distribuição | 208.8 | 552.7 | 627.0 |
| Copel Telecomunicações* | 85.6 | 148.9 | 176.0 |
| Copel Comercialização | - | - | 0.1 |
| Copel Renováveis | - | - | 1.4 |
| Holding | - | - | 4.1 |
| Copel Brisa Portiguar | 1.4 | 1.4 | 110.2 |
| São Bento Energia | 0.1 | 0.1 | 3.2 |
| Cutia Wind Farm Complex | 128.9 | 456.7 | 601.3 |
| Other Invesment² | - | 3.1 | 18.4 |
| TOTAL | 911.1 | 2,728.4 | 3,236.8 |
| Regarding the participation of Copel in Enterprises. | |||
| ‚Includes Voltalia São Miguel do Gostoso I Participações among others. | |||
| * Budget adequacy according to the minutes of the 156th Ordinary Board of Director's Meeting | |||
* Amountssubject to rounding.
23
Earnings Release 3Q16 |
Copel Distribuição’s captive market energy sales totaled 17,124 GWh between January and September 2016, 5.0% down year-on-year, mainly due to the industrial and commercial segments, as a result of the economic slowdown and the migration of customers to the free market.
In 3Q16, energy consumption in the captive market fell by 9.0%, to 5,288 GWh. The highlight was the residential segment, which recorded growth for the second consecutive quarter compared to 2015.
The following table shows captive market trends by consumption segment:
| Number of Customers | Energy sold (GWh) | |||||||||
| Sep-16 | Sep-15 | Var. % | 3Q16 | 3Q15 | Var. % | 9M16 | 9M15 | Var. % | ||
| Residential | 3,580,622 | 3,501,313 | 2.3 | 1,675 | 1,656 | 1.1 | 5,208 | 5,239 | (0.6) | |
| Industrial | 83,683 | 89,551 | (6.6) | 1,374 | 1,754 | (21.7) | 4,604 | 5,172 | (11.0) | |
| Commercial | 380,354 | 373,827 | 1.7 | 1,160 | 1,308 | (11.3) | 3,862 | 4,159 | (7.1) | |
| Rural | 361,982 | 369,905 | (2.1) | 487 | 505 | (3.4) | 1,654 | 1,708 | (3.2) | |
| Other | 57,364 | 57,174 | 0.3 | 591 | 585 | 1.1 | 1,796 | 1,753 | 2.5 | |
| Captive Market | 4,464,005 | 4,391,770 | 1.6 | 5,287 | 5,808 | (9.0) | 17,124 | 18,031 | (5.0) | |
For more details visit the Notice to the Market - IR 21/16 (link).
Copel Distribuição’s grid market, comprising the captive market, concessionaires and licensees in the state of Paraná, and all free consumers in the Company’s concession area, fell by 1.9% in the third quarter of 2016, as shown in the following table:
| Number of Customers / Agreements | Energy Sold (GWh) | |||||||||
| Sep-16 | Sep-15 | Var. % | 3Q16 | 3Q15 | Var. % | 9M16 | 9M15 | Var. % | ||
| Captive Market | 4,464,005 | 4,391,770 | 1.8 | 5,287 | 5,808 | (9.0) | 17,124 | 18,031 | (5.0) | |
| Concessionaries and Licensees | 6 | 6 | - | 163 | 188 | (13.1) | 524 | 569 | (7.9) | |
| Free Customers ¹ | 447 | 127 | 81.7 | 1,418 | 1,006 | 40.9 | 3,580 | 3,058 | 17.1 | |
| Grid Market | 4,464,458 | 4,391,903 | 1.8 | 6,868 | 7,002 | (1.9) | 21,228 | 21,658 | (2.0) | |
| ¹ All free customers served by Copel GeT and other suppliers at the Copel Distribuição concession area. | ||||||||||
Electricity sales to final consumers, comprising Copel Distribuição’s sales in the captive market and Copel Geração e Transmissão sales in the free market, fell by 8.1% in the third quarter of 2016.
The table below breaks down energy sales by consumption segment:
* Amountssubject to rounding.
24
Earnings Release 3Q16 |
| Segment | Market | Energy Sold (GWh) | |||||
3Q16 | 3Q15 | Var. % | 9M16 | 9M15 | Var. % | ||
| Residential | 1,675 | 1,656 | 1.1 | 5,208 | 5,239 | (0.6) | |
| Total | 2,339 | 2,749 | (14.9) | 7,379 | 8,126 | (9.2) | |
| Industrial | Captive | 1,374 | 1,754 | (21.7) | 4,604 | 5,172 | (11.0) |
| Free | 965 | 995 | (3.0) | 2,775 | 2,954 | (6.1) | |
| Total | 1,160 | 1,311 | (11.5) | 3,864 | 4,168 | (7.3) | |
| Commercial | Captive | 1,160 | 1,308 | (11.3) | 3,862 | 4,159 | (7.1) |
| Free | - | 3 | - | 2 | 9 | (77.8) | |
| Rural | 488 | 505 | (3.4) | 1,654 | 1,708 | (3.2) | |
| Other | 591 | 586 | 0.8 | 1,796 | 1,754 | 2.4 | |
| Energy Supply | 6,253 | 6,807 | (8.1) | 19,901 | 20,995 | (5.2) | |
Total energy sold by Copel in all markets, comprising the sales of Copel Distribuição, Copel Geração e Transmissão and the Wind Farm Complexes, came to 11,235 GWh in the third quarter of 2016, 7.9% higher than in the same period last year. The following table shows Copel’s total electricity sales broken down between Copel Distribuição, Copel Geração e Transmissão and the Wind Farm Complexes:
| Number of Customers / Agreements | Energy Sold (GWh) | |||||||||
| Sep-16 | Sep-15 | Var. % | 3Q16 | 3Q15 | Var. % | 9M16 | 9M15 | Var. % | ||
| Copel DIS | ||||||||||
| Captive Market | 4,464,005 | 4,391,770 | 1.6 | 5,287 | 5,809 | (9.0) | 17,124 | 18,031 | (5.0) | |
| Concessionaries and Licensees | 4 | 4 | - | 151 | 176 | (14.2) | 485 | 527 | (8.0) | |
| CCEE (MCP) | - | - | - | 1,250 | 202 | 518.8 | 2,250 | 377 | 496.8 | |
| Total Copel DIS | 4,464,009 | 4,391,774 | 1.6 | 6,688 | 6,187 | 8.1 | 19,859 | 18,935 | 4.9 | |
| Copel GeT |
|
|
|
|
|
|
|
|
| |
| CCEAR (Copel DIS) | 1 | 1 | - | 38 | 48 | (20.8 | 115 | 170 | (32.4) | |
| CCEAR (other concessionaries) | 39 | 40 | (2.5) | 793 | 1,057 | (25.0 | 2,677 | 3,333 | (19.7) | |
| Free Customers | 27 | 28 | (3.6) | 965 | 998 | (3.3 | 2,778 | 2,963 | (6.2) | |
| Bilateral Agreements ¹ | 33 | 52 | (36.5) | 1,937 | 1,683 | 15.1 | 5,796 | 5,085 | 14.0 | |
| CCEE (MCP) ² | - | - | - | 512 | 139 | 268.3 | 1,395 | 1,807 | (22.8) | |
| Total Copel GeT | 100 | 121 | (17.4) | 4,245 | 3,925 | 8.2 | 12,761 | 13,358 | (4.5) | |
| Wind Farms Complex |
|
|
|
|
|
|
|
|
| |
| CCEAR (other concessionaries) | 112 | 112 | - | 212 | 212 | - | 629 | 553 | 13.7 | |
| CER | 3 | 3 | - | 90 | 90 | - | 268 | 179 | 49.7 | |
| Total Wind Farm Complex | 115 | 115 | - | 302 | 302 | - | 897 | 732 | 22.5 | |
| Total Copel Consolidated | 4,464,224 | 4,392,010 | 1.6 | 11,235 | 10,414 | 7.9 | 33,517 | 33,025 | 1.5 | |
| Note: Not considering the energy from MRE (Energy Relocation Mechanism). | ||||||||||
| ¹ Includes Short Term Sales Agreements. | ||||||||||
| ² Assured Power allocated in the period, does not consider the impact of the GSF. | ||||||||||
| CCEE: Electric Power Trade Chamber / CCEAR: Energy Purchase Agreements in the Regulated Market / MCP: Short Term Market / CER: Agreements Reserve Energy. | ||||||||||
* Amountssubject to rounding.
25
Earnings Release 3Q16 |
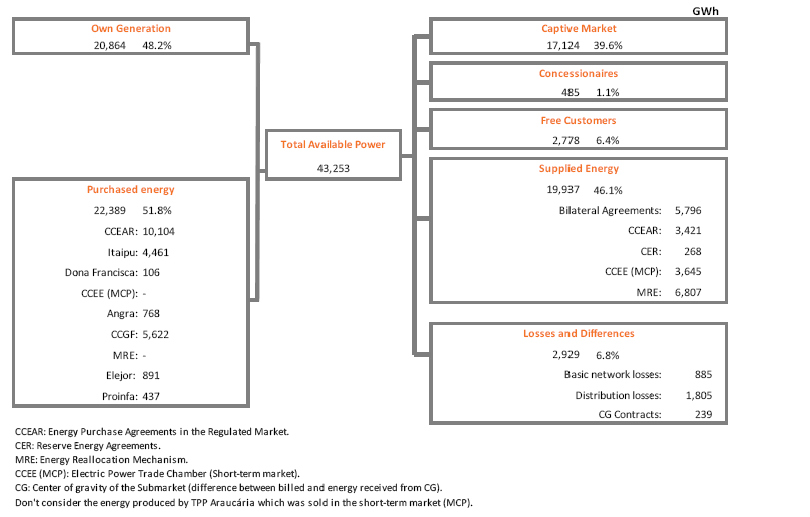
Energy Flow – Copel Dis
GWh
| GWh | |||
Energy Flow - Copel Dis | 9M16 | 9M15 | Var. % |
| Itaipu | 4,461 | 4,445 | 0.4 |
| CCEAR – Copel Geração e Transmissão | 116 | 170 | (31.8) |
| CCEAR – Other | 9,988 | 10,970 | (9.0) |
| CCEAR – Adjustment auction | - | 1,303 | - |
| CCEE (MCP) | - | 398 | - |
| Angra | 768 | 786 | (2.3) |
| CCGF | 5,622 | 2,028 | 177.2 |
| Proinfa | 437 | 438 | (0.2) |
| Elejor S.A | 891 | 887 | 0.5 |
| Available Power | 22,283 | 21,425 | 4.0 |
| Captive market | 17,124 | 18,031 | (5.0) |
| Concessionaries | 485 | 527 | (8.0) |
| CCEE (MCP) | 2,250 | 377 | 496.8 |
| Losses and differences | 2,424 | 2,490 | (2.7) |
| Basic network losses | 380 | 428 | (11.2) |
| Distribution losses | 1,805 | 1,807 | (0.1) |
| CG contract allocation | 239 | 255 | (6.3) |
Energy Flow – Copel GeT
| GWh | |||
Energy Flow - Copel GeT | 9M16 | 9M15 | Var. % |
| Own Generation | 19,960 | 17,939 | 11.3 |
| MRE | - | 144 | - |
| Dona Francisca | 106 | 222 | (52.3) |
| Total Available Power | 20,066 | 18,305 | 9.6 |
| Bilateral Agreements | 5,796 | 5,085 | 14.0 |
| CCEAR – COPEL Distribuição | 116 | 170 | (31.8) |
| CCEAR – Other | 2,676 | 3,334 | (19.7) |
| Free Customers | 2,778 | 2,962 | (6.2) |
| CCEE (MCP) | 1,395 | 1,807 | (22.8) |
| MRE | 6,807 | 4,509 | 51.0 |
| Losses and differences | 498 | 438 | 13.7 |
* Amountssubject to rounding.
26
Earnings Release 3Q16 |
Energy Flow – Wind Farms
| GWh | |||
Energy Flow - São Bento Energia | 9M16 | 9M15 | Var. % |
| Own Generation | 310 | 248 | 25.0 |
| CCEE (MCP) | - | 61 | - |
| Total Available Power | 310 | 309 | 0.3 |
| CCEAR – Other | 286 | 285 | 0.4 |
| Losses and differences | 24 | 24 | - |
| GWh | |||
Energy Flow - Brisa Potiguar | 9M16 | 9M15 | Var. % |
| Own Generation | 594 | 176 | 237.5 |
| CCEE (MCP) | - | 256 | - |
| Total Available Power | 594 | 432 | 37.5 |
| CCEAR – Other | 343 | 268 | 28.0 |
| CER | 268 | 179 | 49.7 |
| Losses and differences | (17) | (15) | 13.3 |
Consolidated Energy Flow (Jan/ Set 2016)
* Amountssubject to rounding.
27
Earnings Release 3Q16 |
Sales to Distributors Average Tariff (CCEARs) – Copel Geração e Transmissão
| R$ / MWh | ||||||
| Tariff | Amount | Sep-16 | Jun-16 | Sep-15 | Var. % | Var. % |
| Average MW | (1) | (2) | (3) | (1/2) | (1/3) | |
| Copel Geração e Transmissão | 305 | 185.79 | 176.93 | 158.10 | 5.0 | 17.5 |
| Auction CCEAR 2008 - 2015 | - | - | - | 141.46 | - | - |
| Auction CCEAR 2009 - 2016 | 200 | 177.20 | 168.95 | 162.87 | 4.9 | 8.8 |
| Auction CCEAR 2011 - 2040 ( HPP Mauá) | 97 | 201.05 | 193.20 | 184.33 | 4.1 | 9.1 |
| Auction CCEAR 2013 - 2042 (Cavernoso II) | 8 | 215.44 | 207.23 | 195.28 | 4.0 | 10.3 |
| Auction - CCEAR 2015 - 2044 (UHE Colíder) | - | 151.69 | 149.32 | 139.96 | 1.6 | 8.4 |
| Copel Distribuição | ||||||
| Concession holders in the State of Paraná | 74 | 217.14 | 279.17 | 272.32 | (22.2) | (20.3) |
| Total / Tariff Weighted Average Supply | 379 | 191.91 | 198.04 | 173.89 | (3.1) | 10.4 |
| With PIS/COFINS. Net of ICMS. |
Power Purchase Average Tariff – Copel Distribuição
| R$ / MWh | ||||||
| Tariff* | Amount | Sep-16 | Jun-16 | Sep-15 | Var. % | Var. % |
| Average MW | (1) | (2) | (3) | (1/2) | (1/3) | |
| Itaipu1 | 641.8 | 183.65 | 187.89 | 320.61 | (2.3) | (42.7) |
| Auction – CCEAR 2008 – 2015 | - | - | - | 143.96 | - | - |
| Auction – CCEAR 2010 – H30 | 69.4 | 210.41 | 195.43 | 192.66 | 7.7 | 9.2 |
| Auction – CCEAR 2010 – T152 | 65.0 | 186.62 | 170.90 | 208.80 | 9.2 | (10.6) |
| Auction – CCEAR 2011 – H30 | 57.5 | 217.82 | 203.83 | 199.58 | 6.9 | 9.1 |
| Auction – CCEAR 2011 – T152 | 54.2 | 225.79 | 202.85 | 336.67 | 11.3 | (32.9) |
| Auction – CCEAR 2012 – T152 | 115.4 | 205.01 | 208.88 | 207.90 | (1.9) | (1.4) |
| Auction – CCEAR 2014 - 2019 ³ | 109.1 | 138.18 | 138.39 | 147.46 | (0.2) | (6.3) |
| Auction – CCEAR 2014 - 20194 | 208.3 | 320.12 | 320.12 | 292.93 | - | 9.3 |
| Auction 2014 - 36M | 122.4 | 176.64 | 176.64 | 159.60 | - | 10.7 |
| Auction 2016 - T20² | 34.2 | 149.15 | 143.71 | - | 3.8 | - |
| Angra | 116.8 | 204.39 | 204.39 | 170.38 | - | 20.0 |
| CCGF5 | 861.2 | 69.27 | 60.49 | 30.31 | 14.5 | 128.5 |
| Santo Antônio | 138.0 | 134.99 | 126.16 | 123.48 | 7.0 | 9.3 |
| Jirau | 229.6 | 118.73 | 110.97 | 106.87 | 7.0 | 11.1 |
| Others Auctions6 | 321.5 | 191.75 | 201.15 | 225.59 | (4.7) | (15.0) |
| Bilaterals | 135.4 | 232.69 | 232.69 | 210.32 | - | 10.6 |
| Total / Tariff Average Supply | 3,279.8 | 159.79 | 157.74 | 183.18 | 1.3 | (12.8) |
| 1Furnas transport charge not included. | ||||||
| 2Average auction price restated according as bilateral payment to vendors. It does not include hiring effects recorded by the CCEE. | ||||||
| ³ Energy Agreements. | ||||||
| 4Capacity Agreements. | ||||||
| 5Contract of quotas of assured power of those HPPs which concessions were extended pursuant the new rules of Law 12783/13. | ||||||
| 6Products average price. | ||||||
| *The table has been updated for all periods as new calculation methodology for average prices, a result of the 4th phase of the Public Hearing 78/2011 | ||||||
| Aneel approved on 03.28.2016. | ||||||
| With PIS/COFINS. | ||||||
Sales to Final Customers Average Tariff Copel Distribuição – without ICMS
* Amountssubject to rounding.
28
Earnings Release 3Q16 |
| R$ / MWh | |||||
| Tariff¹ | Sep-16 | Jun-16 | Sep-15 | Var. % | Var. % |
| (1) | (2) | (3) | (1/2) | (1/3) | |
| Industrial | 366.98 | 417.12 | 418.28 | (12.0) | (12.3) |
| Residential | 421.41 | 491.71 | 492.11 | (14.3) | (14.4) |
| Commercial | 408.88 | 467.13 | 462.49 | (12.5) | (11.6) |
| Rural | 285.90 | 314.51 | 316.44 | (9.1) | (9.7) |
| Other | 306.14 | 350.98 | 357.86 | (12.8) | (14.5) |
| Retail distribution average rate | 379.04 | 433.87 | 433.92 | (12.6) | (12.6) |
| ¹ Does not consider tariff flags. Net of ICMS. |
Copel’s capital amounts to R$6,910.0 million, represented by shares with no par value. The Company's current number of shareholders is 25,151. In September 2016 the Company’s capital was as follows:
| Thousand shares | ||||||||
| Shareholders | Common | % | Preferred "A" | % | Preferred "B" | % | TOTAL | % |
| State of Paraná | 85,029 | 58.6 | - | - | - | - | 85,029 | 31.0 |
| BNDESPAR | 38,299 | 26.4 | - | - | 27,282 | 21.3 | 65,581 | 24.0 |
| Eletrobras | 1,531 | 1.1 | - | - | - | - | 1,531 | 0.6 |
| Free Floating | 19,874 | 13.7 | 77 | 23.4 | 100,964 | 78.7 | 120,915 | 44.2 |
| BM&FBovespa | 18,610 | 12.8 | 77 | 23.4 | 64,949 | 50.6 | 83,636 | 30.6 |
| NYSE | 1,264 | 0.9 | - | - | 35,932 | 28.0 | 37,196 | 13.6 |
| LATIBEX | - | - | - | - | 83 | 0.1 | 83 | - |
| Other | 298 | 0.2 | 252 | 76.6 | 49 | - | 599 | 0.2 |
| TOTAL | 145,031 | 100.0 | 329 | 100.0 | 128,295 | 100.0 | 273,655 | 100.0 |
* Amountssubject to rounding.
29
Earnings Release 3Q16 |
| Stock Performance (Jan - Sep/16 | Common | Preferred "B" | |||
| (CPLE3 / ELPVY) | (CPLE6 / ELP / XCOP) | ||||
| Total | Daily average | Total | Daily average | ||
| BM&FBovespa | Number of Trades | 15,034 | 119 | 533,654 | 4,235 |
| Volume Traded | 4,692,200 | 37,240 | 96,981,600 | 769,695 | |
| Trading Value (R$ thousand) | 79,078 | 628 | 2,484,011 | 19,714 | |
| Presence in Trading Sessions | 126 | 100% | 126 | 100% | |
| Volume Traded | 359,565 | 3,745 | 65,960,903 | 519,377 | |
| NYSE | Trading Value (US$ thousand) | 1,462 | 15 | 476,945 | 3,755 |
| Presence in Trading Sessions | 96 | 74% | 127 | 98% | |
| Volume Traded | - | - | 182,846 | 2,344 | |
| LATIBEX | Trading Value (Euro thousand) | - | - | 1,014 | 13 |
| Presence in Trading Sessions | - | - | 78 | 60% | |
In 9M16, the free float accounted for 44.2% of the Company’s capital. Copel’s market capitalization, based on the stock prices on all markets at the end of September 2016, was R$7,395.1 million. Out of the 66 stocks that make up the Ibovespa index, Copel’s class B preferred shares accounted for 0.4% of the portfolio, with a Beta index of 1.1. Copel also accounted for 7.1% of the BM&FBovespa’s Electric Power Index (IEE). In the Corporate Sustainability Index (ISE), Copel class B preferred shares accounted for 1.0%.
Copel’s common shares (ON - CPLE3) and class B preferred shares (PNB - CPLE6) were traded in 100% of the trading sessions of the São Paulo Stock Exchange (BM&FBovespa). Copel’s common and class B preferred shares closed the period at R$21.15 and R$33.63, with a positive variation of 32.2% and 38.4% respectively. In the same period the Ibovespa had positive change of 34.6%. On the New York Stock Exchange (NYSE), class B preferred shares, represented by American Depositary Shares (ADSs), were traded at Level 3, under the ticker ELP, in 98% of the trading sessions and closed the period at US$10.37, with a positive variation of 76.7%. Over this period, the Dow Jones Index positive by 5.1%.
On the Latibex (the Euro market for Latin American securities on the Madrid Stock Exchange), Copel’s class B preferred shares were traded under the ticker XCOP in 60% of the trading sessions and closed theperiodat €9.45,with a positive variation of 73.1%. In the same period the Latibex All Shares index had positive growth of 49.7%.
* Amountssubject to rounding.
30
Earnings Release 3Q16 |
The table below summarizes Copel’s share prices in 9M16.
| Ticker / Index | Price / Points | Var. (%) | ||
| 09.30.2016 | 12.31.2015 | |||
| BM&FBovespa | CPLE3 | R$ 21.15 | R$ 16.00 | 32.2 |
| CPLE6 | R$ 33.63 | R$ 24.30 | 38.4 | |
| Ibovespa | 58,367 | 43,350 | 34.6 | |
| NYSE | ELP | US$ 10.37 | US$ 5.87 | 76.7 |
| Dow Jones | 18,308 | 17,425 | 5.1 | |
| LATIBEX | XCOP | € 9.45 | € 5.46 | 73.1 |
| Latibex | 1,585 | 1,059 | 49.7 | |
The table below presents the payments of dividends and interest on own capital as of 2011:
| Type of Earning | Thousands of R$ | R$ per Share | |||||
| Fiscal Year | Approved on | Paid on | (gross) | Common | Preferred "A" | Preferred "B" | |
| Total | 2011 | 421,091 | 1.46833 | 2.52507 | 1.61546 | ||
| IOC¹ | 2011 | 08/11/11 | 09/15/11 | 225,814 | 0.78803 | 0.86706 | 0.86706 |
| IOC | 2011 | 04/26/12 | 05/29/12 | 195,277 | 0.68030 | 1.65801 | 0.74840 |
| Total | 2012 | 268,554 | 0.93527 | 2.52507 | 1.02889 | ||
| IOC¹ | 2012 | 12/19/12 | 01/15/13 | 138,072 | 0.47920 | 2.52507 | 0.52720 |
| Dividends | 2012 | 04/25/13 | 05/23/13 | 130,482 | 0.45607 | - | 0.50169 |
| Total | 2013 | 560,537 | 1.95572 | 2.52507 | 2.15165 | ||
| IOC¹ | 2013 | 11/13/13 | 12/16/13 | 180,000 | 0.62819 | 0.69111 | 0.69111 |
| Dividends¹ | 2013 | 11/13/13 | 12/16/13 | 145,039 | 0.50617 | 0.55688 | 0.55688 |
| Dividends | 2013 | 04/24/14 | 05/28/14 | 235,498 | 0.82136 | 1.27708 | 0.90366 |
| Total | 2014 | 622,523 | 2.17236 | 2.52507 | 2.39000 | ||
| IOC¹ | 2014 | 10/24/14 | 11/21/14 | 30,000 | 0.10469 | 0.11519 | 0.11519 |
| Dividends¹ | 2014 | 10/24/14 | 11/21/14 | 350,770 | 1.22416 | 1.34678 | 1.34678 |
| Dividends | 2014 | 04/23/15 | 06/22/15 | 241,753 | 0.84351 | 1.06310 | 0.92803 |
| Total | 2015 | 326,795 | 1.13716 | 2.52507 | 1.25473 | ||
| IOC | 2015 | 04/28/16 | 06/15/16 | 198,000 | 0.68748 | 2.10511 | 0.76022 |
| Dividends | 2015 | 04/28/16 | 06/15/16 | 128,795 | 0.44968 | 0.41996 | 0.49451 |
| ¹ In advance |
* Amountssubject to rounding.
31
Earnings Release 3Q16 |
Assets in Operation
Copel Geração e Transmissão
Below is the main information of Copel GeT’s power station and the power produced in 9M16.
| Power Plants | Installed | Assured Power | Generation | Concession |
| Capacity (MW) | (Average MW) | (GWh) | Expires | |
| Hydroelectric Power Plants | 4,463.9 | 1,943.4 | 19,913.6 |
|
| HPP Gov. Bento Munhoz da Rocha Netto (Foz do Areia) | 1,676.0 | 576.0 | 6,135.4 | 09.17.2023 |
| HPP Gov. Ney Aminthas de Barros Braga (Segredo) | 1,260.0 | 603.0 | 6,140.3 | 11.15.2029 |
| HPP Gov. José Richa (Salto Caxias) | 1,240.0 | 605.0 | 6,169.4 | 05.04.2030 |
| HPP Mauá(1) | 185.2 | 100.8 | 1,097.9 | 07.02.2042 |
| HPP Guaricana | 36.0 | 16.1 | 121.7 | 08.16.2026 |
| SHP Cavernoso II(2) | 19.0 | 10.6 | 36.1 | 02.27.2046 |
| HPP Chaminé | 18.0 | 11.6 | 105.1 | 08.16.2026 |
| HPP Apucaraninha | 10.0 | 6.7 | 18.0 | 10.12.2025 |
| HPP Derivação do Rio Jordão | 6.5 | 5.9 | 36.4 | 11.15.2029 |
| HPP Marumbi | 4.8 | 2.4 | 15.3 | (3) |
| HPP São Jorge | 2.3 | 1.5 | 12.2 | 12.03.2024 |
| HPP Chopim I | 2.0 | 1.5 | 10.4 | (4) |
| HPP Cavernoso | 1.3 | 1.0 | 5.0 | 01.07.2031 |
| SHP Melissa | 1.0 | 0.6 | 4.8 | (4) |
| SHP Salto do Vau | 0.9 | 0.6 | 5.0 | (4) |
| SHP Pitangui | 0.9 | 0.1 | 0.9 | (4) |
| Thermal Power Plant | 20.0 | 10.3 | 41.9 |
|
| TTP Figueira | 20.0 | 10.3 | 41.9 | 03.26.2019 |
| Wind Energy Plants | 2.5 | 0.5 | 2.4 |
|
| UEE Eólica de Palmas(5) | 2.5 | 0.5 | 2.4 | 09.28.2029 |
| TOTAL | 4,486.4 | 1,954.2 | 19,957.9 | |
| (1) Refered to COPEL's participation (51% of power plant capacity of 363 MW). | ||||
| (2) Plant resumes commercial operation in June 2016. | ||||
| (3) Submitted to ANEEL for ratification. | ||||
| (4) Power plants with no concession agreement, only required to be registered at ANEEL. | ||||
| (5) Average wind plant generation. | ||||
In addition, Copel GeT operates two plants under the quota system, as shown below:
Power Plants - Quota System | Installed | Assured Power | Service Provision Revenue² | Service Provision Revenue² | Granting Fee | Concession |
| Capacity (MW) | (Average MW) | (jul.15 - jun.16) | (jul.16 - jun.17) | (R$ million) | Expires | |
| (R$ million) | (R$ million) | |||||
| HPP Gov. Pedro Viriato Parigot de Souza (GPS)¹ | 260.0 | 109.0 | 130.9 | 126.7 | 574.8 | 01.05.2046 |
| HPP Rio dos Patos³ | 1.7 | 1.0 | 0.6 | 0.6 | - | - |
| TOTAL | 261.7 | 110.0 | 131.5 | 127.3 | 574.8 | |
| (1)The energy generated by the plant will be allocated 100% in the physical guarantee of quota system in 2016, and 70% from 1 January 2017, and to that portion of energy, Copel GeT will not bear the hydrological risks or with the financial resultsof the MRE associated with the plant. | ||||||
| (2)The RAG the periodJul.15 - Jun.16 refers to the allocation of 100% of Physical security in the quota regime. Adjusted annually by the IPCA. | ||||||
| (3)The concession won in 14.2.2014, however, the Company will remain responsible for providing operation and maintenance services until the winning bidder takes the plant. In this period the Company will receive a preset fee for the service. | ||||||
* Amountssubject to rounding.
32
Earnings Release 3Q16 |
Wind Complex
Copel has 11 wind farms in commercial operation, which generated 904.6 GWh in 9M16, as shown in the following chart:
| Wind Farm | Auction ¹ | Installed | Assured Power | Generation | Price ² | Expiration of | |
| Capacity (MW) | (Average MW) | (GWh) | Authorization | ||||
| São Bento Energia, Invest. e Part. S.A. | 94.0 | 46.3 | 309.9 | 204.89 | |||
| GE Boa Vista S.A. | 2nd LFA (08.26.2010) | 14.0 | 6.3 | 41.2 | 210.18 | 04.27.2046 | |
| GE Olho D’Água S.A. | 30.0 | 15.3 | 106.0 | 204.06 | 05.31.2046 | ||
| GE São Bento do Norte S.A. | 30.0 | 14.6 | 97.8 | 204.06 | 05.18.2046 | ||
| GE Farol S.A. | 20.0 | 10.1 | 64.9 | 204.06 | 04.19.2046 | ||
| Copel Brisa Potiguar S.A. | 183.6 | 92.6 | 594.7 | 179.36 | |||
| Nova Asa Branca I Energias Renováveis S.A. | 2nd LFA (08.26.2010) | 27.0 | 13.2 | 87.6 | 206.24 | 04.27.2046 | |
| Nova Asa Branca II Energias Renováveis S.A. | 27.0 | 12.8 | 84.6 | 206.24 | 05.31.2046 | ||
| Nova Asa Branca III Energias Renováveis S.A. | 27.0 | 12.5 | 91.5 | 206.24 | 05.31.2046 | ||
| Nova Eurus IV Energias Renováveis S.A. | 27.0 | 13.7 | 85.0 | 206.24 | 04.27.2046 | ||
| Santa Maria Energias Renováveis S.A. | 4th LER (08.18.2011) | 29.7 | 15.7 | 92.1 | 144.87 | 05.01.2047 | |
| Santa Helena Energias Renováveis S.A. | 29.7 | 15.7 | 97.3 | 144.87 | 04.19.2047 | ||
| Ventos de Santo Uriel S.A. | 16.2 | 9.0 | 56.7 | 143.74 | 04.19.2047 | ||
| Total | 277.6 | 138.9 | 904.6 | 187.87 | |||
| ¹ LFA - Auction of Alternative Sources/ LER - Auction Reserve Energy. | |||||||
| ² Price updated to September 2016. | |||||||
Interest in Generation Projects
Copel holds interests in seven power generation projects at the operational stage, with a total installed capacity of 890.2 MW, 602.9 MW referred to Copel´s stake, as shown below:
| Company | Installed Capacity | Assured Power | Partners | PPA signed with | Concession |
| (MW) | (Average MW) | Expires | |||
| COPEL - 20% | |||||
| TPP Araucária | 484.1 | 365.2 | COPEL GeT - 60% | ¹ | 12.22.2029 |
| (UEG Araucária) | Petrobras - 20% | ||||
| HPP Santa Clara | COPEL - 70% | COPEL Dis | |||
| (Elejor) | 123.4 | 72.4 | Paineira Participações - 30% | Free customers | 05.28.2037 |
| SHP Santa Clara I | 3.6 | 2.8 | COPEL - 70% | Free customers | |
| (Elejor) | Paineira Participações - 30% | 12.18.1932 | |||
| HPP Fundão | 122.5 | 67.9 | COPEL - 70% | COPEL Dis | |
| (Elejor) | Paineira Participações - 30% | Free customers | 05.28.2037 | ||
| SHP Fundão I | 2.5 | 2.1 | COPEL - 70% | Free customers | 12.18.1932 |
| (Elejor) | Paineira Participações - 30% | ||||
HPP Dona Francisca (DFESA) | COPEL - 23.03% | COPEL GeT | |||
125.0 | 78.0 | Gerdau - 51.82% | Gerdau | ||
| Celesc - 23.03% | Celesc | 08.27.2033 | |||
| Desenvix - 2.12% | Desenvix | ||||
| SHP Arturo Andreoli | 29.1 | 20.4 | COPEL - 35.77% | Free customers | 04.23.2030 |
| (Foz do Chopim) | Silea Participações - 64.23% | ||||
| ¹ Since February 1, 2014, the plant’s operation has been under the responsibility of UEGA. The Araucária TPP does not have availability agreements and operates under the merchantmodel. | |||||
* Amountssubject to rounding.
33
Earnings Release 3Q16 |
Interest in Wind Farms
Copel has 49% interest in the Voltalia São Miguel do Gostoso I Participações S.A. wind farm complex, in the State of Rio Grande do Norte.Whose energy was sold in the Fourth Reserve Energy Auction by under twenty-year contracts, with supply beginning in July, 2015.
| Wind Farm | Installed Capacity¹ | Assured Power | Price² | Start up | Stake (%) | Wind farm | Expiration of |
| (MW) | (Average MW) | location | Authorization | ||||
| Voltalia - São Miguel do Gostoso I Participações S.A. ³ | |||||||
| Carnaúbas | 27.0 | 13.1 | 140.52 | Jul-15 | 49% COPEL 51% Voltalia | 04.08.2047 | |
| Reduto | 27.0 | 14.4 | São Miguel do | 04.15.2047 | |||
| Santo Cristo | 27.0 | 15.3 | Gostoso (RN) | 04.17.2047 | |||
| São João | 27.0 | 14.3 | 03.25.2047 | ||||
| Total | 108.0 | 57.1 | 140.52 | ||||
| ¹ The capacity envisaged in the Auction was altered based on the characteristics of Acciona Windpower’s equipment, respecting the volume of energy sold. | |||||||
| ² Price updated to September 2016. | |||||||
| ³ Developments apt for commercial operations, waiting for completion of transmission of works. | |||||||
The construction works of these wind farms were concluded in April 2015 and they have been prepared to operate since then. However, commercial operations will only begin after completion of the works in the transmission facilities (ICG Touros), under the responsibility of the transmission agent, which is scheduled for 2017.
Under Construction
Copel Geração e Transmissão
Copel GeT is building two hydroelectric power plants that will add 405 MW to its total installed capacity, as described below.
| Power Plants | Contract | Installed Capacity | (Average MW) | Energy Sold in the | Supply Start | Price¹ | CAPEX² | Concession |
| (MW) | (Average MW) | (R$/MWh) | (R$ million) | Expires | ||||
| HPP Colíder | 01/2011 | 300 | 179.6 | 125.0 | 01.01.2015 | 157.56 | 2,153.0 | 01.16.1946 |
| 100% Copel GeT | de 01.17.2011 | |||||||
| HPP Baixo Iguaçu | 02/2012 de 08.20.2012 | |||||||
| 30% Copel GeT | 350 | 172.8 | 121.0 | 09.27.2018³ | 163.97 | 657.6 | 08.19.1947 | |
| 70% Geração Céu Azul S.A | ||||||||
| Total³ | 650 | 352.4 | ||||||
| ¹ Adjusted by the IPCA up to September 2016. Font: CCEE. | ||||||||
| ² Adjusted for Copel's stake. | ||||||||
| ³ According to 2nd Amendment to the Concession Agreement, which including 756 days waiver of responsibility. | ||||||||
Colíder Hydroelectric Power Plant
Around 91% of the works are complete. As a result of force majeure and government acts during the implementation of the Colíder Hydroelectric Power Plant, Copel Geração e Transmissão requested with Aneel a waiver of responsibility, totaling 644 days, related to the delay in the plant’s startup, initially scheduled for December 30, 2014, however, Aneel rejected the administrative claim filed by Copel GeT keeping unchanged the implementation and supply schedules and other obligations contained in the Energy TradingAgreements in the Regulated Environment associated with the plant. The Company filed a request for reconsideration of the order and awaiting trial. The entry into operation of the plant is scheduled for the 2nd half 2017.
* Amountssubject to rounding.
34
Earnings Release 3Q16 |
Since October 2015 the Company has an injunction determining that Aneel refrains from imposing the Company, until the Administrative Case No. 48500.000623 / 2015 is examined,any and all onus of Concession Agreement.
Baixo Iguaçu Hydroelectric Power Plant
As a result of act of government, fortuitous event and force majeure, the commercial start-up of generation unit 1 is scheduled for November 1, 2018, while units 2 and 3 should begin operations in December 2018 and January 2019. The construction works are on schedule and the wall for the rerouting of their river has been concluded, while the powerhouses and spillway assembly works are moving ahead.
Copel Renováveis
Wind Farm Complex
Copel Renováveis is expanding its energy generation matrix with renewable sources by building wind farm complexes in the State of Rio Grande do Norte, consisting of 13 projects with a total installed capacity estimated at 332.0 MW, as follows:
| Wind Farm | Auction ¹ | Installed Capacity (MW) ² | Assured Power (Average MW) | Price ³ | Start up | CAPEX (R$ million) | Premium Value (R$ million) | Wind farm location | Expiration of Authorization |
| UEE Cutia S.A. | 6th LER(10/31/2014) | 25.2 | 9.6 | 170.32 | Oct-17 | 201.6 | 9.4 | Pedra Grande | 01.04.2042 |
| UEE Guajiru S.A. | 21.6 | 8.3 | 170.32 | 131.4 | Pedra Grande | 01.04.2042 | |||
| UEE Esperança do Nordeste S.A. | 30.0 | 9.1 | 170.32 | 168.6 | São Bento do Norte | 05.10.2050 | |||
| UEE Jangada S.A. | 30.0 | 10.3 | 170.32 | 172.3 | São Bento do Norte | 01.04.2042 | |||
| UEE Maria Helena S.A. | 30.0 | 12.0 | 170.32 | 173.9 | São Bento do Norte | 01.04.2042 | |||
| UEE Paraíso dos Ventos do Nordeste | 30.0 | 10.6 | 170.32 | 172.3 | São Bento do Norte | 05.10.2050 | |||
| UEE Potiguar S.A. | 28.8 | 11.5 | 170.32 | 172.1 | São Bento do Norte | 05.10.2050 | |||
| CGE São Bento do Norte I S.A. | 20th LEN (11/28/2014) | 24.2 | 9.7 | 161.18 | Jan-19 | 154.4 | 14.2 | São Bento do Norte | 08.03.2050 |
| CGE São Bento do Norte II S.A. | 24.2 | 10.0 | 161.18 | 154.9 | São Bento do Norte | 08.03.2050 | |||
| CGE São Bento do Norte III S.A. | 22.0 | 9.6 | 161.18 | 154.8 | São Bento do Norte | 08.03.2050 | |||
| CGE São Miguel I S.A. | 22.0 | 8.7 | 161.18 | 140.5 | São Bento do Norte | 08.03.2050 | |||
| CGE São Miguel II S.A. | 22.0 | 8.4 | 161.18 | 142.8 | São Bento do Norte | 08.03.2050 | |||
| CGE São Miguel III S.A. | 22.0 | 8.4 | 161.18 | 140.6 | São Bento do Norte | 08.03.2050 | |||
| Total | 332.0 | 126.2 | 166.35 | 2,080.2 | 23.6 | ||||
| ¹ Types of auctions: LER - Auction Reserve Energy / LEN - New Energy Auction. | |||||||||
| ² The installed capacity of the new projects can be optimized in relation to the registered at auctions. | |||||||||
| 3Price updated to September 2016. | |||||||||
* Amountssubject to rounding.
35
Earnings Release 3Q16 |
Assets in Operation
The chart below shows the transmission concession agreements and the design of the substations park and the transmission lines in operation:
| Subsidiary / SPC | Contract | Enterprise | TL | Substation | APR ¹ (R$ million) | Concession Expiration | |
| Extension (km) | Amount | MVA | |||||
| Copel GeT | 060/20012 | Several | 2,021 | 32 | 12,202 | 192.1 | 12.31.2042 |
| Copel GeT | 075/20013 | TL Bateias - Jaguariaiva | 137 | - | - | 19.1 | 08.16.2031 |
| Copel GeT | 006/2008 | TL Bateias - Pilarzinho | 32 | - | - | 1.0 | 03.16.2038 |
| Copel GeT | 027/2009 | TL Foz - Cascavel Oeste | 116 | - | - | 11.2 | 11.18.2039 |
| Copel GeT | 015/2010 | Cerquilho III Substation | - | 1 | 300 | 4.5 | 10.05.2040 |
| Copel GeT | 022/2012 | TL Foz do Chopim - Salto Osório LT Londrina - Figueira | 102 | - | - | 5.6 | 08.26.2042 |
| Copel GeT | 002/2013 | TL Assis — Paraguaçu Paulista II | 83 | 1 | 150 | 7.7 | 02.24.2043 |
| Copel GeT | 005/2014 | TL Bateias - Curitiba Norte | 31 | 1 | 300 | 8.4 | 01.28.2044 |
| Subtotal Copel GeT4 | 2,522 | 35 | 12,952 | 249.7 | |||
| Costa Oeste Copel GeT - 51% Eletrosul - 49% | 001/2012 | TL Cascavel Norte - Cascavel Oeste TL Cascavel Norte - Umuarama Sul Umuarama Sul Substation | 159 | 1 | 300 | 6.5 | 01.11.2042 |
| Transm. Sul Brasileira Copel GeT - 20% Eletrosul - 80% | 004/2012 | TL Nova Sta Rita - Camaquã | 798 | 1 | 166 | 13.6 | 05.09.2042 |
| Caiuá Transmissora Copel GeT - 49% Elecnor - 51% | 007/2012 | TL Guaíra - Umuarama Sul TL Cascavel Norte - Cascavel Oeste Santa Quitéria Substation / Cascavel Norte Substation | 142 | 2 | 700 | 12.0 | 05.09.2042 |
| Integração Maranhense Copel GeT - 49% Elecnor - 51% | 011/2012 | TL Açailandia - Miranda II | 365 | - | - | 18.0 | 05.09.2042 |
| Marumbi Copel GeT - 80% Eletrosul - 20% | 008/2012 | TL Curitiba - Curitiba Leste | 29 | 1 | 672 | 14.3 | 05.09.2042 |
| Matrinchã Copel GeT - 49% State Grid - 51% | 012/2012 | TL Paranaíta - Ribeirãozinho | 1,005 | 3 | - | 94.2 | 05.09.2042 |
| Guaraciaba Copel GeT - 49% State Grid - 51% | 013/2012 | LT Ribeirãozinho - Marimbondo | 600 | 1 | - | 48.7 | 05.09.2042 |
| Subtotal SPCs5 | 3,098 | 9 | 1,838 | 207.3 | |||
| Total | 5,620 | 44 | 14,790 | 457.0 | |||
| 1Proportion to the participation of Copel in the venture. Updated according to Aneel Aproval Resolution No. 2,098/2016 06.28.2016 | |||||||
| 2Renewed contract pursuant to Law 12,783/13. | |||||||
| 3From the 10.31.2018 APR will be reduced 50%. | |||||||
| 4Consolidated Income. | |||||||
| 5Equity in Earning of Subsidiaries. | |||||||
Assets under Construction
Copel GeT is substantially increasing its share of the transmission segment through own investments and partnerships in SPCs. The projects have a joint total of 2,901 km of transmission lines and 7 substations and will generate APR of R$345.4 million of which refers to Copel Get stake. Copel’s interest in the transmission projects is available in the table below.
* Amountssubject to rounding.
36
Earnings Release 3Q16 |
| Subsidiary / SPC | Auction | Signing of Contract | Enterprise | State | km Subst | APR¹ (R$ million) | CAPEX² (R$ million) | Start up | Concession Expiration | |
| Copel GeT | 001/10 | Oct-10 | TL Araraquara II — Taubaté | SP | 356 | - | 27.4 | 434.3 | Apr-17 | 10.05.2040 |
| Copel GeT | 001/14 | Sep-14 | TL Foz do Chopim - Realeza | PR | 53 | 1 | 7.0 | 57.0 | Mar-17 | 09.04.2044 |
| Copel GeT | 001/14 | Sep-14 | TL Assis – Londrina | SP / PR | 120 | - | 18.3 | 151.0 | Sep-17 | 09.04.2044 |
| Copel GeT | 005/15 | Apr-16 | TL Curitiba Leste - Blumenau | PR / SC | 230 | 3 | 104.8 | 560.9 | Mar-21 | 04.06.2046 |
| TL Baixo Iguaçu - Realeza | 0.0 | Sep-19 | ||||||||
| Subtotal Copel GeT | 759 | 4 | 157.5 | 1,203.1 | - | |||||
| Paranaíba Copel GeT - 24,5% Furnas - 24,5% State Grid - 51% | 007/12 | May-13 | TL Barreiras II - Pirapora II | BA / MG / GO | 967 | - | 32.1 | 248.4 | Nov-16 | 05.01.2043 |
| Mata de Santa Genebra Copel GeT - 50,1% Furnas - 49,9% | 007/13 | May-14 | TL Araraquara II - Bateias | SP / PR | 847 | 3 | 109.9 | 782.1 | Nov-17 | 05.13.2044 |
| Cantareira Copel GeT - 49% Elecnor - 51% | 001/14 | Sep-14 | TL Estreito - Fernão Dias | SP / MG | 328 | - | 45.9 | 408.9 | Mar-18 | 09.04.2044 |
| Subtotal SPC | 2,142 | 3 | 187.9 | 1,439.4 | ||||||
| Total | 2,901 | 7 | 345.4 | 2,642.5 | ||||||
| ¹ Updated according to Aneel Ratification Resolution 1918/2015 / Adjusted for Copel’s stake. | ||||||||||
| ² Adjusted for Copel’s stake. | ||||||||||
Concession agreement
In December 2015, the Company signed the fifth amendment to the Public Electricity Distribution Concession Agreement no. 46/1999 of Copel Distribuição S.A., extending the concession term to July 7, 2045.
The concession agreement imposes economic and financial efficiency and quality conditions. Failure to comply with the conditions for two consecutive years or any of the limits at the end of the first five years will result in the termination of the concession. From the sixth year following execution of the agreement, any breach of quality criteria for three consecutive years or economic and financial management criteria for two consecutive years will result in the opening of a forfeiture process. In addition, noncompliance with the overall goals of collective continuity indicators for two consecutive years or three times in five years may limit the payment of dividends or interest on equity, while failure to meet the economic and financial sustainability indicators will reflect the need for a capital contribution from the controlling shareholders. The following chart shows the goals set for Copel Distribuição in the first 5 years of renovation:
* Amountssubject to rounding.
37
Earnings Release 3Q16 |
| Year | Economic and Financial Management | Quality (Limit Established)1 | |
| DECi² | FECi² | ||
| 2016 | 13.61 | 9.24 | |
| 2017 | EBITDA4=0 | 12.54 | 8.74 |
| 2018 | EBITDA4(-)QRR³=0 | 11.23 | 8.24 |
| 2019 | {Net Debt / [EBITDA4(-)QRR³]} =1/(0.8*SELIC5) | 10.12 | 7.74 |
| 2020 | {Net Debt / [EBITDA4(-)QRR³]} =1/(1.11*SELIC5) | 9.83 | 7.24 |
| 1According to Aneel’s Technical Note No. 0335/2015 | |||
| ² DECi – Equivalent Time of Interruption Caused by Internal Source per Consumer Unit; and FECi – Equivalent Frequency of Interruption Caused byInternal Source per Consumer Unit. | |||
| ³ QRR: Regulatory Reintegration Quota or Regulatory Depreciation Expense. It will be the value set in the last Periodic Tariff Review - RTP, plus theIGP-M between the month prior to the RTP and the month prior to the period of twelve (12) months of the determination of economic andfinancial sustainability. In June/2016 set value was R$333.8 million. | |||
| 4EBITDA adjusted for the effects of post-employment benefits, provisions and PDV. | |||
| 5Selic: limited to 12.87% p.y. | |||
Operating Data
In the distribution business, Copel serves more than 4.4 million energy consumers in 1,113 locations, belonging to 394 municipalities in State of Paraná and one in the State of Santa Catarina. Copel Distribuição operates and maintains the installations in the 13.8 kV, 34.5 kV, 69 kV, 138 kV and some of 230 kV voltage levels.
| Voltage | Km | Substations | MVA |
| 13.8 kV | 104,312 | - | - |
| 34.5 kV | 83,841 | 224 | 1,470 |
| 69 kV | 643 | 36 | 2,420 |
| 88 kV1 | - | - | 5 |
| 138 kV | 6,028 | 104 | 6,904 |
| 230 kV | 228 | - | - |
| Total | 195,052 | 364 | 10,799 |
| 1Not automated. |
Compact-Design Distribution Lines
Copel Distribuição has continued to implement compact-design distribution lines in urban areas with a high concentration of trees surrounding the distribution grids. This technology reduces the number of trees cut down or trimmed, and improves the quality of power supply by reducing the number of unplanned outages. The total length of compact-design distribution lines in operation in September 2016 was 8,657 km.
Secondary Isolated Lines
Copel Distribuiçãohas also invested in low-voltage (127/220V) secondary isolated lines, which offer substantial advantages over regular overhead lines, including: improvement in DEC and FEC distribution performance indicators, defense against illegal connections, improved environmental conditions, reduced areas subject to tree trimming, improved safety, reduced voltage drops throughout the grid, and increased transformer usefullife, due to the reduction of short-circuits, among other advantages. The total length of installed secondary isolated lines closed September 2016 at 15,890 km.
* Amountssubject to rounding.
38
Earnings Release 3Q16 |
Quality of Supply
The two main indicators of power supply quality are DEC (outage duration) and FEC (outage frequency). The more severe weather events compared to previous years contributed to increasing outage duration and frequency indicators (DEC and FEC, respectively) in 2014 and 2015. The trends for these indicators, as well as for total time service, are shown below:
| Jan-Sep | DEC ¹ (hours) | FEC ² (outages) | Total time service (hours) |
| 2012 | 7.00 | 5.60 | 1:38 |
| 2013 | 8.02 | 5.79 | 1:52 |
| 2014 | 10.05 | 6.51 | 2:30 |
| 2015 | 9.42 | 5.85 | 2:27 |
| 2016 | 7.85 | 5.23 | 2:20 |
| ¹ DEC measured in hours and hundredths of an hour | |||
| ² FEC expressed in number of interruptions and hundredths of a number of interruptions year to date | |||
Copel Telecomunicações has an optical backbone, a high capacity intermunicipal transmission network, and the access, a customer service network. The access network can be multi-point (GPON) or point-to-point (conventional), thus connecting the customer to the network's transmission Copel Telecom and providing the contracted services.
In September 2016, the backbone cable network extended for 10,140 km and the access network extended for 20,977 km. Currently, we serve the 399 municipalities in the State of Paraná and another 2 in State of Santa Catarina.
Copel Telecomunicações Fiber Optic Network
Map of the State of Paraná

* Amountssubject to rounding.
39
Earnings Release 3Q16 |
Other Sectors
Copel holds interests in companies in the gas, telecommunications, sanitation and service sectors, as shownbelow:
| Company | Sector | Partners |
| Dominó Holdings S.A. | Sanitation | COPEL - 49.0% Andrade Gutierrez - 51.0% |
| Cia. de Saneamento do Paraná - Sanepar | Sanitation | COPEL - 7.6% State of Paraná - 51.4% Dominó Holdings S.A. - 12.2% Andrade Gutierrez - 2.1% Other - 26.7% |
| Companhia Paranaense de Gás - Compagás | Gas | COPEL - 51.0% Mitsui Gás - 24.5% Gaspetro - 24.5% |
| Paraná Gás Exploração e Produção S.A1 | Oil and natural gas | COPEL - 30.0% Petra Energia - 30.0% Bayar Participações -30.0% Tucumann Engenharia - 10.0% |
| Sercomtel S.A. Telecom | Telecommunications | COPEL - 45.0% Município de Londrina - 44.4% Banco Itauleasing S.A. - 7.1% Outros - 3.5% |
| Carbocampel S.A. | Coal mining | COPEL - 49.0% Carbonífera Cambuí - 51.0% |
| Copel Amec Ltda in liquidation | Services | COPEL - 48.0% Amec - 47.5% Lactec - 4.5% |
| 1More information in item 8.6 |
Project Portfolio
Copel holds interests in different power generation projects.When these projects go into commercial operation, they will add 331.7 MW of installed capacity to the Company's portfolio.
* Amountssubject to rounding.
40
Earnings Release 3Q16 |
| Project | Estimated Installed Capacity (MW)¹ | Estimated Assured Power (Average MW) | COPEL' Stake (%) |
| SHP | 176.5 | 98.9 | |
| Bela Vista | 29.0 | 18.0 | 36.0 |
| Dois Saltos | 25.0 | 13.6 | 30.0 |
| Foz do Curucaca | 29.5 | 16.2 | 15.0 |
| Salto Alemã | 29.0 | 15.9 | 15.0 |
| São Luiz | 26.0 | 14.3 | 15.0 |
| Alto Chopim | 20.3 | 11.2 | 15.0 |
| Rancho Grande | 17.7 | 9.7 | 15.0 |
| HPP | 331.0 | 165.5 | |
| São Jerônimo | 331.0 | 165.5 | 41.2 |
| WPP | 159.0 | 70.2 | |
| Complexo Alto Oriente | 60.0 | 27.4 | 100.0 |
| Complexo Jandaia | 99.0 | 42.8 | 100.0 |
| Total | 666.5 | 334.6 | |
| ¹ The installed capacity of the new projects can be optimized in relation to the registered at auctions. | |||
Thermal Power Generation
Copel is conducting feasibility studies about four thermoelectric power plants to be constructed in the state of Paraná that may add up to 1,700 MW of installed capacity to the Company’s portfolio, as shown in the chart below:
| Project | Estimated Installed Capacity (MW) | Fuel | Location |
| Araucária II TPP ¹ | 500.0 | Natural Gas | Araucária - PR |
| Litoral TPP | 500.0 | Natural Gas | Paranaguá - PR |
| Sul TPP | 500.0 | Natural Gas | Paranaguá - PR |
| Norte Pioneiro TPP | 200.0 | Coal | Sapopema - PR |
| Total | 1,700.0 | ||
| ¹ Owns Preliminary and Installation License by Instituito Ambiental do Paraná. | |||
The feasibility of natural gas thermoelectric power projects Litoral TPP and Sul TPP, is subject to the construction of a regasification facility in the coast of the state of Paraná, which would also supply natural gas to UEGA II to Compagas.
Interest in Feasibility Study
Hydroelectric Potential Surveyed Along the Piquiri River
The feasibility studies for the four hydroelectric power plants making up the hydroelectric potential of the Piquiri River, in Paraná, were submitted by Copel GeT and accepted by Aneel in 2012. The following table features these plants, which have a joint installed capacity 459.3 MW:
* Amountssubject to rounding.
41
Earnings Release 3Q16 |
| Project | Estimated Installed Capacity (MW) |
| HPP Apertados | 139.0 |
| HPP Comissário | 140.0 |
| HPP Foz do Piquiri | 93.2 |
| HPP Ercilândia | 87.1 |
| Total | 459.3 |
Tapajós Hydroelectric Complex
Copel and other eight companies participated in the environmental assessment of the Tapajós River Basin and the feasibility studies of the Tapajós River Complex, comprising five plants, with a joint installed capacity of 12,000 MW. The Technical and Economic Feasibility Study of the São Luiz do Tapajós Hydroelectric Power Plant (EVTE) was delivered to Aneel in April 2014, and the Environmental Impact Studies (EIA) and the Environmental Impact Report (RIMA) were concluded and delivered to the Brazilian Institute of the Environment and Renewable Natural Resources (IBAMA) in May 2014. IBAMA recently filed the environmental licensing process.
On August 10, 2016, the Company's Board of Directors approved the withdrawal of Copel Geração e Transmissão from the Tapajós Consortium. As a result, the Company is no longer taking part in the projects’ feasibility studies. Due to this decision, on September 30, 2016, the Company provisioned R$14.5 million for impairment losses, which represents the entire amount invested.
Oil and Gas Exploration and Production On November 28, 2013, in the 12th round of Bids of the National Petroleum Agency (ANP), the consortium formed by Copel (30%), Bayar Participações (30%), Tucumann Engenharia (10%) and Petra Energia (30%) (the latter acting as operator) won the right to explore, develop and produce oil and natural gas in four blocks in an 11,327 km² area in the midwestern region of the State of Paraná. The consortium’s total investment will come to R$78.1 million in the first phase of exploration, for the term of four years granted by the ANP.Copel and its partners Bayar, Tucumann and Petra signed concession contracts for 2 blocks in May 2014. |  |
The activities of the first phase of exploitation by the consortium are suspended in the other blocks due to a public-interest civil action, as a result the respective concession contracts have yet to be signed. However, these two blocks are in their activities of the first phase of exploitation by the consortium stalled due to a public-interest civil action, which also keeps pending the signatures of the concession of the two blocks contracts.
* Amountssubject to rounding.
42
Earnings Release 3Q16 |
Copel’s workforce closed 9M16 at 8,563 employees distributed. The table below shows employee number trends in the Company and its subsidiaries in the last four years:
| Headcount | 2013 | 2014 | 2015 | 9M16 |
| Geração e Transmissão | 1,702 | 1,554 | 1,568 | 1,681 |
| Distribuição | 6,375 | 6,071 | 6,032 | 6,097 |
| Telecomunicações | 434 | 601 | 621 | 640 |
| Holding | 136 | 329 | 347 | 69 |
| Comercialização | - | 11 | 10 | 20 |
| Renováveis | - | 26 | 50 | 56 |
| TOTAL | 8,647 | 8,592 | 8,628 | 8,563 |
At the end of September 2016, Copel Distribuição had 4,464,005 customers, representing a consumer-to-employee ratio of 732. Compagas, Elejor and UEG Araucária, companies in which Copel holds a majority interest, had 162, 7 and 16 employees, respectively.
* Amountssubject to rounding.
43
44
Earnings Release 3Q16 |
Information about 3Q16 Results Conference Call:
> Wednesday, November 16, 2016, at 03:00 p.m. (Brasília time)
> Telephone: (+1 516) 300 1066
> Code: Copel
A live webcast of the conference call will be available at:www.copel.com/ir
Please connect 15 minutes before the call.
Investor Relations – Copel
ri@copel.com
Telephone: (+ 55 41) 3222-2027
The information contained in this press release may contain forward-looking statements that reflect management’s current view and estimates of future economic circumstances, industry conditions, company performance, and financial results. Any statements, expectations, capabilities, plans and assumptions contained in this press release that do not describe historical facts such as statements regarding the declaration or payment of dividends, the direction of future operations, the implementation of relevant operating and financial strategies, the investment program, factors or trends affecting the Company’s financial condition, liquidity or results of operations are forward-looking statements within the meaning of the U.S. Private Securities Litigation Reform Act of 1995 and involve a number of risks and uncertainties. There is no guarantee that these results will actually occur. The statements are based on many assumptions and factors, including general economic and market conditions, industry conditions and operating factors. Any changes in such assumptions or factors could cause actual results to differ materially from current expectations.
* Amountssubject to rounding.
45
Earnings Release 3Q16 |
| R$ '000 | ||
| Consolidated Cash Flow | 9M16 | 9M15 |
| Cash flows from operating activities | ||
| Net income for the period | 1,057,613 | 863,439 |
| Adjustments to reconcile net income with the cash provided by operating activities | 2,405,848 | 1,484,923 |
| Depreciation and Amortization | 532,108 | 503,355 |
| Unrealized monetary and exchange variations, net | 543,095 | 238,699 |
| Remuneration of accounts receivable related to the concession | (84,866) | (66,340 |
| Sectoral assets and liabilities result | 1,190,132 | (322,708 |
| (771,332) | - | |
| Result of the renegotiation of the hydrological risk | (26,872) | - |
| Equity in earnings of subsidiaries | (173,868) | (150,901 |
| Income Tax and Social Contribution | 639,637 | 571,855 |
| Deferred Income Tax and Social Contribution | 26,200 | (157,119 |
| Net operational provisions and reversals | 206,170 | 497,139 |
| Appropriation of actuarial calculation of post-employment benefits | 96,632 | 106,758 |
| Appropriation of pension and healthcare contribution | 98,537 | 95,299 |
| Provision for research and development and energy efficiency | 74,595 | 94,901 |
| Write off of intangible assets related to concession - goodwill | 55 | 38,664 |
| Write off of property, plant, and equipment | 21,316 | 17,614 |
| Write off of intangible assets | 34,309 | 17,707 |
| Decrese (increase) in assets | 1,201,696 | (640,994 |
| Increase (reduction) of liabilities | (1,814,085) | 290,323 |
| Income tax and social contribution paid | (853,780) | (555,268 |
| Charges on loans and financing paid | (312,276) | (382,597 |
| Charges paid debentures | (368,613) | (188,717 |
| Net cash generated by operating activities | 1,316,403 | 871,109 |
| Cash flows from investing activities | ||
| Bonds and securities | (19,711) | 91,593 |
| Loans to related parties | - | (29,400) |
| Receipt of loans to related parties | 5,112 | 7,894 |
| Additions in investments | (384,436) | (273,480) |
| Additions to property, plant, and equipment | (938,629) | (707,302) |
| Additions to intangible | (683,059) | (735,923) |
| Customer contributions | 108,512 | 184,239 |
| Net cash generated (used) by investing activities | (1,912,211) | (1,462,379) |
| Cash flows from financing activities | ||
| Loans and financing obtained | 25,274 | 1,149,956 |
| Debentures Issued | 1,322,965 | 1,008,633 |
| Amortization of principal amounts of loans and financing | (188,487) | (1,143,591) |
| Amortization of principal amounts of debentures | (267,677) | (32,008) |
| Dividends and interest on own capital paid | (359,288) | (300,283) |
| Net cash used by financing activities | 532,787 | 682,707 |
| Increase (decrease) in cash and cash equivalents | (63,021) | 91,437 |
| Cash and cash equivalents at the beginning of the year | 1,480,727 | 740,131 |
| Cash and cash equivalents at the end of the year | 1,417,706 | 831,568 |
| Variation in cash and cash equivalents | (63,021) | 91,437 |
* Amountssubject to rounding.
46
Earnings Release 3Q16 |
Income Statement – Copel Geração e Transmissão
| R$' 000 | |||||||
| Income Statement | 3Q16 (1) | 2Q16 (2) | 3Q15 (3) | Var.% (1/3) | 9M16 (4) | 9M15 (5) | Var.% (4/5) |
| OPERATING REVENUES | 554,369 | 1,753,147 | 595,961 | (7.0) | 3,059,231 | 2,164,454 | 41.3 |
| Electricity sales to final customers | 155,770 | 146,088 | 138,288 | 12.6 | 441,614 | 424,333 | 4.1 |
| Electricity sales to distributors | 459,921 | 446,973 | 349,285 | 31.7 | 1,340,057 | 1,390,849 | (3.7) |
| Use of the main transmission grid | (166,037) | 1,047,297 | 54,844 | - | 958,551 | 179,605 | 433.7 |
| Construction revenue | 93,384 | 104,084 | 42,698 | 118.7 | 286,263 | 136,782 | 109.3 |
| Other operating revenues | 11,331 | 8,705 | 10,846 | 4.5 | 32,746 | 32,885 | (0.4) |
| OPERATING COSTS AND EXPENSES | (460,453) | (440,420) | (409,184) | 12.5 | (1,291,653) | (1,568,271) | (17.6) |
| Electricity purchased for resale | (12,274) | (24,997) | (51,210) | (76.0) | (49,058) | (292,270) | (83.2) |
| Charges of main distribution and transmission grid | (72,360) | (65,009) | (65,690) | 10.2 | (202,845) | (186,231) | 8.9 |
| Personnel and management | (66,423) | (64,898) | (53,736) | 23.6 | (192,810) | (162,223) | 18.9 |
| Pension and healthcare plans | (17,355) | (14,832) | (14,222) | 22.0 | (47,176) | (42,691) | 10.5 |
| Materials and supplies | (4,384) | (3,751) | (3,691) | 18.8 | (12,913) | (11,523) | 12.1 |
| Materials and supplies for power eletricity | (5,652) | (7,009) | (7,433) | (24.0) | (16,646) | (21,089) | (21.1) |
| Third-party services | (27,918) | (26,501) | (22,557) | 23.8 | (78,3850 | (75,536) | 3.8 |
| Depreciation and amortization | (68,864) | (65,866) | (67,574) | 1.9 | (208,749) | (209,273) | (0.3) |
| Provisions and reversals | (30,762) | (17,712) | (11,508) | 167.3 | (40,632) | (251,208) | - |
| Construction cost | (104,685) | (97,431) | (62,475) | 67.6 | (278,623) | (177,444) | 57.0 |
| Other cost and expenses | (49,776) | (52,414) | (49,088) | 1.4 | (163,816) | (138,783) | 18.0 |
| EQUITY IN EARNINGS OF SUBSIDIARIES | 53,732 | 26,038 | 57,802 | (7.0) | 100,419 | 268,356 | (62.6) |
| PROFIT BEFORE FINANCIAL RESULTS AND TAXES | 147,648 | 1,338,765 | 244,579 | - | 1,867,997 | 864,539 | 116.1 |
| FINANCIAL RESULTS | (111,875) | (83,302) | (14,363) | 678.9 | (338,773) | 61,683 | - |
| Financial income | 26,232 | 20,747 | 19,589 | 33.9 | 60,296 | 140,435 | (57.1) |
| Financial expenses | (138,107) | (104,049) | (33,952) | - | (399,069) | (78,752) | 406.7 |
| OPERATIONAL EXPENSES/ INCOME | 35,773 | 1,255,463 | 230,216 | (84.5) | 1,529,224 | 926,222 | 65.1 |
| INCOME TAX AND SOCIAL CONTRIBUTION ON PROFIT | 9,125 | (416,861) | (58,105) | - | (480,506) | (221,759) | - |
| Income tax and social contribution on profit | (64,735 | (31,564) | (86,069) | (24.8) | (198,985) | (386,737) | (48.5) |
| Deferred income tax and social contribution on profit | 73,860 | (385,297) | 27,964 | 164.1 | (281,521) | 164,978 | - |
| NET INCOME (LOSS) | 44,898 | 838,602 | 172,111 | (73.9) | 1,048,718 | 704,463 | 48.9 |
| EBITDA | 216,512 | 1,404,631 | 312,153 | (30.6 | 2,076,746 | 1,073,812 | 93.4 |
* Amountssubject to rounding.
47
Earnings Release 3Q16 |
Income Statement – Copel Distribuição
| R$' 000 | |||||||
| Income Statement | 3Q16 (1) | 2Q16 (2) | 3Q15 (3) | Var.% (1/3) | 9M16 (4) | 9M15 (5) | Var.% (4/5) |
| OPERATING REVENUES | 2,163,995 | 1,730,422 | 2,136,489 | 1.3 | 5,971,695 | 7,217,318 | (17.3) |
| Electricity sales to final customers | 915,304 | 1,335,275 | 1,272,494 | (28.1) | 3,691,299 | 3,737,614 | (1.2) |
| Electricity sales to distributors | 183,664 | 134,056 | 64,491 | 184.8 | 474,367 | 204,625 | 131.8 |
| Use of the main distribution grid | 697,649 | 767,801 | 609,793 | 14.4 | 2,266,034 | 1,598,813 | 41.7 |
| Construction revenue | 263,004 | 188,853 | 224,453 | 17.2 | 629,198 | 626,758 | 0.4 |
| Sectorial assets and liabilities result | 64,355 | (727,285) | (59,678) | - | (1,190,132) | 979,343 | - |
| Other operating revenues | 40,019 | 31,722 | 24,936 | 60.5 | 100,929 | 70,165 | 43.8 |
| OPERATING COSTS AND EXPENSES | (2,145,881) | (1,968,417) | (2,289,454) | (6.3) | (6,286,491) | (7,241,236) | (13.2) |
| Electricity purchased for resale | (1,231,983) | (1,094,179) | (1,428,080) | (13.7) | (3,580,004) | (4,777,595) | (25.1) |
| Charges of main transmission grid | (146,391) | (161,014) | (160,636) | (8.9) | (516,545) | (464,947) | 11.1 |
| Personnel and management | (174,289) | (175,298) | (150,365) | 15.9 | (519,356) | (439,131) | 18.3 |
| Pension and healthcare plans | (44,052) | (38,660) | (40,966) | 7.5 | (121,732) | (123,506) | (1.4) |
| Materials and supplies | (13,633) | (15,102) | (14,285) | (4.6) | (46,224) | (42,385) | 9.1 |
| Third-party services | (93,719) | (87,410) | (90,274) | 3.8 | (266,033) | (262,462) | 1.4 |
| Depreciation and amortization | (69,973) | (68,886) | (67,508) | 3.7 | (205,149) | (182,968) | 12.1 |
| Provisions and reversals | (73,045) | (106,286) | (63,559) | 14.9 | (291,434) | (210,338) | 38.6 |
| Construction cost | (263,004) | (188,853) | (224,453) | 17.2 | (629,198) | (626,758) | 0.4 |
| Other cost and expenses | (35,792) | (32,729) | (49,328) | (27.4) | (110,816) | (111,146) | (0.3) |
| PROFIT BEFORE FINANCIAL RESULTS AND TAXES | 18,114 | (237,995) | (152,965) | - | (314,796) | (23,918) | - |
| FINANCIAL RESULTS | (29,566) | 139,173 | 43,658 | - | 147,647 | 179,500 | (17.7) |
| Financial income | 83,979 | 223,915 | 109,894 | (23.6) | 423,112 | 370,245 | 14.3 |
| Financial expenses | (113,545) | (84,742) | (66,236) | 71.4 | (275,465) | (190,745) | 44.4 |
| OPERATIONAL EXPENSES/ INCOME | (11,452) | (98,822) | (109,307) | (89.5) | (167,149) | 155,582 | - |
| INCOME TAX AND SOCIAL CONTRIBUTION ON PROFIT | (115,183) | 34,592 | 36,174 | - | (62,863) | (57,383) | 9.5 |
| Income tax and social contribution on profit | 21,668 | (157,613) | - | - | (366,519) | - | - |
| Deferred income tax and social contribution on profit | (136,851) | 192,205 | 36,174 | - | 303,656 | (57,383) | - |
| NET INCOME (LOSS) | (126,635) | (64,230) | (73,133) | 73.2 | (230,012) | 98,199 | - |
| EBITDA | 88,087 | (169,108) | (85,457) | - | (109,647) | 159,050 | - |
* Amountssubject to rounding.
48
Earnings Release 3Q16 |
Income Statement– Copel Telecomunicações
| Income Statement | 3Q16 (1) | 2Q16 (2) | 3Q15 (3) | Var.% (1/3) | 9M16 (4) | 9M15 (5) | Var.% (4/5) |
| NET OPERATING REVENUES | 80,329 | 78,376 | 71,504 | 12.3 | 236,790 | 204,141 | 16.0 |
| Revenues from telecommunications | 71,281 | 69,117 | 61,873 | 15.2 | 210,207 | 174,789 | 20.3 |
| Other operating revenues | 9,048 | 9,259 | 9,631 | (6.1) | 26,583 | 29,352 | (9.4) |
| OPERATING COSTS AND EXPENSES | (57,385) | (54,078) | (50,586) | 13.4 | (168,909) | (139,733) | 20.9 |
| Personnel and management | (22,832) | (22,441) | (18,872) | 21.0 | (66,065) | (56,386) | 17.2 |
| Pension and healthcare plans | (4,609) | (4,613) | (4,302) | 7.1 | (14,036) | (12,968) | 8.2 |
| Materials and supplies | (342 | (687) | (692 | (50.6) | (1,384) | (1,609) | (14.0) |
| Third-party services | (12,166) | (10,537) | (9,105) | 33.6 | (32,780) | (24,447) | 34.1 |
| Depreciation and amortization | (8,552) | (8,544 | (8,087) | 5.7 | (25,492) | (23,088) | 10.4 |
| Provisions and reversals | (817) | (1,741) | (1,441) | (43.3) | (7,794) | (3,843) | 102.8 |
| Other cost and expenses | (8,067) | (5,515 | (8,087) | (0.2 | (21,358) | (17,392) | 22.8 |
| PROFIT BEFORE FINANCIAL RESULTS AND TAXES | 22,944 | 24,298 | 20,918 | 9.7 | 67,881 | 64,408 | 5.4 |
| FINANCIAL RESULTS | (4,068) | (2,337) | 453 | - | (10,374) | 995 | - |
| Income tax and social contribution on profit | 2,232 | 4,314 | 949 | 135.2 | 11,150 | 2,244 | 396.9 |
| Deferred income tax and social contribution on profit | (6,300) | (6,651) | (496) | - | (21,524) | (1,249 | - |
| OPERATIONAL EXPENSES / INCOME | 18,876 | 21,961 | 21,371 | (11.7) | 57,507 | 65,403 | (12.1) |
| INCOME TAX AND SOCIAL CONTRIBUTION ON PROFIT | (6,220) | (7,191) | (7,112) | (12.5) | (18,912) | (21,975) | (13.9) |
| Income tax and social contribution on profit | (7,402) | (6,772) | (8,616) | (14.1) | (22,372) | (24,319 | (8.0) |
| Deferred income tax and social contribution on profit | 1,182 | (419) | 1,504 | (21.4) | 3,460 | 2,344 | 47.6 |
| NET INCOME (LOSS) | 12,656 | 14,770 | 14,259 | (11.2) | 38,595 | 43,428 | (11.1) |
| EBITDA | 31,496 | 32,842 | 29,005 | 8.6 | 93,373 | 87,496 | 6.7 |
* Amountssubject to rounding.
49
Earnings Release 3Q16 |
| R$' 000 | ||||||||||
| Assets - Sep-16 | Geração e Transmissão | Distribuição | Telecom | Compagas | Elejor | UEG Araucária | Other¹ | Holding | Eliminations | Consolidated |
| CURRENT | 1,372,851 | 2,532,912 | 79,793 | 107,267 | 81,888 | 363,141 | 335,190 | 518,809 | (509,958 | 4,881,893 |
| Cash and cash equivalents | 753,600 | 307,973 | 6,827 | 35,003 | 45,018 | 19,069 | 240,139 | 10,077 | - | 1,417,706 |
| Bonds and securities | 10,488 | - | - | - | - | 325,349 | 1,204 | 183 | - | 337,224 |
| Collaterals and escrow accounts | - | 1,329 | - | 216 | - | - | - | 127 | - | 1,672 |
| Customers | 417,177 | 1,757,882 | 41,096 | 57,712 | 23,576 | 452 | 60,045 | - | (59,255 | 2,298,685 |
| Dividends receivable | 30,791 | - | - | - | - | - | 8,719 | 399,829 | (411,543 | 27,796 |
| Account receivable related to concession | 17,585 | - | - | - | - | - | - | - | - | 17,585 |
| Accounts receivable related to the concession compensation | - | - | - | - | - | - | - | - | - | - |
| Other current receivables | 82,570 | 209,443 | 4,091 | 10,768 | 3,962 | 10,756 | 6,536 | 12,027 | (4,003 | 336,150 |
| Inventories | 27,022 | 98,252 | 11,634 | 2,056 | - | - | - | - | - | 138,964 |
| Income tax and social contribution | - | 61,270 | 11,128 | 530 | 6 | 6,171 | 3,926 | 56,777 | - | 139,808 |
| Other current recoverable taxes | 20,498 | 53,447 | 4,970 | 422 | - | 1,344 | 819 | 162 | - | 81,662 |
| Prepaid expenses | 11,372 | 19,614 | - | 560 | 9,326 | - | 254 | - | - | 41,126 |
| Related parties | 1,748 | 23,702 | 47 | - | - | - | 13,548 | 39,627 | (35,157 | 43,515 |
| NON-CURRENT | 13,434,895 | 7,221,321 | 722,779 | 390,923 | 641,444 | 388,516 | 2,664,311 | 16,939,432 | (16,787,931 | 25,615,690 |
| Long Term Assets | 3,243,289 | 1,818,583 | 70,741 | 87,136 | 38,299 | 2,380 | 134,084 | 2,013,152 | (131,357 | 7,276,307 |
| Bonds and securities | 89,992 | 1,421 | - | 6,495 | - | - | 91,333 | - | - | 189,241 |
| Collaterals and escrow accounts | - | 77,101 | - | - | - | - | - | - | - | 77,101 |
| Customers | 474 | 66,440 | 36,407 | - | - | - | - | - | - | 103,321 |
| CRC transferred to the State Government of Paraná | - | - | - | - | - | - | - | 1,476,618 | - | 1,476,618 |
| Judicial deposits | 73,126 | 386,200 | 9,190 | 36,832 | 78 | 2,380 | 234 | 84,319 | - | 592,359 |
| Account receivable related to concession | 2,913,806 | 587,484 | - | 19,183 | - | - | - | - | - | 3,520,473 |
| Accounts receivable related to the concession extension | 59,339 | - | - | - | - | - | - | - | - | 59,339 |
| Other receivables | 15,932 | 25,835 | 81 | 1,860 | - | - | - | - | - | 43,708 |
| Income tax and social contribution | 600 | 15,859 | - | - | - | - | - | 149,212 | - | 165,671 |
| Deferred income tax and social contribution | - | 610,808 | 16,723 | 22,613 | 26,399 | - | - | 46,582 | - | 723,125 |
| Other recoverable taxes | 72,528 | 47,435 | 8,340 | - | - | - | - | 15 | - | 128,318 |
| Prepaid Expenses | 17,492 | - | - | 153 | 11,822 | - | - | - | - | 29,467 |
| Receivables from subsidiaries | - | - | - | - | - | - | 42,517 | 256,406 | (131,357 | 167,566 |
| Investments | 3,949,933 | 1,374 | - | - | - | - | 939,820 | 14,922,538 | (17,062,993 | 2,750,672 |
| Property, Plant and Equipment, net | 6,140,411 | - | 633,766 | - | 419,087 | 385,865 | 1,589,800 | 577 | - | 9,169,506 |
| Intangible Assets | 101,262 | 5,401,364 | 18,272 | 303,787 | 184,058 | 271 | 607 | 3,165 | 406,419 | 6,419,205 |
| TOTAL | 14,807,746 | 9,754,233 | 802,572 | 498,190 | 723,332 | 751,657 | 2,999,501 | 17,458,241 | (17,297,889 | 30,497,583 |
| ¹ Wind Farms, Copel Renováveis and Copel Participações |
Amounts subject to rounding.
50
Earnings Release 3Q16 |
| R$' 000 | ||||||||||
| Assets - Dec-15 | Geração e Transmissão | Distribuição | Telecom | Compagas | Elejor | UEG Araucária | Other¹ | Holding | Elimin. e Reclassif. | Consolidado |
| CURRENT | 1,334,755 | 4,155,554 | 179,898 | 103,579 | 75,004 | 674,778 | 233,072 | 793,344 | (616,587) | 6,933,397 |
| Cash and cash equivalents | 654,438 | 416,086 | 122,667 | 29,321 | 41,655 | 132,854 | 58,053 | 25,653 | - | 1,480,727 |
| Bonds and securities | 11,826 | 165 | - | - | - | 329,747 | 64,368 | 168 | - | 406,274 |
| Collaterals and escrow accounts | - | 1,717 | - | 151 | - | - | - | 132 | - | 2,000 |
| Customers | 397,151 | 2,353,136 | 25,486 | 62,125 | 21,187 | 186,707 | 32,530 | - | (45,495) | 3,032,827 |
| Dividends receivable | 93,645 | - | - | - | - | - | 12,079 | 488,187 | (553,566) | 40,345 |
| CRC transferred to the State Government of Paraná | - | - | - | - | - | - | - | 111,663 | - | 111,663 |
| Sectorial financial assets | - | 910,759 | - | - | - | - | - | - | - | 910,759 |
| Account receivable related to concession | 9,162 | - | - | - | - | - | - | - | - | 9,162 |
| Accounts receivable related to the concession compensation | - | - | - | - | - | - | - | - | - | - |
| Other current receivables | 109,590 | 272,652 | 4,278 | 714 | 2,951 | 24,422 | 49,950 | 13,018 | (2,686) | 474,889 |
| Inventories | 26,773 | 89,343 | 12,784 | 2,118 | - | - | - | - | - | 131,018 |
| Income tax and social contribution | - | 20,592 | 10,864 | 7,088 | - | - | 1,624 | 154,076 | - | 194,244 |
| Other current recoverable taxes | 14,214 | 49,988 | 3,768 | 1,632 | - | 1,048 | 75 | - | - | 70,725 |
| Prepaid expenses | 17,956 | 21,634 | 51 | 430 | 9,211 | - | - | - | - | 49,282 |
| Receivables from subsidiaries | - | 19,482 | - | - | - | - | 14,393 | 447 | (14,840) | 19,482 |
| NON-CURRENT | 10,701,929 | 6,559,712 | 589,419 | 377,724 | 668,250 | 373,729 | 1,700,975 | 16,160,380 | (15,117,858) | 22,014,260 |
| Long Term Assets | 1,436,140 | 1,426,826 | 59,031 | 71,016 | 46,070 | 680 | 85,597 | 2,016,306 | (189,874) | 4,951,792 |
| Bonds and securities | 83,361 | 1,289 | - | 6,467 | - | - | - | - | - | 91,117 |
| Collaterals and escrow accounts | - | 86,137 | - | - | - | - | - | - | - | 86,137 |
| Customers | 2,055 | 40,676 | 32,331 | - | - | - | - | - | - | 75,062 |
| CRC transferred to the State Government of Paraná | - | - | - | - | - | - | - | 1,271,579 | - | 1,271,579 |
| Judicial deposits | 59,885 | 352,712 | 7,775 | 31,254 | 52 | 680 | 157 | 267,412 | - | 719,927 |
| Sectorial financial assets | - | 134,903 | - | - | - | - | - | - | - | 134,903 |
| Account receivable related to concession | 920,673 | 424,140 | - | 13,638 | - | - | - | - | - | 1,358,451 |
| Accounts receivable related to the concession extension | 219,556 | - | - | - | - | - | - | - | - | 219,556 |
| Other receivables | 12,531 | 19,083 | - | - | - | - | - | - | - | 31,614 |
| Income tax and social contribution | 573 | 14,969 | - | - | - | - | - | 79,144 | - | 94,686 |
| Other recoverable taxes | 69,351 | 307,152 | 13,262 | 19,504 | 27,373 | - | - | 100,920 | - | 537,562 |
| Deferred income tax and social contribution | 61,460 | 45,765 | 5,663 | - | - | - | - | 14 | - | 112,902 |
| Advances to suppliers | 6,695 | - | - | 153 | 18,645 | - | - | - | - | 25,493 |
| Receivables from subsidiaries | - | - | - | - | - | - | 85,440 | 297,237 | (189,874) | 192,803 |
| Investments | 2,979,400 | 1,374 | - | - | - | - | 447,619 | 14,140,573 | (15,344,256) | 2,224,710 |
| Property, Plant and Equipment, net | 6,208,220 | - | 512,068 | - | 431,693 | 372,728 | 1,167,518 | 455 | - | 8,692,682 |
| Intangible Assets | 78,169 | 5,131,512 | 18,320 | 306,708 | 190,487 | 321 | 241 | 3,046 | 416,272 | 6,145,076 |
| TOTAL | 12,036,684 | 10,715,266 | 769,317 | 481,303 | 743,254 | 1,048,507 | 1,934,047 | 16,953,724 | (15,734,445) | 28,947,657 |
| ¹ Wind Farms, Copel Renováveis and Copel Participações | ||||||||||
Amounts subject to rounding.
51
Earnings Release 3Q16 |
| R$' 000 | ||||||||||
| Liabilities - Sep-16 | Geração e Transmissão | Distribuição | Telecom | Compagas | Elejor | UEG Araucária | Other¹ | Holding | Eliminations | Consolidated |
| CURRENT | 1,176,905 | 2,519,112 | 116,683 | 98,027 | 151,766 | 54,835 | 201,232 | 825,236 | (511,670) | 4,632,126 |
| Social charges and accruals | 62,055 | 161,027 | 20,384 | 8,574 | 354 | 281 | 3,525 | 5,131 | - | 261,331 |
| Associated companies and parent company | 4,180 | 2,482 | 8,259 | - | - | - | 20,237 | - | (35,158) | - |
| Suppliers | 191,337 | 828,248 | 56,258 | 51,603 | 3,289 | 20,556 | 116,118 | 2,225 | (63,248) | 1,206,386 |
| Income Tax and Social Contribution payable | 76,907 | - | 2,254 | 8,081 | 7,719 | - | 2,812 | - | - | 97,773 |
| Other taxes | 77,090 | 111,810 | 6,362 | 6,774 | 1,967 | 3,270 | 2,946 | 1,086 | - | 211,305 |
| Loans and financing | 96,887 | 294,278 | 5,923 | - | - | - | 28,795 | 421,618 | (1,721) | 845,780 |
| Debentures | 91,407 | 561,931 | 6,245 | 21,656 | 40,490 | - | 19,869 | 391,011 | - | 1,132,609 |
| Dividends payable | 347,363 | 5,000 | 7,999 | - | 32,234 | 30,717 | 4,044 | 3,319 | (411,543) | 19,133 |
| Post employment benefits | 10,846 | 30,537 | 1,653 | - | - | - | 24 | 161 | - | 43,221 |
| Customer charges due | 11,110 | 133,247 | - | - | - | - | - | - | - | 144,357 |
| Research and development and energy efficiency | 46,167 | 107,566 | - | - | 5,818 | 1 | - | - | - | 159,552 |
| Payables related to concession | 4,086 | - | - | - | 57,947 | - | - | - | - | 62,033 |
| Sectorial financial liabilities | - | 193,402 | - | - | - | - | - | - | - | 193,402 |
| Other accounts payable | 157,470 | 89,584 | 1,346 | 1,339 | 1,948 | 10 | 2,862 | 685 | - | 255,244 |
| NON-CURRENT | 4,919,752 | 2,611,986 | 232,621 | 58,166 | 499,513 | 19,791 | 1,238,458 | 1,348,405 | (672,433) | 10,256,259 |
| Associated companies and parent company | - | - | - | - | - | - | 585,236 | - | (585,236) | - |
| Suppliers | 5,923 | - | - | - | - | - | - | - | - | 5,923 |
| Deferred income tax and social contribution | 212,171 | - | - | - | - | - | - | - | - | 212,171 |
| Tax liabilities | 140,801 | 87,008 | 5,360 | - | - | 2,474 | 240 | 1,646 | - | 237,529 |
| Loans and financing | 1,745,425 | 503,863 | 17,485 | - | - | - | 361,748 | 558,909 | (87,118) | 3,100,312 |
| Debentures | 1,982,832 | 499,983 | 170,353 | 44,677 | 40,648 | - | 278,449 | 665,727 | - | 3,682,669 |
| Post-employment benefits | 170,699 | 403,296 | 25,291 | 4,221 | - | - | 2,963 | 9,583 | - | 616,053 |
| Research and development and energy efficiency | 65,158 | 222,408 | - | - | - | 17,317 | - | - | - | 304,883 |
| Payables related to the concession | 43,100 | - | - | - | 458,865 | - | - | - | - | 501,965 |
| Sectorial financial liabilities | - | 165,205 | - | - | - | - | - | - | - | 165,205 |
| Other payables | 46,688 | - | - | 8,517 | - | - | 9,768 | - | (79) | 64,894 |
| Tax, social security, labor and civil provisions | 506,955 | 730,223 | 14,132 | 751 | - | - | 54 | 112,540 | - | 1,364,655 |
| EQUITY | 8,711,089 | 4,623,135 | 453,268 | 341,997 | 72,053 | 677,031 | 1,559,811 | 15,284,600 | (16,113,786) | 15,609,198 |
| Attributable to controlling shareholders | 8,711,089 | 4,623,135 | 453,268 | 341,997 | 72,053 | 677,031 | 1,559,811 | 15,284,600 | (16,438,386) | 15,284,598 |
| Capital | 4,429,898 | 4,176,841 | 316,097 | 220,966 | 35,503 | 707,440 | 923,339 | 6,910,000 | (10,810,084) | 6,910,000 |
| Advance for Future Capital Increase | 909,500 | - | - | - | - | - | 608,292 | - | (1,517,792) | - |
| Equity valuation adjustments | 958,756 | 75,990 | 8,309 | (538) | 256 | - | 7,563 | 1,063,224 | (1,050,337) | 1,063,223 |
| Legal Reserves | 382,670 | 167,490 | 14,754 | 22,391 | 7,101 | 35,441 | 1,489 | 744,784 | (631,336) | 744,784 |
| Retained earnigs | 867,876 | 432,825 | 75,513 | 52,902 | - | - | 14,294 | 5,413,573 | (1,443,411) | 5,413,572 |
| Additional proposed dividends | - | - | - | - | - | - | - | - | - | - |
| Accrued earnings (losses) | 1,162,389 | (230,011) | 38,595 | 46,276 | 29,193 | (65,850) | 4,834 | 1,153,019 | (985,426) | 1,153,019 |
| Attributable to noncontrolling interests | - | - | - | - | - | - | - | - | 324,600 | 324,600 |
| TOTAL | 14,807,746 | 9,754,233 | 802,572 | 498,190 | 723,332 | 751,657 | 2,999,501 | 17,458,241 | (17,297,889) | 30,497,583 |
| ¹ Wind Farms, Copel Renováveis and Copel Participações | ||||||||||
Amounts subject to rounding.
52
Earnings Release 3Q16 |
| R$' 000 | ||||||||||
| Liabilities - Dec/15 | Geração e Transmissão | Distribuição | Telecom | Compagas | Elejor | UEG Araucária | Other¹ | Holding | Eliminations | Consolidated |
| CURRENT | 1,350,330 | 2,653,747 | 45,203 | 137,886 | 165,641 | 173,421 | 438,142 | 442,214 | (617,466) | 4,789,118 |
| Social charges and accruals | 54,234 | 158,281 | 20,105 | 7,063 | 240 | 195 | 2,846 | 15,437 | - | 258,401 |
| Associated companies and parent company | - | - | - | - | - | - | 14,839 | - | (14,839) | - |
| Suppliers | 395,038 | 988,683 | 11,062 | 98,100 | 4,551 | 9,712 | 151,553 | 2,601 | (48,174) | 1,613,126 |
| Income Tax and Social Contribution payable | 177,269 | 65,632 | - | - | 19,798 | 47,138 | 2,079 | - | - | 311,916 |
| Other taxes | 108,289 | 182,658 | 3,833 | 7,858 | 1,793 | 751 | 3,150 | 32,616 | - | 340,948 |
| Loans and financing | 111,910 | 101,141 | 5,914 | - | - | - | 28,692 | 61,788 | (887) | 308,558 |
| Debentures | 95,580 | 523,967 | 1,778 | 18,878 | 40,490 | - | 223,815 | 19,497 | - | 924,005 |
| Dividends payable | 292,813 | 133,950 | - | 5,479 | 34,093 | 115,359 | 7,857 | 310,022 | (553,566) | 346,007 |
| Post employment benefits | 11,041 | 30,722 | 1,521 | - | - | - | 18 | 21 | - | 43,323 |
| Customer charges due | 16,036 | 261,422 | - | - | - | - | - | - | - | 277,458 |
| Research and development and energy efficiency | 49,321 | 113,524 | - | - | 4,900 | 136 | - | - | - | 167,881 |
| Payables related to concession | 3,839 | - | - | - | 57,947 | - | - | - | - | 61,786 |
| Other accounts payable | 34,960 | 93,767 | 990 | 508 | 1,829 | 130 | 3,293 | 232 | - | 135,709 |
| NON-CURRENT | 3,780,935 | 2,457,846 | 227,140 | 47,696 | 503,612 | 16,847 | 480,024 | 2,265,783 | (205,822) | 9,574,061 |
| Associated companies and parent company | - | - | 11,900 | - | - | - | 90,368 | - | (102,268) | - |
| Suppliers | 5,923 | - | - | - | - | - | - | - | - | 5,923 |
| Deferred income tax and social contribution | - | - | - | - | - | - | 214 | - | - | 214 |
| Tax liabilities | 170,690 | 79,343 | 4,765 | - | - | 841 | 168 | 1,466 | - | 257,273 |
| Loans and financing | 1,732,304 | 770,722 | 21,624 | - | - | - | 377,987 | 969,412 | (103,547) | 3,768,502 |
| Debentures | 995,175 | 499,411 | 160,380 | 37,341 | 71,026 | - | - | 996,590 | - | 2,759,923 |
| Post-employment benefits | 152,831 | 365,049 | 19,849 | 4,221 | - | - | 1,592 | 7,795 | - | 551,337 |
| Research and development and energy efficiency | 50,665 | 164,441 | - | - | - | 16,006 | - | - | - | 231,112 |
| Payables related to the concession | 41,293 | - | - | - | 432,586 | - | - | - | - | 473,879 |
| Other payables | 15,865 | - | - | 5,409 | - | - | 9,695 | - | (7) | 30,962 |
| Tax, social security, labor and civil provisions | 616,189 | 578,880 | 8,622 | 725 | - | - | - | 290,520 | - | 1,494,936 |
| EQUITY | 6,905,419 | 5,603,673 | 496,974 | 295,721 | 74,001 | 858,239 | 1,015,881 | 14,245,727 | (14,911,157) | 14,584,478 |
| Attributable to controlling shareholders | 6,905,419 | 5,603,673 | 496,974 | 295,721 | 74,001 | 858,239 | 1,015,881 | 14,245,727 | (15,249,907) | 14,245,728 |
| Capital | 4,334,865 | 3,342,841 | 304,198 | 220,966 | 35,503 | 707,439 | 644,032 | 6,910,000 | (9,589,844) | 6,910,000 |
| Advance for Future Capital Increase | 95,033 | 834,000 | - | - | - | - | 408,734 | - | (1,337,767) | - |
| Reservas de capital | - | - | - | - | - | - | - | - | - | - |
| Equity valuation adjustments | 1,072,427 | 75,990 | 8,308 | (538) | 256 | - | 7,939 | 1,177,372 | (1,164,382) | 1,177,372 |
| Legal Reserves | 382,668 | 167,490 | 14,754 | 22,391 | 7,101 | 35,441 | 1,847 | 744,783 | (631,691) | 744,784 |
| Retained earnigs | 867,876 | 1,052,826 | 145,513 | 52,902 | 31,141 | - | 26,477 | 5,413,572 | (2,176,735) | 5,413,572 |
| Additional proposed dividends | 152,550 | 130,526 | 24,201 | - | - | 115,359 | 96 | - | (422,732) | - |
| Accrued earnings (losses) | - | - | - | - | - | - | (73,244) | - | 73,244 | - |
| Attributable to noncontrolling interests | - | - | - | - | - | - | - | - | 338,750 | 338,750 |
| TOTAL | 12,036,684 | 10,715,266 | 769,317 | 481,303 | 743,254 | 1,048,507 | 1,934,047 | 16,953,724 | (15,734,445) | 28,947,657 |
| ¹ Wind Farms, Copel Renováveis and Copel Participações | ||||||||||
Amounts subject to rounding.
53
Earnings Release 3Q16 |
Income Statement by Company
| R$'000 | |||||||||||
| Income Statement 3Q16 | Geração e Transmissão | Distribuição | Telecom | Compagas | Elejor | UEG Araucária | Other¹ | Holding | Eliminations | Consolidated | |
| Generation | Transmission | ||||||||||
| NET OPERATING INCOME | 624,460 | (70,091) | 2,163,995 | 80,329 | 127,033 | 68,797 | 327 | 52,230 | - | (139,884) | 2,907,196 |
| Electricity sales to final customers | 155,770 | - | 915,304 | - | - | - | - | 1,030 | - | (806) | 1,071,298 |
| Electricity sales to distributors | 459,921 | - | 183,664 | - | - | 68,797 | 327 | 51,200 | - | (79,896) | 684,013 |
| Use of the main distribution and transmission grid | - | (166,037) | 697,649 | - | - | - | - | - | - | (28,209) | 503,403 |
| Construction revenue | - | 93,384 | 263,004 | - | 5,832 | - | - | - | - | - | 362,220 |
| Telecommunications | - | - | - | 71,281 | - | - | - | - | - | (7,922) | 63,359 |
| Distribution of piped gas | - | - | - | - | 120,924 | - | - | - | - | (2,089) | 118,835 |
| Sectorial assets and liabilities result | - | - | 64,355 | - | - | - | - | - | - | - | 64,355 |
| Other operating revenues | 8,769 | 2,562 | 40,019 | 9,048 | 277 | - | - | - | - | (20,962) | 39,713 |
| OPERATING COSTS AND EXPENSES | (309,606) | (150,847) | (2,145,881) | (57,385) | (94,569) | (24,368) | (27,611) | (30,747) | (26,991) | 139,939 | (2,728,065) |
| Energy purchased for resale | (12,274) | - | (1,231,983) | - | - | (7,641) | - | (1,735) | - | 79,900 | (1,173,733) |
| Charges of the main distribution and transmission grid | (72,360) | - | (146,391) | - | - | (2,893) | (5,907) | (3,563) | - | 27,236 | (203,878) |
| Personnel and management | (42,027) | (24,396) | (174,289) | (22,832) | (8,851) | (821) | (550) | (6,188) | (6,056) | - | (286,010) |
| Private pension and health plans | (11,223) | (6,132) | (44,052) | (4,609) | (677) | (21) | (73) | (783) | 1,235 | - | (66,335) |
| Materials | (3,155) | (1,229) | (13,633) | (342) | (544) | (62) | (77) | (122) | (290) | - | (19,454) |
| Raw material and supplies - energy production | (5,652) | - | - | - | - | - | (2,802) | - | - | 2,089 | (6,365) |
| Natural gas and supplies for gas business | - | - | - | - | (64,471) | - | - | - | - | - | (64,471) |
| Third-party services | (22,537) | (5,381) | (93,719) | (12,166) | (5,147) | (2,718) | (10,359) | (2,864) | (9,220) | 27,911 | (136,200) |
| Depreciation and amortization | (68,013) | (851) | (69,973) | (8,552) | (6,287) | (6,723) | (6,692) | (11,974) | (296) | - | (179,361) |
| Provisions and reversals | (25,716) | (5,046) | (73,045) | (817) | (754) | - | - | (85) | (2,740) | 52 | (108,151) |
| Construction cost | - | (104,685) | (263,004) | - | (5,832) | - | - | - | - | - | (373,521) |
| Other operating costs and expenses | (46,649) | (3,127) | (35,7920 | (8,067) | (2,006) | (3,489) | (1,151) | (3,433) | (9,624) | 2,751 | (110,586) |
| EQUITY IN EARNINGS OF SUBSIDIARIES | 4,647 | 49,085 | - | - | - | - | - | 12,461 | (38,060) | 41,026 | 69,159 |
| PROFIT BEFORE FINANCIAL RESULTS AND TAXES | 319,501 | (171,853) | 18,114 | 22,944 | 32,464 | 44,429 | (27,284) | 33,944 | (65,051) | 41,081 | 248,290 |
| FINANCIAL RESULTS | (77,647) | (34,228) | (29,566) | (4,068) | 2,793 | (17,050) | 4,235 | (9,284) | (47,657) | - | (212,472) |
| Financial income | 18,467 | 7,765 | 83,979 | 2,232 | 3,309 | 1,039 | 4,564 | 10,041 | 32,766 | (154) | 164,008 |
| Financial expenses | (96,114) | (41,993) | (113,545) | (6,300) | (516) | (18,089) | (329) | (19,325) | (80,423) | 154 | (376,480) |
| OPERATIONAL EXPENSES / INCOME | 241,854 | (206,081) | (11,452) | 18,876 | 35,257 | 27,379 | (23,049) | 24,660 | (112,708) | 41,081 | 35,818 |
| INCOME TAX AND SOCIAL CONTRIBUTION ON PROFIT | (77,219) | 86,344 | (115,183) | (6,220) | (12,300) | (9,304) | - | (2,581) | 25,591 | - | (110,872) |
| NET INCOME | 164,635 | (119,737) | (126,635) | 12,656 | 22,957 | 18,075 | (23,049) | 22,079 | (87,117) | 41,081 | (75,054) |
| Attributed to controlling shareholders | 164,635 | (119,736) | (126,635) | 12,656 | 11,708 | 12,652 | (18,439) | 22,079 | (87,117) | - | (87,116) |
| Attributed to non-controlling interest | - | - | - | - | 11,249 | 5,423 | (4,610) | - | - | - | 12,062 |
| EBITDA | 387,514 | (171,002) | 88,087 | 31,496 | 38,751 | 51,152 | (20,592) | 45,918 | (64,755) | 41,081 | 427,651 |
| ¹ Wind Farms, Copel Renováveis and Copel Participações | |||||||||||
Amounts subject to rounding.
54
Earnings Release 3Q16 |
| R$'000 | |||||||||||
| Income Statement 3Q15 | Geração e Transmissão | Distribuição | Telecom | Compagas | Elejor | UEG Araucária | Other¹ | Holding | Eliminations | Consolidated | |
| Generation | Transmission | ||||||||||
| NET OPERATING INCOME | 468,689 | 127,272 | 2,136,489 | 71,504 | 348,921 | 59,985 | 286,553 | 63,180 | - | (317,405) | 3,245,188 |
| Electricity sales to final customers | 138,288 | - | 1,272,494 | - | - | - | - | - | - | (1,196) | 1,409,586 |
| Electricity sales to distributors | 349,285 | - | 64,491 | - | - | 59,985 | 286,553 | 63,180 | - | (72,304) | 751,190 |
| Use of the main distribution and transmission grid | (5,027) | 59,871 | 609,793 | - | - | - | - | - | - | (23,023) | 641,614 |
| Construction revenue | (13,072) | 55,770 | 224,453 | - | 15,333 | - | - | - | - | - | 282,484 |
| Telecommunications | - | - | - | 61,873 | - | - | - | - | - | (7,095) | 54,778 |
| Distribution of piped gas | - | - | - | - | 333,588 | - | - | - | - | (192,745) | 140,843 |
| Sectorial assets and liabilities result | - | - | (59,678) | - | - | - | - | - | - | - | (59,678) |
| Other operating revenues | (785) | 11,631 | 24,936 | 9,631 | - | - | - | - | - | (21,042) | 24,371 |
| OPERATING COSTS AND EXPENSES | (285,438) | (123,746) | (2,289,454) | (50,586) | (353,364) | (30,930) | (277,704) | (51,742) | (37,769) | 317,370 | (3,183,363) |
| Energy purchased for resale | (51,210) | - | (1,428,080) | - | - | (14,002) | - | (26,360) | - | 71,763 | (1,447,889) |
| Charges of the main distribution and transmission grid | (65,690) | - | (160,636) | - | - | (3,114) | (5,385) | (3,020) | - | 21,086 | (216,759) |
| Personnel and management | (35,793) | (17,943) | (150,365) | (18,872) | (8,402) | (722) | (769) | (4,254) | (16,770) | - | (253,890) |
| Private pension and health plans | (9,697) | (4,525) | (40,966) | (4,302) | (580) | - | (66) | (464) | (2,111) | - | (62,711) |
| Materials | (2,885) | (806) | (14,285) | (692) | (493) | (141) | (78) | (46) | (147) | - | (19,573) |
| Raw material and supplies - energy production | (7,433) | - | - | - | - | - | (240,063) | - | - | 192,530 | (54,966) |
| Natural gas and supplies for gas business | - | - | - | - | (298,099) | - | - | - | - | - | (298,099) |
| Third-party services | (17,365) | (5,192) | (90,274) | (9,105) | (4,472) | (3,258) | (16,529) | (2,154) | (3,805) | 27,782 | (124,372) |
| Depreciation and amortization | (66,365) | (1,209) | (67,508) | (8,087) | (5,791) | (6,710) | (7,515) | (12,860) | (2,201) | - | (178,246) |
| Provisions and reversals | 8,381 | (19,889) | (63,559) | (1,441) | (15,396) | - | - | - | (1,334) | (209) | (93,447) |
| Construction cost | 9,226 | (71,701) | (224,453) | - | (15,333) | - | - | - | - | - | (302,261) |
| Other operating costs and expenses | (46,607) | (2,481) | (49,328) | (8,087) | (4,798) | (2,983) | (7,299) | (2,584) | (11,401) | 4,418 | (131,150) |
| EQUITY IN EARNINGS OF SUBSIDIARIES | 30,499 | 27,303 | - | - | - | - | - | 20,482 | 124,533 | (143,725) | 59,092 |
| PROFIT BEFORE FINANCIAL RESULTS AND TAXES | 213,750 | 30,829 | (152,965) | 20,918 | (4,443) | 29,055 | 8,849 | 31,920 | 86,764 | (143,760) | 120,917 |
| FINANCIAL RESULTS | (96,672) | 82,309 | 43,658 | 453 | (421) | (24,330) | 24,003 | (17,878) | (18,211) | (172) | (7,261) |
| Financial income | (67,268) | 86,857 | 109,894 | 949 | 2,126 | 829 | 24,429 | 2,551 | 60,820 | (972) | 220,215 |
| Financial expenses | (29,404) | (4,548) | (66,236) | (496) | (2,547) | (25,159) | (426) | (20,429) | (79,031) | 800 | (227,476) |
| OPERATIONAL EXPENSES / INCOME | 117,078 | 113,138 | (109,307) | 21,371 | (4,864) | 4,725 | 32,852 | 14,042 | 68,553 | (143,932) | 113,656 |
| INCOME TAX AND SOCIAL CONTRIBUTION ON PROFIT | (38,775) | (19,330) | 36,174 | (7,112) | 1,620 | (2,107) | (9,717) | (2,032) | 19,056 | - | (22,223) |
| NET INCOME | 78,303 | 93,808 | (73,133) | 14,259 | (3,244) | 2,618 | 23,135 | 12,010 | 87,609 | (143,932) | 91,433 |
| Attributed to controlling shareholders | 704,463 | - | 98,199 | 43,428 | 9,404 | 4,232 | 222,692 | (89,410) | 796,916 | - | 87,609 |
| Attributed to non-controlling interest | - | - | - | - | 9,035 | 1,814 | 55,674 | - | - | - | 3,824 |
| EBITDA | 280,115 | 32,038 | (85,457) | 29,005 | 1,348 | 35,765 | 16,364 | 44,780 | 88,965 | (143,760) | 299,163 |
| ¹ Wind Farms, Copel Renováveis and Copel Participações | |||||||||||
Amounts subject to rounding.
55
Earnings Release 3Q16 |
| R$'000 | |||||||||||
| Income Statement 9M16 | Geração e Transmissão | Distribuição | Telecom | Compagas | Elejor | UEG Araucária | Other¹ | Holding | Elimin. e Reclassif. | Consolidated | |
| Generation | Transmission | ||||||||||
| NET OPERATING INCOME | 1,808,220 | 1,251,011 | 5,971,695 | 236,790 | 432,210 | 193,536 | 57,432 | 158,841 | - | (434,345) | 9,675,390 |
| Electricity sales to final customers | 441,614 | - | 3,691,299 | - | - | - | - | 1,030 | - | (2,969) | 4,130,974 |
| Electricity sales to distributors | 1,340,057 | - | 474,367 | - | - | 193,536 | 57,432 | 157,811 | - | (228,239) | 1,994,964 |
| Use of the main distribution and transmission grid (TUSD/ TUST) | - | 958,551 | 2,266,034 | - | - | - | - | - | - | (75,637) | 3,148,948 |
| Construction revenue | - | 286,263 | 629,198 | - | 19,204 | - | - | - | - | - | 934,665 |
| Telecommunications | - | - | - | 210,207 | - | - | - | - | - | (22,858) | 187,349 |
| Distribution of piped gas | - | - | - | - | 412,729 | - | - | - | - | (43,726) | 369,003 |
| Sectoral assets and liabilities result | - | - | (1,190,132) | - | - | - | - | - | - | - | (1,190,132) |
| Other operating revenues | 26,549 | 6,197 | 100,929 | 26,583 | 277 | - | - | - | - | (60,916) | 99,619 |
| OPERATING COSTS AND EXPENSES | (893,446) | (398,207) | (6,286,491) | (168,909) | (363,184) | (73,397) | (145,292) | (91,967) | 103,252 | 434,418 | (7,883,223) |
| Energy purchased for resale | (49,058) | - | (3,580,004) | - | - | (24,734) | - | (1,806) | - | 228,225 | (3,427,377) |
| Charges of the main distribution and transmission grid | (202,845) | - | (516,545) | - | - | (7,694) | (16,584) | (10,783) | - | 72,897 | (681,554) |
| Personnel and management | (127,190) | (65,620) | (519,356) | (66,065) | (25,865) | (2,467) | (1,927) | (16,031) | (21,992) | - | (846,513) |
| Private pension and health plans | (31,220) | (15,956) | (121,732) | (14,036) | (1,983) | (65) | (219) | (2,982) | (4,170) | - | (192,363) |
| Materials | (9,324) | (3,589) | (46,224) | (1,384) | (1,348) | (219) | (309) | (227) | (474) | - | (63,098) |
| Raw material and supplies - energy production | (16,646) | - | - | - | - | - | (51,657) | - | - | 43,726 | (24,577) |
| Natural gas and supplies for gas business | - | - | - | - | (264,236) | - | - | - | - | - | (264,236) |
| Third-party services | (62,450) | (15,935) | (266,033) | (32,780) | (14,083) | (8,722) | (53,681) | (13,450) | (17,165) | 81,742 | (402,557) |
| Depreciation and amortization | (206,728) | (2,021) | (205,149) | (25,492) | (18,215) | (20,159) | (17,552) | (35,919) | (873) | - | (532,108) |
| Provisions and reversals | (32,413) | (8,219) | (291,434) | (7,794) | (1,459) | - | - | (127) | 176,407 | 72 | (164,967) |
| Construction cost | - | (278,623) | (629,198) | - | (19,204) | - | - | - | - | - | (927,025) |
| Other operating costs and expenses | (155,572) | (8,244) | (110,816) | (21,358) | (16,791) | (9,337) | (3,363) | (10,642) | (28,481) | 7,756 | (356,848) |
| EQUITY IN EARNINGS OF SUBSIDIARIES | 7,414 | 93,005 | - | - | - | - | - | 43,367 | 944,348 | (914,266) | 173,868 |
| OPERATIONAL EXPENSES / INCOME | 922,188 | 945,809 | (314,796) | 67,881 | 69,026 | 120,139 | (87,860) | 110,241 | 1,047,600 | (914,193) | 1,966,035 |
| FINANCIAL RESULTS | (245,041) | (93,732) | 147,647 | (10,374) | 2,389 | (75,935) | 22,010 | (35,441) | 45,892 | - | (242,585) |
| Income tax and social contribution on profit | 47,738 | 12,558 | 423,112 | 11,150 | 10,839 | 2,878 | 23,141 | 23,150 | 271,127 | (1,496) | 824,197 |
| Deferred income tax and social contribution on profit | (292,779) | (106,290) | (275,465) | (21,524) | (8,450) | (78,813) | (1,131) | (58,591) | (225,235) | 1,496 | (1,066,782) |
| EARNINGS BEFORE INCOME TAXES | 677,147 | 852,077 | (167,149) | 57,507 | 71,415 | 44,204 | (65,850) | 74,800 | 1,093,492 | (914,193) | 1,723,450 |
| INCOME TAX AND SOCIAL CONTRIBUTION ON PROFIT | (222,175) | (258,331) | (62,863) | (18,912) | (25,139) | (15,012) | - | (9,262) | (54,143) | - | (665,837) |
| NET INCOME | 454,972 | 593,746 | (230,012) | 38,595 | 46,276 | 29,192 | (65,850) | 65,538 | 1,039,349 | (914,193) | 1,057,613 |
| Attributed to controlling shareholders | 454,972 | 593,746 | (230,012) | 38,595 | 23,601 | 20,434 | (52,681) | 65,538 | 1,039,349 | - | 1,039,349 |
| Attributed to non-controlling interest | - | - | - | - | 22,675 | 8,758 | (13,169) | - | - | - | 18,264 |
| EBITDA | 1,128,916 | 947,830 | (109,647) | 93,373 | 87,241 | 140,298 | (70,308) | 146,160 | 1,048,473 | (914,193) | 2,498,143 |
| ¹ Wind Farms, Copel Renováveis and Copel Participações | |||||||||||
Amounts subject to rounding.
56
Earnings Release 3Q16 |
| R$'000 | |||||||||||
| Income Statement 9M15 | Geração e Transmissão | Distribuição | Telecom | Compagas | Elejor | UEG Araucária | Other¹ | Holding | Elimin. e Reclassif. | Consolidated | |
| Generation | Transmission | ||||||||||
| NET OPERATING INCOME | 1,833,992 | 330,462 | 7,217,318 | 204,141 | 1,228,211 | 175,343 | 1,406,826 | 120,501 | - | (1,125,666) | 11,391,128 |
| Electricity sales to final customers | 424,333 | - | 3,737,614 | - | - | - | - | - | - | (3,203) | 4,158,744 |
| Electricity sales to distributors | 1,390,849 | - | 204,625 | - | - | 175,343 | 1,406,822 | 120,501 | - | (212,324) | 3,085,816 |
| Use of the main distribution and transmission grid (TUSD/ TUST) | - | 179,605 | 1,598,813 | - | - | - | - | - | - | (61,067) | 1,717,351 |
| Construction revenue | - | 136,782 | 626,758 | - | 60,138 | - | - | - | - | - | 823,678 |
| Telecommunications | - | - | - | 174,789 | - | - | - | - | - | (21,106) | 153,683 |
| Distribution of piped gas | - | - | - | - | 1,168,073 | - | - | - | - | (766,553) | 401,520 |
| Sectoral assets and liabilities result | - | - | 979,343 | 979,343 | |||||||
| Other operating revenues | 18,810 | 14,075 | 70,165 | 29,352 | - | - | 4 | - | - | (61,413) | 70,993 |
| OPERATING COSTS AND EXPENSES | (1,257,322) | (310,949) | (7,241,236) | (139,733) | (1,200,175) | (90,474) | (1,029,227) | (169,494) | (109,295) | 1,129,798 | (10,418,107) |
| Energy purchased for resale | (292,270) | - | (4,777,595) | - | - | (44,801) | - | (112,289) | - | 211,696 | (5,015,259) |
| Charges of the main distribution and transmission grid | (186,231) | - | (464,947) | - | - | (7,482) | (14,777) | (7,907) | - | 57,877 | (623,467) |
| Personnel and management | (109,815) | (52,408) | (439,131) | (56,386) | (23,088) | (2,219) | (1,804) | (13,460) | (49,349) | - | (747,660) |
| Private pension and health plans | (28,835) | (13,856) | (123,506) | (12,968) | (1,684) | - | (196) | (1,465) | (6,099) | - | (188,609) |
| Materials | (9,005) | (2,518) | (42,385) | (1,609) | (1,328) | (222) | (173) | (143) | (416) | - | (57,799) |
| Raw material and supplies - energy production | (21,089) | - | - | - | - | - | (934,478) | - | - | 767,547 | (188,020) |
| Natural gas and supplies for gas business | - | - | - | - | (1,054,077) | - | - | - | - | - | (1,054,077) |
| Third-party services | (60,545) | (14,991) | (262,462) | (24,447) | (12,750) | (8,293) | (43,695) | (4,708) | (9,035) | 82,962 | (357,964) |
| Depreciation and amortization | (206,653) | (2,620) | (182,968) | (23,088) | (15,513) | (20,128) | (24,832) | (23,189) | (4,364) | - | (503,355) |
| Provisions and reversals | (213,915) | (37,293) | (210,338) | (3,843) | (15,827) | 401 | - | - | (20,283) | 3,959 | (497,139) |
| Construction cost | - | (177,444) | (626,758) | - | (60,138) | - | - | - | - | - | (864,340) |
| Other operating costs and expenses | (128,964) | (9,819) | (111,146) | (17,392) | (15,770) | (7,730) | (9,272) | (6,333) | (19,749) | 5,757 | (320,418) |
| EQUITY IN EARNINGS OF SUBSIDIARIES | 167,019 | 101,337 | - | - | - | - | - | (12,966) | 892,479 | (996,968) | 150,901 |
| PROFIT BEFORE FINANCIAL RESULTS AND TAXES | 743,689 | 120,850 | (23,918) | 64,408 | 28,036 | 84,869 | 377,599 | (61,959) | 783,184 | (992,836) | 1,123,922 |
| FINANCIAL RESULTS | (38,496) | 100,179 | 179,500 | 995 | 1,026 | (74,968) | 41,737 | (24,353) | (31,195) | (172) | 154,253 |
| Income tax and social contribution on profit | 33,524 | 106,911 | 370,245 | 2,244 | 7,390 | 1,828 | 45,560 | 10,180 | 171,828 | (984) | 748,726 |
| Deferred income tax and social contribution on profit | (72,020) | (6,732) | (190,745) | (1,249) | (6,364) | (76,796) | (3,823) | (34,533) | (203,023) | 812 | (594,473) |
| EARNINGS BEFORE INCOME TAXES | 705,193 | 221,029 | 155,582 | 65,403 | 29,062 | 9,901 | 419,336 | (86,312) | 751,989 | (993,008) | 1,278,175 |
| INCOME TAX AND SOCIAL CONTRIBUTION ON PROFIT | (181,608) | (40,151) | (57,383) | (21,975) | (10,623) | (3,855) | (140,970) | (3,098) | 44,927 | - | (414,736) |
| NET INCOME | 523,585 | 180,878 | 98,199 | 43,428 | 18,439 | 6,046 | 278,366 | (89,410) | 796,916 | (993,008) | 863,439 |
| Attributed to controlling shareholders | 523,585 | 180,878 | - | - | - | - | - | - | - | - | - |
| Attributed to non-controlling interest | - | - | - | - | - | - | - | - | - | - | - |
| EBITDA | 950,342 | 123,470 | 159,050 | 87,496 | 43,549 | 104,997 | 402,431 | (38,770) | 787,548 | (992,836) | 1,627,277 |
| ¹ Wind Farms, Copel Renováveis and Copel Participações | |||||||||||
Amounts subject to rounding.
57
| COMPANHIA PARANAENSE DE ENERGIA – COPEL | ||
| By: | /S/ Luiz Fernando Leone Vianna | |
Luiz Fernando Leone Vianna Chief Executive Officer | ||
This press release may contain forward-looking statements. These statements are statements that are not historical facts, and are based on management's current view and estimates of future economic circumstances, industry conditions, company performance and financial results. The words "anticipates", "believes", "estimates", "expects", "plans" and similar expressions, as they relate to the company, are intended to identify forward-looking statements. Statements regarding the declaration or payment of dividends, the implementation of principal operating and financing strategies and capital expenditure plans, the direction of future operations and the factors or trends affecting financial condition, liquidity or results of operations are examples of forward-looking statements. Such statements reflect the current views of management and are subject to a number of risks and uncertainties. There is no guarantee that the expected events, trends or results will actually occur. The statements are based on many assumptions and factors, including general economic and market conditions, industry conditions, and operating factors. Any changes in such assumptions or factors could cause actual results to differ materially from current expectations.