Companhia Paranaense de Energia - COPEL (ELP)
Filed: 18 May 17, 12:00am
Indicate by check mark whether the registrant by furnishing the information contained in this Form is also thereby furnishing the information to the Commission pursuant to Rule 12g3-2(b) under the Securities Exchange Act of 1934.
Yes _______ No ___X____![]()
1Q17 Results
Copel records EBITDA of R$1,006.1 million in the 1Q17
|  Net income of R $ 417.3 million in 1Q17; Net income of R $ 417.3 million in 1Q17; |
| Dividends of R$506.2 million referring to 2016 - 50% of payout; | |
| Grid Market grows 3.5% in 1Q17; | |
| R$587.6 million of capex carried in 1Q17; | |
| New CFO. |
| 1Q17 (1) | 4Q16 (2) | 1Q16 (3) | Var.% (1/3) | |
| Net Operating Revenues (R$ million) | 3,297.0 | 3,426.4 | 3,082.7 | 7.0 |
| Operating Income (R$ million) | 667.0 | (245.1) | 191.4 | 248.4 |
| Net Income (R$ million) | 417.3 | (109.8) | 136.1 | 206.6 |
| Earnings per share (R$)¹ | 1.50 | (0.29) | 0.49 | 207.4 |
| EBITDA (R$ million) | 1,006.1 | 254.3 | 537.4 | 87.2 |
| Return on Shareholders' Equity (annualized)² | 11.5% | - | 3.8% | 203.2 |
| Energy Supply (GWh) | 6,513 | 6,250 | 6,896 | (5.6) |
| Capex (R$ million)³ | 587.6 | 830.7 | 891.6 | (34.1) |
| EBITDA Margin | 30.5% | 7.4% | 17.4% | 75.1 |
| Operating Margin | 20.2% | - | 6.2% | 225.7 |
| Net Margin | 12.7% | - | 4.4% | 186.7 |
| ¹ Consider the Net Income attributed to the shareholders of the parent company. | ||||
| ² Calculated according to the initial shareholders' equity for the year. | ||||
| ³ Includes contributions and advances for future investments and capital increases. | ||||
| Values subject to rounding adjustments. | ||||
| Average Rates (R$/MWh) | Mar-17 | Dec-16 | Sep-16 | Jun-16 | Mar-16 |
| Power Purchase Average Rate - Copel Dis ¹ | 152.67 | 156.88 | 161.11 | 157.74 | 152.05 |
| Retail Average Rate - Copel Dis² | 384.19 | 380.27 | 379.04 | 433.87 | 433.82 |
| Sales to Distributors Average Rate - Copel GeT³ | 205.10 | 187.18 | 185.79 | 176.93 | 170.92 |
| Indicators | Mar-17 | Dec-16 | Sep-16 | Jun-16 | Mar-16 |
| Equity (R$ Thousand) | 15,567,737 | 15,155,446 | 15,609,198 | 15,683,988 | 14,710,154 |
| Net debt (R$ Thousand)4 | 8,955,773 | 8,656,231 | 8,094,830 | 7,482,218 | 7,341,040 |
| Book Value per Share (R$) | 56.89 | 55.38 | 57.04 | 57.31 | 53.75 |
| Net debt/ Shareholders' Net Equity5 | 57.3% | 58.3% | 56.1% | 48.9% | 53.2% |
| Current Liquidity | 0.8 | 0.8 | 1.1 | 1.0 | 1.2 |
| ¹Considers PIS/COFINS. | |||||
| ² Does not consider tariff flags. ICMS net. | |||||
| ³ Included Guarantees and Endorsements. ICMS net. | |||||
| 4Included Guarantees and Endorsements and collaterals and escrow accounts. | |||||
| 5Considers gross debt without endorsements and guarantees. | |||||
| CPLE3 | R$25.88 | ELP | US$ 10.31 | Market value | R$8.0 bi |
| CPLE6 | R$32.74 | XCOP | € 9.65 | * Quotes 03.31.2017 |

LIST OF CONTENTS
| 1. Main Events in the Period | 3 |
| 2. Financial Performance | 8 |
| 2.1 Operating Revenues | 8 |
| 2.2 Operating Costs and Expenses | 9 |
| 2.3 Equity in the Earnings of Subsidiaries | 11 |
| 2.4 EBITDA | 12 |
| 2.5 Financial Result | 12 |
| 2.6 Consolidated Net Income | 13 |
| 2.7 Consolidated Income Statement | 14 |
| 3. Main Account and Changes Balance Sheet | 15 |
| 3.1 Main Accounts | 15 |
| 3.2 Balance Sheet – Assets | 17 |
| 3.3 Debt | 18 |
| 3.4 Balance Sheet – Liabilities | 21 |
| 4. Performance of the Main Companies | 21 |
| 4.1 Copel Geração e Transmissão | 21 |
| 4.2 Copel Distribuição | 23 |
| 4.3 Copel Telecomunicações | 24 |
| 4.5 Accounting Information | 25 |
| 5. Investment Program | 26 |
| 6. Power Market and Tariffs | 26 |
| 6.1 Captive Market – Copel Distribuição | 26 |
| 6.2 Grid Market (TUSD) | 27 |
| 6.3 Electricity Sales | 27 |
| 6.4 Total Energy Sold | 28 |
| 6.5 Energy Flow | 29 |
| 6.6 Tariffs | 31 |
| 7. Capital Market | 33 |
| 7.1 Capital Stock | 33 |
| 7.2 Stock Performance | 35 |
| 7.3 Dividends and Interest on Own Capital | 36 |
| 8. Operating Performance | 37 |
| 8.1 Power Generation | 37 |
| 8.2 Transmission | 42 |
| 8.3 Distribution | 44 |
| 8.4 Telecommunications | 46 |
| 8.5 Equity Interests | 47 |
| 8.6 New Projects | 47 |
| 9. Other Information | 49 |
| 9.1 Human Resources | 49 |
| 9.2 Main Operational Indicators | 50 |
| 9.3 Conference Call 1Q17 Results | 51 |
| Exhibit I – Consolidated Cash Flow Statement | 52 |
| Exhibit II – Financial Statements – Wholly Owned Subsidiaries | 53 |
| Exhibit III – Financial Statements by Company | 56 |
| 2 | |
| * Amounts subject to rounding. |
1. Main Events in the Period
Copel reported an EBITDA of R$1,006.1 million in the 1Q17, 87.2% higher than the R$537.4 million recorded in the 1Q16, mainly due (a) the recognition of R$224.6 million concerning the remeasurement of transmission assets (RBSE), (b) the result of the distributor's 4th tariff review cycle, in June 2016, plus the 3.5% increase in the grid market, (c) the reduction in the cost of electricity purchase from Itaipu, as a result of the dollar’s lower exchange rate, and (d) the 36.1% decrease in charges of the mains transmission and distribution grid, due to the smaller dispatch outside the order of merit. In the 1Q17, Copel reported a net income of R$417.3 million vs. R$136.1 million in the 1Q16. More details in theitem 2.
RBSE Indemnification
On May 9, 2017, Aneel approved the result of the inspection of the appraisal report of the transmission assets existing on May 31, 2000 (Existing Basic Network System - RBSE and Other Transmission Facilities - RPC) related to the concession agreement No. 060/2001. The Agency recognized the amount of R$667.6 million as the net value of the assets for the purposes of indemnification as of December 31, 2012.
Until December 31, 2016, based on the information available in Decree No. 120/2016 and in the Tariff Adjustment Procedure (PRORET), the Company, based in its the best estimate, this had already recognized in its financial statements the amount of R$580.7 million at the base-date of December 31, 2012 and the respective reevaluation of the estimated cash flow, which represented a balance of the financial asset of R$1,187.0 million, of which R$809.7 million had as counterpart the operating revenue and affected the result of 2016.
In the 1Q17, the Company remeasured the asset based on the amount approved by Aneel, which resulted in the recognition of R$224.6 million in operating revenue, totaling R$1,411.6 million in financial asset.
In addition, on April 11, 2017, a court order was issued concerning the lawsuit filed by three business associations, which provisionally establishes the exclusion of the "compensation" portion, provided for in Article 15, Paragraph 2, of Law No. 12,783/2013 and the subsequent recalculation of fares by Aneel. The Copel, based on the opinion of its legal advisors, understands that this is an interim decision that does not go against the right of the Company to receive the due amounts related to RBSE assets and that these rights are assured by the Law.
Reduction in the recoverable value of assets of the generation segment - Impairment
In the first quarter of 2017, a complement was added to the estimate in order to reduce the recoverable value of the wind power assets of the Cutia Wind Complex, whose impact on the result was of R$30.0 million. The calculation of the value took into account the assumptions used in the impairment tests carried out in the 4Q16, with the most relevant being: updating the discount rate and increasing the CAPEX of the projects.
3
* Amounts subject to rounding.
Dividends
At the 62nd Annual Shareholders' Meeting (ASM), held on April 28, 2017, was approved by a majority the distribution of dividends in the total amount of R$506.2 million for the 2016 fiscal year, corresponding to 50% of the adjusted net income of 2016, with R$282.9 million as interest on equity, paid until June 30, 2017, and R$223.3 million as dividends, paid until December 31, 2017. The effective date of the payment will be disclosed in a timely manner through a notice to the shareholders.
New Chief Financial and Investor Relations Officer
Mr. Adriano Rudek de Moura is Copel’s new CFO. He has built a great part of his career at the multinational Electrolux, a leading global company in home appliances, present in over 150 countries. Mr. Moura has a bachelor's degree in Accounting and a specialization degree in Controllership and Finance from University of São Paulo (USP). With thirty-four years’ experience in the financial area, he has an extensive experience in Strategic, Financial, Tax and Corporate Planning, Investment Analysis, M&A, Cash Management and Asset Exposure, Pricing & Revenue Management, Corporate Governance, Internal Controls (SOX), Reports (IFRS, CPCs, Group Accounting Manual), Compliance (Accounting & Tax), IT, Investor Relations, Financial Institutions, External Audit and Government. He has occupied several management positions at Electrolux and, for the last 14 years, he has worked as the Vice President of Finance, Administration and Investor Relations for Electrolux's Latin American operations.
New composition of the Board of Directors and Fiscal Council
At the 62nd Annual Shareholders' Meeting (ASM), held on April 28, 2017, the new members of the Board of Directors and Fiscal Council were elected for the 2017-2019 term of office. The Company's Board of Directors has (a) five members appointed by the State of Paraná, (b) two members appointed by BNDESPar S.A., (c) one member appointed by the Company's employees, and (d) one member elected by the minority shareholders. The current composition of Copel's Board of Directors is presented in the following table:
| 4 | |
| * Amounts subject to rounding. |
| Term of office | Name | Indicated by |
| 2017 - 2019 | Mauricio Shulman (Chairman) | State of Paraná (majoritary shareholder) |
| Antonio Sergio de Souza Guetter | State of Paraná (majoritary shareholder) | |
| George Hermann Rodolfo Tormin | State of Paraná (majoritary shareholder) | |
| Rogério Perna | State of Paraná (majoritary shareholder) | |
| Luiz Henrique Tessuti Dividino | State of Paraná (majoritary shareholder) | |
| Adriana Angela Antoniolli | Company employees¹ | |
| Leila Abraham Loria | BNDESPar S.A | |
| Olga Stankevicius Colpo | BNDESPar S.A | |
| Sérgio Abu Jamra Misael | Common and Preferred (minority shareholders) | |
| ¹ According to State Law No 8,096/85, regulated by Decree No 6,383/85 and by State Law No 8,681/87. | ||
The Fiscal Council, which is composed of five sitting members and five alternate members, is now composed as follows:
| Mandate | Holder | Alternate | Indicated by |
| 2017 - 2019 | Mauro Ricardo Machado Costa | Roberto Brunner | State of Paraná (majoritary shareholder) |
| Norberto Anacleto Ortigara | Osni Ristow | State of Paraná (majoritary shareholder) | |
| Nelson Leal Junior | Gilmar Mendes Lourenço | State of Paraná (majoritary shareholder) | |
| Roberto Lamb | Kurt Janos Toth | Common Shareholders (Minority) | |
| Letícia Pedercini Issa Maia | Alexandre Pedercini Issa | Preferred Shareholders (Minority) |
New Chief Executive Officer of Copel Distribuição
Mr. Maximiliano Andres Orfali is the new CEO of Copel Distribuição. Mr. Max is a career employee of Copel, with an undergraduate degree in Electrical Engineering from the Federal University of Santa Catarina, an Executive MBA degree in Business Finance and Business Management (FGV), as well as a specialization degree in Electrical Energy Systems (UFSC) and Technical Management of Concessionaires (UFPR). With twenty-two years of career in the Company, he occupied several management positions at Copel Distribuição, as Department Manager of different areas (Operation, Maintenance, Measurement, Billing, Services and Commercial) and Head of Finance and Regulation, Operations Engineering and Maintenance, Commercial, and Implementation of Systems. He recently worked as Head of Business Management of the Subsidiary.
HPP Colíder
On February, 2017, the Energy Trading Chamber - CCEE (Câmara de Comercialização de Energia) announced the result of the processing of the new statements, backdating to 2016, for the Mechanism for the Compensation of Surplus and Deficits - MCSD of New Energy from July to December 2016. Copel GeT participated in the reduction offer of the Electric Power Trading Agreements in the Regulated Environment - CCEARs (Contratos de Comercialização de Energia no Ambiente Regulado) of the HPP Colíder, obtaining the reduction of the agreements in its entirety (average of 125 MW) from July 2016.
| 5 | |
| * Amounts subject to rounding. |
It should be noted that due to the preliminary protection issued by the TRF of the 1st Region, in October 2015, Copel GeT was already relieved to deliver the energy of the CCEARs in that period.
The schedule of the Colíder HPP, which is being built in the Teles Pires river, in the state of Mato Grosso, was impacted by suppliers who failed to comply with the expected schedule for the delivery of equipment related to electromechanical assembly services. The first generating unit’s startup is scheduled for February 2018, while the third and final generating unit is scheduled to go into operation in July 2018.
Revised Assured Power
On May 4, 2017, Decree No. 178 of the Ministry of Mines and Energy was published, which disclosed the revised amounts of the Assured Power of Hydroelectric Power Plants - HPPs centrally dispatched in the National Interconnected System (SIN) obtained through the application of the methodology presented in the Report of the Ordinary Review of the Assured Power of the Electric Energy of HPPs, dated from April 25, 2017, prepared by the Working Group established by Decree MME No. 681, of December 30, 2014, composed of representatives of the Ministry of Mines and Energy, of the Electric Energy Research Center - CEPEL and of the Energy Research Company - EPE.
With this review, three Copel GeT’ power plants had the revised assured power, which resulted in an increase of 3.4 average MW, equivalent to 0.2% of the total of this subsidiary. The amounts of assured power of the plants will be valid as of January 1, 2018 and are detailed below.
| Power Plants | Installed Capacity (MW) | Current Assured Power (Average MW) | Revised Assured Power¹ (Average MW) | Concession Expires |
| Hydroelectric Power Plants | ||||
| HPP Gov. Bento Munhoz da Rocha Netto (Foz do Areia) | 1,676.0 | 576.0 | 603.3 | 09.17.2023 |
| HPP Gov. Ney Aminthas de Barros Braga (Segredo) | 1,260.0 | 603.0 | 578.5 | 11.15.2029 |
| HPP Gov. José Richa (Salto Caxias) | 1,240.0 | 605.0 | 605.6 | 05.04.2030 |
| TOTAL | 4,176.0 | 1,784.0 | 1,787.4 | |
| ¹ Valid from January 1, 2018. |
The assured power of the other plants of the Company remain valid.
Dominó Holdings S.A.
On March 13, 2017, at the Extraordinary General Meeting, the shareholders of Dominó Holdings (49.0% Copel Comercialização SA) authorized the reduction of the Company's capital stock without the cancellation of shares, upon delivery of all 16,237,359 Common shares issued by Sanepar, owned by Dominó Holdings, in the proportion of its stake. As a result, Copel Comercialização became the direct owner of 7,956,306 common
| 6 | |
| * Amounts subject to rounding. |
shares of Sanepar, valued by equity value of R$73.4 million, as shown in the table below.
| Shareholder | Common | % | TOTAL | % | ||
| Copel Comercialização S.A. | 7,956,306 | 4.7 | 7,956,306 | 1.6 | ||
As a result, Copel now has the following direct interest in Sanepar.
| Shareholder | Common | % | Preferred | % | TOTAL | % | Financial Assets (R$ million) | |
| Copel Holding S.A. | - | - | 36,343,267 | 10.8 | 36,343,267 | 7.2 | 399.8 | |
| Copel Comercialização S.A | 7,956,306 | 4.7 | - | - | 7,956,306 | 1.6 | 73.4 | |
| Total | 7,956,306 | 4.7 | 36,343,267 | 10.8 | 44,299,573 | 8.8 | 473.2 | |
| 7 | |
| * Amounts subject to rounding. |
2. Financial Performance
The analyzes refer to the first quarter of 2017 compared to the same period of 2016.
2.1 Operating Revenues
Net operating revenue came to R$3,297.0 million, 7.0% up on 1Q17, chiefly due to (a) the 32.9% increase in the "use of the main distribution and transmission grid" line, composed by the TUSD and TUST revenues, mainly reflecting (i) the recognition of R$224.6 million arising from the remeasurement of transmission assets concerning the RBSE, (ii) the result of the 4th tariff review cycle of Copel Distribuição, (iii) the 3.5% growth in the grid market, and (iv) the expansion and updating of the transmission assets base of Copel GeT; and (b) the 6.2% growth in the "electricity sales to distributors", result of higher revenues in CCEE, due to the higher average GSF (107.0% in the 1Q17 over the 87.8% of the 1Q16) and the higher average spot price (PLD) in the period (R$155.37/MWh in the 1Q17 over the R$34.59/MWh of the 1Q16).
The variation in the operating revenue was negatively impacted by the 28.2% reduction in the "electricity sales to final customers" line, due to the 11.3% decrease in the captive market of Copel Distribuição and the 12.9% average reduction applied to the tariffs from June 24, 2016.
The following variations are also highlights:
(i) the 11.9% increase in “revenues from telecommunications”, due to the expansion of the service to new customers; (ii) the 35.0% increase in “other operating revenues”, mainly due to fines paid by captive consumers who migrated to the free market, revenues from leases and rentals, and provision of maintenance and operation services; (iii) a negative result of R$148.0 million in sectorial financial assets and liabilities, resulting from the lower purchase cost of Itaipu's electric energy, due negative dollar exchange variation when compared to the previous tariff readjustment, and to the receipt of a higher amount of the recoverable portion of the charges of the sector within the current tariff; and (iv) decrease of 4.5% in “distribution of piped gas”, reflecting the reduction in consumption of natural gas, mainly in the industrial and cogeneration sector, partially offset by the reajustment in gas prices.
| 8 | |
| * Amounts subject to rounding. |
| R$ '000 | ||||
| Income Statement | 1Q17 (1) | 4Q16 (2) | 1Q16 (3) | Var.% (1/3) |
| Electricity sales to final customers | 1,133,537 | 1,100,531 | 1,579,314 | (28.2) |
| Electricity sales to distributors | 724,199 | 681,108 | 682,006 | 6.2 |
| Use of the main distribution and transmission grid | 1,135,544 | 827,635 | 854,217 | 32.9 |
| Construction revenue | 219,406 | 344,977 | 271,153 | (19.1) |
| Fair value of assets from the indemnity for the concession | 6,329 | 132,741 | 9,026 | (29.9) |
| Revenues from telecommunications | 69,912 | 74,232 | 62,497 | 11.9 |
| Distribution of piped gas | 117,627 | 102,882 | 123,192 | (4.5) |
| Result of sectorial financial assets and liabilities | (147,977) | 110,470 | (527,202) | (71.9) |
| Other operating revenues | 38,434 | 51,787 | 28,461 | 35.0 |
| Net Operating Revenue | 3,297,011 | 3,426,363 | 3,082,664 | 7.0 |
2.2 Operating Costs and Expenses
In 1Q17, operating costs and expenses totaled R$2,507.7 million, 9.5% down, reflecting the (a) reduction of 10.3% in "electricity purchased for resale", mainly due Itaipu, due to the lower dollar exchange in the period (R$3.15/US$1.00 in the 1Q17 versus R$3.90/US$1.00 in the 1Q16), partially offset by the readjustment applied to the power transfer rate of the plant, which was of US$28.73/KW in 2017 over the US$25.78/KW in 2016; (b) the reduction of 36.1% in "charges of the main distribution and transmission grid" due to the lower costs with system service charges (ESS), given the lower thermal dispatch outside the merit order; and (c) a 28.2% decrease in "natural gas and supplies for the gas business" costs, due to the non-activation of TTP Araucária (over a generation of 78 GWh in the 1Q16).
| R$'000 | ||||
| Electricity Purchased for Resale | 1Q17 (1) | 4Q16 (2) | 1Q16 (3) | Var.% (1/3) |
| CCEAR (Auction) | 720,883 | 849,717 | 812,470 | (11.3) |
| Itaipu Binacional | 264,595 | 251,131 | 301,584 | (12.3) |
| CCEE | 125,846 | 188,534 | 133,063 | (5.4) |
| Proinfa | 54,338 | 60,536 | 60,573 | (10.3) |
| Bilateral | 9,148 | 6,315 | 4,217 | 116.9 |
| (-) PIS/Pasep and Cofins | (98,301) | (98,006) | (112,036) | (12.3) |
| TOTAL | 1,076,509 | 1,258,227 | 1,199,871 | (10.3) |
| R$000 | ||||
| Charges of the main distribution and transmission grid | 1Q17 (1) | 4Q16 (2) | 1Q16 (3) | Var.% (1/3) |
| System usage charges | 141,237 | 156,543 | 150,729 | (6.3) |
| Itaipu transportation charges | 24,598 | 23,777 | 23,731 | 3.7 |
| Charge reserve energy - EER | - | - | 17,686 | - |
| System Service Charges - ESS | 20,907 | 25,499 | 93,417 | (77.6) |
| (-) PIS / Pasep and Cofins taxes on charges for use of power grid | (17,731) | (21,130) | (20,882) | (15.1) |
| TOTAL | 169,011 | 184,689 | 264,681 | (36.1) |
| 9 | |
| * Amounts subject to rounding. |
The reduction in operating costs and expenses was partially offset by the 11.3% growth in the "personnel and management" line, mainly reflecting the salary adjustment applied from October 2016 and the recognition of an additional cost of R$55.0 million in the construction cost line, mainly due to the increase in capex and higher expropriation costs related to the Araraquara II - Taubaté transmission line.
The following are also noteworthy:
(i) recording R$98.7 million in "provisions and reversals", of which R$30.0 million refers to impairment of the assets of the Cutia Wind Complex, R$26.3 million to net provisions with labor lawsuits, R$24.7 million to allowance for doubtful accounts (PECLD), R$15.8 million to net provisions for civil and administrative lawsuits, and R$1.9 million to losses of tax credits, regulatory lawsuits, passage, environmental and expropriation easement; (ii) a 14.1% decrease in "other costs and expenses", mainly due to the reduction of R$18.3 million in costs related to financial compensation for the use of water resources, reflecting the lower generation of hydraulic energy in the period (6,181 GWh in 1Q17 versus 7,471 GWh in 1Q16); and (iii) a 7.2% decrease in "third-party services" due to lower expenses with maintenance of the electric system and authorized and accredited agents;
| R$ '000 | ||||
| Operating Costs and Expenses | 1Q17 (1) | 4Q16 (2) | 1Q16 (3) | Var.% (1/3) |
| Electricity purchased for resale | 1,076,509 | 1,258,227 | 1,199,871 | (10.3) |
| Charge of the main distribution and transmission grid | 169,011 | 184,689 | 264,681 | (36.1) |
| Personnel and management | 306,098 | 457,905 | 275,131 | 11.3 |
| Pension and healthcare plans | 59,138 | 67,404 | 63,508 | (6.9) |
| Materials and supplies | 19,371 | 18,365 | 23,315 | (16.9) |
| Materials and supplies for power eletricity | 5,061 | 8,775 | 10,494 | (51.8) |
| Natural gas and supplies for the gas business | 82,339 | 61,177 | 114,651 | (28.2) |
| Third-party services | 120,910 | 147,936 | 130,290 | (7.2) |
| Depreciation and amortization | 183,078 | 176,188 | 179,036 | 2.3 |
| Provisions and reversals | 98,699 | 603,729 | 121,061 | (18.5) |
| Construction cost | 274,729 | 353,720 | 258,865 | 6.1 |
| Other cost and expenses | 112,778 | 58,008 | 131,320 | (14.1) |
| TOTAL | 2,507,721 | 3,396,123 | 2,772,223 | (9.5) |
| 10 | |
| * Amounts subject to rounding. |
2.3 Equity in the Earnings of Subsidiaries
Equity in the earnings of investees reflects gains and losses from investments in Copel’s investees and is presented in the table below.
| '000 | ||||
| Company | 1Q17 (1) | 4Q16 (2) | 1Q16 (3) | Var. % (1/3) |
| Joint Ventures | 28,839 | 36,614 | 31,608 | (8.8) |
| Dominó Holdings S.A. | (629) | 10,508 | 8,692 | - |
| Voltalia São Miguel do Gostoso I Participações S.A. | 360 | 1,171 | 579 | (37.8) |
| Paraná Gás Exploração e Produção S.A. | (19) | (32) | (21) | (9.5) |
| Costa Oeste Transmissora de Energia S.A. | 1,081 | 493 | 1,913 | (43.5) |
| Marumbi Transmissora de Energia S.A. | 2,686 | (433) | 4,632 | (42.0) |
| Transmissora Sul Brasileira de Energia S.A. | 688 | 530 | (110) | - |
| Caiuá Transmissora de Energia S.A. | 1,507 | (6) | 621 | 142.7 |
| Integração Maranhense Transmissora de Energia S.A. | 3,200 | 461 | 291 | 999.7 |
| Matrinchã Transmissora de Energia (TP NORTE) S.A. | 5,922 | 9,496 | 10,416 | (43.1) |
| Guaraciaba Transmissora de Energia (TP SUL) S.A. | 8,320 | 6,675 | 2,935 | 183.5 |
| Paranaíba Transmissora de Energia S.A. | 3,977 | 4,052 | 2,719 | 46.3 |
| Mata de Santa Genebra Transmissão S.A. | 3,065 | 1,610 | (2,534) | - |
| Cantareira Transmissora de Energia S.A. | (1,319) | 2,089 | 1,475 | - |
| Associates | 4,874 | 11,213 | 16,286 | (70.1) |
| Cia. de Saneamento do Paraná - Sanepar¹ | - | 6,600 | 11,111 | - |
| Dona Francisca Energética S.A. | 2,168 | 1,876 | 2,656 | (18.4) |
| Foz do Chopim Energética Ltda. | 2,683 | 2,200 | 2,799 | (4.1) |
| Others² | 23 | 537 | (280) | - |
| TOTAL | 33,713 | 47,827 | 47,894 | (29.6) |
| ¹ Equity accounting was accounted up until 11.30.2016. | ||||
| ² Includes Carbocampel S.A., Copel Amec S/C Ltda, Escoelectric Ltda e Dois Saltos Ltda. | ||||
Due to the conversion of common shares into preferred shares issued by Sanepar and held by Dominó Holdings, the Shareholders' Agreement, signed between the state of Paraná and Dominó Holdings, was automatically terminated. As a result, Copel no longer classifies its investment in Sanepar as an affiliate, but as a financial asset available for sale. Accordingly, it stopped being recorded under the equity method and is now recorded at fair value. More details in theitem 3.1.
| 11 | |
| * Amounts subject to rounding. |
2.4 EBITDA
In the 1Q17, earnings before interest, taxes, depreciation and amortization reached R$1,006.1 million, an increase of 87.2% over the R$537.3 million recorded in the 1Q16, mainly reflecting the re-measurement of the cash flow of the transmission assets related to the RBSE, and the result of the 4th Tariff Review Cycle of Copel Distribuição valid as of June 24, 2016.
Excluding the non-recurring effects of the period, adjusted EBITDA would have been R$811.5 million in 1Q17, 51% higher the same period in 2016. The following table shows the items considered in the calculation of adjusted EBITDA.
| R$ million | |||
| Adjusted EBITDA | 1Q17 (1) | 1Q16 (2) | Var.% (1/2) |
| EBITDA | 1,006.1 | 537.4 | 87.2 |
| (-)/+ Impairment Testing - Wind Farms | 30.0 | - | - |
| (+/-) Remeasurement of financial assets RBSE | (224.6) | - | - |
| Adjusted EBITDA | 811.5 | 537.4 | 51.0 |
2.5 Financial Result
In the 1Q17, the financial income totaled R$163.6 million over the R$204.9 million in the 1Q16, mainly reflecting the lower income from financial investments, resulting from the drop in the Selic rate (average of 12.7% in the 1Q17 vs. 14.15% in the 1Q16), the lower income and monetary variation on CRC transferred, due to the lower IGP-DI in the period (0.73% in the 1Q17 vs. 2.97% in the 1Q16), and the lower balance related to interest rate on bills paid in arrears on energy bills.
The financial expenses recorded in the 1Q17 totaled R$319.6 million, a balance 14.0% lower than the one recorded in the 1Q16, mostly due the lower exchange variation on the purchase of electricity from Itaipu and the higher balance of financing and debentures, partially offset by the drop in interest and the dollar exchange rate.
| 12 | |
| * Amounts subject to rounding. |
The following table shows these changes and the financial result.
| R$'000 | ||||
| 1Q17 (1) | 4Q16 (2) | 1Q16 (3) | Var.% (1/3) | |
| Financial Revenues | 163,587 | 72,356 | 204,943 | (20.2) |
| Income and monetary variation on CRC transfer | 32,197 | 46,117 | 57,468 | (44.0) |
| Income from investments held for trading | 35,051 | 35,524 | 41,945 | (16.4) |
| Monetary restatement on indemnifiable assets - concession | - | (129,311) | - | - |
| Late fees on electricity bills | 48,062 | 43,698 | 58,604 | (18.0) |
| Income from financial investments available for sale | 3,160 | 3,200 | 3,099 | 2.0 |
| Monetary restatement and adjustment to present value of accounts payable related to concession | - | 1 | 841 | - |
| Income from sectorial assets and liabilities | 11,509 | 1 | 16,903 | (31.9) |
| Exchange variation About Purchase Itaipu Electric Power | 8,748 | 2,999 | 17,305 | (49.4) |
| Escrow deposits monetary variation | 7,300 | 99,823 | - | - |
| Other financial revenues | 17,560 | (29,696) | 8,778 | 100.0 |
| Financial Expenses | (319,608) | (395,515) | (371,830) | (14.0) |
| Monetary variation, foreign exchange and debt service charges | (272,086) | (287,223) | (239,673) | 13.5 |
| Monetary variation and adjustment to present value of accounts payable related to concession | (18,361) | (16,846) | (35,735) | (48.6) |
| Exchange variation About Purchase Itaipu Electric Power | - | (8,889) | (10,533) | - |
| Pis/ Pasep and Cofins taxes over interest on equity | - | (40,607) | (3,043) | - |
| Income from sectorial assets and liabilities | - | 4,257 | (1,648) | - |
| Monetary and exchange variation | - | (54,753) | - | - |
| Interest on R&D and PEE | (10,592) | (10,813) | (9,602) | 10.3 |
| Accounts receivable tied to the concession fair value's update | (5,779) | - | - | - |
| Other financial expenses | (12,790) | 19,359 | (71,596) | (82.1) |
| Financial income (expenses) | (156,021) | (323,159) | (166,887) | (6.5) |
2.6 Consolidated Net Income
In 1Q17, Copel recorded net income of R$417.3 million, 206.6% higher than the R$136.1 million registered in the same period of 2016.
| 13 | |
| * Amounts subject to rounding. |
2.7 Consolidated Income Statement
| R$'000 | ||||
| Income Statement | 1Q17 (1) | 4Q16 (2) | 1Q16 (3) | Var.% (1/3) |
| OPERATING REVENUES | 3,297,011 | 3,426,363 | 3,082,664 | 7.0 |
| Electricity sales to final customers | 1,133,537 | 1,100,531 | 1,579,314 | (28.2) |
| Electricity sales to distributors | 724,199 | 681,108 | 682,006 | 6.2 |
| Use of the main distribution and transmission grid | 1,135,544 | 827,635 | 854,217 | 32.9 |
| Construction revenue | 219,406 | 344,977 | 271,153 | (19.1) |
| Fair value of assets from the indemnity for the concession | 6,329 | 132,741 | 9,026 | (29.9) |
| Revenues from telecommunications | 69,912 | 74,232 | 62,497 | 11.9 |
| Distribution of piped gas | 117,627 | 102,882 | 123,192 | (4.5) |
| Result of Sectorial financial assets and liabilities | (147,977) | 110,470 | (527,202) | (71.9) |
| Other operating revenues | 38,434 | 51,787 | 28,461 | 35.0 |
| OPERATING COSTS AND EXPENSES | (2,507,721) | (3,396,123) | (2,772,223) | (9.5) |
| Electricity purchased for resale | (1,076,509) | (1,258,227) | (1,199,871) | (10.3) |
| Charge of the main distribution and transmission grid | (169,011) | (184,689) | (264,681) | (36.1) |
| Personnel and management | (306,098) | (457,905) | (275,131) | 11.3 |
| Pension and healthcare plans | (59,138) | (67,404) | (63,508) | (6.9) |
| Materials and supplies | (19,371) | (18,365) | (23,315) | (16.9) |
| Materials and supplies for power eletricity | (5,061) | (8,775) | (10,494) | (51.8) |
| Natural gas and supplies for the gas business | (82,339) | (61,177) | (114,651) | (28.2) |
| Third-party services | (120,910) | (147,936) | (130,290) | (7.2) |
| Depreciation and amortization | (183,078) | (176,188) | (179,036) | 2.3 |
| Provisions and reversals | (98,699) | (603,729) | (121,061) | (18.5) |
| Construction cost | (274,729) | (353,720) | (258,865) | 6.1 |
| Other cost and expenses | (112,778) | (58,008) | (131,320) | (14.1) |
| EQUITY IN EARNINGS OF SUBSIDIARIES | 33,713 | 47,827 | 47,894 | (29.6) |
| PROFIT BEFORE FINANCIAL RESULTS AND TAXES | 823,003 | 78,067 | 358,335 | 129.7 |
| FINANCIAL RESULTS | (156,021) | (323,159) | (166,887) | (6.5) |
| Financial income | 163,587 | 72,356 | 204,943 | (20.2) |
| Financial expenses | (319,608) | (395,515) | (371,830) | (14.0) |
| OPERATIONAL EXPENSES/ INCOME | 666,982 | (245,092) | 191,448 | 248.4 |
| INCOME TAX AND SOCIAL CONTRIBUTION ON PROFIT | (249,712) | 135,269 | (55,359) | 351.1 |
| Income tax and social contribution on profit | (193,112) | 50,315 | (353,151) | (45.3) |
| Deferred income tax and social contribution on profit | (56,600) | 84,954 | 297,792 | - |
| NET INCOME (LOSS) | 417,270 | (109,823) | 136,089 | 206.6 |
| Attributed to controlling shareholders | 410,342 | (80,699) | 133,506 | 207.4 |
| Attributed to non-controlling interest | 6,928 | (29,124) | 2,583 | 168.2 |
| EBITDA | 1,006,081 | 254,255 | 537,371 | 87.2 |
| 14 | |
| * Amounts subject to rounding. |
3. Main Account and Changes Balance Sheet
The main accounts and changes in the Balance Sheet in relation to December 2016 are described below. Additional information can be found in the Notes to our Quarterly Financial Information.
3.1 Main Accounts
Cash, Cash Equivalents and Bonds and Securities
On March 31, 2017, the cash and cash equivalents, bonds and securities of Copel’s wholly owned subsidiaries and controlled companies totaled R$1,400.5 million, 5.3% lower than the R$1,479.6 million recorded on March 2016. These funds were invested, mostly in Bank Deposit Certificates (CDBs) and repo transactions. The investments earned an average yield of the period variation in the Interbank Deposit Certificate (CDI) rate.
CRC Transferred to the State of Paraná
Through the fourth addendum signed on January 21, 2005, the Company renegotiated the CRC balance on December 31, 2004 with the State of Paraná at R$1,197.4 million, in 244 monthly installments recalculated by the price amortization system, restated by the IGP-DI inflation index plus annual interest of 6.65%. The first installment was due on January 30, 2005, with subsequent and consecutive maturities until April 2025.
In accordance with the request by the State of Paraná, approved by the Company's Board of Directors subject to the consent of the Department of the Treasury, the Novation of the CRC Adjustment Agreement is underway, which grants, in the period from April to December 2016, a total grace period for payments and, from January to December 2017, only of the main amount, without any real loss of the total amount of the agreement, maintaining its net present value. The other clauses in the agreement will remain unchanged. The current balance of the CRC is R $ 1,524.5 million.
Other temporary investments
The Shareholders' Agreement, signed between the state of Paraná and Dominó Holdings, was terminated, removing from Dominó Holdings the significant influence over its investment in Sanepar. This occurred due to the conversion of common shares into preferred shares issued by Sanepar and held by Dominó Holdings. Given this fact, the investment of Sanepar which ceased to be classified as an affiliate and is now considered a financial asset available for sale.
With the termination of this agreement, Copel also no longer classifies its investment in Sanepar as an affiliate, but as a financial asset available for sale. On March 31, 2017, the balance of this account amounted to R$490.9 million, R$473.1 million of which is related to Copel’s investment in Sanepar.
| 15 | |
| * Amounts subject to rounding. |
Sectorial Financial Assets and Liabilities
As of December 31, 2014, Copel Distribuição has recognized sectorial financial assets and/or liabilities in its financial statements as a result of an amendment to the concession agreement that guarantees that the residual amounts of items of Portion A and other financial components not recovered or returned via tariffs will be included in, or discounted from, the calculation of the indemnification for non-amortized assets at the expiration of the concession. On March 31, 2017, the Company had a balance of R$442.1 million of sector financial liabilities. More detail in our Financial Statements (Note 9).
Accounts Receivable Related to the Concession
This line refers to accounts receivable related to the contracts for the concession of electric power generation, transmission and distribution activities. The amounts refer to (a) the concession fee paid as a result of the auction involving the Governador Parigot de Souza Plant – HPP GPS, won by Copel GeT on November 25, 2015 (R$592.5 million), (b) its investments in infrastructure and financial remuneration that have not been or will not be recovered via tariffs and/or APR until the expiration of the concession (R$2,038.7 million), (c) the amounts receivable from energy transmission assets of the Existing System Basic Network – RBSE and connection facilities and other transmission facilities - RPC, as a result of the recognition of the effects of Ordinance 120 of the Ministry of Mines and Energy (R$1,411.6 million) and (d) the gas distribution concession agreement -Compagás (R$86.9 million). On March 31, 2016, the balance of this account stood at R$4,129.6 million. For further information, please refer to notes 10 of our Financial Statements.
Accounts Receivable related to the Concession Indemnification
This account refers to the residual value of the generation assets whose concession expired in 2015 (Rio dos Patos HPP, GPS HPP and Mourão I HPP). On March 31, 2016, the amount registered in this account was R$67.6 million. More details in Notes 11 to our Financial Statements.
Investments, Property, Plant and Equipment and Intangible Assets
"Investments" moved up 2.6% until March 31, 2017, due to equity in the earnings of subsidiaries and capital contributions recorded in the period. “Property, plant and equipment” increased 0.8%, due to the startup of new assets, in accordance with the Company's investment program, net of period depreciation. “Intangible assets” grew 0.4%, reflecting period investments in new assets.
16
* Amounts subject to rounding.
3.2 Balance Sheet – Assets
| R$'000 | |||||
| Assets | Mar-17 (1) | Dec-16 (2) | Mar-16 (3) | Var.% (1/2) | Var.% (1/3) |
| CURRENT | 4,623,842 | 4,402,990 | 5,951,158 | 5.0 | (22.3) |
| Cash and cash equivalents | 945,591 | 982,073 | 1,160,439 | (3.7) | (18.5) |
| Bonds and securities | 254,813 | 302,398 | 334,090 | (15.7) | (23.7) |
| Collaterals and escrow accounts | 276 | 1,294 | 1,964 | (78.7) | (85.9) |
| Customers | 2,439,429 | 2,217,355 | 3,073,253 | 10.0 | (20.6) |
| Dividends receivable | 71,657 | 71,758 | 38,950 | (0.1) | 84.0 |
| CRC transferred to the State of Paraná | 40,993 | - | 114,281 | - | (64.1) |
| Net sectorial financial assets | - | - | 387,928 | - | - |
| Account receivable related to concession | 106,175 | 65,595 | 88,265 | 61.9 | 20.3 |
| Other current receivables | 319,648 | 306,933 | 366,028 | 4.1 | (12.7) |
| Inventories | 126,880 | 130,637 | 141,251 | (2.9) | (10.2) |
| Income tax and social contribution | 177,745 | 188,952 | 82,521 | (5.9) | 115.4 |
| Other current recoverable taxes | 73,127 | 67,931 | 72,862 | 7.6 | 0.4 |
| Prepaid expenses | 37,444 | 39,096 | 43,590 | (4.2) | (14.1) |
| Related parties | 30,064 | 28,968 | 45,736 | 3.8 | (34.3) |
| NON-CURRENT | 26,456,494 | 26,031,219 | 23,232,784 | 1.6 | 13.9 |
| Long Term Assets | 8,568,555 | 8,302,154 | 5,897,858 | 3.2 | 45.3 |
| Bonds and securities | 200,075 | 195,096 | 171,133 | 2.6 | 16.9 |
| Other temporary investments | 490,861 | 408,297 | - | 20.2 | - |
| Collaterals and escrow accounts | 70,948 | 73,074 | 81,706 | (2.9) | (13.2) |
| Customers | 278,413 | 270,786 | 75,595 | 2.8 | 268.3 |
| Net sectoral financial assets | 1,483,507 | 1,522,735 | 1,277,004 | (2.6) | 16.2 |
| CRC transferred to the State of Paraná | 613,122 | 657,603 | 763,899 | (6.8) | (19.7) |
| Account receivable related to concession | 4,023,460 | 3,748,335 | 1,975,688 | 7.3 | 103.6 |
| Accounts receivable related to the concession compensation | 67,633 | 67,401 | 219,556 | 0.3 | (69.2) |
| Other non-current receivables | 89,640 | 73,551 | 36,462 | 21.9 | 145.8 |
| Income tax and social contribution | 155,775 | 169,967 | 156,515 | (8.3) | (0.5) |
| Deferred income tax and social contribution | 798,643 | 803,477 | 835,252 | (0.6) | (4.4) |
| Other non-current recoverable taxes | 117,038 | 131,108 | 115,854 | (10.7) | 1.0 |
| Prepaid expenses | 24,299 | 25,583 | 21,628 | (5.0) | 12.3 |
| Related parties | 155,141 | 155,141 | 167,566 | - | (7.4) |
| Investments | 2,395,731 | 2,334,950 | 2,320,878 | 2.6 | 3.2 |
| Property, plant and equipment, net | 9,003,701 | 8,934,303 | 8,803,555 | 0.8 | 2.3 |
| Intangible assets | 6,488,507 | 6,459,812 | 6,210,493 | 0.4 | 4.5 |
| TOTAL | 31,080,336 | 30,434,209 | 29,183,942 | 2.1 | 6.5 |
17
* Amounts subject to rounding.
3.3 Debt
Gross Debt
Copel’s consolidated debt totaled R$8,917.7 million on March 31, 2017, 0.9% higher than the R$8,837.1 million recorded in 1Q16.
On March 31, 2017, Copel’s gross debt represented 57.3% of consolidated shareholders’ equity, which at the end of the period was R$15,429.3 million, equivalent to R$56.89 per share (book value per share). The breakdown of the balance of loans, financing and debentures is shown in the table below:
| R$'000 | ||||
| Total | composition | |||
| % | ||||
| Domestic Currency | Eletrobras - COPEL | 45,718 | 0.5 | |
| FINEP | 20,666 | 0.2 | ||
| BNDES | 1,661,797 | 18.6 | ||
| Banco do Brasil S/A and other | 1,572,032 | 17.6 | ||
| Debentures and Promissory Notes | 5,532,135 | 62.0 | ||
| Total | 8,832,348 | 99.0 | ||
| Foreign Currency | National Treasury | 85,329 | 1.0 | |
| Total | 85,329 | 1.0 | ||
| TOTAL | 8,917,677 | 100.0 |
Loans, financing and debentures maturities are presented below:
| R$'000 | ||||||||
| Short Term apr/17 - mar/18 | Long Term | Total | ||||||
| apr/18 - dec/18 | 2019 | 2020 | 2021 | 2022 | From 2023 | |||
| Domestic Currency | 2,745,989 | 2,148,452 | 1,742,520 | 557,862 | 181,360 | 204,642 | 1,251,523 | 8,832,348 |
| Foreign Currency | 1,710 | - | - | - | - | - | 83,619 | 85,329 |
| TOTAL | 2,747,699 | 2,148,452 | 1,742,520 | 557,862 | 181,360 | 204,642 | 1,335,142 | 8,917,677 |
Endorsements and Guarantees
At the end of March 2017, the Company had R$1,509.8 million in guarantees and endorsements, as shown below.
| R$'000 | |||||
| Guarantees and Endorsements¹ | Mar-17 (1) | Dec-16 (2) | Mar-16 (3) | Var.% (1/2) | Var.% (1/3) |
| Transmissora Sul Brasileira de Energia S.A. | 65,769 | 66,802 | 67,714 | (1.5) | (2.9) |
| Caiuá Transmissora de Energia S.A. | 37,464 | 38,230 | 40,497 | (2.0) | (7.5) |
| Integração Maranhense Transmissora de Energia S.A. | 61,755 | 63,171 | 66,939 | (2.2) | (7.7) |
| Matrinchã Transmissora de Energia (TP NORTE) S.A. | 389,230 | 392,164 | 317,445 | (0.7) | 22.6 |
| Guaraciaba Transmissora de Energia (TP SUL) S.A. | 190,064 | 190,343 | 204,368 | (0.1) | (7.0) |
| Costa Oeste Transmissora de Energia S.A. | 15,246 | 15,573 | 16,677 | (2.1) | (8.6) |
| Mata de Santa Genebra Transmissão S.A. | 254,979 | 244,998 | 238,522 | 4.1 | 6.9 |
| Paranaíba Transmissora de Energia S.A. | 174,557 | 148,872 | 143,198 | 17.3 | 21.9 |
| Marumbi Transmissora de Energia S.A. | 37,815 | 38,689 | 41,002 | (2.3) | (7.8) |
| Cantareira Transmissora de Energia S.A. | 141,958 | 32,192 | - | 341.0 | - |
| Voltalia São Miguel do Gostoso I Participações S.A. | 140,962 | 142,030 | 134,217 | (0.8) | 5.0 |
| TOTAL | 1,509,799 | 1,373,064 | 1,270,579 | 10.0 | 18.8 |
| ¹ Adjusted for Copel’s stake. |
18
* Amounts subject to rounding.
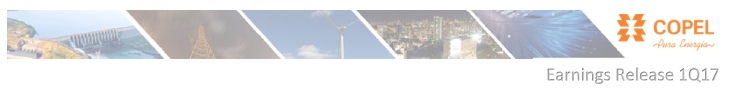
Copel’s consolidated net debt (loans, financing and debentures less cash and cash equivalents) and the net debt/EBITDA ratio are shown in the following chart:
| R$'000 | ||||||
| 2012 | 2013 | 2014 | 2015 | 2016 | 1Q17 | |
| Net Debt Total¹ | 1,014,402 | 2,497,172 | 5,446,685 | 6,977,022 | 8,656,231 | 8,955,773 |
| ¹ Considers Garantees, endorsements and escrow accounts. | ||||||
Net Debt by Subsidiary
The following table shows the gross debt and net debt of the subsidiaries:
| R$'000 | ||||||
| GeT | DIS | Telecom | Holding | Other | Total | |
| Total debt | 4,148,213 | 1,838,643 | 200,111 | 2,026,165 | 704,545 | 8,917,677 |
| Endorsements and Guarantees | 99,219 | - | - | 1,410,580 | - | 1,509,799 |
| Availability | 162,783 | 522,060 | 16,273 | 17,040 | 753,547 | 1,471,703 |
| Net debt | 4,084,649 | 1,316,583 | 183,838 | 3,419,705 | (49,002) | 8,955,773 |
19
* Amounts subject to rounding.
Accounts Payables related to the Concession
Use of Public Property
It refers to the concession charges for the use of public property incurred since the execution of the project’s concession agreement until the end of the concession.
| R$'000 | ||||||
| Mauá | Colíder | Baixo Iguaçu | SHP¹ | Elejor | Total | |
| 16,326 | 22,958 | 6,483 | 1,614 | 520,234 | 567,615 | |
| ¹Relative to SPP Cavernoso, Apucaraninha, Chaminé and Derivação do Rio Jordão. | ||||||
Provisions for Legal Claims
The Company is involved in a series of lawsuits in different courts and instances. Copel’s management, based on its legal advisors’ opinion, maintains a provision for legal claims for those cases assessed as probable losses. The balances of provisions for legal claims are as follows:
| R$ '000 | |||||
| Probable Losses - Consolidated | Mar-17 (1) | Dec-16 (2) | Mar-16 (3) | Var % (1/2) | Var % (1/3) |
| Tax | 151,358 | 204,882 | 328,972 | (26.1) | (54.0) |
| Labor suits | 465,057 | 458,901 | 485,297 | 1.3 | (4.2) |
| Employees and Benefits | 44,626 | 42,366 | 80,116 | 5.3 | (44.3) |
| Civil | 499,859 | 465,804 | 616,337 | 7.3 | (18.9) |
| Civil and administrative claims | 304,871 | 295,484 | 328,700 | 3.2 | (7.2) |
| Easements | 103,716 | 99,380 | 68,851 | 4.4 | 50.6 |
| Condemnations and property | 84,970 | 65,712 | 205,197 | 29.3 | (58.6) |
| Customers | 6,302 | 5,228 | 13,589 | 20.5 | (53.6) |
| Environmental claims | 887 | 1,432 | 1,048 | (38.1) | (15.4) |
| Regulatory | 69,158 | 67,958 | 58,246 | 1.8 | 18.7 |
| TOTAL | 1,230,945 | 1,241,343 | 1,570,016 | (0.8) | (21.6) |
The lawsuits classified as possible losses, as estimated by the Company and its controlled companies at the 1Q17, totaled R$2,540.9 million, 0.8% lower than in December 2016 (R$2,559.9 million), distributed in lawsuits of the following natures: fiscal (R$ 788.0 million), regulatory (R$787.0 million), civil (R$591.7 million), labor (R$351.2 million) and employee benefits (R$22.1million).
20
* Amounts subject to rounding.
3.4 Balance Sheet – Liabilities
| R$'000 | |||||
| Liabilities | Mar-17 (1) | Dec-16 (2) | Mar-16 (3) | Var.% (1/2) | Var.% (1/3) |
| CURRENT | 5,807,153 | 5,656,036 | 4,848,541 | 2.7 | 19.8 |
| Payroll, social charges and accruals | 298,165 | 287,797 | 258,919 | 3.6 | 15.2 |
| Suppliers | 1,143,603 | 1,255,639 | 1,536,069 | (8.9) | (25.6) |
| Income tax and social contribution payable | 102,803 | 41,454 | 214,542 | 148.0 | (52.1) |
| Other taxes due | 261,289 | 294,994 | 239,854 | (11.4) | 8.9 |
| Loans, financing and debentures | 2,747,699 | 2,601,940 | 1,405,090 | 5.6 | 95.6 |
| Minimum compulsory dividend payable | 274,549 | 266,831 | 333,848 | 2.9 | (17.8) |
| Post employment benefits | 47,672 | 47,894 | 43,327 | (0.5) | 10.0 |
| Customer charges due | 131,660 | 141,712 | 199,360 | (7.1) | (34.0) |
| Research and development and energy efficiency | 229,218 | 231,513 | 158,958 | (1.0) | 44.2 |
| Accounts Payable related to concession | 63,297 | 66,210 | 269,319 | (4.4) | (76.5) |
| Net sectorial financial liabilities | 275,238 | 155,261 | 42,662 | 77.3 | 545.2 |
| Other accounts payable | 231,960 | 264,791 | 146,593 | (12.4) | 58.2 |
| NON-CURRENT | 9,705,446 | 9,622,727 | 9,625,247 | 0.9 | 0.8 |
| Suppliers | 52,127 | 36,711 | 5,923 | 42.0 | 780.1 |
| Deferred income tax and social contribution | 233,325 | 178,430 | - | 30.8 | - |
| Other taxes due | 298,551 | 303,146 | 248,819 | (1.5) | 20.0 |
| Loans, financing and debentures | 6,169,978 | 6,235,162 | 6,414,703 | (1.0) | (3.8) |
| Post employment benefits | 733,985 | 721,971 | 572,770 | 1.7 | 28.1 |
| Research and development and energy efficiency | 276,920 | 252,376 | 256,989 | 9.7 | 7.8 |
| Accounts Payable related to concession | 504,318 | 499,332 | 487,804 | 1.0 | 3.4 |
| Net sectorial financial liabilities | 166,858 | 123,731 | 36,795 | 34.9 | 353.5 |
| Other accounts payable | 38,439 | 30,525 | 31,428 | 25.9 | 22.3 |
| Tax, social security, labor and civil provisions | 1,230,945 | 1,241,343 | 1,570,016 | (0.8) | (21.6) |
| EQUITY | 15,567,737 | 15,155,446 | 14,710,154 | 2.7 | 5.8 |
| Attributed to controlling shareholders | 15,280,581 | 14,864,165 | 14,378,163 | 2.8 | 6.3 |
| Share capital | 7,910,000 | 7,910,000 | 6,910,000 | - | 14.5 |
| Equity valuation adjustments | 986,031 | 998,466 | 1,156,865 | (1.2) | (14.8) |
| Legal reserves | 792,716 | 792,716 | 744,784 | - | 6.4 |
| Retained earnings | 5,162,983 | 5,162,983 | 5,413,571 | - | (4.6) |
| Accrued earnings | 428,851 | - | 152,943 | - | 180.4 |
| Attributable to non-controlling interest | 287,156 | 291,281 | 331,991 | (1.4) | (13.5) |
| TOTAL | 31,080,336 | 30,434,209 | 29,183,942 | 2.1 | 6.5 |
4. Performance of the Main Companies
4.1 Copel Geração e Transmissão
In the 1Q17, Copel GeT's operating income increased 42.8% to R$1,073.5 million and mainly reflects the recognition of R$224.6 million in the revenue "use of the main transmission grid (TUST)" as a result of Aneel's approval of the amount corresponding to the portion of the not-amortized reversible assets related to the RBSE (as described in item 2.1) and the 28.7% growth in "electricity sales to distributors" due to the higher GSF
21
* Amounts subject to rounding.
that resulted in secondary energy in the 1Q17 (average GSF of 107.0% in the 1Q17 vs. 87.8% in the 1Q16) and the higher average spot price (PLD) in the period (R$155.37/MWh in the 1Q17 vs. R$34.59/MWh in the 1Q16). Operating costs and expenses reached R$433.2 million, 10.9% higher than the R$390.8 million reported in the 1Q16, and mainly resulting from (a) the increase in construction costs, mainly due to recognition of R$50.0 million in losses related to the Araraquara II - Taubaté Transmission Line; (b) the 14.3% increase in the "charge of the main transmission grid" due to the start-up of new transmission assets and the RAP adjustment applied in July 2016; and (c) the 11.6% increase in personnel and administrative costs, resulting from the adjustment applied to salaries as of October 2016. These increases were partially offset by the 31.8% decrease in "other costs and expenses", reflecting the reduction of R$18.3 million in costs with financial compensation for the use of water resources, reflecting the lower generation of hydraulic energy in the period (6,168 GWh in the 1Q17 vs. 7,460 GWh in the 1Q16).
The equity result was positive, reaching R$4.3 million, 79.0% lower than the 1Q16. This result was impacted, in particular, by the negative result of R$24.0 million of the UEG Araucária and by the impairment of R$30.0 million from the Cutia Wind Complex.
In 1Q17, Copel GeT posted net income of R$343.0 million and EBITDA of R$713.9 million.
| Main Indicators | 1Q17 (1) | 4Q16 (2) | 1Q16 (3) | Var.% (1/3) |
| Net Operating Revenue (R$ million) | 1,073.5 | 876.1 | 751.7 | 42.8 |
| Operating Costs and Expenses (R$ million) | (433.2) | (593.4) | (390.8) | 10.9 |
| Operating Income (R$ million) | 514.9 | (189.1) | 238.0 | 116.4 |
| Net Income (R$ million) | 343.0 | (144.2) | 165.2 | 107.6 |
| EBITDA (R$ million) | 713.9 | (18.4) | 455.6 | 56.7 |
| Operating Margin | 48.0% | -21.6% | 31.7% | 51.5 |
| Net Margin | 31.9% | -16.5% | 22.0% | 45.4 |
| EBITDA Margin | 66.5% | -2.1% | 60.6% | 9.7 |
| Investment Program (R$ million) | 273.0 | 297.4 | 609.3 | (55.2) |
Copel GeT’s - Adjusted EBITDA
Excluding non-recurring effects of the period, EBITDA Copel GeT would be R$519.3 million, 14.0% higher than recorded in same period in 2016.
| R$ million | |||
| Adjusted EBITDA | 1Q17 (1) | 1Q16 (2) | Var.% (1/2) |
| EBITDA | 713.9 | 455.6 | 56.7 |
| (-)/+ Impairment Testing - Wind Farms | 30.0 | - | - |
| (+/-) Remeasurement of financial assets RBSE | (224.6) | - | - |
| Adjusted EBITDA | 519.3 | 455.6 | 14.0 |
22
* Amounts subject to rounding.
4.2 Copel Distribuição
In the first quarter of 2017, the operating revenue of Copel Distribuição decreased by 3.9%, reaching R$2,004.3 million. This result was mostly due to the 31.8% decrease in the electricity sales to final customers, from the 11.3% drop in Copel Distribuição's captive market in the 1Q17, together with the average 12.9% reduction in the applied to the tariff from June 24, 2016, and the 28.3% reduction in the electricity sales to distributors, from 22.2% drop in the volume of energy sold to the 3 concessionaires and 1 permissionary that are part of Copel Dis' portfolio.
These reductions were partially offset by the 7.7% increase in the use of the main distribution grid revenue, reflecting the result of the 4th tariff review cycle and the 3.5% growth in the grid market, and 29.4% in other operating revenues, mainly from higher revenues with fines paid by captive customers that migrated to the free market. It is also noteworthy the negative result of R$148.0 million in the result of sectorial financial assets and liabilities (already explained in item 2.1), when compared to the negative R$527.2 millions recorded in the 1Q16.
Operating costs and expenses decreased by 13.4%, to R$1,882.1 million in the 1Q17, mainly reflecting (a) the 10.7% decrease with electricity purchased for resale, mainly due to the (i) lower energy costs of Itaipu - from the lower dollar exchange rate in the period (R$3.15/US$1.00 in the 1Q17 vs. R$3.90/US$1.00 in the 1Q16), partially offset by the adjustment applied to the transferred tariff of the plant power (US$28.73/ KW in 2017 vs. US$25.78/KW in 2016) - and (ii) the termination of existing energy agreements; (b) the 49.0% reduction of the charges of the main distribution and transmission grid, due to lower costs of the system's service (ESS) from the lower thermal dispatch outside the merit order; and (c) the recording of R$58.7 million in provisions and reversals (vs. R$112.1 million in the 1Q16), being R$24.8 million related to allowance doubtful accounts (PECLD), R$22.0 million to labor lawsuits, and R$11.9 million to civil and administrative lawsuits.
The reduction in operating costs and expenses was partially offset by the 10.8% increase in personnel and management costs, reflecting the salary adjustments in October 2016, and the 20.9% increase in other costs and operating expenses, mainly due to the increase in expenses with the authorized agent and losses for the deactivation and sale of assets and rights, partially offset by the recovery of invoices.
The financial result at the end of the quarter was a positive of R$15.7 million, vs. the R$29.1 million of the 1Q16. As a result, Copel Distribuição recorded a net income of R$71.3 million and an EBITDA of R$193.2 million in the 1Q17.
23
* Amounts subject to rounding.
| Main Indicators | 1Q17 (1) | 4Q16 (2) | 1Q16 (3) | Var.% (1/3) |
| Net Operating Revenue (R$ million) | 2,004.3 | 2,373.1 | 2,085.9 | (3.9) |
| Operating Costs and Expenses (R$ million) | (1,882.1) | (2,215.9) | (2,172.2) | (13.4) |
| Operating Income (R$ million) | 138.0 | 36.5 | (56.9) | - |
| Net Income (R$ million) | 71.3 | 70.7 | (39.1) | - |
| EBITDA (R$ million) | 193.2 | 226.2 | (20.0) | - |
| Operating Margin | 6.9% | 1.5% | - | - |
| Net Margin | 3.6% | 3.0% | - | - |
| EBITDA Margin | 9.6% | 9.5% | - | - |
| Investment Program (R$ million) | 134.3 | 224.4 | 157.6 | (14.8) |
4.3 Copel Telecomunicações
The operating revenue of Copel Telecomunicações reached R$87.7 million in the 1Q17, a 12.3% growth, and mainly reflects the expansion of the area of operation and the service to new customers. The operating costs and expenses increased 14.1%, reaching R$65.5 million. This increase was influenced by the increase of 45.9% in costs with third-party services, which are necessary for the expansion of the area of operation; 22.0% in personnel and management, as a result of the salary adjustment applied in October 2016, plus the 7.3% increase in the number of employees, and the provision of R$1.1 million for compensation with voluntary resignations and retirements. The net income for the period grew 3.1%, totaling R$11.5 million, whereas the EBITDA advanced 8.4%, resulting in R$31.5 million.
| Main Indicators | 1Q17 (1) | 4Q16 (2) | 1Q16 (3) | Var.% (1/3) |
| Net Operating Revenue (R$ million) | 87.7 | 88.3 | 78.1 | 12.3 |
| Operating Costs and Expenses (R$ million) | (65.5) | (72.9) | (57.4) | 14.1 |
| Operating Income (R$ million) | 17.1 | 16.1 | 16.7 | 2.6 |
| Net Income (R$ million) | 11.5 | 19.7 | 11.2 | 3.1 |
| EBITDA (R$ million) | 31.5 | 24.5 | 29.0 | 8.4 |
| Operating Margin | 19.5% | 18.3% | 21.3% | (8.6) |
| Net Margin | 13.1% | 22.3% | 14.3% | (8.2) |
| EBITDA Margin | 35.9% | 27.8% | 37.2% | (3.5) |
| Investment Program (R$ million) | 40.2 | 44.9 | 26.3 | 52.9 |
24
* Amounts subject to rounding.
4.5 Accounting Information
Accounting information concerning Copel’s interests in other companies in 1Q17 is shown in the following table:
| R$'000 | ||||
| Partnerships - Mar-17 | Total Assets | Shareholders' Equity | Net Oper. Revenues | Net Income |
| Parent Company (Consolidated) | ||||
| Companhia Paranaense de Gás - Compagás | 528,178 | 311,425 | 123,704 | 11,797 |
| Elejor - Centrais Elétricas do Rio Jordão S.A. | 702,970 | 62,704 | 68,757 | 19,845 |
| UEG Araucária Ltda | 644,060 | 578,728 | - | (24,035) |
| Jointly-controlled entities (Equity in earning) | ||||
| Costa Oeste Transmissora de Energia S.A. | 114,070 | 75,124 | 3,186 | 2,119 |
| Caiuá Transmissora de Energia S.A. | 255,727 | 125,643 | 5,122 | 3,076 |
| Cantareira Transmissora S.A | 697,946 | 327,622 | 149,240 | (2,692) |
| Dominó Holdings S.A. | 26,665 | 15,379 | - | (1,284) |
| Guaraciaba Transmissora de Energia (TP Sul) S.A. | 1,338,330 | 831,203 | 63,285 | 16,979 |
| Integração Maranhense Transmissora de Energia S.A. | 514,798 | 256,026 | 7,423 | 6,530 |
| Marumbi Transmissora de Energia S.A. | 188,232 | 121,955 | 5,508 | 3,357 |
| Mata de Santa Genebra Transmissão S.A. | 1,256,176 | 676,670 | 230,780 | 6,118 |
| Matrinchã Transmissora de Energia (TP Norte) S.A. | 2,651,897 | 1,628,554 | 94,745 | 12,085 |
| Paranaíba Transmissora de Energia S.A. | 1,455,277 | 625,600 | 51,743 | 16,228 |
| Transmissora Sul Brasileira de Energia S.A. | 694,870 | 350,285 | 14,444 | 3,441 |
| Voltalia São Miguel do Gostoso I Participações S.A. | 157,158 | 154,944 | - | 734 |
| Associates (Equity in erarning) | ||||
| Dona Francisca Energética S.A. | 148,186 | 139,690 | 17,445 | 9,414 |
| Foz do Chopim Energética Ltda | 49,290 | 39,549 | 9,714 | 7,503 |
| 1This data was adjusted to Copel's practices. | ||||
| ² As of 4Q16, Sanepar was classified as Financial Assets. |
25
* Amounts subject to rounding.
5. Investment Program
The following chart shows the investment program carried out in 1Q17:
| R$ million | ||
| Subsidiary / SPC | Carried 1Q17 | Scheduled1 2017 |
| Copel Geração e Transmissão | 273.0 | 597.5 |
| HPP Colíder2 | 6.4 | 24.1 |
| HPP Baixo Iguaçu2 | 47.7 | 47.7 |
| TL Araraquara / Taubaté | 77.2 | 137.9 |
| TL Foz do Chopim - Realeza | 2.5 | 9.5 |
| TL Assis - Londrina | 12.7 | 20.4 |
| TL Curitiba Leste / Blumenau | 3.4 | 32.1 |
| Mata de Santa Genebra Transmissão3 | 103.7 | 101.1 |
| Others | 19.4 | 224.7 |
| Copel Distribuição | 134.3 | 629.6 |
| Copel Telecomunicações | 40.2 | 164.3 |
| Copel Comercialização | - | 0.2 |
| Copel Renováveis | - | 1.5 |
| Holding | - | 1.6 |
| Cutia Wind Farm Complex | 140.0 | 638.6 |
| Other Invesment4 | - | 28.8 |
| TOTAL | 587.6 | 2,062.1 |
| 1Capital budget originally approved by the Board of Directors. These values do not consider appropriation due | ||
| to own labor, interest and others. | ||
| 2Planned CAPEX under review. | ||
| 3Regarding the participation of Copel in Enterprises. | ||
6. Power Market and Tariffs
6.1 Captive Market – Copel Distribuição
Copel Distribuição’s captive market energy sales totaled 5,336 GWh in the 1Q17, which represents a reduction of 11.3% in compared 1Q16. This decrease was influenced by the reduction in consumption of industrial and commercial classes, mainly due to the migration of customers to the free market throughout 2016. The following table shows captive market trends by consumption segment:
| Number of Customers | Energy sold (GWh) | ||||||
| Mar-17 | Mar-16 | Var. % | 1Q17 | 1Q16 | Var. % | ||
| Residential | 3,622,426 | 3,549,987 | 2.0 | 1,898 | 1,781 | 6.6 | |
| Industrial | 79,083 | 87,461 | (9.6) | 897 | 1,607 | (44.2) | |
| Commercial | 384,041 | 377,880 | 1.6 | 1,300 | 1,417 | (8.2) | |
| Rural | 358,847 | 366,365 | (2.1) | 630 | 614 | 2.6 | |
| Other | 57,456 | 57,023 | 0.8 | 611 | 597 | 2.3 | |
| Captive Market | 4,501,853 | 4,438,716 | 1.4 | 5,336 | 6,016 | (11.3) | |
26
* Amounts subject to rounding.
For more details visit the Notice to the Market - IR 11/17 (link).
6.2 Grid Market (TUSD)
Copel Distribuição’s grid market, comprising the captive market, concessionaires and licensees in the state of Paraná, and all free consumers in the Company’s concession area, presented an increase of 3.5% in 1Q17. The table below shows the behavior of the grid market in the 1Q17 versus 1Q16:
| Number of Customers / Agreements | Energy Sold (GWh) | ||||||
| Mar-17 | Mar-16 | Var. % | 1Q17 | 1Q16 | Var. % | ||
| Captive Market | 4,501,853 | 4,438,716 | 1.4 | 5,336 | 6,016 | (11.3) | |
| Concessionaries and Licensees | 6 | 6 | - | 143 | 177 | (19.2) | |
| Free Customers ¹ | 805 | 157 | 412.7 | 1,959 | 991 | 97.7 | |
| Grid Market | 4,502,664 | 4,438,879 | 1.4 | 7,438 | 7,184 | 3.5 | |
| ¹ All free customers served by Copel GeT, Copel Comercialização and other suppliers at the Copel Distribuição concession area. | |||||||
6.3 Electricity Sales
Electricity sales to final customers, comprising Copel Distribuição’s sales in the captive market and Copel Geração e Transmissão and Copel Comercialização sales in the free market, fell by 5.6% in the 1Q17.
The table below breaks down energy sales by consumption segment:
| Segment | Market | Energy Sold (GWh) | ||
| 1Q17 | 1Q16 | Var. % | ||
| Residential | 1,898 | 1,781 | 6.6 | |
| Total | 2,038 | 2,485 | (18.0) | |
| Industrial | Captive | 897 | 1,607 | (44.2) |
| Free | 1,141 | 878 | 30.0 | |
| Total | 1,336 | 1,419 | (5.8) | |
| Commercial | Captive | 1,300 | 1,417 | (8.3) |
| Free | 36.00 | 2 | - | |
| Rural | 630 | 614 | 2.6 | |
| Other | 611 | 597 | 2.3 | |
| Energy Supply | 6,513 | 6,896 | (5.6) | |
27
* Amounts subject to rounding.
6.4 Total Energy Sold
Total energy sold by Copel in all markets, comprising the sales of Copel Distribuição, Copel Geração e Transmissão,the Wind Farm Complexes and Copel Comercialização, came to 10,348 GWh in 1Q17, representing a decrease of 6.8% in compared 1Q16.
The following table shows Copel’s total electricity sales broken down between Copel Distribuição, Copel Geração e Transmissão, Wind Farm Complexes and Copel Comercialização:
| Number of Customers / Agreements | Energy Sold (GWh) | ||||||
| Mar-17 | Mar-16 | Var. % | 1Q17 | 1Q16 | Var. % | ||
| Copel DIS | |||||||
| Captive Market | 4,501,853 | 4,438,716 | 1.4 | 5,336 | 6,016 | (11.3) | |
| Concessionaries and Licensees | 4 | 4 | - | 126 | 162 | (22.2) | |
| CCEE (MCP) | - | - | - | 591 | 358 | 65.1 | |
| Total Copel DIS | 4,501,857 | 4,438,720 | 1.4 | 6,053 | 6,536 | (7.4) | |
| Copel GeT | |||||||
| CCEAR (Copel DIS) | 1 | 1 | - | 23 | 41 | (44.0) | |
| CCEAR (other concessionaries) | 28 | 39 | (28.2) | 212 | 1,002 | (78.8) | |
| Free Customers | 51 | 24 | 112.5 | 1,080 | 880 | 22.7 | |
| Bilateral Agreements ¹ | 32 | 19 | 68.4 | 1,669 | 2,031 | (17.8) | |
| CCEE (MCP) ² | - | - | - | 866 | 309 | 180.3 | |
| Total Copel GeT | 112 | 83 | 34.9 | 3,850 | 4,263 | (9.7) | |
| Wind Farms Complex | |||||||
| CCEAR (other concessionaries) | 112 | 112 | - | 207 | 209 | (1.0) | |
| CER | 3 | 3 | - | 88 | 89 | (1.1) | |
| Total Wind Farm Complex | 115 | 115 | - | 295 | 298 | (1.0) | |
| Copel Comercialização | |||||||
| Free Customers | 43 | - | - | 98 | - | - | |
| Bilateral Agreements | 12 | - | - | 52 | - | - | |
| Total Copel Comercialização | 55 | - | - | 150 | - | - | |
| Total Copel Consolidated | 4,502,139 | 4,438,918 | 1.4 | 10,348 | 11,097 | (6.8) | |
| Note: Not considering the energy from MRE (Energy Relocation Mechanism). | |||||||
| ¹ Includes Short Term Sales Agreements. | |||||||
| ² Assured Power allocated in the period, does not consider the impact of the GSF. | |||||||
| CCEE: Electric Power Trade Chamber / CCEAR: Energy Purchase Agreements in the Regulated Market / MCP: Short Term Market / CER: | |||||||
| Agreements Reserve Energy. | |||||||
28
* Amounts subject to rounding.
6.5 Energy Flow
Energy Flow – Copel Dis
| Energy Flow - Copel Dis | 1Q17 | 1Q16 | Var. % |
| Itaipu | 1,465 | 1,482 | (1.1) |
| CCEAR – Copel Geração e Transmissão | 23 | 41 | (43.9) |
| CCEAR – Other | 3,003 | 3,397 | (11.6) |
| CCEAR – Adjustment auction | - | - | - |
| CCEE (MCP) | - | - | - |
| Angra | 252 | 255 | (1.2) |
| CCGF | 1,784 | 1,891 | (5.7) |
| Proinfa | 124 | 137 | (9.5) |
| Elejor S.A | 293 | 296 | (1.0) |
| Available Power | 6,944 | 7,499 | (7.4) |
| Captive market | 5,336 | 6,016 | (11.3) |
| Concessionaries | 126 | 162 | (22.2) |
| CCEE (MCP) | 591 | 358 | 65.1 |
| Losses and differences | 891 | 963 | (7.5) |
| Basic network losses | 124 | 151 | (17.9) |
| Distribution losses | 687 | 732 | (6.1) |
| CG contract allocation | 80 | 80 | - |
Energy Flow – Copel GeT
| GWh | |||
| Energy Flow - Copel GeT | 1Q17 | 1Q16 | Var. % |
| Own Generation | 6,181 | 7,471 | -17.3 |
| Dona Francisca | 35 | 35 | 0.0 |
| Total Available Power | 6,216 | 7,506 | (17.2) |
| Bilateral Agreements | 1,669 | 2,031 | (17.8) |
| CCEAR – COPEL Distribuição | 23 | 41 | (43.9) |
| CCEAR – Other | 212 | 1,002 | (78.8) |
| Free Customers | 1,080 | 880 | 22.7 |
| CCEE (MCP) | 866 | 309 | 180.3 |
| MRE | 2,212 | 3,056 | (27.6) |
| Losses and differences | 154 | 187 | (17.6) |
29
* Amounts subject to rounding.
Energy Flow – Wind Farms
| GWh | |||
| Energy Flow - São Bento Energia | 1Q17 | 1Q16 | Var. % |
| Own Generation | 93 | 78 | 19.2 |
| CCEE (MCP) | - | - | - |
| Total Available Power | 93 | 78 | 19.2 |
| CCEAR – Other | 94 | 95 | (1.1) |
| Losses and differences | (1) | (17) | (94.1) |
| GWh | |||
| Energy Flow - Brisa Potiguar | 1Q17 | 1Q16 | Var. % |
| Own Generation | 117 | 146 | (19.9) |
| CCEE (MCP) | - | - | - |
| Total Available Power | 117 | 146 | (19.9) |
| CCEAR – Other | 113 | 114 | (0.9) |
| CER | 88 | 89 | (1.1) |
| Losses and differences | (84) | (57) | 47.4 |
Energy Flow – Copel Comercialização
| GWh | |||
| Energy Flow - Copel Com | 1Q17 | 1Q16 | Var. % |
| Own Generation | 150 | - | - |
| Total Available Power | 150 | - | - |
| Free Customers | 98 | - | - |
| Bilateral Agreements | 52 | - | - |
30
* Amounts subject to rounding.
Consolidated Energy Flow (1Q17)
![]()
6.6 Tariffs
Sales to Distributors Average Tariff (CCEARs) – Copel Geração e Transmissão
| R$ / MWh | ||||||
| Tariff | Amount Average MW | Mar-17 (1) | Dec-16 (2) | Mar-16 (3) | Var. % (1/2) | Var. % (1/3) |
| Copel Geração e Transmissão | 108 | 205.10 | 187.18 | 170.92 | 0.7 | 13.1 |
| Auction CCEAR 2009 - 2016 | - | - | 178.38 | 163.88 | 0.7 | 8.9 |
| Auction CCEAR 2011 - 2040 ( HPP Mauá) | 101 | 203.89 | 203.71 | 187.22 | 1.3 | 9.0 |
| Auction CCEAR 2013 - 2042 (Cavernoso II) | 7 | 222.60 | 222.65 | 205.16 | 3.3 | 8.4 |
| Auction - CCEAR 2015 - 2044 (UHE Colíder) | - | 155.33 | 155.20 | 142.44 | 2.3 | 8.9 |
| Copel Distribuição | ||||||
| Concession holders in the State of Paraná | 75 | 213.69 | 215.32 | 282.51 | (0.8) | (23.2) |
| Total / Tariff Weighted Average Supply | 183 | 208.62 | 192.05 | 192.35 | 0.1 | 3.9 |
| With PIS/COFINS. Net of ICMS. |
Power Purchase Average Tariff – Copel Distribuição
31
* Amounts subject to rounding.
| R$ / MWh | ||||||
| Tariff* | Amount Average MW | Mar-17 (1) | Dec-16 (2) | Mar-16 (3) | Var. % (1/2) | Var. % (1/3) |
| Itaipu1 | 636.9 | 190.7 | 164.9 | 198.9 | 15.6 | (4.1) |
| Auction – CCEAR 2010 – H30 | 75.9 | 210.7 | 210.0 | 190.8 | 0.3 | 10.4 |
| Auction – CCEAR 2010 – T152 | 65.1 | 219.9 | 143.1 | 98.3 | 53.7 | 123.7 |
| Auction – CCEAR 2011 – H30 | 62.5 | 217.6 | 217.7 | 199.0 | (0.1) | 9.3 |
| Auction – CCEAR 2011 – T152 | 54.2 | 189.5 | 180.5 | 219.7 | 5.0 | (13.7) |
| Auction – CCEAR 2012 – T152 | 115.4 | 236.8 | 233.9 | 193.6 | 1.3 | 22.4 |
| Auction – CCEAR 2014 - 2019 ³ | 109.0 | 139.6 | 139.6 | 133.9 | - | 4.3 |
| Auction – CCEAR 2014 - 20194 | 113.5 | 320.1 | 320.1 | 292.9 | - | 9.3 |
| Auction 2014 - 36M | - | 0.0 | 176.6 | 176.6 | - | - |
| Auction 2016 - T20² | 31.6 | 139.3 | 151.8 | 136.9 | (8.3) | 1.8 |
| Angra | 116.8 | 222.3 | 197.8 | 197.8 | 12.4 | 12.4 |
| CCGF5 | 862.4 | 56.5 | 66.6 | 53.7 | (15.2) | 5.2 |
| Santo Antônio | 144.2 | 135.0 | 135.0 | 123.5 | - | 9.3 |
| Jirau | 239.9 | 118.7 | 118.7 | 108.6 | - | 9.3 |
| Others Auctions6 | 405.0 | 174.3 | 213.1 | 190.3 | (18.2) | (8.4) |
| Bilaterals | 135.4 | 232.7 | 232.7 | 210.3 | - | 10.6 |
| Total / Tariff Average Supply | 3,167.8 | 152.67 | 156.88 | 152.05 | (2.7) | 0.4 |
| 1Furnas transport charge not included. | ||||||
| 2Average auction price restated according as bilateral payment to vendors. It does not include hiring effects recorded by the CCEE. | ||||||
| ³ Energy Agreements. | ||||||
| 4Capacity Agreements. | ||||||
| 5Contract of quotas of assured power of those HPPs which concessions were extended pursuant the new rules of Law 12783/13. | ||||||
| 6Products average price. | ||||||
| *The table has been updated for all periods as new calculation methodology for average prices, a result of the 4th phase of the Public Hearing 78/2011 | ||||||
| Aneel approved on 03.28.2016. | ||||||
| With PIS/COFINS. | ||||||
Sales to Final Customers Average Tariff Copel Distribuição – without ICMS
| R$ / MWh | |||||
| Tariff¹ | Mar-17 (1) | Dec-16 (2) | Mar-16 (3) | Var. % (1/2) | Var. % (1/3) |
| Industrial | 385.31 | 373.80 | 419.54 | 3.1 | (8.2) |
| Residential | 421.44 | 421.43 | 492.27 | 0.0 | (14.4) |
| Commercial | 412.23 | 408.16 | 463.25 | 1.0 | (11.0) |
| Rural | 286.53 | 284.51 | 316.83 | 0.7 | (9.6) |
| Other | 310.59 | 308.18 | 357.98 | 0.8 | (13.2) |
| Retail distribution average rate | 384.19 | 380.27 | 433.82 | 1.0 | (11.4) |
| ¹ Does not consider tariff flags. Net of ICMS. |
32
* Amounts subject to rounding.
7. Capital Market
7.1 Capital Stock
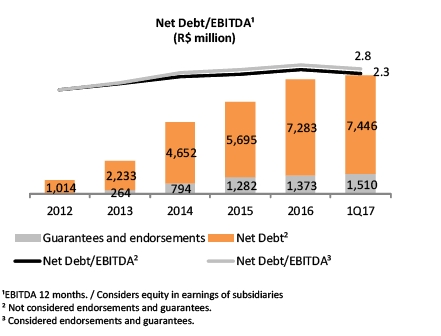
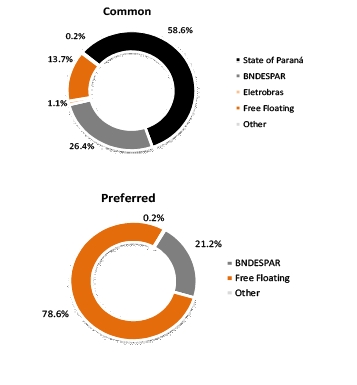
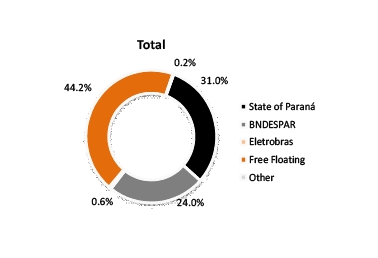
Copel’s capital amounts to R$7,910.0 million, represented by shares with no par value. The Company's current number of shareholders is 25,813. In March 2017 the Company’s capital was as follows:
| Thousand shares | |||||||||
| Shareholders | Common | % | Preferred "A" | % | Preferred "B" | % | TOTAL | % | |
| State of Paraná | 85,029 | 58.6 | - | - | - | - | 85,029 | 31.0 | |
| BNDESPAR | 38,299 | 26.4 | - | - | 27,282 | 21.3 | 65,581 | 24.0 | |
| Eletrobras | 1,531 | 1.1 | - | - | - | - | 1,531 | 0.6 | |
| Free Floating | 19,874 | 13.7 | 77 | 23.4 | 100,964 | 78.7 | 120,915 | 44.2 | |
| B3 | 18,610 | 12.8 | 77 | 23.4 | 64,949 | 50.6 | 83,636 | 30.6 | |
NYSE | 1,264 | 0.9 | - | - | 35,932 | 28.0 | 37,196 | 13.6 | |
| LATIBEX | - | - | - | - | 83 | 0.1 | 83 | - | |
| Other | 298 | 0.2 | 252 | 76.6 | 49 | - | 599 | 0.2 | |
| TOTAL | 145,031 | 100.0 | 329 | 100.0 | 128,295 | 100.0 | 273,655 | 100.0 | |
33
* Amounts subject to rounding.
34
* Amounts subject to rounding.
7.2 Stock Performance
| Stock Performance (Jan - Mar/17) | Common | Preferred "B" | |||
| (CPLE3 / ELPVY) | (CPLE6 / ELP / XCOP) | ||||
| Total | Daily average | Total | Daily average | ||
| B3 | Number of Trades | 8,122 | 131 | 200,875 | 3,240 |
| Volume Traded | 2,871,800 | 46,319 | 34,358,000 | 554,161 | |
| Trading Value (R$ thousand) | 71,330 | 1,150 | 1,181,178 | 19,051 | |
| Presence in Trading Sessions | 62 | 95% | 62 | 95% | |
| NYSE | Volume Traded | 47,425 | 1,157 | 24,497,056 | 395,114 |
| Trading Value (US$ thousand) | 357 | 9 | 253,556 | 4,090 | |
| Presence in Trading Sessions | 41 | 64% | 62 | 97% | |
| LATIBEX | Volume Traded | - | - | 821,006 | 13,459 |
| Trading Value (Euro thousand) | - | - | 411 | 7 | |
| Presence in Trading Sessions | - | - | 61 | 94% | |
From January to March 2017, Copel’s common shares (ON - CPLE3) and class B preferred shares (PNB - CPLE6) were traded in 95% of the trading sessions of the B3 S.A. - Brasil, Bolsa, Balcão (B3). The free float accounted for 45.0% of the Company’s capital. At the end of March 2017, the market value of Copel considering the prices of all markets was R$7,963.0 million.
Out of the 58 stocks that make up the Ibovespa index, Copel’s class B preferred shares accounted for 0.3% of the portfolio, with a Beta index of 1.2. Copel also accounted for 7.0% of the B3’s Electric Power Index (IEE). In the Corporate Sustainability Index (ISE), Copel class B preferred shares accounted for 1.0%.
Copel’s common and class B preferred shares closed the period at R$25.88 and R$32.74, with a positive variation of 35.6% and 19.7% respectively. In the same period the B3 had positive change of 7.9%.
On the New York Stock Exchange (NYSE), class B preferred shares, represented by American Depositary Shares (ADSs), were traded at Level 3, under the ticker ELP, in 97.0% of the trading sessions and closed the period at US$10.31, with a positive variation of 21.6%. Over this period, the Dow Jones Index positive by 4.6%.
On the Latibex (the Euro market for Latin American securities on the Madrid Stock Exchange), Copel’s class B preferred shares were traded under the ticker XCOP in 94% of the trading sessions and closed the period at €9.65, with a positive variation of 19.4%. In the same period the Latibex All Shares index had positive growth of 9.9%. The table below summarizes Copel’s share prices in 1Q17.
35
* Amounts subject to rounding.
| Ticker / Index | Price / Points | Var. (%) | ||
| 03.31.2017 | 12.31.2016 | |||
| B3 | CPLE3 | R$ 25.88 | R$ 19.08 | 35.6 |
| CPLE6 | R$ 32.74 | R$ 27.36 | 19.7 | |
| Ibovespa | 64,984 | 60,227 | 7.9 | |
| NYSE | ELP | US$ 10.31 | US$ 8.48 | 21.6 |
| Dow Jones | 20,663 | 19,763 | 4.6 | |
| LATIBEX | XCOP | € 9.65 | € 8.08 | 19.4 |
| Latibex | 1,992 | 1,812 | 9.9 | |
7.3 Dividends and Interest on Own Capital
The table below presents the payments of dividends and interest on own capital as of 2011:
| Type of Earning | Fiscal Year | Approved on | Paid on | Thousands of R$ | R$ per Share | ||
| (gross) | Common | Preferred "A" | Preferred "B" | ||||
| Total | 2011 | 421,091 | 1.46833 | 2.52507 | 1.61546 | ||
| IOC¹ | 2011 | 08/11/11 | 09/15/11 | 225,814 | 0.78803 | 0.86706 | 0.86706 |
| IOC | 2011 | 04/26/12 | 05/29/12 | 195,277 | 0.68030 | 1.65801 | 0.74840 |
| Total | 2012 | 268,554 | 0.93527 | 2.52507 | 1.02889 | ||
| IOC¹ | 2012 | 12/19/12 | 01/15/13 | 138,072 | 0.47920 | 2.52507 | 0.52720 |
| Dividends | 2012 | 04/25/13 | 05/23/13 | 130,482 | 0.45607 | - | 0.50169 |
| Total | 2013 | 560,537 | 1.95572 | 2.52507 | 2.15165 | ||
| IOC¹ | 2013 | 11/13/13 | 12/16/13 | 180,000 | 0.62819 | 0.69111 | 0.69111 |
| Dividends¹ | 2013 | 11/13/13 | 12/16/13 | 145,039 | 0.50617 | 0.55688 | 0.55688 |
| Dividends | 2013 | 04/24/14 | 05/28/14 | 235,498 | 0.82136 | 1.27708 | 0.90366 |
| Total | 2014 | 622,523 | 2.17236 | 2.52507 | 2.39000 | ||
| IOC¹ | 2014 | 10/24/14 | 11/21/14 | 30,000 | 0.10469 | 0.11519 | 0.11519 |
| Dividends¹ | 2014 | 10/24/14 | 11/21/14 | 350,770 | 1.22416 | 1.34678 | 1.34678 |
| Dividends | 2014 | 04/23/15 | 06/22/15 | 241,753 | 0.84351 | 1.06310 | 0.92803 |
| Total | 2015 | 326,795 | 1.13716 | 2.52507 | 1.25473 | ||
| IOC | 2015 | 04/28/16 | 06/15/16 | 198,000 | 0.68748 | 2.10511 | 0.76022 |
| Dividends | 2015 | 04/28/16 | 06/15/16 | 128,795 | 0.44968 | 0.41996 | 0.49451 |
| Total | 2016 | 506,213 | 1.76466 | 2.89050 | 1.94342 | ||
| IOC | 2016 | 04/28/17 | until 06/30/2017 | 282,947 | 0.98539 | 2.89050 | 1.08410 |
| Dividends | 2016 | 04/28/17 | until 12/31/2017 | 223,266 | 0.77927 | - | 0.85932 |
| ¹ In advance |
36
* Amounts subject to rounding.
8. Operating Performance
8.1 Power Generation
Assets in Operation
Copel Geração e Transmissão
Below is the main information of Copel GeT’s power station and the power produced in 1Q17.
| Power Plants | Installed | Assured Power | Generation | Concession |
| Capacity (MW) | (Average MW) | (GWh) | Expires | |
| Hydroelectric Power Plants | 4,541.9 | 1,976.1 | 6,168.4 | |
| HPP Gov. Bento Munhoz da Rocha Netto (Foz do Areia) | 1,676.0 | 576.0 | 1,662.9 | 09.17.2023 |
| HPP Gov. Ney Aminthas de Barros Braga (Segredo) | 1,260.0 | 603.0 | 2,047.8 | 11.15.2029 |
| HPP Gov. José Richa (Salto Caxias) | 1,240.0 | 605.0 | 1,877.3 | 05.04.2030 |
| HPP Gov. Parigot de Souza(1) | 78.0 | 32.7 | 127.4 | 01.05.2046 |
| HPP Mauá(2) | 185.2 | 100.8 | 303.9 | 07.02.2042 |
| HPP Guaricana | 36.0 | 16.1 | 54.3 | 08.16.2026 |
| SHP Cavernoso II(3) | 19.0 | 10.6 | 15.9 | 02.27.2046 |
| HPP Chaminé | 18.0 | 11.6 | 32.0 | 08.16.2026 |
| HPP Apucaraninha | 10.0 | 6.7 | 19.2 | 10.12.2025 |
| HPP Derivação do Rio Jordão | 6.5 | 5.9 | 12.7 | 11.15.2029 |
| HPP Marumbi | 4.8 | 2.4 | 5.3 | (4) |
| HPP São Jorge | 2.3 | 1.5 | 3.9 | 12.03.2024 |
| HPP Chopim I | 2.0 | 1.5 | 2.7 | (5) |
| HPP Cavernoso | 1.3 | 1.0 | 0.1 | 01.07.2031 |
| SHP Melissa | 1.0 | 0.6 | 1.5 | (5) |
| SHP Salto do Vau | 0.9 | 0.6 | 1.5 | (5) |
| SHP Pitangui | 0.9 | 0.1 | 0.2 | (5) |
| Thermal Power Plant | 20.0 | 10.3 | 12.2 | |
| TTP Figueira | 20.0 | 10.3 | 12.2 | 03.26.2019 |
| Wind Energy Plants | 2.5 | 0.5 | 0.7 | |
| UEE Eólica de Palmas(6) | 2.5 | 0.5 | 0.7 | 09.28.2029 |
| TOTAL | 4,564.4 | 1,986.9 | 6,181.3 | |
| (1) Proportional to 30% of the energy of the plant. The other 70% are allocated in the physical guarantee of quota system. | ||||
| (2) Refered to COPEL's participation (51% of power plant capacity of 363 MW). | ||||
| (3) Plant resumes commercial operation in June 2016. | ||||
| (4) Submitted to ANEEL for ratification. | ||||
| (5) Power plants with no concession agreement, only required to be registered at ANEEL. | ||||
| (6) Average wind plant generation. | ||||
On March 24, 2017 Copel GeT filed an agreement with Aneel with its intention to extend the granting of the TPP Figueira, noting, however, that it will sign the necessary contracts and/or additives only after knowing and accepting the contractual terms and the rules that will govern any process related to the extension of the grant.
37
* Amounts subject to rounding.
In addition, Copel GeT operates one plants under the quota system, as shown below:
| Power Plants - Quota System | Installed Capacity (MW) | Assured Power (Average MW) | Service Provision Revenue² (jul.16 - jun.17) (R$ million) | Granting Fee (R$ million) | Concession Expires |
| HPP Gov. Pedro Viriato Parigot de Souza (GPS)¹ | 182.0 | 76.3 | 126.1 | 574.8 | 01.05.2046 |
| HPP Rio dos Patos | 1.7 | 1.0 | - | - | - |
| TOTAL | 183.7 | 77.3 | 126.1 | 574.8 | |
| (1)Proportional the energy allocated in the physical guarantee of quota system (70% of the energy of the plant). To that portion of energy, Copel GeT will not bear the hydrological risks or with the financial | |||||
| results of the MRE associated with the plant. | |||||
| (2)Updated by Resolution nº 2,107, of July 19, 2016, of Aneel. | |||||
With respect to the Rio dos Patos facility, we are currently in charge of the facility on a temporary basis awaiting the decision of the MME on Aneel's recommendation for the extinction of the Rio dos Patos. The operation has been suspended since September 2014 as a result of a flood damage occured in July of that same year. The process will be done without the reversion of the assets of the company to the granting authority. With the extinction of Rio dos Patos, part of its structure will be reused during the construction of the Bela Vista SHP project, in which Copel will have a 36.0% interest.
In February 2017, Aneel recommended to the MME the shut down of the facility without reverting the assets to the granting authority. We are currently awaiting MME´s decision with respect to this facility.
Wind Farms Complex
Copel has 11 wind farms in commercial operation, which generated 210.3 GWh in 1Q17, as shown in the following chart:
| Wind Farm | Auction ¹ | Installed Capacity (MW) | Assured Power (Average MW) | Generation (GWh) | Price ² | Expiration of Authorization |
| São Bento Energia, Invest. e Part. S.A. | 94.0 | 46.3 | 93.4 | 208.40 | ||
| GE Boa Vista S.A. | 2nd LFA (08.26.2010) | 14.0 | 6.3 | 11.7 | 213.78 | 04.27.2046 |
| GE Olho D’Água S.A. | 30.0 | 15.3 | 32.7 | 207.55 | 05.31.2046 | |
| GE São Bento do Norte S.A. | 30.0 | 14.6 | 30.4 | 207.55 | 05.18.2046 | |
| GE Farol S.A. | 20.0 | 10.1 | 18.7 | 207.55 | 04.19.2046 | |
| Copel Brisa Potiguar S.A. | 183.6 | 98.4 | 116.9 | 183.85 | ||
| Nova Asa Branca I Energias Renováveis S.A. | 2nd LFA (08.26.2010) | 27.0 | 14.2 | 20.7 | 209.77 | 04.24.2046 |
| Nova Asa Branca II Energias Renováveis S.A. | 27.0 | 14.3 | 16.5 | 209.77 | 05.30.2046 | |
| Nova Asa Branca III Energias Renováveis S.A. | 27.0 | 14.5 | 19.1 | 209.77 | 05.30.2046 | |
| Nova Eurus IV Energias Renováveis S.A. | 27.0 | 14.7 | 17.1 | 209.77 | 04.26.2046 | |
| Santa Maria Energias Renováveis S.A. | 4th LER (08.18.2011) | 29.7 | 15.7 | 14.5 | 147.35 | 05.07.2047 |
| Santa Helena Energias Renováveis S.A. | 29.7 | 16.0 | 14.8 | 147.35 | 04.08.2047 | |
| Ventos de Santo Uriel S.A. | 16.2 | 9.0 | 14.2 | 146.20 | 04.08.2047 | |
| Total | 277.6 | 144.7 | 210.3 | 191.70 | ||
| ¹ LFA - Auction of Alternative Sources/ LER - Auction Reserve Energy. | ||||||
| ² Price updated to March, 2017. | ||||||
Interest in Generation Projects
Copel holds interests in seven power generation projects at the operational stage, with a total installed capacity of 884.7 MW, 599.0 MW referred to Copel´s stake, as shown below:
38
* Amounts subject to rounding.
| Company | Installed Capacity (MW) | Assured Power (Average MW) | Partners | PPA signed with | Concession Expires |
TPP Araucária | 484.1 | 390.3 | COPEL - 20% COPEL GeT - 60% Petrobras - 20% | ¹ | 12.22.2029 |
HPP Santa Clara | 120.2 | 69.6 | COPEL - 70% Paineira Participações - 30% | COPEL Dis Free customers | 05.28.2037 |
SHP Santa Clara I | 3.6 | 2.8 | COPEL - 70% Paineira Participações - 30% | Free customers | 12.18.1932 |
HPP Fundão | 120.2 | 65.8 | COPEL - 70% Paineira Participações - 30% | COPEL Dis Free customers | 05.28.2037 |
SHP Fundão I | 2.5 | 2.1 | COPEL - 70% Paineira Participações - 30% | Free customers | 12.18.1932 |
HPP Dona Francisca | 125.0 | 78.0 | COPEL - 23.03% Gerdau - 51.82% Celesc - 23.03% Desenvix - 2.12% | COPEL GeT Gerdau Celesc Desenvix | 08.27.2033 |
SHP Arturo Andreoli | 29.1 | 20.4 | COPEL - 35.77% Silea Participações - 64.23% | Free customers | 04.23.2030 |
| ¹ Since February 1, 2014, the plant’s operation has been under the responsibility of UEGA. The Araucária TPP does not have availability agreements and operates under the merchant | |||||
| model. | |||||
Interest in Wind Farms
Copel has 49% interest in the Voltalia São Miguel do Gostoso I Participações S.A. wind farm complex, in the State of Rio Grande do Norte. Whose energy was sold in the Fourth Reserve Energy Auction by under twenty-year contracts, with supply beginning in July, 2015.
| Wind Farm | Installed Capacity¹ (MW) | Assured Power (Average MW) | Price² | Start up | Stake (%) | Wind farm location | Expiration of Authorization |
| Voltalia - São Miguel do Gostoso I Participações S.A. ³ | |||||||
| Carnaúbas | 27.0 | 13.1 | 142.92 | Jul-15 | 49% COPEL 51% Voltalia | São Miguel do Gostoso (RN) | 04.08.2047 |
| Reduto | 27.0 | 14.4 | 04.15.2047 | ||||
| Santo Cristo | 27.0 | 15.3 | 04.17.2047 | ||||
| São João | 27.0 | 14.3 | 03.25.2047 | ||||
| Total | 108.0 | 57.1 | 142.92 | ||||
| ¹ The capacity envisaged in the Auction was altered based on the characteristics of Acciona Windpower’s equipment, respecting the volume of energy sold. | |||||||
| ² Price updated to March 2017. | |||||||
| ³ Developments apt for commercial operations, waiting for completion of transmission of works. | |||||||
The construction works of these wind farms were concluded in April 2015 and they have been prepared to operate since then. However, commercial operations will only begin after completion of the works in the transmission facilities (ICG Touros), under the responsibility of the transmission agent, which is scheduled for 2017.
39
* Amounts subject to rounding.
Under Construction
Copel Geração e Transmissão
Copel GeT is building two hydroelectric power plants that will add 405 MW to its total installed capacity, as described below.
| Power Plants | Contract | Installed Capacity (MW) | Assured Power (Average MW) | Energy Sold in the (Average MW) | Supply Start | Price¹ (R$/MWh) | CAPEX² (R$ million) | Concession Expires |
HPP Colíder | 01/2011 de 01.17.2011 | 300 | 177.9 | 125.0 | 01.01.2015 | 160.26 | 2,153.0 | 01.16.1946 |
HPP Baixo Iguaçu | 02/2012 de 08.20.2012 | 350 | 171.3 | 121.0 | 01.01.2013 | 166.78 | 685.8 | 09.14.2049 |
| Total³ | 650 | 349.2 | ||||||
| ¹ Adjusted by the IPCA up to March 2017. Font: CCEE. | ||||||||
| ² Adjusted for Copel's stake (considers own capital and third-party capital). | ||||||||
| ³ According to 2nd Amendment to the Concession Agreement, which including 756 days waiver of responsibility. | ||||||||
Colíder Hydroelectric Power Plant
In July 2010, Copel won the Aneel auction for the 35-year concession to build and operate the Colíder Hydroelectric Power Plant, in the Teles Pires river, in the state of Mato Grosso. The Colíder HPP will have an installed capacity of 300.0 MW and is located between the cities of Nova Canaã do Norte and Itaúba, with the cities of Colíder and Cláudia also being served by the future unit. The construction of the plant began in 2011 and around 93% of the works are complete. The dam is concluded and the spillway is being finalized. The manufacturing of equipment and electromechanical assemblies are underway, and Generating Unit 01 will reach its final assembly phase in 2017. In February 2016, we began building the 64-km transmission line, which will connect the plant to the Cláudia substation.
As a result of force majeure and government acts during the implementation of the Colíder HPP, Copel Geração e Transmissão requested with Aneel a waiver of responsibility, totaling 644 days, related to the delay in the plant’s startup, initially scheduled for December 30, 2014. Copel GeT honored the Colíder HPP’s CCEAR commitments, totaling 125 average-MW, using uncontracted energy surplus from its other plants.
In October 2015, the Regional Federal Appellate Court of the 1st Region granted Copel GeT a preliminary relief exempting it from fines, penalties, charges and other burdens until the waiver of responsibility request is settled with ANEEL. The request was denied in June 2016, so Copel GeT filed an administrative appeal at Aneel, requesting the reconsideration of the ruling.
In March 2017, Aneel denied Copel GeT's administrative appeal. However, considering the reasons that impacted the plant’s scheduled startup - force majeure and government acts during the implementation of the project - Copel will forward the matter to the Judiciary.
The first generating unit’s startup is scheduled for February 2018, while the third and final generating unit is scheduled to go into operation in July 2018.
40
* Amounts subject to rounding.
From a total assured power of 177.9 average-MW, established by MME (Ministry of Mines and Energy) Ordinance 258 of December 21, 2016, 125.0 average-MW are committed under a 30-year agreement, for the price of R$103.40/MWh, as of July 1, 2010 (annually adjusted by the IPCA consumer price index). The remaining 52.9 average-MW not sold under this agreement have not yet been contracted and are available for sale to large consumers in the free market.
On January 26, 2017, the Brazilian Energy Trading Chamber (CCEE) announced the results of the annual processing of the Compensation Mechanism of Surplus and Deficit (MCSD) of New Energy for the product from January 1 to December 31, 2017. Copel GeT participated in the reduction offer for the Colíder HPP’s Energy Commercialization Agreements in the Regulated Environment (CCEARs), obtaining a full reduction of the agreements (125 average-MW).
In addition, on February, 2017, the Energy Trading Chamber - CCEE (Câmara de Comercialização de Energia) announced the result of the processing of the new statements, backdating to 2016, for the Mechanism for the Compensation of Surplus and Deficits - MCSD of New Energy from July to December 2016. Copel GeT participated in the reduction offer of the Electric Power Trading Agreements in the Regulated Environment -CCEARs (Contratos de Comercialização de Energia no Ambiente Regulado) of the HPP Colíder, obtaining the reduction of the agreements in its entirety (average of 125 MW) from July 2016.
It should be noted that due to the preliminary protection issued by the TRF of the 1st Region, in October 2015, Copel GeT was already relieved to deliver the energy of the CCEARs in that period.
Baixo Iguaçu Hydroelectric Power Plant
As a result of act of government, fortuitous event and force majeure, the commercial start-up of generation unit 1 is scheduled for November 27, 2018, while units 2 and 3 should begin operations in December 2018 and January 2019. The construction works are on schedule and the wall for the rerouting of their river has been concluded, while the powerhouses and spillway assembly works are moving ahead.
Copel Renováveis
Wind Farm Complex
Copel Renováveis is expanding its energy generation matrix with renewable sources by building wind farm complexes in the State of Rio Grande do Norte, consisting of 13 projects with a total installed capacity estimated at 314.5 MW, as follows:
41
* Amounts subject to rounding.
| Cutia Wind Farm | Auction ¹ | Installed Capacity (MW)2,3 | Assured Power (Average MW) | Price4 | Start up | CAPEX (R$ million) | Premium Value (R$ million) | Wind farm location | Expiration of Authorization |
| UEE Cutia S.A. | 6th LER (10/31/2014) | 23.1 | 9.6 | 173.23 | Oct-17 | 1,318.0 | 9.4 | Pedra Grande | 01.04.2042 |
| UEE Guajiru S.A. | 21.0 | 8.3 | 173.23 | Pedra Grande | 01.04.2042 | ||||
| UEE Esperança do Nordeste S.A. | 27.3 | 9.1 | 173.23 | São Bento do Norte | 05.10.2050 | ||||
| UEE Jangada S.A. | 27.3 | 10.3 | 173.23 | São Bento do Norte | 01.04.2042 | ||||
| UEE Maria Helena S.A. | 30.0 | 12.0 | 173.23 | São Bento do Norte | 01.04.2042 | ||||
| UEE Paraíso dos Ventos do Nordeste | 27.3 | 10.6 | 173.23 | São Bento do Norte | 05.10.2050 | ||||
| UEE Potiguar S.A. | 27.3 | 11.5 | 173.23 | São Bento do Norte | 05.10.2050 | ||||
| CGE São Bento do Norte I S.A. | 20th LEN (11/28/2014) | 23.1 | 9.7 | 163.94 | Jan-19 | 893.4 | 14.2 | São Bento do Norte | 08.03.2050 |
| CGE São Bento do Norte II S.A. | 23.1 | 10.0 | 163.94 | São Bento do Norte | 08.03.2050 | ||||
| CGE São Bento do Norte III S.A. | 22.0 | 9.6 | 163.94 | São Bento do Norte | 08.03.2050 | ||||
| CGE São Miguel I S.A. | 21.0 | 8.7 | 163.94 | São Bento do Norte | 08.03.2050 | ||||
| CGE São Miguel II S.A. | 21.0 | 8.4 | 163.94 | São Bento do Norte | 08.03.2050 | ||||
| CGE São Miguel III S.A. | 21.0 | 8.4 | 163.94 | São Bento do Norte | 08.03.2050 | ||||
| Total | 314.5 | 126.2 | 169.20 | 2,211.4 | 23.6 | ||||
| ¹ Types of auctions: LER - Auction Reserve Energy / LEN - New Energy Auction. | |||||||||
| ² The installed capacity of the new projects can be optimized in relation to the registered at auctions. | |||||||||
| ³ The installed capacity of the wind farms was adjusted according to Aneel 's dispatches numbers: 1,248, 1,249, 1,250, 1,251, 1,252, 1,253, 1,254, 1,255, 1,256, 1,257 and 1,258 from May 8, 2017. | |||||||||
| 4Price updated to March 2017. | |||||||||
8.2 Transmission
Assets in Operation
The chart below shows the transmission concession agreements and the design of the substations park and the transmission lines in operation:
42
* Amounts subject to rounding.
| Subsidiary / SPC | Contract | Enterprise | TL | Substation | APR ¹ | Concession | |
| Extension (km) | Amount | MVA | (R$ million) | Expiration | |||
| Copel GeT | 060/20012 | Several | 2,021 | 32 | 12,202 | 192.1 | 12.31.2042 |
| Copel GeT | 075/20013 | TL Bateias - Jaguariaiva | 137 | - | - | 19.1 | 08.16.2031 |
| Copel GeT | 006/2008 | TL Bateias - Pilarzinho | 32 | - | - | 1.0 | 03.16.2038 |
| Copel GeT | 027/2009 | TL Foz - Cascavel Oeste | 116 | - | - | 11.2 | 11.18.2039 |
| Copel GeT | 015/2010 | Cerquilho III Substation | - | 1 | 300 | 4.5 | 10.05.2040 |
| Copel GeT | 022/2012 | TL Foz do Chopim - Salto Osório LT Londrina - Figueira | 102 | - | - | 5.6 | 08.26.2042 |
| Copel GeT | 002/2013 | TL Assis — Paraguaçu Paulista II | 83 | 1 | 150 | 7.7 | 02.24.2043 |
| Copel GeT | 005/2014 | TL Bateias - Curitiba Norte | 31 | 1 | 300 | 8.4 | 01.28.2044 |
| Copel GeT | 021/2014 | TL Foz do Chopim - Realeza | 52 | 1 | 150 | 7.0 | 09.04.2044 |
| Subtotal Copel GeT4 | 2,574 | 36 | 13,102 | 256.7 | |||
| Costa Oeste | TL Cascavel Norte - Cascavel Oeste | ||||||
| Copel GeT - 51% | 001/2012 | TL Cascavel Norte - Umuarama Sul | 152 | 1 | 300 | 6.5 | 01.11.2042 |
| Eletrosul - 49% | Umuarama Sul Substation | ||||||
| Transm. Sul Brasileira | |||||||
| Copel GeT - 20% | 004/2012 | TL Nova Sta Rita - Camaquã | 785 | 1 | 166 | 13.6 | 05.09.2042 |
| Eletrosul - 80% | |||||||
| Caiuá Transmissora | TL Guaíra - Umuarama Sul | ||||||
| Copel GeT - 49% | 007/2012 | TL Cascavel Norte - Cascavel Oeste | 136 | 2 | 700 | 12.0 | 05.09.2042 |
| Elecnor - 51% | Santa Quitéria Substation / Cascavel Norte Substation | ||||||
| Integração Maranhense | |||||||
| Copel GeT - 49% | 011/2012 | TL Açailandia - Miranda II | 365 | - | - | 18.0 | 05.09.2042 |
| Elecnor - 51% | |||||||
| Marumbi | |||||||
| Copel GeT - 80% | 008/2012 | TL Curitiba - Curitiba Leste | 29 | 1 | 672 | 14.3 | 05.09.2042 |
| Eletrosul - 20% | |||||||
| Matrinchã | |||||||
| Copel GeT - 49% | 012/2012 | TL Paranaíta - Ribeirãozinho | 1,005 | 3 | - | 94.2 | 05.09.2042 |
| State Grid - 51% | |||||||
| Guaraciaba | |||||||
| Copel GeT - 49% | 013/2012 | LT Ribeirãozinho - Marimbondo | 600 | 1 | - | 48.7 | 05.09.2042 |
| State Grid - 51% | |||||||
| Paranaíba | |||||||
| Copel GeT - 24,5% | 007/2013 | TL Barreiras II - Pirapora II | 953 | - | - | 32.1 | 05.01.2043 |
| Furnas - 24,5% | |||||||
| State Grid - 51% | |||||||
| Subtotal SPCs5 | 4,025 | 9 | 1,838 | 239.5 | |||
| Total | 6,599 | 45 | 14,940 | 496.1 | |||
| 1Proportion to the participation of Copel in the venture. Updated according to Aneel Aproval Resolution No. 2,098/2016 06.28.2016 | |||||||
| 2Renewed contract pursuant to Law 12,783/13. | |||||||
| 3From the 10.31.2018 APR will be reduced 50%. | |||||||
| 4Consolidated Income. | |||||||
| 5Equity in Earning of Subsidiaries. | |||||||
Assets under Construction
Copel GeT is substantially increasing its share of the transmission segment through own investments and partnerships in SPCs. The projects have a joint total of 1,881 km of transmission lines and 4 substations and will generate APR of R$306.3 million of which refers to Copel Get stake. Copel’s interest in the transmission projects is available in the table below.
43
* Amounts subject to rounding.
| Subsidiary / SPC | Auction | Signing of Contract | Enterprise | State | km | Subst | APR¹ (R$ million) | CAPEX² (R$ million) | Start up | Concession Expiration |
| Copel GeT | 001/10 | Oct-10 | TL Araraquara II — Taubaté | SP | 356 | - | 27.4 | 434.3 | Aug-17 | 10.05.2040 |
| Copel GeT | 001/14 | Sep-14 | TL Assis – Londrina | SP / PR | 120 | - | 18.3 | 151.0 | Sep-17 | 09.04.2044 |
| Copel GeT | 005/15 | Apr-16 | TL Curitiba Leste - Blumenau TL Baixo Iguaçu - Realeza | PR / SC | 230 | 3 | 104.8 | 560.9 | Sep-19 Mar-21 | 04.06.2046 |
| Subtotal Copel GeT | 706 | 3 | 150.5 | 1,146.1 | - | |||||
| Mata de Santa Genebra | ||||||||||
| Copel GeT - 50,1% | 007/13 | May-14 | TL Araraquara II - Bateias | SP / PR | 847 | 1 | 109.9 | 1012.6 | Nov-17 | 05.13.2044 |
| Furnas - 49,9% | ||||||||||
| Cantareira | ||||||||||
| Copel GeT - 49% | 001/14 | Sep-14 | TL Estreito - Fernão Dias | SP / MG | 328 | - | 45.9 | 422.2 | Mar-18 | 09.04.2044 |
| Elecnor - 51% | ||||||||||
| Subtotal SPC | 1,175 | 1 | 155.8 | 1,434.8 | ||||||
| Total | 1,881 | 4 | 306.3 | 2,580.9 | ||||||
| ¹ Updated according to Aneel Ratification Resolution 1918/2015 / Adjusted for Copel’s stake. | ||||||||||
| ² Adjusted for Copel’s stake (considers own capital and third-party capital). | ||||||||||
8.3 Distribution
Concession agreement
In December 2015, the Company signed the fifth amendment to the Public Electricity Distribution Concession Agreement no. 46/1999 of Copel Distribuição S.A., extending the concession term to July 7, 2045.
The concession agreement imposes economic and financial efficiency and quality conditions. Failure to comply with the conditions for two consecutive years or any of the limits at the end of the first five years will result in the termination of the concession. From the sixth year following execution of the agreement, any breach of quality criteria for three consecutive years or economic and financial management criteria for two consecutive years will result in the opening of a forfeiture process. In addition, noncompliance with the overall goals of collective continuity indicators for two consecutive years or three times in five years may limit the payment of dividends or interest on equity, while failure to meet the economic and financial sustainability indicators will reflect the need for a capital contribution from the controlling shareholders. The following chart shows the goals set for Copel Distribuição in the first 5 years of renovation:
44
* Amounts subject to rounding.
| Year | Economic and Financial Management | Quality (Limit Established)1 | Quality Performed | ||
| DECi² | FECi² | DECi² | FECi² | ||
| 2016 | 13.61 | 9.24 | 10.82 | 7.23 | |
| 2017 | EBITDA4≥0 | 12.54 | 8.74 | - | - |
| 2018 | EBITDA4(-) QRR³≥0 | 11.23 | 8.24 | - | - |
| 2019 | {Net Debt / [EBITDA4(-)QRR³]}≤1/(0.8*SELIC5) | 10.12 | 7.74 | - | - |
| 2020 | {Net Debt / [EBITDA4(-)QRR³]}≤1/(1.11*SELIC5) | 9.83 | 7.24 | - | - |
| 1According to Aneel’s Technical Note No. 0335/2015 | |||||
| ² DECi – Equivalent Time of Interruption Caused by Internal Source per Consumer Unit; and FECi – Equivalent Frequency of Interruption Caused by Internal Source per Consumer Unit. | |||||
| ³ QRR: Regulatory Reintegration Quota or Regulatory Depreciation Expense. It will be the value set in the last Periodic Tariff Review - RTP, plus the IGP-M between the month prior to the | |||||
| RTP and the month prior to the period of twelve (12) months of the determination of economic and financial sustainability. In June/2016 set value was R$333.8 million. | |||||
| 4EBITDA adjusted for the effects of post-employment benefits, provisions and PDV. | |||||
| 5Selic: limited to 12.87% p.y. | |||||
Operating Data
In the distribution business, Copel serves more than 4.5 million energy customers in 1,113 locations, belonging to 394 municipalities in State of Paraná and one in the State of Santa Catarina. Copel Distribuição operates and maintains the installations in the 13.8 kV, 34.5 kV, 69 kV, 138 kV and some of 230 kV voltage levels.
| Voltage | Km | Substations | MVA |
| 13.8 kV | 104,764 | - | - |
| 34.5 kV | 84,199 | 223 | 1,500 |
| 69 kV | 695 | 35 | 2,335 |
| 88 kV1 | - | - | 5 |
| 138 kV | 5,970 | 106 | 7,163 |
| 230 kV | 166 | - | - |
| Total | 195,794 | 364 | 11,003 |
| 1Not automated. |
Compact-Design Distribution Lines
Copel Distribuição has continued to implement compact-design distribution lines in urban areas with a high concentration of trees surrounding the distribution grids. This technology reduces the number of trees cut down or trimmed, and improves the quality of power supply by reducing the number of unplanned outages. The total length of compact-design distribution lines in operation in March 2017 was 9,052 km.
Secondary Isolated Lines
Copel Distribuição has also invested in low-voltage (127/220V) secondary isolated lines, which offer substantial advantages over regular overhead lines, including: improvement in DEC and FEC distribution performance indicators, defense against illegal connections, improved environmental conditions, reduced areas subject to tree trimming, improved safety, reduced voltage drops throughout the grid, and increased transformer useful life, due to the reduction of short-circuits, among other advantages. The total length of installed secondary isolated lines closed March 2017 at 16,507 km.
45
* Amounts subject to rounding.
Quality of Supply
The two main indicators of power supply quality are DEC (outage duration) and FEC (outage frequency). The trends for these indicators, as well as for total time service, are shown below:
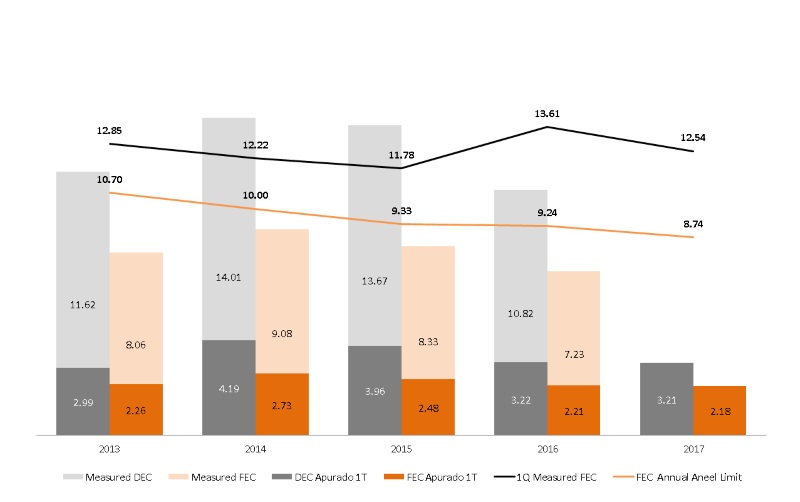
8.4 Telecommunications
Copel Telecomunicações has an optical backbone, a high capacity intermunicipal transmission network, and the access, a customer service network. The access network can be multi-point (GPON) or point-to-point (conventional), thus connecting the customer to the network's transmission Copel Telecom and providing the contracted services.
In March 2017, the backbone cable network extended for 10,140 km and the access network extended for 20,977 km. Currently, we serve the 399 municipalities in the State of Paraná and another 2 in the State of Santa Catarina.
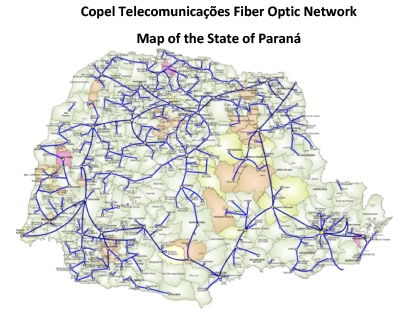
46
8.5 Equity Interests
Other Sectors
Copel holds interests in companies in the gas, telecommunications, sanitation and service sectors, as shown below:
| Company | Sector | Partners |
| Dominó Holdings S.A. | Sanitation | COPEL - 49.0% |
| Andrade Gutierrez - 51.0% | ||
| Cia. de Saneamento do Paraná - Sanepar | Sanitation | COPEL - 7.2% |
| State of Paraná - 29.9% | ||
| Dominó Holdings S.A. - 3.2% | ||
| Other - 59.7% | ||
| Companhia Paranaense de Gás - Compagás | Gas | COPEL - 51.0% |
| Mitsui Gás - 24.5% | ||
| Gaspetro - 24.5% | ||
| Paraná Gás Exploração e Produção S.A1 | Oil and natural gas | COPEL - 30.0% |
| Petra Energia - 30.0% | ||
| Bayar Participações -30.0% | ||
| Tucumann Engenharia - 10.0% | ||
| Sercomtel S.A. Telecom | Telecommunications | COPEL - 45.0% |
| Município de Londrina - 44.4% | ||
| Banco Itauleasing S.A. - 7.1% | ||
| Outros - 3.5% | ||
| Carbocampel S.A. | Coal mining | COPEL - 49.0% |
| Carbonífera Cambuí - 51.0% | ||
| Copel Amec Ltda in liquidation | Services | COPEL - 48.0% |
| Amec - 47.5% | ||
| Lactec - 4.5% | ||
| 1More information in item 8.6 |
8.6 New Projects
Project Portfolio
Copel holds interests in different power generation projects. When these projects go into commercial operation, they will add 692.5 MW of installed capacity to the Company's portfolio.
| Project | Estimated Installed Capacity | Estimated Assured Power | COPEL' Stake |
| (MW)¹ | (Average MW) | (%) | |
| SHP | 88.0 | 52.0 | |
| Bela Vista | 29.0 | 16.6 | 36.0 |
| Dois Saltos | 30.0 | 15.5 | 30.0 |
| Salto Alemã | 29.0 | 19.8 | 19.0 |
| HPP | 378.0 | 205.0 | |
| São Jerônimo | 331.0 | 178.1 | 41.2 |
| Salto Grande | 47.0 | 26.9 | 35.8 |
| WPP | 149.1 | 79.6 | |
| Complexo Alto Oriente | 48.3 | 24.7 | 100.0 |
| Complexo Jandaia | 100.8 | 54.9 | 100.0 |
| Total | 615.1 | 336.6 | |
| ¹ The installed capacity of the new projects can be optimized in relation to the registered at auctions. | |||
47
* Amounts subject to rounding.
Copel, in partnership with the companies Brennand, Minas PCH and Silea, is also developing studies in the lower reaches of the Rio Chopim that will lead to the feasibility of another four (4) hydroelectric projects. As for wind power generation, there are studies for the feasibility of new wind farms in the State of Rio Grande do Norte, where Copel already has wind assets. The short-term objective is to register such projects in the EPE to enable participation in the upcoming auctions to be organized by the Federal Government. The technical characteristics may be adjusted until the effective energy commercialization of the projects, since Copel's engineering is conducting optimization studies, in order to make the projects more competitive.
Interest in Feasibility Study
Hydroelectric Potential Surveyed Along the Piquiri River
The feasibility studies for the four hydroelectric power plants making up the hydroelectric potential of the Piquiri River, in Paraná, were submitted by Copel GeT and accepted by Aneel in 2012. The following table features these plants, which have a joint installed capacity 459.3 MW:
| Project | Estimated Installed Capacity (MW) | |
| HPP Apertados | 139.0 | |
| HPP Comissário | 140.0 | |
| HPP Foz do Piquiri | 93.2 | |
| HPP Ercilândia | 87.1 | |
| Total | 459.3 |
| Oil and Gas Exploration and Production (Paraná Gás | |
| Exploração e Produção S.A) | |
On November 28, 2013, in the 12th round of Bids of the National Petroleum Agency (ANP), the consortium formed by Copel (30%),Bayar Participações (30%), Tucumann Engenharia (10%) and PetraEnergia (30%) (the latter acting as operator) won the right to explore,develop and produce oil and natural gas in four blocks in an 11,327km² area in the midwestern region of the State of Paraná. Theconsortium’s total investment will come to R$78.1 million in the firstphase of exploration, for the term of four years granted by the ANP.Copel and its partners Bayar, Tucumann and Petra signed concessioncontracts for 2 blocks in May 2014. At the end of 2016, State Law No. 18.947/2016 was sanctioned, suspendingpor ten years the environmental licensing of any drilling or exploration activity of shale gas by the hydraulicfracturing method, better known as "fracking". The effects of this agreement on a concession and future actionsare under evaluation by the Company. |
Signature Bonus: R$12.5 million |
48
* Amounts subject to rounding.
9. Other Information
9.1 Human Resources
Copel’s workforce closed 1Q17 at 8,494 employees distributed. The table below shows employee number trends in the Company and its subsidiaries in the last four years:
| Headcount | 2014 | 2015 | 2016 | 2017 |
Geração e Transmissão | 1,554 | 1,568 | 1,680 | 1,683 |
Distribuição | 6,071 | 6,032 | 6,022 | 5,970 |
Telecomunicações | 601 | 621 | 660 | 663 |
Holding | 329 | 347 | 69 | 69 |
Comercialização | 11 | 10 | 30 | 39 |
Renováveis | 26 | 50 | 70 | 70 |
TOTAL | 8,592 | 8,628 | 8,531 | 8,494 |
At the end of March, Copel Distribuição had 4,501,853 customers, representing a consumer-to-employee ratio of 754. Compagas, Elejor and UEG Araucária, companies in which Copel holds a majority interest, had 162, 7 and 16 employees, respectively.
49
* Amounts subject to rounding.
9.2 Main Operational Indicators
| Installed capacity | |||||
| Generation | Transmission | ||||
| (MW) | |||||
| Copel GeT | Copel GeT | ||||
| In operation | 4,746.4 | In operation | |||
| Hydroeletric1 | 16 | 4,541.9 | Transmission Lines (km) | 2,574 | |
| Quota System | 1 | 182.0 | Substation (amount) | 36 | |
| Thermal | 1 | 20.0 | Under construction | ||
| Wind power | 1 | 2.5 | Transmission Lines (km) | 706 | |
| Under construction | 405.0 | Substation (amount) | 3 | ||
| Hydroeletric | 2 | 405.0 | Partnership | ||
| Wind Farms | In operation | ||||
| In operation | 11 | 277.6 | Transmission Lines (km) | 4,025 | |
| Under construction | 13 | 314.5 | Substation (amount) | 9 | |
| Partnership | Under construction | ||||
| In operation | 599.0 | Transmission Lines (km) | 1,175 | ||
| Hydroeletric | 6 | 211.7 | Substation (amount) | 1 | |
| Thermal | 1 | 387.3 | |||
| Under construction | 52.9 | ||||
| Copel Distribuition | |||||
| Wind farms¹ | 4 | 52.9 | |||
| Distribution lines (km) | 195,794 | ||||
| Substations | 364 | ||||
| Installed power substations (MVA) | 11,003 | ||||
| Copel Telecom | |||||
| Municipalities served | 395 | ||||
| Optical cables backbone network (km) | 10,140 | Locations served | 1,113 | ||
| Optical cables access network (km) | 20,977 | Captive customers | 4,501,853 | ||
| Cities served in Parana State | 399 | Customers by distribution employee | 754 | ||
| Cities served in Santa Catarina State | 2 | DEC (in hundredths of an hour and minute) | 3.21 | ||
| FEC (number of outages) | 2.18 | ||||
| Administration | |||||
| Total employees | 8,494 | ||||
| Copel Geração e Transmissão | 1,683 | Copel Participações | 39 | ||
| Copel Distribuição | 5,970 | Copel Renováveis | 70 | ||
| Copel Telecomunicações | 663 | Copel Holding | 69 | ||
| 130% of the Parigot de Souza HPP's assured energy become sold by Copel GeT as of January 1st, 2017. | |||||
| ² The Wind Farm Voltalia São Miguel do Gostoso I Participações S.A., is able to operate commercially, though the operation will only begin after completion of the | |||||
| transmission of works, transmission agent's responsibility. | |||||
50
* Amounts subject to rounding.
9.3 Conference Call 1Q17 Results
Information about 1Q17 Results Conference Call:
>Tuesday, May 16, 2017, at 10:00 a.m. (Brasília time)
>Telephone: (+1 516) 300 1066>Code:Copel
A live webcast of the conference call will be available at:ir.copel.comPlease connect 15 minutes before the call.
Investor Relations – Copelri@copel.comTelephone: (+ 55 41) 3222-2027
| The information contained in this press release may contain forward-looking statements that reflect management’s current view and estimates of future economic circumstances, industry conditions, companyperformance, and financial results. Any statements, expectations, capabilities, plans and assumptions containedin this press release that do not describe historical facts such as statements regarding the declaration orpayment of dividends, the direction of future operations, the implementation of relevant operating and financialstrategies, the investment program, factors or trends affecting the Company’s financial condition, liquidity orresults of operations are forward-looking statements within the meaning of the U.S. Private Securities LitigationReform Act of 1995 and involve a number of risks and uncertainties. There is no guarantee that these results willactually occur. The statements are based on many assumptions and factors, including general economic andmarket conditions, industry conditions and operating factors. Any changes in such assumptions or factors couldcause actual results to differ materially from current expectations. |
51
* Amounts subject to rounding.
Exhibit I – Consolidated Cash Flow Statement
| R$'000 | ||
| Consolidated Cash Flow | 1Q17 | 1Q16 |
| Cash flows from operating activities | ||
| Net income for the period | 417,270 | 136,089 |
| Adjustments to reconcile net income with the cash provided by operating activities | 764,449 | 1,127,857 |
| Depreciation and Amortization | 183,078 | 179,036 |
| Unrealized monetary and exchange variations, net | 272,676 | 206,376 |
| Remuneration of accounts receivable related to the concession | (23,249) | (37,548) |
| Sectoral assets and liabilities result | 163,104 | 545,993 |
| Interest - bonus from the grant | (20,612) | - |
| Gain on remeasurement of the cash flow from the RBSE assets | (224,604) | - |
| Equity in earnings of subsidiaries | (33,713) | (47,894) |
| Recognition of fair value of accounts receivable related to concession | - | - |
| Income Tax and Social Contribution | 193,112 | 353,151 |
| Deferred Income Tax and Social Contribution | 56,600 | (297,792) |
| Net operational provisions and reversals | 98,699 | 121,061 |
| Appropriation of actuarial calculation of post-employment benefits | 24,108 | 32,210 |
| Appropriation of pension and healthcare contribution | 36,981 | 34,498 |
| Provision for research and development and energy efficiency | 26,403 | 26,367 |
| Write off of intangible assets related to concession - goodwill | 6 | 52 |
| Write off of property, plant, and equipment | 1,864 | 2,673 |
| Write off of intangible assets | 9,996 | 9,674 |
| Decrese (increase) in assets | (136,619) | 308,354 |
| Increase (reduction) of liabilities | (353,894) | (792,840) |
| Income tax and social contribution paid | (131,763) | (450,525) |
| Charges on loans and financing paid | (120,367) | (127,724) |
| Charges paid debentures | (11,645) | (5,213) |
| Net cash generated by operating activities | 427,431 | 195,998 |
| Cash flows from investing activities | ||
| Bonds and securities | (27,611) | (3,365) |
| Additions in investments | (105,789) | (51,806) |
| Reduction of capital in investees | 73,361 | - |
| Additions to property, plant, and equipment | (197,609) | (218,174) |
| Financial participation of the consumer - property, plant and equipment | - | 40 |
| Additions to intangible | (167,037) | (187,739) |
| Customer contributions | 26,100 | 23,953 |
| Net cash generated (used) by investing activities | (398,585) | (437,091) |
| Cash flows from financing activities | ||
| Loans and financing obtained | 77,060 | - |
| Amortization of principal amounts of loans and financing | (120,801) | (42,866) |
| Amortization of principal amounts of debentures | (18,252) | (14,828) |
| Dividends and interest on own capital paid | (3,335) | (21,501) |
| Net cash used by financing activities | (65,328) | (79,195) |
| Increase (decrease) in cash and cash equivalents | (36,482) | (320,288) |
| Cash and cash equivalents at the beginning of the year | 982,073 | 1,480,727 |
| Cash and cash equivalents at the end of the year | 945,591 | 1,160,439 |
| Variation in cash and cash equivalents | (36,482) | (320,288) |
52
* Amounts subject to rounding.
Exhibit II – Financial Statements – Wholly Owned Subsidiaries
Income Statement – Copel Geração e Transmissão
| R$'000 | ||||
| Income Statement | 1Q17 | 4Q16 | 1Q16 | Var.% |
| (1) | (2) | (3) | (1/3) | |
OPERATING REVENUES | 1,073,542 | 876,090 | 751,715 | 42.8 |
Electricity sales to final customers | 141,827 | 157,495 | 139,756 | 1.5 |
Electricity sales to distributors | 557,416 | 466,938 | 433,163 | 28.7 |
Use of the main transmission grid | 298,800 | 120,505 | 77,291 | 286.6 |
Construction revenue | 62,169 | 118,979 | 88,795 | (30.0) |
Other operating revenues | 13,330 | 12,172 | 12,710 | 4.9 |
OPERATING COSTS AND EXPENSES | (433,249) | (593,374) | (390,780) | 10.9 |
Electricity purchased for resale | (6,688) | (11,763) | (11,787) | (43.3) |
Charges of main distribution and transmission grid | (74,857) | (73,755) | (65,476) | 14.3 |
Personnel and management | (68,592) | (109,329) | (61,489) | 11.6 |
Pension and healthcare plans | (14,213) | (16,707) | (14,989) | (5.2) |
Materials and supplies | (3,615) | (3,890) | (4,778) | (24.3) |
Materials and supplies for power eletricity | (4,334) | (7,904) | (3,985) | 8.8 |
Third-party services | (26,203) | (26,290) | (23,966) | 9.3 |
Depreciation and amortization | (69,307) | (62,150) | (74,019) | (6.4) |
Provisions and reversals | (5,914) | (111,888) | 7,842 | - |
Construction cost | (117,492) | (127,722) | (76,507) | 53.6 |
Other cost and expenses | (42,034) | (41,975) | (61,626) | (31.8) |
EQUITY IN EARNINGS OF SUBSIDIARIES | 4,327 | (363,251) | 20,649 | (79.0) |
PROFIT BEFORE FINANCIAL RESULTS AND TAXES | 644,620 | (80,535) | 381,584 | - |
FINANCIAL RESULTS | (129,702) | (108,542) | (143,596) | - |
Financial income | 10,416 | 40,193 | 13,317 | (21.8) |
Financial expenses | (140,118) | (148,735) | (156,913) | (10.7) |
OPERATIONAL EXPENSES/ INCOME | 514,918 | (189,077) | 237,988 | 116.4 |
INCOME TAX AND SOCIAL CONTRIBUTION ON PROFIT | (171,962) | 44,891 | (72,770) | - |
Income tax and social contribution on profit | (117,710) | 16,228 | (102,686) | 14.6 |
Deferred income tax and social contribution on profit | (54,252) | 28,663 | 29,916 | - |
NET INCOME (LOSS) | 342,956 | (144,186) | 165,218 | 107.6 |
EBITDA | 713,927 | (18,385) | 455,603 | 56.7 |
53
* Amounts subject to rounding.
Income Statement – Copel Distribuição
| R$'000 | ||||
| Income Statement | 1Q17 | 4Q16 | 1Q16 | Var.% |
(1) | (2) | (3) | (1/3) | |
OPERATING REVENUES | 2,004,319 | 2,373,070 | 2,085,928 | (3.9) |
Electricity sales to final customers | 982,325 | 940,161 | 1,440,720 | (31.8) |
Electricity sales to distributors | 112,287 | 183,502 | 156,647 | (28.3) |
Use of the main distribution grid | 862,424 | 735,512 | 800,584 | 7.7 |
Construction revenue | 152,628 | 220,077 | 177,341 | (13.9) |
Fair value of assets from the indemnity for the concession | 4,861 | 131,738 | 8,650 | (43.8) |
Sectorial assets and liabilities result | (147,977) | 110,470 | (527,202) | (71.9) |
Other operating revenues | 37,771 | 51,610 | 29,188 | 29.4 |
OPERATING COSTS AND EXPENSES | (1,882,067) | (2,215,886) | (2,172,193) | (13.4) |
Electricity purchased for resale | (1,119,526) | (1,313,226) | (1,253,842) | (10.7) |
Charges of main transmission grid | (106,649) | (126,208) | (209,140) | (49.0) |
Personnel and management | (188,105) | (285,618) | (169,769) | 10.8 |
Pension and healthcare plans | (38,693) | (41,597) | (39,020) | (0.8) |
Materials and supplies | (14,230) | (12,954) | (17,489) | (18.6) |
Third-party services | (81,432) | (82,446) | (84,904) | (4.1) |
Depreciation and amortization | (70,981) | (69,031) | (66,290) | 7.1 |
Provisions and reversals | (58,676) | (8,510) | (112,103) | (47.7) |
Construction cost | (152,628) | (220,077) | (177,341) | (13.9) |
Other cost and expenses | (51,147) | (56,219) | (42,295) | 20.9 |
PROFIT BEFORE FINANCIAL RESULTS AND TAXES | 122,252 | 157,184 | (86,265) | - |
FINANCIAL RESULTS | 15,701 | (120,635) | 29,390 | (46.6) |
Financial income | 77,653 | (26,232) | 106,568 | (27.1) |
Financial expenses | (61,952) | (94,403) | (77,178) | (19.7) |
OPERATIONAL EXPENSES/ INCOME | 137,953 | 36,549 | (56,875) | - |
INCOME TAX AND SOCIAL CONTRIBUTION ON PROFIT | (66,665) | 34,134 | 17,728 | - |
Income tax and social contribution on profit | (50,424) | 51,678 | (230,574) | (78.1) |
Deferred income tax and social contribution on profit | (16,241) | (17,544) | 248,302 | - |
NET INCOME (LOSS) | 71,288 | 70,683 | (39,147) | - |
EBITDA | 193,233 | 226,215 | (19,975) | - |
54
* Amounts subject to rounding.
Income Statement– Copel Telecomunicações
| Income Statement | 1Q17 | 4Q16 | 1Q16 | Var.% |
| (1) | (2) | (3) | (1/3) | |
| NET OPERATING REVENUES | 87,691 | 88,325 | 78,085 | 12.3 |
| Revenues from telecommunications | 78,170 | 79,234 | 69,809 | 12.0 |
| Other operating revenues | 9,521 | 9,091 | 8,276 | 15.0 |
| OPERATING COSTS AND EXPENSES | (65,528) | (72,939) | (57,446) | 14.1 |
| Personnel and management | (25,357) | (35,332) | (20,792) | 22.0 |
| Pension and healthcare plans | (3,744) | (4,791) | (4,814) | (22.2) |
| Materials and supplies | (568) | (660) | (355) | 60.0 |
| Third-party services | (14,707) | (13,772) | (10,077) | 45.9 |
| Depreciation and amortization | (9,299) | (9,153) | (8,396) | 10.7 |
| Provisions and reversals | (2,709) | 543 | (5,236) | (48.3) |
| Other cost and expenses | (9,144) | (9,774) | (7,776) | 17.6 |
| PROFIT BEFORE FINANCIAL RESULTS AND TAXES | 22,163 | 15,386 | 20,639 | 7.4 |
| FINANCIAL RESULTS | (5,056) | 763 | (3,969) | 27.4 |
| Income tax and social contribution on profit | 2,616 | 2,339 | 4,604 | (43.2) |
| Deferred income tax and social contribution on profit | (7,672) | (1,576) | (8,573) | (10.5) |
| OPERATIONAL EXPENSES / INCOME | 17,107 | 16,149 | 16,670 | 2.6 |
| INCOME TAX AND SOCIAL CONTRIBUTION ON PROFIT | (5,588) | 3,588 | (5,501) | 1.6 |
| Income tax and social contribution on profit | (7,541) | 3,369 | (8,198) | (8.0) |
| Deferred income tax and social contribution on profit | 1,953 | 219 | 2,697 | (27.6) |
| NET INCOME (LOSS) | 11,519 | 19,737 | 11,169 | 3.1 |
| EBITDA | 31,462 | 24,539 | 29,035 | 8.4 |
55
* Amounts subject to rounding.
Exhibit III – Financial Statements by Company
Balance Sheet by Company
| R$'000 | ||||||||||
| Assets - Mar-17 | Geração e Transmissão | Distribuição | Telecom | Compagas | Elejor | UEG Araucária | Other¹ | Holding | Eliminations | Consolidated |
| CURRENT | 777,697 | 2,788,634 | 88,183 | 120,984 | 77,644 | 284,961 | 404,177 | 734,883 | (653,321) | 4,623,842 |
| Cash and cash equivalents | 54,937 | 449,295 | 16,273 | 46,548 | 39,855 | 20,239 | 301,624 | 16,820 | - | 945,591 |
| Bonds and securities | 10,594 | - | - | - | - | 241,926 | 2,202 | 91 | - | 254,813 |
| Collaterals and escrow accounts | - | 15 | - | 132 | - | - | - | 129 | - | 276 |
| Customers | 397,665 | 1,911,774 | 44,734 | 56,454 | 23,938 | - | 49,304 | - | (44,440) | 2,439,429 |
| Dividends receivable | 65,970 | - | - | - | - | - | 10,492 | 484,570 | (489,375) | 71,657 |
| CRC transferred to the State Government of Paraná | - | - | - | - | - | - | - | 40,993 | - | 40,993 |
| Account receivable related to concession | 106,175 | - | - | - | - | - | - | - | - | 106,175 |
| Accounts receivable related to the concession compensation | - | - | - | - | - | - | - | - | - | - |
| Other current receivables | 69,967 | 198,641 | 4,549 | 13,893 | 4,278 | 12,240 | 6,891 | 8,962 | 227 | 319,648 |
| Inventories | 27,993 | 88,052 | 8,357 | 2,478 | - | - | - | - | - | 126,880 |
| Income tax and social contribution | 26,035 | 69,439 | 8,258 | 1,060 | - | 7,701 | 5,631 | 59,621 | - | 177,745 |
| Other current recoverable taxes | 9,881 | 52,402 | 5,983 | - | - | 2,855 | 1,766 | 240 | - | 73,127 |
| Prepaid expenses | 8,407 | 19,016 | 29 | 419 | 9,573 | - | - | - | - | 37,444 |
| Related parties | 73 | - | - | - | - | - | 26,267 | 123,457 | (119,733) | 30,064 |
| NON-CURRENT | 13,912,905 | 7,453,933 | 808,727 | 407,194 | 625,326 | 359,099 | 2,480,083 | 16,996,478 | (16,587,251) | 26,456,494 |
| Long Term Assets | 3,760,901 | 1,896,725 | 91,316 | 173,274 | 35,683 | 57,044 | 214,647 | 2,471,029 | (132,064) | 8,568,555 |
| Bonds and securities | 97,252 | 1,817 | - | 6,831 | - | - | 94,175 | - | - | 200,075 |
| Other temporary investments | - | - | - | - | - | - | 73,361 | 417,500 | - | 490,861 |
| Collaterals and escrow accounts | - | 70,948 | - | - | - | - | - | - | - | 70,948 |
| Customers | 111,953 | 115,782 | 50,678 | - | - | - | - | - | - | 278,413 |
| CRC transferred to the State Government of Paraná | - | - | - | - | - | - | - | 1,483,507 | - | 1,483,507 |
| Judicial deposits | 82,908 | 348,033 | 11,685 | 2,137 | 78 | 10,686 | 347 | 157,248 | - | 613,122 |
| Account receivable related to concession | 3,308,489 | 628,121 | - | 86,850 | - | - | - | - | - | 4,023,460 |
| Accounts receivable related to the concession extension | 67,633 | - | - | - | - | - | - | - | - | 67,633 |
| Other receivables | 16,061 | 44,057 | 90 | 29,432 | - | - | - | - | - | 89,640 |
| Income tax and social contribution | 615 | 16,416 | - | - | - | - | - | 138,744 | - | 155,775 |
| Deferred income tax and social contribution | - | 600,060 | 20,054 | 47,892 | 25,749 | 46,358 | - | 58,530 | - | 798,643 |
| Other recoverable taxes | 61,679 | 46,507 | 8,809 | - | - | - | 28 | 15 | - | 117,038 |
| Prepaid Expenses | 14,311 | - | - | 132 | 9,856 | - | - | - | - | 24,299 |
| Receivables from subsidiaries | - | 24,984 | - | - | - | - | 46,736 | 215,485 | (132,064) | 155,141 |
| Investments | 4,036,141 | 1,362 | - | - | - | - | 691,922 | 14,521,342 | (16,855,036) | 2,395,731 |
| Property, Plant and Equipment, net | 6,019,084 | - | 698,886 | - | 410,367 | 301,831 | 1,572,758 | 775 | - | 9,003,701 |
| Intangible Assets | 96,779 | 5,555,846 | 18,525 | 233,920 | 179,276 | 224 | 756 | 3,332 | 399,849 | 6,488,507 |
| TOTAL | 14,690,602 | 10,242,567 | 896,910 | 528,178 | 702,970 | 644,060 | 2,884,260 | 17,731,361 | (17,240,572) | 31,080,336 |
| ¹ Wind Farms, Copel Renováveis and Copel Comercialização | ||||||||||
56
* Amounts subject to rounding.
| R$'000 | ||||||||||
| Assets - Dec-16 | Geração e Transmissão | Distribuição | Telecom | Compagas | Elejor | UEG Araucária | Other¹ | Holding | Eliminations | Consolidated |
| CURRENT | 700,532 | 2,588,602 | 89,471 | 135,292 | 76,231 | 328,563 | 474,157 | 698,488 | (688,346) | 4,402,990 |
| Cash and cash equivalents | 125,165 | 330,810 | 12,651 | 35,309 | 38,483 | 19,644 | 373,915 | 46,096 | - | 982,073 |
| Bonds and securities | 13,301 | - | - | - | - | 287,792 | 1,156 | 149 | - | 302,398 |
| Collaterals and escrow accounts | - | 1,056 | - | 110 | - | - | - | 128 | - | 1,294 |
| Customers | 298,189 | 1,783,081 | 45,948 | 78,292 | 24,362 | - | 46,524 | - | (59,041) | 2,217,355 |
| Dividends receivable | 66,178 | - | - | - | - | - | 10,559 | 485,263 | (490,242) | 71,758 |
| CRC transferred to the State Government of Paraná | - | - | - | - | - | - | - | - | - | - |
| Account receivable related to concession | 65,595 | - | - | - | - | - | - | - | - | 65,595 |
| Accounts receivable related to the concession compensation | - | - | - | - | - | - | - | - | - | - |
| Other current receivables | 66,821 | 192,465 | 3,674 | 17,452 | 4,174 | 11,086 | 6,538 | 8,736 | (4,013) | 306,933 |
| Inventories | 28,182 | 90,591 | 9,003 | 2,861 | - | - | - | - | - | 130,637 |
| Income tax and social contribution | 5,169 | 115,908 | 12,536 | 830 | - | 7,873 | 4,737 | 41,899 | - | 188,952 |
| Other current recoverable taxes | 4,444 | 54,749 | 5,608 | - | - | 2,168 | 765 | 197 | - | 67,931 |
| Prepaid expenses | 9,506 | 19,889 | 51 | 438 | 9,212 | - | - | - | - | 39,096 |
| Related parties | 17,982 | 53 | - | - | - | - | 29,963 | 116,020 | (135,050) | 28,968 |
| NON-CURRENT | 13,448,496 | 7,485,975 | 767,039 | 391,185 | 632,457 | 356,875 | 2,339,326 | 16,622,075 | (16,012,209) | 26,031,219 |
| Long Term Assets | 3,503,258 | 1,971,232 | 79,853 | 152,676 | 35,700 | 49,123 | 141,104 | 2,506,318 | (137,110) | 8,302,154 |
| Bonds and securities | 92,817 | 1,467 | - | 6,636 | - | - | 94,176 | - | - | 195,096 |
| Other temporary investments | - | - | - | - | - | - | - | 408,297 | - | 408,297 |
| Collaterals and escrow accounts | - | 73,074 | - | - | - | - | - | - | - | 73,074 |
| Customers | 111,953 | 117,459 | 41,374 | - | - | - | - | - | - | 270,786 |
| CRC transferred to the State Government of Paraná | - | - | - | - | - | - | - | 1,522,735 | - | 1,522,735 |
| Judicial deposits | 76,822 | 410,737 | 10,815 | 2,159 | 78 | 2,765 | 295 | 153,932 | - | 657,603 |
| Sectoral financial assets | - | - | - | - | - | - | - | - | - | - |
| Account receivable related to concession | 3,050,151 | 614,806 | - | 83,378 | - | - | - | - | - | 3,748,335 |
| Accounts receivable related to the concession extension | 67,401 | - | - | - | - | - | - | - | - | 67,401 |
| Other receivables | 15,185 | 47,087 | 90 | 11,189 | - | - | - | - | - | 73,551 |
| Income tax and social contribution | 608 | 16,143 | - | - | - | - | - | 153,216 | - | 169,967 |
| Deferred income tax and social contribution | - | 616,301 | 18,101 | 49,181 | 26,074 | 46,358 | - | 47,462 | - | 803,477 |
| Other recoverable taxes | 72,419 | 49,174 | 9,473 | - | - | - | 27 | 15 | - | 131,108 |
| Prepaid Expenses | 15,902 | - | - | 133 | 9,548 | - | - | - | - | 25,583 |
| Receivables from subsidiaries | - | 24,984 | - | - | - | - | 46,606 | 220,661 | (137,110) | 155,141 |
| Investments | 3,819,530 | 1,362 | - | - | - | - | 680,331 | 14,111,959 | (16,278,232) | 2,334,950 |
| Property, Plant and Equipment, net | 6,026,605 | - | 667,443 | - | 414,840 | 307,504 | 1,517,281 | 630 | - | 8,934,303 |
| Intangible Assets | 99,103 | 5,513,381 | 19,743 | 238,509 | 181,917 | 248 | 610 | 3,168 | 403,133 | 6,459,812 |
| TOTAL | 14,149,028 | 10,074,577 | 856,510 | 526,477 | 708,688 | 685,438 | 2,813,483 | 17,320,563 | (16,700,555) | 30,434,209 |
| ¹ Wind Farms, Copel Renováveis and Copel Comercialização | ||||||||||
57
* Amounts subject to rounding.
| R$'000 | ||||||||||
| Liabilities - Mar-17 | Geração e Transmissão | Distribuição | Telecom | Compagas | Elejor | UEG Araucária | Other¹ | Holding | Eliminations | Consolidated |
| CURRENT | 1,794,303 | 2,786,551 | 198,651 | 153,666 | 158,846 | 44,535 | 257,215 | 1,068,157 | (654,771) | 5,807,153 |
| Social charges and accruals | 70,783 | 188,423 | 22,370 | 6,260 | 288 | 233 | 4,623 | 5,185 | - | 298,165 |
| Associated companies and parent company | - | 35 | 91,899 | - | - | - | 24,601 | - | (116,535) | - |
| Suppliers | 142,683 | 732,287 | 34,034 | 113,671 | 3,576 | 13,004 | 151,401 | 98 | (47,151) | 1,143,603 |
| Income Tax and Social Contribution payable | 91,692 | - | - | 909 | 8,032 | - | 2,170 | - | - | 102,803 |
| Other taxes | 71,021 | 171,540 | 6,126 | 7,932 | 1,954 | 573 | 1,904 | 239 | - | 261,289 |
| Loans and financing | 705,533 | 304,945 | 5,933 | - | - | - | 29,059 | 419,610 | (1,710) | 1,463,370 |
| Debentures | 248,151 | 560,263 | 6,230 | 23,194 | 40,488 | - | 20,159 | 385,844 | - | 1,284,329 |
| Dividends payable | 261,685 | 130,900 | 28,910 | 1,176 | 38,008 | 30,718 | 16,101 | 256,426 | (489,375) | 274,549 |
| Post employment benefits | 11,996 | 33,638 | 1,838 | - | - | - | 33 | 167 | - | 47,672 |
| Customer charges due | 5,860 | 125,800 | - | - | - | - | - | - | - | 131,660 |
| Research and development and energy efficiency | 62,897 | 159,872 | - | - | 6,449 | - | - | - | - | 229,218 |
| Payables related to concession | 4,146 | - | - | - | 59,151 | - | - | - | - | 63,297 |
| Sectorial financial liabilities | - | 275,238 | - | - | - | - | - | - | - | 275,238 |
| Other accounts payable | 117,856 | 103,610 | 1,311 | 524 | 900 | 7 | 7,164 | 588 | - | 231,960 |
| NON-CURRENT | 4,442,681 | 2,517,630 | 240,585 | 63,087 | 481,420 | 20,797 | 690,249 | 1,382,623 | (133,626) | 9,705,446 |
| Associated companies and parent company | - | - | - | - | - | - | 47,000 | - | (47,000) | - |
| Suppliers | 36,711 | - | - | 15,416 | - | - | - | - | - | 52,127 |
| Deferred income tax and social contribution | 229,517 | - | - | - | - | - | 3,808 | - | - | 233,325 |
| Tax liabilities | 164,292 | 121,112 | 7,613 | - | - | 3,008 | 354 | 2,172 | - | 298,551 |
| Loans and financing | 1,208,551 | 480,570 | 14,733 | - | - | - | 350,480 | 554,541 | (83,619) | 2,525,256 |
| Debentures | 1,985,978 | 492,865 | 173,215 | 33,991 | 20,337 | - | 272,166 | 666,170 | - | 3,644,722 |
| Post-employment benefits | 202,967 | 487,924 | 30,961 | 4,826 | - | - | 3,690 | 3,617 | - | 733,985 |
| Research and development and energy efficiency | 56,159 | 202,972 | - | - | - | 17,789 | - | - | - | 276,920 |
| Payables related to the concession | 43,235 | - | - | - | 461,083 | - | - | - | - | 504,318 |
| Sectorial financial liabilities | - | 166,858 | - | - | - | - | - | - | - | 166,858 |
| Other payables | 20,714 | - | - | 8,036 | - | - | 12,696 | - | (3,007) | 38,439 |
| Tax, social security, labor and civil provisions | 494,557 | 565,329 | 14,063 | 818 | - | - | 55 | 156,123 | - | 1,230,945 |
| EQUITY | 8,453,618 | 4,938,386 | 457,674 | 311,425 | 62,704 | 578,728 | 1,936,796 | 15,280,581 | (16,452,175) | 15,567,737 |
| Attributable to controlling shareholders | 8,453,618 | 4,938,386 | 457,674 | 311,425 | 62,704 | 578,728 | 1,936,796 | 15,280,581 | (16,739,331) | 15,280,581 |
| Capital | 4,429,898 | 4,176,841 | 316,098 | 220,966 | 35,503 | 707,440 | 815,375 | 7,910,000 | (10,702,121) | 7,910,000 |
| Advance for Future Capital Increase | 1,029,700 | 538,000 | - | - | - | - | 1,787,481 | - | (3,355,181) | - |
| Equity valuation adjustments | 936,209 | 31,270 | 6,058 | (406) | 256 | - | (1,338) | 986,031 | (972,049) | 986,031 |
| Legal Reserves | 427,895 | 120,987 | 17,612 | 22,639 | 7,100 | - | 3,776 | 792,716 | (600,009) | 792,716 |
| Retained earnigs | 1,268,451 | - | 106,387 | 56,429 | - | - | 38,833 | 5,162,983 | (1,470,100) | 5,162,983 |
| Additional proposed dividends | - | - | - | - | - | - | 15,883 | - | (15,883) | - |
| Accrued earnings (losses) | 361,465 | 71,288 | 11,519 | 11,797 | 19,845 | (128,712) | (723,214) | 428,851 | 376,012 | 428,851 |
| Attributable to noncontrolling interests | - | - | - | - | - | - | - | - | 287,156 | 287,156 |
| TOTAL | 14,690,602 | 10,242,567 | 896,910 | 528,178 | 702,970 | 644,060 | 2,884,260 | 17,731,361 | (17,240,572) | 31,080,336 |
| ¹ Wind Farms, Copel Renováveis and Copel Participações | ||||||||||
58
* Amounts subject to rounding.
| R$'000 | ||||||||||
| Liabilities - Dec-16 | Geração e Transmissão | Distribuição | Telecom | Compagas | Elejor | UEG Araucária | Other¹ | Holding | Eliminations | Consolidated |
| CURRENT | 1,708,931 | 2,740,992 | 172,651 | 180,133 | 142,222 | 62,253 | 268,120 | 1,069,839 | (689,105) | 5,656,036 |
| Social charges and accruals | 71,249 | 178,348 | 21,159 | 6,529 | 259 | 261 | 4,419 | 5,573 | - | 287,797 |
| Associated companies and parent company | - | 135 | 85,490 | - | - | - | 49,351 | - | (134,976) | - |
| Suppliers | 136,139 | 867,410 | 15,753 | 136,869 | 3,193 | 30,494 | 126,607 | 2,225 | (63,051) | 1,255,639 |
| Income Tax and Social Contribution payable | 18,329 | - | - | 6,438 | 14,453 | - | 2,234 | - | - | 41,454 |
| Other taxes | 124,805 | 145,664 | 9,482 | 6,938 | 2,039 | 770 | 4,884 | 412 | - | 294,994 |
| Loans and financing | 684,078 | 299,299 | 5,932 | - | - | - | 28,981 | 453,288 | (836) | 1,470,742 |
| Debentures | 170,923 | 524,036 | 2,764 | 21,826 | 40,488 | - | 20,013 | 351,148 | - | 1,131,198 |
| Dividends payable | 261,685 | 149,500 | 28,910 | 1,176 | 12,281 | 30,718 | 16,377 | 256,426 | (490,242) | 266,831 |
| Post employment benefits | 12,156 | 33,649 | 1,868 | - | - | - | 33 | 188 | - | 47,894 |
| Customer charges due | 6,379 | 135,333 | - | - | - | - | - | - | - | 141,712 |
| Research and development and energy efficiency | 64,409 | 160,947 | - | - | 6,157 | - | - | - | - | 231,513 |
| Payables related to concession | 4,107 | - | - | - | 62,103 | - | - | - | - | 66,210 |
| Sectorial financial liabilities | - | 155,261 | - | - | - | - | - | - | - | 155,261 |
| Other accounts payable | 154,672 | 91,410 | 1,293 | 357 | 1,249 | 10 | 15,221 | 579 | - | 264,791 |
| NON-CURRENT | 4,379,635 | 2,506,487 | 237,704 | 46,716 | 486,765 | 20,422 | 703,229 | 1,386,559 | (144,790) | 9,622,727 |
| Associated companies and parent company | - | - | - | - | - | - | 46,685 | - | (46,685) | - |
| Suppliers | 36,711 | - | - | - | - | - | - | - | - | 36,711 |
| Deferred income tax and social contribution | 175,265 | - | - | - | - | - | 3,165 | - | - | 178,430 |
| Tax liabilities | 173,483 | 117,054 | 7,389 | - | - | 2,841 | 304 | 2,075 | - | 303,146 |
| Loans and financing | 1,228,746 | 502,161 | 16,094 | - | - | - | 356,147 | 562,072 | (89,669) | 2,575,551 |
| Debentures | 1,984,421 | 492,188 | 171,420 | 39,960 | 30,496 | - | 275,175 | 665,951 | - | 3,659,611 |
| Post-employment benefits | 199,495 | 480,246 | 30,313 | 4,826 | - | - | 3,574 | 3,517 | - | 721,971 |
| Research and development and energy efficiency | 50,995 | 183,800 | - | - | - | 17,581 | - | - | - | 252,376 |
| Payables related to the concession | 43,063 | - | - | - | 456,269 | - | - | - | - | 499,332 |
| Sectorial financial liabilities | - | 123,731 | - | - | - | - | - | - | - | 123,731 |
| Other payables | 20,579 | - | - | 257 | - | - | 18,125 | - | (8,436) | 30,525 |
| Tax, social security, labor and civil provisions | 466,877 | 607,307 | 12,488 | 1,673 | - | - | 54 | 152,944 | - | 1,241,343 |
| EQUITY | 8,060,462 | 4,827,098 | 446,155 | 299,628 | 79,701 | 602,763 | 1,842,134 | 14,864,165 | (15,866,660) | 15,155,446 |
| Attributable to controlling shareholders | 8,060,462 | 4,827,098 | 446,155 | 299,628 | 79,701 | 602,763 | 1,842,134 | 14,864,165 | (16,157,941) | 14,864,165 |
| Capital | 4,429,898 | 4,176,841 | 316,097 | 220,966 | 35,503 | 707,440 | 905,376 | 7,910,000 | (10,792,121) | 7,910,000 |
| Advance for Future Capital Increase | 979,500 | 498,000 | - | - | - | - | 1,566,180 | - | (3,043,680) | - |
| Capital reserve | - | - | - | - | - | - | - | - | - | - |
| Equity valuation adjustments | 954,718 | 31,270 | 6,058 | (406) | 256 | - | (1,338) | 998,466 | (990,558) | 998,466 |
| Legal Reserves | 427,895 | 120,987 | 17,612 | 22,639 | 7,100 | - | 3,848 | 792,716 | (600,081) | 792,716 |
| Retained earnigs | 1,268,451 | - | 106,388 | 56,429 | - | - | 38,831 | 5,162,983 | (1,470,099) | 5,162,983 |
| Additional proposed dividends | - | - | - | - | 36,842 | - | 16,711 | - | (53,553) | - |
| Accrued earnings (losses) | - | - | - | - | - | (104,677) | (687,474) | - | 792,151 | - |
| Attributable to noncontrolling interests | - | - | - | - | - | - | - | - | 291,281 | 291,281 |
| TOTAL | 14,149,028 | 10,074,577 | 856,510 | 526,477 | 708,688 | 685,438 | 2,813,483 | 17,320,563 | (16,700,555) | 30,434,209 |
| ¹ Wind Farms, Copel Renováveis and Copel Participações | ||||||||||
59
* Amounts subject to rounding.
Income Statement by Company
| R$'000 | |||||||||||
| Income Statement 1Q17 | Geração e Transmissão | Distribuição | Telecom | Compagas | Elejor | UEG Araucária | Other¹ | Holding | Elimin. e Reclassif. | Consolidated | |
| Generation | Transmission | ||||||||||
| NET OPERATING INCOME | 708,953 | 364,589 | 2,004,319 | 87,691 | 123,704 | 68,757 | - | 72,283 | - | (133,285) | 3,297,011 |
| Electricity sales to final customers | 141,827 | - | 982,325 | - | - | - | - | 10,138 | - | (753) | 1,133,537 |
| Electricity sales to distributors | 557,416 | - | 112,287 | - | - | 68,757 | - | 62,023 | - | (76,284) | 724,199 |
| Use of the main distribution and transmission grid (TUSD/ TUST) | - | 298,800 | 862,424 | - | - | - | - | - | - | (25,680) | 1,135,544 |
| Construction revenue | - | 62,169 | 152,628 | - | 4,609 | - | - | - | - | - | 219,406 |
| Fair value of assets from the indemnity for the concession | - | - | 4,861 | - | 1,468 | - | - | - | - | - | 6,329 |
| Telecommunications | - | - | - | 78,170 | - | - | - | - | - | (8,258) | 69,912 |
| Distribution of piped gas | - | - | - | - | 117,627 | - | - | - | - | - | 117,627 |
| Sectoral assets and liabilities result | - | - | (147,977) | - | - | - | - | - | - | - | (147,977) |
| Other operating revenues | 9,710 | 3,620 | 37,771 | 9,521 | - | - | - | 122 | - | (22,310) | 38,434 |
| OPERATING COSTS AND EXPENSES | (264,281) | (168,968) | (1,882,067) | (65,528) | (109,409) | (20,087) | (25,476) | (83,166) | (16,597) | 127,858 | (2,507,721) |
| Energy purchased for resale | (6,688) | - | (1,119,526) | - | - | (3,974) | - | (23,207) | - | 76,886 | (1,076,509) |
| Charges of the main distribution and transmission grid | (74,857) | - | (106,649) | - | - | (2,823) | (5,962) | (3,433) | - | 24,713 | (169,011) |
| Personnel and management | (42,784) | (25,808) | (188,105) | (25,357) | (8,017) | (845) | (606) | (7,168) | (7,408) | - | (306,098) |
| Private pension and health plans | (8,745) | (5,468) | (38,693) | (3,744) | (739) | (21) | (84) | (791) | (853) | - | (59,138) |
| Materials | (2,493) | (1,122) | (14,230) | (568) | (629) | (62) | (85) | (65) | (117) | - | (19,371) |
| Raw material and supplies - energy production | (4,334) | - | - | - | - | - | (727) | - | - | - | (5,061) |
| Natural gas and supplies for gas business | - | - | - | - | (82,339) | - | - | - | - | - | (82,339) |
| Third-party services | (21,218) | (4,985) | (81,432) | (14,707) | (6,037) | (3,185) | (11,410) | (2,209) | (4,012) | 28,285 | (120,910) |
| Depreciation and amortization | (68,139) | (1,168) | (70,981) | (9,299) | (7,047) | (7,227) | (5,981) | (12,937) | (299) | - | (183,078) |
| Provisions and reversals | 3,371 | (9,285) | (58,676) | (2,709) | 24 | - | - | (24,606) | (1,389) | (5,429) | (98,699) |
| Construction cost | - | (117,492) | (152,628) | - | (4,609) | - | - | - | - | - | (274,729) |
| Other operating costs and expenses | (38,394) | (3,640) | (51,147) | (9,144) | (16) | (1,950) | (621) | (8,750) | (2,519) | 3,403 | (112,778) |
| EQUITY IN EARNINGS OF SUBSIDIARIES | (24,799) | 29,126 | - | - | - | - | - | (27,032) | 440,520 | (384,102) | 33,713 |
| OPERATIONAL EXPENSES / INCOME | 419,873 | 224,747 | 122,252 | 22,163 | 14,295 | 48,670 | (25,476) | (37,915) | 423,923 | (389,529) | 823,003 |
| FINANCIAL RESULTS | (83,956) | (45,746) | 15,701 | (5,056) | 3,515 | (18,638) | 1,441 | 4,496 | (27,778) | - | (156,021) |
| Income tax and social contribution on profit | 7,825 | 2,591 | 77,653 | 2,616 | 9,293 | 962 | 1,981 | 21,934 | 41,862 | (3,130) | 163,587 |
| Deferred income tax and social contribution on profit | (91,781) | (48,337) | (61,952) | (7,672) | (5,778) | (19,600) | (540) | (17,438) | (69,640) | 3,130 | (319,608) |
| EARNINGS BEFORE INCOME TAXES | 335,917 | 179,001 | 137,953 | 17,107 | 17,810 | 30,032 | (24,035) | (33,419) | 396,145 | (389,529) | 666,982 |
| INCOME TAX AND SOCIAL CONTRIBUTION ON PROFIT | (120,775) | (51,187) | (66,665) | (5,588) | (6,013) | (10,187) | - | (3,494) | 14,197 | - | (249,712) |
| NET INCOME | 215,142 | 127,814 | 71,288 | 11,519 | 11,797 | 19,845 | (24,035) | (36,913) | 410,342 | (389,529) | 417,270 |
| Attributed to controlling shareholders | 215,142 | 127,814 | 71,288 | 11,519 | 6,016 | 13,892 | (19,229) | (36,913) | 410,342 | - | 410,342 |
| Attributed to non-controlling interest | - | - | - | - | 5,781 | 5,954 | (4,806) | - | - | - | 6,928 |
| EBITDA | 488,012 | 225,915 | 193,233 | 31,462 | 21,342 | 55,897 | (19,495) | (24,978) | 424,222 | (389,529) | 1,006,081 |
| ¹ Wind Farms, Copel Renováveis and Copel Comercialização | |||||||||||
60
* Amounts subject to rounding.
| R$'000 | |||||||||||
| Income Statement 1Q16 | Geração e Transmissão | Distribuição | Telecom | Compagas | Elejor | UEG Araucária | Other¹ | Holding | Elimin. e Reclassif. | Consolidated | |
| Generation | Transmission | ||||||||||
| NET OPERATING INCOME | 583,819 | 167,896 | 2,085,928 | 78,085 | 160,218 | 60,426 | 55,752 | 48,395 | - | (157,855) | 3,082,664 |
| Electricity sales to final customers | 139,756 | - | 1,440,720 | - | - | - | - | - | - | (1,162) | 1,579,314 |
| Electricity sales to distributors | 433,163 | - | 156,647 | - | - | 60,426 | 55,752 | 48,395 | - | (72,377) | 682,006 |
| Use of the main distribution and transmission grid (TUSD/ TUST) | - | 77,291 | 800,584 | - | - | - | - | - | - | (23,658) | 854,217 |
| Construction revenue | - | 88,795 | 177,341 | - | 5,017 | - | - | - | - | - | 271,153 |
| Fair value of assets from the indemnity for the concession | - | - | 8,650 | - | 376 | - | - | - | - | - | 9,026 |
| Telecommunications | - | - | - | 69,809 | - | - | - | - | - | (7,312) | 62,497 |
| Distribution of piped gas | - | - | - | - | 154,825 | - | - | - | - | (31,633) | 123,192 |
| Sectoral assets and liabilities result | - | - | (527,202) | - | - | - | - | - | - | - | (527,202) |
| Other operating revenues | 10,900 | 1,810 | 29,188 | 8,276 | - | - | - | - | - | (21,713) | 28,461 |
| OPERATING COSTS AND EXPENSES | (283,277) | (107,503) | (2,172,193) | (57,446) | (146,936) | (22,145) | (75,045) | (30,936) | (35,336) | 158,594 | (2,772,223) |
| Energy purchased for resale | (11,787) | - | (1,253,842) | - | - | (6,183) | - | (34) | - | 71,975 | (1,199,871) |
| Charges of the main distribution and transmission grid | (65,476) | - | (209,140) | - | - | (2,417) | (5,350) | (3,572) | - | 21,274 | (264,681) |
| Personnel and management | (42,477) | (19,012) | (169,769) | (20,792) | (7,895) | (741) | (563) | (4,426) | (9,456) | - | (275,131) |
| Private pension and health plans | (10,267) | (4,722) | (39,020) | (4,814) | (645) | (21) | (72) | (885) | (3,062) | - | (63,508) |
| Materials | (3,539) | (1,239) | (17,489) | (355) | (399) | (56) | (136) | (37) | (65) | - | (23,315) |
| Raw material and supplies - energy production | (3,985) | - | - | - | - | - | (38,142) | - | - | 31,633 | (10,494) |
| Natural gas and supplies for gas business | - | - | - | - | (114,651) | - | - | - | - | - | (114,651) |
| Third-party services | (19,228) | (4,738) | (84,904) | (10,077) | (3,862) | (2,969) | (24,119) | (6,427) | (2,609) | 28,643 | (130,290) |
| Depreciation and amortization | (73,656) | (363) | (66,290) | (8,396) | (5,926) | (6,715) | (5,432) | (11,974) | (284) | - | (179,036) |
| Provisions and reversals | 5,289 | 2,553 | (112,103) | (5,236) | (170) | - | - | - | (11,394) | - | (121,061) |
| Construction cost | - | (76,507) | (177,341) | - | (5,017) | - | - | - | - | - | (258,865) |
| Other operating costs and expenses | (58,151) | (3,475) | (42,295) | (7,776) | (8,371) | (3,043) | (1,231) | (3,581) | (8,466) | 5,069 | (131,320) |
| EQUITY IN EARNINGS OF SUBSIDIARIES | (1,709) | 22,358 | - | - | - | - | - | 8,598 | 162,366 | (143,719) | 47,894 |
| PROFIT BEFORE FINANCIAL RESULTS AND TAXES | 298,833 | 82,751 | (86,265) | 20,639 | 13,282 | 38,281 | (19,293) | 26,057 | 127,030 | (142,980) | 358,335 |
| FINANCIAL RESULTS | (113,632) | (29,964) | 29,390 | (3,969) | (1,455) | (29,638) | 4,974 | (13,467) | (8,384) | (742) | (166,887) |
| Income tax and social contribution on profit | 10,349 | 2,968 | 106,568 | 4,604 | 3,478 | 975 | 5,388 | 6,228 | 65,127 | (742) | 204,943 |
| Deferred income tax and social contribution on profit | (123,981) | (32,932) | (77,178) | (8,573) | (4,933) | (30,613) | (414) | (19,695) | (73,511) | - | (371,830) |
| EARNINGS BEFORE INCOME TAXES | 185,201 | 52,787 | (56,875) | 16,670 | 11,827 | 8,643 | (14,319) | 12,590 | 118,646 | (143,722) | 191,448 |
| INCOME TAX AND SOCIAL CONTRIBUTION ON PROFIT | (62,666) | (10,104) | 17,728 | (5,501) | (4,211) | (2,932) | - | (2,533) | 14,860 | - | (55,359) |
| NET INCOME | 122,535 | 42,683 | (39,147) | 11,169 | 7,616 | 5,711 | (14,319) | 10,057 | 133,506 | (143,722) | 136,089 |
| Attributed to controlling shareholders | 122,535 | 42,683 | (39,147) | 11,169 | 3,883 | 3,998 | (11,456) | 10,057 | 133,506 | - | 133,506 |
| Attributed to non-controlling interest | - | - | - | - | 3,733 | 1,713 | (2,863) | - | - | - | 2,583 |
| EBITDA | 372,489 | 83,114 | (19,975) | 29,035 | 19,208 | 44,996 | (13,861) | 38,031 | 127,314 | (142,980) | 537,371 |
| ¹ Wind Farms, Copel Renováveis and Copel Comercialização | |||||||||||
61
* Amounts subject to rounding.
| COMPANHIA PARANAENSE DE ENERGIA – COPEL | ||
| By: | /S/ Antonio Sergio de Souza Guetter | |
Antonio Sergio de Souza Guetter Chief Executive Officer | ||
This press release may contain forward-looking statements. These statements are statements that are not historical facts, and are based on management's current view and estimates of future economic circumstances, industry conditions, company performance and financial results. The words "anticipates", "believes", "estimates", "expects", "plans" and similar expressions, as they relate to the company, are intended to identify forward-looking statements. Statements regarding the declaration or payment of dividends, the implementation of principal operating and financing strategies and capital expenditure plans, the direction of future operations and the factors or trends affecting financial condition, liquidity or results of operations are examples of forward-looking statements. Such statements reflect the current views of management and are subject to a number of risks and uncertainties. There is no guarantee that the expected events, trends or results will actually occur. The statements are based on many assumptions and factors, including general economic and market conditions, industry conditions, and operating factors. Any changes in such assumptions or factors could cause actual results to differ materially from current expectations.