Companhia Paranaense de Energia - COPEL (ELP)
Filed: 19 Apr 18, 12:00am
Indicate by check mark whether the registrant by furnishing the information contained in this Form is also thereby furnishing the information to the Commission pursuant to Rule 12g3-2(b) under the Securities Exchange Act of 1934.
Yes _______ No ___X____
|
4Q17 Results
Copel records EBITDA of R$521.8million in the fourth quarter

| 4Q17 | 3Q17 | 4Q16 | Var.% | 2017 | 2016 | Var. % |
| (1) | (2) | (3) | (1/3) | (4) | (5) | (4/5) |
Net Operating Revenues (R$ million) | 3,910.7 | 3,643.7 | 3,297.1 | 18.6 | 14,024.6 | 13,101.8 | 7.0 |
Operating Costs and Expenses (R$ million) | 3,618.1 | 3,159.7 | 3,396.1 | 6.5 | 11,984.9 | 11,279.3 | 6.3 |
Operating Income (R$ million) | 146.9 | 318.2 | (417.2) | - | 1,392.9 | 1,309.4 | 6.4 |
Net Income (R$ million) | 160.2 | 389.8 | (271.1) | - | 1,118.3 | 789.8 | 41.6 |
Earnings per share (R$)¹ | 0.37 | 1.40 | (0.77) | - | 3.78 | 3.03 | 24.8 |
EBITDA (R$ million) | 521.8 | 643.7 | 124.9 | 317.6 | 2,878.8 | 2,752.4 | 4.6 |
Return on Shareholders' Equity (annualized)² | 4.3% | 10.8% | - | - | 7.5% | 5.4% | 37.7 |
Grid Market (GWh) | 7,377 | 7,188 | 7,039 | 4.8 | 29,215 | 28,267 | 3.4 |
Capex (R$ million)³ | 742.2 | 537.4 | 830.7 | (10.7) | 2,508.8 | 3,575.4 | (29.8) |
EBITDA Margin | 13.3% | 17.7% | 3.8% | 252.1 | 20.5% | 21.0% | (2.3) |
Operating Margin | 3.8% | 8.7% | - | - | 9.9% | 10.0% | (0.6) |
Net Margin | 4.1% | 10.7% | - | - | 8.0% | 6.0% | 32.3 |
¹ Consider the Net Income attributed to the shareholders of the parent company. |
|
| |||||
² Consider the initial shareholders' equity for the year. |
|
|
|
|
| ||
³ Includes contributions and advances for future investments and capital increases. |
|
| |||||
Values subject to rounding adjustments. |
|
|
|
|
|
|
|
Average Rates (R$/MWh) | Dec-17 | Sep-17 | Jun-17 | Mar-17 | Dec-16 |
Power Purchase Average Rate - Copel Dis ¹ | 163.64 | 184.88 | 152.14 | 152.67 | 156.88 |
Retail Average Rate - Copel Dis² | 403.17 | 404.99 | 379.77 | 384.19 | 380.27 |
Sales to Distributors Average Rate - Copel GeT³ | 211.76 | 211.03 | 208.36 | 205.10 | 187.18 |
Indicators | Dec-17 | Sep-17 | Jun-17 | Mar-17 | Dec-16 |
Equity (R$ Thousand) | 15,529,773 | 15,868,242 | 15,492,895 | 15,567,737 | 14,997,412 |
Net debt (R$ Thousand) | 8,468,757 | 7,741,549 | 7,542,661 | 7,446,250 | 7,421,378 |
Book Value per Share (R$) | 56.75 | 57.99 | 56.61 | 56.89 | 54.80 |
Net debt/ Shareholders' Net Equity4 | 63.3% | 60.0% | 61.1% | 57.3% | 58.9% |
Current Liquidity | 0.9 | 0.8 | 0.8 | 0.8 | 0.7 |
¹ Considers PIS/COFINS. |
|
|
|
|
|
² Does not consider tariff flags. ICMS net. |
|
|
|
|
|
³ Considers PIS/COFINS. ICMS net. |
|
|
|
|
|
4Considers gross debt without endorsements and guarantees. |
|
|
|
| |
CPLE3 | R$21.40 CPLE6 | R$24.95 | ELP | US$ 7.63 XCOP | € 6.29 | Market value | R$6.3 bi *Quotes 12.31.2017 |

|
Earnings Release 4Q17 |
LIST OF CONTENTS
1. Main Events in the Period | 3 |
2. Financial Performance | 14 |
2.1 Operating Revenues | 14 |
2.2 Operating Costs and Expenses | 15 |
2.3 Equity in the Earnings of Subsidiaries | 18 |
2.4 EBITDA | 18 |
2.5 Financial Result | 19 |
2.6 Consolidated Net Income | 20 |
2.7 Consolidated Income Statement | 21 |
3. Main Account and Changes Balance Sheet | 22 |
3.1 Main Accounts | 22 |
3.2 Balance Sheet – Assets | 25 |
3.3 Debt | 26 |
3.4 Balance Sheet – Liabilities | 29 |
4. Performance of the Main Companies | 30 |
4.1 Copel Geração e Transmissão | 30 |
4.2 Copel Distribuição | 32 |
4.3 Copel Telecomunicações | 33 |
4.4 UEG Araucária | 34 |
4.5 Accounting Information | 35 |
5. Investment Program | 36 |
6. Power Market and Tariffs | 36 |
6.1 Captive Market – Copel Distribuição | 36 |
6.2 Grid Market (TUSD) | 37 |
6.3 Electricity Sales | 37 |
6.4 Total Energy Sold | 38 |
6.5 Energy Flow | 39 |
6.6 Tariffs | 41 |
7. Capital Market | 43 |
7.1 Capital Stock | 43 |
7.2 Stock Performance | 44 |
7.3 Dividends and Interest on Own Capital | 45 |
8. Operating Performance | 46 |
8.1 Power Generation | 46 |
8.2 Transmission | 53 |
8.3 Distribution | 54 |
8.4 Telecommunications | 56 |
8.5 Equity Interests | 57 |
8.6 New Projects | 58 |
9. Other Information | 60 |
9.1 Human Resources | 60 |
9.2 Main Operational Indicators | 61 |
9.3 Conference Call 4Q17 Results | 62 |
Exhibit I – Consolidated Cash Flow Statement | 63 |
Exhibit II – Financial Statements – Wholly Owned Subsidiaries | 64 |
Exhibit III – Financial Statements by Company | 67 |
2 |
* Amountssubject to rounding.
|
Earnings Release 4Q17 |
COPEL reported an EBITDA of R$521.8 million in 4Q17, a 317.6% increase over the R$124.9 million verified in 4Q16. This result was impacted by the R$25.7 million related to the reversal of estimated losses with generation assets impairment, against a provision for impairment of R$567.1 million in 4Q16, and by the record of R$270.5 million in provisions for lawsuits referring to civil, administrative, labor and post-employment benefit matters.
Copel's adjusted EBITDA in 4Q17 was of R$665.8 million, a 5.1% growth when compared to the adjusted EBITDA in 4Q16 (R$633.3 million), mainly reflecting (a) a 4.8% growth in Copel Distribuição's grid market, (b) a 5.85% of average adjustment applied to Copel Distribuição’s tariffs as of June 24, 2017, (c) RAP adjustment and the start-up of new transmission assets throughout 2017, and (d) a 5.1% decrease in PMSO (Personnel and management, pension and health plans, materials, third party services, provisions and reversals and others), except for provisions and reversals, partially offset by the 42.4% higher cost of electricity purchase, mainly due to the GSF of the period. More details initem 2.
Resubmission of 2016 Comparable Balances
As already disclosed in Note No. 3.2 to the our Interim Financial Information as of September 30, 2017 (“FI 3Q17”), during the preparation of our FI 3Q17, the Company's Management identified an investment by its indirect subsidiary UEG Araucária Ltda. in a Multimarket Investment Fund, which holds shares of other investment funds that in turn invest in a private company, whose main asset is a real estate development.
In light of such finding and in compliance with the best governance practices, the Company's Management relied on independent experts that, together with the Management, conducted an internal investigation into the accounting classification and value of such investment, other impacts and the circumstances of the investment. The valuation has already been concluded, but the investigations are still going on.
After the valuation was concluded and during the investigations, we found that (i) the investment occurred strictly in the UEG Araucária, (ii) this investment violated Copel’s investment policy, which authorizes investments in wholly-owned investment funds only to the extent such funds invest exclusively in bonds issued by the Brazilian federal government or by financial institutions controlled by the Brazilian federal government, (iii) the need to establish a provision for the devaluation of such investment in 2016, due to (a) its specific characteristics, such as (b) that if the correct nature of that investment had been identified during that year, additional analyzes would have been carried out, which would make it possible to conclude that there were signs of a devaluation. As recognized in the 2016 FS previously disclosed, as of December 31, 2016, this investment amounted to R$165.7 million and was recognized under “Bonds and Securities”, as a current asset. This accounting classification was based on the information delivered at that time by the management of UEGAraucária to the Company’s Management, pursuant to which that investment was made in a wholly-owned fund, that was composed of shares issued by other investment funds and government bonds, with immediate liquidity and that were available for sale.
3 |
* Amountssubject to rounding.
|
Earnings Release 4Q17 |
Based on our conclusions about the investments’ accounting classification and value and based on the information available until the preparation of the 2017 FS, we recognized a provision for the impairment of such investment amounting to R$ 136.9 million as of December 31, 2016. This provision was recorded under “Bonds and Securities” with a corresponding increase in “Financial expenses”. The remaining amount of such investment in 2016, which corresponded to R$28.8 million, was reclassified as a non-current asset in light of the expected term for realizing it.
In light of the above, the opinion of our independent auditors on our individual and consolidated financial statements for the fiscal year ended December 31, 2017 was issued with a qualification with respect to the information related to the fiscal year 2016 and presented for comparative purposes, which was amended and restated to reflect the adjustments discussed above. This qualification was inserted in the auditors’ opinion due to the fact that our internal investigation has not been concluded and the auditors are not able to issue a conclusive and sufficient opinion about whether the impairment provision should be recognized in the financial statements for the fiscal year ended December 31, 2016 (included in the financial statements for the fiscal year ended December 31, 2017 for comparison purposes) or whether this provision should be recognized in earlier fiscal years.
In addition to the above, Copel Distribuição recognized adjustments to the impact of tax litigation in earlier fiscal years. As a result of such adjustments, we recognized an increase of R$ 32.0 million in “Financial expenses” as of December 31, 2016 and a corresponding increase in the provision for litigation under our non-current liabilities, as well as an increase under “Deferred income tax and social contribution” in our Income Statement, amounting to R$ 10.9 million, and the corresponding increase in “Deferred Taxes” in our non-current assets.
As a result of the above mentioned adjustments discussed above, the financial statements for the fiscal year ended December 31, 2016, required for comparison purposes, were amended and restated in the financial statements for the fiscal year of 2017. Please refer to our Standard Financial Statements (Demonstrações Financeiras Padronizadas – DFP) for detailed information (Note No. 4.1).
The following charts reflect the impact of the above mentioned adjustments discussed above in our Balance Sheet and our Income Statement for 2016.
4 |
* Amountssubject to rounding.
|
Earnings Release 4Q17 |
|
|
|
|
|
| R$ million |
12.31.2016 |
|
| Parent Company |
|
| Consolidated |
Submitted | Restatement | Resubmitted | Submitted | Restatement | Restatement | |
BALANCE SHEET |
|
|
|
|
|
|
Assets | 17,320,563 | (130,651) | 17,189,912 | 30,434,209 | (126,039) | 30,308,170 |
Current assets | 698,488 | - | 698,488 | 4,402,990 | (165,749) | 4,237,241 |
Bonds and securities(Adjustment Araucária TPP) | 149 | - | 149 | 302,398 | (165,749) | 136,649 |
Noncurrent assets | 16,622,075 | (130,651) | 16,491,424 | 26,031,219 | 39,710 | 26,070,929 |
Bonds and securities(Adjustment Araucária TPP) | - | - | - | 195,096 | 28,832 | 223,928 |
Income tax and social contribution(Ajuste Copel Dis) | 47,462 | - | 47,462 | 803,477 | 10,878 | 814,355 |
Investments(Adjustment Araucária TPP) | 14,111,959 | (130,651) | 13,981,308 | 2,334,950 | - | 2,334,950 |
Liabilities | 17,320,563 | (130,651) | 17,189,912 | 30,434,209 | (126,039) | 30,308,170 |
Noncurrent liabilities | 1,386,559 | - | 1,386,559 | 9,622,727 | 31,995 | 9,654,722 |
Provisions for legal claims(Adjustment Copel Distribuição) | 152,944 | - | 152,944 | 1,241,343 | 31,995 | 1,273,338 |
Equity | 14,864,165 | (130,651) | 14,733,514 | 15,155,446 | (158,034) | 14,997,412 |
Attributable to controlling shareholder's | 14,864,165 | (130,651) | 14,733,514 | 14,864,165 | (130,651) | 14,733,514 |
Profit retention reserve | 5,162,983 | (130,651) | 5,032,332 | 5,162,983 | (130,651) | 5,032,332 |
Attributable to non-controlling interest | - | - | - | 291,281 | (27,383) | 263,898 |
|
|
|
|
|
| R$ million |
12.31.2016 |
|
| Parent Company |
|
| Consolidated |
Submitted | Restatement | Resubmitted | Submitted | Restatement | Resubmitted | |
Statements of Income |
|
|
|
|
|
|
Net operating revenue | 1,026,621 | (130,651) | 895,970 | (823,536) | - | (823,536) |
Equity accounting results(Adjustment Araucária TPP) | 902,731 | (130,651) | 772,080 | 221,695 | - | 221,695 |
Income before financial result and taxes | 1,026,621 | (130,651) | 895,970 | 2,044,102 | - | 2,044,102 |
Financial Results | (13,057) | - | (13,057) | (565,744) | (168,912) | (734,656) |
Interest expenses (Adjustment Araucária TPP and Copel Dis) | (334,113) | - | (334,113) | (1,462,297) | (168,912) | (1,631,209) |
Operating profit | 1,013,564 | (130,651) | 882,913 | 1,478,358 | (168,912) | 1,309,446 |
Income tax and social contribution payable | (54,914) | - | (54,914) | (530,568) | 10,878 | (519,690) |
Deferred income tax and social contribution | (50,032) | - | (50,032) | 58,754 | 10,878 | 69,632 |
Net income | 958,650 | (130,651) | 827,999 | 947,790 | (158,034) | 789,756 |
Attributed to controlling shareholders | - | - | - | 958,650 | (130,651) | 827,999 |
Attributed to non-controlling interest | - | - | - | (10,860) | (27,383) | (38,243) |
The Company informs that the annual report on Form 20-F to the U.S. Securities and Exchange Commission - SEC, for the year ended December 31, 2017 is in the process of being prepared and will include the restatement of the financial statements for 2016. As a result, the financial statements as of and for the year ended December 31, 2016 and the related report of the Company’s independent registered accounting firm included in the Company’s annual report on Form 20-F for the year ended December 31, 2016 should no longer be relied on.
Reversal of Provision for Estimated Losses with Impairment
In 4Q17, the amount of R$128.2 million was related to the reversal of provision for estimated losses with impairment of credit arising from the gas purchase agreement signed by the compagas with Petrobras, wich contains a clause for the future compensation of balances concerning the purchase of contracted and guaranteed volumes, higher than those effectively extracted and used. Pursuant to the contractual provisions and consumption outlook, resulting from the review of the projects and scenarios for the years ahead, Compagas estimates to fully compensate the amounts paid up to 2024. In addition, if the concession has an early termination due to any reason, the agreement with Petrobras provides for the right to dispose this asset.
5 |
* Amountssubject to rounding.
|
Earnings Release 4Q17 |
This reversal was partially offset by the provision for impairment related to HPP Colíder (R$44.2 million), TPP Figueira (R$33.8 million), the Cutia and Bento Miguel Wind Complex (R$14.6 million), and to other hydraulic generation assets in the State of Paraná (R$9.9 million). These provisions result from the review of (i) the discount rate, (ii) the assumptions related to the electric energy available for sale in the long term, (iii) delays in the implementation of the construction work and/or modernization, and (iv) an increase in capex to conclude the project.
As a result, the Company had a net balance of R$25.7 million in reversal for impairment in 4Q17.
Provisions for Lawsuits
The Company recorded R$270.5 million in provisions for lawsuits in 4Q17, of which R$181.7 million refers to civil and administrative matters, R$85.6 million to labor and employee benefits matters, and R$3.2 million to tax, regulatory, environmental matters and way easements. Of the balance presented, R$204.7 million are considered non-recurring and are related to matters (i) to arbitrations protected by secrecy and confidentiality, at the probationary stage, without a ruling rendered, (ii) the lawsuit for indemnification on alleged damages due to the implementation of hydroelectric project, and (iii) labor matters.
Copel Distribuição Performance
Copel Distribuição reported an EBITDA of R$110.9 million in 4Q17, a 13.4% increase over the R$97.8 million verified in 4Q16, mainly reflecting the average adjustment of 5.85% on the tariffs as of June 24, 2017, the 4.8% growth in the grid market of the distributor and the 6.5% decrease in manageable costs, partially offset by the higher balances of provisions related mainly to labor and employment benefits matters.
In 2017, EBITDA reached R$573.1 million, 5 times higher than the R$116.6 million reported in 2016, particularly reflecting the 3.4% growth in the grid market of the distributor, the average adjustment of 5.85% on the tariffs as of June 24, 2017 and the 2.6% decrease in PMSO (Personnel and management, pension and health plans, materials, third party services, provisions and reversals and others).
Comparing the reported EBITDA with the regulatory EBITDA (R$1.0 billion), Copel Dis’s performance was 42.8% below the regulatory, reflecting the performance of manageable costs above the tariff coverage, which were impacted by the record of estimated loss for doubtful accounts (PECLD) above of amount of R$35.4 million above the tariff coverage and R$168.6 million in other provisions for disputes.
|
|
| R$ million |
| 2017 | 2017 | Var. % |
| Reported | Tariff Coverage | |
EBITDA | 573.1 | 1,001.2 | (42.8) |
|
|
|
|
PMSO | 1,795.4 | 1,283.8 | 39.8 |
6 |
* Amountssubject to rounding.
|
Earnings Release 4Q17 |
It should be noted that, in 2017, the personnel costs increased by 0.9% year-over-year (vs. the 2.94% inflation of the last 12 months), mainly reflecting the wage policy adopted as of October 2016, partially offset by the reduction of 276 employees in the workforce during 2017 and the revision of the assumptions that subsidize the actuarial calculation.
The Company has carried out efforts to reduce the difference between the tariff coverage and the effective PMSO. In 2017, the PMSO was 2.6% lower vs 2016, while the tariff coverage increased 7.8%, according to the table below.
|
|
| R$ million |
| 2017 | 2016 | Var. % |
PMSO (tariff coverage) | 1,283.9 | 1,191.0 | 7.8 |
PMSO (carried) | 1,795.4 | 1,842.9 | (2.6) |
% Above Tariff Coverage | 39.8% | 54.7% |
|
Shareholding in Sanepar
In December 2017, the Company participated as a seller of the public offering for the secondary distribution of share deposit certificates ("Units"), each representing one common share and four preferred shares issued by Companhia de Saneamento do Paraná - SANEPAR, in accordance with the documents of the respective offer.
Copel's participation in the transaction included the sale of 8,859,914 Units, which represents all of its Units issued by Sanepar, of which 7,268,653 Units were held by Copel Holding and 1,591,261 Units held by Copel Comercialização, at the price of R$55,20/Unit.
The settlement of the transaction occurred on December 18, 2017 and resulted in the entry of R$484.6 million into the Company's cash.
On December 2016, Copel started to classify its investment in Sanepar as a financial asset available for sale. The initial recognition of the asset was based on the fair value and its variation recorded directly in the equity, net of taxes. With the total sale of this investment, in December 2017, the accumulated earnings in the equity were reclassified for the fiscal year’s income, totaling R$28.7 million.
General Meeting of Debenture Holders
On December 20, 2017, the 1st General Meeting of Debenture Holders of the Company's 5th (fifth) issuance of simple, non-convertible debentures into shares, of the unsecured type, in a single series, of the Company ("Debentures"), by means of which the amendment of the definition of "Consolidated Net Financial Debt" provided for in item (z) of Clause 7.1 of the respective deed of issue was approved, as Management’s Proposal disclosed to the market on December 05, 2017, which provides for the exclusion of endorsements andguarantees provided from the definition in question. It shall read as follows:
7 |
* Amountssubject to rounding.
|
Earnings Release 4Q17 |
“Consolidated Net Financial Debt" means (a) the sum of all the consolidated financial debt of the Issuer with individuals and/or legal entities, including loans and financing with third parties, issuance of fixed income securities, convertible or non-convertible into shares, local and/or international capital markets; (b) minus the sum of cash and cash equivalents (cash and financial investments) and the spread on derivative transactions." The amendment in question standardizes the financial ratios applicable to the securities issued by the Company and its subsidiaries.
As a result of this approval, on December 28, 2017, the Company paid Debenture holders R$8.7 million, related to the restructuring fee (flat) equivalent to 1.30% of the debentures unit plus the interest remuneration.
Colíder HPP
On January 29th and 31st, the generator rotor was launched in unit 1’s well and the turbine rotor of generator unit 2 was lowered at the Colíder Hydroelectric Power Plant. With the equipment in the well, the next steps are lowering the stator and closing the machine to start testing. Colíder Power Plant’s powerhouse will have three groups of generators with a total installed power of 300 megawatts. Unit 1 will be the first one ready, scheduled for May 2018, while the third and final generating unit is scheduled to start operating in November 2018.
Given Aneel’s negative decisions on the request for liability exemption and its reconsiderations, on December 18, 2017, Copel GeT filed an ordinary lawsuit at a Judicial Court.
The Company has a balance of R$181.6 million in the “clients” account concerning the sale of electric energy to be reprocessed by CCEE from January to May 2015 due to the request for liability exemption in the delivery of the electric energy to comply with Colíder HPP’s trade agreements, from which was recorded an estimated loss with doubtful accounts (PECLD) of R$119.7 million.
Copel GeT has been honoring energy supply agreements as follows:
- from January 2015 to May 2016: with leftovers of uncontracted electric energy in its other power plants;
- from June 2016 to December 2018: partial reduction in June 2016 through a Bilateral Agreement and from July 2016 to December 2018 with reduction of all Agreements of Electric Energy Trading in Regulated Environment - CCEARs, through a Bilateral Agreement and the participation in the Compensation Mechanism of Leftovers and Deficits - MCSD of New Electric Energy. More details in item 8.1.
Dividends and Interest on Equity
On December 13, 2017, Copel’s Board of Directors resolved to advance part of the Interest on Capital (IOC), to shareholders with interest on December 28, 2017, in the amount of R$266.0 million, thus replacing the 2017dividends, pursuant to Law 9249/95. The proceeds distributed, as well as the payment date, will be ratified at the Annual Shareholders’ Meeting, which will analyze the Management Report, Balance Sheet and other Financial Statements for the year 2017.
8 |
* Amountssubject to rounding.
|
Earnings Release 4Q17 |
Complementing the installment of IOC, at the Annual Shareholders' Meeting (ASM), will be proposed the distribution of R$23.4 million as dividends, totaling R$289.4 million, which represents R$1.00 per common share, R$2.89 per PNA share and R$1.11 per PNB share.
2018 Investment Program
In 2018, Copel intends to invest R$2.9 billion, of which R$888.5 million of the planned investments will be allocated to conclude the construction of the Cutia Wind Farm, which changed its schedule of entry into operation and consequent readjustment of its financial schedule in 2017. In the distribution segment, investments of R$790.0 million are planned for the improvement, modernization, expansion and reinforcement of the energy distribution system in State of Paraná. Generation and transmission projects will receive R$743.6 million, which will be mainly used to the conclude the construction works in progress.
Issue of R$600.0 million in Debentures - Copel Holding
On January 19, 2018, Copel carried out the 7th Issue of Simple and Unsecured Debentures, not convertible into shares, in a single series, for public distribution, pursuant to ICVM No. 476/2009, in the total amount of R$600 million. Six hundred thousand (600,000) debentures were issued, with a par value of R$1,000, maturity of three years as of the issue date and amortization in two annual installments, on January 15, 2020 and February 15, 2021. The debentures will be remunerated with an interest corresponding to the accumulated variation of 119% of the average daily rates of Interbank Deposits (DI). The funds raised were used to strengthen the capital structure of the issuer.
Assured Power Review
On May 03, 2017, Decree No. 178 of the Ministry of Mines and Energy – MME was published, which disclosed the revised amounts of the assured power of the Hydropower Plants - HPPs centrally dispatched in the National Interconnected System (SIN) obtained through the application of the methodology presented in the Report of the Ordinary Review of the Physical Warranty of the Electric Energy of HPPs, dated from April 25, 2017, prepared by the working group established by Decree MME No. 681, of December 30, 2014, composed of representatives of the MME, of the Electric Energy Research Center - CEPEL and of the Energy Research Company - EPE.
The table below shows the assured power of Copel’s projects that have changed.
9 |
* Amountssubject to rounding.
|
Earnings Release 4Q17 |
Power Plants | Installed | Current Assured Power | Revised Assured Power¹ | Concession Expires |
Capacity (MW) | (Average MW) | (Average MW) | ||
HPP Gov. Bento Munhoz da Rocha Netto (Foz do Areia) | 1,676.0 | 576.0 | 603.3 | 09.17.2023 |
HPP Gov. Ney Aminthas de Barros Braga (Segredo) | 1,260.0 | 603.0 | 578.5 | 11.15.2029 |
HPP Gov. José Richa (Salto Caxias) | 1,240.0 | 605.0 | 605.6 | 05.04.2030 |
HPP Dona Francisca | 125.0 | 78.0 | 76.0 | 08.27.2033 |
(23% Copel) |
|
|
|
|
HPP Santa Clara e UHE Fundão - Elejor | 240.3 | 135.4 | 133.0 | 05.28.2037 |
(70% Copel) |
|
|
|
|
TOTAL | 4,541.3 | 1,997.4 | 1,996.4 |
|
¹ Valid from January 1, 2018. |
|
|
|
|
Startup – Estreito – Fernão Dias TL
On February 03, 2018, we’ve started the commercial operations of the Estreito - Fernão Dias transmission line (500 kV), project owned by SPE Cantareira (49% Copel GeT and 51% Celeo Redes). The line, which goes through the states of São Paulo and Minas Gerais, has a length of 342 kilometers and has a APR of R$47.6 million.
Copel is the Most Transparent State-Owned Company in Brazil
The association Transparência Internacional (TRAC Brazil) carried out an unprecedented study to measure the transparency level in activities carried out by the Top 100 largest companies and the Top 10 largest Brazilian banks. Copel stood out among the state-owned companies evaluated. In the overall ranking, Companhia Paranaense de Energia appears in 8th place.
Copel is Elected by Aneel as Best Distributor in the Country
Copel Distribuição was elected the best distributor of energy of the Country and of the South Region in the customer’s opinion, according to Aneel’s Consumer Satisfaction Index (IASC). In the last four years, this is the second time Copel has been recognized by Aneel as Brazil’s best distributor and the third time as the South Region’s best distributor. In addition, last year, Copel was elected by the Abradee award as Brazil’s best distributor for the fourth consecutive year and by the Cier award as the best distributor in Latin America for the fifth time in the last seven years.
Copel remains in the BM&FBovespa’s ISE portfolio
Copel continues to be part of the Corporate Sustainability Index (ISE) portfolio in 2018, reflecting the Company's ongoing concern with the development of sustainability, based on economic efficiency, environmental balance, social justice and corporate governance. The thirteenth portfolio of the ISE is effective from January 8, 2018 to January 4, 2019 and is composed of shares of 30 companies, totaling R$1.3 trillion in market value, equivalent to 41.5% of the total negotiated B3.
10 |
* Amountssubject to rounding.
|
Earnings Release 4Q17 |
Hiring of a Market Maker
With the purpose of fomenting the liquidity of the Company’s Shares, BTG Pactual Corretora de Títulos e Valores Mobiliários S.A was hired to work as Market Maker of the common shares (CPLE3) and preferred shares (CPLE6), within Brasil, Bolsa, Balcão – B3, pursuant to CVM Instruction 384/2003, B3’s Market Maker Regulations, B3’s Operation Regulations and other applicable rules and regulations. BTG Pactual’s activities as a Market Maker started on March 16, 2018, with a contractual term of twelve (12) months as of the date of signature of the agreement, and may be renewed for equal periods, but limited to a maximum term of 60 months.
Improvements in FNQ’s Management
In March 2018, Copel Distribuição won the Best in Management (Melhores em Gestão) award, the country’s main award on organizational management, promoted by the National Foundation of Quality (FNQ - Fundação Nacional da Qualidade). The award is granted to Brazilian companies that stand out for their excellence in management practices, considered world-class level, that is, they are among the companies with leadership precepts that work as a mirror to the world.
From the 11 organizations awarded by FNQ as best in management, three were chosen as highlights. Among them, Copel Distribuição was the only one in the electric energy industry to receive this title.
Recognized as a success story, Copel Telecom was also included in the awards.
Copel Holding’s New CEO
The engineer Jonel Nazareno Iurk is the new CEO replacing the Mr. Sergio Sergio de Souza Guetter, who will again be the CEO director of Copel Distribuição, a position he held until March 2017. Civil engineer, Mr. Jonel Nazareno Iurk was an environmental sanitation coordinator in the Coordination of the Curitiba Metropolitan Region – Comec, an operational development engineer and coordinator of rural sanitation and environmental studies at Companhia de Saneamento do Paraná – Sanepar, and Head of the Brazilian Institute of the Environment and Renewable Natural Resources – Ibama in Paraná. He was also a Technical Officer at ECOBR Engenharia e Consultoria Ambiental, the Paraná State Secretary of Environment and Water Resources and recently held the position of CEO of Companhia Paranaense de Gás, Compagas. In Copel, Mr. Iurk was Chief Business Development Officer from 2013 to 2017 and Officer of Environment and Corporate Citizenship in 2013.
Business Management’s New Director
Mr. Deonilson Roldo is the new Business Management Officer of Copel. Degree in Social Communication, with specialization degree in Economics, Mr. Deonilson was, among other functions, Chief of Staff in the Governor’sOffice for the State of Paraná, Advisor Secretary for Communication and Chief of Staff of Curitiba Municipality, Secretary for Communication of Curitiba Municipality, and Press coordinator and Secretary for Communication of the State of Paraná, member of the Fiscal Council of the Cutia Wind Complex and recently held the position of State Secretary for of the Government of the State of Paraná.
11 |
* Amountssubject to rounding.
|
Earnings Release 4Q17 |
Currently is Chairman of the Nomination and Evaluation Committee of Companhia de Saneamento do Paraná – Sanepar, Member of the Nomination and Evaluation Committee ofCompanhia de Tecnologia da Informação eComunicação do Paraná - Celepar, ofAdministração dos Portos de Paranaguá e Antonina - Appa and ofFomento Paraná, Member of the State Traffic Council (Conselho Estadual de Trânsito – Cetran), and Member of the Control Council of State Enterprises of the Government of Paraná (Conselho de Controle das Empresas Estaduais do Governo do Paraná).
New Director of Business Development
The Engineer Jose Marques Filho is the new Copel’s Director of Business Development. Mr. Marques has a degree in Civil Engineering from the Universidade de São Paulo and a PhD in Civil Engineering from the Universidade Federal do Rio Grande do Sul. He is currently an adjunct professor at the Universidade Federal do Paraná, advisor to the Instituto Brasileiro do Concreto, where he also served as President, coordinator of the Concrete Dams Commission and Vice President of the Brazilian Dams Committee, as Brazil's representative on the ICOLD (Committe on Concrete Dams International Commission on Large Dams) and president of Paraná Gás. He was general coordinator of the Materials and Structures Laboratory and Director of Instituto de Tecnologia para o Desenvolvimento – LACTEC and Chairman of the Board of Directors of the Centrais Elétricas do Rio Jordão – Elejor.
New Chief Legal and Institutional Relations Officer
Mr. Harry Françóia Júnior is the Company's new Chief Legal and Institutional Relations Officer. He has a Law degree from PUC – PR, a degree in Contemporary Law from Levin College of Law (University of Florida), and a post-graduate diploma in Administrative Law from Universidade Federal de Santa Catarina and in Civil Procedure Law from the Brazilian Institute of Legal Studies (IBEJ). Throughout his career, Mr. Françóia Júnior has worked as Chief Assistant Officer at Copel Comercialização, the Managing Director and General Secretary of the Presidency of the Legislative Assembly of Paraná, the Vice President of the OAB/PR Lawyers Association Commission, the Vice President of Political and Legal Affairs of the Federation of Commercial and Industrial Associations Of Paraná (Faciap), a Member of the OAB/PR Commissions on Environmental Law and Consumer Protection Law, and a Lawyer in the Business Law area with emphasis on Corporate and Tax Law at Harry Françóia - Advogados Associados. Recently, he occupied the position of Chief Business Development Officer at Copel.
12 |
* Amountssubject to rounding.
|
Earnings Release 4Q17 |
Copel Distribuição - New Chief Executive Officer
The engineer Antonio Sergio de Souza Guetter is the new Copel Distribuição’s CEO, a position he held in 2016. Copel's career officer, Mr. Guetter served as Financial and Investor Relations Officer, Chief Executive Officer of Copel Renováveis, Assistant Officer of Copel Participações, in addition to having worked at the Fundação Copel de Previdência e Assistência Social, entity in which he held the position of Chief Executive Officer and Director of Administration and Security. He recently held the position of Chief Executive Officer of Copel Holding.
13 |
* Amountssubject to rounding.
|
Earnings Release 4Q17 |
The following analyzes refer to the fourth quarter of 2017 and to the accumulated of year compared to the same period of 2016.
In the fourth quarter of 2017, net operating revenue totaled R$3,910.7 million, an increase of 18.6%, compared to the R$3,297.1 million registered in the 4Q16, a result of (a) a 29.2% growth in the “electricity sales to distributors”, mainly due of dispatch of 195.2 GWh of Araucaria TPP and the sale of 920 GWh by Copel Comercialização in bilateral contracts; (b) a 14.4% increase in "electricity sales to final customers" revenue, as a result of Copel Distribuição's tariff adjustment effective as of June 24, 2017, which adjusted the energy tariff (TE) by 10,28%, and the sale of 258 GWh to free customers of Copel Comercialiazação; (c) of the positive result of R$381.1 million in sectorial financial assets and liabilities (compared to R$110.5 million in 4Q16), due to the lower hydrological risk (GSF), from 69.3% in 4Q17 to 88.3% in 4Q16, and the higher average PLD in the period (R$398.09/MWh in 4Q17 compared to R$162.82/MWh in 4Q16);
The following variations are also worth mentioning:
(i) the 3.3% growth in the “use of the main distribution and transmition grid" line, due to (a) the 4.8% growth in the 4Q17 grid market, (b) Copel’s tariff adjustment, which adjusted the TUSD by 0.85% as of June 24, 2017, and (c) the adjustment applied to the RAP as of July 2017, partially offset by the removal of the balance of revenue from group companies (Copel GeT and Copel Distribuição) referring to the portion of APR related to RBSE, which was recognized in GeT’s revenue during 2016 and at the beginning of 2017;
(ii) the 10.3% increase in “revenues from telecommunications”, due to the expansion of services to new customers;
(iii) the 34.4% decrease in “other operating revenues”, mainly due to lower revenues from fines and with provision of technical services to third parties;
(iv) the 7.9% drop in “distribution of piped gas”, due to the reduction in the natural gas consumption, partially offset by the TPP Araucária dispatch.
14 |
* Amountssubject to rounding.
|
Earnings Release 4Q17 |
|
|
|
|
|
|
| R$ '000 |
Income Statement | 4Q17 | 3Q17 | 4Q16 | Var.% | 2017 | 2016 | Var.% |
(1) | (2) | (3) | (1/3) | (4) | (5) | (4/5) | |
Electricity sales to final customers | 1,258,915 | 1,197,358 | 1,100,531 | 14.4 | 4,681,533 | 5,231,505 | (10.5) |
Electricity sales to distributors | 879,843 | 798,482 | 681,108 | 29.2 | 3,176,354 | 2,676,072 | 18.7 |
Use of the main distribution and transmission grid | 855,319 | 794,692 | 827,635 | 3.3 | 3,617,941 | 3,976,583 | (9.0) |
Construction revenue | 276,191 | 196,994 | 344,977 | (19.9) | 868,001 | 1,279,642 | (32.2) |
Fair value of assets from the indemnity for the concession | 48,655 | 2,980 | 3,430 | - | 57,080 | 132,741 | (57.0) |
Revenues from telecommunications | 81,897 | 81,918 | 74,232 | 10.3 | 308,952 | 261,581 | 18.1 |
Distribution of piped gas | 94,745 | 117,566 | 102,882 | (7.9) | 454,815 | 471,885 | (3.6) |
Result of sectorial financial assets and liabilities | 381,121 | 417,889 | 110,470 | 245.0 | 718,826 | (1,079,662) | - |
Other operating revenues | 33,978 | 35,790 | 51,787 | (34.4) | 141,071 | 151,406 | (6.8) |
Net Operating Revenue | 3,910,664 | 3,643,669 | 3,297,052 | 18.6 | 14,024,573 | 13,101,753 | 7.0 |
In the 2017, Copel's net operating revenue increased by 7.0%, mainly due to the result of sectorial financial assets and liabilities and the incresase of 18.7% in the revenue of electricity sales to distributors, mainly due to the registration of R$275.1 million in revenue at Copel Comercialização and an increase of 18.1% in telecommunications revenues, due to the expansion of the customer base, partially offset by (a) a drop of 10.5% in eletricity sales to final customers, reflecting the 11.6% reduction in the captive market of Copel Distribuição; (b) a reduction of 9.0% in use of the main distribution and transmission grid, mainly due to the recognition of R$809.6 million related to the recognition of the indemnification of assets related to RBSE in 2016; and (c) a 3.6% reduction in distribution of piped gas, due to the 2.5% drop in natural gas consumption in the period.
Disregarding the effect of the recognition of indemnification of RBSE related assets in 2016 and its adjustment in 2017 (R$183.0 million in 1Q17), the Company would have ended 2017 with a 12.6% growth in net operating revenue.
In 4Q17, operating costs and expenses increased by 6.5%, totaling R$3,618.1 million. This result was mainly due to the 42.4% increase in costs with "electricity purchased for resale”, as a result of the higher hydrological risk (GSF of 69.3% in 4Q17 vs. 88.3% in 4Q16) and the higher average PLD in the period (R$398.09/MWh in 4Q17 vs. R$162.82/MWh in 4Q16); partially offset by the lower balance of provisions and reversals (R$268.4 million in 4Q17 versus R$603.7 million in 4Q16) due to the net effect of R$25.7 million referring to the reversal of impairment in 4Q17, while in 4Q16 the amount of R$567.1 million was reported for impairment of generation assets. Also on this line, it is noteworthy (a) the 65.1% decrease in provisions related to doubtful accounts - PECLD (R$18.2 million in 4Q17 versus R$52.3 million in 4Q16) and (ii) the 78.1% decrease in provisions related to tax credit losses, offset by the record of R$270.5 million in provisions for civil and administrative matters (R$181.7 million), labor and employee benefits matters (R$85.6 million), regulatory matters, environmental taxes and way easements (R$3.2 million).
15 |
* Amountssubject to rounding.
|
Earnings Release 4Q17 |
|
|
|
|
|
|
| R$'000 |
Electricity Purchased for Resale | 4Q17 | 3Q17 | 4Q16 | Var.% | 2017 | 2016 | Var. % |
(1) | (2) | (3) | (1/3) | (4) | (5) | (4/5) | |
CCEAR (Auction) | 680,750 | 588,838 | 849,513 | (19.9) | 2,693,976 | 3,219,900 | (16.3) |
Itaipu Binacional | 278,214 | 284,707 | 251,131 | 10.8 | 1,117,957 | 1,089,804 | 2.6 |
CCEE | 537,740 | 745,951 | 188,534 | 185.2 | 1,766,091 | 535,656 | 229.7 |
Micro and mini generators and customer repurchase | 1,478 | 2,414 | 204 | 624.5 | 3,892 | 561 | 593.8 |
Proinfa | 54,389 | 54,433 | 60,536 | (10.2) | 217,646 | 242,910 | (10.4) |
Bilateral | 348,770 | 398,312 | 6,315 | - | 766,803 | 20,006 | - |
(-) PIS/Pasep and Cofins | (109,065) | (116,460) | (98,006) | 11.3 | (400,915) | (423,233) | (5.3) |
TOTAL | 1,792,276 | 1,958,195 | 1,258,227 | 42.4 | 6,165,450 | 4,685,604 | 31.6 |
Also noteworthy are the following variations:
(i) the 754.4% increase in materials and supplies for power electricity due to the generation of 195.2 GWh by TPP Araucária;
(ii) the 24.4% increase in charges for the main distribution and transmission grid, reflecting the higher costs for the use of the system – basic network, due to the TUST adjustment in June 2017 and the 321.8% adjustment of Itaipu’s electric energy transmission tariff, partially offset by CCEE’s decision to onlend to the market the surplus of resources accumulated in the CONER account - given the outlook of the PLD’s increase in 2017; and
|
|
|
|
|
|
| R$'000 |
Charges of the main distribution and transmission grid | 4Q17 | 3Q17 | 4Q16 | Var.% | 2017 | 2016 | Var.% |
(1) | (2) | (3) | (1/3) | (4) | (5) | (4/5) | |
System usage charges | 243,821 | 245,763 | 156,543 | 55.8 | 779,311 | 618,195 | 26.1 |
Itaipu transportation charges | 50,960 | 46,771 | 23,777 | 114.3 | 147,284 | 82,935 | 77.6 |
Charge reserve energy - EER | - | - | - | - | - | 66,593 | - |
System Service Charges - ESS | (33,330) | (98,768) | 25,499 | - | (129,484) | 185,105 | - |
(-) PIS / Pasep and Cofins taxes on charges for use of power grid | (31,679) | (20,698) | (21,130) | 49.9 | (85,081) | (86,585) | (1.7) |
TOTAL | 229,772 | 173,068 | 184,689 | 24.4 | 712,030 | 866,243 | (17.8) |
(iii) the5.1% decrease in PMSO (Personnel and management, pension and health plans, materials, third party services, provisions and reversals and others), excluding estimated losses, provisions and reversals, reflecting the lower costs with personnel and management, pension and health plans, third-party services, and the recognition of a profit of R$28.7 million as a result of the disposal of investment in Sanepar, partially offset by (a) the 12.7% increase in other operating costs and expenses, mainly due to the record of R$13.0 million referring to the fees of state control and audit on the use of water resources (established by State Law No. 18.878/2016, which became due as of January 1, 2017), and to the greater amount of losses with the deactivation of assets and rights, and (b) the 32.3% increase in material costs, mainly related to electric energy materials and fuels and parts for vehicles.
Manageable Costs | 4Q17 | 4Q16 | Var. % | 2017 | 2016 | Var. % |
Personnel a nd ma na gement | 423,350 | 457,905 | (7.5) | 1,343,344 | 1,304,418 | 3.0 |
Priva te pens i on a nd hea l thca re pl a ns | 62,085 | 67,404 | (7.9) | 237,597 | 259,767 | (8.5) |
Ma teria l | 24,290 | 18,365 | 32.3 | 83,124 | 81,463 | 2.0 |
Thi rd-pa rty s ervi ces | 136,023 | 147,936 | (8.1) | 521,515 | 550,493 | (5.3) |
Other cos ts a nd e xpens es operati ng | 65,399 | 58,008 | 12.7 | 413,950 | 414,856 | (0.2) |
TOTAL | 711,147 | 749,618 | (5.1) | 2,599,530 | 2,610,997 | (0.4) |
16 |
* Amountssubject to rounding.
|
Earnings Release 4Q17 |
Excluding the cost of user fees for water resources and supervision, as well as the effect of classification and disposal of the investment in Sanepar, manageable costs decreased by 4.0% (R$733.0 million in 4T17 and R$763.2 million in 4Q16).
It should be noted that the "personnel and managers" showed 7.5% decrease and mainly reflects lower compensation costs with remuneration, as a result of the salary policy applied as from October 2017, and the lower provision balance for indemnities related to the Incentive Dismissal Plan (PDI). Up to December 31, 2017, there was a reduction of 281 employees in Copel's personnel, of which 248 joined the PDI and left the Company in 2017. The adhesion of these employees to the program represented a cost of R$40.4 million in 2017, with a cost reduction of around R$60.2 million as from 2018. The costs of "pension and healthcare plans" decreased by 7.9% due to the lower amount allocated to the "post-employment plan", motivated by the revision of the assumptions that subsidize the actuarial calculation.
Personnel and Management | 4Q17 | 4Q16 | Var. % | 2017 | 2016 | Var. % |
Personnel a nd management | 423,350 | 457,905 | (7.5) | 1,343,344 | 1,304,418 | 3.0 |
(-) Provis ion for indemnification for voluntary dismis sal¹ | (20,423) | (28,550) | (7.9) | (53,468) | (44,276) | (8.5) |
TOTAL | 402,927 | 429,355 | (6.2) | 1,289,876 | 1,260,142 | 2.4 |
Excluding the effect of the provision for indemnification related to PDI (R$20.4 million in 4Q17 and R$28.6 million in 4Q16), personnel costs decreased by 6.2% compared to 4Q16, equivalent to R$26.4 million, and totaled R$402.9 million in the period.
|
|
|
|
|
|
| R$ '000 |
Operating Costs and Expenses | 4Q17 | 3Q17 | 4Q16 | Var.% | 2017 | 2016 | Var.% |
| (1) | (2) | (3) | (1/3) | (4) | (5) | (4/5) |
Electricity purchased for resale | 1,792,276 | 1,958,195 | 1,258,227 | 42.4 | 6,165,450 | 4,685,604 | 31.6 |
Charge of the main distribution and transmission grid | 229,772 | 173,068 | 184,689 | 24.4 | 712,030 | 866,243 | (17.8) |
Personnel and management | 423,350 | 294,754 | 457,905 | (7.5) | 1,343,344 | 1,304,418 | 3.0 |
Pension and healthcare plans | 62,085 | 58,358 | 67,404 | (7.9) | 237,597 | 259,767 | (8.5) |
Materials and supplies | 24,290 | 19,875 | 18,365 | 32.3 | 83,124 | 81,463 | 2.0 |
Materials and supplies for power eletricity | 74,970 | 8,902 | 8,775 | 754.4 | 97,360 | 33,352 | 191.9 |
Natural gas and supplies for the gas business | 61,628 | 78,079 | 61,177 | 0.7 | 309,542 | 325,413 | (4.9) |
Third-party services | 136,023 | 134,906 | 147,936 | (8.1) | 521,515 | 550,493 | (5.3) |
Depreciation and amortization | 182,208 | 182,197 | 176,188 | 3.4 | 731,599 | 708,296 | 3.3 |
Provisions and reversals | 268,352 | (100,038) | 603,729 | (55.6) | 365,539 | 768,696 | (52.4) |
Construction cost | 297,771 | 189,011 | 353,720 | (15.8) | 1,003,881 | 1,280,745 | (21.6) |
Other cost and expenses | 65,399 | 162,395 | 58,008 | 12.7 | 413,950 | 414,856 | 4 |
TOTAL | 3,618,124 | 3,159,702 | 3,396,123 | 6.5 | 11,984,931 | 11,279,346 | 6.3 |
In 2017, operating costs and expenses totaled R$11,894.9 million (6.3% up). This result was mostly impacted by (a) the 31.6% increase in “electricity purchased for resale”, caused by the higher hydrological deficit (18.4% in 2017 and 11.8% in 2016) and the higher PLD (PLD médio de R$ 318,15/MWh em 2017 ante R$ 92,40/MWh em 2016), (b) 191.9% increase in "materials and supplies for power electricity" costs, due to TPP Araucária's dispatch in 4Q17, and (c) 3.0% increase in "personnel and managements", in line with inflation in the period(IPCA of 2.94% in 2017), impacted by the provision of R$51.4 million for compensation for voluntary dismissals and retirement, and for the wage policy adopted from October 2017.
17 |
* Amountssubject to rounding.
|
Earnings Release 4Q17 |
These events were partially offset by (a) a reduction of 52.4% in "provisions and reversals", reflecting the reversal of impairment in the amount of R$122.8 million in 2017, against a provision of R$581.6 million related to impairment in 2016; and (b) a reduction of 17.8% in "charge of the main distribution and transmission grid", mainly due to CCEE's decision to pass on to the market the excess of resources accumulated in the CONER account - given the high of the PLD throughout 2017.
Equity in the earnings of investees reflects gains and losses from investments in Copel’s investees and is presented in the table below.
|
|
|
|
|
|
| R$'000 |
| 4Q17 | 3Q17 | 4Q16 | Var. % | 2017 | 2016 | Var. % |
Company | (1) | (2) | (3) | (1/3) | (4) | (5) | (4/5) |
Joint Ventures | 44,240 | (26,190) | 36,614 | 20.8 | 91,982 | 159,739 | (42.4) |
Dominó Holdings S.A. ¹ | 2 | (22) | 10,508 | - | (564) | 37,492 | - |
Voltalia São Miguel do Gostoso I Participações S.A. | (1,278) | 6 | 1,171 | - | (565) | 4,345 | - |
Paraná Gás Exploração e Produção S.A. | (7) | (5) | (32) | (78.1) | (34) | (69) | (50.7) |
Costa Oeste Transmissora de Energia S.A. | 618 | (5,159) | 493 | 25.4 | (2,566) | 7,372 | - |
Marumbi Transmissora de Energia S.A. | 2,169 | (16,597) | (433) | - | (9,537) | 16,188 | - |
Transmissora Sul Brasileira de Energia S.A. | (6,783) | 273 | 530 | - | (5,009) | 1,806 | - |
Caiuá Transmissora de Energia S.A. | 827 | (6,271) | (6) | - | (4,020) | 8,143 | - |
Integração Maranhense Transmissora de Energia S.A. | 721 | (12,104) | 461 | 56.4 | (8,852) | 15,934 | - |
Matrinchã Transmissora de Energia (TP NORTE) S.A. | 26,862 | 2,009 | 9,496 | 182.9 | 57,376 | 41,910 | 36.9 |
Guaraciaba Transmissora de Energia (TP SUL) S.A. | 6,752 | 2,016 | 6,675 | 1.2 | 25,377 | 11,194 | 126.7 |
Paranaíba Transmissora de Energia S.A. | 5,064 | 4,267 | 4,052 | 25.0 | 17,020 | 12,847 | 32.5 |
Mata de Santa Genebra Transmissão S.A. | 4,484 | 5,202 | 1,610 | 178.5 | 19,477 | (2,578) | - |
Cantareira Transmissora de Energia S.A. | 4,809 | 195 | 2,089 | 130.2 | 3,879 | 5,155 | (24.8) |
Associates | 2,783 | 3,685 | 11,213 | (75.2) | 15,534 | 61,956 | (74.9) |
Cia . de Saneamento do Paraná - Sanepar¹ | - | - | 6,600 | - | - | 43,120 | - |
Dona Francisca Energética S.A. | 2,411 | 2,190 | 1,876 | 28.5 | 8,876 | 7,901 | 12.3 |
Foz do Chopim Energética Ltda.² | 378 | 1,503 | 2,200 | (82.8) | 6,645 | 10,675 | (37.8) |
Others³ | (6) | (8) | 537 | - | 13 | 260 | 4 |
TOTAL | 47,023 | (22,505) | 47,827 | (1.7) | 107,516 | 221,695 | (51.5) |
In 4Q17, earnings before interest, taxes, depreciation and amortization reached R$521.8 million, 317.6% higher than the R$124.9 million reported in 4Q16. While in 2017, EBITDA reached R$2,878.8 million, 4.6% more than in the same period of 2016 (R$2,752.4 million).
18 |
* Amountssubject to rounding.
|
Earnings Release 4Q17 |
Excluding extraordinary effects, the adjusted EBITDA in 4Q17 would be 5.1% higher year-over-year, mainly due to the order on TPP Araucária and the 4.8% increase in Copel Distribuição’s grid market and the reduction of 5.1% in PMSO, partially offset by the worsen GSF, in line with the high PLD, generating higher costs with electric energy purchase.
The 2017 EBITDA would be 15.1% higher than the R$2,400.6 million in 2016, explained mainly by the significant growth of Copel Distribuição's EBITDA, reflecting the tariff readjustment applied as of June 24, 2017, 3.4% growth in the grid market and control of manageable costs; and by 2.7% and 7.1% growth in Copel GeT's electricity sales to final customers and distributors revenues, partially offset by higher energy purchase costs due to the effect of the GSF.
The following table presents the items considered in the adjusted EBITDA calculation.
|
|
|
|
|
| R$ million |
Adjusted EBITDA | 4Q17 | 4Q16 | Var.% | 2017 | 2016 | Var.% |
| (1) | (2) | (1/2) | (3) | (4) | (3/4) |
EBITDA | 521.8 | 124.9 | 317.6 | 2,878.8 | 2,752.4 | 4.6 |
(-)/+ Remeasurement of financial assets RBSE | - | (38.3) | - | (183.0) | (809.7) | (77.4) |
(-)/+ Provision for PECLD above tariff coverage | 5.7 | 39.8 | (85.6) | 40.6 | 129.9 | (68.8) |
(-) Reversal Provisions for Legal Claims - Cofins | 235.5 | - | - | 237.5 | - | - |
(-)/+ Revers al of provision | (42.8) | - | - | (59.5) | (193.4) | (69.2) |
(-)/+ Impairment Test | (25.7) | 567.1 | - | (122.8) | 581.6 | - |
(-)/+ Remesuration of the Indemnification of Generation Concessions | - | (8.1) | - | - | (8.1) | - |
(-)/+ Result of change in evaluation method - Sanepar | - | (52.1) | - | - | (52.1) | - |
(-)/+ Result of disposal of investment - Sanepar | (28.7) | - | - | (28.7) | - | - |
Adjusted EBITDA | 665.8 | 633.3 | 5.1 | 2,762.9 | 2,400.6 | 15.1 |
In 4Q17, financial revenues totaled R$164.2 million, a 17.2% decrease over the R$198.5 million recorded in 4Q16, mainly due to judicial deposit update.
The financial expenses totaled R$357.0 million, a 36.8% decrease over 4Q16, mainly due to the restatement of 2016 balances, resulting from the provision for the devaluation of the R$136.9 million investment made by UEG Araucária in Multimarket Investment Fund. See more details in Note 4.1.1 of our Financial Statements.
In addition, the reduction in financial expenses was also affected by the lower exchange variation on the purchase of electric energy from Itaipu and the reduction of debt charges due to the SELIC rate reduction (in 4Q17 the DI average was 7.47% over 13.84% in 4Q16). The higher balance of financing and debentures partially offset the decrease in the financial expenses.
The following table shows these changes and the financial result.
19 |
* Amountssubject to rounding.
|
Earnings Release 4Q17 |
|
|
|
|
|
|
| R$'000 |
| 4Q17 | 3Q17 | 4Q16 | Var.% | 2017 | 2016 | Var.% |
| (1) | (2) | (3) | (1/3) | (4) | (5) | (4/5) |
Financial Revenues | 164,248 | 236,246 | 198,467 | (17.2) | 699,310 | 896,553 | (22.0) |
Income and monetary variation on CRC transfer | 48,746 | 36,620 | 46,117 | 5.7 | 141,923 | 194,153 | (26.9) |
Income from investments held for trading | 28,262 | 18,848 | 35,524 | (20.4) | 95,221 | 175,367 | (45.7) |
Late fees on electricity bills | 63,134 | 37,106 | 43,698 | 44.5 | 191,554 | 221,673 | (13.6) |
Income from financial investments available for sale | 3,542 | 4,591 | - | - | 19,302 | 13,497 | 43.0 |
Monetary restatement and adjustment to present value of accounts payable related to concession | (5,995) | 2,807 | 1 | - | 10,813 | 1,116 | 868.9 |
Income from sectorial assets and liabilities | (522) | (1) | 1 | - | 20,493 | 27,734 | (26.1) |
Exchange variation About Purchase Itaipu Electric Power | (742) | 9,771 | 2,999 | - | 17,777 | 39,283 | (54.7) |
Other financial revenues | 27,823 | 126,504 | 70,127 | (60.3) | 202,227 | 223,730 | (9.6) |
Financial Expenses | (356,948) | (379,501) | (564,427) | (36.8) | (1,453,527) | (1,631,209) | (10.9) |
Monetary variation, foreign exchange and debt service charges | (227,839) | (239,123) | (287,223) | (20.7) | (993,970) | (1,072,875) | (7.4) |
Monetary variation and adjustment to present value of accounts payable related to concession | (16,355) | (16,180) | (16,846) | (2.9) | (65,418) | (90,480) | (27.7) |
Exchange variation About Purchase Itaipu Electric Power | (4,568) | 652 | (8,889) | - | (12,264) | (20,597) | (40.5) |
Pis/ Pasep and Cofins taxes over interest on equity | (45,196) | - | (40,607) | 11.3 | (45,196) | (40,607) | 11.3 |
Income from sectorial assets and liabilities | (8,127) | (14,613) | 4,257 | - | (29,622) | (13,947) | 112.4 |
Interest on R&D and PEE | (6,585) | (8,244) | (10,813) | (39.1) | (34,345) | (41,781) | (17.8) |
Accounts receivable tied to the concession fair value's update | - | (4,380) | - | - | (51,211) | (5,235) | 878.2 |
Estimated losses on impairment of assets | (5,372) | - | (136,917) | (96.1) | (5,372) | (136,917) | (96.1) |
Other financial expenses | (42,906) | (97,613) | (67,389) | (36.3) | (216,129) | (208,770) | 3.5 |
Financial income (expenses) | (192,700) | (143,255) | (365,960) | (47.3) | (754,217) | (734,656) | 2.7 |
In 4Q17, Copel recorded net income of R$160.2 million against a loss of R$271.1 million registered in the same period of 2016.
In 2017, the net income was R$1,118.3 million, higher 41.6% from R$789.8 million accumulated in 2016.
20 |
* Amountssubject to rounding.
|
Earnings Release 4Q17 |
|
|
|
|
|
|
| R$'000 |
Income Statement | 4Q17 | 3Q17 | 4Q16 | Var.% | 2017 | 2016 | Var.% |
| (1) | (2) | (3) | (1/3) | (4) | (5) | (4/5) |
OPERATING REVENUES | 3,910,664 | 3,643,669 | 3,297,052 | 18.6 | 14,024,573 | 13,101,753 | 7.0 |
Electricity s ales to final cus tomers | 1,258,915 | 1,197,358 | 1,100,531 | 14.4 | 4,681,533 | 5,231,505 | (10.5) |
Electricity s ales to distributors | 879,843 | 798,482 | 681,108 | 29.2 | 3,176,354 | 2,676,072 | 18.7 |
Use of the main dis tribution a nd transmis sion grid | 855,319 | 794,692 | 827,635 | 3.3 | 3,617,941 | 3,976,583 | (9.0) |
Construction revenue | 276,191 | 196,994 | 344,977 | (19.9) | 868,001 | 1,279,642 | (32.2) |
Fair value of a ssets from the i ndemnity for the concession | 48,655 | 2,980 | 3,430 | - | 57,080 | 132,741 | (57.0) |
Revenues from telecommunications | 81,897 | 81,918 | 74,232 | 10.3 | 308,952 | 261,581 | 18.1 |
Dis tribution of piped gas | 94,745 | 117,566 | 102,882 | (7.9) | 454,815 | 471,885 | (3.6) |
Result of Sectorial financial a ss ets a nd l iabilities | 381,121 | 417,889 | 110,470 | 245.0 | 718,826 | (1,079,662) | - |
Other operating revenues | 33,978 | 35,790 | 51,787 | (34.4) | 141,071 | 151,406 | (6.8) |
OPERATING COSTS AND EXPENSES | (3,618,124) | (3,159,702) | (3,396,123) | 6.5 | (11,984,931) | (11,279,346) | 6.3 |
Electricity purchased for resale | (1,792,276) | (1,958,195) | (1,258,227) | 42.4 | (6,165,450) | (4,685,604) | 31.6 |
Charge of the main distribution and transmiss ion grid | (229,772) | (173,068) | (184,689) | 24.4 | (712,030) | (866,243) | (17.8) |
Personnel a nd management | (423,350) | (294,754) | (457,905) | (7.5) | (1,343,344) | (1,304,418) | 3.0 |
Pension and healthcare plans | (62,085) | (58,358) | (67,404) | (7.9) | (237,597) | (259,767) | (8.5) |
Materials a nd supplies | (24,290) | (19,875) | (18,365) | 32.3 | (83,124) | (81,463) | 2.0 |
Materials a nd supplies for power eletricity | (74,970) | (8,902) | (8,775) | 754.4 | (97,360) | (33,352) | 191.9 |
Natural gas a nd s upplies for the gas business | (61,628) | (78,079) | (61,177) | 0.7 | (309,542) | (325,413) | (4.9) |
Third-party s ervices | (136,023) | (134,906) | (147,936) | (8.1) | (521,515) | (550,493) | (5.3) |
Depreciation a nd a mortization | (182,208) | (182,197) | (176,188) | 3.4 | (731,599) | (708,296) | 3.3 |
Provis ions a nd reversals | (268,352) | 100,038 | (603,729) | (55.6) | (365,539) | (768,696) | (52.4) |
Construction cos t | (297,771) | (189,011) | (353,720) | (15.8) | (1,003,881) | (1,280,745) | (21.6) |
Other cost and expens es | (65,399) | (162,395) | (58,008) | 12.7 | (413,950) | (414,856) | (0.2) |
EQUITY IN EARNINGS OF SUBSIDIARIES | 47,023 | (22,505) | 47,827 | (1.7) | 107,516 | 221,695 | (51.5) |
PROFIT BEFORE FINANCIAL RESULTS AND TAXES | 339,563 | 461,462 | (51,244) | - | 2,147,158 | 2,044,102 | 5.0 |
FINANCIAL RESULTS | (192,700) | (143,255) | (365,960) | (47.3) | (754,217) | (734,656) | 2.7 |
Financia l income | 164,248 | 236,246 | 198,467 | (17.2) | 699,310 | 896,553 | (22.0) |
Financia l expens es | (356,948) | (379,501) | (564,427) | (36.8) | (1,453,527) | (1,631,209) | (10.9) |
OPERATIONAL EXPENSES/ INCOME | 146,863 | 318,207 | (417,204) | - | 1,392,941 | 1,309,446 | 6.4 |
INCOME TAX AND SOCIAL CONTRIBUTION ON PROFIT | 13,357 | 71,577 | 146,147 | (90.9) | (274,686) | (519,690) | (47.1) |
Income tax a nd s ocial contribution on profit | 89,879 | (143,708) | 50,315 | 78.6 | (379,943) | (589,322) | (35.5) |
Deferred i ncome tax and social contribution on profit | (76,522) | 215,285 | 95,832 | - | 105,257 | 69,632 | 51.2 |
NET INCOME (LOSS) | 160,220 | 389,784 | (271,057) | - | 1,118,255 | 789,756 | 41.6 |
Attributed to controlling shareholders | 99,930 | 383,314 | (211,350) | - | 1,033,626 | 827,999 | 24.8 |
Attributed to non-controlling i nterest | 60,290 | 6,470 | (56,507) | - | 84,629 | (38,243) | - |
EBITDA | 521,771 | 643,659 | 124,944 | 317.6 | 2,878,757 | 2,752,398 | 4.6 |
21 |
* Amountssubject to rounding.
|
Earnings Release 4Q17 |
The main accounts and changes in the Balance Sheet in relation to December 2016 are described below. Additional information can be found in the Notes to our Financial Statement.<0}
Cash, Cash Equivalents and Bonds and Securities<0}
On December 31, 2017, the cash and cash equivalents, bonds and securities of Copel’s wholly owned subsidiaries and controlled companies totaled R$1,286.1 million, 4.2% lower than the R$1,342.7 million recorded on December 2016. These funds were invested, mostly in Bank Deposit Certificates (CDBs) and repo transactions. These investments are remunerated between 60% and 100% of the variation rate of the Interbank Deposit Certificate (CDI).
<<CRC Transferred to the State of Paraná
Through the fourth addendum signed on January 21, 2005, the Company renegotiated the CRC balance on December 31, 2004 with the State of Paraná at R$1,197.4 million, in 244 monthly installments recalculated by the price amortization system, restated by the IGP-DI inflation index plus annual interest of 6.65%. The first installment was due on January 30, 2005, with subsequent and consecutive maturities until April 2025.
The State of Paraná requested the Company and the Board of Directors approved, on June 16, 2016, subject to the consent of the Department of the Treasury, the Novation of the CRC Adjustment Agreement, which contemplates: (i) from April to December 2016, a total grace period for principal and interest payments; and (ii) from January to December 2017, a grace only the principal amount, but with monthly interest payments. The other clauses would be maintained, including the maintenance of the current correction and interest rates, thus not affecting the overall net present value of said agreement.
The State of Paraná complied with the agreed terms and made the payments of the monthly installments of interest estimated until December 2017. Once the grace period ended, as of January 2018, there are 88 monthly installments, which are being paid strictly under the conditions contracted.
The Company's management and the State of Paraná formalized the Fifth Amendment on October 31, 2017. The current balance of the CRC is R$1,516.4 million.
Other temporary investments
In November 2016, the Shareholders' Agreement, signed between the state of Paraná and Dominó Holdings, was terminated, removing from Dominó Holdings the significant influence over its investment in Sanepar. This occurred due to the conversion of common shares into preferred shares issued by Sanepar and held by DominóHoldings. Given this fact, the investment of Sanepar which ceased to be classified as an associated company and is now considered a financial asset available for sale. Accordingly, its recognition is no longer recorded under the equity method, but rather at fair value. On September 30, 2017, the balance of this account amounted to R$489.3 million, R$470.7 million of which is related to Copel’s investment in Sanepar.
22 |
* Amountssubject to rounding.
|
Earnings Release 4Q17 |
In December 2017, the Company participated as a seller of the public offering for the secondary distribution of share deposit certificates ("Units"), each representing one common share and four preferred shares issued by Companhia de Saneamento do Paraná - SANEPAR, in accordance with the documents of the respective offer.
Copel's participation in the transaction included the sale of 8,859,914 Units, which represents all of its Units issued by Sanepar, of which 7,268,653 Units held by Copel Holding and 1,591,261 Units held by Copel Comercialização, at the price of R$55,20/Unit. As a result, the Company ceased to have an investment in Sanepar, and as of December 31, 2017, the balance of this account totaled R$18.7 million.
Sectorial Financial Assets and Liabilities
As of December 31, 2014, Copel Distribuição has recognized sectorial financial assets and/or liabilities in its financial statements as a result of an amendment to the concession agreement, that guarantees that the residual amounts of items of Portion A and other financial components not recovered or returned via tariffs will be included in, or discounted from, the calculation of the indemnification for non-amortized assets at the expiration of the concession. On December 31, 2017, the Company had a net asset of R$59.7 million. More detail in our Financial Statement (Note 9).
Accounts Receivable Related to the Concession
This line refers to accounts receivable related to the contracts for the concession of electric power generation, transmission, distribution and distribution of natural gas activities. The amounts refer to (a) the concession fee paid as a result of the auction involving the Governador Parigot de Souza Plant – HPP GPS, won by Copel GeT on November 25, 2015 (R$606.5 million), (b) its investments in infrastructure and financial remuneration that have not been or will not be recovered via tariffs and/or APR until the expiration of the concession (R$2,181.6 million), (c) the amounts receivable from energy transmission assets of the Existing System Basic Network – RBSE and connection facilities and other transmission facilities - RPC, as a result of the recognition of the effects of MME Ordinance No. 120 and the approval, by Aneel, of the result of the inspection of the appraisal report of these assets (R$1,418.4 million) and (d) the gas distribution concession agreement - Compagas (R$303.6 million).
Due to the publication of Complementary State Law 205/2017, which brought a new interpretation on the due date of Compagas concession (from July 06, 2024 to January 20, 2019), a transfer of R$160.0 million was made from the intangible to Accounts Receivable Related to the Concession. More details in our Financial Statement (Note 2.1.1).
23 |
* Amountssubject to rounding.
|
Earnings Release 4Q17 |
As of December 31, 2017, the balance of the account totaled R$4,510.1 million. More details in our Financial Statement (NE n ° 10).
Accounts Receivable related to the Concession Indemnification
This account refers to the residual value of the generation assets whose concession expired in 2015 (Rio dos Patos HPP, GPS HPP and Mourão I HPP). On December 31, 2017, the amount registered in this account was R$68.9 million. More details in Notes 11 to our Financial Statement.
Investments, Property, Plant and Equipment and Intangible Assets
"Investments" moved up 9.8% until December 31, 2017, due to equity in the earnings of subsidiaries and capital contributions recorded in the period. “Property, plant and equipment” increased 10.0%, due to the startup of new assets, in accordance with the Company's investment program, net of period depreciation. “Intangible assets” decreased by 0.1% due to the adjustment made as a result of the new interpretation on the maturity of the Compagas concession, partially offset by investments in new assets in the period.
24 |
* Amountssubject to rounding.
|
Earnings Release 4Q17 |
|
|
|
|
| R$'000 |
| Dec-17 | Sep-17 | Dec-16 | Var.% | Var.% |
Assets | (1) | (2) | (3) | (1/2) | (1/3) |
CURRENT | 5,701,834 | 6,180,714 | 4,237,241 | (7.7) | 34.6 |
Cash and cash equivalents | 1,040,075 | 1,305,400 | 982,073 | (20.3) | 5.9 |
Bonds and securities | 1,341 | 241,567 | 136,649 | (99.4) | (99.0) |
Collaterals and escrow accounts | 59,372 | 65,749 | 1,294 | (9.7) | - |
Customers | 2,733,240 | 2,653,868 | 2,217,355 | 3.0 | 23.3 |
Dividends receivable | 80,815 | 52,662 | 71,758 | 53.5 | 12.6 |
CRC transferred to the State of Paraná | 167,109 | 122,302 | - | 36.6 | - |
Sectorial financial assets | 171,609 | 64,908 | - | 164.4 | - |
Account receivable related to concession | 149,744 | 152,228 | 65,595 | (1.6) | 128.3 |
Other current receivables | 409,351 | 366,729 | 306,933 | 11.6 | 33.4 |
Inventories | 110,559 | 116,701 | 130,637 | (5.3) | (15.4) |
Income tax and social contribution | 501,685 | 762,758 | 188,952 | (34.2) | 165.5 |
Other current recoverable taxes | 198,232 | 204,380 | 67,931 | (3.0) | 191.8 |
Prepaid expenses | 39,867 | 34,194 | 39,096 | 16.6 | 2.0 |
Related parties | 38,835 | 37,268 | 28,968 | 4.2 | 34.1 |
NON-CURRENT | 27,479,813 | 27,526,470 | 26,070,929 | (0.2) | 5.4 |
Long Term Assets | 8,633,949 | 8,801,560 | 8,341,864 | (1.9) | 3.5 |
Bonds and securities | 244,645 | 165,414 | 223,928 | 47.9 | 9.3 |
Other temporary investments | 18,727 | 489,334 | 408,297 | (96.2) | (95.4) |
Collaterals and escrow accounts | 75,665 | 72,765 | 73,074 | 4.0 | 3.5 |
Customers | 261,082 | 270,450 | 270,786 | (3.5) | (3.6) |
CRC transferred to the State of Paraná | 1,349,253 | 1,369,471 | 1,522,735 | (1.5) | (11.4) |
Judicial deposits | 582,529 | 574,453 | 657,603 | 1.4 | (11.4) |
Sectoral financial assets | 171,609 | 194,725 | - | (11.9) | - |
Account receivable related to concession | 4,360,378 | 4,060,841 | 3,748,335 | 7.4 | 16.3 |
Accounts receivable related to the concession compensation | 68,859 | 68,182 | 67,401 | 1.0 | 2.2 |
Other non-current receivables | 149,416 | 102,835 | 73,551 | 45.3 | 103.1 |
Income tax and social contribution | 176,480 | 162,844 | 169,967 | 8.4 | 3.8 |
Deferred income tax and social contribution | 915,492 | 994,010 | 814,355 | (7.9) | 12.4 |
Other non-current recoverable taxes | 116,974 | 117,018 | 131,108 | - | (10.8) |
Prepaid expenses | 12,684 | 16,570 | 25,583 | (23.5) | (50.4) |
Related parties | 130,156 | 142,648 | 155,141 | (8.8) | (16.1) |
Investments | 2,563,590 | 2,500,985 | 2,334,950 | 2.5 | 9.8 |
Property, plant and equipment, net | 9,829,450 | 9,661,798 | 8,934,303 | 1.7 | 10.0 |
Intangible assets | 6,452,824 | 6,562,127 | 6,459,812 | (1.7) | (0.1) |
TOTAL | 33,181,647 | 33,707,184 | 30,308,170 | (1.6) | 9.5 |
25 |
* Amountssubject to rounding.
|
Earnings Release 4Q17 |
Gross Debt
Copel's total consolidated debt amounted to R$9,830.5 million on December 31, 2017, an increase of 11.2% compared to the R$8,837.1 million recorded in 2016, mainly due to the 6th issue of R$520.0 million in debentures from Copel Holding and the 2nd issue of R$220.0 million in debentures from Copel Telecomunicações.
On December 31, 2017, Copel’s gross debt represented 63.3% of consolidated shareholders’ equity, which at the end of the period was R$15,529.8 million, equivalent to R$56.75 per share (book value per share). The breakdown of the balance of loans, financing and debentures is shown in the table below:<0}
|
|
|
| R$'000 |
|
|
| Total | Composition |
|
|
|
| % |
Domestic Currency | Eletrobras - COPEL | 34,997 | 0.4 | |
FINEP | 16,337 | 0.2 | ||
BNDES | 1,576,660 | 16.0 | ||
Banco do Brasil S/A and other | 1,512,322 | 15.4 | ||
Debentures and Promissory Notes | 6,600,897 | 67.1 | ||
Total | 9,741,213 | 99.1 | ||
Foreign Currency | National Treasury | 89,270 | 0.9 | |
Total | 89,270 | 0.9 | ||
TOTAL |
|
| 9,830,483 | 100.0 |
Loans, financing and debentures maturities are presented below:
|
|
|
|
|
|
|
| R$'000 |
| Short Term |
|
| Long Term |
|
|
| Total |
| 2019 | 2020 | 2021 | 2022 | 2023 | From 2024 | ||
Domestic Currency | 2,415,943 | 3,192,751 | 1,103,102 | 759,627 | 1,003,861 | 204,403 | 1,061,526 | 9,741,213 |
Foreign Currency | 785 | - | - | - | - | - | 88,485 | 89,270 |
TOTAL | 2,416,728 | 3,192,751 | 1,103,102 | 759,627 | 1,003,861 | 204,403 | 1,150,011 | 9,830,483 |
Endorsements and Guarantees
At the end of December 31, 2017, the Company had R$1,538.1 million in guarantees and endorsements, as shown below.
26 |
* Amountssubject to rounding.
|
Earnings Release 4Q17 |
|
|
|
|
| R$'000 |
| Dec-17 | Sep-17 | Dec-16 | Var.% | Var.% |
Guarantees and Endorsements¹ | (1) | (3) | (3) | (1/2) | (1/3) |
Transmissora Sul Brasileira de Energia S.A. | - | 64,142 | 66,802 | - | - |
Caiuá Transmissora de Energia S.A. | 35,039 | 35,843 | 38,230 | (2.2) | (8.3) |
Integração Maranhense Transmissora de Energia S.A. | 57,328 | 58,797 | 63,171 | (2.5) | (9.2) |
Matrinchã Transmissora de Energia (TP NORTE) S.A. | 372,833 | 381,776 | 392,164 | (2.3) | (4.9) |
Guaraciaba Transmissora de Energia (TP SUL) S.A. | 206,502 | 191,133 | 190,343 | 8.0 | 8.5 |
Costa Oeste Transmissora de Energia S.A. | - | - | 15,573 | - | - |
Mata de Santa Genebra Transmissão S.A. | 352,652 | 272,768 | 244,998 | 29.3 | 43.9 |
Paranaíba Transmissora de Energia S.A. | 169,564 | 169,966 | 148,872 | (0.2) | 13.9 |
Marumbi Transmissora de Energia S.A. | - | - | 38,689 | - | - |
Cantareira Transmissora de Energia S.A. | 215,204 | 208,101 | 32,192 | 3.4 | 568.5 |
Voltalia São Miguel do Gostoso I Participações S.A. | 129,018 | 131,014 | 142,030 | (1.5) | (9.2) |
TOTAL | 1,538,140 | 1,513,540 | 1,373,064 | 1.6 | 12.0 |
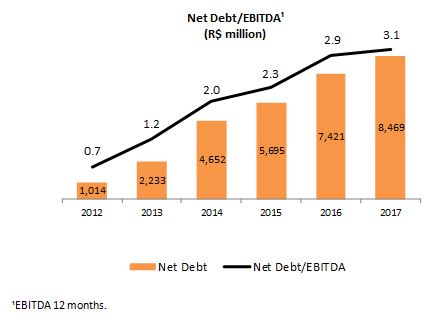
Copel’s consolidated net debt (loans, financing and debentures less cash and cash equivalents) and the net debt/EBITDA ratio are shown in the following chart:
Net Debt by Subsidiary
The following table shows the gross debt and net debt of the subsidiaries:
|
|
|
|
|
| R$'000 |
| GeT | DIS | Telecom | Holding | Other | Total |
Total debt | 4,872,871 | 1,712,991 | 416,518 | 2,201,593 | 626,510 | 9,830,483 |
Availability | 403,391 | 251,145 | 31,977 | 313,228 | 361,985 | 1,361,726 |
Net debt | 4,469,480 | 1,461,846 | 384,541 | 1,888,365 | 264,525 | 8,468,757 |
27 |
* Amountssubject to rounding.
|
Earnings Release 4Q17 |
Accounts Payables related to the Concession
Use of Public Property
It refers to the concession charges for the use of public property incurred since the execution of the project’s concession agreement until the end of the concession.
|
|
|
|
| R$'000 |
Mauá | Colíder | Baixo Iguaçu | SHP¹ | Elejor | Total |
16,384 | 23,188 | 6,977 | 845 | 507,560 | 554,954 |
¹Relative to SPP Cavernoso, Apucaraninha, Chaminé and Derivação do Rio Jordão. |
| ||||
Provisions for Legal Claims
The Company is involved in a series of lawsuits in different courts and instances. Copel’s management, based on its legal advisors’ opinion, maintains a provision for legal claims for those cases assessed as probable losses. The balances of provisions for legal claims are as follows:
|
|
|
|
| R$ '000 |
Probable Losses - Consolidated | Dec-17 | Sep-17 | Dec-16 | Var % | Var % |
(1) | (3) | (3) | (1/2) | (1/3) | |
Tax | 138,541 | 134,026 | 236,877 | 3.4 | (41.5) |
Labor suits | 475,631 | 449,167 | 458,901 | 5.9 | 3.6 |
Employees and Benefits | 89,438 | 57,073 | 42,366 | 56.7 | 111.1 |
Civil | 742,554 | 542,839 | 465,804 | 36.8 | 59.4 |
Civil and administrative claims | 527,613 | 344,772 | 295,484 | 53.0 | 78.6 |
Easements | 110,936 | 103,806 | 99,380 | 6.9 | 11.6 |
Condemnations and property | 95,627 | 87,648 | 65,712 | 9.1 | 45.5 |
Customers | 8,378 | 6,613 | 5,228 | 26.7 | 60.3 |
Environmental claims | 1,584 | 1,257 | 1,432 | 26.0 | 10.6 |
Regulatory | 64,316 | 67,211 | 67,958 | (4.3) | (5.4) |
TOTAL | 1,512,064 | 1,251,573 | 1,273,338 | 20.8 | 18.7 |
The lawsuits classified as possible losses, as estimated by the Company and its controlled companies at the end 2017, totaled R$3,113.3 million, 21.6% higher than in December 2016 (R$2,559.9 million), distributed in lawsuits of the following natures: fiscal (R$858.1 million), regulatory (R$793.4 million), civil (R$1,081.5 million), labor (R$360.1 million) and employee benefits (R$20.2 million).
28 |
* Amountssubject to rounding.
|
Earnings Release 4Q17 |
|
|
|
|
| R$'000 |
| Dec-17 | Sep-17 | Dec-16 | Var.% | Var.% |
Liabilities | (1) | (2) | (3) | (1/2) | (1/3) |
CURRENT | 6,109,914 | 7,666,236 | 5,656,036 | (20.3) | 8.0 |
Payroll, social charges and accruals | 313,967 | 320,065 | 287,797 | (1.9) | 9.1 |
Suppliers | 1,683,577 | 2,175,030 | 1,255,639 | (22.6) | 34.1 |
Income tax and social contribution payable | 86,310 | 245,134 | 41,454 | (64.8) | 108.2 |
Other taxes due | 345,487 | 375,903 | 294,994 | (8.1) | 17.1 |
Loans, financing and debentures | 2,416,728 | 3,277,407 | 2,601,940 | (26.3) | (7.1) |
Minimum compulsory dividend payable | 288,981 | 313,304 | 266,831 | (7.8) | 8.3 |
Post employment benefi ts | 53,225 | 47,572 | 47,894 | 11.9 | 11.1 |
Customer charges due | 150,025 | 143,468 | 141,712 | 4.6 | 5.9 |
Research and development and energy effi ciency | 282,766 | 269,755 | 231,513 | 4.8 | 22.1 |
Accounts Payable related to concession | 62,624 | 61,798 | 66,210 | 1.3 | (5.4) |
Net sectorial fi nancial liabilities | 192,819 | 293,130 | 155,261 | (34.2) | 24.2 |
Other accounts payable | 121,405 | 143,670 | 264,791 | (15.5) | (54.2) |
Provision for litigation | 112,000 | - | - | - | - |
NON-CURRENT | 11,541,960 | 10,172,706 | 9,654,722 | 13.5 | 19.5 |
Suppliers | 43,469 | 36,710 | 36,711 | 18.4 | 18.4 |
Deferred i ncome tax and s ocial contribution | 156,630 | 189,795 | 178,430 | (17.5) | (12.2) |
Other taxes due | 809,576 | 811,092 | 303,146 | (0.2) | 167.1 |
Loans, financing and debentures | 7,413,755 | 6,249,288 | 6,235,162 | 18.6 | 18.9 |
Post employment benefi ts | 812,878 | 758,617 | 721,971 | 7.2 | 12.6 |
Research and development and energy effi ciency | 249,709 | 244,784 | 252,376 | 2.0 | (1.1) |
Accounts Payable related to concession | 492,330 | 487,040 | 499,332 | 1.1 | (1.4) |
Net sectorial fi nancial liabilities | 90,700 | 89,131 | 123,731 | 1.8 | (26.7) |
Other accounts payable | 72,849 | 54,676 | 30,525 | 33.2 | 138.7 |
Tax, social security, labor and ci vil provisions | 1,400,064 | 1,251,573 | 1,273,338 | 11.9 | 10.0 |
EQUITY | 15,529,773 | 15,868,242 | 14,997,412 | (2.1) | 3.5 |
Attributed to controlling shareholders | 15,223,258 | 15,579,664 | 14,733,514 | (2.3) | 3.3 |
Share ca pital | 7,910,000 | 7,910,000 | 7,910,000 | - | - |
Equity valuation adjustments | 895,601 | 949,011 | 998,466 | (5.6) | (10.3) |
Legal reserves | 844,398 | 792,716 | 792,716 | 6.5 | 6.5 |
Retained earnings | 5,573,259 | 4,939,717 | 5,032,332 | 12.8 | 10.7 |
Accrued ea rnings | - | 988,220 | - | - | - |
Attributable to non-controlling interest | 306,515 | 288,578 | 263,898 | 6.2 | 16.1 |
TOTAL | 33,181,647 | 33,707,184 | 30,308,170 | (1.6) | 9.5 |
29 |
* Amountssubject to rounding.
|
Earnings Release 4Q17 |
Copel GeT reported a positive EBITDA of R$119.7 million in 4Q17 versus a negative EBITDA of R$100.5 million verified in 4Q16. It should be noted that the result of Copel GeT in 4Q16 was adversely impacted (a) by the negative equity result of R$445.4 million related to (i) the impairment of the Cutia Wind Complex and (ii) R$69.1 million of impairment and R$136.9 million related to the provision for investment devaluation made by UEG Araucária (adjustment made in 2017 with the restatement of the 2016 balances), and (b) R$110.6 million related Copel GeT’s impairment.
In relation to the EBITDA recorded in 4Q17, the amount calculated was mainly impacted by the higher cost of energy purchases (R$147.5 million in 4Q17 versus R$11.8 million in 4Q16), due to the lower GSF (69.3% in 4Q17 compared to 88.3% in 4Q16) and the recording of R$185.1 million in provisions and reversals.
The manageable costs, excluding estimated losses, provisions and reversals, and fees on water use and inspection, decreased by 0.2% and mainly reflect the lower costs with personnel and management, pension and healthcare plans and materials.
The “personnel” line had a 1.5% decrease and mainly reflects the lower balance of the indemnification provision concerning the Incentive Dismissal Plan. Up to December 31, 2017, 53 employees joined the incentive dismissal program and left the Company throughout the year. The adhesion of these employees to the program represented a cost of R$11.3 million in 2017, with a cost reduction perspective of R$15.5 million as of 2018.
Personnel and Management | 4Q17 | 4Q16 | Var. % | 2017 | 2016 | Var. % |
Pers onnel and Ma nagement | 107,694 | 109,329 | (1.5) | 318,438 | 302,139 | 5.4 |
(-) Provis ion for i ndemnification for voluntary dis mis sa l¹ | (8,582) | (10,965) | (39.0) | (13,661) | (16,601) | (39.3) |
TOTAL | 99,112 | 98,364 | 0.8 | 304,777 | 285,538 | 6.7 |
¹ Regarding the total of 66 employees who joined the PDI during the year 2017. |
|
|
| |||
Excluding the provisions with indemnities for the Incentive Dismissal Program, the costs with personnel and administrators increased by 0.8% (compared to 2.94% inflation of the last 12 months), reflecting the adjustment applied to salaries as of October 2017 and the organizational restructuring of Copel Renováveis as of September 2017, which resulted in the transfer of activities and of 56 employees to Copel GeT.
Manageable Costs | 4Q17 | 4Q16 | Var. % | 2017 | 2016 | Var. % |
Personnel a nd ma nagement | 107,694 | 109,329 | (1.5) | 318,438 | 302,139 | 5.4 |
Private pension a nd hea lthcare pla ns | 15,685 | 16,707 | (6.1) | 58,521 | 63,883 | (8.4) |
Materials | 3,625 | 3,890 | (6.8) | 16,129 | 16,803 | (4.0) |
Third pa rty services | 30,185 | 26,290 | 14.8 | 110,285 | 104,675 | 5.4 |
Other operating cos ts and expens es | 5,297 | 6,640 | (20.2) | 32,264 | 45,130 | (28.5) |
TOTAL | 162,486 | 162,856 | (0.2) | 535,637 | 532,630 | 0.6 |
30 |
* Amountssubject to rounding.
|
Earnings Release 4Q17 |
The following table presents the main indicators of Copel GeT.
|
|
|
|
|
|
| R$'000 |
| 4Q17 | 3Q17 | 4Q16 | Var.% | 2017 | 2016 | Var.% |
Main Indicators | (1) | (2) | (3) | (1/3) | (4) | (5) | (4/5) |
Net Operating Revenue (R$ million) | 824.4 | 729.3 | 876.1 | (5.9) | 3,409.9 | 3,935.3 | (13.4) |
Operating Costs and Expenses (R$ million) | (760.8) | (510.4) | (593.4) | 28.2 | (2,116.0) | (1,885.0) | 12.3 |
Operating Income (R$ million) | (49.9) | 196.0 | (271.2) | (81.6) | 892.6 | 1,258.0 | (29.0) |
Net Income (R$ million) | 84.3 | 164.9 | (226.3) | - | 739.0 | 822.4 | (10.1) |
EBITDA (R$ million) | 118.2 | 381.4 | (100.5) | - | 1,632.7 | 1,976.2 | (17.4) |
Operating Margin | - | 26.9% | - | - | 26.2% | 32.0% | (18.1) |
Net Margin | 10.2% | 22.6% | - | - | 21.7% | 20.9% | 3.7 |
EBITDA Margin | 14.3% | 52.3% | - | - | 47.9% | 50.2% | (4.7) |
Investment Program (R$ million) | 327.2 | 240.9 | 297.4 | 10.0 | 1,071.3 | 1,879.2 | (43.0) |
Excluding non-recurring events, Copel GeT’s EBITDA decrease 18.3%, totaling R$316.5million, mainly reflecting the higher cost of the electric energy purchased for resale (R$147.5 million in 4Q17 versus R$11.8 million in 4Q16) due to the lower GSF (69.3% in 4Q17 versus 88.3% in 4Q16).
The 4Q17 net profit was of R$84.3 million versus R$226.3 million in 4Q16.
|
|
|
|
|
| R$ million |
Adjusted EBITDA | 4Q17 | 4Q16 | Var.% | 2017 | 2016 | Var.% |
| (1) | (2) | (1/2) | (3) | (4) | (3/4) |
EBITDA | 118.2 | (100.5) | - | 1,632.7 | 1,976.2 | (17.4) |
(-)/+ Remeas urement of financial as s ets RBSE | - | (38.3) | - | (183.0) | (809.7) | - |
(-)/+ Provis ion for l itigation | 92.7 | - | - | 92.7 | - | - |
(-)/+ Copel GeT Impairment Tes t | 87.9 | 96.1 | (8.5) | 61.6 | 110.6 | (44.3) |
(-)/+ Araucária TPP Impairment Tes t (60%) | - | 41.5 | - | (41.5) | 41.5 | - |
(-)/+ Provision for devaluation of Araucária TPP Inves tment (60%) | 3.2 | 82.1 | (96.1) | 3.2 | 82.1 | (96.1) |
(-)/+ Wind Farm Impairment Test | 14.5 | 314.4 | - | (8.3) | 314.4 | - |
(-)/+ Remes uration of the Indemnifi cation of Generation Conces s ions | - | (8.1) | - | - | (8.1) | - |
Adjusted EBITDA | 316.5 | 387.2 | (18.3) | 1,557.5 | 1,707.0 | (8.8) |
In 2017, Copel GeT recorded an EBITDA of R$1,632.7 million, a 17.4% decrease when compared to the same period of the previous year, mainly reflecting the non-recurring events related to the recognition of the RBSE reameasurement, which improved the result by R$809.7 million in 2016, the record of R$92.7 million related to the provision for lawsuits and for the estimated losses with generation assets impairment, and R$361.2 million in energy purchased (R$60.8 million in 2016).
Excluding the aforementioned effects, Copel GeT’s adjusted EBITDA was of R$1,557.5 million in 2017, a 8.8% decrease when compared to the adjusted EBITDA of 2016.
31 |
* Amountssubject to rounding.
|
Earnings Release 4Q17 |
Copel Distribuição reported an EBITDA of R$110.9 million in 4Q17, a 13.4% increase over the R$97.8 million verified in 4Q16, mainly reflecting the average adjustment of 5.85% on the tariffs as of June 24, 2017, the 4.8% growth in the grid market of the distributor partially offset by the higher balances of provisions related mainly to labor and employment benefits matters (R$80.0 million in 4Q17 versus R$8.5 million in 4Q16).
The “result of sector financial assets and liabilities” account totaled R$381.1 million and corresponds the higher costs of electric energy purchased for resale, mainly due to the higher hydrological deficit (30.7% in 4Q17 versus 11.7% in 4Q16) and the average PLD (R$398.09/MWh in 4Q17 and R$162.82/MWh in 4Q16).
The manageable costs, excluding estimated losses, provisions and reversals, decreased by 6.5% and mainly reflect the lower costs with personnel and management, pension and healthcare plans and indemnities.
Manageable Costs | 4Q17 | 4Q16 | Var. % | 2017 | 2016 | Var. % |
Personnel and management | 267,143 | 285,618 | (6.5) | 822,963 | 804,974 | 2.2 |
Private pension and healthcare plans | 40,177 | 41,597 | (3.4) | 154,285 | 163,329 | (5.5) |
Materials | 18,731 | 12,954 | 44.6 | 60,320 | 59,178 | 1.9 |
Third party services | 89,069 | 82,446 | 8.0 | 347,393 | 348,479 | (0.3) |
Other operating costs and expenses | 32,390 | 56,219 | (42.4) | 157,921 | 167,035 | (5.5) |
TOTAL | 447,510 | 478,834 | (6.5) | 1,542,882.0 | 1,542,995 | - |
It should be noted that the costs with personnel and management decreased by 6.5%, mainly as a result of lower costs with compensation due to the salary policy applied as from October 2017, and the lower provision for indemnities is due to the Incentive Dismissal Plan. Up to December 31, 2017, there was a reduction of 276 employees in Copel Distribuição’s staff, of which 175 joined the incentive dismissal program and left the Company throughout 2017. The adhesion of these employees to the program represented a cost of R$23.5 million in 2017, with a cost reduction perspective of R$37.7 million as of 2018.
Personnel and Management | 4Q17 | 4Q16 | Var. % | 2017 | 2016 | Var. % |
Personnel and management | 267,143 | 285,618 | (6.5) | 822,963 | 804,974 | 2.2 |
(-) Provision for indemnifi cation for voluntary dismissal¹ | (12,215) | (16,604) | (3.4) | (29,188) | (25,556) | (5.5) |
TOTAL | 254,928 | 269,014 | (5.2) | 793,775 | 779,418 | 1.8 |
¹ Regarding the total of 171 employees who joined the PDI during the year 2017. |
|
| ||||
Disregarding the effect of the provision for indemnification related to the PDI, the costs with personnel decreased by 5.2% over 4Q16, corresponding to R$14.1 million, and totaled R$254.9 million in the year.
The net income 4Q17 was of R$85.8 million, 73.1% higher than the R$49.6 million year-over-year, mainly due to, in addition to the factors mentioned above, the lower financial expense related to debt charges.
32 |
* Amountssubject to rounding.
|
Earnings Release 4Q17 |
|
|
|
|
|
|
| R$'000 |
Main Indicators | 4Q17 | 3Q17 | 4Q16 | Var.% | 2017 | 2016 | Var.% |
Net Operating Revenue (R$ million) | 2,605.6 | 2,588.1 | 2,244.7 | 16.1 | 9,358.7 | 8,344.8 | 12.2 |
Operating Costs and Expenses (R$ million) | (2,566.0) | (2,525.3) | (2,215.9) | 15.8 | (9,071.4) | (8,502.4) | 6.7 |
Operating Income (R$ million) | 72.6 | 90.5 | 4.6 | 1,494.9 | 324.4 | (162.6) | - |
Net Income (R$ million) | 85.8 | 182.2 | 49.6 | 73.1 | 347.3 | (180.4) | - |
EBITDA (R$ million) | 110.9 | 134.1 | 97.8 | 13.4 | 573.1 | 116.6 | 391.7 |
Operating Margin | 2.8% | 3.5% | 0.2% | 1,274.1 | 3.5% | - | - |
Net Margin | 3.3% | 7.0% | 2.2% | 49.1 | 3.7% | - | - |
EBITDA Margin | 4.3% | 5.2% | 4.4% | (2.3) | 6.1% | 1.4% | 338.4 |
Investment Program (R$ million) | 192.4 | 155.0 | 224.4 | (14.3) | 630.4 | 777.1 | (18.9) |
In 2017, Copel Distribuição recorded an EBITDA of R$573.1 million, 5 times higher than 2016 (EBITDA of R$116.6 million). This performance was mainly affected by (i) the 3.4% increase in 2017 grid market, (ii) the average adjustment of 5.85% on the tariffs as of June 24, 2017, and (iii) the 15.81% reduction in provisions and reversals, mainly due to the lower balance of PECLD (R$83.9 million in 2017 versus R$171.0 million in 2016), partially offset by higher provisions related to lawsuits on benefits to employees.
Manageable costs, excluding estimated losses, provisions and reversals, were in line with 2016, totaling R$1,542.9 million, while personnel and management costs increased 2.2%, below the year’s inflation, mainly reflecting the policy of not replacing job vacancies.
Excluding the non-recurring effects of provisions and reversals and the record of PECLD above the tariff coverage, Copel Distribuição’s EBITDA would be of R$142.7 million in 4Q17, an 3.7% increase over the R$137.6 million in 4Q16. In 2017, EBITDA would be of R$636.5 million, 106.2% higher than in 2016 (R$308.8 million).
|
|
|
|
|
| R$ million |
| 4Q17 | 4Q16 | Var.% | 2017 | 2016 | Var.% |
Adjusted EBITDA | (1) | (2) | (1/2) | (3) | (4) | (3/4) |
EBITDA | 110.9 | 97.8 | 13.4 | 573.1 | 116.6 | 391.7 |
+/(-) Al l owa nce for doubtful a ccounts | 5.7 | 39.8 | (85.7) | 40.6 | 129.9 | (68.7) |
+ Provi s i on for l i ti ga ti on | 30.8 | - | - | 30.8 | 62.3 | - |
(-) Reve rs a l of l i ti ga ti on | (4.7) | - | - | (8.0) | - | - |
Adjusted EBITDA | 142.7 | 137.6 | 3.7 | 636.5 | 308.8 | 106.2 |
Copel Telecom reported an EBITDA of R$23.9 million in 4Q17, a 2.5% decrease when compared to R$24.5 million verified in 4Q16. This result reflects higher costs with third-party services and advertising and marketing, partially offset by 13.6% growth in telecom revenues, due to the expansion of the customer base.
The manageable costs, excluding estimated losses, provisions and reversals, increased by 13.5% in the period, mainly due to the increase in advertising costs (in line with other costs and operating expenses) and to the increase with third-party services, which are required to expand the area of operations, partially offset by the reduction in the “personnel” and “private pension and healthcare plans” line.
33 |
* Amountssubject to rounding.
|
Earnings Release 4Q17 |
Tel |
|
|
|
|
|
|
Manageable Costs | 4Q17 | 4Q16 | Var. % | 2017 | 2016 | Var. % |
Personnel a nd management | 34,047 | 35,332 | (3.6) | 107,874 | 101,397 | 6.4 |
Private pension and healthcare plans | 3,961 | 4,791 | (17.3) | 14,800 | 18,827 | (21.4) |
Materials | 1,152 | 660 | 74.5 | 2,978 | 2,044 | 45.7 |
Third party services | 18,807 | 13,772 | 36.6 | 67,612 | 46,552 | 45.2 |
Other operating costs a nd expenses | 15,041 | 9,774 | 53.9 | 41,589 | 31,132 | 33.6 |
TOTAL | 73,008 | 64,329 | 13.5 | 234,853 | 199,952 | 17.5 |
It should be noted that the costs with personnel and administrators decreased by 3.6% in 4Q17, mainly due to the salary policy applied as from October 2017 and the reduction of the staff resulting from the Incentive Dismissal Plan. Throughout 2017, 25 employees left the company, totaling an indemnity cost of R$2.9 million with a cost reduction perspective of R$3.7 millions.
Personnel and Management | 4Q17 | 4Q16 | Var. % | 2017 | 2016 | Var. % | ||||
Personnel a nd management | 34,047 | 35,332 | (3.6) | 107,874 | 101,397 | 6.4 | ||||
(-) Provision for indemnificati on for vol untary dismi ssal¹ | (2,057) | (981) | (17.3) | (5,813) | (2,036) | (21.4) | ||||
TOTAL | 31,990 | 34,351 | (6.9) | 102,061 | 99,361 | 2.7 | ||||
¹ Regarding the total of 27 employees who joined the PDI during the year 2017. |
|
| ||||||||
Disregarding the effect of the provision for indemnification related to the PDI, the costs with personnel decreased by 6.9% over 4Q16.
|
|
|
|
|
|
| R$'000 |
| 4Q17 | 3Q17 | 4Q16 | Var.% | 2017 | 2016 | Var.% |
Main Indicators | (1) | (2) | (3) | (1/3) | (4) | (5) | (4/5) |
Net Operating Revenue (R$ million) | 100.3 | 99.4 | 88.3 | 13.6 | 380.6 | 325.1 | 17.1 |
Operating Costs and Expenses (R$ million) | (87.2) | (67.7) | (72.9) | 19.5 | (286.4) | (241.8) | 18.4 |
Operating Income (R$ million) | 6.7 | 28.2 | 16.1 | (58.7) | 75.3 | 73.7 | 2.3 |
Net Income (R$ million) | 8.1 | 18.8 | 19.7 | (58.8) | 54.1 | 58.3 | (7.3) |
EBITDA (R$ million) | 23.9 | 41.5 | 24.5 | (2.5) | 133.7 | 117.9 | 13.4 |
Operating Margin | 6.7% | 28.3% | 18.3% | (63.6) | 19.8% | 22.7% | (12.6) |
Net Margin | 8.1% | 18.9% | 22.3% | (63.7) | 14.2% | 17.9% | (20.8) |
EBITDA Margin | 23.9% | 41.7% | 27.8% | (14.1) | 35.1% | 36.3% | (3.1) |
Investment Program (R$ million) | 62.6 | 75.5 | 44.9 | 39.4 | 241.1 | 193.8 | 24.4 |
The net profit totaled R$8.1 million, down 58.8% versus R$19.7 million in 4Q16, reflecting the higher cost with debt charges due to the higher balance of debentures.
In 2017, Copel Telecom’s EBITDA reached R$133.7 million, a 13.4% decrease over 2016 performance, while the net profit decrease 7.3%, totaling R$54.1 million.
In 4Q17, UEG Araucária reported net revenue of R$128.0 million, reflecting the generation of 195.2 GWh in the period. The operating costs and expenses totaled R$115.8 million, up 1.6% on those recorded in 4Q16, mainly reflecting higher expenses with materials and suplies for power electricity, while in 4Q16 was recorded R$69.1 million in impairment and R$28.4 million in costs of third-party services related to the maintenance of the plant.As a result, UEG Araucária recorded EBITDA of R$18.2 million and loss of R$8.5 million in 4Q17. In the year to date, UEG Araucária recorded R$31.1 million of EBITDA and a loss of R$0.4 million.
34 |
* Amountssubject to rounding.
|
Earnings Release 4Q17 |
| 4Q17 | 3Q17 | 4Q16 | Var.% | 2017 | 2016 | Var.% |
Main Indicators | (1) | (2) | (3) | (1/3) | (4) | (5) | (4/5) |
Net Operating Revenue (R$ million) | 128.0 | 1.1 | - | - | 129.1 | 57.4 | (91.0) |
Operating Costs and Expenses (R$ million) | (115.8) | 42.9 | (114.0) | 1.6 | (121.9) | (259.3) | (89.1) |
Operating Income (R$ million) | 17.8 | 35.9 | (257.5) | - | 6.7 - | 323.4 | - |
Net Income (R$ million) | (8.5) | 55.2 | (211.2) | (96.0) | (0.4) - | 277.0 | - |
EBITDA (R$ million) | 18.2 | 50.0 | (108.1) | - | 31.1 - | 178.4 | - |
Operating Margin | 13.9% | - | - | - | 5.2% | - | - |
Net Margin | - | - | - | - | - | - | - |
EBITDA Margin | 14.2% | - | - | - | 24.1% | - | - |
It should be noted that on December 31, 2017 an adjustment was made to the balances of the result presented by UEG Araucária in 2016, related to the provision registration in the amount of R$136.9 million for devaluation of investment held in Multimarket Investment Fund, on the date basis of December 31, 2016. More details seeitem 1.
Accounting information concerning Copel’s interests in other companies in 2017 is shown in the following table:
|
|
|
| R$'000 |
|
|
|
|
|
| Total Assets | Shareholders' | Net Oper. | Net Income |
Partnerships - Dec-17 | Equity | Revenues | ||
Parent Company (Consolidated) |
|
|
|
|
Companhia Paranaense de Gás - Compagás | 632,910 | 397,758 | 515,563 | 113,953 |
Elejor - Centrais Elétricas do Rio Jordão S.A. | 675,450 | 61,727 | 291,597 | 96,220 |
UEG Araucária Ltda | 526,330 | 465,474 | 129,084 | (7,861) |
Jointly-controlled entities (Equity in earning) |
|
|
|
|
Costa Oeste Transmissora de Energia S.A. | 99,028 | 65,972 | 11,837 | (5,032) |
Caiuá Transmissora de Energia S.A. | 230,743 | 114,361 | (2,904) | (8,207) |
Cantareira Transmissora S.A | 952,670 | 408,200 | 392,766 | 7,917 |
Guaraciaba Transmissora de Energia (TP Sul) S.A. | 1,428,247 | 853,716 | 208,444 | 51,791 |
Integração Maranhense Transmissora de Energia S.A. | 466,783 | 231,430 | (14,460) | (18,066) |
Marumbi Transmissora de Energia S.A. | 162,155 | 106,677 | 19,498 | (11,921) |
Mata de Santa Genebra Transmissão S.A. | 1,722,063 | 916,914 | 588,123 | 38,877 |
Matrinchã Transmissora de Energia (TP Norte) S.A. | 2,774,973 | 1,705,752 | 403,891 | 117,092 |
Paranaíba Transmissora de Energia S.A. | 1,698,213 | 662,342 | 320,302 | 69,469 |
Transmissora Sul Brasileira de Energia S.A. | 659,464 | 321,801 | 53,374 | (25,042) |
Voltalia São Miguel do Gostoso I Participações S.A. | 155,272 | 153,058 | - | (1,152) |
Associates (Equity in erarning) |
|
|
|
|
Dona Francisca Energética S.A. | 138,079 | 129,492 | 70,716 | 38,540 |
Foz do Chopim Energética Ltda | 61,163 | 36,579 | 40,441 | 18,579 |
35 |
* Amountssubject to rounding.
|
Earnings Release 4Q17 |
The following chart shows the investment program carried in 2017 and schedule 2018:
|
|
| R$ million |
| Carried | Carried | Scheduled |
Subsidiary / SPC | 4Q17 | 2017 | 20181 |
Copel Geração e Transmissão | 327.2 | 1,071.3 | 743.6 |
HPP Colíder | 46.2 | 159.6 | 98.7 |
HPP Baixo Iguaçu1 | 55.5 | 249.7 | 71.7 |
TL Araraquara / Taubaté | 34.8 | 141.0 | 40.4 |
TL Foz do Chopim - Realeza | - | 3.1 | - |
TL Assis - Londrina | - | 28.5 | - |
TL Curitiba Leste / Blumenau | 32.9 | 47.9 | 281.8 |
Mata de Santa Genebra Transmissão2 | 34.1 | 210.9 | - |
Cantareira Transmissora2 | 12.3 | 35.2 | 14.8 |
Paranaíba Transmissora2 | - | 2.1 | - |
Bateias Substation | - |
| 17.5 |
Others | 111.5 | 193.3 | 218.7 |
Copel Distribuição | 192.4 | 630.4 | 790.0 |
Copel Telecomunicações | 62.6 | 241.1 | 340.2 |
Copel Comercialização | - | - | 0.2 |
Copel Renováveis | - | - | - |
Holding | - | - | 2.4 |
Cutia Wind Farm Complex | 160.0 | 566.0 | 888.5 |
Copel Brisa Potiguar | - |
| 156.3 |
São Bento Energia | - |
| 6.6 |
Other Invesment3 | - | - | 0.8 |
TOTAL | 742.2 | 2,508.8 | 2,928.6 |
Copel Distribuição’s captive market energy sales totaled 4,865 GWh in the 4Q17, which represents a reduction of 6.5%. This result was influenced by the reduction in consumption of industrial and commercial classes, mainly due to the migration of customers to the free market.
The following table shows captive market trends by consumption segment:
| Number of Customers | Energy sold (GWh) | ||||||||
| Dec-17 | Dec-16 | Var. % | 4Q17 | 4Q16 | Var. % | 2017 | 2016 | Var. % | |
Residential | 3,682,009 | 3,597,105 | 2.4 | 1,784 | 1,724 | 3.5 | 7,126 | 6,932 | 2.8 | |
Industrial | 76,328 | 82,021 | (6.9) | 756 | 1,149 | (34.2) | 3,254 | 5,753 | (43.4) | |
Commercial | 389,844 | 382,121 | 2.0 | 1,143 | 1,197 | (4.5) | 4,651 | 5,059 | (8.1) | |
Rural | 354,829 | 360,066 | (1.5) | 556 | 526 | 5.7 | 2,257 | 2,180 | 3.5 | |
Other | 57,483 | 57,454 | 0.1 | 626 | 608 | 3.0 | 2,455 | 2,404 | 2.1 | |
Captive Market | 4,560,493 | 4,478,767 | 1.8 | 4,865 | 5,204 | (6.5) | 19,743 | 22,328 | (11.6) | |
For more details visit the Notice to the Market - IR 04/18 (link).
36 |
* Amountssubject to rounding.
|
Earnings Release 4Q17 |
Copel Distribuição’s grid market, comprising the captive market, concessionaires and licensees in the state of Paraná, and all free consumers in the Company’s concession area, presented an increase of 4.8% in 4Q17, as shown in the following table:
| Number of Customers / Agreements | Energy Sold (GWh) | ||||||||
| Dec-17 | Dec-16 | Var. % | 4Q17 | 4Q16 | Var. % | 2017 | 2016 | Var. % | |
Captive Market | 4,560,493 | 4,478,767 | 1.8 | 4,865 | 5,204 | (6.5) | 19,743 | 22,328 | (11.6) | |
Concessionaries and Licensees | 6 | 6 | - | 160 | 141 | 13.3 | 599 | 665 | (10.0) | |
Free Customers ¹ | 991 | 620 | 59.8 | 2,352 | 1,694 | 38.8 | 8,873 | 5,274 | 68.2 | |
Grid Market | 4,561,490 | 4,479,393 | 1.8 | 7,377 | 7,039 | 4.8 | 29,215 | 28,267 | 3.4 | |
The result was mainly due to the 5.4% increase in the total consumption of the industrial class in 4Q17, as a result of the improvement in industrial production in the state of Paraná, which closed 2017 with a growth of 4.4% compared to 2016. The sectors that contributed most to the increase in energy consumption were: food manufacturing, pulp and papermaking and manufacturing of wood products.
Electricity sales to final customers, comprising Copel Distribuição’s sales in the captive market and Copel Geração e Transmissão and Copel Comercialização sales in the free market, fell by 2.0% between October and December 2017.
The table below breaks down energy sales by consumption segment:
Segment | Market | Energy Sold (GWh) | |||||
4Q17 | 4Q16 | Var. % | 2017 | 2016 | Var. % | ||
Residential |
| 1,784 | 1,724 | 3.5 | 7,126 | 6,932 | 2.8 |
| Total | 1,957 | 2,195 | (10.9) | 7,689 | 9,574 | (19.7) |
Industrial | Captive | 756 | 1,149 | (34.2) | 3,254 | 5,753 | (43.4) |
| Free | 1,201 | 1,046 | 14.8 | 4,435 | 3,821 | 16.1 |
| Total | 1,201 | 1,197 | 0.3 | 4,847 | 5,061 | (4.2) |
Commercial | Captive | 1,143 | 1,197 | (4.5) | 4,651 | 5,059 | (8.1) |
| Free | 58 | - | - | 196 | 2 | - |
Rural |
| 556 | 526 | 5.7 | 2,257 | 2,180 | 3.5 |
Other |
| 626 | 608 | 3.0 | 2,455 | 2,404 | 2.1 |
Energy Supply |
| 6,124 | 6,250 | (2.0) | 24,374 | 26,151 | (6.8) |
37 |
* Amountssubject to rounding.
|
Earnings Release 4Q17 |
Total energy sold by Copel in all markets, comprising the sales of Copel Distribuição, Copel Geração e Transmissão, the Wind Farm Complexes and Copel Comercialização, came to 11,309 GWh in 4Q17, representing a increase of 2.7%.
The following table shows Copel’s total electricity sales broken down between Copel Distribuição, Copel Geração e Transmissão, Wind Farm Complexes and Copel Comercialização:
| Number of Customers /Agreements | Energy Sold (GWh) | ||||||||
| ||||||||||
| Dec-17 | Dec-16 | Var. % | 4Q17 | 4Q16 | Var. % | 2017 | 2016 | Var. % | |
Copel DIS |
|
|
|
|
|
|
|
|
| |
Captive Market | 4,560,493 | 4,478,767 | 1.8 | 4,865 | 5,205 | (6.5) | 19,743 | 22,328 | (11.6) | |
Concessionaries and Licensees | 3 | 4 | (25.0) | 130 | 130 | - | 521 | 614 | (15.1) | |
CCEE (MCP) | - | - | - | 27 | 1,359 | (98.0) | 1,530 | 3,611 | (57.6) | |
Total Copel DIS | 4,560,496 | 4,478,771 | 1.8 | 5,022 | 6,694 | (25.0) | 21,794 | 26,553 | (17.9) | |
Copel GeT |
|
|
|
|
|
|
|
|
| |
CCEAR (Copel DIS) | 1 | 1 | - | 24 | 42 | (42.9) | 87 | 158 | (45.0) | |
CCEAR (other concessionaries) | 27 | 39 | (30.8) | 218 | 672 | (67.6) | 837 | 3,347 | (75.0) | |
Free Customers | 52 | 40 | 30.0 | 1,001 | 1,046 | (4.3) | 3,861 | 3,823 | 1.0 | |
Bilateral Agreements ¹ | 37 | 30 | 23.3 | 2,248 | 1,886 | 19.2 | 8,504 | 7,682 | 10.7 | |
CCEE (MCP) ² | - | - | - | 1,307 | 367 | 256.1 | 4,656 | 1,762 | 164.2 | |
Total Copel GeT | 117 | 110 | 6.4 | 4,798 | 4,013 | 19.6 | 17,945 | 16,772 | 7.0 | |
Wind Farms Complex |
|
|
|
|
|
|
|
|
| |
CCEAR (other concessionaries) | 112 | 112 | - | 213 | 212 | 0.5 | 840 | 842 | (0.2) | |
CER | 3 | 3 | - | 90 | 90 | - | 357 | 358 | (0.3) | |
Total Wind Farm Complex | 115 | 115 | - | 303 | 302 | 0.3 | 1,197 | 1,200 | (0.2) | |
Copel Comercialização |
|
|
|
|
|
|
|
|
| |
Free Customers | 139 | - | - | 258 | - | - | 771 | - | - | |
Bilateral Agreements | 53 | - | - | 920 | - | - | 1,882 | - | - | |
CCEE (MCP) ² | - | - | - | 8 | - | - | 18 | - | - | |
Total Copel Comercialização | 192 | - | - | 1,186 | - | - | 2,671 | - | - | |
Total Copel Consolidated | 4,560,920 | 4,478,996 | 1.8 | 11,309 | 11,009 | 2.7 | 43,607 | 44,525 | (2.1) | |
Note: Not considering the energy from MRE (Energy Relocation Mechanism). |
|
|
|
|
| |||||
¹ Includes Short Term Sales Agreements. |
|
|
|
|
|
|
|
| ||
² Ass ured Power allocated in the period, does not cons ider the impact of the GSF. |
|
|
|
| ||||||
CCEE: Electric Power Trade Chamber / CCEAR: Energy Purchase Agreements i n the Regulated Market / MCP: Short Term Market / CER: Agreements Res erve Energy. | ||||||||||
In addition, in November 2017 the TPP Araucária was activated by the Operador Nacional do Sistema - ONS, and generated power energy for two weeks, totaling 195.2 GWh, while in 2016 the plant was not activated.
38 |
* Amountssubject to rounding.
1 This item presents a balance different from what was published in the Notice to the Market 04/18, as a result of CCEE recontabilisations of the new Energy MCSD, which impacted Copel Dis's MCP line in 2017
|
Earnings Release 4Q17 |
Energy Flow – Copel Dis
|
|
| GWh |
Energy Flow - Copel Dis | 2017 | 2016 | Var. % |
Itaipu | 5,934 | 5,958 | (0.4) |
CCEAR – Copel Geração e Transmissão | 87 | 157 | (44.6) |
CCEAR – Other | 9,860 | 13,387 | (26.3) |
CCEE (MCP) | 215 | - | - |
Angra | 1,023 | 1,026 | (0.3) |
CCGF | 7,271 | 7,553 | (3.7) |
Proinfa | 514 | 593 | (13.3) |
Elejor S.A | 1,186 | 1,189 | (0.3) |
Available Power | 26,090 | 29,863 | (12.6) |
Captive market | 19,743 | 22,328 | (11.6) |
Concessionaries¹ | 402 | 614 | (34.5) |
Electricity sales to distributor CCEE² | 142 | - | - |
Assigments - Mechanism for Compensation of Surpluses and Deficits (MCSD) EN³ | 980 | - | - |
CCEE (MCP) | 1,530 | 3,611 | (57.6) |
Losses and differences | 3,293 | 3,310 | (0.5) |
Basic network losses | 455 | 484 | (6.0) |
Distribution losses | 2,505 | 2,510 | (0.2) |
CG contract allocation | 333 | 316 | 5.4 |
1Eletricity sales to concessionaries with own market of less than 500GWh / year |
|
| |
2Eletricity sales to the agent distributor of CCEE through a Regulated Bilateral Contract - CBR |
| ||
3Assignments MCSD EN - Contractual assignments to other distributors through the Mechanism for Compensation of Surpluses and Deficits (MCSD) | |||
Energy Flow – Copel GeT
|
|
| GWh |
Energy Flow - Copel GeT | 2017 | 2016 | Var. % |
Own Generation | 19,867 | 25,850 | (23.1) |
MRE | 1,272 | - | - |
Dona Francisca | 1,055 | 141 | 648.2 |
Total Available Power | 22,194 | 25,991 | (14.6) |
Bilateral Agreements | 8,504 | 7,682 | 10.7 |
CCEAR – COPEL Distribuição | 87 | 157 | (44.6) |
CCEAR – Other | 837 | 3,348 | (75.0) |
Free Customers | 3,861 | 3,823 | 1.0 |
CCEE (MCP) | 4,656 | 1,762 | 164.2 |
MRE | 3,754 | 8,575 | (56.2) |
Losses and differences | 495 | 644 | (23.1) |
39 |
* Amountssubject to rounding.
|
Earnings Release 4Q17 |
Energy Flow – Wind Farms
|
|
| GWh |
Energy Flow - São Bento Energia | 2017 | 2016 | Var. % |
Own Generation | 306 | 437 | (30.0) |
Total Available Power | 306 | 437 | (30.0) |
CCEAR – Other | 383 | 382 | 0.3 |
Losses and differences | (77) | 55 | - |
|
|
|
|
|
|
| GWh |
Energy Flow - Brisa Potiguar | 2017 | 2016 | Var. % |
Own Generation | 718 | 781 | (8.1) |
Total Available Power | 718 | 781 | (8.1) |
CCEAR – Other | 457 | 459 | (0.4) |
CER | 357 | 358 | (0.3) |
Losses and differences | (96) | (36) | 166.7 |
Energy Flow – Copel Comercialização
|
|
| GWh |
Energy Flow - Copel Com | 2017 | 2016 | Var. % |
Own Generation | 2,671 | - | - |
Total Available Power | 2,671 | - | - |
Free Customers | 771 | - | - |
Bilateral Agreements | 1,882 | - | - |
CCEE (MCP) | 18 | - | - |
40 |
* Amountssubject to rounding.
|
Earnings Release 4Q17 |
Consolidated Energy Flow (Jan to Dec 17)

Sales to Distributors Average Tariff (CCEARs) – Copel Geração e Transmissão
|
|
|
|
|
| R$ / MWh |
| Amount | Dec-17 | Sep-17 | Dec-16 | Var. % | Var. % |
Tariff |
|
|
|
|
|
|
| Average MW | (2) | (2) | (3) | (1/2) | (1/3) |
Copel Geração e Transmissão | 108 | 211.76 | 211.03 | 187.18 | 0.3 | 13.1 |
Auction CCEAR 2009 - 2016 | - | - | - | 178.38 | - | - |
Auction CCEAR 2011 - 2040 ( HPP Mauá) | 100 | 210.36 | 209.78 | 203.71 | 0.3 | 3.3 |
Auction CCEAR 2013 - 2042 (Cavernoso II) | 8 | 229.30 | 225.81 | 222.65 | 1.5 | 3.0 |
Auction - CCEAR 2015 - 2044 (UHE Colíder) | - | 160.72 | 160.08 | 142.47 | 0.4 | 12.8 |
Copel Distribuição |
|
|
|
|
|
|
Concession holders in the State of Paraná | 59 | 239.43 | 236.16 | 215.32 | 1.4 | 11.2 |
Total / Tariff Weighted Average Supply | 167 | 221.54 | 220.37 | 192.05 | 0.5 | 15.4 |
With PIS/COFINS. Net of ICMS. |
|
|
|
|
|
|
Power Purchase Average Tariff – Copel Distribuição |
|
|
|
|
| |
Power Purchase Average Tariff – Copel Distribuição
41 |
* Amountssubject to rounding.
|
Earnings Release 4Q17 |
|
|
|
|
|
| R$ / MWh |
| Amount | Dec-17 | Sep-17 | Dec-16 | Var. % | Var. % |
Tariff* | Average MW | (1) | (2) | (3) | (1/2) | (1/3) |
Itaipu1 | 639.0 | 195.04 | 209.76 | 164.90 | (7.0) | 18.3 |
Auction – CCEAR 2010 – H30 | 71.9 | 201.94 | 218.27 | 209.98 | (7.5) | (3.8) |
Auction – CCEAR 2010 – T152 | 54.0 | 157.61 | 273.39 | 143.08 | (42.3) | 10.2 |
Auction – CCEAR 2011 – H30 | 59.1 | 225.50 | 225.62 | 217.72 | (0.1) | 3.6 |
Auction – CCEAR 2011 – T152 | 54.2 | 200.84 | 356.45 | 180.47 | (43.7) | 11.3 |
Auction – CCEAR 2012 – T152 | 115.4 | 285.74 | 304.55 | 233.91 | (6.2) | 22.2 |
Auction – CCEAR 2014 - 2019 ³ | 109.0 | 144.49 | 365.41 | 139.64 | (60.5) | 3.5 |
Auction – CCEAR 2014 - 20194 | 15.3 | 333.19 | 333.19 | 320.12 | - | 4.1 |
Auction 2014 - 36M | - | - | - | 176.64 | - | - |
Auction 2016 - T20² | 14.0 | 162.01 | 163.55 | 151.83 | (0.9) | 6.7 |
Angra | 116.6 | 222.30 | 229.71 | 197.79 | - 3.2 | 12.4 |
CCGF5 | 811.2 | 69.04 | 64.39 | 66.57 | 7.2 | 3.7 |
Santo Antônio | 103.6 | 139.84 | 139.84 | 134.99 | - | 3.6 |
Jirau | 37.0 | 123.00 | 123.00 | 118.73 | - | 3.6 |
Others Auctions6 | 342.0 | 224.22 | 249.51 | 213.11 | (10.1) | 5.2 |
Bilaterals | 135.4 | 240.53 | 240.53 | 232.69 | - | 3.4 |
Total / Tariff Average Supply | 2,677.8 | 163.64 | 184.88 | 156.88 | (11.5) | 4.3 |
1Furnas transport charge not included. 6Products average price, without PROINFA. With PIS/COFINS. |
Sales to Final Customers Average Tariff Copel Distribuição
|
|
|
|
| R$ / MWh |
| Dec-17 | Sep-17 | Dec-16 | Var. % | Var. % |
Tariff¹ | (1) | (2) | (3) | (1/2) | (1/3) |
Industrial | 406.04 | 408.44 | 373.80 | (0.6) | 8.6 |
Residential | 440.53 | 440.54 | 421.43 | - | 4.5 |
Commercial | 436.37 | 440.25 | 408.16 | (0.9) | 6.9 |
Rural | 297.60 | 298.48 | 284.51 | (0.3) | 4.6 |
Other | 324.42 | 324.98 | 308.18 | (0.2) | 5.3 |
Retail distribution average rate | 403.17 | 404.99 | 380.27 | (0.4) | 6.0 |
¹ Does not consider tariff flags. Net of ICMS. | |||||
42 |
* Amountssubject to rounding.
|
Earnings Release 4Q17 |
Copel’s capital amounts to R$7,910.0 million, represented by shares with no par value. The Company's current number of shareholders is 27,808. In December 2017 the Company’s capital was as follows:
|
|
|
|
|
|
| Thousand shares | |
Shareholders | Common | % | Preferred "A" | % | Preferred "B" | % | TOTAL | % |
State of Paraná | 85,029 | 58.6 | - | - | - | - | 85,029 | 31.0 |
BNDESPAR | 38,299 | 26.4 | - | - | 27,282 | 21.3 | 65,581 | 24.0 |
Eletrobras | 1,531 | 1.1 | - | - | - | - | 1,531 | 0.6 |
Free Floating | 19,836 | 13.7 | 77 | 23.4 | 100,965 | 78.7 | 120,878 | 44.2 |
B3 | 18,692 | 12.9 | 77 | 23.4 | 68,879 | 53.7 | 87,648 | 32.0 |
NYSE | 1,144 | 0.8 | - | - | 31,958 | 24.9 | 33,102 | 12.1 |
LATIBEX | - | - | - | - | 128 | 0.1 | 128 | 0.1 |
Other | 336 | 0.2 | 252 | 76.6 | 49 | - | 636 | 0.2 |
TOTAL | 145,031 | 100.0 | 329 | 100.0 | 128,296 | 100.0 | 273,655 | 100.0 |
43 |
* Amountssubject to rounding.
|
Earnings Release 4Q17 |
|
| Common |
| Preferred "B" | |
Stock Performance (Jan - Sep/17) | (CPLE3 / ELPVY) | (CPLE6 / ELP / XCOP) | |||
|
| Total | Daily average | Total | Daily average |
B3 | Number of Trades | 55,357 | 225 | 932,069 | 3,789 |
Volume Traded | 16,576,500 | 67,384 | 192,357,800 | 781,942 | |
Trading Value (R$ thousand) | 366,631 | 1,490 | 5,551,491 | 22,567 | |
Presence in Trading Sessions | 246 | 100% | 246 | 100% | |
| Volume Traded | 321,743 | 1,797 | 128,316,176 | 511,220 |
NYSE | Trading Value (US$ thousand) | 2,110 | 12 | 1,118,770 | 4,457 |
| Presence in Trading Sessions | 179 | 71% | 251 | 100% |
| Volume Traded | - | - | 1,515,580 | 12,736 |
LATIBEX | Trading Value (Euro thousand) | - | - | 496 | 4 |
| Presence in Trading Sessions | - | - | 119 | 46% |
From January to December 2017, Copel’s common shares (ON - CPLE3) and class B preferred shares (PNB - CPLE6) were traded in 100% of the trading sessions of the B3 S.A. - Brasil, Bolsa, Balcão (B3).
The free float accounted for 45.0% of the Company’s capital. At the end of December 2017, the market value of Copel considering the prices of all markets was R$6,321.5 million.
Out of the 59 stocks that make up the Ibovespa index, Copel’s class B preferred shares accounted for 0.204% of the portfolio, with a Beta index of 1.251.
Copel also accounted for 4.8% of the B3’s Electric Power Index (IEE). In the Corporate Sustainability Index (ISE), Copel class B preferred shares accounted for 0.7%.
On the B3, Copel’s common closed the period at R$21.40, with a positive variation of 12.2% and class B preferred shares closed the period at R$24.95, with a negative variation of 8.8%. In the same period the Ibovespa had positive change of 26.9%.
On the New York Stock Exchange (NYSE), class B preferred shares, represented by American Depositary Shares (ADSs), were traded at Level 3, under the ticker ELP, in 100% of the trading sessions and closed the period at US$7.63, with a negative variation of 10.0%. Over this period, the Dow Jones Index positive by 25.1%.
On the Latibex (the Euro market for Latin American securities on the Madrid Stock Exchange), Copel’s class B preferred shares were traded under the ticker XCOP in 46% of the trading sessions and closed the period at €6.29, with a negative variation of 22.2%. In the same period the Latibex All Shares index had positive growth of 9.0%.
44 |
* Amountssubject to rounding.
|
Earnings Release 4Q17 |
The table below summarizes Copel’s share prices in 2017.
| Ticker / Index | Price / Points | Var. (%) | |
| 12.31.2017 | 12.31.2016 | ||
| CPLE3 | R$ 21.40 | R$ 19.08 | 12.2 |
B3 | CPLE6 | R$ 24.95 | R$ 27.36 | (8.8) |
| Ibovespa | 76,402 | 60,227 | 26.9 |
NYSE | ELP | US$ 7.63 | US$ 8.48 | (10.0) |
Dow Jones | 24,719 | 19,763 | 25.1 | |
LATIBEX | XCOP | € 6.29 | € 8.08 | (22.2) |
Latibex | 1,974 | 1,812 | 9.0 | |
The table below presents the payments of dividends and interest on own capital as of 2011:
|
|
|
| Thousands of R$ |
| R$ per Share |
|
Type of Earning | Fiscal Year | Approved on | Paid on | (gross) | Common | Preferred "A" | Preferred "B" |
Total | 2011 |
|
| 421,091 | 1.46833 | 2.52507 | 1.61546 |
IOC¹ | 2011 | 08/11/11 | 09/15/11 | 225,814 | 0.78803 | 0.86706 | 0.86706 |
IOC | 2011 | 04/26/12 | 05/29/12 | 195,277 | 0.68030 | 1.65801 | 0.74840 |
Total | 2012 |
|
| 268,554 | 0.93527 | 2.52507 | 1.02889 |
IOC¹ | 2012 | 12/19/12 | 01/15/13 | 138,072 | 0.47920 | 2.52507 | 0.52720 |
Dividends | 2012 | 04/25/13 | 05/23/13 | 130,482 | 0.45607 | - | 0.50169 |
Total | 2013 |
|
| 560,537 | 1.95572 | 2.52507 | 2.15165 |
IOC¹ | 2013 | 11/13/13 | 12/16/13 | 180,000 | 0.62819 | 0.69111 | 0.69111 |
Dividends¹ | 2013 | 11/13/13 | 12/16/13 | 145,039 | 0.50617 | 0.55688 | 0.55688 |
Dividends | 2013 | 04/24/14 | 05/28/14 | 235,498 | 0.82136 | 1.27708 | 0.90366 |
Total | 2014 |
|
| 622,523 | 2.17236 | 2.52507 | 2.39000 |
IOC¹ | 2014 | 10/24/14 | 11/21/14 | 30,000 | 0.10469 | 0.11519 | 0.11519 |
Dividends¹ | 2014 | 10/24/14 | 11/21/14 | 350,770 | 1.22416 | 1.34678 | 1.34678 |
Dividends | 2014 | 04/23/15 | 06/22/15 | 241,753 | 0.84351 | 1.06310 | 0.92803 |
Total | 2015 |
|
| 326,795 | 1.13716 | 2.52507 | 1.25473 |
IOC | 2015 | 04/28/16 | 06/15/16 | 198,000 | 0.68748 | 2.10511 | 0.76022 |
Dividends | 2015 | 04/28/16 | 06/15/16 | 128,795 | 0.44968 | 0.41996 | 0.49451 |
Total | 2016 |
|
| 506,213 | 1.76466 | 2.89050 | 1.94342 |
IOC | 2016 | 04/28/17 | 06/30/17 | 282,947 | 0.98539 | 2.89050 | 1.08410 |
Dividends | 2016 | 04/28/17 | 12/28/2017 | 223,266 | 0.77927 | - | 0.85932 |
Total | 2017 |
|
| 266,000 | 0.92624 | 2.89050 | 1.01887 |
IOC¹ | 2017 | 12/13/17 | to be defined | 266,000 | 0.92624 | 2.89050 | 1.01887 |
45 |
* Amountssubject to rounding.
|
Earnings Release 4Q17 |
Assets in Operation
Copel Geração e Transmissão
Below is the main information of Copel GeT’s power station and the power produced in 2017.
Power Plants | Installed | Assured Power Generation | Concession | |
| Capacity (MW) | (Average MW) | (GWh) | Expires |
Hydroelectric Power Plants | 4,541.9 | 1,976.1 | 19,792.9 |
|
HPP Gov. Bento Munhoz da Rocha Netto (Foz do Areia) | 1,676.0 | 576.0 | 4,788.3 | 09.17.2023 |
HPP Gov. Ney Aminthas de Barros Braga (Segredo) | 1,260.0 | 603.0 | 6,373.8 | 11.15.2029 |
HPP Gov. José Richa (Salto Caxias) | 1,240.0 | 605.0 | 6,632.2 | 05.04.2030 |
HPP Gov. Parigot de Souza(1) | 78.0 | 32.7 | 379.0 | 01.05.2046 |
HPP Mauá(2) | 185.2 | 100.8 | 1,112.7 | 07.02.2042 |
HPP Guaricana | 36.0 | 16.1 | 150.2 | 08.16.2026 |
SHP Cavernoso II | 19.0 | 10.6 | 69.7 | 02.27.2046 |
HPP Chaminé | 18.0 | 11.6 | 114.5 | 08.16.2026 |
HPP Apucaraninha | 10.0 | 6.7 | 64.0 | 10.12.2025 |
HPP Derivação do Rio Jordão | 6.5 | 5.9 | 50.6 | 11.15.2029 |
HPP Marumbi | 4.8 | 2.4 | 19.0 | (3) |
HPP São Jorge | 2.3 | 1.5 | 14.6 | 12.03.2024 |
HPP Chopim I | 2.0 | 1.5 | 10.4 | (4) |
HPP Cavernoso | 1.3 | 1.0 | 2.6 | 01.07.2031 |
SHP Melissa | 1.0 | 0.6 | 5.6 | (4) |
SHP Salto do Vau | 0.9 | 0.6 | 4.8 | (4) |
SHP Pitangui | 0.9 | 0.1 | 0.8 | (4) |
Thermal Power Plant | 20.0 | 10.3 | 70.3 |
|
TTP Figueira | 20.0 | 10.3 | 70.3 | 03.26.2019 |
Wind Energy Plants | 2.5 | 0.5 | 3.7 |
|
UEE Eólica de Palmas(5) | 2.5 | 0.5 | 3.7 | 09.28.2029 |
TOTAL | 4,564.4 | 1,986.9 | 19,866.9 |
|
Notes: |
|
|
|
|
(1) Proportional to 30% of the energy of the plant. The other 70% are allocated in the physical guarantee of quota system. | ||||
(2) Refered to COPEL's participation (51% of power plant capacity of 363 MW). | ||||
(3) Submitted to ANEEL for ratification. | ||||
(4) Power plants wi th no concession agreement, only required to be registered at ANEEL. | ||||
(5) Average wi nd plant generation. | ||||
On March 24, 2017 Copel GeT filed an agreement with Aneel with its intention to extend the granting of the TPP Figueira, noting, however, that it will sign the necessary contracts and/or additives only after knowing and accepting the contractual terms and the rules that will govern any process related to the extension of the grant.
In addition, Copel GeT operates one plants under the quota system, as shown below:
46 |
* Amountssubject to rounding.
|
Earnings Release 4Q17 |
Power Plants - Quota System | Installed Capacity (MW) | Assured Power (Average MW) | Service Provision Revenue² (jul.17 - jun.18) (R$ million) | Granting Fee (R$ million) | Concession Expires |
HPP Gov. Pedro Viriato Parigot de Souza (GPS)¹ | 182.0 | 76.3 | 114.1 | 574.8 | 01.05.2046 |
TOTAL | 182.0 | 76.3 | 114.1 | 574.8 |
|
|
|
|
|
|
|
(1)Proportional the energy allocated in the physical guarantee of quota system (70% of the energy of the plant). To that portion of energy, Copel GeT will not bear the hydrological risks or withthe financial results of the MRE associated with the plant. | |||||
(2)Updated by Resolution nº 2,265, of July 4, 2017, of Aneel. | |||||
Copel was designated as the interim operator of the Rio dos Patos plant (1.7 average MW of installed capacity and 1 average MW of assured power) after the final term of the concession, awaiting the MME's decision on ANEEL's recommendation for the extinction of the plant without the reversal of the assets to the granting power. However, its operation was suspended in September 2014 due to flood damage in July of that year.
In view of this scenario, awaiting the confirmation by MME, Copel is carrying out the pertinent analyzes regarding the best use to be made of the assets of this plant, as well as the necessary actions in case of reversion of the assets to Copel.
Wind Farms Complex
Copel has 11 wind farms in commercial operation, which generated 1,024.6 GWh in 2017, as shown in the following chart:
Wind Farm | Auction ¹ | Installed Capacity (MW) | Assured Power (Average MW) | Generation (GWh) | Price ² | Expiration of Authorization |
São Bento Energia, Invest. e Part. S.A. |
| 94.0 | 46.3 | 306.1 | 213.79 |
|
GE Boa Vista S.A. | 2nd LFA | 14.0 | 6.3 | 41.2 | 219.31 | 04.27.2046 |
GE Olho D’Água S.A. | 30.0 | 15.3 | 103.9 | 212.92 | 05.31.2046 | |
GE São Bento do Norte S.A. | 30.0 | 14.6 | 96.8 | 212.92 | 05.18.2046 | |
GE Farol S.A. | 20.0 | 10.1 | 64.3 | 212.92 | 04.19.2046 | |
Copel Brisa Potiguar S.A. |
| 183.6 | 98.4 | 718.5 | 188.60 |
|
Nova Asa Branca I Energias Renováveis S.A. | 2nd LFA (08.26.2010) | 27.0 | 14.2 | 106.7 | 215.20 | 04.24.2046 |
Nova Asa Branca II Energias Renováveis S.A. | 27.0 | 14.3 | 104.5 | 215.20 | 05.30.2046 | |
Nova Asa Branca III Energias Renováveis S.A. | 27.0 | 14.5 | 111.1 | 215.20 | 05.30.2046 | |
Nova Eurus IV Energias Renováveis S.A. | 27.0 | 14.7 | 106.3 | 215.20 | 04.26.2046 | |
Santa Maria Energias Renováveis S.A. | 4th LER (08.18.2011) | 29.7 | 15.7 | 102.8 | 151.16 | 05.07.2047 |
Santa Helena Energias Renováveis S.A. | 29.7 | 16.0 | 111.1 | 151.16 | 04.08.2047 | |
Ventos de Santo Uriel S.A. | 16.2 | 9.0 | 76.0 | 149.99 | 04.08.2047 | |
Total |
| 277.6 | 144.7 | 1,024.6 | 196.66 |
|
¹ LFA - Auction of Alternative Sources/ LER - Auction Reserve Energy. | ||||||
² Price updated to March, 2018. | ||||||
47 |
* Amountssubject to rounding.
|
Earnings Release 4Q17 |
Interest in Generation Projects
Copel holds interests in seven power generation projects at the operational stage, with a total installed capacity of 884.7 MW, 599.0 MW referred to Copel´s stake, as shown below:
Company | Installed Capacity | Assured Power | Partners | PPA signed with | Concession |
(MW) | (Average MW) | Expires | |||
TPP Araucária (UEG Araucária) |
|
| COPEL - 20% |
|
|
484.1 | 390.3 | COPEL GeT - 60% | ¹ | 12.22.2029 | |
|
| Petrobras - 20% |
|
| |
HPP Santa Clara (Elejor) |
|
| COPEL - 70% Paineira Participações - 30% | COPEL Dis Free customers |
|
120.2 | 69.2 | 05.28.2037 | |||
|
|
| |||
SHP Santa Clara I (Elejor) |
|
| COPEL - 70% Paineira Participações - 30% | Free customers |
|
3.6 | 2.8 | 12.18.1932 | |||
|
|
| |||
HPP Fundão (Elejor) |
|
| COPEL - 70% Paineira Participações - 30% | COPEL Dis Free customers |
|
120.2 | 63.8 | 05.28.2037 | |||
|
|
| |||
SHP Fundão I (Elejor) |
|
| COPEL - 70% Paineira Participações - 30% | Free customers |
|
2.5 | 2.1 | 12.18.1932 | |||
|
|
| |||
HPP Dona Francisca (DFESA) | 125.0 | 75.9 | COPEL - 23.03% | COPEL GeT | 08.27.2033 |
Gerdau - 51.82% | Gerdau | ||||
Celesc - 23.03% | Celesc | ||||
Desenvix - 2.12% | Desenvix | ||||
SHP Arturo Andreoli (Foz do Chopim) |
|
| COPEL - 35.77% Silea Participações - 64.23% |
|
|
29.1 | 20.4 | Free customers | 04.23.2030 | ||
|
|
|
| ||
¹ Since February 1, 2014, the plant’s operation has been under the responsibility of UEGA. The Araucária TPP does not have availability agreements and operates | |||||
Interest in Wind Farms
Copel has 49% interest in the Voltalia São Miguel do Gostoso I Participações S.A. wind farm complex, in the State of Rio Grande do Norte.Whose energy was sold in the Fourth Reserve Energy Auction by under twenty-year contracts, with supply beginning in July, 2015, according to the table below.
Wind Farm | Installed Capacity¹ (MW) | Assured Power (Average MW) | Price² | Start up | Stake (%) | Wind farm location | Expiration of Authorization |
Voltalia - São Miguel do Gostoso I Participações S.A. |
|
|
|
|
| ||
Carnaúbas | 27.0 | 13.1 | 146.62 | Jul-15 | 49% COPEL 51% Voltalia | São Miguel do Gostoso (RN) | 04.08.2047 |
Reduto | 27.0 | 14.4 | 04.15.2047 | ||||
Santo Cristo | 27.0 | 15.3 | 04.17.2047 | ||||
São João | 27.0 | 14.3 | 03.25.2047 | ||||
Total | 108.0 | 57.1 | 146.62 |
|
|
| |
¹ The capacity envisaged in the Auction was altered based on the characteristics of Acciona Windpower’s equipment, respecting the volume of energy sold. | |||||||
² Price updated to March 2018. | |||||||
On June 17, 2017, the four wind farms comprising the São Miguel do Gostoso I Wind Complex were connected to the National Interconnected System (SIN). The Complex was able to start its operations in June 2015, when the construction of the complex was completed. Since then, the complex has received the total revenue of remuneration, in accordance with the public auction held in 2011.
48 |
* Amountssubject to rounding.
|
Earnings Release 4Q17 |
Under Construction
Copel Geração e Transmissão
Copel GeT is building two hydroelectric power plants that will add 405 MW to its total installed capacity, as described below.
Power Plants | Contract | Installed Capacity | Assured Power | Energy Sold in the | Supply Start | Price¹ | CAPEX² | Concession |
(MW) | (Average MW) | (Average MW) | (R$/MWh) | (R$ million) | Expires | |||
HPP Colíder | 01/2011 | 300 | 178.1 | 125.0 | 01.01.2015 | 164.40 | 2,364.0 | 01.16.2046 |
HPP Baixo Iguaçu | 02/2012 | 350 | 171.3 | 121.0 | 11.12.2018³ | 171.10 | 703.8 | 10.30.2049 |
Total³ |
| 650 | 349.4 |
|
|
|
|
|
¹ Adjusted by the IPCA up to March/2017. Font: CCEE. | ||||||||
² Adjusted for Copel's stake (considers own capital and third-party capital). | ||||||||
³ According to 2nd Amendment to the Concession Agreement, which included 756 days waiver of responsibility and Aneel Dispatch No. 3770 of November 7, 2017, which included more 46 days waiver ofresponsibility . | ||||||||
Colíder Hydroelectric Power Plant
On July 30, 2010, under Aneel New Energy Auction no. 003/2010, Copel GeT was awarded the concession to explore the Colíder HPP for a term of 35 years, commencing January 17, 2011, the signing date of MME - Colíder HPP Concession Agreement no. 001/11.
The project is part of the Brazilian Government’s Growth Acceleration Program - PAC and will consist of a main power house with an installed capacity of 300 MW, sufficient to serve around 1 million inhabitants, based on the estimated energy potential of the Teles Pires River on the border of the municipalities of Nova Canaã do Norte and Itaúba, in northern Mato Grosso.
The BNDES endorsed the qualification of the Colíder HPP for feasibility analysis of financial support and the financing agreement, in the amount of R$1,041.2 million (Note 23). The amounts released up to December 31, 2017 total R$975.1 million.
Due to force majeure events and government acts, such as fire in the construction site, difficulties related to environmental licensing, supplier delays in equipment delivery and services related to electromechanical assembly and construction of the transmission line associated with the plant, the schedule of the project was affected, leading to the postponement of the beginning of commercial generation: the startup of the first generation unit is scheduled for May 2018 and the third and last generation unit is expected to begin operations in November 2018. As a result of these events, this project shows an asset impairment balance of R$683.0 million as of December 31, 2017 (R$595.5 million as of December 31, 2016).
The energy from the Colíder HPP was sold at an Aneel auction at a final tariff of R$103.40/MWh, as of July 1, 2010, restated by the IPCA inflation index to R$163.41 on December 31, 2017. A total of 125 average-MW was traded, to be supplied beginning January 2015, for 30 years. Copel GeT filed with Aneel a request for exclusion of liability, so that the obligation to supply the energy sold is postponed. The request was not accepted in firstinstance; however, the Company exercised its right to appeal and filed a motion for rehearing, which was denied on March 14, 2017. As Copel GeT does not agree with the decision, it filed another motion for rehearing, which was denied on a final basis on July 4, 2017. Not agreeing with the decision, Copel GeT again requested the reconsideration, which was definitively denied on July 4, 2017. Copel GeT filed on December 18, 2017 an ordinary action with the Judicial Court requesting the reversal of the agency's decision.
49 |
* Amountssubject to rounding.
|
Earnings Release 4Q17 |
Copel GeT has been honoring energy supply agreements as follows:
• from January 2015 to May 2016: with energy surplus of its other plants that has not been contracted;
• from June 2016 to December 2017: partial reduction in June 2016 through a Bilateral Agreement and reduction of all Energy Commercialization Agreements in the Regulated Environment – CCEARs between July 2016 and December 2017 through a Bilateral Agreement and participation in the Mechanism for Compensation of Surpluses and Deficits – MCSD of New Energy.
The project’s assured energy of 177.9 average-MW, established by Ordinance 258 of the Ministry of Mines and Energy (MME) of December 21, 2016, was increased to 178.1 average-MW, according by Ordinance 213 / SPE of the MME, of July 14 2017.
On December 31, 2017, Colíder HPP expenses totaled R$2,197.6 million.
Baixo Iguaçu Hydroelectric Power Plant
Copel holds a 30% interest in the Baixo Iguaçu Consortium (CEBI). The purpose of the consortium is to build and operate the Baixo Iguaçu Hydroelectric Power Plant, with an installed capacity of 350.2 MW and assured power of 171.3 average-MW located on the Iguaçu river, between the cities of Capanema and Capitão Leônidas Marques, and between HPP Governador José Richa and the Iguaçu National Park, in the State of Paraná. With an estimated total investment of R$2.3 billion, the first unit of the plant is expected to start operating in November 2018. The work on the construction site began in July 2013, with the excavation of the generation circuit, the earthworks of the construction site and the construction of the housing areas.
The beginning of the commercial generation of unit 1 is currently expected for the end of November 2018, and of units 2 and 3 for December 2018 and January 2019, respectively. The original schedule was changed due to the suspension of the Installation License, according to the ruling of the Regional Federal Court of the 4th Region (TRF-RS), which occurred on June 16, 2014, and paralyzed the construction works from July of that year. In March 2015, a ruling authorizing the resumption of the construction works was issued. However, the Chico Mendes Institute for Biodiversity Conservation (ICMBio) enforced additional constraints on the environmental licensing, which prevented the immediate resumption of the construction work. CEBI submitted to the Environmental Institute of Paraná (IAP) all the necessary information to comply with these constraints and, inAugust 2015, the license was issued. After the measures discussed and agreed with the Developer Consortium, on February 1, 2016, the construction work was fully resumed.
50 |
* Amountssubject to rounding.
|
Earnings Release 4Q17 |
In August 2016, Aneel issued the 2nd Amendment to the Concession Agreement, in order to formalize the redefinition of HPP Baixo Iguaçu’s schedule, as well as its final closing date, acknowledging, in favor of CEBI, an exemption of liability for the delay in the implementation of the project for a period corresponding to 756 days, recommending to the MME the extension of the term of the grant and establishing that the CCEE must postpone the beginning of the supply period of the CCEARs for the period of the recognized exemption of liability.
On November 7, 2017, Aneel recognized an additional 46 days of exclusion of liability for the delay in the implementation of the Baixo Iguaçu HPP, barring any penalties and contractual, commercial or regulatory obligations arising from the delay. The project already had 746 days of exclusion of liability; therefore, its concession term will now expire on October 30, 2049 and supply of the Energy Commecialization Agreements shall begin on November 12, 2018.
At the construction site, the works are following the schedule established when the work was resumed. The assembly activities of the powerhouses and the spillway are fully in progress, as are the social and environmental programs.
Wind Farm Complex
Copel is expanding its energy generation matrix with renewable sources by building wind farm complexes in the State of Rio Grande do Norte, consisting of 13 projects with a total installed capacity estimated at 312.9 MW, as follows:
Cutia Wind Farm | Auction ¹ | Installed Capacity (MW)2 | Assured Power (Average MW) | Price4 | Start up | CAPEX (R$ million) | Premium | Wind farm location | Expiration of Authorization |
Value | |||||||||
(R$ million) | |||||||||
Cutia Wind Farm |
| 180.6 | 71.4 | 177.72 |
|
|
|
|
|
UEE Cutia S.A. |
| 23.1 | 9.6 | 177.72 |
|
|
| Pedra Grande | 01.04.2042 |
UEE Guajiru S.A. |
| 21.0 | 8.3 | 177.72 |
|
|
| Pedra Grande | 01.04.2042 |
UEE Esperança do Nordeste S.A. | 6th LER | 27.3 | 9.1 | 177.72 |
|
|
| São Bento do Norte | 05.10.2050 |
UEE Jangada S.A. | (10/31/2014) | 27.3 | 10.3 | 177.72 | Jul-18 | 1,161.9 | 9.4 | São Bento do Norte | 01.04.2042 |
UEE Maria Helena S.A. |
| 27.3 | 12.0 | 177.72 |
|
|
| São Bento do Norte | 01.04.2042 |
UEE Paraíso dos Ventos do Nordeste |
| 27.3 | 10.6 | 177.72 |
|
|
| São Bento do Norte | 05.10.2050 |
UEE Potiguar S.A. |
| 27.3 | 11.5 | 177.72 |
|
|
| São Bento do Norte | 05.10.2050 |
Bento Miguel Wind Farm |
| 132.3 | 58.1 | 168.18 |
|
|
|
|
|
CGE São Bento do Norte I S.A. |
| 23.1 | 10.1 | 168.18 |
|
|
| São Bento do Norte | 08.03.2050 |
CGE São Bento do Norte II S.A. |
| 23.1 | 10.8 | 168.18 |
|
|
| São Bento do Norte | 08.03.2050 |
CGE São Bento do Norte III S.A. | 20th LEN | 23.1 | 9.6 | 168.18 | Jan-19 | 846.5 | 14.2 | São Bento do Norte | 08.03.2050 |
CGE São Miguel I S.A. | (11/28/2014) | 21.0 | 9.3 | 168.18 |
|
|
| São Bento do Norte | 08.03.2050 |
CGE São Miguel II S.A. |
| 21.0 | 9.1 | 168.18 |
|
|
| São Bento do Norte | 08.03.2050 |
CGE São Miguel III S.A. |
| 21.0 | 9.2 | 168.18 |
|
|
| São Bento do Norte | 08.03.2050 |
Total |
| 312.9 | 129.5 | 173.44 |
| 2,008.4 | 23.6 |
|
|
¹ Types of auctions: LER - Auction Reserve Energy / LEN - New Energy Auction. | |||||||||
² The installed capacity of the new projects can be optimized in relation to the registered at auctions. | |||||||||
³ Price updated to March 2018. | |||||||||
The largest Copel wind farm called Cutia is under construction, and is divided into two large complexes:
51 |
* Amountssubject to rounding.
|
Earnings Release 4Q17 |
• Cutia Complex: composed of seven wind farms (Guajiru, Jangada, Potiguar, Cutia, Maria Helena, Esperança do Nordeste and Paraíso do Ventos do Nordeste) with 180.6 MW of total installed capacity, 71.4 average MW of assured power, all located in the State of Rio Grande do Norte. The power that will be generated by the farms was sold on the 6th Reserve Auction that was held on October 31, 2014, at an average historical price of R$144.00/MWh, and the startup for commercial generation of these farms is scheduled for July 2018; and
• Bento Miguel Complex: composed of six wind farms (São Bento do Norte I, São Bento do Norte II, São Bento do Norte III, São Miguel I, São Miguel II and São Miguel III) with a total installed capacity of 132.3 MW, 54.8 average MW assured power, all also located in the State of Rio Grande do Norte. The power that will be generated by the farms was sold on the 20th New Energy Auction that was held on November 28, 2014, at an average historical price of R$136.97/MWh, and the initial startup for commercial generation of these farms is January 2019.
The following are the relevant milestones for the execution of the works from January 2016 to December 2017. In January 2016, the environmental licenses were obtained, beginning the access road runs, bases and assembly platform of the generator set. In April 2016, construction of the Cutia Substation was started, with installed capacity of three 120 MVA transformers and twenty-six 34.0 kV circuits, two circuits for each wind farm. In October 2016, with the advanced stage of construction services in some farms, the first generator sets began to be delivered, and Torres Productive Center began operating, a structure in which precast elements that will constitute the towers of support of the wind turbines will be produced. In January 2017, the process of assembling the towers of the wind turbines began.
As a result of the review of the recoverable amount of these projects, a balance of estimated losses on impairment of assets of R$322.7 million as of December 31, 2017 was recorded (R$314,5 million as of December 31, 2016).
52 |
* Amountssubject to rounding.
|
Earnings Release 4Q17 |
Assets in Operation
The chart below shows the transmission concession agreements and the design of the substations park and the transmission lines in operation:
Subsidiary / SPC | Contract | Enterprise | TL | Substation | MVA | APR ¹ | Concession |
Extension (km) | Amount | (R$ million) | Expiration | ||||
Copel GeT | 060/20012 | Several | 2,024 | 32 | 12,202 | 473.9 | 12.31.2042 |
Copel GeT | 075/20013 | TL Bateias - Jaguariaiva | 137 | - | - | 18.3 | 08.16.2031 |
Copel GeT | 006/2008 | TL Bateias - Pilarzinho | 32 | - | - | 1.0 | 03.16.2038 |
Copel GeT | 027/2009 | TL Foz - Cascavel Oeste | 116 | - | - | 10.9 | 11.18.2039 |
Copel GeT | 015/2010 | Cerquilho III Substation | - | 1 | 300 | 4.5 | 10.05.2040 |
|
| TL Foz do Chopim - Salto Osório |
|
|
|
|
|
Copel GeT | 022/2012 |
| 102 | - | - | 5.5 | 08.26.2042 |
|
| LT Londrina - Figueira |
|
|
|
|
|
Copel GeT | 002/2013 | TL Assis — Paraguaçu Paulista II | 83 | 1 | 200 | 7.6 | 02.24.2043 |
Copel GeT | 005/2014 | TL Bateias - Curitiba Norte | 31 | 1 | 300 | 8.3 | 01.28.2044 |
Copel GeT | 021/2014 | TL Foz do Chopim - Realeza | 52 | 1 | 150 | 7.2 | 09.04.2044 |
Copel GeT | 022/2014 | TL Assis – Londrina | 122 | - | - | 18.9 | 09.04.2044 |
Subtotal Copel GeT4 |
|
| 2,699 | 36 | 13,152 | 556.1 |
|
Costa Oeste |
| TL Cascavel Norte - Cascavel Oeste |
|
|
|
|
|
Copel GeT - 51% | 001/2012 | TL Cascavel Norte - Umuarama Sul | 152 | 1 | 300 | 5.5 | 01.11.2042 |
Eletrosul - 49% |
| Umuarama Sul Substation |
|
|
|
|
|
Transm. Sul Brasileira |
|
|
|
|
|
|
|
Copel GeT - 20% | 004/2012 | TL Nova Sta Rita - Camaquã | 785 | 1 | 300 | 11.5 | 05.09.2042 |
Eletrosul - 80% |
|
|
|
|
|
|
|
Caiuá Transmissora |
| TL Guaíra - Umuarama Sul |
|
|
|
|
|
Copel GeT - 49% | 007/2012 | TL Cascavel Norte - Cascavel Oeste | 136 | 2 | 700 | 9.5 | 05.09.2042 |
Elecnor - 51% |
| Santa Quitéria Substation / Cascavel Norte Substation |
|
|
|
| |
Integração Maranhense |
|
|
|
|
|
|
|
Copel GeT - 49% | 011/2012 | TL Açailandia - Miranda II | 365 | - | - | 15.2 | 05.09.2042 |
Elecnor - 51% |
|
|
|
|
|
|
|
Marumbi |
|
|
|
|
|
|
|
Copel GeT - 80% | 008/2012 | TL Curitiba - Curitiba Leste | 29 | 1 | 300 | 13.5 | 05.09.2042 |
Eletrosul - 20% |
|
|
|
|
|
|
|
Matrinchã |
|
|
|
|
|
|
|
Copel GeT - 49% | 012/2012 | TL Paranaíta - Ribeirãozinho | 1,005 | 3 | - | 92.8 | 05.09.2042 |
State Grid - 51% |
|
|
|
|
|
|
|
Guaraciaba |
|
|
|
|
|
|
|
Copel GeT - 49% | 013/2012 | LT Ribeirãozinho - Marimbondo | 600 | 1 | - | 48.7 | 05.09.2042 |
State Grid - 51% |
|
|
|
|
|
|
|
Paranaíba |
|
|
|
|
|
|
|
Copel GeT - 24,5% | 007/2013 | TL Barreiras II - Pirapora II | 953 | - | - | 30.1 | 05.01.2043 |
Furnas - 24,5% |
|
|
|
|
|
|
|
State Grid - 51% |
|
|
|
|
|
|
|
Cantareira |
|
|
|
|
|
|
|
Copel GeT - 49% | 19/2014 | LT Estreito - Fernão Dias | 342 | - | - | 47.6 | 09.04.2044 |
Elecnor - 51% |
|
|
|
|
|
|
|
Subtotal SPCs5 |
|
| 4,367 | 9 | 1,600 | 274.4 |
|
Total |
|
| 7,066 | 45 | 14,752 | 830.5 |
|
1Proportion to the participation of Copel in the venture. Updated according to Aneel Aproval Resolution No. 2.258/2017 06.27.2017 | |||||||
2Renewed contract pursuant to Law 12,783/13. | |||||||
3From the 10.31.2018 APR will be reduced 50%. | |||||||
4Consolidated Income. | |||||||
5Equity in Earning of Subsidiaries. | |||||||
Assets under Construction
Copel GeT is substantially increasing its share of the transmission segment through own investments and partnerships in SPCs. The projects have a joint total of 1,408 km of transmission lines and 4 substations and willgenerate APR of R$251.3 million of which refers to Copel Get stake. Copel’s interest in the transmission projects is available in the table below.
53 |
* Amountssubject to rounding.
|
Earnings Release 4Q17 |
Subsidiary / SPC | Auction | Signing of | Enterprise | State | km | Subst | APR¹ | CAPEX² | Start up | Next Review | Concession |
Contract | (R$ million) | (R$ million) | Expiration | ||||||||
Copel GeT | 001/10 | Oct-10 | TL Araraquara II — Taubaté | SP | 334 | - | 29.0 | 434.3 | Apr-18 | 2021 | 10.05.2040 |
|
|
| TL Curitiba Leste - Blumenau |
|
|
|
| Mar-21 |
|
| |
Copel GeT | 005/15 | Apr-16 |
| PR / SC | 189 | 3 | 108.6 | 560.9 |
| 2021 | 04.06.2046 |
|
|
| TL Baixo Iguaçu - Realeza |
|
|
|
|
| Sep-19 |
|
|
Subtotal Copel GeT |
|
|
|
| 523 | 3 | 137.6 | 995.1 |
| - |
|
Mata de Santa Genebra |
|
|
|
|
|
|
|
|
|
| |
Copel GeT - 50,1% | 007/13 | May-14 | TL Araraquara II - Bateias | SP / PR | 885 | 1 | 113.9 | 823.1 | Nov-18 | 2019 | 05.13.2044 |
Furnas - 49,9% |
|
|
|
|
|
|
|
|
|
|
|
Subtotal SPC |
|
|
|
| 885 | 1 | 113.8 | 823.1 |
|
|
|
Total |
|
|
|
| 1,408 | 4 | 251.3 | 1,818.3 |
|
|
|
¹ Updated according to Aneel Ratification Resolution 1918/2015 / Adjusted for Copel’s stake. | |||||||||||
² Adjusted for Copel’s stake (considers own capital and third-party capital). | |||||||||||
Concession agreement
In December 2015, the Company signed the fifth amendment to the Public Electricity Distribution Concession Agreement no. 46/1999 of Copel Distribuição S.A., extending the concession term to July 7, 2045.
The concession agreement imposes economic and financial efficiency and quality conditions. Failure to comply with the conditions for two consecutive years or any of the limits at the end of the first five years will result in the termination of the concession. From the sixth year following execution of the agreement, any breach of quality criteria for three consecutive years or economic and financial management criteria for two consecutive years will result in the opening of a forfeiture process.
The following chart shows the goals set for Copel Distribuição in the first 5 years of renovation:
|
| Quality (Limit Established)1 | Quality Performed | ||
Year | Economic and Financial Management | DECi² | FEC² | DECi² | FEC² |
2016 |
| 13.61 | 9.24 | 10.80 | 7.14 |
2017 | EBITDA4≥ 0 | 12.54 | 8.74 | 10.41 | 6.79 |
2018 | EBITDA4(-) QRR³ ≥ 0 | 11.23 | 8.24 | - | - |
2019 | {Net Debt / [EBITDA4(-) QRR³]} ≤ 1 / (0.8 * SELIC5) | 10.12 | 7.74 | - | - |
2020 | {Net Debt / [EBITDA4(-) QRR³]} ≤ 1 / (1.11 * SELIC5) | 9.83 | 7.24 | - | - |
1According to Aneel’s Technical Note No. 0335/2015 |
|
|
|
| |
² DECi – Equivalent Time of Interruption Caused by Internal Source per Consumer Unit; and FECi – Equivalent Frequency of Interruption Caused by Internal Source per | |||||
³ QRR: Regulatory Reintegration Quota or Regulatory Depreciation Expense. It will be the value set in the last Periodic Tariff Review - RTP, plus the IGP-M between theonth prior to the RTP and the month prior to the period of twelve (12) months of the determination of economic and financial sustainability. In June/2016 set value was | |||||
4EBITDA adjusted for the effects of post-employment benefits, provisions and PDV. | |||||
5Selic: limited to 12.87% p.y. | |||||
54 |
* Amountssubject to rounding.
|
Earnings Release 4Q17 |
Operating Data
In the distribution business, Copel serves more than 4.5 million energy customers in 1,113 locations, belonging to 394 municipalities in State of Paraná and one in the State of Santa Catarina. Copel Distribuição operates and maintains the installations in the 13.8 kV, 34.5 kV, 69 kV and 138 kV.
Voltage | Km | Substations | MVA |
13.8 kV | 105,511 | - | - |
34.5 kV | 84,639 | 225 | 1,538 |
69 kV | 866 | 35 | 2,406 |
88 kV1 | - | - | 5 |
138 kV | 5,935 | 109 | 7,286 |
230 kV | - | - | - |
Total | 196,951 | 369 | 11,235 |
1Not automated. |
|
|
|
Copel Dis migrated from the grid system and the data previously obtained with insulation voltage to 230 kV today reflects the operating voltage, which iswhy the 230 kV lines have been zeroed | |||
Compact-Design Distribution Lines
Copel Distribuição has continued to implement compact-design distribution lines in urban areas with a high concentration of trees surrounding the distribution grids. This technology reduces the number of trees cut down or trimmed, and improves the quality of power supply by reducing the number of unplanned outages. In December 2017, the total length of compact-design distribution lines in operation was 9,616 km.
Secondary Isolated Lines
Copel Distribuição has also invested in low-voltage (127/220V) secondary isolated lines, which offer substantial advantages over regular overhead lines, including: improvement in DEC and FEC distribution performance indicators, defense against illegal connections, improved environmental conditions, reduced areas subject to tree trimming, improved safety, reduced voltage drops throughout the grid, and increased transformer useful life, due to the reduction of short-circuits, among other advantages. The total length of installed secondary isolated lines closed December 2017 at 17,384 km.
55 |
* Amountssubject to rounding.
|
Earnings Release 4Q17 |
Quality of Supply
The two main indicators of power supply quality are DEC (outage duration) and FEC (outage frequency). The trends for these indicators, as well as for total time service, are shown below:
Copel Telecomunicações has an optical backbone, a high capacity intermunicipal transmission network, and the access, a customer service network. The access network can be multi-point (GPON) or point-to-point (conventional), thus connecting the customer to the network's transmission Copel Telecom and providing the contracted services.
In December 2017, the backbone cable network extended for 10,152 km and the access network extended for 21.206 km. Currently, we serve the 399 municipalities in the State of Paraná and another 2 in the State of Santa Catarina.
Copel Telecomunicações Fiber Optic Network
Map of the State of Paraná
|
56 |
* Amountssubject to rounding.
|
Earnings Release 4Q17 |
Other Sectors
Copel holds interests in companies in the gas, telecommunications, sanitation and service sectors, as shownbelow:
| Sector | Partners |
Dominó Holdings Ltda¹ | Participation in society | COPEL - 49.0% |
|
| Andrade Gutierrez - 51.0% |
|
| COPEL - 51.0% |
Companhia Paranaense de Gás - Compagas | Gas | Mitsui Gás - 24.5% |
|
| Gaspetro - 24.5% |
|
| COPEL - 30.0% |
Paraná Gás Exploração | Oil and natural gas | Petra Energia - 30.0% |
e Produção S.A1 |
| Bayar Participações -30.0% |
|
| Tucumann Engenharia - 10.0% |
|
| COPEL - 45.0% |
|
| Município de Londrina - 44.4% |
Sercomtel S.A. Telecom | Telecommunications | Banco Itauleasing S.A. - 7.1% |
|
| Outros - 3.5% |
Carbocampel S.A. | Coal mining | COPEL - 49.0% |
|
| Carbonífera Cambuí - 51.0% |
|
| COPEL - 48.0% |
Copel Amec Ltda | Services | Amec - 47.5% |
in liquidation |
| Lactec - 4.5% |
1In November 2017, the transformation from a joint-stock company (S.A.) to a limited liability partnership (Ltda). and the change in the investment of ajointly-controlled company into an associated company. | ||
2More information in item 8.6 | ||
On November 17, 2017, Copel requested the conversion of shares and for joining Sanepar’s Units Program, which occurred on November 21, 2017. The units held by Copel and Copel Energia are represented by one common share and four preferred shares issued by Sanepar.
Copel, holder of 36,343,267 preferred shares issued by Sanepar, requested the conversion of 7,268,655 into common shares and the formation of 7,268,653 Units. Copel Energia, in turn, holder of 7,956,306 common shares issued by Sanepar acquired on March 13, 2017, requested the conversion of 6,365,044 into preferred shares and the formation of 1,591,261 Units.
In December 2017, the Company participated as a seller of the public offering for secondary distribution of share deposit certificates ("Units"), each representing one common share and four preferred shares issued by Companhia de Saneamento do Paraná - SANEPAR, terms of the documents of the respective offer.
Copel's participation in the transaction included the sale of 8,859,914 Units, which represents all of its Units issued by Sanepar, of which 7,268,653 Units held by Copel Holding and 1,591,261 Units held by Copel Comercialização, at the price of R$55,20/Unit.
57 |
* Amountssubject to rounding.
|
Earnings Release 4Q17 |
The settlement of the transaction occurred on December 18, 2017 and resulted in the entry of R$484.6 million into the Company's cash.
Since December 2016, COPEL has classified its investment in Sanepar as a financial asset available for sale, whose initial recognition was based on the fair value and its variation directly recorded in shareholders' equity, net of tax effects. With the total sale of this investment in December 2017, retained earnings in shareholders' equity were reclassified to income for the year, totaling R$28.7 million.
Project Portfolio
Copel holds interests in different power generation projects.When these projects go into commercial operation, they will add 327.2 MW of installed capacity to the Company's portfolio.
Project | Estimated Installed Capacity | Estimated Assured Power | COPEL' Stake |
(MW)¹ | (Average MW) | (%) | |
SHP | 88.0 | 52.0 |
|
Bela Vista | 29.0 | 16.6 | 36.0 |
Dois Saltos | 30.0 | 15.5 | 30.0 |
Salto Alemã | 29.0 | 19.8 | 19.0 |
HPP | 378.0 | 205.0 |
|
São Jerônimo | 331.0 | 178.1 | 41.2 |
Salto Grande | 47.0 | 26.9 | 35.8 |
WPP | 149.1 | 79.6 |
|
Complexo Alto Oriente | 48.3 | 24.7 | 100.0 |
Complexo Jandaia | 100.8 | 54.9 | 100.0 |
Total | 615.1 | 336.6 |
|
¹ The installed capacity of the new projects can be optimized in relation to the registered at auctions. | |||
Copel, in partnership with the companies Brennand, Minas PCH and Silea, is also developing studies in the lower reaches of the Rio Chopim that will lead to the feasibility of another four (4) hydroelectric projects. As for wind power generation, there are studies for the feasibility of new wind farms in the State of Rio Grande do Norte, where Copel already has wind assets. The short-term objective is to register such projects in the EPE to enable participation in the upcoming auctions to be organized by the Federal Government. The technical characteristics may be adjusted until the effective energy commercialization of the projects, since Copel's engineering is conducting optimization studies, in order to make the projects more competitive.
58 |
* Amountssubject to rounding.
|
Earnings Release 4Q17 |
Interest in Feasibility Study
Hydroelectric Potential Surveyed Along the Piquiri River
The feasibility studies for the four hydroelectric power plants making up the hydroelectric potential of the Piquiri River, in Paraná, were submitted by Copel GeT and accepted by Aneel in 2012. The following table features these plants, which have a joint installed capacity 459.3 MW:
Project |
| Estimated Installed Capacity (MW) |
HPP Apertados |
| 139.0 |
HPP Comissário |
| 140.0 |
HPP Foz do Piquiri | 93.2 | |
HPP Ercilândia |
| 87.1 |
Total |
| 459.3 |
Oil and Gas Exploration and Production (Paraná Gás
Exploração e Produção S.A) On November 28, 2013, in the 12th round of Bids of the National Petroleum Agency (ANP), the consortium formed by Copel (30%), Bayar Participações (30%), Tucumann Engenharia (10%) and Petra Energia (30%) (the latter acting as operator) won the right to explore, develop and produce oil and natural gas in four blocks in an 11,327 km² area in the midwestern region of the State of Paraná. The consortium’s total investment will come to R$78.1 million in the first phase of exploration, for the term of four years granted by the ANP. Copel and its partners Bayar, Tucumann and Petra signed concession contracts for 2 blocks in May 2014. At the end of 2016, State Law No. 18.947/2016 was sanctioned, suspending por ten years the environmental licensing of any drilling or exploration activity of shale gas by the hydraulic fracturing method, better known as "fracking". |  |
Due to the ruling rendered regarding the Public Civil Action referred to above (in the lower court), issued on June 7, 2017, stating the nullity of the bidding procedure and the respective agreements signed for the areas of the Rio Paraná Basin, and the lack of compliance prospects of the object of ANP’s 12th Round of Bids, the consortium resolved to request to ANP the discharge from its contractual obligations under the 12th Round of Bids without charges to the bidders, with the consequent refund of the signature bonus, reimbursement of the guarantee costs incurred and discharge of the guarantees presented (application filed at ANP on June 6, 2017).
59 |
* Amountssubject to rounding.
|
Earnings Release 4Q17 |
Copel’s workforce closed 4Q17 at 8,245 employees distributed. The table below shows employee number trends in the Company and its subsidiaries in the last four years:
Headcount | 2014 | 2015 | 2016 | 2017 |
Geração e Transmissão | 1,554 | 1,568 | 1,680 | 1,734 |
Distribuição | 6,071 | 6,032 | 6,022 | 5,746 |
Telecomunicações | 601 | 621 | 660 | 649 |
Holding | 329 | 347 | 69 | 78 |
Comercialização | 11 | 10 | 30 | 38 |
Renováveis | 26 | 50 | 70 | - |
TOTAL | 8,592 | 8,628 | 8,531 | 8,245 |
At the end of December, Copel Distribuição had 4,560,493 customers, representing a consumer-to-employee ratio of 793. Compagas, Elejor and UEG Araucária, companies in which Copel holds a majority interest, had 163, 7 and 17 employees, respectively.
60 |
* Amountssubject to rounding.
|
Earnings Release 4Q17 |
|
| Installed |
|
|
|
Generation |
| capacity |
| Transmission |
|
|
| (MW) |
|
|
|
Copel GeT |
|
|
| Copel GeT |
|
In operation |
| 4,746.4 |
| In operation |
|
Hydroeletric1 | 16 | 4,541.9 |
| Transmission Lines (km) | 2,699 |
Quota System | 1 | 182.0 |
| Substation (amount) | 36 |
Thermal | 1 | 20.0 |
| Under construction |
|
Wind power | 1 | 2.5 |
| Transmission Lines (km) | 523 |
Under construction |
| 405.0 |
| Substation (amount) | 3 |
Hydroeletric | 2 | 405.0 |
| Partnership |
|
Wind Farms |
|
|
| In operation |
|
In operation | 11 | 277.6 |
| Transmission Lines (km) | 4,367 |
Under construction | 13 | 21.0 |
| Substation (amount) | 9 |
Partnership |
|
|
| Under construction |
|
In operation |
| 651.9 |
| Transmission Lines (km) | 885 |
Hydroeletric | 6 | 211.7 |
| Substation (amount) | 1 |
Thermal | 1 | 387.3 |
|
|
|
Wind farms | 4 | 52.9 |
| Copel Distribuition |
|
|
|
|
| Distribution lines (km) | 196,951 |
Copel Telecom |
|
|
| Substations | 369 |
Optical cables backbone network (km) | 10,152 |
| Installed power substations (MVA) | 11,235 | |
Optical cables access network (km) |
| 21,051 |
| Municipalities served | 395 |
Cities served in Parana State |
| 399 |
| Locations served | 1,113 |
Cities served in Santa Catarina State |
| 2 |
| Captive customers | 4,560,493 |
|
|
|
| Customers by distribution employee | 794 |
|
|
|
| DEC (in hundredths of an hour and minute) | 10.46 |
|
|
|
| FEC (number of outages) | 6.83 |
|
|
|
|
|
|
Administration |
|
|
|
|
|
|
|
|
|
|
|
Total employees |
| 8,245 |
|
|
|
Copel Geração e Transmissão |
| 1,734 |
| Copel Participações | 38 |
Copel Distribuição |
| 5,746 |
| Copel Renováveis | - |
Copel Telecomunicações |
| 649 |
| Copel Holding | 78 |
|
|
|
|
|
|
1Since January 1, 2017, the HPP Governor Pedro Viriato Parigot de Souza (GPS) has 30% of i ts assured power marketed by Copel GeT and 70% allocated i n thequota system. | |||||
61 |
* Amountssubject to rounding.
|
Earnings Release 4Q17 |
Information about 4Q17 Results Conference Call:
> Tuesday, April 17, 2018, at 10:00 a.m. (Brasília time)
> Telephone: (+1 516) 300 1066
> Code: Copel
A live webcast of the conference call will be available at:ir.copel.com
Please connect 15 minutes before the call.
Investor Relations – Copel
Telephone: (+ 55 41) 3222-2027
The information contained in this press release may contain forward-looking statements that reflect management’s current view and estimates of future economic circumstances, industry conditions, company performance, and financial results. Any statements, expectations, capabilities, plans and assumptions contained in this press release that do not describe historical facts such as statements regarding the declaration or payment of dividends, the direction of future operations, the implementation of relevant operating and financial strategies, the investment program, factors or trends affecting the Company’s financial condition, liquidity or results of operations are forward-looking statements within the meaning of the U.S. Private Securities Litigation Reform Act of 1995 and involve a number of risks and uncertainties. There is no guarantee that these results will actually occur. The statements are based on many assumptions and factors, including general economic and market conditions, industry conditions and operating factors. Any changes in such assumptions or factors could cause actual results to differ materially from current expectations.
62 |
* Amountssubject to rounding.
|
Earnings Release 4Q17 |
|
| R$'000 |
Consolidated Cash Flow | 2017 | 2016 |
Cash flows from operating activities |
|
|
Net income for the period | 1,118,255 | 789,756 |
Adjustments to reconcile net income with the cash provided by operating activities | 1,105,046 | 3,370,122 |
Depreciation and Amortization | 731,599 | 708,296 |
Unrealized monetary and exchange variations , net | 915,542 | 1,311,228 |
Remuneration of transmission concession contracts | (129,769) | (98,780) |
Revers al of es timates of los ses on transmission concession contracts | - | - 29,025 |
Sectoral assets and liabilities result | (767,040) | 1,079,662 |
Interest - bonus from the grant | (82,160) | (96,783) |
Gain on remeasurement of the cash fl ow from the RBSE assets | (361,156) | (809,639) |
Result of the adherence to the Special Tax Regularization Program | (154,197) | - |
Result of the renegotiation of the hydrological risk | - | (26,872) |
Equity in earnings of subsidiaries | (107,516) | (221,695) |
Recognition of fa ir value of accounts receivable related to concession | - 57,080 | - 132,741 |
Result from the change of the investment valuation method | - | (52,107) |
Income Tax and Social Contribution | 379,943 | 589,322 |
Deferred Income Tax and Social Contribution | (105,257) | (69,632) |
Net operational provisions and reversals | 365,539 | 768,696 |
Appropriation of actuarial calculation of pos t-employment benefi ts | 97,511 | 130,707 |
Appropriation of pension and healthcare contribution | 153,069 | 142,735 |
Provision for research and development and energy efficiency | 118,753 | 101,946 |
Write off of i ntangible assets related to concess ion - goodwi ll | 17 | 54 |
Write off of property, plant, and equipment | 64,508 | 27,316 |
Write off of i ntangible assets | 42,740 | 47,434 |
Decrese (increase) in assets | 122,811 | 1,033,645 |
Increase (reduction) of liabilities | 157,180 | (1,946,822) |
Income tax and social contribution paid | (335,087) | (859,784) |
Charges on loans and financing paid | (532,033) | (362,128) |
Charges paid debentures | (622,815) | (547,971) |
Net cash generated by operating activities | 1,013,357 | 1,476,818 |
Cash flows from investing activities |
|
|
Bonds and securities | 48,552 | 13,664 |
Loans to related parties | (5,145) | (9,422) |
Receipt of l oans to related parties | 24,985 | 5,112 |
Additions in investments | (248,243) | (505,098) |
Reduction of capital i n i nvestees | - | 74,983 |
Disposal of equity interests | 460,417 | - |
Additions to property, plant, and equipment | (1,205,508) | (1,284,436) |
Financial participation of the cons umer - property, plant and equipment | - | 40 |
Additions to intangible | (806,240) | (928,727) |
Customer contributions | 125,858 | 122,809 |
Net cash generated (used) by investing activities | (1,605,324) | (2,511,075) |
Cash flows from financing activities | 0 | 0 |
Loans and fi nancing obtained | 800,044 | 93,806 |
Debentures Issued | 2,242,521 | 1,822,965 |
Amortization of principal amounts of loans and financing | (971,187) | (226,973) |
Amortization of principal amounts of debentures | (915,005) | (785,239) |
Dividends and i nterest on own capital paid | (506,404) | (368,956) |
Net cash used by financing activities | 649,969 | 535,603 |
Increase (decrease) in cash and cash equivalents | 58,002 | (498,654) |
Cas h and cash equivalents at the beginning of the year | 982,073 | 1,480,727 |
Cas h and cash equivalents at the end of the year | 1,040,075 | 982,073 |
Variation in cash and cash equivalents | 58,002 | (498,654) |
63 |
* Amountssubject to rounding.
|
Earnings Release 4Q17 |
Income Statement – Copel Geração e Transmissão
Income Statement | 4Q17 | 3Q17 | 4Q16 | Var.% | 2017 | 2016 | Var.% |
| (1) | (2) | (3) | (1/3) | (4) | (5) | (4/5) |
OPERATING REVENUES | 824,369 | 729,299 | 876,089 | (5.9) | 3,409,904 | 3,935,320 | (13.4) |
Electricity sales to final customers | 158,006 | 158,335 | 157,495 | 0.3 | 615,249 | 599,109 | 2.7 |
Electricity sales to distributors | 460,445 | 437,558 | 466,938 | (1.4) | 1,935,996 | 1,806,995 | 7.1 |
Us e of the main transmission grid | 137,509 | 110,750 | 120,505 | 14.1 | 673,597 | 1,079,056 | (37.6) |
Construction revenue | 56,840 | 10,634 | 118,979 | (52.2) | 136,336 | 405,242 | (66.4) |
Other operating revenues | 11,569 | 12,022 | 12,172 | (5.0) | 48,726 | 44,918 | 8.5 |
OPERATING COSTS AND EXPENSES | (760,819) | (510,390) | (593,374) | 28.2 | (2,116,038) | (1,885,027) | 12.3 |
Electricity purchased for resale | (147,468) | (194,984) | (11,763) | - | (361,227) | (60,821) | 493.9 |
Charges of ma in distribution a nd transmission grid | (76,275) | (76,436) | (73,755) | 3.4 | (300,943) | (276,600) | 8.8 |
Personnel a nd management | (107,694) | (69,442) | (109,329) | (1.5) | (318,438) | (302,139) | 5.4 |
Pension a nd healthcare plans | (15,685) | (14,430) | (16,707) | (6.1) | (58,521) | (63,883) | (8.4) |
Materials and s upplies | (3,625) | (4,647) | (3,890) | (6.8) | (16,129) | (16,803) | (4.0) |
Materials and s upplies for power eletricity | (6,506) | (8,289) | (7,904) | (17.7) | (26,809) | (24,550) | 9.2 |
Third-party s ervices | (30,185) | (26,930) | (26,290) | 14.8 | (110,285) | (104,675) | 5.4 |
Depreciation and a mortization | (66,778) | (67,911) | (62,150) | 7.4 | (272,855) | (270,899) | 0.7 |
Provisions and reversals | (185,093) | 7,586 | (111,888) | 65.4 | (190,859) | (152,520) | 25.1 |
Construction cost | (78,420) | (2,651) | (127,722) | (38.6) | (272,216) | (406,345) | (33.0) |
Other cost a nd expenses | (43,090) | (52,256) | (41,976) | 2.7 | (187,756) | (205,792) | (8.8) |
EQUITY IN EARNINGS OF SUBSIDIARIES | (12,174) | 94,624 | (445,401) | (97.3) | 65,968 | (344,982) | - |
PROFIT BEFORE FINANCIAL RESULTS AND TAXES | 51,376 | 313,533 | (162,686) | - | 1,359,834 | 1,705,311 | (20.3) |
FINANCIAL RESULTS | (101,315) | (117,578) | (108,542) | - | (467,235) | (447,315) | - |
Financial income | 8,942 | 12,178 | 40,193 | (77.8) | 43,825 | 100,489 | (56.4) |
Financial expenses | (110,257) | (129,756) | (148,735) | (25.9) | (511,060) | (547,804) | (6.7) |
OPERATIONAL EXPENSES/ INCOME | (49,939) | 195,955 | (271,228) | (81.6) | 892,599 | 1,257,996 | (29.0) |
INCOME TAX AND SOCIAL CONTRIBUTION ON PROFIT | 134,205 | (31,043) | 44,891 | 199 | (153,576) | (435,615) | (64.7) |
Income ta x and s ocial contribution on profit | 83,757 | (63,592) | 16,228 | 416.1 | (195,572) | (182,757) | 7.0 |
Deferred income ta x and s ocial contribution on profit | 50,448 | 32,549 | 28,663 | 76.0 | 41,996 | (252,858) | - |
NET INCOME (LOSS) | 84,266 | 164,912 | (226,337) | - | 739,023 | 822,381 | (10.1) |
EBITDA | 118,154 | 381,444 | (100,536) | - | 1,632,689 | 1,976,210 | (17.4) |
64 |
* Amountssubject to rounding.
|
Earnings Release 4Q17 |
Income Statement – Copel Distribuição
|
|
|
|
|
|
| R$'000 |
Income Statement | 4Q17 | 3Q17 | 4Q16 | Var.% | 2017 | 2016 | Var.% |
(1) | (2) | (3) | (1/3) | (4) | (5) | (4/5) | |
OPERATING REVENUES | 2,605,556 | 2,588,093 | 2,244,693 | 16.1 | 9,358,664 | 8,344,765 | 12.2 |
Electricity s ales to final customers | 1,057,154 | 999,208 | 940,161 | 12.4 | 3,953,867 | 4,631,460 | (14.6) |
Electricity s ales to distributors | 118,852 | 191,626 | 183,502 | (35.2) | 666,645 | 657,869 | 1.3 |
Use of the main distribution grid | 792,016 | 756,634 | 735,512 | 7.7 | 3,144,611 | 3,001,546 | 4.8 |
Construction revenue | 216,343 | 182,978 | 220,077 | (1.7) | 717,351 | 849,275 | (15.5) |
Fair value of as sets from the indemnity for the concess ion | 6,179 | 3,856 | 3,361 | 83.8 | 16,199 | 131,738 | (87.7) |
Sectorial assets and liabilities result | 381,121 | 417,889 | 110,470 | 245.0 | 718,826 | (1,079,662) | - |
Other operating revenues | 33,891 | 35,902 | 51,610 | (34.3) | 141,165 | 152,539 | (7.5) |
OPERATING COSTS AND EXPENSES | (2,565,952) | (2,525,258) | (2,215,886) | 15.8 | (9,071,359) | (8,502,377) | 6.7 |
Electricity purchased for res ale | (1,537,746) | (1,699,739) | (1,313,226) | 17.1 | (5,717,970) | (4,893,230) | 16.9 |
Charges of main transmission grid | (213,018) | (153,458) | (126,208) | 68.8 | (554,805) | (642,753) | (13.7) |
Personnel and management | (267,143) | (175,991) | (285,618) | (6.5) | (822,963) | (804,974) | 2.2 |
Pension and healthcare plans | (40,177) | (37,887) | (41,597) | (3.4) | (154,285) | (163,329) | (5.5) |
Materials and supplies | (18,731) | (13,716) | (12,954) | 44.6 | (60,320) | (59,178) | 1.9 |
Third-party services | (89,069) | (88,110) | (82,446) | 8.0 | (347,393) | (348,479) | (0.3) |
Depreciation and amortization | (71,298) | (71,294) | (69,031) | 3.3 | (285,835) | (274,180) | 4.3 |
Provisions and reversals | (80,037) | (59,408) | (8,510) | 840.5 | (252,516) | (299,944) | (15.8) |
Construction cost | (216,343) | (182,978) | (220,077) | (1.7) | (717,351) | (849,275) | (15.5) |
Other cos t and expenses | (32,390) | (42,677) | (56,219) | (42.4) | (157,921) | (167,035) | (5.5) |
PROFIT BEFORE FINANCIAL RESULTS AND TAXES | 39,604 | 62,835 | 28,807 | 37.5 | 287,305 | (157,612) | - |
FINANCIAL RESULTS | 33,030 | 27,697 | (24,253) | - | 37,057 | (4,983) | - |
Financial income | 68,784 | 158,638 | 102,145 | (32.7) | 380,597 | 396,880 | (4.1) |
Financial expenses | (35,754) | (130,941) | (126,398) | (71.7) | (343,540) | (401,863) | (14.5) |
OPERATIONAL EXPENSES/ INCOME | 72,634 | 90,532 | 4,554 | - | 324,362 | (162,595) | - |
INCOME TAX AND SOCIAL CONTRIBUTION ON PROFIT | 13,146 | 91,708 | 45,012 | (70.8) | 22,893 | (17,851) | - |
Income tax and social contribution on profit | 16,852 | (12,408) | 51,677 | (67.4) | (47,571) | (314,842) | (84.9) |
Deferred income tax a nd social contribution on profit | (3,706) | 104,116 | (6,665) | (44.4) | 70,464 | 296,991 | (76.3) |
NET INCOME (LOSS) | 85,780 | 182,240 | 49,566 | 73.1 | 347,255 | (180,446) | - |
EBITDA | 110,902 | 134,129 | 97,838 | 13.4 | 573,140 | 116,568 | 391.7 |
65 |
* Amountssubject to rounding.
|
Earnings Release 4Q17 |
Income Statement – Copel Telecomunicações
Income Statement | 4Q17 | 3Q17 | 4Q16 | Var.% | 2017 | 2016 | Var.% |
(1) | (2) | (3) | (1/3) | (4) | (5) | (4/5) | |
NET OPERATING REVENUES | 100,299 | 99,436 | 88,325 | 13.6 | 380,550 | 325,115 | 17.1 |
Revenues from telecommunica tions | 89,534 | 89,868 | 79,234 | 13.0 | 340,821 | 289,441 | 17.8 |
Other operating revenues | 10,765 | 9,568 | 9,091 | 18.4 | 39,729 | 35,674 | 11.4 |
OPERATING COSTS AND EXPENSES | (87,187) | (67,714) | (72,939) | 19.5 | (286,363) | (241,848) | 18.4 |
Personnel and management | (34,047) | (23,499) | (35,332) | (3.6) | (107,874) | (101,397) | 6.4 |
Pension and healthcare plans | (3,961) | (3,495) | (4,791) | (17.3) | (14,800) | (18,827) | (21.4) |
Materials and s upplies | (1,152) | (654) | (660) | 74.5 | (2,978) | (2,044) | 45.7 |
Third-party services | (18,807) | (18,420) | (13,772) | 36.6 | (67,612) | (46,552) | 45.2 |
Deprecia tion and amortization | (10,813) | (9,742) | (9,153) | 18.1 | (39,553) | (34,645) | 14.2 |
Provisions and reversals | (3,366) | (2,515) | 543 | - | (11,957) | (7,251) | 64.9 |
Other cost and expenses | (15,041) | (9,389) | (9,774) | 53.9 | (41,589) | (31,132) | 33.6 |
PROFIT BEFORE FINANCIAL RESULTS AND TAXES | 13,112 | 31,722 | 15,386 | (14.8) | 94,187 | 83,267 | 13.1 |
FINANCIAL RESULTS | (6,440) | (3,551) | 763 | - | (18,863) | (9,611) | - |
Income tax and social contribution on profit | 3,627 | 3,662 | 2,339 | 55.1 | 11,828 | 13,489 | (12.3) |
Deferred income tax and social contribution on profit | (10,067) | (7,213) | (1,576) | 538.8 | (30,691) | (23,100) | 32.9 |
OPERATIONAL EXPENSES / INCOME | 6,672 | 28,171 | 16,149 | (58.7) | 75,324 | 73,656 | 2.3 |
INCOME TAX AND SOCIAL CONTRIBUTION ON PROFIT | 1,456 | (9,413) | 3,588 | (59.4) | (21,272) | (15,324) | 38.8 |
Income tax and social contribution on profit | 2,411 | (8,239) | 3,369 | (28.4) | (21,810) | (19,003) | 14.8 |
Deferred income tax and social contribution on profit | (955) | (1,174) | 219 | - | 538 | 3,679 | (85.4) |
NET INCOME (LOSS) | 8,128 | 18,758 | 19,737 | (58.8) | 54,052 | 58,332 | (7.3) |
EBITDA | 23,925 | 41,464 | 24,539 | (2.5) | 133,740 | 117,912 | 13.4 |
66 |
* Amountssubject to rounding.
|
Earnings Release 4Q17 |
Balance Sheet by Company
|
|
|
|
|
|
|
|
|
|
| R$'000 |
Assets - Dec-17 | Geração e | Distribuição | Telecom | Compagas | Elejor | UEG | Comercialização | Other¹ | Holding | Eliminations | Consolidated |
Transmissão | Araucária | ||||||||||
CURRENT | 1,053,154 | 3,609,663 | 102,002 | 151,966 | 77,216 | 99,101 | 187,966 | 302,912 | 998,294 | (880,440) | 5,701,834 |
Cash and cash e quivalents | 299,234 | 174,468 | 31,977 | 84,079 | 37,905 | 51,264 | 97,068 | 207,247 | 56,833 | - | 1,040,075 |
Bonds and securities | - | - | - | - | - | - | 1,251 | - | 90 | - | 1,341 |
Collaterals a nd escrow accounts | - | 59,146 | - | 97 | - | - | - | - | 129 | - | 59,372 |
Customers | 345,736 | 2,184,280 | 44,453 | 44,161 | 25,380 | 39,151 | 73,027 | 40,811 | - | (63,759) | 2,733,240 |
Dividends receiva ble | 100,193 | - | - | - | - | - | 2,008 | 12,966 | 459,464 | (493,816) | 80,815 |
CRC transferred to the State Government of Pa raná | - | - | - | - | - | - | - | - | 167,109 | - | 167,109 |
Sectorial financial assets | - | 171,609 | - | - | - | - | - | - | - | - | 171,609 |
Account receivable related to concession | 149,744 | - | - | - | - | - | - | - | - | - | 149,744 |
Other current receivables | 76,247 | 307,261 | 3,100 | 1,561 | 4,722 | 1,284 | 297 | 7,979 | 8,287 | (1,387) | 409,351 |
Inventories | 29,063 | 71,653 | 7,356 | 2,487 | - | - | - | - | - | - | 110,559 |
Income tax and socia l contribution | 6,522 | 440,040 | 8,154 | 19,440 | - | 7,402 | 1,773 | 4,299 | 14,055 | - | 501,685 |
Other current recoverable taxes | 18,257 | 160,547 | 6,825 | - | - | - | 11,998 | 329 | 276 | - | 198,232 |
Prepaid e xpenses | 9,366 | 21,090 | 61 | 141 | 9,209 | - | - | - | - | - | 39,867 |
Rela ted parties | 18,792 | 19,569 | 76 | - | - | - | 544 | 29,281 | 292,051 | (321,478) | 38,835 |
NON-CURRENT | 14,413,433 | 7,919,925 | 952,739 | 480,944 | 598,234 | 427,229 | 20,403 | 2,931,439 | 16,973,088 | (17,237,621) | 27,479,813 |
Long Term Assets | 3,830,993 | 2,167,690 | 69,543 | 437,056 | 27,885 | 93,182 | 17,703 | 163,135 | 1,967,632 | (140,870) | 8,633,949 |
Bonds and s ecurities | 104,157 | 1,012 | - | 7,172 | - | 26,323 | - | 105,981 | - | - | 244,645 |
Other tempora ry investments | - | - | - | - | - | - | - | - | 18,727 | - | 18,727 |
Collaterals and e scrow accounts | - | 75,665 | - | - | - | - | - | - | - | - | 75,665 |
Customers | 111,953 | 121,363 | 27,766 | - | - | - | - | - | - | - | 261,082 |
CRC transferred to the State Government of Paraná | - | - | - | - | - | - | - | - | 1,349,253 | - | 1,349,253 |
Judicial deposits | 84,462 | 305,075 | 12,376 | 49,984 | 77 | 10,952 | 129 | 307 | 119,167 | - | 582,529 |
Sectoral financial a ssets | - | 171,609 | - | - | - | - | - | - | - | - | 171,609 |
Account receivable related to concession | 3,372,504 | 684,206 | - | 303,668 | - | - | - | - | - | - | 4,360,378 |
Accounts receivable related to the concession extension | 68,859 | - | - | - | - | - | - | - | - | - | 68,859 |
Other receivables | 21,604 | 29,758 | 104 | 76,122 | - | 16,647 | - | 5,181 | - | - | 149,416 |
Income tax and socia l contribution | 632 | 17,040 | - | - | - | - | - | - | 158,808 | - | 176,480 |
Deferred i ncome tax and s ocial contribution | - | 712,976 | 18,671 | - | 24,775 | 39,260 | 17,574 | - | 102,236 | - | 915,492 |
Other recovera ble taxes | 57,281 | 48,986 | 10,626 | - | - | - | - | 66 | 15 | - | 116,974 |
Prepaid Expenses | 9,541 | - | - | 110 | 3,033 | - | - | - | - | - | 12,684 |
Receivables from subsidiaries | - | - | - | - | - | - | - | 51,600 | 219,426 | (140,870) | 130,156 |
Investments | 4,247,219 | 1,362 | - | - | - | - | 2,457 | 782,081 | 15,003,023 | (17,472,552) | 2,563,590 |
Property, Plant and Equipment, net | 6,244,837 | - | 866,489 | - | 397,786 | 333,889 | 57 | 1,985,562 | 830 | - | 9,829,450 |
Intangible Assets | 90,384 | 5,750,873 | 16,707 | 43,888 | 172,563 | 158 | 186 | 661 | 1,603 | 375,801 | 6,452,824 |
TOTAL | 15,466,587 | 11,529,588 | 1,054,741 | 632,910 | 675,450 | 526,330 | 208,369 | 3,234,351 | 17,971,382 | (18,118,061) | 33,181,647 |
67 |
Amounts subject to rounding.
|
Earnings Release 4Q17 |
|
|
|
|
|
|
|
|
|
| R$'000 |
Assets - Dec-16 | Geração e | Distribuição | Telecom | Compagas | Elejor | UEG | Other¹ | Holding | Eliminations | Consolidated |
Transmissão | Araucária | |||||||||
CURRENT | 700,532 | 2,588,602 | 89,471 | 135,292 | 76,231 | 162,814 | 474,157 | 698,488 | (688,346) | 4,237,241 |
Cash a nd cash equivalents | 125,165 | 330,810 | 12,651 | 35,309 | 38,483 | 19,644 | 373,915 | 46,096 | - | 982,073 |
Bonds a nd securities | 13,301 | - | - | - | - | 122,043 | 1,156 | 149 | - | 136,649 |
Collaterals a nd escrow a ccounts | - | 1,056 | - | 110 | - | - | - | 128 | - | 1,294 |
Customers | 298,189 | 1,783,081 | 45,948 | 78,292 | 24,362 | - | 46,524 | - | (59,041) | 2,217,355 |
Dividends receivable | 66,178 | - | - | - | - | - | 10,559 | 485,263 | (490,242) | 71,758 |
Account receivable related to concession | 65,595 | - | - | - | - | - | - | - | - | 65,595 |
Other current receivables | 66,821 | 192,465 | 3,674 | 17,452 | 4,174 | 11,086 | 6,538 | 8,736 | (4,013) | 306,933 |
Inventories | 28,182 | 90,591 | 9,003 | 2,861 | - | - | - | - | - | 130,637 |
Income tax and s ocial contribution | 5,169 | 115,908 | 12,536 | 830 | - | 7,873 | 4,737 | 41,899 | - | 188,952 |
Other current recoverable taxes | 4,444 | 54,749 | 5,608 | - | - | 2,168 | 765 | 197 | - | 67,931 |
Prepaid expenses | 9,506 | 19,889 | 51 | 438 | 9,212 | - | - | - | - | 39,096 |
Related parties | 17,982 | 53 | - | - | - | - | 29,963 | 116,020 | (135,050) | 28,968 |
NON-CURRENT | 13,366,346 | 7,496,853 | 767,039 | 391,185 | 632,457 | 385,707 | 2,339,326 | 16,491,424 | (15,799,408) | 26,070,929 |
Long Term Assets | 3,503,258 | 1,982,110 | 79,853 | 152,676 | 35,700 | 77,955 | 141,104 | 2,506,318 | (137,110) | 8,341,864 |
Bonds and s ecurities | 92,817 | 1,467 | - | 6,636 | - | 28,832 | 94,176 | - | - | 223,928 |
Other temporary investments | - | - | - | - | - | - | - | 408,297 | - | 408,297 |
Collaterals and escrow a ccounts | - | 73,074 | - | - | - | - | - | - | - | 73,074 |
Customers | 111,953 | 117,459 | 41,374 | - | - | - | - | - | - | 270,786 |
CRC transferred to the State Government of Paraná | - | - | - | - | - | - | - | 1,522,735 | - | 1,522,735 |
Judicial deposits | 76,822 | 410,737 | 10,815 | 2,159 | 78 | 2,765 | 295 | 153,932 | - | 657,603 |
Account receivable related to concession | 3,050,151 | 614,806 | - | 83,378 | - | - | - | - | - | 3,748,335 |
Accounts receivable related to the concession extension | 67,401 | - | - | - | - | - | - | - | - | 67,401 |
Other receivables | 15,185 | 47,087 | 90 | 11,189 | - | - | - | - | - | 73,551 |
Income tax and s ocial contribution | 608 | 16,143 | - | - | - | - | - | 153,216 | - | 169,967 |
Deferred income tax a nd s ocial contribution | - | 627,179 | 18,101 | 49,181 | 26,074 | 46,358 | - | 47,462 | - | 814,355 |
Other recoverable taxes | 72,419 | 49,174 | 9,473 | - | - | - | 27 | 15 | - | 131,108 |
Prepaid Expenses | 15,902 | - | - | 133 | 9,548 | - | - | - | - | 25,583 |
Receivables from s ubsidiaries | - | 24,984 | - | - | - | - | 46,606 | 220,661 | (137,110) | 155,141 |
Investments | 3,737,380 | 1,362 | - | - | - | - | 680,331 | 13,981,308 | (16,065,431) | 2,334,950 |
Property, Plant and Equipment, net | 6,026,605 | - | 667,443 | - | 414,840 | 307,504 | 1,517,281 | 630 | - | 8,934,303 |
Intangible Assets | 99,103 | 5,513,381 | 19,743 | 238,509 | 181,917 | 248 | 610 | 3,168 | 403,133 | 6,459,812 |
TOTAL | 14,066,878 | 10,085,455 | 856,510 | 526,477 | 708,688 | 548,521 | 2,813,483 | 17,189,912 | (16,487,754) | 30,308,170 |
¹ Wind Farms, Copel Renováveis a nd Copel Comercialização |
|
|
|
|
|
|
|
|
| |
68 |
Amounts subject to rounding.
|
Earnings Release 4Q17 |
Liabilities - Dec-17 | Geração e | Distribuição | Telecom | Compagas | Elejor | UEG Araucária | Comercialização | Other¹ | Holding | Eliminations | Consolidated |
Transmissão | |||||||||||
CURRENT | 1,941,599 | 2,872,432 | 114,511 | 147,743 | 164,574 | 38,386 | 73,107 | 581,110 | 1,057,679 | (881,227) | 6,109,914 |
Social charges and accruals | 81,040 | 188,369 | 25,586 | 8,800 | 284 | 291 | 2,410 | 210 | 6,977 | - | 313,967 |
Associated companies and parent company | 22,561 | 30,746 | 5,319 | - | - | - | 1,101 | 257,084 | 3,936 | (320,747) | - |
Suppliers | 177,970 | 1,129,475 | 42,392 | 89,756 | 3,328 | 5,539 | 65,664 | 233,236 | 2,096 | (65,879) | 1,683,577 |
Income Tax and Social Contribution payable | 45,277 | - | - | - | 36,964 | - | 22 | 1,580 | 2,467 | - | 86,310 |
Other taxes | 130,256 | 192,079 | 9,002 | 6,583 | 2,079 | 1,536 | 23 | 3,453 | 476 | - | 345,487 |
Loans and financing | 103,003 | 325,219 | 5,936 | - | - | - | - | 29,201 | 322,092 | (785) | 784,666 |
Debentures | 947,310 | 262,246 | 7,415 | 25,138 | 30,370 | - | - | 20,242 | 339,341 | - | 1,632,062 |
Dividends payable | 297,500 | 98,968 | 15,405 | 15,573 | 24,055 | 30,718 | 3,717 | 28,873 | 267,988 | (493,816) | 288,981 |
Post employment benefits | 13,551 | 37,680 | 1,900 | - | - | - | 6 | 31 | 57 | - | 53,225 |
Customer charges due | 8,393 | 141,632 | - | - | - | - | - | - | - | - | 150,025 |
Research and development a nd energy efficiency | 83,642 | 191,359 | - | - | 7,467 | 298 | - | - | - | - | 282,766 |
Payables related to concession | 4,213 | - | - | - | 58,411 | - | - | - | - | - | 62,624 |
Sectorial financial liabilities | - | 192,819 | - | - | - | - | - | - | - | - | 192,819 |
Other accounts payable | 26,883 | 81,840 | 1,556 | 1,893 | 1,616 | 4 | 164 | 7,200 | 249 | - | 121,405 |
Provisions for litigation | - | - | - | - | - | - | - | - | 112,000 | - | 112,000 |
NON-CURRENT | 5,104,056 | 3,204,453 | 457,035 | 87,409 | 449,149 | 22,470 | 1,751 | 665,277 | 1,690,445 | (140,085) | 11,541,960 |
Associated companies and parent company | - | - | - | - | - | - | - | 51,600 | - | (51,600) | - |
Suppliers | 30,105 | - | - | 13,364 | - | - | - | - | - | - | 43,469 |
Deferred income tax a nd social contribution | 132,274 | - | - | 17,475 | - | - | - | 6,881 | - | - | 156,630 |
Tax liabilities | 177,077 | 618,527 | 7,933 | - | - | 3,237 | 131 | 306 | 2,365 | - | 809,576 |
Loans and financing | 1,673,034 | 383,783 | 10,401 | - | - | - | - | 332,086 | 664,020 | (88,485) | 2,974,839 |
Debentures | 2,149,524 | 741,743 | 392,766 | 17,537 | - | - | - | 261,206 | 876,140 | - | 4,438,916 |
Post-employment benefi ts | 215,059 | 552,708 | 32,869 | 5,658 | - | 628 | 1,464 | 497 | 3,995 | - | 812,878 |
Research and development a nd energy efficiency | 36,235 | 194,869 | - | - | - | 18,605 | - | - | - | - | 249,709 |
Payables related to the concession | 43,181 | - | - | - | 449,149 | - | - | - | - | - | 492,330 |
Sectorial financial liabilities | - | 90,700 | - | - | - | - | - | - | - | - | 90,700 |
Other payables | 22,149 | 4,098 | - | 33,223 | - | - | - | 12,549 | 830 | - | 72,849 |
Tax, social security, labor and civil provisions | 625,418 | 618,025 | 13,066 | 152 | - | - | 156 | 152 | 143,095 | - | 1,400,064 |
EQUITY | 8,420,932 | 5,452,703 | 483,195 | 397,758 | 61,727 | 465,474 | 133,511 | 1,987,964 | 15,223,258 | (17,096,749) | 15,529,773 |
Attributable to controlling shareholders | 8,420,932 | 5,452,703 | 483,195 | 397,758 | 61,727 | 465,474 | 133,511 | 1,987,964 | 15,223,258 | (17,403,264) | 15,223,258 |
Capital | 5,459,598 | 4,746,053 | 316,098 | 220,966 | 35,503 | 707,440 | 66,289 | 1,495,153 | 7,910,000 | (13,047,100) | 7,910,000 |
Advance for Future Capital Increase | 54,829 | 374,000 | - | - | - | - | 24,070 | 1,261,785 | - | (1,714,684) | - |
Equity valuation adjustments | 881,136 | 1,509 | 5,998 | (657) | 256 | - | (668) | 1,646 | 895,601 | (889,220) | 895,601 |
Legal Reserves | 464,846 | 117,233 | 20,315 | 25,917 | 7,100 | - | 2,508 | 4,080 | 844,398 | (641,999) | 844,398 |
Retained earnigs | 1,560,523 | 213,908 | 140,784 | 151,532 | - | - | 41,312 | 40,672 | 5,573,259 | (2,148,731) | 5,573,259 |
Additional proposed dividends | - | - | - | - | 18,868 | - | - | - | - | (18,868) | - |
Accrued earnings (losses) | - | - | - | - | - | (241,966) | - | (815,372) | - | 1,057,338 | - |
Attributable to noncontrolling interests | - | - | - | - | - | - | - | - | - | 306,515 | 306,515 |
TOTAL | 15,466,587 | 11,529,588 | 1,054,741 | 632,910 | 675,450 | 526,330 | 208,369 | 3,234,351 | 17,971,382 | (18,118,061) | 33,181,647 |
¹ Wind Farms , Copel Renováveis and Copel Participações |
|
|
|
|
|
|
|
|
|
| |
69 |
Amounts subject to rounding.
|
Earnings Release 4Q17 |
|
|
|
|
|
|
|
|
|
| R$'000 |
Liabilities - Dec-16 | Geração e | Distribuição | Telecom | Compagas | Elejor | UEG Araucária | Other¹ | Holding | Eliminations | Consolidated |
Transmissão | ||||||||||
CURRENT | 1,708,931 | 2,740,992 | 172,651 | 180,133 | 142,222 | 62,253 | 268,120 | 1,069,839 | (689,105) | 5,656,036 |
Social charges and accruals | 71,249 | 178,348 | 21,159 | 6,529 | 259 | 261 | 4,419 | 5,573 | - | 287,797 |
Associated companies and parent company | - | 135 | 85,490 | - | - | - | 49,351 | - | (134,976) | - |
Suppliers | 136,139 | 867,410 | 15,753 | 136,869 | 3,193 | 30,494 | 126,607 | 2,225 | (63,051) | 1,255,639 |
Income Tax and Social Contribution payable | 18,329 | - | - | 6,438 | 14,453 | - | 2,234 | - | - | 41,454 |
Other taxes | 124,805 | 145,664 | 9,482 | 6,938 | 2,039 | 770 | 4,884 | 412 | - | 294,994 |
Loans and financing | 684,078 | 299,299 | 5,932 | - | - | - | 28,981 | 453,288 | (836) | 1,470,742 |
Debentures | 170,923 | 524,036 | 2,764 | 21,826 | 40,488 | - | 20,013 | 351,148 | - | 1,131,198 |
Dividends payable | 261,685 | 149,500 | 28,910 | 1,176 | 12,281 | 30,718 | 16,377 | 256,426 | (490,242) | 266,831 |
Post employment benefits | 12,156 | 33,649 | 1,868 | - | - | - | 33 | 188 | - | 47,894 |
Customer charges due | 6,379 | 135,333 | - | - | - | - | - | - | - | 141,712 |
Research a nd development and energy efficiency | 64,409 | 160,947 | - | - | 6,157 | - | - | - | - | 231,513 |
Payables related to concession | 4,107 | - | - | - | 62,103 | - | - | - | - | 66,210 |
Sectorial financial liabilities | - | 155,261 | - | - | - | - | - | - | - | 155,261 |
Other accounts payable | 154,672 | 91,410 | 1,293 | 357 | 1,249 | 10 | 15,221 | 579 | - | 264,791 |
NON-CURRENT | 4,379,635 | 2,538,482 | 237,704 | 46,716 | 486,765 | 20,422 | 703,229 | 1,386,559 | (144,790) | 9,654,722 |
Associated companies and parent company | - | - | - | - | - | - | 46,685 | - | (46,685) | - |
Suppliers | 36,711 | - | - | - | - | - | - | - | - | 36,711 |
Deferred income tax and s ocial contribution | 175,265 | - | - | - | - | - | 3,165 | - | - | 178,430 |
Ta x liabilities | 173,483 | 117,054 | 7,389 | - | - | 2,841 | 304 | 2,075 | - | 303,146 |
Loans and financing | 1,228,746 | 502,161 | 16,094 | - | - | - | 356,147 | 562,072 | (89,669) | 2,575,551 |
Debentures | 1,984,421 | 492,188 | 171,420 | 39,960 | 30,496 | - | 275,175 | 665,951 | - | 3,659,611 |
Post-employment benefits | 199,495 | 480,246 | 30,313 | 4,826 | - | - | 3,574 | 3,517 | - | 721,971 |
Research a nd development and energy efficiency | 50,995 | 183,800 | - | - | - | 17,581 | - | - | - | 252,376 |
Payables related to the concession | 43,063 | - | - | - | 456,269 | - | - | - | - | 499,332 |
Sectorial financial liabilities | - | 123,731 | - | - | - | - | - | - | - | 123,731 |
Other payables | 20,579 | - | - | 257 | - | - | 18,125 | - | (8,436) | 30,525 |
Ta x, social security, labor and civil provisions | 466,877 | 639,302 | 12,488 | 1,673 | - | - | 54 | 152,944 | - | 1,273,338 |
EQUITY | 7,978,312 | 4,805,981 | 446,155 | 299,628 | 79,701 | 465,846 | 1,842,134 | 14,733,514 | (15,653,859) | 14,997,412 |
Attributable to controlling shareholders | 7,978,312 | 4,805,981 | 446,155 | 299,628 | 79,701 | 465,846 | 1,842,134 | 14,733,514 | (15,917,757) | 14,733,514 |
Capital | 4,429,898 | 4,176,841 | 316,097 | 220,966 | 35,503 | 707,440 | 905,376 | 7,910,000 | (10,792,121) | 7,910,000 |
Advance for Future Capital Increase | 979,500 | 498,000 | - | - | - | - | 1,566,180 | - | (3,043,680) | - |
Equity valuation a djustments | 954,718 | 31,270 | 6,058 | (406) | 256 | - | (1,338) | 998,466 | (990,558) | 998,466 |
Legal Reserves | 427,895 | 99,870 | 17,612 | 22,639 | 7,100 | - | 3,848 | 792,716 | (578,964) | 792,716 |
Retained earnigs | 1,186,301 | - | 106,388 | 56,429 | - | - | 38,831 | 5,032,332 | (1,387,949) | 5,032,332 |
Additional proposed dividends | - | - | - | - | 36,842 | - | 16,711 | - | (53,553) | - |
Accrued earnings (losses) | - | - | - | - | - | (241,594) | (687,474) | - | 929,068 | - |
Attributable to noncontrolling interests | - | - | - | - | - | - | - | - | 263,898 | 263,898 |
TOTAL | 14,066,878 | 10,085,455 | 856,510 | 526,477 | 708,688 | 548,521 | 2,813,483 | 17,189,912 | (16,487,754) | 30,308,170 |
¹ Wind Farms, Copel Renováveis and Copel Participações |
|
|
|
|
|
|
|
|
| |
70 |
Amounts subject to rounding.
|
Earnings Release 4Q17 |
Income Statement by Company
|
|
|
|
|
|
|
|
|
|
|
| R$'000 |
Income Statement 4Q17 | Geração e Transmissão |
|
|
| UEG Araucária |
|
|
| Elimin. e Reclassif. |
| ||
|
| Distribuição | Telecom | Compagas | Elejor | Comercialização | Other¹ | Holding | Consolidated | |||
Generation | Transmission | |||||||||||
NET OPERATING INCOME | 627,512 | 196,857 | 2,605,556 | 100,299 | 145,782 | 72,551 | 128,001 | 299,632 | 43,697 | - | (309,223) | 3,910,664 |
Electricity sales to final customers | 158,006 | - | 1,057,154 | - | - | - | - | 44,781 | - | - | (1,026) | 1,258,915 |
Electricity sales to distributors | 460,445 | - | 118,852 | - | - | 72,551 | 128,000 | 254,653 | 43,697 | - | (198,355) | 879,843 |
Use of the main distribution a nd transmission grid (TUSD/ TUST) | - | 137,509 | 792,016 | - | - | - | - | - | - | - | (74,206) | 855,319 |
Construction revenue | - | 56,840 | 216,343 | - | 3,008 | - | - | - | - | - | - | 276,191 |
Fair value of assets from the indemnity for the concession | - | - | 6,179 | - | 42,476 | - | - | - | - | - | - | 48,655 |
Telecommunications | - | - | - | 89,534 | - | - | - | - | - | - | (7,637) | 81,897 |
Distribution of piped gas | - | - | - | - | 100,298 | - | - | - | - | - | (5,553) | 94,745 |
Sectoral assets and liabilities result | - | - | 381,121 | - | - | - | - | - | - | - | - | 381,121 |
Other operating revenues | 9,061 | 2,508 | 33,891 | 10,765 | - | - | 1 | 198 | - | - | (22,446) | 33,978 |
OPERATING COSTS AND EXPENSES | (575,341) | (185,478) | (2,565,952) | (87,187) | 69,197 | (28,608) | (115,821) | (285,662) | (50,925) | (102,411) | 310,064 | (3,618,124) |
Energy purchased for resale | (147,468) | - | (1,537,746) | - | - | (10,669) | - | (294,315) | (11) | - | 197,933 | (1,792,276) |
Charges of the main distribution and transmission grid | (76,275) | - | (213,018) | - | - | (3,171) | (6,150) | - | (5,068) | - | 73,910 | (229,772) |
Personnel and management | (66,553) | (41,141) | (267,143) | (34,047) | (11,963) | (897) | (842) | (3,997) | (6,626) | 9,859 | - | (423,350) |
Private pension and health plans | (9,641) | (6,044) | (40,177) | (3,961) | (1,358) | (52) | (713) | (410) | (656) | 927 | - | (62,085) |
Materials | (2,346) | (1,279) | (18,731) | (1,152) | (446) | (49) | (100) | (3) | (29) | (155) | - | (24,290) |
Raw material and supplies - energy production | (6,506) | - | - | - | - | - | (73,823) | - | - | - | 5,359 | (74,970) |
Natural gas and supplies for gas business | - | - | - | - | (61,628) | - | - | - | - | - | - | (61,628) |
Third-party services | (23,199) | (6,986) | (89,069) | (18,807) | (5,393) | (2,984) | (8,029) | (302) | (6,252) | (3,602) | 28,600 | (136,023) |
Depreciation and amortization | (65,125) | (1,653) | (71,298) | (10,813) | (7,260) | (6,826) | (5,986) | (2) | (12,941) | (304) | - | (182,208) |
Provisions a nd reversals | (137,037) | (48,056) | (80,037) | (3,366) | 128,012 | - | - | (94) | (14,700) | (113,173) | 99 | (268,352) |
Construction cost | - | (78,420) | (216,343) | - | (3,008) | - | - | - | - | - | - | (297,771) |
Other operating costs a nd expenses | (41,191) | (1,899) | (32,390) | (15,041) | 32,241 | (3,960) | (20,178) | 13,461 | (4,642) | 4,037 | 4,163 | (65,399) |
EQUITY IN EARNINGS OF SUBSIDIARIES | (57,696) | 45,522 | - | - | - | - | - | 2 | (61,316) | 273,116 | (152,605) | 47,023 |
OPERATIONAL EXPENSES / INCOME | (5,525) | 56,901 | 39,604 | 13,112 | 214,979 | 43,943 | 12,180 | 13,972 | (68,544) | 170,705 | (151,764) | 339,563 |
FINANCIAL RESULTS | (76,858) | (24,457) | 33,030 | (6,440) | (29,501) | (21,780) | 5,599 | 567 | (27,060) | (45,059) | (741) | (192,700) |
Income tax and social contribution on profit | 6,180 | 2,762 | 68,784 | 3,627 | 17,521 | (5,585) | 12,063 | 585 | 5,735 | 57,030 | (4,454) | 164,248 |
Deferred income tax and social contribution on profit | (83,038) | (27,219) | (35,754) | (10,067) | (47,022) | (16,195) | (6,464) | (18) | (32,795) | (102,089) | 3,713 | (356,948) |
EARNINGS BEFORE INCOME TAXES | (82,383) | 32,444 | 72,634 | 6,672 | 185,478 | 22,163 | 17,779 | 14,539 | (95,604) | 125,646 | (152,505) | 146,863 |
INCOME TAX AND SOCIAL CONTRIBUTION ON PROFIT | 105,687 | 28,517 | 13,146 | 1,456 | (68,505) | (6,553) | (26,327) | (4,908) | (3,440) | (25,716) | - | 13,357 |
NET INCOME | 23,304 | 60,961 | 85,780 | 8,128 | 116,973 | 15,610 | (8,548) | 9,631 | (99,044) | 99,930 | (152,505) | 160,220 |
Attributed to controlling shareholders | 23,304 | 60,961 | 85,780 | 8,128 | 59,656 | 10,927 | (6,838) | 9,631 | (99,044) | 99,930 | (152,505) | 99,930 |
Attributed to non-controlling interest | - | - | - | - | 57,317 | 4,683 | (1,710) | - | - | - | - | 60,290 |
EBITDA | 59,600 | 58,554 | 110,902 | 23,925 | 222,239 | 50,769 | 18,166 | 13,974 | (55,603) | 171,009 | (151,764) | 521,771 |
¹ Wind Farms, Copel Renováveis and Copel Participações
71 |
Amounts subject to rounding.
|
Earnings Release 4Q17 |
|
|
|
|
|
|
|
|
|
|
| R$'000 |
| Geração e Transmissão | Distribuição | Telecom | Compagas | Elejor | UEG | Other¹ | Holding | Elimin. e | Consolidated | |
Income Statement 4Q16 | Generation | Transmission | Araucária | Reclassif. | |||||||
NET OPERATING INCOME | 634,271 | 241,818 | 2,244,693 | 88,325 | 109,678 | 70,150 | - | 44,694 | - | (136,577) | 3,297,052 |
El ectricity sales to fi nal customers | 157,495 | - | 940,161 | - | - | - | - | 3,583 | - | (708) | 1,100,531 |
El ectricity sales to distributors | 466,938 | - | 183,502 | - | - | 70,150 | - | 41,090 | - | (80,572) | 681,108 |
Us e of the main distribution and transmission grid (TUSD/ TUST) | - | 120,505 | 735,512 | - | - | - | - | - | - | (28,382) | 827,635 |
Construction revenue | - | 118,979 | 220,077 | - | 5,921 | - | - | - | - | - | 344,977 |
Fair value of assets from the indemnity for the concession | - | - | 3,361 | - | 69 | - | - | - | - | - | 3,430 |
Telecommunications | - | - | - | 79,235 | - | - | - | - | - | (5,003) | 74,232 |
Distribution of piped gas | - | - | - | - | 103,602 | - | - | - | - | (720) | 102,882 |
Sectoral assets and liabilities result | - | - | 110,470 | - | - | - | - | - | - | - | 110,470 |
Other operating revenues | 9,838 | 2,334 | 51,610 | 9,090 | 86 | - | - | 21 | - | (21,192) | 51,787 |
OPERATING COSTS AND EXPENSES | (386,379) | (206,995) | (2,215,886) | (72,939) | (171,633) | (22,924) | (114,032) | (370,905) | 20,638 | 144,932 | (3,396,123) |
Energy purchased for resale | (11,763) | - | (1,313,226) | - | - | (6,354) | - | (7,454) | - | 80,570 | (1,258,227) |
Charges of the main distribution and transmission grid | (73,755) | - | (126,208) | - | - | (2,835) | (5,967) | (3,668) | - | 27,744 | (184,689) |
Personnel and management | (57,983) | (51,346) | (285,618) | (35,332) | (6,900) | (817) | (1,009) | (10,031) | (8,869) | - | (457,905) |
Private pension and health plans | (8,492) | (8,215) | (41,597) | (4,791) | (1,613) | (31) | (97) | (1,049) | (1,519) | - | (67,404) |
Materials | (2,462) | (1,428) | (12,954) | (660) | (420) | (67) | (142) | (59) | (173) | - | (18,365) |
Raw material and supplies - energy production | (7,904) | - | - | - | - | - | (1,590) | - | - | 719 | (8,775) |
Na tural gas and supplies for gas business | - | - | - | - | (61,177) | - | - | - | - | - | (61,177) |
Third-party services | (18,195) | (8,095) | (82,446) | (13,772) | (5,999) | (3,045) | (28,350) | (5,358) | (7,166) | 24,490 | (147,936) |
Depreciation and amortiza tion | (60,474) | (1,676) | (69,031) | (9,153) | (7,036) | (6,728) | (5,978) | (15,815) | (297) | - | (176,188) |
Provisions and reversals | (109,898) | (1,990) | (8,510) | 543 | (90,265) | - | (69,073) | (322,820) | (10,073) | 8,357 | (603,729) |
Construction cost | - | (127,722) | (220,077) | - | (5,921) | - | - | - | - | - | (353,720) |
Other operating costs and expenses | (35,453) | (6,523) | (56,219) | (9,774) | 7,698 | (3,047) | (1,826) | (4,651) | 48,735 | 3,052 | (58,008) |
EQUITY IN EARNINGS OF SUBSIDIARIES | (470,366) | 24,965 | - | - | - | - | - | (304,364) | (172,268) | 969,860 | 47,827 |
PROFIT BEFORE FINANCIAL RESULTS AND TAXES | (222,474) | 59,788 | 28,807 | 15,386 | (61,955) | 47,226 | (114,032) | (630,575) | (151,630) | 978,215 | (51,244) |
FINANCIAL RESULTS | (115,075) | 6,533 | (24,253) | 763 | (2,877) | (17,782) | (143,511) | (7,609) | (58,949) | - | (362,760) |
Income tax and social contribution on profit | 31,412 | 8,781 | 102,145 | 2,339 | 3,646 | 1,001 | (6,316) | 10,280 | 49,929 | (1,550) | 201,667 |
Deferred income tax and social contribution on profit | (146,487) | (2,248) | (126,398) | (1,576) | (6,523) | (18,783) | (137,195) | (17,889) | (108,878) | 1,550 | (564,427) |
EARNINGS BEFORE INCOME TAXES | (337,549) | 66,321 | 4,554 | 16,149 | (64,832) | 29,444 | (257,543) | (638,184) | (210,579) | 978,215 | (414,004) |
INCOME TAX AND SOCIAL CONTRIBUTION ON PROFIT | 7,072 | 37,819 | 45,012 | 3,588 | 23,507 | (9,513) | 46,358 | (6,925) | (771) | - | 146,147 |
NET INCOME | (330,477) | 104,140 | 49,566 | 19,737 | (41,325) | 19,931 | (211,185) | (645,109) | (211,350) | 978,215 | (267,857) |
Attributed to controlling shareholders | (330,477) | 104,140 | 49,566 | 19,737 | (21,076) | 13,952 | (168,947) | (645,109) | (211,350) | 64,022 | (211,350) |
Attributed to non-controlling interest | - | - | - | - | (20,249) | 5,979 | (42,238) | - | - | - | (56,507) |
EBITDA | (162,000) | 60,182 | 97,838 | 24,539 | (54,919) | 53,954 | (108,054) | (614,760) | (151,333) | 978,215 | 124,944 |
¹ Wind Farms, Copel Renováveis and Copel Participações
72 |
Amounts subject to rounding.
|
Earnings Release 4Q17 |
|
|
|
|
|
|
|
|
|
|
|
| R$'000 |
Income Statement 2017 | Geração e Transmissão | Distribuição | Telecom | Compagas | Elejor | UEG | Comercialização | Other¹ | Holding | Elimin. e | Consolidated | |
Generation | Transmission | Araucária | Reclassif. | |||||||||
NET OPERATING INCOME | 2,588,751 | 821,153 | 9,358,664 | 380,550 | 515,563 | 291,597 | 129,084 | 664,495 | 203,221 | - | (928,505) | 14,024,573 |
Electricity sales to fi nal customers | 615,249 | - | 3,953,867 | - | - | - | - | 115,905 | - | - | (3,488) | 4,681,533 |
Electricity sales to distributors | 1,935,996 | - | 666,645 | - | - | 291,597 | 128,953 | 547,989 | 203,221 | - | (598,047) | 3,176,354 |
Use of the main distribution a nd transmission grid (TUSD/ TUST) | - | 673,597 | 3,144,611 | - | - | - | - | - | - | - | (200,267) | 3,617,941 |
Construction revenue | - | 136,336 | 717,351 | - | 14,314 | - | - | - | - | - | - | 868,001 |
Fair value of a ssets from the i ndemnity for the concession | - | - | 16,199 | - | 40,881 | - | - | - | - | - | - | 57,080 |
Telecommunications | - | - | - | 340,821 | - | - | - | - | - | - | (31,869) | 308,952 |
Distribution of piped gas | - | - | - | - | 460,368 | - | - | - | - | - | (5,553) | 454,815 |
Sectoral a ssets a nd liabilities result | - | - | 718,826 | - | - | - | - | - | - | - | - | 718,826 |
Other operating revenues | 37,506 | 11,220 | 141,165 | 39,729 | - | - | 131 | 601 | - | - | (89,281) | 141,071 |
OPERATING COSTS AND EXPENSES | (1,569,528) | (546,510) | (9,071,359) | (286,363) | (309,213) | (93,230) | (121,883) | (654,445) | (125,120) | (128,389) | 921,109 | (11,984,931) |
Energy purchased for resale | (361,227) | - | (5,717,970) | - | - | (27,894) | (788) | (654,026) | (110) | - | 596,565 | (6,165,450) |
Charges of the main distribution a nd transmission grid | (300,943) | - | (554,805) | - | - | (12,001) | (24,180) | - | (17,364) | - | 197,263 | (712,030) |
Personnel a nd management | (195,923) | (122,515) | (822,963) | (107,874) | (35,761) | (3,557) | (2,729) | (12,993) | (20,574) | (18,455) | - | (1,343,344) |
Private pension a nd health plans | (35,788) | (22,733) | (154,285) | (14,800) | (3,577) | (133) | (969) | (1,415) | (1,954) | (1,943) | - | (237,597) |
Materials | (11,397) | (4,732) | (60,320) | (2,978) | (1,936) | (312) | (376) | (27) | (415) | (631) | - | (83,124) |
Ra w material a nd supplies - energy production | (26,809) | - | - | - | - | - | (75,910) | - | - | - | 5,359 | (97,360) |
Na tural gas a nd supplies for gas business | - | - | - | - | (309,542) | - | - | - | - | - | - | (309,542) |
Third-party s ervices | (85,676) | (24,609) | (347,393) | (67,612) | (22,670) | (12,167) | (39,524) | (1,280) | (20,292) | (14,265) | 113,973 | (521,515) |
Depreciation a nd a mortization | (265,654) | (7,201) | (285,835) | (39,553) | (28,753) | (27,704) | (23,936) | (9) | (51,751) | (1,203) | - | (731,599) |
Provisions a nd reversals | (110,756) | (80,103) | (252,516) | (11,957) | 123,007 | - | 69,073 | (156) | (979) | (93,756) | (7,396) | (365,539) |
Construction cost | - | (272,216) | (717,351) | - | (14,314) | - | - | - | - | - | - | (1,003,881) |
Other operating costs a nd expenses | (175,355) | (12,401) | (157,921) | (41,589) | (15,667) | (9,462) | (22,544) | 15,461 | (11,681) | 1,864 | 15,345 | (413,950) |
EQUITY IN EARNINGS OF SUBSIDIARIES | (27,176) | 93,144 | - | - | - | - | - | (564) | (65,670) | 1,291,434 | (1,183,652) | 107,516 |
OPERATIONAL EXPENSES / INCOME | 992,047 | 367,787 | 287,305 | 94,187 | 206,350 | 198,367 | 7,201 | 9,486 | 12,431 | 1,163,045 | (1,191,048) | 2,147,158 |
FINANCIAL RESULTS | (356,841) | (110,394) | 37,057 | (18,863) | (25,612) | (54,254) | (475) | 6,193 | (84,483) | (146,543) | (2) | (754,217) |
Income tax and social contribution on profit | 30,512 | 13,313 | 380,597 | 11,828 | 38,821 | 13,493 | 7,529 | 6,515 | 27,247 | 181,312 | (11,857) | 699,310 |
Deferred income tax and s ocial contribution on profi t | (387,353) | (123,707) | (343,540) | (30,691) | (64,433) | (67,747) | (8,004) | (322) | (111,730) | (327,855) | 11,855 | (1,453,527) |
EARNINGS BEFORE INCOME TAXES | 635,206 | 257,393 | 324,362 | 75,324 | 180,738 | 144,113 | 6,726 | 15,679 | (72,052) | 1,016,502 | (1,191,050) | 1,392,941 |
INCOME TAX AND SOCIAL CONTRIBUTION ON PROFIT | (123,061) | (30,515) | 22,893 | (21,272) | (66,785) | (47,893) | (7,098) | (2,638) | (15,441) | 17,124 | - | (274,686) |
NET INCOME | 512,145 | 226,878 | 347,255 | 54,052 | 113,953 | 96,220 | (372) | 13,041 | (87,493) | 1,033,626 | (1,191,050) | 1,118,255 |
Attributed to controlling shareholders | 512,145 | 226,878 | 347,255 | 54,052 | 58,116 | 67,354 | (298) | 13,041 | (87,493) | 1,033,626 | (1,191,050) | 1,033,626 |
Attributed to non-controlling i nterest | - | - | - | - | 55,837 | 28,866 | (74) | - | - | - | - | 84,629 |
EBITDA | 1,257,701 | 374,988 | 573,140 | 133,740 | 235,103 | 226,071 | 31,137 | 9,495 | 64,182 | 1,164,248 | (1,191,048) | 2,878,757 |
73 |
Amounts subject to rounding.
|
Earnings Release 4Q17 |
|
|
|
|
|
|
|
|
|
|
| R$'000 |
Income Statement 2016 | Geração e Transmissão | Distribuição | Telecom | Compagas | Elejor | UEG | Other¹ | Holding | Elimin. e | Consolidated | |
Generation | Transmission | Araucária | Reclassif. | ||||||||
NET OPERATING INCOME | 2,442,491 | 1,492,829 | 8,344,765 | 325,115 | 542,822 | 263,686 | 57,432 | 203,535 | - | (570,922) | 13,101,753 |
Electri city s ales to fi nal cus tomers | 599,109 | - | 4,631,460 | - | - | - | - | 4,613 | - | (3,677) | 5,231,505 |
Electri city s ales to di stributors | 1,806,995 | - | 657,869 | - | - | 263,686 | 57,432 | 198,901 | - | (308,811) | 2,676,072 |
Use of the main di stribution and trans mi ss ion gri d (TUSD/ TUST) | - | 1,079,056 | 3,001,546 | - | - | - | - | - | - | (104,019) | 3,976,583 |
Cons truction revenue | - | 405,242 | 849,275 | - | 25,125 | - | - | - | - | - | 1,279,642 |
Fai r val ue of a ssets from the i ndemnity for the concessi on | - | - | 131,738 | - | 1,003 | - | - | - | - | - | 132,741 |
Tel ecommunications | - | - | - | 289,442 | - | - | - | - | - | (27,861) | 261,581 |
Distribution of pi ped ga s | - | - | - | - | 516,331 | - | - | - | - | (44,446) | 471,885 |
Sectoral a s sets and l iabi l ities result | - | - | (1,079,662) | - | - | - | - | - | - | - | (1,079,662) |
Other operating revenues | 36,387 | 8,531 | 152,539 | 35,673 | 363 | - | - | 21 | - | (82,108) | 151,406 |
OPERATING COSTS AND EXPENSES | (1,279,825) | (605,202) | (8,502,377) | (241,848) | (534,817) | (96,321) | (259,324) | (462,872) | 123,890 | 579,350 | (11,279,346) |
Energy purchased for resa le | (60,821) | - | (4,893,230) | - | - | (31,088) | - | (9,260) | - | 308,795 | (4,685,604) |
Charges of the mai n di stribution and tra nsmi ssi on grid | (276,600) | - | (642,753) | - | - | (10,529) | (22,551) | (14,451) | - | 100,641 | (866,243) |
Personnel and mana gement | (185,173) | (116,966) | (804,974) | (101,397) | (32,765) | (3,284) | (2,936) | (26,062) | (30,861) | - | (1,304,418) |
Pri va te pension and heal th plans | (39,712) | (24,171) | (163,329) | (18,827) | (3,596) | (96) | (316) | (4,031) | (5,689) | - | (259,767) |
Ma teria ls | (11,786) | (5,017) | (59,178) | (2,044) | (1,768) | (286) | (451) | (286) | (647) | - | (81,463) |
Raw ma teria l and suppl ies - energy production | (24,550) | - | - | - | - | - | (53,247) | - | - | 44,445 | (33,352) |
Na tural gas and s uppl ies for gas bus iness | - | - | - | - | (325,413) | - | - | - | - | - | (325,413) |
Thi rd-party s ervi ces | (80,645) | (24,030) | (348,479) | (46,552) | (20,082) | (11,767) | (82,031) | (18,808) | (24,331) | 106,232 | (550,493) |
Depreciation and a mortization | (267,202) | (3,697) | (274,180) | (34,645) | (25,251) | (26,887) | (23,530) | (51,734) | (1,170) | - | (708,296) |
Provi sions and reversa ls | (142,311) | (10,209) | (299,944) | (7,251) | (91,724) | - | (69,073) | (322,947) | 166,334 | 8,429 | (768,696) |
Cons truction cost | - | (406,345) | (849,275) | - | (25,125) | - | - | - | - | - | (1,280,745) |
Other operating costs and expens es | (191,025) | (14,767) | (167,035) | (31,132) | (9,093) | (12,384) | (5,189) | (15,293) | 20,254 | 10,808 | (414,856) |
EQUITY IN EARNINGS OF SUBSIDIARIES | (462,952) | 117,970 | - | - | - | - | - | (260,997) | 772,080 | 55,594 | 221,695 |
OPERATIONAL EXPENSES / INCOME | 699,714 | 1,005,597 | (157,612) | 83,267 | 8,005 | 167,365 | (201,892) | (520,334) | 895,970 | 64,022 | 2,044,102 |
FINANCIAL RESULTS | (360,116) | (87,199) | (4,983) | (9,611) | (1,422) | (93,717) | (121,501) | (43,050) | (13,057) | - | (734,656) |
Income tax a nd social contribution on profi t | 79,150 | 21,339 | 396,880 | 13,489 | 13,551 | 3,879 | 16,825 | 33,430 | 321,056 | (3,046) | 896,553 |
Defe rred income ta x and socia l contribution on profi t | (439,266) | (108,538) | (401,863) | (23,100) | (14,973) | (97,596) | (138,326) | (76,480) | (334,113) | 3,046 | (1,631,209) |
EARNINGS BEFORE INCOME TAXES | 339,598 | 918,398 | (162,595) | 73,656 | 6,583 | 73,648 | (323,393) | (563,384) | 882,913 | 64,022 | 1,309,446 |
INCOME TAX AND SOCIAL CONTRIBUTION ON PROFIT | (215,103) | (220,512) | (17,851) | (15,324) | (1,632) | (24,525) | 46,358 | (16,187) | (54,914) | - | (519,690) |
NET INCOME | 124,495 | 697,886 | (180,446) | 58,332 | 4,951 | 49,123 | (277,035) | (579,571) | 827,999 | 64,022 | 789,756 |
Attri buted to control l ing s harehol ders | 124,495 | 697,886 | (180,446) | 58,332 | 2,525 | 34,386 | (221,628) | (579,571) | 827,999 | 64,022 | 827,999 |
Attri buted to non-controll ing i nterest | - | - | - | - | 2,426 | 14,737 | (55,407) | - | - | - | (38,243) |
EBITDA | 966,916 | 1,008,012 | 116,568 | 117,912 | 33,256 | 194,252 | (178,362) | (468,600) | 897,140 | 64,022 | 2,752,398 |
¹ Wi nd Farms, Copel Renovávei s and Copel Participações |
|
|
|
|
|
|
|
|
|
| |
74 |
Amounts subject to rounding.
| COMPANHIA PARANAENSE DE ENERGIA – COPEL | ||
| By: | /S/ Antonio Sergio de Souza Guetter | |
Antonio Sergio de Souza Guetter Chief Executive Officer | ||
This press release may contain forward-looking statements. These statements are statements that are not historical facts, and are based on management's current view and estimates of future economic circumstances, industry conditions, company performance and financial results. The words "anticipates", "believes", "estimates", "expects", "plans" and similar expressions, as they relate to the company, are intended to identify forward-looking statements. Statements regarding the declaration or payment of dividends, the implementation of principal operating and financing strategies and capital expenditure plans, the direction of future operations and the factors or trends affecting financial condition, liquidity or results of operations are examples of forward-looking statements. Such statements reflect the current views of management and are subject to a number of risks and uncertainties. There is no guarantee that the expected events, trends or results will actually occur. The statements are based on many assumptions and factors, including general economic and market conditions, industry conditions, and operating factors. Any changes in such assumptions or factors could cause actual results to differ materially from current expectations.