Companhia Paranaense de Energia - COPEL (ELP)
Filed: 28 May 19, 2:54pm
Indicate by check mark whether the registrant by furnishing the information contained in this Form is also thereby furnishing the information to the Commission pursuant to Rule 12g3-2(b) under the Securities Exchange Act of 1934.
Yes _______ No ___X____![]()
Companhia Paranaense de Energia
Corporate Taxpayer's ID (CNPJ/MF) 76.483.817/0001-20
State registration 10146326-50
Publicly-Held Company- CVM 1431-1
copel@copel.com
Rua Coronel Dulcídio, 800, Batel – Curitiba - PR
CEP 80420-170
MANAGEMENTS’ REPORT
AND
FINANCIAL STATEMENTS
2018
![]()
SUMÁRIO
2
![]()
MESSAGE FROM THE CEO
Copel presented in 2018 solid financial results and expanded its business. In a year of political transition and with a macroeconomic scenario of an ongoing recovering, Copel recorded an EBITDA of 3.143.3 million, 9,4% above than what was recorded last year, and a net profit of R$1,444.0 million, and has experienced a growth of 29.1%.
The figures reflect a consistentcost reduction program, improvements in efficiency and a strict discipline in the allocation of capital.Concurrently, concluded a long cycle of investments in its generation and transmission facilities in the ten States in which the Company operates.Highlights of this process include the conclusion of the hydroelectric power plants of Colíder (300 MW of installed capacity and an investment of R$2.4 billion), and Baixo Iguaçu (350 MW and R$2.5 billion), with Copel holding a 30% ownership interest, as well as Cutia and Bento Miguel wind farm complexes (312 MW and R$2.1 billion), with the production beginning in 2019.
More than the expansion of Copel’s generator park, we will begin to reap the benefits of our investmentswith an incremental revenue of approximately R$450 million henceforth the current year, when we project an investment of approximately R$2 billion in the Company business.Those investments include the start of work of SHP Bela Vista, acquired in an auction last year, and of the transmission lines concentrated in the State of Paraná.
Copel Energia, our trading subsidiary also made a significant step forward in 2018.Having been established less than two years ago, it showed a 102% increase in its revenues, and already ranks as one of the largest traders in Brazil in terms of traded volume.The objective is to expand the market share even more with the Copel brand reputation as its driving force.
In the distribution segment, Copel improved, in the last two years, in 73% the efficiency of the EBITDA achieved in relation to the estimated regulatory EBITDA. There is also a realistic expectation that it will be achieved in 2019, when the investment in the segment shall amount to R$835 million.Currently Copel Distribuição presents its main supply quality indices — System Average Interruption Duration Index (SAIDI) and the Customer Average Interruption Duration Index (CAIDI) which are below the regulatory limits, a factor that contributed to the Company being recognized as the best distributor in Brazil, in the opinion of its customers, as well as by the Brazilian Electricity Regulatory Agency (Aneel).
We launched Smart Copel, the most modern distribution operations center in Brazil, in the district of Novo Mundo in Curitiba.The unit will gradually centralize the system management—undertaking the function that was originally performed in five regions of the State— , and already allows to remote control the electrical system, identifying problems quickly and controlling the quality of supply in real time, among other features.
Considering the transformation that the distribution segment is currently undergoing, innovation in investment is vital, and it is focusing on the construction of infrastructure for the future smart cities. Our grids modernization program shall continue with the implementation of innovations that are the result of more thana decade of working with smart grids operation.These include smart grid automation and remote-control technologies, installation of smart meters and pioneering research and development projects in Brazil.
3
![]()
In 2018, Ipiranga, in the interior of Paraná State, became the first city in Brazil to be entirely covered by smart meters and reclosers integrated into a single communication system.The second project to utilize this concept shall fully cover the cities of São José dos Pinhais and Tijucas do Sul, serving 126,000 consumers.Copel set of innovations also includes the largest research on current energy storage in Brazil. And microgeneration tests from the biomass of agribusiness, which holds enormous potential for exploration in Paraná.
Electrical mobility is another important innovation investment, with the 2018 inauguration of the largest networking of charging stations in Brazil. This includes 11 electric car charging stations that connect Paraná from East to West, along more than 700 kilometers between Paranaguá Harbor and the city of Foz do Iguaçu.
The basis for all these investments and results stands in our corporate governance.In December 2018, Copel have received a certification for Governance by B3 Stock Exchange, being the only state-owned enterprise to have receive such recognition.Furthermore, seeking to become a reference in sustainability we consolidated last year our role as protagonists through the articulation of key figures in the Southern Region of Brazil in pursuit of Sustainable Development Objectives (SDO).For this purpose, the Company, which leads the regional front of the Global Pact Cities Program since 2017, started to host, at its facilities in Curitiba, in 2018, the `Local Hub 2030’, event which is directly linked to the United Nations (UN).
The achieved results reflect Copel’s largest asset, more than 7,600 employees which spare no efforts to provide a service of excellence, and whom in 2018 have ranked us among the 150 Best Companies to Work For, in a survey by Você S/A Magazine.
It is with great courage and confidence that we face the challenges of 2019. We have started a new cycle for the Company with limitless energy to collaborate as an indispensable driver of economic growth and, accordingly, serve our customers, partners and society in general.
Daniel Pimentel Slaviero
Copel CEO
4
![]()
1. ORGANIZAtIONAL profile
Copel was created in October 1954 and is the largest company in Paraná State in equity and net revenue.It operates with cutting-edge technology in the areas of generation, transmission, commercialization and distribution of energy, as well as in telecommunications and natural gas.
It operates a comprehensive and effective electrical system with its own generating plants, transmission lines, substations, electrical lines and grids of the distribution system, and a modern telecommunications system that integrates all the cities of the State.
Although the Company is headquartered in Curitiba, Copel is present in ten other Brazilian states as follows:

5
![]()
· Participation in the Market
Main Products(%) |
| Brazil | Southern Region | Paraná |
Electricity generation(1) |
| 3,1 | (2) (3) 21,1 | (2) (3) 49,3 |
Electricity transmission(4) |
| 2.4 | 11,6 | 21,6 |
Electricity distribution(5) |
| (6) 6,2 | (6) 33,8 | (7)97,3 |
Gas distribution(7) |
| 3,0 | 23,4 | 100,0 |
Telecommunications(8) | 0,6 | 3,4 | 8,8 | |
(1) Installed capacity. Equity interest of Copel and wind farms are not included. | ||||
(2) Itaipu Power Plant not included | ||||
(3) Paranapanema river power plants not included | ||||
(4) The market refers to Permitted Annual Revenues - RAP | ||||
(5) Distribution wire market | ||||
(6) Source: Empresa de Pesquisa Energética - EPE | ||||
(7)Estimated | ||||
(8)Number of hits | ||||
6
![]()
· Awards and Certifications in 2018
|
|
Awards / Certifications | Certification Body |
Abradee Award - Management Quality | Associação Brasileira de Distribuidores de Energia Elétrica - Abradee |
Award - Best Distribuition Company (Bronze Category) | Comisíon de Integración Energética Regional - CIER América Latina |
Clima Paraná Ouro Seal | Governo do Estado do Paraná |
Award -150 Great to Work | Você S/A Magazine |
Certificado Empresa Cidadã - information presetend at Social Report | Conselho Regional de Contabilidade do Rio de Janeiro, Sistema Firjan e Fecomércio |
Award - 500 Largest Companies in the South -Large company in Paraná State | Amanhã Magazine |
Award - 500 Largest Companies in the South - Highest Net Revenue in the Energy Sector | Amanhã Magazine |
Award - 500 Largest Companies in the South - Highest Net Revenue and Highest Net Equity among the 100 Largest Companies in Paraná | Amanhã Magazine |
Sesi ODS Award- Recognition of practices in support of sustainable development objectives - industry category | Sesi Paraná |
ODS Sesi Seal -Optical fiber recycling | SESI - Serviço Social da Indústria |
Data center Merit | Anuário telecom |
IASC Brazil Award - Concessionaries with more than 400.000 Consumer Units | Aneel |
IASC South Award - Concessionaries with more than 400.000 Consumer Units | Aneel |
Award - Best in Management | FNQ - Fundação Nacional da Qualidade |
Better Social and Environmental Practices | Benchmarking Brasil |
Viva Voluntário (Voluntary Work) | Governo Federal |
Best Fleet Management in Latin America | Instituto Parar |
Professionals of the Year award | Organizações Globo |
Carbon-Zero Certificate | Biofílica |
Best Fleet Management in Latin America | Anuário telecom |
Abraconee Award Best 2017 Financial Statement Disclosure - 1st place in the Holding Category of the electric energy sector. | Associação Brasileira dos Contadores do Setor de Energia Elétrica - Abraconee |
Abraconee Award Best 2017 Financial Statement Disclosure - 3td place in the category large companies of the electric energy sector. | Associação Brasileira dos Contadores do Setor de Energia Elétrica - Abraconee |
Leading State-Owned Company in Governance | B3 S.A. - Brasil, Bolsa, Balcão |
Business Sustainability Index | B3 S.A. - Brasil, Bolsa, Balcão |
The more transparent public company in Brazil | Transparência Internacional - Trac Brasil |
10 years issuing the greehouse gas emission | GHG Protocol |
Recognition for the implantation of the nursing support rooms | Ministry of Health |
Broadband operator with highest overall satisfaction score | Anatel |
7
![]()
· Strategic Reference
Copel's actions and management decisions are directed by the guidelines established in its Mission, Vision and Values, as follows:
Mission:Provide energy and sustainable development solutions.
Vision:To be a reference in the businesses in which it operates generating value in a sustainable way.
Values:
· Ethics:Result of a collective agreement that defines individual behaviors in line with a common goal.
· Respect for people:Taking others into account.
· Commitment:Ability to engage intensely and completely in the work, contributing to the achievement of the organization’s goals.
· Transparency:Accountability of the decisions and achievements of the company to report its positive or negative aspects to all stakeholders.
· Safety and Health:Healthy working environment in which workers and managers collaborate to use a process of continuous improvement of the protection and promotion of safety, health and well-being for all.
· Responsibility:Conducting the company's life in a sustainable manner, respecting the rights of all stakeholders, including the future generations, and the commitment to sustaining all life forms.
· Innovation:Applying ideas in processes, products or services in order to improve something that already exists or to build something different and better.
8
![]()
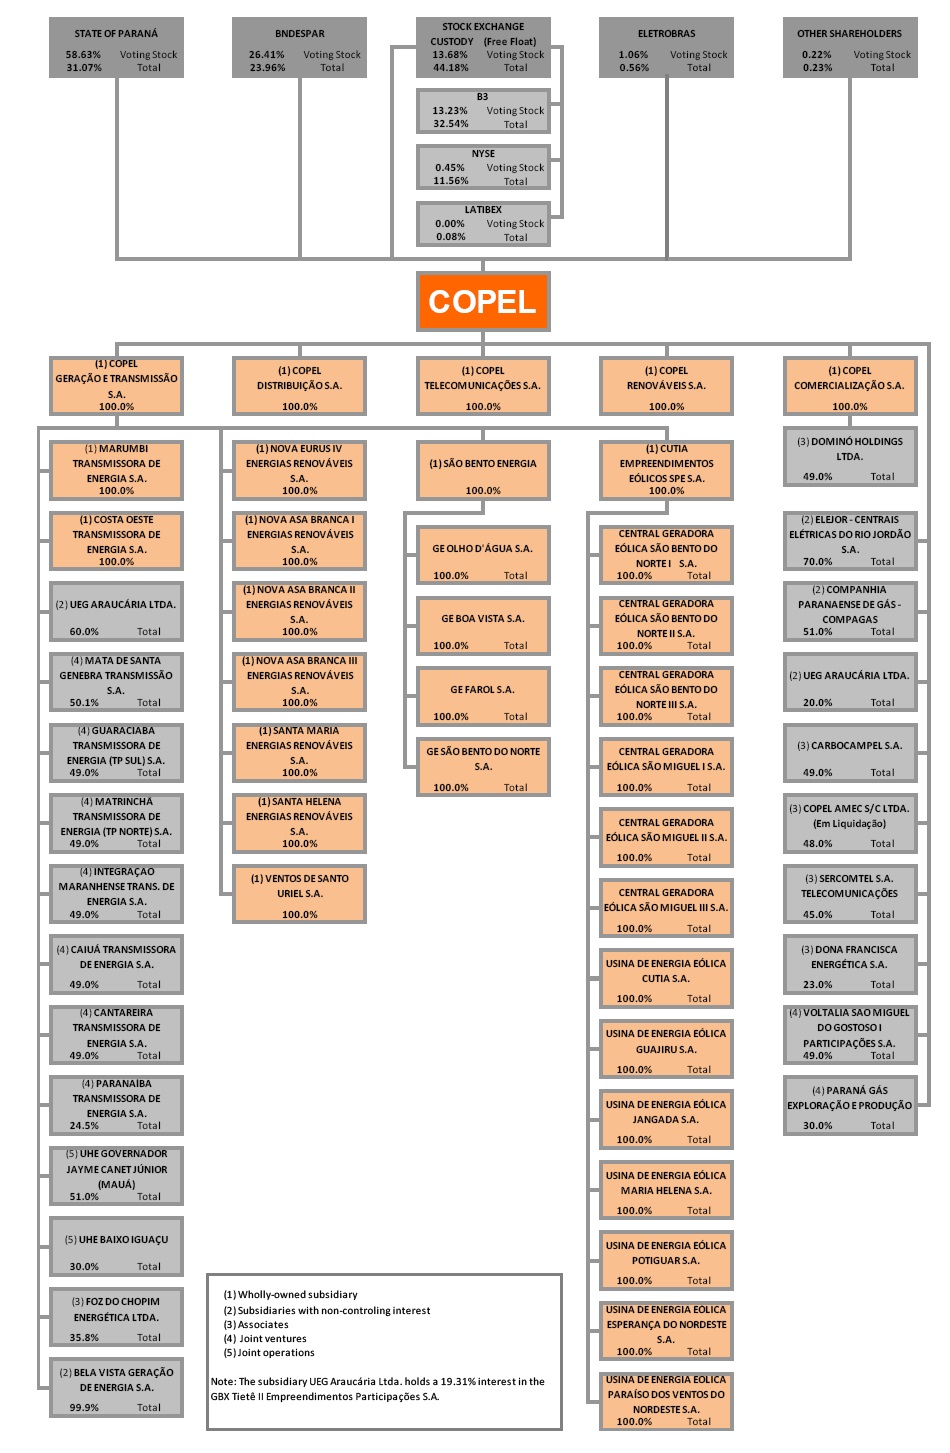
Organizational structure
The following chart shows the Copel's shareholding structure on December 31, 2018:
9
![]()
· Copel in Numbers
| 2018 | 2017 | variation % |
Accounting Indicators |
|
|
|
Total assets | 35,930,100 | 33,162,377 | 8.3 |
Cash and cash equivalents | 1,948,409 | 1,040,075 | 87.3 |
Bonds and securities | 344,296 | 219,663 | 56.7 |
Total debt | 11,565,438 | 9,830,483 | 17.6 |
Net debt | 9,272,733 | 8,570,745 | 8.2 |
Gross operating revenues | 23,725,810 | 21,574,289 | 10.0 |
Deductions from revenues | 8,791,030 | 7,549,716 | 16.4 |
Net operating revenues | 14,934,780 | 14,024,573 | 6.5 |
Operating costs and expenses | 12,676,621 | 11,984,931 | 5.8 |
Equity in earnings of investees | 135,888 | 101,739 | 33.6 |
Equity pick-up | 2,258,159 | 2,039,642 | 10.7 |
EBTIDA or LAJIDA | 3,143,226 | 2,872,980 | 9.4 |
Financial result | (438,050) | (748,440) | (41.5) |
IRPJ/CSLL | 511,993 | 274,686 | 86.4 |
Operating profit | 1,955,997 | 1,392,941 | 40.4 |
Net income for the year | 1,444,004 | 1,118,255 | 29.1 |
Shareholder's Equity | 16,336,214 | 15,510,503 | 5.3 |
Interest on shareholder's equity | 280,000 | 266,000 | 5.3 |
Dividends | 98,542 | 23,401 | 321.1 |
Economic and Financial Indicators |
|
|
|
Current liquidity (index) | 1.0 | 0.9 | 11.1 |
Overall liquidity (index) | 0.9 | 0.8 | 12.5 |
EBTIDA Margin (%) | 21.0 | 20.5 | 2.4 |
Earnings per share - Common Shares | 4.91091 | 3.60754 | 36.1 |
Earnings per share - Class "A" preferred shares | 5.40201 | 3.96830 | 36.1 |
Earnings per share - Class "B" preferred shares | 5.40201 | 3.96830 | 36.1 |
Equity value per share – R$ (shareholders’ equity/number of shares) | 59.7 | 56.7 | 5.3 |
Debt on shareholders' equity (%) | 70.8 | 63.4 | 11.7 |
Operating margin (operating profit / net operating revenue) (%) | 13.1 | 9.9 | 32.3 |
Net margin (net income/net operating revenues) (%) | 9.7 | 8.0 | 21.3 |
Participation of third-party capital (%) | 54.5 | 53.2 | 2.4 |
Return on shareholders' equity (%)(1) | 9.3 | 7.5 | 24.0 |
(1) LL ÷ (initial PL) |
10
![]()
2. corporate governance
In addition to Law 13,303/2016, Copel's management has as a reference the Code of Best Corporate Governance Practices, from the Brazilian Corporate Governance Institute (IBGC), CVM Instruction 586/2017, the decisions of the Securities and Exchange Commission - SEC, and the Sarbanes-Oxley Act - SOX.The Company has a Corporate Governance Policy, in which establishes its responsibility, objectives and commitments, based on the principles of transparency, equity, accountability and corporate responsibility.
COPEL has improved its corporate governance practices to fully comply with legal requirements, the Brazilian Securities and Exchange Commission (CVM) regulations, the B3 Issuer Regulations and the strict practices imposed by the US legislation for companies listed on the New York Stock Exchange, aligned with the best corporate governance practices.
It was the first company in the Brazilian electric sector to be listed on the New York Stock Exchange, in 1997.Its brand is also present in the European Economic Community since June 2002 due to its entry into Latibex - the Latin American arm of the Madrid Stock Exchange (Spain).In Brazil, Copel is a member of B3's Corporate Governance at Level 1.In December 2018, the Company received the certification in the Governance of State-Owned Enterprises Program of the Brazilian stock exchange.
Among the advances made in 2018, we highlight:
· the revision of the Bylaws of Copel (Holding) and its wholly-owned subsidiaries (SIs), which have incorporated improvements beyond the provisions of the State-Owned Enterprises Law, strengthening the Company's corporate governance;
· the establishment of guidelines and rules for the nomination of members to the boards of Copel (Holding) and SIs, and to the boards of their direct or indirect ownership interests in line with the relevant legislation and with the agreements with the CVM; and
· the establishment of guidelines and rules for the management of the Company's ownership interests, seeking to maximize the efficiency, efficacy and effectiveness of its business, contribute to Copel’s sustainability and ownership interests, reduce exposure to risks and strengthen the internal control environment with the objective of avoiding fraud and reducing the financial losses generated by the process’s inefficiency.
In addition to these advances, other corporate governance measures that deserve special mention are the management of fraud and corruption risks in the operations; of conflicts of interest; damage to reputation; and the adoption of anticompetitive practices.
11
![]()
2.1.Governance Structure
The Company's governance structure is as follows:

General meeting of shareholders
It is the Company’s highest authority, with powers to decide on all businesses related to its corporate purpose.It is governed by relevant legislation.
Nomination and evaluation committee
Committee with the authority to support the shareholder in the verification of the compliance of the nomination and evaluation process of the board members, members of the supervisory board and members of the statutory committees of Copel (Holding) and its wholly-owned subsidiaries, such authority may be extended to its direct and indirect ownership interests, pursuant to relevant legislation.
12
![]()
Fiscal Council
A body that is independent from Management, which purpose is to inspect the actions undertaken by officers and members of the board of directors and provide an opinion on the Company's accounts.
Board of Directors - BOD
Strategic and collegiate decision-making body, responsible for defining the Company's highest level of guidance, protecting its assets, verifying compliance with its corporate purpose, and being responsible for guiding the executive board in order to maximize return on investment, adding value to the business in a sustainable manner.
Executive Board
Executive management and representation body of Copel (Holding), with responsibility for ensuring the regular operation of the Company, in line with the general strategy outlined by the Board of Directors.It is composed of a CEO, a Chief Executive Officer, a Chief Financial and Investor Relations Officer, a Chief Legal and Institutional Relations Officer, a Chief Business Development Officer, and a Chief Governance, Risk and Compliance Officer.The Company also has a Deputy Officer.
The Chief Financial and Investor Relations Officer of Copel (Holding) is responsible for performing the unpaid function of Chief Financial Officer of the wholly-owned subsidiaries, unless specific legislation determines nomination of an exclusive officer.
It is incumbent upon the Company's Chief Legal and Institutional Relations Officer to perform the unpaid function of Chief Legal and Institutional Relations Officer for Copel GeT, Copel DIS, Copel Energia and Copel REN.
Statutory Audit Committee
Advisory body to the Board of Directors, composed mostly of independent members, chosen from among the members of the Board of Directors and in accordance with relevant legislation.This body is intended to protect the interests of shareholders and other stakeholders by monitoring the quality of financial statements and internal controls, as well as the organization's compliance, integrity, and risk management.
Board of Ethical Guidance
A body linked to the Chief Executive Officer, whose purpose is to ensure that Copel's ethical and moral position remains at elevated levels with respect to civil society.
Committee of disclosure of material acts and relevant facts
A body linked to the Financial and Investor Relations Office whose purpose is to manage the Company's Information Disclosure and Preservation of Confidentiality Policy, responsible for approving the information to be disclosed to the market and for monitoring and providing privileged information to the area responsible for communicating with regulatory agencies and other capital market agents.
13
![]()
Financial Committee (ad hoc)
A committee intended to advise the Board of Directors of Copel (Holding), with competencies related to economic and financial matters of the Company, and its wholly-owned subsidiaries, subsidiaries and associates.
Standing Compensation Committee
A body linked to the Enterprise Management Office/ Business Management Board responsible for preparing and proposing a policy to establish compensation of managers and members of the supervisory board of Copel's wholly-owned subsidiaries, subsidiaries and associates.
Internal Audit
An independent, non-statutory body linked to the CEO, responsible for assessing the effectiveness of the risk management process and the adequacy of actions for handling and internal control mechanisms, as well as providing advice to the Supervisory Board, Board of Directors, Statutory Audit Committee, Executive Board and other business areas.
· Integrity Program
In accordance with Federal Law 12,846/2013, Federal Decree 8,420/2015 and Federal Law 13,303/2016, Copel published in 2017 its Integrity Program, a set of internal mechanisms for integrity, ethics, transparency, risk management, internal controls, compliance, internal audit and application of the Code of Conduct, which must be observed by all employees, managers and members of the supervisory board.The purpose of the Program is to prevent, detect and remedy any acts that may have an impact on the Company.The initiative is coordinated by the Governance, Risk and Compliance Office, monitored by internal and external audit, and submitted to Copel’s Statutory Audit Committee.
The disclosure and dissemination of the Integrity Program and other compliance initiatives are digitally made from time to time across the Company. The content in its entirety can be accessed through Copel’s online internal and external channels, through the Compliance Portal.
· Anti-corruption practices
The operational processes are annually assessed for risks related to errors or fraud that may interfere with the results of the financial statements, and internal controls are established, submitted to tests by the Internal Audit and to the Independent Auditor, with results reported to Management.The tests occur annually beginning in October and are finalized with an assessment of the severity and magnitude of the weaknesses at the time of filing Form 20-F with the SEC in April of each year.
Taking into account the number of processes mapped to comply with the Sarbanes Oxley Act, 100% of Copel's operations were subject to risk assessments related to corruption.
14
![]()
The Company also carries out activities intended to safeguard the internal control environment and to comply with legal and regulatory requirements in force, particularly of SOX.The internal control structure complies with COSO standards, which is an internationally recognized reference framework. Copel uses tools provided by the ERP-SAP system.
· Reporting channels
In order to receive opinions, criticisms, complaints, claims and personal inquiries, Copel provides communication channels that, in addition to contributing to the fight against fraud and corruption, also expand the organization's relationship with its stakeholders.These are:
· Confidential Communication Channel: intended to receive complaints and communications regarding noncompliance with laws and regulations, particularly of fraud or irregularities involving finance, auditing or accounting matters.The channel guarantees protection, preservation of the identity of the person making the claim and an answer to the complaint.It is available 24 hours a day, seven days a week, toll-free call: 0800 643 5665. 0800 643 5665.
· Ombudsman: There are two channels open to all stakeholders, internal and external, for suggestions, claims and complaints, and are available on weekdays, from 8 am to 6 pm, with toll-free call.The Copel Distribuição Ombudsman is available through the phone number 0800 647 0606 and also through the email ouvidoria@copel.com.In addition, it can receive the complaints in person or through correspondence sent to its address at Rua Professor Brasilio Ovidio da Costa, 1703, Santa Quitéria, CEP: 80310-130, Curitiba - Paraná. 80310-130 Curitiba – PR.The Copel Telecomunicações Ombudsman is available through phone number 0800 649 3949 and through the email ouvidoriatelecom@copel.com, able to receive complaints in person or through correspondence sent to its address at Rua Comendador Araújo, 614, Batel, CEP: 80420-000, Curitiba - Paraná. 80420-000 Curitiba - PR.
· Commission for Analysis of Complaints of Harassment - CADAM: assists and supports every employee who is a victim of bullying in his or her work environment.The information is confidential, and both the complainant and the respondent have a guarantee of identity preservation. Email: cadam@copel.com. Email: cadam@copel.com
· Ethical Guidance Board - EGB: assesses and issues guidance on processes related to ethical conduct in the Company and has a maximum deadline of 90 days to offer a final answer. Email: conselho.etica@copel.com
· External Audit
Under the terms of Instruction 381/2003, of the Brazilian Securities and Exchange Commission, in an internal Corporate Governance standard and under the review and supervision of the Audit Committee, the Company and its wholly-owned subsidiaries have a contract with Deloitte Touche Tohmatsu AuditoresIndependentes since March 21, 2016, to provide audit services of the financial statements.The work necessary for the evaluation of the fiscal year will extend until June 30, 2019, date that will correspond to its final term, and may be formally extended by up to 24 months.
15
![]()
The Company changes the firm responsible for auditing its financial statements in accordance with the independent auditor's rotation criterion, in accordance with CVM Instruction 308/1999, and/or Law 8,666 /1993 - "Bid to Tender Law".
The contracted value for the period 2019-2020 is R$3.2 million. The amount paid for external audit services rendered in 2018 was R$3.8 million.
When hiring other services from its external auditors, the Company's practice foresees the prior analysis by the Audit Committee of the Board of Directors, which should take into account in this evaluation whether a relationship or service rendered by an independent auditor:(a) creates conflicting interests with its audit client; (b) puts them in a position to audit their own work; (c) results in working as manager or as employee of the audit client; or (d) puts them in a position of being an advocate to the audit client.
The Audit Committee also considers in this type of assessment if any service rendered by the independent audit firm may impair in fact or apparently the firm’s independence.Whenever necessary, the Audit Committee can count on the technical support of the Internal Audit, or independent advisory service for a technical evaluation that may be required in each specific case, the discussions on the hiring of other independent auditor services are recorded in the minutes of meeting of these boards.
The challenges of sustainability are part of Copel’s strategic reference contained in the mission and vision of business.The permanent search for improving the performance of the area of sustainability, as well as its communication with stakeholders and the management of matters and indicators are steps of this strategy.
Throughout its history, the Company has undertaken voluntary commitments that are recognized worldwide as best practices:
· Agenda 2030
· Global Compact
· Global Compact Cities Program
· National Movement ODS We Can
· Statement:Call to Action for Governments in the Fight against Corruption
· Business Pact for Integrity and Against Corruption
· Principles for Sustainable Business Education
16
![]()
3. OPERATING PERFORMANCE
In 2018 the Brazilian economy was shaped by several economic, political and institutional elements that were reflected in the slow recovery and the low economic growth of the country.At the end of May 2018, Brazil recorded the largest strike of recent times, when truck drivers, dissatisfied with diesel prices, blocked highways which caused significant shortages of food and fuel throughout the country. The external uncertainties provoked by a possible trade war between the United States and China, corroborated by the United Kingdom's exit from the European Union, caused great fluctuations in the UD Dollar and the stock market, which coupled with the internal tensions of the Brazilian electoral process contributed to lower economic growth estimates for 2018 still further. This perception was consolidated in the fall in market expectations for the national GDP as surveyed by the Focus Bulletin of the Central Bank, which, from a peak of 2.9% at the end of February, fell to 1.3% at the end of December. On the other hand, a fall in inflation rates and with the Central Bank of Brazil Overnight Interest Rate (SELIC) at its lowest level since 1998, aligned with a modest recovery in the labor market, contributed to the 1.3% expansion of Brazilian gross domestic product, as reported by the Brazilian Institute of Geography and Statistics - IBGE.
At the regional level, Paraná had already anticipated recovery from the crisis as from the second six-month period of 2016, reaping the excellent results of the performance in rural areas, when a record harvest of 41.5 million tons of grain was recorded in 2017.The estimate for 2018 was below the previous year, but with production levels higher than those observed in 2016, so that the positive effects of agricultural earnings were reflected in the industrial segments, directly linked to agriculture, as well as other sectors such as trade and services.In addition, the state’s manufacturing sector has been progressively recovering its production levels from the second six-month period of 2017, with especial focus on the automobile and pulp and paper industries, supported in part by the international market.Improvements in trade and service sector indices for the state of Paraná also posted significant growth, associated with several sectors of expanded retail trade.Given this scenario, the economy of Paraná recorded growth of 1.5% in 2018, according to data from the Paraná Institute of Economic and Social Development (IPARDES).
On July 5, 2017, the Ministry of Mines and Energy (MME) published a public inquiry containing a proposal for legal measures that will enable the future of the electric energy sector with long-term sustainability, titled "Enhancement of the Legal Framework of the Electric Sector."The public inquiry was held from July 5, 2017 to August 17, 2017 and received more than 209 contributions from a wide variety of segments.
On February 9, 2018, a document concluding the public inquiry and containing a compiled proposal for improvements to be made to the energy regulatory framework, driven in particular by technological, socialand environmental phenomena and by frictions in existing business models, was published on the website of that government ministry. These themes included discussions on the following:
17
![]()
· An end to the quota regime for hydroelectric power plants, either extended or under tender, established by Law 12,783/2013 and allocation of part of the economic benefit of grants to the Energy Development Account - CDE, with a view to reducing said charge to civil society;
· Reduction of access limits to the free energy market;
· Alignment of the short-term price setting to the operating cost of the system;
· Possibility of separation of guarantee and energy, currently sold in aggregate form;
· Effect of migrating consumers to the free market;
· Environmental attributes market;
· Attracting foreign capital to investments in the Brazilian electric energy sector;
· Rationalization of tariff discounts;
· Allocation of funds from the global reversion reserve to the transmission segment;
· Guidelines for the use of resources in research and development;
· Modernization of the regulated market; and
· Reduction of judicial involvement over hydrological risk.
In May 2018, most of the aforementioned improvements were added to the Bill drawn up by the Chamber of Deputies, Law 1,917 /2015, called Portabilidade da Conta da Luz - (electric energy bill portability law), as a substitute.The Bill is awaiting approval of that Chamber for subsequent submission and approval in the Senate and then the Presidential sanction.
If the project is converted into Law, there will also be a need for the supervenient regulation of these issues.For this reason, there are many uncertainties related to the future proposal of the energy sector.However, Copel monitors and works together to build a new regulatory framework, including, through intermediation of the associations that represent it, public hearings and inquiries instituted by the Concession Grantor and Aneel, with a view to mitigating risks and anticipating new opportunities for Company business.
· Extension of Concessions
Concessions of the generation, transmission and distribution segments are governed by Law 12,783 of January 11, 2013.
In the hydroelectric generation segment, for the concessions of plants covered by article 19 of Law 9,074 /1995 - which encompasses most Copel plants - the possibility of extending the physical guarantee quotas for up to a single 30-year period, through acceptance of express conditions as: regulated tariffs, energy allocation to the regulated market, and submission to quality standards.The thermoelectric power plant generation concession establishes the possibility of a single 20-year extension at the discretion of theconcession grantor provided that they ensure continuity, efficiency in the provision of the service and the security of the system are ensured.
18
![]()
In the transmission segment, to the electric energy transmission concessions covered by paragraph 5 of article 17 of Law 9,074 /1995, allow for the possibility of a single 30-year extension, one time, at the discretion of the concession grantor, in order to ensure continuity, efficiency in the provision of the service and low tariffs.
In the distribution segment, the electric energy distribution concessions covered by article 22 of Law 9,074 dated 1995, allow for the possibility of a single 30-year extension, one time, at the discretion of the concession grantor, in order to ensure continuity, efficiency in the provision of the service, low tariffs and compliance with operational and economic rationality criteria.
Generation Concessions
In 2014 and 2015, four Copel generation concessions expired:Rio dos Patos, with 1.8 MW; Governador Pedro Viriato Parigot de Souza Plant - GPS, with 260 MW; Mourão, with 8.2 MW; and Chopim I, with 1.8 MW of installed capacity.Once the extension conditions were known, analysis was carried out, which concluded that the extension of the concession for these plants was not feasible.The HPP Rios dos Patos had its concession expired, without further rebidding, due to lack of operational conditions.The Company signed an instrument committing to buy or sell the remaining assets. The amount negotiated was R$9.1 million.
The HPPs GPS and Mourão were resubmitted to tender by the concession grantor, for another 30 years, and the former one was obtained by Copel.The HPP Chopim 1 had its operating regime changed, as a result of the law, having the condition of registration passed in favor of the Company.
The Figueira Thermoelectric Power Plant concession expired on March 26, 2019. On May 24, 2017, the Company filed its intention to extend this concession, emphasizing, however, that it will sign the necessary contracts and/or amendments, only after knowing and accepting the contractual terms and the rules that will govern all process related to the extension of the grant.
Transmission Concessions
In 2015, COPEL's largest transmission concession, known as the Concession of Existing Installations or Contract No. 060/2001, was won. After being aware of the conditions for extension, analyzes and evaluations were made, opting for an extension of the transmission contract, for a further 30 years, in accordance with Law 12.783 / 2013, detailed in Note 10.4 to the Financial Statements.
Distribution Concessions
In 2015, Copel won the distribution concession agreement No. 046/1999.
In November 2015, by the Order of the Minister of Mines and Energy, Copel's request for extension of the concession was granted.In December of the same year, the fifth (5th) contractual addendum was entered into, which formalized the extension of Concession Agreement No. 46/1999 for another 30 years, subject to acceptance of new indicators of service quality and economic and financial sustainability.
19
![]()
The following table sets out the minimum economic-financial sustainability parameters defined for Copel Distribuição in the first five years of renewal:
Economic and Financial Management | Realizado | Quality - limits (a) | Quality - accomplished | ||||
Ano | Gestão Econômico-Financeira | SAIDIi(b) | CAIDIi(b) | SAIDIi | CAIDIi | ||
2016 | - | - | 13.61 | 9.24 | 10.80 | 7.14 | |
2017 | Lajida ≥ 0(d) |
| 661.4 | 12.54 | 8.74 | 10.41 | 6.79 |
2018 | Lajida (-) QRR ≥ 0(e) (f) | 11.23 | 8.24 | 10,29(c) | 6,20(c) | ||
2019 | {Net Debt / [Lajida (-) QRR ≥ 0]} ≤ 1 / (0,8 * Selic)(e)(g) | 10.12 | 7.74 | - | - | ||
2020 | {Net Debt / [Lajida (-) QRR ≥ 0]} ≤ 1 / (1,11 * Selic)(e)(g) | 9.83 | 7.24 | - | - | ||
(a) According to NT 0335/2015 Aneel. | |||||||
(b) DECi - Equivalent Duration of Interruption of Internal Origin per Consumer Unit; and FECi - Equivalent Frequency of Interruption of Internal Origin per Consumer Unit. | |||||||
(c)Preliminary data. | |||||||
(d)Amount will be presented in the Regulatory Accounting Statement. | |||||||
(e) QRR: Regulatory Reintegration Quota or Regulatory Depreciation Expenses. It will be the value defined in the last Periodic Tariff Review - RTP, plus the IPCA between the month prior to RTP and the month prior to the 12-month period of the economic-financial sustainability measurement. | |||||||
(f)Selic: limited to 12.87% a.a. | |||||||
The Company has achieved the annual indicators and reiterates its commitment to the economic sustainability of the concession and the continuity of the investments supported by cost control management, maximization of productivity and improvement of operational efficiency.
Gas Concessions
Companhia Paranaense de Gas - Compagas is the concessionaire responsible for the distribution of piped natural gas in the State of Paraná, whose concession was granted on July 6, 1994 for 30 years.On December 7, 2017, the State of Paraná has published the Supplementary Law No. 205, introducing a new interpretation of the expiry of the concession, understanding that the expiry will be on January 20, 2019.
The management of Compagas, its parent company and other shareholders questioned the effects of the aforesaid law since they understand that these conflict with the provisions of the concession agreement currently in force.Compagas filed a lawsuit challenging the early termination of the concession, obtaining on October 30, 2018 a preliminary injunction, which can be subject to an appeal by the State of Paraná.
20
![]()
· Energy Flow (% and GW /hour)

21
![]()
3.3. Business Segments
3.3.1. Generation
Copel operates 35 plants of its own and has ownership interest in another 10. Of this total 21 are hydroelectric, 22 wind powered and two thermoelectric plants with a total installed capacity of 5,828 MW and a physical guarantee of 2,715.7 MW on average, as shown below:
Plants in Operation at December 31, 2018 - Physical Characteristics
Developments | Installed Capacity (MW) | Physical Assurance (Average MW) | Ownership % | Proportional Installed Capacity (MW) | Proportional Physical Assurance (Average MW) | Start of Commercial Operations | Concession expires on |
Hydroelectric Power Plants | |||||||
UHE Gov. José Richa (Salto Caxias)(1) | 1,240.0 | 605.6 | 100% | 1,240.0 | 605.6 | 18.02.1999 | 04.05.2030 |
UHE Gov. Ney Aminthas de Barros Braga (Segredo)(1) | 1,260.0 | 578.5 | 100% | 1,260.0 | 578.5 | 29.09.1992 | 15.11.2029 |
UHE Gov. Bento Munhoz da Rocha Netto (Foz do Areia)(1) | 1,676.0 | 603.3 | 100% | 1,676.0 | 603.3 | 01.10.1980 | 17.09.2023 |
UHE Gov. Pedro Viriato Parigot de Souza (GPS) | 260.0 | 109.0 | 100% | 260.0 | 109.0 | 03.09.1971 | 04.01.2046 |
UHE Gov. Jayme Canet Júnior (Mauá) | 361.0 | 197.7 | 51% | 184.1 | 100.8 | 23.11.2012 | 02.07.2042 |
UHE Guaricana | 36.0 | 16.1 | 100% | 36.0 | 16.1 | 01.01.1957 | 15.08.2026 |
UHE Chaminé | 18.0 | 11.6 | 100% | 18.0 | 11.6 | 01.01.1930 | 16.08.2026 |
PCH Cavernoso II | 19.0 | 10.5 | 100% | 19.0 | 10.5 | 15.05.2013 | 27.02.2046 |
UHE Apucaraninha | 10.0 | 6.7 | 100% | 10.0 | 6.7 | 06.04.1949 | 12.10.2025 |
UHE Derivação do Rio Jordão | 6.5 | 5.9 | 100% | 6.5 | 5.9 | 02.12.1997 | 15.11.2029 |
CGH Marumbi | 4.8 | 2.4 | 100% | 4.8 | 2.4 | 05.04.1961 | (2) |
UHE São Jorge | 2.3 | 1.5 | 100% | 2.3 | 1.5 | 01.01.1945 | 03.12.2024 |
CGH Chopim I | 2.0 | 1.5 | 100% | 2.0 | 1.5 | 28.05.1963 | (3) |
UHE Cavernoso | 1.3 | 1.0 | 100% | 1.3 | 1.0 | 07.12.1965 | 07.01.2031 |
CGH Melissa | 1.0 | 0.6 | 100% | 1.0 | 0.6 | 31.01.1966 | (4) |
CGH Salto do Vau | 0.9 | 0.6 | 100% | 0.9 | 0.6 | 01.01.1959 | (4) |
CGH Pitangui | 0.9 | 0.1 | 100% | 0.9 | 0.1 | 01.01.1911 | (4) |
UHE Santa Clara e Fundão | 240.3 | 135.4 | 70% | 168.2 | 94.8 | 31.07.2005 | 28.05.2037 |
UHE Dona Francisca | 125.0 | 78.0 | 23% | 28.8 | 18.0 | 05.02.2001 | 27.08.2033 |
PCH Arturo Andreoli | 29.1 | 20.4 | 36% | 10.4 | 7.3 | 25.10.2001 | 23.04.2030 |
UHE Santa Clara I e Fundão I | 6.0 | 4.9 | 70% | 4.2 | 3.4 | 13.08.2005 | 18.12.2032 |
Total Hydroelectric Power Plants | 5,300.1 | 2,391.3 |
| 4,934.4 | 2,179.2 | 85% |
|
Eólicas | |||||||
Santa Maria | 29.7 | 15.7 | 100% | 29.7 | 15.7 | 23.04.2015 | 07.05.2047 |
Santa Helena | 29.7 | 16.0 | 100% | 29.7 | 16.0 | 06.05.2015 | 08.04.2047 |
Olho d'Água | 30.0 | 15.3 | 100% | 30.0 | 15.3 | 25.02.2015 | 31.05.2046 |
São Bento do Norte | 30.0 | 14.6 | 100% | 30.0 | 14.6 | 25.02.2015 | 18.05.2046 |
Eurus IV | 27.0 | 14.7 | 100% | 27.0 | 14.7 | 20.08.2015 | 26.04.2046 |
Asa Branca I | 27.0 | 14.2 | 100% | 27.0 | 14.2 | 05.08.2015 | 24.04.2046 |
Asa Branca II | 27.0 | 14.3 | 100% | 27.0 | 14.3 | 15.09.2015 | 30.05.2046 |
Asa Branca III | 27.0 | 14.5 | 100% | 27.0 | 14.5 | 04.09.2015 | 30.05.2046 |
Farol | 20.0 | 10.1 | 100% | 20.0 | 10.1 | 25.02.2015 | 19.04.2046 |
Ventos de Santo Uriel | 16.2 | 9.0 | 100% | 16.2 | 9.0 | 22.05.2015 | 08.04.2047 |
Boa Vista | 14.0 | 6.3 | 100% | 14.0 | 6.3 | 25.02.2015 | 27.04.2046 |
Cutia | 23.1 | 9.6 | 100% | 23.1 | 9.6 | 22.12.2018 | 04.01.2042 |
Esperança do Nordeste | 27.3 | 9.1 | 100% | 27.3 | 9.1 | 29.12.2018 | 10.05.2050 |
Guajiru | 21.0 | 8.3 | 100% | 21.0 | 8.3 | 29.12.2018 | 04.01.2042 |
Jangada | 27.3 | 10.3 | 100% | 27.3 | 10.3 | 29.12.2018 | 04.01.2042 |
Maria Helena | 27.3 | 12.0 | 100% | 27.3 | 12.0 | 29.12.2018 | 04.01.2042 |
Potiguar | 27.3 | 11.5 | 100% | 27.3 | 11.5 | 29.12.2018 | 10.05.2050 |
Palmas(5) | 2.5 | 0.5 | 100% | 2.5 | 0.5 | 12.11.1999 | 28.09.2029 |
Santo Cristo | 27.0 | 15.3 | 49% | 13.23 | 7.5 | 30.06.2015 | 17.04.2047 |
Reduto | 27.0 | 14.4 | 49% | 13.23 | 7.1 | 26.06.2015 | 15.04.2047 |
São João | 27.0 | 14.3 | 49% | 13.23 | 7.0 | 30.06.2015 | 25.03.2047 |
Carnaúbas | 27.0 | 13.1 | 49% | 13.23 | 6.4 | 30.06.2015 | 08.04.2047 |
Total Wind Energy Plants | 541.4 | 263.1 |
| 486.3 | 234.0 | 6% |
|
Termelétricas |
|
|
|
|
|
|
|
UTE Figueira | 20.0 | 10.3 | 100% | 20.0 | 10.3 | 08.04.1963 | 26.03.2019 |
UTE Araucária(6) | 484.1 | 365.2 | 80% | 387.3 | 292.2 | 27.09.2002 | 22.12.2029 |
Total Thermal Power Plants | 504.1 | 375.5 |
| 407.3 | 302.5 | 9% |
|
Total Sources | 6,345.6 | 3,029.9 |
| 5,828.0 | 2,715.7 | #DIV/0! |
|
(1) Physical Guarantee as a result of the new amounts established by Ordinance MME nº 178 of 03.05.2017, with effect from 01.01.2018 | |||||||
(2) In the process of homologation at ANEEL. | |||||||
(3) Registration according to Aneel Order n° 182/2002 and Aneel Resolution n° 5373/2015. | |||||||
(4) Registration according to Aneel Order n° 182/2002 and Aneel Resolution n° 5373/2015. | |||||||
(5) Whithout physical guarantee set by the MME, estimated value based on generation average. | |||||||
(6) The Company still holds a 20% interest in the Holding and 60% in Copel GeT. | |||||||
22
![]()
To fulfill important strategic and sustainability guidelines established for the generation business, the Company’s main purpose is to profitably and sustainably boost the share of renewable alternative sources in the energy mix.
The composition of the generating park by source is as follows:

Currently, the Company is focusing its efforts on the construction of 9 plants, which will add 537.4 MW of installed capacity and 288.5 MW on average of physical guarantee to the generating park:
Power Plant Projects under Construction - Physical Characteristics
Development | Installed Capacity (MW) | Physical Assurance (average MW) |
| Ownership % | Proportional Installed Capacity (MW) | Proportional Physical Assurance (Average MW) | Commercial Operations expected to start on |
| Concession expires on |
|
Hydroelectric Power Plants |
|
|
|
|
|
|
|
|
|
|
UHE Colíder | 300.0 | 178.1 | (1) | 100% | 300.0 | 178.1 | 09.03.2019 | (3) | 16.01.2046 |
|
UHE Baixo Iguaçu | 350.2 | 172.4 | (2) | 30% | 105.1 | 51.7 | 08.02.2019 | (3) | 14.09.2049 | (4) |
Total das Hidrelétricas | 650.2 | 350.5 |
|
| 405.1 | 229.8 |
|
|
|
|
Wind Energy Plants | ||||||||||
Paraíso dos Ventos do Nordeste | 27.3 | 10.6 |
| 100% | 27.3 | 10.6 | 05.01.2019 |
| 03.08.2050 |
|
São Bento do Norte I | 23.1 | 10.1 | 100% | 23.1 | 10.1 | 31.01.2019 |
| 03.08.2050 | ||
São Bento do Norte II | 23.1 | 10.8 |
| 100% | 23.1 | 10.8 | 29.01.2019 |
| 03.08.2050 |
|
São Bento do Norte III | 23.1 | 10.2 | 100% | 23.1 | 10.2 | 15.05.2019 |
| 03.08.2050 | ||
São Miguel I | 21.0 | 9.3 |
| 100% | 21.0 | 9.3 | 14.02.2019 |
| 03.08.2050 |
|
São Miguel II | 21.0 | 9.1 | 100% | 21.0 | 9.1 | 02.02.2019 | 03.08.2050 | |||
São Miguel III | 21.0 | 9.2 |
| 100% | 21.0 | 9.2 | 14.02.2019 |
| 03.08.2050 |
|
|
|
|
|
|
|
|
|
|
|
|
Total Wind Energy Plants | 132.3 | 58.7 |
|
| 132.3 | 58.7 | 20% |
|
|
|
|
|
|
|
|
|
|
|
|
|
|
Total Sources | 782.5 | 409.2 |
|
| 537.4 | 288.5 |
|
|
|
|
(1)Physical guarantee revised by virtue of the new amounts established by the Ordinance of the Planning and Energetic Development Secretary 213/2017. | ||||||||||
(2) Physical guarantee revised by virtue of the new amounts established by the Ordinance of the Planning and Energetic Development Secretary 11/2017. | ||||||||||
(3)Entry of the first generating unit (Note 40.2). | ||||||||||
(4)According to the 2nd Addendum to the Concession Agreement, which considers the exclusion of responsibility for 756 days. | ||||||||||
Were invested R$4 billion in these generation projects still under construction up to December 31, 2018. From this total, R$3.1 billion refers to the increase in fixed assets in progress, of our own plants, and of the consortium plants, and the remainder refers to investment in wind farms.
In the segment of electric energy generation, we also give emphasis to:
23
![]()
· Colíder Hydroelectric Power Plant:Copel Geração e Transmissão won the concession for the implementation and operation of the plant for 35 years in the energy auction held by Aneel on July 30, 2010, with 300 MW of installed capacity.The construction of the plant, located in the Teles Pires River, between the cities of Nova Canaã do Norte and Itaúba, in Mato Grosso, was started in 2011 and shall absorb R$2.4 billion in investments.Projection for the start of commercial operation was in June 2018, however, due tounforeseeable circumstances or force majeure, such as fire at the construction site, acts of public power, delays in the delivery of equipment, in electromechanical assembly services and in the construction of the transmission line associated with the plant, in addition to the fact that an Operating License was not issued by the Environment Department for the State of Mato Grosso - SEMA /MT - the project experienced adverse effects on its schedule, so that the commercial generation of the plant was postponed.See Note 18.4 to the Financial Statements for more information.
· Baixo Iguaçu Hydroelectric Power Plant: With a 30% ownership interest in the project, where the remaining 70% is held by Neoenergia, the total investment is estimated at R$2.5 billion.Commercial operation began in February 2019. See Note 18.5.1 of the Financial Statements.
· Modernization of the Figueira Thermoelectric Power Plant:The Company started the modernization work in 2015, in order to increase its efficiency and reduce the emission of gases and particles resulting from the coal burning.Until the first quarter of 2016, the work developed as it should, but after the second quarter of the same year, as a result of financial difficulties, the company that was hired to carry out the services showed signs of difficulty to maintain the execution of the activities agreed, culminating in the near paralysis of the work. In view of this situation, the Company replaced the engaged company to continue the work, restarting the work at the beginning of the second half of 2017, with the completion expected in 2019.
· Cutia and Bento Miguel Wind Farm Complex:Copel Geração e Transmissão’s largest wind farm project is at the conclusion stage and at the beginning of entry into commercial operation.Named Cutia Empreendimentos Eólicas - CEE SA, it is divided into two large complexes:(a) Cutia Complex, comprised of seven wind farms (Guajiru, Jangada, Potiguar, Cutia, Maria Helena, Esperança do Nordeste and Paraíso do Ventos do Nordeste), with a total installed capacity of 180.6 MW, physical guarantee of 71.4 MW on average, all located in the State of Rio Grande do Norte, and (b) Bento Miguel Complex: comprised of six wind farms (São Bento do Norte I, São Bento do Norte II, São Bento do Norte III, São Miguel I, São Miguel II and São Miguel III) with 132.3 MW of total installed capacity, 58.7 MW on average of physical guarantee, all located in the State of Rio Grande do Norte. See Note 18.6 to the Financial Statements for more information.
24
![]()
3.3.2. Transmission
The main responsibility of the segment is to provide electric energy transportation and transformation services, and is responsible for the construction, operation and maintenance of substations, as well as for the lines for the transmission of energy.
The Company owns and participates in transmission concessions in operation, corresponding to 6,628 kilometers of transmission lines, with a processing power of its substations in the order of 14,974 MVA. Below is the breakdown of transmission lines and substations in operation:
25
![]()
Transmission Lines and Substations in Operation on December 31, 2018
Transmission Lines and Substations | Property | Circuit | Tension (kV) | Extension (km) | Transformation capacity (MVA) | Commercial Operations expected to start on | Concession expires on | ||
Own lines and Substations | 3,032 | 13,302 | |||||||
| Contract No. 060/2001 | Miscellaneous transmission installations (1) | Both | Varied | 2,064 | 12,352 | Multiple | 31.12.2042 | |
Contract No. 075/2001 | LT Bateias - Jaguariaíva | CS | 230 kV | 137 | - | 01.11.2003 | 16.08.2031 | ||
| Contract No. 006/2008 | LT Bateias - Pilarzinho |
| CS | 230 kV | 32 | - | 14.09.2009 | 16.03.2038 |
Contract No. 027/2009 | LT Foz do Iguaçu - Cascavel Oeste | CS | 525 kV | 116 | - | 06.12.2012 | 18.11.2039 | ||
| Contract No. 010/2010 | LT Araraquara 2 - Taubaté |
| CS | 500 kV | 334 | - | 27.07.2018 | 05.10.2040 |
Contract No. 015/2010 | SE Cerquilho III | - | 230/138 kV | - | 300 | 01.06.2014 | 05.10.2040 | ||
| Contract No. 022/2012 | LT Londrina - Figueira C2 |
| CS | 230 kV | 92 | - | 30.06.2015 | 26.08.2042 |
|
| LT Foz do Chopim - Salto Osório C2 |
| CS | 230 kV | 10 | - |
|
|
Contract No. 002/2013 | LT Assis - Paraguaçu Paulista II | CD | 230 kV | 42 | - | 25.01.2016 | 24.02.2043 | ||
SE Paraguaçu Paulista II | - | 230 kV | - | 200 | |||||
| Contract No. 005/2014 | LT Bateias - Curitiba Norte |
| CS | 230 kV | 31 | - | 29.07.2016 | 28.01.2044 |
|
| SE Curitiba Norte |
| - | 230/138 kV | - | 300 |
|
|
Contract No. 021/2014 | LT Foz do Chopim - Realeza | CS | 230 kV | 52 | - | 05.03.2017 | 04.09.2044 | ||
SE Realeza | - | 230/138 kV | - | 150 | |||||
| Contract No. 022/2014 | LT Assis - Londrina C2 |
| CS | 500 kV | 122 | - | 05.09.2017 | 04.09.2044 |
Special Purpose Entity | 3,596 | 1,672 | |||||||
| Costa Oeste Transmissora de Energia S.A. | 100.0% |
|
|
|
|
|
| |
| Contract No. 001/2011 | LT Cascavel Norte - Cascavel Oeste |
| CS | 230kV | 30 |
|
|
|
| Contract No. 001/2012 | LT Cascavel Norte - Umuarama Sul |
| CS | 230 kV | 130 | - | 31.08.2014 | 11.01.2042 |
|
| SE Umuarama |
| - | 230/138 kV | - | 300 | 27.07.2014 |
|
Caiuá Transmissora de Energia S.A. | 49.0% | ||||||||
Contract No. 007/2012 | LT Umuarama - Guaíra | CS | 230 kV | 105 | - | 12.05.2014 | 09.05.2042 | ||
LT Cascavel Oeste - Cascavel Norte | CS | 230 kV | 37 | - | 02.07.2014 | ||||
SE Santa Quitéria - SF6 | - | 230/138/13,8 kV | - | 400 | 01.06.2014 | ||||
SE Cascavel Norte | - | 230/138/13,8 kV | - | 300 | 02.07.2014 | ||||
| Marumbi Transmissora de Energia S.A. | 100.0% |
|
|
|
|
|
| |
| Contract No. 008/2012 | LT Curitiba - Curitiba Leste |
| CS | 525 kV | 29 | - | 28.06.2015 | 09.05.2042 |
|
| SE Curitiba Leste |
| - | 525/230 kV | - | 672 |
|
|
Integração Maranhense e Transmissora de Energia S.A. | 49.0% | ||||||||
Contract No. 011/2012 | LT Açailândia - Miranda II | CS | 500 kV | 365 | - | 02.12.2014 | 09.05.2042 | ||
| Matrinchã Transmissora de Energia (TP NORTE) S.A. | 49.0% |
|
|
|
|
|
| |
| Contract No. 012/2012 | LT Paranatinga - Ribeirãozinho |
| CD | 500 Kv | 355 | - | 29.07.2016 | 09.05.2042 |
|
| LT Paranaíta - Cláudia |
| CD | 500 Kv | 300 | - |
|
|
|
| LT Cláudia - Paranatinga |
| CD | 500 Kv | 350 | - |
|
|
|
| SE Paranaíta(2) |
| - | 500 Kv | - | - |
|
|
|
| SE Cláudia(2) |
| - | 500 Kv | - | - |
|
|
|
| SE Paranatinga(2) |
| - | 500 Kv | - | - |
|
|
| Guaraciaba Transmissora de Energia S.A. | 49.0% |
|
|
|
|
|
| |
Contract No. 013/2012 | LT Ribeirãozinho - Rio Verde Norte C3 | CS | 500 Kv | 250 | - | 30.08.2016 | 09.05.2042 | ||
LT Rio Verde Norte - Marimbondo II | CD | 500 Kv | 350 | - | |||||
SE Marimbondo II (2) | - | 500 Kv | - | - | |||||
| Paranaíba Transmissora de Energia S.A | 24.5% |
|
|
|
|
|
| |
| Contract No. 007/2013 | LT Barreiras II - Rio das Éguas |
| CS | 500 Kv | 239 | - | 30.01.2017 | 02.05.2043 |
|
| LT Rio das Éguas - Luziânia |
| CS | 500 Kv | 368 | - |
|
|
|
| LT Luziânia - Pirapora 2 |
| CS | 500 Kv | 346 | - |
|
|
Cantareira Transmissora de Energia S.A. | 49.0% | ||||||||
Contract No. 019/2014 | LT Estreito - Fernão Dias | CD | 500 kV | 342 | - | 05.03.2018 | 04.09.2044 | ||
|
|
|
|
|
|
|
|
|
|
Total |
|
|
|
| 6,628 | 14,974 |
|
| |
(1) Concession extended under the terms of Provisional Measure No. 579/2012. | |||||||||
(2) Exclusive for reactive control of the transmission lines of the National Interconnected System, improving the quality of the transmitted energy. | |||||||||
The transmission concessions in operation at December 31, 2018 currently generate RAP to Copel Geração e Transmissão of R$807.4 million, proportional to its share in the projects.
Currently, the Company is focusing its efforts on the following projects, which will add 1,408 kilometers in extension and 4,500 MVA of transformation capacity to the set of own and partnership transmission lines and substations, as follows:
26
![]()
Transmission Lines and Substations Projects - Physical Characteristics
Transmission Lines and Substations | Property | Circuit | Tension (kV) | Extension (km) | Transformation capacity (MVA) | Commercial Operations expected to start on | Concession expires on | ||
Own lines and Substations |
|
|
| 522.8 | 900 |
|
| ||
Contract No. 006/2016 | LT Curitiba leste - Blumenau | CS | 525 KV | 142.0 | - | 04.04.2021 | 06.04.2046 | ||
LT Baixo Iguaçu - Realeza |
| CS | 230 KV | 38.0 | - | ||||
LT Curitiba centro | Subterrâneo | 230 KV | 8.5 | - | 04.09.2019 | 06.04.2046 | |||
SE Medianeira | - | 230/138 KV | - | 300 | |||||
SE Curitiba centro | - | 230/138 KV | - | 300 | |||||
SE Andira leste | - | 230/138 KV | - | 300 | |||||
Special Purpose Entity |
|
|
|
| 885.0 | 3,600 |
|
| |
Mata de Santa Genebra Transmissão S.A. | 50.1% | ||||||||
Contract No. 001/2014 | LT Itatiba - Bateias | CS | 500 Kv | 414.0 | - | 31.08.2019 | 13.05.2044 | ||
LT Araraquara 2 - Itatiba | CS | 500 Kv | 222.0 | - | |||||
LT Araraquara 2 - Fernão Dias | CS | 500 Kv | 249.0 | - | |||||
SE Santa Bárbara d'Oeste (1) | - | 440 kV | - | - | |||||
SE Itatiba (1) |
| - | 500 kV | - | - | ||||
SE Fernão Dias | - | 500/440 kV | - | 3,600 | 01.06.2019 | 13.05.2044 | |||
|
|
|
|
|
|
|
|
|
|
Total |
|
|
|
| 1,408 | 4,500 |
|
| |
(1) | Exclusive for reactive control of the transmission lines of the National Interconnected System, improving the quality of the transmitted energy. | ||||||||
· Transmission works:
· Lot E - Auction ANEEL 05/2015:Through transmission service concession agreement 06/2016 that includes a series of projects that are expected to start operating in September 2019 and other works, such as the 500 kV Blumenau - Curitiba Leste transmission line with commercial operation projected for March 2021.The project will enable an increase of the RAP to Copel GeT in the order of R$118 million, when all the projects are completed.Lot E was divided into several projects that are in different stages. Some works are in the commissioning phase of the facilities while others are already in operation.
In addition to the works won in the auctions promoted by Aneel, Copel GeT has works stemming from the authorization resolutions in order to expand and improve existing facilities, such as:
· Authorization Resolution 5,711 /2016: implementation at the 230 kV Figueira substation, of the first 138 kV - 15 Mvar capacitor bank, with an investment of R$4,8 million and RAP of approximately R$0.8 million, from the commercial start-up scheduled for March 2020.
· Authorization Resolution 5,834 /2016:implementation at the 230 kV Apucarana substation of the 138 kV – 30 Mvar capacitor bank, with an investment of R$5,5 million and RAP of approximately R$0.9 million from the commercial start-up scheduled for March 2020.
· Other highlights
· LT 500 kV Araraquara - Taubaté:On July 27, 2018, the ONS issued the Definitive Release Term (TLD) for the project consisting of the implementation of the Transmission Facilities pursuant to Aneel Auction 01/2010. Lot A - which includes the construction and operation of 334.3 km, 500 kV Transmission Line, from the SE Araraquara 2 gateway to the vicinity of SE Taubaté and the respective line entries, barinterconnections and other equipment, which enabled an increase of RAP to Copel GeT in the order of R$30 million.
27
![]()
· Authorization Resolution 5,776 /2016: On July 29, 2018, ONS issued a TLD for the 230 kV Sarandi substation, of the second 230 /138 kV - 150 MVA autotransformer, with an investment of around R$14.8 million, allowing an increase of RAP in the range of R$2.5 million, from the commercial start-up.
· Authorization Resolution 5,930 /2016:On October 14, 2018, the ONS issued a TLD referring to the implementation of the 500 kV Bateias substation, a bar reactor bank of 500 kV - 200 Mvar, with an investment of approximately R$30 million and RAP of approximately R$4.3 million.
3.3.3. Distribution
In the scope of electric energy distribution, Copel Distribuição's main activities are to provide, operate and maintain the infrastructure, as well as to provide related services, described in the Concession Agreement 046/1999, signed on June 24, 1999, the Fifth Amendment Term of which was entered into on December 9, 2015, extending the concession until July 7, 2045. Decree 8,461, dated 2 June 2015, regulated the extension of the electric energy distribution concessions referred to in article 7, of Law 12,783, of January 11, 2013, establishing, as a condition for the concession extension, efficiency indicators that shall be observed by the concessionaire for a period of five years counted from January 1, 2016.
Copel Distribuição's activities are intended to serve approximately 4.6 million energy consumers in 1,113 locations in 394 cities in Paraná and one in Santa Catarina (Porto União). The cities of Guarapuava and Coronel Vivida are partially served. It also operates and maintains installations with voltage levels up to 138kV.
In 2018, substations were connected to reinforce the electrical distribution system, improving quality and increasing the availability of electric energy to consumers.The works of new substations and completed expansions are as follows:
Substation | Power (MVA) | Location |
Implantations | ||
SE Queimados 34,5 kV | 7.00 | Palmeira |
SE Rio Branco do Sul 138 kV | 30.00 | Rio Branco Do Sul |
Expansions |
|
|
SE Cambira 34,5 kV | 7.00 | Cambira |
SE Matelândia 34,5 kV | 7.00 | Matelândia |
SE Novo Mundo 69 kV | 41.67 | Curitiba |
28
![]()
· Distribution lines
The following table shows the extension of the distribution lines of Copel Distribuição:
Distribution Lines | Lenght in km |
13,8 kV | 106,732 |
34,5 kV | 87,090 |
69,0 kV | 751 |
138,0 kV | 6,265 |
Total | 200,838 |
· Substations
The following table presents the Copel Distribuição substation park, open for voltage:
Power | Automated Substations | MVA |
34,5 kV | 225 | 1,502 |
69,0 kV | 35 | 2,393 |
88,0 kV | - | 5 |
138,0 kV | 109 | 7,125 |
Total | 369 | 11,025 |
· Quality of Supply
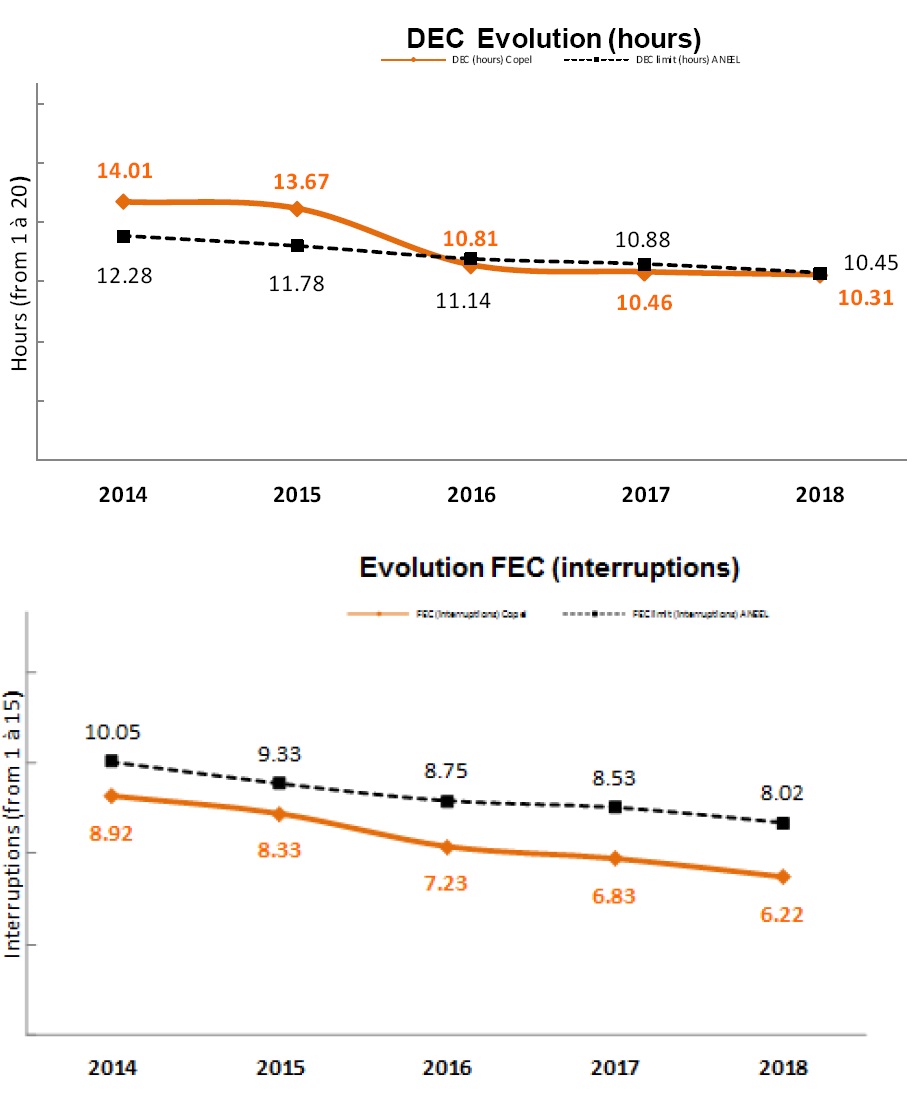
Supply quality is measured by indicators that monitor distributors’ performance in terms of continuity of the service provided.The System Average Interruption Duration Index (SAIDI) measures the number of hours on average that consumers remain without power during a certain period of time.The Customer Average Interruption Duration Index (CAIDI) indicates the average number of outages per consumer unit.Based on SAIDI and CAIDI, Aneel establishes individual continuity parameters (Individual interruption duration per consumer unit, Individual interruption frequency per consumer unit, and Maximum continuous interruption duration per consumer unit or connection point) which are itemized in electric energy consumers’ monthly bills.
These indicators are reviewed in the Periodic Tariff Review and are increasingly becoming stricter in order to improve the quality of customer service.The indicator is established in the Concession Agreement, being that the non-compliance with the efficiency criterion for the quality of the service provided, for two consecutive years during the period assessed, or in the year 2020, will result in the extinction of the concession.
Copel Distribuição’s results of SAIDI and CAIDI indicators showed an improvement in the number and duration of outages for 2018 compared to the previous year, due to investments in performance and expansion work, increase in periodic maintenance and preventive inspections, presented, as shown below:
29
![]()
· Management of energy losses
Energy losses are inherent to the nature of the process of transforming, transmission and distribution of electric energy.An analysis of the electric energy required to serve customers must consider that not all the electric energy generated is delivered to the end consumers.
In this context, losses may be segmented between Losses in the Basic Grid, which are external to the concessionaire’s distribution system and are imminently technical in their origin, and Distribution Losses that may be of a technical or non-technical nature.
30
![]()
The technical losses refer to the portion of losses in the distribution inherent to the transmission process, voltage transformation and energy measurement in the concessionaire’s grid.Non-technical losses, in turn, represent all other losses associated with the distribution of electric energy, such as energy theft, measurement errors, errors in the billing process, consumer units that do not have measuring equipment, among others.
In 2018, overall distribution losses - technical, non-technical and basic network - accounted 9.7% of the energy injected into the distribution system, representing a 5.4% year-on-year increase.
Copel Distribuição maintains a Non-Technical Loss Combatting Program that consists of several activities that intend to reduce or maintain the current level of non-technical losses through the following activities:
· Constant mapping of the situation regarding clandestine connections, by identifying the areas and the number of families with clandestine connections;
· Improvement of actions to combat irregular procedures, improving the performance of targeted inspections;
· Investments for the provision and /or acquisition of equipment for inspection;
· Preparation and execution of specific training and recycling related to commercial losses;
· Conducting inspections, both in Medium and Low Voltage;
· Educational notes in the press and messages on electric bills.
· Joint operations with the Civil Police and Prosecution Office;
· Opening of the police investigation in regions where significant numbers of irregular procedures are identified.
· Captive market
The following table shows the behavior of the captive market by consumption class in number of consumers and the behavior of energy sold in the last four years:
Captive Market - Copel Distribuição | ||||||
| Number of Consumers | Sold Energy | ||||
| Dez/18 | Dez/17 | % | Dez/18 | Dez/17 | % |
Residential | 3,754,598 | 3,682,009 | 2.0 | 7,238 | 7,126 | 1.6 |
Industrial | 73,070 | 76,328 | (4.3) | 2,935 | 3,254 | (9.8) |
Commercial | 400,209 | 389,844 | 2.7 | 4,653 | 4,651 | - |
Rural | 352,074 | 354,829 | (0.8) | 2,288 | 2,257 | 1.4 |
Others | 57,853 | 57,483 | 0.6 | 2,480 | 2,455 | 1.0 |
Total | 4,637,804 | 4,560,493 | 1.7 | 19,594 | 19,743 | (0.8) |
31
![]()
· Grid Market (TUSD)
In 2018, the wire load, which takes into account all consumers who accessed the grid of the Distributor, grew by 1.9%, strongly influenced by the industrial class. In this segment, "Food”, “Pulp & Paper” and “Wood” where the industrial branches that have contributed more to this result, together they represent more than 50% of the industrial use and have registered an average variation of 4,8% in 2018.
The wire Market have reached in 2018 the pre-crisis levels seen four years ago. The industrial class had already regained these consumption levels in 2017, and the residential and commercial classes continue to show positive growth, however, have not yet recovered the levels of 2014.
Market Power Wire - Copel Distribuição | ||||||
| Number of Consumers | Distributed Energy (GWh) | ||||
| Dez/18 | Dez/17 | % | Dez/18 | Dez/17 | % |
Captive Market | 4,637,804 | 4,560,493 | 1.7 | 19,594 | 19,743 | (0.8) |
Concessionaires and Permissionaires | 3 | 3 | - | 279 | 521 | (46.4) |
Free Consumers | 1,121 | 991 | 13.1 | 9,568 | 8,873 | 7.8 |
Wire Dealerships | 4 | 3 | 33.3 | 511 | 263 | 94.3 |
Wire Market | 4,638,932 | 4,561,490 | 1.7 | 29,952 | 29,400 | 1.9 |
· Purchase of energy
Under the current regulatory framework, the energy contracting by the distributors mainly occurs through auctions overseen by Aneel. To supply the market in the coming years, in 2018 Copel Distribuição participated in the following auctions: 28th New Energy Auction (A-4), hold on September 9, 2018, with a 39 MW average acquired and shall begin the supply on January 1, 2024.
To serve the market in 2018, the agreements negotiated in prior years started being supplied: 16th New Energy Auction (A-5) and 18th New Energy Auction (A-5), both contracted in 2013 and the 22nd New Energy Auction (A-3), contracted in 2015.
· Overcontracting
In the current regulatory model, the purchase of energy by distributors is regulated by Law No. 10,484/1914 and by Decree No. 5,163 /2004, which determine that these shall acquire the volume required to serve 100% of their market.
The verification that the whole market is being served takes into account the period comprised by the calendar year, being the difference between the costs paid by the tariff and the costs actually realized with the purchase of energy, entirely passed on to the captive consumers, provided that the distributor records a contracting level between 100 % and 105% of its market. However, if distributors reach contracting levels below or above the regulatory limits, these will still be able to maintain a guarantee of neutrality, if it isidentified that such violation arises from extraordinary or unforeseeable events, that do not allow management by the buyer.
32
![]()
In recent years, the distribution segment has been exposed to a scenario of widespread overcontracting, as most companies have reached a contracting level of more than 105%.
Understanding that several of the factors that contributed to this situation are extraordinary and unavoidable by the distributors, such as the compulsory allocation of physical guarantee quotas and the mass migration of consumers to the free market, the Regulatory Agency and the Ministry of Mines and Energy implemented a series of measures intended to mitigate overcontracting, highlighting:
· Normative Resolution 706/2016, which regulated the recognition of involuntary overcontracting resulting from the reallocation of physical guarantee quotas for plants renewed in accordance with Law No. 12,783 /2013;
· Normative Resolution 693/2015 which regulated the Mechanism for Compensation of New Energy Surpluses and Deficits - MCSD-EN, focused on the contracts stemming from new generation projects, through which the reallocation of energy between distributors and generators was permitted;
· Normative Resolution 711/2016 which established the criteria and conditions for the signing of bilateral agreements between distributors and generators, which included: temporary reduction, total or partial contracted energy, permanent but partial reduction of the agreement or termination of agreement.
· Decree 9,143/2017 which, among other measures, amended Decree 5,163 /2004, recognizing: i) the involuntary contractual exposures stemming from the migration of special consumers to the free market, provided that Aneel observes an evaluation of maximum effort by the distributors; and (ii) the right to contractual reduction of existing energy auctions, of amounts related to the migration of special consumers to the free market. The eligible agreements are those resulting from the auctions of existing energy made after June 2016, pursuant to Normative Resolution 726/2016; and
· Normative Resolution 824/2018, which established the criteria for the processing of the Mechanism for Sale of Energy Surplus by the distributors.
In relation to contracting, preliminarily, yet in 2017 and throughout 2018, Copel Distribuição's indicators often identified overcontracting scenarios. During this period, the monitoring of indicators of contracting levels prevailed, and mitigating actions were required.
All available tools were used for contracting management by the Distributor, in order to meet the requirement to make the maximum effort to adjust its contracting level to the regulatory limits. In this context, we can highlight the following actions:
a) Surplus Statement in the MCSDs of New Energy and Free Exchanges, related to the amounts of energy in surpluses of physical guarantee quotas and not included in agreements for special consumers;
b) Full return on MCSD 4%, referring to market variations of up to 4% of existing contracted energy amounts;
33
![]()
c) Full return in the monthly MCSDs, of the available amounts of energy in the Distributor portfolio, related to the termination of agreements for potentially free consumers; and
d) Establishing of negotiations with generators to reduce contracts, entering into bilateral agreements pursuant to Normative Resolution 711/2016.
Copel Distribuição ended 2018 within the regulatory contracting limits from 100% to 105%, thus guaranteeing the neutrality of the costs associated with the purchase of energy.
· Tariff Flags
The purpose of the tariff flag system is for consumer prices to reflect conditions under which electric energy is generated in the SIN, by the charging of additional amounts in the Energy Tariff (TE), thus enabling consumers to adapt their consumption to the actual price of electric energy. Green, yellow and red flags show higher or lower electric energy costs depending on conditions for electric energy generation. Tariff flag amounts are set in a specific document published by Aneel each calendar year, in approval resolution.
The table below shows the history of tariff flags and the amounts charged:
| 2018 | 2017 | ||
Month | Flag | Value applied in the tariff (every 100kwh) | Flag | Value applied in the tariff (every 100kwh) |
January | green | - | yellow | 2.00 |
February | green | - | yellow | 2.00 |
March | green | - | yellow | 2.00 |
April | green | - | red | 3.00 |
May | yellow | 1.00 | red | 3.00 |
June | red | 5.00 | green | - |
July | red | 5.00 | yellow | 2.00 |
August | red | 5.00 | red | 3.00 |
September | red | 5.00 | yellow | 2.00 |
October | red | 5.00 | red | 3.50 |
November | yellow | 1.00 | red | 5.00 |
December | green | - | red | 3.00 |
· White Tariff
Since January 1, 2018, the White Tariff has been in effect, a tariff type that presents a change in the energy value according to the day and time of consumption.
The white tariff is to enable the consumer to rationalize the energy consumption at the peak times (5:30 p.m. to 8:29 p.m.) and encourage the use in periods when demand is low. This type is offered for the low voltage consumer units (127, 220, 380 or 440 Volts), called group B.
The conditions for application of the white tariff are set forth in the Normative Resolutions of Aneel 414/2010 and 733/2016.
34
![]()
· Annual Tariff Adjustment - RTA
The Tariff Adjustment process is intended to pass on: non-manageable costs (Portion A), which covers costs related to the acquisition of electric energy, use of transmission systems, sectorial charges, unrecoverable revenues, and monetarily restate the manageable costs (Portion B), inherent in the activity of energy distribution, i.e., operational costs and capital remuneration.
In June 2018, through Homologation Resolution No. 2,402/2018, Aneel approved the last annual tariff adjustment for Copel Distribuição, which corresponded to the average tariff effect to be charged to consumers of 15.99%, which was 17.55%, on average for high voltage consumers and 15.13% on average for low voltage consumers.
3.3.4. Trading
Copel Comercialização S.A. (Copel Energia) operates with purchase and sale of energy and provision of services in the Free Energy Market. In 2018, it was heavily involved in its consolidation and began its activities as a retailer, being the first Brazilian seller to represent a generator in the Electric Energy Trading Chamber (CCEE).
With only two years of operation, Copel Energia is already one of the largest companies in the market, with a portfolio of more than 520 customers in 14 Brazilian states.
In addition, it offered management services, consulting for migration, modeling for generators and consumers, demand management, among other products, which allow customers to operate with security in the Free Market.
Having as a value proposition the Company's security and its good relationship with its customers, in 2018 Copel Energia reached the milestone of 740 MWm traded on the CCEE, preparing for the imminent opening of the free energy market and the new challenges of the market.
3.3.5. Telecommunications
Copel Telecomunicações is responsible for the provision of telecommunications and communications services in general, in the form of the Multimedia Communication Service - SCM, in Paraná. Since 1998, the subsidiary has been licensed to operate these services and offer the highest technology to companies, public authority, and in the retail sector, for residential customers in 85 cities.
Through its robust network of optical fibers, which form a 34.2-thousand-kilometerbackbone, it carries ultra-speed data and manages an optical ring that serves the 399 municipalities of Paraná, with a portfolio of data, voice and datacenter transport products.
35
![]()
3.3.6. Ownership interests
Copel has ownership interests and associations with companies, consortia and other institutions operating in several sectors in addition to the energy area, as presented in note 1.1 and 2 to the Financial Statements.
36
![]()
4. ECONOMIC-FINANCIAL PERFORMANCE
In 2018, Net Operating Revenue increased by R$910.3 million, which represents a 6.5% increase year-on-year. This variation is mainly due to:
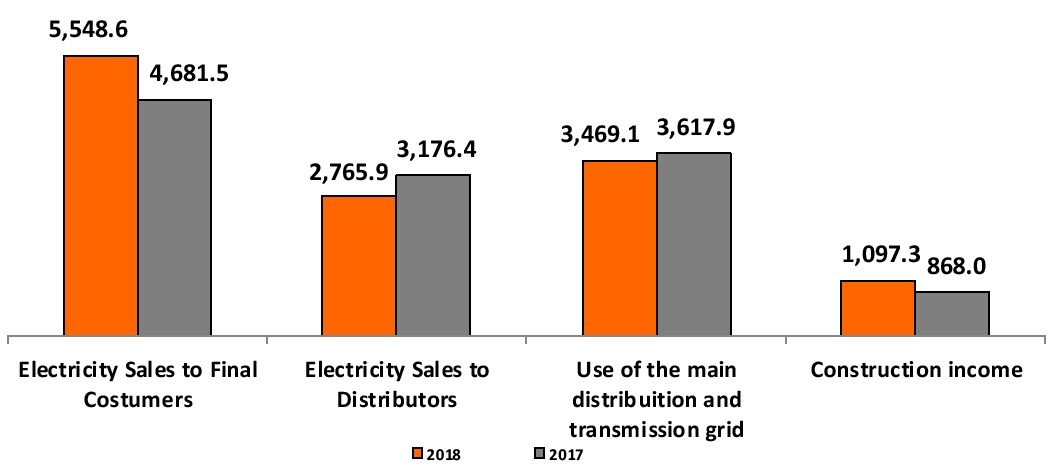
1) increase of R$867.1 million inRevenue from Electricity Sales to Final Customers, mainly due to the effects of the Annual Tariff Adjustment - RTA for 2018, which adjusted the energy tariff by 15.61% of June 24, 2018, RTA 2017 of 10.28% from January to June, and growth in trader operations in 2018;
2) decrease of R$410.5 million inRevenue from Electricity Sales to Distributors, mainly due to the decrease in CCEE revenues due to the lower average PLD in the period, R$287.62 /MWh in 2018 compared to R$318.15 /MWh in 2017 and the UTE Araucária dispatch in 2017;
3) decrease of R$148.8 million inRevenue from Use of the Main Distribution and Transmission Grid, mainly due to the recognition of the adjustment of the definitive report of RBSE assets in 2017 of R$183 million while in 2018 only the restatement of the asset was recognized;
4) increase of R$229.3 million inConstruction Revenue. The Company accounts for revenue related to the construction or improvement of the infrastructure used in the provision of services of distribution, and transmission of electric energy, and gas, which totaled R$1,097.3 million in 2018 and R$868 million in 2017. Such corresponding expenses are recognized in the statement of income for the period, as construction cost, when incurred;
37
![]()

5) increase of R$57.2 million inTelecommunications Revenue, mainly due to the increase in the number of customers, particularly in the retail market, with the Copel Fibra product;
6) increase of R$102.4 millionin Revenue from Distribution of Piped Gas, affected by gas sales growth of 6% in the volume consumed year-on-year;
7) increase of R$174.9 million inSectorial financial assets and liabilities result mainly due to greater exposure with electric energy purchased for resale; and
8) increase of R$38.7 million inOther Operating Revenues reflecting the increase in service income and revenue from lease and rental, offset by the lower variation in the fair value of the concession-related assets - of approximately R$9.6 million.
4.2.Operating Costs and Expenses
· Not manageable
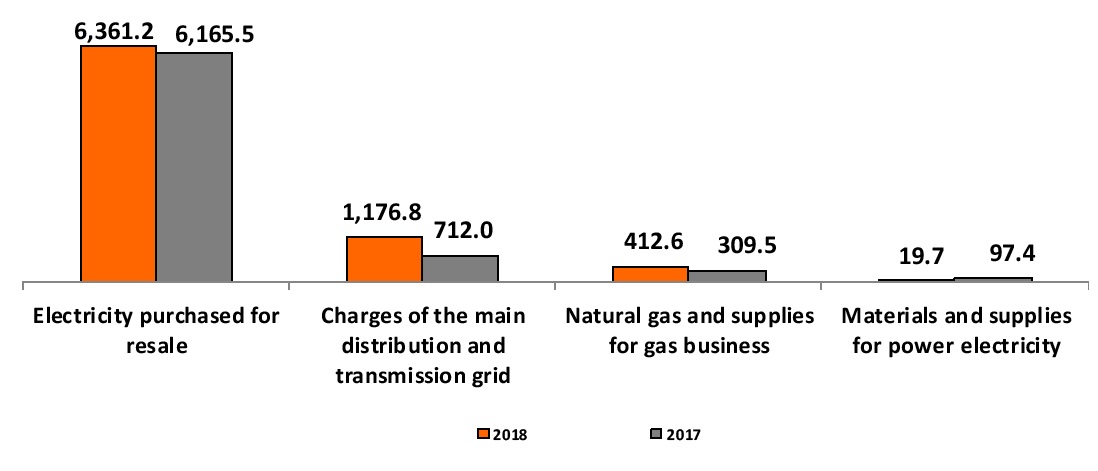
38
![]()
1) increase of R$195.7 million inElectricity Purchased for Resale, mainly due to the 29.1% increase in the purchase of energy relating to the trader;
2) increase of R$464.8 million inCharge of the Main Distribution and Transmission Grid,mainly due to the tariff increase resulting from the renewals of the transmission concessions for RBSE assets;
3) increase of R$103.1 million inNatural Gas and Inputs for Gas Operationmainly due to the change in the US Dollar currency;
· Manageable
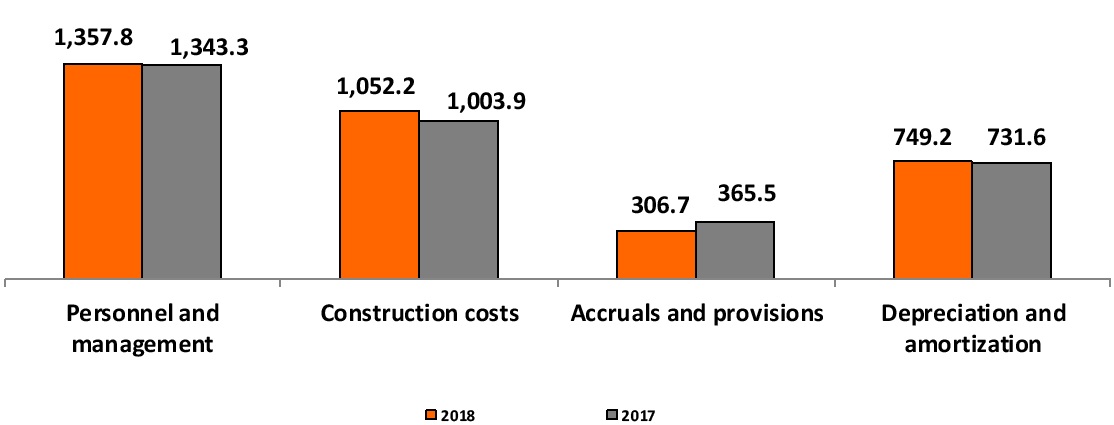
4) increase of R$R$14.5 million inPersonnel and Management, reflecting the salary adjustment pursuant to the collective agreement of 3.97% in October 2018 and 1.63% in 2017, and the variation of R$15.8 million of Provision for indemnification for voluntary resignations and retirements and the higher value of Profit Sharing - PLR, offset by the reduction of employees and the cost reduction policy;
5) an increase inConstruction Cost, from R$1,003.9 million in 2017 to R$1,052.2 million in 2018, reflecting investments in transmission and distribution and gas assets;
6) decrease of R$58.8 million inCredit Losses, Provisions and Reversals,mainly due to the reversal of a provision for litigation related to indemnification of third parties, amounting to R$90.2 million;
39
![]()
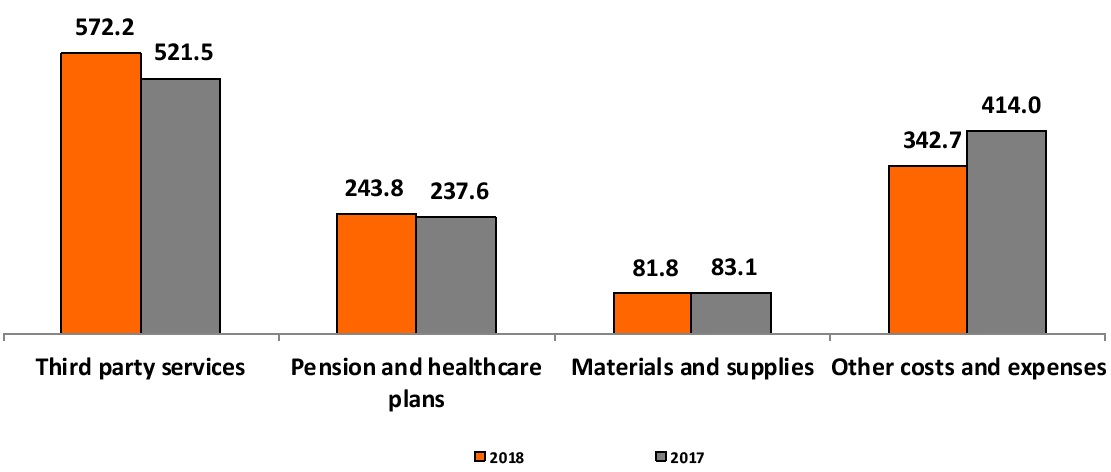
7) increase of R$50.7 million inThird-Party Services, due to the higher amount in maintenance of the electrical grid, communication, data processing and transmission and in consulting and auditing services; and
8) increase of R$6.2 million inPension and Healthcare Plans due to the adjustment of the monthly healthcare plans.
Consolidated |
| 2018 | 2017 |
In R$ million |
| ||
Net income | 1,444.0 | 1,118.3 | |
Deferred IRPJ and CSLL |
| (68.0) | (105.3) |
IRPJ and CSLL | 580.0 | 380.0 | |
Financial expenses (income), net |
| 438.1 | 748.4 |
Lajir/Ebit |
| 2,394.1 | 2,141.4 |
Depreciation and amortization | 749.2 | 731.6 | |
Lajida/Ebitda |
| 3,143.3 | 2,873.0 |
Net Operating Revenue - ROL | 14,934.8 | 14,024.6 | |
Ebitda Margin% (Ebitda ÷ ROL) |
| 21.0% | 20.5% |
The Company's EBITDA in 2018 was of R$3,143.3 million, an increase of R$270.3 million compared to 2017, which represents a 9.4% increase.
40
![]()
4.4.Financial Result
The financial result increased R$310.4 million, mainly due to the 16.4% increase in financial revenues, due to interest and monetary variation on CRC onlendings, the recognition of tax credits and a reduction of 13.5% in financial expenses, as a consequence of lower monetary and exchange variations and debt charges.
In 2018, Copel recorded R$13,365 million in Added Value - total 13.5% higher than the previous year, in the amount of R$11,772.8.The full statement is available in the Financial Statements.
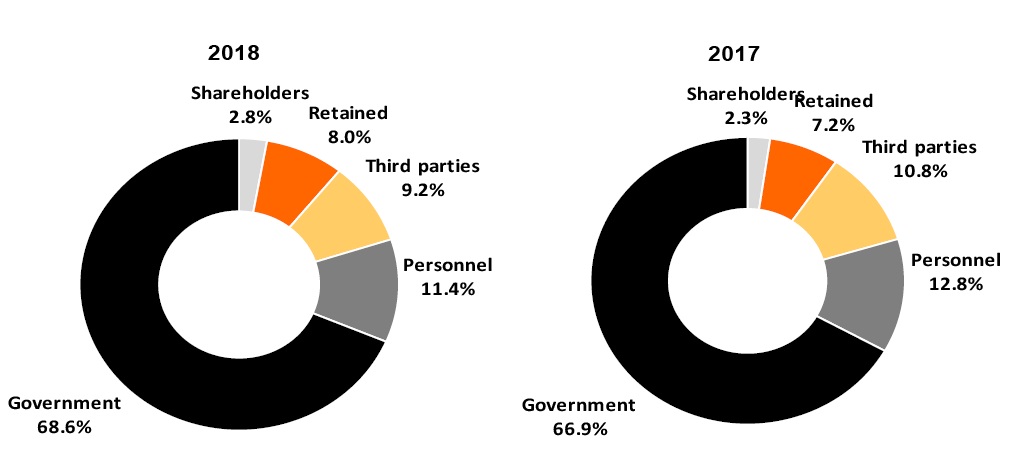
The Company meets its liquidity and capital requirements primarily with cash from operations and external financing used to expand and modernize business related to generation, transmission, trade and distribution of energy as well as telecommunications.
An important point to note is that the Company seeks to invest in projects and, accordingly, uses credit facilities available in the market that suit Copel’s capital structure in terms of financial leverage compared to returns from projects.
41
![]()
|
|
|
|
Inflows - 2018 (In R$ million) | Company | Financing Agent | Value |
7ª Issuance of debentures | Holding | Debenturistas | 600 |
8ª Release of Funds UHE Colíder | Copel Geração e Transmissão | BNDES | 30 |
UHE Baixo Iguaçu | Copel Geração e Transmissão | BNDES | 162 |
Promissory Notes - 4ª Issuance | Copel Geração e Transmissão | Notistas | 600 |
4ª Issuance of debentures | Copel Geração e Transmissão | Debenturistas | 1,000 |
5ª Issuance of debentures | Copel Geração e Transmissão | Debenturistas | 290 |
Lib. Recources contract 415.855-22/14 LPT 5th tranche | Copel Distribuição | Caixa Econômica | 11 |
4ª Issuance of debentures | Copel Distribuição | Debenturistas | 1,000 |
Cutia | Cutia Empreendimentos Eólicos | BNDES | 513 |
Total |
|
| 4,206 |
Payments made in the year totaled R$3,407.80 million, of which R$2,617.8 million in principal and R$790.1 million in charges.
The long-term debt repayment schedule, comprising loans, financing and debentures, is as follows:

In 2018, the net income attributable to parent company’s shareholders was R$1,407.1 million, 36.1% higher than 2017, which amounted to R$1,033.6 million.
42
![]()
Distribution of dividends and interest on capital
(in R$ thousands) | 2018 | 2017 | ||||
Total | DIV | JCP | Total | DIV | JCP | |
Approval by AGO |
|
|
|
| 15/06/18 | 15/06/18 |
Approval by CAD |
|
| 12/12/18 |
| 12/04/18 | 13/12/17 |
Payment date | a definir | a definir | a definir | 14/08/18 | 14/08/18 | 14/08/18 |
Adjusted Net Income | 1,403,796 |
|
| 1,053,594 |
|
|
Value of ON Shares | 191,369 | 49,942 | 141,427 | 146,193 | 11,859 | 134,334 |
Value of PNA Shares | 950 | - | 950 | 950 | - | 950 |
Value of PNB Shares | 186,223 | 48,600 | 137,623 | 142,258 | 11,542 | 130,716 |
Gross Total Shared | 378,542 | 98,542 | 280,000 | 289,401 | 23,401 | 266,000 |
Note: The JCP information refers to the first semester of this financial year, stated on December 27, 2018 (§1 from Art. 73 of the Bylaws). | ||||||
Of the net income for 2018, calculated in accordance with corporate law, the Company proposes to distribute to shareholders the amount of R$378.5 million, as follows: a) interest on capital in place of dividends, in the gross amount of R$280 million, distributed as R$0.97515 per common share(ON), R$2.89050 per class "A" preferred share(PNA) and R$1.07270 per preferred class "B" share(PNB); and b) dividends amounting to R$98.5 million distributed as R$0.344435 per common share(ON) and R$0.37881 per preferred class B share(PNB).
The date of payment shall be decided at the Annual General Meeting.
Volume traded in 2018:
Traded Volume | ON (CPLE3) | PNB (CPLE6) | |||
Total | Daily average | Total | Daily average | ||
B3 | Trades | 87,489 | 356 | 1,021,590 | 4,153 |
Quantity | 21,323,100 | 86,679 | 203,723,400 | 828,144 | |
Volume (R$ thousand) | 501,151 | 2,037 | 5,065,366 | 20,591 | |
Presence in trade sessions | 246 | 100% | 246 | 100% | |
NYSE | Quantity | 861,370 | 4,350 | 122,677,117 | 488,753 |
Volume (US$ thousand) | 6,074 | 31 | 840,317 | 3,348 | |
Presence in trade sessions | 198 | 79% | 251 | 100% | |
Latibex | Quantity | - | - | 127,569 | 1,575 |
Volume (€ thousand) | - | - | 734 | 9 | |
Presence in trade sessions | - | - | 81 | 32% | |
43
![]()
Performance of the share price:
|
|
|
|
|
| Share | 2018 | 2017 | Change % |
B3 | ON (CPLE3) | R$ 29.80 | R$ 21.40 | 39.3 |
ON average | R$ 22.29 | R$ 22.40 | (0.5) | |
PNB (CPLE6) | R$ 30.55 | R$ 24.95 | 22.4 | |
PNB average | R$ 24.62 | R$ 28.29 | (13.0) | |
Ibovespa | 87,887 | 76,402 | 15.0 | |
Electricity Index | 49,266 | 39,732 | 24.0 | |
NYSE | ON (ELPVY) | US$ 7.71 | US$ 6.30 | 22.4 |
ON average | US$ 6.04 | US$ 6.88 | (12.3) | |
PNB (ELP) | US$ 7.83 | US$ 7.63 | 2.6 | |
PNB average | US$ 6.75 | US$ 8.87 | (23.9) | |
Dow Jones Index | 23,327.46 | 24,719.22 | (5.6) | |
Latibex | PNB (XCOP) | € 7.15 | € 6.29 | 13.7 |
PNB average | € 5.75 | € 7.98 | (27.9) | |
Latibex Index | 2,178.40 | 1,974.20 | 10.3 |
Since 2003, the Company has calculated the non-payment rate of the product "electric energy supply", whose calculation methodology considers a non-paying consumer as those overdue for over 15 days and up to 360 days, in accordance with the notice period, and the recognition of losses on past due debts is excluded.
In December 2018, Copel Distribuição's amount overdue by consumers was R$238.7 million, equivalent to 1.44% of its revenues, while in 2017 this amount reached R$226.5 million or 1.52% of revenues.
Although market expectations confirmed the end of the recession, 2018 was marked by impacts of the crisis, such as unemployment and low production levels.As a result, the non-payment indicators, presented by the Company and Abradee non-payment rates, differed according to the following table:
Indicator | 2018 | 2017 | Change % |
Abradee Non-Payment | 2.69% | 2.58% | 4.26% |
Company Non-Payment | 1.44% | 1.52% | -5.26% |
The investment program for 2019 was approved on November 8, 2018 by the 184th ordinary meeting of the BOD and updated by the 186th ordinary meeting of the BOD on January 23, 2019.
The investments made and projected are as follows:
44
![]()
| Realized | Estimated | Change % | |
Companies (in R$ millions) | 2018 | 2017 | 2019 | 2018-2017 |
Generation and Transmission | 729.3 | 1,071.3 | 794.8 | (31.9) |
Distribution | 696.0 | 630.4 | 835.0 | 10.4 |
Telecommunication | 309.4 | 241.1 | 290.2 | 28.3 |
Cutia | 781.3 | 566.0 | 59.2 | 38.0 |
Other (2) | 53.7 | - | 14.3 | - |
Total | 2,569.7 | 2,508.8 | 1,993.5 | 2.4 |
(1) Refers to the participation of Copel in the establishment. | ||||
(2) Includes Copel Renováveis, São Bento Energia, Copel Brisa Potiguar, SPE Voltália São Miguel do Gostoso, SPE Paraná Gás, SPE Dois Saltos, Copel Comercialização, Copel Renováveis and Copel Holding. | ||||
The investments made in 2017 and 2018 were mainly intended to conclude works in progress, which also justifies the reduction of the budget projected for 2019, given that the main projects are being completed.
4.10. Research & Development-R&D and Energy Efficiency Program - EEP
The legislation requires the application of a minimum percentage of Net Operating Revenue – NOR in R&D and EEP projects.In addition to these amounts, a contribution to the National Fund for Scientific and Technological Development - FNDCT and the Ministry of Mines and Energy - MME, is also made, which in 2018 was R$47.5 million.
Generation and Transmission
In 2018, Copel Geração e Transmissão invested R$22.8 million in the execution of 29 R&D projects, of which 7 are strategic, whose themes were established by Aneel through Call for Projects.In 10 projects, it participated cooperatively with other companies.It also applied approximately R$414.4 thousand in the management of R&D projects through management projects, totaling R$23.3 million invested in R&D.
Distribution
In 2018, R$30.9 million were invested in:42 R&D projects (8 completed during the year and 34 are underway) and participation in cooperation with other companies in the electric energy sector in 9 projects, among them 2 strategic projects whose themes were established by Aneel through Call for Projects.
Seven new projects were contracted, of which four were selected through the Innovation Committee, the theme of which was established by Aneel. The investments total R$25 million to be realized in up to 4 years.
In 2018, the Company invested R$10.1 million in EEP projects.
45
![]()
5. SOCIal AND ENVIRONMENTAL PERFORMANCE
Considering Copel Holding, Copel Distribuição, Copel Geração e Transmissão, Copel Telecomunicações and Copel Comercialização, the Company has 7,611 employees in its headcount. 27 new employees were admitted in 2018 through a public tender and one employee was reinstated.During the same period, 671 employees left the Company.563 left by the voluntary retirement program (PDI).The turnover rate was 4.3% in 2018 and 2.5% in 2017.
· People Development
In an era in which people and their knowledge became the main competitive differentials of companies, encourage and promote the education and development of employees, constantly relying on qualified and experienced professionals, is Copel’s strategy to face this challenge, allowing all of its professionals to bring to bear their potential in and environment conducive to the development of their skills and development of their career. To this end, several educational actions are promoted, ranging from basic training to graduate and research courses. These actions are organized into: corporate programs, training courses (for basic training to perform duties), compulsory training (courses for specific activities), training for professional improvement, events (seminars, lectures, workshops, congresses, etc.) and research and development projects.
Copel also offers training for outsourced employees, provided for in an agreement or due to the Company's interest, focused on integration and specific activities to be performed by the professionals when rendering services.
The Corporate Education model is based on the synergistic and cooperative performance of the Corporate University and the training areas of the wholly owned subsidiaries, focusing on business competitiveness and profitability.
Corporate education actions (integrity, sustainability, foreign language training, leadership, preparation for the future, integration, among other programs) are coordinated by UniCopel and aim to build learning focused on areas of knowledge that are directly aligned with the Company's skills and business.
We highlight, in 2018, the expansion of Copel's Distance Education actions, the continuity of the Leadership Program and the strengthening of the Integrity and Accessibility Programs.
Copel’s Distance Learning Platform
In 2018, there was an increase in the number of distance courses offered by both UniCopel and the training areas of the wholly-owned subsidiaries.The use of this type of education has allowed more people access to knowledge, to improve their activities and their personal and professional development. In addition, distanceeducation has been a powerful ally in the communication of significant and /or mandatory information to all employees, such as the Code of Conduct, Cost Management and Anticorruption Law.
46
![]()
In order to support the growth of the use of this modality, UniCopel has made several improvements in the distance education platform in the last year and has studied new tools and methodologies to increase learning and the results obtained by these means.
Transformational Leadership Program
The Transformational Leadership program, implemented in 2016, continued in 2017 and was extended in 2018.
The main objective of the program has been to train leaders prepared for the responsible management of business and people, without diminishing attention on well-being and the development of their teams.
The program's in-person educational actions in 2018 were directed toward new managers who had not yet participated in any action in 2017 in an effort to align them with the new culture being constructed. There were also distance courses for the entire management team on topics that were very significant to the Company: diversity, sustainability, innovation and emotional management, as well as a great meeting for all Copel leaders, where the Company's Officers discussed with management body strategic themes for business success.
Accessibility Program
Copel's commitment to the accessibility and inclusion of people with disabilities - PcDs - in the Company's day-to-day business has been a long-standing one.Reaffirming this commitment, several seminars and training sessions were held in 2018 in different cities in Paraná State to raise awareness and knowledge among the Company's employees about the main difficulties faced by the PcDs and to present ways to improve their inclusion in Copel routines.
Another action that reinforced this commitment was the launching of the course "Meet a disabled person", a partnership between the Family and Social Development Secretariat of Paraná and Copel, which sought to communicate knowledge about PcDs and promote a culture of inclusion.Last year, 2,719 people attended this course on the distance education platform.
Other programs
In addition to its own training and qualification programs, the Company encourages the training of its professionals through the following initiatives:
Foreign Language Training Program - established in 2012, it is intended for employees who perform activities in which another language is required.
Graduate courses - a program focused on the professional development in specific and strategic subjects focused on the production of researches, dissertations, theses, generating innovations and improvements for the Company and for the electric sector.
47
![]()
· Benefits
Highlights of the benefits granted by the Company to all its employees, in addition to those provided for by legislation, include: tuition grants; advances on vacation pay and additional payment of 1/3 of salary in addition to legally required amounts; advance of the first installment of the 13th monthly salary in the month of January; profit sharing; quality of life incentives, with initiatives such as Copel's choir and the company games; food and meal vouchers; snack voucher; childcare assistance; assistance to employees with disabilities and to employees who have disabled dependents; maternity leave and extended paternity leave; and supplementation of sickness pay. In addition to these, as of October 2018, employees may opt to reduce the working day from 8 hours to 6 hours, at no reduction of salary, according to the criteria established in internal regulations. Additionally, Copel´s Pension and Social Assistance Foundation, for which Copel acts as a sponsor grants a: private pension plan to supplement official social security as well as health and dental care plans. Copel Foundation also provides a portfolio of loans to its participants under legal provisions governing the investment of its pension fund reserves.
· Compensation policy
Copel’s practices for compensation, recognition and incentives are based on the Company’s structured compensation model supported by two pillars: fixed pay (reflecting market levels and individual merit) and variable pay (Profit Sharing Program [PLR]).Copel's employee profit sharing program complies with Federal Law 10,101 /2000, State Decree 1,978 /2007 and State Law 16,560 /2010, and income is distributed equally to all employees.The ratio between the lowest salary paid by the Company in December 2018 (R$1,834.84) and the national minimum wage in effect on that date (R$954.00) was 1.92 times, and there was no significant difference in the same period in relation to the proportion of basic salary between men and women.
· Labor relations
There are 19 trade unions representing the various classes of workers, and Copel holds meetings with them to discuss matters of mutual interest.In the collective bargaining month (October), this relationship intensifies when the unions and Copel discuss demands for the official collective bargaining agreement (ACT).
· Performance assessment
Since 2013, Copel's Performance Management is carried out through the Our Energy Program, which is annually improved in accordance with the best market practices.In 2018, 100% of the employees considered able were submitted to the performance assessment.
Copel's suppliers must comply with the legislation in force in Brazil across all areas. The compliancerequirement is expressed in the Internal Regulations for Bids and Contracts, contractual clauses, supplier registration manuals and technical standards and manuals, which are permanently availableonline.
48
![]()
In 100% of the labor assignment agreements, outsourced workers undergo an integration process, in which Copel highlights its contractual demands regarding social and environmental issues, human and labor rights, accessibility and inclusion, and combatting child labor.Failure to comply may lead to administrative sanctions, such as fines, contractual termination, or even a ban, for up to two years, from participating in new Company bids.
Copel has maintained in its contracts a standard clause of social and environmental responsibility. In 2016, hiring began to be accompanied by Declaration of Suitability and Social Responsibility. In 2018, a new contract model came into force, which also includes aspects of human rights, in particular the fulfillment of the 10 Principles of the Global Compact.
Depending on the object to be contracted, some specific clauses related to environmental requirements are inserted in the minutes that accompany the bid for tender when it is published.
Copel believes that the sustainability of its business model depends on an ongoing dialogue with various stakeholders: shareholders, consumers, employees, suppliers, the government and communities.The relationship with all these groups, with quality and in a transparent manner, is evaluated by the Company as a competitive advantage.
For this reason, Copel maintains a working group dedicated to executing a structured relationship policy, governed by constant planning and activities, with the purpose of guaranteeing levels of excellence of these groups’ satisfaction with the Company.
· Copel Distribuição
For the second year in a row, Copel was elected by Aneel as the best major energy distributor in Brazil and in the South region in the perception of the residential customer.The award refers to the Aneel Consumer Satisfaction Index (IASC) 2018, an indicator that reveals customer satisfaction with the services provided last year.
In order to reach IASC, Aneel evaluates a series of criteria, such as the quality perceived by the customer, cost-benefit ratio of services, general satisfaction and trust in the supplier.
· Copel Telecomunicações
Copel Telecom was the best-rated broadband operator by customers in the Satisfaction and Perceived Quality Survey of 2018 conducted by Anatel.In order to prepare the ranking of the best evaluated companies and reach the index of general satisfaction of the contracted service, indicators such as service channels, product offer, collection and general quality are assessed, forming the rank of each company.Copel Telecom customers awarded a grade of 8.35 the highest ranking achieved by a fixed broadband company since the survey was launched.
49
![]()
5.4. Social and Environmental Responsibility
Social responsibility is a commitment for Copel, which seeks alternatives that promote social well-being, in line with legislation and behavioral norms.These expectations are often assessed through satisfaction surveys (and the manifestations received through dialogue channels and relationship programs).
The guidelines of the Company's Sustainability Policy include:
· Promote social responsibility actions guided by the mission, values and voluntary commitments assumed.
· Manage private social investment and tax incentives with transparency, intended to maximize the social return of invested funds.
· Encourage employees to engage in voluntary work to improve social reality
· Promote awareness and education actions for the internal public and other stakeholders related to sustainability
· Promote accessibility in all its forms, ensuring the full rights for people with disabilities
50
![]()
Actions are also carried out which are intended to value diversity, inclusion and combat discrimination in relation to gender, sexual orientation, race, beliefs, ethnicity and people with disabilities.Likewise, it seeks to combat the sexual exploitation of children and adolescents in the value chain and prioritize efforts in situations of greater vulnerability, as well as eliminating all forms of forced or child labor.Copel seeks to ensure freedom of association and effective recognition of the right to collective bargaining.It also acts strongly on accessibility issues.
With regard to natural resources management, the Company undertakes activities to achieve water, energy and paper use targets, which are part of the Eco-efficiency Program and intend to support projects to reduce and employ better use of these resources, building awareness in various areas of the Company and meeting the strategic guideline to achieve excellence in costs, processes and quality.The program also operates on the lines of mobility, fuel, education, and communication.
In 2018, the following initiatives were carried out: a device was tested to reduce water consumption in toilets; management of water, energy and fuel consumption; and educational campaigns.The campaign to encourage the use of ethanol in the fleet of vehicles was also maintained, and the Copel’s No Plastics campaign was launched, with a view to reducing the consumption of plastic cups.Regarding the use of energy, one highlight was an action to reduce consumption in microcomputers. With regard to mobility, the following initiatives were highlighted: "Bike to Work Day "(May 11),"World Car Free Day"(week of September 17 to 22) - zero emissions (pedestrians and cyclists) and the I Pedalada Interpolos Copel.
More information on the Company's social and environmental responsibility can be found in the Integrated Report (www.copel.com/sustentabilidade), which states the performance associated with the generation of value in the social, economic and environmental dimensions.
51
![]()
6. BALANCE SHEET
| ANNUAL SOCIAL BALANCE SHEET | |||||||
| On December 31, 2018 and 2017 | |||||||
| (In thousands of Reais, except when indicated otherwise) | |||||||
2018 |
| 2017 | ||||||
| 1 - CALCULATION BASIS |
|
|
|
|
|
|
|
NE 31 | Net Revenue (NR) | 14,934,780 |
| 14,024,573 | ||||
| ||||||||
| 2 - INTERNAL SOCIAL INDICATORS |
| % on RL |
|
| % on RL | ||
NE 32.2 | Management compensation | 21,673 | 0.1 |
| 23,240 | 0.2 | ||
| Employees compensation | 904,200 |
| 6.1 |
| 927,782 |
| 6.6 |
Food (food voucher and other) | 134,781 | 0.9 |
| 143,015 | 1.0 | |||
| Compulsory payroll charges | 306,836 |
| 2.1 |
| 316,680 |
| 2.3 |
Pension plan | 79,806 | 0.5 |
| 80,180 | 0.6 | |||
| Health (healthcare plan) | 184,572 |
| 1.2 |
| 179,319 |
| 1.3 |
Training and professional development | 8,053 | 0.1 |
| 8,000 | 0.1 | |||
NE 32.2 | Profit sharing | 91,526 |
| 0.6 |
| 68,817 |
| 0.5 |
NE 32.2 | Severance pay | 69,289 | 0.5 |
| 53,468 | 0.4 | ||
(1) | Other benefits | 15,664 |
| 0.1 |
| 15,878 |
| 0.1 |
| Total | 1,816,400 |
| 12.2 |
| 1,816,379 |
| 13.0 |
| 3 - EXTERNAL SOCIAL INDICATORS |
| % on RL |
|
| % on RL | ||
Culture | 12,846 | 0.1 |
| 17,700 | 0.1 | |||
| Health and sanitation | 2,280 |
| - |
| 1,130 |
| - |
Sports | 2,883 | - |
| 1,129 | - | |||
| Other | 65,904 |
| 0.4 |
| 72,022 |
| 0.5 |
Research and Development | 45,786 | 0.3 |
| 41,318 | 0.3 | |||
| Energy Efficiency Program | 10,135 |
| 0.1 |
| 22,451 |
| 0.2 |
“Morar Bem” Program | 2,381 | - |
| 3,044 | - | |||
| “Tarifa Noturna” Program | 2,355 |
| - |
| 291 |
| - |
Other | 5,247 | - |
| 4,918 | - | |||
| Total contribution to society | 83,913 |
| 0.6 |
| 91,981 |
| 0.7 |
Taxes (except payroll charges) | 8,925,290 | 59.8 | 7,626,806 | 54.4 | ||||
| Total | 9,009,203 |
| 60.4 |
| 7,718,787 |
| 55.1 |
| 4 – ENVIRONMENTAL INDICATORS |
| % on RL |
|
| % on RL | ||
| ||||||||
| Investments related to corporate operations | 290,214 |
| 1.9 |
| 236,345 |
| 1.7 |
Investments in programs and/or external projects | 2,818 | - |
| 2,178 | - | |||
| Total | 293,032 |
| 2.0 |
| 238,523 |
| 1.7 |
|
| |||||||
(2) | Quantity of environmental sanctions | 3 |
|
|
| 4 |
|
|
Amount of environmental sanctions (R$ thousands) | 544 |
| 361 | |||||
| ||||||||
| Metas ambientais |
|
| 2018 |
|
|
| Goals 2019 |
Regarding the establishment of annual targets to reduce waste; general consumption regarding production/operations; and increasing the efficacy in the use of natural resources, the company: | ( ) has no targets |
| ( ) has no targets | |||||
|
|
|
|
|
|
|
|
|
NE - Note | ||||||||
52
![]()
| ||||||||
2018 |
| 2017 | ||||||
| ||||||||
| 5 – EMPLOYEES INDICATORS (including subsidiaries) |
|
|
|
| |||
| ||||||||
| Employees at the end of the period |
|
| 7,794 |
|
|
| 8,432 |
New hires in the period | 37 |
| 76 | |||||
| Level of education of employees: | Men | Women | Total |
| Men | Women | Total |
Total Post-Secondary and University Extension | 2,994 | 1,241 | 4,235 |
| 3,132 | 1,311 | 4,443 | |
| Total Senior High School | 3,028 | 503 | 3,531 |
| 3,254 | 585 | 3,839 |
Total Junior High School | 28 | 0 | 28 |
| 143 | 7 | 150 | |
| Employees Age Grade: |
|
|
|
|
|
|
|
From 18 to 30 years old (exclusive) | 419 |
| 678 | |||||
| From 30 to 45 years old (exclusive) |
|
| 4,185 |
|
|
| 4,282 |
From 45 to 60 years old (exclusive) | 3,042 |
| 3,339 | |||||
| Over 60 years old |
|
| 148 |
|
|
| 133 |
Women working in the company | 1,744 |
| 1,903 | |||||
| % Women in management positions: |
|
|
|
|
|
|
|
In relation to total number of women | 6.0 |
| 5.7 | |||||
| In relation to total number of managers |
|
| 20.2 |
|
|
| 20.4 |
Afro descendants working in the company | 1,010 |
| 1,068 | |||||
| % Afro descendants in management positions: |
|
|
|
|
|
|
|
In relation to total number of afro-descendants | 3.7 |
| 3.6 | |||||
| In relation to total number of managers |
|
| 7.2 |
|
|
| 7.2 |
Persons with special needs | 257 |
| 269 | |||||
| Dependents |
|
| 14,129 |
|
|
| 15,401 |
(3) | Outsourced | 6,520 |
| 7,009 | ||||
(4) | Apprentices |
|
| 195 |
|
|
| 238 |
(4) | Interns | 252 |
| 239 | ||||
| No. of labor claims in course at the end of the year |
| 3,797 |
|
|
| 4,385 | |
No. of labor claims closed in the year | 1,231 |
| 1,339 | |||||
| ||||||||
| 6 – MATERIAL INFORMATION REGARDING THE EXERCISE OF CORPORATE CITIZENSHIP |
|
|
| ||||
| ||||||||
| ||||||||
Ratio between the highest and the lowest salary | 19 |
| 19 | |||||
(5) | Number of Occupational Accidents |
|
| 300 |
|
|
| 257 |
Total number of consumer complaints and criticisms: |
| |||||||
| with the company |
|
| 51,757 |
|
|
| 80,922 |
(6) | with Procon agency | 7,650 |
|
| 9,558 | |||
| in Court |
|
| 6,950 |
|
|
| 4,805 |
Percentage of complaints and criticisms answered or resolved: |
| |||||||
| by the company |
|
| 100.0% |
|
|
| 99.7% |
(6) | by Procon agency | 100.0% |
|
| 100.0% | |||
| in Court |
|
| 21.4% |
|
|
| 14.8% |
|
|
|
|
|
|
|
|
|
53
![]()
|
|
|
|
|
|
|
|
|
|
|
|
| 2018 |
|
|
| Goals 2019 |
| ||||||||
Social and environmental projects developed by the company were defined by | Executive board and managers |
| executive board and managers | |||||
| Safety and health standards in the workplace were defined by: | all + Cipa |
| all + Cipa | ||||
Regarding freedom of association, collective bargaining rights and internal representation of workers, the company: | encourages and follows ILO standards |
| encourages and will follow ILO standards | |||||
| Private pension plans cover: | all |
| all | ||||
Profit sharing includes: | all |
| all | |||||
| In the selection of suppliers, the same ethical, social responsibility and environmental standards adopted by the company: | are required |
| are required | ||||
Regarding participation of employees in volunteer work, the company: | organizes and encourages |
| will organize and encourage | |||||
| ||||||||
| 7- WEALTH GENERATION AND DISTRIBUTION |
|
| 2018 |
|
|
| 2017 |
| ||||||||
| ||||||||
| Total added value to be distributed |
| 13,364,990 |
|
| 11,772,831 | ||
Value Added Distribution (DVA): |
| |||||||
| Third Parties |
|
| 9.2% |
|
|
| 10.8% |
Personnel | 11.4% |
| 12.8% | |||||
| Government |
|
| 68.6% |
|
|
| 66.9% |
Shareholders | 2.8% |
| 2.5% | |||||
| Withheld |
|
| 8.1% |
|
|
| 7.0% |
| ||||||||
| 8 - OTHER INFORMATION |
|
|
|
|
| ||
| • Begining 2010, the Brazilian Institute of Social and Economic Analyses (Ibase) no longer requires use of its Social Balance Sheet standard, given that the Institute understands that this tool and methodology are already commonly used by companies, consulting firms and institutes that promote corporate social responsibility in Brazil. Accordingly, Copel, which had already been using this model since 1999, grounded on Ibase guidance, decided to improve the presentation of its Social Balance Sheet by addressing te information requeired by NBCT 15, aiming at transparency of its information. | |||||||
• The Notes (NEs) are na integral part of the Financial Statements and contain other socio-environmental information not included in this Social Balance Sheet. | ||||||||
| • This Social Balance Sheet includes data about Copel's holding, wholly-owned subsidiaries, subsidiaries and consortiums, due to the consolidation of the Company's results, except when stated otherwise. | |||||||
(1) The item "Other Benefits" includes: additional sick pay, extended maternity leave, insurance, additional transportation ticket, disability allowance, accidental death, day-care assistance, education allowance, culture and occupational and medical safety. | ||||||||
| (2) Information regarding fines and socio-environmental assessments of the holding and Copel Distribuição S.A., Copel Geração e Transmissão S.A, Copel Telecomunicações S.A., Copel Comercialização S.A. and Copel Renováveis S.A. These original amounts may change according to the answer to the administrative defense submitted to the environmental authority. The amounts of the sanctions are proportional to Copel's equity interest in the developments. | |||||||
| (3) This number corresponds to total outsourced workers hired in the period, regardless of the number of hours worked. It does not include the number of outsourced positions; contractors who work in the implementation of Copel Geração e Transmissão ans the subsidiaries (Plants, Transmission Lines and substations); or those working on the expansion of the Copel Telecom system. | |||||||
| (4) Not included in the Company's headcount. | |||||||
| (5) Calculated using the methodology used in the GRI Sustainability Report G4 - indicator LA6. | |||||||
| (6) Includes the complaints in the Procon, Ombudsman, Consumer Gov.Aneel and Anatel deemed appropriate. | |||||||
54
![]()
7. COMPOSITION OF GROUPS RESPONSIBLE FOR GOVERNANCE
BOARD OF DIRECTORS |
|
Chairman | MAURICIO SCHULMAN |
Members | DANIEL PIMENTEL SLAVIERO ADRIANA ANGELA ANTONIOLLI LEILA ABRAHAM LORIA MARCO ANTÔNIO BARBOSA CÂNDIDO OLGA STANKEVICIUS COLPO SÉRGIO ABU JAMRA MISAEL (VAGO) (VAGO) |
STATUTORY AUDIT COMMITTEE |
|
Chairman
| MAURICIO SCHULMAN
|
Members | LEILA ABRAHAM LORIA MARCO ANTÔNIO BARBOSA CÂNDIDO OLGA STANKEVICIUS COLPO (VAGO)
|
FISCAL COUNCIL |
|
Chairman | ROBERTO LAMB |
Full Members | CLEMENCEAU MERHEB CALIXTO DAVID ANTONIO BAGGIO BATISTA GEORGE HERMANN RODOLFO TORMIN LETÍCIA PEDERCINI ISSA MAIA |
|
|
Substitute Members | KURT JANOS TOTH JULIO TAKESHI SUZUKI JÚNIOR OTAMIR CESAR MARTINS JOÃO LUIZ GIONA JUNIOR GILBERTO PEREIRA ISSA |
EXECUTIVE BOARD |
|
CEO | DANIEL PIMENTEL SLAVIERO |
Chief Enterprise Management Officer | ANA LETÍCIA FELLER |
Chief Financial and Investor Relations Officer | ADRIANO RUDEK DE MOURA |
Chief Business Development Officer | CASSIO SANTANA DA SILVA |
Chief Legal and Institutional Relations Officer | EDUARDO VIEIRA DE SOUZA BARBOSA |
Chief Governance, Risk and Compliance Officer | vicente loiácono neto |
Deputy Officer | DAVID CAMPOS |
|
|
ACCOUNTANT |
|
CRC-PR-045809/O-2 | ADRIANO FEDALTO |
|
|
More details on this report: |
|
Investor Relations:
| Fone: +55 (41) 3222-2027 ri@copel.com |
55
![]()
Companhia Paranaense de Energia
Corporate Taxpayer's ID (CNPJ/MF) 76.483.817/0001-20
State registration 10146326-50
Publicly-Held Company - CVM 1431-1
www.copel.com copel@copel.com
Rua Coronel Dulcídio, 800, Batel - Curitiba - PR
CEP 80420-170
FINANCIAL STATEMENTS
2018
![]()
SUMÁRIO | ||
![]()
Statements of Financial Position
as of December 31, 2018 and 2017
All amounts expressed in thousands of Brazilian reais
ASSETS | Note |
| Parent Company |
| Consolidated |
|
|
|
|
| |
|
| 12.31.2018 | 12.31.2017 | 12.31.2018 | 12.31.2017 |
|
|
|
|
|
|
CURRENT ASSETS |
|
|
|
|
|
Cash and cash equivalents | 5 | 315,003 | 56,833 | 1,948,409 | 1,040,075 |
Bonds and securities | 6 | 123,560 | 90 | 124,862 | 1,341 |
Collaterals and escrow accounts |
| 129 | 129 | 203 | 59,372 |
Trade accounts receivable | 7 | - | - | 2,944,091 | 2,733,240 |
Dividends receivable |
| 519,100 | 459,464 | 76,672 | 80,815 |
CRC transferred to the Paraná State Government | 8 | 190,876 | 167,109 | 190,876 | 167,109 |
Sectorial financial assets | 9 | - | - | 421,184 | 171,609 |
Accounts receivable - concessions | 10 | - | - | 53,177 | 149,744 |
Contract assets | 11 | - | - | 85,019 | - |
Other current receivables | 12 | 7,027 | 8,287 | 363,250 | 409,351 |
Inventories |
| - | - | 116,285 | 110,559 |
Income tax and social contribution receivable | 13.1 | 6,130 | 14,055 | 152,157 | 501,685 |
Other current recoverable taxes | 13.3 | 321 | 276 | 160,842 | 198,232 |
Prepaid expenses | 14 | 40 | - | 40,819 | 39,867 |
Receivable from related parties | 15 | 8,134 | 292,051 | - | 38,835 |
|
| 1,170,320 | 998,294 | 6,677,846 | 5,701,834 |
|
|
|
|
|
|
NONCURRENT ASSETS |
|
|
|
|
|
Long Term Assets |
|
|
|
|
|
Bonds and securities | 6 | - | - | 219,434 | 218,322 |
Other temporary investments | 16 | 19,511 | 18,727 | 19,511 | 18,727 |
Collaterals and escrow accounts | 22.1 | - | - | 89,555 | 75,665 |
Trade accounts receivable | 7 | - | - | 162,915 | 261,082 |
CRC transferred to the Paraná State Government | 8 | 1,254,166 | 1,349,253 | 1,254,166 | 1,349,253 |
Judicial deposits | 16 | 131,840 | 119,167 | 528,290 | 582,529 |
Sectorial financial assets | 9 | - | - | 257,635 | 171,609 |
Accounts receivable - concessions | 10 | - | - | 2,497,514 | 4,429,237 |
Contract assets | 11 | - | - | 3,348,211 | - |
Other noncurrent receivables | 12 | 7,444 | - | 228,894 | 149,416 |
Income tax and social contribution receivable | 13.1 | 148,140 | 158,808 | 166,384 | 176,480 |
Deferred income tax and social contribution | 13.2 | 147,368 | 102,236 | 1,007,061 | 915,492 |
Other noncurrent recoverable taxes | 13.3 | 86,110 | 15 | 231,400 | 116,974 |
Prepaid expenses | 14 | - | - | 3,290 | 12,684 |
Receivable from related parties | 15 | 104,751 | 219,426 | - | 130,156 |
|
| 1,899,330 | 1,967,632 | 10,014,260 | 8,607,626 |
|
|
|
|
|
|
Investments | 17 | 16,070,567 | 14,987,607 | 2,368,234 | 2,570,643 |
Property, plant and equipment | 18 | 996 | 830 | 10,840,663 | 9,829,450 |
Intangible assets | 19 | 1,593 | 1,603 | 6,029,097 | 6,452,824 |
|
|
|
|
|
|
|
| 17,972,486 | 16,957,672 | 29,252,254 | 27,460,543 |
|
|
|
|
|
|
TOTAL ASSETS |
| 19,142,806 | 17,955,966 | 35,930,100 | 33,162,377 |
Notes are an integral part of these financial statements. | |||||
3
![]()
Statements of Financial Position
as of December 31, 2018 and 2017
All amounts expressed in thousands of Brazilian reais
LIABILITIES | Note |
| Parent Company |
| Consolidated |
|
|
|
|
| |
|
| 12.31.2018 | 12.31.2017 | 12.31.2018 | 12.31.2017 |
|
|
|
|
|
|
CURRENT LIABILITIES |
|
|
|
|
|
Payroll, social charges and accruals | 20 | 6,747 | 6,977 | 284,179 | 313,967 |
Accounts payable to related parties |
| 755 | 3,936 | - | - |
Accounts payable to suppliers | 21 | 2,731 | 2,096 | 1,419,243 | 1,683,577 |
Income tax and social contribution payable | 13.1 | - | 2,467 | 197,949 | 86,310 |
Other taxes due | 13.3 | 152 | 476 | 451,433 | 345,487 |
Loans and financing | 22 | 129,401 | 322,092 | 1,113,047 | 784,666 |
Debentures | 23 | 941,677 | 339,341 | 2,184,881 | 1,632,062 |
Dividend payable |
| 354,203 | 267,988 | 375,675 | 288,981 |
Post-employment benefits | 24 | 87 | 57 | 58,478 | 53,225 |
Sectorial charges due | 25 | - | - | 79,872 | 150,025 |
Research and development and Energy efficiency | 26 | - | - | 270,429 | 282,766 |
Accounts payable related to concession | 27 | - | - | 67,858 | 62,624 |
Sectorial financial liabilities | 9 | - | - | - | 192,819 |
Other accounts payable | 28 | 135 | 249 | 192,070 | 121,405 |
Provisions for legal claims | 29 | - | 112,000 | - | 112,000 |
|
| 1,435,888 | 1,057,679 | 6,695,114 | 6,109,914 |
|
|
|
|
|
|
NONCURRENT LIABILITIES |
|
|
|
|
|
Accounts payable to suppliers | 21 | - | - | 49,956 | 43,469 |
Deferred income tax and social contribution | 13.2 | - | - | 157,420 | 156,630 |
Other taxes due | 13.3 | 2,602 | 2,365 | 796,732 | 809,576 |
Loans and financing | 22 | 773,984 | 664,020 | 2,934,260 | 2,974,839 |
Debentures | 23 | 596,403 | 876,140 | 5,333,250 | 4,438,916 |
Post-employment benefits | 24 | 4,867 | 3,995 | 910,285 | 812,878 |
Research and development and Energy efficiency | 26 | - | - | 322,306 | 249,709 |
Accounts payable related to concession | 27 | - | - | 516,305 | 492,330 |
Sectorial financial liabilities | 9 | - | - | 96,531 | 90,700 |
Other accounts payable | 28 | 3,957 | 830 | 116,954 | 72,849 |
Provisions for legal claims | 29 | 292,180 | 143,095 | 1,664,773 | 1,400,064 |
|
| 1,673,993 | 1,690,445 | 12,898,772 | 11,541,960 |
|
|
|
|
|
|
EQUITY |
|
|
|
|
|
Attributable to controlling shareholders |
|
|
|
|
|
Capital | 30.1 | 7,910,000 | 7,910,000 | 7,910,000 | 7,910,000 |
Equity valuation adjustments | 30.2 | 785,610 | 895,601 | 785,610 | 895,601 |
Legal reserve |
| 914,751 | 844,398 | 914,751 | 844,398 |
Profit retention reserve |
| 6,422,564 | 5,557,843 | 6,422,564 | 5,557,843 |
|
| 16,032,925 | 15,207,842 | 16,032,925 | 15,207,842 |
|
|
|
|
|
|
Attributable to non-controlling interests | 17.2.2 | - | - | 303,289 | 302,661 |
|
|
|
|
|
|
|
| 16,032,925 | 15,207,842 | 16,336,214 | 15,510,503 |
|
|
|
|
|
|
TOTAL LIABILITIES & EQUITY |
| 19,142,806 | 17,955,966 | 35,930,100 | 33,162,377 |
Notes are an integral part of these financial statements. | |||||
4
![]()
for the years ended December 31, 2018 and 2017
All amounts expressed in thousands of Brazilian reais
| Note |
| Parent Company |
| Consolidated |
|
|
|
|
| |
|
| 12.31.2018 | 12.31.2017 | 12.31.2018 | 12.31.2017 |
NET OPERATING REVENUE | 31 | - | - | 14,934,780 | 14,024,573 |
|
|
|
|
|
|
OPERATING COSTS | 32 | - | - | (11,501,688) | (10,665,890) |
|
|
|
|
|
|
GROSS PROFIT |
| - | - | 3,433,092 | 3,358,683 |
|
|
|
|
|
|
Operational expenses / income |
|
|
|
|
|
Selling expenses | 32 | - | - | (148,709) | (169,050) |
General and administrative expenses | 32 | (67,292) | (59,601) | (723,534) | (685,675) |
Other operational income (expenses) | 32 | 11,696 | (68,788) | (302,690) | (464,316) |
Equity in earnings of investees | 17 | 1,356,375 | 1,291,434 | 135,888 | 101,739 |
|
| 1,300,779 | 1,163,045 | (1,039,045) | (1,217,302) |
|
|
|
|
|
|
PROFIT BEFORE FINANCIAL RESULTS AND TAXES |
| 1,300,779 | 1,163,045 | 2,394,047 | 2,141,381 |
|
|
|
|
|
|
Financial results | 33 |
|
|
|
|
Financial income |
| 301,729 | 181,312 | 813,915 | 699,310 |
Financial expenses |
| (238,355) | (327,855) | (1,251,965) | (1,447,750) |
|
| 63,374 | (146,543) | (438,050) | (748,440) |
|
|
|
|
|
|
OPERATING PROFIT |
| 1,364,153 | 1,016,502 | 1,955,997 | 1,392,941 |
|
|
|
|
|
|
INCOME TAX AND SOCIAL CONTRIBUTION | 13.4 |
|
|
|
|
Current |
| (2,083) | (36,803) | (580,065) | (379,943) |
Deferred |
| 44,993 | 53,927 | 68,072 | 105,257 |
|
| 42,910 | 17,124 | (511,993) | (274,686) |
|
|
|
|
|
|
NET INCOME |
| 1,407,063 | 1,033,626 | 1,444,004 | 1,118,255 |
Attributed to controlling shareholders |
| - | - | 1,407,063 | 1,033,626 |
Attributed to non-controlling interest | 17.2.2 | - | - | 36,941 | 84,629 |
|
|
|
|
|
|
BASIC AND DILUTED NET EARNING PER SHARE ATTRIBUTED TO PARENT |
|
|
|
|
|
COMPANY SHAREHOLDERS - EXPRESSED IN BRAZILIAN REAIS | 30.5 |
|
|
|
|
Common shares |
| 4.91091 | 3.60754 |
|
|
Class "A" Preferred shares |
| 5.40201 | 3.96830 |
|
|
Class "B" Preferred shares |
| 5.40201 | 3.96830 |
|
|
Notes are an integral part of these financial statements. | |||||
5
![]()
Statements of Comprehensive Income
for the years ended December 31, 2018 and 2017
All amounts expressed in thousands of Brazilian reais
| Note |
| Parent Company |
| Consolidated |
|
|
|
| ||
|
| 12.31.2018 | 12.31.2017 | 12.31.2018 | 12.31.2017 |
|
|
|
|
| |
NET INCOME |
| 1,407,063 | 1,033,626 | 1,444,004 | 1,118,255 |
Other comprehensive income |
|
|
|
|
|
Items that will never be reclassified to profit or loss | 30.2 |
|
|
|
|
Gain (losses) on actuarial liabilities |
|
|
|
| |
Post employment benefits |
| (408) | 18 | (58,354) | (46,506) |
Post employment benefits - equity |
| (38,245) | (29,567) | - | - |
Taxes on other comprehensive income |
| 139 | (7) | 19,994 | 16,827 |
Items that may be reclassified to profit or loss | 30.2 |
|
|
| |
Adjustments related to financial assets |
| - | 11,661 | - | 26,138 |
Adjustments related to financial assets - equity |
| - | 9,554 | - | - |
Taxes on other comprehensive income |
| - | (3,965) | - | (8,888) |
Realization - gain on financial assets, net of tax |
| - | (9,355) | - | (18,909) |
Realization - gain on financial assets - equity |
| - | (9,554) | - | - |
Total comprehensive income, net of taxes |
| (38,514) | (31,215) | (38,360) | (31,338) |
|
|
|
|
| |
TOTAL COMPREHENSIVE INCOME |
| 1,368,549 | 1,002,411 | 1,405,644 | 1,086,917 |
|
|
|
|
| |
Attributed to controlling shareholders |
|
|
| 1,368,549 | 1,002,411 |
Attributed to non-controlling interest |
|
|
| 37,095 | 84,506 |
|
|
|
|
|
|
Notes are an integral part of these financial statements. | |||||
6
![]()
Statements of Changes in Equity
for the years ended December 31, 2018 and 2017
All amounts expressed in thousands of Brazilian reais
|
| Attributable to controlling shareholders |
|
|
| |||||
|
|
| Equity valuation adjustments | Profit reserves |
| Attributable |
| |||
|
|
|
|
|
|
| to |
| ||
| Note |
|
| Other |
| Profit |
|
| non - |
|
|
| Deemed | comprehensive | Legal | retention | Accumulated | Shareholders’ | controlling | Equity | |
|
| Capital | cost | income | reserve | reserve | profit | equity | interests | Consolidated |
Balance as of January 1, 2017 |
| 7,910,000 | 944,956 | 53,510 | 792,716 | 5,016,916 | - | 14,718,098 | 260,044 | 14,978,142 |
Net Income |
| - | - | - | - | - | 1,033,626 | 1,033,626 | 84,629 | 1,118,255 |
Other comprehensive income |
|
|
|
|
|
|
|
|
|
|
Gain on financial assets, net of taxes | 30.2 | - | - | 17,250 | - | - | - | 17,250 | - | 17,250 |
Actuarial losses, net of taxes | 30.2 | - | - | (29,556) | - | - | - | (29,556) | (123) | (29,679) |
Realization - gain on financial assets, net of taxes | 30.2 | - | - | (18,909) | - | - | - | (18,909) | - | (18,909) |
Total comprehensive income |
| - | - | (31,215) | - | - | 1,033,626 | 1,002,411 | 84,506 | 1,086,917 |
Realization - deemed cost, net of taxes | 30.2 | - | (71,650) | - | - | - | 71,650 | - | - | - |
Deliberation of additional dividends proposed | 17.2.2 | - | - | - | - | - | - | - | (11,053) | (11,053) |
Approval of additional dividends in accordance with the 62th Annual General Meeting |
| - | - | - | - | (223,266) | - | (223,266) | - | (223,266) |
Allocation proposed to GSM: |
|
|
|
|
|
|
|
|
|
|
Legal reserve |
| - | - | - | 51,682 | - | (51,682) | - | - | - |
Interest on ow n capital | 30.4 | - | - | - | - | - | (266,000) | (266,000) | - | (266,000) |
Dividends | 17.2.2 | - | - | - | - | - | (23,401) | (23,401) | (30,836) | (54,237) |
Profit retention reserve |
| - | - | - | - | 764,193 | (764,193) | - | - | - |
Balance as of December 31, 2017 |
| 7,910,000 | 873,306 | 22,295 | 844,398 | 5,557,843 | - | 15,207,842 | 302,661 | 15,510,503 |
Adjustments arising from the adoption of CPC 47/IFRS15 and CPC 48/IFRS9 | 4.18.3 | - | - | (4,391) | - | - | (160,533) | (164,924) | - | (164,924) |
Transfers to profit retention reserve | 4.18.3 | - | - | - | - | (160,533) | 160,533 | - | - | - |
Balance as of January 1, 2018 |
| 7,910,000 | 873,306 | 17,904 | 844,398 | 5,397,310 | - | 15,042,918 | 302,661 | 15,345,579 |
Net Income |
| - | - | - | - | - | 1,407,063 | 1,407,063 | 36,941 | 1,444,004 |
Other comprehensive income |
|
|
|
|
|
|
|
|
|
|
Actuarial gain (losses), net of taxes | 30.2 | - | - | (38,514) | - | - | - | (38,514) | 154 | (38,360) |
Total comprehensive income |
| - | - | (38,514) | - | - | 1,407,063 | 1,368,549 | 37,095 | 1,405,644 |
Realization - deemed cost, net of taxes | 30.2 | - | (67,086) | - | - | - | 67,086 | - | - | - |
Allocation proposed to GSM: |
|
|
|
|
|
|
|
|
|
|
Legal reserve |
| - | - | - | 70,353 | - | (70,353) | - | - | - |
Interest on ow n capital | 30.4 | - | - | - | - | - | (280,000) | (280,000) | - | (280,000) |
Dividends | 17.2.2 | - | - | - | - | - | (98,542) | (98,542) | (36,467) | (135,009) |
Profit retention reserve |
| - | - | - | - | 1,025,254 | (1,025,254) | - | - | - |
Balance as of December 31, 2018 |
| 7,910,000 | 806,220 | (20,610) | 914,751 | 6,422,564 | - | 16,032,925 | 303,289 | 16,336,214 |
Notes are an integral part of these financial statements. | ||||||||||
7
![]()
Statements of Cash Flows
for the years ended December 31, 2018 and 2017
All amounts expressed in thousands of Brazilian reais
| Note |
| Parent Company |
| Consolidated |
|
| 12.31.2018 | 12.31.2017 | 12.31.2018 | 12.31.2017 |
|
|
|
|
|
|
CASH FLOWS FROM OPERATIONAL ACTIVITIES |
|
|
|
|
|
Net income |
| 1,407,063 | 1,033,626 | 1,444,004 | 1,118,255 |
|
|
|
|
|
|
Adjustments to reconcile net income for the period with cash generated from operating activities |
|
|
|
|
|
Unrealized monetary and cambial variation and debt charges - net |
| 5,704 | 134,705 | 767,751 | 900,610 |
Interest - bonus from the grant of concession agreements under the quota system | 10.3 | - | - | (85,986) | (82,160) |
Gain on transmission concession agreement | 11.3 | - | - | (268,904) | (129,769) |
Gain on remeasurement of the cash flow from the RBSE assets | 10.5 | - | - | (82,640) | (361,156) |
Result of the adoption of the Special Tax Regularization Program |
| - | - | - | (154,197) |
Income tax and social contribution | 13.4 | 2,083 | 36,803 | 580,065 | 379,943 |
Deferred income tax and social contribution | 13.4 | (44,993) | (53,927) | (68,072) | (105,257) |
Equity in earnings of investees | 17.1 | (1,356,375) | (1,291,434) | (135,888) | (101,739) |
Appropriation of acturial calculation of post-employment benefits | 24.4 | 563 | 519 | 97,900 | 97,511 |
Appropriation of pension and healthcare contributions | 24.4 | 5,860 | 2,471 | 151,215 | 153,069 |
Creation for research and development and energy efficiency programs | 26.2 | - | - | 125,369 | 118,753 |
Recognition of fair value of assets related to concession compensation | 31 | - | - | (47,499) | (57,080) |
Sectorial financial assets and liabilities result | 31 | - | - | (985,344) | (767,040) |
Depreciation and amortization | 32 | 1,223 | 1,203 | 749,179 | 731,599 |
Net operating estimated losses, provisions and reversals | 32.4 | 24,902 | 93,756 | 306,697 | 365,539 |
Losses in business combination | 32.6 | - | - | 3,769 | - |
Result of disposal of investment | 32.6 | (11,000) | (14,174) | (8,174) | (28,650) |
Fair value in the purchase and sale of power in the active market | 35.2.12 | - | - | (3,786) | - |
Impairment of accounts receivable related to concession | 10 | - | - | 1,536 | 17 |
Loss on disposal of contract assets | 11 | - | - | 9,762 | - |
Loss on disposal of property, plant and equipment | 18.2 | - | - | 68,450 | 64,508 |
Loss on disposal of intangible assets | 19 | 13 | 2,064 | 28,742 | 42,740 |
|
| 35,043 | (54,388) | 2,648,146 | 2,185,496 |
|
|
|
|
|
|
Decrease (increase) in assets |
|
|
|
|
|
Trade accounts receivable |
| - | - | 191,113 | (322,814) |
Dividends and interest on own capital received |
| 609,219 | 669,179 | 50,858 | 44,334 |
CRC transferred to the Government of the State of Paraná | 8.1 | 260,117 | 97,085 | 260,117 | 97,085 |
Judicial deposits |
| (1,171) | 34,550 | 87,853 | 96,028 |
Sectorial financial assets | 9.2 | - | - | 482,974 | - |
Other receivables |
| 5,243 | 449 | 17,292 | (44,193) |
Inventories |
| - | - | (5,726) | 20,078 |
Income tax and social contribution |
| 19,803 | 22,252 | 360,855 | 146,602 |
Other current taxes recoverable |
| (86,140) | (79) | (74,003) | 87,884 |
Prepaid expenses |
| (40) | - | 8,520 | 12,128 |
Related parties |
| 8,940 | (29,690) | - | (667) |
|
| 815,971 | 793,746 | 1,379,853 | 136,465 |
|
|
|
|
|
|
Increase (decrease) in liabilities |
|
|
|
|
|
Payroll, social charges and accruals |
| (230) | 1,404 | (29,845) | 26,170 |
Related parties |
| (3,181) | 3,936 | (59) | - |
Suppliers |
| 635 | (129) | (572,306) | 275,370 |
Other taxes |
| (32,585) | (25,648) | 75,234 | 24,795 |
Post-employment benefits | 24.4 | (5,929) | (2,625) | (204,809) | (200,848) |
Sectorial charges due |
| - | - | (70,507) | 8,313 |
Research and development and energy efficiency | 26.2 | - | - | (91,015) | (104,512) |
Payable related to the concession | 27.2 | - | - | (64,365) | (65,871) |
Sectorial financial liabilities |
| - | - | - | 419,220 |
Other accounts payable |
| 3,013 | 500 | 103,464 | (101,062) |
Provisions for legal claims | 29.1.1 | (102) | (260) | (144,171) | (124,395) |
|
| (38,379) | (22,822) | (998,379) | 157,180 |
|
|
|
|
|
|
CASH GENERATED FROM OPERATING ACTIVITIES |
| 812,635 | 716,536 | 3,029,620 | 2,479,141 |
|
|
|
|
|
|
Income tax and social contribution paid |
| (4,550) | (34,336) | (468,552) | (335,087) |
Loans and financing - interest due and paid | 22.4 | (90,332) | (127,507) | (289,095) | (532,033) |
Debentures - interest due and paid | 23.2 | (64,523) | (114,287) | (501,002) | (622,815) |
|
|
|
|
|
|
NET CASH GENERATED FROM OPERATING ACTIVITIES |
| 653,230 | 440,406 | 1,770,971 | 989,206 |
(continued) |
|
|
|
|
|
8
![]()
Statements of Cash Flows
for the years ended December 31, 2018 and 2017 (continued)
All amounts expressed in thousands of Brazilian reais
| Note | Parent Company |
| Consolidated | |
|
| 12.31.2018 | 12.31.2017 | 12.31.2018 | 12.31.2017 |
|
|
|
|
|
|
CASH FLOWS FROM INVESTMENT ACTIVITIES |
|
|
|
|
|
Financial investments |
| (124,254) | 24 | (75,804) | 48,512 |
Loans and financing granted to related parties |
| (192,445) | (251,856) | - | (5,145) |
Receipt of loans and financing granted to related parties |
| 560,877 | 124,122 | 117,645 | 24,985 |
Additions to contract assets |
| - | - | (792,835) | - |
Customers contributions - contract assets |
| - | - | 106,764 | - |
Acquisitions of subsidiaries - effect on cash |
| - | - | 7,998 | - |
Disposal of investments |
| - | 397,572 | - | 484,608 |
Additions in investments | 17.1 e 39.1 | (608,934) | (574,347) | (51,557) | (248,243) |
Capital reduction of investees | 17.1 | 45,000 | 170,000 | 35,280 | - |
Additions to property, plant and equipment |
| (267) | (282) | (1,489,067) | (1,205,508) |
Customers contributions - property, plant and equipment |
| - | - | 12 | - |
Additions to intangible assets |
| (3) | (499) | (7,589) | (806,240) |
Customers contributions - intangible assets |
| - | - | - | 125,858 |
|
|
|
|
|
|
NET CASH (USED IN) GENERATED FROM INVESTING ACTIVITIES |
| (320,026) | (135,266) | (2,149,153) | (1,581,173) |
|
|
|
|
|
|
CASH FLOWS FROM FINANCING ACTIVITIES |
|
|
|
|
|
Loans and financing obtained from third parties | 22.4 | - | 77,000 | 1,314,766 | 800,044 |
Issue of Debentures | 23.2 | 600,000 | 520,000 | 2,890,283 | 2,242,521 |
Payments of principal - loans and financing | 22.4 | (77,000) | (83,000) | (1,126,144) | (971,187) |
Payments of principal - debentures | 23.2 | (333,300) | (333,300) | (1,491,667) | (915,005) |
Dividends and interest on own capital paid |
| (264,734) | (475,103) | (300,722) | (506,404) |
|
|
|
|
|
|
NET CASH GENERATED FROM FINANCING ACTIVITIES |
| (75,034) | (294,403) | 1,286,516 | 649,969 |
|
|
|
|
|
|
TOTAL EFFECTS ON CASH AND CASH EQUIVALENTS |
| 258,170 | 10,737 | 908,334 | 58,002 |
|
|
|
|
|
|
Cash and cash equivalents at the beginning of the period | 5 | 56,833 | 46,096 | 1,040,075 | 982,073 |
Cash and cash equivalents at the end of the period | 5 | 315,003 | 56,833 | 1,948,409 | 1,040,075 |
|
|
|
|
|
|
CHANGE IN CASH AND CASH EQUIVALENTS |
| 258,170 | 10,737 | 908,334 | 58,002 |
Notes are an integral part of these financial statements. | |||||
9
![]()
for the years ended December 31, 2018 and 2017
All amounts expressed in thousands of Brazilian reais
ADDED VALUE TO DISTRIBUTE |
| Parent Company |
| Consolidated |
|
|
|
| |
| 12.31.2018 | 12.31.2017 | 12.31.2018 | 12.31.2017 |
Income |
|
|
|
|
Sale of energy, services and other income | - | - | 21,462,972 | 19,772,940 |
Construction income | - | - | 1,799,252 | 1,810,472 |
Fair value of indemnifiable concession assets | - | - | 47,499 | 57,080 |
Sectorial financial assets and liabilities result | - | - | 985,344 | 767,040 |
Other income | 36,915 | 14,197 | 183,435 | 40,919 |
Expected credit losses | - | - | (96,202) | (90,589) |
36,915 | 14,197 | 24,382,300 | 22,357,862 | |
|
|
|
| |
( - ) Supplies acquired from third parties |
|
|
|
|
Energy purchased for resale | - | - | 6,813,043 | 6,514,399 |
Charges for use of the main transmission grid ( - ) ESS and ERR | - | - | 1,280,910 | 926,595 |
Materials, supplies and third parties services | 32,171 | 14,896 | 688,635 | 717,206 |
Natural gas and supplies for gas operations | - | - | 528,021 | 393,018 |
Construction costs | - | - | 1,581,909 | 1,759,922 |
Loss / Recovery of assets | 459 | 2,065 | 176,000 | 89,638 |
Impairment | - | - | (18,920) | (122,782) |
Other supplies | 41,162 | 116,641 | 302,282 | 502,035 |
73,792 | 133,602 | 11,351,880 | 10,780,031 | |
|
|
|
| |
( = ) GROSS ADDED VALUE | (36,877) | (119,405) | 13,030,420 | 11,577,831 |
|
|
|
| |
( - ) Depreciation and amortization | 1,223 | 1,203 | 749,179 | 731,599 |
|
|
|
| |
( = ) NET ADDED VALUE | (38,100) | (120,608) | 12,281,241 | 10,846,232 |
|
|
|
| |
( + ) Transferred added value |
|
|
|
|
Results from investment interests | 1,356,375 | 1,291,434 | 135,888 | 101,739 |
Financial income | 301,729 | 181,312 | 813,915 | 699,310 |
Other Income | 1,264 | 13,958 | 133,946 | 125,550 |
1,659,368 | 1,486,704 | 1,083,749 | 926,599 | |
|
|
|
| |
| 1,621,268 | 1,366,096 | 13,364,990 | 11,772,831 |
(continued) |
|
|
|
|
10
![]()
Statements of Added Value
for the years ended December 31, 2018 and 2017 (continued)
All amounts expressed in thousands of Brazilian reais
DISTRIBUTION OF ADDED VALUE | Parent Company | Consolidated | ||||||
|
|
|
|
|
|
|
| |
| 12.31.2018 | % | 12.31.2017 | % | 12.31.2018 | % | 12.31.2017 | % |
Personnel |
|
|
|
|
|
| ||
Remuneration and fees | 8,890 |
| 10,543 |
| 930,377 |
| 952,270 | |
Private pension and health plans | 2,286 |
| 1,943 |
| 264,380 |
| 259,498 | |
Meal and education assistance | 1,108 |
| 1,131 |
| 127,683 |
| 136,494 | |
Social security charges - FGTS | 655 |
| 664 |
| 66,906 |
| 67,380 | |
Labor indemnities (reversals) | 1,659 |
| 2,989 |
| 70,891 |
| 59,066 | |
Profit sharing | 863 |
| 586 |
| 91,526 |
| 68,817 | |
Transfers to property, plant and equipment in progress | - |
| - |
| (28,890) |
| (31,892) | |
15,461 | 1.0 | 17,856 | 1.3 | 1,522,873 | 11.4 | 1,511,633 | 12.8 | |
|
|
|
|
|
| |||
Government |
|
|
|
|
|
| ||
Federal |
|
|
|
|
|
| ||
Tax | (25,949) |
| 34,222 |
| 2,230,343 |
| 2,030,069 | |
Sectorial charges | - |
| - |
| 2,685,524 |
| 2,066,194 | |
State | 13 |
| 6 |
| 4,240,617 |
| 3,772,327 | |
Municipal | 56 |
| 87 |
| 8,737 |
| 7,516 | |
(25,880) | (1.6) | 34,315 | 2.5 | 9,165,221 | 68.6 | 7,876,106 | 66.9 | |
|
|
|
|
|
| |||
Third Parties |
|
|
|
|
|
| ||
Interest | 223,473 |
| 279,143 |
| 1,178,497 |
| 1,223,026 | |
Leasing and rent | 1,151 |
| 1,156 |
| 41,453 |
| 33,337 | |
Donations, subsidies and contributions | - |
| - |
| 12,942 |
| 10,474 | |
224,624 | 13.9 | 280,299 | 20.5 | 1,232,892 | 9.2 | 1,266,837 | 10.8 | |
|
|
|
|
|
| |||
Shareholders |
|
|
|
|
|
| ||
Retained profits | 1,028,521 |
| 744,225 |
| 1,028,521 |
| 744,225 | |
Own capital remuneration | 280,000 |
| 266,000 |
| 280,000 |
| 266,000 | |
Dividends | 98,542 |
| 23,401 |
| 98,542 |
| 23,401 | |
Non controlling interests | - |
| - |
| 36,941 |
| 84,629 | |
1,407,063 | 86.7 | 1,033,626 | 75.7 | 1,444,004 | 10.8 | 1,118,255 | 9.5 | |
|
|
|
|
|
| |||
1,621,268 | 100.0 | 1,366,096 | 100.0 | 13,364,990 | 100.0 | 11,772,831 | 100.0 | |
Notes are an integral part of these financial statements. | ||||||||
11
![]()
NOTES TO THE FINANCIAL STATEMENTS
for the years ended December 31, 2018 and 2017
All amounts expressed in thousands of Brazilian reais, unless otherwise stated
Companhia Paranaense de Energia (Copel, Company or Parent Company), with its head office located at Rua Coronel Dulcídio, 800, Curitiba - State of Paraná, is a publicly-held mixed capital company controlled by the State of Paraná and its shares are traded at Corporate Governance Level 1 of the Special Listing Segments of B3 S.A. - Brasil, Bolsa Balcão Stock Exchange and also on the New York Stock Exchange (NYSE) and on the Madrid Stock Exchange in the Latin American segment (Latibex).
The core activities of Copel and its subsidiaries, which are regulated by the Brazilian Electricity Regulatory Agency (ANEEL), linked to the Brazilian Ministry of Mines and Energy (MME), is to carry out research, study, planning, and asset building activities related to the generation, transformation, distribution and trading of energy in any of its forms, primarily electricity. Furthermore, Copel participates in consortiums and in private sector and mixed-capital companies for the purpose of engaging in activities, primarily in the fields of energy, telecommunications and natural gas.
1.1 Copel’s equity interests
Copel has direct and indirect interests in subsidiaries (1.1.1), joint ventures (1.1.2), associates (1.1.3) and joint operations (1.1.4).
The changes, acquisitions and sales in relation to the equity stakes as of 12.31.2017 were: business combination presented in Note 1.2, transfer of Foz do Chopim (Note 1.1.3) and constitution of the Specific Purpose Company - SPE Bela Vista Geração de Energia S.A.
12
![]()
1.1.1 Subsidiaries
| Headquarters | Main activity | Interest | |
Subsidiaries | % | Investor | ||
Copel Geração e Transmissão S.A. (Copel GeT) | Curitiba/PR | Production and transmission of electricity | 100.0 | Copel |
Copel Distribuição S.A. (Copel DIS) | Curitiba/PR | Distribution and marketing of electricity | 100.0 | Copel |
Copel Telecomunicações S.A. (Copel TEL) | Curitiba/PR | Telecommunication and communication | 100.0 | Copel |
Copel Renováveis S.A. (Copel REN) (a) | Curitiba/PR | Control and management of interests | 100.0 | Copel |
Copel Comercialização S.A. (Copel Energia) | Curitiba/PR | Commercialization of electricity | 100.0 | Copel |
Companhia Paranaense de Gás - Compagás | Curitiba/PR | Distribution of pipeline gas | 51.0 | Copel |
Elejor - Centrais Elétricas do Rio Jordão S.A. | Curitiba/PR | Production of electricity | 70.0 | Copel |
UEG Araucária Ltda. (UEG) | Curitiba/PR | Production of electricity from natural gas | 20.0 | Copel |
|
|
| 60.0 | Copel GeT |
São Bento Energia, Investimentos e Participações S.A. (São Bento) | Curitiba/PR | Control and management of interests | 100.0 | Copel GeT |
Nova Asa Branca I Energias Renováveis S.A. | S. Miguel do Gostoso/RN | Production of electricity from wind sources | 100.0 | Copel GeT |
Nova Asa Branca II Energias Renováveis S.A. | Parazinho/RN | Production of electricity from wind sources | 100.0 | Copel GeT |
Nova Asa Branca III Energias Renováveis S.A. | Parazinho/RN | Production of electricity from wind sources | 100.0 | Copel GeT |
Nova Eurus IV Energias Renováveis S.A. | Touros/RN | Production of electricity from wind sources | 100.0 | Copel GeT |
Santa Maria Energias Renováveis S.A. | Maracanaú/CE | Production of electricity from wind sources | 100.0 | Copel GeT |
Santa Helena Energias Renováveis S.A. | Maracanaú/CE | Production of electricity from wind sources | 100.0 | Copel GeT |
Ventos de Santo Uriel S.A. | João Câmara/RN | Production of electricity from wind sources | 100.0 | Copel GeT |
Cutia Empreendimentos Eólicos S.A. (Cutia) | Curitiba/PR | Control and management of interests | 100.0 | Copel GeT |
Costa Oeste Transmissora de Energia S.A. (1.2) | Curitiba/PR | Transmission of electricity | 100.0 | Copel GeT |
Marumbi Transmissora de Energia S.A. (1.2) | Curitiba/PR | Transmission of electricity | 100.0 | Copel GeT |
Bela Vista Geração de Energia S.A. (b) | Curitiba/PR | Production of electricity | 99.9 | Copel GeT |
GE Olho D’Água S.A. | São Bento do Norte/RN | Production of electricity from wind sources | 100.0 | São Bento |
GE Boa Vista S.A. | São Bento do Norte/RN | Production of electricity from wind sources | 100.0 | São Bento |
GE Farol S.A. | São Bento do Norte/RN | Production of electricity from wind sources | 100.0 | São Bento |
GE São Bento do Norte S.A. | São Bento do Norte/RN | Production of electricity from wind sources | 100.0 | São Bento |
Central Geradora Eólica São Bento do Norte I S.A. (c) | São Bento do Norte/RN | Production of electricity from wind sources | 100.0 | Cutia |
Central Geradora Eólica São Bento do Norte II S.A. (c) | São Bento do Norte/RN | Production of electricity from wind sources | 100.0 | Cutia |
Central Geradora Eólica São Bento do Norte III S.A. (b) | São Bento do Norte/RN | Production of electricity from wind sources | 100.0 | Cutia |
Central Geradora Eólica São Miguel I S.A. (c) | São Bento do Norte/RN | Production of electricity from wind sources | 100.0 | Cutia |
Central Geradora Eólica São Miguel II S.A. (c) | São Bento do Norte/RN | Production of electricity from wind sources | 100.0 | Cutia |
Central Geradora Eólica São Miguel III S.A. (c) | São Bento do Norte/RN | Production of electricity from wind sources | 100.0 | Cutia |
Usina de Energia Eólica Guajiru S.A. (c) | São Bento do Norte/RN | Production of electricity from wind sources | 100.0 | Cutia |
Usina de Energia Eólica Jangada S.A. (c) | São Bento do Norte/RN | Production of electricity from wind sources | 100.0 | Cutia |
Usina de Energia Eólica Potiguar S.A. (c) | São Bento do Norte/RN | Production of electricity from wind sources | 100.0 | Cutia |
Usina de Energia Eólica Cutia S.A. (c) | São Bento do Norte/RN | Production of electricity from wind sources | 100.0 | Cutia |
Usina de Energia Eólica Maria Helena S.A. (c) | São Bento do Norte/RN | Production of electricity from wind sources | 100.0 | Cutia |
Usina de Energia Eólica Esperança do Nordeste S.A.(c) | São Bento do Norte/RN | Production of electricity from wind sources | 100.0 | Cutia |
Usina de Energia Eólica Paraíso dos Ventos do Nordeste S.A. (b) | São Bento do Norte/RN | Production of electricity from wind sources | 100.0 | Cutia |
|
|
|
|
|
(a) Company management is assessing whether a business purpose change or a closure and transfer of assets to the shareholder is required. | ||||
(b) Pre-operating stage. | ||||
(c) Operation started from December 2018. | ||||
1.1.2 Joint ventures | ||||
Joint ventures | Headquarters | Main activity | Interest | |
% | Investor | |||
Voltalia São Miguel do Gostoso I Participações S.A. | São Paulo/SP | Interests in companies | 49.0 | Copel |
Paraná Gás Exploração e Produção S.A. (a) | Curitiba/PR | Exploration of natural gas | 30.0 | Copel |
Caiuá Transmissora de Energia S.A. | Rio de Janeiro/RJ | Transmission of electricity | 49.0 | Copel GeT |
Integração Maranhense Transmissora de Energia S.A. | Rio de Janeiro/RJ | Transmission of electricity | 49.0 | Copel GeT |
Matrinchã Transmissora de Energia (TP NORTE) S.A. | Rio de Janeiro/RJ | Transmission of electricity | 49.0 | Copel GeT |
Guaraciaba Transmissora de Energia (TP SUL) S.A. | Rio de Janeiro/RJ | Transmission of electricity | 49.0 | Copel GeT |
Paranaíba Transmissora de Energia S.A. | Rio de Janeiro/RJ | Transmission of electricity | 24.5 | Copel GeT |
Mata de Santa Genebra Transmissão S.A. (b) | Rio de Janeiro/RJ | Transmission of electricity | 50.1 | Copel GeT |
Cantareira Transmissora de Energia S.A. | Rio de Janeiro/RJ | Transmission of electricity | 49.0 | Copel GeT |
|
|
|
|
|
(a) Project with its activities halted because of a Public Civil Action pending a decision at TRF-4. There is a decision of the consortium members requesting the National Agencyof Petroleum, Natural Gas and Biofuels – ANP, through the establishment of an institutional arbitration procedure, to release contractual obligations without burden to thebidders, with the consequent return of the subscription bonuses, reimbursement of the warranty costs incurred, and the release of the guarantees provided. | ||||
(b) Pre-operating stage. | ||||
13
![]()
1.1.3 Associates
Associated companies | Headquarters | Main activity | Interest | |
% | Investor | |||
Dona Francisca Energética S.A. | Agudo/RS | Production of electricity | 23.0303 | Copel |
Foz do Chopim Energética Ltda. (a) | Curitiba/PR | Production of electricity | 35.77 | Copel GeT |
Carbocampel S.A. | Figueira/PR | Coal exploration | 49.0 | Copel |
Copel Amec S/C Ltda. - em liquidação | Curitiba/PR | Services | 48.0 | Copel |
Sercomtel S.A. Telecomunicações (c) | Londrina/PR | Telecommunications | 45.0 | Copel |
Dominó Holdings Ltda. | Curitiba/PR | Interests in companies | 49.0 | Copel Energia |
GBX Tietê II Empreendimentos Participações S.A. (b) | São Paulo/SP | Incorporation of real estate projects | 19.31 | UEG |
. |
|
|
|
|
(a) In February 2018, the associated Foz do Chopim Energética Ltda. was transferred from Copel to Copel GeT, through an increase in the capital stock.As it is a transferwithout change of control, the Company recorded the book values. The balances was transferred in the transaction are shown in Note 17.1 | ||||
(b) Pre-operating stage. | ||||
(c) Investment reduced to zero due to the impairment tests. | ||||
1.1.4 Joint operations (consortiums)
Joint operations | Interest (%) | Other consortium members |
Hydroelectric Power Plant Gov. Jayme Canet Júnior - Mauá (Note 18.5) | 51.0 | Eletrosul Centrais Elétricas S.A. (49%) |
Hydroelectric Power Plant Baixo Iguaçu (Note 18.5.1) | 30.0 | Geração Céu Azul S.A (subsidiarie of Neoenergia S.A.) (70%) |
1.2 Business combination through the exchange of assets
1.2.1 Subsidiaries acquired and joint venture disposed of
On August 30, 2018, Copel GeT signed a Share Exchange Agreement with Eletrosul with respect to the joint ventures Costa Oeste Transmissora de Energia S.A. (51% -Copel GeT and 49% - Eletrosul), Marumbi Transmissora de Energia S.A. (80% - Copel GeT and 20%- Eletrosul) and Transmissora Sul Brasileira de Energia S.A. (20% - Copel GeT and 80% - Eletrosul). The impact of the exchange agreement is that Copel GeT obtained a 100% interest in the former joint ventures Costa Oeste and Marumbi, and Eletrosul obtained a 100% interest in Transmissora Sul Brasileira.
The assumption of the 100% interest in Costa Oeste and Marumbi by Copel GeT will allow economies of scale in the integrated management of these ventures with the other Company’s assets.
The business combinations occurred on August 31, 2018, date of transfer of the shares.
|
|
| Percentage interest | Consideration | |
|
| in shares of Copel-GeT | transferred | ||
Subsidiaries acquired | Main activity | Date of acquisition | previous | acquired | R$ |
Costa Oeste | Transmission of electricity | 08.31.2018 | 51% | 49% | 38,883 |
Marumbi | Transmission of electricity | 08.31.2018 | 80% | 20% | 23,811 |
1.2.2 Consideration transferred and concession right generated in acquisitions
The business combinations occurred through exchange of assets and the amount of the consideration corresponded to the fair value of the 20% interest held by Copel GeT in Transmissora Sul Brasileira (asset transferred). This amount was allocated in proportion to the fair value of the equity interests acquired from Eletrosul, corresponding to 49% of Costa Oeste and 20% of Marumbi.
14
![]()
| Net assets transferred | Net assets acquired | |
Consideration transferred | Transmissora Sul Brasileira | Costa Oeste | Marumbi |
Fair value on 08.31.2018 | 313,471 | 73,219 | 109,861 |
Percentage of interest transferred/acquired | 20% | -49% | -20% |
Amount of portion exchanged | 62,694 | (35,878) | (21,971) |
Consideration amount | 62,694 | 38,883 | 23,811 |
Concession rights | - | 3,005 | 1,840 |
The concession rights generated in the business combinations consist mainly of expected synergies and economies of scale and will be amortized over the remaining concession periods of Costa Oeste and Marumbi, which will expire on January 11, 2042 and May 9, 2042, respectively.
|
|
|
|
Concession right generated in the acquisition |
| Costa Oeste | Marumbi |
Fair value of consideration transferred |
| 38,883 | 23,811 |
Fair value of Copel GeT interest before the combination | 37,341 | 87,890 | |
76,224 | 111,701 | ||
Net value of identifiable assets acquired and liabilities assumed | (73,219) | (109,861) | |
Concession rights |
| 3,005 | 1,840 |
1.2.3 Assets acquired, and liabilities recognized on the acquisition date
Copel GeT measured preliminarily at fair value on the acquisition date its prior equity interests in the acquires, the identifiable assets acquired, and the liabilities assumed.
The losses resulting from the fair value measurement of the prior equity interests of Copel GeT in Costa Oeste and Marumbi, amounting to R$ 3,769, are included in Other operating income (expenses), net, in the statement of income.
The fair values of the prior equity interests and the interests acquired on the business combination dates of Costa Oeste and Marumbi are shown below:
Costa Oeste |
| Fair value | ||
|
| Equity interest |
| |
| At the | before business | Equity interest | |
08.31.2018 | Carrying amount | acquisition date | combination - 51% | acquired - 49% |
Assets identified | 102,355 | 109,327 | 55,757 | 53,570 |
Cash and cash equivalents | 4,140 | 4,140 | 2,111 | 2,029 |
Trade accounts receivable | 945 | 945 | 482 | 463 |
Prepaid expenses | 22 | 22 | 11 | 11 |
Taxes recoverable | 59 | 59 | 30 | 29 |
Collaterals | 1,711 | 1,711 | 873 | 838 |
Contract assets | 95,448 | 95,448 | 48,678 | 46,770 |
Contract assets - business combination | - | 6,972 | 3,556 | 3,416 |
Property, plant and equipment | 13 | 13 | 7 | 6 |
Intangible assets | 17 | 17 | 9 | 8 |
Liabilities assumed | 30,420 | 36,108 | 18,416 | 17,692 |
Suppliers | 93 | 93 | 47 | 46 |
Financing | 26,011 | 26,011 | 13,266 | 12,745 |
Deferred income tax and social contribution | 3,029 | 3,029 | 1,545 | 1,484 |
Deferred income tax and social contribution - business combination | - | 661 | 337 | 324 |
Provisions for legal claims | 831 | 831 | 424 | 407 |
Contingent liabilities - business combination | - | 5,027 | 2,564 | 2,463 |
Others liabilities | 456 | 456 | 233 | 223 |
Net assets acquired | 71,935 | 73,219 | 37,341 | 35,878 |
15
![]()
Marumbi |
| Fair value | ||
|
| Equity interest |
| |
| At the | before business | Equity interest | |
08.31.2018 | Carrying amount | acquisition date | combination - 80% | acquired - 20% |
Assets identified | 167,533 | 164,999 | 132,000 | 32,999 |
Cash and cash equivalents | 3,857 | 3,857 | 3,086 | 771 |
Trade accounts receivable | 1,928 | 1,928 | 1,542 | 386 |
Prepaid expenses | 56 | 56 | 45 | 11 |
Taxes recoverable | 6 | 6 | 5 | 1 |
Collaterals | 2,623 | 2,623 | 2,098 | 525 |
Contract assets | 159,022 | 156,488 | 125,191 | 31,297 |
Contract assets - business combination | 22 | 22 | 18 | 4 |
Intangible assets | 19 | 19 | 15 | 4 |
Liabilities assumed | 52,142 | 55,138 | 44,110 | 11,028 |
Suppliers | 3,016 | 3,016 | 2,413 | 603 |
Financing | 40,764 | 40,764 | 32,611 | 8,153 |
Deferred income tax and social contribution | 4,919 | 4,919 | 3,935 | 984 |
Deferred income tax and social contribution - business combination | - | (2,849) | (2,279) | (570) |
Provisions for legal claims | 2,103 | 2,103 | 1,682 | 421 |
Contingent liabilities - business combination | - | 5,845 | 4,676 | 1,169 |
Others liabilities | 1,340 | 1,340 | 1,072 | 268 |
Net assets acquired | 115,391 | 109,861 | 87,890 | 21,971 |
1.2.4 Impact of acquisition on consolidated profit or loss
The profit for the year includes R$ 1,875 attributable to the additional income generated by Costa Oeste and R$ 5,108 attributable to Marumbi. The consolidated revenues for the period include R$ 3,093 related to Costa Oeste and R$ 6,085 related to Marumbi.
Had these business combinations occurred on January 1, 2018, the consolidated net operating revenue would have increased in R$ 23,834, totalizing R$ 14,958,614 and the consolidated net income for the period would have increased in R$ 4,666, totalizing R$1,448,670. Management considers that these pro forma amounts represent an approximate measurement of the combined consolidated performance on an annualized basis and serve as reference for comparison in future years.
16
![]()
2 Concessions and Authorizations
2.1 Concessions contracts or authorizations obtained by Copel
Copel |
| Interest % | Maturity |
Concession agreement / authorization of the equity |
|
|
|
Copel DIS | Contract 046/1999, extended by 5th addendum to the contract | 100 | 07.07.2045 |
Copel TEL | Authorization term 54/2003 - Anatel/SVP/PVST | 100 | Indeterminate |
| Authorization term 305/2012 - Anatel/SVP/PVST | 100 | Indeterminate |
Elejor | Contract 125/2001 - HPP Fundão and Santa Clara | 70 | 05.28.2037 |
| Authorization - SHP Fundão I and SHP Santa Clara I - 753/2002 and 757/2002 | 70 | 12.18.2032 |
Dona Francisca Energética | Contract 188/1998 - HPP Dona Francisca | 23 | 08.27.2033 |
UEG Araucária | Authorization 351/1999 - TPP Araucária (60% Copel GET) | 20 | 12.22.2029 |
Compagás (2.1.1) | Concession gas distribution contract | 51 | 01.20.2019 |
Dois Saltos (a) | Authorization 5,204/2015 | 30 | 04.22.2045 |
Paraná Gás (1.1.2 - a) | PART-T-300_R12 4861-.0000.99/2014-00 - ANP | 30 | 05.15.2045 |
Usina de Energia Eólica São João S.A. (b) | MME Ordinance 173 /2012 - WPP São João | 49 | 03.25.2047 |
Usina de Energia Eólica Carnaúba S.A. (b) | MME Ordinance 204 /2012 - WPP Carnaúbas | 49 | 04.08.2047 |
Usina de Energia Eólica Reduto S.A. (b) | MME Ordinance 230 /2012 - WPP Reduto | 49 | 04.15.2047 |
Usina de Energia Eólica Santo Cristo S.A. (b) | MME Ordinance 233/2012 - WPP Santo Cristo | 49 | 04.17.2047 |
|
|
|
|
(a) Building under construction. | |||
(b) Subsidiaries of Voltalia São Miguel do Gostoso I Participações S.A. | |||
Hydroelectric Power Plant - HPP | |||
Small Hydroelectric Plant - SHP | |||
Thermal Power Plant - TPP | |||
Wind Power Plant - WPP | |||
2.1.1 Compagás
Compagás is a party to a concession agreement entered with the Concession Grantor, the State of Paraná, setting July 6, 2024 as the expiration date of the concession.
On December 7, 2017, the State of Paraná published Supplementary Law 205, introducing a new interpretation of the expiration of the concession, understanding that expiration will be on January 20, 2019. Considering that up to this date the extension/bidding of the concession has not yet occurred, the law provides that the concession operator may, after the expiration of the term, remain responsible for its performance until the assumption of the new concession operator, subject to the conditions established.
The Management of Compagás, its Parent company and other shareholders are challenging the effects of the aforesaid law since they understand that it conflicts with the provisions of the concession agreement currently in force. Compagás filed a lawsuit challenging the early termination of the concession and, on October 30, 2018, a preliminary injunction was granted. The Company is awaiting the trial of the merit of the case.
However, as of the issuance of these annual financial statements, such lawsuit continues outstanding. These financial statements reflect the acceleration of the expiration of the Compagás concession as of December 31, 2018, as follows:
17
![]()
| End of |
| End of |
12.31.2018 | Adjustments | concession in 2019 | |
STATEMENTS OF FINANCIAL POSITION |
| ||
Noncurrent assets |
| ||
Accounts receivable related to the concession and Contract Assets | 148,720 | 199,257 | 347,977 |
Intangible assets | 152,538 | (148,919) | 3,619 |
STATEMENTS OF INCOME |
| ||
Net operating revenue |
| ||
Fair value of assets from the indemnity for the concession | 9,184 | 3,009 | 12,193 |
Operating Costs |
| ||
Amortization | (29,012) | 6,253 | (22,759) |
|
| - |
|
| End of |
| End of |
12.31.2017 | Adjustments | concession in 2019 | |
STATEMENTS OF FINANCIAL POSITION |
| ||
Noncurrent assets |
| ||
Accounts receivable related to the concession | 148,868 | 154,800 | 303,668 |
Intangible assets | 198,688 | (154,800) | 43,888 |
STATEMENTS OF INCOME |
| ||
Net operating revenue |
| ||
Fair value of assets from the indemnity for the concession | (197) | 41,078 | 40,881 |
Management will continue to make its best efforts to protect the Company’s interests, aiming to appropriately settle the impacts of the new interpretation given by the Concession Grantor and find alternatives necessary to maintain the concession in a sustainable manner.
18
![]()
2.2 Contratos de Concessão/Autorização da Copel GeT e das suas participações societárias
Copel GeT |
| Interest % | Maturity |
ONEROUS CONCESSION BY THE USE OF PUBLIC PROPERTY - UBP |
| ||
| |||
Generation Concession 001/2007 - HPP Gov. Jayme Canet Júnior (Mauá) | 51 | 07.02.2042 | |
| |||
Generation concession 001/2011- HPP Colíder (a) | 100 | 01.16.2046 | |
| |||
Ordinance 133/2011 - SHP Cavernoso II | 100 | 02.27.2046 | |
| |||
Generation Concession 002/2012- HPP Baixo Iguaçu (a) | 30 | 09.13.2049 | |
| |||
Generation Concession 007/2013 |
| ||
HPP Apucaraninha | 100 | 10.12.2025 | |
HPP Chaminé | 100 | 08.16.2026 | |
HPP Derivação do Rio Jordão | 100 | 11.15.2029 | |
HPP Cavernoso | 100 | 01.07.2031 | |
| |||
PUBLIC SERVICE CONCESSIONS |
| ||
| |||
Generation concession 045/1999 |
| ||
TPP Figueira (Note 35.2.6) | 100 | 03.26.2019 | |
HPP Gov. Bento Munhoz da Rocha Neto (Foz do Areia) (Note 35.2.6) | 100 | 09.17.2023 | |
HPP São Jorge | 100 | 12.03.2024 | |
HPP Guaricana | 100 | 08.16.2026 | |
HPP Gov. Ney Aminthas de Barros Braga (Segredo) | 100 | 11.15.2029 | |
HPP Gov. José Richa (Salto Caxias) | 100 | 05.04.2030 | |
| |||
Authorization 278/1999 - WPP Palmas | 100 | 09.28.2029 | |
| |||
Dispatch 182/2002 - Hydroeletric Generating Plant - HGP Melissa, HGP Pitangui and |
| ||
HGP Salto do Vau (only register with ANEEL) | 100 | - | |
| |||
Generation concession 002/2016 -HPP Gov. Pedro Viriato Parigot de Souza (GPS) | 100 | 01.05.2046 | |
| |||
HPP Marumbi -Power generating plant registration: CGH. PH. PR. 001501-6.02 | 100 | - | |
| |||
Authorization Aneel 5,373/2015 - HGP Chopim I (only register with ANEEL) | 100 | - | |
| |||
Concession agreement / authorization of the equity |
| ||
UEG Araucária | Authorization 351/1999 - TPP Araucária (20% - Copel) | 60 | 12.22.2029 |
Nova Asa Branca I | MME Ordinance 267/2011 - WPP Asa Branca I | 100 | 04.24.2046 |
Nova Asa Branca II | MME Ordinance 333/2011 - WPP Asa Branca II | 100 | 05.30.2046 |
Nova Asa Branca III | MME Ordinance 334/2011 - WPP Asa Branca III | 100 | 05.30.2046 |
Nova Eurus IV | MME Ordinance 273/2011 -WPP Eurus IV | 100 | 04.26.2046 |
Santa Maria | MME Ordinance 274/2012 - WPP SM | 100 | 05.07.2047 |
Santa Helena | MME Ordinance 207/2012 - WPP Santa Helena | 100 | 04.08.2047 |
Ventos de Santo Uriel | MME Ordinance 201/2012 - WPP Santo Uriel | 100 | 04.08.2047 |
GE Boa Vista | MME Ordinance 276 /2011 - WPP Dreen Boa Vista | 100 | 04.27.2046 |
GE Farol | MME Ordinance 263 /2011 - WPP Farol | 100 | 04.19.2046 |
GE Olho D’Água | MME Ordinance 343 /2011 - WPP Dreen Olho D'Água | 100 | 05.31.2046 |
GE São Bento do Norte | MME Ordinance 310 /2011 - WPP Dreen São Bento do Norte | 100 | 05.18.2046 |
Esperança do Nordeste | MME Ordinance 183/2015 - WPP Esperança do Nordeste (b) | 100 | 05.10.2050 |
Paraíso dos Ventos do Nordeste | MME Ordinance 182/2015 - WPP Paraíso dos Ventos do Nordeste (a) | 100 | 05.10.2050 |
Usina de Energia Eólica Jangada | Resolution 3,257/2011 - WPP GE Jangada (b) | 100 | 01.04.2042 |
Maria Helena | Resolution 3,259/2011 - WPP GE Maria Helena (b) | 100 | 01.04.2042 |
Usina de Energia Eólica Potiguar | MME Ordinance 179/2015 - WPP Potiguar (b) | 100 | 05.10.2050 |
Usina de Energia Eólica Guajiru | Resolution 3,256/2011 - WPP Dreen Guajiru (b) | 100 | 01.04.2042 |
Usina de Energia Eólica Cutia | Resolution 3,258/2011 - WPP Dreen Cutia (b) | 100 | 01.04.2042 |
São Bento do Norte I | Ordinance 349/2015 - WPP São Bento do Norte I (b) | 100 | 08.03.2050 |
São Bento do Norte II | Ordinance 348/2015 - WPP São Bento do Norte II (b) | 100 | 08.03.2050 |
São Bento do Norte III | Ordinance 347/2015 - WPP São Bento do Norte III (a) | 100 | 08.03.2050 |
São Miguel I | Ordinance 352/2015 - WPP São Miguel I (b) | 100 | 08.03.2050 |
São MigueI lI | Ordinance 351/2015 - WPP São Miguel II (b) | 100 | 08.03.2050 |
São Miguel III | Ordinance 350/2015 - WPP São Miguel III (b) | 100 | 08.03.2050 |
Foz do Chopim | Authorization 114/2000 - SHP Arturo Andreoli | 35.77 | 04.23.2030 |
SHP Bela Vista | Resolution 913/2007 (c) | 99.9 | 01.01.2041 |
|
|
|
|
(a) Project under construction. | |||
(b) Beginning of the operation in December, 2018. | |||
(c) Building under construction, in process of transfer of the grant after success in Auction No. 003/2018-ANEEL, on 08.31.2018. | |||
19
![]()
Copel GeT |
| Interest % | Maturity |
Transmission lines and substations concession agreements |
| ||
Contract 060/2001 (extended by 3rd addendum to the contract) - Transmission facilities – several joint ventures | 100 | 12.31.2042 | |
Contract 075/2001 - Transmission line Bateias - Jaguariaíva | 100 | 08.16.2031 | |
Contract 006/2008 - Transmission line Bateias - Pilarzinho | 100 | 03.16.2038 | |
Contract 027/2009 - Transmission line Foz do Iguaçu - Cascavel Oeste | 100 | 11.18.2039 | |
Contract 010/2010 - Transmission line Araraquara II - Taubaté | 100 | 10.05.2040 | |
Contract 015/2010 - Substation Cerquilho III | 100 | 10.05.2040 | |
Contract 022/2012 - Transmission line - Foz do Chopim - Salto Osório C2; Transmission line 230 kV Londrina - Figueira | 100 | 08.26.2042 | |
Contract 002/2013 - Transmission line - Assis - Paraguaçu Paulista II; Substation 230/88 kV Paraguaçu Paulista II | 100 | 02.24.2043 | |
Contract 005/2014 - Transmission line - Bateias - Curitiba Norte; Substation 230/138 kV Curitiba Norte | 100 | 01.28.2044 | |
Contract 021/2014 - Transmission line Foz do Chopim - Realeza; Substation Realeza 230/138 kV - Pátio novo 230 kV | 100 | 09.04.2044 | |
Contract 022/2014 - Transmission line Assis - Londrina | 100 | 09.04.2044 | |
Contract 006/2016 - Transmission line 525kV Curitiba Leste - Blumenau C1 (a) | 100 | 04.06.2046 | |
Contract 006/2016 - Transmission line 230 kV Uberaba - Curitiba Centro C1 e C2 (Underground) (a) |
| ||
Contract 006/2016- Substation 230/138 kV Curitiba Centro (SF6) - 230/138 kV - 2 x ATF 150 MVA (a) |
| ||
Contract 006/2016- Substation 230/138 kV Medianeira (Pátio novo 230 kV) - 2 x 150 MVA (a) |
| ||
Contract 006/2016- Transmission line 230 kV Baixo Iguaçu - Realeza (a) |
| ||
Contract 006/2016- Substation 230/138 kV Andirá Leste - 2 x ATR 150 MVA (a) |
| ||
| |||
Concession agreement / authorization of the equity |
| ||
Costa Oeste Transmissora | Contract 001/2012 - Transmission line Cascavel Oeste - Umuarama; Substation Umuarama 230/20138 kV | 100 | 01.11.2042 |
Caiuá Transmissora | Contract 007/2012 - Transmission line Umuarama - Guaíra; Transmission line 230 kV Cascavel Oeste - Cascavel Norte; | 49 | 05.09.2042 |
Substation Santa Quitéria 230/69-13,8 kV; Substation Cascavel Norte 230/20138-13,8 kV |
| ||
Marumbi Transmissora | Contract 008/2012 - Transmission line Curitiba - Curitiba Leste; Substation Curitiba Leste 525/230 kV | 100 | 05.09.2042 |
Integração Maranhense | Contract 011/2012 - Transmission line Açailândia - Miranda II | 49 | 05.09.2042 |
Matrinchã Transmissora | Contract 012/2012 - Transmission line Paranaíta - Ribeirãozinho; Transmission line 500 kV Paranaíta - Cláudia; | 49 | 05.09.2042 |
Substation Cláudia 500 kV; Transmission line 500 kV Cláudia - Paranatinga; Substation Paranatinga 500 kV; |
| ||
Transmission line 500 kV Paranatinga - Ribeirãozinho |
| ||
Guaraciaba Transmissora | Contract 013/2012 - Transmission line Ribeirãozinho - Marimbondo II; | 49 | 05.09.2042 |
Transmission line 500 kV Ribeirãozinho - Rio Verde Norte; Transmission line 500 Rio Verde Norte - Marimbondo II; |
| ||
Sectioning of Transmission lines 500 kV Marimbondo - Araraquara, at Substation Marimbondo II; |
| ||
Substation Marimbondo II 500 kV |
| ||
Paranaíba Transmissora | Contract 007/2013 - Transmission line - T 500 kV Barreiras II - Rio das Éguas; | 24.5 | 05.01.2043 |
Transmission line 500 kV Rio das Éguas - Luziânia; Transmission line 500 kV Luziânia - Pirapora 2 |
| ||
Mata de Santa Genebra | Contract 001/2014 - Transmission line - Itatiba - Bateias (a); Transmission line 500 kV Itatiba - Bateias (a); | 50.1 | 05.13.2044 |
Transmission line 500 kV Araraquara 2 - Itatiba (a); Transmission line 500 kV Araraquara 2 - Fernão Dias (a); |
| ||
Substation Santa Bárbara D'Oeste 440 kV (a); Substation Itatiba 500 kV (a); |
| ||
Substation 500/440 kV Fernão Dias (a) |
| ||
Cantareira Transmissora | Contract 019/2014 - Transmission line - Estreito - Fernão Dias | 49 | 09.04.2044 |
|
|
|
|
(a) Buildings under construction. | |||
3.1 Statement of compliance
The individual financial statements of the Parent Company and the consolidated financial statements have been prepared in accordance with International Financial Reporting Standards (IFRS) issued by the International Accounting Standards Board, IASB, as well as with accounting practices adopted in Brazil (BR GAAP), which comprise the standards, guidelines and interpretations issued by the Accounting Pronouncements Committee (Comitê de Pronunciamentos Contábeis or CPC) and approved by the Brazilian Securities and Exchange Commission (Comissão de Valores Mobiliários or CVM) and the Federal Accounting Council (Conselho Federal de Contabilidade – CFC).
The Company's Management believes that all the relevant information used in its management is evidenced in the consolidated financial statements.
The consolidated financial statements were approved by Management and authorized for issue on March 28, 2019.
20
![]()
3.2 Functional and presentation currency
The financial statements are presented in Brazilian Reais, which is the functional and presentation currency of the Company. Balances herein have been rounded to the nearest thousand, unless otherwise indicated.
3.3 Basis of measurement
The financial statements were prepared based on the historical cost, except for certain financial instruments measured at fair value and investments, as described in the respective accounting policies and notes.
3.4 Use of estimates and judgments
In the preparation of these financial statements, Management used judgments, estimates and assumptions that affect the application of accounting policies and the reported amounts of assets, liabilities, income and expenses of Copel and its subsidiaries. Actual results may differ from those estimates.
Estimates and assumptions are reviewed on a continuous basis. Changes in estimates are recognized in the period in which they occur.
Information about judgment referring to the adoption of accounting policies which significantly impacts the amounts recognized in the consolidated financial statements, except those involving estimates, is included in the following notes:
· Note 4.1 – Basis of consolidation; and
· �� Note 4.2 – Financialinstruments.
3.4.2 Uncertainties over assumptions and estimates
Information on uncertainties related to assumptions and estimates that pose a chance of resulting in a material change within the next financial year is included in the following notes:
· Notes 4.3 and 9 – Sectorial financial assets and liabilities;
· Notes 4.4 and 10 – Accounts receivable related to the concession;
· Notes 4.5 and 11 – Contract assets;
· Notes 4.8 and 18 – Property, plant and equipment;
· Notes 4.9 and 19 – Intangible assets;
· Notes 4.10 and 18.7 – Impairment of assets;
· Notes 4.11 and 29 – Provisions for litigation and contingent liabilities;
· Note 4.12 – Revenue recognition;
· Note 4.14 – Power purchase and sale transactions in the Spot Market (Electricity Energy Trading Chamber – CCEE);
· Note 4.15 –Power purchase and sale transactions in the active market;
· Note 7.3 – Expected credit losses;
21
![]()
· Note 13.2 – Deferred income tax and social contribuition; and
· Note 24 – Post-employment benefits.
3.5 Management’s Judgment on Going Concern
Management has concluded that there are no material uncertainties that cast doubt on the Company’s ability to continue as a going concern. No events or conditions were identified that, individually or in the aggregate, may raise significant doubts on its ability to continue as a going concern.
The main bases of judgment used for such conclusion are: (i) main activities resulting from long-term concessions; (ii) robust equity; (iii) strong operating cash generation, including financial capacity to settle commitments entered into with financial institutions; (iv) historical profitability; and (v) fulfillment of the objectives and targets set forth in the Company's Strategic Planning, which is approved by Management, monitored and reviewed periodically, seeking the continuity of its activities.
4 Significant Accounting Policies
4.1 Basis of consolidation
4.1.1 Calculation of equity in earnings of investees
Investments in subsidiaries, joint ventures and associate are recognized in the parent company's financial statements based on the equity method and investments in joint ventures and associate are recognized in the consolidated financial statements based on the equity method.
Under this method, investments are initially recorded at cost and their carrying amount is increased or decreased by the recognition of the investor's interest in profit, loss and other comprehensive income generated by investees after acquisition. This method must be discontinued from the date the investment ceases to qualify as a controlled, jointly controlled or associated company.
Payment of dividends decreases the carrying value of investments.
When required, for calculation of equity in earnings of investees, the investees' financial statements are adjusted to align their policies with the Company's accounting policies.
4.1.2 Subsidiaries
The subsidiaries are entities to which the Company is exposed to or has a right over the variable returns arising from its involvement with them and has the ability to affect those returns exerting its power over the entities.
The financial statements of the subsidiaries are included in the consolidated financial statements as from the date they start to be controlled by the Company until the date such control ceases.
The balances of the subsidiaries’ assets and liabilities, and profit or loss, are consolidated and transactions between consolidated companies are eliminated.
22
![]()
4.1.3 Noncontrolling interests
Noncontrolling interests are presented in equity, separately from the equity attributable to the Company's shareholders. Profits, losses and other comprehensive income are also allocated separately from the ones allocated to the Company's shareholders, even if this procedure results in negative noncontrolling interest balance.
4.1.4 Joint ventures and associates
Joint ventures are entities over which the Company, subject to an agreement, has the ability to affect returns exerting its power in conjunction with other parties, irrespective of the percentage of interest in the voting capital.
Associates are entities over which the Company exerts significant influence regarding financial and operational decisions, without control.
When the share in losses of a joint venture or associate equals or exceeds the accounting balance of the investor’s equity interest in the investee, the investor should discontinue the recognition of its share in future losses. Additional losses will be considered, and a liability will be recognized, only if the investor incurs legal or constructive obligations, or performs payments on behalf of the investee. Should the investee subsequently post profits, the investor should resume the recognition of its interest in these profits only subsequent to the point at which the portion to which it is entitled to in these subsequent profits equals its share in unrecognized losses.
4.1.5 Joint operations (consortiums)
Joint operation is a joint business according to which parties that jointly control the business have rights on assets and obligations regarding liabilities related to the business.
Joint operations are recorded in proportion to the share of interest held in their assets, liabilities and profit or loss.
4.1.6 Business combination
The acquisition analysis is done on a case-by-case basis to determine whether the transaction represents a business combination or an asset purchase. Transactions between companies under common control do not constitute a business combination.
Assets and liabilities acquired in a business combination are accounted for using the acquisition method and are recognized at their fair values at the acquisition date.
The excess of the acquisition cost over the fair value of the net assets acquired (identifiable assets acquired, net of assumed liabilities) is recognized as goodwill in intangible assets. When the amount generated is negative, the bargain purchase gain is recognized directly in profit or loss.
23
![]()
The amount paid that refers specifically to the concession right acquired in a business combination where the acquired entity is a concession operator, whose right to the concession has a known and defined term, is not characterized as goodwill.
In acquisitions of interests in associate and in joint ventures, although they do not constitute a business combination, the net assets acquired are also recognized at fair value. Goodwill is presented in the investment.
4.2 Financial instruments
Financial instruments are recognized immediately on the trade date, that is, when the obligation or right arises. They are initially recorded at fair value, unless it is a trade receivables without a significant financing component, plus, for an item not measured at fair value through profit or loss, any directly attributable transaction costs. An accounts receivable from customers without a significant component of financing is initially measured at the price of the transaction.
Fair values are determined based on market prices for financial instruments with active market, and by the present value method of expected cash flows, for those that have no quotation available in the market.
Copel and its subsidiaries do not operate with derivative financial instruments, except for the purchase and sale of energy contracts disclosed in Statement Note. 35.2.12. The company does not operate financial instruments measured at fair value through other comprehensive income.
Financial assets are not reclassified subsequent to initial recognition, unless the Company changes the business model for the management of financial assets, in which case all affected financial assets are reclassified on the first day of the reporting period subsequent to the change in business model.
The Company's financial instruments are classified and measured as described below.
4.2.1 Financial assets recorded at fair value through profit or loss
Financial assets recorded at fair value through profit or loss include financial assets designated upon initial recognition as at fair value through profit or loss or financial assets required to be measured at fair value. Financial assets are classified as held for trading if they are acquired for the purpose of being sold or repurchased in the near term. Financial assets with cash flows that are not solely payments of principal and interest are classified and measured at fair value through profit or loss, irrespective of the business model. After initial recognition, transaction costs and attributable interest expenses, when incurred, are recognized through profit or loss.
4.2.2 Financial assets measured at amortized cost
Financial assets are classified and measured when: (i) the financial asset is maintained within a business model whose objective is to maintain financial assets in order to receive contractual cash flows; and (ii) the contractual terms of the financial asset give rise on specified dates to cash flows that are solely payments of principal and interest on the principal amount outstanding.
24
![]()
4.2.3 Financial liabilities measured at amortized cost
Financial liabilities are measured at amortized cost using the effective interest method. This method is also used to allocate interest expense of these liabilities for the period. The effective interest rate is the rate that discounts estimated future cash flows (including fees paid or received that form an integral part of the effective interest rate, transaction costs and other premiums or discounts) over the expected life of the financial liability or, when appropriate, over a shorter period, for the initial recognition of the net carrying amount.
4.2.4 Financial liabilities measured at fair value through Profit or Loss
Financial liabilities designated fair value through profit or loss are stated at fair value with the respective gains or losses in fair value recognized in the statement of income. Net gains or losses recognized in profit or loss include the interest paid on the financial liability.
4.2.5 Derecognition of financial assets and liabilities
The Company derecognizes a financial asset when the contractual rights to the cash flows from the financial asset expire, or it transfers the rights to receive the contractual cash flows in a transaction in which substantially all of the risks and rewards of ownership of the financial asset are transferred or in which the Company neither transfers nor retains substantially all of the risks and rewards of ownership and it does not retain control of the financial asset.
The Company derecognizes financial liabilities only when its obligations are discharged, cancelled or settled. The difference between the carrying amount of the derecognized financial liability and the corresponding disbursement made, or to be made, is recorded to profit or loss.
4.3 Net sectorial financial assets and liabilities
According to the amendment to the concession agreement of distribution companies, the Company records changes in sectorial financial assets and liabilities, until the next tariff adjustment/review process, when the Concession Grantor approves the transfer as components of the power tariff and thus, it passes the adjustment on to consumers in the next tariff cycle, which occurs on June 24 of each year.
In the event of termination of the concession for any reason, the residual values of Part A items and other financial components not recovered or returned through tariff are incorporated in the calculation of compensation or deducted from unamortized assets indemnity values, thus protecting rights or obligations of the distribution company to the Concession Grantor.
25
![]()
4.4 Accounts receivable related to the concession
Refer to financial assets of the concessions with unconditional right to receive cash by the Company, guaranteed by the Concession Grantor by contractual clause and specific legislation.
4.4.1 Power distribution service concession
The concession agreement for electricity distribution provides that the users of the public service remunerate part of the investments made by the concessionaire and the Concession Grantor at the end of the concession indemnifies the other party. This model provides for the recognition of financial assets, contract assets in the construction period and intangible assets.
The portion recognized as financial asset refers to the indemnity set forth in the public power distribution service concession agreements, which the Company understands as an unconditional right to cash payments from the Concession Grantor upon expiration of the concession. This indemnification aims to reimburse the Company for investments made in infrastructure, without recovery, through the tariff.
The cash flows related to these assets are determined taking into account the Regulatory Compensation Basis (Base de Remuneração Regulatória or BRR, in Portuguese), defined by the Concession Grantor. The methodology of the BRR is based on the replacement cost of the assets that make up the power distribution infrastructure related to the concession.
4.4.2 Piped gas distribution service concession
Gas concession agreement follows the bifurcated model, whereby part of the investments made by the concession operator is paid by users of the public service and the other part is indemnified by the Concession Grantor, the State of Paraná, at the end of the concession. This model provides for recognition of a financial asset, a contract asset in the construction period and an intangible asset.
The amount recognized as a financial asset is the amount that will be indemnified by the Concession Grantor corresponding to the investments made in the last ten years prior to the end of the concession as foreseen in the agreement and that, according to Management, assures the unconditional right to receive cash at the end of the concession. The indemnity assumption is based on the replacement cost of the concession assets.
4.4.3 Bonus for the grant of quota system generation concession agreement
The quota system generation concession agreement provides for the payment of a bonus for the grant to the Concession Grantor, pursuant to paragraph 7 of article 8 of Law 12,783/2013.
This bonus is recognized as a financial asset because it represents an unconditional right to receive cash, guaranteed by the Concession Grantor during the term of the concession and without risk of demand.
The remuneration of this financial asset is based on the Weighted Average Cost of Capital - WACC defined by the National Energy Policy Council (CNPE) in Resolution 2/2015, which is being presented in the statement of income as operating revenue in accordance with the Company's business model.
26
![]()
4.4.4 Transmission concession – Reassessment of assets of the Basic Network of the Existing System
Refers to the right to reimbursement of the Concession Agreement No. 060/2001 arising from the Annual Revenue Allowed not received in the period from January 2013 to June 2017. The balance includes monetary adjustment and interest rates (Note 10.5).
4.4.5 Concession of power generation
The Company has operated and operates concession agreements for power generation that contain indemnification clauses for the infrastructure not depreciated, amortized and/or received during the concession term. After maturity, the residual balance of the assets is transferred to Accounts receivable related to the concession. At the end of each reporting period, Management evaluates the recoverability of the asset, remeasuring its cash flow based on its best estimate.
4.5 Contract assets
Represented by the construction in progress or in service of the infrastructure delegated by the Concession Grantor, conditional upon the receipt of revenue not only by the passage of time, but after fulfilling the performance obligation to maintain and operate the infrastructure.
4.5.1 Power distribution service concession
Represents the concessionaire's contractual right related to the works under construction to meet the needs of the concession, accounted for at cost plus financial charges, when applicable.
When the assets are put into operation, the assets are transferred to the intangible asset, in the amount equivalent to what will be remunerated by the user through payment of the fee for the use of the services, or to the accounts receivable associated to the concession, in the amount equivalent to the residual portion of the assets not amortized, which will be reverted to the Concession Grantor through indemnification at the end of the concession.
4.5.2 Power gas distribution service concession
Construction in progress for the distribution of piped gas which will be transferred to intangible assets upon their entry in operation and to the extent that the right (authorization) is received to charge the users of the public service. The amount that will not be amortized within the term of the concession is presented in financial assets, indemnified at the end of the concession by the Concession Grantor according to contractual definition.
4.5.3 Power transmission concession
Represents the balance of public electricity transmission contracts signed with the Concession Grantor to build, operate and maintain the high voltage lines and substations of the generation centers up to the distribution points.
27
![]()
During the term of the concession agreement, the Company receives, subject to its performance, a remuneration denominated Annual Revenue Allowance (RAP) that remunerates the investments made in the construction of the infrastructure and covers the costs of operation and maintenance incurred. After the start of the commercial operation, this revenue is recognized in the statement of income to the extent that the operation and maintenance service are provided, and the portion of the revenue recognized in the construction phase, referring to the remuneration of the constructed assets, is billed, and will be presented in trade accounts receivable until their actual receipt.
The assets arising from the construction of the transmission infrastructure are formed by the recognition of construction revenue (Note 4.13) and by their financial remuneration (Note 4.12.2).
Upon expiration of the concession, any uncollected amounts related to the construction of infrastructure shall be received directly from the Concession Grantor, as an unconditional right to cash reimbursement pursuant to the concession agreement, as compensation for investments made and not recovered through tariffs (RAP).
4.6 Accounts payable related to the concession
These refer to the amounts set forth in the concession agreement in connection with the right to explore hydraulic energy potential (onerous concession), whose agreement is signed as Use of Public Property (Uso do Bem Público or UBP, in Portuguese) agreements. The asset is recognized on the date of signature of the concession agreement corresponding to the present value of future cash payments for the concession. The liability is then remeasured using the effective interest rate and reduced by contractual payments.
4.7 Inventories (including property, plant and equipment and contract assets)
Materials and supplies in inventory, classified under current assets, and those assigned for investments, classified under property, plant and equipment, and contract assets, have been recorded at their average acquisition cost.Recorded amounts do not exceed their net realizable value.
4.8 Property, plant and equipment
The property, plant and equipment related to the public service concession agreement are depreciated according to the straight-line method based on annual rates set forth and reviewed periodically by ANEEL, which are used and accepted by the market as representative of the economic useful lives of the assets related to concession's infrastructure. Property, plant and equipment related to contracts for the use of public property under the independent electricity producer scheme are depreciated based on annual rates established by ANEEL limited to the concession period. All other property, plant and equipment are depreciated using the straight-line method based on estimates of their useful lives, which is reviewed annually and adjusted if necessary.
Costs directly attributable to construction works as well as interest and financial charges on borrowings from third parties during construction are recorded under property, plant and equipment in progress, if it is probable that they will result in future economic benefits for the Company.
28
![]()
4.9 Intangible assets
These comprise software acquired from third parties and software developed in-house and are measured at acquisition cost and amortized over five years, besides Intangible assets from Concession Agreements below.
4.9.1 Onerous concession of electric power generation
Corresponds to acquisition of exploration rights on hydropower potential whose onerous concession contract is signed as Use of Public Property - UBP.
During construction work, this asset is recognized at the present value of future cash disbursements during the Concession Agreement term. When commercial operation starts, the amount starts to be amortized over the concession period.
4.9.2 Hydrological risk renegotiation (Generation Scaling Factor - GSF)
Asset consisting of the renegotiation of the hydrological risk under the terms of Law No. 13,203/2015, arising from the excess amount between the amounts recovered from the cost with the adjustment of the Energy Reallocation Mechanism - MRE (GSF), subtracted from the total cost of the risk premium to be amortized over the energy supply period in the regulated environment. The amount was transformed by ANEEL into an extension of the concession period, which is amortized on a straight-line basis as from January 1, 2016 until the end of the new concession period, according to note 14.1.
4.9.3 Power distribution service concession
This comprises the right to control infrastructure, built or acquired by the operator or provided to be used by the operator as part of the electric energy public service concession, and the right to charge fees to the users of the public service.
Intangible assets are recorded at their fair acquisition and construction value, less accumulated amortization and impairment losses, when applicable. The amortization of intangible assets reflects the pattern in which it is expected that future economic benefits will flow to the Company during the concession period.
During the infrastructure construction phase costs are classified as contract assets (Note 4.5).
4.9.4 Piped gas distribution service concession
Intangible assets for piped gas distribution services, which correspond to the right to charge users for the gas supply.
This intangible asset was initially recognized at acquisition or construction cost, plus interest and other capitalized finance charges. This asset is amortized using the straight-line basis over its estimated useful life, considering the economic benefits generated by intangible assets.
During the infrastructure construction phase, costs are classified as contract assets (Note 4.5).
29
![]()
4.9.5 Intangible assets acquired separately
Intangible assets with a finite useful life, acquired separately, are recorded at cost, less accumulated amortization and accumulated impairment losses. Amortization is recognized using the straight-line method based on the estimated useful lives of the corresponding assets. The estimated useful lives and the amortization method are reviewed at the end of each reporting period, with the effect of any changes in estimate being accounted for on a prospective basis.
4.9.6 Derecognition of intangible assets
An intangible asset is derecognized when no future economic benefits are expected from use or disposal. Gains or losses arising from disposal of an intangible asset are recognized in profit or loss, measured as the difference between net disposal proceeds and the carrying amount of the asset.
4.10 Impairment of assets
Assets are assessed to detect evidence of impairment.
4.10.1 Financial assets
Provisions for losses on financial assets are based on assumptions about default risk and expected loss rates. The Company uses judgment to establish these assumptions and to select the data for the calculation of the impairment, based on the Company's history, on the existing market conditions and on the future estimates at the end of each year.
The Company applies the simplified approach of IFRS 9/CPC 48 to the measurement of expected credit losses by considering a provision for expected loss over a useful life for all trade accounts receivable. To measure expected credit losses, trade accounts receivable are grouped based on shared credit risk characteristics and overdue days.
4.10.2 Non-financial assets
Assets under formation arising from onerous concession and concession rights and/or authorization to generate electricity are classified as intangible assets. Impairment is tested along with the other assets of that cash-generating unit.
Whenever there is a loss resulting from situations where an asset’s carrying value exceeds its recoverable value, defined as the higher of the asset’s value in use or its net selling price, this loss is recognized in profit or loss for the year.
For impairment testing purposes, assets are grouped at the lowest levels for which there are separately identifiable cash flows (Cash Generating Units - CGU).
The amount of the impairment of non-financial assets is reviewed at the reporting date. In case of reversal of impairment losses which had been recorded in prior years, this reversal is recognized in current year's profit or loss.
30
![]()
The Impairment of contract assets in their construction phase are tested immediately, mainly considering the use of the effective interest rate fixed at the beginning of the project and carried to the end of the concession cash flow. After the beginning of the commercial operation, the portion of revenue recognizedis tested for impairment in the accounts receivable from customers. For the receivable part conditioned to fulfill the performance obligation to maintain and operate the infrastructure, the Company has no history and no expectation of losses, since amount are subject to guarantee structures, via shared apportionment of eventual default losses among the other members of the national interconnected system managed by the “Operador Nacional do Sistema” (ONS) and by jurisdiction of the sector.
4.11 Provisions
Provisions are recognized when: i) the Company has a present obligation (legal or constructive) resulting from a past event, ii) it is probable (i.e., more likely than not) that an outflow of resources embodying economic benefits will be required to settle the obligation, and iii) a reliable estimate can be made of the amount to settle the obligation.
The estimates of outcomes and financial impacts are determined by the Company, which requires use of judgment by Management, supplemented by the experience of similar past transactions and, in some cases, by independent expert reports.
Environmental liabilities are recognized as the Company assumes formal obligations before regulatory agencies or becomes aware of potential risks related to environmental issues, which may lead to cash disbursements that are deemed probable and that may be estimated. During the project implementation phase, the accrued amounts are included in property, plant and equipment (generation), construction cost (transmission) or contract assets (distribution). At the start of operations, all costs included in the Operating License, whose programs will be executed during the concession and the respective disbursement has not yet occurred, are measured and adjusted to present value according to the estimated cash flow of disbursements and recorded as environmental provisions matched against the assets related to the project, being adjusted periodically.
Once the project enters commercial operation, all costs or expenses incurred with environmental programs related to the project’s operation and maintenance licenses are analyzed according to their nature and included in profit or loss for the period.
4.12 Revenue recognition
4.12.1 Revenue from contracts with customers
Revenue is measured based on the consideration that the Company expects to receive in a contract with the customer, net of any variable consideration. The Company recognizes revenues when it transfers control of the product or service to the customer. The Company's operating revenue comes mainly from the electricity supply and from the electric network availability.
31
![]()
The revenue from electricity supply is recognized monthly based on the data for billing that are determined by the average MW of contracted electricity and declared with the CCEE. When the information is not available, the Company estimates the revenue considering the contracts’ rules, the price estimate and the volume provided.
For wind power generation companies subject to minimum generation amounts, the Company understands that it is subject to variable consideration, and for this reason, includes a provision for non-performance based on the annual generation estimates, reducing revenue.
Revenue from electric power supply and network availability is recognized monthly based on measured and effectively billed energy. In addition, the Company records unbilled revenue, calculated from the period between the last billing and the end of each month, by estimate based on the last measurement taken. In the concession contract for the public electricity distribution service, non-performance compensations are provided for quality indicators that, when incurred, reduce electricity availability revenue.
4.12.2 Interest income
Interest income is recognized when it is probable that future economic benefits will flow to the Company and its amount can be reliably measured. Interest income is recognized on a straight-line basis and based on time and the effective interest rate on outstanding principal amounts. The effective interest rate is the one that discounts the estimated future cash receipts calculated during the estimated life of the financial asset in relation to initial net carrying amount of that asset.
Regarding the financial and contract assets of the power transmission concession, financial compensation revenue is recognized using the discount rate established at the beginning of each project, which is presented in the statement of income as operating income in accordance with the Company's business model.
4.13 Construction revenues and costs
Revenue related to construction services for infrastructure in the power transmission and distribution services, and gas distribution, are recognized using the percentage of completion (PoC) method at each reporting period and measured on the basis of the proportion of costs incurred in relation to the total estimated costs of the distribution and transmission concession contracts. Related costs are recognized in the statement of income as construction cost.
Given that Copel DIS and Compagás outsource the construction of distribution infrastructure to unrelated parties through works carried out in the short term, the construction margin to the power and gas distribution activities result in no significant amounts, resulting in the non-recognition of such margin.
The construction margin adopted for the transmission activity for the years 2018 and 2017 was 1.65%, and results from a calculation methodology which takes into account the respective business risk.
32
![]()
4.14 Power purchase and sale transactions in the Spot Market (Electric Energy Trading Chamber – CCEE)
Power purchase and sale transactions in CCEE are recorded on the accrual basis of accounting, based on data released by CCEE, which are calculated by the product of the Differences settlement prices - PLD multiplied by the energy surplus declared with CCEE, or, when such information is not available in a timely manner, by an estimate prepared by Management.
4.15 Power purchase and sale transactions in the active market
The Company negotiates energy purchase and sale agreements in the active market and part of its contracts are classified as derivative financial instruments measured at fair value through profit or loss.
Unrealized net gains or losses arising from the mark-to-market of these contracts (the difference between contractual and market prices) are recognized in the statement of income.
4.16 Leases
Leases are classified as finance leases whenever the terms of the lease transfer substantially all the risks and rewards of ownership to the lessee. Other leases are classified as operating.
4.17 Added Value Statement - DVA
This demonstration aims to highlight the wealth generated by the companies as well as their distribution during a certain period. It is presented, as required by Brazilian corporate law, as part of its individual financial statements and as supplementary information to the consolidated financial statements, since it is not an expected or mandatory statement under IFRS.
4.18 Standards applicable to the Company effective January 1, 2018
The following accounting pronouncements were reviewed and had no material effect on the transactions carried out by the Company in periods prior to or after the effective date, of January 1, 2018:
(i) ICPC 21/IFRIC 22 – Foreign Currency Transactions and Advance Consideration;
(ii) CPC 10 (R1)/IFRS 2 – Share-based payment;
(iii) CPC 28/IAS 40 – Investment Property;
(iv) CPC 18 (R2)/IAS 28 – Investments in Associates and Joint Ventures; and
(v) Annual Review of CPC n° 12/2017 (IASB ciclo 2014-2016).
Furthermore, Copel and its subsidiaries adopted the following standards, with effects from January 1, 2018:
4.18.1 CPC 48/IFRS 9 – Financial instruments
The Company adopted CPC 48/IFRS 9 applying the exemption set forth in item 7.2.15 of the standard, which allows it not to restate prior period’s comparative information due to the changes in classification and measurement of financial instruments.
33
![]()
The new standard establishes three categories for classification and measurement of financial assets: (i) measured at fair value through profit or loss; (ii) measured at amortized cost, based on the business model within which they are held and the characteristics of their contractual cash flows; and (iii) measured at fair value through other comprehensive income. The initial adoption had the following impacts on the classification of the Company's financial assets:
Financial instrument | Classification as CPC 38/IAS 39 | New classification (CPC 48/IFRS 9) |
Bonds and securities | Available for sale | Fair value through profit or loss |
Collaterals and escrow accounts | Loans and receivables | Amortized cost |
Trade accounts receivable | Loans and receivables | Amortized cost |
CRC transferred to the State Government of Paraná | Loans and receivables | Amortized cost |
Sectorial financial assets | Loans and receivables | Amortized cost |
Accounts receivable related to the concession - |
|
|
transmission (amortizable) | Loans and receivables | (a) |
Accounts receivable related to the concession - |
|
|
transmission (indemnable) | Loans and receivables | (a) |
Accounts receivable related to the concession - |
|
|
bonus from the grant | Loans and receivables | Amortized cost |
Accounts receivable related to the concession - distribution | Available for sale | Fair value through profit or loss |
Accounts receivable related to the concession compensation | Available for sale | Fair value through profit or loss |
State of Paraná - Government Programs | Loans and receivables | Amortized cost |
Other temporary investments | Available for sale | Fair value through profit or loss |
|
|
|
(a) Rights that are now considered as contract assets, in accordance with IFRS 9.(Note 11) | ||
The standard also requires the Company’s Management to carry out an assessment of its financial assets for a time span of twelve months or throughout the life of the asset and record the effects when there is indication of expected credit losses (ECLs) on financial assets. CPC 48/IFRS 9 defined the expected credit loss model, which requires an entity to account for ECLs and changes in those expected credit losses at each reporting date to reflect changes in credit risk since initial recognition.
Previously, impairment of accounts receivable was presented as incurred losses. Uncollectable individual accounts receivable were written off through the direct reduction of the accounting value.
Since the adoption of the new standard, the Company has applied the simplified approach whereby expected losses are recognized throughout the life of financial assets of trade accounts receivable. The effect on the balance sheet as of January 1, 2018 arising from this new accounting policy is presented in Note 4.18.3.
With regard to financial liabilities, CPC/48IFRS 9 defines that any change in fair value of a financial liability designated as at fair value through profit or loss attributable to changes in the credit risk of that liability should be stated in other comprehensive income and not in the statement of income, unless such recognition results in a mismatching in the statement of income. There was no impact on the classification of Company’s financial liabilities.
34
![]()
4.18.2 CPC 47/IFRS 15 – Revenue from contracts with customers
The Company opted to adopt the CPC 47/IFRS 15 standard on the date of the initial application as an adjustment to the opening balance, considering only contracts entered into prior to the date of application, as set forth in Appendix C of CPC 47, in items C3 (b) and C7.
The standard establishes that an entity shall recognize revenue to represent the transfer of promised goods or services to customers in an amount that reflects the consideration to which the entity expects to be entitled in exchange for those goods or services. Therefore, an entity recognizes revenue when (or as) the entity satisfies a performance obligation, i.e., when the "control" over the goods and services in a certain operation is transferred to the customer.
The standard also determines that when the Company completes the performance by transferring goods or services to the customer before payment of the consideration or before payment is due, the entity must present this right as a contract asset.
The contract asset is defined by the standard as the right to the consideration in exchange for goods or services transferred to the customer when this right is conditioned to something beyond the passage of time, for instance, its future performance.
The effects on the balance sheet resulting from the adoption of this standard are presented in Note 4.18.3.
In addition, as a result of the new standard, in the energy distribution segment, the Company changed the method for accounting compensation of non-performance evidenced by the availability indicators, which were previously recorded as operating expenses and are currently recorded reducing revenue from electric network availability.
4.18.3 Effect on the financial statements
The differences in accounting balances of financial assets and liabilities resulting from the initial adoption of CPC 47/IFRS 15 and CPC 48/IFRS 9 were recognized in retained earnings, totaling R$ 160,533, as shown below:
35
![]()
|
|
|
| Parent Company |
|
|
| Consolidated |
| 12.31.2017 | Effects of applying | Effects of applying | 01.01.2018 | 12.31.2017 | Effects of applying | Effects of applying | 01.01.2018 |
STATEMENTS OF FINANCIAL POSITION |
|
|
|
|
| |||
Assets | 17,955,966 | (150,428) | (14,496) | 17,791,042 | 33,162,377 | (150,428) | (14,496) | 32,997,453 |
Current assets | 998,294 | - | - | 998,294 | 5,701,834 | (2,960) | (18,608) | 5,680,266 |
Trade accounts receivable (a) (b) | - | - | - | - | 2,733,240 | (2,960) | (18,507) | 2,711,773 |
Other current receivables (a) | 8,287 | - | - | 8,287 | 409,351 | - | (101) | 409,250 |
Accounts receivable related to the concession (c) | - | - | - | - | 149,744 | (66,366) | - | 83,378 |
Contract assets (c) | - | - | - | - | - | 66,366 | - | 66,366 |
Noncurrent assets | 16,957,672 | (150,428) | (14,496) | 16,792,748 | 27,460,543 | (147,468) | 4,112 | 27,317,187 |
Trade accounts receivable (a) | - | - | - | - | 261,082 | - | (3,356) | 257,726 |
Accounts receivable related to the concession (c) | - | - | - | - | 4,429,237 | (2,066,325) | - | 2,362,912 |
Contract assets (c) | - | - | - | - | - | 2,774,142 | - | 2,774,142 |
Deferred income tax and social contribution | 102,236 | - | - | 102,236 | 915,492 | 1,280 | 7,468 | 924,240 |
Investments (d) | 14,987,607 | (150,428) | (14,496) | 14,822,683 | 2,570,643 | (148,748) | - | 2,421,895 |
Intangible assets in progress (c) | 830 | - | - | 830 | 9,829,450 | (707,817) | - | 9,121,633 |
Liabilities | 17,955,966 | (150,428) | (14,496) | 17,791,042 | 33,162,377 | (150,428) | (14,496) | 32,997,453 |
Equity | 15,207,842 | (150,428) | (14,496) | 15,042,918 | 15,510,503 | (150,428) | (14,496) | 15,345,579 |
Attributable to controlling shareholder's | 15,207,842 | (150,428) | (14,496) | 15,042,918 | 15,207,842 | (150,428) | (14,496) | 15,042,918 |
Equity valuation adjustments (e) | 895,601 | - | (4,391) | 891,210 | 895,601 | - | (4,391) | 891,210 |
Accumulated profit | - | (150,428) | (10,105) | (160,533) | - | (150,428) | (10,105) | (160,533) |
a) Increase of R$ 21,863 in expected credit losses from trade accounts receivable and R$ 101 in expected credit losses from other receivables recognized in retained earnings net of taxes.
b) In the telecommunications segment, revenue from activation is recognized at a point in time if the customer opts for non-loyalty of the connectivity plan. If the customer opts for loyalty, a discount is applied to the amount of the service rendered during the plan and the revenue will be deferred for a twelve-month period. The Company assessed that the deferred revenue adjustment to be recognized on January 1, 2018 was R$ 2,960, based on the agreements in effect on December 31, 2017.
c) Reclassification of R$ 2,132,691 of accounts receivable related to the concession for contract assets, referring to electricity transmission concession contracts, by CPC 47/IFRS 15, which brought the concept of the right to receive the built infrastructure conditioned to the fulfillment of performance obligations to operate and maintain the infrastructure and not only over time. Reclassification of R$ 707,817 intangible assets in progress to contract assets because works in progress for the distribution of electricity and piped gas were within the scope of ICPC 01/IFRIC 12 until December 31, 2017. With the entry into force on January 1, 2018 of CPC 47/IFRS 15 and the revision of ICPC 01/IFRIC 12, the Company began to classify as contract assets the works for distribution of electricity and piped gas during the construction period.
d) As of December 31, 2017, the joint ventures operating in the transmission segment had their electricity transmission concession agreements classified as financial assets within the scope of CPC 38/IAS 39 and ICPC 01/IFRIC 12. With the entry into force on January 1, 2018 of CPC 47/IFRS 15, bringing the concept of the right to receive the infrastructure investments conditioned to the fulfillment of performance obligations to operate and maintain the infrastructure and not only by the passage of time, the electricity transmission concession agreements started being classified as contract assets. As a result, the balance of the financial assets of the joint ventures started being classified on January 1, 2018 as contract assets in accordance with the Company's practices, with a reduction in its measurement in the amount of R$148,748 with effect in the Company in the caption Investments, by equity. At the transition, the Company and its joint ventures opted to adopt the standard on the date of initial application as an adjustment to the opening balance, in equity account, considering only agreements outstanding prior to the date of application, as set forth in Appendix C of CPC 47, in items C3 (b) e C7.
36
![]()
e) Realization of the fair value of other temporary investments, previously classified as available for sale and recognized in other comprehensive income within the scope of CPC 38/IAS 39. As from January 1, 2018 the fair value of temporary investments started being classified as fair value through profit or loss in accordance with CPC 48/IFRS 9.
4.19 New standards that are not yet in effect
In addition, the standards below, effective as of January 1, 2019 and not early adopted by the Company:
(i) CPC 18 (R2)/IAS 28 – Investments in associates and joint ventures;
(ii) CPC 33 (R1)/IAS 19 – Employee benefits;
(iii) CPC 48/IFRS 9 – Financial instruments; and
(iv) Revision of CPC n° 13/2018 (IASB cycle 2015-2017).
The Company assessed the application of these changes and do not expect significant impacts on their financial statements due to the adoption of the new requirements.
In addition, the standards below, also effective as of January 1, 2019 and not adopted in advance by the Company were evaluated, as described below.
4.19.1 CPC 06 (R2)/IFRS 16 - Leases
The pronouncement replaces CPC 06 (R1)/IAS 17 - Leases, as well as related interpretations (ICPC 03/IFRIC 4, SIC 15 and SIC 27). It eliminates the operating lease accounting for the lessee, presenting a single lease model consisting of initially recognizing all leases in intangible assets (Right-of-Use Assets) and liabilities (Other Accounts Payable) at present value; and recognizing the amortization of the right to use the asset and lease interest separately in the statement of income.
For short-term leases (lease term of 12 months or less) and low-value assets leases (such as computers, printers and mobile devices), the Company will choose to recognize lease expenses on a straight-line basis as provided for in CPC 06 (R2)/IFRS 16.
Management intends to apply the modified retrospective transition method, which does not require the presentation of comparative information, and the liability and the right-of-use asset are recognized at the present value of the remaining payments.
As of January 1st, 2019, the Company will recognize a right to use asset and a lease liability at the present value of approximately R$ 114,000, resulting in a variation of no more than 0.5% of the total consolidated asset as of December 31, 2018, with no impact on equity.
37
![]()
4.19.2 ICPC22/IFRIC 23 – Uncertainty over Income Tax Treatments
The interpretation explains how to apply the recognition and measurement requirements of CPC 32 - Income Taxes where there is un/certainty over a tax treatment. In accordance with certain requirements, such as where the tax authority is most likely not to accept certain treatment, the entity shall recognize and measure its current or deferred tax, asset or liability, applying the requirements of CPC 32 based on taxable profit (tax loss), tax bases, unused tax losses, unused tax credits and ruling statutory tax rates, considering this non-acceptance.
The Company is evaluating the income tax treatments and has the perspective of concluding that the application of the standard will not have significant impacts on its results.
|
| Parent Company |
| Consolidated |
| 12.31.2018 | 12.31.2017 | 12.31.2018 | 12.31.2017 |
Cash and bank accounts | 2,044 | 2,477 | 167,728 | 157,470 |
Financial investments with immediate liquidity | 312,959 | 54,356 | 1,780,681 | 882,605 |
| 315,003 | 56,833 | 1,948,409 | 1,040,075 |
These comprise cash on hand, deposits with banks and short-term highly-liquid investments, which can be redeemed in cash within 90 days from the investment date. Temporary short-term investments are recorded at cost at the reporting date, plus earnings accrued. Cash and cash equivalents are subject to an insignificant risk of change in value.
Financial investments from Copel and its subsidiaries refer to Bank Deposit Certificates - CDBs and Repurchase Agreements, which are the sale of a security with the commitment of the seller (Bank) to repurchase it, and of the purchaser to resell it in the future. Investments are remunerated between 75% and 101% of Interbank Deposit Certificate (Certificado de Depósito Interbancário - CDI) interest.
|
|
| Parent Company |
| Consolidated |
Category | Index | 12.31.2018 | 12.31.2017 | 12.31.2018 | 12.31.2017 |
Quotas in Funds (a) | CDI | 123,560 | 90 | 286,855 | 114,732 |
Bank Deposit Certificates - CDB | 95.0% to 101% of CDI | - | - | 50,629 | 57,192 |
Committed Operation | 96.5% to 100% of CDI | - | - | 6,116 | 47,052 |
Financial Treasury Bonds - LFT | Selic | - | - | 696 | 687 |
|
| 123,560 | 90 | 344,296 | 219,663 |
| Current | 123,560 | 90 | 124,862 | 1,341 |
| Noncurrent | - | - | 219,434 | 218,322 |
Interbank Deposit Certificate - CDI | |||||
Interest rate equivalent to the reference rate of the Special System for Settlement and Custody - Selic | |||||
(a) These are fixed income funds in the Parent Company and reserve accounts intended to comply with contracts withBNDES, in other companies. | |||||
38
![]()
Copel and its subsidiaries has securities that yield variable interest rates. The term of these securities ranges from 1 to 60 months from the end of the reporting period.
Consolidated | Balances | Overdue | Overdue for | Total | Total |
| falling due | up to 90 days | more than 90 days | 12.31.2018 | 12.31.2017 |
Customers |
|
|
|
|
|
Residential | 343,122 | 224,828 | 16,671 | 584,621 | 512,817 |
Industrial | 282,547 | 40,763 | 85,786 | 409,096 | 368,054 |
Commercial | 284,733 | 64,786 | 29,930 | 379,449 | 340,520 |
Rural | 64,804 | 20,498 | 4,332 | 89,634 | 80,531 |
Public Entities | 43,038 | 9,028 | 4,854 | 56,920 | 55,826 |
Public lighting | 39,095 | 19 | - | 39,114 | 37,684 |
Public service | 41,211 | 1,046 | 445 | 42,702 | 39,780 |
Unbilled | 538,245 | - | - | 538,245 | 471,421 |
Energy installments plan (7.1) | 137,866 | 15,129 | 44,956 | 197,951 | 190,261 |
Low income subsidy - Eletrobras | 11,958 | - | - | 11,958 | 14,435 |
Other receivables | 41,725 | 23,768 | 72,623 | 138,116 | 157,611 |
1,828,344 | 399,865 | 259,597 | 2,487,806 | 2,268,940 | |
Concessionaires and Permission holder |
|
|
|
|
|
Energy supplies |
|
|
|
|
|
Energy purchase agreements in the |
|
|
|
|
|
regulated market - CCEAR | 4,590 | 788 | 5,504 | 10,882 | 61,838 |
Bilateral contracts | 94,162 | - | 7,432 | 101,594 | 68,111 |
CCEE (7.2) | 132,801 | - | 190,856 | 323,657 | 442,541 |
Unbilled | 137,076 | - | - | 137,076 | 183,765 |
Quota system and Reimbursement to generators | - | 740 | 2,254 | 2,994 | 1,331 |
368,629 | 1,528 | 206,046 | 576,203 | 757,586 | |
Charges from using transmission grid | 191,879 | 8,305 | 7,876 | 208,060 | 162,020 |
. |
|
|
| - |
|
Telecommunications | 43,499 | 13,190 | 6,296 | 62,985 | 65,769 |
. |
|
|
| - |
|
Gas distribution | 87,754 | 5,074 | 10,512 | 103,340 | 49,837 |
. |
|
|
| - |
|
Expected credit losses (7.3) | (2,886) | (10,732) | (317,770) | (331,388) | (309,830) |
| 2,517,219 | 417,230 | 172,557 | 3,107,006 | 2,994,322 |
Current |
|
|
| 2,944,091 | 2,733,240 |
Noncurrent |
|
|
| 162,915 | 261,082 |
7.1 Energy installments plan
The trade accounts receivable renegotiated are discounted to present value taking into consideration the future value, the maturity dates, the dates of settlement and the discount rate ranging from 0.0028% to 2.1450% p.m.
7.2 Electricity Trading Chamber - CCEE
From the total balance, the most significant amounts are: (i) R$ 54,873 of Copel DIS, fully received to the date of this publication; (ii) R$ 57,930 of Wind Farms, of which R$ 8,606 were already received or offset and the remaining balance is expected to be received or offset with CCEE upcoming settlements; and (iii) R$ 201,252 of Copel GeT, of which R$ 42,023 was received and the balance is also expected to be received or offset with the upcoming CCEE settlements.
39
![]()
From this amount of GeT, R$ 190,856 is the remainder of the R$ 231,617 balance derived from the reprocessing by CCEE of the energy measured at the PLD amount for the period from January to October 2015. This was the result of the favorable outcome on the filing of application for preliminary injunction in the ordinary lawsuit for exclusion of responsibility in energy delivery to comply with the trading contracts of HPP Colíder (Note 18.4). During this period Copel GeT complied with its commitment with energy surpluses not contracted in its other plants.
From the amount of R$ 201,252 calculated by CCEE, based on the PLD amount, arising from the effects of the injunction to exclude the responsibility of Colíder HPP, there is an expected credit losses of R$ 119,665. The remaining balance of R$ 81,585 refers to the right that we are certain to receive for the energy supply, regardless of any litigation, measured at the price of the trading agreements.
Also, regarding the exclusion of responsibility of Colíder HPP, there is an additional amount of R$ 43,844 related to the same energy supply, measured at the PLD amount, which was not recognized due to the uncertainty on the related lawsuit merit judgment.
7.3 Expected credit losses
As from January 1, 2018, expected credit losses are recorded based on the analysis of the risks of realization of the credits in an amount considered sufficient to cover expected losses on the realization of the trade accounts receivable, considering specific criteria of the payment history, the collection actions performed for the recovery of the credit and the materiality of the amounts due in the receivables portfolio.
The Company considers the provision for expected credit losses of trade accounts receivable sufficient to cover possible losses on the realization of these assets, according to the breakdown below:
Consolidated | Balance as of | Additions / | Reversal | Balance as of | Effects of applying | Additions / | Reversal | Balance as of |
| January 1, 2017 | (reversals) | of write offs | December 31, 2017 | new CPC/IFRS | (reversals) | of write offs | December 31, 2018 |
Customers |
|
|
|
|
|
|
|
|
Residential | 66,502 | 36,177 | (80,147) | 22,532 | (5,708) | 62,274 | (57,376) | 21,722 |
Industrial | 66,563 | 26,265 | (14,049) | 78,779 | 4,394 | 10,367 | (6,343) | 87,197 |
Commercial | 67,075 | 18,101 | (25,901) | 59,275 | 16,973 | 10,318 | (16,849) | 69,717 |
Rural | 3,130 | 2,997 | (3,396) | 2,731 | 1,646 | 3,734 | (4,301) | 3,810 |
Public Entities | 12,981 | (3,833) | (4,313) | 4,835 | 3,262 | (1,313) | (1,910) | 4,874 |
Public lighting | 104 | 205 | (269) | 40 | 389 | (304) | (5) | 120 |
Public service | 1,111 | (653) | (439) | 19 | 460 | 8 | (288) | 199 |
Unbilled |
|
|
| - | 1,573 | (71) | - | 1,502 |
Adjustment to present value |
|
|
| - | (4,048) | 1,165 | - | (2,883) |
217,466 | 79,259 | (128,514) | 168,211 | 18,941 | 86,178 | (87,072) | 186,258 | |
Concessionaries and permission holder |
|
|
|
|
|
|
|
|
CCEE (7.2) | 119,665 | - | - | 119,665 | - | - | - | 119,665 |
Concessionaries and permission holder | 13,077 | 1,287 | (175) | 14,189 | 4,155 | (8,860) | (10) | 9,474 |
132,742 | 1,287 | (175) | 133,854 | 4,155 | (8,860) | (10) | 129,139 | |
Telecommunications | 534 | 8,309 | (7,332) | 1,511 | (1,233) | 12,749 | (9,148) | 3,879 |
Gas distribution | 4,924 | 1,433 | (103) | 6,254 | - | 6,017 | (159) | 12,112 |
| 355,666 | 90,288 | (136,124) | 309,830 | 21,863 | 96,084 | (96,389) | 331,388 |
Trade accounts receivable are written off when there is no reasonable expectation of recovery. Indications for this include, among other things, the inability of the debtor to participate in a plan to renegotiate its debt with the Company or to make contractual payments of overdue debts.
40
![]()
Expected credit losses are presented in selling expenses, in the group of Credit losses, provisions and reversals. Subsequent recoveries of amounts previously written off are also credited to selling expenses in the Other net operating costs and expenses.
8 CRC Transferred to the Paraná State Government
By means of a fourth amendment dated January 21, 2005, the Company renegotiated with the State of Paraná the outstanding CRC (Account for Compensation of Income and Losses) balance as of December 31, 2004, in the amount of R$ 1,197,404. This receivable is to be paid by the State of Paraná in 244 installments under the Price amortization system, adjusted according to the IGP-DI inflation index plus interest of 6.65% p.a., which are received monthly, with the first installment due on January 30, 2005 and the others due in subsequent and consecutive months.
The Paraná State Government requested the Novation of the Adjustment Term of CRC, which was approved by the Company’s Board of Directors on June 16, 2016, subject to the consent of the Ministry of Finance of the following: (i) no principal and interest payments in the period from April to December 2016, and (ii) no payment of principal and monthly payments of interest from January to December 2017. The other clauses were maintained, including the maintenance of the current restatement and interest indexes, thus not affecting the global net present value of the referred agreement.
The Company’s Management and the State of Paraná formalized on October 31, 2017 the fifth amendment.
The State of Paraná complied with the agreed terms and made the payments of the monthly interest until December 2017. With the end of the grace period, the State of Paraná has strictly complied with the payments under the agreed terms, there remaining 76 monthly installments to be paid.
8.1 Changes in CRC
Balance as of |
| Monetary |
| Balance as of |
| Monetary |
| Balance as of |
January 1, 2017 | Interest | variations | Amortizations | December 31, 2017 | Interest | variations | Amortizations | December 31, 2018 |
1,522,735 | 97,085 | (6,373) | (97,085) | 1,516,362 | 93,009 | 95,788 | (260,117) | 1,445,042 |
Current |
|
|
| 167,109 |
|
|
| 190,876 |
Noncurrent |
|
|
| 1,349,253 |
|
|
| 1,254,166 |
8.2 Maturity of non-current installments
2020 | 203,570 |
2021 | 217,108 |
2022 | 231,547 |
2023 | 246,946 |
2024 | 263,369 |
After 2024 | 91,626 |
| 1,254,166 |
41
![]()
9 Net Sectorial Financial Assets and Liabilities
The Net Sectorial Financial Assets and Liabilities are compounded of the values of: a) Compensation Account of Changes in Values and Portion A - CVA, composed of the variation between the expected and realized costs of electric power, power transmission and sector charges, and b) financial items, which correspond to over-contracting of energy, neutrality of charges and other tariff rights and obligations. After the homologation of the Annual Tariff Adjustment and Periodic Tariff Review, the new tariff applied for the tariff year allows the collection or return of the assets / liabilities constituted.
Thus, the balance as of December 31, 2018 is composed of: i) the previous cycle (2018 tariff adjustment), under amortization, which represents the balance approved by ANEEL already reflected in the tariff, and ii) by the cycle under constitution (2019 tariff adjustment and 2021 periodic tariff revision), whose values will be ratified by ANEEL in the next tariff events.
9.1 Composition of net sectorial financial assets and liabilities balances per tariff cycle
Consolidated |
| 12.31.2018 |
| 12.31.2017 |
| Current | Noncurrent | Current | Noncurrent |
Sectorial financial assets - Electricity rate adjustment recoverable 2018 |
|
|
|
|
Portion A |
|
|
|
|
Electricity purchased for resale - CVA Energ | 274,495 | - | 333,412 | 333,412 |
Electricity purchased for resale - Itaipu | 278,072 | - | 250,851 | 250,851 |
Transport of energy using the transmission system - basic grid | 28,100 | - | 18,056 | 18,056 |
Transport of energy purchased from Itaipu | 8,312 | - | 5,063 | 5,063 |
System Service Charges - ESS | (240,248) | - | (211,735) | (211,735) |
Energy Development Account - CDE | 16,434 | - | (28,800) | (28,800) |
Proinfa | 3,007 | - | (33) | (33) |
Other financial components |
|
|
|
|
Neutrality | 42,605 | - | 33,319 | 33,319 |
Overcontracting | (46,972) | - | (112,137) | (112,137) |
Hydrological risk | (175,117) | - | (93,964) | (93,964) |
Tariff refunds | (36,840) | - | (21,302) | (21,302) |
CVA Angra III Adjustment | 6,272 | - | (1,121) | (1,121) |
Other | 5,429 | - | - | - |
163,549 | - | 171,609 | 171,609 | |
Sectorial financial assets - Electricity rate adjustment recoverable 2019 |
|
|
|
|
Portion A |
|
|
|
|
Electricity purchased for resale - CVA Energ | 176,198 | 176,198 | - | - |
Electricity purchased for resale - Itaipu | 304,085 | 304,086 | - | - |
Transport of energy using the transmission system - basic grid | (29,307) | (29,307) | - | - |
Transport of energy purchased from Itaipu | 7,469 | 7,469 | - | - |
System Service Charges - ESS | (120,862) | (120,862) | - | - |
Energy Development Account - CDE | 71,325 | 71,325 | - | - |
Proinfa | (9) | (9) | - | - |
Other financial components | - | - | - | - |
Neutrality | 40,212 | 40,211 | - | - |
Overcontracting | (95,722) | (95,722) | - | - |
Hydrological risk | (71,958) | (71,958) | - | - |
Tariff refunds | (23,796) | (23,796) | - | - |
257,635 | 257,635 | - | - | |
| 421,184 | 257,635 | 171,609 | 171,609 |
42
![]()
Consolidated |
| 12.31.2018 |
| 12.31.2017 |
| Current | Noncurrent | Current | Noncurrent |
Sectorial financial liabilities - Electricity rate adjustment recoverable 2017 |
|
|
|
|
Portion A |
|
|
|
|
Electricity purchased for resale - CVA Energ | - | - | (168,939) | - |
ESS | - | - | (167,938) | - |
CDE | - | - | (84,293) | - |
Proinfa | - | - | (5,122) | - |
Electricity purchased for resale - Itaipu | - | - | 36,002 | - |
Transport of energy using the transmission system - basic grid | - | - | 11,127 | - |
Transport of energy purchased from Itaipu | - | - | 2,797 | - |
Other financial components |
|
|
|
|
Tariff refunds | - | - | (12,470) | - |
Overcontracting | - | - | 87,949 | - |
Neutrality | - | - | 54,609 | - |
CVA Angra III Adjustment | - | - | 50,435 | - |
Other | - | - | 3,024 | - |
- | - | (192,819) | - | |
Sectorial financial liabilities - Tariff Review 2021 |
|
|
|
|
Financial components |
|
|
|
|
Tariff refunds | - | (96,531) | - | (90,700) |
- | (96,531) | - | (90,700) | |
| - | (96,531) | (192,819) | (90,700) |
9.2 Changes in net sectorial financial assets and liabilities
Consolidated |
| Operating revenues | Financial results |
|
| |
Balance as of | Rate | Balance as of | ||||
| December 31, 2017 | Constitution | Amortization | Updating | flags | December 31, 2018 |
Portion A |
|
|
|
|
|
|
Electricity purchased for resale - Itaipu (9.2.1) | 537,704 | 661,144 | (348,586) | 35,981 | - | 886,243 |
Electricity purchased for resale - CVA Energ (9.2.2) | 497,885 | 710,482 | (129,555) | 31,053 | (482,974) | 626,891 |
Transport of energy using the transmission system - basic grid | 47,239 | (36,959) | (43,101) | 2,307 | - | (30,514) |
Transport of energy purchased from Itaipu | 12,923 | 21,526 | (12,194) | 995 | - | 23,250 |
ESS (9.2.3) | (591,408) | (302,226) | 443,817 | (32,155) | - | (481,972) |
CDE (9.2.4) | (141,893) | 231,308 | 69,851 | (182) | - | 159,084 |
Proinfa | (5,188) | 6,111 | 2,024 | 42 | - | 2,989 |
Other financial components |
|
|
|
|
|
|
Neutrality (9.2.5) | 121,247 | 100,280 | (100,661) | 2,162 | - | 123,028 |
CVA Angra III Adjustment | 48,193 | 8,482 | (57,214) | 6,811 | - | 6,272 |
Hydrological risk (9.2.6) | (187,928) | (310,975) | 189,289 | (9,419) | - | (319,033) |
Tariff refunds (9.2.7) | (145,774) | (80,493) | 52,290 | (6,986) | - | (180,963) |
Overcontracting (9.2.8) | (136,325) | (54,421) | (37,176) | (10,494) | - | (238,416) |
Others | 3,024 | 11,193 | (8,892) | 104 | - | 5,429 |
| 59,699 | 965,452 | 19,892 | 20,219 | (482,974) | 582,288 |
Current assets | 171,609 |
|
|
|
| 421,184 |
Noncurrent assets | 171,609 | 257,635 | ||||
Current liabilities | (192,819) | - | ||||
Noncurrent liabilities | (90,700) |
|
|
|
| (96,531) |
43
![]()
Consolidated |
| Operating revenues | Financial results |
|
| |
Balance as of | Rate | Balance as of | ||||
| January 1, 2017 | Constitution | Amortization | Updating | flags | December 31, 2017 |
Portion A |
|
|
|
|
|
|
Electricity purchased for resale - Itaipu (9.2.1) | 424,085 | 495,889 | (420,054) | 37,784 | - | 537,704 |
Electricity purchased for resale - CVA Energ (9.2.2) | (536,125) | 937,324 | 517,751 | (1,845) | (419,220) | 497,885 |
Transport of energy using the transmission system - basic grid | 8,411 | 50,426 | (12,275) | 677 | - | 47,239 |
Transport of energy purchased from Itaipu | 7,703 | 11,067 | (7,155) | 1,308 | - | 12,923 |
ESS (9.2.3) | (273,418) | (529,932) | 262,568 | (50,626) | - | (591,408) |
CDE (9.2.4) | 70,611 | (158,514) | (60,149) | 6,159 | - | (141,893) |
Proinfa | 17,293 | (14,677) | (10,423) | 2,619 | - | (5,188) |
Other financial components |
|
|
|
|
|
|
Neutrality (9.2.5) | 190,976 | 28,694 | (99,593) | 1,170 | - | 121,247 |
CVA Angra III Adjustment | - | 97,426 | (54,516) | 5,283 | - | 48,193 |
Hydrological risk (9.2.6) | - | (183,728) | - | (4,200) | - | (187,928) |
Tariff refunds (9.2.7) | (71,244) | (78,254) | 13,479 | (9,755) | - | (145,774) |
Overcontracting (9.2.8) | 156,170 | (203,797) | (90,272) | 1,574 | - | (136,325) |
Extraordinary Tariff Review | (257,353) | - | 257,353 | - | - | - |
Financial exposure | (16,250) | - | 16,250 | - | - | - |
Others | 149 | 5,570 | (3,418) | 723 | - | 3,024 |
| (278,992) | 457,494 | 309,546 | (9,129) | (419,220) | 59,699 |
Current assets | - |
|
|
|
| 171,609 |
Noncurrent assets | - | 171,609 | ||||
Current liabilities | (155,261) | (192,819) | ||||
Noncurrent liabilities | (123,731) |
|
|
|
| (90,700) |
9.2.1 Electricity purchased for resale - Itaipu
The power output from the Itaipu hydroelectric power plant is sold as quotas to utility companies in the South, Southeast and Midwest Brazilian regions in proportion to their markets, whose value is set in dollars per kilowatt of contracted monthly power (USD/kW). The invoices are paid in Brazilian currency and are used for currency conversion, the average USD sales rate calculated by the Central Bank of Brazil, on the business day immediately prior to the payment of the invoice.
The amount constituted in 2018 refers to the change in the power purchase cost and foreign exchange difference, in relation to that predicted in the last tariff adjustment, where the Itaipu HPP transfer tariff for 2018 was USD 27.87/kW (Resolution 2,363/2017). The dollar used in monthly payments was higher than the tariff coverage, thus generating a sectorial financial asset, which will be reversed in the next tariff adjustment in June 2019.
9.2.2 Electricity purchased for resale – CVA Energy
The balance constituted reflects the difference between the average price of payment related to the cost of energy purchased and the average price of tariff coverage, mainly due to the effects of contracting by availability (ECD) - associated with the dispatch of thermal plants and generation of wind farms and the transfer of the hydrological risk associated with the plants committed to Contracts of Quotas of Assured Power - CCGF, as well as the enterprises that signed the renegotiation term.
The CVA Energy account was offset by funds received from the Rate Tier Pooling Account (CCRBT) or Tariff Flags Account, which in the year resulted in the deduction of R$ 482,974 from the cost of energy.
44
![]()
9.2.3 System Service Charges - ESS
The objective of the ESS is to cover the cost of maintaining the reliability and stability of the electrical system. Its calculation is performed monthly by CCEE and paid by the distributor and by generation agents. The ESS liability balance set up in 2018 is the result of the lower amount paid in relation to the amount included in the tariff, mainly due to the variation of the costs related to the dispatch of thermal plants.
9.2.4 Energy Development Account - CDE
The balance of the CDE in 2018 is the result of the higher amount of monthly payment quotas, except in this case the CDE discounts resulting from preliminary injunctions, ratified by ANEEL (Note 31.2.1), in relation to the regulatory quota in the electricity tariff.
9.2.5 Neutrality
Portion A's neutrality corresponds to the estimate of the recoverable portion of the sector charges, energy, transportation, financial components and unrecoverable revenues, not billed by the current, and should be understood as the guarantee of transfer to consumers of all the components over which the distributor has no managing power.
9.2.6 Hydrological risk
In the tariff adjustment of 2018, there was calculation of the coverage of the hydrological risks associated with plants committed to Contract of Quotas of Assured Power - CCGF, of the Itaipu plant and of the hydroelectric power plants whose energy was contracted within the Regulated Contracting Environment - ACR and that signed the Risk Renegotiation Term in conformity with Law No. 13,203/2015. The estimated hydrological risk defined in the tariff adjustment will be reversed in the subsequent tariff adjustment, adjusted by the Selic rate.
9.2.7 Tariff refunds
ANEEL, by means of Order No. 245 of January 28, 2016, in line with the Tariff Regulation Procedures - Proret, sub-module 2.1 - General Procedures, determined that the amounts resulting from excess demand and surplus of reagents previously recorded as special obligations should be recorded as sector financial liabilities.
9.2.8 Overcontracting
ANEEL, though the Normative Resolution 255/2007, established the criteria for transfer to the final consumer's tariffs. For the calculation of the transfer of energy overcontracting or exposure to the short-term market, it is necessary to calculate the results in the short-term market of the distributor with data made available by CCEE. The Company closed the 2018 year within the regulatory limits of 100% to 105% contracting, thus ensuring the integral transfer of overcontracting.
45
![]()
10 Accounts Receivable - Concessions
Consolidated | 12.31.2018 | 12.31.2017 |
Power distribution service concession (10.1) | 783,023 | 684,206 |
Piped gas distribution service concession (10.2) | 322,259 | 303,668 |
Bonus from the grant of concession agreements under the quota system (10.3) | 625,772 | 606,479 |
Power transmission concession (10.4) | - | 1,497,399 |
Remeasurement of RBSE assets (10.5) | 753,826 | 1,418,370 |
Generation concession agreements (10.6) | 65,811 | 68,859 |
| 2,550,691 | 4,578,981 |
Current | 53,177 | 149,744 |
Noncurrent | 2,497,514 | 4,429,237 |
10.1 Power distribution service concession
Balance as of January 1, 2017 | 614,806 |
Donations and grants received | 76 |
Transfers from intangible assets (Note 19.1) | 56,853 |
Transfers to other receivables (assets held for disposal) | (3,711) |
Fair value recognition | 16,199 |
Loss on disposal | (17) |
Balance as of December 31, 2017 | 684,206 |
Transfers from contract assets (Note 11.1) | 66,380 |
Transfers to other receivables (assets held for disposal) | (1,334) |
Fair value recognition | 35,306 |
Loss on disposal | (1,535) |
Balance as of December 31, 2018 | 783,023 |
The distribution concession agreement amount is measured at fair value and its collection is assured by the Concession Grantor through an indemnity upon the return of these assets at the end of the concession period.
10.2 Piped gas distribution service concession
Balance as of January 1, 2017 | 83,378 |
Reclassifications from intangible assets (Note 2.1.1) | 154,800 |
Transfers from intangible assets (Note 19.3) | 24,609 |
Fair value recognition | 40,881 |
Balance as of December 31, 2017 | 303,668 |
Transfers from contract assets (Note 11.2) | 6,399 |
Fair value recognition | 12,193 |
Loss on disposal | (1) |
Balance as of December 31, 2018 | 322,259 |
46
![]()
10.3 Bonus from the grant of concession agreements under the quota system
Balance as of January 1, 2017 | 586,706 |
Transfers to electricity grid use charges - customers | (62,387) |
Interest (Note 31) | 82,160 |
Balance as of December 31, 2017 | 606,479 |
Transfers to electricity grid use charges - customers | (66,693) |
Interest (Note 31) | 85,986 |
Balance as of December 31, 2018 | 625,772 |
On January 5, 2016, Copel GeT entered into a 30-year concession agreement of HPP GPS, in accordance with Law No. 12,783/2013, with payment of the Bonus from the Grant - BO to the Concession Grantor, amounting to R$ 574,827, as per ANEEL Invitation to Bid 12/2015.
The electric energy in 2016 was fully sold to the Regulated Contracting Environment - ACR under the Assured Power Quota System - CGF or “quota regime” and, as from 2017 to the end of the concession, in the proportion of 70% of the power in the ACR and 30% in the free environment - ACL.
The amount of the bonus for the grant was recognized as a financial asset due to the Copel GeT’s unconditional right to receive the amount paid with inflation adjustment based on IPCA and interest during the concession period.
10.4 Power transmission concession
Balance as of January 1, 2017 | 1,342,055 |
Transfers to electricity grid use charges - customers | (81,497) |
Transfers to property, plant and equipment | (29,264) |
Remuneration | 129,769 |
Construction income | 136,336 |
Balance as of December 31, 2017 | 1,497,399 |
Transfers to contract assets (Note 11.3) | (1,497,399) |
Balance as of December 31, 2018 | - |
10.5 Remeasurement of RBSE assets
Balance as of January 1, 2017 | 1,186,985 |
Gain on remeasurement of the cash flow from the RBSE assets | 178,141 |
Increase in the estimated amount due to the approval of the report on RBSE assets | 183,015 |
Transfers to electricity grid use charges - customers | (129,771) |
Balance as of December 31, 2017 | 1,418,370 |
Transfers to contract assets (Note 11.3) | (635,292) |
Gain on the cash flow from the RBSE assets | 82,640 |
Transfers to electricity grid use charges - customers | (111,892) |
Balance as of December 31, 2018 | 753,826 |
Copel GeT extended the concession agreement 060/2001, pursuant to Law No. 12,783/2013, and recognized receivables related to the electricity transmission assets of the Existing Basic Network System (RBSE) and the connecting facilities and Other Transmission Facilities - RPC existing in May 2000 and not yet depreciated or amortized.
47
![]()
On April 20, 2016, MME Ordinance No. 120 was published, determining that the amounts of assets not yet depreciated and/or amortized shall comprise the Regulatory Remuneration Base (BRR) for electricity transmission concession operators as of the 2017 tariff review process, in order to define the Annual Permitted Revenue (RAP). The Ordinance addressed issues related to updating, remuneration and period for receiving the amounts, which are regulated by ANEEL Normative Resolution No. 762/2017, by means of Public Hearing 068/2016.
On April 12, 2017, ANEEL issued Technical Note No. 61/2017 - SFF, which concluded the audit of the assets appraisal report and recognized the amount of R$ 667,637 as the net value of the assets at December 31, 2012. ANEEL’s board approved the inspection results on May 9, 2017, with no recognition of R$ 214,663 in relation to the amount originally requested of R$ 882,300, considering that the main disallowance is related to assets of Substation SF6 of Salto Caxias.
Moreover, on June 27, 2017 ANEEL published Resolution No. 2,258 establishing the Annual Permitted Revenue (RAP), for the 2017/2018 tariff cycle, considering a court decision on the injunction of April 11, 2017 related to a lawsuit filed by three business associations, which determines the deduction of the “compensation”, provided for in article 15, paragraph 2 of Law 12,783/2013. The same decision was applied for the current 2018-2019 cycle, according to ANEEL Resolution 2,408 of June 26, 2018.
The compensation being challenged in court related to the cost of equity calculated for the RBSE assets from January 2013 to June 2017, temporarily reduced the RAP of this cycle from R$ 136,790 to R$ 102,514, and the amount deducted from the RAP by ANEEL in the eight tariff cycles is R$ 201,795.
Based on the opinion of its legal counsel, Copel GeT understands that this is a provisional decision and is not against Copel GeT’s right to receive the amounts related to RSBE assets, which are guaranteed by Law. Therefore, the receivables related to the compensation by the cost of equity considered in the receipt flow of this asset are recorded in non-current assets.
Until December 31, 2017, RBSE assets were classified as a financial asset under the scope of CPC 38/IAS 39 and ICPC 01/IFRIC 12.
With the adoption of CPC 47/IFRS 15 on January 1, 2018, which brought the concept of the receivable right conditioned to the fulfillment of performance obligations to operate and maintain the infrastructure and not only over time, the Company changed the classification to contract assets for the part related to RBSE assets approved for receipt after the first RAP cycle that began in July 2017. As a result, the balance as of January 1, 2018 is now classified as contract assets along with the other power transmission concession agreements (Note 11.3), with no effect on their measurement.
The part of RAP restated by the Concession Grantor, for the period from January 2013 to June 2017, approved for receipt in 8 years from the cycle that began in July 2017 was maintained with the classification of financial asset due to the unconditional right to receive the amount paid with updating by the IPCA and remuneration interest during the agreed period.
48
![]()
10.6 Power generation concession contract
Balance as of January 1, 2017 | 67,401 |
Gain on remeasurement of the cash flow | 341 |
Reversal of impairment (Note 32.4) | 1,117 |
Balance as of December 31, 2017 | 68,859 |
Transfers to other current receivables - disposal of assets | (9,053) |
Gain on remeasurement of the cash flow | 1,247 |
Reversal of impairment (Note 32.4) | 4,758 |
Balance as of December 31, 2018 | 65,811 |
The balance refers to generation assets and as a result of the expiration of the GPS and Mourão I HPP concessions. Copel GeT depreciated the plants up to the expiration dates of the concessions, and the remaining balance was reclassified to Accounts Receivable Related to Concession Compensation. Although the Concession Grantor has not yet disclosed the means of remunerating these assets and there are uncertainties as to the approval of the investments made, Management believes that compensation for these assets indicates the recoverability of the recorded balance, based on the compensation methodology determined by ANEEL.
The variation in the remeasurement of the cash flow from these assets has a corresponding entry in Other operating income, in Other operational income (expenses) group.
Copel GeT submitted to ANEEL, in a timely manner, its interest in receiving the indemnifiable amount. Proof of the investments made was formalized with the regulatory agency on December 17, 2015. The new replacement value methodology was used to prepare the information, as defined in ANEEL Normative Resolution No. 596/2013.
On December 11, 2018, the Company signed the contractual commitment for the purchase and sale of the remaining assets of the extinguished Rio dos Patos HPP, as recommended in ANEEL's Authorizing Resolution No. 7,050 of June 5, 2018.The negotiation price was R$ 9,053.
Consolidated | 12.31.2018 | 12.31.2017 |
Power distribution service concession (11.1) | 640,500 | - |
Piped gas distribution service concession (11.2) | 25,718 | - |
Power transmission concession (11.3) | 2,767,012 | - |
| 3,433,230 | - |
Current | 85,019 | - |
Noncurrent | 3,348,211 | - |
49
![]()
11.1 Power distribution service concession contract
Consolidated | Assets | Special liabilities | Total |
Balance as of December 31, 2017 | - | - | - |
Transfers from intangible assets (Note 19.1) | 714,446 | (26,100) | 688,346 |
Acquisitions | 797,832 | - | 797,832 |
Customers contributions | - | (106,764) | (106,764) |
Provision for legal claims added to the cost of the works | 4,320 | - | 4,320 |
Transfers to intangible assets (Note 19.1) | (775,701) | 107,679 | (668,022) |
Transfers to accounts receivable related to concession (Note 10.1) | (67,310) | 930 | (66,380) |
Loss on disposal | (8,832) | - | (8,832) |
Balance as of December 31, 2018 | 664,755 | (24,255) | 640,500 |
These assets consist of works in progress related mainly to the construction and expansion of substations, lines and distribution networks, measured at historical cost, net of the Special Obligations.
During the construction phase, the costs of borrowings and debentures are capitalized. In 2018 these costs totaled R$ 5,435 at the average rate of 0.26% p.a. (R$ 4,497 at the average rate of 0.25% p.a. in 2017, capitalized in intangible assets in progress).
Until 31.12.2017, they were classified as intangible assets under the scope of ICPC 01 / IFRIC 12. With the CPC 47/IFRS 15 adoption, on January 1, 2018 and the revision of ICPC 01/IFRIC 12, the Company became to classify the electricity distribution works during the construction period as contract assets. The adoption of this standard was made prospectively (Note 4.18.2).
11.2 Piped gas distribution service concession contract
Balance as of December 31, 2017 | - |
Transfers from intangible assets (Note 19.3) | 19,471 |
Acquisitions | 15,618 |
Transfers to intangible assets (Note 19.3) | (2,042) |
Transfers to accounts receivable related to concession (Note 10.2) | (6,399) |
Loss on disposal | (930) |
Em 31.12.2018 | 25,718 |
Until December 31, 2017, they were classified as intangible assets within the scope of ICPC 01/IFRIC 12. With the adoption of CPC 47/IFRS 15 on January 1, 2018 and the revision of ICPC 01/IFRIC 12, the Company began to classify the electricity distribution works during the construction period as contract assets, prospectively (Note 4.18.2).
50
![]()
11.3 Transmission service concession contract
Balance as of December 31, 2017 | - |
Transfers from accounts receivable related to concession (Note 10.4) | 1,497,399 |
Transfers from accounts receivable related to concession - RBSE (Note 10.5) | 635,292 |
Effect of acquisition of control of Costa Oeste and Marumbi | 258,908 |
Transfers to electricity grid use charges - customers | (243,247) |
Transfers to property, plant and equipment | (501) |
Transfers from judicial deposits and litigations | 8,277 |
Remuneration | 268,904 |
Construction income | 341,980 |
Balance as of December 31, 2018 | 2,767,012 |
Until December 31, 2017, electricity transmission concession agreements were classified as financial assets within the scope of CPC 38/IAS 39 and ICPC 01/IFRIC 12.
With the adoption of CPC 47/IFRS 15 on January 1, 2018, which brought the concept of the right to receive infrastructure built conditioned to the fulfillment of performance obligations to operate and maintain the infrastructure and not only by the passage of time, the Company changed the classification of electricity transmission concession agreements in accordance with the new standard. The balance started being classified as contract assets, with no effect on its measurement as from January 1, 2018, prospectively (Note 4.18.2).
. |
| Parent Company |
| Consolidated |
| 12.31.2018 | 12.31.2017 | 12.31.2018 | 12.31.2017 |
Services in progress (a) | 7,444 | 7,444 | 165,973 | 141,959 |
Credits on purchases of gas (12.1) | - | - | 112,003 | 77,279 |
CDE Transfer (12.2) | - | - | 107,472 | 136,559 |
Tariff flag - CCRTB | - | - | 28,725 | 14,536 |
Advance payments to suppliers (b) | 319 | - | 22,096 | 29,016 |
Advance payments to employees | 453 | 660 | 21,201 | 25,928 |
Advance for severance estate | - | - | 19,591 | 19,230 |
Decommissioning in progress | - | - | 19,457 | 53,348 |
Fair value in the purchase and sale of power in the active market (Note 35.2.12) | - | - | 14,793 | - |
Other receivables | 6,255 | 183 | 80,833 | 60,912 |
14,471 | 8,287 | 592,144 | 558,767 | |
Current | 7,027 | 8,287 | 363,250 | 409,351 |
Noncurrent | 7,444 | - | 228,894 | 149,416 |
CCRTB - Centralizing account of Tariff Flag Resources. | ||||
(a) This item refers to services currently in progress within the Company, most of which are related to the Research andDevelopment and Energy Efficiency programs, which upon conclusion are offset against the respective liability recorded forthis purpose. | ||||
(b) Advances to suppliers provided on contractual clauses. | ||||
51
![]()
12.1 Credits on purchases of gas - Compagás
This balance refers to the gas acquisition of contracted and guaranteed volumes, higher than those actually withdrawn and used, and contains a future compensation clause. Compagás has the right to use the gas in subsequent months, and can compensate the volume contracted and not consumed until 2022. According to the contractual provisions and consumption perspectives, derived from the review of the projects and scenarios for the next years, Compagás estimates to fully offset the contracted volumes in the course of its operation. The contracts with Petrobras provide for the right to dispose of this asset. The expiration date of the concession is in discussion with the Concession Grantor, as described in Note 2.1.1.
12.2 CDE Transfer
Balance to be transferred by the CDE referring to tariff discounts on the tariffs applicable to users defined in accordance with art. 13, item VII, of Law 10,438/2002 and Decree No. 7,891/2013. The amount transferred to Copel DIS for the period from June 2017 to May 2018, in accordance with Resolution No. 2,255/2017, was R$ 49,304 per month. As from June 2018, this amount was changed to R$ 62,699 per month, by Ratifying Resolution No. 2,402, dated 6/19/2018, which approved the result of the last Annual Tariff Adjustment.
13.1 Income tax and social contribution
The taxation on profit comprises income tax and social contribution calculated based on the taxable profits (adjusted profit) of each taxable entity at the applicable tax rates according to prevailing legislation, namely, at 15%, plus 10% surtax on the amount exceeding R$ 240 per year, for income tax and at 9% for social contribution.
Income tax and social contribution losses can be offset against future taxable profits, considering the limit of 30% of the taxable profit for the period, and can be carried forward indefinitely.
13.2 Deferred income tax and social contribution
The Company, based on its profitability history and the expectation of generating future taxable profits, based on its internal projections prepared for reasonable periods for its business, sets up a deferred tax asset on temporary differences between the tax bases.
The deferred income tax and social contribution are recognized on temporary differences between the carrying amounts of assets and liabilities in the financial statements and the corresponding tax bases used for tax calculation purposes, to the extent that it is probable that there will be sufficient taxable profits against which the temporary differences can be utilized and the tax losses can be offset.
Deferred tax assets and liabilities may be offset if there is a legal right to offset the current tax assets and liabilities and they relate to the same taxing authority.
52
![]()
13.2.1 Changes in deferred income tax and social contribution
Parent Company |
|
| Recognized |
|
| Recognized |
|
|
| in other |
|
| in other |
| |
Balance as of | Recognized | comprehensive | Balance as of | Recognized | comprehensive | Balance as of | |
| January 1, 2017 | in income | income | December 31, 2017 | in income | income | December 31, 2018 |
Noncurrent assets |
|
|
|
|
|
|
|
Provisions for legal claims | 52,000 | 34,732 | - | 86,732 | 13,391 | - | 100,123 |
Amortization - concession | 19,299 | 381 | - | 19,680 | 383 | - | 20,063 |
Provision for financing | 3,457 | - | - | 3,457 | (2) | - | 3,455 |
Post-employment benefits | 1,222 | 159 | (7) | 1,374 | 169 | 139 | 1,682 |
Others | 22,694 | (7,475) | - | 15,219 | 35,955 | - | 51,174 |
98,672 | 27,797 | (7) | 126,462 | 49,896 | 139 | 176,497 | |
(-) Noncurrent liabilities |
|
|
|
|
|
|
|
Escrow deposits monetary variation | 24,699 | (6,350) | - | 18,349 | 3,910 | - | 22,259 |
Transaction cost on borrowings and debentures | 1,715 | 1,900 | - | 3,615 | 726 | - | 4,341 |
Financial instruments | 7,079 | (3,963) | (854) | 2,262 | 267 | - | 2,529 |
Result from the change in the |
|
|
|
|
|
|
|
investment valuation method | 17,717 | (17,717) | - | - | - | - | - |
| 51,210 | (26,130) | (854) | 24,226 | 4,903 | - | 29,129 |
Net | 47,462 | 53,927 | 847 | 102,236 | 44,993 | 139 | 147,368 |
Consolidated |
|
| Recognized |
|
| Effects | Business | Recognized |
|
Balance as of | Recognized | comprehensive | Balance as of | Recognized | of applying | combination | comprehensive | Balance as of | |
| January 1, 2017 | in income | income | December 31, 2017 | in income | new CPC/IFRS | effect | income | December 31, 2018 |
Noncurrent assets |
|
|
|
|
|
|
|
|
|
Provisions for legal claims | 438,538 | 75,820 | - | 514,358 | 55,123 | - | 3,696 | - | 573,177 |
Post-employment benefits | 260,068 | 16,716 | 16,827 | 293,611 | 15,080 | - | - | 19,994 | 328,685 |
Impairment of assets | 289,617 | 20,944 | - | 310,561 | 17,450 | - | - | - | 328,011 |
Research and development and energy efficiency programs | 142,279 | 14,046 | - | 156,325 | (1,834) | - | - | - | 154,491 |
Provision for energy purchases | 115,257 | 14,620 | - | 129,877 | 25,693 | - | - | - | 155,570 |
Expected credit losses | 129,638 | (16,258) | - | 113,380 | (6,838) | 7,468 | - | - | 114,010 |
Tax losses and negative tax basis | 51,113 | 59,545 | - | 110,658 | (39,518) | - | - | - | 71,140 |
Social security contributions - injunction on judicial deposit | 54,750 | 6,106 | - | 60,856 | 6,154 | - | - | - | 67,010 |
Amortization - concession | 44,131 | 4,591 | - | 48,722 | 4,617 | - | - | - | 53,339 |
Provision for tax losses | 23,176 | 739 | - | 23,915 | 11,518 | - | - | - | 35,433 |
Provision for profit sharing | 21,331 | 939 | - | 22,270 | 8,278 | - | - | - | 30,548 |
Concession contracts | 26,206 | (1,300) | - | 24,906 | (1,300) | - | - | - | 23,606 |
Financial instruments | 12,923 | 2,795 | - | 15,718 | (3,486) | - | - | - | 12,232 |
Others | 91,337 | (33,878) | - | 57,459 | 41,641 | 1,006 | - | - | 100,106 |
1,700,364 | 165,425 | 16,827 | 1,882,616 | 132,578 | 8,474 | 3,696 | 19,994 | 2,047,358 | |
(-) Noncurrent liabilities |
|
|
|
|
|
|
|
|
|
Concession contracts | 440,522 | 95,204 | - | 535,726 | 68,475 | - | 9,457 | - | 613,658 |
Deemed cost | 486,795 | (36,911) | - | 449,884 | (34,559) | - | - | - | 415,325 |
Escrow deposits monetary variation | 62,538 | (7,210) | - | 55,328 | 8,839 | - | - | - | 64,167 |
Transaction cost on borrowings and debentures | 9,642 | 11,896 | - | 21,538 | 9,589 | - | - | - | 31,127 |
Deferment of capital gains | 11,320 | - | - | 11,320 | - | - | - | - | 11,320 |
Capitalization of financial charges | 5,357 | - | - | 5,357 | (3,459) | - | - | - | 1,898 |
Others | 48,265 | (2,811) | (853) | 44,601 | 15,621 | - | - | - | 60,222 |
1,064,439 | 60,168 | (853) | 1,123,754 | 64,506 | - | 9,457 | - | 1,197,717 | |
Net | 635,925 | 105,257 | 17,680 | 758,862 | 68,072 | 8,474 | (5,761) | 19,994 | 849,641 |
Assets presented in the Statement of Financial Position | 814,355 |
|
| 915,492 |
|
|
|
| 1,007,061 |
(-) Liabilities presented in the Statement of Financial Position | (178,430) |
|
| (156,630) |
|
|
|
| (157,420) |
13.2.2 Realization of deferred taxes
The projection of deferred tax credits realization recorded in noncurrent assets and liabilities arising from temporary differences is based on the average realization period of each item of deferred assets and liabilities and tax losses, also based on projections of future results. These projections were evaluated by the Supervisory Board and approved by the Board of Directors on March 28, 2019. The breakdown of the main credits is as follows:
- Amounts recorded on provisions for post-employment benefits will be realized as the payments are made to the Copel Foundation or reversed according to new actuarial estimates;
- Amounts set up on the provisions for legal claims will be realized according to court decisions;
- Amounts set up on the provision for impairment of assets will be realized through the amortization and/or depreciation of the impaired asset;
- Amounts set up on the provision for purchase of energy will be realized in the immediately following period by the recording of the tax document of the purchase;
53
![]()
- Amounts set up on the provisions for R&D and PEE will be realized through the expenses incurred in the projects carried out;
- Amounts recorded on the deemed cost will be realized through the amortization and/or depreciation of the valued asset;
- Amounts related to the concession agreement will be realized over the term of the agreement;
- The other amounts set up will be realized according to the tax realization of each of the tax bases. On March 28, 2019, the Company’s Supervisory Board examined and the Board of Directors approved the technical study which points out to the realization of deferred taxes.
The projected realization of the deferred taxes is shown below:
|
|
|
|
|
. |
| Parent Company |
| Consolidated |
| Assets | Liabilities | Assets | Liabilities |
2019 | 39,521 | (1,446) | 528,769 | (82,554) |
2020 | 168 | (1,446) | 263,907 | (82,937) |
2021 | 168 | (1,446) | 164,724 | (83,423) |
2022 | 168 | - | 131,876 | (100,484) |
2023 | 168 | - | 103,979 | (68,853) |
2024 to 2026 | 504 | - | 216,854 | (188,881) |
2027 to 2029 | 135,800 | (24,791) | 637,249 | (590,585) |
| 176,497 | (29,129) | 2,047,358 | (1,197,717) |
13.2.3 Unrecognized tax credits
As of December 31, 2018, UEG Araucária did not recognize income tax and social contribution credits on income tax and social contribution tax losses in the amount of R$ 34.567 because at present there is no reasonable assurance of generation of future taxable profits sufficient to allow the utilization of these tax credits.
54
![]()
13.3 Other taxes recoverable and other tax obligations
. |
| Parent Company |
| Consolidated |
| 12.31.2018 | 12.31.2017 | 12.31.2018 | 12.31.2017 |
Current assets |
|
|
|
|
Recoverable ICMS (VAT) | - | 7 | 96,072 | 68,773 |
Recoverable PIS/Pasep and Cofins taxes | 321 | 269 | 64,200 | 128,888 |
Other recoverable taxes | - | - | 570 | 571 |
321 | 276 | 160,842 | 198,232 | |
Noncurrent assets |
|
|
|
|
Recoverable ICMS (VAT) | - | - | 50,306 | 36,740 |
PIS/Pasep and Cofins taxes | 86,097 | - | 147,380 | 46,858 |
Other recoverable taxes | 13 | 15 | 33,714 | 33,376 |
86,110 | 15 | 231,400 | 116,974 | |
Current liabilities |
|
|
|
|
ICMS (VAT) payable | - | 3 | 185,634 | 151,928 |
PIS/Pasep and Cofins payable | - | - | 115,345 | 17,632 |
IRRF on JSCP | - | - | 23,687 | 54,047 |
Special Tax Regularization Program - Pert (13.3.1) | - | - | 46,777 | 45,108 |
Ordinary financing of taxes with the federal tax authorities | - | - | 64,974 | 63,791 |
Other taxes | 152 | 473 | 15,016 | 12,981 |
152 | 476 | 451,433 | 345,487 | |
Noncurrent liabilities |
|
|
|
|
Social security contributions - injunction on judicial deposit | 2,602 | 2,365 | 197,413 | 179,373 |
Special Tax Regularization Program - Pert (13.3.1) | - | - | 471,665 | 488,563 |
Ordinary financing of taxes with the federal tax authorities | - | - | 21,658 | 85,054 |
TCFRH (a) | - | - | 101,821 | 53,349 |
Other taxes | - | - | 4,175 | 3,237 |
| 2,602 | 2,365 | 796,732 | 809,576 |
(a) Fee for Control, Monitoring and Inspection of Activities of Exploitation and Use of Water Resources - payment suspended due to injunction. | ||||
Sales and services revenues are subject to value-added tax (Imposto sobre Circulação de Mercadorias e Serviços or ICMS, in Portuguese) and service tax (Imposto sobre Serviços or ISS, in Portuguese), at the applicable rates, and to the PIS (Social Integration Program) and COFINS (Contribution for Social Security Funding).
Credits resulting from non-cumulative PIS and COFINS charges are accounted for as reductions to operating costs in the statement of income.
Credits arising from non-cumulative ICMS, PIS and COFINS related to the purchase of assets are presented as reductions to the acquisition cost of these assets.
Prepayments or amounts that can be offset are presented in current and non-current assets, according to their expected realization.
55
![]()
13.3.1 Special Regime for Tax Regularization (PERT)
Copel DIS joined PERT in 2017, considering the benefits offered by the program in the face of the change in the CVA tax regime, from a billing regime to an accrual basis. The payment of 20% of the debt occurred in 2017 and as of January 2018 the payment of the balance began in 145 monthly installments of R$ 3,572, adjusted by the Selic rate.
13.4 Reconciliation of provision for income tax (IRPJ) and social contribution (CSLL)
. |
| Parent Company |
| Consolidated |
| 12.31.2018 | 12.31.2017 | 12.31.2018 | 12.31.2017 |
Income before IRPJ and CSLL | 1,364,153 | 1,016,502 | 1,955,997 | 1,392,941 |
IRPJ and CSLL (34%) | (463,812) | (345,611) | (665,039) | (473,600) |
Tax effects on: |
|
|
|
|
Equity in income | 411,195 | 278,013 | 46,203 | 36,555 |
Interest on own capital | 95,200 | 90,440 | 98,917 | 90,440 |
Dividends | 280 | 497 | 280 | 497 |
Non deductible expenses | (30) | (5,533) | (9,322) | (26,292) |
Tax incentives | 68 | 178 | 16,465 | 14,973 |
Unrecognized income and social contribution tax loss carry-forwards | - | - | (15,383) | (5,645) |
Setting up and/or offset of income tax and social contribution losses of prior years | - | - | 5,037 | 90,804 |
Difference between the calculation bases of deemed profit and taxable profit | - | - | 11,076 | (19,680) |
Others | 9 | (860) | (227) | 17,262 |
Current IRPJ and CSLL | (2,083) | (36,803) | (580,065) | (379,943) |
Deferred IRPJ and CSLL | 44,993 | 53,927 | 68,072 | 105,257 |
Effective rate - % | -3.1% | -1.7% | 26.2% | 19.7% |
Consolidated | 12.31.2018 | 12.31.2017 |
Risk premium - GSF renegotiation (14.1) | 12,574 | 28,033 |
Others | 31,535 | 24,518 |
| 44,109 | 52,551 |
Current | 40,819 | 39,867 |
Noncurrent | 3,290 | 12,684 |
14.1 Hydrological risk renegotiation (GSF)
In accordance with Hydrological Risk Renegotiation Term and previously mentioned regulations, the companies acquired the right to partially recover the cost with MRE (GSF) in 2015, in the amount of R$ 33.55 per average MW of electricity for SP100 product class, based on the risk premium contracted by them (Note 4.9.2).
The amounts originally recognized on the renegotiation of the hydrological risk were as follows:
56
![]()
Power Plant | Physical guarantee | Eligible amount of energy (Average MW ) | Amortization period | Grant extension period | Asset value | Value of prepaid expenses to | Value of intangible assets amortization over the concession period |
Mauá | 100.827 | 97.391 | 01.01.2016 to 06.30.2020 | not applicable | 28,623 | 28,623 | - |
Foz do Areia | 576,000 | 226.705 | 01.01.2016 to 12.31.2016 | 05.24.2023 to 09.17.2023 | 66,628 | 17,222 | 49,406 |
Santa Clara and Fundão | 135,400 | 134.323 | 01.01.2016 to 04.22.2019 | 10.25.2036 to 05.28.2037 | 39,369 | 30,326 | 9,043 |
|
| 458.419 |
|
| 134,620 | 76,171 | 58,449 |
A breakdown of these items as at December 31, 2018 and 2017 is presented below:
Consolidated | Balance as of |
|
| Balance as of |
|
| Balance as of |
| January 1, 2017 | Amortization | Transfers | December 31, 2017 | Amortization | Transfers | December 31, 2018 |
Risk premium - current asset | 15,459 | (12,876) | 12,876 | 15,459 | (15,459) | 9,394 | 9,394 |
Risk premium - noncurrent asset | 25,450 | - | (12,876) | 12,574 | - | (9,394) | 3,180 |
Intangible | 53,186 | (7,441) | - | 45,745 | (7,038) | - | 38,707 |
| 94,095 | (20,317) | - | 73,778 | (22,497) | - | 51,281 |
Risk premium to be amortized - prepaid expenses | 40,909 |
|
| 28,033 |
|
| 12,574 |
Grant extension period - intangible | 53,186 |
|
| 45,745 |
|
| 38,707 |
15 Receivables from Related Parties
. |
| Parent Company |
| Consolidated |
| 12.31.2018 | 12.31.2017 | 12.31.2018 | 12.31.2017 |
Controlling shareholders |
|
|
|
|
State of Paraná (15.1) | - | 130,156 | - | 130,417 |
|
|
|
| |
Subsidiaries |
|
|
|
|
Copel DIS (15.2) | 104,751 | 89,270 | - | - |
Eólicas (15.3) | - | 221,327 | - | - |
Structure sharing | 8,134 | 27,273 | - | - |
Reimbursement of expenses | - | 5,215 | - | - |
|
|
|
| |
Joint Ventures |
|
|
|
|
Voltalia São Miguel do Gostoso (15.4) | - | 38,169 | - | 38,169 |
Structure sharing | - | 67 | - | 405 |
| 112,885 | 511,477 | - | 168,991 |
Current | 8,134 | 292,051 | - | 38,835 |
Noncurrent | 104,751 | 219,426 | - | 130,156 |
15.1 State of Paraná
15.1.1 “Luz Fraterna” (Fraternal Light in Portuguese) Program
The credit of R$ 115,890 related to “Luz Fraterna” Program as of December 31, 2017 was fully paid in March 2018. A lawsuit was filed on November 5, 2018 against the State of Paraná, responsible for the payment of the bills regarding interest, fines and inflation adjustments on the electricity bills for the period from September 2010 to June 2015 (Note 36.a).
57
![]()
15.1.2 2014 Construction Works for the World Cup
Regarding the credit related to the 2014 World Soccer Cup of R$ 14,266 (R$ 14,266 as of December 31, 2017), through the 2,119th Meeting held on July 28, 2014, Copel’s executive board approved the transfer of the credit rights of the costs related to mobility projects for the FIFA 2014 World Soccer Cup made by Copel DIS and under the responsibility of the Paraná State government. ANEEL agreed to the transaction through Order No. 3,483/2015 and a Credit Assignment Agreement that transfers Copel DIS rights to Copel was executed.
In addition, State Law No. 18,875, dated September 27, 2016, authorized the State of Paraná to pay debts due and unpaid to Copel relating to services rendered up to the date of publication of said Law.
After the issuance of said law, there were several administrative negotiations in order to settle this debt with the appropriate bodies. However, in view of the administrative procedures adopted at the time of such works and other documentary hindrances, Management reassessed the issue and decided to establish a provision for the event of non-receipt of this asset. Management stresses that it will continue making all necessary efforts and taking all appropriate measures to preserve the Company’s interests.
15.2 Copel DIS – Loan Transfer - STN
The Company transferred the loans and financing to its wholly-owned subsidiaries when it was established in 2001. However, since the transfer agreements for the subsidiaries were not formalized with financial institutions, these commitments are also recorded in the parent company.
The balance with Copel DIS refers to the financing of the National Treasury Secretariat (STN), transferred with the same incidence of charges assumed by the Company (Note 22) and presented as loan and financing obligations at Copel DIS.
15.3 Eólicas - Contratos de mútuo
On 21.08.2017, loan agreements were signed between Copel (lender) and wind farms (borrowers), with the approval of limits plus IOF and interest of 117% of CDI, in order to provide funds for financing activities and business. Of the approved limit value, of R $ 408,800, R $ 406,051 was used.The contracts were settled on November 30, 2018 and December 4, 2018.
| Approved |
| Financial income |
| Balance receivable |
Borrower | limit | 12.31.2018 | 12.31.2017 | 12.31.2018 | 12.31.2017 |
Usina de Energia Eólica Guajiru S.A. | 49,300 | 3,059 | 817 | - | 31,584 |
Usina de Energia Eólica Jangada S.A. | 88,800 | 5,666 | 517 | - | 31,078 |
Usina de Energia Eólica Potiguar S.A. | 91,400 | 5,894 | 1,626 | - | 73,702 |
Usina de Energia Eólica Cutia S.A. | 40,100 | 2,409 | 518 | - | 20,181 |
Usina de Energia Eólica Maria Helena S.A. | 102,800 | 6,619 | 1,345 | - | 61,963 |
Usina de Energia Eólica Esperança do Nordeste S.A. | 16,500 | 762 | 8 | - | 490 |
Usina de Energia Eólica Paraíso dos Ventos do Nordeste S.A. | 19,900 | 812 | 56 | - | 2,329 |
| 408,800 | 25,221 | 4,887 | - | 221,327 |
58
![]()
15.4 Voltalia São Miguel do Gostoso Participações S.A. – Loan agreements
On May 14, 2015, a loan agreement was entered into by and between Copel (lender) and Voltalia São Miguel do Gostoso Participações S.A. (borrower), aiming at providing working capital for funding the borrower’s activities and business. A limit of R$ 29,400 was established, plus IOF (tax on financial transactions) and interest of 111.5% of the CDI. Of the limit approved, the borrower used R$ 27,950. The initial term of two years was extended to February 6, 2018, the date on which the contract was settled, with finance income recorded in 2018 in the amount of R$ 294 (R$ 3,513 in 2017).
. |
| Parent Company |
| Consolidated |
| 12.31.2018 | 12.31.2017 | 12.31.2018 | 12.31.2017 |
Taxes claims | 131,791 | 119,156 | 369,423 | 337,909 |
Labor claims | 49 | 11 | 84,908 | 120,463 |
. | - | - | - | - |
Civil |
|
|
|
|
Civil | - | - | 63,484 | 110,495 |
Easements | - | - | 3,280 | 6,114 |
Customers | - | - | 1,861 | 2,522 |
- | - | 68,625 | 119,131 | |
. |
|
|
|
|
Others | - | - | 5,334 | 5,026 |
| 131,840 | 119,167 | 528,290 | 582,529 |
17.1 Changes in investments
Parent Company |
|
|
| Investment/ |
|
|
| Effects of |
|
|
|
| Equity | Advance for |
|
| Proposed | applying |
|
| |
Balance as of |
| valuation | future capital | Capital | Amorti- | dividends | new CPC/IFRS |
| Balance as of | |
| January 1, 2018 | Equity | adjustments | increase | decrease | zation | and JCP | (Note 4.18.3) | Other | December 31, 2018 |
Subsidiaries |
|
|
|
|
|
|
|
|
|
|
Copel GeT | 8,409,370 | 884,568 | (17,608) | 237,000 | - | - | (466,950) | (148,215) | 13,799 | 8,911,964 |
Copel DIS | 5,452,703 | 376,783 | (21,897) | 221,390 | - | - | (104,381) | (15,843) | - | 5,908,755 |
Copel TEL | 483,195 | 24,449 | 1,270 | 147,125 | - | - | (16,300) | (866) | - | 638,873 |
Copel REN | 28,579 | 33 | 137 | - | - | - | - | - | - | 28,749 |
Copel Energia | 133,511 | (4,838) | (305) | 100 | (45,000) | - | - | - | - | 83,468 |
UEG Araucária (17.2) | 89,240 | (15,171) | 63 | - | - | - | - | - | - | 74,132 |
Compagás (17.2) | 202,857 | 30,405 | 95 | - | - | - | (11,703) | - | - | 221,654 |
Elejor (17.2) | 43,208 | 53,432 | - | - | - | - | (58,855) | - | - | 37,785 |
Elejor - concession rights | 13,762 | - | - | - | - | (754) | - | - | - | 13,008 |
14,856,425 | 1,349,661 | (38,245) | 605,615 | (45,000) | (754) | (658,189) | (164,924) | 13,799 | 15,918,388 | |
Joint Ventures |
|
|
|
|
| - |
|
|
|
|
Voltalia São Miguel do Gostoso I (17.3) | 74,998 | (3,964) | - | 39,534 | - | - | - | - | - | 110,568 |
Voltalia São Miguel do Gostoso - authorization rights | 10,773 | - | - | - | - | (368) | - | - | - | 10,405 |
Paraná Gás | 3 | (3) | - | - | - | - | - | - | - | - |
85,774 | (3,967) | - | 39,534 | - | (368) | - | - | - | 120,973 | |
Associates |
|
|
|
|
|
|
|
|
|
|
Dona Francisca Energética (17.4) | 29,821 | 9,989 | - | - | - | - | (10,666) | - | - | 29,144 |
Foz do Chopim Energética (17.4) | 13,084 | 715 | - | - | - | - | - | - | (13,799) | - |
Other (a) | 2,503 | (23) | - | 9 | - | - | - | - | (427) | 2,062 |
45,408 | 10,681 | - | 9 | - | - | (10,666) | - | (14,226) | 31,206 | |
| 14,987,607 | 1,356,375 | (38,245) | 645,158 | (45,000) | (1,122) | (668,855) | (164,924) | (427) | 16,070,567 |
(a) R$ 427 from the sale of the associated company, Dois Saltos Empreendimentos de Geração de Energia Elétrica Ltda, in December 2018. | ||||||||||
59
![]()
Parent Company |
|
|
| Investment/ |
|
|
|
|
|
| Equity | Advance for |
| Proposed |
|
| |
Balance as of |
| valuation | future capital | Amorti- | dividends | Capital | Balance as of | |
| January 1, 2017 | Equity | adjustments | increase | zation | and JCP | decrease | December 31, 2017 |
Subsidiaries |
|
|
|
|
|
|
|
|
Copel GeT | 7,966,750 | 739,023 | (1,932) | 105,029 | - | (399,500) | - | 8,409,370 |
Copel DIS | 4,805,981 | 347,255 | (29,761) | 445,212 | - | (115,984) | - | 5,452,703 |
Copel TEL | 446,155 | 54,052 | (60) | - | - | (16,952) | - | 483,195 |
Copel REN | 28,778 | (2,268) | 2,069 | - | - | - | - | 28,579 |
Copel Energia | 269,870 | 13,041 | 247 | 24,070 | - | (3,717) | (170,000) | 133,511 |
UEG Araucária (17.2) | 89,314 | (74) | - | - | - | - | - | 89,240 |
Compagás (17.2) | 152,811 | 58,116 | (128) | - | - | (7,942) | - | 202,857 |
Elejor (17.2) | 55,790 | 67,354 | - | - | - | (79,936) | - | 43,208 |
Elejor - concession rights | 14,516 | - | - | - | (754) | - | - | 13,762 |
13,829,965 | 1,276,499 | (29,565) | 574,311 | (754) | (624,031) | (170,000) | 14,856,425 | |
Joint Ventures |
|
|
|
|
|
|
|
|
Voltalia São Miguel do Gostoso I (17.3) | 75,563 | (565) | - | - | - | - | - | 74,998 |
Voltalia São Miguel do Gostoso - authorization rights | 11,140 | - | - | - | (367) | - | - | 10,773 |
Paraná Gás | 37 | (34) | - | - | - | - | - | 3 |
86,740 | (599) | - | - | (367) | - | - | 85,774 | |
Associates |
|
|
|
|
|
|
|
|
Dona Francisca Energética (17.4) | 32,766 | 8,876 | - | - | - | (11,821) | - | 29,821 |
Foz do Chopim Energética (17.4) | 13,967 | 6,645 | - | - | - | (7,528) | - | 13,084 |
Other | 2,454 | 13 | - | 36 | - | - | - | 2,503 |
49,187 | 15,534 | - | 36 | - | (19,349) | - | 45,408 | |
| 13,965,892 | 1,291,434 | (29,565) | 574,347 | (1,121) | (643,380) | (170,000) | 14,987,607 |
Consolidated |
|
| Investment/ |
|
|
| Effects of |
|
|
|
| Advance for |
|
| Proposed | applying |
|
| |
Balance as of |
| future capital | Capital | Amorti- | dividends | new CPC/IFRS |
| Balance as of | |
| January 1, 2018 | Equity | increase | decrease | zation | and JCP | (Note 4.18.3) | Other (a) | December 31, 2018 |
Joint Ventures (17.3) |
|
|
|
|
|
|
|
|
|
Voltalia São Miguel do Gostoso I | 74,998 | (3,964) | 39,534 | - | - | - | - | - | 110,568 |
Voltalia São Miguel do Gostoso - authorization rights | 10,773 | - | - | - | (368) | - | - | - | 10,405 |
Paraná Gás | 3 | (3) | - | - | - | - | - | - | - |
Costa Oeste (Note 1.2) | 33,646 | 3,041 | - | - | - | - | - | (36,687) | - |
Marumbi (Note 1.2) | 85,341 | 6,971 | - | - | - | - | - | (92,312) | - |
Transmissora Sul Brasileira (Note 1.2) | 64,360 | 1,161 | - | - | - | - | - | (65,521) | - |
Caiuá | 56,037 | 5,034 | - | - | - | (1,324) | 14,892 | - | 74,639 |
Integração Maranhense | 113,401 | 9,238 | - | - | - | (2,022) | 9,067 | - | 129,684 |
Matrinchã | 835,819 | 50,411 | - | - | - | (9,131) | (203,883) | - | 673,216 |
Guaraciaba | 418,320 | 35,321 | - | - | - | (4,328) | (92,372) | - | 356,941 |
Paranaíba | 162,273 | (16,510) | - | - | - | (2,976) | 17,797 | - | 160,584 |
Mata de Santa Genebra | 459,374 | (2,541) | 48,096 | - | - | 3,264 | (23,931) | - | 484,262 |
Cantareira | 200,018 | 24,564 | - | (35,280) | - | (1,461) | 129,682 | - | 317,523 |
2,514,363 | 112,723 | 87,630 | (35,280) | (368) | (17,978) | (148,748) | (194,520) | 2,317,822 | |
Associates |
|
|
|
|
|
|
|
|
|
Dona Francisca Energética (17.4) | 29,821 | 9,989 | - | - | - | (10,666) | - | - | 29,144 |
Foz do Chopim Energética (17.4) | 13,084 | 13,214 | - | - | - | (18,071) | - | - | 8,227 |
Dominó Holdings | 2,457 | (15) | - | - | - | - | - | - | 2,442 |
Other | 9,556 | (23) | 9 | - | - | - | - | (427) | 9,115 |
54,918 | 23,165 | 9 | - | - | (28,737) | - | (427) | 48,928 | |
Investment property | 1,362 | - | - | - | (5) | - | - | (15) | 1,342 |
Other investments | - | - | 142 | - | - | - | - | - | 142 |
| 2,570,643 | 135,888 | 87,781 | (35,280) | (373) | (46,715) | (148,748) | (194,962) | 2,368,234 |
(a) Of the total, the amounts of R$ 36,687 and R$ 92,312 refers to investments that are now subsidiaries; R$ 65,521 refers to investment written off; R$ 427 from the sale of the associated company Dois Saltos Empreendimentos de Geração de Energia Elétrica Ltda ; and R$ 15 refers to the transfer to Other receivables. | |||||||||
60
![]()
Consolidated |
|
| Investment/ |
|
|
|
|
|
| Advance for |
| Proposed |
|
| |
Balance as of |
| future capital | Amorti- | dividends |
| Balance as of | |
| January 1, 2017 | Equity | increase | zation | and JCP | Other (a) | December 31, 2017 |
Joint Ventures (17.3) |
|
|
|
|
|
|
|
Dominó Holdings (a) | 81,526 | (568) | - | - | (5,144) | (75,814) | - |
Voltalia São Miguel do Gostoso I | 75,563 | (565) | - | - | - | - | 74,998 |
Voltalia São Miguel do Gostoso - authorization rights | 11,140 | - | - | (367) | - | - | 10,773 |
Paraná Gás | 37 | (34) | - | - | - | - | 3 |
Costa Oeste (Note 1.2) | 37,232 | (2,566) | - | - | (1,020) | - | 33,646 |
Marumbi (Note 1.2) | 94,878 | (9,537) | - | - | - | - | 85,341 |
Transmissora Sul Brasileira (Note 1.2) | 69,369 | (5,009) | - | - | - | - | 64,360 |
Caiuá | 60,057 | (4,020) | - | - | - | - | 56,037 |
Integração Maranhense | 122,253 | (8,852) | - | - | - | - | 113,401 |
Matrinchã | 792,069 | 57,376 | - | - | (13,626) | - | 835,819 |
Guaraciaba | 398,969 | 25,377 | - | - | (6,026) | - | 418,320 |
Paranaíba | 147,213 | 17,020 | 2,082 | - | (4,042) | - | 162,273 |
Mata de Santa Genebra | 232,240 | 19,477 | 210,920 | - | (3,263) | - | 459,374 |
Cantareira | 161,855 | 3,879 | 35,205 | - | (921) | - | 200,018 |
2,284,401 | 91,978 | 248,207 | (367) | (34,042) | (75,814) | 2,514,363 | |
Associates |
|
|
|
|
|
|
|
Dona Francisca Energética (18.5) | 32,766 | 8,876 | - | - | (11,821) | - | 29,821 |
Foz do Chopim Energética (18.5) | 13,967 | 6,645 | - | - | (7,528) | - | 13,084 |
Dominó Holdings | - | 4 | - | - | - | 2,453 | 2,457 |
Other | 12,016 | (5,764) | 36 | 2,872 | - | 396 | 9,556 |
58,749 | 9,761 | 36 | 2,872 | (19,349) | 2,849 | 54,918 | |
Other investments | 1,362 | - | - | - | - | - | 1,362 |
| 2,344,512 | 101,739 | 248,243 | 2,505 | (53,391) | (72,965) | 2,570,643 |
(a) Of the total amount of R$75,814, R$73,361 refers to capital decrease and R$2,453 refers to the change in the investment of a Joint venture to anAssociate. | |||||||
17.2 Subsidiaries with non-controlling interests
17.2.1 Summarized financial information
| Compagás | Elejor | UEG Araucária | |||
| 12.31.2018 | 12.31.2017 | 12.31.2018 | 12.31.2017 | 12.31.2018 | 12.31.2017 |
|
|
|
|
|
| |
ASSETS | 675,286 | 632,910 | 652,175 | 675,450 | 436,137 | 507,060 |
Current assets | 204,725 | 151,966 | 80,990 | 77,216 | 33,573 | 99,101 |
Noncurrent assets | 470,561 | 480,944 | 571,185 | 598,234 | 402,564 | 407,959 |
|
|
|
|
|
| |
LIABILITIES | 675,286 | 632,910 | 652,175 | 675,450 | 436,137 | 507,060 |
Current liabilities | 133,769 | 147,743 | 124,880 | 164,574 | 42,185 | 38,386 |
Noncurrent liabilities | 106,900 | 87,409 | 473,318 | 449,149 | 23,290 | 22,470 |
Equity | 434,617 | 397,758 | 53,977 | 61,727 | 370,662 | 446,204 |
|
|
|
|
|
| |
STATEMENT OF INCOME |
|
|
|
|
|
|
Operating revenues | 588,532 | 515,563 | 293,942 | 291,597 | 524 | 129,084 |
Operating costs and expenses | (515,594) | (309,213) | (89,931) | (93,230) | (94,970) | (121,883) |
Financial results | (2,411) | (25,612) | (89,301) | (54,254) | 2,275 | 5,302 |
Equity in earnings of investees | - | - | - | - | - | (5,777) |
Income tax and social contribution | (10,909) | (66,785) | (38,379) | (47,893) | 16,316 | (7,098) |
Net income (loss) | 59,618 | 113,953 | 76,331 | 96,220 | (75,855) | (372) |
Other comprehensive income | 187 | (251) | - | - | - | - |
Total comprehensive income | 59,805 | 113,702 | 76,331 | 96,220 | (75,855) | (372) |
|
|
|
|
|
| |
STATEMENTS OF CASH FLOWS |
|
|
|
|
|
|
Cash flows from operational activities | 66,017 | 83,661 | 127,108 | 143,911 | (26,980) | (86,840) |
Cash flows from investment activities | (15,961) | (14,268) | (2,659) | (1,461) | (2,768) | 118,460 |
Cash flows from financing activities | (43,980) | (20,623) | (119,468) | (143,028) | - | - |
|
|
|
|
|
| |
TOTAL EFFECTS ON CASH AND CASH EQUIVALENTS | 6,076 | 48,770 | 4,981 | (578) | (29,748) | 31,620 |
Cash and cash equivalents at the beginning of the year | 84,079 | 35,309 | 37,905 | 38,483 | 51,264 | 19,644 |
Cash and cash equivalents at the end of the year | 90,155 | 84,079 | 42,886 | 37,905 | 21,516 | 51,264 |
CHANGE IN CASH AND CASH EQUIVALENTS | 6,076 | 48,770 | 4,981 | (578) | (29,748) | 31,620 |
|
|
|
|
|
|
|
61
![]()
17.2.2 Changes in equity attributable to non-controlling shareholders
Participation in capital stock | Compagás: 49% | Elejor: 30% | UEG Araucária: 20% | Consolidated |
January 1, 2017 | 146,818 | 23,910 | 89,316 | 260,044 |
Net income (loss) | 55,837 | 28,866 | (74) | 84,629 |
Other comprehensive income | (123) | - | - | (123) |
Deliberation of additional dividends proposed | - | (11,053) | - | (11,053) |
Dividends | (7,631) | (23,205) | - | (30,836) |
Balance as of December 31, 2017 | 194,901 | 18,518 | 89,242 | 302,661 |
Net income (loss) | 29,213 | 22,899 | (15,171) | 36,941 |
Other comprehensive income | 91 | - | 63 | 154 |
Dividends | (11,243) | (25,224) | - | (36,467) |
Balance as of December 31, 2018 | 212,962 | 16,193 | 74,134 | 303,289 |
17.3 Total balances of the groups of assets, liabilities, profit or loss and equity interest in commitments and contingent liabilities of the main joint ventures
| Voltalia | Caiuá | Integração Maranhense | Matrinchã | Guaraciaba | Paranaíba | Mata de Santa Genebra | Cantareira |
12.31.2018 | ||||||||
. |
|
|
|
|
|
|
|
|
ASSETS | 227,867 | 261,951 | 465,801 | 2,199,434 | 1,295,670 | 1,574,846 | 2,365,160 | 1,443,693 |
Current assets | 2,344 | 26,471 | 47,347 | 326,557 | 229,693 | 165,072 | 202,253 | 161,328 |
Cash and cash equivalents | 205 | 1,128 | 1 | 116,634 | 136,191 | 13,931 | 19,568 | 301 |
Other current assets | 2,139 | 25,343 | 47,346 | 209,923 | 93,502 | 151,141 | 182,685 | 161,027 |
Noncurrent assets | 225,523 | 235,480 | 418,454 | 1,872,877 | 1,065,977 | 1,409,774 | 2,162,907 | 1,282,365 |
. |
|
|
|
|
|
|
|
|
LIABILITIES | 227,867 | 261,951 | 465,801 | 2,199,434 | 1,295,670 | 1,574,846 | 2,365,160 | 1,443,693 |
Current liabilities | 2,216 | 24,955 | 73,856 | 137,627 | 79,701 | 104,599 | 124,606 | 60,964 |
Financial liabilities | - | 7,615 | 13,228 | 70,192 | 27,950 | 55,968 | 33,964 | 46,329 |
Other current liabilities | 2,216 | 17,340 | 60,628 | 67,435 | 51,751 | 48,631 | 90,642 | 14,635 |
Noncurrent liabilities | - | 84,672 | 127,284 | 687,897 | 487,520 | 814,798 | 1,273,962 | 734,724 |
Financial liabilities | - | 57,028 | 91,342 | 683,316 | 482,125 | 612,854 | 934,650 | 532,179 |
Other noncurrent liabilities | - | 27,644 | 35,942 | 4,581 | 5,395 | 201,944 | 339,312 | 202,545 |
Equity | 225,651 | 152,324 | 264,661 | 1,373,910 | 728,449 | 655,449 | 966,592 | 648,005 |
. |
|
|
|
|
|
|
|
|
STATEMENT OF INCOME |
|
|
|
|
|
|
|
|
Net operating income | - | 25,129 | 42,379 | 272,103 | 181,665 | (14,331) | 514,591 | 195,441 |
Operating costs and expenses | (103) | (4,785) | (7,732) | (47,771) | (27,273) | (23,244) | (462,839) | (60,529) |
Financial results | (170) | (5,017) | (7,817) | (61,910) | (35,036) | (57,977) | (59,507) | (58,402) |
Equity in income of subsidiaries | (7,815) | - | - | - | - | - | - | - |
Income tax and social contribution | - | (5,053) | (7,974) | (59,544) | (47,273) | 28,163 | 2,685 | (26,379) |
Net income (loss) | (8,088) | 10,274 | 18,856 | 102,878 | 72,083 | (67,389) | (5,070) | 50,131 |
Other comprehensive income | - | - | - | - | - | - | - | - |
Total comprehensive income | (8,088) | 10,274 | 18,856 | 102,878 | 72,083 | (67,389) | (5,070) | 50,131 |
. |
|
|
|
|
|
|
|
|
Investment interest - % | 49.0 | 49.0 | 49.0 | 49.0 | 49.0 | 24.5 | 50.1 | 49.0 |
Investment book value | 110,568 | 74,639 | 129,684 | 673,216 | 356,941 | 160,584 | 484,262 | 317,523 |
. |
|
|
|
|
|
|
|
|
62
![]()
| Voltalia | Transmis-sora Sul Brasileira | Caiuá | Integração Maranhense | Matrinchã | Guaraciaba | Paranaíba | Mata de Santa Genebra | Canta-reira |
12.31.2017 | |||||||||
. |
|
|
|
|
|
|
|
|
|
ASSETS | 155,272 | 659,464 | 230,743 | 466,783 | 2,774,973 | 1,428,247 | 1,698,213 | 1,722,063 | 952,670 |
Current assets | 2,141 | 56,604 | 22,895 | 44,594 | 297,331 | 139,920 | 233,065 | 107,568 | 6,046 |
Cash and cash equivalents | 3 | 25,547 | 1,626 | 2,224 | 116,256 | 34,364 | 29,066 | 96,244 | 5,169 |
Other current assets | 2,138 | 31,057 | 21,269 | 42,370 | 181,075 | 105,556 | 203,999 | 11,324 | 877 |
Noncurrent assets | 153,131 | 602,860 | 207,848 | 422,189 | 2,477,642 | 1,288,327 | 1,465,148 | 1,614,495 | 946,624 |
. |
|
|
|
|
|
|
|
|
|
LIABILITIES | 155,272 | 659,464 | 230,743 | 466,783 | 2,774,973 | 1,428,247 | 1,698,213 | 1,722,063 | 952,670 |
Current liabilities | 2,214 | 220,845 | 23,608 | 71,563 | 140,515 | 71,818 | 124,764 | 12,630 | 9,706 |
Financial liabilities | - | 212,618 | 7,427 | 13,240 | 48,686 | 32,627 | 53,317 | - | - |
Other current liabilities | 2,214 | 8,227 | 16,181 | 58,323 | 91,829 | 39,191 | 71,447 | 12,630 | 9,706 |
Noncurrent liabilities | - | 116,818 | 92,774 | 163,790 | 928,706 | 502,713 | 911,107 | 792,519 | 534,764 |
Financial liabilities | - | 106,174 | 64,081 | 103,755 | 712,198 | 388,806 | 638,779 | 703,897 | 439,192 |
Other noncurrent liabilities | - | 10,644 | 28,693 | 60,035 | 216,508 | 113,907 | 272,328 | 88,622 | 95,572 |
Equity | 153,058 | 321,801 | 114,361 | 231,430 | 1,705,752 | 853,716 | 662,342 | 916,914 | 408,200 |
. |
|
|
|
|
|
|
|
|
|
STATEMENT OF INCOME |
|
|
|
|
|
|
|
|
|
Net operating income | - | 53,374 | (2,904) | (14,460) | 403,891 | 208,444 | 320,302 | 588,123 | 392,766 |
Operating costs and expenses | (113) | (63,752) | (5,194) | (4,245) | (183,660) | (93,369) | (150,984) | (434,779) | (347,771) |
Financial results | 9 | (26,994) | (6,017) | (9,070) | (47,331) | (36,981) | (59,132) | (94,512) | (35,207) |
Equity in income of subsidiaries | (1,048) | - | - | - | - | - | - | - | - |
Income tax and social contribution | - | 12,330 | 5,908 | 9,709 | (55,808) | (26,303) | (40,717) | (19,955) | (1,871) |
Net income (loss) | (1,152) | (25,042) | (8,207) | (18,066) | 117,092 | 51,791 | 69,469 | 38,877 | 7,917 |
Other comprehensive income | - | - | - | - | - | - | - | - | - |
Total comprehensive income | (1,152) | (25,042) | (8,207) | (18,066) | 117,092 | 51,791 | 69,469 | 38,877 | 7,917 |
. |
|
|
|
|
|
|
|
|
|
Investment interest - % | 49.0 | 20.0 | 49.0 | 49.0 | 49.0 | 49.0 | 24.5 | 50.1 | 49.0 |
Investment book value | 74,998 | 64,360 | 56,037 | 113,401 | 835,819 | 418,320 | 162,273 | 459,374 | 200,018 |
. |
|
|
|
|
|
|
|
|
|
As of December 31, 2018, Copel's interest in the commitments assumed from its joint ventures is equivalent to R$ 81,263 (R$ 141,744 in 2017) and in contingent liabilities is equivalent to R$ 40.324 (R$ 38,218 in 2017).
63
![]()
17.4 Total balances of the groups of assets, liabilities, profit or loss and equity interest in contingent liabilities of the main associates
| Dona Francisca | Foz do Chopim | ||
| 12.31.2018 | 12.31.2017 | 12.31.2018 | 12.31.2017 |
. |
|
|
|
|
ASSETS | 134,141 | 138,079 | 106,736 | 61,163 |
Current assets | 12,493 | 10,304 | 73,786 | 21,553 |
Noncurrent assets | 121,648 | 127,775 | 32,950 | 39,610 |
. |
|
|
|
|
LIABILITIES | 134,141 | 138,079 | 106,736 | 61,163 |
Current liabilities | 4,231 | 4,144 | 57,603 | 1,808 |
Noncurrent liabilities | 3,361 | 4,443 | 26,133 | 22,776 |
Equity | 126,549 | 129,492 | 23,000 | 36,579 |
. |
|
| �� |
|
STATEMENT OF INCOME |
|
|
|
|
Net operating income | 70,716 | 70,716 | 46,479 | 40,441 |
Operating costs and expenses | (25,268) | (30,379) | (2,020) | (21,124) |
Financial income (expense) | 366 | 835 | (638) | 809 |
Income tax and social contribution | (2,446) | (2,632) | (6,880) | (1,547) |
Net income | 43,368 | 38,540 | 36,941 | 18,579 |
Other comprehensive income | - | - | - | - |
Total comprehensive income | 43,368 | 38,540 | 36,941 | 18,579 |
. |
|
|
|
|
Investment interest - % | 23.0303 | 23.0303 | 35.77 | 35.77 |
Investment book value | 29,144 | 29,821 | 8,227 | 13,084 |
|
|
|
|
|
As at December 31, 2018, Copel's interest in the contingent liabilities of its associates is equivalent to R$ 61,341 (R$ 58,194 in 2017).
18 Property, Plant and Equipment
The Company and its subsidiaries record assets used in administrative and commercial facilities for generation of electric power and telecommunication services in property, plant and equipment account. Investments in electric power transmission and distribution and in piped gas distribution are recorded in financial assets and/or intangible assets accounts as per CPC 04/IAS 38, CPC 47/IFRS 15 and ICPC 01/IFRIC 12. (Notes 4.4, 4.5 and 4.9).
Upon initial adoption of IFRS, property, plant and equipment were measured at fair value with recognition of their deemed cost.
Under the regulation relating to the concession of public electric energy services, the assets and facilities used mostly in the generation of power are attached to these services and cannot be withdrawn, sold, assigned, or mortgaged without the prior written consent of the regulatory agency. ANEEL Resolution No. 691/2015, however, regulates the release of assets from the concessions of the Public Electric Power Service, granting prior authorization to release the property and other fixed assets not usable by the concession when they are destined for sale, and also determining that the sales proceeds less respective charges be deposited in a restricted bank account to be invested in the concession.
64
![]()
18.1 Property, plant and equipment by asset class
Consolidated |
| Accumulated |
|
| Accumulated |
|
| Cost | depreciation | 12.31.2018 | Cost | depreciation | 12.31.2017 |
In service |
|
|
|
|
|
|
Reservoirs, dams and aqueducts | 6,643,087 | (4,216,613) | 2,426,474 | 6,638,348 | (4,071,621) | 2,566,727 |
Machinery and equipment | 5,648,292 | (2,674,150) | 2,974,142 | 5,320,736 | (2,654,801) | 2,665,935 |
Buildings | 1,500,990 | (1,021,783) | 479,207 | 1,500,144 | (989,221) | 510,923 |
Land | 375,286 | (18,184) | 357,102 | 277,665 | (15,287) | 262,378 |
Vehicles and aircraft | 47,744 | (41,978) | 5,766 | 59,101 | (48,759) | 10,342 |
Furniture and tools | 22,057 | (12,642) | 9,415 | 16,990 | (11,476) | 5,514 |
(-) Provision for impairment (18.7) | (3,489) | - | (3,489) | (4,986) | - | (4,986) |
(-) Special Obligations | (68) | 27 | (41) | (56) | 18 | (38) |
14,233,899 | (7,985,323) | 6,248,576 | 13,807,942 | (7,791,147) | 6,016,795 | |
|
|
|
|
|
| |
In progress |
|
|
|
|
|
|
Cost | 5,789,780 | - | 5,789,780 | 5,023,013 | - | 5,023,013 |
(-) Provision for impairment (18.7) | (1,197,693) | - | (1,197,693) | (1,210,358) | - | (1,210,358) |
4,592,087 | - | 4,592,087 | 3,812,655 | - | 3,812,655 | |
| 18,825,986 | (7,985,323) | 10,840,663 | 17,620,597 | (7,791,147) | 9,829,450 |
18.2 Changes in property, plant and equipment
Consolidated | Balance as of | Additions / |
| Loss on |
| Transfers/ | Balance as of |
| January 1, 2018 | Depreciation | disposal | Capitalizations | Reclassifications | December 31, 2018 | |
In service |
|
|
|
|
|
|
|
Reservoirs, dams and aqueducts | 2,566,727 | - | (144,991) | (1) | 4,739 | - | 2,426,474 |
Machinery and equipment | 2,665,935 | - | (199,846) | (61,959) | 760,887 | (190,875) | 2,974,142 |
Buildings | 510,923 | - | (35,932) | (500) | 4,716 | - | 479,207 |
Land | 262,378 | - | (2,897) | (83) | 97,704 | - | 357,102 |
Vehicles and aircraft | 10,342 | - | (4,484) | (392) | 300 | - | 5,766 |
Furniture and tools | 5,514 | - | (1,171) | (24) | 5,047 | 49 | 9,415 |
(-) Provision for impairment (18.7) | (4,986) | 1,497 | - | - | - | - | (3,489) |
(-) Special Obligations | (38) | - | 9 | - | (12) | - | (41) |
6,016,795 | 1,497 | (389,312) | (62,959) | 873,381 | (190,826) | 6,248,576 | |
In progress |
|
|
|
|
|
|
|
Cost | 5,023,013 | 1,455,318 | - | (5,491) | (873,381) | 190,321 | 5,789,780 |
(-) Provision for impairment (18.7) | (1,210,358) | 12,665 | - | - | - | - | (1,197,693) |
3,812,655 | 1,467,983 | - | (5,491) | (873,381) | 190,321 | 4,592,087 | |
| 9,829,450 | 1,469,480 | (389,312) | (68,450) | - | (505) | 10,840,663 |
Consolidated | Balance as of | Additions / |
| Loss on | Transfers/ | Balance as of |
| Restated | Depreciation | disposal | Reclassifications | December 31, 2017 | |
In service |
|
|
|
|
|
|
Reservoirs, dams and aqueducts | 2,683,512 | - | (144,484) | (2,160) | 29,859 | 2,566,727 |
Machinery and equipment | 2,663,971 | - | (188,988) | (37,685) | 228,637 | 2,665,935 |
Buildings | 544,372 | - | (36,347) | (773) | 3,671 | 510,923 |
Land | 264,761 | - | (2,935) | (3) | 555 | 262,378 |
Vehicles and aircraft | 15,671 | - | (5,492) | (6) | 169 | 10,342 |
Furniture and tools | 5,782 | - | (803) | (12) | 547 | 5,514 |
(-) Provision for impairment (18.7) | (77,318) | 72,332 | - | - | - | (4,986) |
(-) Special Obligations | (46) | - | 8 | - | - | (38) |
6,100,705 | 72,332 | (379,041) | (40,639) | 263,438 | 6,016,795 | |
In progress |
|
|
|
|
|
|
Cost | 3,969,703 | 1,318,336 | - | (23,869) | (241,157) | 5,023,013 |
(-) Provision for impairment (18.7) | (1,136,105) | (74,253) | - | - | - | (1,210,358) |
2,833,598 | 1,244,083 | - | (23,869) | (241,157) | 3,812,655 | |
| 8,934,303 | 1,316,415 | (379,041) | (64,508) | 22,281 | 9,829,450 |
65
![]()
18.3 Costs of borrowings and debentures capitalized
The costs of borrowings and debentures capitalized during 2018 amounted to R$ 4,229, at an average rate of 0.11% p.a. (R$ 2,297, at an average rate of 0.09% p.a. during 2017).
18.4 HPP Colíder
On July 30, 2010, on the ANEEL Auction of Power from New Projects 003/10, Copel GeT won the rights to the concession of the Colíder Hydroelectric Power Plant, valid for 35 years from the date of signature of Concession Agreement No. 001/11-MME-HPP Colíder, which took place on January 17, 2011.
This project will comprise a main powerhouse of 300 MW, which is enough to supply approximately one million people. The facility will take advantage of the hydroelectric potential discovered on the Teles Pires River, between the towns of Nova Canaã do Norte and Itaúba, in the northern region of the State of Mato Grosso.
The National Bank for Economic and Social Development (BNDES) approved the classification of the HPP Colíder project for financial support in the total amount of R$ 1,041,155 (Note 22). The amounts released until December 31, 2018 totaled R$ 1,005,108.
Due to acts of God and force majeure, such as fire at the construction site, public power acts, delays involving environmental licenses, among other setbacks, such as delays in delivery of equipment, in electromechanical assembly services and in the construction of the transmission line of the power plant, the project timeframe was adversely affected, leading to postponement of the commercial generation of the power plant. The first generating unit started operation in March 2019, while the third and last one is expected to July 2019. As a result of these events, the assets were reduced for impairment as shown in Note 18.7.
The Colíder Hydroelectric Power Plant’s power output was sold on an ANEEL auction at a final price of R$ 103.40/MWh, as of July 1, 2010, restated according to the variation of IPCA inflation index to R$ 169.52 as of December 31, 2018. 125 MW – mean were sold for supply starting on January 2015, for 30 years. Copel GeT submitted an application to ANEEL to exclude its responsibility, so that the obligation to supply energy could be postponed. In a first judgment, the request was not accepted. Copel GeT filed an application for reconsideration of the decision, which was also denied on March 14, 2017. Not agreeing with the decision, Copel GeT filed another application for reconsideration, which was definitely denied on July 4, 2017. Copel GeT filed a common lawsuit with the Court on December 18, 2017 applying for a preliminary injunction and requesting the reversal of the decision of the Agency. On April 6, 2018, the Federal Court of the 1st Region fully granted the preliminary injunction required by Copel Get in the Interlocutory Appeal to exempt it from any burden, charges or restrictions to the right arising from the delay in the implementation schedule of the Colíder HPP.
Copel GeT has complied with its commitments of energy supply as follows:
· From January 2015 to June 2016 – with energy surpluses not contracted in its other plants;
66
![]()
· In June 2016 – with partial reduction through a bilateral agreement; and
· From July 2016 to December 2018, with reduction of all supply contracts of the CCEARs – Energy Trading Agreement in the Regulated Environment, through a bilateral agreement and participation in the New Energy and Decrease Clearing Facility (“Mecanismo de Compensação de Sobras e Déficits de Energia Nova – MCSD-EN”).
On July 14, 2017, the assured power of the project was revised by MME Ordinance No. 213/SPE, going to 178.1 MW mean, after full set-up.
18.5 Joint operations - consortiums
The amounts recorded under property, plant and equipment referring to the share of interest of Copel GeT in consortiums are shown below:
| Share | Annual average |
|
|
Joint operations | Copel GeT (%) | depreciation rate (%) | 12.31.2018 | 12.31.2017 |
In service |
|
|
|
|
HPP Gov. Jayme Canet Júnior (Mauá) - Consórcio |
|
|
|
|
Energético Cruzeiro do Sul | 51.00 |
| 859,917 | 859,917 |
(-) Accumulated depreciation |
| 3.43 | (176,546) | (147,086) |
|
|
| 683,371 | 712,831 |
In progress |
|
|
|
|
HPP Baixo Iguaçu (18.5.1) | 30.00 |
| 717,599 | 640,178 |
|
|
| 717,599 | 640,178 |
|
|
| 1,400,970 | 1,353,009 |
18.5.1 Consórcio Empreendedor Baixo Iguaçu - Cebi
Copel holds a 30% interest in Consórcio Empreendedor Baixo Iguaçu – Cebi.The purpose of the consortium is to build and operate the project known as Baixo Iguaçu Hydroelectric Plant, with installed capacity of 350.2 MW and physical guarantee of 171.3 MW mean located on the Iguaçu River between the municipalities of Capanema and Capitão Leônidas Marques, and between the Governador José Richa Hydroelectric Plant and the Iguaçu National Park, in the State of Paraná. With total estimated investment of R$ 2,477,000, the start of commercial operation of unit 1 and 2 occurred in February 2019, and unit 3 occurred in April 2019.
The construction works started in July 2013, and the previous schedule has been changed due to the suspension of the Installation License, as per the decision of the Federal Court of the 4th Region (TRF-RS), rendered on June 16, 2014, that stopped the construction work as from July of that year. The work was resumed on February 1, 2016.
In August 2016, ANEEL published the 2nd Amendment to the Concession Agreement with the purpose of formalizing the redefinition of the schedule of HPP Baixo Iguaçu as well as the final date of termination. ANEEL also acknowledged in favor of Cebi the exclusion of responsibility for the delay in implementing the project for a period of 756 days. ANEEL recommended to the MME the extension of the grant period and determined CCEE to postpone the start of the supply period for the CCEARs for the period of exclusion of responsibility acknowledged.
67
![]()
On November 7, 2017, ANEEL acknowledged additional 46 days of exclusion of responsibility for the delay in implementing HPP Baixo Iguaçu, dismissing the application of any penalties and contractual, commercial or regulatory obligations derived from the delay. Accordingly, the project, which already counted with exclusion of responsibility for 756 days, now has a termination date for its concession on October 30, 2049, and the start of supply of Energy Sale Agreements on November 12, 2018.
On December 18, 2018 the filling of the reservoir was finalized, which made it possible to start the commercial operation of the first two generating units in February 2019.
18.6 Cutia wind farm Project
The largest Copel wind farm called Cutia is under construction. Cutia wind farm project is divided into two large complexes:
· Cutia Complex: composed of seven wind farms (Guajiru, Jangada, Potiguar, Cutia, Maria Helena, Esperança do Nordeste and Paraíso do Ventos do Nordeste), with 180.6 MW of total installed capacity, 71.4 MW-mean of assured power, all located in the State of Rio Grande do Norte. The power that will be generated by the farms was sold on the 6th Reserve Auction that was held on October 31, 2014, at an average historical price of R$ 144.00/MWh, inflation adjusted according to the variation of the IPCA to R$ 183.26 as of December 31, 2018. Starting in the last fortnight of December 2018, wind farms began to operate commercially on a phased basis by each wind turbine; and
· Bento Miguel Complex: composed of six wind farms (São Bento do Norte I, São Bento do Norte II, São Bento do Norte III, São Miguel I, São Miguel II and São Miguel III) with a total installed capacity of 132.3 MW, 58.7 MW-mean of assured power, all also located in the State of Rio Grande do Norte. The power that will be generated by the wind farms was sold on the 20th Reserve Auction that was held on November 28, 2014, at an average historical price of R$ 142.03/MWh, inflation adjusted according to the variation of the IPCA to R$ 179.84 as of December 31, 2018. Starting on January 29, 2019, wind farms began to operate commercially on a phased basis by each wind turbine.
As a result of the review of the recoverable amount of these projects, a balance of estimated losses on impairment of assets is recorded as described in Note 18.7.
68
![]()
18.7 Estimated losses on impairment of generation segment assets
During the year, the Company reviewed the recoverable amount of the generation assets as a result of the changes in the implementation schedules of the projects, budgets, estimates of future energy sales prices and discount rates. From these previous indicators, a number of power plants or cash generating units of the generation segment were tested.
The calculation of the value in use was based on discounted operating cash flows over the time of concessions, maintaining the Company’s current commercial conditions. The rate used to discount the cash flows was set in light of the WACC (Weighted Average Cost of Capital) methodology and CAPM (Capital Asset Pricing Model) methodology for the generation business, considering usual market parameters.
Internal references such as the budget approved by the Company, historical or past data, updating of the timeframe of work and amount of investments for projects in course support the design of key assumptions by Company Management. In the same framework, external references such as level of consumption of electric power, expansion of the economic activity in Brazil and the availability of water resources support the key information about estimated cash flows.
A number of assumptions used by Company Management when determining future cash flows can be affected by uncertain events, which, in turn, may give rise to variation in results. Changes in the political and economic model, for example, may lead to upward trend when projecting country risk-rating, increasing the discount rates used in tests.
The tests considered the following key assumptions:
· Growth compatible with historical data and perspective for the Brazilian economy growth;
· Specific after-tax discount rates for the segments tested, obtained through the methodology usually applied by the market, taking into consideration the weighted average cost of capital;
· Projected revenue in accordance with the agreements in force, without any expectation for renewal of concession/authorization; and
· Expenses broken into cash generating units, projected in view of the budget approved by the Company.
The Company considered all its generation projects as independent cash generating units.
69
![]()
The projects with impairment balances recorded at December 31, 2018 are the following:
Consolidated |
|
| Property, Plant and Equipment | Value in use | |
|
| Cost | Depreciation | Impairment | |
HPP Colíder | 2,334,223 | (2,497) | (731,265) | 1,600,461 | |
Wind power complex Cutia | 1,217,079 | - | (167,875) | 1,049,204 | |
Wind power complex Bento Miguel | 823,045 | - | (84,621) | 738,424 | |
Consórcio Tapajós (a) | 14,464 | - | (14,464) | - | |
Power plants in Paraná |
| 961,887 | (46,607) | (202,957) | 712,323 |
|
| 5,350,698 | (49,104) | (1,201,182) | 4,100,412 |
(b) Project under development | |||||
The Company reviewed the recoverable amount of property, plant and equipment and, as a result of these analyses, the impairment changed as follows: | |||||
Consolidated | Balance as of | Impairment | Balance as of | Impairment | Balance as of |
| January 1, 2017 | December 31, 2017 | December 31, 2018 | ||
In service |
|
| |||
UEG Araucária | (69,073) | 69,073 | - | - | - |
Power plants in Paraná | (8,245) | 3,259 | (4,986) | 1,497 | (3,489) |
(77,318) | 72,332 | (4,986) | 1,497 | (3,489) | |
In progress |
|
| |||
HPP Colíder (18.7.1) | (595,489) | (87,532) | (683,021) | (48,244) | (731,265) |
Wind power complex Cutia (18.7.2) | (232,827) | 8,317 | (224,510) | 56,635 | (167,875) |
Wind power complex Bento Miguel (18.7.2) | (81,637) | (16,594) | (98,231) | 13,610 | (84,621) |
Consórcio Tapajós | (14,464) | - | (14,464) | - | (14,464) |
Power plants in Paraná (18.7.3) | (211,688) | 21,556 | (190,132) | (9,336) | (199,468) |
| (1,136,105) | (74,253) | (1,210,358) | 12,665 | (1,197,693) |
| (1,213,423) | (1,921) | (1,215,344) | 14,162 | (1,201,182) |
18.7.1 HPP Colíder
In December 2018, the calculation of the value in use considered the Company’s assumptions and budgets and pre-tax discount rate in constant currency of 5.36% p.a. (5.35% p.a. in 2017), which derives from the WACC methodology for the electricity generation segment. Although the current estimate for start-up of the first turbine has been postponed to March 2019 (in 2018 the tentative date was May 2018), and the construction’s budget changes, an additional impairment was recognized.
18.7.2 Cutia and Bento Miguel Wind Farms
In December 2018, the calculation of the value in use considered the Company’s assumptions and budgets and pretax discount rate in constant currency of 7.13%, which derives from the WACC methodology for the electric power generation segment, adjusted for the specific condition of taxation of those projects.
The reversal observed in both complexes is justified by the increase in generation expectancy changed to 100% of the physical guarantee of the P-50 (in 2017, 95% of the P-50) and by the variations in the long-term projection of the PLD and the selling price in the ACL.
70
![]()
18.7.3 Power plants of Paraná
In December 2018, for the power plants of Paraná with indicators of impairment, the calculation of value in use of generation assets in the State of Paraná considered: (i) the Company’s assumptions and budgets; and (ii) after-tax discount rate in constant currency of 5.36% p.a. (5.35% p.a. in 2017), which derives from the WACC methodology for the electricity generation segment. Additional impairment was recorded based on: (i) postponement of the start-up of the hydroelectric plant to March 2019, and the thermal plant to March 2019 (in 2017 both were for October 2018); and (ii) changes in the construction budget of the HPPs.
18.7.4 Cash generating units with no provision for impairment
The table below presents the cash-generating units that did not present impairment as of December 31, 2018. Also, the Company performed a sensitivity analysis, increasing the discount rate by 5% and by 10% for impairment risk, and it was verified that none of the power plants presented a risk of impairment since the recoverable amount (“VR”) exceeds carrying amount (“VC”) of PP&E, as shown below:
Cash generating unit |
|
| VR/VC-1 | VR/VC-1 | Impairment |
Discount rate | VR/VC-1 | (5% Variation) | (10% Variation) | ||
Wind power Assets |
|
|
|
|
|
Complexo EOL São Bento (a) | 7.13% | 60.49% | 55.82% | 51.36% | - |
Complexo EOL Brisa I (b) | 7.13% | 22.47% | 18.97% | 15.64% | - |
Complexo EOL Brisa II (c) | 7.13% | 18.77% | 14.74% | 10.93% | - |
Thermal Assets |
|
|
|
|
|
UEGA | 7.67% | 70.74% | 67.36% | 64.08% |
|
Hydric Assets |
|
|
|
|
|
Foz do Areia | 5.36% | 232.59% | 230.48% | 228.39% | - |
Segredo | 5.36% | 168.12% | 164.07% | 160.11% | - |
Caxias | 5.36% | 131.38% | 127.72% | 124.14% | - |
Guaricana | 5.36% | 22.57% | 21.25% | 19.96% | - |
Chaminé | 5.36% | 59.22% | 57.54% | 55.89% | - |
Apucaraninha | 5.36% | 15.44% | 14.07% | 12.72% |
|
Chopim I | 5.36% | 99.24% | 95.35% | 91.58% | - |
São Jorge | 5.36% | 3.22% | 2.24% | 1.27% | - |
Melissa | 5.36% | 23.18% | 21.15% | 19.20% | - |
Mauá | 5.36% | 56.90% | 53.26% | 49.75% | - |
Cavernoso II | 5.36% | 7.60% | 4.92% | 2.35% | - |
Elejor | 7.00% | 66.64% | 62.63% | 58.78% | - |
(a) Contemplates the GE Boa Vista, GE Farol, GE Olho D’Água and GE São Bento do Norte wind farms. | |||||
(b) Contemplates the Nova Asa Branca I, Nova Asa Branca II, Nova Asa Branca III and Nova Eurus IV wind farms. | |||||
(c) Contemplates the Santa Maria, Santa Helena and Ventos de Santo Uriel wind farms. | |||||
71
![]()
18.8 Average depreciation rates
Average rate of depreciation (%) | 12.31.2018 | 12.31.2017 |
Generation |
|
|
General equipment | 6.25 | 6.33 |
Machinery and equipment | 3.56 | 3.59 |
Generators | 3.34 | 3.21 |
Reservoirs, dams and ducts | 2.21 | 2.11 |
Hydraulic turbines | 2.60 | 2.61 |
Gas and steam turbines | 2.00 | 2.30 |
Water cooling and treatment | 4.00 | 4.00 |
Gas conditioner | 4.00 | 4.00 |
Wind power plant unit | 3.71 | 3.85 |
Central management |
|
|
Buildings | 3.35 | 3.33 |
Machinery and office equipment | 6.25 | 6.25 |
Furniture and fixtures | 6.25 | 6.25 |
Vehicles | 14.29 | 14.29 |
Telecommunications |
|
|
Transmission equipment | 4.77 | 6.36 |
Terminal equipment | 9.96 | 12.09 |
Infrastructure | 10.37 | 7.45 |
In 2018, the Company's Management deemed it necessary to reassess the estimated useful lives of assets related to the telecommunications business. As a result, some depreciation rates were changed, which were applied in 2018 and prospectively, without significant impact on the result.
Depreciation of assets which are part of the original project of Mauá, Colíder, Cavernoso II, Santa Clara and Fundão HPPs
The assets of the original project of the Mauá, Colíder and Cavernoso II Hydroelectric Power Plants of Copel Get, and the Santa Clara and Fundão Hydroelectric Power Plants of Elejor are considered by the Concession Grantor, without full guarantee of indemnification of the residual value at the end of the concession term. This interpretation is based on Law 8,987/95 and Decree 2,003/96, which regulate the production of electricity by independent producers.
Accordingly, from the date these assets start operations they are depreciated at the rates set by ANEEL, limited to the concession term.
As established in concession agreements, subsequent investments not forecast in the original project, provided that they are approved by the Concession Grantor and have not yet been amortized, will be indemnified at the end of the concessions and these assets will be depreciated at the rates set by ANEEL, from the date they start operations.
72
![]()
19 Intangible Assets
Consolidated | 12.31.2018 | 12.31.2017 |
Concession agreement - distribution of electricity (19.1) | 5,390,063 | 5,750,873 |
Generation concession agreements/ authorization (19.2) | 593,852 | 619,221 |
Concession agreement - piped gas distribution (19.3) | 3,619 | 43,888 |
Others (19.4) | 41,563 | 38,842 |
| 6,029,097 | 6,452,824 |
19.1 Power distribution service concession
. |
|
|
|
|
|
Consolidated |
|
| Special liabilities | ||
| in service | in progress | in service | in progress | Total |
Balance as of January 1, 2017 | 7,537,158 | 849,715 | (2,845,024) | (28,468) | 5,513,381 |
Acquisitions | - | 757,709 | - | - | 757,709 |
Customers contributions | 628 | - | (579) | (125,983) | (125,934) |
Provision for claims added to the cost of the works | - | (1,587) | - | - | (1,587) |
Transfers to accounts receivable related to concession (Note 10.1) | - | (56,853) | - | - | (56,853) |
Capitalizations for intangible in service | 822,472 | (822,472) | (128,351) | 128,351 | - |
Amortization of quotas - concession (a) | (411,575) | - | 125,740 | - | (285,835) |
Amortization of quotas - PIS/Pasep and Cofins credits | (11,014) | - | - | - | (11,014) |
Loss on disposal | (29,704) | (12,066) | 2,776 | - | (38,994) |
Balance as of December 31, 2017 | 7,907,965 | 714,446 | (2,845,438) | (26,100) | 5,750,873 |
Transfers to contract assets (Note 11.1) | - | (714,446) | - | 26,100 | (688,346) |
Transfers from contract assets (Note 11.1) | 775,701 | - | (107,679) | - | 668,022 |
Amortization of quotas - concession (a) | (431,963) | - | 130,388 | - | (301,575) |
Amortization of quotas - PIS/Pasep and Cofins credits | (10,813) | - | - | - | (10,813) |
Loss on disposal | (28,098) | - | - | - | (28,098) |
Balance as of December 31, 2018 | 8,212,792 | - | (2,822,729) | - | 5,390,063 |
(a) Amortization during the concession as of the start of commercial operations of the enterprises or based on the useful life of the assets, of the two the shortest. | |||||
In accordance with ICPC 01/IFRIC 12 - Service Concession Arrangements, the portion of infrastructure that will be used during concession was recorded in intangible assets, net of special obligations.
The Special Obligations represent the resources related to the financial participation of consumers, the Federal, State and Municipal Governments, destined to investments in projects related to the concession, and are not onerous liabilities or shareholder credits.
Amortization of Intangible Assets is initiated upon transfer to Intangible Assets under the straight-line method based on the estimated useful life of the asset and will be fully amortized over the term of the concession.
As a result of the initial adoption of CPC 47/IFRS 15 on January 1, 2018, the balance of construction in progress was transferred to contract assets (Note 11.1).
19.2 Generation concession agreements
73
![]()
19.3 Piped gas distribution service concession
. |
|
|
|
|
Consolidated | Concession contract (a) | Concession and | ||
| in service | in progress | authorization rights | Total |
Balance as of January 1, 2017 | 254,280 | 6,299 | 403,133 | 663,712 |
ANEEL grant - use of public property | - | 678 | - | 678 |
Amortization of quotas - concession and authorization (b) | (17,837) | - | (13,139) | (30,976) |
Transfer to property, plant and equipment | - | - | (14,193) | (14,193) |
Balance as of December 31, 2017 | 236,443 | 6,977 | 375,801 | 619,221 |
ANEEL grant - use of public property | - | 302 | - | 302 |
Business combination (Note 1.2) | - | - | 4,845 | 4,845 |
Amortization of quotas - concession and authorization (b) | (17,311) | - | (13,205) | (30,516) |
Capitalizations for intangible in service | 7,279 | (7,279) | - | - |
Balance as of December 31, 2018 | 226,411 | - | 367,441 | 593,852 |
(a) Includes the balances of use of public asset and hydrological risk renegotiation | ||||
(b) Amortization during the concession/authorization as of the start of commercial operations of the enterprises. | ||||
As a result of the initial adoption of CPC 47/IFRS 15, on January 1, 2018, the balance of construction in progress was transferred to contract assets (Note 11.2).
19.4 Other intangible assets
Consolidated | in service | in progress | Total |
Balance as of January 1, 2017 | 25,725 | 18,485 | 44,210 |
Acquisitions | - | 6,932 | 6,932 |
Transfers from property, plant and equipment | 105 | - | 105 |
Capitalizations for intangible in service | 5,744 | (5,744) | - |
Amortization of quotas (b) | (8,809) | - | (8,809) |
Amortization of quotas - PIS/Pasep and Cofins credits | (54) | - | (54) |
Loss on disposal | (18) | (3,524) | (3,542) |
Balance as of December 31, 2017 | 22,693 | 16,149 | 38,842 |
Effect of acquisition of control of Costa Oeste and Marumbi | - | 37 | 37 |
Acquisitions | - | 7,589 | 7,589 |
Transfers from property, plant and equipment | 112 | 1,979 | 2,091 |
Capitalizations for intangible in service | 9,448 | (9,448) | - |
Amortization of quotas (a) | (6,410) | - | (6,410) |
Amortization of quotas - PIS/Pasep and Cofins credits | (23) | - | (23) |
Loss on disposal | (190) | (373) | (563) |
Balance as of December 31, 2018 | 25,630 | 15,933 | 41,563 |
(a) Annual amortization rate: 20%. |
74
![]()
20 Payroll, Social Charges and Accruals
|
| Parent Company |
| Consolidated |
| 12.31.2018 | 12.31.2017 | 12.31.2018 | 12.31.2017 |
Social security liabilities |
|
|
|
|
Taxes and social contribution | 1,529 | 1,778 | 54,653 | 49,748 |
Social security charges on paid vacation and 13th salary | 731 | 768 | 30,010 | 32,686 |
2,260 | 2,546 | 84,663 | 82,434 | |
Labor liabilities |
|
|
|
|
Payroll, net | - | 157 | 1,308 | 1,796 |
Vacation | 2,480 | 2,511 | 101,327 | 106,450 |
Provisons for profit sharing | 863 | 586 | 91,526 | 68,817 |
Voluntary retirement program | 1,144 | 877 | 5,349 | 38,642 |
Other liabilities | - | 300 | 6 | 15,828 |
4,487 | 4,431 | 199,516 | 231,533 | |
| 6,747 | 6,977 | 284,179 | 313,967 |
21 Accounts payable to suppliers
Consolidated | 12.31.2018 | 12.31.2017 |
Energy supplies | 819,792 | 986,689 |
Materials and supplies | 384,300 | 521,969 |
Natural gas for resale | 95,478 | 101,026 |
Charges for use of grid system | 169,629 | 117,362 |
| 1,469,199 | 1,727,046 |
Current | 1,419,243 | 1,683,577 |
Noncurrent | 49,956 | 43,469 |
75
![]()
22 Borrowings
|
|
| Issue | Number of | Final | Annual rate p.y. | Finance |
|
| Consolidated |
| Contracts | Company | Date | installment | maturity | (interest + commission) | charges | Principal | 12.31.2018 | 12.31.2017 |
Foreign currency |
|
|
|
|
|
|
|
|
| |
National Treasury Department - STN |
|
|
|
|
|
|
|
|
| |
(Secretaria do Tesouro Nacional) |
|
|
|
|
|
|
|
|
| |
(1) | Par Bond | Copel | 05.20.1998 | 1 | 04.11.2024 | 6.0% + 0.20% | Half-yearly | 17,315 | 42,914 | 52,768 |
(1) | Discount Bond | Copel | 05.20.1998 | 1 | 04.11.2024 | 2.375% + 0.20% | Half-yearly | 12,082 | 61,837 | 36,502 |
Total foreign currency |
|
|
|
|
|
|
| 104,751 | 89,270 | |
|
|
|
|
|
|
|
|
|
| |
Local currency |
|
|
|
|
|
|
|
|
| |
Banco do Brasil |
|
|
|
|
|
|
|
|
| |
(2) | 21/02155-4 | Copel DIS | 09.10.2010 | 2 | 08.15.2018 | 109.0% of DI | Half-yearly | 116,667 | - | 60,049 |
(3) | 21/02248-8 | Copel DIS | 06.22.2011 | 2 | 05.16.2018 | 109.0% of DI | Half-yearly | 150,000 | - | 75,601 |
(4) | CCB 21/11062X | Copel DIS | 08.26.2013 | 3 | 07.27.2018 | 106.0% of DI | Half-yearly | 151,000 | - | 51,932 |
(5) | CCB 330.600.773 | Copel DIS | 07.11.2014 | 3 | 07.11.2019 | 111.8% of DI | Half-yearly | 116,667 | 40,023 | 80,699 |
(6) | CFX 17/35959-7 | Copel DIS | 05.16.2017 | 2 | 05.06.2019 | 12.0% | Quarterly | 75,000 | 37,973 | 75,291 |
(7) | CCB 21/00851-5 | Copel DIS | 06.30.2017 | 2 | 06.13.2019 | 11.0% | Quarterly | 38,889 | 19,340 | 38,241 |
(8) | CCB 17/35960-0 | Copel DIS | 07.27.2017 | 2 | 07.17.2019 | 11.0% | Quarterly | 50,333 | 51,473 | 51,073 |
(9) | CFX 17/35958-9 | Copel DIS | 08.15.2017 | 2 | 08.05.2019 | 11.0% | Quarterly | 58,333 | 59,102 | 58,636 |
(10) | NCI 330.600.132 | Copel HOL | 02.28.2007 | 3 | 02.28.2019 | 107.8% of DI | Half-yearly | 231,000 | 78,669 | 157,707 |
(11) | CCB 306.401.381 | Copel HOL | 06.21.2018 | 4 | 07.21.2021 | 120.0% of DI | Quarterly | 640,005 | 641,530 | 660,949 |
(12) | NCI 306.401.445 | Copel HOL | 02.24.2017 | 2 | 02.15.2020 | 124.5% of DI | Half-yearly | 77,000 | 78,435 | 78,186 |
|
|
|
|
|
|
|
| 1,006,545 | 1,388,364 | |
Eletrobras |
|
|
|
|
|
|
|
|
| |
(13) | 980/95 | Copel DIS | 12.22.1994 | 80 | 11.15.2018 | 8.0% | Quarterly | 11 | - | 3 |
(13) | 981/95 | Copel DIS | 12.22.1994 | 80 | 08.15.2019 | 8.0% | Quarterly | 1,169 | 49 | 115 |
(13) | 982/95 | Copel DIS | 12.22.1994 | 80 | 11.15.2019 | 8.0% | Quarterly | 1,283 | 24 | 48 |
(13) | 983/95 | Copel DIS | 12.22.1994 | 80 | 11.15.2020 | 8.0% | Quarterly | 11 | 51 | 77 |
(13) | 984/95 | Copel DIS | 12.22.1994 | 80 | 11.15.2020 | 8.0% | Quarterly | 14 | 22 | 33 |
(13) | 985/95 | Copel DIS | 12.22.1994 | 80 | 08.15.2021 | 8.0% | Quarterly | 61 | 17 | 23 |
(14) | 142/06 | Copel DIS | 05.11.2006 | 120 | 09.30.2018 | 5.0% + 1.0% | Monthly | 74,340 | - | 2,730 |
(14) | 206/07 | Copel DIS | 03.03.2008 | 120 | 08.30.2020 | 5.0% + 1.0% | Monthly | 109,642 | 14,839 | 23,746 |
(14) | 273/09 | Copel DIS | 02.18.2010 | 120 | 12.30.2022 | 5.0% + 1.0% | Monthly | 63,944 | 6,577 | 8,222 |
|
|
|
|
|
|
|
| 21,579 | 34,997 | |
Caixa Econômica Federal |
|
|
|
|
|
|
|
|
| |
(14) | 415.855-22/14 | Copel DIS | 03.31.2015 | 120 | 12.08.2026 | 6.0% | Monthly | 16,984 | 15,298 | 5,087 |
(15) | 3153-352 | Copel DIS | 11.01.2016 | 36 | 12.15.2021 | 5.5 % above TJLP | Quarterly | 489 | 496 | 498 |
|
|
|
|
|
|
|
| 15,794 | 5,585 | |
Finep |
|
|
|
|
|
|
|
|
| |
(16) | 21120105-00 | Copel Tel | 07.17.2012 | 81 | 10.15.2020 | 4.0% | Monthly | 35,095 | 5,730 | 8,855 |
(16) | 21120105-00 | Copel Tel | 07.17.2012 | 81 | 10.15.2020 | 3.5% + TR | Monthly | 17,103 | 4,842 | 7,482 |
|
|
|
|
|
|
|
| 10,572 | 16,337 | |
BNDES |
|
|
|
|
|
|
|
|
| |
(17) | 820989.1 | Copel GeT | 03.17.2009 | 179 | 01.15.2028 | 1.63% above TJLP | Monthly | 169,500 | 107,326 | 118,370 |
(18) | 1120952.1-A | Copel GeT | 12.16.2011 | 168 | 04.15.2026 | 1.82% above TJLP | Monthly | 42,433 | 23,098 | 26,078 |
(19) | 1120952.1-B | Copel GeT | 12.16.2011 | 168 | 04.15.2026 | 1.42% above TJLP | Monthly | 2,290 | 1,246 | 1,407 |
(20) | 1220768.1 | Copel GeT | 09.28.2012 | 192 | 07.15.2029 | 1.36% above TJLP | Monthly | 73,122 | 50,908 | 55,357 |
(21) | 13211061 | Copel GeT | 12.04.2013 | 192 | 10.15.2031 | 0% and 1.49% above TJLP | Monthly | 1,041,155 | 841,871 | 871,022 |
(22) | 13210331 | Copel GeT | 12.03.2013 | 168 | 08.15.2028 | 1.49% and 1.89% above TJLP | Monthly | 17,644 | 12,659 | 13,878 |
(23) | 15206041 | Copel GeT | 12.28.2015 | 168 | 06.15.2030 | 2.42% above TJLP | Monthly | 34,265 | 23,984 | 25,899 |
(24) | 15205921 | Copel GeT | 12.28.2015 | 168 | 12.15.2029 | 2.32% above TJLP | Monthly | 21,584 | 14,518 | 15,734 |
(25) | 18205101 | Copel GeT | 11.22.2018 | 192 | 06.15.2035 | 1.94% above TJLP | Monthly | 194,000 | 158,659 | - |
(26) | 14205611-A | Copel DIS | 12.15.2014 | 72 | 01.15.2021 | 2.09% above TJLP | Annual | 41,583 | 14,450 | 21,267 |
(26) | 14205611-B | Copel DIS | 12.15.2014 | 6 | 02.15.2021 | 2.09 above TR BNDES | Monthly | 17,821 | 11,992 | 15,384 |
(27) | 14205611-C | Copel DIS | 12.15.2014 | 113 | 06.15.2024 | 6.0% | Monthly | 78,921 | 43,097 | 50,949 |
(28) | 14205611-D | Copel DIS | 12.15.2014 | 57 | 02.15.2021 | TJLP | Monthly | 750 | 20 | 29 |
(29) | 14.2.1271.1 | Santa Maria | 06.01.2015 | 192 | 08.15.2031 | 1.66% above TJLP | Monthly | 59,462 | 48,125 | 51,578 |
(29) | 14.2.1272.1 | Santa Helena | 06.01.2015 | 192 | 08.15.2031 | 1.66% above TJLP | Monthly | 64,520 | 52,188 | 55,932 |
(30) | 11211521 | GE Farol | 03.19.2012 | 192 | 06.15.2030 | 2.34% above TJLP | Monthly | 54,100 | 45,158 | 48,741 |
(30) | 11211531 | GE Boa Vista | 03.19.2012 | 192 | 06.15.2030 | 2.34% above TJLP | Monthly | 40,050 | 33,385 | 36,034 |
(30) | 11211541 | GE S.B. do Norte | 03.19.2012 | 192 | 06.15.2030 | 2.34% above TJLP | Monthly | 90,900 | 75,715 | 81,723 |
(30) | 11211551 | GE Olho D'Água | 03.19.2012 | 192 | 06.15.2030 | 2.34% above TJLP | Monthly | 97,000 | 80,863 | 87,278 |
(31) | 18204611 | Cutia | 10.25.2018 | 192 | 07.15.2035 | 2.04% above TJLP | Monthly | 619,405 | 505,368 | - |
(32) | 13212221 - A | Costa Oeste | 12.03.2013 | 168 | 11.30.2028 | 1.95% + TJLP | Monthly | 23,634 | 21,291 | - |
(33) | 13212221 - B | Costa Oeste | 12.03.2013 | 106 | 09.30.2023 | 3.5% | Monthly | 9,086 | 3,789 | - |
(34) | 14205851 - A | Marumbi | 07.08.2014 | 168 | 06.30.2029 | 2.00% + TJLP | Monthly | 33,460 | 27,134 | - |
(35) | 14205851 - B | Marumbi | 07.08.2014 | 106 | 04.30.2024 | 6.00% | Monthly | 21,577 | 12,076 | - |
|
|
|
|
|
|
|
| 2,208,920 | 1,576,660 | |
(36) | Promissory notes | Copel GeT | 05.12.2017 | 1 | 05.12.2019 | 117% of DI | Single | 500,000 | 571,822 | 529,919 |
|
|
|
|
|
|
|
|
|
| |
|
|
|
|
|
|
|
| 571,822 | 529,919 | |
Banco do Brasil |
|
|
|
|
|
|
|
|
| |
BNDES Transfer |
|
|
|
|
|
|
|
|
| |
(37) | 21/02000-0 | Copel GeT | 04.16.2009 | 179 | 01.15.2028 | 2.13% above TJLP | Monthly | 169,500 | 107,324 | 118,373 |
|
|
|
|
|
|
|
| 107,324 | 118,373 | |
Total local currency |
|
|
|
|
|
|
| 3,942,556 | 3,670,235 | |
|
|
|
|
|
|
|
|
| 4,047,307 | 3,759,505 |
|
|
|
|
|
|
| Current | 1,113,047 | 784,666 | |
|
|
|
|
|
|
|
| Noncurrent | 2,934,260 | 2,974,839 |
76
![]()
Allocation: |
(1) The restructuring of medium and long-term debt in connection w ith the financing received under Law No. 4,131/1962. |
(2) (3) (4) (5) (6) (7) (8) (9) (10) (11) (12) Working capital. |
(13) National Program for Watering - Proni. |
(14) Rural Electricity Program -Luz para Todos. |
(15) Operation for the acquisition of machinery and/or equipment and IT and automation equipment. |
(16) BEL project - ultra wide band intranet service (Ultra Wide Band - UWB). |
(17) (37) Construction of the Mauá Hydroelectric Power Plant and its transmission system, in consortium with Eletrosul. |
(18) Implementation of transmission line between substations Foz do Iguaçu and Cascavel Oeste. |
(19) Purchase of machinery and equipment for implementation of the transmission line described above. |
(20) Implementation of Cavernoso II SHP. |
(21) Implementation of HPP Colíder and associated transmission system. |
(22) Implementation of the 230/138kV Cerquilho III Substation. |
(23) Implementation of transmission line Assis – Paraguaçu Paulista II. |
(24) Implementation of transmission lines Londrina – Figueira and Salto Osório – Foz do Chopim C2. |
(25) Implementation of HPP Baixo Iguaçu and associated transmission system. |
(26) Investment in preservation of businesses, improvements, operational support and general investments in expansion. |
(27) National machinery and equipment accredited by BNDES. |
(28) Implementation, expansion and consolidation of projects and Enterprises Social Investment Programs (ISE). |
(29) (30) (31) Construction and implementation of wind generating plant. |
(32) Implementation of Transmission Line 230 kV between SE Cascavel Oeste and SE Umuarama Sul andimplementation of SE Umuarama Sul 230/138 kV. |
(33) Acquisition of domestic machinery and equipment for implementation of the aforementioned project. |
(34) Implementation of Transmission Line 525 kV between SE Curitiba Leste and implementation of SE Curitiba Leste 525/230 kV. |
(35) Acquisition of domestic machinery and equipment for implementation of the aforementioned project. |
(36) Payment of the first installment of debentures and cash enhancement of Copel Get. |
77
![]()
Guarantees: |
(1) Company’s centralized revenues account. Deposited Collateral (23.1). |
(2) (3) Pledge until 360 days. |
(2) (3) (4) (5) (6) (7) (8) (9) (10) (11) (12) (19) Credit assignment. |
(13) (14) Own revenue, supported by power of attorney granted by a public instrument, and the issue of promissory notes and commercial duplicates equal to the number of installments falling due. |
(15) Fiduciary assignment of trade notes. |
(16) Withhold the amounts from the checking account in which revenues are deposited. |
(17) (20) (37) Total revenue from the sale and/or transaction of CCEAR energy, related to the project, through Concession Agreement of Attachment of Revenues, Account Management and Other Covenants. |
(18) (19) Fiduciary assignment of rights under the Concession Agreement No. 027/2009-ANEEL, Transmission Service Provision Contract No. 09/2010-ONS and contracts for use of Transmission System, signed by the ONS, the Dealerships and the Transmission System users, including the total income from the provision of transmission services. |
(21) Fiduciary assignment of rights under the Concession Agreement No. 01/2011MME-HPP Colíder and fiduciary assignment due to the Purchase and Sale of Electric Energy (CCVEE) between Copel and BRF - Brasil Foods S.A. |
(22) Fiduciary assignment of rights under the Public Service Concession Agreement for Electric Power Transmission No. 015/2010-ANEEL, signed between Copel and the Federal Government. |
(23) Assignment of credit rights deriving from Concession Agreement No. 002/2013 - ANEEL. |
(24) Assignment of credit rights deriving from Concession Agreement No. 022/2012 - ANEEL. |
(25) Fiduciary assignment, pursuant to paragraph 3 of article 66-B of Law 4,728, dated July 7, 1965, (i) of its share of the rights from the concession it holds as a result of the Concession Agreement of Use of Public Property for the generation of Electric Energy nº 02/2012-MME-UHE Baixo Iguaçu, of August 20, 2012. |
(26) (27) (28) Surety of Companhia Paranaense de Energia; fiduciary assignment of income and indemnity rights of the concession. |
(29) Guarantee from Companhia Paranaense de Energia; pledge of shares; assignment of credit rights deriving from Electricity Agreement Reservation No. 153/2011; assignment of revenues arising from the project. |
(30) Pledge of shares (GE Farol, GE Boa Vista, GE São Bento do Norte and GE Olho D'Água); assignment of receivables arising from the sale of electricity produced by the project; assignment of machinery and equipment assembled or built with the funds pegged to it. |
(31) Pledge of shares; assignment of fiduciary receivables. |
(32) (33) Fiduciary Assignment of the rights arising from the Concession Agreement 001/2012 and 100% of the shares seized in favor of the BNDES until the loan is discharged. |
(34) (35) Fiduciary Assignment of the rights arising from the Concession Agreement 008/2012 and 100% of the shares seized in favor of the BNDES until the loan is discharged. |
(36) Surety of Companhia Paranaense de Energia. |
22.1 Collateral and escrow deposits - STN
These are guarantees provided in the form of cash deposits, Par Bonds of R$ 52,717 (R$ 44,548 in 2017) and Discount Bonds in the amount of R$ 36,838 (R$ 31,117 in 2017), to be used to repay amounts of principal corresponding to STN contracts, when these payments are due on April 11, 2024. The amounts are updated by applying the weighted average percentage changes of United States Treasury Zero Coupon bond prices, by the share of each series of the instrument in the portfolio of collateral for principal, provided in the context of the Brazilian Financing Plan enacted in 1992.
78
![]()
22.2 Breakdown of borrowings by currency and index
Consolidated |
|
|
|
|
|
|
| 12.31.2018 | % | 12.31.2017 | % |
Foreign currency - change in currencies in the period (%) |
|
|
|
|
|
U.S. Dollar | 17.13 | 104,751 | 2.59 | 89,270 | 2.37 |
| 104,751 | 2.59 | 89,270 | 2.37 | |
Local currency - accumulated index in the period (%) |
|
|
|
|
|
CDI | 6.40 | 1,410,479 | 34.85 | 1,695,042 | 45.09 |
TJLP | 7.03 | 2,245,786 | 55.49 | 1,629,198 | 43.34 |
TR | 0.00 | 4,842 | 0.12 | 7,482 | 0.20 |
IPCA | 3.75 | 11,992 | 0.30 | 15,384 | 0.41 |
Without indexer (annual fixed rate) | - | 269,457 | 6.65 | 323,129 | 8.59 |
| 3,942,556 | 97.41 | 3,670,235 | 97.63 | |
|
| 4,047,307 | 100.00 | 3,759,505 | 100.00 |
22.3 Maturity of non-current installments
Parent Company | Consolidated | |||||
12.31.2018 | Foreign currency | Local currency | Total | Foreign currency | Local currency | Total |
2020 | - | 354,047 | 354,047 | - | 558,069 | 558,069 |
2021 | - | 316,291 | 316,291 | - | 503,246 | 503,246 |
2022 | - | - | - | - | 190,244 | 190,244 |
2023 | - | - | - | - | 188,586 | 188,586 |
2024 | 103,646 | - | 103,646 | 103,646 | 184,691 | 288,337 |
After 2024 | - | - | - | - | 1,205,778 | 1,205,778 |
| 103,646 | 670,338 | 773,984 | 103,646 | 2,830,614 | 2,934,260 |
22.4 Changes in borrowings
Parent Company | Foreign currency | Local currency | Total |
Balance as of January 1, 2017 | 90,505 | 924,855 | 1,015,360 |
Funding | - | 77,000 | 77,000 |
Charges | 3,868 | 101,575 | 105,443 |
Monetary and exchange variations | (1,184) | - | (1,184) |
Amortization - principal | - | (83,000) | (83,000) |
Payment - charges | (3,919) | (123,588) | (127,507) |
Balance as of December 31, 2017 | 89,270 | 896,842 | 986,112 |
Charges | 5,038 | 64,406 | 69,444 |
Monetary and exchange variations | 15,161 | - | 15,161 |
Amortization - principal | - | (77,000) | (77,000) |
Payment - charges | (4,718) | (85,614) | (90,332) |
Balance as of December 31, 2018 | 104,751 | 798,634 | 903,385 |
79
![]()
Consolidated | Foreign currency | Local currency | Total |
Balance as of January 1, 2017 | 90,505 | 3,955,788 | 4,046,293 |
Funding | - | 800,044 | 800,044 |
Charges | 3,868 | 395,081 | 398,949 |
Monetary and exchange variations | (1,184) | 18,623 | 17,439 |
Amortization - principal | - | (971,187) | (971,187) |
Payment - charges | (3,919) | (528,114) | (532,033) |
Balance as of December 31, 2017 | 89,270 | 3,670,235 | 3,759,505 |
Effect of acquisition of control of Costa Oeste and Marumbi | - | 66,775 | 66,775 |
Funding | - | 1,314,766 | 1,314,766 |
Charges | 5,038 | 289,365 | 294,403 |
Monetary and exchange variations | 15,161 | 11,936 | 27,097 |
Amortization - principal | - | (1,126,144) | (1,126,144) |
Payment - charges | (4,718) | (284,377) | (289,095) |
Balance as of December 31, 2018 | 104,751 | 3,942,556 | 4,047,307 |
22.5 Covenants
The Company and its subsidiaries signed borrowings agreements containing covenants that require economic and financial ratios to be maintained within pre-determined parameters, requiring annual fulfillment and other conditions to be complied with, such as not changing the Company’s interest in the capital stock of subsidiaries that would represent change of control without prior consent. Failing to fulfill these conditions may lead to accelerated debt repayment and/or fines.
As of December 31, 2018, the Company is in compliance with all covenants.
The financial covenants contained in the borrowings agreements are presented below:
Company | Contract | Annual financial index | Limit |
Copel GeT | BNDES Finem nº 820989.1 - Mauá | EBITDA / Net financial results | ≥ 1.3 |
Banco do Brasil nº 21/02000-0 - Mauá | |||
3rd issue of Promissory Notes | Consolidated net debt / Consolidated EBITDA | ≤ 3.5 | |
Copel DIS | BNDES Finem nº 14205611 | Financial indebtedness / adjusted EBITIDA | ≤ 4.0 |
Santa Maria | BNDES Finem nº 14212711 | Debt service coverage ratio | ≥ 1.3 |
Santa Helena | BNDES Finem nº 14212721 | ||
São Bento Energia, Investimento e Participações | BNDES Assignment Agreement | Debt service coverage ratio | ≥ 1.3 |
GE Boa Vista S.A. | BNDES Finem nº 11211531 | ||
GE Farol S.A. | BNDES Finem nº 11211521 | ||
GE Olho D´Água S.A. | BNDES Finem nº 11211551 | ||
GE São Bento do Norte S.A. | BNDES Finem nº 11211541 | ||
Cutia | BNDES Finem nº 18204611 | Debt service coverage ratio | ≥ 1.2 |
Costa Oeste | BNDES Finem nº 14205851 - A | Debt service coverage ratio | ≥ 1,3 |
Marumbi | BNDES Finem nº 14205851 - B | Debt service coverage ratio | ≥ 1,3 |
Financing for businesses - Finem |
|
|
|
80
![]()
23 Debentures
|
| Issue | Number of | Maturity | Annual rate p.y. |
|
| Consolidated | |
Issue | Company | Date | installment | initial | final | (interest) | Principal | 12.31.2018 | 12.31.2017 |
(1) 5th | Copel | 05.13.2014 | 3 | 05.13.2017 | 05.13.2019 | 111.5% of DI | 1,000,000 | 336,139 | 672,537 |
(2) 6th | Copel | 06.28.2017 | 1 | - | 06.28.2019 | 117.0% of DI | 520,000 | 585,540 | 542,944 |
(3) 7th | Copel | 01.19.2018 | 2 | 01.19.2020 | 01.19.2021 | 119.0% of DI | 600,000 | 616,401 | - |
(4) 1st | Copel GeT | 05.15.2015 | 3 | 05.15.2018 | 05.15.2020 | 113.0% of DI | 1,000,000 | 695,328 | 1,059,822 |
(5) 2nd | Copel GeT | 07.13.2016 | 2 | 07.13.2018 | 07.13.2019 | 121.0% of DI | 1,000,000 | 514,993 | 1,037,570 |
(6) 3rd | Copel GeT | 10.20.2017 | 3 | 10.20.2020 | 10.20.2022 | 126.0% of DI | 1,000,000 | 1,003,715 | 999,442 |
(7) 4th | Copel GeT | 07.23.2018 | 3 | 07.23.2021 | 07.23.2023 | 126.0% of DI | 1,000,000 | 1,017,858 | - |
(8) 5th | Copel GeT | 09.25.2018 | 5 | 09.15.2021 | 09.15.2025 | IPCA + 7.6475% | 290,000 | 286,199 | - |
(9) 2nd | Copel DIS | 10.27.2016 | 2 | 10.27.2018 | 10.27.2019 | 124.0% of DI | 500,000 | 250,943 | 502,179 |
(10) 3rd | Copel DIS | 10.20.2017 | 2 | 10.20.2021 | 10.20.2022 | 126.0% of DI | 500,000 | 502,640 | 501,810 |
(11) 4th | Copel DIS | 09.27.2018 | 3 | 09.27.2021 | 09.27.2023 | DI + spread 2.70% | 1,000,000 | 1,003,524 | - |
(12) 1st | Copel TEL | 10.15.2015 | 5 | 10.15.2020 | 10.15.2024 | IPCA + 7.9633% | 160,000 | 186,783 | 184,506 |
(13) 2nd | Copel TEL | 07.15.2017 | 1 | - | 07.15.2022 | IPCA + 5.4329% | 220,000 | 232,131 | 215,675 |
(14) 2nd | (a) | 03.24.2016 | 192 | 08.15.2016 | 07.15.2032 | TJLP + 2.02% | 147,575 | 128,243 | 135,662 |
(15) 2nd | (a) | 03.24.2016 | 192 | 08.15.2016 | 07.15.2032 | IPCA + 9.87% | 153,258 | 140,043 | 145,786 |
(16) 2nd | Elejor | 09.26.2013 | 60 | 10.26.2013 | 09.26.2018 | DI + Spread 1.00% | 203,000 | - | 30,370 |
(17) 1st | Compagás | 12.16.2013 | 40 | 09.15.2015 | 12.15.2018 | TJLP+1.7% p.y.+1.0% | 66,626 | - | 19,214 |
(18) 2nd | Compagás | 04.15.2016 | 54 | 07.15.2017 | 12.15.2021 | TJLP/Selic + 2.17% | 33,620 | 17,651 | 23,461 |
|
|
|
|
|
|
|
| 7,518,131 | 6,070,978 |
| Current | 2,184,881 | 1,632,062 | ||||||
|
|
|
|
|
|
| Noncurrent | 5,333,250 | 4,438,916 |
(a) Nova Asa Branca I, Nova Asa Branca II, Nova Asa Branca III, Nova Eurus IV e Ventos de Santo Uriel. | |||||||||
Characteristics: | |||||||||
(1) (2) (3) (4) (5) (6) (7) (8) (9) (10) (11) (12) (13) (16) Simple debentures, single series, not convertible into shares, unsecured, for public | |||||||||
distribution with restricted placement efforts, according to CVM No. 476. | |||||||||
(14) Simple debentures, 1st serie, issued privately and not convertible into shares. | |||||||||
(15) Simple debentures, 2nd serie, issued privately and not convertible into shares. | |||||||||
(17) (18) Simple floating debentures, issued privately in a single series and not convertible into shares. | |||||||||
Finance charges: | |||||||||
(1) Half-yearly interest - May and November. | |||||||||
(2) Interest on the maturity of the agreement - June | |||||||||
(3) (7) (13) Half-yearly interest - January and July. | |||||||||
(4) Annual interest - May. | |||||||||
(5) Annual interest - July. | |||||||||
(6) (10) (12) Half-yearly interest - April and October. | |||||||||
(8) (11) Half-yearly interest - March and September. | |||||||||
(9) Annual interest - October. | |||||||||
(14) (15) (16) Monthly interest. | |||||||||
(17) (18) Quarterly interest - March, June, September and December. | |||||||||
Allocation: | |||||||||
(1) (2) (3) (4) (5) (6) (9) (10) Working capital or used to make investments in the issuer. | |||||||||
(7) Full early redemption of the 4th issue of the Company’s trade promissory notes and partial payment of the 1st amortizationinstallment of the 2nd issue of debentures. | |||||||||
(8) Reimbursement of expenses related to the Construction Project of the Transmission Lines in: Araraquara II - Taubaté, Assis - Londrina and Foz do Chopim. | |||||||||
(11) Working capital and payment of the 1st installment of amortization of the 2nd issue of debentures | |||||||||
(12) (13) Deployment, expansion and modernization of the telecommunication network. | |||||||||
(14) (15) Implementation of wind farms and associated transmission systems. | |||||||||
(16) Full settlement of the loan agreement with Copel. | |||||||||
(17) (18) Fund investment plan of the issuer. | |||||||||
Collaterals: | |||||||||
(1) (2) (3) (4) (5) (6) (7) (8) (9) (10) (11) (12) (13) (16) Personal guarantee | |||||||||
(14) (15) Real and personal guarantee and pledge of Copel Geração e Transmissão's shares. | |||||||||
(17) (18) Floating | |||||||||
Guarantor: | |||||||||
(1) (2) (3) (4) (5) (6) (7) (8) (9) (10) (11) (12) (13) (14) (15) Copel. | |||||||||
(16) Copel, at the ratio of 70% and Paineira Participações S.A., at the ratio of 30%. | |||||||||
(17) (18) Compagás. | |||||||||
Trustee: | |||||||||
(1) (2) (3) (4) (5) (6) (7) (8) (9) (10) (11) (12) (13) (16) Pentágono S.A. DTVM. | |||||||||
(14) (15) None. | |||||||||
(17) (18) BNDES Participações S.A. - BNDESPAR. | |||||||||
81
![]()
23.1 Maturity of non-current installments
12.31.2018 | Parent Company | Consolidated |
2020 | 298,202 | 995,390 |
2021 | 298,201 | 1,631,912 |
2022 | - | 1,588,014 |
2023 | - | 784,214 |
2024 | - | 128,112 |
After 2024 | - | 205,608 |
| 596,403 | 5,333,250 |
23.2 Changes in debentures
| Parent Company | Consolidated |
Balance as of January 1, 2017 | 1,017,099 | 4,790,809 |
Funding | 520,000 | 2,242,521 |
Charges and monetary variations | 125,969 | 575,468 |
Amortization - principal | (333,300) | (915,005) |
Payment - charges | (114,287) | (622,815) |
Balance as of December 31, 2017 | 1,215,481 | 6,070,978 |
Funding | 600,000 | 2,890,283 |
Charges and monetary variations | 120,422 | 549,539 |
Amortization - principal | (333,300) | (1,491,667) |
Payment - charges | (64,523) | (501,002) |
Balance as of December 31, 2018 | 1,538,080 | 7,518,131 |
82
![]()
23.3 Covenants
Copel and its subsidiaries issued debentures containing covenants that require the maintenance of certain economic and financial ratios within pre-determined parameters, requiring annual fulfillment and other conditions to be complied with, such as not changing the Company’s interest in the capital stock that would represent change of control without prior consent from the debenture holders; not paying out dividends or interest on capital if it is in arrears in relation to honoring any of its financial obligations or not maintaining the financial ratios as determined without prior written consent of the debenture holders. Failing to fulfill these conditions may lead to accelerated redemption of debentures and regulatory penalties.
As of December 31, 2018, the subsidiaries Nova Asa Branca I Energias Renováveis S.A., Nova Asa Branca II Energias Renováveis S.A., Nova Asa Branca III Energias Renováveis S.A., Nova Eurus IV Energias Renováveis S.A. and Ventos de Santo Uriel did not comply with the Debt Service Coverage Ratio - ICSD of 1.3, when calculating the rate without considering the value of the compensation to suppliers of goods (Note 32.6 – b). On December 28, 2018, the Company requested preventively and received a letter from BNDES, referring to AE/DEENE2 No. 101/2018, not declaring accelerated maturity of the debentures in 2018. Except for the foregoing, as of December 31, 2018, the Company is in compliance with all covenants.
The financial covenants contained in the debenture agreements are presented as follow:
Company | Contract | Annual financial index | Limit |
Copel | 5th issue de Debentures | Consolidated net debt / Consolidated EBITDA | ≤ 3.5 |
6th issue de Debentures | |||
7th issue de Debentures | |||
Copel GeT | 1st issue de Debentures | ||
2nd issue de Debentures | |||
3rd issue de Debentures | |||
4th issue de Debentures | |||
5th issue de Debentures | |||
Copel DIS | 2nd issue de Debentures | ||
3rd issue de Debentures | |||
4th issue de Debentures | |||
Copel TEL | 1st issue de Debentures | ||
2nd issue de Debentures | |||
Compagás | 1st issue de Debentures | Net debt / EBITDA | ≤ 3.5 |
2nd issue de Debentures | General Indebtedness | ≤ 0.7 | |
Nova Asa Branca I | 2nd issue de Debentures | Debt service coverage ratio | ≥ 1.3 |
Nova Asa Branca II | |||
Nova Asa Branca III | |||
Nova Eurus IV | |||
Ventos de Santo Uriel |
83
![]()
24 Post-employment benefits
Copel and its subsidiaries sponsors private retirement and pension plans (Unified Plan and Plan III) and Healthcare Plan for medical and dental care (“ProSaúde II” and “ProSaúde III” Plans) for their active employees and their dependents. The lifetime sponsorship of the Healthcare Plan for retirees, pensioners and legal dependents is only applied to “Prosaúde II” plan participants.
The amounts of these actuarial obligations (contributions, costs, liabilities, and/or assets) are calculated annually by an independent actuary at year end.
The benefits plan assets are measured at market values (mark-to-market).
The amount of the net assistance liability is recognized at the present value of the actuarial liability, less the fair value of the plan assets.
Under the projected credit unit method adopted, each year of service triggers an additional benefit unit, which are added up to determine the final liability.
Other actuarial assumptions are used, which take into account biometric and economic tables in addition to historical data from the benefits plans, obtained from the manager of these plans, Fundação Copel de Previdência e Assistência Social.
Actuarial gains or losses caused by changes in assumptions and/or actuarial adjustments are recognized in other comprehensive income.
24.1 Pension Plan
The Unified Plan is a Defined Benefit plan - BD in which the income is predetermined, according to each individual’s salary. This plan has been a closed plan for new participants since 1998.
The Plan III is a Variable Contribution plan – CV, being the only plan available for new participants.
The costs assumed by the sponsors for these plans are recognized according to the actuarial evaluation prepared annually by independent actuaries in accordance with CPC 33 (R1) Employees and Benefits, correlated to IAS 19 and IFRIC 14. The economic and financial assumptions for purposes of the actuarial valuation are discussed with the independent actuaries and approved by management.
24.2 Healthcare Plan
Copel and its subsidiaries allocate resources for the coverage of healthcare expenses incurred by their employees and their dependents, within rules, limits and conditions set in “ProSaúde II” and “ProSaúde III” Plans’ regulations. Coverage includes periodic medical exams in both plans and is only extended to all retirees and pensioners for life in the “ProSaúde II” plan.
84
![]()
24.3 Balance sheet and statement of income
Amounts recognized in liabilities, under Post-employment Benefits, are summarized below:
. |
| Parent Company |
| Consolidated |
| 12.31.2018 | 12.31.2017 | 12.31.2018 | 12.31.2017 |
Pension plans | 7 | 12 | 1,149 | 1,069 |
Healthcare plans | 4,947 | 4,040 | 967,614 | 865,034 |
| 4,954 | 4,052 | 968,763 | 866,103 |
Current | 87 | 57 | 58,478 | 53,225 |
Noncurrent | 4,867 | 3,995 | 910,285 | 812,878 |
Amounts recognized in the statement of income are shown below:
. |
| Parent Company |
| Consolidated |
| 12.31.2018 | 12.31.2017 | 12.31.2018 | 12.31.2017 |
Employees |
|
|
|
|
Pension plans | 523 | 606 | 78,209 | 78,680 |
Healthcare plan - post employment | 563 | 519 | 97,866 | 97,511 |
Healthcare plan - active employees | 816 | 341 | 86,580 | 81,617 |
(-) Transfers to construction in progress | - | - | (20,630) | (21,901) |
1,902 | 1,466 | 242,025 | 235,907 | |
Management |
|
|
|
|
Pension plans | 344 | 392 | 1,598 | 1,500 |
Healthcare plan | 40 | 85 | 127 | 190 |
| 384 | 477 | 1,725 | 1,690 |
| 2,286 | 1,943 | 243,750 | 237,597 |
24.4 Changes in post-employment benefits
| Parent Company | Consolidated |
Balance as of January 1, 2017 | 3,705 | 769,865 |
Appropriation of actuarial calculation | 519 | 97,511 |
Appropriation of pension and healthcare contributions | 2,471 | 153,069 |
Adjustment related to actuarial gains (loss) | (18) | 46,506 |
Amortizations | (2,625) | (200,848) |
Balance as of December 31, 2017 | 4,052 | 866,103 |
Appropriation of actuarial calculation | 563 | 97,900 |
Appropriation of pension and healthcare contributions | 5,860 | 151,215 |
Adjustment related to actuarial gains (loss) | 408 | 58,354 |
Amortizations | (5,929) | (204,809) |
Balance as of December 31, 2018 | 4,954 | 968,763 |
24.5 Actuarial valuation in accordance with CPC 33 (R1)
24.5.1 Actuarial assumptions
The actuarial assumptions used to determine the amounts of liabilities and costs for 2018 and 2017 are shown below:
85
![]()
Consolidated |
| 2018 |
| 2017 |
| Real | Nominal | Real | Nominal |
Economic |
|
|
|
|
Inflation p.y. | - | 4.00% | - | 4.50% |
Expected rate of discount/return p.y. |
|
|
|
|
Unified Plan | 4.60% | 8.78% | 5.11% | 9.84% |
Plan III | 4.60% | 8.78% | 5.24% | 9.97% |
Assistance Plan | 4.60% | 8.78% | 5.20% | 9.94% |
Salary growth |
|
|
|
|
Unified Plan p.y. | 2.00% | 6.08% | 2.00% | 6.59% |
Plan III p.y. | 1.50% | 5.56% | 1.50% | 6.07% |
Demographic |
|
|
|
|
Mortality Table |
| AT - 2000 |
| AT - 2000 |
Mortality table of individuals with permanent disability |
| WINKLEVOSS |
| WINKLEVOSS |
Table of new disability benef it vested |
| TASA 1927 |
| TASA 1927 |
24.5.2 Number of participants and beneficiaries
Consolidated | Social Security Plans |
| ||||
Unified Plan | Plan III | Assistance Plan | ||||
| 12.31.2018 | 12.31.2017 | 12.31.2018 | 12.31.2017 | 12.31.2018 | 12.31.2017 |
Number of active participants | 33 | 37 | 8,180 | 8,540 | 7,427 | 8,172 |
Number of Inactive participants | 4,368 | 4,435 | 3,843 | 3,509 | 8,174 | 7,703 |
Number of dependent people | - | - | - | - | 22,472 | 23,081 |
Total | 4,401 | 4,472 | 12,023 | 12,049 | 38,073 | 38,956 |
24.5.3 Life expectancy after the average age of participants – Annuity Table AT-2000 (in years)
Consolidated | Unified Plan | Plan III |
As of 12.31.2018 |
|
|
Retired participants | 14.37 | 22.74 |
Pensioner participants | 15.68 | 27.21 |
As of 12.31.2017 |
|
|
Retired participants | 14.92 | 23.01 |
Pensioner participants | 16.37 | 27.99 |
|
|
|
The average age of inactive participants of the healthcare and pension plans of Copel and its subsidiaries is 67.3 and 66.8 years, respectively.
24.5.4 Actuarial evaluation
Based on the review of the assumptions, the amounts of the Unified Plan and Plan III as of December 31, 2018, respectively, totaled a surplus of R$ 376,077 and R$ 32,732, while, as of December 31, 2017, the position was, respectively, R$ 481,678 and R$ 86,487. The current applicable legislation does not permit any significant reduction in contributions or reimbursements to the Company based on the current surplus in this plan. For this reason, the Company did not record assets on its December 31, 2018 balance sheet that reflect any such right to reduce contributions or refund surplus or other amounts.
86
![]()
Consolidated | Unified | Plan | Assistance | 12.31.2018 | 12.31.20167 |
Total liabilities or partially covered | 5,914,764 | 2,145,504 | 1,140,605 | 9,200,873 | 8,123,419 |
Fair value of the plan assets | (6,290,841) | (2,178,236) | (172,991) | (8,642,068) | (7,826,550) |
Plan coverage status | (376,077) | (32,732) | 967,614 | 558,805 | 296,869 |
Unrecognized asset | 376,077 | 32,732 | - | 408,809 | 568,165 |
| - | - | 967,614 | 967,614 | 865,034 |
Copel and its subsidiaries made adjustments to their assistance liabilities through the actuarial report issued on December 31, 2018, when an actuarial gain of R$ 58,354 was recorded in other comprehensive income, corresponding to an increase ascertained on that base date.
24.5.5 Changes in actuarial liabilities
Consolidated | Unified Plan | Plan III | Assistance Plan |
Present value of net actuarial obligations as of January 1, 2017 | 4,951,078 | 1,565,121 | 933,914 |
Cost of services | 329 | 10,502 | 9,225 |
Cost of interest | 563,257 | 176,878 | 105,987 |
Benefits paid | (406,023) | (122,841) | (7) |
Actuarial (gain) losses | 244,253 | 104,908 | (13,162) |
Present value of net actuarial obligations as of December 31, 2017 | 5,352,894 | 1,734,568 | 1,035,957 |
Cost of services | 589 | 9,604 | 11,633 |
Cost of interest | 533,201 | 195,991 | 102,916 |
Benefits paid | (414,256) | (133,281) | (7) |
Actuarial (gain) losses | 442,336 | 338,779 | (9,894) |
Present value of net actuarial obligations as of December 31, 2018 | 5,914,764 | 2,145,661 | 1,140,605 |
24.5.6 Changes in actuarial assets
Consolidated | Unified Plan | Plan III | Assistance Plan |
Fair value of the Plan's assets as of January 1, 2017 | 5,478,802 | 1,793,516 | 165,301 |
Return estimated for assets | 546,699 | 202,691 | 23,934 |
Contributions and distributions | 30,520 | 10,505 | - |
Benefits paid | (406,023) | (122,841) | - |
Actuarial gain (losses) | 184,574 | (62,816) | (18,312) |
Fair value of the Plan's assets as of December 31, 2017 | 5,834,572 | 1,821,055 | 170,923 |
Return estimated for assets | 593,572 | 230,703 | 16,579 |
Contributions and distributions | 24,011 | 9,184 | - |
Benefits paid | (414,256) | (133,281) | - |
Actuarial gain (losses) | 252,942 | 250,575 | (14,511) |
Fair value of the Plan's assets as of December 31, 2018 | 6,290,841 | 2,178,236 | 172,991 |
24.5.7 Estimated costs
The estimated net periodic plan costs (gains) for 2019 for each plan are shown below:
Consolidated | Unified Plan | Plan III | Assistance Plan | 2018 |
Cost of current service | 560 | 4,098 | 14,306 | 18,964 |
Estimated cost of interest | 477,731 | 128,060 | 106,004 | 711,795 |
Expected return on plan assets | (584,972) | (180,750) | (20,733) | (786,455) |
Expected employee contributions | (213) | (2,049) | - | (2,262) |
Costs (income or loss) | (106,894) | (50,641) | 99,577 | (57,958) |
87
![]()
24.5.8 Sensitivity Analysis
The following tables set out a sensitivity analysis, which shows the effect of a one percent increase or decrease in the assumed care costs, in the aggregate of the cost of service and cost of interest components and the accumulated post-employment benefit obligation.
Consolidated | Projected scenarios | |
| Increase by 1% | Decrease in 1% |
Sensitivity of long-term interest rate |
|
|
Impacts on the obligations of the pension | (382,458) | 587,106 |
Impacts on the obligations of healthcare program | (182,573) | 182,573 |
Sensitivity of growth rate of the medical costs |
|
|
Impacts on the obligations of healthcare program | 79,801 | (74,557) |
Impact on cost of service for the following financial year of healthcare program | 982 | (918) |
Sensitivity of the service cost |
|
|
Impacts on the obligations of the pension | (64) | 98 |
Impacts on the obligations of healthcare program | (2,260) | 2,260 |
|
|
|
24.5.9 Benefits payable
The estimated benefits to be paid by Copel and its subsidiaries in the next five years and the total benefits for the following fiscal years are shown below:
Consolidated | Unified Plan | Plan III | Assistance Plan | Total |
2019 | 354,069 | 148,236 | 47,519 | 549,824 |
2020 | 340,372 | 192,004 | 52,063 | 584,439 |
2021 | 326,924 | 198,083 | 51,821 | 576,828 |
2022 | 313,390 | 199,913 | 51,146 | 564,449 |
2023 | 300,346 | 198,714 | 49,950 | 549,010 |
2024 a 2048 | 3,072,612 | 3,110,140 | 645,610 | 6,828,362 |
24.5.10 Asset allocation and investment strategy
The asset allocation for Copel and its subsidiaries pension and healthcare plans at the end of 2018 and the allocation goal for 2019, by asset category, are shown below:
Consolidated | Goal for 2019 | 2018 |
Fixed income | 77.8% | 87.8% |
Variable income | 5.7% | 7.0% |
Loans | 2.0% | 1.6% |
Real estate | 3.8% | 1.6% |
Investment structuring | 8.1% | 2.0% |
Foreign investments | 2.6% | 0.0% |
| 100.0% | 100.0% |
88
![]()
In addition, information on the allocation of assets of pension plans sponsored by the Company:
Consolidated | Unified Plan | Plan III | ||
| target (%)(*) | minimum (%) | target (%) | minimum (%) |
Fixed income | 91.0% | 57.0% | 60.0% | 33.0% |
Variable income | 2.5% | 1.0% | 10.0% | 7.0% |
Loans | 0.5% | 0.0% | 4.0% | 1.0% |
Real estate | 3.0% | 1.0% | 5.0% | 0.0% |
Investment structuring | 3.0% | 0.0% | 15.0% | 0.0% |
Foreign investments | 0.0% | 0.0% | 6.0% | 0.0% |
(*) Target based on the total investment of each plan. | ||||
Management of Fundação Copel decided to keep a more conservative approach investing in variable income in relation to the allowed legal limit, which is 70%. | ||||
As of December 31, 2018, and 2017, the pension plan assets included the following securities issued by Copel:
Consolidated | Social Security Plans | |||
Unified Plan | Plan III | |||
| 31.12.2018 | 31.12.2017 | 31.12.2018 | 31.12.2017 |
Debentures | - | - | 4,166 | 6,729 |
Shares | 5 | - | 13 | - |
| 5 | - | 4,179 | 6,729 |
24.5.11 Additional information
Copel and its subsidiaries made contributions to Plan III (variable contribution plan) for all active employees at December 31, 2018 and 2017, in the amounts of R$ 77,797 and R$ 80,727, respectively.
Consolidated | 12.31.2018 | 12.31.2017 |
Energy Development Account - CDE | 73,549 | 121,912 |
Tariff flags | - | 22,427 |
Global Reversal Reserve - RGR | 6,323 | 5,686 |
| 79,872 | 150,025 |
26 Research and Development and Energy Efficiency
In accordance with Law No. 9,991/2000 and supplementary regulations, concession operators and licensees of electric power generation and transmission are required to allocate annually the percentage of 1% of their net operating regulatory revenue to research and development of the electricity sector activities, and the electric power distribution concession operators must segregate this same percentage into the research and development and energy efficiency programs of the electricity sector.
89
![]()
26.1 Balances recognized for investment in Research and Development (R&D) activities and the Energy Efficiency Program (EEP)
Consolidated | Amounts payable, before any related prepayments | Amounts payable to regulatory agencies | Other amounts payable |
|
|
| 12.31.2018 | 12.31.2017 | |||
Research and Development - R&D |
|
|
|
|
|
National Fund for Scientific and Technological Development - FNDCT | - | 4,725 | - | 4,725 | 5,232 |
MME | - | 2,361 | - | 2,361 | 2,616 |
R&D | 129,159 | - | 198,467 | 327,626 | 316,121 |
129,159 | 7,086 | 198,467 | 334,712 | 323,969 | |
Energy efficiency program - EEP |
|
|
|
|
|
National Program of Electricity Conservation - Procel | - | 15,792 | - | 15,792 | 6,041 |
EEP | 22,326 | - | 219,905 | 242,231 | 202,465 |
| 22,326 | 15,792 | 219,905 | 258,023 | 208,506 |
| 151,485 | 22,878 | 418,372 | 592,735 | 532,475 |
Current | 270,429 | 282,766 | |||
|
|
| Noncurrent | 322,306 | 249,709 |
26.2 Changes in R&D and EEP balances
Consolidated | FNDCT | MME | R&D | Procel | EEP | Total |
Balance as of January 1, 2017 | 4,603 | 2,302 | 294,088 | 4,932 | 177,964 | 483,889 |
Additions | 29,956 | 14,978 | 29,956 | 8,500 | 34,000 | 117,390 |
Performance agreement | - | - | - | - | 1,363 | 1,363 |
Selic interest rate (Note 33) | - | - | 19,544 | (128) | 14,929 | 34,345 |
Payments | (29,327) | (14,664) | - | (7,263) | - | (51,254) |
Concluded projects | - | - | (27,467) | - | (25,791) | (53,258) |
Balance as of December 31, 2017 | 5,232 | 2,616 | 316,121 | 6,041 | 202,465 | 532,475 |
Effect of acquisition of control |
|
|
|
|
| |
of Costa Oeste and Marumbi | 23 | 9 | 467 | - | - | 499 |
Additions | 31,186 | 15,595 | 31,188 | 9,067 | 36,270 | 123,306 |
Performance agreement | - | - | - | - | 2,063 | 2,063 |
Selic interest rate (Note 33) | - | - | 12,627 | 684 | 12,096 | 25,407 |
Payments | (31,716) | (15,859) | - | - | - | (47,575) |
Concluded projects | - | - | (32,777) | - | (10,663) | (43,440) |
Balance as of December 31, 2018 | 4,725 | 2,361 | 327,626 | 15,792 | 242,231 | 592,735 |
90
![]()
27 Accounts Payable Related to Concessions
Consolidated |
|
|
|
| Discount | Annual |
|
|
| Company | Grant | Signature | Closing | Rate | Adjustment | 12.31.2018 | 12.31.2017 |
(1) HPP Mauá | Copel GeT | 06.29.2007 | 07.03.2007 | 07.2042 | 5.65% p.y. | IPCA | 16,709 | 16,384 |
(2) HPP Colider | Copel GeT | 12.29.2010 | 01.17.2011 | 01.2046 | 7.74% p.y. | IPCA | 23,864 | 23,188 |
(3) HPP Baixo Iguaçu | Copel GeT | 07.19.2012 | 08.20.2012 | 01.2047 | 7.74% p.y. | IPCA | 7,412 | 6,977 |
(4) SHP Cavernoso | Copel GeT | 07.11.2013 | 07.11.2013 | 07.2018 | 7.74% p.y. | IPCA | - | 27 |
(5) HPP Apucaraninha | Copel GeT | 07.11.2013 | 07.11.2013 | 07.2018 | 7.74% p.y. | IPCA | - | 185 |
(6) HPP Chaminé | Copel GeT | 07.11.2013 | 07.11.2013 | 07.2018 | 7.74% p.y. | IPCA | - | 320 |
(7) HPP Derivação Rio Jordão | Copel GeT | 07.11.2013 | 02.24.2014 | 02.2019 | 7.74% p.y. | IPCA | 47 | 313 |
(8) HPP Fundão e HPP Santa Clara | Elejor | 10.23.2001 | 10.25.2001 | 10.2036 | 11.00% p.y. | IGPM | 536,131 | 507,560 |
|
|
|
|
|
|
| 584,163 | 554,954 |
|
|
|
|
|
| Current | 67,858 | 62,624 |
|
|
|
|
|
| Noncurrent | 516,305 | 492,330 |
Discount rate in the calculation of the present value | ||||||||
Real and net discount rate, compatible with the estimated long-term rate, not being linked to the expectation of return from the project. | ||||||||
Payment to the Union | ||||||||
Monthly Instalments equivalent to 1/12 of the annual adjusted payment, according to the concession contract. | ||||||||
27.1 Nominal value and present value of accounts payable related to concessions
Consolidated | Nominal value | Present value |
2019 | 68,001 | 67,858 |
2020 | 66,754 | 60,138 |
2021 | 66,754 | 54,296 |
2022 | 66,754 | 49,025 |
After 2022 | 1,027,917 | 352,846 |
| 1,296,180 | 584,163 |
27.2 Changes in accounts payable related to concessions
Balance as of January 1, 2017 | 565,542 |
Additions | 678 |
Adjust to present value | 1,432 |
Monetary variations | 53,173 |
Payments | (65,871) |
Balance as of December 31, 2017 | 554,954 |
Additions | 302 |
Adjust to present value | (114) |
Monetary variations | 93,386 |
Payments | (64,365) |
Balance as of December 31, 2018 | 584,163 |
91
![]()
28 Other Accounts Payable
Consolidated | 12.31.2018 | 12.31.2017 |
Customers (a) | 70,713 | 33,380 |
Obligations to customers in gas sales operations | 55,048 | 33,221 |
Investment acquisition | 32,200 | 12,307 |
Public lighting rate collected | 28,337 | 24,101 |
Aneel Order No. 084/2017 provision | 24,314 | 22,132 |
Financial offset for the use of water resources | 20,820 | 21,467 |
Fair value in the purchase and sale of power in the active market (Note 35.2.12) | 11,007 | - |
Pledges in guarantee | 10,026 | 8,837 |
Reimbursements to customer contributions | 5,036 | 5,481 |
Other liabilities | 51,523 | 33,328 |
| 309,024 | 194,254 |
Current | 192,070 | 121,405 |
Noncurrent | 116,954 | 72,849 |
(a) Of the balance of Customers, R$32,639 refers to amounts transferred from the Federal Government to Copel, in accordance with ANEEL Directive Release No. 565/2018, for the reimbursement of consumers due to the exceeding amount collected from the Net Operating Revenue in the period from January 2010 to December 2012. | ||
29 Provisions for Legal Claims and Contingent Liabilities
Copel and its subsidiaries are defendant in various judicial and administrative proceedings before different courts. Based on assessments made by the Company’s legal counsel, Management makes provisions for legal claims in which losses are rated probable, thus meeting the criteria for recognition of provisioning described in Note 4.11.
The Company’s Management believes that it is not practicable to provide information regarding the expected timing of any cash outflows resulting from these lawsuits in which the Company and its subsidiaries are involved, due to the slow pace and unpredictability of Brazilian legal, tax and regulatory systems, and since final resolution of the proceedings for which a provision has been registered depends on the conclusions of court proceedings.Therefore, this information is not being provided.
92
![]()
29.1 Provision for tax and civil risks
29.1.1 Changes in provisions for legal claims rated as involving probable losses
Consolidated |
| Income |
|
|
|
| ||
| Provision | Construction |
|
|
|
| ||
Balances as of | for litigations | cost | Additions |
| Transfers/ | Balances as of | ||
| January 1, 2018 | Additions | Reversals | Additions/(Rev.) | to assets | Discharges | Others | December 31, 2018 |
Tax |
|
|
|
|
|
|
|
|
Cofins (a) | 79,748 | 22,855 | - | - | - | - | - | 102,603 |
Others (b) | 58,793 | 7,722 | (26,695) | - | - | (6,325) | 20,999 | 54,494 |
138,541 | 30,577 | (26,695) | - | - | (6,325) | 20,999 | 157,097 | |
Labors (c) | 475,631 | 232,195 | (2,400) | - | - | (92,644) | - | 612,782 |
Employee benefits (d) | 89,439 | 11,089 | (10,062) | - | - | (5,267) | - | 85,199 |
Civil |
|
|
|
|
|
|
|
|
Civil and administrative claims (e) | 527,613 | 119,633 | (118,652) | - | - | (36,005) | 345 | 492,934 |
Easements (f) | 110,936 | 2,179 | (305) | (4,600) | 8,477 | (1,474) | 2,934 | 118,147 |
Expropriations and property (g) | 95,627 | 156 | (1,350) | 4,032 | 18,168 | (232) | - | 116,401 |
Customers (h) | 8,377 | 464 | (1,469) | - | - | (2,163) | - | 5,209 |
Environmental (i) | 1,584 | 2,570 | (562) | - | - | (61) | - | 3,531 |
744,137 | 125,002 | (122,338) | (568) | 26,645 | (39,935) | 3,279 | 736,222 | |
Regulatory (j) | 64,316 | 9,296 | (139) | - | - | - | - | 73,473 |
| 1,512,064 | 408,159 | (161,634) | (568) | 26,645 | (144,171) | 24,278 | 1,664,773 |
Current | 112,000 | Current | - | |||||
Noncurrent | 1,400,064 |
|
|
|
|
| Noncurrent | 1,664,773 |
Consolidated |
| Income |
|
|
|
| ||
| Provision | Construction |
|
|
|
| ||
Balances as of | for litigations | cost | Additions |
|
| Balances as of | ||
| January 1, 2017 | Additions | Reversals | Additions | to assets | Discharges | Transfers | December 31, 2017 |
Tax |
|
|
|
|
|
|
|
|
Cofins (a) | 93,892 | 8,888 | (23,032) | - | - | - | - | 79,748 |
Others (b) | 142,985 | 21,890 | (113,739) | - | - | (433) | 8,090 | 58,793 |
236,877 | 30,778 | (136,771) | - | - | (433) | 8,090 | 138,541 | |
Labors (c) | 458,901 | 122,992 | (18,518) | - | - | (87,744) | - | 475,631 |
Employee benefits (d) | 42,366 | 61,765 | (7,194) | - | - | (7,498) | - | 89,439 |
Civil |
|
|
|
|
|
|
|
|
Civil and administrative claims (e) | 295,484 | 255,280 | (3,240) | - | - | (28,074) | 8,163 | 527,613 |
Easements (f) | 99,380 | 4,593 | - | 4,503 | 2,641 | (181) | - | 110,936 |
Expropriations and property (g) | 65,712 | 848 | (701) | 24,285 | 5,499 | (16) | - | 95,627 |
Customers (h) | 5,228 | 3,884 | (286) | - | - | (449) | - | 8,377 |
Environmental (i) | 1,432 | 960 | (808) | - | - | - | - | 1,584 |
467,236 | 265,565 | (5,035) | 28,788 | 8,140 | (28,720) | 8,163 | 744,137 | |
Regulatory (j) | 67,958 | 1,648 | (5,290) | - | - | - | - | 64,316 |
| 1,273,338 | 482,748 | (172,808) | 28,788 | 8,140 | (124,395) | 16,253 | 1,512,064 |
Current | 112,000 | |||||||
|
|
|
|
|
|
| Noncurrent | 1,400,064 |
Parent company | Balance as of | Income |
| Balance as of | |
| January 1, 2018 | Additions | Reversals | Discharges | December 31, 2018 |
Tax |
|
|
|
|
|
Cofins (a) | 79,748 | 22,855 | - | - | 102,603 |
Others (b) | 24,365 | 5,768 | - | (93) | 30,040 |
104,113 | 28,623 | - | (93) | 132,643 | |
Labor (c) | 518 | 141 | (70) | (1) | 588 |
Civil (e) | 135,422 | 30,768 | (23,409) | (8) | 142,773 |
Regulatory (j) | 15,042 | 1,134 | - | - | 16,176 |
| 255,095 | 60,666 | (23,479) | (102) | 292,180 |
Current | 112,000 | Current | - | ||
Noncurrent | 143,095 |
|
| Noncurrent | 292,180 |
93
![]()
Parent company | Balance as of | Income |
| Balance as of | |
| Balances as of | Additions | Reversals | Discharges | December 31, 2017 |
Tax |
|
|
|
|
|
Cofins (a) | 93,892 | 8,888 | (23,032) | - | 79,748 |
Others (b) | 23,335 | 1,283 | - | (253) | 24,365 |
117,227 | 10,171 | (23,032) | (253) | 104,113 | |
Labor (c) | 18 | 511 | (4) | (7) | 518 |
Civil (e) | 20,578 | 114,844 | - | - | 135,422 |
Regulatory (j) | 15,121 | - | (79) | - | 15,042 |
| 152,944 | 125,526 | (23,115) | (260) | 255,095 |
Current | 112,000 | ||||
|
|
|
| Noncurrent | 143,095 |
29.1.2 Description of nature and/or details of the principal lawsuits
a) Contribution for Social Security Funding (COFINS)
Plaintiff :Federal Revenue of Brazil
Cofins payables and respective interest and fines from August 1995 to December 1996 due to the termination of a judicial decision that had recognized the Company’s exemption from Cofins.
Current status: awaiting judgment.
b) Other tax provisions
Lawsuits relating to federal, state and municipal taxes, fees and other charges.
c) Labor
Labor claims comprise claims filed by employees and former employees of Copel and its subsidiaries in connection with the payment of overtime differences, hazardous working conditions, transfer bonuses, salary equality/reclassification and other matters, and also claims by former employees of contractors and third- parties (secondary responsibility) involving indemnity and other matters.
d) Employee benefits
Labor claims comprise claims filed by retired former employees of the Company and its wholly-owned Controlled Companies against the Copel Foundation, which will have consequential impact on the Company and its wholly-owned subsidiaries, since additional contributions will be required.
e) Civil and administrative claims
Lawsuits involving billing, irregular procedures, administrative contracts and contractual fines, indemnity for accidents with the electric power network or vehicles.
The balance also contains amounts being discussed by arbitration under confidentiality, in the discovery phase, with no decision having been handed down to date.
The main lawsuit is described below:
94
![]()
Plaintiff: Tradener Ltda. Estimated amount: R$ 128.481
Class lawsuit No. 588/2006 has already been rendered final and unappeasable, and the ruling recognized as valid commissions payable by the Company to Tradener. In the civil public lawsuit No. 0000219- 78.2003.8.16.0004, filed by the Prosecution Office, a decision has also been rendered ruling on the absence of irregularities in the electric power purchase agreement. Therefore, Tradener brought recovery lawsuits, seeking to receive its commissions.
Current status:Case record 0005990.22.2012.8.16.0004 - the Company was ordered to pay the amount of R$ 107,955, the restated amount by reference to the INPC/IBGE variation, from the maturity of the commissions, plus interest of 1% per month, as from the date of notification (October 31, 2012), as well as attorneys’ fees. The Company filed an appeal against this decision, however, on November 8, 2016, by majority voting, the Court dismissed the appeal. Copel filed an application for Clarification of Ruling, which was partially granted for the ruling obscurity to be dispelled, although without changing the result of the appeal. Copel filed a Special Appeal, which was dismissed. Copel filed an Appeal to the Higher Court of Justice, which is pending judgment.
f) Easements
Lawsuits are filed challenging expropriation when there is a difference between the amount determined by Copel for payment and the amount claimed by the property owner and/or when the owner's documentation supporting title to the property may not be registered (when probate proceedings are still in progress, properties have no registry number with the land registry, etc.).
Cases may also arise from intervention in third-party adverse possession, either as a confronter, or in case of a property where there are areas of easement of passage, in order to preserve the limits and boundaries of expropriated areas.
g) Expropriations and property
Lawsuits are filed challenging expropriation when there is a difference between the amount determined by Copel for payment and the amount claimed by the property owner and/or when the owner's documentation supporting title to the property may not be registered (in case probate proceedings are still in progress, properties have no registry number with the land registry, etc.).
Possessory lawsuits include those for repossession of property owned by the concession operator. Litigation arises when there is a need to repossess properties invaded or occupied by third parties in areas owned by the Company. Cases may also arise from intervention in third-party adverse possession, or owners or occupants of contiguous properties or even in cases of properties to preserve limits and boundaries of expropriated areas.
The main lawsuits are as follows:
Plaintiff: property owner Estimated value: R$ 39.399
95
![]()
Expropriation lawsuit for construction of electric substation discussing the indemnity amount.
Current status: lawsuit awaiting judgment at higher court.
Autor: property owner Estimated value: R$ 22.449
Lawsuit for the expropriation of the area used for the reservoir of the Mauá Plant filed by Consórcio Energético Cruzeiro do Sul, in which Copel GeT participates with 51%, which discusses the indemnity amount of the property that is in a submerged part.
Current status: Lower court decision, motions to clarify were filed, which have not yet been judged.
h) Consumers
Lawsuits seeking compensation for damages caused in household appliances, industrial and commercial machines, lawsuits claiming damages for pain and suffering caused by service interruption and lawsuits filed by industrial consumers challenging the lawfulness of the increase in electricity prices while Plano Cruzado (anti-inflation economic plan) was in effect and claiming reimbursement for the amounts paid by the Company.
i) Environmental
Class lawsuits whose purpose is to obstruct the progress of environmental licensing for new projects or to recover permanent preservation areas located around the hydroelectric power plant dams unlawfully used by private individuals. If the outcome of the lawsuits is unfavorable to the Company, Management estimates only the cost to prepare new environmental studies and to recover the areas owned by Copel GeT.
They also include the Commitment Agreements (TAC), which refer to the commitments agreed-upon and approved between the Company and the relevant bodies for noncompliance with any condition provided for by the Installation and Operating Licenses.
j) Regulatory
The Company is challenging, both at the administrative and judicial levels, notifications issued by the Regulatory Agency of alleged violations against regulations. The principal action is described below:
Plaintiffs: Companhia Estadual de Energia Elétrica - CEEE and Dona Francisca Energética S.A.
Estimated amount: R$ 53.120
Copel, Copel GeT and Copel DIS are challenging lawsuits filed against ANEEL's decision No. 288/2002 involving these companies.
Current status: awaiting judgment.
96
![]()
29.2 Contingent liabilities
29.2.1 Classification of lawsuits rated as possible losses
Contingent liabilities are present obligations arising from past events for which no provisions are recognized because it is not probable that an outflow of resources embodying economic benefits will be required to settle the obligation. The following information concerns the nature of Copel and its subsidiaries contingent liabilities and potential losses arising therefrom:
|
| Parent company |
| Consolidated |
| 12.31.2018 | 12.31.2017 | 12.31.2018 | 12.31.2017 |
Tax (a) | 160,139 | 513,803 | 568,512 | 858,082 |
Labor (b) | 561 | 420 | 311,777 | 360,322 |
Employee benefits (c) | - | - | 19,099 | 20,262 |
Civil (d) | 473,430 | 458,708 | 1,286,466 | 1,091,122 |
Regulatory (e) | - | - | 866,836 | 793,720 |
| 634,130 | 972,931 | 3,052,690 | 3,123,508 |
29.2.2 Description of nature and/or details of the principal lawsuits
a) Tax
Lawsuits relating to federal, state and municipal taxes, fees and other charges in which the Company challenges their applicability, calculation bases and amounts due to be collected. The main lawsuits are as follows:
Plaintiff: National Institute of Social Security - INSS Estimated amount: R$ 108.493
Tax requirements related to the social security contribution.
Current status:awaiting judgment in the Administrative Council of Tax Appeals - CARF.
Plaintiff: State Tax Authority - (SEFAZ) Estimated amount: R$ 78.402
Copel Distribution received tax deficiency notice 6.587.156-4 from the State of Paraná for allegedly failing to pay ICMS (VAT) tax on the ‘metered demand’ line in the electricity bills issued to a major consumer between May 2011 and December 2013.
The Company maintains its illegitimacy to appear in the taxable position of this tax assessment, since it was not included in the judicial proceeding, thus it cannot suffer the effects of the ruling rendered thereon, which would entail its illegitimacy to appear as liable taxpayer in tax deficiency notice 6.587.156-4.
Plaintiff:Copel Estimated amount:R$ 76.475
Tax Requirement on Urban Territorial Property - IPTU on properties affected by the public electricity service. The case is pending judgment at first instance.
Plaintiff:City Hall Estimated amount: R$ 55.735
97
![]()
City halls tax requirement as ISS in construction services provided by third parties. Current status: awaiting the decision on the appeal.
Situação atual: aguardando julgamento de recurso.
Autor: Brazilian Federal Revenue Office Estimated amount: R$ 116.086
Requirement and administrative question related to federal taxes, mostly still pending management review.
b) Labor
Labor claims comprise claims filed by employees and former employees of Copel and its subsidiaries in connection with the payment of overtime differences, hazardous working conditions, transfer bonuses, salary equality/reclassification, and other matters, and also claims by former employees of contractors and third- parties (secondary responsibility) involving indemnity and other matters.
c) Employee benefits
Labor claims comprise claims filed by retired former employees of the Company and its wholly-owned subsidiaries against the Copel Foundation, which will have consequential impact on the Company and its wholly-owned subsidiaries, since additional contributions will be required.
d) Civil
Lawsuits involving billing, irregular procedures, administrative contracts and contractual fines, indemnity for accidents with the electric power network or vehicles, easements of passage, expropriations, patrimonial and environmental.
The balance also contains amounts being discussed by arbitration under confidentiality, in the discovery phase, with no decision having been handed down to date.
The main lawsuits are as follows:
Plaintiff: Mineradora Tibagiana Ltda. Estimated amount: R$ 172.583
Lawsuit claiming compensation for alleged losses when this mining company was involved in the construction of the Mauá plant by the Energético Cruzeiro do Sul consortium in which Copel GeT has a 51% stake. The action challenges the validity of the mining permit granted by Mineradora Tibagiana for the Mauá job site and the indemnifying effects arising therefrom.
Current status: awaiting judgment by lower court.
Plaintiff:franchises of the Agency/ Copel store Estimated amount: R$ 44.717
Filing of two individual claims against Copel Distribuição regarding the franchise contracts of Copel branches/stores, with the main petition claiming an extension of the term of the contract and secondary petition to recognize the existence of a sub concession, with transfer of the services provided and full pass-through of the fees, amongst other amounts, with related appeals currently awaiting trial.
98
![]()
Current status: awaiting judgment.
Plaintiff: Copel Distribuição Estimated amount: R$ 78.277
The Department of Roads and Roadworks - DER issued a tax assessment notice to Copel Distribuição, as a consequence, the Company filed a lawsuit challenging DER’s Charge for Use or Occupancy of Highway Domain Range, since the Company understands that this charge is unconstitutional because it has a confiscatory nature. Currently, the process awaits decision on the production of expert evidence.
e) Regulatory
The Company is challenging, both at the administrative and judicial levels, notifications issued by the Regulatory Agency of alleged violations against regulations. The main action is described below:
Plaintiff: Energia Sustentável do Brasil S.A. - ESBR Estimated amount: R$ 729.609
ESBR filed Ordinary Lawsuit No. 10426-71.2013.4.01.4100 against ANEEL in the federal courts of Rondônia, the decision on which: (i) excludes liability for the 535-day schedule overrun in the construction of the Jirau Hydropower Station; (ii) declares any obligations, penalties and costs imposed on ESBR as a result of the schedule overrun to be unenforceable, and (iii) annuls ANEEL Resolution No. 1,732/2013, which recognized a schedule overrun of only 52 days. An appeal has been brought by ANEEL, pending judgment by the TRF of the 1st Region.
The practical outcome of the decision is that, by exempting ESBR, it exposed the distribution utilities with which it had concluded regulated power trading contracts (CCEARs), including Copel DIS, to the spot market and spot prices during the period. The reason is that electricity trading rules require that all electricity consumed be covered by a contract.
If the lawsuits are judged unfavorably against Copel, the amount will be classified as Sectorial Financial Asset to be recovered through tariff rates.
Current status:awaiting judgment.
99
![]()
30 Equity.......................
30.1 Capital
Capital consists of common and preferred shares. Each common share entitles its holder to one vote in the general shareholders’ meetings. Preferred shares do not have voting rights and have two classes “A” and “B”.
According to Article 17 and following paragraphs of Federal Law No. 6,404/76, dividends paid to preferred shares must be at least 10% higher than those paid to common shares.
Class “A” preferred shares have priority in the reimbursement of capital and in the distribution of minimum dividends of 10% p.a. (non-cumulative), calculated based on the capital represented by this class of shares.
Class “B” preferred shares have priority in the reimbursement of capital and the right to the distribution of dividends, calculated as 25% of adjusted profit or loss for the year, pursuant to the corporate legislation and to the Company’s by-laws, calculated proportionately to the capital represented by the shares of this class. Dividends for Class “B” have priority only over the common shares and are only paid out of the remaining profits payment of priority dividends of class “A” shares.
The paid-in share capital is R$ 7,910,000. The different classes of shares (with no par value) and main shareholders are detailed below:
|
|
|
|
|
|
| Number of shares in units | |
Shareholders | Common | Class "A” Preferred | Class “B” preferred | Total | ||||
| in share | % | in share | % | in share | % | in share | % |
State of Paraná | 85,028,598 | 58.63 | - | - | - | - | 85,028,598 | 31.07 |
BNDES | 38,298,775 | 26.41 | - | - | 27,282,006 | 21.26 | 65,580,781 | 23.96 |
Eletrobrás | 1,530,774 | 1.06 | - | - | - | - | 1,530,774 | 0.56 |
Free float: |
|
|
|
|
|
|
|
|
B3 | 19,186,634 | 13.23 | 76,763 | 23.36 | 69,782,600 | 54.39 | 89,045,997 | 32.54 |
NYSE | 649,508 | 0.45 | - | - | 30,973,304 | 24.15 | 31,622,812 | 11.56 |
Latibex | - | - | - | - | 208,846 | 0.16 | 208,846 | 0.08 |
Municipalities | 178,393 | 0.12 | 9,326 | 2.84 | 3,471 | - | 191,190 | 0.07 |
Other shareholders | 158,398 | 0.10 | 242,538 | 73.80 | 45,441 | 0.04 | 446,377 | 0.16 |
| 145,031,080 | 100.00 | 328,627 | 100.00 | 128,295,668 | 100.00 | 273,655,375 | 100.00 |
30.2 Equity valuation adjustments
Fair values of fixed assets – deemed costs – were recognized on the first-time adoption of IFRS. The line item “Equity value adjustments” was the balancing item of this adjustment, net of deferred income tax and social contribution. The realization of such adjustments is recorded in the retained earnings line item, to the extent of the depreciation or possible disposal of the measured fixed assets.
Adjustments arising from the changes in fair value involving financial assets, as well as actuarial gains and losses, are also recorded in this line item.
100
![]()
| Parent company | Consolidated |
Balance as of January 1, 2017 | 998,466 | 998,466 |
Financial assets available for sale |
|
|
Financial investments | 2 | 3 |
Taxes on adjustments | - | (1) |
Equity interest investments | 11,659 | 26,135 |
Taxes on adjustments | (3,965) | (8,887) |
Investments in equity interests - equity in the parent company, net of taxes. | 9,554 | - |
Actuarial liabilities |
| |
Post employment benefits | 18 | (46,506) |
Taxes on adjustments | (7) | 16,827 |
Post employment benefits - equity in the parent company, net of taxes. | (29,567) | - |
Realization of equity evaluation adjustment |
| |
Deemed cost of fixed assets | - | (108,561) |
Taxes on adjustments | - | 36,911 |
Deemed cost of fixed assets - equity in the parent company, net of taxes. | (71,650) | - |
Gains on Investments in equity investments | (14,174) | (28,650) |
Taxes on adjustments | 4,819 | 9,741 |
Gains on Investments in equity investments - equity in the parent company, net of taxes. | (9,554) | - |
Attributed to non-controlling interest | - | 123 |
Balance as of December 31, 2017 | 895,601 | 895,601 |
Adjusts to actuarial liabilities |
| |
Post employment benefits | (408) | (58,354) |
Taxes on adjustments | 139 | 19,994 |
Post employment benefits - equity in the parent company, net of taxes. | (38,245) | - |
Realization of equity evaluation adjustment |
| |
Deemed cost of fixed assets | - | (101,645) |
Taxes on adjustments | - | 34,559 |
Deemed cost of fixed assets - equity in the parent company, net of taxes. | (67,086) | - |
Reclassification by adoption of CPC 48/IFRS 9 |
| |
Equity interest investments | (4,391) | (4,391) |
Attributed to non-controlling interest | - | (154) |
Balance as of December 31, 2018 | 785,610 | 785,610 |
30.3 Legal reserve and profit retention reserve
The amount of 5% of profit for the year is allocated to the legal reserve, before any other allocation, limited to 20% of capital.
The profit retention reserve is earmarked for covering the Company's investment program, according to Article 196 of Law No. 6,404/1976. It is funded by retaining the remaining profit or loss after setting up the legal reserve, interest on capital and dividends proposed.
101
![]()
30.4 Proposed dividend distribution
Parent company | 12.31.2018 | 12.31.2017 |
Calculation of minimum mandatory dividend (25%) - (1) |
|
|
Net income for the year | 1,407,063 | 1,033,626 |
Legal Reserve (5%) | (70,353) | (51,681) |
Realization of equity evaluation adjustment | 67,086 | 71,650 |
Calculation basis for minimum mandatory dividends | 1,403,796 | 1,053,595 |
350,949 | 263,399 | |
|
| |
Total proposed distribution - (2) (3 + 5) | 378,542 | 289,401 |
|
| |
Interest on own capital, net - (3) | 280,000 | 266,000 |
Tax on interest on own capital | (27,593) | (26,002) |
Interest on own capital, net - (4) | 252,407 | 239,998 |
|
| |
Dividends proposed - (5) | 98,542 | 23,401 |
|
| |
Total proposed distribution, net - (6) (4 + 5) | 350,949 | 263,399 |
|
| |
|
| |
Gross value of dividends per share: |
|
|
Ordinary shares | 1.31950 | 1.00801 |
Class “A” preferred shares | 2.89050 | 2.89050 |
Class “B” preferred shares | 1.45151 | 1.10883 |
|
| |
Gross amount of dividends per class of shares: |
|
|
Ordinary shares | 191,369 | 146,193 |
Class “A” preferred shares | 950 | 950 |
Class “B” preferred shares | 186,223 | 142,258 |
In accordance with the legal and statutory provisions in effect, the basis for calculating mandatory dividends is obtained from net income, less the quota allocated to the legal reserve. However, Management decided to add to the calculation basis the realization of the equity valuation adjustments, which is dealt with in item 28 of ICPC 10 - Interpretation on the Initial Application to Property, Plant and Equipment and CPC 27, 28, 37 e 43, in order to void the effect of the increase in depreciation expense arising from the adoption accounting standards, as well as CPC 27/IAS 16 - Property, Plant and Equipment. This procedure reflects the Company's shareholder remuneration policy, which will be practiced during the realization of the entire reserve for equity valuation adjustments.
The distribution of the minimum mandatory dividend is included in Dividend payable in Copel and its subsidiaries financial statements at year-end.
The tax benefit of interest on capital is recorded in the statement of income upon its recognition in accounts payable.
102
![]()
30.5 Earnings per share – basic and diluted
Parent company | 12.31.2018 | 12.31.2017 |
Basic and diluted numerator |
|
|
Basic and diluted earnings allocated by classes of shares, allocated to controlling shareholders: |
|
|
Common shares | 712,234 | 523,206 |
Class “A” preferred shares | 1,775 | 1,304 |
Class “B” preferred shares | 693,054 | 509,116 |
1,407,063 | 1,033,626 | |
Basic and diluted denominator |
|
|
Weighted average of shares (in thousands): |
|
|
Common shares | 145,031,080 | 145,031,080 |
Class “A” preferred shares | 328,627 | 328,627 |
Class “B” preferred shares | 128,295,668 | 128,295,668 |
273,655,375 | 273,655,375 | |
|
| |
Basic and diluted earnings per share attributable to shareholders of parent company |
|
|
Common shares | 4.91091 | 3.60754 |
Class “A” preferred shares | 5.40201 | 3.96830 |
Class “B” preferred shares | 5.40201 | 3.96830 |
|
|
|
103
![]()
31 Net Operating Revenue
Consolidated | Gross | PIS/Pasep |
| Sectorial | Service tax | Net revenues |
| revenues | and Cofins | ICMS (VAT) | charges (31.2) | (ISSQN) | 12.31.2018 |
Electricity sales to final customers | 10,104,045 | (931,771) | (2,315,030) | (1,308,660) | - | 5,548,584 |
Residential | 3,262,212 | (301,885) | (892,053) | (471,575) | - | 1,596,699 |
Industrial | 2,863,086 | (261,692) | (486,614) | (260,416) | - | 1,854,364 |
Trade, services and other activities | 2,172,540 | (201,047) | (625,123) | (313,744) | - | 1,032,626 |
Rural | 897,606 | (83,064) | (71,665) | (131,494) | - | 611,383 |
Public entities | 263,827 | (24,415) | (52,208) | (38,337) | - | 148,867 |
Public lighting | 279,767 | (25,890) | (80,768) | (40,399) | - | 132,710 |
Public service | 365,007 | (33,778) | (106,599) | (52,695) | - | 171,935 |
Electricity sales to distributors | 3,136,244 | (318,368) | - | (51,960) | - | 2,765,916 |
Bilateral contracts | 2,002,077 | (242,828) | - | (34,759) | - | 1,724,490 |
Electric Energy Trade Chamber - CCEE | 663,024 | (23,448) | - | (11,511) | - | 628,065 |
CCEAR (auction) | 327,759 | (39,753) | - | (5,690) | - | 282,316 |
Interest (Note 10.3) | 85,986 | - | - | - | - | 85,986 |
Quota system | 57,398 | (12,339) | - | - | - | 45,059 |
Use of the main distribution and transmission grid | 6,867,274 | (657,679) | (1,643,593) | (1,096,942) | - | 3,469,060 |
Residential | 2,222,621 | (209,406) | (624,777) | (371,351) | - | 1,017,087 |
Industrial | 1,179,534 | (104,588) | (436,421) | (184,179) | - | 454,346 |
Trade, services and other activities | 1,416,111 | (132,444) | (425,030) | (234,558) | - | 624,079 |
Rural | 363,296 | (34,180) | (28,206) | (61,378) | - | 239,532 |
Public entities | 185,383 | (17,466) | (35,497) | (31,146) | - | 101,274 |
Public lighting | 184,530 | (17,386) | (53,502) | (30,814) | - | 82,828 |
Public service | 141,556 | (13,337) | (40,160) | (23,647) | - | 64,412 |
Free consumers | 795,105 | (74,912) | - | (135,166) | - | 585,027 |
Basic network, BN connections, and connection grid | 1,411 | (133) | - | (240) | - | 1,038 |
Operating and maintenance income - O&M | 58,578 | (25,526) | - | (11,536) | - | 21,516 |
Interest income | 319,149 | (28,301) | - | (12,927) | - | 277,921 |
Construction income | 1,097,313 | - | - | - | - | 1,097,313 |
Fair value of assets from the indemnity for the concession | 47,499 | - | - | - | - | 47,499 |
Telecommunications | 512,540 | (19,248) | (125,229) | - | (1,884) | 366,179 |
Distribution of piped gas | 753,222 | (69,382) | (126,530) | - | (124) | 557,186 |
Sectorial financial assets and liabilities result | 985,344 | (91,656) | - | - | - | 893,688 |
Other operating revenue | 222,329 | (29,696) | - | - | (3,278) | 189,355 |
Leasing and rent (31.1) | 132,682 | (17,722) | - | - | - | 114,960 |
Income from rendering of services | 59,280 | (7,918) | - | - | (3,278) | 48,084 |
Charged service | 18,475 | (2,468) | - | - | - | 16,007 |
Other income | 11,892 | (1,588) | - | - | - | 10,304 |
| 23,725,810 | (2,117,800) | (4,210,382) | (2,457,562) | (5,286) | 14,934,780 |
CCEAR - Agreements for Power Trade on the Regulated Market | ||||||
104
![]()
Consolidated | Gross | PIS/Pasep |
| Sectorial | Service tax | Net revenues |
| revenues | and Cofins | ICMS (VAT) | charges (31.2) | (ISSQN) | 12.31.2017 |
Electricity sales to final customers | 8,689,516 | (749,683) | (2,039,245) | (1,219,055) | - | 4,681,533 |
Residential | 2,829,626 | (242,916) | (771,902) | (433,080) | - | 1,381,728 |
Industrial | 2,382,314 | (208,226) | (433,088) | (252,531) | - | 1,488,469 |
Trade, services and other activities | 1,908,426 | (163,834) | (548,328) | (291,798) | - | 904,466 |
Rural | 772,465 | (66,314) | (75,137) | (119,645) | - | 511,369 |
Public entities | 236,719 | (20,322) | (46,506) | (36,418) | - | 133,473 |
Public lighting | 244,381 | (20,979) | (70,811) | (37,359) | - | 115,232 |
Public service | 315,585 | (27,092) | (93,473) | (48,224) | - | 146,796 |
Electricity sales to distributors | 3,529,770 | (300,003) | - | (53,413) | - | 3,176,354 |
Bilateral contracts | 1,947,862 | (203,994) | - | (30,656) | - | 1,713,212 |
Electric Energy Trade Chamber - CCEE | 1,077,943 | (45,889) | - | (16,966) | - | 1,015,088 |
CCEAR (auction) | 367,970 | (38,537) | - | (5,791) | - | 323,642 |
Interest (Note 10.3) | 82,160 | - | - | - | - | 82,160 |
Quota system | 53,835 | (11,583) | - | - | - | 42,252 |
Use of the main distribution and transmission grid | 6,442,761 | (588,290) | (1,488,323) | (748,207) | - | 3,617,941 |
Residential | 2,025,400 | (189,915) | (572,269) | (252,691) | - | 1,010,525 |
Industrial | 1,076,613 | (96,059) | (385,725) | (126,842) | - | 467,987 |
Trade, services and other activities | 1,310,903 | (122,168) | (386,320) | (162,367) | - | 640,048 |
Rural | 342,195 | (32,056) | (25,811) | (43,365) | - | 240,963 |
Public entities | 174,427 | (16,355) | (33,384) | (21,922) | - | 102,766 |
Public lighting | 167,907 | (15,744) | (48,668) | (20,935) | - | 82,560 |
Public service | 126,795 | (11,889) | (36,146) | (15,816) | - | 62,944 |
Free consumers | 663,248 | (62,190) | - | (84,633) | - | 516,425 |
Basic network, BN connections, and connection grid | 1,387 | (130) | - | (177) | - | 1,080 |
Operating and maintenance income - O&M | 113,324 | (16,733) | - | (7,793) | - | 88,798 |
Interest income | 440,562 | (25,051) | - | (11,666) | - | 403,845 |
Construction income | 868,001 | - | - | - | - | 868,001 |
Fair value of assets from the indemnity for the concession | 57,080 | - | - | - | - | 57,080 |
Telecommunications | 426,773 | (15,854) | (99,460) | - | (2,507) | 308,952 |
Distribution of piped gas | 621,992 | (58,959) | (107,912) | - | (306) | 454,815 |
Sectorial financial assets and liabilities result | 767,040 | (48,214) | - | - | - | 718,826 |
Other operating revenue | 171,356 | (27,710) | - | - | (2,575) | 141,071 |
Leasing and rent (31.1) | 109,230 | (10,956) | - | - | - | 98,274 |
Income from rendering of services | 30,247 | (5,789) | - | - | (2,575) | 21,883 |
Charged service | 15,981 | (5,758) | - | - | - | 10,223 |
Other income | 15,898 | (5,207) | - | - | - | 10,691 |
| 21,574,289 | (1,788,713) | (3,734,940) | (2,020,675) | (5,388) | 14,024,573 |
31.1 Leases and rentals
31.1.1 Revenues from leases and rentals
Consolidated | 12.31.2018 | 12.31.2017 |
Equipment and framework | 131,409 | 106,790 |
Facilities sharing | 1,003 | 2,159 |
Real estate | 270 | 281 |
| 132,682 | 109,230 |
31.1.2 Receivables from non-cancelable leases
Consolidated | Less than |
| Over | Total |
| 1 year | 1 to 5 years | 5 years | 12.31.2018 |
Facilities sharing | 1,142 | 5,710 | 16,811 | 23,663 |
|
|
|
|
|
105
![]()
31.2 Regulatory charges
Consolidated | 12.31.2018 | 12.31.2017 |
Energy Development Account - "CDE " - Power distribution service concession (31.2.1) | 1,840,283 | 1,415,738 |
Other charges - rate flags | 423,098 | 420,027 |
Research and development and energy efficiency - R&D and EEP | 123,306 | 117,390 |
Global Reversion Reserve - RGR quota | 48,512 | 46,825 |
Energy Development Account - "CDE " - Power transmission concession | 12,211 | 10,971 |
Inspection fee | 10,152 | 9,723 |
| 2,457,562 | 2,020,674 |
31.2.1 Energy Development Account - CDE
The CDE was created by Law 10,438/2002, amended by Law 12,783/2013 and, in order to meet its objectives, it has among its sources of funds, quotas paid by agents that negotiate energy with final consumers, in tariffs.
Currently, the Company makes payments for the “CDE USO” charge, intended to cover the CDE 's objectives set forth by law, and the annual quota of “CDE ENERGIA”, composed of:
a) Regulated Contracting Environment “CONTA – ACR”. The purpose of this account is to cover costs incurred by the distribution concession operators relating to involuntary spot market exposure and the costs of thermal power dispatching in 2014, linked to CCEAR in the modality due to the availability of electric energy.
b) “CDE-ENERGIA”. destined to the return of the resources received by the distribution concession operators, from January 2013 to January 2014, to cover costs relating to involuntary spot market exposure and the hydrological risk of the plants contracted on a regime of quotas, and the costs of thermal power dispatching for reasons of energy security, in compliance with Decree 7,895/2013 and Decree 8,203/2014.
The annual quotas for each distributor are defined by ANEEL through resolutions enacted by it.The balance at December 31, 2018 is as follows:
Resolutions | Period | 12.31.2018 |
CDE USO |
|
|
Resolution No. 2,368/2018 | January to August | 594,972 |
Resolution No. 2,446/2018 | September to December | 445,075 |
(-) Preliminary injunctions | January to December | (2) |
|
| 1,040,045 |
CONTA ACR |
|
|
Resolution No. 2,231/2017 | January to December | 557,981 |
|
| 557,981 |
CDE ENERGIA |
|
|
Resolution No. 2,202/2017 | January to May | 100,692 |
Resolution No. 2,358/2017 | Junho to December | 145,007 |
(-) Preliminary injunctions | January to December | (3,442) |
|
| 242,257 |
|
| 1,840,283 |
106
![]()
Preliminary injunctions
As a result of preliminary injunctions in favor of the Brazilian Association of Large Industrial Consumers and Free Consumers - Abrace, and of the National Association of Energy Consumers - Anace and other associates, which challenge at court the tariff components of CDE-Use and CDE-Electricity, ANEEL, through Resolutions 1,967/2015, 1,986/2015 and 2,083/2016, ratified the tariff calculation, deducting these charges from associates of those entities, as long as the preliminary injunctions granted in Judicial Proceedings are not overthrown. By Decree No. 1,576/2016, the associated distributors are assured of the right of non-transfer, deducting from the portion of CDE-Use and CDE-Electricity the amounts not collected.
The unbilled amounts resulting from these injunctions do not impact the distributor's result.
31.3 Copel DIS annual tariff adjustment
The annual tariff adjustment, which occurs between tariff reviews, is approved by ANEEL based on a formula defined in the concession agreement and on regulations established in Proret, which consider for unmanageable costs (Portion A) the variations incurred in the period and for manageable costs (Portion B) the IPCA variation, adjusted by applying the Factor X.
In 2018, ANEEL’s Resolution No. 2,402 of June 19, 2018, approved the result of Copel DIS Annual Tariff Review and authorized a 15.99% (5.85% in 2017) average rate increase to consumers, consisting of: 6.52% related to the inclusion of financial components; 0.31% from updating Portion B; 7.49% from adjusting Portion A; and 1.67% reflecting the withdrawal of the financial components from the previous tariff process.
This adjustment was fully applied to Copel DIS tariffs as from June 24, 2018.
32 Operating Costs and Expenses
Consolidated |
|
| General and | Other |
|
Operational | Selling | administrative | operating |
| |
| costs | expenses | expenses | expenses, net | 12.31.2018 |
Electricity purchased for resale (32.1) | (6,361,178) | - | - | - | (6,361,178) |
Charge of the main distribution and transmission grid | (1,176,780) | - | - | - | (1,176,780) |
Personnel and management (32.2) | (978,878) | (18,460) | (360,447) | - | (1,357,785) |
Pension and healthcare plans (Note 24.3) | (176,102) | (2,447) | (65,201) | - | (243,750) |
Materials and supplies | (68,920) | (655) | (12,182) | - | (81,757) |
Materials and supplies for power electricity | (19,729) | - | - | - | (19,729) |
Natural gas and supplies for gas business | (412,618) | - | - | - | (412,618) |
Third-party services (32.3) | (392,869) | (23,266) | (156,092) | - | (572,227) |
Depreciation and amortization | (709,575) | (15) | (26,015) | (13,574) | (749,179) |
Credit losses, provisions and reversals (32.4) | 18,920 | (81,936) | - | (243,681) | (306,697) |
Construction cost (32.5) | (1,052,208) | - | - | - | (1,052,208) |
Other operating costs and expenses, net (32.6) | (171,751) | (21,930) | (103,597) | (45,435) | (342,713) |
| (11,501,688) | (148,709) | (723,534) | (302,690) | (12,676,621) |
107
![]()
Consolidated |
|
| General and | Other |
|
Operational | Selling | administrative | operating |
| |
| costs | expenses | expenses | expenses, net | 12.31.2017 |
Electricity purchased for resale (32.1) | (6,165,450) | - | - | - | (6,165,450) |
Charge of the main distribution and transmission grid | (712,030) | - | - | - | (712,030) |
Personnel and management (32.2) | (984,011) | (20,435) | (338,898) | - | (1,343,344) |
Pension and healthcare plans (Note 24.3) | (175,479) | (2,424) | (59,694) | - | (237,597) |
Materials and supplies | (71,535) | (968) | (10,621) | - | (83,124) |
Materials and supplies for power electricity | (97,360) | - | - | - | (97,360) |
Natural gas and supplies for gas business | (309,542) | - | - | - | (309,542) |
Third-party services (32.3) | (386,435) | (18,826) | (116,254) | - | (521,515) |
Depreciation and amortization | (686,007) | (16) | (32,070) | (13,506) | (731,599) |
Credit losses, provisions and reversals (32.4) | 122,782 | (90,478) | - | (397,843) | (365,539) |
Construction cost (32.5) | (1,003,881) | - | - | - | (1,003,881) |
Other operating costs and expenses, net (32.6) | (196,942) | (35,903) | (128,138) | (52,967) | (413,950) |
| (10,665,890) | (169,050) | (685,675) | (464,316) | (11,984,931) |
Parent company | General and | Other operacional |
|
administrative | income |
| |
| expenses | (expenses), net | 12.31.2018 |
Personnel and management (32.2) | (15,144) | - | (15,144) |
Pension and healthcare plans (Note 24.3) | (2,286) | - | (2,286) |
Materials and supplies | (706) | - | (706) |
Third party services | (31,465) | - | (31,465) |
Depreciation and amortization | (101) | (1,122) | (1,223) |
Credit losses, provisions and reversals (32.4) | - | (24,902) | (24,902) |
Other operating income (expenses) - (a) | (17,590) | 37,720 | 20,130 |
| (67,292) | 11,696 | (55,596) |
(a) From the balance of R$37,721 in the column of Other operacional income (expenses), net, R$25,129 refers to recognition of taxcredit, according to note 33.1. | |||
Parent company | General and | Other operacional |
|
administrative | income |
| |
| expenses | (expenses), net | 12.31.2017 |
Personnel and management (32.2) | (18,455) | - | (18,455) |
Pension and healthcare plans (Note 24.3) | (1,943) | - | (1,943) |
Materials and supplies | (631) | - | (631) |
Third party services | (14,265) | - | (14,265) |
Depreciation and amortization | (82) | (1,121) | (1,203) |
Credit losses, provisions and reversals (32.4) | - | (93,756) | (93,756) |
Other operating income (expenses) | (24,225) | 26,089 | 1,864 |
| (59,601) | (68,788) | (128,389) |
32.1 Energy purchased for resale
Consolidated | 12.31.2018 | 12.31.2017 |
Purchase of Energy in the Regulated Environment - CCEAR | 2,599,345 | 2,693,976 |
Electric Energy Trade Chamber - CCEE | 1,850,021 | 1,766,091 |
Itaipu Binacional | 1,272,177 | 1,117,957 |
Bilateral contracts | 928,741 | 766,803 |
Program for incentive to alternative energy sources - Proinfa | 228,295 | 217,646 |
Micro and mini generators and repurchase of customers | 12,373 | 3,892 |
(-) PIS/Pasep/Cofins taxes on electricity purchased for resale | (529,774) | (400,915) |
| 6,361,178 | 6,165,450 |
108
![]()
32.2 Personnel and Management
. |
| Parent company |
| Consolidated |
| 12.31.2018 | 12.31.2017 | 12.31.2018 | 12.31.2017 |
Personnel |
|
|
|
|
Wages and salaries | 5,122 | 5,913 | 794,966 | 806,119 |
Social charges on payroll | 1,757 | 2,038 | 261,459 | 266,183 |
Meal assistance and education allowance | 1,108 | 1,131 | 113,177 | 119,881 |
Provisions for profit sharing (a) | 863 | 586 | 91,526 | 68,817 |
Voluntary retirement program | 1,656 | 2,890 | 69,289 | 53,468 |
10,506 | 12,558 | 1,330,417 | 1,314,468 | |
Management |
|
|
|
|
Wages and salaries | 3,553 | 4,640 | 21,422 | 22,895 |
Social charges on payroll | 999 | 1,168 | 5,695 | 5,635 |
Other expenses | 86 | 89 | 251 | 346 |
| 4,638 | 5,897 | 27,368 | 28,876 |
| 15,144 | 18,455 | 1,357,785 | 1,343,344 |
(a) According to Federal Law No. 10,101/2000, State Decree No. 1,978/2007 and State Law No. 16,560/2010. | ||||
32.3 Third party services
Consolidated | 12.31.2018 | 12.31.2017 |
Maintenance of electrical system | 144,211 | 135,265 |
Communication, processing and transmission of data | 115,397 | 94,230 |
Maintenance of facilities | 91,872 | 95,176 |
Meter reading and bill delivery | 43,968 | 49,647 |
Consulting and audit | 41,615 | 21,589 |
Consumer service | 34,502 | 29,789 |
Other services | 100,662 | 95,819 |
| 572,227 | 521,515 |
32.4 Credit losses, provisions and reversals
. |
| Parent company |
| Consolidated |
| 12.31.2018 | 12.31.2017 | 12.31.2018 | 12.31.2017 |
Provision for litigations | 10,636 | 93,756 | 219,636 | 386,373 |
Impairment of assets |
|
|
|
|
Accounts receivable related to the concession compensation (Note 11.1) | - | - | (4,758) | (1,117) |
Credits on sales and purchases of gas | - | - | - | (123,586) |
Property, plant and equipment (Note 18.7) | - | - | (14,162) | 1,921 |
Expected credit losses (Trade accounts and Other current receivables) | 14,266 | - | 96,202 | 90,478 |
Tax credits estimated losses | - | - | 9,779 | 11,470 |
| 24,902 | 93,756 | 306,697 | 365,539 |
32.5 Construction costs
Consolidated | 12.31.2018 | 12.31.2017 |
Materials and supplies | 507,899 | 387,278 |
Third party services | 400,680 | 437,788 |
Personnel | 124,469 | 143,266 |
Others | 19,160 | 35,549 |
| 1,052,208 | 1,003,881 |
109
![]()
32.6 Other operating costs and expenses, net
Consolidated | 12.31.2018 | 12.31.2017 |
Losses in the decommissioning and disposal of assets | 106,675 | 58,569 |
Financial offset for the use of water resources | 105,310 | 110,971 |
Taxes | 84,492 | 87,759 |
Leasing and rent (32.6.1) | 40,016 | 32,037 |
Compensation | 30,949 | 45,712 |
Advertising and publicity | 22,135 | 27,768 |
Losses in business combination (Note 1.2.3) | 3,769 | - |
Gain (loss) on sale of investments (a) | (8,174) | (28,650) |
Other net income, costs and expenses (b) | (42,459) | 79,784 |
| 342,713 | 413,950 |
(a) In 2018, the gain on the sale of the associated company Dois Saltos Empreendimentos de Geração de Energia Elétrica Ltda. was R$ 11,000 and the loss on the disposal of the jointly-owned subsidiary Transmissora Sul Brasileira de Energia S.A. was R$ 2,826 (Note 1.2). In 2017, the gain on the disposal of the shares of Companhia de Saneamento do Paraná – Sanepar was R$ 28,650. | ||
(b) This balance of 2018 includes the revenue of R$ 72,068 related to the reimbursement with suppliers of assets of windfarms of the Brisa Complex. | ||
32.6.1 Leases and rentals
Consolidated | 12.31.2018 | 12.31.2017 |
Real estate | 29,216 | 29,749 |
Others | 12,237 | 3,588 |
(-) PIS and Cofins credits | (1,437) | (1,300) |
| 40,016 | 32,037 |
32.6.2 Commitments from leases and rents
Consolidated | Less than |
| Over | Total |
| 1 year | 1 to 5 years | 5 years | 12.31.2018 |
Real estate | 26,457 | 66,886 | 178,550 | 271,893 |
Veículos | 17,003 | 50,241 | - | 67,244 |
Equipamentos | 773 | 2,900 | - | 3,673 |
| 44,233 | 120,027 | 178,550 | 342,810 |
The balance includes land lease values for which, after the start-up of the project, payments are variable, applying a percentage of the gross revenue less the deductions foreseen in the contract (taxes, fees and contributions).
110
![]()
33 Financial Results
. |
| Parent company |
| Consolidated |
| 12.31.2018 | 12.31.2017 | 12.31.2018 | 12.31.2017 |
Financial income |
|
|
|
|
Arrears charges on bills | - | - | 226,050 | 191,554 |
Interest and monetary variation of CRC transfer (Note 8.1) | 214,627 | 141,923 | 214,627 | 141,923 |
Return on financial investments | 13,589 | 15,164 | 98,841 | 114,523 |
Recognition of tax credit (33.1) | 55,096 | - | 55,096 | - |
Remuneration of net sectorial assets and liabilities (Note 9.2) | - | - | 43,966 | 20,493 |
Monetary variation over the Itaipu power purchase | - | - | 24,658 | 17,777 |
Monetary variation and adjust to present value of accounts |
|
|
|
|
payable related to the concession (Note 27.2) | - | - | 1,047 | 10,813 |
Other financial income | 18,417 | 24,225 | 149,630 | 202,227 |
301,729 | 181,312 | 813,915 | 699,310 | |
( - ) Financial expenses |
|
|
|
|
Monetary and cambial variation and debt charges | 184,979 | 227,543 | 871,397 | 993,970 |
Monetary variation and adjust to present value of accounts |
|
|
|
|
payable related to the concession (Note 27.2) | - | - | 94,319 | 65,418 |
Monetary variation over the Itaipu power purchase | - | - | 50,203 | 12,264 |
Interest and monetary variation of CRC transfer (Note 8.1) | 25,830 | 51,211 | 25,830 | 51,211 |
Interest on R&D and EEP (Note 26.2) | - | - | 25,407 | 34,345 |
Remuneration of net sectorial assets and liabilities (Note 9.2) | - | - | 23,747 | 29,622 |
PIS/Pasep/Cofins taxes on interest on capital | 13,636 | 44,978 | 13,636 | 45,196 |
Other financial expenses | 13,910 | 4,123 | 147,426 | 215,724 |
238,355 | 327,855 | 1,251,965 | 1,447,750 | |
Net | 63,374 | (146,543) | (438,050) | (748,440) |
33.1 Recognition of tax credit
On February 14, 2018 the Federal Revenue of Brazil recognized tax credit for the restated amount of R$ 80,225 in favor of the Company, regarding the disputed tax levy on Pasep from July 1988 to July 1995, in connection with the effects of Federal Senate Resolution 49, of October 9, 1995, which suspended the effects of Decree-Laws 2,445/1988 and 2,449/1988, deemed to be unconstitutional by the Federal Supreme Court. From the total amount recognized, R$ 55,096 were recorded in finance income and R$ 25,129 in other operating income.
Operating segments are business activities that generate revenues and incur expenses, whose operating results are regularly reviewed by the executive boards of the Parent Company and subsidiaries and by key strategic decision-makers responsible for allocating funds and assessing performance.
34.1 Products and services from which we generate revenues from the reportable segments
The Company operates in reportable segments identified by Management, through the chief officers of each business area, taking into consideration the regulatory environments, the strategic business units and the different products and services. These segments are managed separately, since each business and each company requires different technologies and strategies.
111
![]()
In 2018 and 2017, all sales have been to customers within the Brazilian territory, in addition, all non-current assets are also located in national territory.
Copel and its subsidiaries did not identify any customer who individually accounts for more than 10% of their total net revenues in 2018.
The Company evaluates the performance of each segment based on information derived from the accounting records.
The accounting policies of the operating segments are the same as those described in Note 4.
34.2 The Companys reportable segments
The reportable segments of the Company, in accordance with CPC 22/IFRS 8, are:
Power generation and transmission (GET) -this segment comprises the generation of electric energy from hydraulic, wind, and thermal projects (GER) and the transmission and transformation of the power generated by the Company, and the construction, operation and maintenance of all power transmission substations and lines (TRA); for managers, the assets and liabilities of the generation and transmission segments are shown on an aggregate basis while their result is shown separately;
Power distribution (DIS) -this segment comprises the distribution of electric energy, the operation and maintenance of the distribution infrastructure and related services;
Telecommunications (TEL) -this segment comprises telecommunications and general communications services;
GAS -this segment comprises the public service of piped natural gas distribution;
Power sale (COM) -this segment comprises the sale of electric energy and related services; and
Holding Company (HOL) -this segment comprises participation in other companies.
34.3 Assets by reportable segment
ASSETS | Electric Energy | TEL | GAS | COM | HOL | Intersegment operations | Consolidated | |
12.31.2018 | GET | DIS | ||||||
|
|
|
|
|
|
|
| |
TOTAL ASSETS | 18,573,953 | 12,331,603 | 1,264,748 | 675,286 | 227,287 | 3,359,407 | (502,184) | 35,930,100 |
CURRENT ASSETS | 1,722,519 | 3,971,915 | 88,239 | 204,725 | 181,077 | 1,214,523 | (705,152) | 6,677,846 |
NON-CURRENT ASSETS | 16,851,434 | 8,359,688 | 1,176,509 | 470,561 | 46,210 | 2,144,884 | 202,968 | 29,252,254 |
Long term assets | 4,660,867 | 2,968,282 | 88,798 | 466,942 | 43,564 | 1,950,280 | (164,473) | 10,014,260 |
Investments | 2,212,271 | 1,343 | - | - | 2,442 | 152,178 | - | 2,368,234 |
Property, plant and equipment | 9,728,872 | - | 1,071,489 | - | 51 | 40,251 | - | 10,840,663 |
Intangible assets | 249,424 | 5,390,063 | 16,222 | 3,619 | 153 | 2,175 | 367,441 | 6,029,097 |
112
![]()
ASSETS | Electric Energy | TEL | GAS | COM | HOL | Intersegment operations | Consolidated | |
12.31.2017 | GET | DIS | ||||||
|
|
|
|
|
|
|
| |
TOTAL ASSETS | 17,110,518 | 11,529,588 | 1,054,741 | 632,910 | 208,369 | 3,211,162 | (584,911) | 33,162,377 |
CURRENT ASSETS | 1,461,512 | 3,609,663 | 102,002 | 151,966 | 187,966 | 1,035,545 | (846,820) | 5,701,834 |
NON-CURRENT ASSETS | 15,649,006 | 7,919,925 | 952,739 | 480,944 | 20,403 | 2,175,617 | 261,909 | 27,460,543 |
Long term assets | 4,037,312 | 2,167,690 | 69,543 | 437,056 | 17,703 | 2,019,192 | (140,870) | 8,607,626 |
Investments | 2,424,081 | 1,362 | - | - | 2,457 | 115,765 | 26,978 | 2,570,643 |
Property, plant and equipment | 8,924,508 | - | 866,489 | - | 57 | 38,396 | - | 9,829,450 |
Intangible assets | 263,105 | 5,750,873 | 16,707 | 43,888 | 186 | 2,264 | 375,801 | 6,452,824 |
34.4 Statement of income by reportable segment
STATEMENT OF INCOME | Electric Energy | TEL | GAS | COM | HOL | Intersegment operations | Consolidated | ||
GET |
| ||||||||
12.31.2018 | GER | TRA | DIS | ||||||
|
|
|
|
|
|
|
|
| |
NET OPERATING REVENUES | 3,007,565 | 904,826 | 9,972,442 | 421,408 | 588,532 | 1,341,162 | - | (1,301,155) | 14,934,780 |
Net operating revenues - third-parties | 2,116,875 | 680,567 | 9,932,267 | 364,741 | 582,895 | 1,341,162 | - | (83,727) | 14,934,780 |
Net operating revenues - between segments | 890,690 | 224,259 | 40,175 | 56,667 | 5,637 | - | - | (1,217,428) | - |
OPERATING COSTS AND EXPENSES | (1,619,431) | (561,850) | (9,474,473) | (369,201) | (515,594) | (1,354,578) | (57,993) | 1,276,499 | (12,676,621) |
Energy purchased for resale | (417,918) | - | (5,577,719) | - | - | (1,338,473) | - | 972,932 | (6,361,178) |
Charges for use of the main transmission grid | (408,347) | - | (1,012,062) | - | - | - | - | 243,629 | (1,176,780) |
Personnel and management | (214,855) | (147,139) | (837,728) | (92,472) | (34,896) | (13,734) | (16,961) | - | (1,357,785) |
Pension and healthcare plans | (36,379) | (25,884) | (159,842) | (13,892) | (3,881) | (1,507) | (2,365) | - | (243,750) |
Materials and supplies | (11,637) | (5,054) | (60,379) | (1,763) | (2,110) | (65) | (749) | - | (81,757) |
Raw materials and supplies for generation | (25,367) | - | - | - | - | - | - | 5,638 | (19,729) |
Natural gas and supplies for gas business | - | - | - | - | (412,618) | - | - | - | (412,618) |
Third party services | (119,668) | (33,489) | (339,399) | (91,127) | (17,034) | (1,700) | (32,311) | 62,501 | (572,227) |
Depreciation and amortization | (353,916) | (11,386) | (301,581) | (58,209) | (22,759) | (16) | (1,312) | - | (749,179) |
Provision (reversal) for litigations | 18,059 | 7,879 | (222,057) | (12,844) | (154) | 9 | (10,528) | - | (219,636) |
Impairment of assets | 22,312 | - | - | - | - | - | 1,648 | (5,040) | 18,920 |
Other estimated losses, provisions and reversals | 55,457 | (49,486) | (77,985) | (12,749) | (6,017) | (935) | (14,266) | - | (105,981) |
Construction cost | - | (277,259) | (741,855) | - | (13,478) | - | - | (19,616) | (1,052,208) |
Other operating costs and expenses, net | (127,172) | (20,032) | (143,866) | (86,145) | (2,647) | 1,843 | 18,851 | 16,455 | (342,713) |
EQUITY IN EARNINGS OF INVESTEES | 5,514 | 123,676 | - | - | - | (15) | 6,713 | - | 135,888 |
PROFIT (LOSS) BEFORE FINANCIAL INCOME AND TAX | 1,393,648 | 466,652 | 497,969 | 52,207 | 72,938 | (13,431) | (51,280) | (24,656) | 2,394,047 |
Financial income | 119,196 | 29,163 | 335,377 | 16,808 | 29,454 | 6,065 | 305,344 | (27,492) | 813,915 |
Financial expenses | (517,832) | (136,455) | (308,319) | (41,713) | (31,865) | (104) | (243,169) | 27,492 | (1,251,965) |
OPERATING PROFIT (LOSS) | 995,012 | 359,360 | 525,027 | 27,302 | 70,527 | (7,470) | 10,895 | (24,656) | 1,955,997 |
Income tax and social contribution | (327,598) | (75,361) | (148,244) | (2,853) | (10,909) | 2,632 | 41,957 | 8,383 | (511,993) |
NET INCOME (LOSS) | 667,414 | 283,999 | 376,783 | 24,449 | 59,618 | (4,838) | 52,852 | (16,273) | 1,444,004 |
STATEMENT OF INCOME | Electric Energy | TEL | GAS | COM | HOL | Intersegment operations | Consolidated | ||
GET |
| ||||||||
12.31.2017 | GER | TRA | DIS | ||||||
|
|
|
|
|
|
|
|
| |
NET OPERATING REVENUES | 3,176,811 | 819,623 | 9,358,664 | 380,550 | 515,563 | 664,495 | - | (891,133) | 14,024,573 |
Net operating revenues - third-parties | 2,851,644 | 640,199 | 9,324,633 | 306,473 | 510,010 | 664,495 | - | (272,881) | 14,024,573 |
Net operating revenues - between segments | 325,167 | 179,424 | 34,031 | 74,077 | 5,553 | - | - | (618,252) | - |
OPERATING COSTS AND EXPENSES | (1,868,390) | (546,510) | (9,071,359) | (286,363) | (309,213) | (654,445) | (139,784) | 891,133 | (11,984,931) |
Energy purchased for resale | (390,019) | - | (5,717,970) | - | - | (654,026) | - | 596,565 | (6,165,450) |
Charges for use of the main transmission grid | (352,958) | - | (554,805) | - | - | - | - | 195,733 | (712,030) |
Personnel and management | (218,456) | (122,515) | (822,963) | (107,874) | (35,761) | (12,993) | (22,782) | - | (1,343,344) |
Pension and healthcare plans | (38,782) | (22,733) | (154,285) | (14,800) | (3,577) | (1,415) | (2,005) | - | (237,597) |
Materials and supplies | (12,463) | (4,732) | (60,320) | (2,978) | (1,936) | (27) | (668) | - | (83,124) |
Raw materials and supplies for generation | (102,719) | - | - | - | - | - | - | 5,359 | (97,360) |
Natural gas and supplies for gas business | - | - | - | - | (309,542) | - | - | - | (309,542) |
Third party services | (120,993) | (24,609) | (347,393) | (67,612) | (22,670) | (1,280) | (15,089) | 78,131 | (521,515) |
Depreciation and amortization | (368,987) | (7,201) | (285,835) | (39,553) | (28,753) | (9) | (1,261) | - | (731,599) |
Provision (reversal) for litigations | (39,733) | (81,210) | (168,600) | (3,648) | 854 | (156) | (93,880) | - | (386,373) |
Impairment of assets | 3,886 | - | - | - | 123,586 | - | (4,690) | - | 122,782 |
Other estimated losses, provisions and reversals | (9,397) | 1,107 | (83,916) | (8,309) | (1,433) | - | - | - | (101,948) |
Construction cost | - | (272,216) | (717,351) | - | (14,314) | - | - | - | (1,003,881) |
Other operating costs and expenses, net | (217,769) | (12,401) | (157,921) | (41,589) | (15,667) | 15,461 | 591 | 15,345 | (413,950) |
EQUITY IN EARNINGS OF INVESTEES | (5,777) | 93,145 | - | - | - | (564) | 14,935 | - | 101,739 |
PROFIT (LOSS) BEFORE FINANCIAL INCOME AND TAX | 1,302,644 | 366,258 | 287,305 | 94,187 | 206,350 | 9,486 | (124,849) | - | 2,141,381 |
Financial income | 73,433 | 13,313 | 380,597 | 11,828 | 38,821 | 6,515 | 186,660 | (11,857) | 699,310 |
Financial expenses | (565,837) | (123,707) | (343,540) | (30,691) | (64,433) | (322) | (331,077) | 11,857 | (1,447,750) |
OPERATING PROFIT (LOSS) | 810,240 | 255,864 | 324,362 | 75,324 | 180,738 | 15,679 | (269,266) | - | 1,392,941 |
Income tax and social contribution | (191,899) | (30,515) | 22,893 | (21,272) | (66,785) | (2,638) | 15,530 | - | (274,686) |
NET INCOME (LOSS) | 618,341 | 225,349 | 347,255 | 54,052 | 113,953 | 13,041 | (253,736) | - | 1,118,255 |
113
![]()
34.5 Additions to non-current assets by reportable segment
| Electric Energy | TEL | GAS | COM | HOL | Consolidated | |
12.31.2018 | GET | DIS | |||||
|
|
|
|
|
|
| |
Contract assets | - | 797,832 | - | 15,618 | - | - | 813,450 |
|
|
|
|
|
|
| |
Property, plant and equipment | 1,160,967 | - | 308,242 | - | 4 | 267 | 1,469,480 |
|
|
|
|
|
|
| |
Intangible assets | 6,351 | - | 1,235 | - | - | 3 | 7,589 |
|
|
|
|
|
|
|
|
| Electric Energy | TEL | GAS | COM | HOL | Consolidated | |
12.31.2017 | GET | DIS | |||||
|
|
|
|
|
|
| |
Property, plant and equipment |
|
|
|
|
|
|
|
Additions | 1,077,088 | - | 238,944 | - | 7 | 376 | 1,316,415 |
Intangible assets |
|
|
|
|
|
|
|
Additions | 3,996 | 757,709 | 2,200 | 13,745 | 101 | 635 | 778,386 |
|
|
|
|
|
|
|
|
114
![]()
35 Financial Instruments
35.1 Categories and determination of fair value of financial statements
Consolidated |
|
|
| 12.31.2018 | 12.31.2017 | |
| Note | Level | Book value | Fair value | Book value | Fair value |
Financial assets |
|
|
|
|
|
|
Fair value through profit or loss |
|
|
|
|
|
|
Cash and cash equivalents (a) | 5 | 1 | 1,948,409 | 1,948,409 | 1,040,075 | 1,040,075 |
Bonds and securities (b) | 6 | 1 | 696 | 696 | 687 | 687 |
Bonds and securities (b) | 6 | 2 | 343,600 | 343,600 | 218,976 | 218,976 |
Accounts receivable related to the distribution concession (c) | 10.1 e 10.2 | 3 | 1,105,282 | 1,105,282 | 987,874 | 987,874 |
Accounts receivable related to the transmission concession (c) | 10.4 | 1 | - | - | 99,969 | 99,969 |
Accounts receivable related to the concession compensation (d) | 10.6 | 3 | 65,811 | 65,811 | 68,859 | 68,859 |
Other temporary investments (e) |
| 1 | 11,557 | 11,557 | 8,958 | 8,958 |
Other temporary investments (e) |
| 2 | 7,954 | 7,954 | 9,769 | 9,769 |
|
|
| 3,483,309 | 3,483,309 | 2,435,167 | 2,435,167 |
Amortized cost |
|
|
|
|
|
|
Pledges and restricted deposits linked (a) |
| 1 | 203 | 203 | 59,372 | 59,372 |
Collaterals and escrow accounts STN (f) | 22.1 | 2 | 89,555 | 76,524 | 75,665 | 57,188 |
Trade accounts receivable (a) | 7 | 1 | 3,107,006 | 3,107,006 | 2,994,322 | 2,994,322 |
CRC Transferred to the State Government of Paraná (g) | 8 | 2 | 1,445,042 | 1,546,469 | 1,516,362 | 1,620,212 |
Sectorial financial assets (a) | 9 | 1 | 678,819 | 678,819 | 343,218 | 343,218 |
Accounts receivable related to the transmission concession (c) | 10.4 | 1 | - | - | 1,397,430 | 1,397,430 |
Accounts receivable related to the concession - RBSE (c) | 10.5 | 1 | 753,826 | 753,826 | 1,418,370 | 1,418,370 |
Accounts receivable related to the concession - bonus from |
|
|
|
|
|
|
the grant (h) | 10.3 | 2 | 625,772 | 714,880 | 606,479 | 694,463 |
State of Paraná - Government Programs (a) | 15.1 | 1 | - | - | 130,417 | 130,417 |
|
|
| 6,700,223 | 6,877,727 | 8,541,635 | 8,714,992 |
Total financial assets |
|
| 10,183,532 | 10,361,036 | 10,976,802 | 11,150,159 |
Financial liabilities |
|
|
|
|
|
|
Amortized cost |
|
|
|
|
|
|
Sectorial financial liabilities (a) | 9 | 1 | 96,531 | 96,531 | 283,519 | 283,519 |
Ordinary financing of taxes with the federal tax authorities (f) | 13.3 | 2 | 86,632 | 84,383 | 148,845 | 142,702 |
Special Tax Regularization Program - Pert (f) | 13.3 | 2 | 518,442 | 469,304 | 533,671 | 431,036 |
Suppliers (a) | 21 | 1 | 1,469,199 | 1,469,199 | 1,727,046 | 1,727,046 |
Loans and financing (f) | 22 | 2 | 4,047,307 | 4,012,621 | 3,759,505 | 3,569,856 |
Debentures (i) | 23 | 1 | 7,518,131 | 7,518,133 | 6,070,978 | 6,070,978 |
Payable related to concession (j) | 27 | 3 | 584,163 | 687,869 | 554,954 | 645,904 |
Total financial liabilities |
|
| 14,320,405 | 14,338,040 | 13,078,518 | 12,871,041 |
Different levels are defined as follows: | ||||||
Level 1: Obtained from quoted prices (not adjusted) in active markets for identical assets and liabilities; | ||||||
Level 2: obtained through other variables in addition to quoted prices included in Level 1, which are observable for theassets or liabilities; | ||||||
Level 3: obtained through assessment techniques which include variables for the assets or liabilities, which however are not basedon observable market data. | ||||||
The financial instruments classification changes, as of the adoption of CPC 48/IFRS 9, on 01.01.2018, is described in Note 4.18.1.
Determining fair values
a) Equivalent to their respective carrying values due to their nature and terms of realization.
b) Fair value is calculated based on information made available by the financial agents and the market values of the bonds issued by the Brazilian government.
c) The criteria are disclosed in Note 4.4.
115
![]()
d) The fair values of generation assets approximate their carrying amounts, according to Note 4.4.
e) Calculated according to the price quotations published in an active market, for assets classified as level 1 and determined in view of the comparative assessment model for assets classified as level 2.
f) The cost of the last borrowing taken out by the Company is used as a basic assumption, namely TJLP plus spread of 1.94% p.a., for discount of the expected payment flows.
g) The Company based its calculation on the comparison with a long-term and post-fixed National Treasury Bond (NTN-B) maturing on August 15, 2024, which yields approximately 4.29% p.a. plus the IPCA inflation index.
h) Receivables related to the concession agreement for providing electricity generation services under quota arrangements at their fair value calculated by expected cash inflows discounted at the rate established in ANEEL auction notice 12/2015 (9.04%).
i) Calculated from the Unit Price quotation (PU) for December 31, 2018, obtained from the Brazilian Association of Financial and Capital Markets (ANBIMA), net of unamortized financial cost.
j) Actual net discount rate of 8.13% p.a., in line with the Company’s estimated rate for long-term projects.
35.2 Financial risk management
The Company's business activities are exposed to the following risks arising from financial instruments:
35.2.1 Credit risk
Credit risk is the risk of the Company incurring losses due to a customer or financial instrument counterparty, resulting from failure in complying with contractual obligations.
Consolidated |
|
|
Exposure to credit risk | 12.31.2018 | 12.31.2017 |
Cash and cash equivalents (a) | 1,948,409 | 1,040,075 |
Bonds and securities (a) | 344,296 | 219,663 |
Pledges and restricted deposits linked (a) | 89,758 | 135,037 |
Trade accounts receivable (b) | 3,107,006 | 2,994,322 |
CRC Transferred to the State Government of Paraná (c) | 1,445,042 | 1,516,362 |
Sectorial financial assets (d) | 678,819 | 343,218 |
Accounts receivable related to the concession (e) | 1,859,108 | 3,903,643 |
Accounts receivable related to the concession - Bonus from the grant (f) | 625,772 | 606,479 |
Accounts receivable related to the concession compensation (g) | 65,811 | 68,859 |
State of Paraná - Government Programs | - | 130,417 |
Loans - Related Parties | - | 38,169 |
Other temporary investments (h) | 19,511 | 18,727 |
| 10,183,532 | 11,014,971 |
a) The Company’s Management manages the credit risk of its assets in accordance with the Group's policy of investing virtually all of its funds in federal banking institutions. As a result of legal and/or regulatory requirements, in exceptional circumstances the Company may invest funds in prime private banks.
116
![]()
b) The risk arises from the possibility that the Company might incur losses resulting from difficulties to receive its billings to customers. This risk is closely related to internal and external factors of Copel. To mitigate this type of risk, the Company manages its accounts receivable, detecting defaulting consumers, implementing specific collection policies and suspending the supply and/or recording of energy and the provision of service, as established in the agreement.
c) Management believes this credit risk is low because repayments are secured by funds from dividends.
d) Management believes this risk is low because these contracts assure an unconditional right to be paid in cash by the concession Grantor at the end of the concession period for any infrastructure investments not recovered through tariffs.
e) Management considers the risk of this credit to be reduced, since the agreements signed guarantee the unconditional right to receive cash at the end of the concession to be paid by the Concession Grantor, referring to investments in infrastructure not recovered through the tariff.
Management also considers the credit risk reduced to the balance of RBSE assets, even in light of the injunctions that temporarily reduced the RAP to be received, as described in Note 10.5.
f) Management considers the risk of this credit to be low, as the contract for the sale of energy by quota guarantees the receipt of an Annual Generation Revenue - RAG guaranteed which includes the annual amortization of this amount during the concession term.
g) For the generation concession assets, ANEEL published Normative Resolution No. 596/2013, which deals with the definition of criteria for calculating the VNR, for the purposes of indemnification. Management's expectation regarding the indemnification of these assets indicates the recoverability of the balances recorded, as described in Note 10.6.
h) The risk arises from the possibility that the Company might incur losses resulting from the volatility on the stock market. This type of risk involves external factors and has been managed through periodic assessment of the variations occurred in the market.
35.2.2 Liquidity risk
The Company's liquidity risk consists of the possibility of having insufficient funds, cash or other financial assets to settle obligations on their scheduled maturity dates.
The Company manages liquidity risk relying on a set of methodologies, procedures and instruments applied to secure ongoing control over financial processes to ensure proper management of risks.
Investments are financed by incurring medium and long-term debt with financial institutions and capital markets.
Short, medium and long-term business projections are made and submitted to Management bodies for evaluation. The budget for the next fiscal year is annually approved.
117
![]()
Medium and long-term business projections cover monthly periods over the next five years. Short-term projections consider daily periods covering only the next 90 days.
The Company permanently monitors the volume of funds to be settled by controlling cash flows to reduce funding costs, the risk involved in the renewal of loan agreements and compliance with the financial investment policy, while concurrently keeping minimum cash levels.
The following table shows the expected undiscounted settlement amounts in each time range. Projections were based on financial indicators linked to the related financial instruments and forecast according to average market expectations as disclosed in the Central Bank of Brazil's Focus Report, which provides the average expectations of market analysts for these indicators for the current year and the following year. As from 2022, 2021 indicators are repeated on an unaltered basis throughout the forecast period.
Consolidated | Interest (a) | Less than | 1 to 3 | 3 months |
| Over |
|
|
| 1 month | months | to 1 year | 1 to 5 years | 5 years | Total |
12.31.2018 |
|
|
|
|
|
|
|
Loans and financing | Note 22 | 213,934 | 178,471 | 990,005 | 2,051,613 | 1,846,702 | 5,280,725 |
Debentures | Note 23 | 74,834 | 62,755 | 2,473,208 | 6,317,116 | 550,901 | 9,478,814 |
Payable related to concession | Rate of return + |
|
|
|
|
|
|
use of public property | IGP-M and IPCA | 5,924 | 11,825 | 53,605 | 312,422 | 1,347,527 | 1,731,303 |
Suppliers | - | 1,058,074 | 211,709 | 145,317 | 28,986 | 25,113 | 1,469,199 |
Ordinary financing of taxes |
|
|
|
|
|
|
|
with the federal tax authorities | Selic | 5,796 | 11,660 | 53,634 | 18,293 | - | 89,383 |
Special Tax Regularization Program - Pert | Selic | 3,916 | 7,889 | 36,498 | 223,421 | 440,857 | 712,581 |
Sectorial financial liabilities | Selic | - | - | - | 106,796 | - | 106,796 |
|
| 1,362,478 | 484,309 | 3,752,267 | 9,058,647 | 4,211,100 | 18,868,801 |
(a) Effective interest rate - weighted average. | |||||||
As disclosed in Notes 22.5 and 23.3, Copel and its subsidiaries has borrowings agreements and debentures with covenants that if breached may have their payment accelerated.
As at December 31, 2018, the Company recorded negative net working capital of R$ 17,268 (R$ 408,080 in 2017. Management has been monitoring the liquidity and taking actions to balance the short-term financial capacity, preserving the Company's investment programs, as well as seeking debt repayment extension.
35.2.3 Market risk
Market risk is the risk that fair value or the future cash flows of a financial instrument shall oscillate due to changes in market prices, such as currency rates, interest rates and stock price. The purpose of managing this risk is to control exposures within acceptable limits, while optimizing return.
a) Foreign currency risk (US Dollar)
This risk comprises the possibility of losses due to fluctuations in foreign exchange rates, which may reduce assets or increase liabilities denominated in foreign currencies.
The Company’s foreign currency indebtedness is not significant and it is not exposed to foreign exchange derivatives. The Company monitors all relevant foreign exchange rates.
118
![]()
The effect of the exchange rate variation resulting from the power purchase agreement with Eletrobras (Itaipu) is transferred to customers in Copel DIS's next tariff adjustment.
The exchange rate risk posed by the purchase of gas arises from the possibility of Compagas reporting losses on the fluctuations in foreign exchange rates, increasing the amount in Reais of the accounts payable related to the gas acquired from Petrobras. This risk is mitigated by the monitoring and transfer of the price fluctuation through tariff, when possible. Compagás monitors these fluctuations on an ongoing basis.
Sensitivity analysis of foreign currency risk
The Company has developed a sensitivity analysis in order to measure the impact of the devaluation of the U.S. dollar on its borrowings subject to currency risk.
The baseline scenario takes into account the existing balances in each account as of December 31, 2018 and the probable scenario assumes a variation in the foreign exchange rate – prevailing at the end of the period (R$/USD 3.70) based on the median market expectation for 2019 reported in the Central Bank’s Focus report of February 8, 2019. For the scenarios 1 and 2, deteriorations of 25% and 50%, respectively, were considered for the main risk factor for the financial instrument compared to the rate used in the probable scenario.
. |
| Baseline | Projected scenarios - Dec.2019 |
|
|
Foreign exchange risk | Risk | 12.31.2018 | Probable | Scenario 1 | Scenario 2 |
. |
|
|
|
|
|
Financial assets |
|
|
|
|
|
Collaterals and escrow accounts - STN | USD depreciation | 89,555 | (4,040) | (25,419) | (46,798) |
. |
| 89,555 | (4,040) | (25,419) | (46,798) |
Financial liabilities |
|
|
|
|
|
Loans and financing - STN | USD appreciation | (104,751) | 4,726 | (20,281) | (45,287) |
Suppliers |
|
|
|
|
|
Eletrobras (Itaipu) | USD appreciation | (145,098) | 6,546 | (28,092) | (62,731) |
Acquisition of gas | USD appreciation | (66,808) | 3,014 | (12,935) | (28,883) |
|
| (316,657) | 14,286 | (61,308) | (136,901) |
In addition to the sensitivity analysis required by CVM Resolution No. 475/2008, the Company evaluates its financial instruments considering the possible effects on profit and loss and equity of the risks evaluated by the Company’s Management on the reporting date for the financial instruments, as recommended by CPC 40 (R1) - Financial Instruments: Disclosure. Based on the equity position and the notional value of the financial instruments held as of December 31, 2018, it is estimated that these effects will approximate the amounts stated in the above table in the column for the forecast probable scenario, since the assumptions used by the Company are similar to those previously described.
b) Interest rate and monetary variation risk
This risk comprises the possibility of losses due to fluctuations in interest rates or other indicators, which may reduce financial income or financial expenses or increase the financial expenses related to the assets and liabilities raised in the market.
119
![]()
The Company has not engaged in transactions with derivatives to cover this risk, but it has continually monitored interest rates and market indicators, in order to assess the potential need for such transactions.
Sensitivity analysis of interest rate and monetary variation risk
The Company has developed a sensitivity analysis in order to measure the impact of variable interest rates and monetary variations on its financial assets and liabilities subject to these risks.
The baseline scenario takes into account the existing balances in each account as of December 31, 2018 while the ‘probable’ scenario assumes balances reflecting varying indicators as follows: CDI/Selic - 6.50%, IPCA - 3.87%, IGP-DI - 4.04%, IGP-M - 3.90% and TLP - 6.50%, estimated as market average projections for 2019 according to the Focus Report issued by the Central Bank of Brazil as of February 8, 2019, except TLP that considers the Company’s internal projection.
For the scenarios 1 and 2, deteriorations of 25% and 50%, respectively, were considered for the main risk factor for the financial instrument compared to the rate used in the probable scenario.
. |
| Baseline | Projected scenarios - Dec.2019 |
|
|
Interest rate risk and monetary variation | Risk | 12.31.2018 | Probable | Scenario 1 | Scenario 2 |
. |
|
|
|
|
|
Financial assets |
|
|
|
|
|
Bonds and securities | Low CDI/SELIC | 344,296 | 24,100 | 18,075 | 12,052 |
Collaterals and escrow accounts | Low CDI/SELIC | 203 | 13 | 10 | 7 |
CRC transferred to the State Government of Paraná | Low IGP-DI | 1,445,042 | 58,380 | 43,785 | 29,190 |
Sectorial financial assets | Low Selic | 678,819 | 44,123 | 33,092 | 22,062 |
Accounts receivable related to the concession | Low IPCA | 2,484,880 | 96,165 | 72,124 | 48,082 |
Accounts receivable related to the concession compensation | Undefined (a) | 65,811 | - | - | - |
|
| 5,019,051 | 222,781 | 167,086 | 111,393 |
Financial liabilities |
|
|
|
|
|
Loans and financing |
|
|
|
|
|
Banco do Brasil | High CDI | (838,657) | (54,513) | (68,141) | (81,769) |
BNDES | High TJLP | (2,137,966) | (138,968) | (173,710) | (208,452) |
BNDES | High IPCA | (11,992) | (464) | (580) | (696) |
Promissory notes | High CDI | (571,822) | (37,168) | (46,461) | (55,753) |
Banco do Brasil - Distribution of Funds from BNDES | High TJLP | (107,324) | (6,976) | (8,720) | (10,464) |
Caixa Econômica Federal | High TJLP | (496) | (32) | (40) | (48) |
Other | No risk | (274,299) | - | - | - |
Debentures | High CDI/SELIC | (6,535,759) | (424,824) | (531,030) | (637,237) |
Debentures | High IPCA | (845,156) | (32,708) | (40,884) | (49,061) |
Debentures | High TJLP | (137,216) | (8,919) | (11,149) | (13,378) |
Suppliers - renegotiation of gas | High IGP-M | (28,670) | (1,118) | (1,398) | (1,677) |
Sectorial financial liabilities | High Selic | (96,531) | (6,275) | (7,843) | (9,412) |
Ordinary financing of taxes with the federal tax authorities | High Selic | (86,632) | (5,631) | (7,039) | (8,447) |
Special Tax Regularization Program - Pert | High Selic | (518,442) | (33,699) | (42,123) | (50,548) |
Payable related to concession | High IGP-M | (536,131) | (20,909) | (26,136) | (31,364) |
Payable related to concession | High IPCA | (48,032) | (1,859) | (2,324) | (2,788) |
. |
| (12,775,125) | (774,063) | (967,578) | (1,161,094) |
(a) Risk assessment still requires ruling by the Granting Authority. | |||||
120
![]()
In addition to the sensitivity analysis required by CVM Resolution No. 475/2008, the Company evaluates its financial instruments considering the possible effects on profit and loss and equity of the risks evaluated by the Company’s Management on the reporting date for the financial instruments, as recommended by CPC 40 (R1) - Financial Instruments: Disclosures. Based on the equity position and the notional value of the financial instruments held as of December 31, 2018, it is estimated that these effects will approximate the amounts stated in the above table in the column for the forecast probable scenario, since the assumptions used by the Company are similar to those previously described.
35.2.4 Electricity shortage risk
Approximately 64% of installed capacity in Brazil currently comes from hydroelectric generation, as informed by the Generation Information Bank of ANEEL, which makes Brazil and the geographic region in which we operate subject to hydrological conditions that are unpredictable, due to non-cyclical deviations of mean precipitation. Unsatisfactory hydrological conditions may cause, among other things, the implementation of comprehensive programs of electricity savings, such as rationalization or even a mandatory reduction of consumption, which is the case of rationing.
Since 2014, the reservoirs of the Southeast/Midwest, North and Northeast Brazilian regions have been subject to adverse climate situations, leading agencies responsible for this industry to adopt water resources optimization measures to guarantee fully meeting electricity demand.
The Electric Sector Monitoring Committee (CMSE) has maintained the energy deficit risk indicators within the safety margin in short-term projections. The same position is adopted by ONS regarding the risk of deficit in the medium term, as stated in the 2018-2022 Energy Operation Plan.
Although dam storage levels are not ideal, from the standpoint of regulatory agencies, when combined with other variables, they are sufficient to keep the risk of deficit within the safety margin established by the National Energy Policy Council - CNPE (maximum risk of 5%) in all subsystems.
35.2.5 Risk of GSF impacts
The Energy Reallocation Mechanism (MRE) is a system of redistribution of electric power generated, characteristic of the Brazilian electric sector, which has its existence by the understanding, at the time, of the need for a centralized operation associated with a centrally calculated optimum price known as PLD. Since generators have no control over their production, each plant receives a certain amount of virtual energy which can be compromised through contracts. This value, which enables the registration of bilateral contracts, is known as Physical Guarantee - GF and is also calculated centrally. Unlike PLD, which is calculated on a weekly basis, GF, as required by Law, is recalculated every five years, with a limit of increase or decrease, restricted to 5% by revision or 10% in the concession period.
121
![]()
The contracts need to have an energy physical guarantee basis. This is done, especially, through the allocation of power generated received from the MRE or purchase. The GSF is the ratio of the entire hydroelectric generation of the MRE participants to the GF sum of all the MRE plants. Basically, the GSF is used to calculate how much each plant will receive from generation to back up its GF. Thus, knowing the GSF of a given month the company will be able to know if it will need to back up its contracts through purchases.
Whenever GSF multiplied by GF is less than the sum of contracts, the company will need to buy the difference in the spot market. However, whenever GSF multiplied by GF is greater than the total contracts, the company will receive the difference to the PLD.
The low inflows that have been recorded since 2014, as well as problems with delays in the expansion of the transmission system have resulted in low GSF values, resulting in heavy losses for the companies holding MRE participating hydroelectric projects.
For plants with contracts in the Free Contracting Environment - ACL, the main way to manage the low GSF risk is not to compromise the entire GF with contracts, approach currently adopted by the Company.
For the contracts in the ACR, Law 13,203/2015, allowed the generators to contract insurance for electricity demand (load), by means of payment of a risk premium. Copel adopted this approach to protect contracts related to energy generated by the Mauá, Santa Clara, Fundão, Baixo Iguaçu and Cavernoso II Thermoelectric Plants.
For the distribution segment, the effects of the GSF are perceived in the costs associated with quotas of Itaipu, of Angra and the plants whose concessions were renewed in accordance with Law 12,783/2013. This is a financial risk, since there is guarantee of neutrality of expenses with energy purchases through a tariff transfer.
35.2.6 Risk of non-renewal of concessions – generation and transmission
Decree 9,187 of November 1, 2017 regulates the extension of the thermoelectric power generation concessions set forth in Law 12,783/2013. Currently, there are two bills in progress that intend to reduce the deadline to file for intention to extend from 60 to 36 months and to terminate the possibility of extending the physical guarantee quotas regime established by said law.
By 2023, two generation plants will have their concessions overdue: the Usina Termelétrica de Figueira – UTE Figueira (20 MW) in March 2019 and the Governor Bento Munhoz hydroelectric power plant at Rocha Netto-GBM plant (1676 MW), in September 2023.
Regarding the HPP Figueira concession, the Company awaits a manifestation of the Concession Grantor regarding the request for extension of this Concession, required in March 2017. The plant is undergoing a modernization process and will have as direct benefits the improvement in energy efficiency and the reduction of pollutant emissions in the atmosphere, in comparison with the old plant.
122
![]()
Regarding the HPP GBM, the Company did not express an interest in extending this concession. Under Law 12,783/2013, the option for extension is conditioned to a change in the plant operation regime, which may occur within 60 months before its final term. Internal studies indicated that the extension through change of the anticipated operation regime is economically and financially disadvantageous in relation to the exploration of the plant in the present regime until its final term. The plant must be tendered by the Concession Grantor and the Company may participate in the auction, if it meets the qualification conditions.
According to the law, the Company may express its intention to extend the concession of the São Jorge HPP in 2019, the Apucaraninha HPP in 2020, and the Guaricana and Chaminé HPPs in 2021. If the Company does not express an interest in the extension of the current regime, the concession of the São Jorge HPP may, at its final term, be granted to the Company in the condition of registration, and the other concessions, at their final term, shall be tendered by the Concession Grantor.
Copel GeT does not have any transmission concession ending in the next ten years.
35.2.7 Risk of non-renewal of concessions – distribution of electricity
On December 9, 2015, pursuant to the Concession Agreement Amendment No. 46/1999 of Copel DIS, the concession was extended, provided that quality and efficiency parameters for provision of distribution services are met, measured by indicators that consider duration and frequency of service interruptions (DECi and FECi) and efficiency in the Company’s economic and financial management.
The fifth amendment to the concession agreement imposes indexes of economic and financial efficiency and quality. Failure to comply with the indexes for two consecutive years or any limits at the end of the first five years will result in the termination of the concession (clause 18, sub clause 1), observing the agreement terms, specifically the right to full defense and reconsideration.
Non-compliance with the global electricity supply quality indicators (DEC and FEC) for two consecutive years or three times in five years, depending on ANEEL’s regulation, may limit the payment of dividends or interest on capital (clause 2, sub clause 8), while the breach of the economic and financial sustainability indicators may require a capital contribution from the controlling shareholders (clause 13, sub clause 4).
From the sixth year following the signing of the agreement, the breach of quality criteria for three consecutive years or of economic and financial management criteria for two consecutive years will result in the opening of an expiration process (clause 12, sub clause 14), causing the end of the concession.
The following table sets forth the minimum parameters of economic and financial sustainability defined for Copel DIS in the first five years of the renewal:
123
![]()
|
| Quality - limits (a) | Quality (Performed) | ||
Year | Economic and Financial Management | DECi(b) | FECi(b) | DECi | FECi |
2016 | 13.61 | 9.24 | 10.80 | 7.14 | |
2017 | EBITDA = 0(d) | 12.54 | 8.74 | 10.41 | 6.79 |
2018 | EBITDA (-) QRR = 0(e) (f) | 11.23 | 8.24 | 10,29c | 6,20c |
2019 | {Net Debt / [EBITDA (-) QRR]} = 1 / (0.8 * SELIC)(e) (g) | 10.12 | 7.74 | - | - |
2020 | {Net Debt / [EBITDA (-) QRR]} = 1 / (1.11 * SELIC)(e) (g) | 9.83 | 7.24 | - | - |
(a) According to Aneel’s Technical Note No. 0335/2015. | |||||
(b) DECi - Equivalent Time of Interruption Caused by Internal Source per Consumer Unit; and FECi - Equivalent Frequency of Interruption Caused by Internal Source per Consumer Unit. | |||||
(c) Preliminary data. | |||||
(d) Regulatory EBTIDA adjusted for non-recurring events (PDV, post-employment benefit, provisions and reversals) according to clause six, of the Fifth Amendment to the Concession Agreement. | |||||
(e) QRR: Regulatory Reintegration Quota or Regulatory Depreciation Expense. This is the value defined in the most recent Periodical Tariff Review (RTP), plus IPCA between the month preceding the RTP and the month preceding the twelve-month period of the economic and financial sustainability measurement. | |||||
(f) Data will be disclosed in Copel DIS's Regulatory Financial Statements. | |||||
(g) Selic: limited to 12.87% p.y. | |||||
35.2.8 Risk of non-extension of the gas distribution concession
As presented in Note 2.1.1, the expiration date of the gas distribution concession of the subsidiary Compagás is under discussion with the concession grantor.
In the event of non-extension of the concession, Compagás will be entitled to compensation for investments made in the last 10 years prior to the end of the concession at their depreciated replacement value, according to the contractual clause.
35.2.9 Risk of overcontracting and undercontracting of electricity
Under the current regulatory model, the agreement for purchase of electric power by distributors is regulated by Law No. 10,484/2014 and Decree No. 5,163/2004, which determine that distributors must purchase the volume required to serve 100% of their market.
The contracting of the total output available in the market is verified by observing the period comprising the calendar year, and the difference between the costs remunerated by the tariff and those actually incurred in the power purchases are fully passed on to captive consumers, as long as the Distributor presents a contracting level between 100% and 105% of its market. However, if distributors determine contracting levels lower or higher than the regulatory limits, there is the assurance of neutrality if it is identified that such violation derives from extraordinary and unforeseen events that are not manageable by the buyer.
Since 2016, the distribution segment has been exposed to a general overcontracting scenario, as most companies determined contracting levels higher than 105%. Considering that several factors that have contributed to this situation are extraordinary and unavoidable by the distributors, such as the involuntary allocation of physical guarantee quotas and the broad migration of consumers to the free market, ANEEL and MME implemented a series of measures aiming at the mitigation of overcontracting, among which we can highlight:
124
![]()
• Normative Resolution No. 700/2016, which regulated the recognition of involuntary overcontracting arising from the reallocation of assured power quota of plants renewed pursuant Law 12,783/2013;
• Normative Resolution No. 693/2015, which regulated the New Energy and Decrease Clearing Facility (“Mecanismo de Compensação de Sobras e Déficits - MCSD-EN”), for the contracts arising from new generation projects, which permits reallocation of energy between distributors and generators;
• Normative Resolution No. 711/2016, which established criteria and conditions for bilateral agreements between distributors and generators, under the modalities of temporary total or partial reduction in the contracted power, permanent partial reduction, and also of contractual termination;
• Decree 9,143/2017 was published, which, among other measures, changes Decree 5,163/2014, recognizing: i) the involuntary contractual exposures arising from the migration of special consumers to the free market, provided that the evaluation of the maximum effort by distributors is considered by ANEEL; and ii) the contractual right to the reduction of existing power auctions, by the amounts related to the migration of special consumers to the free market. Eligible contracts are those arising from power auctions held after June 2016, pursuant to Normative Resolution No. 726/2016;
• Normative Resolution No. 824/2018, which established criteria for the processing of the Mechanism for Sale of Energy Surplus.
In relation to the contracting of 2018, preliminary, still in 2017, and throughout 2018, Copel Distribuição's indicators often indicated overcontracting scenarios. During this period, the monitoring of indicators of contracting levels prevailed, and mitigating actions were required.
All tools available were used to manage the power contracting by distributors, seeking to meet the requirement of endeavoring to adjust its contracting level to regulatory limits. In this context, we can highlight the following actions by the Company:
a) It reported surpluses of New Energy and Free Power Exchanges, under the Mechanism for Compensation of Power Surpluses and Deficits (MCSD), related to exceeding amounts of energy of physical guarantee quotas and of which the contracting by special consumers has been cancelled (disengaged);
b) It fully returned under the MCSD mechanism, the maximum variation of 4% in the contracted amounts of existing electricity;
c) It fully returned, under the monthly MCSD mechanism, the available amounts of energy existing in Distributor's portfolio, related to the disengaging of potentially free consumers; and
d) It established agreements with generators for the reduction of contracts, entering into bilateral agreements in accordance with Normative Resolution No. 711/2016.
According to the most up-to-date market data, Copel Distribuição closed 2018 year within the regulatory limits of 100% to 105% contracting, thus ensuring the neutrality of the costs associated with the energy purchase.
125
![]()
35.2.10 Gas shortage risk
This risk involves potential periods of shortage of natural gas supply to meet the Company’s gas distribution and thermal generation business requirements.
Long periods of gas shortage could result in losses due to lower revenues by subsidiaries Compagas and UEG Araucária.
The natural gas supply contract between Brazil and Bolivia is effective for twenty years, ending in 2019. Due to the non-use of all contracted natural gas in recent years, the Ministry of Mines and Energy considers the extension of the term of this contract by two years in its Ten Year Planning. In the event of non-renewal of this contract, currently centralized in Petrobras, direct consumers or state distributors must directly negotiate the fuel supply with producers, importers or suppliers of natural gas.
On the other hand, the volume of natural gas produced in the pre-salt has increased. The Brazilian’s current net output is 67 million m³/day and with growing trend.
In addition to the gas from Bolivia and from the pre-salt, there is the alternative of importing the Liquified Natural Gas (LNG). Currently, Petrobras has tree regasification stations with total capacity of 41 million m³/day.
There are also projects of new regasification stations in all Brazilian regions, with stations located in the South region of Brazil capable of serving the consumption of this region of the country without the need for large investments in transport infrastructure and reducing the level of capacity utilization of the Gasbol Sul line, which would increase the supply of natural gas in Paraná.
In the international market, the natural gas price has remained stable, indicating a balance between supply and demand.
In this scenario, the natural gas shortage risk can be considered low.
35.2.11 Risk of non-performance of wind farms
The power generation authorization contracts for wind power are subject to performance clauses, which provide for a minimum annual and four-year generation of the physical guarantee committed in the auction. Ventures are subject to climatic factors associated with wind velocity uncertainties, and non-compliance with what is stated in the agreement may jeopardize future revenues of the Company.
35.2.12 Risk related to price of power purchase and sale transactions in the active market
The Company operates in the market for the purchase and sale of energy in the active market (Note 4.15), with the objective of achieving results with changes in energy prices, subject to the risk limits established by Management. This activity, therefore, exposes the Company to the risk of future energy price.
The purchase and sale of energy are recognized at fair value through profit or loss, based on the difference between the contracted price and the market price of the transactions at the balance sheet date.
126
![]()
Based on the notional value of R$ 222,928 for purchase contracts and R$ 95,382 for contracts for the sale of electricity, outstanding on December 31 of 2018, the fair value was estimated using the prices defined by the Company in the last week of December 2018, which represented the best estimate of the future market price. The discount rate uses the return rate of the NTN-B disclosed by ANBIMA as of December 31, 2018, adjusted by a credit risk rate.
The balances relating to these outstanding transactions at December 31, 2018 are presented below.
Consolidated | 12.31.2018 | ||
| Assets | Liabilities | Net |
Current | 10,748 | (6,991) | 3,757 |
Noncurrent | 4,045 | (4,016) | 29 |
| 14,793 | (11,007) | 3,786 |
Sensitivity analysis on the power purchase and sale transactions in the active market
The main risk factor is the exposure to variation of energy market prices. The variation of the discount rate does not have a relevant impact on the fair value determined, especially in view of the short-term for the settlement of contracts.
The sensitivity analyses were prepared in accordance with CVM Instruction 475/08, considering, for scenarios 1 and 2, the increase or decrease of 25% and 50% in future prices, applied to market prices of December 31, 2018.The results obtained are as follows:
Consolidated | Price | Baseline | Projected scenarios | |
| variation | 31.12.2018 | Scenario 1 | Scenario 2 |
|
|
|
| |
Gains (losses) on purchase and sale of energy in active market | Elevation | 3,786 | 31,356 | 58,926 |
|
|
| ||
Reduction | 3,786 | (23,784) | (51,354) | |
|
|
|
|
|
127
![]()
35.3 Capital management
The Company seeks to maintain a strong capital base to maintain the trust of investors, creditors and market and ensure the future development of the business. Management also strives to maintain a balance between the highest possible returns with more adequate levels of borrowings and the advantages and the assurance afforded by a healthy capital position. Thus, it maximizes the return for all stakeholders in its operations, optimizing the balance of debts and equity.
The Company monitors capital by using an index represented by adjusted consolidated net debt divided by adjusted consolidated EBITDA (Earnings before interest, taxes, depreciation and amortization), for the last twelve months. The corporate goal established in the strategic planning provides for maintenance of ratio below 3.5 while any expectation of failing to meet this target will prompt Management to take steps to correct its course by the end of each reporting period.
As of December 31, 2018, the ratio attained is shown below:
Consolidated | 12.31.2018 | 12.31.2017 |
Loans and financing | 4,047,307 | 3,759,505 |
Debentures | 7,518,131 | 6,070,978 |
(-) Cash and cash equivalents | (1,948,409) | (1,040,075) |
(-) Bonds and securities (current) | (124,862) | (1,341) |
(-) Bonds and securities (noncurrent) | (119,574) | (112,604) |
(-) Collaterals and escrow accounts STN | (89,555) | (75,665) |
Adjusted net debt | 9,283,038 | 8,600,798 |
Net income | 1,444,004 | 1,118,255 |
Equity in earnings of investees | (135,888) | (101,739) |
Deferred IRPJ and CSLL | (68,072) | (105,257) |
Provision for IRPJ and CSLL | 580,065 | 379,943 |
Financial expenses (income), net | 438,050 | 748,440 |
Depreciation and amortization | 749,179 | 731,599 |
Adjusted ebitda | 3,007,338 | 2,771,241 |
Adjusted net debt / Adjusted ebitda | 3.09 | 3.10 |
35.3.1 The equity to debt ratio is shown below:
| Parent company |
| Consolidated | |
Indebtedness | 12.31.2018 | 12.31.2017 | 12.31.2018 | 12.31.2017 |
Loans and financing | 903,385 | 986,112 | 4,047,307 | 3,759,505 |
Debentures | 1,538,080 | 1,215,481 | 7,518,131 | 6,070,978 |
(-) Cash and cash equivalents | 315,003 | 56,833 | 1,948,409 | 1,040,075 |
(-) Bonds and securities (current) | 123,560 | 90 | 124,862 | 1,341 |
Net debt | 2,002,902 | 2,144,670 | 9,492,167 | 8,789,067 |
Equity | 16,032,925 | 15,207,842 | 16,336,214 | 15,510,503 |
Equity indebtedness | 0.12 | 0.14 | 0.58 | 0.57 |
128
![]()
36 Related Party Transactions
Consolidated |
| Assets |
| Liabilities | Revenue | Cost / Expense | ||
Related parties / Nature of operation | 12.31.2018 | 12.31.2017 | 12.31.2018 | 12.31.2017 | 12.31.2018 | 12.31.2017 | 12.31.2018 | 12.31.2018 |
Controlling shareholder |
|
|
|
|
|
|
|
|
State of Paraná - dividends payable | - | - | 112,196 | 85,710 | - | - | - | - |
CRC Transfer (Note 8) | 1,445,042 | 1,516,362 | - | - | 188,797 | 90,712 | - | - |
"Luz Fraterna" Program (a) | 10,353 | 168,405 | - | - | - | - | - | - |
2014 World Cup construction work (Note 15.1.2) | - | 14,266 | - | - | - | - | - | - |
Morar Bem Paraná Program | - | 261 | - | - | - | 1,165 | - | - |
Remuneration and employ social security charges assigned (b) | 1,248 | 56 | - | - | - | - | - | - |
Telecommunication services (c) | 15,788 | 28,750 | - | - | 41,375 | 40,396 | - | - |
Sistema Meteorológico do Paraná - Simepar (d) | - | - | 181 | - | - | - | (1,559) | (1,752) |
. |
|
|
|
|
|
|
|
|
Entities with significant influence |
|
|
|
|
|
|
|
|
BNDES and BNDESPAR -dividends payable (e) | - | - | 80,144 | 59,366 | - | - | - | - |
Financing (Note 22) | - | - | 2,208,920 | 1,576,660 | - | - | (131,379) | (140,537) |
Debentures - Compagás (Note 23) | - | - | 17,651 | 42,675 | - | - | (2,625) | (5,242) |
Debentures - wind farms (Note 23) (f) | - | - | 268,286 | 281,448 | - | - | (30,316) | (30,540) |
|
|
|
|
|
|
|
| |
State of Paraná investee |
|
|
|
|
|
|
|
|
Sanepar (c) (g) | - | 24 | 273 | - | 4,200 | 3,699 | (5,227) | (1,783) |
Use of water withdrawn from plants’ reservoirs | 144 | - | - | - | - | - | - | - |
Dividends | - | 12,095 | - | - | - | - | - | - |
|
|
|
|
|
|
|
| |
Joint ventures |
|
|
|
|
|
|
|
|
Voltalia São Miguel do Gostoso(Note 15.4) | - | 38,169 | - | - | 294 | 3,513 | - | - |
Dividends | 1,032 | 1,032 | - | - | - | - | - | - |
|
|
|
| 212 |
| - |
| |
Caiuá Transmissora de Energia (h) (i) (j) | 329 | 320 | 285 | 271 | 4,250 | 3,792 | (14,869) | (13,700) |
Dividends | 3,316 | 1,991 | - | - | - | - | - | - |
|
|
|
|
|
|
|
| |
Integração Maranhense Transmissora (h) (j) | - | - | 58 | 43 | - | - | (1,797) | (1,468) |
Dividends | 6,033 | 4,012 | - | - | - | - | - | - |
|
|
|
|
|
|
|
| |
Matrinchã Transmissora de Energia (h) (j) | - | - | 316 | 220 | - | - | (9,514) | (6,636) |
Dividends | 21,470 | 36,840 | - | - | - | - | - | - |
|
|
|
|
|
|
|
| |
GuaraciabaTransmissora de Energia (h) (j) | - | - | 136 | 74 | - | - | (4,475) | (3,202) |
Dividends | 15,869 | 11,541 | - | - | - | - | - | - |
|
|
|
|
|
|
|
| |
Paranaíba Transmissora de Energia(h) | - | - | 212 | 159 | - | - | (6,595) | (3,642) |
Dividends | 8,544 | 7,093 | - | - | - | - | - | - |
|
|
|
|
|
|
|
| |
Cantareira Transmissora de Energia(h) | - | - | 170 | - | - | - | (1,618) | - |
Dividends | 1,461 | 2,146 | - | - | - | - | - | - |
|
|
|
|
|
|
|
| |
Mata de Santa Genebra Transmissão(h) | 5,126 | 78 | - | - | 6,600 | 1,950 | - | - |
Dividends | - | 3,264 | - | - | - | - | - | - |
|
|
|
|
|
|
|
| |
Associates |
|
|
|
|
|
|
|
|
|
|
|
|
|
|
|
| |
Dona Francisca Energética S.A.(k) | - | - | 1,436 | 1,436 | - | - | (16,903) | (17,031) |
. |
|
|
|
|
|
|
|
|
Foz do Chopim Energética Ltda. (c) (h) | 193 | 163 | - | - | 2,668 | 2,063 | - | - |
Dividends | 18,071 | - | - | - | - | - | - | - |
Acquisition of power plant projects | - | - | 19,461 | - | - | - | - | - |
|
|
|
|
|
|
|
| |
Sercomtel S.A. Telecomunicações (c) (l) | 2,226 | 3,778 | - | - | 8,051 | 8,153 | (4) | (4) |
. |
|
|
|
|
|
|
|
|
Key management staff |
|
|
|
|
|
|
|
|
Fees and social security charges (Note 32.2) | - | - | - | - | - | - | (27,368) | (28,876) |
Pension and healthcare plans (Note 24.3) | - | - | - | - | - | - | (1,725) | (1,690) |
|
|
|
|
|
|
|
| |
Other related parties |
|
|
|
|
|
|
|
|
Fundação Copel (c) | 20 | 38 | - | - | 299 | 316 | - | - |
Administrative property rental | - | - | 312 | 349 | - | - | (15,396) | (16,347) |
Pension and healthcare plans (Note 24.3) | - | - | 968,763 | 866,103 | - | - | - | - |
. |
|
|
|
|
|
|
|
|
Lactec (m) | - | - | 1,601 | 1,762 | - | - | (4,026) | (15,912) |
|
|
|
|
|
|
|
|
|
a) The “Luz Fraterna” Program, created under Law No. under ticker 491/2013 and No. 17,639/2013 allows the State Government to pay for the electricity bills of low income families in Paraná, which have duly applied for the program and provided that their consumption does not exceed 120 kWh per month. This benefit is available to residential customers with single-phase connections, rural customers with single-phase connections or two-phase connections with circuit breakers of up to 50 amperes. Applicants must not have more than one electricity bill under their names and must not have any pending debts to the Company.
129
![]()
In March 2018 the amount of R$ 159,274 was deducted. The principal interest, fine and monetary restatement, at December 31, 2011, totaled R$ 158,849. For these charges on electricity bills for the period of September 2010 to June 2015, a lawsuit filed against the State of Paraná was filed on November 5, 2018, relating to the payment of invoices pursuant to State Law No. 14,087/2003. We highlight that despite the negotiations maintained by the Management, seeking to settle this debt, uncertainties still exist regarding the realization of this asset and therefore, in view of this condition, this asset was not recognized, therefore, in accordance with the current accounting standards. For the tax treatment, as determined by the Federal Revenue of Brazil in the Instruction Normative No. 1,753/2017, the Company has taxed this revenue. Management further emphasizes that it is making all necessary efforts and taking all necessary measures to preserve the Company’s interests.
b) Reimbursement of wages and social charges for employees transferred to the Paraná State Government. Balances presented are net of expected credit loss.
c) Revenue of Copel TEL from telecommunications services and lease of equipment and infrastructure.
d) The Meteorological System of Paraná - Simepar is a supplementary unit of the Independent Social Service Paraná Technology, linked to the State Department of Science, Technology and Higher Education. Simepar had contracts with Copel for services of weather forecast, meteorological reports, ampacity analysis, mapping and analyses of winds and atmospheric discharges.
e) BNDES is the parent company of BNDES Participações S.A. - BNDESPAR, which owns Copel shares (Note 30.1). On December 22, 2018 it was ended the shareholder agreement between the State of Paraná and BNDESPAR, signed on December 22, 1998.
f) BNDES and BNDESPAR acquired all the debentures issued by the subsidiaries Nova Asa Branca I, Nova Asa Branca II, Nova Asa Branca III, Nova Eurus IV and Ventos de Santo Uriel (Note 23).
g) Basic sanitation provided by Sanepar.
h) Charges for the use of the Transmission System and revenue from operating and maintenance contracts, engineering services and sharing of facilities with Copel GeT.
i) Copel DIS has Contracts for Connecting to the Transmission System - CCT with Caiuá Transmissora de Energia, with expiration until the concession of the distributor or transmitter expires, whichever occurs first.
j) Copel DIS maintains a Contract for the Use of Transmission System (Cust) with ONS and power transmission concession operators whose subject matter is the contracting of Transmission System Use Amount (Must). Contracting is permanent and is regulated by ANEEL Normative Resolution No. 666/2015. Amounts are defined for four subsequent years, with annual reviews.
k) Power purchase and sale agreement signed by Dona Francisca Energética and Copel GeT, expiring on March 31, 2025.
130
![]()
l) Light pole sharing agreement, signed between Sercomtel S.A. Telecomunicações and Copel DIS.
m) The Institute of Technology for Development (Lactec) is a Public Interest Civil Society Organization (OSCIP), in which Copel is an associate. Lactec has service and R&D contracts with Copel GeT and Copel DIS, which are subject to prior or later control and approval by ANEEL.
Transactions arising from operations in a regulated environment are billed according to the criteria and definitions established by the regulatory agents.
36.1 Guarantees awarded to related parties
Sureties and guarantees granted by Copel to its subsidiaries for financing and debentures are informed in Notes 22 and 23.
Copel provided financial guarantees, in the form of corporate guarantee letter, for power purchase agreements made by Copel GeT, in the total amount of R$ 3,246 (R$ 3,645 in 2017) and made by Copel Energia, in the amount of R$ 79,358 (R$ 49,584 in 2017).
Sureties and guarantees granted by Copel and Copel GeT for financing, debentures and insurance contracts of joint ventures are shown below:
|
|
|
|
|
|
|
|
|
|
| Date | Final | Amount | Balance | Interest | Amount | |
| Company | Operation | issued | maturity | approved | 12.31.2018 | % | guarantees |
(1) | Caiuá Transmissora | Financing | 12.23.2013 | 02.15.2029 | 84,600 | 64,643 | 49.0 | 35,843 |
(2) | Guaraciaba Transmissora | Financing | 09.28.2016 | 01.15.2031 | 440,000 | 510,075 | 49.0 | 191,133 |
(3) | Integração Maranhense | Financing | 12.30.2013 | 02.15.2029 | 142,150 | 104,570 | 49.0 | 58,797 |
(4) | Mata de Santa Genebra | Financing | 11.30.2017 | 07.15.2033 | 1,018,500 | 968,614 | 50.1 | 353,205 |
(5) | Matrinchã Transmissora | Financing | 12.27.2013 | 05.15.2029 | 691,440 | 550,181 | 49.0 | 284,036 |
(6) | Matrinchã Transmissora | Debentures | 05.15.2016 | 06.15.2029 | 180,000 | 203,327 | 49.0 | 97,740 |
(7) | Paranaíba Transmissora | Financing | 10.21.2015 | 10.15.2030 | 606,241 | 559,720 | 24.5 | 143,925 |
(8) | Paranaíba Transmissora | Debentures | 01.15.2017 | 03.15.2028 | 120,000 | 109,102 | 24.5 | 26,041 |
(9) | Voltália São Miguel do Gostoso Participações S.A. (a) | Debentures | 01.15.2016 | 12.15.2028 | 57,000 | 49,424 | 49.0 | 26,569 |
(10) | Usina de Energia Eólica Carnaúba S.A. (a) | Financing | 08.24.2015 | 11.15.2031 | 74,000 | 60,303 | 49.0 | 26,829 |
(11) | Usina de Energia Eólica Reduto S.A. (a) | Financing | 08.24.2015 | 11.15.2031 | 70,000 | 56,547 | 49.0 | 26,827 |
(12) | Usina de Energia Eólica Santo Cristo S.A. (a) | Financing | 08.24.2015 | 11.15.2031 | 74,000 | 59,234 | 49.0 | 25,220 |
(13) | Usina de Energia Eólica São João S.A. (a) | Financing | 08.24.2015 | 11.15.2031 | 68,000 | 55,074 | 49.0 | 25,569 |
(14) | Cantareira Transmissora de Energia | Financing | 12.28.2016 | 09.15.2032 | 426,834 | 471,449 | 49.0 | 208,101 |
(15) | Cantareira Transmissora de Energia | Debentures | 01.09.2018 | 08.15.2032 | 100,000 | 107,059 | 49.0 | 49,000 |
|
|
|
|
|
|
|
| 1,578,835 |
(a) Subsidiaries of Voltália São Miguel do Gostoso I Participações S.A. | ||||||||
Financial institution (fund provider): | ||||||||
BNDES: (1) (2) (3) (4) (5) (7) (10) (11) (12) (13) (14) | ||||||||
Allocation: | ||||||||
Investment Program and/or Working capital. | ||||||||
Endorsement/Security: | ||||||||
Provided by Copel Geração e Transmissão: (1) (3); | ||||||||
Provided by Copel: (2) (4) (5) (6) (7) (8) (9) (10) (11) (12) (13) (14) (15) | ||||||||
Securities offered for the transaction: | ||||||||
Pledge of shares of Copel Geração e Transmissão proportional to the interest in projects. | ||||||||
131
![]()
Performance bond | Final | Amount | % endorsement | Amount |
Company | maturity | Insured | Copel GeT | endorsement |
Matrinchã Transmissora | 09.30.2019 | 90,000 | 49.0 | 44,100 |
Guaraciaba Transmissora | 04.30.2019 | 47,000 | 49.0 | 23,030 |
Mata de Santa Genebra | 11.29.2019 | 78,300 | 50.1 | 39,228 |
Cantareira Transmissora | 08.31.2018 | 31,200 | 49.0 | 15,288 |
|
|
|
| 121,646 |
37 Commitments...................
Commitments related to long-term contracts not yet incurred, and therefore not recognized in the financial statements, are as follows:
Consolidated | 12.31.2018 | 12.31.2017 |
Energy purchase and transportation contracts | 140,638,024 | 118,588,046 |
Additions to property, plant and equipment |
|
|
Construção de linhas de transmissão e subestações | 214,086 | 292,601 |
Construction of HPP Colíder power plant | 36,303 | 42,653 |
Construction of HPP Baixo Iguaçu | 202,668 | 193,156 |
Construction of Cutia wind farm | 40,392 | 701,191 |
Telecommunications works | 115,710 | 131,557 |
Acquisition of assets for electricity distribution | 528,109 | 161,337 |
Gas purchase contracts | 1,339,848 | 2,346,064 |
Details by peril type and effective date of the main insurance policies can be seen below:
Consolidated | End | Insured |
Policy | of term | amount |
Nominated Risks | 08.24.2019 | 2,226,749 |
Operational risks - UHE Colíder | 11.01.2019 | 988,398 |
Operational risks - UEG Araucária (a) | 11.30.2019 | 849,558 |
Operational risks - HPP Governador Jayme Canet Junior | 11.23.2019 | 799,290 |
Operational risks - Brisa Potiguar | 06.27.2019 | 770,713 |
Fire - owned and rented facilities | 08.24.2019 | 619,414 |
Operational risks - São Bento | 06.27.2019 | 489,357 |
Operational risks - Elejor | 03.11.2019 | 395,100 |
Legal guarantee - Office of the General Counsel to the National Treasury | 05.10.2020 | 326,712 |
(a) The values of the insured of operating risks - UEG Araucária have been translated from USD into BRL, with the currentrate R$ 3,8748 as of December 31, 2018. | ||
In addition to the insurance policies listed above, Copel and its subsidiaries takes out other insurance policies with lower values, such as: for liability of Directors and Officers (D&O), general civil liability, payment guarantee, sundry perils, national and international transportation, life, aircraft and vehicles. The guarantee insurance taken out by the subsidiaries, joint ventures and associates have Copel and/or Copel GeT as guarantor, within the limits of their share of interest in each project.
132
![]()
39 Additional information to the Statement of Cash Flows
39.1 Transactions not involving cash
Among the transactions carried out in the line item Contract assets, specified in Notes 11.1 and 11.2, the acquisitions totaled R$ 813,450 (R$778,386 in 2017, presented in Notes 19.1, 19.3 and 20.4). Of this amount, R$ 50,927 (R$30,312 in 2017) represent the amount of purchases made in installments and not settled through the end of the reporting period.
As mentioned in Note 17.1, the total amount of contributions in the line item Investments was R$ 87,781. This amount includes R$ 36,224 related to the capital increase in joint venture Voltalia São Miguel do Gostoso I, made through the conversion and settlement of the loan agreement between the parent company Copel and the mentioned investee.
In turn, according to information in Note 18.2, property, plant and equipment acquisitions totaled R$ 1,455,318 (R$1,318,336 in 2017). Of this amount, R$ 71,454 (R$123,268 in 2017) represent the amount of purchases made in installments and not settled through the end of the reporting period.
The mentioned transactions did not involve cash and, for this reason, are not being presented in the statement of cash flows.
40.1 SPE Uirapuru Transmissora de Energia S.A.
In March 2019 Copel GeT signed an Agreement for the Purchase and Sale of Shares – CCVA with Centrais Elétricas Brasileiras S.A. – Eletrobrás and the Eletrosul Foundation for Social Security and Assistance – ELOS to transfer 100% of the shares of SPE Uirapuru Transmissora de Energia S.A., subject to approval by the National Electric Energy Agency – Aneel and by Administrative Council for Economic Defese – CADE. The Company awaits completion of the pending suspensive conditions, from which time it can obtain control of the company within 15 business days.
40.2 Commercial start-up of projects
Usina Hidrelétrica Baixo Iguaçu
On February 8, 2019, the first generating unit, of 116.7 MW of installed capacity, according to ANEEL dispatch number 384/2019 started production operations; on the February 21, 2019 was followed by the second generating unit of 116.7 MW of installed capacity, according to ANEEL dispatch number 461/2019; and on April 10,.2019, the third and last generating unit started production operations, according to ANEEL dispatch number 1037/2019, totalizing 350.2 MW of installed capacity of the plant.
133
![]()
Usina Hidrelétrica Colíder
On March 9, 2019, the first generating unit, of 100 MW of installed capacity, according to ANEEL dispatch number 673/2019 started production operations.
Complexo Eólico Cutia e Bento Miguel
In January 2019, the Paraíso dos Ventos do Nordeste wind farm, belonging to the Cutia Complex, started its operations.
In January, February and April 2019, the Bento Miguel Complex wind farms started to operate.
SPE Mata de Santa Genebra
On February 2nd, 2019, all the steps programmed for the period of operations in tests of the Santa Bárbara d’Oeste substation, belonging to SPE Mata de Santa Genebra, were completed, allowing the operation of the substation in a commercial operation. SPE Mata de Santa Genebra still awaits the issuance of the Provisional Release Agreement (TLP) by ONS, without prejudice to the date already started of the commercial operation. The TLP will provide to SPE Mata de Santa Genebra the receipt of a portion of the Annual Revenue Allowed – RAP, related to the Santa Bárbara d’Oeste substation, in the amount of R$ 10,800. The total RAP foreseen for the project is R$ 233,800.
134
| © 2018 Deloitte Touche Tohmatsu. Rua Pasteur, 463 - 1º andar - cj. 101 e 103 e 5º andar Bairro Batel 80250-080 - Curitiba - PR Brasil Tel: + 55 (41) 3312-1400 :+ 55 (41) 3312-1470
|
(Convenience Translation into English from the Original Previously Issued in Portuguese)
INDEPENDENT AUDITOR’S REPORT ON THE
INDIVIDUAL AND CONSOLIDATED FINANCIAL STATEMENTS
To the Board of Directors and Shareholders of
Companhia Paranaense de Energia – COPEL
Opinion
We conducted our audit in accordance with Brazilian and International Standards on Auditing. Our responsibilities under those standards are further described in the Auditor’s responsibilities for the audit of the individual and consolidated financial statements section of our report. We are independent of the Company and its subsidiaries in accordance with the relevant ethical requirements in the Code of Ethics for Professional Accountants and the professional standards issued by the Brazilian Federal Accounting Council (“CFC”), and we have fulfilled our other ethical responsibilities in accordance with these requirements. We believe that the audit evidence we have obtained is sufficient and appropriate to provide a basis for our audit opinion.
Basis for opinion
We conducted our audit in accordance with Brazilian and international standards on auditing. Our responsibilities under those standards are further described in the “Auditor’s Responsibilities for the Audit of the Individual and Consolidated Financial Statements” section of this report. We are independent of the Company and its subsidiaries in accordance with the relevant ethical requirements in the Code of Ethics for Professional Accountants and the professional standards issued by the Brazilian Federal Accounting Council (“CFC”), and we have fulfilled our other ethical responsibilities in accordance with these requirements. We believe that the audit evidence we have obtained is sufficient and appropriate to provide a basis for our audit opinion.
Key audit matters
Key audit matters are those matters that, in our professional judgment, were of most significance in our audit of the individual and consolidated financial statements of the current period. These matters were addressed in the context of our audit of the individual and consolidated financial statements as a whole, and in forming our opinion thereon, and we do not provide a separate opinion on these matters.
Revenue recognition
As described in notes 4.12 and 31 to the financial statements, the revenue of the Company and its subsidiaries derives mainly from the distribution, generation, transmission, and sale of electricity. This matter was considered a key audit matter due to the complexity of capturing, processing, and recognizing the transactions, the dependency on information technology systems, and the related internal control involved in the Company’s and its subsidiaries’ revenue recognition process.
Deloitte refers to one or more of Deloitte Touche Tohmatsu Limited, a UK private company limited by guarantee (“DTTL”), its network of member firms, and their related entities. DTTL and each of its member firms are legally separate and independent entities. DTTL (also referred to as “Deloitte Global”) does not provide services to clients. Please see www.deloitte.com/about to learn more about our global network of member firms.
Deloitte provides audit & assurance, consulting, financial advisory, risk advisory, tax & legal and related services to public and private clients spanning multiple industries. Deloitte serves four out of five Fortune Global 500® companies through a globally connected network of member firms in more than 150 countries bringing world-class capabilities, insights, and high-quality service to address clients’ most complex business challenges. To learn more about how Deloitte’s approximately 286,200 professionals make an impact that matters, please connect with us on Facebook, LinkedIn, or Twitter.
2019 Deloitte Touche Tohmatsu. All rights reserved. |
|
135
![]()
To address this key audit matter our audit procedures on revenue recognition included, among others: (a) assessing the design, implementation, and effectiveness of the Company’s and its subsidiaries’ internal control activities relating to Management’s process to measure the amount of revenue to be recognized in the financial statements; (b) involving our information technology specialists to assess the IT systems and environment used for revenue recognition; (c) testing, on a sample basis, the occurrence, completeness, and accuracy of the revenue recognized by Copel and its subsidiaries, and whether this revenue was recorded in the correct reporting period, based on an estimate prepared by Management, including the assessment of the unbilled revenue estimate; (d) testing, on a sample basis, the accuracy of invoice issuance; (e) testing, on a sample basis, the subsequent collection of invoices; and (f) assessing whether the disclosures made by Management in the financial statements are appropriate.
As a result of these procedures, deficiencies in internal control related to the unbilled generation and transmission revenue review processes and the recognition of telecommunications and energy sales revenue were identified, which have changed our assessment regarding the nature, timing and extent of our initially planned substantive procedures.
Based on the audit procedures described above and the audit evidence obtained, we concluded that the capture, processing, recognition, and the related disclosures on the recognition of the Company’s and its subsidiaries’ revenue are acceptable in the context of the financial statements taken as whole.
Estimated losses for impairment of property, plant and equipment items
As disclosed in notes 4.10 and 18.7 to the financial statements, the Company and its subsidiaries conduct an annual analysis of impairment indicators and, where necessary, measure their assets’ recoverable amount to conclude whether or not there is the need to recognize an allowance for impairment losses on fixed assets. This matter was considered a key audit matter due to the high degree of Management’s judgment required to measure the allowance for impairment, which requires the use of technical knowledge and the history of the Company’s and its subsidiaries’ operations, and making projections of future earnings, for the purpose of measuring the value in use said assets.
To address this key audit matter, our audit procedures included, among others: (a) assessing the design, implementation, and effectiveness of the relevant internal control over the asset impairment test; (b) assessing the criteria used to identify and measure the recoverable amount of the Company’s and its subsidiaries’ cash-generating units; (c) involving our corporate finance specialists to assist us with the assessment of the appropriateness of the model used by Management to test its assets for impairment (discounted cash flows), notably as regards the discount rate and the appropriateness of the valuation model; (d) assessing the key business assumptions used in the discounted cash flow model, notably the assumptions relating to projected revenue, estimated costs, and costs for the completion of the projects under construction; and (e) assessing whether the disclosures made by Management in the financial statements are appropriate.
© 2019 Deloitte Touche Tohmatsu. All rights reserved.
136
![]()
Based on the audit procedures described above and the audit evidence obtained, we concluded that the measurement of the allowance for impairment losses on property, plant and equipment performed by Management, as well as the related disclosures, are acceptable in the context of the financial statements taken as a whole.
Based on the audit procedures described above, we consider that the measurement of the provision for impairment of property, plant and equipment made by Management, as well as the related disclosures, are acceptable in the context of the financial statements taken as a whole.
Provision for tax, civil, labor and environmental risks
As disclosed in notes 4.11 and 29 to the financial statements, the Company and its subsidiaries are defendants in a series of lawsuits involving civil, tax, labor and environmental matters.
This matter was considered a key audit matter due to the high degree of judgment required to determine the likelihood of loss, measure the provision for risks, and prepare the related disclosures in the financial statements, which requires the use of technical and historical knowledge of the Company and its subsidiaries and the review by Management of relevant case law per individual lawsuit.
To address this key audit matter, our audit procedures included, among others: (a) assessing the design, implementation and effectiveness of the relevant internal controls over contingencies, specifically in determining the likelihood of loss and measuring the provision for risks; (b) testing, with the assistance of our information technology specialists, the IT controls and systems used by Management to control and assess the existing risks; (c) testing the completeness and accuracy of the database used by Management to determine the likelihood of loss and measure the provision for risks; (d) obtaining independent confirmation from the outside legal counsel and the attorney in charge of each lawuit of the classification of the likelihood of loss for the Company and its subsidiaries, including the amount involved; (e) assessing the assumptions and judgments used by Management in the development of these estimates, with the support of our tax and environmental specialists, including the analysis of contradictory evidence; and (f) assessing the disclosures made by Management in the financial statements.
Based on the audit procedures described above and on the audit evidences obtained, we believe that the provision for risks set up by Management, as well as the related disclosures, are acceptable in the context of the financial statements taken as a whole.
As a result of the performance of these procedures, deficiencies in internal control related to the legal risks review processes related to labor lawsuits were identified, which changed our assessment regarding the nature, timing and extent of our initially planned substantive procedures.
Based on the audit procedures described above and the audit evidence obtained, we conclude that the provision for risks estimated by Management, as well as the related disclosures, are acceptable in the context of the financial statements taken as a whole
© 2019 Deloitte Touche Tohmatsu. All rights reserved.
137
![]()
Contract assets - Transmission
As disclosed in note 4.18 to the financial statements, due to the adoption of IFRS 15/CPC 47 – Revenue from Contracts with Customers, the Company, through its subsidiary Copel Geração e Transmissão, reviewed the accounting treatment of the transmission concession financial asset and concluded that beginning January 1, 2018 such asset would start to be measured and classified pursuant this standard, and no longer pursuant to IFRIC 12/ICPC 01 –Concession Arrangements. This matter was considered a key audit matter , in light of the materiality of the balances involved and the high degree of judgment and complexity for Management to determine the factors and assumptions, linked mainly to the process of adoption of the new accounting policy, at the time the Company obtains the control of the asset and the concession asset measurement, and when the performances obligations are satisfied.
Our audit procedures included, among others: (i) assessing the design, implementation, and effectiveness of the Company’s internal control activities relating to the measurement of the concession asset, as well as other new controls implemented Management in light of the new standard; (ii) discussing the assumptions used to measure the concession asset with the Company’s Management; (iii) obtaining the measurement spreadsheets prepared by the Company to match them with the records made in the accounting system, with the appropriate measurement and classification of the concession asset; (iv) recalculating the concession asset; (v) reading and reviewing the concession contracts; (vi) reviewing Management accounting policies as compared to IFRS 15 requirements; and(vii)assessing the disclosures made by Management in the financial statements.
Based on the audit procedures described above and the audit evidence obtained, we concluded that the adoption of the new concession asset measurement and classification policy, made by the Company, as well as the related disclosures, are acceptable in the context of the financial statements taken as a whole.
Fair value of energy purchase and sale transactions in an active market
As disclosed in note 4.15 to the financial statements, the Company, through its wholly-owned subsidiary Copel Comercialização S.A., is a party to energy sale contracts with trading characteristics, where there is no commitment to arrange a purchase under a sale contract and that the Company has a certain flexibility to manage the contracts in this portfolio for the purpose of obtaining gains arising on changes in market prices, taking into account its risk policies and limits. This matter was considered a key audit matter due to the high degree of judgment required by Management to measure the fair value of the energy purchase and sale contracts with forward positions as at December 31, 2018, requiring the use of technical and market knowledge by the Company.
To address this key audit matter, our audit procedures included, among others: (a) assessing the design, implementation and effectiveness of the relevant internal controls over energy purchase and sale contracts and the measurement of the fair value of the energy purchase and sale contracts of the trading portfolio; (b) assessing the criteria used to identify the energy purchase and sale contracts in the trading portfolio and measuring the fair value of such contracts at the end of the reporting period; (c) assessing the assumptions and judgments used by Management in the development of the fair value and the analysis of contradictory evidence; and (d) assessing the disclosures made by Management in the financial statements.
Based on the audit procedures described above and the audit evidence obtained, we conclude that the fair value measurement of the energy purchase and sale transactions in the Company’s trading portfolio, through its wholly-owned subsidiary Copel Comercialização S.A., as well as the related disclosures, are acceptable in the context of the financial statements taken as whole.
© 2019 Deloitte Touche Tohmatsu. All rights reserved.
138
![]()
Other matters
Statements of value added
The individual and consolidated statements of value added (“DVA”) for the year ended December 31, 2018, prepared under the responsibility of the Company's Management and disclosed as supplemental information for purposes of the IFRS, were subject to audit procedures performed together with the audit of the Company’s financial statements. In forming our opinion, we assess whether these statements of value added are reconciled with the financial statements and accounting records, as applicable, and whether their form and content are in accordance with the criteria set out in technical pronouncement CPC 09 –Statement of Value Added. In our opinion, these statements of value added were appropriately prepared, in all material respects, in accordance with the criteria set out in such technical pronouncement and are consistent in relation to the individual and consolidated financial statements taken as a whole.
Other information accompanying the individual and consolidated financial statements and the independent auditor’s report
Management is responsible for the other information. The other information comprises the Management Report.
Our opinion on the individual and consolidated financial statements does not cover the Management Report and we do not express any form of audit conclusion thereon.
In connection with our audit of the individual and consolidated financial statements, our responsibility is to read the Management Report and, in doing so, consider whether this report is materially inconsistent with the financial statements or our knowledge obtained in the audit or otherwise appears to be materially misstated.
If, based on the work we have performed, we conclude that there is a material misstatement in the Management Report, we are required to report that fact. We have nothing to report in this regard
individual and consolidated financial statements
Management is responsible for the preparation and fair presentation of the individual and consolidated financial statements in accordance with accounting practices adopted in Brazil and the International Financial Reporting Standards (“IFRSs”), issued by the International Accounting Standards Board (“IASB”), and for such internal control as Management determines is necessary to enable the preparation of financial statements that are free from material misstatement, whether due to fraud or error.
In preparing the individual and consolidated financial statements, Management is responsible for assessing the Company’s ability to continue as a going concern, disclosing, as applicable, matters related to going concern and using the going concern basis of accounting unless Management either intends to liquidate the Company and its subsidiaries or to cease operations, or has no realistic alternative but to do so.
Those charged with governance are responsible for overseeing the Company’s and its subsidiaries’ financial reporting process.
Auditor’s responsibilities for the audit of the individual and consolidated financial statements
© 2019 Deloitte Touche Tohmatsu. All rights reserved.
139
![]()
Our objectives are to obtain reasonable assurance about whether the individual and consolidated financial statements as a whole are free from material misstatement, whether due to fraud or error, and to issue an auditor’s report that includes our opinion. Reasonable assurance is a high level of assurance, but is not a guarantee that an audit conducted in accordance with Brazilian and International Standards on Auditing will always detect a material misstatement when it exists. Misstatements can arise from fraud or error and are considered material if, individually or in the aggregate, they could reasonably be expected to influence the economic decisions of users taken on the basis of these financial statements.
As part of an audit in accordance with Brazilian and International Standards on Auditing, we exercise professional judgment and maintain professional skepticism throughout the audit. We also:
· Identify and assess the risks of material misstatement of the individual and consolidated financial statements, whether due to fraud or error, design and perform audit procedures responsive to those risks, and obtain audit evidence that is sufficient and appropriate to provide a basis for our opinion. The risk of not detecting a material misstatement resulting from fraud is higher than for one resulting from error, as fraud may involve collusion, forgery, intentional omissions, misrepresentations, or the override of internal control.
· Obtain an understanding of internal control relevant to the audit in order to design audit procedures that are appropriate in the circumstances, but not for the purpose of expressing an opinion on the effectiveness of the internal control of the Company and its subsidiaries.
· Evaluate the appropriateness of accounting policies used and the reasonableness of accounting estimates and related disclosures made by Management.
· Conclude on the appropriateness of Management’s use of the going concern basis of accounting and, based on the audit evidence obtained, whether a material uncertainty exists related to events or conditions that may cast significant doubt on the ability of the Company and its subsidiaries to continue as a going concern. If we conclude that a material uncertainty exists, we are required to draw attention in our auditor’s report to the related disclosures in the individual and consolidated financial statements or, if such disclosures are inadequate, to modify our opinion. Our conclusions are based on the audit evidence obtained up to the date of our auditor’s report. However, future events or conditions may cause the Company and its subsidiaries to cease to continue as a going concern.
· Evaluate the overall presentation, structure and content of the financial statements, including the disclosures, and whether the individual and consolidated financial statements represent the underlying transactions and events in a manner that achieves fair presentation.
· Obtain sufficient appropriate audit evidence regarding the financial information of the entities or business activities within the Group to express an opinion on the consolidated financial statements. We are responsible for the direction, supervision and performance of the group audit. We remain solely responsible for our audit opinion.
We communicate with those charged with governance regarding, among other matters, the planned scope and timing of the audit and significant audit findings, including any significant deficiencies in internal control that we identify during our audit.
We also provide those charged with governance with a statement that we have complied with relevant ethical requirements regarding independence, and to communicate with them all relationships and other matters that may reasonably be thought to bear on our independence, and where applicable, related safeguards.
From the matters communicated with those charged with governance, we determine those matters that were of most significance in the audit of the financial statements of the current period and are therefore the key audit matters. We describe these matters in our auditor’s report unless law or regulation precludes public disclosure about the matter or when, in extremely rare circumstances, we determine that a matter should not be communicated in our report because the adverse consequences of doing so would reasonably be expected to outweigh the public interest benefits of such communication.
© 2019 Deloitte Touche Tohmatsu. All rights reserved.
140
![]()
The accompanying individual and consolidated financial statements have been translated into English for the convenience of readers outside Brazil.
Curitiba, March 28, 2019
DELOITTE TOUCHE TOHMATSU Auditores Independentes | Fernando de Souza Leite Engagement Partner |
© 2019 Deloitte Touche Tohmatsu. All rights reserved.
141
![]()
ANNUAL STATUTORY AUDIT COMMITTEE REPORT
1. PRESENTATION AND GENERAL INFORMATION
Copel's Statutory Audit Committee (CAE or Committee) is established in Section I of Chapter V of its Bylaws, and is comprised of five members, Board Members, mostly independent members, pursuant to applicable legislation. The characteristics, composition, functioning and competences of the Committee are established in specific Internal Regulations. This Committee advises and reports to the Board of Directors - BOD, to which it is directly linked.
The main duties of the Statutory Audit Committee are to ensure the quality and integrity of the Company's financial statements; compliance with legal and regulatory requirements; the performance, independence and quality of the work of the Independent Audit firm engaged to issue an opinion on the financial statements; the performance and quality of the work of the Internal Audit; and for the quality and efficiency of internal control and risk management systems.
In 2018 at the request of the CAE, a work plan to support its activities was prepared by the consulting firm PricewaterhouseCoopers - PwC in conjunction with the Copel Internal Audit team considering current legislation, internal regulations and best market practices. To study and develop this plan, PwC used the following work methodology: mapping the responsibilities of the CAE; a plan to meet responsibilities; reference benchmarks; training; and discussions with the Committee. As a result, the consulting firm presented a Work Plan listing the requirements and recommendations for CAE operation, as well as a schedule for the performance of these activities over one year. The structure of this schedule includes the matters to be covered; the internal area responsible for support; the activity to be performed; the references in relation to Law 13313/2016, the Sarbanes-Oxley Act - SOx 301/407, CVM Instruction 509, best governance practices; the frequency of presentation of the matters, the estimated duration of discussion; and the distribution of these matters throughout the year.
The Independent Audit, currently Deloitte Touche Tohmatsu Auditores Independentes - Deloitte, are responsible for auditing the financial statements and must ensure that these present fairly the financial position of the Company - Copel Holding and the consolidated financial statements of its wholly-owned subsidiaries (GeT, DIS , CTE, REN, COM and Eólicas) and subsidiaries - in accordance with accounting practices adopted in Brazil, Brazilian corporate law, the rules of the Brazilian Securities and Exchange Commission (CVM), already aligned with international accounting standards, and standards issued by the Brazilian Electricity Regulatory Agency - ANEEL and the Brazilian Telecommunications Regulatory Agency - ANATEL. In addition, Deloitte is also responsible for assessing the internal control environment of Copel Holding and its wholly-owned subsidiaries, as these are subject to the Sarbanes-Oxley Act - SOx.
The Statutory Audit Committee shall prepare the Statutory Audit Committee Report on an annual basis, containing the following information: (i) its activities, findings, conclusions and recommendations in the period, including analysis of the effectiveness of such activities; (ii) an evaluation of the effectiveness of internal control and risk management systems, recording any weaknesses; (iii) a description of the recommendations presented to the boards, recording those not complied with and any justification; (iv) an evaluation of the effectiveness of the work of the independent auditing firm and the Internal Audit, verifying compliance with legislation, the Company's regulations and internal standards, recording any weaknesses; and (v) an evaluation of the financial statements, with emphasis on the application of the accounting practices adopted in Brazil and abroad, in addition to compliance with standards issued by regulatory agencies, recording any differences and weaknesses.
142
![]()
2. HISTORY OF COMMITTEE COMPOSITION
Initially created in order for the Company to comply with the requirements of the Sarbanes-Oxley Act - SOx, which regulates the activities of publicly traded companies with shares traded on the NYSE stock exchange in the United States, the Audit Committee, linked to the Board of Directors, has been in operation since May 2005. With the amendment of the Company's Bylaws, approved at the 195th Extraordinary General Meeting of Shareholders held on June 7, 2017, the Committee was renamed the Statutory Audit Committee (CAE).
In 2018, the Committee had the following composition, elected for the term of office from April 2017 to April 2019: Members Mauricio Schulman (as Chairman); Leila Abraham Loria, Marco Antônio Barbosa Cândido, Olga Stankevicius Colpo and Rogério Perna. Mr. Rogério Perna was the CAE's financial and accounting specialist, in compliance with Brazilian and US legislation until his resignation, accepted on September 12, 2018, by the 182nd Ordinary Meeting of the Board of Directors. Currently, the CAE is composed of the following board members: Mauricio Schulman (as Chairman); Leila Abraham Loria, Marco Antônio Barbosa Cândido and Olga Stankevicius Colpo.
It should be stressed that all members of the CAE are considered independent members under the criteria of Federal Law 13303/2016 and meet the independence requirements imposed by the Securities and Exchange Commission - SEC and by the New York Stock Exchange - NYSE.
3. SUMMARY OF ACTIVITIES IN 2018
3.1. MEETINGS HELD AND MAIN CHARACTERISTICS
The items of the meetings held in 2018 were based on the Work Plan prepared for the Statutory Audit Committee, which indicates the following matters for the discussion by the Committee over the year, distributed over at least 12 meetings and 99 items: analysis of accounting information; external audit; whistleblowing channel; training; compliance; hiring/consulting; internal controls, internal audit and financial statements; debriefing; disclosure; finances and financial statements; risk management; budget; other extraordinary matters; related parties; CAE internal rules; and CAE independence regulations.
During the period from January 1 to December 31, 2018, 18 meetings of Copel´s Statutory Audit Committee were held, which included 104 items, involving members of the Executive Board, Managers, Internal Auditors and Independent Auditors.
The decisions taken and the recommendations made by the CAE were duly recorded in the minutes. The main topics discussed during the meetings were reported on a monthly basis at the ordinary meetings of the Board of Directors (BOD), detailing the activities and recommendations addressed to the different areas of the Company and its subsidiaries and associates as well as the discussions and the findings regarding monitoring of the Internal Auditor and Independent Auditor activities. These reports were summarized in the minutes of the Board of Directors meeting.
143
![]()
ITEMS BY SUBJECT:
The summary of the scope of the items carried out is as follows:
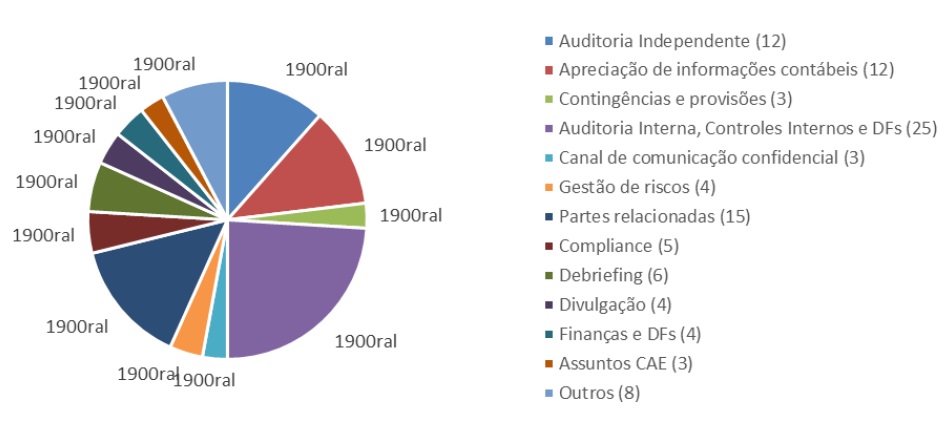
3.2. INDEPENDENT AUDIT
During the course of 2018, there were 12 items regarding the participation of the Independent Audit, considered in meetings of the Statutory Audit Committee. These items addressed the planning of the Independent Audit work for 2018; an analysis of significant matters addressed by the Independent Auditor; monitoring the status of action plans and/ or projects to mitigate weaknesses identified by the independent audit over the 2018 period; and inquiring about knowledge of fraud and the processes adopted for its mitigation.
The Committee assesses the volume and quality of the information provided, which supports its opinion on the adequacy and integrity of internal control systems and financial statements, as satisfactory. No situations were identified that could affect the objectivity and independence of the independent auditors. As a result, the Statutory Audit Committee evaluates the coverage and quality of the work performed by the Independent Audit, regarding the financial statements for the fiscal year ended December 31, 2018, as adequate.
The Committee reviews decisions taken on matters related to independent audit on a monthly basis.
3.3. FINANCIAL STATEMENTS
During the course of 2018, 12 items were prepared for financial statement purposes, in meetings of the Statutory Audit Committee. These items addressed the engagement of other services that may be provided by the Independent Audit firms auditing the Company's financial statements; a review of accounting policies, practices and principles used by Copel in the preparation of the financial statements, in particular the new accounting pronouncements – CPC 47 - Revenue from Contracts with Customers and CPC 48 - Financial Instruments; the analysis and recommendation for approval of the Annual Management Report and Financial Statements for the year 2017; a preliminary review of the Interim Financial Statements - 1st, 2nd and 3rd Quarters of 2018; the restatement of the Annual Management Report and the Financial Statements for 2017, with presentation of Deloitte´s unqualified opinion; the ratification of the Proposal of the Executive Board for Allocation of Profit for 2017 and for Payment of Profit Sharing related to the Integration between Capital and Labor and Incentive to Productivity; the review of the Interim Financial Statements for the 1st, 2nd and 3rd Quarters of 2018; and the restatement of the Interim Financial Statements for the first, second and third quarters of 2017.
144
![]()
The Committee discussed the findings of the work with the Independent Auditors, the key audit matters described in its report and its conclusions on the audit of these financial statements, and the opinion of the Independent Auditors does not contain any qualifications. The main points discussed were also related to the accounting practices adopted in Brazil, as well as recommendations, other issues in the reports on internal controls and presentation of the financial statements. The Committee found that the financial statements of the Company - Copel Holding and the consolidated financial statements of the wholly-owned subsidiaries and subsidiaries - are appropriate in relation to accounting practices and Brazilian corporate law, as well as the rules issued by the Brazilian Electricity Regulatory Agency - ANEEL and the Brazilian Telecommunications Regulatory Agency - ANATEL, as well as the rules of the Brazilian Securities and Exchange Commission (CVM) and the International Financial Reporting Standards (IFRS) issued by the International Accounting Standards Board - IASB, and the standards issued by the Securities and Exchange Commission - SEC and the Sarbanes-Oxley Act - SOx.
3.4. CONTINGENCIES AND PROVISIONS
In the course of 2018, 03 items regarding contingencies and provisions were addressed in meetings of the Statutory Audit Committee. These items considered the presentation of the criteria for classifying contingencies, information regarding the Company's provisions and the actions being taken to improve legal proceedings; and the criteria for classification of legal contingencies.
It is important to note that the judicial (and administrative) contingent liabilities and their respective provisions were analyzed and discussed in meetings of the Statutory Audit Committee with the Legal and Accounting Departments, and the Compliance and Internal Controls area, in addition to the Independent Auditors. The Statutory Audit Committee was requested to review the criteria used to classify the likelihood of success and estimate the amounts of the administrative and judicial proceedings and thus provide guidance on provisioning of the amounts in question.
The Committee reviews decisions taken on matters related to contingencies and provisions on a monthly basis.
3.5. INTERNAL AUDIT
During the course of 2018, 19 items covered by the Internal Audit were considered in meetings of the Statutory Audit Committee. During this period, the Committee monitored the activities of the Internal Audit and verified its recommendations, approved the Annual Report on the Activities of the Internal Audit (Raint) 2017 and the Annual Internal Audit Plan (Paint) 2018/2019; carried out the evaluation of the procedures for formalizing the debts in favor of the office contracted office by means of Adjustment of Account Agreement - TAC related to an arbitration process; was made aware of the Internal Audit Certification Project, with presentation of the schedule and general information; accompanied special work of the Internal Audit, obtained information and made approvals under the Quality Management and Continuous Improvement Program - PGQM/International Certification of Internal Audit; approved the adequacy of the Internal Audit Rules and Internal Regulation of the Statutory Audit Committee with the International Standards for the Professional Practice of Internal Audit; and was made aware of the evaluation of the Internal Audit on Risk Management in the Company and on the work related to the Sarbanes-Oxley Act - SOx.
145
![]()
Specifically, in relation to the international certification of the Internal Audit, the CAE analyzed and validated the actions implemented in this regard. It also strongly recommended strengthening the Company's actions to identify problems, ensuring independent performance of the Internal Audit in the execution of its activities.
The Committee assesses the volume and quality of the information provided which supports its opinion on the adequacy and integrity of internal control systems and financial statements as satisfactory. No situations were identified that may affect the objectivity and independence of the Independent Audit. As a result, the Statutory Audit Committee assesses the coverage and quality of the work performed by the Internal Audit, regarding the financial statements for the fiscal year ended December 31, 2018, as adequate.
The Committee reviews decisions taken on matters related to internal auditing on a monthly basis.
3.6. INTERNAL CONTROL SYSTEMS
During the course of 2018, 06 items regarding internal controls were considered in meetings of the Statutory Audit Committee. During this period, the Committee received a report on the work related to internal controls; carried out the preliminary analysis of the Internal Controls Report with the document already in its final draft; and received an update on audit status from Deloitte regarding these Internal Controls.
The methodology adopted by the Company for the analysis of internal controls is in line with the structure of the Internal Control - Integrated Framework, defined by Committee of Sponsoring Organizations of the Treadway Commission (COSO), and the Sarbanes-Oxley Act - SOx. The Company's management is responsible for the implementation of policies, procedures, processes and practices of internal controls that allow the safeguard of assets, timely recognition of liabilities, adherence to rules as well as the integrity and accuracy of information. The Internal Audit is responsible for assessing the degree of compliance or observance, by all areas of the Company, with internal control procedures and practices and that these are being applied effectively.
In 2018, the CAE regularly monitored the review of all of the Company's internal controls that resulted in a distinct plan of action for 2019. The Committee also encouraged and validated the creation of control instruments (Internal Policies, Administrative Rules, among others) to ensure the smooth running of the Company's activities, including those of its subsidiaries and associates.
Although the issue has been dealt with in specific items, it continues to permeate other items of the Committee work agenda, having been discussed at length during the year by the members of the CAE. The Committee reviews decisions taken on matters related to internal control systems on a monthly basis.
3.7. OMBUDSMAN AND WHISTLEBLOWING
During 2018, 03 items regarding the Ombudsman and Whistleblowing Channel were covered in meetings of the Statutory Audit Committee. These items addressed the follow-up of the Whistleblowing Channel and the update of the Whistleblowing Policy for compliance with the Corporate Governance Report - CVM Instruction 586/2017.
146
![]()
The CAE also monitors, during the year, in specific meetings, complaints received by the Channel that were treated, through Internal Audit, under a more intensive investigation due to their nature.
In the first quarter of 2018, there was the engagement through On-site Bidding, of a company to implement and maintain the Whistleblowing Channel with Ernst & Young as the bidder. One of the justifications for the engagement is the modernization of the tool, providing access also via the Internet, and outsource the handling of whistleblowing. Best Corporate Governance practice indicates that with outsourcing there is an improved perception over the guarantee of anonymity by the whistleblower. Accordingly, influenced by a process of communication and education developed by the Company, the public begins to perceive risks and communicates these to the Company through reports.
The Committee reviews decisions taken on matters related to the ombudsman and whistleblowing channel on a monthly basis.
3.8. RISK MANAGEMENT AND MONITORING
During 2018, there were 04 Risks Management and Monitoring items were discussed in meetings of the Statutory Audit Committee. These items addressed the review of the Company's Integrated Corporate Risk Management Policy; and the reporting of work on risk management.
The CAE, with the purpose of reinforcing the quality of the risk matrix, stated the need for a quarterly analysis by the Committee of the risk matrix and that the resulting mitigation plans be added to the Corporate Risk Management Policy.
The Committee reviews decisions taken on matters related to risk management and monitoring on a monthly basis.
3.9. TRANSACTIONS WITH RELATED PARTIES
One of the functions of the Statutory Audit Committee is "to evaluate and monitor, in conjunction with management and the Internal Audit area, the adequacy of transactions with related parties carried out by the Company."
During the course of 2018, there were 15 items regarding transactions with related parties addressed at CAE meetings. These items considered, in addition to the recommendation for approval of the transactions themselves, the review of the Transactions with Related Parties and Conflicts of Interest Policy; and the monitoring of operations/ transactions with Related Parties.
The Committee reviews decisions taken on matters concerning transactions with related parties on a monthly basis.
3.10. OTHER ACTIVITIES
In addition to the aforementioned activities, the Statutory Audit Committee discussed other items in regular meetings related to the matters already indicated in this report and other matters indicated in the CAE Work Plan which are: compliance; debriefing; disclosure; finances and financial statements; monitoring of decisions; budget; CAE internal regulation; and CAE independence regulations. Furthermore, other matters indicated were also considered, when applicable, together with the other items indicated earlier in this report.
147
![]()
These items dealt with the Company's Internal Policies, such as: financial investment, investment, engaging independent auditing services, integrity and updating the integrity program.
In relation to subsidiaries and associates, the CAE intensively monitored the investigation process carried out within UEG Araucária Ltda. (UEGA) over the year, having regularly discussed the matter and having made recommendations to Management. The monthly reports on the progress of the issue continue to be made to the Committee on a regular basis, to monitor the proceedings in progress.
The CAE also analyzed information on review of the Company's Code of Conduct and approved the Committee's Internal Regulations and any amendments thereto, as well as the annual calendar of meetings for 2019.
As part of its 2019 scheduling, the Statutory Audit Committee discussed its Work Plan, prepared by the consultancy PricewaterhouseCoopers - PwC for the Committee and analyzed the results of the 2017 Committee performance evaluations, also conducted by PwC.
4. STATUTORY AUDIT COMMITTEE COMMUNICATION
4.1. BOARD OF DIRECTORS
The Statutory Audit Committee reports its activities monthly at the ordinary meetings of the Board of Directors, presenting the matters discussed, its position and requests made to the various areas of the Company. In specific resolutions, the Statutory Audit Committee issues notice to the Board of Directors, with its position and recommendations.
4.2. SENIOR MANAGEMENT - EXECUTIVE BOARD AND MANAGERS
For all meetings of the Statutory Audit Committee, the Boards involved in the topics to be discussed are invited and recommend participation of the Managers of the areas responsible for the items to be addressed. In addition, it is also the responsibility of these Boards, through their Executive Management, to propose items for presentation to the Statutory Audit Committee, as regards the competences of this Committee, particularly those matters that will be submitted for consideration and decision by the Board of Directors.
5. RECOMMENDATIONS TO THE EXECUTIVE BOARD
· Development of Remediation Plan for material weaknesses in the Company's internal controls, as indicated by the Independent Auditors, in connection with the performance of the audit work related to the fiscal year 2017 and related to the following matters:a. Ineffective internal controls in the monitoring and authorization of certain transactions in not wholly-owned subsidiaries;b. Inefficient internal controls on financial reporting related to the accounting of securities/investments and taxes on regulatory assets;c. Ineffective implementation of general information technology (IT) controls, policies and procedures on user access, segregation of duties, and change management in not-wholly owned subsidiaries;d. Ineffective controls over the approval of certain types of manual accounting entries;e. Ineffective controls on estimates used in the analysis of impairment;f. Ineffective controls in the identification of processes related to the accounting of provision for risks.
148
![]()
For each of these weaknesses, an Action Plan was established by the responsible competent board, which were described in Form 20F, which requires the indication of the Action Plan when there is material weakness identified by the Independent Auditor. Form 20F is required on an annual basis by the Securities and Exchange Commission - SEC for foreign companies with publicly traded securities on the United States stock exchanges. This form includes, for example, reports containing relevant information on the financial statements and aspects of corporate governance. The Action Plans presented on Form 20F were extensively discussed within the scope of the boards involved, as well as with specialists from the Company's areas. A committee was created to monitor remediation actions for material and significant weaknesses identified by the Independent Auditor, Deloitte, in the presence of the Chief Executive Officer and the Officers responsible for the Action Plans. Since then, the CAE has been monitoring the status of the action plans and/or projects on a monthly basis to mitigate the weaknesses identified by the Independent Auditor.
· It is recommended that an Internal Audit of the Quality Assessment Certification Project (Internal Audit Certification) be implemented.
Beginning in August/2018, the Internal Audit established a timetable for the implementation of the certification, with completion scheduled for March/2019, with the Issuance of a Quality Assessment Certificate carried out by the Brazilian Institute of Internal Auditors.
· Verification of the Company’s compliance with Federal Law 13,303/2016 and pertinent measures to also ensure adherence of the associates and/or subsidiaries to the aforementioned Federal Law and any new legislation in force.
The Company has made the necessary adjustments to its corporate and internal documents to comply with the provisions of the law, including engaging PricewaterhouseCoopers - PwC to prepare a work plan for the CAE that is appropriate to the new legislation in force, including Law 13303/2016. The work plan is already incorporated into the routines of the Committee, and its performance is monitored by the Corporate Governance Secretariat - SEC.
In addition, the Corporate Governance Secretariat (SEC) also performs the monitoring of past meetings of the Committee, making information available to the members of the CAE in a virtual restricted access environment, on a monthly basis, before ordinary meetings.
· Development of a plan to implement and maintain the provisions set forth in the Copel Code of Conduct to ensure that employees know and follow the guidelines established by the Code.
The Company held seminars with the participation of employees and outsourced workers on topics such as the Code of Conduct and Whistleblowing Channel, conducted by the Corporate Integrity Coordination, where it emphasized Copel's position of valuing transparent dialogue and ethical relationship with its various audiences, focused on the Company's suppliers. Copies of the Code of Conduct were distributed on those occasions. Also, internal "Compliance Alerts" were issued to all Company employees, on a wide range of topics, focusing on mandatory matters and sensitive processes in each field of activity.
149
![]()
6. CONCLUSIONS AND RECOMMENDATION TO THE BOARD OF DIRECTORS
The members of the Statutory Audit Committee, in the exercise of their duties and legal responsibilities, examined and analyzed the financial statements of the Company, Copel Holding, and the consolidated financial statements of the wholly-owned subsidiaries and subsidiaries, accompanied by the Independent Auditor´s Report and the Annual Management Report for the fiscal year ended December 31, 2018. Considering all the analyses, studies and discussions carried out during the meetings as well as the monitoring and supervision work carried out by the CAE - previously described in summarized form – in addition to information provided by the Company's Management and by Deloitte Touche Tohmatsu Auditores Independentes, the members of the Statutory Audit Committee consider that all material facts are adequately disclosed in the audited financial statements at December 31, 2018, in the Annual Report 2018, and recommend their approval by the Board of Directors.
Curitiba, March 28, 2018.
MAURICIO SCHULMAN LEILA ABRAHAM LORIA
MARCO ANTÔNIO BARBOSA CÂNDIDO OLGA STANKEVICIUS COLPO
150
![]()
SUPERVISORY BOARD’S OPINION ON THE ANNUAL MANAGEMENT REPORT
FOR THE YEAR 2018 AND THE FINANCIAL STATEMENTS FOR THE YEAR 2018 AND ON THE OFFICERS’ PROPOSAL FOR ALLOCATION OF THE PROFIT FOR 2018
The undersigned members of the Supervisory Board of Companhia Paranaense de Energia - Copel, within their legal and statutory duties and responsibilities, have examined the Financial Statements for the year 2018, which comprise the statement of financial position as at December 31, 2018 and the statements of income, comprehensive income, changes in equity and cash flows, as well as the related explanatory notes and the Officers’ Proposal for Allocation of the Profit for 2018. The minutes were received and analyzed individually by the Directors and discussed previously with management. Based on the work performed and discussions held during the year, the analyses and interviews carried out, the accompanying of the discussions and clarifications on internal controls provided by Management and the Independent Auditors, and also considering the Report of the Auditor Deloitte Touche Tohmatsu Auditores Independentes on the Individual and Consolidated Financial Statements, issued with no qualifications, the board members state that they were not aware of any fact or evidence that is not reflected in the referred Financial Statements and that said statements are in a position to be referred to the General Shareholders’ Meeting resolution.
Curitiba, March 28, 2019
ROBERTO LAMB CLEMENCEAU MERHEB CALIXTO
Chairman
DAVID ANTONIO BAGGIO BATISTA GEORGE HERMANN RODOLFO TORMIN
LETÍCIA PEDERCINI ISSA MAIA
151
![]()
In conformity with CVM Instruction 480/2009, in effect since January 1, 2010, below we present the capital budget proposal for 2019, approved at the 184th annual meeting of the Board of Directors of Companhia Paranaense de Energia, held on November 7, 2018, as well as the origin of the funds.
INVESTMENT PROGRAM | R$ Thousand |
Generation and Transmission (a) | 768,494 |
Distribution | 835,000 |
Telecommunications | 290,193 |
Wind Farm Projects (b) | 66,474 |
Others (c) | 7,146 |
TOTAL | 1,967,307 |
(a) Includes SPE Bela Vista (Ger) and SPE Uirapuru (Tra) (b) Includes Brisa Potiguar, Cutia Empreendimentos Eólicos and São Bento Energia (c) Includes Holding, Copel Comercialização, among others |
|
SOURCES OF FUNDS | R$ Thousand |
Funds from Third Parties | 484,000 |
BNDES | 279,000 |
Other Financial Institutions | 205,000 |
Company Funds, from retention of profits and generation of cash from the Company’s operations | 1,483,307 |
TOTAL | 1,967,307 |
152
![]()
S T A T E M E N T………………
By this document, the Officers of Companhia Paranaense de Energia - Copel, mixed capital corporation, with registered office at Rua Coronel Dulcídio nº 800, Curitiba - PR, enrolled in the National Registry of Legal Entities (CNPJ/MF No. 76.483.817/0001-20, for the purpose of the provisions in items V and VI, paragraph 1, of article 25 of CVM Instruction 480/2009, state that:
I. they have reviewed and discussed and agree with the opinions expressed in the audit report of Deloitte Touche Tohmatsu Auditores Independentes related to the financial statements of Copel for the year ended December 31, 2018; and
II. they have reviewed and discussed and agree with the financial statements of Copel for the year ended December 31, 2018.
Curitiba, March 28, 2019
Daniel Pimentel Slaviero Ana Letícia Feller
Chief Executive Officer Chief Enterprise Management Officer
Adriano Rudek de Moura Cassio Santana da Silva
Chief Financial and Investor Relations Officer Chief Business Development Officer
Eduardo Vieira de Souza Barbosa Vicente Loiácono Neto
Chief Legal and Institutional Relations Officer Chief Governance, Risk and
Compliance Officer
153
| COMPANHIA PARANAENSE DE ENERGIA – COPEL | ||
| By: | /S/ Daniel Pimentel Slaviero | |
Daniel Pimentel Slaviero Chief Executive Officer | ||
This press release may contain forward-looking statements. These statements are statements that are not historical facts, and are based on management's current view and estimates of future economic circumstances, industry conditions, company performance and financial results. The words "anticipates", "believes", "estimates", "expects", "plans" and similar expressions, as they relate to the company, are intended to identify forward-looking statements. Statements regarding the declaration or payment of dividends, the implementation of principal operating and financing strategies and capital expenditure plans, the direction of future operations and the factors or trends affecting financial condition, liquidity or results of operations are examples of forward-looking statements. Such statements reflect the current views of management and are subject to a number of risks and uncertainties. There is no guarantee that the expected events, trends or results will actually occur. The statements are based on many assumptions and factors, including general economic and market conditions, industry conditions, and operating factors. Any changes in such assumptions or factors could cause actual results to differ materially from current expectations.