Companhia Paranaense de Energia - COPEL (ELP)
Filed: 11 May 23, 6:27am
SECURITIES AND EXCHANGE COMMISSION
Washington, D.C. 20549
FORM 6-K
Report of Foreign Private Issuer
Pursuant to Rule 13a-16 or 15d-16 of the
Securities Exchange Act of 1934
For the month of May, 2023
Commission File Number 1-14668
COMPANHIA PARANAENSE DE ENERGIA
(Exact name of registrant as specified in its charter)
Energy Company of Paraná
(Translation of Registrant's name into English)
José Izidoro Biazetto, 158
81200-240 Curitiba, Paraná
Federative Republic of Brazil
+55 (41) 3331-4011
(Address of principal executive offices)
Indicate by check mark whether the registrant files or will file annual reports under cover Form 20-F or Form 40-F. Form 20-F ___X___ Form 40-F _______
Indicate by check mark whether the registrant by furnishing the information contained in this Form is also thereby furnishing the information to the Commission pursuant to Rule 12g3-2(b) under the Securities Exchange Act of 1934.
Yes _______ No ___X____


1Q23 Highlights | ||||
 | Adjusted EBITDA of BRL 1.6 billion in 1Q23 (+10.7% vs. 1Q22) |  | Transformation into a Corporation – ongoing valuation and due diligence processes | |
 | Leverage of 2.5x EBITDA and operating cash generation of BRL 698 million on 03.31.2023 |  | Definition of the Concession Bonuses of the Foz do Areia, Salto Caxias and Segredo HPPs in the total amount of R$ 3.7 billion | |
 | Reported net income of R$635 million in 1Q23 |  | Agreement between Itaú and the State of Paraná releases encumbrances on shares issued by the Company | |
 | Personnel cost reduction in real terms of 5.2% (1Q23 vs. 1Q22) |  | Selection of Equity Investment Fund Manager for Corporate Venture Capital (CVC) | |
 | Copel Distribuição's regulatory efficiency of 13.6% adjusted EBITDA LTM |  | Copel GET winner of the Best in Management Award, promoted by the National Quality Foundation | |

Results Webcast May, 11, 2023 | 14h BRT/ 13h EST Access Link |  |
List of contents
| 1. Consolidated Results | 2 |
| 1.1 EBITDA | 2 |
| 1.2 Operating Revenue | 3 |
| 1.3 Operational Costs and Expenses | 4 |
| 1.4 Equity in Earnings of Subsidiaries | 5 |
| 1.5 Financial Results | 5 |
| 1.6 Consolidated Net Income | 6 |
| 1.7 Debt | 6 |
| 2. Investment | 8 |
| 2.1 Investment Policy | 8 |
| 2.2 Investment Program | 8 |
| 3. Copel Geração e Transmissão | 9 |
| 3.1 Financial Performance | 9 |
| 3.1.1 IFRS effect in the Transmission segment | 10 |
| 3.2 Operacional Performance | 11 |
| 3.2.1 Generation | 11 |
| 3.2.2 Hydro and Wind Generation | 12 |
| 3.2.3 Thermal Generation | 12 |
| 3.3 Transmission | 13 |
| 3.3.1 RBSE Reprofiling | 13 |
| 4. Copel Distribuição | 14 |
| 4.1 Financial Performance | 14 |
| 4.1.1 Regulatory Efficiency | 15 |
| 4.2 Operational Performance | 16 |
| 4.2.1 Grid Market (TUSD) | 16 |
| 4.2.2 Captive Market | 16 |
| 4.2.3 Concession Agreement | 16 |
| 4.2.4 Investment and Operational Data | 16 |
| 5. Copel Mercado Livre | 19 |
| 5.1 Financial Performance | 19 |
| 5.2 Operational Performance | 20 |
| 6. ESG Performance | 21 |
| 6.1 Copel pioneers in ESG in the sector | 21 |
| 6.2 Recent Highlights | 21 |
| 6.3 Indicators | 22 |
| 6.4 Ratings, Rankings, and Indexes | 22 |
| 7. Other highlights | 23 |
| List oh Exhibits |
RESULTS | 1Q23 | 1 |
| |
| 1. | Consolidated Results |
The following analyzes refer to the first quarter of 2023, compared to the same period of 2022.
1.1 EBITDA
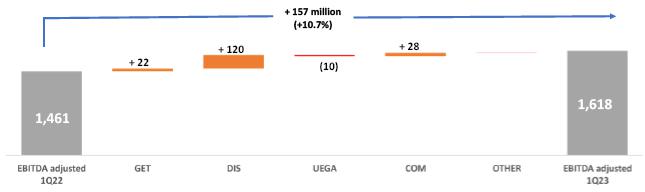
Adjusted EBITDA (excluding non-recurring items) reached R$1,617.9 million, an amount 10.7% higher than the R$1,461.4 million recorded in 1Q22, mainly reflecting the 31.0% increase in Copel's performance Distribution (adjusted EBITDA of R$507.9 million in 1Q23, against R$387.7 million in 1Q22). This better performance is the result of the June 2022 tariff readjustment at Copel Distribuição, with an average effect of 16.5% on tariffs for the use of the distribution system (TUSD), and the 77.4% reduction with provisions and reversals (in recurring terms) of the Copel group, mainly due to the R$65.3 million improvement in the “provisions (reversals) for loan losses (PECLD)” line, partially offset by the 3.0% reduction in the billed grid market.
Also noteworthy in this quarter:
| (i) | better performance by Copel Mercado Livre, with an increase of 125.8% in adjusted EBITDA, mainly explained by the higher sales margin; |
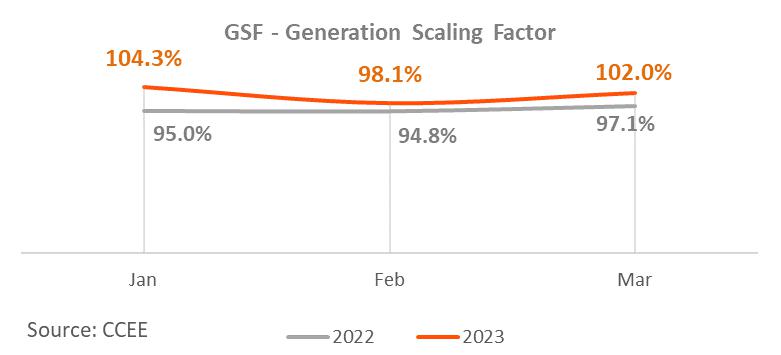
| (ii) | reduction of R$36.3 million in the purchase of electricity by Copel GeT, essentially due to the more favorable hydrological scenario in 1Q23 (average GSF of 101.5%, against 95.6% in 1Q22); |
| (iii) | increase in the result provided by wind power generation assets, especially (a) commercial start-up of the Jandaíra Wind Complex in October 2022 (+R$11.7 million); (b) completion of the acquisition of the Aventura and Santa Rosa & Mundo Novo Wind Complexes on January 30, 2023 (+ R$16.7 million); and (c) an increase of R$22.6 million with the other wind complexes operated by the company, due to the greater intensity of winds in the months of January and February, mainly; and |
| (iv) | better result from Compagas (EBITDA of R$59.7 million in 1Q23, against R$44.7 million in 1Q22), basically due to the tariff readjustment approved in January 2023, which improved the distribution margin in the captive market. |
These events were partially offset, mainly (i) by the reduction of R$109.0 million with “Electricity sales to distributors”, mainly due to the lack of dispatch from TPP Araucária in 1Q23, compared to 238 GWh dispatched in 1Q22, and Elejor's lower margin from electricity sales comparing periods; (ii) the lower remuneration of transmission assets, due to the lower IPCA in the period (IPCA of 2.09% in 1Q23 against 3.20% in 1Q22); and (iii) the 41.5% increase (+R$69.6 million) in “third-party services”, due to higher expenses with maintenance of the electrical system and facilities, consulting services and customer service/call center.
Adjusted Consolidated EBITDA
RESULTS | 1Q23 | 2 |
| |
The non-recurring items that were neutralized for calculating the adjusted EBITDA are shown in the table below:
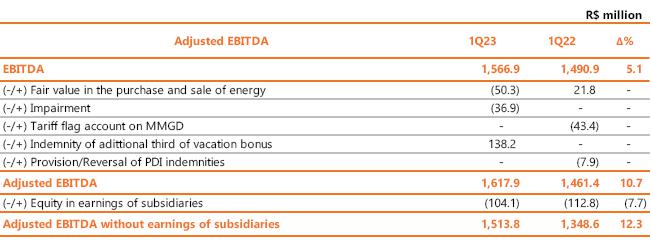
We highlight the non-recurring items referring to (i) indemnity of R$138.2 million related to the additional third of vacation bonus, paid in January 2023, after a collective agreement signed with employees. Such indemnity, of a compensatory nature, ceases the payment of additional benefit related to the third of vacations, dealt with in previous Collective Bargaining Agreements. (for more details see item 7 - Other Highlights); (ii) R$50.3 million referring to the fair value of the purchase and sale of energy (marked to market) by Copel Mercado Livre, amount determined by the difference between the contracted price and the future market price estimated by the Company; and (iii) reversal of impairment of generation assets in the amount of R$36.9 million, resulting from the expected revenue from the sale of energy that offset increases in operating costs and regulatory charges, especially related to HPP Colíder and HPP Baixo Iguaçu.
Within the scope of transmission assets, it is worth mentioning that item 3.1.1 presents the regulatory accounting of the result for the purpose of verifying the IFRS (International Financial Reporting Standards) effect.
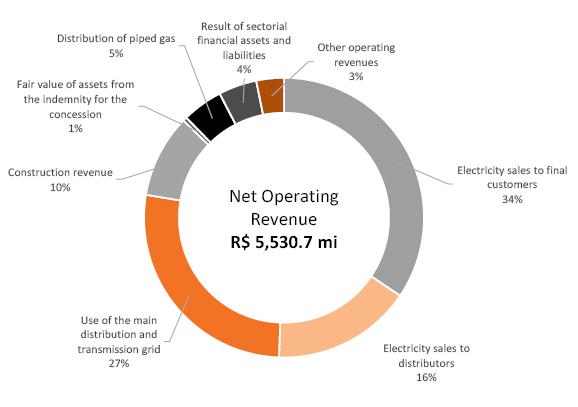
1.2 Operating Revenue
Net operating revenue totaled R$5,530.7 million in 1Q23, a decrease of 1.0% compared to the R$5,587.7 million recorded in 1Q22. This result mainly reflects:
| (i) | decrease of R$230.0 million in electricity sales to final customers, mainly due to the 6.5% drop in the distributor's billed captive market, which considers offset energy from Mini and Micro Distributed Generation – MMGD, and the negative tariff readjustment of 9.58% applied to the Energy Tariff (TE) component in June 2022; |
| (ii) | the R$109.0 million reduction in electricity sales to distributors, mainly due to the lower volume of electricity sold in bilateral contracts by Copel Mercado Livre and the lack of dispatch from TPP Araucária compared to 238 GWh dispatched in 1Q22; and |
| (iii) | the decrease of R$80.0 million in the result of sectorial financial assets and liabilities (CVA), as a result of the reduction in energy costs and other financial components. |
These reductions were partially offset by:
| (i) | increase of R$233.3 million in use of the main distribution and transmission grid, mainly due to the June 2022 tariff readjustment at Copel Distribuição, with an average effect of a 16.5% increase in tariffs for the use of the distribution system (TUSD), partially offset by the 3.0% reduction in Copel Distribuição's billed grid market and the lower remuneration of transmission assets, due to the lower IPCA in the period (IPCA of 2.09% in 1Q23 compared to 3.20% in 1Q22); |
| (ii) | increase of R$74.1 million in the “other operating revenues” line, mainly due to (i) the higher fair value of the purchase and sale of electricity (marked to market) by Copel Mercado Livre, amount determined by the difference between the contracted price and the future market price estimated by the Company, and (ii) the increase in revenues from leasing and rentals by the distributor, with emphasis on the greater volume of sharing poles/fixing points and the contractual readjustment by General Market Price Index - IGP-M; and |
| (iii) | increase of R$27.0 million in distribution of piped gas revenue, basically due to the tariff readjustment approved in January 2023, which improved the distribution margin in the captive market. |
RESULTS | 1Q23 | 3 |
| |
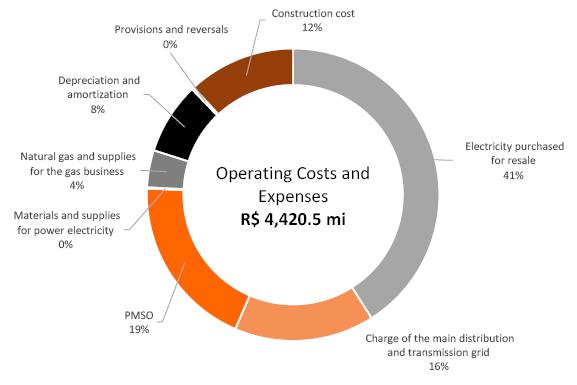
1.3 Operational Costs and Expenses
In 1Q23, operating costs and expenses totaled R$4,420.5 million, a decrease of R$2.4% compared to the R$4,530.0 million recorded in the same period of 2022, mainly due to:
| (i) | the decrease of R$126.7 million in the “provisions and reversals” line (reversal of R$10.7 million in 1Q23 against a provision of R$115.9 million in 1Q22), basically due to (a) of the reversal of R$13.8 million for estimated losses for doubtful accounts (PECLD), against a provision of R$51.4 million in 1Q22, justified, essentially, by the end of the billing restrictions imposed by the COVID-19 pandemic and the improvement of practices for recovering receivables within the scope of Copel Distribuição; (b) the reversal of R$36.9 million arising from the result of impairment of generation assets (HPP Colíder and HPP Baixo Iguaçu); and (c) a 37.2% decrease in provisions for litigation, mainly civil and labor litigation; |
| (ii) | the R$118.5 million reduction in the cost of “electricity purchased for resale” as a result of more favorable hydrological conditions for the period (average GSF of 101.5%, against 95.6% in 1Q22); |
| (iii) | the decrease of R$87.4 million in the “charge of the main distribution and transmission grid” line, explained mainly by lower system service charges (ESS) due to the reduction in thermal dispatch in the comparison between periods; and |
| (iv) | the decrease of R$78.7 million in “Materials and supplies for power electricity”, essentially due to the lack of dispatch from TPP Araucária in 1Q23 compared to the dispatch of 238 GWh in 1Q22. |
Expenses with PMSO, excluding provisions and reversals, increased by 35.4% compared to the same period of the previous year, basically explained by the non-recurring impact of the indemnity related to the additional third of vacation bonus on costs with personnel and higher expenses with third-party services, as explained below:

| (i) | the 50.6% increase (+R$142.8 million) in expenses with “personnel and management”, mainly due to the indemnity related to the additional third of vacation bonus, paid in January 2023, after a collective agreement signed with employees. This indemnity, of a compensatory nature, replaced the benefit of the additional third of vacation bonus, dealt with in previous Collective Bargaining Agreements. With the amount of R$138.2 million, the indemnity ceases the payment of the referred benefit, being preserved to the employees only the constitutional third of vacations (CF, 7º, XVII). Neutralizing the effects of the indemnity of the additional third of vacation bonus, the provisions related to profit sharing (PLR) and performance bonus (PPD) and the provisions and reversals associated with the incentive dismissal program (PDI), there is a reduction of 1.1% in the quarterly comparison despite the 7.19% wage readjustment applied through ACT 2022/2024 collective agreement. Considering the accumulated inflation measured by the National Consumer Price Index - INPC, of 4.36% between 1Q22 and 1Q23, there was a reduction in real terms of 5.2%. |
RESULTS | 1Q23 | 4 |
| |

| (ii) | the 41.5% growth (+R$69.6 million) in third-party services, mainly due to higher expenses with maintenance of the electrical system and installations, consulting services and customer service and call center. It is worth noting that third-party services were also impacted by the acquisition and subsequent operation of the Aventura and Santa Rosa & Mundo Novo Wind Complexes on January 30, 2023; and |
| (iii) | growth of 10.5% in the “other operating costs and expenses” line, mainly due to the greater financial compensation for the use of water resources due to the greater dispatch of hydroelectric plants (+R$17.7 million). |
Headcount Evolution

1.4 Equity in Earnings of Subsidiaries
The equity result of joint ventures and other Copel affiliates was 7.7% lower than that recorded in the same period of the previous year (R$104.1 million, compared to R$112.8 million recorded in 1Q22), in due to the lower remuneration on transmission assets, basically justified by the lower IPCA in the period (IPCA of 2.09% in 1Q23 against 3.20% in 1Q22). More details can be seen in Annex I.
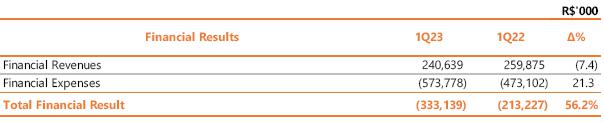
1.5 Financial Results
In 1Q23, the financial result was negative by R$333.1 million, against a negative R$213.2 million recorded in 1Q22, mainly reflecting the higher balance of loans and financing (R$14.7 billion vs. R$11.8 billion in 1Q22) and higher interest rates in the period (CDI of 3.22% in 1Q23 against 2.41% in 1Q22). Financial income registered a decrease of R$19.2 million (-7.4%), basically due to the 27.3% decrease in arrears on energy bills and the lower income from exchange variation of electricity from Itaipu.
RESULTS | 1Q23 | 5 |
| |
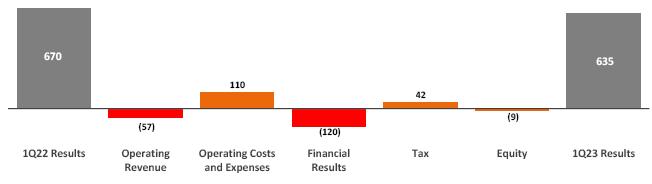
1.6 Consolidated Net Income
In 1Q23, Copel recorded net income of R$635.5 million against net income of R$669.8 million recorded in 1Q23, down 5.1%. In addition to the items already mentioned, it is worth mentioning the increase of R$32.3 million (+10.1%) in the item “depreciation and amortization”, mainly due to the entry into operation of the Jandaíra Wind Complex, the acquisition of the Aventura and Santa Rosa & Mundo Novo Wind Complexes and the increase in investments by Copel Distribuição.
Considering non-recurring items, adjusted net income was R$669.1 million in 1Q23 against R$650.3 million in 1Q22, growth of 2.9%.
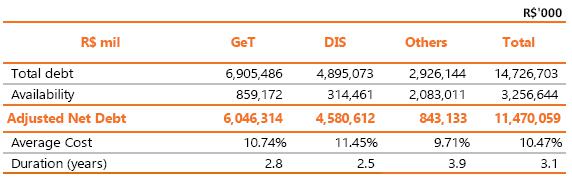
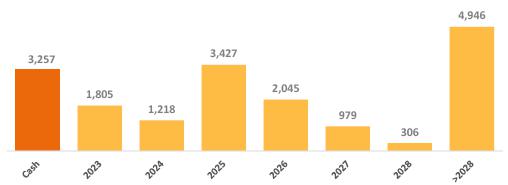
1.7 Debt
Copel's total consolidated debt amounted to R$14,726.7 million on March 31, 2023, a variation of 18.2% in relation to the amount recorded on December 31, 2022, of R$12,454.2 million.
At the end of 1Q23, the Company's gross debt represented 67.6% of consolidated shareholders' equity, which was R$21,766.5 million.
The following charts show the indebtedness of Copel and its subsidiaries at the end of March 2023.
Copel's total consolidated debt amounted to R$12,454.2 million on December 31, 2022, a variation of
Debt by Subsidiary
RESULTS | 1Q23 | 6 |
| |
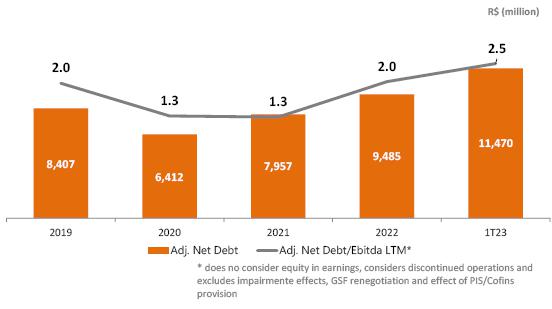
Adjusted Net Debt/EBITDA Adjusted
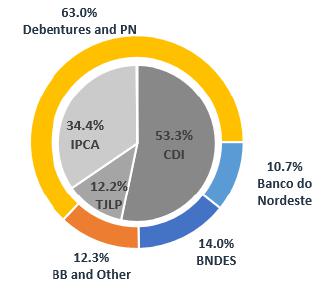
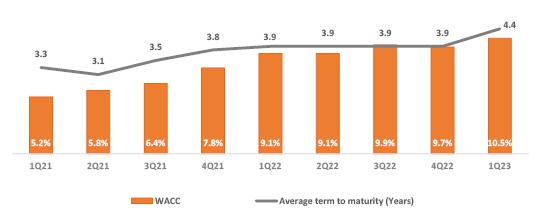
Debt Indexers Average cost: 10.47%
Amortization - R$ million Average term to maturity: 4.4 years
Weighted Average Cost and Average term to maturity
RESULTS | 1Q23 | 7 |
| |
| 2. Investment |
2.1 Investment Policy
In March 2021, the Board of Directors approved the Company's Investment Policy. Said Policy was the object of analysis and approval by the Investment and Innovation Committee, which was established by the new Bylaws of March 11, 2021, whose main purpose is to improve discipline in the allocation of capital, being an essential tool for the execution of strategic guidelines for sustainable growth, generation of value for shareholders and the perpetuity of our energy business.
The Policy establishes the criteria for the selection, prioritization, evaluation, approval and monitoring of investments. Among the various aspects, the Policy segregates investment opportunities in three groups that will be prioritized as follows:
| (i) | Operating Investments: expansion of capacity and modernization of the assets of the Distribution, Transmission and Generation concessions, in addition to the continuity of existing businesses; |
| (ii) | Strategic Investments: acquisition and development of new assets with an emphasis on brownfield opportunities and that provide operational synergies to the Company. Portfolio review and divestments are included; and |
| (iii) | Investments in Innovation: where we highlight projects aimed at open innovation. |
The Investment and Innovation Committee meets ordinarily once a month and extraordinarily whenever necessary, analyzing and issuing recommendations for the Company's investment proposals.
2.2 Investment Program
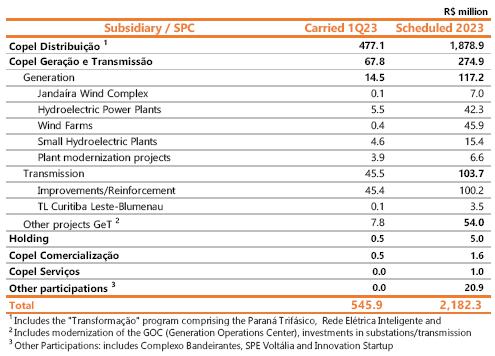
Investment Programs follow their schedules in each development project. For 2023, the estimated amount allocated to the investment program was R$2,182.3 million, with Copel Distribuição contemplating most of the forecast amount, whose objective is the permanent improvement of operational efficiency and cost reduction through the advancement of important projects, highlighting the continuity of the execution of the Paraná Triphasic and Smart Grid programs already started in 2021 (see item 4.2.4). These programs are aimed at renewing depreciated assets in rural areas, improving the quality and speed of service, integration with smart cities and improving information via network sensing.
In 1Q23, R$545.9 million were invested, of which R$477.1 million (87.4%) were allocated to Copel Distribuição, R$67.8 million (12.4%) to Copel Geração e Transmissão and R$0.5 million at Copel Comercialização (>0.1%).
RESULTS | 1Q23 | 8 |
| |
3. Copel Geração e Transmissão (Consolidated Results) |
| 3.1 Financial Performance |
Copel GeT presented adjusted EBITDA, excluding non-recurring effects, of R$1,003.0 million in 1Q23, an increase of 1.1% compared to R$991.6 million in 1Q22.

This result mainly reflects:
| (i) | the addition of results from new wind farms, with the entry into commercial operation of the Jandaíra Wind Complex in October 2022 (+R$11.7 million) and; the conclusion of the acquisition of the Aventura and Santa Rosa & Mundo Novo Wind Complexes on January 30, 2023 (+ R$16.7 million); |
| (ii) | increase of R$22.6 million in the other Wind Complexes operated by the company, due to the increase in energy generation with the greater intensity of winds, mainly in the months of January and February; |
| (iii) | decrease of R$34.6 million in the purchase of electricity (excluding the Wind Complexes), essentially due to the more favorable hydrological scenario in 1Q23 (average GSF of 101.5%, against 95.6% in 1Q22); |
Partially offset by:
| (iv) | the decrease of R$22.9 million in TUST revenue and R$9.5 million in equity income, mainly explained by the lower remuneration on transmission assets, due to the lower IPCA in the period (IPCA of 2.09 % in 1Q23 against 3.20% in 1Q22); |
| (v) | no dispatch from UEGA in 1Q23 compared to 238 GWh dispatch in 1Q22. |
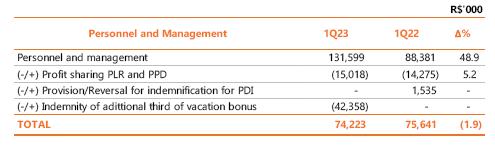
Expenses with PMSO, excluding provisions and reversals, increased by 31.7%, mainly influenced by the non-recurring effect of indemnity of adittional third of vacation bonus (see more details in “Other highlights”) on costs with personnel. In addition to higher expenses with outsourced services, due to the R$9.5 million increase in maintenance of installations and the electrical system, and in line with other costs and operating expenses, mainly due to higher costs with payment of financial compensation for the use of water resources (R$36.5 million in 1Q23 against R$20.1 million in 1Q22).
Neutralizing the effects of the indemnity of adittional third of vacation bonus, the provisions related to profit sharing (PLR) and performance bonus (PPD) and the provisions and reversals associated with the incentive dismissal program (PDI), there is a reduction of 1.9% in the quarterly comparison despite the 7.19% wage readjustment applied through ACT 2022/2024 collective agreement. Considering the accumulated inflation measured by the National Consumer Price Index - INPC, of 4.36% between 1Q22 and 1Q23, there was a reduction in real terms of 6.0%.
RESULTS | 1Q23 | 9 |
| |
Also noteworthy among the non-recurring items, the reversal of impairment of generation assets in the amount of R$36.9 million, resulting from the expected revenue from the sale of energy that offset increases in operating costs and regulatory charges, especially related to HPP Colíder and HPP Baixo Iguaçu.
Within the scope of transmission assets, it is worth mentioning that item 3.1.1 presents the regulatory accounting of the result for the purpose of verifying the IFRS (International Financial Reporting Standards) effect.

In 1Q23, Copel GeT recorded net income of R$413.0 million, a decrease of 10.9% compared to 1Q23. This result mainly reflects, in addition to the items already discussed, the increase in financial expenses, due to the higher amount financed and the increase in the CDI rate (3.22% in 1Q23 against 2.41% in 1Q22); partially offset by the better result with income tax and social contribution.
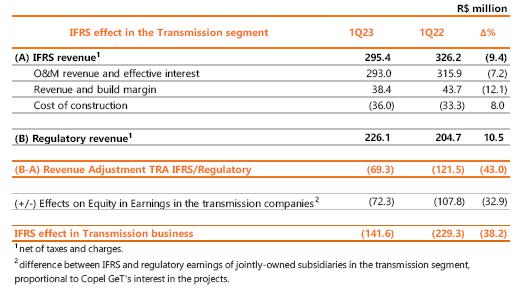
3.1.1 IFRS effect in the Transmission segment
For the calculation, an adjustment was made considering the effects of the application of CPC47/IFRS15 in the corporate statements in the transmission business.
RESULTS | 1Q23 | 10 |
| |
| 3.2 Operacional Performance |
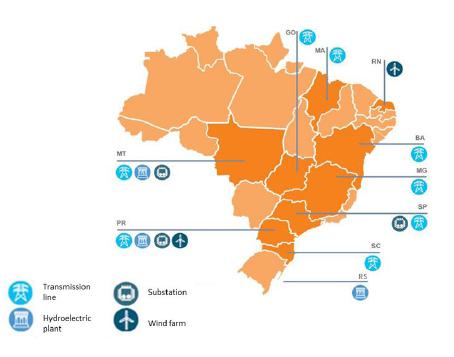
Copel is present in 10 states, operating in the generation and transmission business.
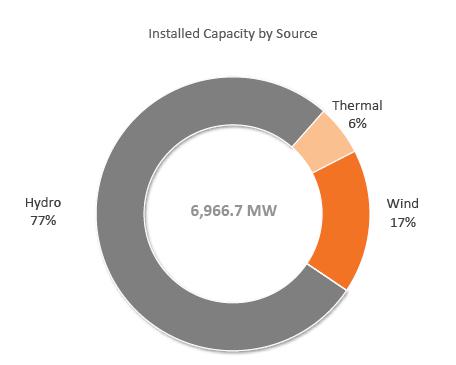
In the Generation business, Copel GET operates a diversified park of hydroelectric, wind and thermal plants, totaling 6,966.7 MW of installed capacity and 3,156.6 average MW of assure energy. In the Transmission business, Copel owns a total grid of 9,685 Km of transmission lines and 51 basic grid substations, considering the affiliates.
For more information on generation and transmission operational data, see Exhibit IV.
3.2.1 Generation
Copel's generating portfolio is made up of 94% of renewable sources, such as hydro and wind power.
RESULTS | 1Q23 | 11 |
| |
3.2.2 Hydro and Wind Generation
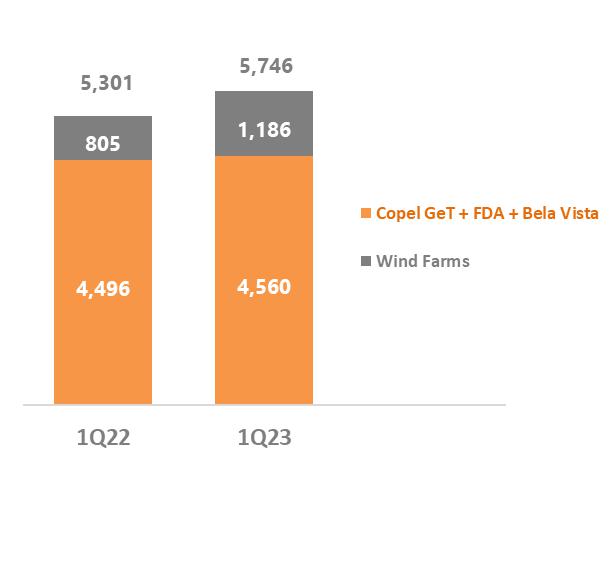
The power generation of Copel Geração e Transmissão S.A. and its wind farms in 1Q23 was 6,430 GWh, against 3,626 GWh in 1Q22. The increase is due, for hydroelectric plants, to the improvement in weather conditions in the South Region and, for wind farms, to the entry into commercial operation of Jandaíra and the acquisition of the Aventura and Santa Rosa & Mundo Novo (SRMN) Wind Complexes.
In the first quarter of 2023, Copel Geração e Transmissão (including energy from HPP Foz do Areia – FDA and SHP Bela Vista – BVE, but excluding TPP Araucária) sold 4,560 GWh of electricity, an increase of 1.4%.
For wind farms, total electricity sold in 1Q23 was 1,186 GWh, an increase of 47.3%, mainly influenced by the commercial start-up of Jandaíra and the acquisition of the Aventura and SRMN Wind Complexes, which became part of the the Company's portfolio on January 30, 2023.
Consolidated Generation Sales (GWh)
3.2.3 Thermal Generation
TPP Araucária
It is a natural gas generation plant with an installed capacity of 484.2 MW that operates in a combined cycle (two gas turbines and one steam turbine) and operates in the modality known as "merchant" in which the plant operates without sales contracts. of electricity, whether in the free (ACL) or regulated (ACR) environment, subject to fluctuations in the Price for Settlement of Differences - PLD. In this modality, the thermoelectric plant is dispatched centrally by the National Electric System Operator (ONS), in situations where the Marginal Cost of Operation (CMO) of the electrical system exceeds its Variable Unit Cost (CVU) approved by ANEEL, or out of order of merit, when requested by the ONS. In this context, with the good hydrological conditions in 1Q23, there was no dispatch from the plant.
TPP Figueira
Coal-fired generation plant with an installed capacity of 17.7 MW, achieved after a recent modernization process that allowed for an increase in capacity without the need to increase the volume of coal consumed. TPP Figueira has been in commercial operation since 12/07/2022, by ANEEL order No. 2502/2022, generating 14.7 GWh in 1Q23.
RESULTS | 1Q23 | 12 |
| |
3.3 Transmission
Copel has more than 9.6 thousand km of transmission lines in nine Brazilian states, considering its own assets and in partnership with other companies. In addition to building, maintaining and operating an extensive own energy transmission grid, Copel provides services to projects of other concessionaires with the quality of someone who has accumulated more than 60 years of experience in the sector. The Transmission projects are listed in Exhibit IV, including the projects of Copel Geração e Transmissão, SPCs Costa Oeste, Marumbi and Uirapuru Transmissora (100% Copel GeT), as well as the 7 SPCs in which Copel GeT has a stake.
3.3.1 RBSE Reprofiling
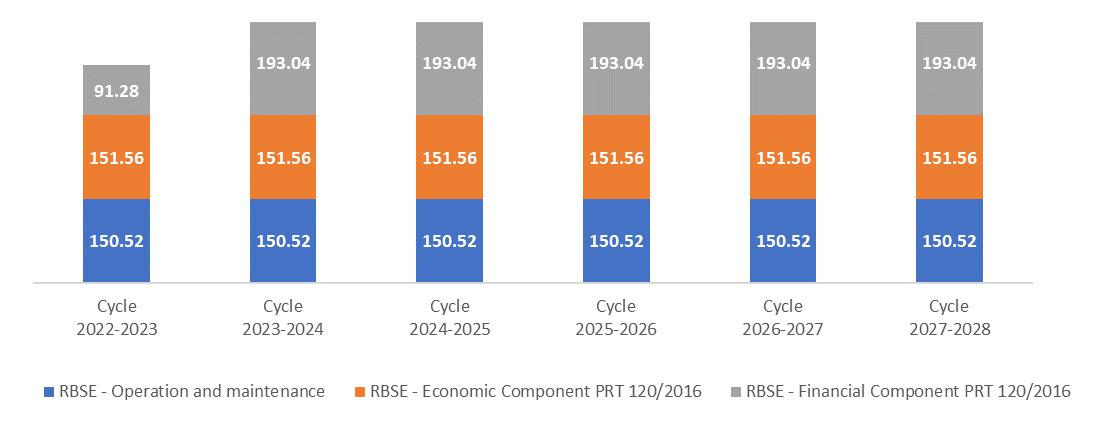
The Concession Agreement 060/2001 represents 37.7% of the annual permitted revenue (RAP) of Copel GET's transmission business, also considering its affiliates. Below, we describe the flow of receipt of the portion of revenue referring to the Basic Grid - Existing System (RBSE) for the next cycles. It is important to note that this flow may change in the future, as a result of the tariff review processes and/or review of parameters used to compose these revenues by the regulatory agent. The values referring to O&M from the 2022-2023 cycle are based on the value currently indicated in sub-module 9.1 of the Tariff Review Program (Proret).
Note:
Economic component: future values based on the 2022-2023 cycle (last ANEEL Resolution REH published)
Financial component: values published in REH 2847/21. Subject to review during the current cycle in view of the controversy in the methodology used to calculate these values by the regulatory agency.
RAP values up to the 2022/2023 cycle taken from the REH of each cycle, with reference to the cycle price (June of the year of publication) RAP values include RB and DIT assets
RESULTS | 1Q23 | 13 |
| |
| 4. Copel Distribuição |
| 4.1 Financial Performance |
Copel Distribuição's EBITDA in 1Q23 was R$417.2 million, 4.1% lower than that recorded in 1Q22, mainly due to the increase in costs with personnel due to the indemnity related to the additional third of vacation bonus, paid in January 2023, after a collective agreement signed with employees. Such indemnity, of a compensatory nature, ceases the payment of additional benefit related to the third of vacations, dealt with in previous Collective Bargaining Agreements. Excluding this non-recurring item and the others listed below, we have an adjusted EBITDA of R$507.9 million in 1Q23, an amount 31.0% higher than that recorded in the same period of the previous year. This increase is mainly due to (i) the June 2022 tariff readjustment at Copel Distribuição, with an average effect of a 16.5% increase on tariffs for the use of the distribution system (TUSD), whose greatest impact was in the Free Consumers class which, given the increase in electricity consumption of 2.9%, recorded an increase in revenue with use of main distribution grid of 50.1%; and (ii) the 82.2% reduction in provisions, resulting from: (a) the reversal of R$15.4 million for estimated losses for doubtful accounts (PECLD), against the provision of R$48.6 million in 1Q22, essentially justified by the end of the billing restrictions imposed by the COVID-19 pandemic and the improvement of practices for recovering receivables, which culminated in the recording of R$40.2 million with debt collect in 1Q23, compared to $17.3 million from 1Q22; and (b) the 34.3% reduction in provisions for labor, civil and administrative litigation. This result was partially offset by the 3.0% reduction in the billed grid market in the period.

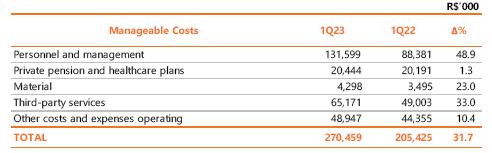
Manageable costs, excluding provisions and reversals, increased by 37.5% compared to 1Q22, mainly as a result of the increase of: 57.6% in personnel, due to the indemnity related to the additional third of vacation bonus, and 42.7% with third-party services, caused by the increase in expenses with maintenance of the electrical system, maintenance of facilities and customer service.

The personnel and management account, excluding the effects of the indemnity of additional third of vacation bonus, provisions for profit sharing (PLR) and performance bonus (PPD), and provision for indemnification for incentive dismissals (PDI), recorded an increase of 0.7% in 1Q23.
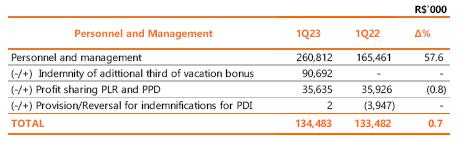
Considering the accumulated inflation measured by the National Consumer Price Index – INPC, of 4.36% between 1Q22 and 1Q23, the personnel and management line recorded a reduction in real terms of 3.5%, mainly as a result of the reduction of 77 employees between periods.
The following table presents the main indicators of Copel Distribuição:
RESULTS | 1Q23 | 14 |
| |

In 1Q23, we also highlight:
| (i) | the 25.0% growth in revenue from use of the main distribution grid, mainly due to the June 2022 tariff readjustment, with an average effect of a 16.5% increase on tariffs for the use of the distribution system (TUSD), partially offset by the reduction in the billed grid market in the period. Also contributing to this growth was the 6.5% reduction in the Energy Development Account – CDE, a line reduction account, which constitutes a sectoral liability in the CVA to maintain the neutrality of sectoral charges for the distributor; |
| (ii) | the 14.8% reduction in electricity sales to final customers, due to the 46.1% reduction in revenue from the electricity sales to the captive market, due to the 6.5% reduction in the billed captive market and the effect average of a 9.58% reduction in the Energy Tariff (TE) component of the company's tariff readjustment, partially offset by the reduction in deductions of amounts referring to tariff flags; |
| (iii) | the 35.1% reduction in revenue from the electricity sales to distributors, due to the 21.4% reduction in revenue from the Electric Energy Trading Chamber – CCEE, even with an increase in energy settlement in the Spot Market, in due to the impact of other revenues on the CCEE pre-invoice for 1Q22, and the 74.3% reduction in revenue from bilateral contracts, due to the reduction of contracts in the MVE; |
| (iv) | the 14.3% reduction in costs with charges of main transmission grid, due to the 98.8% reduction in System Service Charges – ESS, resulting from a more favorable hydrological scenario, partially offset by the increase in: charges for using the main transmission grid, at 30.6%; reserve energy charges, at 122.6%; and charges for transporting power from Itaipu, at 53.8%; |
| (v) | the 24.7% decrease in revenue from sectoral financial assets and liabilities (CVA), due to the reduction in energy costs and other financial components; and |
| (vi) | the 36.3% increase in other operating revenues, mainly due to the growth in revenue from leases and rentals of equipment and structures, especially from pole sharing agreements, due to the higher volume of poles/fixing points allocated and the contractual readjustment by the IGP-M. |
Copel Distribuição's net income was R$139.7 million in 1Q23, a decrease of 38.7% compared to 1Q22. In addition to the items already discussed, this drop in net income is also a consequence of the worsening financial result (in 1Q23 it was a negative R$112.5 million compared to a positive R$22.1 million in the same quarter of last year).
Excluding the effects of the aforementioned non-recurring items, the adjusted net income was of R$199.5 million, an increase of 1.4% compared to 1Q22.
4.1.1 Regulatory Efficiency
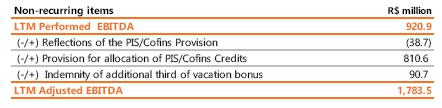
Copel Distribuição recorded adjusted EBITDA of R$1,783.5 million in the last 12 months, an amount 13.6% above regulatory EBITDA, equivalent to an efficiency of R$213.4 million.
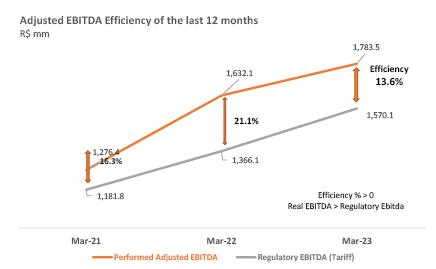
Note: Regulatory EBITDA is calculated based on the WACC + QRR values published in ANEEL's Technical Notes in Tariff Revision or Adjustment events.
RESULTS | 1Q23 | 15 |
| |
4.2 Operational Performance 4.2.1 Grid Market (TUSD) Copel Distribuição's grid market, made up of the captive market, supply to concessionaires and licensees within the State of Paraná and all the free customers existing in its concession area, showed a reduction in electricity consumption of 1.1% in 1Q23. The billed grid market, which considers the offset energy from Mini and Micro Distributed Generation (MMGD), registered a reduction of 3.0% in 1Q23. 4.2.2 Captive Market Copel Distribuição's captive market consumption decreased by 3.2% in 1Q23. The billed captive market, which considers the offset energy from MMGD, recorded a 6.5% reduction in 1Q23. More information about Grid Market and Captive Market in Notice to the Market – 08/23. |
4.2.3 Concession Agreement
In December 2015, the Company signed the fifth amendment to the Public Service Concession Agreement for Electricity Distribution No. 46/1999 of Copel Distribuição SA, which extends the concession until July 7, 2045. Copel Distribuição complied with the conditioning requirements of economic-financial efficiency and quality for the inspection cycle of the initial 5 years. From the sixth year after the conclusion of the contract, failure to comply with the quality criteria for three consecutive years or the economic-financial management criteria for two consecutive years will result in the opening of the expiry process.
For the quality criterion of distribution service provision, ANEEL defined the limits of Equivalent Interruption Duration per Consumer Unit - DEC and Equivalent Interruption Frequency per Consumer Unit - FEC for the years 2021 to 2026. For DEC, the result calculated in 2023 was 2.35 hours. For FEC, the result in the same period was 1.64 interruptions.

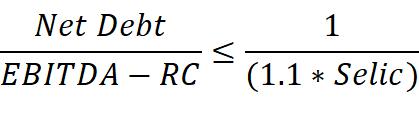
The economic-financial management efficiency criterion will be measured by the calculation, each calendar year, according to ANEEL Normative Resolution No. 896/2020, by the following inequation:
4.2.4 Investment and Operational Data
Transformation Program (Programa Transformação) - a broad investment plan with the objective of modernizing, auto mating and renovating the distribution grid and private communication grid with standardized technologies to service automation equipment. Among the expected benefits are the strengthening of rural grid to reduce disconnections and guarantee support for the growth of agribusiness in the State of Paraná, the reduction of costs with O&M and commercial services and improvement in the control of DEC and FEC indicators. The program is composed of 3 pillar projects to achieve the objectives:
RESULTS | 1Q23 | 16 |
| |
| · | Paraná Tri-phase: represents the improvement and renewal of rural distribution grid in the Company's concession area, with the implementation of a three-phase grid and creation of redundancy in the main rural branches. By the end of March 2023, 185 thousand rural customers had already benefited, along 11,667 km of grid. |
| · | Smart Grid: aims to implement a private communication network with standardized technology to service all automation equipment in the distribution grid and advanced metering infrastructure. By the end of March 2023, 458 thousand smart meters had been installed. |
| · | Total Reliability: aims to ensure modernity in the operations of the energy grid based on the following premises: maintain full communication between teams and the availability of equipment on the grid, implement automation in special equipment, maintain the entire municipality of the concession with a substation or special key and expand the grid circuits and Self Healing. By the end of March 2023, the project had completed 78.9% of the planned schedule. |
Copel Distribuição's Transformation Program covers the construction of approximately 25 thousand km of new grid, 15 thousand new automated points and the implementation of smart grid technology in the state of Paraná.
Compact and Protected Grid – deployment of compact grid predominantly in urban areas with a high degree of afforestation in the vicinity of distribution grid and protected grid exclusively in rural areas. Compact grid avoids cutting and pruning trees and improves the quality of supply, as it reduces the number of disconnections. Protected grid also improves the quality and reliability of the system as it avoids interruptions due to contact with vegetation or other objects and bad weather. At the end of March 2023, the extension of compact and protected grid installed was 24,463 km, compared to 19,767 km in March 2022, an increase of 4,696 km, or 23.8%, in twelve months.
Isolated Secondary Grid- investment in isolated low voltage secondary grid (127/220V), which have significant advantages over the conventional overhead grid, such as: improving the indicators Duração Equivalente de Interrupção por Unidade Consumidora - DEC (Equivalent Duration of Interruption per Consumer Unit) and e Frequência Equivalente de Interrupção por Unidade Consumidora – FEC (Equivalent Frequency of Interruption by Consumer Unit), hinder energy theft, improve environmental conditions, reduce pruning areas, increase safety, reduce voltage drop across the grid and increase the life of transformers by reducing the number short circuits in the network, among others. At the end of March 2023, the extension of isolated secondary distribution grid installed was 22,104 km, compared to 21,119 km in March 2022, an increase of 985 km, or 4.7%, in twelve months.
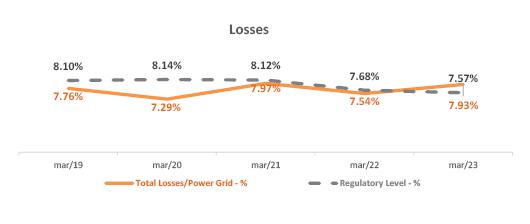
Losses - refer to the generated electrical energy that passes through transmission lines and distribution grid, but which is not commercialized, either for technical or commercial reasons. Distribution losses can be defined as the difference between the electricity purchased by distributors and that billed to their consumers, being classified as technical and non-technical.
Technical Losses are inherent to the activity of electrical energy distribution, as part of the energy is dissipated in the process of transport, voltage transformation and measurement as a result of the laws of Physics. Historically, the Company's Technical Losses have maintained percentages close to or below the regulatory target. At the end of March 2023, Technical Losses of the last twelve months were 2,009 GWh, compared to 2,013 GWh in March 2022.
On the other hand, Non-Technical Losses, calculated by the difference between total losses and technical losses, originate mainly from theft (clandestine connection, direct diversion from the grid), fraud (tampering the meter or deviations), reading, measurement and billing errors. These losses are largely associated with the concessionaire's management and the socioeconomic characteristics of the concession areas. The Company's indicator has remained below regulatory targets in the last 5 years, a reflection of the improvement of techniques to combat losses from the development of data analysis technologies, process automation and exclusivity of the field team for inspections, allowing an increase in productivity and assertiveness in the return of Non-Technical Losses. At the end of March 2023, Non-Technical Losses of the last twelve months were 787 GWh, compared to 614 GWh March 2022.
RESULTS | 1Q23 | 17 |
| |
It should be noted that the targets established for the tariff reasonableness of Non-Technical Losses take into account the level of complexity of the distributor's concession area and, according to ANEEL Report 01/2021 on Electricity Losses in Distribution, the complexity index of the concession of the Copel Distribuição is one of the smallest compared to other concessionaires in Brazil.
At the end of March 2023, Total Losses of the last twelve months were 2,796 GWh, compared to 2,627 GWh in March 2022.
RESULTS | 1Q23 | 18 |
| |
| 5.Copel Mercado Livre |
| 5.1 Financial Performance |
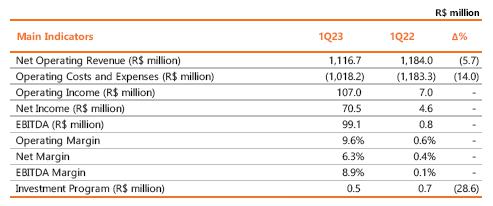
In 1Q23, Copel Mercado Livre presented adjusted EBITDA of R$50.4 million, an amount 125.8% higher than the R$22.3 million recorded in 1Q22, mainly reflecting the 14.2% reduction in costs with electricity purchased for resale and increased sales margin.
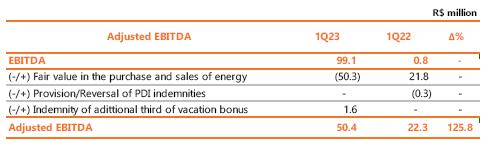
The main adjustment in the periods was the fair value (mark-to-market) of energy purchase and sale contracts - amount determined by the difference between the contracted price and the future market price estimated by the Company - mainly due to the lower variation in inflation in the periods (IPCA of 2.09% in 1Q23 against 3.20% in 1Q22) and by the acquisition of energy for portfolio trading at lower prices.
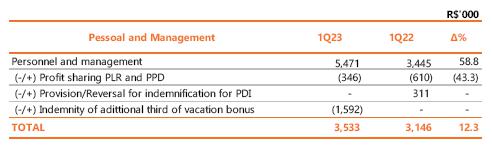
Manageable costs increased by 36.1% in 1Q23 compared to 1Q22, mainly due to (i) a 58.8% increase in costs with personnel due to the indemnity related to the additional third of vacation bonus, pursuant to the Collective Bargaining Agreement (plus details see item “Other Highlights of the Period) and (ii) increase of 48.5% in “other costs and operating expenses” due to the acquisition of computing solutions to improve the customer experience, partially offset by (iii) reduction in “ third-party services” by 47.8%, reflecting the lower cost of communication and data processing.

Excluding the effects of profit sharing (PLR), performance bonuses and the indemnity of additional third of vacation bonus, the personal and management account recorded an increase of 12.3% compared to the amounts recorded in 1Q22, under the effect of the salary readjustment of 7.19%.
Net income in 1Q23 was R$70.5 million (+R$65.9 million compared to R$4.6 million in 1Q22). This result stems from the reduction in operating costs and expenses, with an increase in the sales margin, and the increase in mark-to-market between periods.
RESULTS | 1Q23 | 19 |
| |
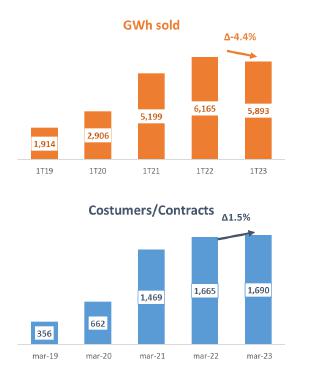
5.2 Operational Performance Copel was a pioneer in creating an energy trader and the first to sell electricity to free customers, when this category was created in the country, in 1995. Copel Mercado Livre, created in 2016, is already the largest in the country in terms of electricity volume traded in the free contracting environment (ACL), offering more savings and tranquility to customers from all regions of Brazil. For a long time known as Copel Energia, Copel Mercado Livre is responsible for trading energy and providing services in the ACL. In March 2023, the Company registered 1,690 clients/contracts, an increase of 1.5% compared to the same period of the previous year. The amount of energy sold reached 5,893 GWh sold in 1Q23, a decrease of 4.4% compared to 1Q22. The chart below depicts the evolution of Copel Mercado Livre in terms of the amount of GWh sold and the number of final consumers. For more information, consult Notice to the Market 08/23.
|
RESULTS | 1Q23 | 20 |
| |
| 6. ESG Performance |
| 6.1 Copel pioneers in ESG in the sector |
Copel was the first company in the industry to produce an Environmental Impact Report for a generation project, and the first energy company in Brazil to become a signatory of the UN Global Compact in 2000. The Company promotes actions to disseminate the UN’s Agenda 2030 and implement the SDGs of the electricity sector. In 2020/2021, Copel participated in the Global Compact Program “SDG Ambition”. Copel joined the “Pact on Water and Energy Resilience” Commitment and received the Federal Government’s Pro Gender and Race Equality Seal. The Company received the Pró-Ética Seal, 2018-2019 and 2020-2021 editions, granted by the Brazillian Comptroller General (CGU) and Instituto ETHOS, for the voluntary adoption of integrity measures, for public recognition of the commitment to implement measures aimed at prevention, detection, and remediation of acts of corruption and fraud.
6.2 Recent Highlights
| § | ESG Goals: In continuity with the Carbon Neutrality Plan approved in March 2021, the Company's Board of Directors approved, at a meeting held on November 4, 2022, the strategies, indicators and goals that will be the basis for the construction of the planning , organization of work teams and the development of actions for Copel for the coming years. The list of ESG indicators to be measured and monitored by the Company was also approved, with the objective of providing relevant and timely information to Copel's stakeholders. Monitoring the goals and action plan will be part of the scope of work of the Statutory Sustainable Development Committee. More information on Copel's Sustainability Portal. |
| § | ISE B3: Copel was ranked 14th in the Ranking of companies listed on B3’s Corporate Sustainability Index (ISE B3); |
| § | Copel signed in May 2022 the Letter of Commitment to the Adoption and Implementation of Metrics of Stakeholder Capitalism. |
Environmental
| § | The Company has a Copel 2030 Neutrality Plan, approved by the Board of Directors: focusing on science-based goals (SBTi), to neutralize Greenhouse Gas (GHG) Emissions for the assets controlled by Copel (according to the concept defined in the GHG Protocol methodology) until 2030. |
| § | Climate Change Management: maintained Concept B of the Carbon Disclosure Project (CDP), one of the main initiatives of the financial sector to reduce greenhouse gas emissions from companies. |
| § | It is part of the portfolio of B3’s Carbon Efficient Index (ICO2 B3) – 2021 |
| § | Joined the Pact on Water and Energy Resilience. Net Zero Ambition Movement – On April 13, 2022, Copel joined the Net Zero Ambition Movement. The movement is part of the strategies developed by the Global Compact so that large companies together can promote actions that result in the reduction of 2Gton CO2e by 2030. |
Social
| § | Actions and Programs – Solidary Selective Collection; Grow Energy Program; Electricity Citizenship; Good Neighborhood Program; Diversity Commission; Human Rights; EducaODS; Illuminating Generations; More than Energy, among others. |
Governance
| § | It has Statutory Advisory Committees to the Board of Directors: Statutory Audit Committee -CAE; Statutory Sustainable Development Committee -CDS, Investment and Innovation Committee -CII and Minority Shareholders Committee -CDM; |
| § | The Board of Directors is made up mostly of independent members; |
| § | The number of CAD members elected by non-controlling shareholders increased to 3; |
| § | The Statutory Audit Committee -CAE is made up of independent members, one of whom is an external member; |
| § | Establishment of variable remuneration with ESG targets –2022: 10% of PPD; |
RESULTS | 1Q23 | 21 |
| |
| § | Achievement of the Pro-Ethics Seal 2020-2021 granted by CGU and Instituto ETHOS –2021; and |
| § | Listed under B3 Governance Level 2. |
Priority SDG of the Brazilian Electricity Sector
6.3 Indicators
The indicators may change due to the assurance of the independent external audit.

6.4 Ratings, Rankings, and Indexes
| Index | Ranking | Reference Year: |
 | 14th position | 2022 |
 | CSA Score 68 | 2022 |
 | Classification B | 2022 |
 | 2023 | |
 | 2023 | |
 | Low Risk | 2023 |
 | A | 2023 |
RESULTS | 1Q23 | 22 |
| |
| 7. Other highlights |
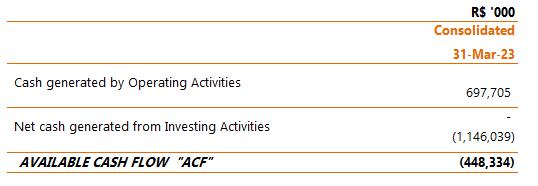
Transformation into Corporation According to Material Fact 06/22 of November 21, 2022, the State of Paraná, the Company's controlling shareholder, expressed its intention to transform Copel into a company with dispersed capital and no controlling shareholder (Corporation), through a public offering of secondary distribution of common shares and/or share deposit certificates (units) issued by the Company. In April 2023, the works began with the advisors' union that will carry out the transaction and the Granting Bonus of the other plants was defined by the MME. General approval processes are in progress, including a waiver request from Copel's debenture holders, as well as valuation and due diligence work by Copel and specialized advisors. After completion of the valuation, the allocation will be made to the controller and the TCE for analysis and subsequent launch of the Follow-on Offer. Available Cash Flow and Dividends Available Cash Flow is defined in the Dividend Policy as: FCD = Cash generated by Operating activities, less net cash used by investing activities, as follows: (a) Cash Generated by Operating Activities: cash generated by operating activities in the fiscal year, before taxes, contributions (IRCS) and financial charges; (b) Net cash used by Investment activities: amount invested in the fiscal year in non-current assets. The Table below shows the calculation of the FCD on March, 31, 2023:
|
Definition of Granting Bonuses for Foz do Areia, Salto Caxias and Segredo HPPs
The Interministerial Ordinance of the Ministries of Mines and Energy and Finance – MME/MF No. 01, of March 30, 2023, established the value of the granting of electric power generation concession for the set of Hydroelectric Power Plants (HPPs) Governador Bento Munhoz da Rocha Netto (“Foz do Areia”), Governor Ney Aminthas de Barros Braga (“Segredo”), and Governor José Richa (“Salto Caxias”), in the amount of R$3,719,428,214.95 (three billion, seven hundred and nineteen million, four hundred and twenty-eight thousand, two hundred and fourteen reais and ninety-five cents).
For more information, see Material Fact 04/23.
Agreement between Itaú Unibanco S.A. and the State of Paraná
On April 11, 2023, Copel received the Official Letter OF CEE/CC 795/23 from the State of Paraná, informing that Itaú Unibanco S.A. and the State of Paraná entered into an agreement for the release, by Itaú Unibanco S.A, of encumbrances on shares issued by COPEL held by the State of Paraná. On the subject, on May 3, 2023, through Official Letter OF CEE/CC 1123/23, the State informed that the Agreement was taken to the plenary of the Federal Supreme Court on April 28, 2023, with its approval approved . Thus, the bookkeeping bank was asked to release the pledged shares in an amount sufficient to carry out a possible public offering of secondary distribution related to the transformation of Copel into a company with dispersed capital and without a controlling shareholder, to be carried out during the year 2023.
For more information access Relevant Facts 05/23 and 06/23.
Signing of ACT and compensation for termination of the payment of the additional third of Vacation Bonus
Copel and its Subsidiaries entered into, in January 2023, the Collective Bargaining Agreement 2022/2024 with the unions that represent the Company's employees. The agreement approved the indemnity for the cessation of payment related to the additional third by way of Vacation Bonus, contained in the previous Collective Bargaining Agreements. In addition to 1/3 of the employee's remuneration as a constitutional third (CF, 7th, XVII), Copel had an additional 1/3 as a benefit to employees. For the extinction of this benefit, it was paid, in a single installment, with an indemnity nature, a compensation cost of R$138.2 million.
RESULTS | 1Q23 | 23 |
| |
Inspeção Técnica em Foz do Areia – FDA
During the scheduled stoppage for inspection, which ended on 03/25/23, of generating unit 03 of the HPP Gov. Bento Munhoz da Rocha Netto (Foz Do Areia - FDA), which has a unit Assured Energy of approximately 144.8 average MW, an isolated fault was identified in the upper wear ring of the turbine rotor. This generating unit will remain unavailable, with a view to carrying out a diagnosis on the cause of the incident and the respective actions for its repair, when the return forecast for this generating unit will be updated. Eventual financial impacts related to non-generation or any reduction in the plant's Assured Energy will only be estimated after the completion of this work. It should be noted that FDA currently has 575.3 average MW of Assured Energy, approved by Ordinance No. 709/2022/GM/MME.
Selection of Equity Investment Fund Manager for Corporate Venture Capital (CVC)
The Company's Board of Directors approved the selection of the company Vox Capital Gestão de Recursos S.A. as manager of Fundo de Investimentos em Participações (“FIP”) for Copel's Corporate Venture Capital (“CVC”) program, or “Copel Ventures”. Copel's Corporate Venture Capital (CVC) model is part of the company's strategy for the 2030 horizon, and seeks to encourage, with a commitment to contribute R$150 million to be invested over the next few years, innovative proposals within the energy and that are adequate to the portfolio of the innovation and investment thesis, in the themes: Clean Renewable Energies, Innovative Internal Processes; Energy as a Service; Asset and Facilities Management; and Smart Cities. The selection process began on November 21, 2022, with the publication of the public call notice COPEL HOL-DDN 06/2022 for the selection of the management company for the FIP. Eight bidders competed in the public call, whose proposals were evaluated according to criteria of experience, scope and history of action, experience in the electricity sector or with energytechs, methodologies and services offered and cost structure.
Copel GeT wins gold in the Best in Management Award in 2023
Copel Geração e Transmissão is the winner of the Melhores em Gestão® Award, promoted by the National Quality Foundation (FNQ). The company received the Gold level trophy at a ceremony held in São Paulo. Annually, FNQ rewards the companies that obtained the best performance in the application of the Management Excellence Model® (MEG), in the last evaluation cycle. The methodology is made up of eight foundations that should guide business administration: systemic thinking, organizational learning and innovation, transformative leadership, commitment to stakeholders, adaptability, sustainable development, process orientation and value generation. This year, fourteen companies entered the ranking of the best in management in Brazil. This award is recognition of the Company's commitment to good governance practices for the sustainable development of its businesses.
Copel starts implementation of electric vehicle fleet
Copel initiated actions to reach the goal that foresees the electrification of its vehicles. In March, the Company entered into a partnership with Mobilize dedicated to new mobility and which offers a wide range of services for the leasing of electric cars that will integrate the company's light vehicle fleet. The goal of decarbonizing Copel's light vehicle fleet is one of the strategic pillars of the 2030 vision, announced by the company on Copel Day 2022. By the end of the year, 15% of light vehicles will be replaced by electric models, that is, 30 vehicles. By 2027, 61 vehicles (30% of the fleet) will be electric, reaching 50% of the fleet in 2030 (102 cars).
Copel completed an innovative R&D project at Colíder HPP
The R&D Project applied at HPP Colíder and entitled Methodology for Computational Modeling of TDG in Water in Spillway Effluent Flows, developed by Copel Geração e Transmissão – Copel GeT and Lactec Institutes, with the participation of the University of Iowa/IIHR, was completed in March. (USA). Total Dissolved Gases (TDG) is a measure of the partial pressures of all gases dissolved in water (mainly oxygen and nitrogen) which, at high values (supersaturation), can cause the so-called “bubble disease” in fish. ” - when there is formation of gas bubbles in the blood and tissues of animals. The project, unprecedented in Brazil, developed a computational modeling methodology to simulate the process of transporting air bubbles in water and the process of dissolution and transport of gases that occur during the operation of a spillway, estimating the percentage of TDG that can be formed before and after designing a deflector. Copel GeT invested R$8.9 million in this R&D, which involved 44,000 hours of work by the professionals involved in the study. So far, seven technical articles have been published that deal with the studies carried out within the scope of R&D and the successful project of the deflectors of the Colíder hydroelectric plant, contributing to the design of future plants, mainly in the Amazon basin, to contemplate the solution.
RESULTS | 1Q23 | 24 |
| |
Copel prepares for the expansion of the free energy market
One of the largest energy trading companies in Brazil, Copel Mercado Livre underwent an internal restructuring to become the main gateway for the company's customers. The change represents another step in the preparation for the new phase of opening the free energy market, which in 2024 will be extended to all customers served in high voltage (those connected to the electrical grid at voltage equal to or greater than 2.3 kilovolts, usually companies, industries, markets and shopping centers). This change will allow all businesses that are currently served by the distributor to choose their energy supplier. The advantages of the free market for companies are greater flexibility to choose the amount of contracted energy, price, period of supply and payment terms. In order to serve these new customers in a personalized and efficient manner, the change implemented by Copel unifies, at the trading company, all areas that work with energy planning and energy trading in the generation and distribution subsidiaries. With the expansion, Copel Mercado Livre's team doubles in size and adds the technical knowledge of professionals with experience in the areas of energy generation and distribution. The fusion of this knowledge is important, for example, because future free market customers come from the distributor, which operates in a regulated manner.
RESULTS | 1Q23 | 25 |
| |
.Disclaimer The information contained in this press release may contain forward-looking statements that reflect management’s current view and estimates of future economic circumstances, industry conditions, company performance, and financial results. Any statements, expectations, capabilities, plans and assumptions contained in this press release that do not describe historical facts such as statements regarding the declaration or payment of dividends, the direction of future operations, the implementation of relevant operating and financial strategies, the investment program, factors or trends affecting the Company’s financial condition, liquidity or results of operations are forward-looking statements within the meaning of the U.S. Private Securities Litigation Reform Act of 1995 and involve a number of risks and uncertainties. There is no guarantee that these results will actually occur. The statements are based on many assumptions and factors, including general economic and market conditions, industry conditions and operating factors. Any changes in such assumptions or factors could cause actual results to differ materially from current expectations. |
Investor Relations
ri@copel.com
Phone: +55 (41) 3331-4011
RESULTS | 1Q23 | 26 |
 |
| Exhibit I -CONSOLIDATED RESULTS > INCOME STATEMENT |
| R$ '000 | ||||||
| Income Statement | 1Q23 | 1Q22 | Δ% | |||
| OPERATING REVENUES | 5,530,666 | 5,587,749 | (1.0) | |||
| Electricity sales to final customers | 1,904,159 | 2,134,153 | (10.8) | |||
| Electricity sales to distributors | 892,664 | 1,001,675 | (10.9) | |||
| Use of the main distribution and transmission grid | 1,496,218 | 1,262,904 | 18.5 | |||
| Construction revenue | 531,360 | 487,063 | 9.1 | |||
| Fair value of assets from the indemnity for the concession | 25,734 | 42,549 | (39.5) | |||
| Distribution of piped gas | 260,118 | 233,089 | 11.6 | |||
| Result of Sectorial financial assets and liabilities | 244,226 | 324,185 | (24.7) | |||
| Other operating revenues | 176,187 | 102,131 | 72.5 | |||
| OPERATING COSTS AND EXPENSES | (4,420,514) | (4,530,050) | (2.4) | |||
| Electricity purchased for resale | (1,820,975) | (1,939,498) | (6.1) | |||
| Charge of the main distribution and transmission grid | (687,571) | (774,975) | (11.3) | |||
| Personnel and management | (425,170) | (282,325) | 50.6 | |||
| Pension and healthcare plans | (65,998) | (68,085) | (3.1) | |||
| Materials and supplies | (20,923) | (18,236) | 14.7 | |||
| Materials and supplies for power eletricity | (6,750) | (85,431) | (92.1) | |||
| Natural gas and supplies for the gas business | (181,782) | (187,412) | (3.0) | |||
| Third-party services | (237,557) | (167,930) | 41.5 | |||
| Depreciation and amortization | (352,650) | (320,378) | 10.1 | |||
| Provisions and reversals | 10,723 | (115,948) | - | |||
| Construction cost | (528,981) | (476,717) | 11.0 | |||
| Other cost and expenses | (102,880) | (93,115) | 10.5 | |||
| EQUITY IN EARNINGS OF SUBSIDIARIES | 104,088 | 112,781 | (7.7) | |||
| PROFIT BEFORE FINANCIAL RESULTS AND TAXES | 1,214,240 | 1,170,480 | 3.7 | |||
| FINANCIAL RESULTS | (333,139) | (213,227) | 56.2 | |||
| Financial income | 240,639 | 259,875 | (7.4) | |||
| Financial expenses | (573,778) | (473,102) | 21.3 | |||
| OPERATIONAL EXPENSES/ INCOME | 881,101 | 957,253 | (8.0) | |||
| INCOME TAX AND SOCIAL CONTRIBUTION ON PROFIT | (245,611) | (287,462) | (14.6) | |||
| Income tax and social contribution on profit | (161,823) | (273,849) | (40.9) | |||
| Deferred income tax and social contribution on profit | (83,788) | (13,613) | 515.5 | |||
| NET PROFIT | 635,490 | 669,791 | (5.1) | |||
| Attributed to shareholders of the parent company - continuous operations | 626,590 | 664,341 | (5.7) | |||
| Attributed to non-controlling shareholders | 8,900 | 5,450 | 63.3 | |||
| EBITDA | 1,566,890 | 1,490,858 | 5.1 |
| |
| Exhibit I -CONSOLIDATED RESULTS > BALANCE SHEET |
| R$'000 | R$'000 | |||||||
| Assets | Mar-23 | Dec-22 | Δ% | Liabilities | Mar-23 | Dec-22 | Δ% | |
| CURRENT | 9,962,530 | 9,327,249 | 6.8 | CURRENT | 7,362,539 | 7,156,597 | 2.9 | |
| Cash and cash equivalents | 2,911,274 | 2,678,457 | 8.7 | Payroll, social charges and accruals | 247,831 | 252,789 | (2.0) | |
| Bonds and securities | 92 | 93 | (1.2) | Suppliers | 1,962,381 | 2,090,022 | (6.1) | |
| Collaterals and escrow accounts | 178 | 157 | 13.2 | Income tax and social contribution payable | 81,503 | 156,191 | (47.8) | |
| Customers | 3,460,367 | 3,342,050 | 3.5 | Other taxes due | 367,539 | 303,606 | 21.1 | |
| Dividends receivable | 137,297 | 138,330 | (0.7) | Loans and financing | 336,274 | 278,838 | 20.6 | |
| Sectorial financial assets | 327,135 | 190,699 | 71.5 | Debentures | 1,468,414 | 1,346,347 | 9.1 | |
| Account receivable related to concession | 8,563 | 8,603 | (0.5) | Minimum compulsory dividend payable | 484,759 | 482,325 | 0.5 | |
| Contract Assets | 242,259 | 220,660 | 9.8 | Post employment benefits | 86,404 | 73,814 | 17.1 | |
| Other current receivables | 998,201 | 897,380 | 11.2 | Customer charges due | 42,338 | 46,488 | (8.9) | |
| Inventories | 223,225 | 194,850 | 14.6 | Research and development and energy efficiency | 376,147 | 370,244 | 1.6 | |
| Income tax and social contribution | 374,539 | 355,065 | 5.5 | Accounts Payable related to concession | 105,228 | 105,003 | 0.2 | |
| Other current recoverable taxes | 1,208,196 | 1,239,694 | (2.5) | Net sectorial financial liabilities | 208,178 | 433,914 | (52.0) | |
| Prepaid expenses | 69,775 | 60,076 | 16.1 | Lease liability | 66,254 | 64,870 | 2.1 | |
| Related parties | 1,430 | 1,135 | 26 | Other accounts payable | 713,968 | 601,619 | 18.7 | |
| NON-CURRENT | 43,101,944 | 40,376,451 | 6.8 | PIS and COFINS to be refunded to costumers | 815,321 | 550,527 | 48.1 | |
| Long Term Assets | 16,947,496 | 16,442,145 | 3.1 | NON-CURRENT | 23,935,402 | 21,415,878 | 11.8 | |
| Bonds and securities | 501,702 | 430,963 | 16.4 | Suppliers | 125,339 | 125,448 | (0.1) | |
| Other temporary investments | 26,802 | 25,619 | 4.6 | Deferred income tax and social contribution | 1,799,750 | 1,517,682 | 18.6 | |
| Customers | 117,630 | 109,819 | 7.1 | Other taxes due | 631,616 | 633,491 | (0.3) | |
| Judicial deposits | 631,837 | 632,458 | (0.1) | Loans and financing | 5,113,768 | 4,371,525 | 17.0 | |
| Sectoral financial assets | 109,045 | 190,699 | (42.8) | Debentures | 7,808,247 | 6,457,508 | 20.9 | |
| Account receivable related to concession | 2,403,465 | 2,269,690 | 5.9 | Post employment benefits | 994,854 | 996,223 | (0.1) | |
| Contract Assets | 7,536,312 | 7,452,019 | 1.1 | Research and development and energy efficiency | 256,226 | 244,514 | 4.8 | |
| Other non-current receivables | 1,372,447 | 931,452 | 47.3 | Accounts Payable related to concession | 830,715 | 832,539 | (0.2) | |
| Income tax and social contribution | 128,108 | 127,824 | 0.2 | Net sectorial financial liabilities | 50,945 | 49,341 | 3.3 | |
| Deferred income tax and social contribution | 1,637,997 | 1,644,299 | (0.4) | Lease liability | 202,543 | 208,886 | (3.0) | |
| Other non-current recoverable taxes | 2,481,904 | 2,627,293 | (5.5) | Other accounts payable | 1,000,001 | 645,234 | 55.0 | |
| Prepaid expenses | 247 | 10 | - | PIS and COFINS to be refunded to costumers | 1,231,291 | 1,444,631 | (14.8) | |
| Investments | 3,435,680 | 3,325,731 | 3.3 | Provision for allocation of Pis and Cofins credits | 1,876,933.0 | 1,851,257 | 1.4 | |
| Property, plant and equipment, net | 11,189,018 | 10,069,468 | 11.1 | Provisions for litigation | 2,013,174 | 2,037,599 | (1.2) | |
| Intangible assets | 11,274,717 | 10,277,727 | 9.7 | EQUITY | 21,766,534 | 21,131,225 | 3.0 | |
| Right to use an asset | 255,034 | 261,380 | (2.4) | Attributed to controlling shareholders | 21,443,824 | 20,817,364 | 3.0 | |
| TOTAL | 53,064,475 | 49,703,700 | 6.8 | Share capital | 10,800,000 | 10,800,000 | - | |
| Equity valuation adjustments | 585,053 | 593,382 | (1.4) | |||||
| Legal reserves | 1,512,687 | 1,512,687 | 0.0 | |||||
| Retained earnings | 7,911,295 | 7,911,295 | - | |||||
| Accrued earnings | 634,789 | - | - | |||||
| Attributable to non-controlling interest | 322,710 | 313,861 | 2.8 | |||||
| TOTAL | 53,064,475 | 49,703,700 | 6.8 | |||||
| |
| Exhibit I -CONSOLIDATED RESULTS > CASH FLOW |
| R$'000 | ||
| Consolidated Cash Flow | 31-Mar-23 | 31-Mar-22 |
| CASH FLOWS FROM OPERATIONAL ACTIVITIES | ||
| Net income | 635,490 | 669,791 |
| Adjustments to reconcile net income for the period with cash generation from operating activities: | 1,054,954 | 1,026,767 |
| Unrealized monetary and exchange variation and debt charges - net | 426,041 | 305,700 |
| Interest - bonus from the grant of concession agreements under the quota system | (36,944) | (41,919) |
| Remuneration of transmission concession contracts | (238,365) | (267,530) |
| Income tax and social contribution | 161,823 | 273,849 |
| Deferred income tax and social contribution | 83,788 | 13,613 |
| Equity in earnings of investees | (104,088) | (112,781) |
| Appropriation of post-employment benefits obligations | 68,482 | 66,524 |
| Creation for research and development and energy efficiency programs | 40,203 | 41,434 |
| Recognition of fair value of assets from the indemnity for the concession | (25,734) | (42,549) |
| Sectorial financial assets and liabilities result | (269,120) | (357,229) |
| Depreciation and amortization | 352,650 | 320,378 |
| Net operating estimated losses, provisions and reversals | (10,723) | 115,948 |
| Realization of added value in business combinations | (181) | (180) |
| Fair value in energy purchase and sale operations | (50,291) | 21,834 |
| Derivatives fair value | - | 2,907 |
| Loss on disposal of accounts receivable related to concession | 30 | 16 |
| Loss on disposal of contract assets | 2,834 | 3,636 |
| Loss on disposal of property, plant and equipment | 811 | 405 |
| Loss on disposal of intangible assets | 18,252 | 12,943 |
| Result of write-offs of use rights of assets and liabilities of leases - net | (4) | (23) |
| Decrease (increase) in assets | 143,709 | 454,445 |
| Trade accounts receivable | 107,912 | 85,124 |
| Dividends and interest on own capital received | 5,860 | 4,127 |
| Judicial deposits | 11,565 | 9,931 |
| Sectorial financial assets | 13,796 | 224,089 |
| Other receivables | (44,699) | 129,138 |
| Inventories | (24,064) | (14,218) |
| Income tax and social contribution recoverable | (8,596) | (23,502) |
| Other taxes recoverable | 91,942 | 49,080 |
| Prepaid expenses | (9,712) | (9,324) |
| Related parties | (295) | - |
| Increase (decrease) in liabilities | (500,958) | 25,731 |
| Payroll, social charges and accruals | 40,770 | 42,191 |
| Related parties | - | - |
| Suppliers | (576,841) | (478,058) |
| Other taxes | 208,575 | 196,852 |
| Post-employment benefits | (57,261) | (50,141) |
| Sectorial charges due | (4,150) | 422,789 |
| Research and development and energy efficiency | (29,894) | (55,326) |
| Payable related to the concession | (29,049) | (26,846) |
| Other accounts payable | 20,647 | 40,232 |
| Provisions for legal claims | (73,755) | (65,962) |
| CASH GENERATED BY OPERATING ACTIVITIES | 697,705 | 1,506,943 |
| Income tax and social contribution paid | (210,839) | (125,556) |
| Loans and financing - interest due and paid | (166,072) | (77,479) |
| Debentures - interest due and paid | (142,569) | (115,772) |
| Charges for lease liabilities paid | (5,711) | (4,653) |
| NET CASH GENERATED FROM OPERATING ACTIVITIES | 172,514 | 1,183,483 |
| CASH FLOWS FROM INVESTMENT ACTIVITIES | ||
| Financial investments | (45,745) | 116,514 |
| Loans and financing granted to related parties | - | - |
| Additions to contract assets | (155,627) | (534,968) |
| Acquisitions of subsidiaries - effect on cash | (912,139) | - |
| Additions in investments | (10,780) | (4,830) |
| Capital reduction of investees | - | 61,536 |
| Additions to property, plant and equipment | (19,704) | (170,806) |
| Additions to intangible assets | (2,044) | (1,567) |
| NET CASH USED FROM INVESTING ACTIVITIES | (1,146,039) | (534,121) |
| CASH FLOWS FROM FINANCING ACTIVITIES | ||
| Loans and financing obtained from third parties | - | 55,788 |
| Issue of debentures | 1,300,000 | - |
| Transaction costs in the issuing of debentures | (11,325) | - |
| Payments of principal - loans and financing | (59,216) | (189,291) |
| Payments of principal - debentures | (5,688) | (5,492) |
| Amortization of principal of lease liabilities | (17,384) | (12,232) |
| Dividends and interest on own capital paid | (45) | (6) |
| NET CASH USED BY FINANCING ACTIVITIES | 1,206,342 | (151,233) |
| TOTAL EFFECTS ON CASH AND CASH EQUIVALENTS | 232,817 | 498,129 |
| Cash and cash equivalents at the beginning of the period | 2,678,457 | 3,472,845 |
| Cash and cash equivalents at the end of the period | 2,911,274 | 3,970,974 |
| CHANGE IN CASH AND CASH EQUIVALENTS | 232,817 | 498,129 |
| |
| Exhibit I -CONSOLIDATED RESULTS > ADJUSTED EBITDA AND FINANCIAL RESULT |
| R$'000 | ||||
| 1Q23 | 1Q22 | Δ% | ||
| EBITDA | 1,566,890 | 1,490,858 | 5.1 | |
| (-)/+ Fair value in the purchase and sale of energy | (50,291) | 21,834 | - | |
| (-)/+ Impairment | (36,925) | - | - | |
| (-)/+ Tariff flag account on MMGD | - | (43,447) | - | |
| (-)/+ indemnity of adittional third of vacation bonus | 138,173 | - | - | |
| (-)/+ Provision/Reversal of PDI indemnities | - | (7,880) | - | |
| Adjusted EBITDA | 1,617,847 | 1,461,365 | 10.7 | |
| (-)/+ Equity in earnings of subsidiaries | (104,088) | (112,781) | (7.7) | |
| Adjusted EBITDA without earnings of subsidiaries | 1,513,759 | 1,348,584 | 12.2 | |
| R$'000 | ||||
| 1Q23 | 1Q22 | Δ% | ||
| Financial Revenues | 240,636 | 259,875 | (7.4) | |
| Income from investments held for trading | 97,604 | 87,944 | 11.0 | |
| Late fees on electricity bills | 55,569 | 76,417 | (27.3) | |
| Monetary restatement and adjustment to present value of accounts payable related to concession | 7,374 | 1,286 | - | |
| Income from sectorial assets and liabilities | 25,195 | 32,129 | (21.6) | |
| Exchange variation About Purchase Itaipu Electric Power | 3,338 | 29,507 | (88.7) | |
| Tax credit recognition | 17,691 | 15,007 | 17.9 | |
| Other financial revenues | 42,443 | 27,812 | 52.6 | |
| (-) Pis/Pasep and Cofins on revenues | (8,578) | (10,227) | (16.1) | |
| Financial Expenses | (573,778) | (473,102) | 21.3 | |
| Monetary variation, foreign exchange and debt service charges | (466,949) | (347,730) | 34.3 | |
| Monetary variation and adjustment to present value of accounts payable related to concession | (34,824) | (71,475) | (51.3) | |
| Exchange variation About Purchase Itaipu Electric Power | (813) | (4,600) | (82.3) | |
| Income from sectorial assets and liabilities | (1,605) | (3,791) | (57.7) | |
| Interest on R&D and PEE | (7,307) | (8,045) | (9.2) | |
| Interest on tax installments | (10,561) | (7,749) | 36.3 | |
| Interest on lease liabilities | (5,717) | (3,865) | 47.9 | |
| Other financial expenses | (46,002) | (25,847) | 78.0 | |
| Financial income (expenses) | (333,142) | (213,227) | 56.2 |
| |
| Exhibit I -CONSOLIDATED RESULTS > EQUITY IN EARNINGS OF SUBSIDIARIES AND INDICATORS |
| R$'000 | ||||||||
| Variation in Equity in earnings of subsidiaries | 1Q23 | 1Q22 | Δ% | |||||
| Joint Ventures | 98,895 | 106,548 | (7.2) | |||||
| Voltalia São Miguel do Gostoso I Participações S.A. | (1,241) | (2,609) | (52.4) | |||||
| Caiuá Transmissora de Energia S.A. | 4,056 | 4,480 | (9.5) | |||||
| Integração Maranhense Transmissora de Energia S.A. | 9,450 | 7,060 | 33.9 | |||||
| Matrinchã Transmissora de Energia (TP NORTE) S.A. | 26,949 | 28,601 | (5.8) | |||||
| Guaraciaba Transmissora de Energia (TP SUL) S.A. | 12,092 | 13,338 | (9.3) | |||||
| Paranaíba Transmissora de Energia S.A. | 9,352 | 12,205 | (23.4) | |||||
| Mata de Santa Genebra Transmissão S.A. | 22,308 | 23,572 | (5.4) | |||||
| Cantareira Transmissora de Energia S.A. | 15,816 | 19,837 | (20.3) | |||||
| Solar Paraná | 113 | 64 | 76.6 | |||||
| Associates | 5,193 | 6,233 | (16.7) | |||||
| Dona Francisca Energética S.A. | 1,033 | 1,639 | (37.0) | |||||
| Foz do Chopim Energética Ltda. | 4,161 | 4,596 | (9.5) | |||||
| Others ¹ | (1) | (2) | (50.0) | |||||
| TOTAL | 104,088 | 112,781 | (7.7) | |||||
| 1 Includes Carbocampel S.A., Copel Amec S/C Ltda, Escoelectric Ltda e Dois Saltos Ltda. | ||||||||
| R$'000 | ||||||||
| Main Indicators -AssociatesMar-23 | Dona Francisca | Foz do Chopim | ||||||
| Total assets | 171,937 | 47,832 | ||||||
| Shareholder’s equity¹ | 126,255 | 45,488 | ||||||
| Net operating revenue | 16,468 | 15,051 | ||||||
| Net Income | 4,479 | 11,635 | ||||||
| Participation in the enterprise - % | 23.0 | 35.8 | ||||||
| Investment book value | 29,076 | 16,269 | ||||||
| R$'000 | ||||||||
| Main Indicators -Joint ventures Mar-23 | Voltalia | Caiuá | Integração Maranhense | Matrinchã | Guaraciaba | Paranaíba | Mata de Santa Genebra | Cantareira |
| Total assets | 236,401 | 339,171 | 616,345 | 3,012,430 | 1,607,296 | 1,988,157 | 3,726,706 | 1,856,198 |
| Shareholder’s equity¹ | 234,152 | 263,984 | 434,149 | 1,956,079 | 977,941 | 1,116,188 | 1,426,284 | 998,337 |
| Net operating revenue | - | 11,912 | 20,078 | 102,392 | 53,922 | 72,662 | 133,026 | 60,070 |
| Net Income | (2,534) | 8,279 | 19,286 | 54,997 | 24,679 | 38,175 | 44,526 | 32,278 |
| Participation in the enterprise - % | 49.0 | 49.0 | 49.0 | 49.0 | 49.0 | 24.5 | 50.1 | 49.0 |
| Investment book value | 114,735 | 129,353 | 212,732 | 958,477 | 479,191 | 273,465 | 714,568 | 489,185 |
| Note: Income from Transmitters according to adjustments for the application of CPC 47 / IFRS 15 in the Corporate Statements. | ||||||||
| |
| Exhibit I -CONSOLIDATED RESULTS > SHARE CAPITAL |
| Share Capital - As of March, 31,2023 | ||||||||
| Thousand shares | ||||||||
| Shareholders | Common | % | Preferred "A" | % | Preferred "B" | % | TOTAL | % |
| State of Paraná | 734,298 | 69.7% | - | - | 115,945 | 6.9% | 850,243 | 31.1% |
| BNDESPAR | 131,162 | 12.4% | - | - | 524,646 | 31.2% | 655,808 | 24.0% |
| Free Floating | 170,029 | 16.1% | 682 | 21.8% | 1,037,743 | 61.8% | 1,208,454 | 44.2% |
| B3 | 138,212 | 13.1% | 682 | 21.8% | 909,513 | 54.2% | 1,048,407 | 38.3% |
| NYSE | 31,595 | 3.0% | - | - | 126,379 | 7.5% | 157,974 | 5.8% |
| LATIBEX | 222 | 0.0% | - | - | 1,851 | 0.1% | 2,073 | 0.1% |
| Other | 18,601 | 1.8% | 2,446 | 78.2% | 1,001 | 0.1% | 22,049 | 0.8% |
| TOTAL | 1,054,090 | 100% | 3,128 | 100% | 1,679,335 | 100% | 2,736,554 | 100% |
| Thousand shares | ||||||||
| Shareholders | UNIT | % | ||||||
| State of Paraná | 28,986 | 13.3% | ||||||
| BNDESPAR | 131,162 | 60.3% | ||||||
| Free Floating | 57,195 | 26.3% | ||||||
| B3 | 25,378 | 11.7% | ||||||
| NYSE | 31,595 | 14.5% | ||||||
| LATIBEX | 222 | 0.1% | ||||||
| Other | 71 | 0.0% | ||||||
| TOTAL | 217,414 | 100% | ||||||
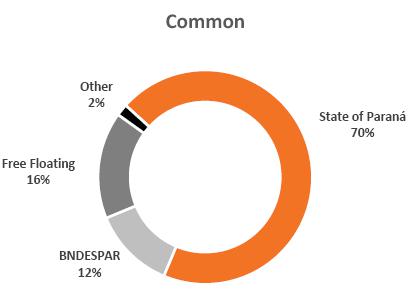 | 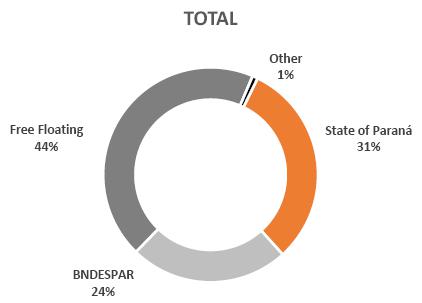 |
| |
| Exhibit II-RESULT BY SUBSIDIARY > COPEL GET (CONSOLIDATED) |
| R$'000 | ||||||
| Income Statement | 1Q23 | 1Q22 | Δ% | |||
| OPERATING REVENUES | 1,345,859 | 1,399,595 | (3.8) | |||
| Electricity sales to final customers | (9) | 83 | - | |||
| Electricity sales to distributors | 1,007,682 | 1,027,421 | (1.9) | |||
| Use of the main transmission grid | 293,039 | 315,894 | (7.2) | |||
| Construction revenue | 38,392 | 43,681 | (12.1) | |||
| Other operating revenues | 6,755 | 12,516 | (46.0) | |||
| OPERATING COSTS AND EXPENSES | (654,548) | (710,413) | (7.9) | |||
| Electricity purchased for resale | (18,017) | (54,353) | (66.9) | |||
| Charges of main distribution and transmission grid | (153,731) | (132,466) | 16.1 | |||
| Personnel and management | (131,599) | (88,381) | 48.9 | |||
| Pension and healthcare plans | (20,444) | (20,191) | 1.2 | |||
| Materials and supplies | (4,298) | (3,495) | 23.0 | |||
| Materials and supplies for power eletricity | (6,878) | (88,177) | (92.2) | |||
| Third-party services | (65,171) | (49,003) | 33.0 | |||
| Depreciation and amortization | (202,015) | (190,306) | 6.2 | |||
| Provisions and reversals | 32,565 | (6,351) | - | |||
| Construction cost | (36,013) | (33,335) | 8.0 | |||
| Other cost and expenses | (48,947) | (44,355) | 10.3 | |||
| EQUITY IN EARNINGS OF SUBSIDIARIES | 104,186 | 113,689 | (8.4) | |||
| PROFIT BEFORE FINANCIAL RESULTS AND TAXES | 795,497 | 802,871 | (0.9) | |||
| FINANCIAL RESULTS | (219,592) | (160,282) | 37.0 | |||
| Financial income | 86,025 | 61,811 | 39.2 | |||
| Financial expenses | (305,617) | (222,093) | 37.6 | |||
| OPERATIONAL EXPENSES/ INCOME | 575,905 | 642,589 | (10.4) | |||
| INCOME TAX AND SOCIAL CONTRIBUTION ON PROFIT | (162,944) | (179,235) | (9.1) | |||
| Income tax and social contribution on profit | (104,545) | (125,580) | (16.7) | |||
| Deferred income tax and social contribution on profit | (58,399) | (53,655) | 8.8 | |||
| NET INCOME (LOSS) | 412,961 | 463,354 | (10.9) | |||
| EBITDA | 997,512 | 993,177 | 0.4 | |||
| |
| Exhibit II-RESULT BY SUBSIDIARY > COPEL DIS |
| R$'000 | ||||||
| Income Statement | 1Q23 | 1Q22 | Δ% | |||
| OPERATING REVENUES | 3,531,641 | 3,521,968 | 0.3 | |||
| Electricity sales to final customers | 1,324,337 | 1,553,540 | (14.8) | |||
| Electricity sales to distributors | 34,115 | 52,555 | (35.1) | |||
| Use of the main distribution grid | 1,300,992 | 1,040,904 | 25.0 | |||
| Construction revenue | 489,977 | 439,969 | 11.4 | |||
| Fair value of assets from the indemnity for the concession | 25,734 | 28,470 | (9.6) | |||
| Sectorial assets and liabilities result | 244,226 | 324,185 | (24.7) | |||
| Other operating revenues | 112,260 | 82,345 | 36.3 | |||
| OPERATING COSTS AND EXPENSES | (3,238,770) | (3,195,366) | 1.4 | |||
| Electricity purchased for resale | (1,464,757) | (1,442,253) | 1.6 | |||
| Charges of main transmission grid | (625,128) | (729,815) | (14.3) | |||
| Personnel and management | (260,812) | (165,461) | 57.6 | |||
| Pension and healthcare plans | (41,545) | (42,945) | (3.3) | |||
| Materials and supplies | (15,960) | (14,068) | 13.4 | |||
| Third-party services | (155,176) | (108,721) | 42.7 | |||
| Depreciation and amortization | (124,363) | (108,525) | 14.6 | |||
| Provisions and reversals | (17,610) | (98,910) | (82.2) | |||
| Construction cost | (489,977) | (439,969) | 11.4 | |||
| Other cost and expenses | (43,442) | (44,700) | (2.8) | |||
| PROFIT BEFORE FINANCIAL RESULTS AND TAXES | 292,871 | 326,601 | (10.3) | |||
| FINANCIAL RESULTS | (112,535) | 22,050 | - | |||
| Financial income | 115,620 | 162,138 | (28.7) | |||
| Financial expenses | (228,155) | (140,087) | 62.9 | |||
| OPERATIONAL EXPENSES/ INCOME | 180,336 | 348,652 | (48.3) | |||
| INCOME TAX AND SOCIAL CONTRIBUTION ON PROFIT | (40,646) | (120,615) | (66.3) | |||
| Income tax and social contribution on profit | (26,320) | (134,044) | (80.4) | |||
| Deferred income tax and social contribution on profit | (14,326) | 13,429 | - | |||
| NET INCOME (LOSS) | 139,690 | 228,037 | (38.7) | |||
| EBITDA | 417,234 | 435,126 | (4.1) | |||
| |
| Exhibit II-RESULT BY SUBSIDIARY > COPEL COM (MERCADO LIVRE) |
| R$'000 | ||||||
| Income Statement | 1Q23 | 1Q22 | Δ% | |||
| OPERATING REVENUES | 1,116,652 | 1,184,043 | (5.7) | |||
| Electricity sales to final customers | 580,207 | 581,249 | (0.2) | |||
| Electricity sales to distributors | 479,303 | 600,412 | (20.2) | |||
| Other operating revenues | 57,142 | 2,381 | - | |||
| OPERATING COSTS AND EXPENSES | (1,018,224) | (1,183,306) | (14.0) | |||
| Electricity purchased for resale | (1,008,782) | (1,176,409) | (14.2) | |||
| Personnel and management | (5,471) | (3,445) | 58.8 | |||
| Pension and healthcare plans | (510) | (463) | 10.2 | |||
| Materials and supplies | (9) | (12) | (29.2) | |||
| Third-party services | (502) | (960) | (47.8) | |||
| Depreciation and amortization | (714) | (77) | 822.1 | |||
| Provisions and reversals | (465) | (745) | (37.6) | |||
| Other cost and expenses | (1,772) | (1,193) | 48.6 | |||
| PROFIT BEFORE FINANCIAL RESULTS AND TAXES | 98,428 | 737 | - | |||
| FINANCIAL RESULTS | 8,547 | 6,269 | 36.3 | |||
| Financial income | 8,631 | 6,355 | 35.8 | |||
| Financial expenses | (84) | (86) | (2.1) | |||
| OPERATIONAL EXPENSES/ INCOME | 106,975 | 7,006 | - | |||
| INCOME TAX AND SOCIAL CONTRIBUTION ON PROFIT | (36,471) | (2,364) | - | |||
| Income tax and social contribution on profit | (13,638) | (6,944) | 96.4 | |||
| Deferred income tax and social contribution on profit | (22,833) | 4,580 | - | |||
| NET INCOME (LOSS) | 70,504 | 4,642 | - | |||
| EBITDA | 99,142 | 815 | - | |||
| |
| Exhibit II-RESULT BY SUBSIDIARY > INCOME STATEMENT FOR THE QUARTER BY COMPANY |
| R$'000 | |||||||||||||||
| Income Statement 1Q23 | GET | Distribuição | Compagas | Elejor | UEG Araucária | Serviços | Wind Farms | FDA | Bela Vista | C. Oeste, Marumbi, Uirapuru | Mercado Livre | Holding | Elimination | Consolidated | |
| Geração | Transmissão | ||||||||||||||
| NET OPERATING INCOME | 625,877 | 317,699 | 3,531,641 | 263,251 | 41,034 | - | - | 203,808 | 192,001 | 7,953 | 22,700 | 1,116,652 | - | (791,950) | 5,530,666 |
| Electricity sales to final customers | - | - | 1,324,337 | - | - | - | - | - | - | (9) | - | 580,207 | - | (376) | 1,904,159 |
| Electricity sales to distributors | 611,265 | - | 34,115 | - | 40,816 | - | - | 203,808 | 191,997 | 7,962 | - | 479,303 | - | (676,602) | 892,664 |
| Use of the main distribution and transmission grid (TUSD/ TUST) | - | 273,146 | 1,300,992 | - | - | - | - | - | - | - | 22,324 | - | - | (100,244) | 1,496,218 |
| Construction revenue | - | 38,022 | 489,977 | 2,991 | - | - | - | - | - | - | 370 | - | - | - | 531,360 |
| Fair value of assets from the indemnity for the concession | - | - | 25,734 | - | - | - | - | - | - | - | - | - | - | - | 25,734 |
| Distribution of piped gas | - | - | - | 260,260 | - | - | - | - | - | - | - | - | - | (142) | 260,118 |
| Sectoral assets and liabilities result | - | - | 244,226 | - | - | - | - | - | - | - | - | - | - | - | 244,226 |
| Other operating revenues | 14,612 | 6,531 | 112,260 | - | 218 | - | - | - | 4 | - | 6 | 57,142 | - | (14,586) | 176,187 |
| OPERATING COSTS AND EXPENSES | (306,870) | (121,398) | (3,238,770) | (219,345) | (22,273) | (21,760) | (661) | (120,861) | (97,815) | (5,120) | (2,801) | (1,018,224) | (34,179) | 789,563 | (4,420,514) |
| Energy purchased for resale | (11,769) | - | (1,464,757) | - | (502) | - | - | (7,544) | (5,575) | (474) | - | (1,008,782) | - | 678,428 | (1,820,975) |
| Charges of the main distribution and transmission grid | (90,281) | - | (625,128) | - | (5,923) | (8,640) | - | (15,244) | (39,025) | (328) | - | - | - | 96,998 | (687,571) |
| Personnel and management | (70,418) | (52,646) | (260,812) | (10,863) | (1,203) | (1,606) | - | (5,186) | (1,011) | (402) | (330) | (5,471) | (15,222) | - | (425,170) |
| Private pension and health plans | (11,482) | (8,178) | (41,545) | (1,500) | (56) | (187) | - | (454) | (89) | (24) | (30) | (510) | (1,943) | - | (65,998) |
| Materials and supplies | (2,311) | (1,355) | (15,960) | (213) | (121) | (4) | - | (363) | (219) | (32) | (15) | (9) | (321) | - | (20,923) |
| Materials and supplies for power eletricity | (6,716) | - | - | - | - | (162) | - | - | - | - | - | - | - | 128 | (6,750) |
| Natural gas and supplies for gas business | - | - | - | (181,782) | - | - | - | - | - | - | - | - | - | - | (181,782) |
| Third-party services | (24,387) | (14,780) | (155,176) | (3,073) | (3,829) | (5,104) | (172) | (24,008) | (8,794) | (820) | (1,676) | (501) | (10,671) | 15,434 | (237,557) |
| Depreciation and amortization | (94,648) | (3,881) | (124,363) | (15,775) | (8,544) | (5,460) | (511) | (61,038) | (31,899) | (2,801) | (7) | (714) | (729) | (2,280) | (352,650) |
| Provisions and reversals | 32,356 | (2,243) | (17,610) | (365) | - | - | - | 2,508 | - | - | (56) | (465) | (3,120) | (282) | 10,723 |
| Construction cost | - | (35,643) | (489,977) | (2,991) | - | - | - | - | - | - | (370) | - | - | - | (528,981) |
| Other operating costs and expenses | (27,214) | (2,672) | (43,442) | (2,783) | (2,095) | (597) | 22 | (9,532) | (11,203) | (239) | (317) | (1,772) | (2,173) | 1,137 | (102,880) |
| EQUITY IN EARNINGS OF SUBSIDIARIES | 85,804 | 120,244 | - | - | - | - | - | 21,911 | - | - | - | - | 639,572 | (763,443) | 104,088 |
| EARNINGS BEFORE INCOME TAXES | 404,811 | 316,545 | 292,871 | 43,906 | 18,761 | (21,760) | (661) | 104,858 | 94,186 | 2,833 | 19,899 | 98,428 | 605,393 | (765,830) | 1,214,240 |
| FINANCIAL RESULTS | (87,668) | (102,080) | (112,535) | (4,503) | (19,283) | 598 | (156) | (40,607) | 5,154 | 3,232 | 1,779 | 8,547 | 14,383 | - | (333,139) |
| Financial income | 25,045 | 13,745 | 115,620 | 6,153 | 12,690 | 2,233 | 170 | 33,975 | 5,301 | 3,232 | 2,494 | 8,631 | 14,924 | (3,574) | 240,639 |
| Financial expenses | (112,713) | (115,825) | (228,155) | (10,656) | (31,973) | (1,635) | (326) | (74,582) | (147) | - | (715) | (84) | (541) | 3,574 | (573,778) |
| OPERATIONAL EXPENSES / INCOME | 317,143 | 214,465 | 180,336 | 39,403 | (522) | (21,162) | (817) | 64,251 | 99,340 | 6,065 | 21,678 | 106,975 | 619,776 | (765,830) | 881,101 |
| INCOME TAX AND SOCIAL CONTRIBUTION ON PROFIT | (78,428) | (31,943) | (40,646) | (13,480) | 1,114 | - | - | (16,639) | (33,725) | (1,347) | (1,578) | (36,471) | 6,814 | 718 | (245,611) |
| NET INCOME | 238,715 | 182,522 | 139,690 | 25,923 | 592 | (21,162) | (817) | 47,612 | 65,615 | 4,718 | 20,100 | 70,504 | 626,590 | (765,112) | 635,490 |
| Attributed to controlling shareholders | 238,715 | 182,522 | 139,690 | 13,222 | 414 | (17,183) | (817) | 47,612 | 65,615 | 4,718 | 20,100 | 70,504 | 626,590 | (765,112) | 626,590 |
| Attributed to non-controlling interest | - | - | - | 12,701 | 178 | (3,979) | - | - | - | - | - | - | - | - | 8,900 |
| EBITDA continued operations | 499,459 | 320,426 | 417,234 | 59,681 | 27,305 | (16,300) | (150) | 165,896 | 126,085 | 5,634 | 19,906 | 99,142 | 606,122 | (763,550) | 1,566,890 |
| |
| R$'000 | |||||||||||||||
| Income Statement 1Q22 | GET | Distribuição | Compagas | Elejor | UEG Araucária | Serviços | Wind Farms | FDA | Bela Vista | C. Oeste, Marumbi, Uirapuru | Mercado Livre | Holding | Elimination | Consolidated | |
| Geração | Transmissão | ||||||||||||||
| NET OPERATING INCOME | 621,952 | 338,680 | 3,521,968 | 253,647 | 54,867 | 98,032 | 8,014 | 142,551 | 186,193 | 7,298 | 30,127 | 1,184,042 | - | (859,620) | 5,587,749 |
| Electricity sales to final customers | 83 | - | 1,553,540 | - | - | - | - | - | - | - | - | 581,249 | - | (719) | 2,134,153 |
| Electricity sales to distributors | 601,650 | - | 52,555 | - | 54,867 | 98,032 | - | 140,486 | 186,188 | 7,298 | - | 600,412 | - | (739,813) | 1,001,675 |
| Use of the main distribution and transmission grid (TUSD/ TUST) | - | 290,461 | 1,040,904 | - | - | - | - | - | - | - | 28,027 | - | - | (96,488) | 1,262,904 |
| Construction revenue | - | 41,587 | 439,969 | 3,413 | - | - | - | - | - | - | 2,094 | - | - | - | 487,063 |
| Fair value of assets from the indemnity for the concession | - | - | 28,470 | 14,079 | - | - | - | - | - | - | - | - | - | - | 42,549 |
| Distribution of piped gas | - | - | - | 236,116 | - | - | - | - | - | - | - | - | - | (3,027) | 233,089 |
| Sectoral assets and liabilities result | - | - | 324,185 | - | - | - | - | - | - | - | - | - | - | - | 324,185 |
| Other operating revenues | 20,218 | 6,632 | 82,345 | 39 | - | - | 8,014 | 2,065 | 5 | - | 6 | 2,381 | - | (19,573) | 102,131 |
| OPERATING COSTS AND EXPENSES | (327,820) | (93,134) | (3,195,367) | (219,506) | (22,280) | (109,890) | (6,467) | (97,791) | (98,585) | (4,948) | (3,667) | (1,183,305) | (41,838) | 874,542 | (4,530,050) |
| Energy purchased for resale | (41,132) | - | (1,442,253) | - | (60) | - | - | (8,160) | (10,680) | (616) | - | (1,176,409) | - | 739,810 | (1,939,498) |
| Charges of the main distribution and transmission grid | (81,507) | - | (729,815) | - | (6,572) | (7,864) | - | (10,462) | (34,982) | (327) | - | - | - | 96,555 | (774,975) |
| Personnel and management | (49,206) | (33,894) | (165,461) | (9,766) | (1,118) | (1,331) | (3,778) | (2,835) | (623) | (293) | (198) | (3,445) | (10,376) | - | (282,325) |
| Private pension and health plans | (11,787) | (7,952) | (42,945) | (1,392) | (53) | (154) | (1,282) | (222) | (52) | (11) | (16) | (463) | (1,759) | - | (68,085) |
| Materials | (2,096) | (1,103) | (14,068) | (241) | (144) | (9) | (36) | (122) | (163) | - | (2) | (12) | (239) | - | (18,236) |
| Raw material and supplies - energy production | - | - | - | - | - | (88,177) | - | - | - | - | - | - | - | 2,746 | (85,431) |
| Natural gas and supplies for gas business | - | - | - | (187,412) | - | - | - | - | - | - | - | - | - | - | (187,412) |
| Third-party services | (20,126) | (9,509) | (108,721) | (3,417) | (3,252) | (5,593) | (826) | (17,983) | (10,195) | (566) | (1,429) | (960) | (6,944) | 21,598 | (167,930) |
| Depreciation and amortization | (93,256) | (3,000) | (108,525) | (10,550) | (9,851) | (5,924) | (468) | (48,273) | (37,076) | (2,771) | (8) | (77) | (601) | - | (320,378) |
| Provisions and reversals | (4,308) | (1,674) | (98,910) | (1,755) | - | (259) | (1) | (106) | - | - | (5) | (745) | (22,928) | 14,742 | (115,948) |
| Construction cost | - | (31,241) | (439,969) | (3,413) | - | - | - | - | - | - | (2,094) | - | - | - | (476,717) |
| Other operating costs and expenses | (24,402) | (4,761) | (44,701) | (1,560) | (1,230) | (579) | (76) | (9,629) | (4,815) | (364) | 85 | (1,194) | 1,008 | (907) | (93,115) |
| EQUITY IN EARNINGS OF SUBSIDIARIES | 65,680 | 134,947 | - | - | - | - | - | 11,649 | - | - | - | - | 711,739 | (811,234) | 112,781 |
| EARNINGS BEFORE INCOME TAXES | 359,811 | 380,493 | 326,601 | 34,141 | 32,586 | (11,858) | 1,547 | 56,409 | 87,608 | 2,350 | 26,460 | 737 | 669,901 | (796,312) | 1,170,480 |
| FINANCIAL RESULTS | (84,754) | (55,854) | 22,051 | 3,068 | (64,527) | 4,367 | 213 | (31,763) | 6,895 | 113 | 718 | 6,269 | (20,019) | - | (213,227) |
| Financial income | 25,414 | 13,345 | 162,138 | 10,769 | 3,351 | 6,176 | 515 | 21,128 | 7,002 | 113 | 1,461 | 6,355 | 17,082 | (14,973) | 259,875 |
| Financial expenses | (110,168) | (69,199) | (140,087) | (7,701) | (67,879) | (1,809) | (302) | (52,891) | (107) | - | (743) | (86) | (37,100) | 14,973 | (473,102) |
| OPERATIONAL EXPENSES / INCOME | 275,057 | 324,639 | 348,652 | 37,209 | (31,941) | (7,491) | 1,760 | 24,646 | 94,503 | 2,462 | 27,178 | 7,006 | 649,882 | (796,312) | 957,253 |
| INCOME TAX AND SOCIAL CONTRIBUTION ON PROFIT | (69,806) | (63,243) | (120,615) | (9,960) | 10,881 | (940) | (628) | (11,352) | (32,125) | (266) | (1,444) | (2,364) | 14,459 | (61) | (287,462) |
| NET INCOME | 205,251 | 261,396 | 228,037 | 27,250 | (21,059) | (8,429) | 1,132 | 13,294 | 62,378 | 2,197 | 25,734 | 4,642 | 664,341 | (796,373) | 669,791 |
| Attributed to controlling shareholders - continued operations | 205,251 | 261,396 | 228,037 | 13,899 | (14,741) | (6,843) | 1,132 | 13,294 | 62,378 | 2,197 | 25,734 | 4,642 | 664,341 | (796,373) | 664,341 |
| Attributed to non-controlling interest | - | - | - | 13,353 | (6,317) | (1,585) | - | - | - | - | - | - | - | - | 5,450 |
| EBITDA continued operations | 453,067 | 383,493 | 435,126 | 44,691 | 42,438 | (5,933) | 2,015 | 104,682 | 124,684 | 5,121 | 26,468 | 815 | 670,502 | (796,312) | 1,490,858 |
| |
| Exhibit II-RESULT BY SUBSIDIARY > ASSETS BY COMPANY |
| R$'000 | ||||||||||||||
| Assets - March-2023 | Geração e Transmissão | Distribuição | Compagas | Elejor | UEG Araucária | Serviços | Wind Farms | FDA | Bela Vista | Costa Oeste, Marumbi, Uirapuru | Mercado Livre | Holding | Eliminations | Consolidated |
| CURRENT | 2,040,015 | 5,139,426 | 281,751 | 231,441 | 82,545 | 5,636 | 1,103,984 | 242,550 | 35,021 | 110,690 | 1,024,669 | 1,125,581 | (1,460,787) | 9,962,522 |
| Cash and cash equivalents | 859,172 | 314,461 | 111,330 | 183,367 | 48,272 | 3,354 | 866,717 | 156,628 | 28,797 | 85,261 | 230,240 | 23,675 | - | 2,911,274 |
| Bonds and securities | - | - | - | - | - | - | - | - | - | - | - | 92 | - | 92 |
| Collaterals and escrow accounts | - | 4 | 174 | - | - | - | - | - | - | - | - | - | - | 178 |
| Customers | 386,507 | 2,575,878 | 117,657 | 30,297 | - | - | 106,980 | 83,376 | 2,759 | 7,092 | 424,208 | - | (274,390) | 3,460,364 |
| Dividends receivable | 226,314 | - | - | - | - | - | 64,381 | - | - | - | - | 715,833 | (869,232) | 137,296 |
| Sectorial financial assets | - | 327,135 | - | - | - | - | - | - | - | - | - | - | - | 327,135 |
| Account receivable related to concession | 8,563 | - | - | - | - | - | - | - | - | - | - | - | - | 8,563 |
| Contract Assets | 226,763 | - | - | - | - | - | - | - | - | 15,496 | - | - | - | 242,259 |
| Other current receivables | 143,747 | 432,617 | 34,294 | 12,502 | 61 | 2 | 12,808 | 13 | 2,495 | 576 | 365,048 | 1,284 | (7,248) | 998,199 |
| Inventories | 32,622 | 179,173 | 6,399 | 202 | - | 249 | 4,375 | - | - | 205 | - | - | - | 223,225 |
| Income tax and social contribution | 111,343 | 95,731 | 11,452 | 4,017 | 13,339 | 1,761 | 18,035 | 708 | 362 | 1,530 | 3,919 | 112,339 | - | 374,536 |
| Other current recoverable taxes | 14,605 | 1,161,157 | - | - | 20,873 | 270 | 9,616 | 1,327 | 17 | - | 331 | - | - | 1,208,196 |
| Prepaid expenses | 11,692 | 42,017 | 445 | 1,056 | - | - | 9,880 | 498 | 591 | 530 | 923 | 2,143 | - | 69,775 |
| Related parties | 18,687 | 11,253 | - | - | - | - | 11,192 | - | - | - | - | 270,215 | (309,917) | 1,430 |
| NON-CURRENT | 21,366,008 | 15,742,516 | 800,835 | 615,569 | 232,361 | 16,338 | 8,305,440 | 530,640 | 207,979 | 500,810 | 1,240,901 | 21,557,870 | (28,015,326) | 43,101,941 |
| Long Term Assets | 6,001,471 | 8,093,276 | 74,405 | 82,022 | 43,521 | 548 | 609,629 | 16,370 | 12 | 500,719 | 1,232,525 | 548,900 | (255,906) | 16,947,492 |
| Bonds and securities | 112,592 | 931 | - | - | - | - | 367,176 | 15,158 | - | 4,103 | 1,740 | - | - | 501,700 |
| Other temporary investments | - | - | - | - | - | - | - | - | - | - | - | 26,802 | - | 26,802 |
| Customers | - | 117,432 | - | - | - | - | 198 | - | - | - | - | - | - | 117,630 |
| Judicial deposits | 86,744 | 381,382 | 65 | 58 | 7,250 | 548 | 50 | - | - | - | 14,678 | 141,062 | - | 631,837 |
| Sectoral financial assets | - | 109,045 | - | - | - | - | - | - | - | - | - | - | - | 109,045 |
| Account receivable related to concession | 843,443 | 1,560,022 | - | - | - | - | - | - | - | - | - | - | - | 2,403,465 |
| Contract Assets | 4,687,429 | 2,330,452 | 30,750 | - | - | - | - | - | - | 495,683 | - | - | (8,002) | 7,536,312 |
| Other non-current receivables | 82,658 | 26,154 | 43,580 | 2,508 | - | - | - | 600 | - | 933 | 1,215,995 | 19 | - | 1,372,447 |
| Income tax and social contribution | 106,733 | 20,003 | - | 1,301 | - | - | - | - | - | - | 71 | - | - | 128,108 |
| Deferred income tax and social contribution | - | 1,188,731 | - | 72,304 | 36,271 | - | - | - | - | - | - | 340,691 | - | 1,637,997 |
| Other non-current recoverable taxes | 81,830 | 2,359,124 | - | - | - | - | 152 | 612 | 12 | - | 41 | 40,131 | - | 2,481,902 |
| Prepaid expenses | 42 | - | 10 | - | - | - | - | - | - | - | - | 195 | - | 247 |
| Related parties | - | - | - | 5,851 | - | - | 242,053 | - | - | - | - | - | (247,904) | - |
| Investments | 8,930,704 | 532 | - | - | - | - | 2,808,443 | - | - | - | - | 20,991,553 | (29,295,552) | 3,435,680 |
| Property, plant and equipment, net | 5,271,756 | - | - | 339,674 | 188,793 | 1,876 | 4,863,720 | 312,210 | 202,707 | 5 | 568 | 7,709 | - | 11,189,018 |
| Intangible assets | 1,100,873 | 7,510,408 | 713,270 | 192,960 | 47 | 1,136 | 1,269 | 202,060 | 5,260 | 86 | 5,974 | 5,242 | 1,536,132 | 11,274,717 |
| Right to use an asset | 61,204 | 138,300 | 13,160 | 913 | - | 12,778 | 22,379 | - | - | - | 1,834 | 4,466 | - | 255,034 |
| TOTAL | 23,406,023 | 20,881,942 | 1,082,586 | 847,010 | 314,906 | 21,974 | 9,409,424 | 773,190 | 243,000 | 611,500 | 2,265,570 | 22,683,451 | (29,476,113) | 53,064,463 |
| |
| R$'000 | ||||||||||||||
| Assets - December-2022 | Geração e Transmissão | Distribuição | Compagas | Elejor | UEG Araucária | Serviços | Wind Farms | FDA | Bela Vista | Costa Oeste, Marumbi, Uirapuru | Mercado Livre | Holding | Eliminations | Consolidated |
| CURRENT | 1,647,236 | 4,937,240 | 282,714 | 224,833 | 97,587 | 6,075 | 937,476 | 376,804 | 26,828 | 94,931 | 990,867 | 1,180,872 | (1,476,214) | 9,327,249 |
| Cash and cash equivalents | 380,955 | 430,121 | 61,059 | 185,916 | 64,991 | 3,748 | 755,355 | 284,624 | 22,934 | 71,141 | 217,736 | 199,877 | - | 2,678,457 |
| Bonds and securities | - | - | - | - | - | - | - | - | - | - | - | 93 | - | 93 |
| Collaterals and escrow accounts | - | 90 | 67 | - | - | - | - | - | - | - | - | - | - | 157 |
| Customers | 389,967 | 2,429,434 | 128,589 | 23,272 | - | - | 97,594 | 88,764 | 2,997 | 7,184 | 475,170 | - | (300,921) | 3,342,050 |
| Dividends receivable | 352,718 | - | - | - | - | - | 45,676 | - | - | - | - | 824,143 | (1,084,207) | 138,330 |
| CRC transferred to the State of Paraná | - | - | - | - | - | - | - | - | - | |||||
| Sectorial financial assets | - | 190,699 | - | - | - | - | - | - | - | - | - | - | - | 190,699 |
| Account receivable related to concession | 8,603 | - | - | - | - | - | - | - | - | - | - | - | - | 8,603 |
| Contract Assets | 205,647 | - | - | - | - | - | - | - | - | 15,013 | - | - | - | 220,660 |
| Other current receivables | 137,224 | 408,462 | 49,518 | 12,237 | 5 | 2 | 5,616 | 2 | - | 66 | 292,962 | 977 | (9,691) | 897,380 |
| Inventories | 30,024 | 158,487 | 5,694 | 195 | - | 249 | - | - | - | 201 | - | - | - | 194,850 |
| Income tax and social contribution | 102,625 | 95,397 | 8,705 | 3,097 | 12,885 | 1,693 | 16,522 | 1,620 | 250 | 1,129 | 3,619 | 107,523 | - | 355,065 |
| Other current recoverable taxes | 11,312 | 1,178,192 | 28,505 | - | 19,705 | 241 | 120 | 1,225 | 16 | - | 378 | - | - | 1,239,694 |
| Prepaid expenses | 13,000 | 37,593 | 577 | 116 | - | 142 | 5,394 | 569 | 631 | 197 | 1,002 | 855 | - | 60,076 |
| Related parties | 15,162 | 8,765 | - | - | - | - | 11,199 | - | - | - | - | 47,404 | (81,395) | 1,135 |
| NON-CURRENT | 20,110,117 | 15,601,575 | 800,999 | 623,364 | 236,832 | 16,870 | 6,623,943 | 561,976 | 210,555 | 496,329 | 818,104 | 20,894,673 | (26,618,884) | 40,376,451 |
| Long Term Assets | 5,924,570 | 8,200,557 | 59,505 | 80,811 | 43,358 | 536 | 476,931 | 15,875 | 15 | 496,232 | 809,498 | 538,071 | (203,812) | 16,442,145 |
| Bonds and securities | 123,022 | 905 | - | - | - | - | 286,623 | 14,750 | - | 3,974 | 1,689 | - | - | 430,963 |
| Other temporary investments | - | - | - | - | - | - | - | - | - | - | - | 25,619 | - | 25,619 |
| Collaterals and escrow accounts | - | - | - | - | - | - | - | - | - | |||||
| Customers | - | 109,472 | - | - | - | - | 347 | - | - | - | - | - | - | 109,819 |
| CRC transferred to the State of Paraná | - | - | - | - | - | - | - | - | - | |||||
| Judicial deposits | 87,125 | 384,425 | 69 | 58 | 7,087 | 536 | 49 | - | - | - | 14,362 | 138,747 | - | 632,458 |
| Sectoral financial assets | - | 190,699 | - | - | - | - | - | - | - | - | - | - | - | 190,699 |
| Account receivable related to concession | 826,871 | 1,442,819 | - | - | - | - | - | - | - | - | - | - | - | 2,269,690 |
| Contract Assets | 4,607,214 | 2,332,171 | 30,032 | - | - | - | - | - | - | 490,785 | - | - | (8,183) | 7,452,019 |
| Other non-current receivables | 89,225 | 15,020 | 29,394 | 2,508 | - | - | - | 475 | - | 1,473 | 793,339 | 18 | - | 931,452 |
| Income tax and social contribution | 106,729 | 19,723 | - | 1,301 | - | - | - | - | - | - | 71 | - | - | 127,824 |
| Deferred income tax and social contribution | - | 1,203,057 | - | 71,094 | 36,271 | - | - | - | - | - | - | 333,877 | - | 1,644,299 |
| Other non-current recoverable taxes | 84,383 | 2,502,266 | - | - | - | - | 133 | 649 | 15 | - | 37 | 39,810 | - | 2,627,293 |
| Prepaid expenses | - | - | 10 | - | - | - | - | - | - | - | - | - | - | 10 |
| Related parties | - | - | - | 5,851 | - | - | 189,779 | - | - | - | - | - | (195,630) | - |
| Investments | 7,720,268 | 534 | - | - | - | - | 2,402,494 | - | - | - | - | 20,339,344 | (27,136,909) | 3,325,731 |
| Property, plant and equipment, net | 5,278,437 | - | - | 345,813 | 193,421 | 1,977 | 3,720,908 | 315,167 | 205,250 | 5 | 541 | 7,948 | - | 10,069,468 |
| Intangible assets | 1,126,526 | 7,257,827 | 726,107 | 195,778 | 53 | 1,263 | 1,104 | 230,934 | 5,288 | 92 | 6,193 | 4,724 | 721,837 | 10,277,727 |
| Right to use an asset | 60,316 | 142,657 | 15,387 | 962 | - | 13,094 | 22,506 | - | - | - | 1,872 | 4,586 | - | 261,380 |
| TOTAL | 21,757,353 | 20,538,815 | 1,083,713 | 848,198 | 334,418 | 22,946 | 7,561,419 | 938,779 | 237,382 | 591,260 | 1,808,971 | 22,075,545 | (28,095,099) | 49,703,700 |
| |
| Exhibit II-RESULT BY SUBSIDIARY > LIABILITIES BY COMPANY |
| R$'000 | ||||||||||||||
| Liabilities - March-23 | Geração e Transmissão | Distribuição | Compagas | Elejor | UEG Araucária | Serviços | Wind Farms | FDA | Bela Vista | Costa Oeste, Marumbi, Uirapuru | Mercado Livre | Holding | Eliminations | Consolidated |
| CURRENT | 1,966,477 | 4,342,958 | 395,791 | 112,442 | 46,340 | 915 | 693,782 | 75,273 | 5,119 | 36,577 | 791,816 | 369,376 | (1,474,333) | 7,362,533 |
| Social charges and accruals | 72,499 | 154,677 | 10,446 | 372 | 673 | - | 37 | - | 18 | - | 2,531 | 6,578 | - | 247,831 |
| Associated companies and parent company | 12,265 | 224,493 | - | - | - | - | 68,542 | 1,100 | 292 | 359 | 477 | 2,349 | (309,877) | - |
| Suppliers | 290,107 | 1,350,253 | 87,056 | 4,254 | 5,999 | 153 | 99,525 | 21,272 | 1,559 | 1,071 | 388,004 | 8,351 | (295,224) | 1,962,380 |
| Income Tax and Social Contribution payable | 22,658 | - | 5,730 | - | - | - | 10,666 | 37,601 | 1,113 | 597 | 3,138 | - | - | 81,503 |
| Other taxes | 26,255 | 285,312 | 14,389 | 1,317 | 272 | 2 | 14,813 | 5,939 | 177 | 245 | 17,530 | 1,289 | - | 367,540 |
| Loans and financing | 144,742 | 6,591 | - | - | - | - | 177,397 | - | - | 7,544 | - | - | - | 336,274 |
| Debentures | 952,184 | 460,910 | - | - | - | - | 55,320 | - | - | - | - | - | - | 1,468,414 |
| Dividends payable | 262,899 | 265,574 | 271,734 | - | 39,396 | - | 104,249 | - | 1,788 | 24,519 | 39,626 | 344,206 | (869,232) | 484,759 |
| Post employment benefits | 21,799 | 60,667 | - | - | - | - | - | - | - | - | 111 | 3,827 | - | 86,404 |
| Customer charges due | 11,608 | 29,032 | - | - | - | - | - | 1,527 | - | 171 | - | - | - | 42,338 |
| Research and development and energy efficiency | 87,840 | 284,277 | - | 1,627 | - | - | - | 847 | - | 1,556 | - | - | - | 376,147 |
| Payables related to concession | 1,934 | - | - | 103,294 | - | - | - | - | - | - | - | - | - | 105,228 |
| Sectorial financial liabilities | - | 208,178 | - | - | - | - | - | - | - | - | - | - | - | 208,178 |
| Other accounts payable | 13,777 | 47,721 | 3,097 | 187 | - | 759 | 146 | - | - | - | 111 | 456 | - | 66,254 |
| Other bills to pay | 45,910 | 149,952 | 3,339 | 1,391 | - | 1 | 163,087 | 6,987 | 172 | 515 | 340,288 | 2,320 | - | 713,962 |
| PIS and Cofins to be refunded to consumers | - | 815,321 | - | - | - | - | - | - | - | - | - | - | - | 815,321 |
| Provisions for litigation | - | - | - | - | - | - | - | - | - | - | - | - | - | - |
| NON-CURRENT | 8,228,241 | 9,776,022 | 103,742 | 769,004 | 16,747 | 13,242 | 2,986,999 | 69,133 | 3,511 | 50,737 | 984,468 | 870,251 | 63,304 | 23,935,401 |
| Associated companies and parent company | - | - | - | - | - | - | 228,498 | - | - | - | - | 5,851 | (234,349) | - |
| Suppliers | 125,339 | - | - | - | - | - | - | - | - | - | - | - | - | 125,339 |
| Deferred income tax and social contribution | 1,249,451 | - | 32,360 | - | - | - | 16,933 | 63,410 | 630 | 18,794 | 122,050 | - | 296,121 | 1,799,749 |
| Tax liabilities | 56,917 | 563,434 | - | - | 6,478 | 545 | - | - | - | - | 450 | 3,792 | - | 631,616 |
| Loans and financing | 2,191,744 | 750,690 | - | - | - | - | 2,147,306 | - | - | 24,028 | - | - | - | 5,113,768 |
| Debentures | 3,616,816 | 3,676,882 | - | - | - | - | 514,549 | - | - | - | - | - | - | 7,808,247 |
| Post-employment benefits | 302,104 | 655,908 | 9,632 | - | 932 | - | - | - | - | - | 3,349 | 22,929 | - | 994,854 |
| Research and development and energy efficiency | - | 242,006 | - | - | 7,945 | - | - | 5,723 | - | 552 | - | - | - | 256,226 |
| Payables related to the concession | 62,448 | - | - | 768,267 | - | - | - | - | - | - | - | - | - | 830,715 |
| Sectorial financial liabilities | - | 50,945 | - | - | - | - | - | - | - | - | - | - | - | 50,945 |
| Lease liability | 50,953 | 98,276 | 10,784 | 737 | - | 12,697 | 22,994 | - | - | - | 1,837 | 4,265 | - | 202,543 |
| Other payables | 48,350 | 8,227 | 34,783 | - | - | - | 51,303 | - | - | - | 856,191 | 25,249 | (24,102) | 1,000,001 |
| PIS/Cofins to be refunded to consumers | - | 1,231,291 | - | - | - | - | - | - | - | - | - | - | - | 1,231,291 |
| Provisions for litigation | - | 1,876,933 | - | - | - | - | - | - | - | - | - | - | - | 1,876,933 |
| EQUITY | 13,211,305 | 6,762,962 | 583,053 | (34,436) | 251,819 | 7,817 | 5,728,643 | 628,784 | 234,370 | 524,186 | 489,286 | 21,443,824 | (28,065,084) | 21,766,529 |
| Attributable to controlling shareholders | 13,211,305 | 6,762,962 | 583,053 | (34,436) | 251,819 | 7,817 | 5,728,643 | 628,784 | 234,370 | 524,186 | 489,286 | 21,443,824 | (28,387,789) | 21,443,824 |
| Capital | 6,242,757 | 5,359,206 | 220,966 | 35,503 | 425,662 | 15,085 | 5,272,534 | 409,509 | 223,913 | 239,000 | 237,210 | 10,800,000 | (18,681,345) | 10,800,000 |
| Advance for Future Capital Increase | - | 13,000 | - | - | - | 1,600 | 2,780 | - | - | - | - | - | (17,380) | - |
| Capital reserves | - | - | - | - | - | - | - | - | - | - | - | - | - | - |
| Equity valuation adjustments | 577,855 | 15,777 | (363) | 6,863 | 137 | (1) | - | - | - | - | (1,113) | 585,053 | (599,155) | 585,053 |
| Legal Reserves | 877,479 | 306,744 | 44,193 | - | - | - | 49,744 | 46,488 | 376 | 24,970 | 22,794 | 1,512,687 | (1,372,788) | 1,512,687 |
| Profit retention reserve | 4,241,625 | 928,545 | 292,334 | - | - | - | 569,195 | - | - | 222,819 | 123,934 | 7,911,295 | (6,378,452) | 7,911,295 |
| Additional proposed dividends | 842,153 | - | - | - | - | - | 68,365 | 107,172 | 5,363 | 17,297 | 35,957 | - | (1,076,307) | - |
| Accumulated profit | 429,436 | 139,690 | 25,923 | (76,802) | (173,980) | (8,867) | (233,975) | 65,615 | 4,718 | 20,100 | 70,504 | 634,789 | (262,362) | 634,789 |
| Attributable to noncontrolling interests | - | - | - | - | - | - | - | - | - | - | - | - | 322,706 | 322,706 |
| TOTAL | 23,406,023 | 20,881,942 | 1,082,586 | 847,010 | 314,906 | 21,974 | 9,409,424 | 773,190 | 243,000 | 611,500 | 2,265,570 | 22,683,451 | (29,476,113) | 53,064,463 |
| |
| R$'000 | ||||||||||||||
| Liabilities - December-22 | Geração e Transmissão | Distribuição | Compagas | Elejor | UEG Araucária | Serviços | Wind Farms | FDA | Bela Vista | Costa Oeste, Marumbi, Uirapuru | Mercado Livre | Holding | Eliminations | Consolidated |
| CURRENT | 2,077,931 | 3,970,515 | 419,277 | 111,142 | 45,115 | 881 | 490,273 | 297,517 | 4,622 | 34,551 | 790,165 | 390,708 | (1,476,100) | 7,156,597 |
| Social charges and accruals | 77,637 | 154,982 | 9,892 | 352 | 646 | - | 51 | - | 37 | - | 2,587 | 6,605 | - | 252,789 |
| Associated companies and parent company | 5,897 | 8,962 | - | - | - | - | 62,831 | 913 | 241 | 299 | 378 | 1,838 | (81,359) | - |
| Suppliers | 312,042 | 1,447,967 | 97,759 | 3,320 | 5,955 | 76 | 41,489 | 23,378 | 1,357 | 883 | 460,957 | 5,373 | (310,534) | 2,090,022 |
| Income Tax and Social Contribution payable | - | - | 12,534 | - | - | - | 7,371 | 130,875 | 254 | 546 | 4,611 | - | - | 156,191 |
| Other taxes | 35,711 | 182,308 | 24,641 | 1,345 | 358 | 30 | 6,604 | 5,516 | 248 | 247 | 17,908 | 28,690 | - | 303,606 |
| Loans and financing | 173,609 | 6,203 | - | - | - | - | 91,293 | - | - | 7,733 | - | - | - | 278,838 |
| Debentures | 923,657 | 373,634 | - | - | - | - | 49,056 | - | - | - | - | - | - | 1,346,347 |
| Dividends payable | 372,899 | 265,574 | 267,149 | - | 38,156 | - | 86,592 | 125,978 | 1,788 | 24,519 | 39,626 | 344,251 | (1,084,207) | 482,325 |
| Post employment benefits | 18,795 | 51,978 | - | - | - | - | - | - | - | - | 84 | 2,957 | - | 73,814 |
| Customer charges due | 14,914 | 29,032 | - | - | - | - | - | 2,343 | - | 199 | - | - | - | 46,488 |
| Research and development and energy efficiency | 83,566 | 284,305 | - | 1,467 | - | - | - | 826 | - | 80 | - | - | - | 370,244 |
| Payables related to concession | 1,918 | - | - | 103,085 | - | - | - | - | - | - | - | - | - | 105,003 |
| Sectorial financial liabilities | - | 433,914 | - | - | - | - | - | - | - | - | - | - | - | 433,914 |
| Other accounts payable | 10,777 | 48,882 | 3,580 | 169 | - | 774 | 145 | - | - | - | 107 | 436 | - | 64,870 |
| Other bills to pay | 46,509 | 132,247 | 3,722 | 1,404 | - | 1 | 144,841 | 7,688 | 697 | 45 | 263,907 | 558 | - | 601,619 |
| PIS and Cofins to be refunded to consumers | - | 550,527 | - | - | - | - | - | - | - | - | - | - | - | 550,527 |
| NON-CURRENT | 6,889,354 | 9,958,028 | 107,306 | 771,897 | 16,322 | 13,431 | 2,174,205 | 78,093 | 3,108 | 52,623 | 600,024 | 867,473 | (115,986) | 21,415,878 |
| Associated companies and parent company | - | - | - | - | - | - | 189,888 | - | - | - | - | 5,851 | (195,739) | - |
| Suppliers | 125,448 | - | - | - | - | - | - | - | - | - | - | - | - | 125,448 |
| Deferred income tax and social contribution | 1,188,192 | - | 36,200 | - | - | - | 10,632 | 73,025 | 416 | 17,838 | 99,217 | - | 92,162 | 1,517,682 |
| Tax liabilities | 55,695 | 566,826 | - | - | 6,331 | 536 | - | - | - | - | 427 | 3,676 | - | 633,491 |
| Loans and financing | 2,215,315 | 751,805 | - | - | - | - | 1,378,697 | - | - | 25,708 | - | - | - | 4,371,525 |
| Debentures | 2,304,860 | 3,642,973 | - | - | - | - | 509,675 | - | - | - | - | - | - | 6,457,508 |
| Post-employment benefits | 300,979 | 657,867 | 9,294 | - | 901 | - | - | - | - | - | 3,292 | 23,890 | - | 996,223 |
| Research and development and energy efficiency | 5,983 | 223,805 | - | - | 7,698 | - | - | 5,068 | - | 1,960 | - | - | - | 244,514 |
| Payables related to the concession | 61,437 | - | - | 771,102 | - | - | - | - | - | - | - | - | - | 832,539 |
| Sectorial financial liabilities | - | 49,341 | - | - | - | - | - | - | - | - | - | - | - | 49,341 |
| Lease liability | 52,848 | 100,659 | 12,421 | 795 | - | 12,895 | 23,030 | - | - | - | 1,865 | 4,373 | - | 208,886 |
| Other payables | 46,169 | 16,006 | 33,223 | - | - | - | 54,340 | - | - | - | 494,641 | 25,241 | (24,386) | 645,234 |
| PIS/Cofins to be refunded to consumers | - | 1,444,631 | - | - | - | - | - | - | - | - | - | - | - | 1,444,631 |
| Provision for allocation of PIS and Cofins credits | - | 1,851,257 | - | - | - | - | - | - | - | - | - | - | - | 1,851,257 |
| Provisions for litigation | 532,428 | 652,858 | 16,168 | - | 1,392 | - | 7,943 | - | 2,692 | 7,117 | 582 | 804,442 | 11,977 | 2,037,599 |
| EQUITY | 12,790,068 | 6,610,272 | 557,130 | (34,841) | 272,981 | 8,634 | 4,896,941 | 563,169 | 229,652 | 504,086 | 418,782 | 20,817,364 | (26,503,013) | 21,131,225 |
| Attributable to controlling shareholders | 12,790,068 | 6,610,272 | 557,130 | (34,841) | 272,981 | 8,634 | 4,896,941 | 563,169 | 229,652 | 504,086 | 418,782 | 20,817,364 | (26,816,874) | 20,817,364 |
| Capital | 6,242,757 | 5,359,206 | 220,966 | 35,503 | 425,662 | 15,085 | 4,685,823 | 409,509 | 223,913 | 239,000 | 237,210 | 10,800,000 | (18,094,634) | 10,800,000 |
| Advance for Future Capital Increase | - | - | - | - | - | 1,600 | 1,460 | - | - | - | - | - | (3,060) | - |
| Capital reserves | - | - | - | - | - | - | - | - | - | - | - | - | - | - |
| Equity valuation adjustments | 586,054 | 15,777 | (363) | 7,050 | 137 | (1) | - | - | - | - | (1,113) | 593,382 | (607,541) | 593,382 |
| Legal Reserves | 877,479 | 306,744 | 44,193 | - | - | - | 34,835 | 46,488 | 376 | 24,970 | 22,794 | 1,512,687 | (1,357,879) | 1,512,687 |
| Profit retention reserve | 4,241,625 | 928,545 | 292,334 | - | - | - | 382,719 | - | - | 222,819 | 123,934 | 7,911,295 | (6,191,976) | 7,911,295 |
| Additional proposed dividends | 842,153 | - | - | - | - | - | 68,365 | 107,172 | 5,363 | 17,297 | 35,957 | - | (1,076,307) | - |
| Accumulated profit | - | - | - | (77,394) | (152,818) | (8,050) | (276,261) | - | - | - | - | - | 514,523 | - |
| Attributable to noncontrolling interests | - | - | - | - | - | - | - | - | - | - | - | 313,861 | 313,861 | |
| TOTAL | 21,757,353 | 20,538,815 | 1,083,713 | 848,198 | 334,418 | 22,946 | 7,561,419 | 938,779 | 237,382 | 591,260 | 1,808,971 | 22,075,545 | (28,095,099) | 49,703,700 |
| |
| Exhibit III -ENERGY MARKET > DISTRIBUTION MARKET |
| Copel’s Total Market | Number of Customers / Agreements | Energy Sold (GWh) | |||||||||
| Mar-23 | Mar-22 | ∆% | 1Q23 | 1Q22 | ∆% | ||||||
| Copel DIS | 5,011,861 | 4,950,099 | 1.2 | 5,655 | 5,687 | (0.6) | |||||
| Captive Market | 5,011,555 | 4,949,803 | 1.2 | 5,150 | 5,319 | (3.2) | |||||
| Concessionariesand Licensees | 2 | 2 | - | 22 | 23 | (4.3) | |||||
| CCEE (Assigments MCSD EN) | 304 | 272 | 11.8 | 48 | 52 | (7.7) | |||||
| CCEE (MVE) | - | 22 | (100.0) | - | 173 | - | |||||
| CCEE (MCP) 2 | - | - | - | 435 | 120 | 262.5 | |||||
| Copel GeT | 389 | 311 | 25.1 | 4,560 | 4,496 | 1.4 | |||||
| CCEAR(Copel DIS) | 3 | 3 | - | 33 | 31 | 6.5 | |||||
| CCEAR(other concessionaries) | 101 | 101 | - | 569 | 567 | 0.4 | |||||
| Free Customers | - | 1 | - | - | - | - | |||||
| Bilateral Agreements (Copel Mercado Livre) | 273 | 191 | 42.9 | 3,492 | 3,692 | (5.4) | |||||
| Bilateral Agreements 1 | 12 | 15 | (20.0) | 153 | 150 | 2.0 | |||||
| CCEE (MCP) 2 | - | - | - | 313 | 56 | 458.9 | |||||
| Wind Farms Complex | 589 | 352 | 67.3 | 1,186 | 805 | 47.3 | |||||
| 15 | 6 | 150.0 | 22 | 8 | 175.0 | ||||||
| CCEAR(other concessionaries) | 541 | 328 | 64.9 | 560 | 318 | 76.1 | |||||
| CER | 10 | 10 | - | 226 | 226 | - | |||||
| Bilateral Agreements (Copel Mercado Livre) | 8 | 5 | 60.0 | 122 | 79 | 54.4 | |||||
| Bilateral Agreements | 15 | 3 | 400.0 | 144 | 102 | 41.2 | |||||
| CCEE (MCP) 2 | - | - | - | 112 | 72 | 55.6 | |||||
| Copel Mercado Livre | 1,690 | 1,665 | 1.5 | 5,893 | 6,165 | (4.4) | |||||
| Free Customers | 1,561 | 1,461 | 6.8 | 2,927 | 2,922 | 0.2 | |||||
| Bilateral Agreements (Group Companies) | - | 5 | - | - | 97 | - | |||||
| Bilateral Agreements | 129 | 199 | - | 2,820 | 3,080 | (8.5) | |||||
| CCEE (MCP) 2 | - | - | - | 146 | 66 | 121.4 | |||||
| Total Copel | 5,014,529 | 4,952,427 | 1.3 | 17,294 | 17,153 | 0.8 | |||||
| Eliminations (operations with Group companies) | 3,775 | 3,907 | |||||||||
| Total Consolidated Copel | 13,519 | 13,246 | 2.1 | ||||||||
| Note: Not considering the energy from MRE (Energy Relocation Mechanism) and the energy from TPP Araucária sold in the CCEE Spot Market. 1 Includes Short Term Sales Agreements and CBR 2 Assured Power allocated in the period, after impact of the GSF. CCEE: Electric Power Trade Chamber / CCEAR: Energy Purchase Agreements in the Regulated Market / MCP: Short Term Market / CER: Agreements Reserve Energy / MCSD EN - Mechanism for Compensation of Surpluses and Deficits of New Energy / MVE - MVE - Sale of energy to the free market through the Surplus Selling Mechanism. | |||||||||||
| Copel’s Dis Market | Number of Customers | Consumed Energy (GWh) | |||||||||
| Mar-23 | Mar-22 | ∆% | 1Q23 | 1Q22 | ∆% | ||||||
| Residential | 4,149,386 | 4,064,683 | 2.1 | 2,254 | 2,267 | (0.6) | |||||
| Industrial | 69,571 | 71,263 | (2.4) | 2,949 | 2,945 | 0.1 | |||||
| Captive | 68,411 | 70,230 | (2.6) | 474 | 516 | (8.1) | |||||
| Free | 1,160 | 1,033 | 12.3 | 2,475 | 2,428 | 1.9 | |||||
| Commercial | 433,318 | 424,952 | 2.0 | 1,697 | 1,705 | (0.5) | |||||
| Captive | 431,819 | 423,646 | 1.9 | 1,167 | 1,207 | (3.3) | |||||
| Free | 1,499 | 1,306 | 14.8 | 530 | 498 | 6.3 | |||||
| Rural | 329,308 | 338,409 | (2.7) | 680 | 744 | (8.6) | |||||
| Captive | 329,257 | 338,366 | (2.7) | 640 | 712 | (10.1) | |||||
| Free | 51 | 43 | 18.6 | 40 | 32 | 26.2 | |||||
| Others | 54,158 | 52,890 | 2.4 | 616 | 620 | (0.6) | |||||
| Captive | 54,146 | 52,878 | 2.4 | 614 | 618 | (0.6) | |||||
| Free | 12 | 12 | - | 2 | 2 | 11.1 | |||||
| Total Captive Market | 5,033,019 | 4,949,803 | 1.7 | 5,150 | 5,319 | (3.2) | |||||
| Total Free Market | 2,722 | 2,394 | 13.7 | 3,046 | 2,960 | 2.9 | |||||
| Supply to Concessionaries | 7 | 7 | - | 221 | 230 | (3.8) | |||||
| Total Grid Market | 5,035,748 | 4,952,204 | 1.7 | 8,418 | 8,510 | (1.1) | |||||
| Micro and Mini Distributed Energy Generation | 249709 | 129218 | 93.2463 | (431) | (273) | 57.9 | |||||
| Total Billed Market | 7,987 | 8,237 | (3.0) | ||||||||
| |
| Exhibit III -ENERGY MARKET > ELECTRICITY PURCHASED AND CHARGES |
| R$'000 | ||||||
| Electricity Purchased for Resale | 1Q23 | 1Q22 | Δ% | |||
| Purchase of energy in the regulated party - CCEAR | 925,468 | 870,197 | 6.4 | |||
| Itaipu Binacional | 212,917 | 350,166 | (39.2) | |||
| Câmara de Comercialização de Energia - CCEE | 99,546 | 69,949 | 42.3 | |||
| Micro and mini generators and customer repurchase | 249,169 | 179,481 | 38.8 | |||
| Proinfa | 91,413 | 110,487 | (17.3) | |||
| Bilateral Agreements | 451,943 | 573,826 | (21.2) | |||
| Fair value in the purchase and sale of energy | - | 21,834 | - | |||
| (-) PIS/Pasep and Cofins | (209,478) | (236,442) | (11.4) | |||
| TOTAL | 1,820,978 | 1,939,498 | (6.1) | |||
| R$'000 | ||||||
| Charges of the main distribution and transmission grid | 1Q23 | 1Q22 | Δ% | |||
| Itaipu transportation charges | 36,712 | 32,879 | 11.7 | |||
| System Service Charges - ESS | 4,039 | 329,524 | (98.8) | |||
| System usage charges | 583,144 | 436,603 | 33.6 | |||
| Charge reserve energy - EER | 138,655 | 62,279 | 122.6 | |||
| System usage charges - Provisions | 2,189 | - | - | |||
| (-) PIS / Pasep and Cofins taxes on charges for use of power grid | (77,170) | (86,311) | (10.6) | |||
| TOTAL | 687,569 | 774,974 | (11.3) |
| |
| Exhibit III -ENERGY MARKET > ENERGY BALANCE |
| (average MW) | |||||
| Energy Balance - Copel GET | 2023 | 2024 | 2025 | 2026 | 2027 |
| Own Resources GeT | 2,142 | 2,145 | 1,608 | 1,612 | 1,591 |
| GeT | 1,514 | 1,515 | 1,514 | 1,517 | 1,496 |
| GPS + Bela Vista + FDA | 628 | 630 | 95 | 95 | 95 |
| Own Resources SPP and Wind Farm | 392 | 392 | 392 | 392 | 392 |
| Purchases | 73 | 15 | 4 | - | - |
| TOTAL OWN RESOURCES + SOLD | 2,607 | 2,553 | 2,005 | 2,004 | 1,984 |
| TOTAL SOLD | 2,252 | 1,812 | 1,487 | 1,100 | 944 |
| Sales (Regulated) | 777 | 646 | 660 | 660 | 660 |
| Sales (Regulated) % | 30% | 26% | 33% | 33% | 34% |
| Sales (Free Market) | 1,475 | 1,166 | 827 | 440 | 284 |
| Sales (Free Market) % | 56% | 45% | 41% | 22% | 14% |
| Total Available | 381 | 757 | 538 | 921 | 1045 |
| Total Available (%) | 14% | 29% | 26% | 45% | 52% |
| Avarege price of energy sold (R$) | 210.24 | 190.96 | 195.18 | 205.92 | 213.36 |
| Reference: December/22 | |||||
| Note: Considers Assured Power updated by Ordinance No. 709/2022 for: FDA, Segredo, Salto Caxias and GPS. | |||||
| (1) Includes Mauá and Baixo Iguaçu Power Plants (proportional to the stake in the project) and GPS 30% (ex-CCGF). Does not include Elejor and Foz do Chopim. | |||||
| (2) Does not include Voltália Wind Complex. | |||||
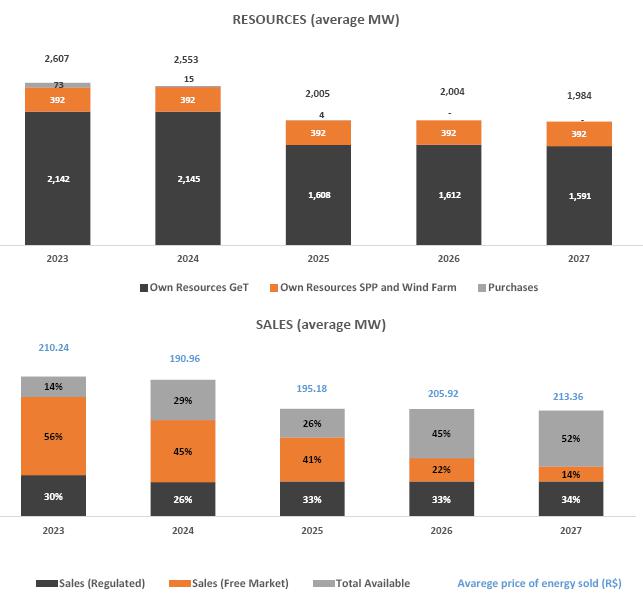
| Comments: 1- Excluding losses and internal consumption. 2- Considering the GFs of wind SPEs constant for all periods. 3- Considering the Sales of wind SPEs constant for all periods. 4- Considering energy purchases in each period. 5 - Prices updated according to the contractual readjustment index, from the reference dates until March/2022. 6 - The GPS CCGF RAG is not considered in the calculation of average prices. 7 - From 2025 disregards FDA. |
| |
| Exhibit III -ENERGY MARKET > TARIFFS |
| Supply Tariff (R$/MWh) | Amount | Mar-23 | Mar-22 | Δ% |
| Average MW | ||||
| Copel Geração e Transmissão | 275 | 240.22 | 217.97 | 10.2 |
| Auction CCEAR 2011 - 2040 ( HPP Mauá) | 102 | 278.14 | 252.48 | 10.2 |
| Auction CCEAR 2013 - 2042 (Cavernoso II) | 8 | 302.37 | 275.87 | 9.6 |
| Auction - CCEAR 2015 - 2044 (HPP Colíder) | 129 | 211.95 | 192.29 | 10.2 |
| Auction - CCAR 2018 - 2048 (HPP Baixo Iguaçu) | 37 | 221.22 | 202.37 | 9.3 |
| Auction - CCAR 2009 - 2016 (HPP Salto Caxias) | * | |||
| Copel Distribuição | ||||
| Concession holders in the State of Paraná | 15 | 262.70 | 235.12 | 11.7 |
| Total / Tariff Weighted Average Supply | 240.82 | 218.45 | 10.2 | |
| Contains PIS and COFINS. Net of ICMS. | ||||
| *Supply contract from May/2023. Quantity 179 average MW. | ||||
| Purchase Tariff - Copel Distribuição (R$/MWh) | Amount | Mar-23 | Mar-22 | Δ% |
| Average MW | ||||
| Itaipu 1 | 513 | 189.58 | 274.54 | (30.9) |
| Auction – CCEAR 2010 – H30 | 75 | 290.05 | 259.53 | 11.8 |
| Auction – CCEAR 2010 – T15 2 | 60 | 185.46 | 405.65 | (54.3) |
| Auction – CCEAR 2011 – H30 | 62 | 298.96 | 267.57 | 11.7 |
| Auction – CCEAR 2011 – T15 2 | 54 | 237.59 | 205.88 | 15.4 |
| Auction – CCEAR 2012 – T15 2 | 108 | 171.88 | 161.44 | 6.5 |
| Auction – CCEAR 2016 – T20 2 | 27 | 219.77 | 207.68 | 5.8 |
| Angra | 99 | 328.91 | 335.41 | (1.9) |
| CCGF 3 | 561 | 146.89 | 114.83 | 27.9 |
| Santo Antônio | 148 | 185.53 | 166.05 | 11.7 |
| Jirau | 247 | 163.25 | 146.11 | 11.7 |
| Others Auctions 4 | 782 | 207.59 | 208.42 | (0.4) |
| Total /Average Purchuse Tariff | 2,737 | 194.14 | 200.43 | (3.1) |
| Contains PIS and COFINS | ||||
| 1Furnas transport charge not included. | ||||
| 2 Average auction price restated according as bilateral payment to vendors. It does not include hiring effects recorded by the CCEE. | ||||
| 3 Contract of quotas of assured power of those HPPs which concessions were extended pursuant the new rules of Law 12783/13. | ||||
| 4 Products average price, does not include PROINFA. | ||||
| *The table has been updated for all periods as new calculation methodology for average prices, a result of the 4th phase of the Public Hearing 78/2011 Aneel approved on 03.28.2016. | ||||
| Retail Tariff - Copel Distribuição (R$/MWh) | Mar-23 | Mar-22 | Δ% | |
| Industrial | 503.86 | 533.92 | (5.6) | |
| Residential | 529.50 | 535.12 | (1.1) | |
| Commercial | 607.35 | 634.04 | (4.2) | |
| Rural | 571.89 | 590.01 | (3.1) | |
| Other | 410.91 | 405.3 | 1.4 | |
| Retail Tariffsupply average tariff | 586.37 | 592.33 | (1.0) | |
| Demand average tariff (R$/kW) | 30.08 | 29.7 | 1.3 | |
| Does not consider tariff flags, Pis/Pasep and net of ICMS. | ||||
| |
| Exhibit III -ENERGY MARKET > WIND POWER PRICES |
| Wind Farms - Sold | Auction ¹ | Price (R$)² | Amount MW average/year | Start ofSupply | End of Supply |
| São Bento Energia, Invest. e Part. S.A. | |||||
| GE Boa Vista S.A. | 2º LFA (08/26/2010) | 293.17 | 5.70 | 01.01.2013 | 12.31.2032 |
| GE Farol S.A. | 284.63 | 9.10 | |||
| GE Olho D’Água S.A. | 284.63 | 14.90 | |||
| GE São Bento do Norte S.A. | 284.63 | 14.00 | |||
| Copel Brisa Potiguar S.A. | |||||
| Nova Asa Branca I Energias Renováveis S.A. | 2º LFA (08/26/2010) | 287.67 | 13.20 | 01.01.2013 | 12.31.2032 |
| Nova Asa Branca II Energias Renováveis S.A. | 287.67 | 12.80 | |||
| Nova Asa Branca III Energias Renováveis S.A. | 287.67 | 12.50 | |||
| Nova Eurus IV Energias Renováveis S.A. | 287.67 | 13.70 | |||
| Santa Maria Energias Renováveis S.A. | 4º LER (08/18/2011) | 202.73 | 15.70 | 07.01.2014 | 06.30.2034 |
| Santa Helena Energias Renováveis S.A. | 202.73 | 16.00 | |||
| Ventos de Santo Uriel S.A. | 201.16 | 9.00 | |||
| Cutia | |||||
| UEE Cutia S.A. | 6º LER (10/31/2014) | 238.47 | 9.60 | 10.01.2017 | 09.30.2037 |
| UEE Esperança do Nordeste S.A. | 238.47 | 9.10 | |||
| UEE Guajiru S.A. | 238.47 | 8.30 | |||
| UEE Jangada S.A. | 238.47 | 10.30 | |||
| UEE Maria Helena S.A. | 238.47 | 12.00 | |||
| UEE Paraíso dos Ventos do Nordeste S.A. | 238.47 | 10.60 | |||
| UEE Potiguar S.A. | 238.47 | 11.30 | |||
| Bento Miguel | |||||
| CGE São Bento do Norte I S.A. | 20ª LEN (11/28/2014) | 225.88 | 9.70 | 01.01.2019 | 12.31.2038 |
| CGE São Bento do Norte II S.A. | 225.88 | 10.00 | |||
| CGE São Bento do Norte III S.A. | 225.88 | 9.60 | |||
| CGE São Miguel I S.A. | 225.88 | 8.70 | |||
| CGE São Miguel II S.A. | 225.88 | 8.40 | |||
| CGE São Miguel III S.A. | 225.88 | 8.40 | |||
| Vilas | |||||
| Vila Ceará I (Antiga Vila Paraíba IV) | 28ª LEN (08/31/2018) | 121.46 | 8.20 | 01.01.2024 | 12.31.2043 |
| Vila Maranhão I | 121.46 | 8.30 | |||
| Vila Maranhão II | 121.46 | 8.30 | |||
| Vila Maranhão III (Antiga Vila Paraíba III) | 121.46 | 8.20 | |||
| Vila Mato Grosso (Antiga Vila Alagoas III) | 29ª LEN (06/28/2019) | 101.32 | 3.30 | 01.01.2023 | 12.31.2042 |
| Jandaira | |||||
| Jandaira I | 30ª LEN (10/18/2019) | 123.90 | 1.60 | 01.01.2025 | 12.31.2044 |
| Jandaira II | 123.90 | 4.10 | |||
| Jandaira III | 123.90 | 4.40 | |||
| Jandaira IV | 123.90 | 4.30 | |||
| Aventura | |||||
| Aventura II | 26º LEN (20/12/2017) | 130.98 | 11.70 | 01.01.2023 | 12.31.2042 |
| Aventura III | 130.98 | 12.80 | |||
| Aventura IV | 130.98 | 14.10 | |||
| Aventura V | 130.98 | 15.00 | |||
| Santa Rosa & Mundo Novo | |||||
| Santa Rosa & Mundo Novo I | 26º LEN (20/12/2017) | 133.68 | 16.50 | 01.01.2023 | 12.31.2042 |
| Santa Rosa & Mundo Novo II | 133.68 | 17.00 | |||
| Santa Rosa & Mundo Novo III | 133.68 | 18.00 | |||
| Santa Rosa & Mundo Novo IV | 133.68 | 7.50 | |||
| Santa Rosa & Mundo Novo V | 133.68 | 8.10 | |||
| Voltália3 | |||||
| Carnaúbas | 04ª LER (08/18/2011) | 196.65 | 13.10 | 07.01.2014 | 06.30.2034 |
| Reduto | 196.65 | 13.90 | |||
| Santo Cristo | 196.65 | 14.80 | |||
| São João | 196.65 | 14.30 | |||
| ¹LFA - Alternative Sources Auction/LER - Reserve Energy Auction/LEN - New Energy Auction. | |||||
| ² Price updated by IPCA until Mar/2023 (Reference Apr/23). Source: CCEE | |||||
| 3 Values presented refer to 100% of the Complex. Copel has a 49% stake in the project. | |||||
| |
| Exhibit III -ENERGY MARKET > ENERGY FLOW |
| GWh | ||||||||||||
| Energy Flow | COPEL DIS | COPEL GET + FDA + BELA VISTA | WIND POWER | COPEL COM | ELIMINATIONS | CONSOLIDATED | ||||||
| 1Q23 | 1Q22 | 1Q23 | 1Q22 | 1Q23 | 1Q22 | 1Q23 | 1Q22 | 1Q23 | 1Q22 | 1Q23 | 1Q22 | |
| Own Generation | - | - | 5,498 | 3,071 | 932 | 492 | - | - | - | - | 6,430 | 3,563 |
| Purchased energy | 6,137 | 6,328 | 47 | 1,680 | 106 | 108 | 5,893 | 6,165 | 3,775 | 3,907 | 8,408 | 10,374 |
| Copel Mercado Livre | - | - | - | 97 | 106 | - | - | - | 106 | 97 | - | - |
| Companies of the group | 55 | 39 | - | - | - | - | 3,614 | 3,771 | 3,669 | 3,810 | - | - |
| Itaipu | 1,174 | 1,300 | - | - | - | - | - | - | - | - | 1,174 | 1,300 |
| Auction – CCEAR | 3,358 | 3,080 | - | - | - | - | - | - | - | - | 3,358 | 3,080 |
| CCEE (MCP) | - | - | - | - | - | - | - | - | - | - | - | - |
| Angra | 215 | 229 | - | - | - | - | - | - | - | - | 215 | 229 |
| CCGF | 1,216 | 1,484 | - | - | - | - | - | - | - | - | 1,216 | 1,484 |
| Proinfa | 101 | 99 | - | - | - | - | - | - | - | - | 101 | 99 |
| Other (1) | 18 | 97 | - | - | - | 108 | 2,269 | 2,394 | - | - | 2,287 | 2,599 |
| Elejor | - | - | - | - | - | - | 10 | - | - | 10 | - | |
| Dona Francisca | - | - | 33 | 33 | - | - | - | - | - | - | 33 | 33 |
| MRE Receipt | - | - | 14 | 1,550 | - | - | - | - | - | - | 14 | 1,550 |
| Avaiable | 6,137 | 6,328 | 5,545 | 4,751 | 1,038 | 600 | 5,893 | 6,165 | 3,775 | 3,907 | 14,838 | 13,937 |
| Captive Market | 5,150 | 5,319 | - | - | - | - | - | - | 5,150 | 5,319 | ||
| Concessionaires (2) | 22 | 23 | - | - | - | - | - | - | 22 | 23 | ||
| CCEE concessionaire supply (3) | - | - | 47 | 42 | - | - | - | - | - | - | 47 | 42 |
| CCEE (MCSD EN Assignments) (4) | 48 | 52 | - | - | - | - | - | - | 48 | 52 | ||
| CCEE (MVE) (5) | - | 173 | - | - | - | - | - | - | - | 173 | ||
| CCEE (MCP) (6) | 435 | 120 | 313 | 56 | 112 | 72 | 146 | 66 | - | - | 1,006 | 314 |
| Free Customers | - | - | - | - | - | - | 2,927 | 2,922 | - | - | 2,927 | 2,922 |
| Bilateral Agreements | - | - | 106 | 108 | 144 | 102 | 2,714 | 3,080 | - | - | 2,964 | 3,290 |
| Auction – CCEAR (7) | - | - | 569 | 567 | 560 | 318 | - | - | - | - | 1,129 | 885 |
| MRE assignment (8) | - | - | 985 | 255 | - | - | - | - | - | - | 985 | 255 |
| CER (9) | - | - | 226 | 226 | - | - | - | - | 226 | 226 | ||
| Copel Mercado Livre | - | - | 3,492 | 3,692 | 122 | 79 | - | - | 3,614 | 3,771 | - | - |
| Companies of the group | - | - | 33 | 31 | 22 | 8 | 106 | 97 | 161 | 136 | - | - |
| Losses and Differences (10) | 482 | 641 | - | - | (148) | (205) | - | - | - | - | 334 | 436 |
| Basic network losses | 135 | 181 | - | - | - | - | - | - | - | - | 135 | 181 |
| Distribution losses | 281 | 378 | - | - | - | - | - | - | - | - | 281 | 378 |
| CG contract allocation (11) | 66 | 82 | - | - | - | - | - | - | - | - | 66 | 82 |
| - | - | - | - | (148) | (205) | - | - | - | - | (148) | (205) | |
| (1) Others: Energy purchased by Copel Comercialização. Includes MCSD EM Assignments of Copel Distribuição (purchase) | ||||||||||||
| (2) Energy supply to concessionaires and licensees with their own market below 500GWh/year | ||||||||||||
| (3) Supply of energy to CCEE's agent distributor, through a Regulated Bilateral Contract Agreement - CBR | ||||||||||||
| (4) Assignments MCSD EN - Contractual assignments to other distributors through the New Energy Surplus and Deficit Compensation Mechanism | ||||||||||||
| (5) CCEE (MVE): Financial settlement of energy surpluses from the distributor to the free market through the Surplus Sale Mechanism | ||||||||||||
| (6) CCEE (MCP): Electric Energy Commercialization Chamber (Spot Market). | ||||||||||||
| (7) CCEAR: Energy Trading Agreement in the Regulated Environment. | ||||||||||||
| (8) MRE: Energy Reallocation Mechanism. | ||||||||||||
| (9) CER: Reserve Energy Contract. | ||||||||||||
| (10) Considers the effects ofMini and Micro Distributed Generation (MMGD). | ||||||||||||
| (11) CG: Submarket Center of Gravity (difference between billed and received energy at the CG). | ||||||||||||
| It does not consider the energy produced by UTE Araucária sold on the spot market (MCP). | ||||||||||||
| |
| Exhibit III -ENERGY MARKET > ENERGY FLOW |
| ENERGY FLOW CONSOLIDATED 1Q23 |

| Notes: |
| CCEAR: Energy Purchase Agreements in the Regulated Market. |
| CER: Reserve Energy Agreements. |
| MRE: Energy Reallocation Mechanism. |
| CCEE (MCP): Electric Power Trade Chamber (Short-term market). |
| CG: Center of gravity of the Submarket (difference between billed and energy received from CG). |
| ¹ Other: Energy purchased by Copel Comercialização and Copel Distribuição |
| 2 Electricity sales to concessionaries and licensees with own market of less than 500GWh/year |
| 3 Eletricity sales to the agent distributor of CCEE through a Regulated Bilateral Contract - CBR |
| 4 Assignments MCSD EN - Contractual assignments to other distributors through the Mechanism for Compensation of Surpluses and Deficits (MCSD) |
| 5 Considers the effect of Distributed Mini and Microgeneration (MMGD) |
| 6 Considers losses and the volume of energy not delivered, referring to availability contracts, which provide for subsequent reimbursement. |
| It does not consider the energy produced by TPP Araucária sold in the MCP (Short Term Market) or through bilateral contracts. |
| |
| Exhibit IV -OPERATIONAL DATA > INDICATORS SUMMARY |
| MANAGEMENT | ||||||
| Copel Staff List | 2018 | 2019 | 2020 | 2021 | 2022 | Mar-23 |
| Geração e Transmissão | 1,660 | 1,620 | 1,533 | 1,523 | 1,487 | 1,490 |
| Distribuição | 5,364 | 4,964 | 4,641 | 4,430 | 4,257 | 4,246 |
| Telecomunicações | 478 | 412 | 355 | 0 | 0 | 0 |
| Holding | 75 | 61 | 96 | 169 | 84 | 84 |
| Comercialização | 34 | 38 | 42 | 44 | 47 | 43 |
| Serviços | - | - | - | 217 | - | 0 |
| TOTAL | 7,611 | 7,095 | 6,667 | 6,383 | 5,875 | 5,863 |
| Cotrolated Staff List | 2018 | 2019 | 2020 | 2021 | 2022 | Mar-23 |
| Compagás | 159 | 148 | 142 | 133 | 132 | 132 |
| UEG Araucária | 17 | 16 | 17 | 15 | 15 | 14 |
| Elejor | 7 | 7 | 7 | 7 | 7 | 7 |
| GENERATION | ||||||
| Copel GET | Amount | Installed Capacity (MW) | Assured Power (Average MW) | |||
| Hydroelectric | 18 | 4,868.5 | 2,067.9 | |||
| Thermoelectric | 1 | 20.0 | 17.7 | |||
| Wind | 43 | 1,130.2 | 561.3 | |||
| Copel GET (Interest) | ||||||
| Hydroelectric | 3 | 299.6 | 155.2 | |||
| Thermoelectric | 1 | 294.8 | 162.6 | |||
| Total Copel GET | 66 | 6,613.1 | 2,964.7 | |||
| Other Interest Copel | ||||||
| Hydroelectric | 5 | 201.3 | 109.7 | |||
| Thermoelectric | 1 | 98.3 | 54.2 | |||
| Wind | 4 | 52.9 | 28.0 | |||
| Solar | 1 | 1.1 | - | |||
| Total Other Interest | 11 | 353.6 | 191.9 | |||
| TOTAL Copel Group | 77.0 | 6,966.7 | 3,156.6 | |||
| TRANSMISSION | ||||||
| Copel GeT | Amount | APR (R$ million) | ||||
| Transmission Lines (km) | 3,705 | 904.8 | ||||
| Substation (amount) | 43 | |||||
| Interest | Amount | Proporcional APR (R$ million) | ||||
| Transmission Lines (km) | 5,980 | 490.9 | ||||
| Substation (amount) | 8 | |||||
| TOTAL | TL | 9,685 | 1,395.7 | |||
| Substation | 51 | |||||
| DISTRIBUTION | ||||||
| Distribution lines (km) | 208,133 | Captive customers | 5,011,555 | |||
| Substations | 389 | Customers by distribution employee | 1,177 | |||
| Installed power substations (MVA) | 11,686 | DEC (in hundredths of an hour and minute) | 2.35 | |||
| Municipalities served | 395 | FEC (number of outages) | 1.64 | |||
| Locations served | 1,068 | |||||
| MERCADO LIVRE | ||||||
| Number of contracts | 1,690 | |||||
| Energy sold (GWh) | 5,893 | |||||
| |
| Exhibit IV -OPERATIONAL DATA > GENERATION |
| COPEL GET | ||||
| Installed Capacity (MW) | Assured Power (Average MW) | Generation 1Q23 (GWh)* | Concession Expires | |
| Hydroelectric Power Plants | 4,868.5 | 2,067.9 | 5,325.3 | |
| Large hydroelectric power plant (HPP) | 4,801.8 | 2,025.4 | 5,227.5 | |
| Gov. Bento Munhoz da Rocha Netto (Foz do Areia)(5) | 1,676.0 | 575.3 | 1,603.4 | 12.21.2024 |
| Gov. Ney Aminthas de B. Braga (Segredo)(5) | 1,260.0 | 558.3 | 1,472.2 | 09.25.2032 |
| Gov. José Richa (Salto Caxias)(5) | 1,240.0 | 575.4 | 1,354.2 | 03.20.2033 |
| Gov. Parigot de Souza (1)(5) | 260.0 | 103.6 | 298.5 | 01.03.2053 |
| - Regime de Cotas (70%) | 182.0 | 72.5 | 208.9 | |
| - Copel GeT(30%) | 78.0 | 31.1 | 89.5 | |
| Colíder(5) | 300.0 | 178.1 | 412.9 | 01.30.2046 |
| Guaricana(5) | 36.0 | 16.1 | 59.5 | 07.21.2028 |
| Bela Vista(2) | 29.8 | 18.6 | 26.9 | 01.02.2041 |
| Small hydroelectric power station (SHP) | 57.1 | 37.3 | 89.2 | |
| Cavernoso (5) | 1.3 | 1.0 | 0.3 | 06.23.2033 |
| Cavernoso II(5) | 19.0 | 10.6 | 25.2 | 12.06.2050 |
| Chaminé (5) | 18.0 | 11.6 | 31.1 | 08.02.2028 |
| Apucaraninha (5) | 10.0 | 6.7 | 16.2 | 01.27.2027 |
| Derivação do Rio Jordão (5) | 6.5 | 5.9 | 12.4 | 06.21.2032 |
| São Jorge (5) | 2.3 | 1.5 | 4.0 | 07.24.2026 |
| hydroelectric power plant (HPP) | 9.6 | 5.2 | 8.6 | |
| Marumbi | 4.8 | 2.4 | 4.8 | (6) |
| Chopim I | 2.0 | 1.5 | 0.0 | (3) |
| Melissa | 1.0 | 0.6 | 1.3 | (3) |
| Salto do Vau | 0.9 | 0.6 | 1.7 | (3) |
| Pitangui | 0.9 | 0.1 | 0.8 | (3) |
| Thermal Power Plant | 20.0 | 10.3 | 14.7 | |
| Figueira | 20.0 | 17.7 | 14.7 | 03.27.2019 |
| Wind Power Plants | 1,130.2 | 561.3 | 932.6 | |
| Eólica de Palmas (4) | 2.5 | 0.4 | 0.3 | 09.29.2029 |
| São Bento Energia, Invest. e Part. S.A. | 94.0 | 38.1 | 67.0 | |
| GE Boa Vista S.A. | 14.0 | 5.2 | 7.4 | 04.28.2046 |
| GE Farol S.A. | 20.0 | 8.8 | 14.0 | 04.20.2046 |
| GE Olho D’Água S.A. | 30.0 | 12.8 | 23.6 | 06.01.2046 |
| GE São Bento do Norte S.A. | 30.0 | 11.3 | 22.0 | 05.19.2046 |
| Copel Brisa Potiguar S.A. | 183.6 | 89.4 | 126.3 | |
| Nova Asa Branca I Energias Renováveis S.A. | 27.0 | 12.1 | 18.3 | 04.25.2046 |
| Nova Asa Branca II Energias Renováveis S.A. | 27.0 | 11.9 | 18.0 | 05.31.2046 |
| Nova Asa Branca III Energias Renováveis S.A. | 27.0 | 12.3 | 15.3 | 05.31.2046 |
| Nova Eurus IV Energias Renováveis S.A. | 27.0 | 12.4 | 17.6 | 04.27.2046 |
| Santa Maria Energias Renováveis S.A. | 29.7 | 15.7 | 21.6 | 05.08.2047 |
| Santa Helena Energias Renováveis S.A. | 29.7 | 16.0 | 23.2 | 04.09.2047 |
| Ventos de Santo Uriel S.A. | 16.2 | 9.0 | 12.3 | 04.09.2047 |
| Complexo Eólico Cutia | 180.6 | 71.4 | 131.0 | |
| UEE Cutia S.A. | 23.1 | 9.6 | 16.8 | 01.05.2042 |
| UEE Esperança do Nordeste S.A. | 27.3 | 9.1 | 15.7 | 05.11.2050 |
| UEE Guajiru S.A. | 21.0 | 8.3 | 14.1 | 01.05.2042 |
| UEE Jangada S.A. | 27.3 | 10.3 | 21.7 | 01.05.2042 |
| UEE Maria Helena S.A. | 27.3 | 12.0 | 20.9 | 01.05.2042 |
| UEE Paraíso dos Ventos do Nordeste S.A. | 27.3 | 10.6 | 20.8 | 05.11.2050 |
| UEE Potiguar S.A. | 27.3 | 11.5 | 20.9 | 05.11.2050 |
| Complexo Eólico Bento Miguel | 132.3 | 58.7 | 90.8 | |
| CGE São Bento do Norte I S.A. | 23.1 | 10.1 | 16.6 | 08.04.2050 |
| CGE São Bento do Norte II S.A. | 23.1 | 10.8 | 18.5 | 08.04.2050 |
| CGE São Bento do Norte III S.A. | 23.1 | 10.2 | 16.1 | 08.04.2050 |
| CGE São Miguel I S.A. | 21.0 | 9.3 | 13.8 | 08.04.2050 |
| CGE São Miguel II S.A. | 21.0 | 9.1 | 13.0 | 08.04.2050 |
| CGE São Miguel III S.A. | 21.0 | 9.2 | 12.8 | 08.04.2050 |
| Complexo Eólico Vilas (8) | 186.7 | 98.6 | 164.0 | |
| Vila Ceará I (Antiga Vila Paraíba IV) | 32.0 | 17.8 | 28.7 | 01.14.2054 |
| Vila Maranhão I | 32.0 | 17.8 | 29.9 | 01.11.2054 |
| Vila Maranhão II | 32.0 | 17.8 | 30.2 | 01.14.2054 |
| Vila Maranhão III (Antiga Vila Paraíba III) | 32.0 | 16.6 | 28.0 | 01.14.2054 |
| Vila Mato Grosso (Antiga Vila Alagoas III) | 58.9 | 28.6 | 47.2 | 12.06.2054 |
| Complexo Jandaira | 90.1 | 46.9 | 76.1 | |
| Jandaira I | 10.4 | 5.6 | 9.9 | 04.02.2055 |
| Jandaira II | 24.3 | 12.3 | 21.2 | 04.02.2055 |
| Jandaira III | 27.7 | 14.8 | 21.4 | 04.02.2055 |
| Jandaira IV | 27.7 | 14.2 | 23.6 | 04.02.2055 |
| Aventura 9 | 105.0 | 65.0 | 107.3 | |
| Aventura II | 21.0 | 13.1 | 21.0 | 06.05.2053 |
| Aventura III | 25.2 | 15.5 | 25.2 | 06.11.2053 |
| Aventura IV | 29.4 | 18.5 | 31.3 | 06.05.2053 |
| Aventura V | 29.4 | 17.9 | 29.8 | 06.05.2053 |
| Santa Rosa e Mundo Novo 9 | 155.4 | 92.8 | 169.8 | |
| Santa Rosa e Mundo Novo I | 33.6 | 17.3 | 30.8 | 06.04.2053 |
| Santa Rosa e Mundo Novo II | 29.4 | 17.2 | 35.3 | 06.04.2053 |
| Santa Rosa e Mundo Novo III | 33.6 | 21.5 | 38.7 | 06.04.2053 |
| Santa Rosa e Mundo Novo IV | 33.6 | 21.0 | 38.9 | 06.01.2053 |
| Santa Rosa e Mundo Novo V | 25.2 | 15.8 | 26.1 | 06.01.2053 |
| TOTAL | 6,018.7 | 2,639.5 | 6,272.6 | |
| (1) RAG of R$155.9 million, updated by Aneel's Resolution No. 3,068, of June 12, 2022. (2) In partial operation, entry into commercial operation of the fourth generating unit scheduled for 2022. (3) Power plants exempted from concession, are only registered with ANEEL. (4) Assured power considered the average wind generation. (5) Extension of Grant according to REH 2919/2021 and 2932/2021. (6) Under approval by ANEEL. | (7) Assured Power updated by Ordinance N°709/2022 for: FDA, Segredo, Salto Caxias and GPS, effective from January/2023. (8) Started up in test operation on 04/25/2022, according to ANEEL Dispatch No. 1047/2022. In commercial operation since 12/07/2022, by ANEEL order No. 2502/2022. (9) Complexes Aventura and Santa Rosa & Novo Mundo joined the Company's portfolio in Jan/23. * Considers internal consumption of generators and generation in commercial operation. ** Plant do not participate in the MRE. | |||
| |
| Exhibit IV -OPERATIONAL DATA > GENERATION |
| INTEREST | ||||||
| Enterprise | Partners | Installed Capacity (MW) | Assured Power 2 (Average MW) | Proportional installed capacity (MW) | Proporcional Assured Power (Average MW) | Concession Expires |
| Hydroelectric Power Plants | 1,111.7 | 586.8 | 500.9 | 264.9 | ||
| Large hydroelectric power plant (HPP) | 1,076.5 | 561.5 | 486.2 | 254.2 | ||
| HPP Mauá (Consórcio Energético Cruzeiro do Sul) | COPEL GeT - 51% Eletrosul - 49% | 361.0 | 188.5 | 184.1 | 96.1 | 05.27.2047 |
| HPP Baixo Iguaçu (Consórcio Empreendedor Baixo Iguaçu) | COPEL GeT - 30% Geração Céu Azul - 70% | 350.2 | 172.4 | 105.1 | 51.7 | 12.03.2049 |
| HPP Santa Clara (Elejor) | COPEL - 70% Paineira Participações - 30% | 120.2 | 66.0 | 84.2 | 46.2 | 06.11.2040 |
| HPP Fundão (Elejor) | COPEL - 70% Paineira Participações - 30% | 120.2 | 62.1 | 84.1 | 43.5 | 06.11.2040 |
| HPP Dona Francisca (DFESA) | COPEL - 23,03% Gerdau - 51,82% Celesc - 23,03% Statkraft - 2,12% | 125.0 | 72.5 | 28.8 | 16.7 | 09.21.2037 |
| Small hydroelectric power station (SHP) | 35.2 | 25.3 | 14.7 | 10.7 | ||
| SHP Santa Clara I (Elejor) | COPEL - 70% Paineira Participações - 30% | 3.6 | 2.8 | 2.5 | 2.0 | 12.19.2032 |
| SHP Fundão I (Elejor) | COPEL - 70% Paineira Participações - 30% | 2.5 | 2.1 | 1.7 | 1.5 | 12.19.2032 |
| SHP Arturo Andreoli 2 (Foz do Chopim) | COPEL GeT - 35,77% Silea Participações - 64,23% | 29.1 | 20.4 | 10.4 | 7.3 | 08.15.2032 |
| Thermal Power Plant | 484.2 | 267.0 | 393.1 | 216.8 | ||
| TPP Araucária 1 (UEG Araucária) | COPEL - 20,3% COPEL GeT - 60,9% Petrobras - 18,8% | 484.2 | 267.0 | 393.1 | 216.8 | 12.23.2029 |
| Wind Power Plants | 108.0 | 57.1 | 52.9 | 28.0 | ||
| Voltalia - São Miguel do Gostoso (5 parques) | COPEL- 49% Voltalia-51% | 108.0 | 57.1 | 52.9 | 28.0 | 03.26.2047 |
| Solar | 2.3 | - | 1.1 | - | ||
| Solar Paraná 3 | COPEL - 49% | 2.3 | - | 1.1 | - | 09.15.2046 |
| TOTAL | 1,706.2 | 910.9 | 948.0 | 509.7 | ||
| 1Since February 1, 2014, the plant’s operation has been under the responsibility of UEGA. The Araucária TPP does not have availability agreements and operates under the merchant model. Assured power pursuant to Ordinance SPE/MME 05/2021. The most recent data from SIGA/ANEEL indicate aAssured power of 267 MW. | ||||||
| 2 Assured power updated by Ordinance No. 709/2022 of: HPP Mauá, Santa Clara, Fundão and Dona Francisca, effective from January/2023. | ||||||
| 3 Holding of 6 SCPs operating in the field of distributed generation (photovoltaic plants): Pharma Solar II, Pharma Solar III, Pharma Solar IV, in commercial operation, e Bandeirantes Solar I, Bandeirantes Solar II e Bandeirantes Solar III, in pre-operational. | ||||||
| |
| Exhibit IV -OPERATIONAL DATA > TRANSMISSION |
| Subsidiary / SPC | Contract | Enterprise | TL | APR ¹ (R$ milhões) | Concession Expiration | ||
| Extension (km)2 | Amount | MVA | |||||
| Copel GeT | 060/20013 | Several | 2,129 | 33 | 12,440 | 527.9 | 01.01.2043 |
| Copel GeT | 075/20014 | TL Bateias - Jaguariaiva | 138 | - | - | 17.6 | 08.17.2031 |
| Copel GeT | 006/2008 | TL Bateias - Pilarzinho | 32 | - | - | 3.4 | 03.17.2038 |
| Copel GeT | 027/2009 | TL Foz - Cascavel Oeste | 117 | - | - | 15.4 | 11.19.2039 |
| Copel GeT | 010/2010 | TL Araraquara II — Taubaté | 334 | - | - | 41.9 | 10.06.2040 |
| Copel GeT | 015/2010 | SE Cerquilho III | - | 1 | 300 | 6.7 | 10.06.2040 |
| Copel GeT | 022/2012 | TL Foz do Chopim - Salto Osório LT Londrina - Figueira | 102 | - | - | 7.5 | 08.27.2042 |
| Copel GeT | 002/2013 | TL Assis — Paraguaçu Paulista II | 83 | 1 | 150 | 11.8 | 02.25.2043 |
| Copel GeT | 005/2014 | TL Bateias - Curitiba Norte | 31 | 1 | 300 | 12.4 | 01.29.2044 |
| Copel GeT | 021/2014 | TL Foz do Chopim - Realeza | 52 | 1 | 300 | 12.5 | 09.05.2044 |
| Copel GeT | 022/2014 | TL Assis – Londrina | 122 | - | - | 26.1 | 09.05.2044 |
| Copel GeT | 006/165 | Lot E: TL Baixo Iguaçu - Realeza; TL Uberaba - Curitiba Centro; TL Curitiba Leste - Blumenau; SE Medianeira; SE Curitiba Centro; SE Andirá leste; Other Sections | 255 | 4 | 900 | 148.9 | 04.07.2046 |
| Costa Oeste Copel Get - 100% | 001/2012 | TL Cascavel Norte - Cascavel Oeste TL Cascavel Norte - Umuarama Sul SE Umuarama Sul | 159 | 1 | 300 | 18.3 | 01.12.2042 |
| Marumbi Copel GeT - 100% | 008/2012 | TL Curitiba - Curitiba Leste | 29 | 1 | 672 | 26.2 | 05.10.2042 |
| Uirapuru Transmissora Copel GeT - 100% | 002/20056 | TL Ivaiporã - Londrina | 122 | - | - | 28.2 | 03.04.2035 |
| Subtotal Copel GeT 7 | 3,705 | 43 | 15,362 | 904.8 | |||
| Caiuá Transmissora Copel GeT - 49% Elecnor - 51% | 007/2012 | TL Guaíra - Umuarama Sul TL Cascavel Norte - Cascavel Oeste SE Santa Quitéria / SE Cascavel Norte | 142 | 2 | 700 | 15.8 | 05.10.2042 |
| Integração Maranhense Copel GeT - 49% Elecnor - 51% | 011/2012 | TL Açailandia - Miranda II | 365 | - | - | 23.7 | 05.10.2042 |
| Matrinchã Copel GeT - 49% State Grid - 51% | 012/2012 | TL Paranaíta - Ribeirãozinho | 2,033 | 4 | 800 | 128.7 | 05.10.2042 |
| Guaraciaba Copel GeT - 49% State Grid - 51% | 013/2012 | TL Ribeirãozinho - Marimbondo | 930 | 1 | - | 64.1 | 05.10.2042 |
| Paranaíba Copel GeT - 24,5% Furnas - 24,5% State Grid - 51% | 007/2012 | TL Barreiras II - Pirapora II | 967 | - | - | 42.8 | 05.02.2043 |
| Cantareira Copel GeT - 49% Elecnor - 51% | 19/2014 | TL Estreito - Fernão Dias | 656 | - | - | 65.5 | 09.05.2044 |
| Mata de Santa Genebra Copel GeT - 50,1% Furnas - 49,9% | 001/14 | TL Araraquara II - Bateias | 887 | 1 | 3,600 | 150.4 | 05.14.2044 |
| Subtotal SPCs 8 | 5,980 | 8 | 5,100 | 490.9 | |||
| Total | 9,685 | 51 | 20,462 | 1,395.7 | |||
| 1 Proportional to Copel's interest in the project. Values referring to the 2022/2023 cycle according to REH 3,067/2022, without considering the adjustment portion (PA). It considers assets that came into operation until 31-mar-2023. ² Considers double circuit sections (circuits that share the same transmission tower). ³ Contract renewed according to Law 12,783/13. The O&M portion is part of the RBSE, under the terms of the Law. It will be received until the end of the concession (Jan/2042). The value of the APR for the 2021-2022 cycle, excluding the RBSE, according to REH 2,959/21, is R$95.1 million. This value refers to the additional APR from reinforcements and improvements. 4 As of 10.31.2018, the APR was reduced by 50%. 5 The construction of 38 km of sectioning lines was foreseen in the implementation of the Andirá Leste and Medianeira SEs, 2 km of which for Contract 060/2001 and 36 km for LTs that do not belong to Copel GeT, which, despite being included in the APR, in reason for the investment made, will not be added to Copel's assets. 6 As of 07/09/2021, the APR was reduced by 50%. 7 Consolidated Result. 8 Equity Income. | |||||||
| |
| Exhibit IV -OPERATIONAL DATA > DISTRIBUTION |
| OPERATIONAL DATA | ||||||
| Number of Consumers | Locations served | Cities served | Voltage | Number of Substations | MVA | Km of lines |
| 5,011,555 | 1,068 | 395 | 13,8 kV | - | - | 111,695 |
| 34,5 kV | 236 | 1,667 | 89,719 | |||
| 69 kV | 36 | 2,477 | 767 | |||
| 138 kV | 117 | 7,537 | 6,712 | |||
| 389 | 11,686 | 208,893 | ||||
| Consumer-to-employee ratio DIS | 2018 | 2019 | 2020 | 2021 | 2022 | Mar-23 |
Captive Consumers | 4,637,804 | 4,713,240 | 4,835,852 | 4,926,608 | 5,011,555 | 5,033,019 |
| Copel Dis employees | 5,364 | 4,964 | 4,641 | 4,430 | 4,257 | 4,246 |
| Consum/Emp | 865 | 949 | 1,042 | 1,112 | 1,177 | 1,185 |
| QUALITY OF SUPPLY | ||||||
| Jan - Mar | DEC ¹ (hours) | FEC ² (outages) | ||||
| 2019 | 3.16 | 1.88 | ||||
| 2020 | 2.15 | 1.62 | ||||
| 2021 | 2.25 | 1.50 | ||||
| 2022 | 2.34 | 1.49 | ||||
| 2023 | 2.35 | 1.64 | ||||
| ¹ DEC measured in hours and hundredths of an hour ² FEC expressed in number of interruptions and hundredths of a number of interruptions year to date * Values of the last 12 months | ||||||
| Period | Technical Loss | Non-Technical Loss | Total loss | |||
| Regulatory (1) | Real (2) | Regulatory (3) | Calculated (4) | Regulatory (5) | Total (6) | |
| Mar-19 | 6.05% | 5.92% | 4.70% | 3.91% | 8.10% | 7.76% |
| Mar-20 | 6.05% | 5.98% | 4.70% | 2.80% | 8.14% | 7.29% |
| Mar-21 | 6.05% | 6.00% | 4.70% | 4.37% | 8.12% | 7.97% |
| Mar-22 | 5.79% | 5.77% | 4.47% | 4.13% | 7.68% | 7.54% |
| Mar-23 | 5.79% | 5.69% | 4.47% | 5.37% | 7.57% | 7.93% |
| (1) Percentage established in the tariff review; | ||||||
| (2) Technical loss calculated and reported monthly to Aneel; | ||||||
| (3) Percentage established in the tariff review; | ||||||
| (4) Difference between reported total losses and technical losses calculated as a percentage established in the review and the total injected energy, also reported monthly to Aneel; | ||||||
| (5) (Regulatory percentage of PNT x informed BT Market + technical losses calculated as a percentage established in the review and the total energy injected) / Injected energy; | ||||||
| (6) Total loss on injected energy. | ||||||
| NOTE: In the calculation of the distributor's total losses, energy losses inherent to the electric power system (technical losses), commercial losses (mainly due to fraud, theft) and differences related to the shift in the billing schedule and the effects of the portion of mini and micro generation distributed in the Company's network | ||||||
SIGNATURE
Pursuant to the requirements of the Securities Exchange Act of 1934, the registrant has duly caused this report to be signed on its behalf by the undersigned, thereunto duly authorized.
Date May 10, 2023
| COMPANHIA PARANAENSE DE ENERGIA – COPEL | ||
| By: | /S/ Daniel Pimentel Slaviero | |
| Daniel Pimentel Slaviero Chief Executive Officer | ||
FORWARD-LOOKING STATEMENTS
This press release may contain forward-looking statements. These statements are statements that are not historical facts, and are based on management's current view and estimates of future economic circumstances, industry conditions, company performance and financial results. The words "anticipates", "believes", "estimates", "expects", "plans" and similar expressions, as they relate to the company, are intended to identify forward-looking statements. Statements regarding the declaration or payment of dividends, the implementation of principal operating and financing strategies and capital expenditure plans, the direction of future operations and the factors or trends affecting financial condition, liquidity or results of operations are examples of forward-looking statements. Such statements reflect the current views of management and are subject to a number of risks and uncertainties. There is no guarantee that the expected events, trends or results will actually occur. The statements are based on many assumptions and factors, including general economic and market conditions, industry conditions, and operating factors. Any changes in such assumptions or factors could cause actual results to differ materially from current expectations.