Companhia Paranaense de Energia - COPEL (ELP)
Filed: 15 Aug 23, 12:36pm

 |
2Q23 Highlights
 | Adjusted EBITDA of BRL 1.3 billion in 2Q23, BRL 2.9 billion in 1H23 and Reported net income of BRL 308 million in 2Q23 |
 | everage of 2.5x EBITDA and operating cash generation of BRL 1.5 billion in 2Q23 (+3.1% vs. 2Q22) |
 | Copel Distribuição Tariff Adjustment - Average Effect 10.50% as of June 24, 2023 |
 | Readjustment of RAPs for the 23/24 cycle to BRL 1.56 billion as of July 1, 2023 |
 | Copel Distribuição's regulatory efficiency of 16.4% adjusted EBITDA LTM |

Results Webcast
August, 15, 2023 | 14h BRT/1:00p.m. EST
Access Link

| RESULTS | 2Q23 | 1 |
| |
List of contents
| 1. Consolidated Results | 3 |
| 1.1 EBITDA | 3 |
| 1.2 Operating Revenue | 4 |
| 1.3 Operational Costs and Expenses | 5 |
| 1.3.1 Provision for allocation of PIS and Cofins credits | 6 |
| 1.4 Equity in Earnings of Subsidiaries | 7 |
| 1.5 Financial Results | 7 |
| 1.6 Consolidated Net Income | 7 |
| 1.7 Debt | 7 |
| 2. Investment | 9 |
| 2.1 Investment Policy | 9 |
| 2.2 Investment Program | 9 |
| 3. Copel Geração e Transmissão | 10 |
| 3.1 Financial Performance | 10 |
| 3.1.1 IFRS effect in the Transmission segment | 11 |
| 3.2 Operacional Performance | 12 |
| 3.2.1 Generation | 12 |
| 3.2.2 Hydro and Wind Generation | 12 |
| 3.2.3 Thermal Generation | 13 |
| 3.3 Transmission | 14 |
| 3.3.1 RBSE Reprofiling | 14 |
| 4. Copel Distribuição | 15 |
| 4.1 Financial Performance | 15 |
| 4.1.1 Regulatory Efficiency | 16 |
| 4.2 Operational Performance | 16 |
| 4.2.1 Grid Market (TUSD) | 16 |
| 4.2.2 Captive Market | 17 |
| 4.2.3 Concession Agreement | 17 |
| 4.2.4 Investment and Operational Data | 18 |
| 5. Copel Mercado Livre | 20 |
| 5.1 Financial Performance | 20 |
| 5.2 Operational Performance | 21 |
| 6. ESG Performance | 22 |
| 6.1 Copel pioneers in ESG in the sector | 22 |
| 6.2 Recent Highlights | 22 |
| 6.3 Indicators | 23 |
| 6.4 Ratings, Rankings, and Indexes | 23 |
| 7. Other highlights | 24 |
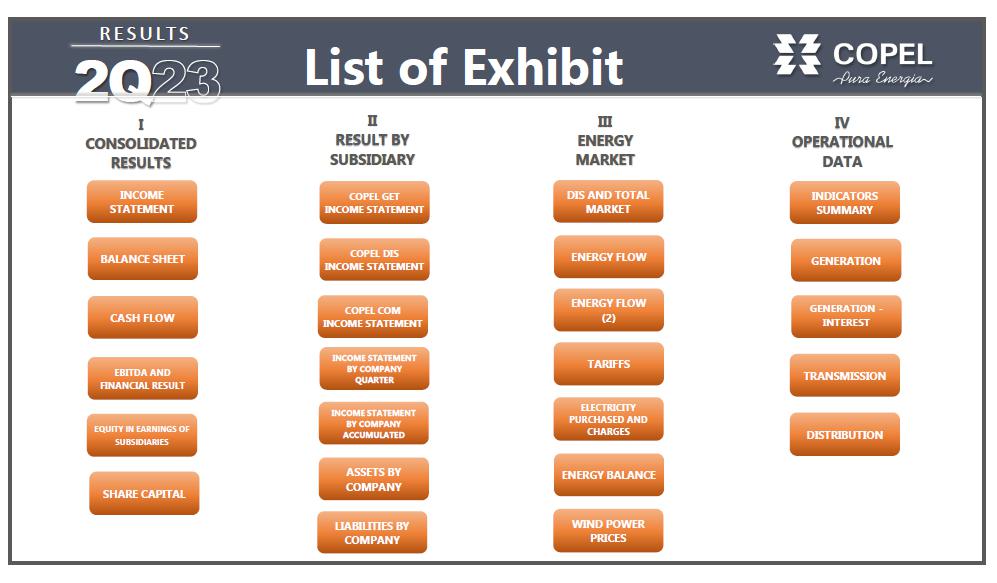
List oh Exhibits
| RESULTS | 2Q23 | 2 |
| |
1. Consolidated
Results
The accumulated in the first half, compared to the same period of 2022.
1.1 EBITDA
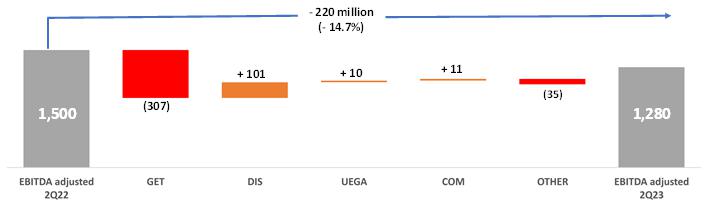
Adjusted EBITDA (excluding non-recurring items) reached R$1,279.8 million, 14.7% lower than the R$1,499.5 million recorded in 2Q22, mainly reflecting the lower remuneration on transmission assets, partially offset, for the better result of Copel da Distribuição, for the better performance of existing wind farms and for the start-up of new generation assets (wind farms Jandaíra, Aventura and SRMN). Disregarding the equity result, Adjusted EBITDA decreased by 6.5% in 2Q23 compared to 2Q22.
The main factors explaining the result are:
(i) decrease of R$135.7 million in equity income and a 35.8% decrease (-R$118.5 million) in Copel GeT's electricity network availability revenue, mainly due to the lower inflation in the period (IPCA of 0.76% in 2Q23 against 2.22% in 2Q22) affecting the remuneration of transmission contract assets and the registration of R$ 30.4 million (gain for efficiency) in the remuneration of subsidiaries Costa Oeste and Marumbi in 2Q22, through the tariff review process; and
(ii) an increase of R$24.0 million in provisions and reversals (in recurring terms), mainly due to the provision of R$16.8 million related to regulatory litigation within the scope of Copel GeT involving the calculation methodology of the Mechanism of Compensation of Surpluses and Deficits (MCSD).
These events were partially offset, mainly:
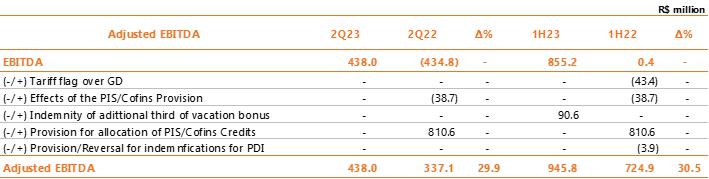
| (i) | by the better performance of Copel Distribuição (adjusted EBITDA of R$438.0 million in 2Q23, against R$337.1 million in 2Q22), mainly due to the growth of 2.0% of the wire market in the period (considering compensated energy from Distributed Mini and Micro Generation – MMGD) and the tariff readjustment, which had an average effect of 16.5% on the tariffs for the use of the distribution system (TUSD); and |
| (ii) | the better result of the wind generation assets, mainly explained by (a) the generation of the Aventura and Santa Rosa & Mundo Novo Complexes acquired on January 30; (b) the commercial start-up of the Jandaíra Complex in October 2022; and (c) for the better performance of the wind complexes operated by the company (+R$ 4.2 million of adjusted EBITDA), due to the higher generation in the period (475 GWh in 2Q23 against 437 GWh in 2Q22, net of losses and differences); and (iii) the increase in Copel Mercado Livre's results, with an increase of R$11.3 million in adjusted EBITDA, essentially justified by the better sales margin. |
Adjusted Consolidated EBITDA
The non-recurring items that were neutralized for calculating the adjusted EBITDA are shown in the table below:
| RESULTS | 2Q23 | 3 |
| |

In 2Q23, the following non-recurring items were recorded: (i) impairment of generation assets in the amount of R$149.1 million, essentially related to UEGA; and (ii) R$22.1 million referring to the fair value (mark-to-market) of Copel Mercado Livre's energy purchase and sale contracts, amount determined by the difference between the contracted price and the future market price estimated by the Company.
Considering the accumulated for the semester, adjusted EBITDA reached R$2,897.6 million, an amount 2.1% lower than the R$2,960.9 million recorded in 1H22, mainly justified by the lower remuneration on transmission contract assets belonging to Copel GeT and joint ventures, partially offset by the better result of Copel Distribuição.
Within the scope of transmission assets, it is worth mentioning that item 3.1.1 presents the regulatory accounting of the result for the purpose of verifying the IFRS (International Financial Reporting Standards) effect.
1.2 Operating Revenue
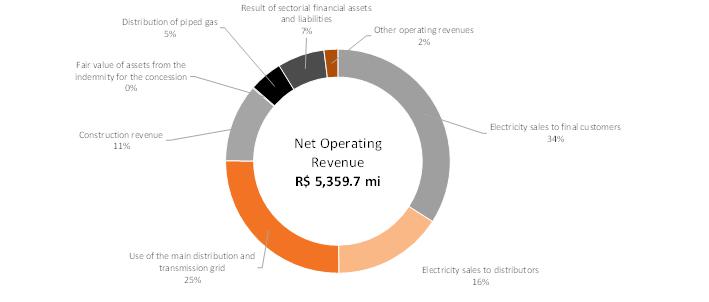
Net operating revenue totaled BRL 5,359.7 million in 2Q23, a 1.9% increase compared to the BRL 5,258.6 million recorded in 2Q22. This result mainly reflects:
(i) increase of R$251.7 million in “use of the main distribution and transmission grid” revenue, mainly due to the June 2022 tariff readjustment by Copel Distribuição, with an average effect of a 16.5% increase in usage tariffs of the distribution system (TUSD), and the 2.0% growth in Copel Distribuição's billed wire market, partially offset by the lower remuneration of transmission assets, due to the lower IPCA in the period (0.76% in 2Q23 compared to 2 .22% in 2Q22);
| (ii) | increase of R$56.7 million in construction revenue, essentially due to the increase in the volume of works related to the “Transformation” program, which includes investments aimed at improving and modernizing infrastructure and improving customer service; |
(iii) growth of R$7.9 million in the result of sectorial financial assets and liabilities (CVA), as a result of the increase in energy costs, charges and other financial components; and
| (iv) | increase of R$ 5.9 million in the “other operating revenues” line, basically due to the increase in revenues from leasing and rentals by the distributor, with emphasis on the greater volume of sharing of poles/fixing points and the Contractual readjustment by the General Market Price Index - IGP-M. |
These increases were partially offset by:
| (i) | reduction of R$85.3 million in electricity sales to distributors, mainly due to the lower volume of energy sold in bilateral contracts by Copel Mercado Livre and the lower margin of Elejor with energy sales in the comparison between periods; |
| (ii) | reduction of R$37.1 million in electricity sales to final customers, mainly due to the negative tariff adjustment of 9.58% applied to the Energy Tariff (TE) component at Copel Distribuição in June 2022, partially offset by the 0.9% growth in the distributor's billed captive market, which considers offset energy from Mini and Micro Distributed Generation – MMGD; and |
| (iii) | decrease of R$71.8 million in Distribution of piped gas revenue, basically due to the lower tariff applied to consumers in the comparison between periods and the reduction in the volume of gas distributed to the captive market. |
| RESULTS | 2Q23 | 4 |
| |
In the first half, net operating revenue totaled BRL 10,890.4 million, an increase of 0.4% compared to the BRL 10,846.3 million recorded in the same period of 2022, with emphasis on the following variations: (i) increase in R$485.0 million (+20.5%) in “use of the main distribution and transmission grid” revenue; (ii) increase of R$79.9 million (+39.4%) in the item “other operating revenues”; (iii) reduction of R$267.1 million (-6.7%) in electricity sales to final customers; and (iv) decrease of R$194.3 million (-10.0%) in revenue from electricity sales to distributors.
1.3 Operational Costs and Expenses
In 2Q23, operating costs and expenses totaled R$4,681.5 million, an increase of R$9.7% compared to the R$4,268.5 million recorded in the same period of 2022 (disregarding the effects of R$810.6 million related to the provision of PIS/COFINS credits), mainly due to:
| (i) | increase of R$ 179.3 million in the line “charge of the main distribution and transmission grid”, mainly explained by higher costs of transporting the basic network and charge for reserve energy (EER); |
| (ii) | growth of R$165.0 million in the line “provisions and reversals” (provision of R$224.9 million in 2Q23 compared to provision of R$59.9 million in 2Q22), mainly due to the negative effect of R$ 150.4 million related to the impairment complement of UEG Araucária and the increase of R$ 23.2 million in provisions for litigation, mainly due to regulatory litigation with a provision of R$ 16.8 million involving the calculation methodology the Surplus and Deficit Compensation Mechanism (MCSD); |
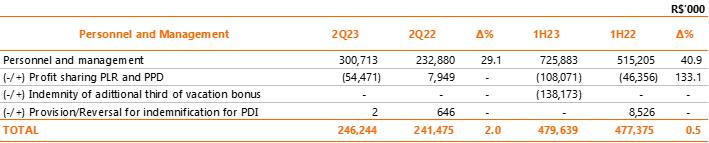
| (iii) | increase of 29.1% (+R$ 67.8 million) in expenses with “personnel and management”, mainly due to the higher provision related to the performance bonus - PPD and profit sharing - PLR (+R$ 54.5 million). Neutralizing the effects of PPD and PLR provisions and reversals and the reversal associated with the voluntary dismissal program (PDI), there is a 2.0% increase in the quarterly comparison, despite the 7.19% salary adjustment applied through collective agreement ACT 2022/2024. Considering the accumulated inflation measured by the National Consumer Price Index – INPC of 3.00% between 2Q22 and 2Q23, there was a reduction in real terms of 1.0%. It is also worth noting that, in 2Q22, the provision for the allocation of PIS and COFINS credits, described in item 1.3.1, significantly impacted the variation in the “personnel and management” line, through the reversal of R$ 7.9 million in PPD and PLR; and |
| (iv) | an increase of R$38.9 million in third-party services, mainly due to the increase in maintenance costs for the electrical system and installations for generation assets, reflecting the acquisition of the Aventura and Santa Rosa & Mundo Novo Wind Complexes, and higher expenses by the distributor with maintenance of the electrical system and customer service. |
These increases were partially offset by: (i) a decrease of R$40.8 million in electricity purchased for resale (-2.1%) due to an improved hydrological scenario and lower dollar variation on energy purchased from Itaipu; (ii) a decrease of R$64.6 million (-25.7%) in expenses with “natural gas and supplies for the gas business”, mainly due to the lower sales volume to consumers in the captive market and the acquisition natural gas at a lower cost due to exchange rate fluctuations and oil prices; (iii) decrease of R$16.6 million (-11.5%) in other operating costs and expenses, mainly due to lower financial compensation for the use of water resources (-R$10.0 million) and the positive effect of the remeasurement of the fair value of the indemnifiable asset of the concession of the HPP GPS and HPP
| RESULTS | 2Q23 | 5 |
| |
Mourão I plants in 2Q22; and (iv) a decrease of R$6.1 million (-22.8%) in material costs, mainly due to the reduction in fuel expenses.
Expenses with PMSO, excluding provisions and reversals, increased by 12.7% compared to the same period of the previous year, basically explained by the increase of R$ 54.5 million in the higher provision related to the performance bonus (PPD) and profit sharing (PLR) and higher expenses with third-party services, as explained below.

Headcount Evolution

In the first six months, total operating costs and expenses reached R$9,102.0 million, 5.3% less than the R$9,609.2 million recorded in the same period of 2022. Without considering the impact of the provision for the allocation of PIS and COFINS credit in 1H22 (an increase of R$810.6 million), operating costs and expenses would have increased by 3.4% in the comparison between periods.
1.3.1 Provision for allocation of PIS and Cofins credits
In 2Q22, Copel Distribuição, with the support of its legal advisors, recognized the “provision for allocation of PIS and COFINS credits” account to record the accounting impacts of Federal Law No. 14,385/2022, of June 27, 2022 (“Law”), which negatively affected the Company's Net Income in that quarter, in the approximate amount of R$1.2 billion, with no cash effect.
The Law, despite the lack of regulation, governs the allocation of tax amounts that were required to be paid in excess by public electricity distribution service providers in the country, due to the collection of PIS/COFINS on ICMS, recognized by the judiciary as undue.
More details can be found in Explanatory Note 12.2.1 of the Company's quarterly information form for June 30, 2023.
| RESULTS | 2Q23 | 6 |
| |
1.4 Equity in Earnings of Subsidiaries
The equity result of joint ventures and other Copel affiliates was 65.1% lower than that recorded in the same period of the previous year (R$ 72.7 million, compared to R$ 208.4 million recorded in 1Q22), in due to the lower remuneration on transmission assets, basically justified by the lower IPCA in the period (0.76% in 2Q23 against 2.22% in 2Q22). More details can be seen in Annex I.
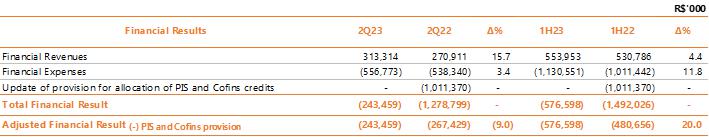
1.5 Financial Results
In 2Q23, the financial result was negative by R$243.5 million, against a negative R$267.4 million recorded in 2Q22, representing a better result when comparing periods. Financial income showed an increase of R$42.4 million, reflecting, above all, the increase of R$46.9 million related to the adjustment to present value on accounts payable linked to the concession and the increase of R$36.0 million in the receipt of fines for arrears within the distribution company, partially offset, mainly, by the reduction of R$ 27.2 million in arrears on energy bills and by the decrease of R$ 22.9 million in the result of remuneration of regulatory assets and liabilities . Financial expenses increased by R$18.4 million, essentially due to the higher monetary variation and debt charges due to the higher balance on loans and financing (R$16.3 billion vs. R$12.9 billion in 2Q22) and the monetary restatement of litigation (+R$ 35.6 million), especially on the provision for the allocation of PIS/COFINS credits.
1.6 Consolidated Net Income
In 2Q23, Copel recorded a net profit of R$307.7 million against a net loss of R$522.4 million recorded in 2Q22. It is worth mentioning that the 2Q22 result had the impact of Law 14,385/2022 with the provision for the allocation of PIS and COFINS credits and a net effect of R$ 1,202.5 million on the quarter's result. Disregarding this effect, net income in 2Q22 would be R$680.1 million.
In addition to the items already mentioned, it is worth mentioning the increase of R$ 36.1 million (+11.2%) in the item “depreciation and amortization”, mainly due to the entry into operation of the Jandaíra Wind Complex, the acquisition of the Aventura and Santa Rosa & Mundo Novo Wind Complexes and the increase in investments by Copel Distribuição.

Considering the first half of the year, net income in 1H23 was R$943.2 million, compared to R$147.4 million in the first half of 2022.
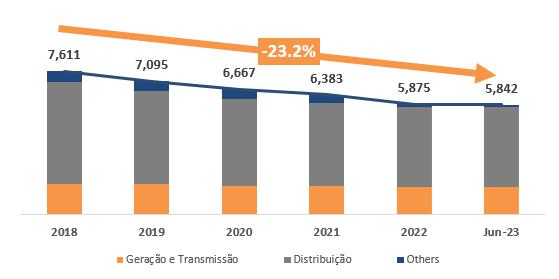
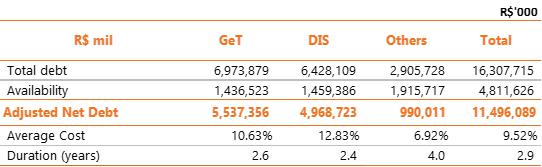
1.7 Debt
Copel's total consolidated debt amounted to R$16,307.7 million on June 30, 2023, a variation of 30.9% in relation to the amount recorded on December 31, 2022, of R$12,454.2 million.
At the end of 2Q23, the Company's gross debt represented 74.1% of consolidated shareholders' equity, which was R$ 22,101.9 million.
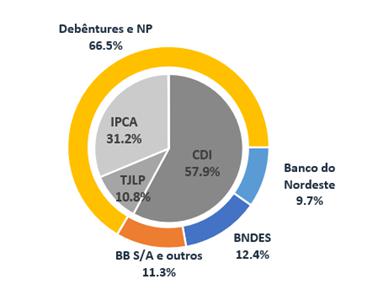
The following charts show the indebtedness of Copel and its subsidiaries at the end of June 2023.
| RESULTS | 2Q23 | 7 |
| |
Debt by Subsidiary
Adjusted Net Debt/EBITDA Adjusted

Debt Indexers Average cost: 9.52%
Amortization - R$ million Average term to maturity: 4.4 years
Weighted Average Cost and Average term to maturity

| RESULTS | 2Q23 | 8 |
| |
| 2. Investment |
2.1 Investment Policy
In March 2021, the Board of Directors approved the Company's Investment Policy. Said Policy was subject to analysis and approval by the Investment and Innovation Committee, which was established by the new Bylaws of March 11, 2021, whose main purpose is to improve discipline in the allocation of capital, being an essential tool for the execution of the strategic guidelines for sustainable growth, generation of value for shareholders and the perpetuity of our energy business.
The Policy establishes the criteria for selecting, prioritizing, evaluating, approving and monitoring investments. Among the various aspects, the Policy segregates investment opportunities into three groups that will be prioritized as follows:
| (i) | Operating Investments: expansion of capacity and modernization of the assets of the Distribution, Transmission and Generation concessions, in addition to the continuity of existing businesses; |
| (ii) | Strategic Investments: acquisition and development of new assets with an emphasis on brownfield opportunities and that provide operational synergies to the Company. Portfolio review and divestments are included; and |
| (iii) | Investments in Innovation: where we highlight projects aimed at open innovation. |
The Investment and Innovation Committee meets ordinarily once a month and extraordinarily whenever necessary, analyzing and issuing recommendations for the Company's investment proposals.
2.2 Investment Program
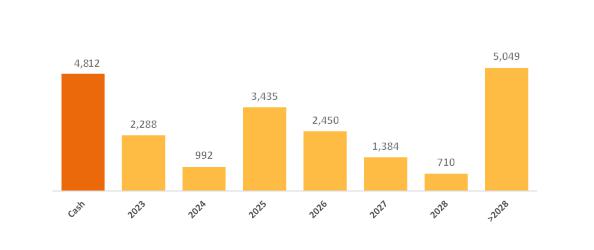
Investment Programs follow their schedules in each development project. For 2023, the estimated amount allocated to the investment program is R$ 2,272.3 million, with Copel Distribuição contemplating most of the forecast amount, whose objective is the permanent improvement of operational efficiency and cost reduction through the advancement of important projects, with emphasis on the continuity of the execution of the Paraná Triphasic and Smart Electric Network programs (see item 4.2.4). These programs are aimed at renewing depreciated assets in rural areas, improving the quality and speed of service, integration with smart cities and improving information via network sensing.
In 2Q23, R$549.0 million were invested, of which R$478.4 million (87.1%) were allocated to Copel Distribuição, R$69.6 million (12.7%) to Copel Geração e Transmissão, R$ 0.6 million (>0.1%) at Copel Holding and R$0.4 million at Copel Comercialização (<0.1%). In the accumulated result for the year, the amount invested was R$ 1,094.9 million, of which R$ 955.5 (87.3%) in Copel Distribuição, R$137.4 million (12.5%) in Copel Geração e Transmissão, R$1.1 million (0.1%) in Copel Holding and R$0.9 million (<0.1%) at Copel Comercialização.
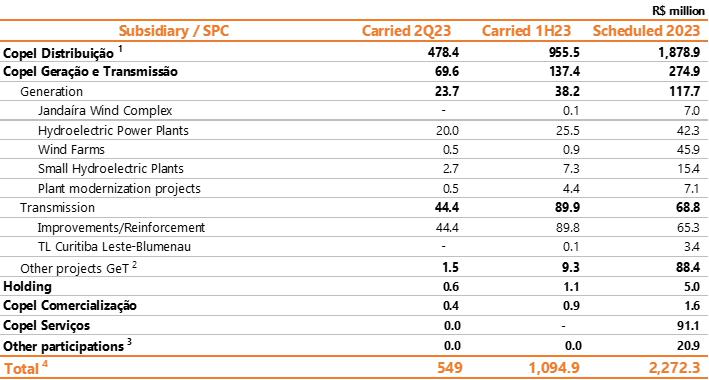
1 Includes the "Transformação" program comprising the Paraná Trifásico, Rede Elétrica Inteligente and Confiabilidade Total.
2 Includes modernization of the GOC (Generation Operations Center), investments in substations/transmission lines and other projects.
3 Other Participations: includes Complexo Bandeirantes, SPE Voltália and Innovation Startup.
4 Does not include acquisition of Aventura Wind Complex and SRMN.
| RESULTS | 2Q23 | 9 |
| |
3. Copel Geração e (Consolidated Results) |
| 3.1 Financial Performance |
Copel GeT presented adjusted EBITDA, excluding non-recurring effects, of R$755.5 million in 2Q23, a decrease of 28.2% compared to R$1,052.9 million in 2Q22. In the accumulated result for the year, adjusted EBITDA decreased by 14.0%, with a result in the half of R$ 1,758.5 million compared to R$ 2,044.5 million in the same period of the previous year.

This result mainly reflects:
| (i) | decrease of R$ 118.5 million in electricity network availability revenue (TUST) and R$ 135.2 million in equity income, mainly explained by the reduction in remuneration on transmission assets, due to the lower variation in the IPCA in the period (0.76% in 2Q23 against 2.22% in 2Q22) and the recording of R$ 30.4 million (efficiency gain) in the remuneration of subsidiaries Costa Oeste and Marumbi in 2Q22, through the tariff review process; |
| (ii) | recording in a provision of R$ 16.8 million related to regulatory litigation within the scope of Copel GeT involving the methodology for calculating the Surplus and Deficit Compensation Mechanism (MCSD); |
Partially offset by:
| (i) | addition of R$34.8 million to the result with the incorporation of new wind farms, with the commercial start-up of the Jandaíra Complex in October 2022 and the acquisition of the Aventura and Santa Rosa & Mundo Novo on January 30, 2023; |
| (ii) | increase of R$4.2 million in the result of other wind complexes operated by the Company due to higher generation (475 GWh in 2Q23 against 437 GWh in 2Q22, net of losses and differences). |
Expenses with PMSO, excluding provisions and reversals, increased by 10.7%, influenced mainly by: (i) the 40.2% increase in expenses with “third-party services”, reflecting the increase in costs with maintenance of facilities and the electrical system generated by the acquisition of the Aventura and Santa Rosa & Mundo Novo Wind Complexes; (ii) 28.4% growth in “Personnel and management” costs due to the impact of the provision for PIS/COFINS in 2Q22, which significantly reduced Profit Sharing (PLR) and Performance Bonus (PPD); partially offset by (iii) the 24.4% reduction in “Other operating costs and expenses”, mainly due to lower costs with the payment of financial compensation for the use of water resources (R$ 23.7 million in 2Q23 against R$ 32, 6 million 2Q22), due to lower hydro generation, and the fair value revaluation of HPP GPS and HPP Mourão I by R$ 26.4 million in 2Q22.
| RESULTS | 2Q23 | 10 |
| |
Neutralizing the effects of provisions related to profit sharing (PLR) and performance bonus (PPD) and provisions and reversals associated with the incentive resignation program (PDI), there is an increase of 3.6% in the quarterly comparison despite the readjustment salary of 7.19% applied through collective agreement ACT 2022/2024. Considering the accumulated inflation measured by the National Consumer Price Index - INPC, of 3.0% between 2Q22 and 2Q23, there was an increase in real terms of 0.6%.
Regarding the non-recurring item, in 2Q23 an impairment of generation assets was recorded in the amount of R$ 149.4 million, explained essentially by the provision of R$ 150.4 million related to the reduction in the expected dispatch from UEGA.
Within the scope of transmission assets, item 3.1.1 presents the regulatory accounting of income for purposes of verifying the IFRS (International Financial Reporting Standards) effect.
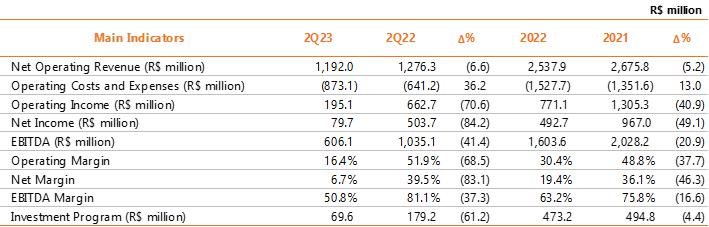
Copel GeT recorded net income of R$79.7 million in 2Q23, a decrease of 84.2% compared to 2Q23. In the accumulated, net income increased from R$967.0 million in 1H22 to R$492.7 million in 1H23. This result mainly reflects, in addition to the items already discussed, the 11.6% increase in depreciation due to the entry of new generation assets and the increase in financial expenses, due to the higher debt stock (R$ 290.6 million in 2Q23 against BRL 259.9 million in 2Q22).
3.1.1 IFRS effect in the Transmission segment
For the calculation, an adjustment was made considering the effects of the application of CPC47/IFRS15 in the corporate statements in the transmission business.

| RESULTS | 2Q23 | 11 |
| |
| 3.2 Operacional Performance |
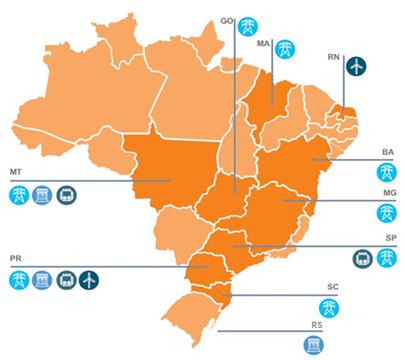
Copel is present in 10 states, operating in the generation and transmission business.
In the Generation business, Copel GET operates a diversified park of hydroelectric, wind and thermal plants, totaling 6,966.7 MW of installed capacity and 3,156.6 average MW of assure energy. In the Transmission business, Copel owns a total grid of 9,685 Km of transmission lines and 51 basic grid substations, considering the affiliates.
For more information on generation and transmission operational data, see Exhibit IV.
3.2.1 Generation
Copel's generating portfolio is made up of 94% of renewable sources, such as hydro and wind power.

3.2.2 Hydro and Wind Generation
The energy generation of Copel Geração e Transmissão S.A. and its wind farms in 1H23 was 10,761 GWh, against 3,626 GWh in 1H22 (9,522 GWh in 1H22). The increase is due, for hydroelectric plants, to the improvement in weather conditions in the South Region and, for wind farms, to the entry into commercial operation of Jandaíra and the acquisition of the Wind Complexes Aventura and Santa Rosa & Mundo Novo (SRMN).
In the second quarter of 2023, Copel Geração e Transmissão (including energy from UHE Foz do Areia – FDA and PCH Bela Vista – BVE, but excluding UTE Araucária) sold 3,953 GWh of electricity, a reduction of 7.1% , mainly due to lower energy sales to Copel Mercado Livre and in the short-term market.
| RESULTS | 2Q23 | 12 |
| |
For wind farms, total electricity sold in 2Q23 was 1,012 GWh, an increase of 41.7%, influenced by the generation of Copel's wind farms in the quarter, the commercial start-up of Jandaíra and the acquisition of Wind Complexes Aventura and SRMN, which became part of the Company's portfolio on January 30, 2023.
Consolidated Generation Sales (GWh)

3.2.3 Thermal Generation
TPP Araucária
It is a natural gas generation plant with an installed capacity of 484.2 MW that operates in a combined cycle (two gas turbines and one steam turbine) and operates in the modality known as "merchant" in which the plant operates without sales contracts. of electricity, whether in the free (ACL) or regulated (ACR) environment, subject to fluctuations in the Price for Settlement of Differences - PLD. In this modality, the thermoelectric plant is dispatched centrally by the National Electric System Operator (ONS), in situations where the Marginal Cost of Operation (CMO) of the electrical system exceeds its Variable Unit Cost (CVU) approved by ANEEL, or out of order of merit, when requested by the ONS. In this context, with the good hydrological conditions in 2Q23, there was no dispatch from the plant.
TPP Figueira
Coal-fired generation plant with an installed capacity of 17.7 MW, achieved after a recent modernization process that allowed for an increase in capacity without the need to increase the volume of coal consumed. TPP Figueira has been in commercial operation since 12/07/2022, by ANEEL order No. 2502/2022, generating 22.8 GWh in 2Q23.

| RESULTS | 2Q23 | 13 |
| |
3.3 Transmission
Copel has more than 9.6 thousand km of transmission lines in eight Brazilian states, considering its own assets and in partnership with other companies. In addition to building, maintaining and operating an extensive own energy transmission grid, Copel provides services to projects of other concessionaires with the quality of someone who has accumulated more than 60 years of experience in the sector. The Transmission projects are listed in Exhibit IV, including the projects of Copel Geração e Transmissão, SPCs Costa Oeste, Marumbi and Uirapuru Transmissora (100% Copel GeT), as well as the 7 SPCs in which Copel GeT has a stake.
3.3.1 RBSE Reprofiling
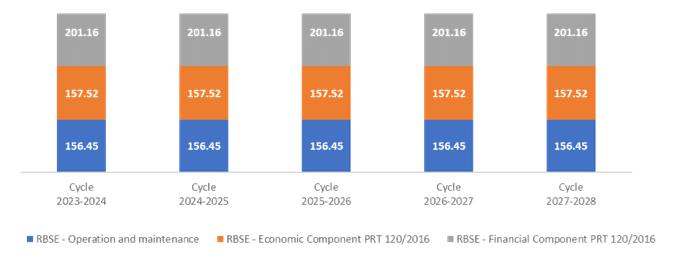
The Concession Agreement 060/2001 represents 42.3% of the annual permitted revenue (APR) of Copel GET's transmission business, also considering its affiliates. Below, we describe the flow of receipt of the portion of revenue referring to the Basic Grid - Existing System (RBSE) for the next cycles. It is important to note that this flow may change in the future, as a result of the tariff review processes and/or review of parameters used to compose these revenues by the regulatory agent. The values referring to O&M from the 2023-2024 cycle were readjusted by the IPCA.
Note:
Economic component: future values based on the 2023-2024 cycle (according to REH 3.216/2023 of 06/30/2023)
Financial component: values published in REH 2847/21. Subject to review during the current cycle in view of the controversy in the methodology used to calculate these values by the regulatory agency.
RAP values up to the 2023-2024 cycle taken from the REH of each cycle, with reference to the cycle price (June of the year of publication) RAP values include RB and DIT assets
��
| RESULTS | 2Q23 | 14 |
| |
| 4. Copel Distribuição |
| 4.1 Financial Performance |
Copel Distribuição's EBITDA in 2Q23 was R$438.0 million and was not affected by non-recurring events. Excluding the impact of the provision for the allocation of PIS/COFINS credits and other non-recurring items that affected 2Q22, EBITDA on a comparable basis increased 29.9%, mainly due to the tariff adjustment in June 2022, with an average effect a 16.5% increase in the Tariffs for the Use of the Distribution System (TUSD) and the 2.0% growth in the billed grid market, which considers offset energy from Distributed Mini and Micro Generation – MMGD. Year-to-date, adjusted EBITDA increased by 30.5%.
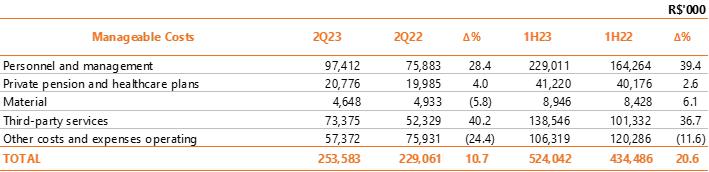
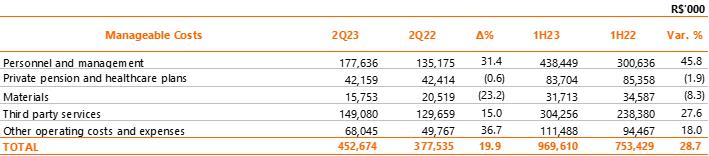
Manageable costs, excluding provisions and reversals, increased 19.9% compared to 2Q22, mainly as a result of: (i) 31.4% increase in personnel, due to the effects of the provision for PIS/COFINS in 2Q22 which significantly reduced PLR and PPD in that period; (ii) 15.0% from third-party services, due to higher expenses with maintenance of the electrical system, maintenance of installations and customer service; and (iii) 36.7% with other operating costs and expenses, related to the deactivation of assets; partially offset by the 23.2% reduction in material expenses, mainly due to the reduction in fuel expenses.
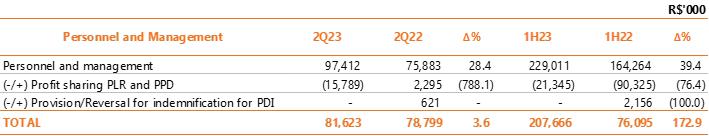
The personnel and management account, excluding the effects of indemnities of the Collective Bargaining Agreement, provisions for profit sharing (PLR) and performance bonuses (PPD), and provision for indemnity for incentivized dismissals (PDI), recorded an increase of 0.6%, below the 7.19% salary adjustment that took place in January/23.
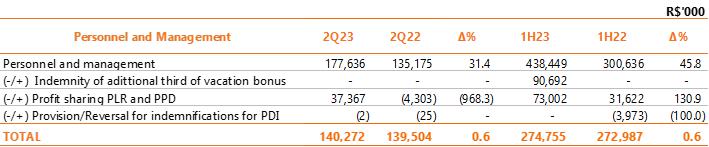
Considering the accumulated inflation measured by the National Consumer Price Index - INPC, of 3.0% between 2Q22 and 2Q23, the cost line with personnel and management registered a reduction in real terms of 2.4%, mainly due to the reduction of 70 employees between periods.
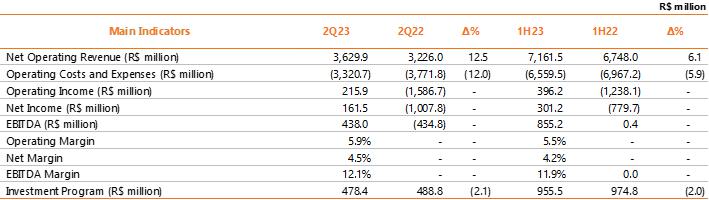
The following table presents the main indicators of Copel Distribuição:
| RESULTS | 2Q23 | 15 |
| |
In 2Q23, we also highlight:
| (i) | the 43.4% growth in revenue from use of the main distribution grid, mainly due to the June 2022 tariff readjustment, with an average effect of a 16.5% increase on tariffs for the use of the distribution system (TUSD) and the 2.0% growth in the billed grid market. Also contributing to this growth was the 4.9% reduction in the Energy Development Account – CDE, a line reduction account, which constitutes a sectoral liability in the CVA to maintain the neutrality of sectoral charges for the distributor; |
| (ii) | the 1.9% decrease in electricity sales to final customers, due to the average effect of a 9.58% reduction in the Energy Tariff (TE) component in the company's 2022 tariff readjustment, partially offset by the increase of 0.9% in the captive market billed in the quarter; |
| (iii) | the 9.6% decrease in revenue from electricity sales to distributors, due to the reduction in revenue from MVE contracts; |
| (iv) | the 34.3% increase in costs with charges of main transmission grid, due to the increase in charges for the use of the basic grid, by 34.3%; reserve energy charges, at 69.8%; and charges for transporting power from Itaipu, at 52.9%; |
| (v) | the 34.7% increase in other operating revenues, mainly due to the growth in revenue from leases and rentals of equipment and structures, especially from pole sharing agreements, due to the higher volume of poles/fixing points allocated and the contractual readjustment by the IGP-M; and |
| (vi) | PECLD, with a reduction of 1.7%. |
Copel Distribuição's net income was R$161.5 million in 2Q23 and R$301.2 million in the year.
4.1.1 Regulatory Efficiency
Copel Distribuição recorded adjusted EBITDA of R$1,884.3 million in the last 12 months, an amount 16.4% above regulatory EBITDA, equivalent to an efficiency of R$265.1 million.

Note: Regulatory EBITDA is calculated based on the WACC + QRR values published in ANEEL's Technical Notes in Tariff Revision or Adjustment events.

4.2 Operational Performance
4.2.1 Grid Market (TUSD)
Copel Distribuição's grid market, made up of the captive market, supply to concessionaires and licensees within the State of Paraná and all the free customers existing in its concession area, had a 4.1% increase in electricity consumption in the 2Q23 compared to the same period of the previous year and 1.5% year-to-date. The billed grid market, which considers offset energy from Distributed Mini and Micro Generation – MMGD, increased 2.0% in the quarter and dropped 0.6% in the year, considering the Availability Cost. The volume of offset energy, which is the excess generation of MMGD compensated for in billing, grew 70.8% in the quarter, with emphasis on growth in the Residential (80.9%), Rural (94.4%), Commercial classes (54.8%) and Industrial (47.5%). The number of consumers subscribing to the MMGD reached 277,977 in June 2023, an amount 74.4% higher than June 2022.
| RESULTS | 2Q23 | 16 |
| |

The 2Q23 result is due to the consumption of electricity by the following classes:
| i) | Residential with an increase of 8.8%, mainly due to the increase of 1.9% in the number of consumers and the increase in average consumption in the period, from 158.51 kWh/month to 169.5 kWh/month, due to the increase in temperature; |
| ii) | Commercial, with an increase of 8.7%, mainly due to the 15.6% growth in consumption in Wholesale Trade, except for vehicles, which accounted for 18.1% in consumption by this class, the increase in consumption with food in 11.3%, representing 6.1% of the consumption of the class, and Retail Trade in 7.5%, representing 29.7% of the consumption of the class, partially offset by the reduction of 2.0 % of consumption in Telecommunications, representing 4.9% of the class; |
| iii) | Other classes, with an increase of 3.8%, mainly due to the growth of the Public Power (9.95%) and Public Service (4.02%) classes; |
| iv) | Rural, with an increase of 0.5%, mainly due to the growth in consumption with Fishing and Aquaculture by 7.6%, representing 5.1% in the consumption of the class, and the increase in consumption with Agriculture, Livestock and Related Services by 0.4%, representing 88.1% of the class's consumption, partially offset by the reduction in consumption with Electricity, gas and other utilities by 1.6%, representing 5.0% in consumption from class; and |
| v) | Industrial, with an increase of 0.1%, mainly due to the 7.1% increase in the consumption of Manufacturing of Food Products, representing 37.8% of the consumption of the class, partially offset by the reduction in consumption of Manufacture of Wood Products by 11.5%, representing 7.6% of the consumption of the class, and by the reduction in consumption of Manufacture of cellulose, paper and paper products by 11.5%, representing 11. 9% of the class. |
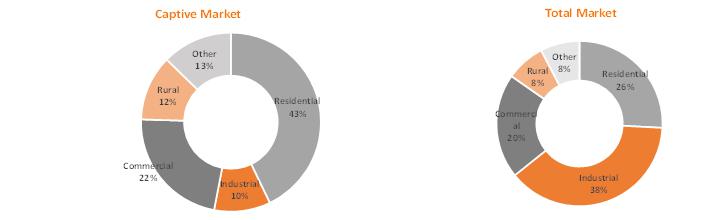
4.2.2 Captive Market
The captive market showed an increase of 4.6% in electricity consumption in the second quarter of 2023 and 0.5% for the year. The billed captive market, which considers MMGD offset energy, increased by 0.9% in the second quarter of 2023 and dropped by 3.0% in the year.
The following graphs show the electricity consumed by class up to June 2023:
4.2.3 Concession Agreement
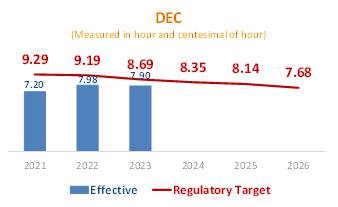
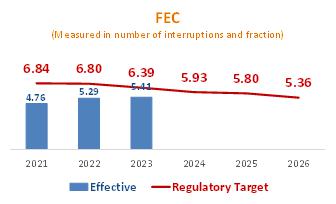
In December 2015, the Company signed the fifth amendment to the Public Service Concession Agreement for Electricity Distribution No. 46/1999 of Copel Distribuição SA, which extends the concession until July 7, 2045. Copel Distribuição complied with the conditioning requirements of economic-financial efficiency and quality for the inspection cycle of the initial 5 years. From the sixth year after the conclusion of the contract, failure to comply with the quality criteria for three consecutive years or the economic-financial management criteria for two consecutive years will result in the opening of the expiry process. For the quality criterion of distribution service provision, ANEEL
| RESULTS | 2Q23 | 17 |
| |
defined the limits of Equivalent Interruption Duration per Consumer Unit - DEC and Equivalent Interruption Frequency per Consumer Unit - FEC for the years 2021 to 2026. For DEC, the result calculated in june 2023 was 7.9 hours. For FEC, the result in the same period was 5.4 interruptions.,
 |  |
The economic-financial management efficiency criterion will be measured by the calculation, each calendar year, according to ANEEL Normative Resolution No. 896/2020, by the following inequation:

4.2.4 Investment and Operational Data
Transformation Program (Programa Transformação) - a broad investment plan with the objective of modernizing, auto mating and renovating the distribution grid and private communication grid with standardized technologies to service automation equipment. Among the expected benefits are the strengthening of rural grid to reduce disconnections and guarantee support for the growth of agribusiness in the State of Paraná, the reduction of costs with O&M and commercial services and improvement in the control of DEC and FEC indicators. The program is composed of 3 pillar projects to achieve the objectives:
| · | Paraná Tri-phase: represents the improvement and renewal of rural distribution grid in the Company's concession area, with the implementation of a three-phase grid and creation of redundancy in the main rural branches. |
| · | Smart Grid: aims to implement a private communication network with standardized technology to service all automation equipment in the distribution grid and advanced metering infrastructure. By the end of June 2023, 511 thousand smart meters had been installed. |
| · | Total Reliability: aims to ensure modernity in the operations of the energy grid based on the following premises: maintain full communication between teams and the availability of equipment on the grid, implement automation in special equipment, maintain the entire municipality of the concession with a substation or special key and expand the grid circuits and Self Healing. By the end of June 2023, the project had completed 80.5% of the planned schedule. |
Copel Distribuição's Transformation Program covers the construction of approximately 25 thousand km of new grid, 15 thousand new automated points and the implementation of smart grid technology in the state of Paraná.
Compact and Protected Grid – deployment of compact grid predominantly in urban areas with a high degree of afforestation in the vicinity of distribution grid and protected grid exclusively in rural areas. Compact grid avoids cutting and pruning trees and improves the quality of supply, as it reduces the number of disconnections. Protected grid also improves the quality and reliability of the system as it avoids interruptions due to contact with vegetation or other objects and bad weather. At the end of June 2023, the extension of compact and protected grid installed was 24,676 km (20,207 km in June 2022), an increase of 4,469 km, or 22.12%, in twelve months.
Isolated Secondary Grid- investment in isolated low voltage secondary grid (127/220V), which have significant advantages over the conventional overhead grid, such as: improving the indicators Duração Equivalente de Interrupção por Unidade Consumidora - DEC (Equivalent Duration of Interruption per Consumer Unit) and e Frequência Equivalente de Interrupção por Unidade Consumidora – FEC (Equivalent Frequency of Interruption by Consumer Unit), hinder energy theft, improve environmental conditions, reduce pruning areas, increase safety, reduce voltage drop across the grid and increase the life of transformers by reducing the number short circuits in the network, among others. At the
| RESULTS | 2Q23 | 18 |
| |
end of June 2023, the the extension of isolated secondary distribution grid installed was 22,391 km (21,349 km in June 2022), an increase of 1,042 km, or 4.88%, in twelve months.
Losses - refer to the generated electrical energy that passes through transmission lines and distribution grid, but which is not commercialized, either for technical or commercial reasons. Distribution losses can be defined as the difference between the electricity purchased by distributors and that billed to their consumers, being classified as technical and non-technical. Technical Losses are inherent to the electrical energy distribution activity and occur due to its dissipation during the transport process, voltage transformation and measurement due to the laws of physics. Historically, the Company's Technical Losses have maintained percentages close to or below the regulatory target. At the end of June 2023, Technical Losses for the last 12 months were 2,052 GWh, compared to 2,029 GWh for the same period of the previous year. Non-Technical Losses, calculated by the difference between total and technical losses, originate mainly from theft (illegal connection, direct grid diversion), fraud (meter tampering or deviations), reading, measurement and billing errors. These losses are largely associated with the concessionaire's management and the socioeconomic characteristics of the concession areas. At the end of June 2023, Non-Technical Losses for the last 12 months were 645 GWh, compared to 665 GWh in the same period of the previous year. Total losses, at the end of June 2023, accumulated in 12 months 2,697 GWh, compared to 2,694 GWh in the same period of the previous year. In terms of classification, Total Losses were made up of 76% Technical Losses and 24% Non-Technical Losses.
| GWh - 12 Months | jun/19 | jun/20* | jun/21 | jun/22 | jun/23 |
| Injected Energy | 33,121 | 32,186 | 33,996 | 35,063 | 35,459 |
| Distribuition losses | 2,632 | 2,263 | 2,693 | 2,694 | 2,697 |
| Technical losses | 2,003 | 1,946 | 2,056 | 2,029 | 2,052 |
| Non-Technical losses | 630 | 317 | 637 | 665 | 645 |
* The losses reflect the difference between the measured load and the billed market and, with the onset of the Covid-19 Pandemic, the load in 2020 suffered a rapid retraction, but the market did not respond at the same speed, due to the mismatch between the measurement schedule and consumers billing schedule, reducing the volume of losses in this period.
The tariff transfer of the efficient levels of losses is foreseen in the concession contracts and these losses are considered in the costs with the purchase of energy up to the regulatory limit stipulated by ANEEL. Despite the total losses having percentages slightly above the regulatory one, the methodology for regulatory calculation uses the billed market and within this methodology, no loss glosses were calculated for Copel Distribuição in the annual tariff readjustment cycles of 2022 and 2023.
At the end of March 2023, Total Losses of the last twelve months were 2,796 GWh, compared to 2,627 GWh in March 2022.

| RESULTS | 2Q23 | 19 |
| |
| 5. Copel Mercado Livre |
| 5.1 Financial Performance |
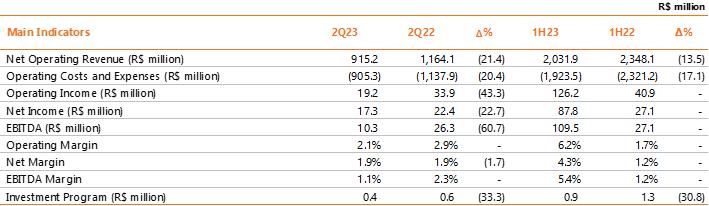
In 2Q23, Copel Mercado Livre presented adjusted EBITDA of R$32.4 million, an amount 53.3% higher than the R$21.2 million recorded in 2Q22, mainly reflecting the increase in the commercialization margin. Year-to-date, adjusted EBITDA increased 90.5%, with a result of R$ 82.9 million in the half compared to R$ 43.5 million in the period in the previous year, under the same effect of the quarter.

In the quarter, the main adjustment between the periods was the fair value (mark-to-market) of energy purchase and sale contracts - amount determined by the difference between the contracted price and the future market price estimated by the Company - a result, mainly, of the execution of contracts that left the base and the increase in the default sensitivity given by the credit risk rate.
Manageable costs increased by 34.7% in 2Q23 compared to 2Q22, mainly impacted by the 30.8% increase in the cost of “Personnel and administrators” due to the reflection of the provision for PIS/COFINS in 2Q22, which significantly reduced the PLR and PPD in that period and the 126.0% increase in “Third-party services” due to technology infrastructure costs for customer service, legal publications and participation in auctions.
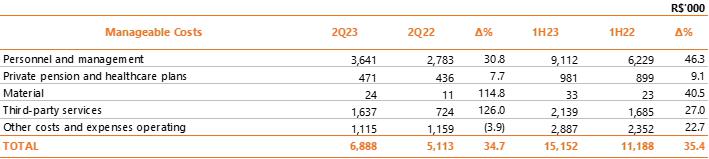
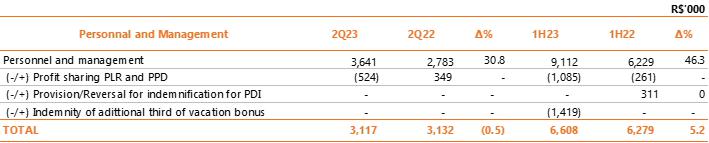
Excluding the effects of PLR and PPD, the personnel account decreased by 0.5% in 2Q23 compared to 2Q22, below the 7.19% salary adjustment that took place in January/23. In the accumulated result for the year, personnel costs increased 27.9% compared to 1H22 due to the indemnity for the cessation of payment related to the additional third as a Vacation Bonus that occurred in January/23.
Net income in 2Q23 was R$17.3 million (down R$5.1 million from R$22.4 million in 2Q22). This result is due to the mark-to-market variation (in 2Q23 it was negative by R$22.1 million, while in 2Q22 it was positive by R$4.4 million). In the accumulated, net income went from R$ 27.1 million in 1H22 to R$ 87.8 million in 1H23 due to the higher sales margin between the periods.
| RESULTS | 2Q23 | 20 |
| |
| 5.1 | Operational Performance |
Copel was a pioneer in creating an energy trader and the first to sell energy to free consumers, when this category was created in the country, in 1995. Copel Mercado Livre, created in 2016, is already the largest in the country in terms of energy volume marketed in the free contracting environment, offering more savings and peace of mind for customers from all regions of Brazil.
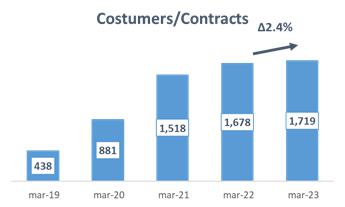
For a long time known as Copel Energia, Copel Mercado Livre is responsible for trading energy and providing services in the ACL. In June 2023, the Company registered 1,719 clients/contracts, an increase of 2.4% compared to the same period of the previous year. The amount of energy sold reached 5,304 GWh sold in 2Q23, a decrease of 11.5% compared to 2Q22. The graph below shows the evolution of Copel Mercado Livre in terms of the amount of GWh sold and the number of final consumers.

| RESULTS | 2Q23 | 21 |
| |
| 6. ESG Performance |
| 6.1 Copel pioneers in ESG in the sector |
Copel was the first company in the industry to produce an Environmental Impact Report for a generation project, and the first energy company in Brazil to become a signatory of the UN Global Compact in 2000. The Company promotes actions to disseminate the UN’s Agenda 2030 and implement the SDGs of the electricity sector. In 2020/2021, Copel participated in the Global Compact Program “SDG Ambition”. Copel joined the “Pact on Water and Energy Resilience” Commitment and received the Federal Government’s Pro Gender and Race Equality Seal. The Company received the Pró-Ética Seal, 2018-2019 and 2020-2021 editions, granted by the Brazillian Comptroller General (CGU) and Instituto ETHOS, for the voluntary adoption of integrity measures, for public recognition of the commitment to implement measures aimed at prevention, detection, and remediation of acts of corruption and fraud.
6.2 Recent Highlights
| § | Publication of the Stakeholder Engagement Policy; |
| § | Publication of the Biodiversity Policy; |
| § | Formalized the Brazilian Business Commitment to Biodiversity with the Brazilian Business Council for Sustainable Development (CEBDS);Copel signed in May 2022 the Letter of Commitment to the Adoption and Implementation of Metrics of Stakeholder Capitalism. |
Environmental
| § | It has a Copel 2030 Neutrality Plan, approved by the Board of Directors: focusing on science-based goals (SBTi), with the purpose of neutralizing the Emission of Greenhouse Effect Gases (GHG) of Scope 1, for the assets that Copel owns operational control (according to the concept established in the GHG Protocol methodology) by 2030; |
| § | Net Zero Ambition Movement – Copel joined the Net Zero Ambition Movement. The movement is part of the strategies developed by the Global Compact so that large companies together can promote actions that result in the reduction of 2Gton CO2e by 2030. |
Social
| § | Actions and Programs – Solidary Selective Collection; Grow Energy Program; Electricity Citizenship; Good Neighborhood Program; Diversity Commission; Human Rights; EducaODS; Illuminating Generations; More than Energy, among others. |
Governance
| § | It has Statutory Advisory Committees to the Board of Directors: Statutory Audit Committee -CAE; Statutory Sustainable Development Committee -CDS, Investment and Innovation Committee -CII and Minority Shareholders Committee -CDM; |
| § | The Board of Directors is made up mostly of independent members; |
| § | The Statutory Audit Committee -CAE is made up of independent members, one of whom is an external member; |
| § | Establishment of variable remuneration with ESG targets –2022: 30% of PPD; |
| § | Listed under B3 Governance Level 2. |
Priority SDG of the Brazilian Electricity Sector

| RESULTS | 2Q23 | 22 |
| |
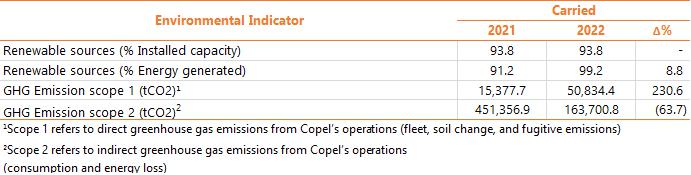
6.3 Indicators
The indicators may change due to the assurance of the independent external audit.


6.4 Ratings, Rankings, and Indexes
| Index | Ranking | Reference Year: |
 | 14th position | 2022 |
 | CSA Score 68 | 2022 |
 | B | 2022 |
 | yes | 2023 |
 | ||
 | Low Risk | 2023 |
 | A | 2023 |
| RESULTS | 2Q23 | 23 |
| |
7. Other highlights |
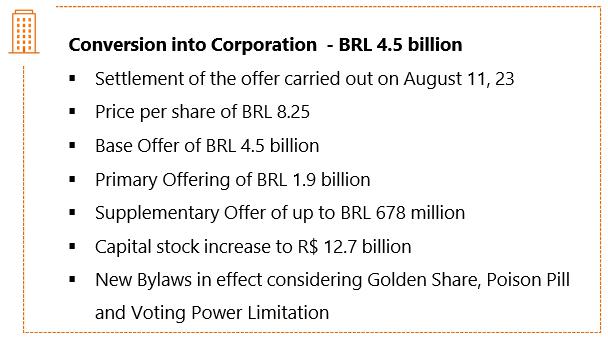
Conversion into Corporation – Public Offering of Shares
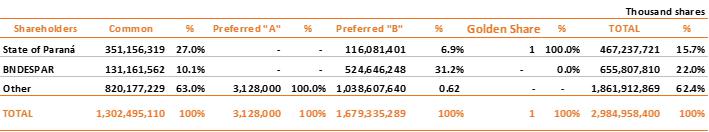
According to Material Fact 06/22 of November 21, 2022, the State of Paraná, the Company's controlling shareholder, expressed its intention to convert Copel into a diluted-capital company, with no controlling shareholder (corporation), through a public offering for secondary distribution of common shares and/or share deposit certificates (units) issued by the Company. On July 26, 2023, Copel submitted to the Brazilian Securities and Exchange Commission a request for automatic registration of public offering for primary and secondary distribution of, initially, 549,171,000 common shares issued by the Company, all registered, book-entry with no par value, free and clear of any liens or encumbrances. On August 11, 2023, the offering was settled at the price of R$7.85 per share, amounting to R$ 4,530.6 million, distributed as follows:
(i) primary distribution of 229,886,000 shares issued by the Company, totaling R$1,896.6 million; and (ii) secondary distribution of 319,285,000 shares sold by the State of Paraná, totaling R$2,634.1 million.
The offering was carried out in Brazil, in the over-the-counter market, targeted at investors in general, pursuant to CVM Resolution 160, with efforts to place the Shares abroad.
Pursuant to article 51 of CVM Resolution 160, the offering may be increased by an additional lot equivalent to 15% of the total shares initially offered, that is, up to 82,375,650 shares, under the same conditions and at the same share price initially offered. The deadline for settlement of additional shares is September 12, 2023. With the settlement of the share offering, Copel's Share Capital increased from R$10,800.0 million to R$ 12,680.1 million, considering transaction costs proportional to the primary offer.
The table below presents the updated breakdown of shares (with no par value):
More information is available in Note 39.1 to our June 2023 Interim Financial Statements.
General Meeting of Debenture holders - Waiver fee
As a result of the transformation process of Copel into a Corporation, General Meetings of Debenture Holders were held to resolve on the consent to carry out the operation, through financial consideration (waiver fee), so that the change in share control would not characterize an event of maturity advance payment of the Company's debts. The financial consideration was conditioned to the success of the offer, with payment within ten days of its settlement.
More information is available in Note 21.3 to our June 2023 Interim Financial Statements.
Change in the Board of Directors
At the Extraordinary General Meeting held on August 10, 2023, the holders of preferred shares and common shares elected the composition of the members of the Board of Directors to replace the members of the Board of Directors who requested resignation and elected by multiple vote. More information on the Composition of the Company's Board of Directors is available on the Company's Corporate Governance website.
Amendment to the Bylaws
On July 10, 2023, the Extraordinary Shareholders' General Meeting approved the proposal to amend Copel's Bylaws forwarded by the Company's Board of Directors, with the main amendments as follows: Conversion into Corporation, Golden Share, Poison Pill and Limited Voting Power. The resolution of the EGM was conditioned to the effective Transformation into a Corporation, so that the said statute took effect from the settlement date of the public offering. More information is available in Material Fact 08/23, Notice to the Market 16/23 and Material Fact 15/23.
| RESULTS | 2Q23 | 24 |
| |
Approval of the Concession Bonuses of the Foz do Areia, the Segredo and the Salto Caxias HPPs
On August 2, 2023, the Federal Accounting Court (“TCU”) sitting en banc, under case TC 006.952/2023-2, approved the amount of R$3.7 billion established in Interministerial Ordinance 7 of the Ministries of Mines, Energy and Finance – MME/MF No. 01 for payment as a bonus for granting the concession of electricity generation for the set of Hydroelectric Power Plants (“HPPs”) Governador Bento Munhoz da Rocha Netto (“Foz do Areia”), Governador Ney Aminthas de Barros Braga (“Segredo”), and Governador José Richa (“Salto Caxias”). More information is available in Material Fact 13/23.
Public Hearing
The Government of the State of Paraná (the Company's controlling shareholder), through the the Control Council of State-Owned Companies (CCEE - Conselho de Controle das Empresas Estaduais), decided to submit to Public Hearing the process of converting Copel into a diluted-capital company, with no controlling shareholder (corporation), with the objective of guaranteeing the publicity of all the relevant conditions of the process and obtaining suggestions and contributions for its improvement. The hearing was held on June 1, 2023, and the documents can be accessed at https://www.casacivil.pr.gov.br/Pagina/Conselho-de-Controle-das-Empresas-Estaduais-CCEE.
Available Cash Flow and Dividends
The Available Cash Flow is defined in the Dividend Policy as: FCD = Cash generated by Operating activities, deducted from the net cash used by investing activities, as follows: (a) Cash generated by Operating Activities: cash generated by operating activities in the fiscal year, before taxes, contributions (IRCS) and financial charges; (b) Net cash used by Investing activities: amount invested in noncurrent assets in the fiscal year. The Table below shows the calculation of FCD as of June 30, 2023:
| R$'000 | |
| 06/30/23 | |
| Cash generated by operating activities | 2.557.882 |
| Net cash used from investing activities | (2.069.181) |
| AVAILABLE CASH FLOW "ACF" | 488.701 |
Increase in the Annual Permitted Revenues (“RAPs”) for the 2023-2024 Cycle
Through Approval Resolution No. 3,216 of 2023, the Brazilian Electricity Regulatory Agency (ANEEL) established the Annual Permitted Revenues (“RAPs”) for electricity transmission assets for the 2023-2024 cycle, effective from July 1st, 2023. According to said resolution, Annual Permitted Revenues for the operational transmission assets owned by Copel Geração e Transmissão and by SPEs, in which a 100% stake is held for the 2023/2024 cycle, will be R$1,049.2 million. Additionally, considering the Annual Permitted Revenues approved for Special Purpose Entities (“SPEs”) in which Copel GeT has a stake, the total consolidated amount for Copel GeT will now be R$1,561.9 million, up by about 13% compared to the previous cycle. More information is available in Appendix IV – Transmission Operational Data.
Copel Distribuição Tariff Increase
O As of June 24, 2023, the new tariffs of Copel Distribuição came into force, with increases approved by the Brazilian Electricity Regulatory Agency (ANEEL), with the average effect of 10.50% to be noted by consumers. More information is available in Notice to the Market 13/23.
Authorization for Transmission Reinforcements and Improvements
On May 23, 2023, Authorizing Resolutions No. 14,531/2023 and No. 14,711/2023 were published in the Federal Official Gazette, which authorize, respectively, subsidiary Copel Geração e Transmissão S.A (“Copel GeT”) to make improvements in transmission facilities under its responsibility (Concession Agreement 060/2001), and Costa Oeste Transmissora de Energia, a wholly-owned subsidiary of Copel GeT, to reinforce the 230 kV Umuarama Sul substation. The aforementioned resolutions, together with ReA ANEEL No. 13,573/2023 and ANEEL Decision No. 618/2023, represent a potential investment of R$204.6 million and an increase of R$32.6 million in the Annual Permitted Revenue after the start-up of the equipment, which has up to 36 months to be installed.
Fitch reaffirms ‘AAA(bra)’ Rating of Copel and its subsidiaries
On May 31, 2023, the risk rating agency Fitch Ratings (“Fitch”) reaffirmed the 'AAA (bra)' long-term rating of Copel and its wholly-owned subsidiaries Copel Geração e Transmissão (“Copel GeT”) and Copel Distribution (“Copel Dis”), the highest possible on the Fitch scale. At the same time, the outlook for the corporate ratings remained as stable. Additional information is provided in Notice to the Market 11/23.
| RESULTS | 2Q23 | 25 |
| |
.Disclaimer
The information contained in this press release may contain forward-looking statements that reflect management’s current view and estimates of future economic circumstances, industry conditions, company performance, and financial results. Any statements, expectations, capabilities, plans and assumptions contained in this press release that do not describe historical facts such as statements regarding the declaration or payment of dividends, the direction of future operations, the implementation of relevant operating and financial strategies, the investment program, factors or trends affecting the Company’s financial condition, liquidity or results of operations are forward-looking statements within the meaning of the U.S. Private Securities Litigation Reform Act of 1995 and involve a number of risks and uncertainties. There is no guarantee that these results will actually occur. The statements are based on many assumptions and factors, including general economic and market conditions, industry conditions and operating factors. Any changes in such assumptions or factors could cause actual results to differ materially from current expectations.
Investor Relations ri@copel.com Phone: +55 (41) 3331-4011 |
|
| RESULTS | 2Q23 | 26 |
| |
| RESULTS | 2Q23 | 27 |
| |
| Exhibit I - CONSOLIDATED RESULTS > INCOME STATEMENT | |||||||
| R$ '000 | |||||||
| Income Statement | 2Q23 | 2Q22 | Δ% | 1H23 | 1H22 | Δ% | |
| OPERATING REVENUES | 5,359,727 | 5,258,566 | 1.9 | 10,890,393 | 10,846,315 | 0.4 | |
| Electricity sales to final customers | 1,825,581 | 1,862,709 | (2.0) | 3,729,740 | 3,996,862 | (6.7) | |
| Electricity sales to distributors | 847,446 | 932,703 | (9.1) | 1,740,110 | 1,934,378 | (10.0) | |
| Use of the main distribution and transmission grid | 1,349,244 | 1,097,535 | 22.9 | 2,845,462 | 2,360,439 | 20.5 | |
| Construction revenue | 604,038 | 547,307 | 10.4 | 1,135,398 | 1,034,370 | 9.8 | |
| Fair value of assets from the indemnity for the concession | 7,880 | 34,756 | (77.3) | 33,615 | 77,305 | (56.5) | |
| Distribution of piped gas | 256,572 | 328,353 | (21.9) | 516,690 | 561,442 | (8.0) | |
| Result of Sectorial financial assets and liabilities | 362,227 | 354,323 | 2.2 | 606,453 | 678,508 | (10.6) | |
| Other operating revenues | 106,740 | 100,880 | 5.8 | 282,927 | 203,011 | 39.4 | |
| OPERATING COSTS AND EXPENSES | (4,681,494) | (5,079,081) | (7.8) | (9,102,008) | (9,609,131) | (5.3) | |
| Electricity purchased for resale | (1,877,592) | (1,918,409) | (2.1) | (3,698,567) | (3,857,907) | (4.1) | |
| Charge of the main distribution and transmission grid | (682,725) | (503,440) | 35.6 | (1,370,296) | (1,278,415) | 7.2 | |
| Personnel and management | (300,713) | (232,880) | 29.1 | (725,883) | (515,205) | 40.9 | |
| Pension and healthcare plans | (67,235) | (66,497) | 1.1 | (133,233) | (134,582) | (1.0) | |
| Materials and supplies | (20,815) | (26,948) | (22.8) | (41,738) | (45,184) | (7.6) | |
| Materials and supplies for power eletricity | (3,810) | (1,499) | 154.1 | (10,560) | (86,930) | (87.9) | |
| Natural gas and supplies for the gas business | (186,424) | (251,003) | (25.7) | (368,206) | (438,415) | (16.0) | |
| Third-party services | (235,529) | (196,668) | 19.8 | (473,086) | (364,598) | 29.8 | |
| Depreciation and amortization | (357,622) | (321,494) | 11.2 | (710,272) | (641,872) | 10.7 | |
| Provisions and reversals | (224,925) | (59,889) | 275.6 | (214,202) | (175,837) | 21.8 | |
| Construction cost | (596,425) | (545,528) | 9.3 | (1,125,406) | (1,022,245) | 10.1 | |
| Other cost and expenses | (127,679) | (144,263) | (11.5) | (230,559) | (237,378) | (2.9) | |
| PROVISION FOR ALLOCATION OF PIS AND COFINS | - | (810,563) | - | - | (810,563) | - | |
| EQUITY IN EARNINGS OF SUBSIDIARIES | 72,745 | 208,425 | (65.1) | 176,833 | 321,206 | (44.9) | |
| PROFIT BEFORE FINANCIAL RESULTS AND TAXES | 750,978 | 387,910 | 93.6 | 1,965,218 | 1,558,390 | 26.1 | |
| FINANCIAL RESULTS | (243,459) | (1,278,799) | (81.0) | (576,598) | (1,492,026) | (61.4) | |
| Financial income | 313,314 | 270,911 | 15.7 | 553,953 | 530,786 | 4.4 | |
| Financial expenses | (556,773) | (538,340) | 3.4 | (1,130,551) | (1,011,442) | 11.8 | |
| OPERATIONAL EXPENSES/ INCOME | 507,519 | (890,889) | - | 1,388,620 | 66,364 | - | |
| INCOME TAX AND SOCIAL CONTRIBUTION ON PROFIT | (199,813) | 368,518 | - | (445,424) | 81,056 | - | |
| Income tax and social contribution on profit | (200,109) | (114,422) | 74.9 | (361,932) | (388,271) | (6.8) | |
| Deferred income tax and social contribution on profit | 296 | 482,940 | (99.9) | (83,492) | 469,327 | - | |
| NET PROFIT | 307,706 | (522,371) | - | 943,196 | 147,420 | - | |
| Attributed to shareholders of the parent company - continuous operations | 317,792 | (536,523) | - | 944,382 | 127,818 | - | |
| Attributed to non-controlling shareholders | (10,086) | 14,152 | - | (1,186) | 19,602 | - | |
| EBITDA | 1,108,599 | 709,404 | 56.3 | 2,675,490 | 2,200,262 | 21.6 | |
| RESULTS | 2Q23 | 28 |
| |
| Exhibit I - CONSOLIDATED RESULTS > BALANCE SHEET | ||||||||
| R$'000 | R$'000 | |||||||
| Assets | Jun-23 | Dec-22 | Δ% | Liabilities | Jun-23 | Dec-22 | Δ% | |
| CURRENT | 11,108,509 | 9,327,249 | 19.1 | CURRENT | 7,571,229 | 7,156,597 | 5.8 | |
| Cash and cash equivalents | 4,447,484 | 2,678,457 | 66.0 | Payroll, social charges and accruals | 280,944 | 252,789 | 11.1 | |
| Bonds and securities | 94 | 93 | 1.0 | Suppliers | 2,083,527 | 2,090,022 | (0.3) | |
| Collaterals and escrow accounts | 221 | 157 | 41.0 | Income tax and social contribution payable | 121,947 | 156,191 | (21.9) | |
| Customers | 3,315,418 | 3,342,050 | (0.8) | Other taxes due | 286,626 | 303,606 | (5.6) | |
| Dividends receivable | 52,175 | 138,330 | (62.3) | Loans and financing | 310,946 | 278,838 | 11.5 | |
| Sectorial financial assets | - | 190,699 | - | Debentures | 1,977,145 | 1,346,347 | 46.9 | |
| Account receivable related to concession | 9,385 | 8,603 | 9.1 | Minimum compulsory dividend payable | 192,836 | 482,325 | (60.0) | |
| Contract Assets | 267,310 | 220,660 | 21.1 | Post employment benefits | 85,814 | 73,814 | 16.3 | |
| Other current receivables | 1,064,925 | 897,380 | 18.7 | Customer charges due | 60,966 | 46,488 | 31.1 | |
| Inventories | 216,646 | 194,850 | 11.2 | Research and development and energy efficiency | 336,536 | 370,244 | (9.1) | |
| Income tax and social contribution | 364,309 | 355,065 | 2.6 | Accounts Payable related to concession | 100,486 | 105,003 | (4.3) | |
| Other current recoverable taxes | 1,310,951 | 1,239,694 | 5.7 | Net sectorial financial liabilities | 971,470 | 433,914 | 123.9 | |
| Prepaid expenses | 58,720 | 60,076 | (2.3) | Lease liability | 62,239 | 64,870 | (4.1) | |
| Related parties | 871 | 1,135 | (23) | Other accounts payable | 699,747 | 601,619 | 16.3 | |
| NON-CURRENT | 42,898,565 | 40,376,451 | 6.2 | PIS and COFINS to be refunded to costumers | - | 550,527 | - | |
| Long Term Assets | 16,706,395 | 16,442,145 | 1.6 | NON-CURRENT | 24,424,913 | 21,415,878 | 14.1 | |
| Bonds and securities | 512,147 | 430,963 | 18.8 | Suppliers | 134,731 | 125,448 | 7.4 | |
| Other temporary investments | 30,616 | 25,619 | 19.5 | Deferred income tax and social contribution | 1,778,207 | 1,517,682 | 17.2 | |
| Customers | 117,665 | 109,819 | 7.1 | Other taxes due | 628,191 | 633,491 | (0.8) | |
| Judicial deposits | 641,506 | 632,458 | 1.4 | Loans and financing | 5,147,214 | 4,371,525 | 17.7 | |
| Sectoral financial assets | 77,334 | 190,699 | (59.4) | Debentures | 8,872,408 | 6,457,508 | 37.4 | |
| Account receivable related to concession | 2,539,161 | 2,269,690 | 11.9 | Post employment benefits | 1,006,133 | 996,223 | 1.0 | |
| Contract Assets | 7,457,254 | 7,452,019 | 0.1 | Research and development and energy efficiency | 275,205 | 244,514 | 12.6 | |
| Other non-current receivables | 1,359,257 | 931,452 | 45.9 | Accounts Payable related to concession | 790,539 | 832,539 | (5.0) | |
| Income tax and social contribution | 128,398 | 127,824 | 0.4 | Net sectorial financial liabilities | 26,274 | 49,341 | (46.8) | |
| Deferred income tax and social contribution | 1,617,571 | 1,644,299 | (1.6) | Lease liability | 218,287 | 208,886 | 4.5 | |
| Other non-current recoverable taxes | 2,218,040 | 2,627,293 | (15.6) | Other accounts payable | 1,041,669 | 645,234 | 61.4 | |
| Prepaid expenses | 7,446 | 10 | - | PIS and COFINS to be refunded to costumers | 625,937 | 1,444,631 | (56.7) | |
| Investments | 3,503,682 | 3,325,731 | 5.4 | Provision for allocation of Pis and Cofins credits | 1,912,748 | 1,851,257 | 3.3 | |
| Property, plant and equipment, net | 10,952,699 | 10,069,468 | 8.8 | Provisions for litigation | 1,967,370 | 2,037,599 | (3.4) | |
| Intangible assets | 11,470,674 | 10,277,727 | 11.6 | EQUITY | 22,010,932 | 21,131,225 | 4.2 | |
| Right to use an asset | 265,115 | 261,380 | 1.4 | Attributed to controlling shareholders | 21,760,819 | 20,817,364 | 4.5 | |
| TOTAL | 54,007,074 | 49,703,700 | 8.7 | Share capital | 10,800,000 | 10,800,000 | - | |
| Equity valuation adjustments | 575,778 | 593,382 | (3.0) | |||||
| Legal reserves | 1,512,687 | 1,512,687 | - | |||||
| Retained earnings | 7,911,295 | 7,911,295 | - | |||||
| Accrued earnings | 961,059 | - | - | |||||
| Attributable to non-controlling interest | 250,113 | 313,861 | (20.3) | |||||
| TOTAL | 54,007,074 | 49,703,700 | 8.7 | |||||
| RESULTS | 2Q23 | 29 |
| |
| Exhibit I - CONSOLIDATED RESULTS > CASH FLOW | ||
| R$'000 | ||
| 06/30/23 | 06/30/22 | |
| CASH FLOWS FROM OPERATIONAL ACTIVITIES | ||
| Net income | 943,196 | 147,420 |
| Adjustments to reconcile net income for the period with cash generation from operating activities: | 2,028,679 | 1,910,094 |
| Unrealized monetary and exchange variation and debt charges - net | 808,716 | 690,867 |
| Interest - bonus from the grant of concession agreements under the quota system | (62,359) | (78,146) |
| Remuneration of transmission concession contracts | (393,015) | (547,268) |
| Provision for allocation of PIS and Cofins credits | - | 1,821,933 |
| Income tax and social contribution | 361,932 | 388,271 |
| Deferred income tax and social contribution | 83,492 | (469,327) |
| Equity in earnings of investees | (176,833) | (321,206) |
| Appropriation of post-employment benefits obligations | 132,804 | 131,075 |
| Creation for research and development and energy efficiency programs | 79,849 | 76,881 |
| Recognition of fair value of assets from the indemnity for the concession | (33,615) | (77,305) |
| Sectorial financial assets and liabilities result | (668,268) | (747,667) |
| Depreciation and amortization | 710,272 | 641,872 |
| Net operating estimated losses, provisions and reversals | 214,202 | 175,837 |
| Realization of added value in business combinations | (361) | (361) |
| Fair value in energy purchase and sale operations | (28,177) | 17,393 |
| Derivatives fair value | - | 2,907 |
| Loss on disposal of accounts receivable related to concession | 144 | 26,625 |
| Loss on disposal of contract assets | 5,147 | 4,742 |
| Loss on disposal of property, plant and equipment | 3,199 | 874 |
| Loss on disposal of intangible assets | 48,138 | 24,731 |
| Result of write-offs of use rights of assets and liabilities of leases - net | 216 | �� (54) |
| Decrease (increase) in assets | 592,217 | 1,905,018 |
| Trade accounts receivable | 409,638 | 1,091,748 |
| Dividends and interest on own capital received | 95,557 | 52,223 |
| Judicial deposits | 12,688 | (10,546) |
| Sectorial financial assets | 67,123 | 606,154 |
| Other receivables | (85,971) | 113,186 |
| Inventories | (17,485) | (9,010) |
| Income tax and social contribution recoverable | (12,648) | (50,082) |
| Other taxes recoverable | 128,907 | 115,107 |
| Prepaid expenses | (5,856) | (2,810) |
| Related parties | 264 | (952) |
| Increase (decrease) in liabilities | (63,014) | (860,789) |
| Payroll, social charges and accruals | 123,222 | (183,119) |
| Related parties | - | - |
| Suppliers | (141,719) | (529,029) |
| Other taxes | 327,224 | 325,078 |
| Post-employment benefits | (110,894) | (97,848) |
| Sectorial charges due | 14,478 | (145,853) |
| Research and development and energy efficiency | (96,911) | (116,075) |
| Payable related to the concession | (58,124) | (53,735) |
| Other accounts payable | 15,945 | 48,109 |
| Provisions for legal claims | (136,235) | (108,317) |
| CASH GENERATED BY OPERATING ACTIVITIES | 2,557,882 | 2,954,323 |
| Income tax and social contribution paid | (346,529) | (206,005) |
| Loans and financing - interest due and paid | (271,476) | (166,625) |
| Debentures - interest due and paid | (455,091) | (370,660) |
| Charges for lease liabilities paid | (12,240) | (9,737) |
| Charges on loans granted/obtained from related parties | - | - |
| NET CASH GENERATED FROM OPERATING ACTIVITIES | 1,472,546 | 2,201,296 |
| CASH FLOWS FROM INVESTMENT ACTIVITIES | ||
| Financial investments | (60,051) | 77,638 |
| Loans and financing granted to related parties | - | - |
| Receipt of loans and financing granted to related parties | - | - |
| Additions to contract assets | (958,578) | (1,021,933) |
| Acquisitions of subsidiaries - effect on cash | (911,450) | - |
| Additions in investments | (10,780) | (4,829) |
| Capital reduction of investees | - | 61,537 |
| Additions to property, plant and equipment | (123,612) | (353,477) |
| Additions to intangible assets | (4,710) | (3,468) |
| NET CASH USED FROM INVESTING ACTIVITIES | (2,069,181) | (1,244,532) |
| CASH FLOWS FROM FINANCING ACTIVITIES | ||
| Loans and financing obtained from third parties | 31,303 | 121,927 |
| Issue of debentures | 2,900,000 | 1,500,000 |
| Transaction costs in the issuing of debentures | (18,889) | (14,445) |
| Payments of principal - loans and financing | (129,139) | (242,732) |
| Payments of principal - debentures | (25,321) | (526,655) |
| Amortization of principal of lease liabilities | (35,682) | (26,327) |
| Dividends and interest on own capital paid | (356,610) | (1,623,198) |
| NET CASH GENERATED (USED) FROM FINANCING ACTIVITIES | 2,365,662 | (811,430) |
| TOTAL EFFECTS ON CASH AND CASH EQUIVALENTS | 1,769,027 | 145,334 |
| Cash and cash equivalents at the beginning of the period | 2,678,457 | 3,472,845 |
| Cash and cash equivalents at the end of the period | 4,447,484 | 3,618,179 |
| CHANGE IN CASH AND CASH EQUIVALENTS | 1,769,027 | 145,334 |
| RESULTS | 2Q23 | 30 |
| |
| Exhibit I - CONSOLIDATED RESULTS > ADJUSTED EBITDA AND FINANCIAL RESULT | ||||||
| R$'000 | ||||||
| 2Q23 | 2Q22 | Δ% | 1H23 | 1H22 | Δ% | |
| EBITDA | 1,108,602 | 709,400 | 56.3 | 2,675,499 | 2,200,258 | 21.6 |
| (-)/+ Fair value in the purchase and sale of energy | 22,114 | (4,441) | (28,177) | 17,393 | ||
| (-)/+ Impairment | 149,074 | 42,129 | 112,149 | 42,129 | ||
| (-)/+ Tariff flag account on MMGD | - | - | - | (43,447) | ||
| (-)/+ Reflection on PIS/Cofins Provision | - | (58,119) | - | (58,119) | ||
| (-)/+ indemnity of adittional third of vacation bonus | - | - | 138,173 | - | ||
| (-)/+ Provision for allocation of PIS/Cofins Credits | - | 810,563 | - | 810,563 | ||
| (-)/+ Provision/Reversal of PDI indemnities | - | - | - | (7,880) | ||
| Adjusted EBITDA | 1,279,790 | 1,499,532 | (14.7) | 2,897,644 | 2,960,897 | (2.1) |
| (-)/+ Equity in earnings of subsidiaries | (72,745) | (208,425) | (65.1) | (176,833) | (321,206) | (44.9) |
| Adjusted EBITDA without earnings of subsidiaries | 1,207,046 | 1,291,107 | (6.5) | 2,720,812 | 2,639,691 | 3.1 |
| R$'000 | ||||||
| 2Q23 | 2Q22 | Δ% | 1H23 | 1H22 | Δ% | |
| Financial Revenues | 313,314 | 270,911 | 15.7 | 553,953 | 530,786 | 4.4 |
| Income from investments held for trading | 111,124 | 125,701 | (11.6) | 208,728 | 213,645 | (2.3) |
| Late fees on electricity bills | 59,438 | 86,640 | (31.4) | 115,007 | 163,057 | (29.5) |
| Monetary restatement and adjustment to present value of accounts payable related to concession | 48,801 | 1,909 | - | 56,176 | 3,195 | - |
| Income from sectorial assets and liabilities | 20,710 | 43,631 | (52.5) | 45,905 | 75,760 | (39.4) |
| Exchange variation About Purchase Itaipu Electric Power | 9,776 | 9,826 | (0.5) | 13,114 | 39,333 | (66.7) |
| Interest on taxes to be compensated | 16,614 | 17,002 | (2.3) | 34,305 | 32,009 | 7.2 |
| Income and monetary restatement of judicial deposits | 12,445 | 9,132 | 36.3 | 28,587 | 19,510 | 46.5 |
| Other financial revenues | 45,697 | (11,645) | - | 72,000 | 5,789 | - |
| (-) Pis/Pasep and Cofins on revenues | (11,291) | (11,285) | 0.1 | (19,869) | (21,512) | (7.6) |
| Financial Expenses | (556,773) | (538,340) | 3.4 | (1,130,551) | (1,011,442) | 11.8 |
| Monetary variation, foreign exchange and debt service charges | (445,134) | (417,464) | 6.6 | (912,083) | (765,194) | 19.2 |
| Monetary variation and adjustment to present value of accounts payable related to concession | (32,958) | (48,595) | (32.2) | (67,783) | (120,070) | (43.5) |
| Exchange variation About Purchase Itaipu Electric Power | (899) | (9,934) | (91.0) | (1,712) | (14,534) | (88.2) |
| Pis/ Pasep and Cofins taxes over interest on equity | (1,258) | (12,378) | (89.8) | (1,258) | (12,378) | (89.8) |
| Income from sectorial assets and liabilities | (1,324) | (3,505) | (62.2) | (2,929) | (7,296) | (59.9) |
| Derivatives fair value - forward contract | - | (2,907) | - | - | (2,907) | - |
| Interest on R&D and PEE | (6,739) | (8,156) | (17.4) | (14,045) | (16,201) | (13.3) |
| Interest on tax installments | (10,318) | (9,264) | 11.4 | (20,879) | (17,013) | 22.7 |
| Interest on lease liabilities | (6,537) | (5,210) | 25.5 | (12,254) | (9,075) | 35.0 |
| Monetary variation of litigation | (41,697) | (6,118) | - | (71,247) | (10,617) | - |
| Other financial expenses | (9,909) | (14,809) | (33.1) | (26,361) | (36,157) | (27.1) |
| (-) Update of provision for allocation of PIS and Cofins credits | - | (1,011,370) | - | - | (1,011,370) | - |
| Financial income (expenses) | (243,459) | (1,278,799) | (81.0) | (576,598) | (1,492,026) | (61.4) |
| RESULTS | 2Q23 | 31 |
| |
| Exhibit I - CONSOLIDATED RESULTS > EQUITY IN EARNINGS OF SUBSIDIARIES AND INDICATORS | ||||||||
| R$'000 | ||||||||
| Variation in Equity in earnings of subsidiaries | 2Q23 | 2Q22 | Δ% | 1H23 | 1H22 | Δ% | ||
| Joint Ventures | 67,129 | 201,506 | (66.7) | 166,024 | 308,054 | (46.1) | ||
| Voltalia São Miguel do Gostoso I Participações S.A. | (1,284) | (1,064) | 20.7 | (2,525) | (3,673) | (31.3) | ||
| Caiuá Transmissora de Energia S.A. | 2,675 | 12,157 | (78.0) | 6,731 | 16,637 | (59.5) | ||
| Integração Maranhense Transmissora de Energia S.A. | 5,381 | 20,125 | (73.3) | 14,831 | 27,185 | (45.4) | ||
| Matrinchã Transmissora de Energia (TP NORTE) S.A. | 18,823 | 95,374 | (80.3) | 45,772 | 123,975 | (63.1) | ||
| Guaraciaba Transmissora de Energia (TP SUL) S.A. | 7,299 | 40,772 | (82.1) | 19,391 | 54,110 | (64.2) | ||
| Paranaíba Transmissora de Energia S.A. | 14,271 | 8,956 | 59.3 | 23,623 | 21,161 | 11.6 | ||
| Mata de Santa Genebra Transmissão S.A. | 10,737 | 9,859 | 8.9 | 33,045 | 33,431 | (1.2) | ||
| Cantareira Transmissora de Energia S.A. | 9,112 | 15,229 | (40.2) | 24,928 | 35,066 | (28.9) | ||
| Solar Paraná | 115 | 98 | 17.3 | 228 | 162 | 40.7 | ||
| Associates | 5,616 | 6,919 | (18.8) | 10,809 | 13,154 | (17.8) | ||
| Dona Francisca Energética S.A. | 1,485 | 1,720 | (13.7) | 2,518 | 3,359 | (25.0) | ||
| Foz do Chopim Energética Ltda. | 4,132 | 5,199 | (20.5) | 8,293 | 9,795 | (15.3) | ||
| Others ¹ | (1) | - | - | (2) | - | - | ||
| TOTAL | 72,745 | 208,425 | (65.1) | 176,833 | 321,208 | (44.9) | ||
| 1 Includes Carbocampel S.A. | ||||||||
| R$'000 | ||||||||
| Main Indicators -Associates Jun-23 | Dona Francisca | Foz do Chopim | ||||||
| Total assets | 174,801 | 46,654 | ||||||
| Shareholder’s equity¹ | 132,709 | 44,680 | ||||||
| Net operating revenue | 33,119 | 29,977 | ||||||
| Net Income | 10,933 | 23,181 | ||||||
| Participation in the enterprise - % | 23.0 | 35.8 | ||||||
| Investment book value | 30,561 | 15,983 | ||||||
| R$'000 | ||||||||
| Main Indicators -Joint ventures Jun-23 | Voltalia | Caiuá | Integração Maranhense | Matrinchã | Guaraciaba | Paranaíba | Mata de Santa Genebra | Cantareira |
| Total assets | 233,838 | 332,510 | 614,017 | 2,942,413 | 1,615,498 | 2,034,691 | 3,691,288 | 1,865,332 |
| Shareholder’s equity¹ | 231,533 | 269,444 | 445,128 | 1,994,495 | 992,837 | 1,174,434 | 1,447,715 | 1,016,934 |
| Net operating revenue | - | 19,797 | 36,194 | 171,052 | 89,544 | 179,359 | 223,684 | 97,769 |
| Net Income | (5,153) | 13,736 | 30,266 | 93,413 | 39,574 | 96,421 | 65,958 | 50,873 |
| Participation in the enterprise - % | 49.0 | 49.0 | 49.0 | 49.0 | 49.0 | 24.5 | 50.1 | 49.0 |
| Investment book value | 113,451 | 132,028 | 218,113 | 977,300 | 486,490 | 287,736 | 725,305 | 498,297 |
| Note: Income from Transmitters according to adjustments for the application of CPC 47 / IFRS 15 in the Corporate Statements. | ||||||||
| RESULTS | 2Q23 | 32 |
| |
| Exhibit I - CONSOLIDATED RESULTS > SHARE CAPITAL | ||||||||
| Share Capital - As of June, 30,2023 | ||||||||
| Thousand shares | ||||||||
| Shareholders | Common | % | Preferred "A" | % | Preferred "B" | % | TOTAL | % |
| State of Paraná | 734,298 | 69.7% | - | - | 116,081 | 6.9% | 850,380 | 31.1% |
| BNDESPAR | 131,162 | 12.4% | - | - | 524,646 | 31.2% | 655,808 | 24.0% |
| Free Floating | 170,036 | 16.1% | 682 | 21.8% | 1,037,596 | 61.8% | 1,208,313 | 44.2% |
| B3 | 140,099 | 13.3% | 682 | 21.8% | 916,876 | 54.6% | 1,057,657 | 38.6% |
| NYSE | 29,717 | 2.8% | - | - | 118,867 | 7.1% | 148,583 | 5.4% |
| LATIBEX | 220 | 0.0% | - | - | 1,853 | 0.1% | 2,073 | 0.1% |
| Other | 18,595 | 1.8% | 2,446 | 78.2% | 1,012 | 0.1% | 22,053 | 0.8% |
| TOTAL | 1,054,090 | 100% | 3,128 | 100% | 1,679,335 | 100% | 2,736,554 | 100% |
| Thousand shares | ||||||||
| Shareholders | UNIT | % | ||||||
| State of Paraná | 28,986 | 13.6% | ||||||
| BNDESPAR | 131,162 | 61.3% | ||||||
| Free Floating | 53,597 | 25.1% | ||||||
| B3 | 23,660 | 11.1% | ||||||
| NYSE | 29,717 | 13.9% | ||||||
| LATIBEX | 220 | 0.1% | ||||||
| Other | 70 | - | ||||||
| TOTAL | 213,815 | 100% | ||||||
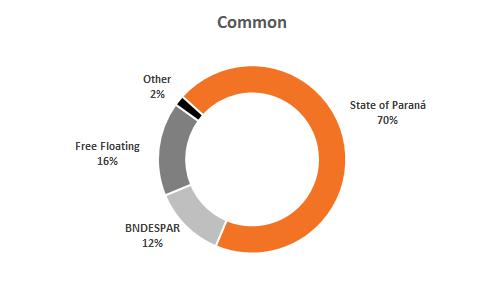 |  |
| RESULTS | 2Q23 | 33 |
| |
| Exhibit II- RESULT BY SUBSIDIARY > COPEL GET (CONSOLIDATED) | ||||||
| R$'000 | ||||||
| Income Statement | 2Q23 | 2Q22 | Δ% | 1H23 | 1H22 | Δ% |
| OPERATING REVENUES | 1,192,037 | 1,276,252 | (6.6) | 2,537,896 | 2,675,847 | (5.2) |
| Electricity sales to final customers | 9 | 17 | (47.1) | - | 100 | - |
| Electricity sales to distributors | 938,402 | 911,814 | 2.9 | 1,946,084 | 1,939,235 | 0.4 |
| Use of the main transmission grid | 212,736 | 331,264 | (35.8) | 505,775 | 647,158 | (21.8) |
| Construction revenue | 33,202 | 21,085 | 57.5 | 71,594 | 64,766 | 10.5 |
| Other operating revenues | 7,688 | 12,072 | (36.3) | 14,443 | 24,588 | (41.3) |
| OPERATING COSTS AND EXPENSES | (873,132) | (641,199) | 36.2 | (1,527,680) | (1,351,612) | 13.0 |
| Electricity purchased for resale | (53,956) | (59,421) | (9.2) | (71,973) | (113,774) | (36.7) |
| Charges of main distribution and transmission grid | (158,725) | (133,158) | 19.2 | (312,456) | (265,624) | 17.6 |
| Personnel and management | (97,412) | (75,883) | 28.4 | (229,011) | (164,264) | 39.4 |
| Pension and healthcare plans | (20,776) | (19,985) | 4.0 | (41,220) | (40,176) | 2.6 |
| Materials and supplies | (4,648) | (4,933) | (5.8) | (8,946) | (8,428) | 6.1 |
| Materials and supplies for power eletricity | (4,200) | (1,583) | - | (11,078) | (89,760) | (87.7) |
| Third-party services | (73,375) | (52,329) | 40.2 | (138,546) | (101,332) | 36.7 |
| Depreciation and amortization | (214,730) | (192,334) | 11.6 | (416,745) | (382,640) | 8.9 |
| Provisions and reversals | (162,348) | (6,336) | - | (129,783) | (12,687) | - |
| Construction cost | (25,590) | (19,306) | 32.5 | (61,603) | (52,641) | 17.0 |
| Other cost and expenses | (57,372) | (75,931) | (24.4) | (106,319) | (120,286) | (11.6) |
| EQUITY IN EARNINGS OF SUBSIDIARIES | 72,427 | 207,670 | (65.1) | 176,613 | 321,359 | (45.0) |
| PROFIT BEFORE FINANCIAL RESULTS AND TAXES | 391,332 | 842,723 | (53.6) | 1,186,829 | 1,645,594 | (27.9) |
| FINANCIAL RESULTS | (196,184) | (180,005) | 9.0 | (415,776) | (340,287) | 22.2 |
| Financial income | 94,434 | 79,866 | 18.2 | 180,459 | 141,677 | 27.4 |
| Financial expenses | (290,618) | (259,871) | 11.8 | (596,235) | (481,964) | 23.7 |
| OPERATIONAL EXPENSES/ INCOME | 195,148 | 662,718 | (70.6) | 771,053 | 1,305,307 | (40.9) |
| INCOME TAX AND SOCIAL CONTRIBUTION ON PROFIT | (115,440) | (159,055) | (27.4) | (278,384) | (338,290) | (17.7) |
| Income tax and social contribution on profit | (116,033) | (87,974) | 31.9 | (220,578) | (213,554) | 3.3 |
| Deferred income tax and social contribution on profit | 593 | (71,081) | - | (57,806) | (124,736) | (53.7) |
| NET INCOME (LOSS) | 79,708 | 503,663 | (84.2) | 492,669 | 967,017 | (49.1) |
| EBITDA | 606,062 | 1,035,057 | (41.4) | 1,603,574 | 2,028,234 | (20.9) |
| RESULTS | 2Q23 | 34 |
| |
| Exhibit II- RESULT BY SUBSIDIARY > COPEL DIS | ||||||
| R$'000 | ||||||
| Income Statement | 2Q23 | 2Q22 | Δ% | 1H23 | 1H22 | Δ% |
| OPERATING REVENUES | 3,629,900 | 3,225,987 | 12.5 | 7,161,541 | 6,747,954 | 6.1 |
| Electricity sales to final customers | 1,278,340 | 1,302,649 | (1.9) | 2,602,677 | 2,856,189 | (8.9) |
| Electricity sales to distributors | 58,326 | 64,517 | (9.6) | 92,441 | 117,072 | (21.0) |
| Use of the main distribution grid | 1,233,875 | 860,601 | 43.4 | 2,534,866 | 1,901,505 | 33.3 |
| Construction revenue | 567,904 | 523,320 | 8.5 | 1,057,880 | 963,288 | 9.8 |
| Fair value of assets from the indemnity for the concession | 7,880 | 30,493 | (74.2) | 33,615 | 58,963 | (43.0) |
| Sectorial assets and liabilities result | 362,226 | 354,322 | 2.2 | 606,453 | 678,508 | (10.6) |
| Other operating revenues | 121,350 | 90,085 | 34.7 | 233,609 | 172,430 | 35.5 |
| OPERATING COSTS AND EXPENSES | (3,320,743) | (3,771,798) | (12.0) | (6,559,513) | (6,967,164) | (5.9) |
| Electricity purchased for resale | (1,496,128) | (1,424,827) | 5.0 | (2,960,886) | (2,867,080) | 3.3 |
| Charges of main transmission grid | (615,533) | (458,281) | 34.3 | (1,240,661) | (1,188,096) | 4.4 |
| Personnel and management | (177,636) | (135,175) | 31.4 | (438,449) | (300,636) | 45.8 |
| Pension and healthcare plans | (42,159) | (42,414) | (0.6) | (83,704) | (85,358) | (1.9) |
| Materials and supplies | (15,753) | (20,519) | (23.2) | (31,713) | (34,587) | (8.3) |
| Third-party services | (149,080) | (129,659) | 15.0 | (304,256) | (238,380) | 27.6 |
| Depreciation and amortization | (128,816) | (111,036) | 16.0 | (253,179) | (219,561) | 15.3 |
| Provisions and reversals | (59,688) | (66,236) | (9.9) | (77,297) | (165,147) | (53.2) |
| Construction cost | (567,904) | (523,320) | 8.5 | (1,057,880) | (963,288) | 9.8 |
| Other cost and expenses | (68,045) | (49,767) | 36.7 | (111,488) | (94,467) | 18.0 |
| Provision for allocation of PIS and Cofins | - | (810,563) | - | - | (810,563) | - |
| PROFIT BEFORE FINANCIAL RESULTS AND TAXES | 309,158 | (545,812) | - | 602,028 | (219,210) | - |
| FINANCIAL RESULTS | (93,260) | (1,040,911) | (91.0) | (205,795) | (1,018,861) | (79.8) |
| Financial income | 138,693 | 147,996 | (6.3) | 254,313 | 310,134 | (18.0) |
| Financial expenses | (231,953) | (177,537) | 30.7 | (460,108) | (317,624) | 44.9 |
| Update of provision for allocation of PIS and Cofins credits | - | (1,011,370) | - | - | (1,011,370) | - |
| OPERATIONAL EXPENSES/ INCOME | 215,898 | (1,586,722) | - | 396,233 | (1,238,071) | - |
| INCOME TAX AND SOCIAL CONTRIBUTION ON PROFIT | (54,368) | 578,950 | - | (95,013) | 458,335 | - |
| Income tax and social contribution on profit | (50,295) | 16 | - | (76,614) | (134,029) | (42.8) |
| Deferred income tax and social contribution on profit | (4,073) | 578,935 | - | (18,399) | 592,364 | - |
| NET INCOME (LOSS) | 161,530 | (1,007,772) | - | 301,220 | (779,735) | - |
| EBITDA | 437,974 | (434,775) | - | 855,207 | 351 | - |
| RESULTS | 2Q23 | 35 |
| |
| Exhibit II- RESULT BY SUBSIDIARY > COPEL COM (MERCADO LIVRE) | ||||||
| R$'000 | ||||||
| Income Statement | 2Q23 | 2Q22 | Δ% | 1H23 | 1H22 | Δ% |
| OPERATING REVENUES | 915,223 | 1,164,072 | (21.4) | 2,031,875 | 2,348,115 | (13.5) |
| Electricity sales to final customers | 547,594 | 560,605 | (2.3) | 1,127,801 | 1,141,855 | (1.2) |
| Electricity sales to distributors | 389,430 | 601,781 | (35.3) | 868,733 | 1,202,193 | (27.7) |
| Other operating revenues | (21,801) | 1,686 | - | 35,341 | 4,067 | 768.9 |
| OPERATING COSTS AND EXPENSES | (905,322) | (1,137,898) | (20.4) | (1,923,546) | (2,321,204) | (17.1) |
| Electricity purchased for resale | (897,232) | (1,132,117) | (20.7) | (1,906,014) | (2,308,526) | (17.4) |
| Personnel and management | (3,641) | (2,783) | 30.8 | (9,112) | (6,229) | 46.3 |
| Pension and healthcare plans | (471) | (436) | 7.9 | (981) | (899) | 9.1 |
| Materials and supplies | (24) | (11) | 114.8 | (33) | (23) | 40.5 |
| Third-party services | (1,638) | (724) | 126.1 | (2,140) | (1,685) | 27.0 |
| Depreciation and amortization | (416) | (86) | 382.9 | (1,130) | (164) | 590.8 |
| Provisions and reversals | (784) | (580) | 35.2 | (1,249) | (1,325) | (5.7) |
| Other cost and expenses | (1,115) | (1,159) | (3.8) | (2,887) | (2,352) | 22.7 |
| PROFIT BEFORE FINANCIAL RESULTS AND TAXES | 9,901 | 26,174 | (62.2) | 108,329 | 26,911 | 302.5 |
| FINANCIAL RESULTS | 9,338 | 7,735 | 20.7 | 17,885 | 14,004 | 27.7 |
| Financial income | 9,406 | 7,932 | 18.6 | 18,037 | 14,286 | 26.3 |
| Financial expenses | (68) | (197) | (65.4) | (152) | (283) | (46.2) |
| OPERATIONAL EXPENSES/ INCOME | 19,239 | 33,909 | (43.3) | 126,214 | 40,915 | 208.5 |
| INCOME TAX AND SOCIAL CONTRIBUTION ON PROFIT | (1,905) | (11,471) | (83.4) | (38,376) | (13,835) | 177.4 |
| Income tax and social contribution on profit | (6,778) | (6,230) | 8.8 | (20,416) | (13,174) | 55.0 |
| Deferred income tax and social contribution on profit | 4,873 | (5,241) | - | (17,960) | (661) | - |
| NET INCOME (LOSS) | 17,334 | 22,438 | (22.7) | 87,838 | 27,080 | 224.4 |
| EBITDA | 10,317 | 26,260 | (60.7) | 109,459 | 27,075 | 304.3 |
| RESULTS | 2Q23 | 36 |
| |
| Exhibit II- RESULT BY SUBSIDIARY > INCOME STATEMENT FOR THE QUARTER BY COMPANY | |||||||||||||||
| R$'000 | |||||||||||||||
| Income Statement 2Q23 | GET | Distribuição | Compagas | Elejor | UEG Araucária | Serviços | Wind Farms | FDA | Bela Vista | C. Oeste, Marumbi, Uirapuru | Mercado Livre | Holding | Elimination | Consolidated | |
| Geração | Transmissão | ||||||||||||||
| NET OPERATING INCOME | 562,635 | 244,823 | 3,629,900 | 259,932 | 34,222 | - | - | 206,235 | 177,682 | 7,868 | 9,967 | 915,223 | - | (688,761) | 5,359,727 |
| Electricity sales to final customers | - | - | 1,278,340 | - | - | - | - | - | - | 9 | - | 547,594 | - | (362) | 1,825,581 |
| Electricity sales to distributors | 547,537 | - | 58,326 | - | 33,986 | - | - | 205,659 | 177,679 | 7,859 | - | 389,430 | - | (573,030) | 847,445 |
| Use of the main distribution and transmission grid (TUSD/ TUST) | - | 205,379 | 1,233,874 | - | - | - | - | - | - | - | 9,800 | - | - | (99,809) | 1,349,245 |
| Construction revenue | - | 33,042 | 567,903 | 2,932 | - | - | - | - | - | - | 160 | - | - | - | 604,038 |
| Fair value of assets from the indemnity for the concession | - | - | 7,881 | - | - | - | - | - | - | - | - | - | - | - | 7,881 |
| Distribution of piped gas | - | - | - | 257,000 | - | - | - | - | - | - | - | - | - | (429) | 256,572 |
| Sectoral assets and liabilities result | - | - | 362,227 | - | - | - | - | - | - | - | - | - | - | - | 362,227 |
| Other operating revenues | 15,098 | 6,402 | 121,349 | - | 236 | - | - | 576 | 3 | - | 7 | (21,801) | - | (15,131) | 106,739 |
| OPERATING COSTS AND EXPENSES | (354,953) | (97,536) | (3,320,743) | (208,133) | (23,093) | (172,927) | (523) | (141,491) | (111,439) | (4,788) | (2,430) | (905,322) | (5,651) | 667,536 | (4,681,494) |
| Energy purchased for resale | (26,242) | - | (1,496,129) | - | (520) | - | - | (5,663) | (22,252) | (138) | - | (897,232) | - | 570,582 | (1,877,592) |
| Charges of the main distribution and transmission grid | (99,879) | - | (615,533) | - | (5,765) | (8,709) | - | (15,906) | (39,371) | (323) | - | - | - | 102,762 | (682,725) |
| Personnel and management | �� (53,214) | (37,922) | (177,637) | (9,300) | (1,334) | (1,566) | - | (3,559) | (623) | (302) | (222) | (3,641) | (11,390) | - | (300,713) |
| Private pension and health plans | (11,777) | (8,203) | (42,159) | (1,451) | (40) | (166) | - | (488) | (88) | (23) | (31) | (471) | (2,338) | - | (67,235) |
| Materials and supplies | (2,348) | (1,399) | (15,753) | (249) | (38) | (18) | - | (178) | (611) | (3) | (89) | (24) | (103) | - | (20,815) |
| Materials and supplies for power eletricity | (3,763) | - | - | - | - | (437) | - | - | - | - | - | - | - | 390 | (3,810) |
| Natural gas and supplies for gas business | - | - | - | (186,424) | - | - | - | - | - | - | - | - | - | - | (186,424) |
| Third-party services | (23,585) | (8,536) | (149,080) | (3,082) | (4,701) | (5,245) | (78) | (38,381) | (9,594) | (828) | (1,607) | (1,639) | (5,100) | 15,924 | (235,529) |
| Depreciation and amortization | (94,660) | (3,858) | (128,816) | (3,860) | (8,473) | (5,722) | (573) | (65,032) | (31,899) | (2,822) | (11) | (416) | (753) | (10,729) | (357,622) |
| Provisions and reversals | (10,396) | (7,116) | (59,687) | 233 | - | (150,469) | - | (164) | (2) | - | (4) | (784) | 14,138 | (10,676) | (224,926) |
| Construction cost | - | (25,430) | (567,903) | (2,932) | - | - | - | - | - | - | (160) | - | - | - | (596,425) |
| Other operating costs and expenses | (29,089) | (5,073) | (68,046) | (1,067) | (2,222) | (595) | 128 | (12,121) | (6,999) | (349) | (307) | (1,115) | (105) | (717) | (127,679) |
| EQUITY IN EARNINGS OF SUBSIDIARIES | (43,513) | 74,806 | - | - | - | - | - | 6,512 | - | - | - | - | 310,575 | (275,635) | 72,745 |
| EARNINGS BEFORE INCOME TAXES | 164,169 | 222,093 | 309,157 | 51,799 | 11,129 | (172,927) | (523) | 71,256 | 66,243 | 3,080 | 7,537 | 9,901 | 304,924 | (296,860) | 750,978 |
| FINANCIAL RESULTS | (104,819) | (70,458) | (93,260) | (424) | 22,860 | 4,210 | (337) | (31,300) | 6,069 | (1,646) | 1,758 | 9,338 | 14,546 | - | (243,459) |
| Financial income | 29,558 | 16,054 | 138,693 | 7,452 | 54,776 | 5,843 | 103 | 35,954 | 6,228 | (1,646) | 2,444 | 9,406 | 18,212 | (9,762) | 313,314 |
| Financial expenses | (134,377) | (86,511) | (231,953) | (7,876) | (31,916) | (1,633) | (440) | (67,253) | (159) | (0) | (685) | (68) | (3,667) | 9,762 | (556,773) |
| OPERATIONAL EXPENSES / INCOME | 59,350 | 151,635 | 215,897 | 51,375 | 33,989 | (168,717) | (860) | 39,956 | 72,312 | 1,434 | 9,295 | 19,239 | 319,469 | (296,860) | 507,522 |
| INCOME TAX AND SOCIAL CONTRIBUTION ON PROFIT | (34,258) | (25,732) | (54,367) | (17,110) | (9,315) | (13,614) | - | (17,510) | (24,243) | (535) | (1,158) | (1,905) | (1,677) | 1,613 | (199,813) |
| NET INCOME | 25,092 | 125,903 | 161,530 | 34,265 | 24,674 | (182,331) | (860) | 22,446 | 48,069 | 900 | 8,137 | 17,334 | 317,792 | (295,247) | 307,706 |
| Attributed to controlling shareholders | 25,092 | 125,903 | 161,530 | 17,475 | 17,272 | (148,053) | (860) | 22,446 | 48,069 | 900 | 8,137 | 17,334 | 317,792 | (295,247) | 317,792 |
| Attributed to non-controlling interest | - | - | �� - | 16,790 | 7,402 | (34,278) | - | - | - | - | - | - | - | - | (10,086) |
| EBITDA | 258,829 | 225,950 | 437,973 | 55,659 | 19,602 | (167,205) | 50 | 136,288 | 98,142 | 5,902 | 7,548 | 10,317 | 305,677 | (286,131) | 1,108,600 |
| RESULTS | 2Q23 | 37 |
| |
| R$'000 | |||||||||||||||
| Income Statement 2Q22 | GET | Distribuição | Compagas | Elejor | UEG Araucária | Serviços | Wind Farms | FDA | Bela Vista | C. Oeste, Marumbi, Uirapuru | Mercado Livre | Holding | Elimination | Consolidated | |
| Geração | Transmissão | ||||||||||||||
| NET OPERATING INCOME | 609,628 | 310,178 | 3,225,987 | 335,544 | 52,531 | - | - | 134,747 | 178,072 | 6,985 | 51,794 | 1,164,072 | - | (810,973) | 5,258,566 |
| Electricity sales to final customers | 17 | - | 1,302,649 | - | - | - | - | - | - | - | - | 560,606 | - | (563) | 1,862,709 |
| Electricity sales to distributors | 592,017 | - | 64,517 | - | 52,531 | - | - | 134,747 | 178,064 | 6,985 | - | 601,781 | - | (697,940) | 932,703 |
| Use of the main distribution and transmission grid (TUSD/ TUST) | - | 280,286 | 860,601 | - | - | - | - | - | - | - | 53,553 | - | - | (96,905) | 1,097,535 |
| Construction revenue | - | 22,850 | 523,319 | 2,903 | - | - | - | - | - | - | (1,765) | - | - | - | 547,307 |
| Fair value of assets from the indemnity for the concession | - | - | 30,493 | 4,263 | - | - | - | - | - | - | - | - | - | - | 34,756 |
| Distribution of piped gas | - | - | - | 328,353 | - | - | - | - | - | - | - | - | - | - | 328,353 |
| Sectoral assets and liabilities result | - | - | 354,323 | - | - | - | - | - | - | - | - | - | - | - | 354,323 |
| Other operating revenues | 17,594 | 7,042 | 90,085 | 25 | - | - | - | - | 8 | - | 6 | 1,686 | - | (15,566) | 100,880 |
| OPERATING COSTS AND EXPENSES | (370,955) | (68,577) | (2,961,234) | (282,507) | (20,066) | (32,354) | (2,110) | (92,234) | (88,606) | (4,552) | (345) | (1,137,898) | (22,502) | 815,423 | (4,268,518) |
| Energy purchased for resale | (54,383) | - | (1,424,826) | - | (42) | - | - | (2,505) | (2,408) | (125) | - | (1,132,117) | - | 697,998 | (1,918,409) |
| Charges of the main distribution and transmission grid | (81,034) | - | (458,281) | - | (6,584) | (7,850) | - | (11,593) | (35,194) | (317) | - | - | - | 97,413 | (503,440) |
| Personnel and management | (40,692) | (28,257) | (135,175) | (9,962) | (1,279) | (2,305) | 97 | (3,421) | (682) | (305) | (222) | (2,783) | (7,893) | - | (232,880) |
| Private pension and health plans | (11,712) | (7,587) | (42,414) | (1,312) | (62) | (150) | (821) | (403) | (81) | (22) | (27) | (436) | (1,470) | - | (66,497) |
| Materials | (3,173) | (1,403) | (20,519) | (809) | (465) | (82) | (12) | (111) | (163) | - | (1) | (11) | (198) | - | (26,948) |
| Raw material and supplies - energy production | - | - | - | - | - | (1,583) | - | - | - | - | - | - | - | 84 | (1,499) |
| Natural gas and supplies for gas business | - | - | - | (251,003) | - | - | - | - | - | - | - | - | - | - | (251,003) |
| Third-party services | (21,135) | (7,086) | (129,658) | (3,273) | (2,524) | (9,123) | (676) | (19,270) | (6,103) | (715) | (1,478) | (724) | (11,970) | 17,067 | (196,668) |
| Depreciation and amortization | (93,583) | (3,338) | (111,036) | (10,578) | (6,308) | (5,927) | (524) | (48,225) | (33,559) | (2,794) | (7) | (86) | (630) | (4,899) | (321,494) |
| Provisions and reversals | (10,321) | 640 | (66,238) | (345) | - | (2,502) | (189) | (108) | (5) | - | (35) | (580) | 10,623 | 9,172 | (59,889) |
| Construction cost | - | (21,071) | (523,319) | (2,903) | - | - | - | - | - | - | 1,765 | - | - | - | (545,528) |
| Other operating costs and expenses | (54,922) | (475) | (49,767) | (2,322) | (2,802) | (2,832) | 15 | (6,596) | (10,410) | (274) | (340) | (1,159) | (10,964) | (1,414) | (144,263) |
| PROVISION FOR ALLOCATION OF PIS AND COFINS | - | - | (810,563) | - | - | - | - | - | - | - | - | - | - | - | (810,563) |
| EQUITY IN EARNINGS OF SUBSIDIARIES | 38,710 | 256,702 | - | - | - | - | - | 5,771 | - | - | - | - | (454,678) | 361,920 | 208,425 |
| EARNINGS BEFORE INCOME TAXES | 277,384 | 498,303 | (545,810) | 53,037 | 32,465 | (32,354) | (2,110) | 48,284 | 89,466 | 2,433 | 51,449 | 26,174 | (477,180) | 366,369 | 387,910 |
| FINANCIAL RESULTS | (91,499) | (59,860) | (1,040,911) | 7,312 | (39,360) | 2,881 | 265 | (39,575) | 6,886 | 254 | 905 | 7,735 | (33,833) | - | (1,278,799) |
| Financial income | 34,429 | 17,308 | 147,997 | 12,879 | 4,448 | 5,654 | 602 | 26,353 | 7,045 | 254 | 1,684 | 7,932 | 20,040 | (15,716) | 270,911 |
| Financial expenses | (125,928) | (77,168) | (177,537) | (5,567) | (43,808) | (2,773) | (337) | (65,928) | (159) | - | (779) | (197) | (53,874) | 15,716 | (538,340) |
| Update of provision for allocation of Pis and Cofins credits | - | - | (1,011,370) | - | - | - | - | - | - | - | - | - | - | - | (1,011,370) |
| OPERATIONAL EXPENSES / INCOME | 185,885 | 438,443 | (1,586,721) | 60,349 | (6,895) | (29,473) | (1,845) | 8,709 | 96,353 | 2,688 | 52,354 | 33,909 | (511,013) | 366,369 | (890,889) |
| INCOME TAX AND SOCIAL CONTRIBUTION ON PROFIT | (48,812) | (60,325) | 578,949 | (17,381) | 2,358 | - | 627 | (12,562) | (32,754) | (304) | (2,197) | (11,471) | (25,511) | (2,099) | 368,518 |
| NET INCOME | 137,073 | 378,118 | (1,007,772) | 42,968 | (4,536) | (29,473) | (1,218) | (3,853) | 63,599 | 2,383 | 50,157 | 22,438 | (536,524) | 364,271 | (522,371) |
| Attributed to controlling shareholders - continued operations | 137,073 | 378,118 | (1,007,772) | 21,915 | (3,175) | (23,931) | (1,218) | (3,853) | 63,599 | 2,383 | 50,157 | 22,438 | (536,524) | 364,271 | (536,523) |
| Attributed to non-controlling interest | - | - | - | 21,053 | (1,361) | (5,542) | - | - | - | - | - | - | - | - | 14,152 |
| EBITDA | 370,966 | 501,641 | (434,774) | 63,615 | 38,773 | (26,427) | (1,586) | 96,509 | 123,025 | 5,227 | 51,456 | 26,260 | (476,550) | 371,268 | 709,404 |
| RESULTS | 2Q23 | 38 |
| |
| Exhibit II- RESULT BY SUBSIDIARY > INCOME STATEMENT BY COMPANY ACCUMULATED | |||||||||||||||
| R$'000 | |||||||||||||||
| Income Statement 1H23 | GET | Distribuição | Compagas | Elejor | UEG Araucária | Serviços | Wind Farms | FDA | Bela Vista | C. Oeste, Marumbi, Uirapuru | Mercado Livre | Holding | Elimination | Consolidated | |
| Geração | Transmissão | ||||||||||||||
| NET OPERATING INCOME | 1,188,512 | 562,522 | 7,161,541 | 523,183 | 75,256 | - | - | 410,043 | 369,683 | 15,821 | 32,667 | 2,031,875 | - | (1,480,711) | 10,890,393 |
| Electricity sales to final customers | - | - | 2,602,677 | - | - | - | - | - | - | - | - | 1,127,801 | - | (738) | 3,729,740 |
| Electricity sales to distributors | 1,158,802 | - | 92,441 | - | 74,802 | - | - | 409,467 | 369,676 | 15,821 | - | 868,733 | - | (1,249,632) | 1,740,109 |
| Use of the main distribution and transmission grid (TUSD/ TUST) | - | 478,525 | 2,534,866 | - | - | - | - | - | - | - | 32,124 | - | - | (200,053) | 2,845,463 |
| Construction revenue | - | 71,064 | 1,057,880 | 5,923 | - | - | - | - | - | - | 530 | - | - | - | 1,135,398 |
| Fair value of assets from the indemnity for the concession | - | - | 33,615 | - | - | - | - | - | - | - | - | - | - | - | 33,615 |
| Distribution of piped gas | - | - | - | 517,260 | - | - | - | - | - | - | - | - | - | (571) | 516,690 |
| Sectoral assets and liabilities result | - | - | 606,453 | - | - | - | - | - | - | - | - | - | - | - | 606,453 |
| Other operating revenues | 29,710 | 12,933 | 233,609 | - | 454 | - | - | 576 | 7 | - | 13 | 35,341 | - | (29,717) | 282,926 |
| OPERATING COSTS AND EXPENSES | (661,823) | (218,934) | (6,559,513) | (427,478) | (45,366) | (194,687) | (1,184) | (262,352) | (209,254) | (9,908) | (5,231) | (1,923,546) | (39,830) | 1,457,099 | (9,102,008) |
| Energy purchased for resale | (38,011) | - | (2,960,886) | - | (1,022) | - | - | (13,207) | (27,827) | (612) | - | (1,906,014) | - | 1,249,010 | (3,698,567) |
| Charges of the main distribution and transmission grid | (190,160) | - | (1,240,661) | - | (11,688) | (17,349) | - | (31,150) | (78,396) | (651) | - | - | - | 199,760 | (1,370,296) |
| Personnel and management | (123,632) | (90,568) | (438,449) | (20,163) | (2,537) | (3,172) | - | (8,745) | (1,634) | (704) | (552) | (9,112) | (26,612) | - | (725,883) |
| Private pension and health plans | (23,259) | (16,381) | (83,704) | (2,951) | (96) | (353) | - | (942) | (177) | (47) | (61) | (981) | (4,281) | - | (133,233) |
| Materials and supplies | (4,659) | (2,754) | (31,713) | (462) | (159) | (22) | - | (541) | (830) | (35) | �� (104) | (33) | (424) | - | (41,738) |
| Materials and supplies for power eletricity | (10,479) | - | - | - | - | (599) | - | - | - | - | - | - | - | 518 | (10,560) |
| Natural gas and supplies for gas business | - | - | - | (368,206) | - | - | - | - | - | - | - | - | - | - | (368,206) |
| Third-party services | (47,972) | (23,316) | (304,256) | (6,155) | (8,530) | (10,349) | (250) | (62,389) | (18,388) | (1,648) | (3,283) | (2,140) | (15,771) | 31,358 | (473,086) |
| Depreciation and amortization | (189,308) | (7,739) | (253,179) | (19,635) | (17,017) | (11,182) | (1,084) | (126,070) | (63,798) | (5,623) | (18) | (1,130) | (1,482) | (13,009) | (710,272) |
| Provisions and reversals | 21,960 | (9,359) | (77,297) | (132) | - | (150,469) | - | 2,344 | (2) | - | (60) | (1,249) | 11,018 | (10,958) | (214,203) |
| Construction cost | - | (61,073) | (1,057,880) | (5,923) | - | - | - | - | - | - | (530) | - | - | - | (1,125,406) |
| Other operating costs and expenses | (56,303) | (7,745) | (111,488) | (3,850) | (4,317) | (1,192) | 150 | (21,653) | (18,202) | (588) | (624) | (2,887) | (2,278) | 420 | (230,559) |
| EQUITY IN EARNINGS OF SUBSIDIARIES | 42,291 | 195,050 | - | - | - | - | - | 28,423 | - | - | - | - | 950,147 | (1,039,078) | 176,833 |
| EARNINGS BEFORE INCOME TAXES | 568,980 | 538,638 | 602,028 | 95,705 | 29,890 | (194,687) | (1,184) | 176,114 | 160,429 | 5,913 | 27,436 | 108,329 | 910,317 | (1,062,690) | 1,965,218 |
| FINANCIAL RESULTS | (192,487) | (172,538) | (205,795) | (4,927) | 3,577 | 4,808 | (493) | (71,907) | 11,223 | 1,586 | 3,537 | 17,885 | 28,929 | - | (576,598) |
| Financial income | 54,603 | 29,799 | 254,313 | 13,605 | 67,466 | 8,076 | 273 | 69,929 | 11,529 | 1,586 | 4,938 | 18,037 | 33,136 | (13,336) | 553,953 |
| Financial expenses | (247,090) | (202,336) | (460,108) | (18,532) | (63,889) | (3,268) | (766) | (141,835) | (306) | (0) | (1,400) | (152) | (4,208) | 13,336 | (1,130,551) |
| OPERATIONAL EXPENSES / INCOME | 376,493 | 366,100 | 396,233 | 90,778 | 33,467 | (189,879) | (1,677) | 104,207 | 171,652 | 7,499 | 30,973 | 126,214 | 939,245 | (1,062,690) | 1,388,623 |
| INCOME TAX AND SOCIAL CONTRIBUTION ON PROFIT | (112,686) | (57,675) | (95,013) | (30,590) | (8,201) | (13,614) | - | (34,149) | (57,968) | (1,882) | (2,736) | (38,376) | 5,137 | 2,331 | (445,424) |
| NET INCOME | 263,807 | 308,425 | 301,220 | 60,188 | 25,266 | (203,493) | (1,677) | 70,058 | 113,684 | 5,618 | 28,237 | 87,838 | 944,382 | (1,060,359) | 943,196 |
| Attributed to controlling shareholders | 263,807 | 308,425 | 301,220 | 30,697 | 17,686 | (165,236) | (1,677) | 70,058 | 113,684 | 5,618 | 28,237 | 87,838 | 944,382 | (1,060,359) | 944,382 |
| Attributed to non-controlling interest | - | - | - | 29,491 | 7,580 | (38,257) | - | - | - | - | - | - | - | - | (1,186) |
| EBITDA | 758,288 | 546,376 | 855,207 | 115,340 | 46,907 | (183,505) | (100) | 302,184 | 224,227 | 11,536 | 27,454 | 109,459 | 911,799 | (1,049,681) | 2,675,490 |
| RESULTS | 2Q23 | 39 |
| |
| R$'000 | |||||||||||||||
| Income Statement 1H22 | GET | Distribuição | Compagas | Elejor | UEG Araucária | Serviços | Wind Farms | FDA | Bela Vista | C. Oeste, Marumbi, Uirapuru | Mercado Livre | Holding | Elimination | Consolidated | |
| Geração | Transmissão | ||||||||||||||
| NET OPERATING INCOME | 1,231,580 | 648,858 | 6,747,955 | 589,191 | 107,398 | 98,032 | 8,014 | 277,297 | 364,265 | 14,283 | 81,921 | 2,348,115 | - | (1,670,594) | 10,846,315 |
| Electricity sales to final customers | 100 | - | 2,856,189 | - | - | - | - | - | - | - | - | 1,141,855 | - | (1,282) | 3,996,862 |
| Electricity sales to distributors | 1,193,667 | - | 117,072 | - | 107,398 | 98,032 | - | 275,233 | 364,253 | 14,283 | - | 1,202,193 | - | (1,437,753) | 1,934,378 |
| Use of the main distribution and transmission grid (TUSD/ TUST) | - | 570,747 | 1,901,505 | - | - | - | - | - | - | - | 81,580 | - | - | (193,393) | 2,360,439 |
| Construction revenue | - | 64,437 | 963,288 | 6,316 | - | - | - | - | - | - | 329 | - | - | - | 1,034,370 |
| Fair value of assets from the indemnity for the concession | - | - | 58,963 | 18,342 | - | - | - | - | - | - | - | - | - | - | 77,305 |
| Distribution of piped gas | - | - | - | 564,469 | - | - | - | - | - | - | - | - | - | (3,027) | 561,442 |
| Sectoral assets and liabilities result | - | - | 678,508 | - | - | - | - | - | - | - | - | - | - | - | 678,508 |
| Other operating revenues | 37,813 | 13,674 | 172,430 | 64 | - | - | 8,014 | 2,064 | 12 | - | 12 | 4,067 | - | (35,139) | 203,011 |
| OPERATING COSTS AND EXPENSES | (698,775) | (161,711) | (6,156,601) | (502,011) | (42,346) | (142,244) | (8,577) | (190,024) | (187,189) | (9,500) | (4,012) | (2,321,203) | (64,340) | 1,689,965 | (8,798,568) |
| Energy purchased for resale | (95,515) | - | (2,867,080) | - | (102) | - | - | (10,665) | (13,086) | (741) | - | (2,308,526) | - | 1,437,808 | (3,857,907) |
| Charges of the main distribution and transmission grid | (162,541) | - | (1,188,096) | - | (13,156) | (15,714) | - | (22,055) | (70,177) | (644) | - | - | - | 193,968 | (1,278,415) |
| Personnel and management | (89,898) | (62,151) | (300,636) | (19,728) | (2,397) | (3,636) | (3,681) | (6,256) | (1,305) | (598) | (420) | (6,229) | (18,270) | - | (515,205) |
| Private pension and health plans | (23,499) | (15,539) | (85,358) | (2,704) | (115) | (304) | (2,103) | (625) | (133) | (33) | (43) | (899) | (3,227) | - | (134,582) |
| Materials | (5,269) | (2,506) | (34,587) | (1,051) | (609) | (91) | (48) | (233) | (327) | - | (3) | (23) | (437) | - | (45,184) |
| Raw material and supplies - energy production | - | - | - | - | - | (89,760) | - | - | - | - | - | - | - | 2,830 | (86,930) |
| Natural gas and supplies for gas business | - | - | - | (438,415) | - | - | - | - | - | - | - | - | - | - | (438,415) |
| Third-party services | (41,261) | (16,595) | (238,379) | (6,691) | (5,776) | (14,716) | (1,502) | (37,253) | (16,298) | (1,281) | (2,912) | (1,685) | (18,914) | 38,665 | (364,598) |
| Depreciation and amortization | (186,839) | (6,338) | (219,561) | (21,125) | (16,159) | (11,851) | (992) | (96,498) | (70,635) | (5,565) | (15) | (164) | (1,231) | (4,899) | (641,872) |
| Provisions and reversals | (14,629) | (1,034) | (165,148) | (2,100) | - | (2,761) | (190) | (214) | (5) | - | (40) | (1,325) | (12,305) | 23,914 | (175,837) |
| Construction cost | - | (52,312) | (963,288) | (6,316) | - | - | - | - | - | - | (329) | - | - | - | (1,022,245) |
| Other operating costs and expenses | (79,324) | (5,236) | (94,467) | (3,881) | (4,032) | (3,411) | (61) | (16,225) | (15,223) | (638) | (250) | (2,352) | (9,956) | (2,321) | (237,378) |
| PROVISION FOR ALLOCATION OF PIS AND COFINS | - | - | (810,563) | - | - | - | - | - | - | - | - | - | - | - | (810,563) |
| EQUITY IN EARNINGS OF SUBSIDIARIES | 104,390 | 391,649 | - | - | - | - | - | 17,420 | - | - | - | - | 257,061 | (449,314) | 321,206 |
| EARNINGS BEFORE INCOME TAXES | 637,195 | 878,796 | (219,209) | 87,180 | 65,052 | (44,212) | (563) | 104,693 | 177,076 | 4,783 | 77,909 | 26,912 | 192,721 | (429,943) | 1,558,390 |
| FINANCIAL RESULTS | (176,253) | (115,714) | (1,018,860) | 10,380 | (103,888) | 7,247 | 478 | (71,338) | 13,781 | 367 | 1,623 | 14,004 | (53,852) | - | (1,492,026) |
| Financial income | 59,843 | 30,653 | 310,134 | 23,648 | 7,799 | 11,830 | 1,117 | 47,481 | 14,047 | 367 | 3,145 | 14,286 | 37,125 | (30,689) | 530,786 |
| Financial expenses | (236,096) | (146,367) | (317,624) | (13,268) | (111,687) | (4,583) | (639) | (118,819) | (266) | - | (1,522) | (283) | (90,977) | 30,689 | (1,011,442) |
| - | - | (1,011,370) | - | - | - | - | - | - | - | - | - | - | - | (1,011,370) | |
| OPERATIONAL EXPENSES / INCOME | 460,942 | 763,082 | (1,238,069) | 97,560 | (38,836) | (36,965) | (85) | 33,355 | 190,857 | 5,150 | 79,532 | 40,916 | 138,869 | (429,943) | 66,364 |
| INCOME TAX AND SOCIAL CONTRIBUTION ON PROFIT | (118,618) | (123,568) | 458,334 | (27,341) | 13,239 | (940) | - | (23,914) | (64,879) | (570) | (3,641) | (13,835) | (11,051) | (2,160) | 81,056 |
| NET INCOME | 342,324 | 639,514 | (779,735) | 70,219 | (25,597) | (37,905) | (85) | 9,441 | 125,978 | 4,580 | 75,891 | 27,081 | 127,818 | (432,103) | 147,420 |
| Attributed to controlling shareholders - continued operations | - | - | - | - | - | - | - | - | - | - | - | - | - | - | 127,818 |
| Attributed to non-controlling interest | - | - | - | - | - | - | - | - | - | - | - | - | - | - | 19,602 |
| EBITDA | 824,034 | 885,134 | 352 | 108,305 | 81,211 | (32,361) | 429 | 201,191 | 247,711 | 10,348 | 77,924 | 27,076 | 193,952 | (425,044) | 2,200,262 |
| RESULTS | 2Q23 | 40 |
| |
| Exhibit II- RESULT BY SUBSIDIARY > ASSETS BY COMPANY | ||||||||||||||
| R$'000 | ||||||||||||||
| Assets - June -2023 | Geração e Transmissão | Distribuição | Compagas | Elejor | UEG Araucária | Serviços | Wind Farms | FDA | Bela Vista | Costa Oeste, Marumbi, Uirapuru | Mercado Livre | Holding | Eliminations | Consolidated |
| CURRENT | 2,533,485 | 5,966,435 | 286,404 | 221,925 | 71,357 | 6,081 | 903,554 | 247,649 | 29,589 | 82,015 | 971,268 | 1,785,403 | (1,996,658) | 11,108,509 |
| Cash and cash equivalents | 1,436,523 | 1,459,386 | 115,314 | 177,522 | 35,563 | 616 | 694,604 | 171,370 | 26,246 | 56,722 | 236,049 | 37,570 | - | 4,447,484 |
| Bonds and securities | - | - | - | - | - | - | - | - | - | - | - | 94 | - | 94 |
| Collaterals and escrow accounts | - | - | 221 | - | - | - | - | - | - | - | - | - | - | 221 |
| Customers | 399,547 | 2,457,925 | 113,441 | 27,069 | 464 | - | 97,725 | 73,890 | 2,670 | 7,668 | 355,997 | - | (220,981) | 3,315,418 |
| Dividends receivable | 116,269 | - | - | - | - | - | 45,818 | - | - | - | 0 | 1,570,637 | (1,680,550) | 52,175 |
| Sectorial financial assets | - | - | - | - | - | - | - | - | - | - | - | - | - | - |
| Account receivable related to concession | 9,385 | - | - | - | - | - | - | - | - | - | - | - | - | 9,385 |
| Contract Assets | 251,792 | - | - | - | - | - | - | - | - | 15,519 | - | - | - | 267,310 |
| Other current receivables | 147,882 | 484,473 | 41,834 | 11,512 | 55 | 3,091 | 13,633 | 32 | - | 547 | 370,601 | 1,332 | (10,070) | 1,064,925 |
| Inventories | 34,719 | 169,702 | 6,906 | 215 | - | 249 | 4,375 | 275 | - | 205 | - | - | - | 216,646 |
| Income tax and social contribution | 96,964 | 97,168 | 1,780 | 5,147 | 13,471 | 1,821 | 18,408 | 484 | 282 | 1,027 | 7,576 | 120,180 | - | 364,309 |
| Other current recoverable taxes | 19,087 | 1,251,762 | 6,685 | - | 21,805 | 304 | 9,598 | 1,360 | 19 | - | 331 | - | - | 1,310,951 |
| Prepaid expenses | 8,209 | 38,221 | 223 | 460 | - | - | 8,183 | 238 | 372 | 327 | 714 | 1,775 | - | 58,720 |
| Related parties | 13,108 | 7,798 | - | - | - | - | 11,208 | - | - | - | - | 53,815 | (85,057) | 871 |
| NON-CURRENT | 20,967,600 | 15,767,576 | 786,326 | 608,662 | 70,590 | 47,766 | 8,190,775 | 499,274 | 204,442 | 493,192 | 1,245,030 | 20,865,450 | (26,848,109) | 42,898,565 |
| Long Term Assets | 6,027,296 | 7,853,255 | 61,028 | 80,955 | 29,328 | 560 | 600,978 | 16,864 | 228 | 492,857 | 1,236,335 | 561,223 | (254,505) | 16,706,395 |
| Bonds and securities | 129,803 | 955 | - | - | - | - | 359,853 | 15,562 | - | 4,193 | 1,786 | - | - | 512,147 |
| Other temporary investments | - | - | - | - | - | - | - | - | - | - | - | 30,616 | - | 30,616 |
| Customers | - | 117,615 | - | - | - | - | 50 | - | - | - | - | - | - | 117,665 |
| Judicial deposits | 93,928 | 381,139 | 65 | 53 | 6,671 | 560 | 48 | - | 218 | - | 14,967 | 143,857 | - | 641,506 |
| Sectoral financial assets | - | 77,334 | - | - | - | - | - | - | - | - | - | - | - | 77,334 |
| Account receivable related to concession | 847,260 | 1,691,901 | - | - | - | - | - | - | - | - | - | - | - | 2,539,161 |
| Contract Assets | 4,684,622 | 2,260,928 | 31,796 | - | - | - | - | - | - | 487,730 | - | - | (7,822) | 7,457,254 |
| Other non-current receivables | 82,750 | 23,705 | 29,157 | 2,508 | �� - | - | - | 725 | - | 933 | 1,219,460 | 19 | - | 1,359,257 |
| Income tax and social contribution | 106,738 | 20,288 | - | 1,301 | - | - | - | - | - | - | 71 | - | - | 128,398 |
| Deferred income tax and social contribution | - | 1,184,658 | - | 71,242 | 22,657 | - | - | - | - | - | - | 339,014 | - | 1,617,571 |
| Other non-current recoverable taxes | 82,044 | 2,094,732 | - | - | - | - | 171 | 577 | 10 | - | 51 | 40,454 | - | 2,218,040 |
| Prepaid expenses | 151 | - | 10 | - | - | - | 22 | - | - | - | - | 7,263 | - | 7,446 |
| Related parties | - | - | - | 5,851 | - | - | 240,835 | - | - | - | - | - | (246,683) | - |
| Investments | 8,579,850 | 458 | - | - | - | - | 2,751,862 | - | - | - | - | 20,285,849 | (28,114,338) | 3,503,682 |
| Property, plant and equipment, net | 5,220,559 | - | - | 336,681 | 41,221 | 31,222 | 4,806,600 | 309,225 | 198,730 | 256 | 549 | 7,658 | - | 10,952,699 |
| Intangible assets | 1,074,362 | 7,778,351 | 713,004 | 190,161 | 41 | 1,015 | 2,684 | 173,185 | 5,484 | 79 | 5,999 | 5,575 | 1,520,734 | 11,470,673 |
| Right to use an asset | 65,533 | 135,512 | 12,294 | 864 | - | 14,969 | 28,652 | - | - | - | 2,147 | 5,145 | - | 265,115 |
| TOTAL | 23,501,085 | 21,734,011 | 1,072,730 | 830,586 | 141,947 | 53,847 | 9,094,329 | 746,923 | 234,031 | 575,206 | 2,216,298 | 22,650,853 | (28,844,766) | 54,007,074 |
| RESULTS | 2Q23 | 41 |
| |
| R$'000 | ||||||||||||||
| Assets - December-2022 | Geração e Transmissão | Distribuição | Compagas | Elejor | UEG Araucária | Serviços | Wind Farms | FDA | Bela Vista | Costa Oeste, Marumbi, Uirapuru | Mercado Livre | Holding | Eliminations | Consolidated |
| CURRENT | 1,647,236 | 4,937,240 | 282,714 | 224,833 | 97,587 | 6,075 | 937,476 | 376,804 | 26,828 | 94,931 | 990,867 | 1,180,872 | (1,476,214) | 9,327,249 |
| Cash and cash equivalents | 380,955 | 430,121 | 61,059 | 185,916 | 64,991 | 3,748 | 755,355 | 284,624 | 22,934 | 71,141 | 217,736 | 199,877 | - | 2,678,457 |
| Bonds and securities | - | - | - | - | - | - | - | - | - | - | - | 93 | - | 93 |
| Collaterals and escrow accounts | - | 90 | 67 | - | - | - | - | - | - | - | - | - | - | 157 |
| Customers | 389,967 | 2,429,434 | 128,589 | 23,272 | - | - | 97,594 | 88,764 | 2,997 | 7,184 | 475,170 | - | (300,921) | 3,342,050 |
| Dividends receivable | 352,718 | - | - | - | - | - | 45,676 | - | - | - | - | 824,143 | (1,084,207) | 138,330 |
| CRC transferred to the State of Paraná | - | - | - | - | - | - | - | - | - | |||||
| Sectorial financial assets | - | 190,699 | - | - | - | - | - | - | - | - | - | - | - | 190,699 |
| Account receivable related to concession | 8,603 | - | - | - | - | - | - | - | - | - | - | - | - | 8,603 |
| Contract Assets | 205,647 | - | - | - | - | �� - | - | - | - | 15,013 | - | - | - | 220,660 |
| Other current receivables | 137,224 | 408,462 | 49,518 | 12,237 | 5 | 2 | 5,616 | 2 | - | 66 | 292,962 | 977 | (9,691) | 897,380 |
| Inventories | 30,024 | 158,487 | 5,694 | 195 | - | 249 | - | - | - | 201 | - | - | - | 194,850 |
| Income tax and social contribution | 102,625 | 95,397 | 8,705 | 3,097 | 12,885 | 1,693 | 16,522 | 1,620 | 250 | 1,129 | 3,619 | 107,523 | - | 355,065 |
| Other current recoverable taxes | 11,312 | 1,178,192 | 28,505 | - | 19,705 | 241 | 120 | 1,225 | 16 | - | 378 | - | - | 1,239,694 |
| Prepaid expenses | 13,000 | 37,593 | 577 | 116 | - | 142 | 5,394 | 569 | 631 | 197 | 1,002 | 855 | - | 60,076 |
| Related parties | 15,162 | 8,765 | - | - | - | - | 11,199 | - | - | - | - | 47,404 | (81,395) | 1,135 |
| NON-CURRENT | 20,110,117 | 15,601,575 | 800,999 | 623,364 | 236,832 | 16,870 | 6,623,943 | 561,976 | 210,555 | 496,329 | 818,104 | 20,894,673 | (26,618,884) | 40,376,451 |
| Long Term Assets | 5,924,570 | 8,200,557 | 59,505 | 80,811 | 43,358 | 536 | 476,931 | 15,875 | 15 | 496,232 | 809,498 | 538,071 | (203,812) | 16,442,145 |
| Bonds and securities | 123,022 | 905 | - | - | - | - | 286,623 | 14,750 | - | 3,974 | 1,689 | - | - | 430,963 |
| Other temporary investments | - | - | - | - | - | - | - | - | - | - | - | 25,619 | - | 25,619 |
| Collaterals and escrow accounts | - | - | - | - | - | - | - | - | - | |||||
| Customers | - | 109,472 | - | - | - | - | 347 | - | - | - | - | - | - | 109,819 |
| CRC transferred to the State of Paraná | - | - | - | - | - | - | - | - | - | |||||
| Judicial deposits | 87,125 | 384,425 | 69 | 58 | 7,087 | 536 | 49 | - | - | - | 14,362 | 138,747 | - | 632,458 |
| Sectoral financial assets | - | 190,699 | - | - | - | - | - | - | - | - | - | - | - | 190,699 |
| Account receivable related to concession | 826,871 | 1,442,819 | - | - | - | - | - | - | - | - | - | - | - | 2,269,690 |
| Contract Assets | 4,607,214 | 2,332,171 | 30,032 | - | - | - | - | - | - | 490,785 | - | - | (8,183) | 7,452,019 |
| Other non-current receivables | 89,225 | 15,020 | 29,394 | 2,508 | - | - | - | 475 | - | 1,473 | 793,339 | 18 | - | 931,452 |
| Income tax and social contribution | 106,729 | 19,723 | - | 1,301 | - | - | - | - | - | - | 71 | - | - | 127,824 |
| Deferred income tax and social contribution | - | 1,203,057 | - | 71,094 | 36,271 | - | - | - | - | - | - | 333,877 | - | 1,644,299 |
| Other non-current recoverable taxes | 84,383 | 2,502,266 | - | - | - | - | 133 | 649 | 15 | - | 37 | 39,810 | - | 2,627,293 |
| Prepaid expenses | - | - | 10 | - | - | - | - | - | - | - | - | - | - | 10 |
| Related parties | - | - | - | 5,851 | - | - | 189,779 | - | - | - | - | - | (195,630) | - |
| Investments | 7,720,268 | 534 | - | - | - | - | 2,402,494 | - | - | - | - | 20,339,344 | (27,136,909) | 3,325,731 |
| Property, plant and equipment, net | 5,278,437 | - | - | 345,813 | 193,421 | 1,977 | 3,720,908 | 315,167 | 205,250 | 5 | 541 | 7,948 | - | 10,069,468 |
| Intangible assets | 1,126,526 | 7,257,827 | 726,107 | 195,778 | 53 | 1,263 | 1,104 | 230,934 | 5,288 | 92 | 6,193 | 4,724 | 721,837 | 10,277,727 |
| Right to use an asset | 60,316 | 142,657 | 15,387 | 962 | - | 13,094 | 22,506 | - | - | - | 1,872 | 4,586 | - | 261,380 |
| TOTAL | 21,757,353 | 20,538,815 | 1,083,713 | 848,198 | 334,418 | 22,946 | 7,561,419 | 938,779 | 237,382 | 591,260 | 1,808,971 | 22,075,545 | (28,095,099) | 49,703,700 |
| RESULTS | 2Q23 | 42 |
| |
| Exhibit II- RESULT BY SUBSIDIARY > LIABILITIES BY COMPANY | ||||||||||||||
| R$'000 | ||||||||||||||
| Liabilities - June -23 | Geração e Transmissão | Distribuição | Compagas | Elejor | UEG Araucária | Serviços | Wind Farms | FDA | Bela Vista | Costa Oeste, Marumbi, Uirapuru | Mercado Livre | Holding | Eliminations | Consolidated |
| CURRENT | 2,760,595 | 4,573,473 | 482,048 | 112,629 | 55,974 | 858 | 607,069 | 116,926 | 1,563 | 11,683 | 826,587 | 32,034 | (2,010,204) | 7,571,229 |
| Social charges and accruals | 86,159 | 173,470 | 8,998 | 459 | 741 | - | 45 | - | 21 | - | 2,996 | 8,055 | - | 280,944 |
| Associated companies and parent company | 5,237 | 11,022 | - | - | - | - | 81,966 | 711 | 186 | 254 | 296 | 1,636 | (101,307) | - |
| Suppliers | 316,872 | 1,436,940 | 81,189 | 3,333 | 14,340 | 86 | 78,046 | 42,890 | 736 | 949 | 330,627 | 5,869 | (228,347) | 2,083,527 |
| Income Tax and Social Contribution payable | 24,381 | - | 13,043 | 6,737 | - | - | 12,731 | 63,096 | 461 | 1,499 | - | - | - | 121,947 |
| Other taxes | 2,988 | 226,226 | 13,440 | 815 | 258 | 3 | 15,175 | 4,706 | 150 | 260 | 20,367 | 2,239 | - | 286,626 |
| Loans and financing | 179,886 | 6,153 | - | - | - | - | 117,936 | - | - | 6,971 | - | - | - | 310,946 |
| Debentures | 996,594 | 930,172 | - | - | - | - | 50,378 | - | - | - | - | - | - | 1,977,145 |
| Dividends payable | 968,052 | 265,574 | 359,122 | - | 40,635 | - | 87,375 | - | - | - | 143,400 | 9,227 | (1,680,550) | 192,836 |
| Post employment benefits | 21,864 | 59,989 | - | - | - | - | - | - | - | - | 132 | 3,829 | - | 85,814 |
| Customer charges due | 15,322 | 44,789 | - | - | - | - | - | 711 | - | 144 | - | - | - | 60,966 |
| Research and development and energy efficiency | 88,688 | 243,725 | - | 1,709 | - | - | - | 855 | - | 1,558 | - | - | - | 336,536 |
| Payables related to concession | 1,998 | - | - | 98,488 | - | - | - | - | - | - | - | - | - | 100,486 |
| Sectorial financial liabilities | - | 971,470 | - | - | - | - | - | - | - | - | - | - | - | 971,470 |
| Other accounts payable | 12,630 | 44,897 | 2,951 | 243 | - | 763 | 192 | - | - | - | 112 | 450 | - | 62,239 |
| Other bills to pay | 39,924 | 159,047 | 3,305 | 846 | - | 6 | 163,226 | 3,957 | 9 | 47 | 328,657 | 729 | - | 699,747 |
| PIS and Cofins to be refunded to consumers | - | - | - | - | - | |||||||||
| Provisions for litigation | - | - | - | - | ||||||||||
| NON-CURRENT | 8,220,343 | 10,236,046 | 100,228 | 728,856 | 16,485 | 15,582 | 3,042,924 | 60,316 | 2,561 | 48,497 | 1,021,732 | 858,000 | 73,350 | 24,424,913 |
| Associated companies and parent company | - | - | - | - | �� - | - | 227,280 | - | - | - | - | 5,851 | (233,131) | - |
| Suppliers | 134,731 | - | - | - | - | - | - | - | - | - | - | - | - | 134,731 |
| Deferred income tax and social contribution | 1,249,095 | - | 30,132 | - | - | - | 15,600 | 53,954 | 465 | 17,509 | 117,177 | - | 294,274 | 1,778,207 |
| Tax liabilities | 57,997 | 558,736 | - | - | 6,621 | 557 | - | - | - | - | 461 | 3,820 | - | 628,191 |
| Loans and financing | 2,167,828 | 749,577 | - | - | - | - | 2,207,099 | - | - | 22,713 | - | - | - | 5,147,214 |
| Debentures | 3,629,570 | 4,742,207 | - | - | - | - | 500,630 | - | - | - | - | - | - | 8,872,408 |
| Post-employment benefits | 306,299 | 662,705 | 9,971 | - | 962 | - | - | - | - | - | 3,420 | 22,776 | - | 1,006,133 |
| Research and development and energy efficiency | - | 260,033 | - | - | 8,192 | - | - | 6,362 | - | 618 | - | - | - | 275,205 |
| Payables related to the concession | 62,322 | - | - | 728,217 | - | - | - | - | - | - | - | - | - | 790,539 |
| Sectorial financial liabilities | - | 26,274 | - | - | - | - | - | - | - | - | - | - | - | 26,274 |
| Lease liability | 56,921 | 98,966 | 10,155 | 639 | - | 15,025 | 29,418 | - | - | - | 2,170 | 4,993 | - | 218,287 |
| Other payables | 48,251 | 5,945 | 33,792 | - | - | - | 55,760 | - | - | 19 | 897,589 | 7,942 | (7,627) | 1,041,669 |
| PIS/Cofins to be refunded to consumers | 625,937 | - | - | - | 625,937 | |||||||||
| Provision for allocation of PIS and COFINS | 1,912,748 | 1,912,748 | ||||||||||||
| Provisions for litigation | 507,329 | 592,918 | 16,178 | - | 710 | - | 7,136 | - | 2,096 | 7,638 | 916 | 812,618 | 19,833 | 1,967,370 |
| EQUITY | 12,520,147 | 6,924,492 | 490,454 | (10,899) | 69,488 | 37,407 | 5,444,336 | 569,681 | 229,907 | 515,026 | 367,979 | 21,760,819 | (26,907,911) | 22,010,932 |
| Attributable to controlling shareholders | 12,520,147 | 6,924,492 | 490,454 | (10,899) | 69,488 | 37,407 | 5,444,336 | 569,681 | 229,907 | 515,026 | 367,979 | 21,760,819 | (27,158,024) | 21,760,819 |
| Capital | 6,242,757 | 5,372,206 | 220,966 | 35,503 | 425,662 | 16,685 | 5,156,932 | 409,509 | 223,913 | 275,161 | 237,210 | 10,800,000 | (18,616,510) | 10,800,000 |
| Advance for Future Capital Increase | - | - | - | - | - | 30,450 | 1,000 | - | - | - | - | �� - | (31,450) | - |
| Capital reserves | - | - | ||||||||||||
| Equity valuation adjustments | 569,376 | 15,777 | (363) | 5,726 | 137 | (1) | - | - | - | - | (1,113) | 575,778 | (589,539) | 575,778 |
| Legal Reserves | 877,479 | 306,744 | 44,193 | - | - | - | 47,654 | 46,488 | 376 | 24,970 | 22,794 | 1,512,687 | (1,370,700) | 1,512,687 |
| Profit retention reserve | 4,241,625 | 928,545 | 165,470 | - | - | - | 437,119 | - | - | 186,658 | 21,250 | 7,911,295 | (5,980,668) | 7,911,295 |
| Additional proposed dividends | - | - | - | - | - | - | - | - | - | - | - | - | - | |
| Accumulated profit | 588,910 | 301,220 | 60,188 | (52,128) | (356,311) | (9,727) | (198,370) | 113,684 | 5,618 | 28,237 | 87,838 | 961,059 | (569,157) | 961,059 |
| Attributable to noncontrolling interests | - | - | - | - | - | - | - | - | - | - | - | - | 250,113 | 250,113 |
| TOTAL | 23,501,085 | 21,734,011 | 1,072,730 | 830,586 | 141,947 | 53,847 | 9,094,329 | 746,923 | 234,031 | 575,206 | 2,216,298 | 22,650,853 | (28,844,766) | 54,007,074 |
| RESULTS | 2Q23 | 43 |
| |
| R$'000 | ||||||||||||||
| Liabilities - December-22 | Geração e Transmissão | Distribuição | Compagas | Elejor | UEG Araucária | Serviços | Wind Farms | FDA | Bela Vista | Costa Oeste, Marumbi, Uirapuru | Mercado Livre | Holding | Eliminations | Consolidated |
| CURRENT | 2,077,931 | 3,970,515 | 419,277 | 111,142 | 45,115 | 881 | 490,273 | 297,517 | 4,622 | 34,551 | 790,165 | 390,708 | (1,476,100) | 7,156,597 |
| Social charges and accruals | 77,637 | 154,982 | 9,892 | 352 | 646 | - | 51 | - | 37 | - | 2,587 | 6,605 | - | 252,789 |
| Associated companies and parent company | 5,897 | 8,962 | - | - | - | - | 62,831 | 913 | 241 | 299 | 378 | 1,838 | (81,359) | - |
| Suppliers | 312,042 | 1,447,967 | 97,759 | 3,320 | 5,955 | 76 | 41,489 | 23,378 | 1,357 | 883 | 460,957 | 5,373 | (310,534) | 2,090,022 |
| Income Tax and Social Contribution payable | - | - | 12,534 | - | - | - | 7,371 | 130,875 | 254 | 546 | 4,611 | - | - | 156,191 |
| Other taxes | 35,711 | 182,308 | 24,641 | 1,345 | 358 | 30 | 6,604 | 5,516 | 248 | 247 | 17,908 | 28,690 | - | 303,606 |
| Loans and financing | 173,609 | 6,203 | - | - | - | - | 91,293 | - | - | 7,733 | - | - | - | 278,838 |
| Debentures | 923,657 | 373,634 | - | - | - | - | 49,056 | - | - | - | - | - | - | 1,346,347 |
| Dividends payable | 372,899 | 265,574 | 267,149 | - | 38,156 | - | 86,592 | 125,978 | 1,788 | 24,519 | 39,626 | 344,251 | (1,084,207) | 482,325 |
| Post employment benefits | 18,795 | 51,978 | - | - | - | - | - | - | - | - | 84 | 2,957 | - | 73,814 |
| Customer charges due | 14,914 | 29,032 | - | - | - | - | - | 2,343 | - | 199 | - | - | - | 46,488 |
| Research and development and energy efficiency | 83,566 | 284,305 | - | 1,467 | - | - | - | 826 | - | 80 | - | - | - | 370,244 |
| Payables related to concession | 1,918 | - | - | 103,085 | - | - | - | - | - | - | - | - | - | 105,003 |
| Sectorial financial liabilities | - | 433,914 | - | - | - | - | - | - | - | - | - | - | - | 433,914 |
| Other accounts payable | 10,777 | 48,882 | 3,580 | 169 | - | 774 | 145 | - | - | - | 107 | 436 | - | 64,870 |
| Other bills to pay | 46,509 | 132,247 | 3,722 | 1,404 | - | 1 | 144,841 | 7,688 | 697 | 45 | 263,907 | 558 | - | 601,619 |
| PIS and Cofins to be refunded to consumers | - | 550,527 | - | - | - | - | - | - | - | - | - | - | - | 550,527 |
| NON-CURRENT | 6,889,354 | 9,958,028 | 107,306 | 771,897 | 16,322 | 13,431 | 2,174,205 | 78,093 | 3,108 | 52,623 | 600,024 | 867,473 | (115,986) | 21,415,878 |
| Associated companies and parent company | - | - | - | - | - | - | 189,888 | - | - | - | - | 5,851 | (195,739) | - |
| Suppliers | 125,448 | - | - | - | - | - | - | - | - | - | - | - | - | 125,448 |
| Deferred income tax and social contribution | 1,188,192 | - | 36,200 | - | - | - | 10,632 | 73,025 | 416 | 17,838 | 99,217 | - | 92,162 | 1,517,682 |
| Tax liabilities | 55,695 | 566,826 | - | - | 6,331 | 536 | - | - | - | - | 427 | 3,676 | - | 633,491 |
| Loans and financing | 2,215,315 | 751,805 | - | - | - | - | 1,378,697 | - | - | 25,708 | - | - | - | 4,371,525 |
| Debentures | 2,304,860 | 3,642,973 | - | - | - | - | 509,675 | - | - | - | - | - | - | 6,457,508 |
| Post-employment benefits | 300,979 | 657,867 | 9,294 | - | 901 | - | - | - | - | - | 3,292 | 23,890 | - | �� 996,223 |
| Research and development and energy efficiency | 5,983 | 223,805 | - | - | 7,698 | - | - | 5,068 | - | 1,960 | - | - | - | 244,514 |
| Payables related to the concession | 61,437 | - | - | 771,102 | - | - | - | - | - | - | - | - | - | 832,539 |
| Sectorial financial liabilities | - | 49,341 | - | - | - | - | - | - | - | - | - | - | - | 49,341 |
| Lease liability | 52,848 | 100,659 | 12,421 | 795 | - | 12,895 | 23,030 | - | - | - | 1,865 | 4,373 | - | 208,886 |
| Other payables | 46,169 | 16,006 | 33,223 | - | - | - | 54,340 | - | - | - | 494,641 | 25,241 | (24,386) | 645,234 |
| PIS/Cofins to be refunded to consumers | - | 1,444,631 | - | - | - | - | - | - | - | - | - | - | - | 1,444,631 |
| Provision for allocation of PIS and Cofins credits | - | 1,851,257 | - | - | - | - | - | - | - | - | - | - | - | 1,851,257 |
| Provisions for litigation | 532,428 | 652,858 | 16,168 | - | 1,392 | - | 7,943 | - | 2,692 | 7,117 | 582 | 804,442 | 11,977 | 2,037,599 |
| EQUITY | 12,790,068 | 6,610,272 | 557,130 | (34,841) | 272,981 | 8,634 | 4,896,941 | 563,169 | 229,652 | 504,086 | 418,782 | 20,817,364 | (26,503,013) | 21,131,225 |
| Attributable to controlling shareholders | 12,790,068 | 6,610,272 | 557,130 | (34,841) | 272,981 | 8,634 | 4,896,941 | 563,169 | 229,652 | 504,086 | 418,782 | 20,817,364 | (26,816,874) | 20,817,364 |
| Capital | 6,242,757 | 5,359,206 | 220,966 | 35,503 | 425,662 | 15,085 | 4,685,823 | 409,509 | 223,913 | 239,000 | 237,210 | 10,800,000 | (18,094,634) | 10,800,000 |
| Advance for Future Capital Increase | - | - | - | - | - | 1,600 | 1,460 | - | - | - | - | - | (3,060) | - |
| Capital reserves | - | - | - | - | - | - | - | - | - | - | - | - | - | - |
| Equity valuation adjustments | 586,054 | 15,777 | (363) | 7,050 | 137 | (1) | - | - | - | - | (1,113) | 593,382 | (607,541) | 593,382 |
| Legal Reserves | 877,479 | 306,744 | 44,193 | - | - | - | 34,835 | 46,488 | 376 | 24,970 | 22,794 | 1,512,687 | (1,357,879) | 1,512,687 |
| Profit retention reserve | 4,241,625 | 928,545 | 292,334 | - | - | - | 382,719 | - | - | 222,819 | 123,934 | 7,911,295 | (6,191,976) | 7,911,295 |
| Additional proposed dividends | 842,153 | - | - | - | - | - | 68,365 | 107,172 | 5,363 | 17,297 | 35,957 | - | (1,076,307) | - |
| Accumulated profit | - | - | - | (77,394) | (152,818) | (8,050) | (276,261) | - | - | - | - | - | 514,523 | - |
| Attributable to noncontrolling interests | - | - | - | - | - | - | - | - | - | - | - | 313,861 | 313,861 | |
| TOTAL | 21,757,353 | 20,538,815 | 1,083,713 | 848,198 | 334,418 | 22,946 | 7,561,419 | 938,779 | 237,382 | 591,260 | 1,808,971 | 22,075,545 | (28,095,099) | 49,703,700 |
| RESULTS | 2Q23 | 44 |
| |
| Exhibit III - ENERGY MARKET> DISTRIBUTION MARKET | |||||||||||
| Copel’s Total Market | Number of Customers / Agreements | Energy Sold (GWh) | |||||||||
| Jun-23 | Jun-22 | ∆% | 2Q23 | 2Q22 | Δ% | 1H23 | 1H22 | Δ% | |||
| Copel DIS | 5,044,797 | 4,969,499 | 1.5 | 5,797 | 5,904 | (1.8) | 11,451 | 11,590 | (1.2) | ||
| Captive Market | 5,044,479 | 4,969,191 | 1.5 | 4,930 | 4,714 | 4.6 | 10,081 | 10,034 | 0.5 | ||
| Concessionaries and Licensees | 2 | 2 | - | 24 | 25 | (2.5) | 46 | 47 | (2.6) | ||
| CCEE (Assigments MCSD EN) | 316 | 284 | 11.3 | 49 | 53 | (8.7) | 96 | 105 | (8.2) | ||
| CCEE (MVE) | - | 22 | (100.0) | - | 175 | (100.0) | - | 348 | (100.0) | ||
| CCEE (MCP) 2 | - | - | - | 794 | 937 | (15.3) | 1,228 | 1,057 | 16.2 | ||
| Copel GeT | 386 | 290 | 33.1 | 3,953 | 4,257 | (7.1) | 8,514 | 8,752 | (2.7) | ||
| CCEAR (Copel DIS) | 3 | 3 | - | 29 | 30 | (1.9) | 62 | 61 | 1.9 | ||
| CCEAR (other concessionaries) | 118 | 101 | 16.8 | 879 | 535 | 64.3 | 1,448 | 1,102 | 31.4 | ||
| Free Customers | - | - | - | - | - | - | - | - | - | ||
| Bilateral Agreements (Copel Mercado Livre) | 260 | 182 | 42.9 | 2,938 | 3,421 | (14.1) | 6,430 | 7,113 | (9.6) | ||
| Bilateral Agreements 1 | 5 | 4 | 25.0 | 38 | 36 | 7.5 | 192 | 186 | 3.0 | ||
| CCEE (MCP) 2 | - | - | - | 69 | 236 | (70.8) | 382 | 290 | 31.7 | ||
| Wind Farms Complex | 557 | 341 | 63.3 | 1,012 | 714 | 41.7 | 2,134 | 1,480 | 44.2 | ||
| 15 | 6 | 150.0 | 29 | 8 | 262.5 | 51 | 16 | 218.8 | |||
| CCEAR (other concessionaries) | 512 | 288 | 77.8 | 489 | 321 | 52.3 | 1,049 | 639 | 64.2 | ||
| CER | 10 | 10 | - | 228 | 228 | - | 454 | 454 | - | ||
| Bilateral Agreements (Copel Mercado Livre) | 8 | 5 | 60.0 | 148 | 64 | 131.3 | 270 | 143 | 88.5 | ||
| Bilateral Agreements | 12 | 32 | (62.5) | 118 | 93 | 26.9 | 262 | 195 | 34.4 | ||
| CCEE (MCP) 2 | - | - | - | - | - | - | 49 | 33 | 48.5 | ||
| Copel Mercado Livre | 1,719 | 1,678 | 2.4 | 5,304 | 5,992 | (11.5) | 11,198 | 12,156 | (7.9) | ||
| Free Customers | 1,585 | 1,470 | 7.8 | 2,921 | 2,840 | 2.8 | 5,848 | 5,762 | 1.5 | ||
| Bilateral Agreements (Group Companies) | 16 | 10 | 60.0 | 68 | 177 | (61.7) | 68 | 274 | (75.2) | ||
| Bilateral Agreements | �� 118 | 198 | (40.4) | 2,219 | 2,964 | (25.1) | 5,039 | 6,044 | (16.6) | ||
| CCEE (MCP) 2 | - | - | - | 97 | 11 | 781.8 | 243 | 76 | 219.7 | ||
| Total Copel | 5,047,459 | 4,971,808 | 1.5 | 16,067 | 16,867 | (4.7) | 33,298 | 33,978 | (2.0) | ||
| Eliminations (operations with Group companies) | |||||||||||
| Total Consolidated Copel | 16,067 | 16,867 | (4.7) | 33,298 | 33,978 | (2.0) | |||||
| Note: Not considering the energy from MRE (Energy Relocation Mechanism) and the energy from TPP Araucária sold in the CCEE Spot Market. 1 Includes Short Term Sales Agreements and CBR 2 Assured Power allocated in the period, after impact of the GSF. CCEE: Electric Power Trade Chamber / CCEAR: Energy Purchase Agreements in the Regulated Market / MCP: Short Term Market / CER: Agreements Reserve Energy / MCSD EN - Mechanism for Compensation of Surpluses and Deficits of New Energy / MVE - MVE - Sale of energy to the free market through the Surplus Selling Mechanism. | |||||||||||
| Copel’s Dis Market | Number of Customers | Consumed Energy (GWh) | |||||||||
| Jun-23 | Jun-22 | ∆% | 2Q23 | 2Q22 | Δ% | 1H23 | 1H22 | Δ% | |||
| Residential | 4,161,476 | 4,085,179 | 1.9 | 2,114 | 1,943 | 8.8 | 4,369 | 4,209 | 3.8 | ||
| Industrial | 69,454 | 70,583 | (1.6) | 3,143 | 3,139 | 0.1 | 6,092 | 6,084 | 0.1 | ||
| Captive | 68,260 | 69,535 | (1.8) | 499 | 536 | (6.9) | 973 | 1,052 | (7.5) | ||
| Free | 1,194 | 1,048 | 13.9 | 2,644 | 2,603 | 1.6 | 5,118 | 5,031 | 1.7 | ||
| Commercial | 435,017 | 426,450 | 2.0 | 1,677 | 1,543 | 8.7 | 3,374 | 3,248 | 3.9 | ||
| Captive | 433,450 | 425,101 | 2.0 | 1,108 | 1,043 | 6.2 | 2,276 | 2,250 | 1.2 | ||
| Free | 1,567 | 1,349 | 16.2 | 569 | 500 | 13.7 | 1,098 | 998 | 10.0 | ||
| Rural | 326,887 | 336,404 | (2.8) | 624 | 621 | 0.5 | 1,304 | 1,365 | (4.5) | ||
| Captive | 326,833 | 336,360 | (2.8) | 584 | 590 | (1.1) | 1,224 | 1,302 | (6.0) | ||
| Free | 54 | 44 | 22.7 | 40 | 31 | 30.3 | 80 | 62 | 28.2 | ||
| Others | 54,472 | 53,028 | 2.7 | 626 | 604 | 3.8 | 1,243 | 1,223 | 1.6 | ||
| Captive | 54,460 | 53,016 | 2.7 | 625 | 602 | 3.8 | 1,239 | 1,220 | 1.6 | ||
| Free | 12 | 12 | - | 2 | 2 | 7.0 | 4 | 3 | 9.0 | ||
| Total Captive Market | 5,044,479 | 4,969,191 | 1.5 | 4,930 | 4,714 | 4.6 | 10,081 | 10,034 | 0.5 | ||
| Total Free Market | 2,827 | 2,453 | 15.2 | 3,254 | 3,135 | 3.8 | 6,300 | 6,095 | 3.4 | ||
| Supply to Concessionaries | 7 | 7 | - | 238 | 240 | (0.6) | 460 | 470 | (2.2) | ||
| Total Grid Market | 5,047,313 | 4,971,651 | 1.5 | 8,423 | 8,089 | 4.1 | 16,841 | 16,599 | 1.5 | ||
| Micro and Mini Distributed Energy Generation | 277,977 | 159,362 | 74.4 | (421) | (247) | 70.8 | (852) | (519) | 64.0 | ||
| Total Billed Market | 8,001 | 7,842 | 2.0 | 15,989 | 16,079 | (0.6) | |||||
| RESULTS | 2Q23 | 45 |
| |
| Exhibit III - ENERGY MARKET> ELECTRICITY PURCHASED AND CHARGES | ||||||
| R$'000 | ||||||
| Electricity Purchased for Resale | 2Q23 | 2Q22 | Δ% | 1H23 | 1H22 | Δ% |
| Purchase of energy in the regulated party - CCEAR | 906,501 | 834,152 | 8.7% | 1,831,966 | 1,704,349 | 7.5% |
| Itaipu Binacional | 252,335 | 364,208 | -30.7% | 465,252 | 714,374 | -34.9% |
| Câmara de Comercialização de Energia - CCEE | 125,269 | 96,618 | 29.7% | 224,815 | 166,567 | 35.0% |
| Micro and mini generators and customer repurchase | 250,008 | 144,784 | 72.7% | 499,177 | 324,265 | 53.9% |
| Proinfa | 92,063 | 111,024 | -17.1% | 183,476 | 221,511 | -17.2% |
| Bilateral Agreements | 458,634 | 610,278 | -24.8% | 910,577 | 1,184,104 | -23.1% |
| Fair value in the purchase and sale of energy | - | (4,441) | - | - | 17,393 | - |
| (-) PIS/Pasep and Cofins | (207,218) | (238,214) | -13.0% | (416,696) | (474,656) | -12.2% |
| TOTAL | 1,877,592 | 1,918,409 | -2.1% | 3,698,567 | 3,857,907 | -4.1% |
| R$'000 | ||||||
| Charges of the main distribution and transmission grid | 2Q23 | 2Q22 | Δ% | 1H23 | 1H22 | Δ% |
| Itaipu transportation charges | 39,256 | 34,729 | 13.0% | 75,969 | 67,609 | 12.4% |
| System Service Charges - ESS | 7,996 | 12,229 | -34.6% | 12,035 | 341,753 | - |
| System usage charges | 588,929 | 447,146 | 31.7% | 1,172,073 | 882,746 | 32.8% |
| Charge reserve energy - EER | 114,099 | 67,187 | 69.8% | 252,754 | 129,466 | 95.2% |
| System usage charges - Provisions | 9,336 | 515 | 1713.5% | 11,525 | 1,517 | - |
| (-) PIS / Pasep and Cofins taxes on charges for use of power grid | (76,890) | (58,365) | 31.7% | (154,059) | (144,676) | 6.5% |
| TOTAL | 682,725 | 503,440 | 35.6% | 1,370,296 | 1,278,415 | 7.2% |
| RESULTS | 2Q23 | 46 |
| |
| Exhibit III - ENERGY MARKET> ENERGY BALANCE | |||||
| (average MW) | |||||
| Energy Balance - Copel GET - Jun-23 | 2023 | 2024 | 2025 | 2026 | 2027 |
| Own Resources GeT | 2,125 | 2,124 | 1,606 | 1,609 | 1,588 |
| GeT | 1,501 | 1,507 | 1,515 | 1,518 | 1,497 |
| GPS + Bela Vista + FDA | 624 | 617 | 91 | 91 | 91 |
| Own Resources SPP and Wind Farm | 544 | 544 | 544 | 544 | 544 |
| Purchases | 73 | 15 | 4 | - | - |
| TOTAL OWN RESOURCES + SOLD | 2,742 | 2,683 | 2,154 | 2,153 | 2,132 |
| TOTAL SOLD | 2,448 | 1,990 | 1,666 | 1,305 | 1,140 |
| Sales (Regulated) | 879 | 766 | 781 | 781 | 781 |
| Sales (Regulated) % | 32% | 29% | 36% | 36% | 37% |
| Sales (Free Market) | 1,569 | 1,224 | 885 | 524 | 359 |
| Sales (Free Market) % | 57% | 46% | 41% | 24% | 17% |
| Total Available | 294 | 693 | 487 | 848 | 992 |
| Total Available (%) | 11% | 25% | 23% | 40% | 46% |
| Avarege price of energy sold (R$) | 203.43 | 187.13 | 189.62 | 194.81 | 199.27 |
| Reference: June/23 | |||||
| Note: Considers Assured Power updated by Ordinance No. 709/2022 for: FDA, Segredo, Salto Caxias and GPS. | |||||
| (1) Includes Mauá and Baixo Iguaçu Power Plants (proportional to the stake in the project) and GPS 30% (ex-CCGF). Does not include Elejor and Foz do Chopim. | |||||
| (2) Does not include Voltália Wind Complex. | |||||

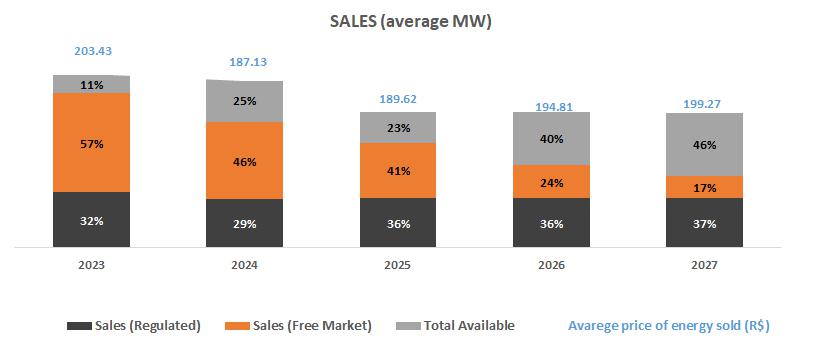
Comments: 1- Excluding losses and internal consumption. 2- Considering the GFs of wind SPEs constant for all periods. 3- Considering the Sales of wind SPEs constant for all periods. 4- Considering energy purchases in each period. 5 - Prices updated according to the contractual readjustment index, from the reference dates until June/2023. 6 - The GPS CCGF RAG is not considered in the calculation of average prices. 7 - From 2025 disregards FDA. |
| RESULTS | 2Q23 | 47 |
| |
| Exhibit III - ENERGY MARKET> TARIFFS | ||||
| Supply Tariff (R$/MWh) | Amount | Jun-23 | Jun-22 | Δ% |
| Average MW | ||||
| Copel Geração e Transmissão | 733 | 246.26 | 228.53 | 7.8% |
| Auction CCEAR 2011 - 2040 ( HPP Mauá) | 91 | 283.09 | 263.40 | 7.5% |
| Auction CCEAR 2013 - 2042 (Cavernoso II) | 7 | 305.81 | 285.16 | 7.2% |
| Auction - CCEAR 2015 - 2044 (HPP Colíder) | 116 | 216.84 | 203.72 | 6.4% |
| Auction - CCAR 2018 - 2048 (HPP Baixo Iguaçu) | 34 | 224.93 | 210.48 | 6.9% |
| Auction - CCAR 2009 - 2016 (HPP Salto Caxias)* | 485 | 247.01 | ||
| Copel Distribuição | ||||
| Concession holders in the State of Paraná | 13 | 265.11 | 241.56 | 9.7% |
| Total / Tariff Weighted Average Supply | 246.42 | 228.53 | 7.8% | |
| Contains PIS and COFINS. Net of ICMS. | ||||
| *Supply contract from May/2023. | ||||
| Purchase Tariff - Copel Distribuição (R$/MWh) | Amount | Jun-23 | Jun-22 | Δ% |
| Average MW | ||||
| Itaipu 1 | 513 | 241.96 | 308.59 | -21.6% |
| Auction – CCEAR 2010 – H30 | 66 | 292.64 | 266.63 | 9.8% |
| Auction – CCEAR 2010 – T15 2 | 60 | 193.39 | 178.14 | 8.6% |
| Auction – CCEAR 2011 – H30 | 54 | 301.71 | 274.90 | 9.8% |
| Auction – CCEAR 2011 – T15 2 | 54 | 247.77 | 225.77 | 9.7% |
| Auction – CCEAR 2012 – T15 2 | 108 | 177.61 | 166.82 | 6.5% |
| Auction – CCEAR 2016 – T20 2 | 27 | 221.18 | 207.59 | 6.5% |
| Angra | 99 | 339.88 | 346.59 | -1.9% |
| CCGF 3 | 490 | 135.00 | 124.89 | 8.1% |
| Santo Antônio | 130 | 187.24 | 170.60 | 9.8% |
| Jirau | 216 | 164.75 | 150.11 | 9.8% |
| Others Auctions 4 | 751 | 209.83 | 209.88 | 0.0% |
| Total / Average Purchuse Tariff | 2,568 | 205.32 | 209.23 | -1.9% |
| Contains PIS and COFINS | ||||
| 1 Furnas transport charge not included. | ||||
| 2 Average auction price restated according as bilateral payment to vendors. It does not include hiring effects recorded by the CCEE. | ||||
| 3 Contract of quotas of assured power of those HPPs which concessions were extended pursuant the new rules of Law 12783/13. | ||||
| 4 Products average price, does not include PROINFA. | ||||
| *The table has been updated for all periods as new calculation methodology for average prices, a result of the 4th phase of the Public Hearing 78/2011 Aneel approved on 03.28.2016. | ||||
| Retail Tariff - Copel Distribuição (R$/MWh) | Jun-23 | Jun-22 | Δ% | |
| Industrial | 504.17 | 531.9 | -5.2% | |
| Residential | 528.18 | 529.08 | -0.2% | |
| Commercial | 594.03 | 628.52 | -5.5% | |
| Rural | 544.95 | 587.27 | -7.2% | |
| Other | 409.25 | 397.13 | 3.1% | |
| Retail Tariff supply average tariff | 579.01 | 586.14 | -1.2% | |
| Demand average tariff (R$/kW) | 29.62 | 29.02 | 2.1% | |
| Does not consider tariff flags, Pis/Pasep and net of ICMS. | ||||
| RESULTS | 2Q23 | 48 |
| |
| Exhibit III - ENERGY MARKET> WIND POWER PRICES | |||||
| Wind Farms - Sold | Auction ¹ | Price (R$)² | Amount MW average/year | Start of Supply | End of Supply |
| São Bento Energia, Invest. e Part. S.A. | |||||
| GE Boa Vista S.A. | 2º LFA (08/26/2010) | 295.40 | 5.70 | 01.01.2013 | 12.31.2032 |
| GE Farol S.A. | 286.79 | 9.10 | |||
| GE Olho D’Água S.A. | 286.79 | 14.90 | |||
| GE São Bento do Norte S.A. | 286.79 | 14.00 | |||
| Copel Brisa Potiguar S.A. | |||||
| Nova Asa Branca I Energias Renováveis S.A. | 2º LFA (08/26/2010) | 289.86 | 13.20 | 01.01.2013 | 12.31.2032 |
| Nova Asa Branca II Energias Renováveis S.A. | 289.86 | 12.80 | |||
| Nova Asa Branca III Energias Renováveis S.A. | 289.86 | 12.50 | |||
| Nova Eurus IV Energias Renováveis S.A. | 289.86 | 13.70 | |||
| Santa Maria Energias Renováveis S.A. | 4º LER (08/18/2011) | 204.27 | 15.70 | 07.01.2014 | 06.30.2034 |
| Santa Helena Energias Renováveis S.A. | 204.27 | 16.00 | |||
| Ventos de Santo Uriel S.A. | 202.69 | 9.00 | |||
| Cutia | |||||
| UEE Cutia S.A. | 6º LER (10/31/2014) | 240.28 | 9.60 | 10.01.2017 | 09.30.2037 |
| UEE Esperança do Nordeste S.A. | 240.28 | 9.10 | |||
| UEE Guajiru S.A. | 240.28 | 8.30 | |||
| UEE Jangada S.A. | 240.28 | 10.30 | |||
| UEE Maria Helena S.A. | 240.28 | 12.00 | |||
| UEE Paraíso dos Ventos do Nordeste S.A. | 240.28 | 10.60 | |||
| UEE Potiguar S.A. | 240.28 | 11.30 | |||
| Bento Miguel | |||||
| CGE São Bento do Norte I S.A. | 20ª LEN (11/28/2014) | 227.60 | 9.70 | 01.01.2019 | 12.31.2038 |
| CGE São Bento do Norte II S.A. | 227.60 | 10.00 | |||
| CGE São Bento do Norte III S.A. | 227.60 | 9.60 | |||
| CGE São Miguel I S.A. | 227.60 | 8.70 | |||
| CGE São Miguel II S.A. | 227.60 | 8.40 | |||
| CGE São Miguel III S.A. | 227.60 | 8.40 | |||
| Vilas | |||||
| Vila Ceará I (Antiga Vila Paraíba IV) | 28ª LEN (08/31/2018) | 122.38 | 8.20 | 01.01.2024 | 12.31.2043 |
| Vila Maranhão I | 122.38 | 8.30 | |||
| Vila Maranhão II | 122.38 | 8.30 | |||
| Vila Maranhão III (Antiga Vila Paraíba III) | 122.38 | 8.20 | |||
| Vila Mato Grosso (Antiga Vila Alagoas III) | 29ª LEN (06/28/2019) | 102.09 | 3.30 | 01.01.2023 | 12.31.2042 |
| Jandaira | |||||
| Jandaira I | 30ª LEN (10/18/2019) | 124.85 | 1.60 | 01.01.2025 | 12.31.2044 |
| Jandaira II | 124.85 | 4.10 | |||
| Jandaira III | 124.85 | 4.40 | |||
| Jandaira IV | 124.85 | 4.30 | |||
| Aventura | |||||
| Aventura II | 26º LEN (20/12/2017) | 131.98 | 11.70 | 01.01.2023 | 12.31.2042 |
| Aventura III | 131.98 | 12.80 | |||
| Aventura IV | 131.98 | 14.10 | |||
| Aventura V | 131.98 | 15.00 | |||
| Santa Rosa & Mundo Novo | |||||
| Santa Rosa & Mundo Novo I | 26º LEN (20/12/2017) | 134.70 | 16.50 | 01.01.2023 | 12.31.2042 |
| Santa Rosa & Mundo Novo II | 134.70 | 17.00 | |||
| Santa Rosa & Mundo Novo III | 134.70 | 18.00 | |||
| Santa Rosa & Mundo Novo IV | 134.70 | 7.50 | |||
| Santa Rosa & Mundo Novo V | 134.70 | 8.10 | |||
| Voltália3 | |||||
| Carnaúbas | 04ª LER (08/18/2011) | 198.14 | 13.10 | 07.01.2014 | 06.30.2034 |
| Reduto | 198.14 | 13.90 | |||
| Santo Cristo | 198.14 | 14.80 | |||
| São João | 198.14 | 14.30 | |||
| ¹LFA - Alternative Sources Auction/LER - Reserve Energy Auction/LEN - New Energy Auction. | |||||
| ² Price updated by IPCA until Jun/2023 (Reference Jul/23). Source: CCEE | |||||
| 3 Values presented refer to 100% of the Complex. Copel has a 49% stake in the project. | |||||
| RESULTS | 2Q23 | 49 |
| |
| Exhibit III - ENERGY MARKET> ENERGY FLOW | ||||||||||||
| GWh | ||||||||||||
| Energy Flow | COPEL DIS | COPEL GET + FDA + BELA VISTA | WIND POWER | COPEL COM | ELIMINATIONS | CONSOLIDATED | ||||||
| 2Q23 | 2Q22 | 2Q23 | 2Q22 | 2Q23 | 2Q22 | 2Q23 | 2Q22 | 2Q23 | 2Q22 | 2Q23 | 2Q22 | |
| Own Generation | 3,628 | 5,459 | 703 | 437 | 4,331 | 5,896 | ||||||
| Purchased energy | 5,874 | 6,266 | 397 | 273 | - | - | 5,305 | 5,992 | 3,212 | 3,700 | 8,364 | 8,831 |
| Copel Mercado Livre | 68 | 177 | 68 | 177 | - | - | ||||||
| Companies of the group | 58 | 38 | 3,086 | 3,485 | 3,144 | 3,523 | - | - | ||||
| Itaipu | 1,187 | 1,314 | - | 1,187 | 1,314 | |||||||
| Auction – CCEAR | 3,199 | 3,044 | - | 3,199 | 3,044 | |||||||
| CCEE (MCP) | - | - | 296 | 63 | - | 12 | 296 | 75 | ||||
| Angra | 217 | 231 | 217 | 231 | ||||||||
| CCGF | 1,092 | 1,436 | 1,092 | 1,436 | ||||||||
| Proinfa | 103 | 105 | 103 | 105 | ||||||||
| Other (1) | 18 | 98 | - | 2,209 | 2,495 | 2,227 | 2,593 | |||||
| Elejor | 10 | - | 10 | - | ||||||||
| Dona Francisca | 33 | 33 | 33 | 33 | ||||||||
| MRE Receipt | - | - | ||||||||||
| Avaiable | 5,874 | 6,266 | 4,025 | 5,732 | 703 | 437 | 5,305 | 5,992 | 3,212 | 3,700 | 12,695 | 14,727 |
| Captive Market | 4,930 | 4,714 | 4,930 | 4,714 | ||||||||
| Concessionaires (2) | 24 | 25 | 24 | 25 | ||||||||
| CCEE concessionaire supply (3) | 38 | 36 | 38 | 36 | ||||||||
| CCEE (MCSD EN Assignments) (4) | 49 | 53 | 49 | 53 | ||||||||
| CCEE (MVE) (5) | - | 175 | - | 175 | ||||||||
| CCEE (MCP) (6) | 794 | 937 | 69 | 236 | -63 | -39 | 97 | 11 | 897 | 1,145 | ||
| Free Customers | - | - | 2,921 | 2,840 | 2,921 | 2,840 | ||||||
| Bilateral Agreements | - | - | 118 | 93 | 2,219 | 2,964 | 2,337 | 3,057 | ||||
| Auction – CCEAR (7) | 879 | 535 | 489 | 321 | 1,368 | 856 | ||||||
| MRE assignment (8) | 72 | 1,474 | 72 | 1,474 | ||||||||
| CER (9) | 228 | 228 | 228 | 228 | ||||||||
| Copel Mercado Livre | 2,938 | 3,421 | 148 | 64 | 3,086 | 3,485 | - | - | ||||
| Companies of the group | 29 | 30 | 29 | 8 | 68 | 177 | 126 | 215 | - | - | ||
| Losses and Differences (10) | 77 | 361 | -246 | -238 | -169 | 124 | ||||||
| RESULTS | 2Q23 | 50 |
| |
| Energy Flow | COPEL DIS | COPEL GET + FDA + BELA VISTA | WIND POWER | COPEL COM | ELIMINATIONS | CONSOLIDATED | ||||||
| 1H23 | 1H22 | 1H23 | 1H22 | 1H23 | 1H22 | 1H23 | 1H22 | 1H23 | 1H22 | 1H23 | 1H22 | |
| Own Generation | - | - | 9,126 | 8,530 | 1,635 | 929 | - | - | - | - | 10,761 | 9,459 |
| Purchased energy | 12,011 | 12,594 | 444 | 1,953 | 106 | 108 | 11,198 | 12,157 | 6,987 | 7,607 | 16,772 | 19,205 |
| Copel Mercado Livre | - | - | 68 | 274 | 106 | - | - | - | 174 | 274 | - | - |
| Companies of the group | 113 | 77 | - | - | - | - | 6,700 | 7,256 | 6,813 | 7,333 | - | - |
| Itaipu | 2,361 | 2,614 | - | - | - | - | - | - | - | - | 2,361 | 2,614 |
| Auction – CCEAR | 6,557 | 6,124 | - | - | - | - | - | - | - | - | 6,557 | 6,124 |
| CCEE (MCP) | - | - | 296 | 63 | - | - | - | 12 | - | - | 296 | 75 |
| Angra | 432 | 460 | - | - | - | - | - | - | - | - | 432 | 460 |
| CCGF | 2,308 | 2,920 | - | - | - | - | - | - | - | - | 2,308 | 2,920 |
| Proinfa | 204 | 204 | - | - | - | - | - | - | - | - | 204 | 204 |
| Other (1) | 36 | 195 | - | - | - | 108 | 4,478 | 4,889 | - | - | 4,514 | 5,192 |
| Elejor | - | - | - | - | - | - | 20 | - | - | - | 20 | - |
| Dona Francisca | - | - | 66 | 66 | - | - | - | - | - | - | 66 | 66 |
| MRE Receipt | - | - | 14 | 1,550 | - | - | - | - | - | - | 14 | 1,550 |
| Avaiable | 12,011 | 12,594 | 9,570 | 10,483 | 1,741 | 1,037 | 11,198 | 12,157 | 6,987 | 7,607 | 27,533 | 28,664 |
| Captive Market | 10,080 | 10,033 | - | - | - | - | - | - | - | - | 10,080 | 10,033 |
| Concessionaires (2) | 46 | 48 | - | - | - | - | - | - | - | - | 46 | 48 |
| CCEE concessionaire supply (3) | - | - | 85 | 78 | - | - | - | - | - | - | 85 | 78 |
| CCEE (MCSD EN Assignments) (4) | 97 | 105 | - | - | - | - | - | - | - | - | 97 | 105 |
| CCEE (MVE) (5) | - | 348 | - | - | - | - | - | - | - | - | - | 348 |
| CCEE (MCP) (6) | 1,229 | 1,057 | 382 | 292 | 49 | 33 | 243 | 77 | - | - | 1,903 | 1,459 |
| Free Customers | - | - | - | - | - | - | 5,848 | 5,762 | - | - | 5,848 | 5,762 |
| Bilateral Agreements | - | - | 106 | 108 | 262 | 195 | 4,933 | 6,044 | - | - �� | 5,301 | 6,347 |
| Auction – CCEAR (7) | - | - | 1,448 | 1,102 | 1,049 | 639 | - | - | - | - | 2,497 | 1,741 |
| MRE assignment (8) | - | - | 1,057 | 1,729 | - | - | - | - | - | - | 1,057 | 1,729 |
| CER (9) | - | - | - | - | 454 | 454 | - | - | - | - | 454 | 454 |
| Copel Mercado Livre | - | - | 6,430 | 7,113 | 270 | 143 | - | - | 6,700 | 7,256 | - | - |
| Companies of the group | - | - | 62 | 61 | 51 | 16 | 174 | 274 | 287 | 351 | - | - |
| Losses and Differences (10) | 559 | 1,002 | - | - | -394 | -443 | - | - | - | - | 165 | 560 |
| (1) Others: Energy purchased by Copel Comercialização. Includes MCSD EM Assignments of Copel Distribuição (purchase) | ||||||||||||
| (2) Energy supply to concessionaires and licensees with their own market below 500GWh/year | ||||||||||||
| (3) Supply of energy to CCEE's agent distributor, through a Regulated Bilateral Contract Agreement - CBR | ||||||||||||
| (4) Assignments MCSD EN - Contractual assignments to other distributors through the New Energy Surplus and Deficit Compensation Mechanism | ||||||||||||
| (5) CCEE (MVE): Financial settlement of energy surpluses from the distributor to the free market through the Surplus Sale Mechanism | ||||||||||||
| (6) CCEE (MCP): Electric Energy Commercialization Chamber (Spot Market). | ||||||||||||
| (7) CCEAR: Energy Trading Agreement in the Regulated Environment. | ||||||||||||
| (8) MRE: Energy Reallocation Mechanism. | ||||||||||||
| (9) CER: Reserve Energy Contract. | ||||||||||||
| (10) Considers the effects of Mini and Micro Distributed Generation (MMGD). | ||||||||||||
| (11) CG: Submarket Center of Gravity (difference between billed and received energy at the CG). | ||||||||||||
| It does not consider the energy produced by UTE Araucária sold on the spot market (MCP). | ||||||||||||
| RESULTS | 2Q23 | 51 |
| |
| Exhibit III - ENERGY MARKET> ENERGY FLOW | |
| ENERGY FLOW CONSOLIDATED 2Q23 | ENERGY FLOW CONSOLIDATED 1H23 |
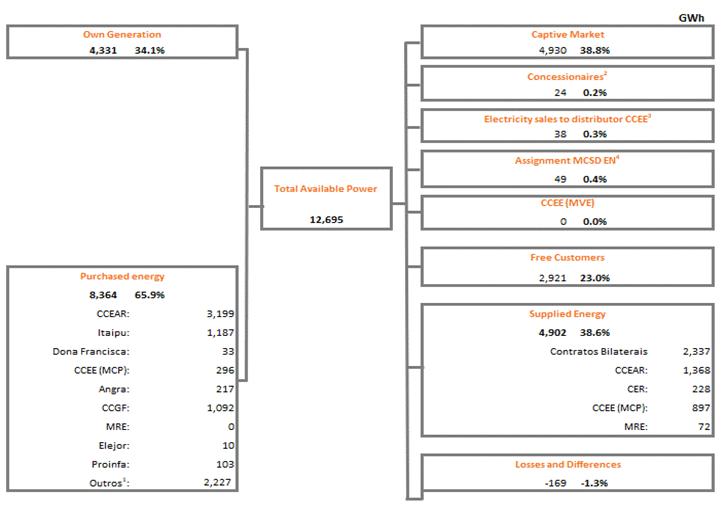 | 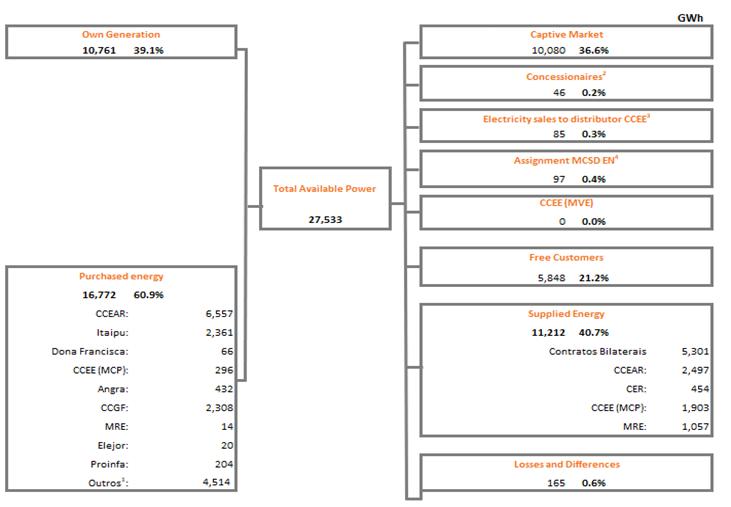 |
| Notes: | |||||||||||||||||||
| CCEAR: Energy Purchase Agreements in the Regulated Market. | |||||||||||||||||||
| CER: Reserve Energy Agreements. | |||||||||||||||||||
| MRE: Energy Reallocation Mechanism. | |||||||||||||||||||
| CCEE (MCP): Electric Power Trade Chamber (Short-term market). | |||||||||||||||||||
| CG: Center of gravity of the Submarket (difference between billed and energy received from CG). | |||||||||||||||||||
| ¹ Other: Energy purchased by Copel Comercialização and Copel Distribuição | |||||||||||||||||||
| 2 Electricity sales to concessionaries and licensees with own market of less than 500GWh/year | |||||||||||||||||||
| 3 Eletricity sales to the agent distributor of CCEE through a Regulated Bilateral Contract - CBR | |||||||||||||||||||
| 4 Assignments MCSD EN - Contractual assignments to other distributors through the Mechanism for Compensation of Surpluses and Deficits (MCSD) | |||||||||||||||||||
| 5 Considers the effect of Distributed Mini and Microgeneration (MMGD) | |||||||||||||||||||
| 6 Considers losses and the volume of energy not delivered, referring to availability contracts, which provide for subsequent reimbursement. | |||||||||||||||||||
| It does not consider the energy produced by TPP Araucária sold in the MCP (Short Term Market) or through bilateral contracts. | |||||||||||||||||||
| RESULTS | 2Q23 | 52 |
| |
| Exhibit IV - OPERATIONAL DATA> INDICATORS SUMMARY | ||||||
| MANAGEMENT | ||||||
| Copel Staff List | 2018 | 2019 | 2020 | 2021 | 2022 | Jun-23 |
| Geração e Transmissão | 1,660 | 1,620 | 1,533 | 1,523 | 1,487 | 1,485 |
| Distribuição | 5,364 | 4,964 | 4,641 | 4,430 | 4,257 | 4,234 |
| Telecomunicações | 478 | 412 | 355 | 0 | 0 | 0 |
| Holding | 75 | 61 | 96 | 169 | 84 | 81 |
| Comercialização | 34 | 38 | 42 | 44 | 47 | 42 |
| Serviços | - | - | - | 217 | - | - |
| TOTAL | 7,611 | 7,095 | 6,667 | 6,383 | 5,875 | 5,842 |
| Cotrolated Staff List | 2018 | 2019 | 2020 | 2021 | 2022 | Jun-23 |
| Compagás | 159 | 148 | 142 | 133 | 132 | 130 |
| UEG Araucária | 17 | 16 | 17 | 15 | 15 | 14 |
| Elejor | 7 | 7 | 7 | 7 | 7 | 7 |
| GENERATION | ||||||
| Copel GET | Amount | Installed Capacity (MW) | Assured Power (Average MW) | |||
| Hydroelectric | 18 | 4,868.5 | 2,067.9 | |||
| Thermoelectric | 1 | 20.0 | 17.7 | |||
| Wind | 43 | 1,130.2 | 561.3 | |||
| Copel GET (Interest) | Proportional installed capacity (MW) | Proporcional Assured Power (Average MW) | ||||
| Hydroelectric | 3 | 299.6 | 155.2 | |||
| Thermoelectric | 1 | 294.8 | 162.6 | |||
| Total Copel GET | 66 | 6,613.1 | 2,964.7 | |||
| Other Interest Copel | Proportional installed capacity (MW) | Proporcional Assured Power (Average MW) | ||||
| Hydroelectric | 5 | 201.3 | 109.7 | |||
| Thermoelectric | 1 | 98.3 | 54.2 | |||
| Wind | 4 | 52.9 | 28.0 | |||
| Solar | 1 | 1.1 | - | |||
| Total Other Interest | 11 | 353.6 | 191.9 | |||
| TOTAL Copel Group | 77.0 | 6,966.7 | 3,156.6 | |||
| TRANSMISSION | ||||||
| Copel GeT | Amount | APR (R$ million) | ||||
| Transmission Lines (km) | 3,705 | 1,049.2 | ||||
| Substation (amount) | 43 | |||||
| Interest | Amount | Proporcional APR (R$ million) | ||||
| Transmission Lines (km) | 5,980 | 512.5 | ||||
| Substation (amount) | 8 | |||||
| TOTAL | TL | 9,685 | 1,561.7 | |||
| Substation | 51 | |||||
| DISTRIBUTION | ||||||
| Distribution lines (km) | 209,665 | Captive customers | 5,044,479 | |||
| Substations | 389 | Customers by distribution employee | 1,191 | |||
| Installed power substations (MVA) | 11,644 | DEC (in hundredths of an hour and minute) | 7.90 | |||
| Municipalities served | 395 | FEC (number of outages) | 5.41 | |||
| Locations served | 1,068 | |||||
| MERCADO LIVRE | ||||||
| Number of contracts | 1,719 | |||||
| Energy sold (GWh) | 5,304 | |||||
| RESULTS | 2Q23 | 53 |
| |
| Exhibit IV - OPERATIONAL DATA> GENERATION | ||||
| COPEL GET | ||||
| Installed Capacity (MW) | Assured Power (Average MW) | Generation 1H23 (GWh)* | Concession Expires | |
| Hydroelectric Power Plants | 4,868.5 | 2,067.9 | 8,802.3 | |
| Large hydroelectric power plant (HPP) | 4,772.0 | 2,006.8 | 8,564.3 | |
| Gov. Bento Munhoz da Rocha Netto (Foz do Areia)(5) | 1,676.0 | 575.3 | 2,527.3 | 12.21.2024 |
| Gov. Ney Aminthas de B. Braga (Segredo)(5) | 1,260.0 | 558.3 | 2,386.3 | 09.25.2032 |
| Gov. José Richa (Salto Caxias)(5) | 1,240.0 | 575.4 | 2,340.2 | 03.20.2033 |
| Gov. Parigot de Souza (1)(5) | 260.0 | 103.6 | 455.0 | 01.03.2053 |
| - Regime de Cotas (70%) | 182.0 | 72.5 | 318.5 | |
| - Copel GeT(30%) | 78.0 | 31.1 | 136.5 | |
| Colíder(5) | 300.0 | 178.1 | 760.6 | 01.30.2046 |
| Guaricana(5) | 36.0 | 16.1 | 94.9 | 07.21.2028 |
| Small hydroelectric power station (SHP) | 86.9 | 55.9 | 219.4 | |
| Bela Vista(2) | 29.8 | 18.6 | 61.9 | 01.02.2041 |
| Cavernoso (5) | 1.3 | 1.0 | 0.5 | 06.23.2033 |
| Cavernoso II(5) | 19.0 | 10.6 | 42.7 | 12.06.2050 |
| Chaminé (5) | 18.0 | 11.6 | 50.7 | 08.02.2028 |
| Apucaraninha (5) | 10.0 | 6.7 | 33.6 | 01.27.2027 |
| Derivação do Rio Jordão (5) | 6.5 | 5.9 | 22.6 | 06.21.2032 |
| São Jorge (5) | 2.3 | 1.5 | 7.3 | 07.24.2026 |
| hydroelectric power plant (HPP) | 9.6 | 5.2 | 18.6 | |
| Marumbi | 4.8 | 2.4 | 11.3 | (6) |
| Chopim I | 2.0 | 1.5 | 0.0 | (3) |
| Melissa | 1.0 | 0.6 | 2.7 | (3) |
| Salto do Vau | 0.9 | 0.6 | 2.9 | (3) |
| Pitangui | 0.9 | 0.1 | 1.6 | (3) |
| Thermal Power Plant | 20.0 | 17.7 | 22.8 | |
| Figueira | 20.0 | 17.7 | 22.8 | 03.27.2019 |
| Wind Power Plants | 1,130.2 | 561.3 | 1,737.0 | |
| Eólica de Palmas (4) | 2.5 | 0.4 | 0.8 | 09.29.2029 |
| São Bento Energia, Invest. e Part. S.A. | 94.0 | 38.1 | 115.2 | |
| GE Boa Vista S.A. | 14.0 | 5.2 | 13.3 | 04.28.2046 |
| GE Farol S.A. | 20.0 | 8.8 | 24.6 | 04.20.2046 |
| GE Olho D’Água S.A. | 30.0 | 12.8 | 40.2 | 06.01.2046 |
| GE São Bento do Norte S.A. | 30.0 | 11.3 | 37.1 | 05.19.2046 |
| Copel Brisa Potiguar S.A. | 183.6 | 89.4 | 244.5 | |
| Nova Asa Branca I Energias Renováveis S.A. | 27.0 | 12.1 | 33.8 | 04.25.2046 |
| Nova Asa Branca II Energias Renováveis S.A. | 27.0 | 11.9 | 33.7 | 05.31.2046 |
| Nova Asa Branca III Energias Renováveis S.A. | 27.0 | 12.3 | 29.9 | 05.31.2046 |
| Nova Eurus IV Energias Renováveis S.A. | 27.0 | 12.4 | 35.9 | 04.27.2046 |
| Santa Maria Energias Renováveis S.A. | 29.7 | 15.7 | 42.7 | 05.08.2047 |
| Santa Helena Energias Renováveis S.A. | 29.7 | 16.0 | 43.7 | 04.09.2047 |
| Ventos de Santo Uriel S.A. | 16.2 | 9.0 | 24.7 | 04.09.2047 |
| Complexo Eólico Cutia | 180.6 | 71.4 | 239.8 | |
| UEE Cutia S.A. | 23.1 | 9.6 | 32.9 | 01.05.2042 |
| UEE Esperança do Nordeste S.A. | 27.3 | 9.1 | 27.8 | 05.11.2050 |
| UEE Guajiru S.A. | 21.0 | 8.3 | 25.9 | 01.05.2042 |
| UEE Jangada S.A. | 27.3 | 10.3 | 39.8 | 01.05.2042 |
| UEE Maria Helena S.A. | 27.3 | 12.0 | 38.8 | 01.05.2042 |
| UEE Paraíso dos Ventos do Nordeste S.A. | 27.3 | 10.6 | 37.6 | 05.11.2050 |
| UEE Potiguar S.A. | 27.3 | 11.5 | 37.0 | 05.11.2050 |
| Complexo Eólico Bento Miguel | 132.3 | 58.7 | 170.6 | |
| CGE São Bento do Norte I S.A. | 23.1 | 10.1 | 31.8 | 08.04.2050 |
| CGE São Bento do Norte II S.A. | 23.1 | 10.8 | 35.2 | 08.04.2050 |
| CGE São Bento do Norte III S.A. | 23.1 | 10.2 | 28.5 | 08.04.2050 |
| CGE São Miguel I S.A. | 21.0 | 9.3 | 25.9 | 08.04.2050 |
| CGE São Miguel II S.A. | 21.0 | 9.1 | 24.4 | 08.04.2050 |
| CGE São Miguel III S.A. | 21.0 | 9.2 | 24.8 | 08.04.2050 |
| Complexo Eólico Vilas (8) | 186.7 | 98.6 | 285.8 | |
| Vila Ceará I (Antiga Vila Paraíba IV) | 32.0 | 17.8 | 48.4 | 01.14.2054 |
| Vila Maranhão I | 32.0 | 17.8 | 51.9 | 01.11.2054 |
| Vila Maranhão II | 32.0 | 17.8 | 53.6 | 01.14.2054 |
| Vila Maranhão III (Antiga Vila Paraíba III) | 32.0 | 16.6 | 48.0 | 01.14.2054 |
| Vila Mato Grosso (Antiga Vila Alagoas III) | 58.9 | 28.6 | 83.9 | 12.06.2054 |
| Complexo Jandaira | 90.1 | 46.9 | 153.5 | |
| Jandaira I | 10.4 | 5.6 | 20.2 | 04.02.2055 |
| Jandaira II | 24.3 | 12.3 | 43.0 | 04.02.2055 |
| Jandaira III | 27.7 | 14.8 | 42.0 | 04.02.2055 |
| Jandaira IV | 27.7 | 14.2 | 48.2 | 04.02.2055 |
| Aventura 9 | 105.0 | 65.0 | 218.8 | |
| Aventura II | 21.0 | 13.1 | 43.5 | 06.05.2053 |
| Aventura III | 25.2 | 15.5 | 51.7 | 06.11.2053 |
| Aventura IV | 29.4 | 18.5 | 62.9 | 06.05.2053 |
| Aventura V | 29.4 | 17.9 | 60.9 | 06.05.2053 |
| Santa Rosa e Mundo Novo 9 | 155.4 | 92.8 | 307.9 | |
| Santa Rosa e Mundo Novo I | 33.6 | 17.3 | 54.2 | 06.04.2053 |
| Santa Rosa e Mundo Novo II | 29.4 | 17.2 | 64.4 | 06.04.2053 |
| Santa Rosa e Mundo Novo III | 33.6 | 21.5 | 72.4 | 06.04.2053 |
| Santa Rosa e Mundo Novo IV | 33.6 | 21.0 | 71.1 | 06.01.2053 |
| Santa Rosa e Mundo Novo V | 25.2 | 15.8 | 46.0 | 06.01.2053 |
| TOTAL | 6,018.7 | 2,646.9 | 10,562.1 | |
| (1) RAG of R$160.9 million, updated by Aneel's Resolution No. 3,225, of July 18, 2023. (2) In partial operation, entry into commercial operation of the fourth generating unit scheduled for 2022. (3) Power plants exempted from concession, are only registered with ANEEL. (4) Assured power considered the average wind generation. (5) Extension of Grant according to REH 2919/2021 and 2932/2021. (6) Under approval by ANEEL. | (7) Assured Power updated by Ordinance N°709/2022 for: FDA, Segredo, Salto Caxias and GPS, effective from January/2023. (8) Started up in test operation on 04/25/2022, according to ANEEL Dispatch No. 1047/2022. In commercial operation since 12/07/2022, by ANEEL order No. 2502/2022. (9) Complexes Aventura and Santa Rosa & Novo Mundo joined the Company's portfolio in Jan/23. * Considers internal consumption of generators and generation in commercial operation. ** Plant do not participate in the MRE. | |||
| RESULTS | 2Q23 | 54 |
| |
| Exhibit IV - OPERATIONAL DATA > GENERATION | ||||||
| INTEREST | ||||||
| Enterprise | Partners | Installed Capacity (MW) | Assured Power 1 (Average MW) | Proportional installed capacity (MW) | Proporcional Assured Power (Average MW) | Concession Expires |
| Hydroelectric Power Plants | 1,111.7 | 586.8 | 500.9 | 264.9 | ||
| Large hydroelectric power plant (HPP) | 1,076.5 | 561.5 | 486.2 | 254.2 | ||
| HPP Mauá (Consórcio Energético Cruzeiro do Sul) | COPEL GeT - 51% Eletrosul - 49% | 361.0 | 188.5 | 184.1 | 96.1 | 05.27.2047 |
| HPP Baixo Iguaçu (Consórcio Empreendedor Baixo Iguaçu) | COPEL GeT - 30% Geração Céu Azul - 70% | 350.2 | 172.4 | 105.1 | 51.7 | 12.03.2049 |
| HPP Santa Clara (Elejor) | COPEL - 70% Paineira Participações - 30% | 120.2 | 66.0 | 84.2 | 46.2 | 05.10.2040 |
| HPP Fundão (Elejor) | COPEL - 70% Paineira Participações - 30% | 120.2 | 62.1 | 84.1 | 43.5 | 06.11.2040 |
| HPP Dona Francisca (DFESA) | COPEL - 23,03% Gerdau - 51,82% Celesc - 23,03% Statkraft - 2,12% | 125.0 | 72.5 | 28.8 | 16.7 | 09.21.2037 |
| Small hydroelectric power station (SHP) | 29.1 | 20.4 | 10.4 | 7.3 | ||
| SHP Arturo Andreoli 2 (Foz do Chopim) | COPEL GeT - 35,77% Silea Participações - 64,23% | 29.1 | 20.4 | 10.4 | 7.3 | 02.14.2034 |
| hydroelectric power plant (HPP) | 6.1 | 4.9 | 4.3 | 3.4 | ||
| SHP Santa Clara I (Elejor) | COPEL - 70% Paineira Participações - 30% | 3.6 | 2.8 | 2.5 | 2.0 | (2) |
| SHP Fundão I (Elejor) | COPEL - 70% Paineira Participações - 30% | 2.5 | 2.1 | 1.7 | 1.5 | (2) |
| Thermal Power Plant | 484.2 | 267.0 | 393.1 | 216.8 | ||
| TPP Araucária 3 (UEG Araucária) | COPEL - 20,3% COPEL GeT - 60,9% Petrobras - 18,8% | 484.2 | 267.0 | 393.1 | 216.8 | 12.23.2029 |
| Wind Power Plants | 108.0 | 57.1 | 52.9 | 28.0 | ||
| Voltalia - São Miguel do Gostoso (5 parques) | COPEL- 49% Voltalia- 51% | 108.0 | 57.1 | 52.9 | 28.0 | (4) |
| Solar | 2.3 | - | 1.1 | - | ||
| Solar Paraná 5 | COPEL - 49% | 2.3 | - | 1.1 | - | 09.15.2046 |
| TOTAL | 1,706.2 | 910.9 | 948.0 | 509.7 | ||
| 1 Assured power updated by Ordinance No. 709/2022 of: HPP Mauá, Santa Clara, Fundão and Dona Francisca, effective from January/2023. | ||||||
| 2 Elejor requested the reclassification of its Small Hydroelectric Power Plants - (SHPs) Fundão I and Santa Clara I to Hydroelectric Generating Centers (CGHs), as amended by Art. 8 of Law 9074/1995. This was formalized through ANEEL Authorizing Resolutions 14,744 and 14,745 of 06/20/2023, with the plants exempted from concession, having only registration with ANEEL. | ||||||
| 3 Since February 1, 2014, the plant’s operation has been under the responsibility of UEGA. The Araucária TPP does not have availability agreements and operates under the merchant model. Assured power pursuant to Ordinance SPE/MME 05/2021. The most recent data from SIGA/ANEEL indicate a Assured power of 267 MW. | ||||||
| 4 The Concession Expires of the wind farm concessions are respectively: Carnaúbas (04.09.2047), Reduto (04.16.2047), Santo Cristo (04.18.2047), São João (03.26.2047). | ||||||
5 Holding of 6 SCPs operating in the field of distributed generation (photovoltaic plants): Pharma Solar II, Pharma Solar III, Pharma Solar IV, in commercial operation, e Bandeirantes Solar I, Bandeirantes Solar II e Bandeirantes Solar III, in pre-operational.
| ||||||
| RESULTS | 2Q23 | 55 |
| |
| Exhibit IV - OPERATIONAL DATA > TRANSMISSION | |||||||
| Subsidiary / SPC | Contract | Enterprise | TL | APR ¹ (R$ milhões) | Concession Expiration | ||
| Extension (km)2 | Amount | MVA | |||||
| Copel GeT | 060/20013 | Several | 2,129 | 33 | 12,440 | 661.3 | 01.01.2043 |
| Copel GeT | 075/20014 | TL Bateias - Jaguariaiva | 138 | - | - | 16.8 | 08.17.2031 |
| Copel GeT | 006/2008 | TL Bateias - Pilarzinho | 32 | - | - | 3.6 | 03.17.2038 |
| Copel GeT | 027/2009 | TL Foz - Cascavel Oeste | 117 | - | - | 16.0 | 11.19.2039 |
| Copel GeT | 010/2010 | TL Araraquara II — Taubaté | 334 | - | - | 43.6 | 10.06.2040 |
| Copel GeT | 015/2010 | SE Cerquilho III | - | 1 | 300 | 7.0 | 10.06.2040 |
| Copel GeT | 022/2012 | TL Foz do Chopim - Salto Osório LT Londrina - Figueira | 102 | - | - | 7.7 | 08.27.2042 |
| Copel GeT | 002/2013 | TL Assis — Paraguaçu Paulista II | 83 | 1 | 150 | 12.2 | 02.25.2043 |
| Copel GeT | 005/2014 | TL Bateias - Curitiba Norte | 31 | 1 | 300 | 12.9 | 01.29.2044 |
| Copel GeT | 021/2014 | TL Foz do Chopim - Realeza | 52 | 1 | 300 | 13.0 | 09.05.2044 |
| Copel GeT | 022/2014 | TL Assis – Londrina | 122 | - | - | 27.1 | 09.05.2044 |
| Copel GeT | 006/165 | Lot E: TL Baixo Iguaçu - Realeza; TL Uberaba - Curitiba Centro; TL Curitiba Leste - Blumenau; SE Medianeira; SE Curitiba Centro; SE Andirá leste; Other Sections | 255 | 4 | 900 | 154.8 | 04.07.2046 |
| Costa Oeste Copel Get - 100% | 001/2012 | TL Cascavel Norte - Cascavel Oeste TL Cascavel Norte - Umuarama Sul SE Umuarama Sul | 159 | 1 | 300 | 19.0 | 01.12.2042 |
| Marumbi Copel GeT - 100% | 008/2012 | TL Curitiba - Curitiba Leste | 29 | 1 | 672 | 27.3 | 05.10.2042 |
| Uirapuru Transmissora Copel GeT - 100% | 002/20056 | TL Ivaiporã - Londrina | 122 | - | - | 26.9 | 03.04.2035 |
| Subtotal Copel GeT 7 | 3,705 | 43 | 15,362 | 1,049.2 | |||
| Caiuá Transmissora Copel GeT - 49% Elecnor - 51% | 007/2012 | TL Guaíra - Umuarama Sul TL Cascavel Norte - Cascavel Oeste SE Santa Quitéria / SE Cascavel Norte | 142 | 2 | 700 | 16.4 | 05.10.2042 |
| Integração Maranhense Copel GeT - 49% Elecnor - 51% | 011/2012 | TL Açailandia - Miranda II | 365 | - | - | 24.6 | 05.10.2042 |
| Matrinchã Copel GeT - 49% State Grid - 51% | 012/2012 | TL Paranaíta - Ribeirãozinho | 2,033 | 4 | 800 | 133.7 | 05.10.2042 |
| Guaraciaba Copel GeT - 49% State Grid - 51% | 013/2012 | TL Ribeirãozinho - Marimbondo | 930 | 1 | - | 69.0 | 05.10.2042 |
| Paranaíba Copel GeT - 24,5% Furnas - 24,5% State Grid - 51% | 007/2012 | TL Barreiras II - Pirapora II | 967 | - | - | 44.5 | 05.02.2043 |
| Cantareira Copel GeT - 49% Elecnor - 51% | 19/2014 | TL Estreito - Fernão Dias | 656 | - | - | 68.0 | 09.05.2044 |
| Mata de Santa Genebra Copel GeT - 50,1% Furnas - 49,9% | 001/14 | TL Araraquara II - Bateias | 887 | 1 | 3,600 | 156.3 | 05.14.2044 |
| Subtotal SPCs 8 | 5,980 | 8 | 5,100 | 512.5 | |||
| Total | 9,685 | 51 | 20,462 | 1,561.7 | |||
1 Proportional to Copel's interest in the project. Values referring to the 2023/2024 cycle, effective from July 1, 2023, according to REH 3.216/2023 - Technical Note No. 39/2023 – STR/ANEEL, of June 30, 2023.
| |||||||
| RESULTS | 2Q23 | 56 |
| |
| Exhibit IV - OPERATIONAL DATA > DISTRIBUTION | ||||||
| OPERATIONAL DATA | ||||||
| Number of Consumers | Locations served | Cities served | Voltage | Number of Substations | MVA | Km of lines |
| 5,047,313 | 1,068 | 395 | 13,8 kV | - | - | 112,103 |
| 34,5 kV | 236 | 1,667 | 90,083 | |||
| 69 kV | 36 | 2,477 | 767 | |||
| 138 kV | 117 | 7,495 | 6,712 | |||
| 389 | 11,644 | 209,665 | ||||
| Consumer-to-employee ratio DIS | 2018 | 2019 | 2020 | 2021 | 2022 | Jun-23 |
Captive Consumers | 4,637,804 | 4,713,240 | 4,835,852 | 4,926,608 | 5,011,555 | 5,044,479 |
| Copel Dis employees | 5,364 | 4,964 | 4,641 | 4,430 | 4,257 | 4,234 |
| Consum/Emp | 865 | 949 | 1,042 | 1,112 | 1,177 | 1,191 |
| QUALITY OF SUPPLY | ||||||
| Year | DEC ¹ (hours) | FEC ² (outages) | ||||
| 2019 | 9.11 | 6.02 | ||||
| 2020 | 7.83 | 5.61 | ||||
| 2021 | 7.20 | 4.76 | ||||
| 2022 | 7.98 | 5.29 | ||||
| 2023 | 7.90 | 5.41 | ||||
| ¹ DEC measured in hours and hundredths of an hour ² FEC expressed in number of interruptions and hundredths of a number of interruptions year to date * Values of the last 12 months | ||||||
| Period | Technical Loss | Non-Technical Loss | Total loss | |||
| Regulatory (1) | Real (2) | Regulatory (3) | Calculated (4) | Regulatory (5) | Total (6) | |
| Jun-19 | 6.05% | 5.91% | 4.70% | 4.38% | 8.09% | 7.95% |
| Jun-20 | 6.05% | 6.04% | 4.70% | 2.17% | 8.18% | 7.03% |
| Jun-21 | 6.05% | 5.93% | 4.70% | 4.34% | 8.08% | 7.92% |
| Jun-22 | 5.79% | 5.73% | 4.47% | 4.54% | 7.65% | 7.68% |
| Jun-23 | 5.79% | 5.65% | 4.47% | 4.55% | 7.57% | 7.61% |
| (1) Percentage established in the tariff review; | ||||||
| (2) Technical loss calculated and reported monthly to Aneel; | ||||||
| (3) Percentage established in the tariff review; | ||||||
| (4) Difference between reported total losses and technical losses calculated as a percentage established in the review and the total injected energy, also reported monthly to Aneel; | ||||||
| (5) (Regulatory percentage of PNT x informed BT Market + technical losses calculated as a percentage established in the review and the total energy injected) / Injected energy; | ||||||
| (6) Total loss on injected energy. | ||||||
| NOTE: In the calculation of the distributor's total losses, energy losses inherent to the electric power system (technical losses), commercial losses (mainly due to fraud, theft) and differences related to the shift in the billing schedule and the effects of the portion of mini and micro generation distributed in the Company's network | ||||||
| RESULTS | 2Q23 | 57 |