Companhia Paranaense de Energia - COPEL (ELP)
Filed: 24 Oct 23, 6:01pm
SECURITIES AND EXCHANGE COMMISSION
Washington, D.C. 20549
FORM 6-K
Report of Foreign Private Issuer
Pursuant to Rule 13a-16 or 15d-16 of the
Securities Exchange Act of 1934
For the month of October, 2023
Commission File Number 1-14668
COMPANHIA PARANAENSE DE ENERGIA
(Exact name of registrant as specified in its charter)
Energy Company of Paraná
(Translation of Registrant's name into English)
José Izidoro Biazetto, 158
81200-240 Curitiba, Paraná
Federative Republic of Brazil
+55 (41) 3331-4011
(Address of principal executive offices)
Indicate by check mark whether the registrant files or will file annual reports under cover Form 20-F or Form 40-F. Form 20-F ___X___ Form 40-F _______
Indicate by check mark whether the registrant by furnishing the information contained in this Form is also thereby furnishing the information to the Commission pursuant to Rule 12g3-2(b) under the Securities Exchange Act of 1934.
Yes _______ No ___X____

COMPANHIA PARANAENSE DE ENERGIA – COPEL
Corporate Taxpayer ID (CNPJ/ME) 76.483.817/0001-20 - Company Registry (NIRE) 41300036535 - CVM Registration
B3 (CPLE3, CPLE5, CPLE6, CPLE11)
NYSE (ELP)
LATIBEX (XCOP, XCOPO, XCOPU)
Copel Distribuição's Grid Market grows 3.4% in 3Q23 and 2.1% in the year
COPEL (“Company”), a company that generates, transmits, distributes and trades energy, informs its shareholders and the market in general the performance of the energy market in the third quarter of 2023, compared to the same period of the previous year.
Distribution - Grid Market
Copel Distribuição's grid market, made up of the captive market, supply to concessionaires and licensees within the State of Paraná and all the free customers existing in its concession area, had an increase of 3.4% in electricity consumption in the 3Q23 in relation to the same period of the previous year and 2.1% in the year to date. The billed grid market, which considers compensated energy from Mini and Micro Distributed Generation – MMGD, fell 1.0% in the quarter and 0.1% in the year to date, considering the Availability Cost[1].
| Number of Customers | Consumed Energy (GWh) | |||||||||||
| Sep-23 | Sep-22 | ∆% | 3Q23 | 3Q22 | ∆% | 9M23 | 9M22 | ∆% | ||||
| Residential | 4,190,534 | 4,108,640 | 2.0 | 2,119 | 1,948 | 8.8 | 6,488 | 6,157 | 5.4 | |||
| Industrial | 69,318 | 70,220 | (1.3) | 3,102 | 3,118 | (0.5) | 9,194 | 9,202 | (0.1) | |||
| Captive | 68,090 | 69,149 | (1.5) | 490 | 543 | (9.7) | 1,464 | 1,595 | (8.2) | |||
| Free | 1,228 | 1,071 | 14.7 | 2,612 | 2,575 | 1.4 | 7,731 | 7,607 | 1.6 | |||
| Commercial | 438,443 | 429,040 | 2.2 | 1,573 | 1,489 | 5.7 | 4,947 | 4,737 | 4.4 | |||
| Captive | 436,796 | 427,641 | 2.1 | 1,041 | 996 | 4.6 | 3,317 | 3,246 | 2.2 | |||
| Free | 1,647 | 1,399 | 17.7 | 532 | 493 | 7.8 | 1,630 | 1,492 | 9.3 | |||
| Rural | 325,182 | 334,480 | (2.8) | 570 | 551 | 3.4 | 1,874 | 1,916 | (2.2) | |||
| Captive | 325,111 | 334,433 | (2.8) | 530 | 519 | 2.2 | 1,754 | 1,821 | (3.7) | |||
| Free | 71 | 47 | 51.1 | 40 | 32 | 23.0 | 120 | 95 | 26.5 | |||
| Others | 54,844 | 53,485 | 2.5 | 593 | 587 | 1.0 | 1,836 | 1,810 | 1.4 | |||
| Captive | 54,832 | 53,473 | 2.5 | 591 | 585 | 1.0 | 1,830 | 1,805 | 1.4 | |||
| Free | 12 | 12 | - | 2 | 2 | - | 5 | 5 | - | |||
| Total Captive Market | 5,075,363 | 4,993,336 | 1.6 | 4,772 | 4,591 | 4.0 | 14,853 | 14,624 | 1.6 | |||
| Total Free Market | 2,958 | 2,529 | 17.0 | 3,185 | 3,102 | 2.7 | 9,486 | 9,198 | 3.1 | |||
| Supply to Concessionaries | 7 | 7 | - | 238 | 230 | 3.4 | 698 | 700 | (0.3) | |||
| Total Grid Market | 5,078,328 | 4,995,872 | 1.7 | 8,195 | 7,923 | 3.4 | 25,036 | 24,522 | 2.1 | |||
| MMGD | 293,245 | 183,893 | 59.5 | (428) | (233) | 83.7 | (1,280) | (751) | 70.4 | |||
| Total Billed Grid Market | 7,767 | 7,690 | 1.0 | 23,756 | 23,771 | (0.1) | ||||||
[1] The availability cost represents the minimum amount charged for the availability of the distribution grid and is referenced in the input configurations of consumer units: 30 kWh single-phase, 50 kWh two-phase and 100 kWh three-phase circuits (ANEEL Ordinance Nº 1,000/2021 art. 291).
 |
|
The volume of offset energy, which is the surplus generation from MMGD compensated in billing, grew 83.7% in the quarter, with emphasis on the growth in the Rural (101.7%), Residential (75.4%), , Commercial (63.3%) and Industrial (127.8%) classes. The number of consumers subscribing to the MMGD reached 293 thousand in September 2023, 59.5% higher than in September 2022.
Micro e Mini Distributed Generation | Offset Energy (GWh) | |||||||
| 3Q23 | 3Q22 | ∆% | 9M23 | 9M22 | ∆% | |||
| Residential | 114 | 65 | 75.4% | 349 | 204 | 71.1% | ||
| Industrial | 41 | 18 | 127.8% | 118 | 72 | 63.9% | ||
| Commercial | 147 | 90 | 63.3% | 437 | 284 | 53.9% | ||
| Rural | 121 | 60 | 101.7% | 361 | 188 | 92.0% | ||
| Other | 5 | - | - | 15 | 3 | 400.0% | ||
| Total MMGD | 428 | 233 | 83.7% | 1,280 | 751 | 70.4% | ||
The 3Q23 result is due to the consumption of electricity by the following classes:
| i. | Residential, with an increase of 8.8%, due to the increase in average consumption in the period, from 158.03 kWh/month to 168.6 kWh/month, mainly due to the increase in average temperature in the months of August[2] and September 2023, and the 2.0% increase in the number of customers; |
| ii. | Commercial, with an increase of 5.7%, mainly due to the growth in consumption of Retail Trade by 6.6%, representing 30.2% of the consumption of the class, of Wholesale Trade by 1.1 %, representing 16.9% of the consumption of the class, and food in 8.0%, representing 6.2% of the consumption of the class, partially offset by the 2.1% reduction in consumption in Telecommunications, representing 4.9% of the consumption of the class; |
| iii. | Rural, with an increase of 3.4%, mainly due to the growth in consumption with Agriculture, Livestock and Related Services by 2.2%, representing 88.1% of the consumption of the class, Electricity, gas and others utilities at 20.4%, representing 4.9% of the consumption of the class, and Fishing and Aquaculture at 28.0%, representing 4.5% of the consumption of the class; and |
| iv. | Industrial, with a drop of 0.5%, mainly due to the reduction in consumption with Manufacturing of Chemical Products by 22.0%, Wood Products by 7.9%, Vehicles by 6.7% and Non-materials Metallics by 6.9%, partially offset by the increase in consumption with Manufacturing of Food Products by 7.9% and Pulp and Paper by 17.3%. |
[2] On average for the entire State, the maximum temperature of August/2023 and the historical average were 25.0°C and 24.4°C, respectively. As for the minimums observed, the temperatures in August/2023 were above the historical level, indicating a month with mornings warmer than normal. The average minimum temperature in Paraná in August/2023 was 13.2°C and the historical average is 11.9°C, that is, 1.3°C higher.
|
|
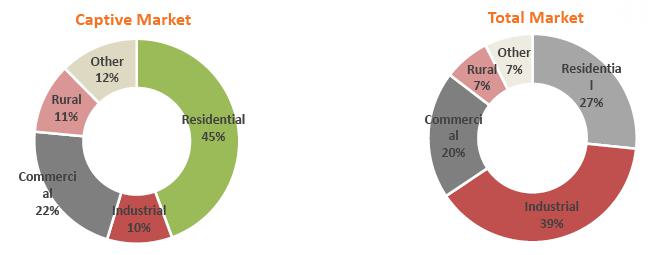
Captive Market
The captive market showed an increase of 4.0% in electricity consumption in the third quarter of 2023 and 1.6% in the year to date. The billed captive market, which considers energy offset from MMGD, fell by 0.3% in the third quarter of 2023 and by 2.2% in the year to date.
The following graphs show the electricity consumed by class in 3Q23:
Generation
In the third quarter of 2023, Copel Geração e Transmissão (including energy from HPP Foz do Areia – FDA and SHP Bela Vista – BVE, but excluding TPP Araucária) sold 4,501 GWh of electrycity, an increase of 5.8%, mainly due to CCEARs resulting from the GSF reconciliation.
For wind farms, the total electrical energy sold was 1,206 GWh, an increase of 42.0%, influenced by the entry into commercial operation of Jandaíra Wind Complex and the acquisition of the Aventura and SRMN Wind Complexes, which became part of the Company's portfolio in January 30, 2023.
For TPP Araucária, there was no dispatch in 3Q23, due to the hydrological conditions.

Trading
Copel Mercado Livre
In 3Q23, Copel Mercado Livre recorded 5,526 GWh of electricity sold, a reduction of 14.3%, due to the reduction in bilateral contracts.
|
|
Copel's Consolidated Market
The total energy sold by Copel, comprising sales by Copel Distribuição, Copel Geração e Transmissão, Wind Farm Complexes and Copel Mercado Livre in all markets, reached 16,759 GWh in 3Q23, a reduction of 4.1%.
The following table shows Copel's total energy sales, broken down into Copel Distribuição, Copel Geração e Transmissão, Wind Farms and Copel Mercado Livre:
| Copel’s Consolidated Market | Nº de customers / contracts | Energy sold (GWh) | Energy sold (GWh) | |||||||||
| Sep 23 | Sep 22 | ∆% | 3Q23 | 3Q22 | ∆% | 9M23 | 9M22 | ∆% | ||||
| Copel DIS | 5,075,638 | 4,996,189 | 1.6% | 5,526 | 5,919 | -6.6% | 16,977 | 17,509 | -3.0% | |||
| Captive Market | 5,075,363 | 4,995,872 | 1.6% | 0 | 4,772 | 4,591 | 4.0% | 14,853 | 14,624 | 1.6% | ||
Concessionaries and Licensees | 7 | 7 | - | 0 | 20 | 21 | -3.3% | 67 | 69 | -2.8% | ||
| CCEE (Assigments MCSD EN) | 268 | 288 | -6.9% | 0 | 75 | 54 | 38.7% | 172 | 159 | 7.8% | ||
| CCEE (MVE) | - | 22 | - | 0 | - | 177 | - | - | 524 | - | ||
| CCEE (MCP) 2 | �� - | - | - | 658 | 1,076 | -38.9% | 1,886 | 2,133 | -11.6% | |||
| Copel GeT | 352 | 280 | 25.7% | 4,501 | 4,256 | 5.8% | 12,513 | 12,893 | -3.0% | |||
| CCEAR (Copel DIS) | 3 | 3 | 0.0% | 29 | 31 | -3.5% | 91 | 91 | 0.1% | |||
CCEAR (other concessionaries) | 118 | 101 | 16.8% | 1,741 | 547 | 218.2% | 3,189 | 1,649 | 93.4% | |||
| Free Customers | - | - | - | - | - | - | - | - | - | |||
| Bilateral Agreements (Copel Mercado Livre) | 227 | 172 | 32.0% | 2,694 | 3,328 | -19.0% | 9,125 | 10,441 | -12.6% | |||
| Bilateral Agreements 1 | 4 | 4 | - | 36 | 37 | -1.3% | 108 | 109 | -0.6% | |||
| CCEE (MCP) 2 | - | - | - | - | 313 | - | - | 604 | - | |||
| Wind Farms Complexes | 600 | 397 | 51.1% | 1,206 | 849 | 42.0% | 3,322 | 2,265 | 46.7% | |||
| CCEAR (Copel DIS) | 15 | 6 | 150.0% | 31 | 8 | 287.5% | 85 | 23 | 269.6% | |||
CCEAR (other concessionaries) | 546 | 334 | 63.5% | 577 | 325 | 77.5% | 1,623 | 964 | 68.4% | |||
| CER | 10 | 10 | - | 231 | 231 | - | 684 | 684 | - | |||
| Bilateral Agreements (Copel Mercado Livre) | 13 | 38 | -65.8% | 180 | 91 | 97.8% | 450 | 234 | 92.3% | |||
| Bilateral Agreements | 16 | 9 | 77.8% | 187 | 139 | 34.5% | 448 | 335 | 33.7% | |||
| CCEE (MCP) 2 | - | - | - | - | 55 | - | 32 | 25 | 28.0% | |||
| Copel Mercado Livre | 1,753 | 1,677 | 4.5% | 5,526 | 6,451 | -14.3% | 16,724 | 18,607 | -10.1% | |||
| Free Customers | 1,620 | 1,482 | 9.3% | 3,014 | 2,934 | 2.7% | 8,862 | 8,696 | 1.9% | |||
| Bilateral Agreements (Group Companies) | 24 | 26 | -7.7% | 330 | 625 | -47.2% | 398 | 899 | -55.7% | |||
| Bilateral Agreements | 109 | 169 | -35.5% | 2,182 | 2,854 | -23.5% | 7,221 | 8,898 | -18.8% | |||
| CCEE (MCP) 2 | - | - | - | - | 38 | - | 243 | 114 | 113.2% | |||
| Total Copel | 5,078,343 | 4,998,543 | 1.6% | 16,759 | 17,475 | -4.1% | 49,535 | 51,275 | -3.4% | |||
| Eliminations (intra-group operations) | - | - | - | 3,264 | 4,083 | -20.1% | 10,251 | 11,690 | -12.3% | |||
| Total Consolidated Copel | - | - | - | 13,495 | 13,392 | 0.8% | 39,284 | 39,585 | -0.8% | |||
Note: Not considering the energy from MRE (Energy Relocation Mechanism) and the energy from TPP Araucária sold in the CCEE Spot Market.
¹ Includes Short Term Agreements and CBR.
² Does not consider negative amounts.
CCEE: Electric Power Trade Chamber / CCEAR: Energy Purchase Agreements in the Regulated Market / MCP: Short Term Market / CER: Agreements Reserve Energy / MCSD EN - Mechanism for Compensation of Surpluses and Deficits of New Energy / MVE - MVE - Sale of energy to the free market through the Surplus Selling Mechanism.
|
|
Curitiba, October 24, 2023.
Adriano Rudek de Moura
Chief Financial and Investor Relations Officer
For further information, please contact the Investor Relations team:
ri@copel.com or +55 41 3331-4011
|
SIGNATURE
Pursuant to the requirements of the Securities Exchange Act of 1934, the registrant has duly caused this report to be signed on its behalf by the undersigned, thereunto duly authorized.
Date October 24, 2023
| COMPANHIA PARANAENSE DE ENERGIA – COPEL | ||
| By: | /S/ Daniel Pimentel Slaviero | |
| Daniel Pimentel Slaviero Chief Executive Officer | ||
FORWARD-LOOKING STATEMENTS
This press release may contain forward-looking statements. These statements are statements that are not historical facts, and are based on management's current view and estimates of future economic circumstances, industry conditions, company performance and financial results. The words "anticipates", "believes", "estimates", "expects", "plans" and similar expressions, as they relate to the company, are intended to identify forward-looking statements. Statements regarding the declaration or payment of dividends, the implementation of principal operating and financing strategies and capital expenditure plans, the direction of future operations and the factors or trends affecting financial condition, liquidity or results of operations are examples of forward-looking statements. Such statements reflect the current views of management and are subject to a number of risks and uncertainties. There is no guarantee that the expected events, trends or results will actually occur. The statements are based on many assumptions and factors, including general economic and market conditions, industry conditions, and operating factors. Any changes in such assumptions or factors could cause actual results to differ materially from current expectations.