Companhia Paranaense de Energia - COPEL (ELP)
Filed: 9 Nov 23, 6:02am
SECURITIES AND EXCHANGE COMMISSION
Washington, D.C. 20549
FORM 6-K
Report of Foreign Private Issuer
Pursuant to Rule 13a-16 or 15d-16 of the
Securities Exchange Act of 1934
For the month of November, 2023
Commission File Number 1-14668
COMPANHIA PARANAENSE DE ENERGIA
(Exact name of registrant as specified in its charter)
Energy Company of Paraná
(Translation of Registrant's name into English)
José Izidoro Biazetto, 158
81200-240 Curitiba, Paraná
Federative Republic of Brazil
+55 (41) 3331-4011
(Address of principal executive offices)
Indicate by check mark whether the registrant files or will file annual reports under cover Form 20-F or Form 40-F. Form 20-F ___X___ Form 40-F _______
Indicate by check mark whether the registrant by furnishing the information contained in this Form is also thereby furnishing the information to the Commission pursuant to Rule 12g3-2(b) under the Securities Exchange Act of 1934.
Yes _______ No ___X____


3Q23 Highlights
| § | Transformation into a Corporation - Exercise of shares from the supplementary lot, total offer of R$5.1 billion and price per share of R$8.25 |
| § | Voluntary Dismissal Program with 1,437 people signed up |
| § | Divestment in UEGA – Beginning of the binding proposal phase |
| § | Divestment in Compagas – Hiring of consultants for structuring and executing the project |
| § | IDIVERSA B3 - Copel joins B3's diversity portfolio |
| § | Adjusted EBITDA1 of R$1.4 billion in 3Q23 (+26.8% vs 3Q22) and R$4.2 billion in 9M23 (+2.2% vs 9M22) |
| § | Net Income1 of R$441 million in 3Q23 (+16.6% vs 3Q22) |
| § | Leverage of 2.3x EBITDA and Operating cash generation of R$1.2 billion in 3Q23 |
| § | Distribution of IOC in the amount of R$958.0 million with payment by the end of June 2024 |
| § | Regulatory efficiency of Copel Distribuição of 19.6% adjusted LTM |
1 Considers discontinued operations

List of contents
| 1. Consolidated Results | 2 |
| 1.1 EBITDA | 2 |
| 1.2 Operating Revenue | 3 |
| 1.3 Operational Costs and Expenses | 4 |
| 1.4 Equity in Earnings of Subsidiaries | 5 |
| 1.5 Financial Results | 5 |
| 1.6 Consolidated Net Income | 6 |
| 1.7 Debt | 6 |
| 2. Investment | 8 |
| 2.1 Investment Policy | 8 |
| 2.2 Investment Program | 8 |
| 3. Copel Geração e Transmissão | 9 |
| 3.1 Financial Performance | 9 |
| 3.1.1 IFRS effect in the Transmission segment | 10 |
| 3.2 Operacional Performance | 11 |
| 3.2.1 Generation | 11 |
| 3.2.2 Hydro and Wind Generation | 11 |
| 3.2.3 Thermal Generation | 12 |
| 3.3 Transmission | 12 |
| 3.3.1 RBSE Reprofiling | 13 |
| 4. Copel Distribuição | 14 |
| 4.1 Financial Performance | 14 |
| 4.1.1 Regulatory Efficiency | 15 |
| 4.2 Operational Performance | 15 |
| 4.2.1 Grid Market (TUSD) | 15 |
| 4.2.2 Captive Market | 16 |
| 4.2.3 Concession Agreement | 16 |
| 4.2.4 Investment and Operational Data | 16 |
| 5. Copel Mercado Livre | 18 |
| 5.1 Financial Performance | 18 |
| 5.2 Operational Performance | 19 |
| 6. ESG Performance | 20 |
| 6.1 Copel pioneers in ESG in the sector | 20 |
| 6.2 Recent Highlights | 20 |
| 6.3 Indicators | 21 |
| 6.4 Ratings, Rankings, and Indexes | 21 |
| 7. Other highlights | 22 |
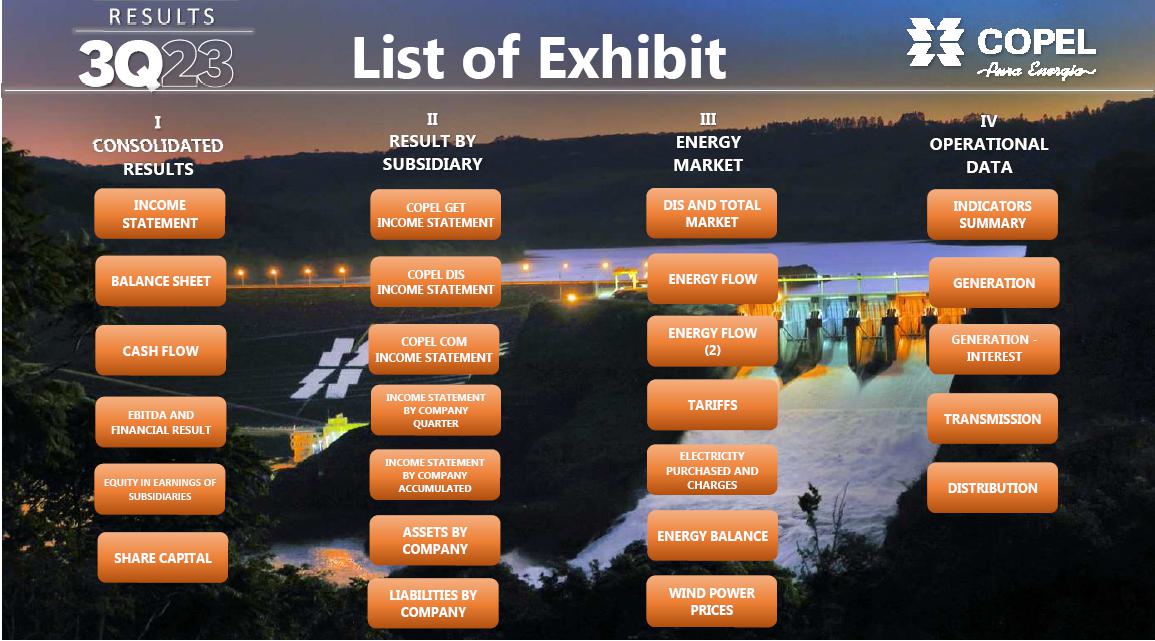
| 8. List of Exhibit | 25 |
| RESULTS | 3Q23 | 1 |
|
| 1. | Consolidated Results |
The following analyzes refer to the third quarter of 2023 and the accumulated period from January to September 2023, compared to the same period in 2022.
1.1 EBITDA
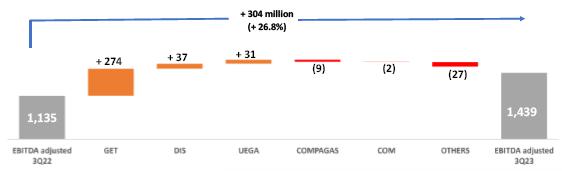
Adjusted EBITDA, considering the results of discontinued operations (referring to Compagas and UEGA, which are in the process of being sold) and excluding non-recurring items, reached R$1,439.1 million, an amount 26.8% higher than the R$1,134.9 million recorded in 3Q22, reflecting, above all, the better result of Copel GeT (+58.1%), Copel Distribuição (+7.0%) and the better remuneration on transmission assets of jointly controlled ventures, partially offset, mainly, by the lower result from Elejor ( -43.6% ) and Compagas (-14.3%). Disregarding the equity in earnings of subsidiaries, adjusted EBITDA increased by 21.8% (R$1,371.2 million in 3Q23 compared to R$1,126.0 million in 3Q22).
The main factors explaining the result are:
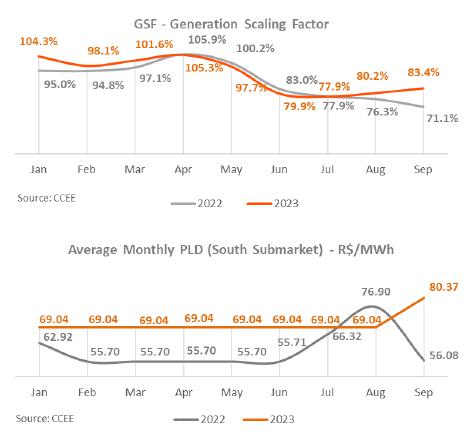
(i) the better performance of Copel GeT in the results of the purchase and sale of electricity (+R$201.8 million), mainly due to the 13.3% growth (+R$130.3 million) in electricity sales to distributors, effect (a) of the greater volume of energy sold in the regulated market (ACR) (+1,446 GWh) given the validity of another contract during the third quarter of 2023, whose origin was the renegotiation of the hydrological risk in the ACR, resulting in the postponement of this contract in the amount of 478 average MW with a sales price for this energy of around R$250 per MWh; (b) the most favorable hydrological scenario in 3Q23, with an average GSF of 80.5%, compared to 75.1% in 3Q22; and (c) for the acquisition of the Aventura and Santa Rosa & Mundo Novo – SRMN Wind Complexes;
(ii) the superior result of Copel Distribuição, mainly due to the tariff readjustment in June 2023, with an average effect of an increase of 6.32% in the Tariffs for the Use of the Distribution System (TUSD), the 1.0% growth in billed grid market and the 42.2% increase in other operating revenues, due to higher revenue from leases and rents from pole sharing contracts; and
(iii) the higher remuneration on transmission agreement assets, mainly due to the periodic tariff review applied to contracts in July 2023 and the inflation (IPCA) of 0.61% in 3Q23 compared to deflation in 3Q22 (-1.32%), with a positive effect on the use of the main distribution and transmission grid revenue from Copel GeT (+R$132.9 million) and on the equity in earnings of subsidiaries result (increase of R$58.9 million) in the comparison between periods.
These events were partially offset, mainly, by (i) the increase of R$101.7 million in provisions and reversals (on a recurring basis), the effect, above all, of the provision of R$66.1 million relating to regulatory litigation within the scope of Copel GeT, effect of Aneel Order No. 2,094 of June 28, 2023, which deals with the methodology for calculating the Surplus and Deficit Compensation Mechanism (MCSD)1; (ii) the growth of R$69.6 million in “third-party services”, basically due to higher expenses with maintenance of the electrical system, consultancy services and expenses related to obtaining waivers in the company's transformation process in True Corporation; and (iii) Elejor's lower margin in the sales of electricity when comparing periods.
Adjusted Consolidated EBITDA
Obs. Considers discontinued operations
1 Due to the renegotiation of the hydrological risk in the ACR in 2016, which extended the validity period for plants with existing energy in the period from 05/24/2023 to 09/17/2023, Copel GeT, understanding that the amounts originally contracted in the auctions must be fully rehired, without subsequent reductions caused by the Surplus and Deficit Return Mechanism – MSCD 4% and monthly, filed a precautionary measure with Aneel, accepted by the agency, to suspend the effects of the MCSD in this process. |
| RESULTS | 3Q23 | 2 |
|
The non-recurring items that were neutralized for calculating the adjusted EBITDA are shown in the table below:
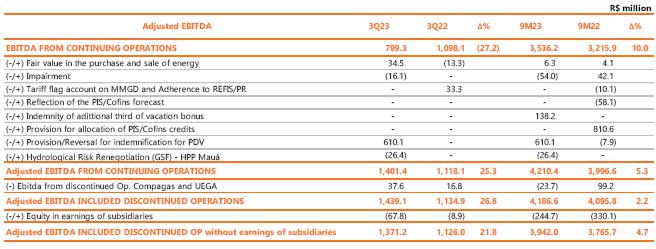
In 3Q23, the following non-recurring items were recorded: (i) provisioning in the amount of R$610.1 million relating to the Voluntary Dismissal Program (PDV) approved in a collective labor agreement and which includes the dismissal of 1,437 employees, as per Notice to the Market 23/23; (ii) R$34.5 million referring to the fair value of Copel Mercado Livre's energy purchase and sale contracts (mark to market), an amount determined by the difference between the contracted price and the future market price estimated by the Company; (iii) recognition, in September 2023, of R$26.4 million relating to the extension of the concession period for HPP Mauá by 763 days, due to the approval of the exclusion of liability in the construction phase of the project and recomposition of the agreement reconciliation of hydrological risk (GSF); and (iv) reversal of impairment of generation assets in the amount of R$16.1 million relating, essentially, to TPP Figueira, due to the completion of the modernization work and its entry into commercial operation.
In 2023, considering the results of discontinued operations and excluding non-recurring items, EBITDA reached R$4,186.6 million, an amount 2.2% higher than the R$4,095.8 million recorded in 9M22, justified mainly by the better performance of Copel Distribuição due, essentially, to the growth of portion B and the control of the manageable costs.
In the context of transmission assets, it is worth mentioning that item 3.1.1 presents the regulatory accounting of results for the purpose of verifying the IFRS (International Financial Reporting Standards) effect.
1.2 Operating Revenue
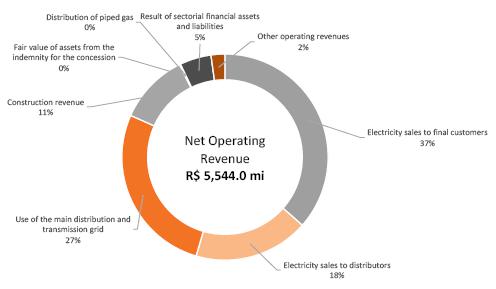
Net operating income from continuing operations totaled R$5,544.0 million in 3Q23, growth of 8.5% compared to the R$5,108.4 million recorded in 3Q22. This result is mainly a reflection of:
| (i) | the increase of R$330.6 million in revenue from the use of the main distribution and transmission grid, mainly due to (a) the June 2023 tariff readjustment of Copel Distribuição, with an average effect of an increase of 6.3% in the Tariffs for the Use of the Distribution System (TUSD); (b) the 1.0% growth in Copel Distribuição’s billed grid market; and (c) the higher remuneration of transmission assets, due to the periodic tariff review applied to transmission agreements in July 2023 and the inflation (IPCA) of 0.61% in 3Q23 compared to deflation in 3Q22 (-1.32%) ; |
| (ii) | the growth of R$273.9 million in revenue from electricity sales to final customers, essentially due to the effect of the distributor’s tariff readjustment of 17.4% applied to the Energy Tariff (TE) component in June 2023; |
| (iii) | the increase of R$52.9 million in construction revenue, essentially due to the increase in the volume of works related to the “Transformation” Program, which encompasses investments aimed at improving and modernizing infrastructure and improvements in customer service; |
| (iv) | the increase of R$11.3 million in the “other operating revenues” line, basically due to the increase in income from leasing and rentals by the distributor, with emphasis on the greater volume of sharing of poles/fixing points and the contractual adjustment according to the General Market Price Index - IGP-M. |
These increases were partially offset by the reduction of R$257.3 million in the result of sectorial financial assets and liabilities (CVA), due to the reduction in the constitution of financial assets, with the reduction in energy costs (lower costs with contracted energy from Itaipu and reduction in tariff flags) and other financial components.
| RESULTS | 3Q23 | 3 |
|
In the period from January to September 2023, net operating revenue totaled R$15,911.8 million, an increase of 4.2% compared to the R$15,270.6 million recorded in the same period of 2022, with emphasis on the following variations: (i) increase of R$815.6 million (+23.1%) in revenue from “Use of the main distribution and transmission grid”; (ii) increase of R$154.3 million (+9.7%) in construction revenue; (iii) growth of R$91.2 million (+29.2%) in the “other operating income” item; (iv) reduction of R$329.3 million (-27.2%) in the result of sectorial financial assets and liabilities; and (v) drop of R$94.2 million (-3.3%) in revenue from electricity sales to distributors.
1.3 Operational Costs and Expenses
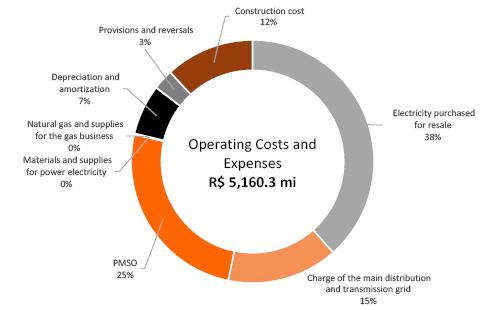
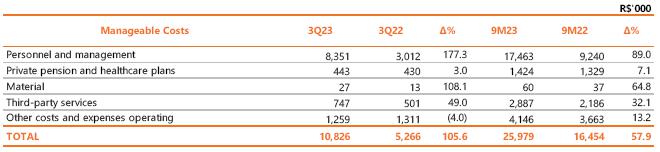
In 3Q23, operating costs and expenses of continued operations totaled R$5,160.3 million, an increase of R$19.3% compared to the R$4,325.3 million recorded in the same period of 2022, mainly due to:
| (i) | the increase in PMSO (excluding provisions and reversals) of R$643.8 million, basically justified by the registration of R$610.1 million relating to the Voluntary Dismissal Program (PDV) and higher expenses with third-party services, partially offset by the reduction in “other operating costs and expenses”, as shown below: |

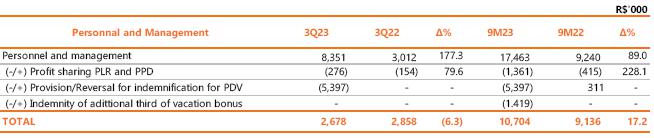
The Voluntary Dismissal Program (PDV), approved in a collective labor agreement, comprises the dismissal of 1,437 employees and the provisioned amount will be paid as indemnification, plus a fine of 40% of the FGTS and the amounts of food assistance and the subsidy from the employer relating to the monthly health plan payment, with the cash disbursement of the indemnification and FGTS fine being made at the time of each employee's dismissal. Furthermore, the personnel line was impacted by the higher provision for the performance bonus (PPD) and profit sharing (PLR), +R$7.3 million.
Neutralizing the effects of provisions related to PDV, PPD and PLR, there is an increase of 2.3% in the quarterly comparison, despite the salary adjustment of 7.19% applied through the ACT 2022/2024 collective labor agreement. Considering the accumulated inflation measured by the National Consumer Price Index – INPC of 4.51% between 3Q22 and 3Q23, there was a reduction in real terms of 2.1%.
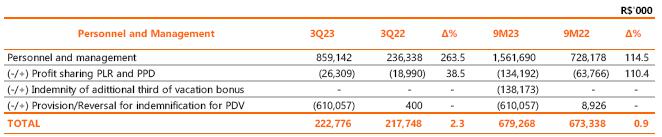
The increase of R$69.6 million in third-party services is mainly due to the increase in expenses with maintenance of the electrical system, consultancy services and expenses related to obtaining waivers in the process of transforming the company into a True Corporation.
| (ii) | the increase of R$ 169.7 million in the line “Charge of the main distribution and transmission grid”, justified mainly by due to higher costs with energy transport on the basic grid; and |
| RESULTS | 3Q23 | 4 |
|
| (iii) | the growth of R$85.6 million in the “provisions and reversals” line (provision of R$141.2 million in 3Q23 compared to provision of R$55.6 million in 3Q22), caused, above all, by the increase in R$93.4 million in provisions for litigation, mainly due to the provision of R$66.1 million involving the calculation methodology of the Surplus and Deficit Compensation Mechanism (MCSD) at Copel GeT. |
These increases were partially offset by: (i) a reduction of R$170.7 million in electricity purchased for resale (-7.9%) due to the improvement in the hydrological scenario (average GSF of 80.5% in 3Q23 compared to 75.1% in 3Q22) and lower costs with energy contracted from Itaipu (-30.5%) due, the lower volume and the reduction in the average purchase price; and (ii) a decrease of R$52.1 million (-40.6%) in the line of other operating costs and expenses, mainly due to the impact of R$33.3 million in 3Q22 related to the distributor's adherence to the program of tax installments (REFIS) and the positive effect in 3Q23 of R$ 26.4 million resulting from the extension of the concession period for HPP Mauá by 294 days, arising from the reconciliation of the hydrological risk (GSF). For more details, see item 7.
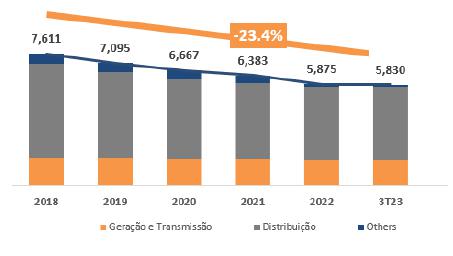
Headcount Evolution
In the year to September, total operating costs and expenses reached R$13,647.5 million, a value 9.3% higher than the R$12,489.1 million recorded in the same period of 2022. Considering the impact of the provision for the allocation of PIS and Cofins credits in 2022 (R$810.6 million), total operating costs and expenses increased by 2.6%.
1.4 Equity in Earnings of Subsidiaries
The equity result of joint ventures and other Copel associates increased by R$58.9 million compared to that recorded in the same period of the previous year (R$67.8 million, compared to R$8.9 million recorded in 3Q22), due to the higher remuneration on transmission assets, basically justified by the higher IPCA in the period (IPCA of 0.61% in 3Q23 compared to -1.32% in 3Q22). More details can be seen in Exhibit I.
1.5 Financial Results
In 3Q23, the financial result was a negative R$322.8 million, compared to a negative R$216.5 million recorded in 3Q22. Financial expenses registered an increase of R$142.2 million, essentially due to the greater monetary variation and debt charges, due to the higher balance on loans and financing (R$15.1 billion vs R$13.3 billion in the 3Q22), and the greater impact of PIS/Pasep and Cofins on Interest on Equity (+R$57.7 million). Financial revenues increased by R$35.9 million, essentially reflecting the higher income from financial investments (+R$59.3 million), partially offset by the 26.8% drop in late payment charges on energy bills.
| RESULTS | 3Q23 | 5 |
|

1.6 Consolidated Net Income
Copel recorded in 3Q23, considering the results of discontinued operations, net income of R$441.2 million compared to R$378.4 million recorded in 3Q22. In addition to the items already mentioned, it is worth highlighting positive impact of R$308.2 million on the item “Income Tax and Social Contribution” in 3Q23, basically due to the deduction of amounts due to the payment of Interest on Equity (JCP) and the increase of R$41.8 million (+13.7%) in the item “depreciation and amortization”, mainly due to the entry into operation of the Jandaíra Wind Complex, the acquisition of the Aventura and Santa Rosa & Mundo Novo Wind Complexes and the increase in investments by Copel Distribuição.
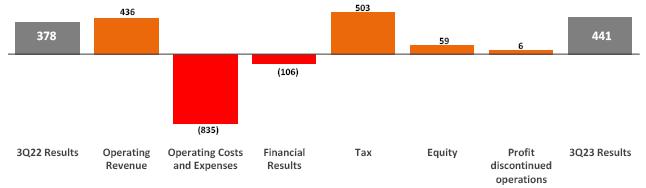
Disregarding the effect of discontinued operations, net income recorded in 3Q23 for continued operations was R$436.9 million compared to R$380.6 million in 3Q22, representing a growth of 14.8%.
Considering the accumulated result in the first nine months, the net income recorded in 9M23, considering discontinued operations, was R$1,384.4 million compared to R$525.8 million recorded in the same period of 2022.
1.7 Debt
Copel's total consolidated debt, considering the results of continued operations, totaled R$15,140.3 million on September 30, 2023, a variation of 21.7% in relation to the amount recorded on December 31, 2022, of R$12,454.2 million.
At the end of 3Q23, the Company's gross debt represented 64.4% of consolidated net equity, which was R$23,508.1 million.
The following graphs show the debt of Copel and its subsidiaries at the end of September 2023.
Debt by Subsidiary
Adjusted Net Debt/EBITDA Adjusted

| RESULTS | 3Q23 | 6 |
|
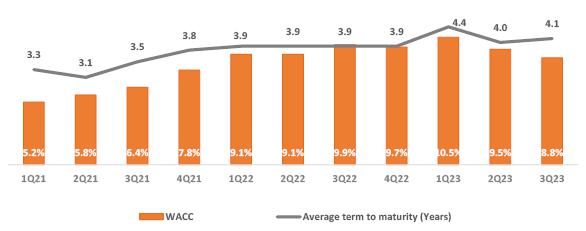
Debt Indexers Average cost: 8.81%

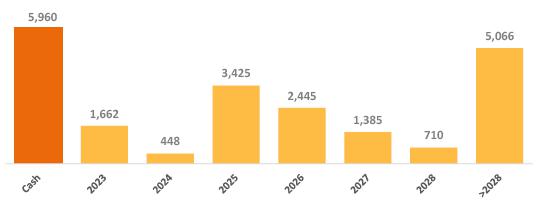
Amortization - R$ million Average term to maturity: 4.1 years
Weighted Average Cost and Average term to maturity
Copel's consolidated debt at the end of 3Q23, considering discontinued operations (referring to Compagas and UEGA, which are in the process of being sold), totaled R$15,443.8 million, an increase justified by the 4th issuance of simple debentures by Compagas in July 2023 in the amount of R$295.0 million.
| RESULTS | 3Q23 | 7 |
|
| 2. Investment |
2.1 Investment Policy
In March 2021, the Board of Directors approved the Company's Investment Policy. Said Policy was subject to analysis and approval by the Investment and Innovation Committee, which was established by the new Bylaws of March 11, 2021, whose main purpose is to improve discipline in the allocation of capital, being an essential tool for the execution of the strategic guidelines for sustainable growth, generation of value for shareholders and the perpetuity of our energy business.
The Policy establishes the criteria for selecting, prioritizing, evaluating, approving and monitoring investments. Among the various aspects, the Policy segregates investment opportunities into three groups that will be prioritized as follows:
| (i) | Operating Investments: expansion of capacity and modernization of the assets of the Distribution, Transmission and Generation concessions, in addition to the continuity of existing businesses; |
| (ii) | Strategic Investments: acquisition and development of new assets with an emphasis on brownfield opportunities and that provide operational synergies to the Company. Portfolio review and divestments are included; and |
| (iii) | Investments in Innovation: where we highlight projects aimed at open innovation. |
The Investment and Innovation Committee meets ordinarily once a month and extraordinarily whenever necessary, analyzing and issuing recommendations for the Company's investment proposals.
2.2 Investment Program
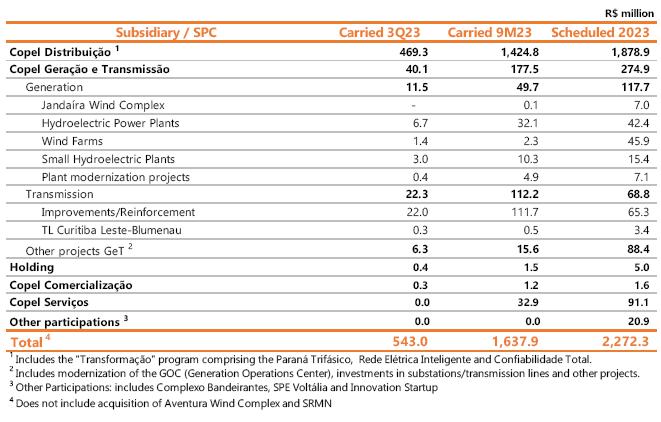
Investment Programs follow their schedules in each development project. For 2023, the estimated amount allocated to the investment program is R$ 2,272.3 million, with Copel Distribuição contemplating most of the forecast amount, whose objective is the permanent improvement of operational efficiency and cost reduction through the advancement of important projects, with emphasis on the continuity of the execution of the Paraná Triphasic and Smart Electric Network programs (see item 4.2.4). These programs are aimed at renewing depreciated assets in rural areas, improving the quality and speed of service, integration with smart cities and improving information via network sensing.
In 3Q23, R$543.0 million were invested, with R$469.3 million (86.4%) allocated to Copel Distribuição, R$40.1 million (7.4%) to Copel Geração e Transmissão, R$ 32.9 million (6.1%) in Copel Serviços and R$0.7 million in Copel Comercialização e Holding (0.1%). The highlight of the quarter is the application of investment for the Distributed Generation project in Paraná carried out by Copel Serviços (R$ 32.9 million). In the year to date, the amount of investment made was R$ 1,637.9 million, of which R$ 1,424.8 (87.0%) in Copel Distribuição, R$ 177.5 million (10.8%) in Copel Geração and Transmission, R$32.9 million (2.0%) in Copel Serviços and R$2.7 million (<0.1%) in Copel Comercialização and Copel Holding.
| RESULTS | 3Q23 | 8 |
|
3. Copel Geração e Transmissão (Consolidated Results) |
| 3.1 Financial Performance |
Copel GeT presented an adjusted EBITDA, considering the result of the discontinued operation of UEGA and excluding non-recurring items, of R$828.8 million, an amount 58.1% higher than the R$524.3 million recorded in 3Q22, in mainly due to the growth of 13.3% (+R$130.3 million) in revenue from electricity sales to distributors, effect (a) of the greater volume of energy sold in the regulated market (ACR) (+1,446 GWh) given the validity of another contract during the third quarter of 2023, whose origin was the renegotiation of the hydrological risk in the ACR, which resulted in the postponement of this contract in the amount of 478 average MW with a sales price of this energy of around R$250 per MWh ; (b) the most favorable hydrological scenario in 3Q23, with an average GSF of 80.5%, compared to 75.1% in 3Q22; and (c) the acquisition of the Aventura and Santa Rosa & Mundo Novo Wind Complexes – SRMN;
Also noteworthy:
| (i) | the growth of R$132.9 million in revenue from the use of the main transmission grid and R$60.8 million in equity in earnings of subsidiaries, justified mainly by the higher remuneration on transmission assets, due to the periodic tariff review applied to transmission agreements and the inflation (IPCA) of 0.61% in 3Q23 compared to deflation in 3Q22 (-1.32%); and |
| (ii) | the most favorable hydrological scenario in 3Q23, with an average GSF of 80.5%, compared to 75.1% in 3Q22. |
Partially offset by:
| (iii) | increase of R$60.7 million with provisions and reversals (on a recurring basis), essentially the effect of the provision relating to regulatory litigation over the calculation methodology of the Surplus and Deficit Compensation Mechanism (MCSD); |
| (iv) | reduction of R$ 22.0 million in revenue from wind farms in the northeast due to generation deviation, mainly due to the operational transmission restriction imposed by the ONS (Constrained-off) resulting from complications in the system in 3Q23. |
PMSO expenses, excluding provisions and reversals, increased by 93.7%, mainly influenced by:
| (i) | increase in personnel and management costs of R$198.1 million, justified by the provision of R$190.3 million related to the Voluntary Dismissal Program (PDV), with 374 subscriptions to Copel GeT; and the provision of R$2.9 million referring to the performance bonus (PPD) and profit sharing (PLR); |
| RESULTS | 3Q23 | 9 |
|
| (ii) | Increase in expenses with “third party services” by 12.8%, reflecting additional costs with the operation and maintenance of the Aventura and Santa Rosa & Mundo Novo Wind Complexes; |
| (iv) | partially offset by the reduction in other operating costs and expenses by 4.3%, mainly due to lower costs with payment of financial compensation for the use of water resources (R$37.7 million in 3Q23 compared to R$39, 3 million 3Q22). |
Neutralizing the effects of provisions relating to PDV, PPD and PLR, there is an increase of 6.3% in the quarterly comparison despite the salary adjustment of 7.19% applied through the ACT 2022/2024 collective agreement. Considering the accumulated inflation measured by the National Consumer Price Index – INPC, of 4.51% between 3Q22 and 3Q23, there was an increase in real terms of 1.7%.
Still regarding non-recurring items, in 3Q23 the following were recorded: (i) recognition, in September 2023, of R$26.4 million relating to the extension of the concession period for HPP Mauá by 763 days, due to the granting of the exclusion of liability in the construction phase of the project and recomposition of the hydrological risk reconciliation (GSF), more details in “Other highlights”; (ii) the partial reversal of impairment of generation assets in the amount of R$16.1 million, mainly explained by the reversal of R$15.8 million relating to TPP Figueira, which has been in commercial operation since December 2022.
Within the scope of transmission assets, item 3.1.1 presents the regulatory accounting of results for the purpose of verifying the IFRS (International Financial Reporting Standards) effect.
Copel GeT recorded net income of R$428.6 million in 3Q23, growth of 142.3% compared to 3Q23. Year to date, net income went from R$1,117.6 million in 9M22 to R$1,172.7 million in 9M23. This result mainly reflects (i) the growth in EBITDA, based on the points presented previously and (ii) the better result with income tax and social contribution (+R$ 102.1 million in 3Q23 compared to -R$ 79.9 million in 2Q22) due to the deduction of amounts due to the payment of Interest on Equity (JCP); partially offset by the increase in financial expenses, resulting from higher monetary charges on the debt.
3.1.1 IFRS effect in the Transmission segment
For the calculation, an adjustment was made considering the effects of the application of CPC47/IFRS15 in the corporate statements in the transmission business.
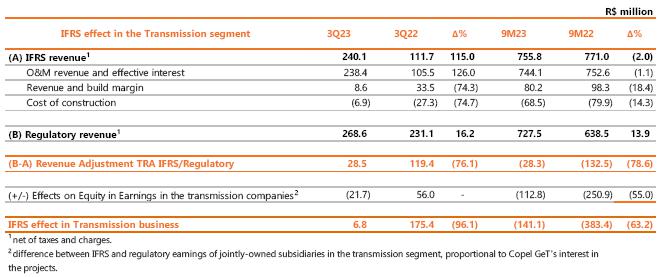
| RESULTS | 3Q23 | 10 |
|
| 3.2 Operacional Performance |
Copel is present in 10 states, operating in the generation and transmission business.
In the Generation business, Copel GET operates a diversified park of hydroelectric, wind and thermal plants, totaling 6,966.7 MW of installed capacity and 3,156.6 average MW of assure energy. In the Transmission business, Copel owns a total grid of 9,685 Km of transmission lines and 51 basic grid substations, considering the affiliates.
For more information on generation and transmission operational data, see Exhibit IV.

3.2.1 Generation
Copel's generating portfolio is made up of 94% of renewable sources, such as hydro and wind power.

3.2.2 Hydro and Wind Generation
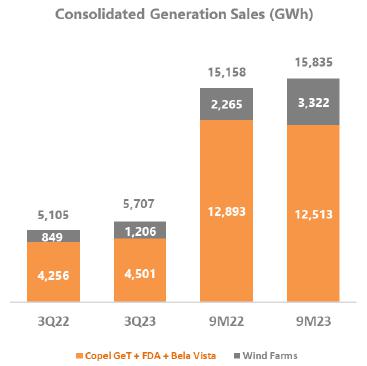
The energy generation of Copel Geração e Transmissão S.A. and its wind farms in 9M23 was 17,710 GWh (compared to 16,855 GWh in 9M22). The increase is mainly due to the entry into commercial operation of Jandaíra and the acquisition of the Aventura and Santa Rosa & Mundo Novo (SRMN) Wind Complexes.
In the third quarter of 2023, Copel Geração e Transmissão (including energy from HPP Foz do Areia – FDA and SHP Bela Vista – BVE, but excluding TPP Araucária) recorded 4,501 GWh of electricity sold, an increase of 5.8%, mainly due to CCEARs resulting from the GSF reconciliation.
For wind farms, the total electrical energy sold in 3Q23 was 1,206 GWh, an increase of 42.0%, influenced by the entry into commercial operation of Jandaíra and the acquisition of the Aventura and SRMN Wind Complexes, which became part of the portfolio of the Company on January 30, 2023.
| RESULTS | 3Q23 | 11 |
|
3.2.3 Thermal Generation
TPP Araucária
It is a natural gas generation plant with an installed capacity of 484.2 MW that operates in a combined cycle (two gas turbines and one steam turbine) and operates in the modality known as "merchant" in which the plant operates without sales contracts. of electricity, whether in the free (ACL) or regulated (ACR) environment, subject to fluctuations in the Price for Settlement of Differences - PLD. In this modality, the thermoelectric plant is dispatched centrally by the National Electric System Operator (ONS), in situations where the Marginal Cost of Operation (CMO) of the electrical system exceeds its Variable Unit Cost (CVU) approved by ANEEL, or out of order of merit, when requested by the ONS. In this context, with the good hydrological conditions in 3Q23, there was no dispatch from the plant.
TPP Figueira
Coal-fired generation plant with an installed capacity of 17.7 MW, achieved after a recent modernization process that allowed for an increase in capacity without the need to increase the volume of coal consumed. TPP Figueira has been in commercial operation since 12/07/2022, by ANEEL order No. 2502/2022, generating 17.3 GWh in 3Q23 and 40.1 GWh in the year to date.
3.3 Transmission
Copel has more than 9.6 thousand km of transmission lines in eight Brazilian states, considering its own assets and in partnership with other companies. In addition to building, maintaining and operating an extensive own energy transmission grid, Copel provides services to projects of other concessionaires with the quality of someone who has accumulated more than 60 years of experience in the sector. The Transmission projects are listed in Exhibit IV, including the projects of Copel Geração e Transmissão, SPCs Costa Oeste, Marumbi and Uirapuru Transmissora (100% Copel GeT), as well as the 7 SPCs in which Copel GeT has a stake.
| RESULTS | 3Q23 | 12 |
|
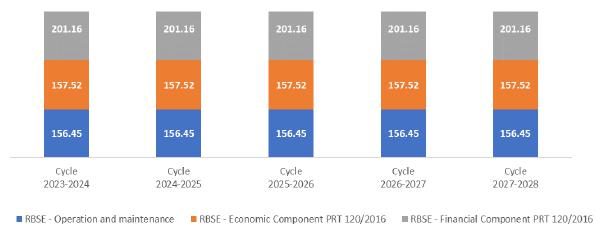
3.3.1 RBSE Reprofiling
The Concession Agreement 060/2001 represents 44.1% of the annual permitted revenue (APR) of Copel GET's transmission business, also considering its affiliates. Below, we describe the flow of receipt of the portion of revenue referring to the Basic Grid - Existing System (RBSE) for the next cycles. It is important to note that this flow may change in the future, as a result of the tariff review processes and/or review of parameters used to compose these revenues by the regulatory agent. The values referring to O&M from the 2023-2024 cycle were readjusted by the IPCA.
Note:
Economic component: future values based on the 2023-2024 cycle (according to REH 3.216/2023 of 06/30/2023)
Financial component: values published in REH 2847/21. Subject to review during the current cycle in view of the controversy in the methodology used to calculate these values by the regulatory agency.
RAP values up to the 2023-2024 cycle taken from the REH of each cycle, with reference to the cycle price (June of the year of publication) RAP values include RB and DIT assets
| RESULTS | 3Q23 | 13 |
|
| 4. Copel Distribuição |
| 4.1 Financial Performance |
Adjusted EBITDA in 3Q23 reached R$566.9 million, an increase of 7.0%, mainly due to (i) the tariff readjustment in June 2023, with an average increase of 6.32% in the Tariffs for the use of the Distribution System (TUSD); (ii) the 1.0% growth in the billed grid market and (iii) the 42.2% (+R$41.6 million) increase in other operating revenues, relating to leases and rentals of equipment and structures and sharing of poles. Year-to-date, adjusted EBITDA increased 20.6%.

Manageable costs, excluding provisions and reversals, increased 109.6% compared to 3Q22, mainly as a result of the increase of: (i) 276.7% in personnel, due to the provision for imdemnification for the Voluntary Dismissal Program (PDV), with 1,034 subscriptions to Copel DIS, and (ii) 31.9% with third-party services, caused by higher expenses with maintenance of the electrical system, maintenance of facilities, call center and customer service; partially offset by the 39.6% reduction in other operating costs and expenses, mainly related to the reduction in taxes, compared to the REFIS/PR registration in 2022.
The personnel and management account, excluding the effects of the provision for PDV, profit sharing (PLR) and performance bonus (PPD), recorded a reduction of 0.2%.
Considering the accumulated inflation measured by the National Consumer Price Index – INPC, of 4.51% between 3Q22 and 3Q23, the cost line with personnel and management registered a reduction in real terms of 4.5%, a result, especially, of the reduction 49 employees between periods.
Provisions and reversals increased by 48.5%, mainly due to the increase in provisions due to risk review in civil, administrative and labor disputes. PECLD, even with the reduction in losses, increased by 6.5%, from R$25.1 million to R$26.7 million in 3Q23, due to a reversal in the constitution of PECLD of R$30,6 million in 3Q22 and the partial impact of the tariff readjustment in 3Q23.
The following table presents the main indicators of Copel Distribuição:

In 3Q23, we also highlight:
| (i) | the 18.8% growth in revenue from Use of the main distribution grid, mainly due to the tariff readjustment in June 2023, with an average effect of a 6.32% increase in the Tariffs for the Use of the Distribution System and 1.0% growth in the billed grid market, which considers offset energy from Distributed Mini and Micro Generation – MMGD. Also contributing to this growth was the 3.7% reduction in the Energy Development Account – CDE, a reducing account for the item, which constitutes a sectoral liability in the CVA to maintain the neutrality of sectoral charges for the distributor; |
| RESULTS | 3Q23 | 14 |
|
| (ii) | the 23.5% increase in electricity sales to final customers, due to the average effect of a 17.4% increase in the Energy Tariff (TE) component in the company's 2023 tariff readjustment, partially offset by 0.3% reduction in the captive billed market in the quarter; |
| (iii) | the 44.4% reduction in revenue from electricity sales to distributors, due to the reduction in revenue from energy settlement in the CCEE Spot Market and revenue from MVE contracts; |
| (iv) | the 48.5% reduction in the sectorial assets and liabilities result, due to the reduction in the constitution of assets due to the reduction in electricity costs; and |
| (v) | the 33.9% increase in costs for charges of main transmission grid, due to the increase of: R$111.7 million in charges for the use of the Basic Grid, given the increase in transmission tariffs; R$ 36.5 million with power transport from Itaipu; R$31.5 million in System Services Charges – ESS, compared to negligible amounts recorded in 3Q22; and R$ 24.9 million with Charges of Reserve Energy, a supplementary charge to the Reserve Energy Account due to the lower amounts collected through the settlement of reserve energy to the PLD. |
Copel Distribuição's net income was R$4.6 million in 3Q23 and R$305.8 million in the year to date. For comparison purposes, we have Copel Distribuição's adjusted net income of R$266.85 million in 3Q23, an increase of 2.8%, and R$627.8 million in the year to date, an increase of 0.4 %.
4.1.1 Regulatory Efficiency
Copel Distribuição recorded an adjusted EBITDA of R$1,954.6 million in the last 12 months, equivalent to an efficiency of R$319.8 million, 19.6% above the regulatory EBITDA and 3.7% higher than the result recorded in the 12 months ending in 2Q23.
Note: Regulatory EBITDA is calculated based on the WACC + QRR values published in ANEEL's Technical Notes in Tariff Revision or Adjustment events.
4.2 Operational Performance
4.2.1 Grid Market (TUSD)
Copel Distribuição's grid market, made up of the captive market, supply to concessionaires and licensees within the State of Paraná and all the free customers existing in its concession area, had a 3.4% increase in electricity consumption in the 3Q23 compared to the same period of the previous year and 2.1% year-to-date. The billed grid market, which considers offset energy from Distributed Mini and Micro Generation – MMGD, increased 1.0% in the quarter and dropped 0.1% in the year, considering the Availability Cost.
| RESULTS | 3Q23 | 15 |
|
4.2.2 Captive Market The captive market showed an increase of 4.0% in electricity consumption in the third quarter of 2023 and 1.6% for the year. The billed captive market, which considers MMGD offset energy, decreased by 0.3% in the third quarter of 2023 and dropped by 2.2% in the year. |
4.2.3 Concession Agreement
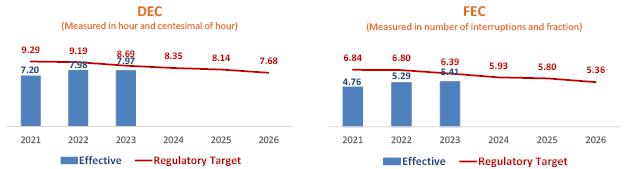
In December 2015, the Company signed the fifth amendment to the Public Service Concession Agreement for Electricity Distribution No. 46/1999 of Copel Distribuição SA, which extends the concession until July 7, 2045. Copel Distribuição complied with the conditioning requirements of economic-financial efficiency and quality for the inspection cycle of the initial 5 years. From the sixth year after the conclusion of the contract, failure to comply with the quality criteria for three consecutive years or the economic-financial management criteria for two consecutive years will result in the opening of the expiry process. For the quality criterion of distribution service provision, ANEEL defined the limits of Equivalent Interruption Duration per Consumer Unit - DEC and Equivalent Interruption Frequency per Consumer Unit - FEC for the years 2021 to 2026. For DEC, the result calculated in September 2023 was 7.97 hours. For FEC, the result in the same period was 5.41 interruptions.
The economic-financial management efficiency criterion will be measured by the calculation, each calendar year, according to ANEEL Normative Resolution No. 896/2020, by the following inequation:

4.2.4 Investment and Operational Data
Transformation Program (Programa Transformação) - a broad investment plan with the objective of modernizing, auto mating and renovating the distribution grid and private communication grid with standardized technologies to service automation equipment. Among the expected benefits are the strengthening of rural grid to reduce disconnections and guarantee support for the growth of agribusiness in the State of Paraná, the reduction of costs with O&M and commercial services and improvement in the control of DEC and FEC indicators. The program is composed of 3 pillar projects to achieve the objectives:
| · | Paraná Tri-phase: represents the improvement and renewal of rural distribution grid in the Company's concession area, with the implementation of a three-phase grid and creation of redundancy in the main rural branches. |
| · | Smart Grid: aims to implement a private communication network with standardized technology to service all automation equipment in the distribution grid and advanced metering infrastructure. By the end of September 2023, 540 thousand smart meters had been installed. |
| · | Total Reliability: aims to ensure modernity in the operations of the energy grid based on the following premises: maintain full communication between teams and the availability of equipment on the grid, implement automation in special equipment, maintain the entire municipality of the concession with a substation or special key and expand the grid circuits and Self Healing. By the end of September 2023, the project had completed 82.2% of the planned schedule. |
Copel Distribuição's Transformation Program covers the construction of approximately 25 thousand km of new grid, 15 thousand new automated points and the implementation of smart grid technology in the state of Paraná.
Compact and Protected Grid – deployment of compact grid predominantly in urban areas with a high degree of afforestation in the vicinity of distribution grid and protected grid exclusively in rural areas. Compact grid avoids cutting and pruning trees and improves the quality of supply, as it reduces the number of disconnections. Protected grid also improves the quality and reliability of the system as it avoids interruptions due to contact with vegetation or other objects and bad weather. At the end of September 2023, the extension of compact and protected grid installed was 26,504 km (21,385 km in September 2022), an increase of 5,119 km, or 23.94%, in twelve months.
| RESULTS | 3Q23 | 16 |
|
Isolated Secondary Grid- investment in isolated low voltage secondary grid (127/220V), which have significant advantages over the conventional overhead grid, such as: improving the indicators Duração Equivalente de Interrupção por Unidade Consumidora - DEC (Equivalent Duration of Interruption per Consumer Unit) and e Frequência Equivalente de Interrupção por Unidade Consumidora – FEC (Equivalent Frequency of Interruption by Consumer Unit), hinder energy theft, improve environmental conditions, reduce pruning areas, increase safety, reduce voltage drop across the grid and increase the life of transformers by reducing the number short circuits in the network, among others. At the end of September 2023, the extension of isolated secondary distribution grid installed was 22,609 km (21,658 km in September 2022), an increase of 951 km, or 4.39%, in twelve months.
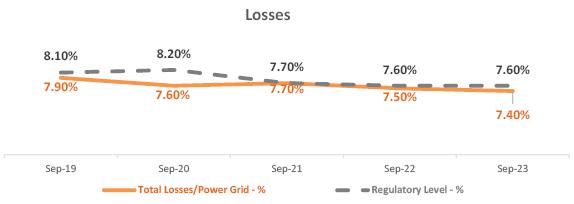
Losses - refer to the generated electrical energy that passes through transmission lines and distribution grid, but which is not commercialized, either for technical or commercial reasons. Distribution losses can be defined as the difference between the electricity purchased by distributors and that billed to their consumers, being classified as technical and non-technical. Technical Losses are inherent to the electrical energy distribution activity and occur due to its dissipation during the transport process, voltage transformation and measurement due to the laws of physics. Historically, the Company's Technical Losses have maintained percentages close to or below the regulatory target. At the end of September 2023, Technical Losses for the last 12 months were 2,057 GWh, compared to 2,038 GWh for the same period of the previous year. Non-Technical Losses, calculated by the difference between total and technical losses, originate mainly from theft (illegal connection, direct grid diversion), fraud (meter tampering or deviations), reading, measurement and billing errors. These losses are largely associated with the concessionaire's management and the socioeconomic characteristics of the concession areas. At the end of September 2023, Non-Technical Losses for the last 12 months were 575 GWh, compared to 614 GWh in the same period of the previous year. Total losses, at the end of September 2023, accumulated in 12 months 2,632 GWh, compared to 2,651 GWh in the same period of the previous year. In terms of classification, Total Losses were made up of 78% Technical Losses and 22% Non-Technical Losses.
| GWh - 12 Months | set/19 | set/20 | set/21 | set/22 | set/23 |
| Injected Energy | 33,023 | 32,377 | 34,374 | 35,216 | 35,546 |
| Distribuition losses | 2,605 | 2,465 | 2,651 | 2,651 | 2,632 |
| Technical losses | 1,997 | 1,958 | 1,989 | 2,038 | 2,057 |
| Non-Technical losses | 608 | 507 | 662 | 614 | 575 |
* The losses reflect the difference between the measured load and the billed market and, with the onset of the Covid-19 Pandemic, the load in 2020 suffered a rapid retraction, but the market did not respond at the same speed, due to the mismatch between the measurement schedule and consumers billing schedule, reducing the volume of losses in this period.
The tariff transfer of the efficient levels of losses is foreseen in the concession contracts and these losses are considered in the costs with the purchase of energy up to the regulatory limit stipulated by ANEEL. Despite the total losses having percentages slightly above the regulatory one, the methodology for regulatory calculation uses the billed market and within this methodology, no loss glosses were calculated for Copel Distribuição in the annual tariff readjustment cycles of 2022 and 2023.
| RESULTS | 3Q23 | 17 |
|
5.Copel Mercado Livre |
| 5.1 Financial Performance |
In 3Q23, Copel Mercado Livre presented an adjusted EBITDA of R$19.9 million, an amount 7.8% lower than the R$21.6 million recorded in 3Q22, mainly reflecting the 14.3% reduction in the amount of energy sold. In the year to date, adjusted EBITDA increased 58.0%, as a result of better sales margins compared to last year, reaching R$102.8 million compared to R$65.1 million in the same period of the previous year.

In the quarter, the main adjustment between periods was the fair value of energy purchase and sale contracts (mark to market) - amount determined by the difference between the contracted price and the future market price estimated by the Company - a result, mainly, of the execution of contracts that went beyond the base and the increase in the sensitivity of default given by the credit risk rate.
Manageable costs increased by 105.6% in 3Q23, mainly impacted by the 177.3% increase in the cost of “Personnel and management”, due to the provision for indemnifications for PDV and the 49.0% increase in “Third-party services” due to expenses with maintenance of facilities and costs with communication, processing and transmission of data.
The personal and administrators account, excluding the effects of the provision for PDV, profit sharing (PLR) and performance bonus (PPD), recorded a reduction of 6.3%.
Considering the accumulated inflation measured by the National Consumer Price Index – INPC, of 4.51% between 3Q22 and 3Q23, the cost line with personnel and management registered a reduction in real terms of 10.3%, a result, especially, of the reduction of 5 employees between periods.
The following table presents the main indicators of Copel Mercado Livre:
Copel Mercado Livre had a loss of R$7.0 million in 3Q23 and a net income of R$80.9 million in the year to date. For comparison purposes, adjusted net income in 3Q23 was R$ 19.4 million, an amount 14.5% lower than 3Q22 and, in the year to date, R$ 89.7 million, an amount 48.0% above the same period of the previous year.
| RESULTS | 3Q23 | 18 |
|
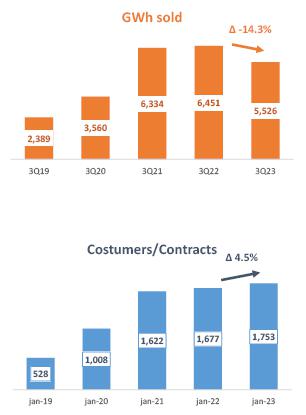
5.2 Operational Performance Copel was a pioneer in creating an energy trader and the first to sell energy to free consumers, when this category was created in the country, in 1995. Copel Mercado Livre, created in 2016, is already the largest in the country in terms of energy volume marketed in the free contracting environment, offering more savings and peace of mind for customers from all regions of Brazil. For a long time known as Copel Energia, Copel Mercado Livre is responsible for trading energy and providing services in the ACL. In September 2023, the Company registered 1,753 clients/contracts, an increase of 4.54% compared to the same period of the previous year. The amount of energy sold reached 5,526 GWh sold in 3Q23, a decrease of 14.3% compared to 3Q22. The graph below shows the evolution of Copel Mercado Livre in terms of the amount of GWh sold and the number of final customers.
|
| RESULTS | 3Q23 | 19 |
|
| 6. ESG Performance |
| 6.1 Copel pioneers in ESG in the sector |
Copel was the first company in the industry to produce an Environmental Impact Report for a generation project, and the first energy company in Brazil to become a signatory of the UN Global Compact in 2000. The Company promotes actions to disseminate the UN’s Agenda 2030 and implement the SDGs of the electricity sector. In 2020/2021, Copel participated in the Global Compact Program “SDG Ambition”. Copel joined the “Pact on Water and Energy Resilience” Commitment and received the Federal Government’s Pro Gender and Race Equality Seal. The Company received the Pró-Ética Seal, 2018-2019 and 2020-2021 editions, granted by the Brazillian Comptroller General (CGU) and Instituto ETHOS, for the voluntary adoption of integrity measures, for public recognition of the commitment to implement measures aimed at prevention, detection, and remediation of acts of corruption and fraud.
6.2 Recent Highlights
| § | Copel participated in the Ambition for SDG 2023 Program, an initiative proposed by the Global Compact at a global level, which has already involved more than 650 companies from all over the world, with the purpose of establishing ambitious goals for the Sustainable Development Goals. Copel presented the Aluno Energia Program, linked to SDG 4 – Quality Education, which is one of the Company's priority SDGs. |
| § | Received for the fourth consecutive year the Gold Seal from the Brazilian GHG Protocol Program for the preparation and publication of its Greenhouse Gas (GHG) Inventory. |
Environmental
| § | It has a Copel 2030 Neutrality Plan, approved by the Board of Directors: focusing on science-based goals (SBTi), with the purpose of neutralizing the Emission of Greenhouse Effect Gases (GHG) of Scope 1, for the assets that Copel owns operational control (according to the concept established in the GHG Protocol methodology) by 2030; |
| § | Net Zero Ambition Movement – Copel joined the Net Zero Ambition Movement. The movement is part of the strategies developed by the Global Compact so that large companies together can promote actions that result in the reduction of 2Gton CO2e by 2030; |
| § | Has corporate policies on Climate Change, Environmental, and Biodiversity; |
| § | Integrates the Brazilian Business Commitment to Biodiversity with the Brazilian Business Council for Sustainable Development (CEBDS). |
Social
| § | Actions and Programs – Solidary Selective Collection; Grow Energy Program; Electricity Citizenship; Good Neighborhood Program; Diversity Commission; Human Rights; EducaODS; Illuminating Generations; More than Energy, among others; |
| § | Has corporate policies on Human Rights, Engagement with Stakeholders, Private Social Investment, People Management, Occupational Health and Safety, among others. |
Governance
| § | It has Statutory Advisory Committees to the Board of Directors: Statutory Audit Committee -CAE; Statutory Sustainable Development Committee -CDS, Investment and Innovation Committee -CII and Minority Shareholders Committee -CDM; |
| § | The Board of Directors is made up mostly of independent members; |
| § | The Statutory Audit Committee -CAE is made up of independent members, one of whom is an external member; |
| § | Establishment of variable remuneration with ESG targets –2022: 30% of PPD; |
| § | Listed under B3 Governance Level 2. |
Priority SDG of the Brazilian Electricity Sector

| RESULTS | 3Q23 | 20 |
|
6.3 Indicators
The indicators may change due to the assurance of the independent external audit.
6.4 Ratings, Rankings, and Indexes
| Index | Ranking | Reference Year: |
 | 14th position | 2022 |
 S&P Global S&P Global | CSA Score 68 | 2022 |
 CARBON DISCLOSURE PROGRAM (CDP) CARBON DISCLOSURE PROGRAM (CDP) | B | 2022 |
 | yes | 2023 |
 | Low Risk | 2023 |
 | A | 2023 |
| RESULTS | 3Q23 | 21 |
|
7. Other highlights |
Conversion into Corporation – Public Offering of Shares
According to Material Fact 06/22 of November 21, 2022, the State of Paraná, the Company's controlling shareholder, expressed its intention to convert Copel into a diluted-capital company, with no controlling shareholder (corporation), through a public offering for secondary distribution of common shares and/or share deposit certificates (units) issued by the Company. On 07/26/2023, Copel submitted to the Securities and Exchange Commission the request for automatic registration of a public offering for primary and secondary distribution of, initially, 549,171,000 common shares issued by the Company, all nominative, book-entry and without par value, free and clear of any liens or encumbrances. On August 11, 2023, the share offering was settled, at a price of R$8.25 per share, totaling R$4,530.6 million. There was also the exercise of 72,821,650 shares from the supplementary lot, concluded on 09/06/23. Thus, the total public distribution offering, consisting of a base offering plus supplementary lot, being (i) primary of 246,256,841 common shares issued by the Company; and (ii) secondary of 375,735,809 shares held by the State of Paraná, totaling R$5,131,439,362.50.
Available Cash Flow and Dividends
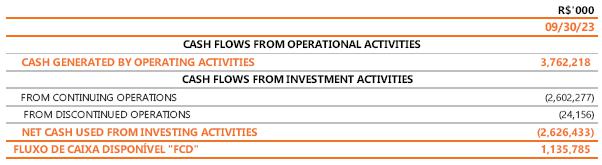
The Available Cash Flow is defined in the Dividend Policy as: FCD = Cash generated by Operating activities, deducted from the net cash used by investing activities, as follows: (a) Cash generated by Operating Activities: cash generated by operating activities in the fiscal year, before taxes, contributions (IRCS) and financial charges; (b) Net cash used by Investing activities: amount invested in noncurrent assets in the fiscal year. The Table below shows the calculation of FCD as of September 30, 2023:
Copel in the IDIVERSA B3 portfolio
The Company's preferred shares (CPLE6) were included in the theoretical portfolio of the Brasil, Bolsa, Balcão Diversity Index (“IDIVERSA B3”). IDIVERSA B3 aims to make diversity indicators visible and tangible for the market and generate comparability in the performance of companies, inducing them to adopt the best practices in relation to diversity. The indicator represents the average performance of the shares of assets of listed companies that stand out in the diversity criteria, based on the Diversity Score developed by B3, based on the data available in the Reference Form (“FRE”). Participation in this index reflects the commitment to the sustainable development strategy and the promotion of professional relationships based on diversity, inclusion, equal opportunity and non-discrimination in people management. More information in Notice to the Market 19/23.
Voluntary Dismissal Program (“PDV”)
Copel launched, on August 24, 2023, as provided for in the Collective Labor Agreement (“ACT”) signed in January this year, the new Voluntary Dismissal Program (“PDV”). 1,437 subscriptions were made, based on an assessment that considered the financial aspects and maintenance of its operations. The total estimated cost of the program, including compensation and additional costs, is R$610 million, which will be recognized in 2023. More information in Notice to the Market 20/23 and Notice to the Market 23/23.
Divestment in UEGA – Binding proposal stage
On September 4, 2023, Petróleo Brasileiro S.A. (“Petrobras”), Copel's partner in UEGA, informed in a statement released to the market the continuity in the process of selling its stake in UEG Araucária S.A. As a result, the divestment of Copel in UEGA will continue jointly with Petrobras. On October 27, 2023, the binding proposal phase began, in which qualified proponents will have the opportunity to carry out due diligence, technical visits and submit their respective binding proposals. The subsequent stages of the operation involve the assessment and approval of the binding proposal within internal corporate governance procedures. More information in Notice to the Market 21/23 and Notice to the Market 25/23.
| RESULTS | 3Q23 | 22 |
|
Divestment in UEGA – Continuity of the sales process
On September 4, 2023, Petróleo Brasileiro S.A. (“Petrobras”), Copel's partner in UEGA, informed in a statement released to the market the continuity in the process of selling its stake in UEGAraucária S.A. As a result, Copel's divestment in UEGA will continue jointly with Petrobras. More information in Notice to the Market 21/23.
Divestment in Compagas – Hiring of advisors
On September 20, 2023, the Board of Directors approved the hiring of the necessary advisors to structure and execute the potential divestment project in Companhia Paranaense de Gas - Compagas. More information in Material Fact 16/23.
Copel approves JCP of R$ 958.0 million
On September 20, 2023, the Board of Directors approved the distribution of Interest on Equity – JCP for 2023, in the amount of R$ 958,000,000.00 as follows: (a) JCP in the amount of R$ 456,920,036.75 , with payment to be made on 11/30/2023; (b) JCP in the amount of R$501,079,963.25, with payment to be made by the end of June 2024, on a date to be fixed by the Ordinary General Meeting held in 2024. More information in Material Fact 17/23.
Copel files letter regarding TPP Figueira concession
On October 31, 2023, the Company filed a letter with Aneel requesting the withdrawal of the intention to extend the concession of TPP Figueira, formulated in 2017, with immediate return to the Granting Authority of all reversible assets, rights and privileges linked to TPP Figueira and with the corresponding compensation to Copel GeT for the reversion of the assets. The plant underwent a recent modernization process, with the direct benefits of improving energy efficiency and reducing pollutant emissions into the atmosphere, compared to the old plant. The plant was released for commercial operation on December 7, 2022 through Order No. 3,502/2022.
Reinstatement of the concession period for HPP Mauá
The Jayme Canet Junior hydroelectric plant (HPP Mauá) had its concession period extended by another 763 days, due to the recognition of the exclusion of liability requested by Copel Get. 469 days were added due to the approval of the liability exclusion itself and another 294 days relating to the recomposition of the extension of the grant of the GSF agreement for the year 2021, due to the liability exclusion.
Therefore, the final deadline for granting the grant is now June 28, 2049, as shown in the table below.
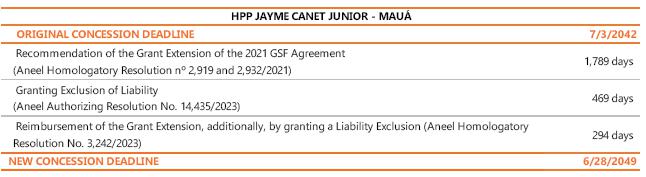
On the base date of September 30, 2023, an additional value to the intangible assets of the aforementioned plant of R$ 26.4 million was recorded, and the useful life of the assets will be reviewed for the new end date of the concession and the depreciation will be recalculated accordingly. prospective. More information in Explanatory Note 17.2 of our Financial Statements.
| RESULTS | 3Q23 | 23 |
|
.Disclaimer
The information contained in this press release may contain forward-looking statements that reflect management’s current view and estimates of future economic circumstances, industry conditions, company performance, and financial results. Any statements, expectations, capabilities, plans and assumptions contained in this press release that do not describe historical facts such as statements regarding the declaration or payment of dividends, the direction of future operations, the implementation of relevant operating and financial strategies, the investment program, factors or trends affecting the Company’s financial condition, liquidity or results of operations are forward-looking statements within the meaning of the U.S. Private Securities Litigation Reform Act of 1995 and involve a number of risks and uncertainties. There is no guarantee that these results will actually occur. The statements are based on many assumptions and factors, including general economic and market conditions, industry conditions and operating factors. Any changes in such assumptions or factors could cause actual results to differ materially from current expectations.
Investor Relations ri@copel.com Phone: +55 (41) 3331-4011
8. List of Exhibit |
| RESULTS | 3Q23 | 24 |
 |
| Exhibit I -CONSOLIDATED RESULTS > INCOME STATEMENT |
| R$ '000 | ||||||
| Income Statement | 3Q23 | 3Q22 | Δ% | 9M23 | 9M22 | Δ% |
| OPERATING REVENUES | 5,543,989 | 5,108,442 | 8.5 | 15,911,770 | 15,270,561 | 4.2 |
| Electricity sales to final customers | 2,023,937 | 1,750,075 | 15.6 | 5,753,677 | 5,746,937 | 0.1 |
| Electricity sales to distributors | 998,600 | 996,566 | 0.2 | 2,738,710 | 2,832,912 | (3.3) |
| Use of the main distribution and transmission grid | 1,502,528 | 1,171,966 | 28.2 | 4,347,990 | 3,532,405 | 23.1 |
| Construction revenue | 616,653 | 563,740 | 9.4 | 1,746,127 | 1,591,794 | 9.7 |
| Fair value of assets from the indemnity for the concession | 8,283 | (13,918) | - | 41,898 | 45,045 | (7.0) |
| Distribution of piped gas | 273,256 | 530,548 | (48.5) | 879,709 | 1,209,056 | (27.2) |
| Result of Sectorial financial assets and liabilities | 120,732 | 109,465 | 10.3 | 403,659 | 312,412 | 29.2 |
| Other operating revenues | (5,160,282) | (4,325,281) | 19.3 | (13,647,472) | (13,299,650) | 2.6 |
| OPERATING COSTS AND EXPENSES | (1,995,559) | (2,166,216) | (7.9) | (5,694,126) | (6,024,123) | (5.5) |
| Electricity purchased for resale | (764,852) | (595,186) | 28.5 | (2,118,488) | (1,858,728) | 14.0 |
| Charge of the main distribution and transmission grid | (859,142) | (236,338) | 263.5 | (1,561,690) | (728,178) | 114.5 |
| Personnel and management | (64,280) | (64,137) | 0.2 | (194,209) | (195,712) | (0.8) |
| Pension and healthcare plans | (23,497) | (20,142) | 16.7 | (64,751) | (64,183) | 0.9 |
| Materials and supplies | (7,175) | - | - | (17,654) | - | - |
| Natural gas and supplies for the gas business | (265,685) | (196,110) | 35.5 | (728,352) | (544,926) | 33.7 |
| Third-party services | (347,778) | (305,986) | 13.7 | (1,027,232) | (914,882) | 12.3 |
| Depreciation and amortization | (141,171) | (55,588) | 154.0 | (204,772) | (226,564) | (9.6) |
| Provisions and reversals | (615,011) | (557,378) | 10.3 | (1,734,494) | (1,573,307) | 10.2 |
| Construction cost | 26,405 | - | - | 26,405 | - | - |
| Renegotiation of Hydrological Risk - GSF - HPP Mauá | (102,537) | (128,200) | (20.0) | (328,109) | (358,484) | (8.5) |
| Other cost and expenses | - | - | - | - | (810,563) | (100.0) |
| PROVISION FOR ALLOCATION OF PIS AND COFINS | 67,842 | 8,909 | 661.5 | 244,675 | 330,115 | (25.9) |
| EQUITY IN EARNINGS OF SUBSIDIARIES | 451,549 | 792,070 | (43.0) | 2,508,973 | 2,301,026 | 9.0 |
| PROFIT BEFORE FINANCIAL RESULTS AND TAXES | (322,810) | (216,485) | 49.1 | (899,289) | (1,726,138) | (47.9) |
| FINANCIAL RESULTS | 264,178 | 228,297 | 15.7 | 796,450 | 723,605 | 10.1 |
| Financial income | (586,988) | (444,782) | 32.0 | (1,695,739) | (1,438,373) | 17.9 |
| Financial expenses | - | - | - | - | (1,011,370) | - |
| Update of provision for allocation of Pis and Cofins credits | 128,739 | 575,585 | (77.6) | 1,609,684 | 574,888 | 180.0 |
| OPERATIONAL EXPENSES/ INCOME | 308,161 | (195,004) | - | (93,059) | (85,667) | 8.6 |
| INCOME TAX AND SOCIAL CONTRIBUTION ON PROFIT | 27,873 | (183,802) | - | (297,401) | (547,597) | (45.7) |
| Income tax and social contribution on profit | 280,289 | (11,202) | - | 204,343 | 461,930 | (55.8) |
| Deferred income tax and social contribution on profit | 436,900 | 380,581 | 14.8 | 1,516,625 | 489,221 | 210.0 |
| NET INCOME continued operations | 4,263 | (2,190) | - | (132,266) | 36,590 | - |
| NET INCOME discontinued operations | 441,163 | 378,391 | 16.6 | 1,384,359 | 525,811 | 163.3 |
| NET INCOME | 441,894 | 381,810 | 15.7 | 1,520,816 | 504,595 | 201.4 |
| Attributed to shareholders of the parent company - continuous operations | (6,489) | (18,898) | (65.7) | (141,029) | (13,865) | 917.2 |
| Attributed to the controlling company's shareholders - discontinued operations | (1,465) | 3,663 | - | 6,114 | (4,016) | - |
| Attributed to non-controlling shareholders | 7,223 | 11,816 | (38.9) | (1,542) | 39,097 | - |
| EBITDA continued operations | 799,327 | 1,098,056 | (27.2) | 3,536,205 | 3,215,908 | 10.0 |
| |
| Exhibit I -CONSOLIDATED RESULTS >BALANCE SHEET |
| R$'000 | R$'000 | |||||||
| Assets | sep-23 | Dec-22 | Δ% | Liabilities | sep-23 | Dec-22 | Δ% | |
| CURRENT | 13,313,738 | 9,327,249 | 42.7 | CURRENT | 8,995,410 | 7,156,597 | 25.7 | |
| Cash and cash equivalents | 5,557,791 | 2,678,457 | 107.5 | Payroll, social charges and accruals | 920,387 | 252,789 | 264.1 | |
| Bonds and securities | 96 | 93 | 3.2 | Suppliers | 2,177,287 | 2,090,022 | 4.2 | |
| Collaterals and escrow accounts | - | 157 | (100.0) | Income tax and social contribution payable | 114,337 | 156,191 | (26.8) | |
| Customers | 3,619,568 | 3,342,050 | 8.3 | Other taxes due | 276,365 | 303,606 | (9.0) | |
| Dividends receivable | 40,725 | 138,330 | (70.6) | Loans and financing | 271,780 | 278,838 | (2.5) | |
| Sectorial financial assets | 38,924 | 190,699 | - | Debentures | 1,390,058 | 1,346,347 | 3.2 | |
| Account receivable related to concession | 9,232 | 8,603 | 7.3 | Minimum compulsory dividend payable | 845,700 | 482,325 | 75.3 | |
| Contract Assets | 296,100 | 220,660 | 34.2 | Post employment benefits | 85,557 | 73,814 | 15.9 | |
| Other current receivables | 971,681 | 897,380 | 8.3 | Customer charges due | 63,359 | 46,488 | 36.3 | |
| Inventories | 185,897 | 194,850 | (4.6) | Research and development and energy efficiency | 348,765 | 370,244 | (5.8) | |
| Income tax and social contribution | 265,210 | 355,065 | (25.3) | Accounts Payable related to concession | 100,083 | 105,003 | (4.7) | |
| Other current recoverable taxes | 980,436 | 1,239,694 | (20.9) | Net sectorial financial liabilities | 723,786 | 433,914 | 66.8 | |
| Prepaid expenses | 64,809 | 60,076 | 7.9 | Lease liability | 52,757 | 64,870 | (18.7) | |
| Related parties | 15,344 | 1,135 | - | Other accounts payable | 739,440 | 601,619 | 22.9 | |
| Assets held for sale | 1,267,925 | - | - | PIS and COFINS to be refunded to costumers | 279,295 | 550,527 | - | |
| NON-CURRENT | 42,387,651 | 40,376,451 | 5.0 | Liabilities associated with assets held for sale | 606,454 | - | - | |
| Long Term Assets | 16,858,518 | 16,442,145 | 2.5 | NON-CURRENT | 23,197,845 | 21,415,878 | 8.3 | |
| Bonds and securities | 554,472 | 430,963 | 28.7 | Suppliers | 134,730 | 125,448 | 7.4 | |
| Other temporary investments | 31,462 | 25,619 | 22.8 | Deferred income tax and social contribution | 1,668,534 | 1,517,682 | 9.9 | |
| Customers | 114,748 | 109,819 | 4.5 | Other taxes due | 618,134 | 633,491 | (2.4) | |
| Judicial deposits | 635,578 | 632,458 | 0.5 | Loans and financing | 5,098,831 | 4,371,525 | 16.6 | |
| Sectoral financial assets | 116,773 | 190,699 | (38.8) | Debentures | 8,379,671 | 6,457,508 | 29.8 | |
| Account receivable related to concession | 2,637,401 | 2,269,690 | 16.2 | Post employment benefits | 1,006,066 | 996,223 | 1.0 | |
| Contract Assets | 7,423,024 | 7,452,019 | (0.4) | Research and development and energy efficiency | 208,279 | 244,514 | (14.8) | |
| Other non-current receivables | 1,083,115 | 931,452 | 16.3 | Accounts Payable related to concession | 783,318 | 832,539 | (5.9) | |
| Income tax and social contribution | 91,703 | 127,824 | (28.3) | Net sectorial financial liabilities | 27,119 | 49,341 | (45.0) | |
| Deferred income tax and social contribution | 1,797,026 | 1,644,299 | 9.3 | Lease liability | 202,767 | 208,886 | (2.9) | |
| Other non-current recoverable taxes | 2,373,216 | 2,627,293 | (9.7) | Other accounts payable | 802,087 | 645,234 | 24.3 | |
| Prepaid expenses | - | 10 | - | PIS and COFINS to be refunded to costumers | 404,329 | 1,444,631 | (72.0) | |
| Investments | 3,566,466 | 3,325,731 | 7.2 | Provision for allocation of Pis and Cofins credits | 1,910,295 | 1,851,257 | - | |
| Property, plant and equipment, net | 10,811,117 | 10,069,468 | 7.4 | Provisions for litigation | 1,953,685 | 2,037,599 | (4.1) | |
| Intangible assets | 10,910,839 | 10,277,727 | 6.2 | EQUITY | 23,508,134 | 21,131,225 | 11.2 | |
| Right to use an asset | 240,711 | 261,380 | (7.9) | Attributed to controlling shareholders | 23,253,055 | 20,817,364 | 11.7 | |
| TOTAL | 55,701,389 | 49,703,700 | 12.1 | Share capital | 12,816,678 | 10,800,000 | 18.7 | |
| Equity valuation adjustments | 565,957 | 593,382 | (4.6) | |||||
| Legal reserves | 1,512,687 | 1,512,687 | - | |||||
| Retained earnings | 7,867,135 | 7,911,295 | (0.6) | |||||
| Accrued earnings | 490,598 | - | - | |||||
| Attributable to non-controlling interest | 255,079 | 313,861 | (18.7) | |||||
| TOTAL | 55,701,389 | 49,703,700 | 12.1 | |||||
| |
| Exhibit I -CONSOLIDATED RESULTS > CASH FLOW |
| R$'000 | ||
| 09/30/23 | 09/30/22 | |
| CASH FLOWS FROM OPERATIONAL ACTIVITIES | ||
| Net income from continuing operations | 1,516,625 | 489,221 |
| Adjustments to reconcile net income for the period with cash generation from operating activities: | 3,344,571 | 2,508,566 |
| Unrealized monetary and exchange variation and debt charges - net | 1,433,850 | 963,354 |
| Interest - bonus from the grant of concession agreements under the quota system | (87,910) | (89,157) |
| Remuneration of transmission concession contracts | (561,622) | (582,687) |
| Provision for allocation of PIS and Cofins credits | - | 1,821,933 |
| Income tax and social contribution | 297,404 | 547,597 |
| Deferred income tax and social contribution | (204,345) | (461,930) |
| Equity in earnings of investees | (244,675) | (330,115) |
| Appropriation of post-employment benefits obligations | 192,058 | 193,860 |
| Creation for research and development and energy efficiency programs | 123,556 | 116,016 |
| Recognition of fair value of assets from the indemnity for the concession | (41,898) | (45,045) |
| Sectorial financial assets and liabilities result | (969,376) | (1,332,293) |
| Depreciation and amortization | 1,027,232 | 914,882 |
| Provision from the voluntary dismissal program | 610,057 | - |
| Net operating estimated losses, provisions and reversals | 204,772 | 226,564 |
| Resultado da repactuação do risco hidrológico - GSF | (26,405) | - |
| Realization of added value in business combinations | (542) | (541) |
| Fair value in energy purchase and sale operations | 6,347 | 4,139 |
| Derivatives fair value | - | 2,907 |
| Loss on disposal of accounts receivable related to concession | 186 | 26,529 |
| Loss on disposal of contract assets | 8,346 | 5,971 |
| Loss on disposal of property, plant and equipment | 3,079 | 978 |
| Loss on disposal of intangible assets | 58,582 | 36,485 |
| Result of write-offs of use rights of assets and liabilities of leases - net | (750) | (102) |
| Decrease (increase) in assets | 57,585 | 2,428,470 |
| Trade accounts receivable | 164,172 | 1,239,898 |
| Dividends and interest on own capital received | 111,960 | 59,336 |
| Judicial deposits | 22,198 | (15,116) |
| Sectorial financial assets | 52,035 | 953,947 |
| Other receivables | (61,482) | 47,834 |
| Inventories | 7,570 | (1,139) |
| Income tax and social contribution recoverable | (142,982) | (59,761) |
| Other taxes recoverable | (77,858) | 206,480 |
| Prepaid expenses | (3,819) | (2,076) |
| Related parties | (14,209) | (933) |
| Increase (decrease) in liabilities | 360,062 | (702,611) |
| Payroll, social charges and accruals | 158,508 | (205,145) |
| Suppliers | 53,968 | (319,036) |
| Other taxes | 728,036 | 450,852 |
| Post-employment benefits | (160,277) | (144,936) |
| Sectorial charges due | 16,871 | (155,669) |
| Research and development and energy efficiency | (193,727) | (141,839) |
| Payable related to the concession | (87,200) | (78,769) |
| Other accounts payable | - | - |
| Provisions for legal claims | 86,143 | 51,401 |
| CASH GENERATED BY OPERATING ACTIVITIES | 3,762,218 | 4,234,425 |
| Income tax and social contribution paid | (272,512) | (322,688) |
| Loans and financing - interest due and paid | (434,261) | (264,920) |
| Debentures - interest due and paid | (708,469) | (541,204) |
| Charges for lease liabilities paid | (17,257) | (14,228) |
| NET CASH GENERATED BY OPERATING ACTIVITIES FROM CONTINUING OPERATIONS | 2,329,719 | 3,091,385 |
| NET CASH GENERATED BY OPERATING ACTIVITIES FROM DISCONTINUED OPERATIONS | 118,351 | 128,041 |
| NET CASH GENERATED FROM OPERATING ACTIVITIES | 2,448,070 | 3,219,426 |
| CASH FLOWS FROM INVESTMENT ACTIVITIES | ||
| Financial investments | (102,812) | 53,375 |
| Additions to contract assets | (1,422,976) | (1,483,399) |
| Acquisitions of subsidiaries - effect on cash | (911,450) | (18,031) |
| Additions in investments | (10,780) | (4,829) |
| Capital reduction of investees | - | 61,537 |
| Additions to property, plant and equipment | (148,152) | (309,827) |
| Additions to intangible assets | (6,107) | (6,244) |
| - | - | |
| NET CASH USED BY INVESTMENT ACTIVITIES FROM CONTINUING OPERATIONS | (2,602,277) | (1,707,418) |
| NET CASH USED BY INVESTMENT ACTIVITIES FROM DISCONTINUED OPERATIONS | (24,156) | (133,706) |
| NET CASH USED FROM INVESTING ACTIVITIES | (2,626,433) | (1,841,124) |
| CASH FLOWS FROM FINANCING ACTIVITIES | ||
| Loans and financing obtained from third parties | 45,325 | 1,891,201 |
| Transaction costs in the issuing of loans and financing | (6,886) | (19,781) |
| Issue of debentures | 2,900,000 | 1,500,000 |
| Transaction costs in the issuing of debentures | (60,677) | (14,445) |
| Payments of principal - loans and financing | (194,678) | (940,584) |
| Payments of principal - debentures | (1,174,084) | (1,271,900) |
| Amortization of principal of lease liabilities | (51,896) | (40,747) |
| Capital increase | 2,031,619 | - |
| Transaction costs in the capital increase | (14,941) | - |
| Dividends and interest on own capital paid | (335,026) | (1,623,381) |
| NET CASH GENERATED (USED) BY FINANCING ACTIVITIES FROM CONTINUING OPERATIONS | 3,138,756 | (519,637) |
| NET CASH GENERATED (USED) BY FINANCING ACTIVITIES FROM DISCONTINUED OPERATIONS | 158,062 | (2,180) |
| NET CASH GENERATED (USED) FROM FINANCING ACTIVITIES | 3,296,818 | (521,817) |
| TOTAL EFFECTS ON CASH AND CASH EQUIVALENTS | 3,118,455 | 856,485 |
| Cash and cash equivalents at the beginning of the period | 2,678,457 | 3,472,845 |
| Cash and cash equivalents at the end of the period | 5,557,791 | 3,827,962 |
| Change in cash and cash equivalents from discontinued operations | 239,121 | 501,368 |
| CHANGE IN CASH AND CASH EQUIVALENTS | 3,118,455 | 856,485 |
| |
| Exhibit I -CONSOLIDATED RESULTS > ADJUSTED EBITDA AND FINANCIAL RESULT |
| R$'000 | ||||||
| 3Q23 | 3Q22 | Δ% | 9M23 | 9M22 | Δ% | |
| EBITDA FROM CONTINUING OPERATIONS | 799,327 | 1,098,056 | (27.2) | 3,536,205 | 3,215,908 | 10.0 |
| (-/+) Fair value in the purchase and sale of energy | 34,524 | (13,254) | 6,347 | 4,139 | ||
| (-/+) Impairment | (16,078) | - | (53,999) | 42,129 | ||
| (-/+) Tariff flag account on MMGD and Adherence to REFIS/PR | - | 33,332 | - | (10,115) | ||
| (-/+) Reflection of the PIS/Cofins forecast | - | - | - | (58,119) | ||
| (-/+) Indemnity of adittional third of vacation bonus | - | - | 138,173 | - | ||
| (-/+) Provision for allocation of PIS/Cofins credits | - | - | - | 810,563 | ||
| (-/+) Provision/Reversal for indemnification for PDV | 610,057 | - | 610,057 | (7,880) | ||
| (-/+) Hydrological Risk Renegotiation (GSF) - HPP Mauá | (26,405) | - | (26,405) | - | ||
| Adjusted EBITDA FROM CONTINUING OPERATIONS | 1,401,425 | 1,118,138 | 25.3 | 4,210,378 | 3,996,625 | 5.3 |
| (-) Ebitda from discontinued Op. Compagas and UEGA | 37,649 | 16,800 | (23,740) | 99,210 | ||
| Adjusted EBITDA INCLUDED DISCONTINUED OPERATIONS | 1,439,074 | 1,134,938 | 26.8 | 4,186,638 | 4,095,835 | 2.2 |
| (-/+) Equity in earnings of subsidiaries | (67,841) | (8,909) | (244,673) | (330,115) | ||
| Adjusted EBITDA INCLUDED DISCONTINUED OP without earnings of subsidiaries | 1,371,233 | 1,126,029 | 21.8 | 3,941,965 | 3,765,720 | 4.7 |
| R$'000 | ||||||
| 3Q23 | 3Q22 | Δ% | 9M23 | 9M22 | Δ% | |
| Financial Revenues | 264,177 | 228,297 | 15.7 | 796,450 | 723,605 | 10.1 |
| Income from investments held for trading | 168,252 | 108,936 | 54.5 | 367,440 | 297,398 | 23.6 |
| Late fees on electricity bills | 43,664 | 59,677 | (26.8) | 156,334 | 218,517 | (28.5) |
| Monetary restatement and adjustment to present value of accounts payable related to concession | 12,883 | (318) | - | 69,059 | 2,877 | - |
| Income from sectorial assets and liabilities | 9,850 | 22,224 | (55.7) | 55,755 | 97,984 | (43.1) |
| Exchange variation About Purchase Itaipu Electric Power | 912 | 2,041 | (55.3) | 14,026 | 41,374 | (66.1) |
| Interest on taxes to be compensated | 17,421 | 18,121 | (3.9) | 50,974 | 49,784 | 2.4 |
| Income and monetary restatement of judicial deposits | 13,115 | 12,364 | 6.1 | 41,392 | 31,628 | 30.9 |
| Other financial revenues | 8,455 | 15,880 | (46.8) | 71,335 | 15,626 | - |
| (-) Pis/Pasep and Cofins on revenues | (10,375) | (10,628) | (2.4) | (29,865) | (31,583) | (5.4) |
| Financial Expenses | (586,987) | (444,782) | 32.0 | (1,695,739) | (1,438,373) | 17.9 |
| Monetary variation, foreign exchange and debt service charges | (442,960) | (341,402) | 29.7 | (1,355,043) | (1,106,596) | 22.5 |
| Monetary variation and adjustment to present value of accounts payable related to concession | (33,441) | (8,667) | 285.8 | (101,224) | (128,737) | (21.4) |
| Exchange variation About Purchase Itaipu Electric Power | (6,073) | (11,890) | (48.9) | (7,785) | (26,424) | (70.5) |
| Pis/ Pasep and Cofins taxes over interest on equity | (69,496) | (11,810) | - | (70,754) | (24,188) | 192.5 |
| Income from sectorial assets and liabilities | (845) | (2,383) | (64.5) | (3,774) | (9,679) | (61.0) |
| Derivatives fair value - forward contract | - | - | - | - | (2,907) | - |
| Interest on R&D and PEE | (6,604) | (7,740) | (14.7) | (20,155) | (23,579) | (14.5) |
| Interest on tax installments | (10,127) | (10,345) | (2.1) | (31,006) | (27,358) | 13.3 |
| Interest on lease liabilities | (5,617) | (5,277) | 6.4 | (17,259) | (14,158) | 21.9 |
| Monetary variation of litigation | (4,746) | (20,024) | (76.3) | (75,993) | (30,641) | 148.0 |
| Other financial expenses | (7,078) | (25,244) | (72.0) | (12,746) | (44,106) | (71.1) |
| (-) Update of provision for allocation of PIS and Cofins credits | - | - | - | - | (1,011,370) | - |
| Financial income (expenses) | (322,810) | (216,485) | 49.1 | (899,289) | (1,726,138) | (47.9) |
| |
| Exhibit I -CONSOLIDATED RESULTS > EQUITY IN EARNINGS OF SUBSIDIARIES AND INDICATORS |
| R$'000 | ||||||||
| Variation in Equity in earnings of subsidiaries | 3Q23 | 3Q22 | Δ% | 9M23 | 9M22 | Δ% | ||
| Joint Ventures | 61,965 | 2,289 | - | 227,989 | 310,343 | (26.5) | ||
| Voltalia São Miguel do Gostoso I Participações S.A. | 1,921 | 3,890 | (50.6) | (604) | 217 | - | ||
| Caiuá Transmissora de Energia S.A. | 2,678 | 601 | 345.6 | 9,409 | 17,238 | (45.4) | ||
| Integração Maranhense Transmissora de Energia S.A. | 4,514 | 697 | 547.6 | 19,345 | 27,882 | (30.6) | ||
| Matrinchã Transmissora de Energia (TP NORTE) S.A. | 18,993 | (4,433) | - | 64,765 | 119,542 | (45.8) | ||
| Guaraciaba Transmissora de Energia (TP SUL) S.A. | 6,547 | (2,410) | - | 25,938 | 51,700 | (49.8) | ||
| Paranaíba Transmissora de Energia S.A. | 6,029 | (103) | - | 29,652 | 21,058 | 40.8 | ||
| Mata de Santa Genebra Transmissão S.A. | 12,356 | 7,214 | 71.3 | 45,401 | 40,645 | 11.7 | ||
| Cantareira Transmissora de Energia S.A. | 8,836 | (3,267) | - | 33,764 | 31,799 | 6.2 | ||
| Solar Paraná | 91 | 100 | (9.0) | 319 | 262 | 21.8 | ||
| Associates | 5,877 | 6,618 | (11.2) | 16,686 | 19,772 | (15.6) | ||
| Dona Francisca Energética S.A. | 1,673 | 1,555 | 7.6 | 4,191 | 4,914 | (14.7) | ||
| Foz do Chopim Energética Ltda. | 4,203 | 5,065 | (17.0) | 12,496 | 14,860 | (15.9) | ||
| Others ¹ | 1 | (2) | - | (1) | (2) | (50.0) | ||
| TOTAL | 67,842 | 8,907 | 661.7 | 244,675 | 330,115 | (25.9) | ||
| 1 Includes Carbocampel S.A. | ||||||||
| R$'000 | ||||||||
| Main Indicators -Associates sep-23 | Dona Francisca | Foz do Chopim | ||||||
| Total assets | 178,555 | 46,502 | ||||||
| Shareholder’s equity¹ | 137,973 | 44,435 | ||||||
| Net operating revenue | 50,044 | 45,199 | ||||||
| Net Income | 18,198 | 34,935 | ||||||
| Participation in the enterprise - % | 23.0 | 35.8 | ||||||
| Investment book value | 31,773 | 15,892 | ||||||
| R$'000 | ||||||||
| Main Indicators -Joint ventures sep-23 | Voltalia | Caiuá | Integração Maranhense | Matrinchã | Guaraciaba | Paranaíba | Mata de Santa Genebra | Cantareira |
| Total assets | 237,862 | 336,778 | 622,577 | 2,991,752 | 1,614,703 | 2,020,602 | 3,762,233 | 1,882,650 |
| Shareholder’s equity¹ | 235,453 | 274,910 | 454,340 | 2,033,251 | 1,006,197 | 1,199,041 | 1,472,379 | 1,034,966 |
| Net operating revenue | - | 27,593 | 48,814 | 240,391 | 126,167 | 226,433 | 303,610 | 134,335 |
| Net Income | (1,233) | 19,203 | 39,480 | 132,171 | 52,935 | 121,028 | 90,621 | 68,908 |
| Participation in the enterprise - % | 49.0 | 49.0 | 49.0 | 49.0 | 49.0 | 24.5 | 50.1 | 49.0 |
| Investment book value | 115,372 | 134,706 | 222,627 | 996,293 | 493,037 | 293,765 | 737,662 | 507,133 |
| Note: Income from Transmitters according to adjustments for the application of CPC 47 / IFRS 15 in the Corporate Statements. | ||||||||
| |
| Exhibit I -CONSOLIDATED RESULTS > SHARE CAPITAL |
| Share Capital - As of September, 30,2023 | ||||||||
| Thousand shares | ||||||||
| Shareholders | Common | % | Preferred "A" | % | Preferred "B" | % | TOTAL | % |
| State of Paraná | 358,563 | 27.6% | - | - | 116,081 | 6.9% | 474,644 | 15.9% |
| BNDESPAR | 131,162 | 10.1% | - | - | 524,646 | 31.2% | 655,808 | 22.0% |
| Free Floating | 803,601 | 61.8% | 682 | 21.8% | 1,037,617 | 61.8% | 1,841,900 | 61.8% |
| B3 | 776,595 | 59.7% | 682 | 21.8% | 928,623 | 55.3% | 1,705,901 | 57.2% |
| NYSE | 26,793 | 2.1% | - | - | 107,172 | 6.4% | 133,964 | 4.5% |
| LATIBEX | 213 | 0.0% | - | - | 1,822 | 0.1% | 2,035 | 0.1% |
| Other | 7,022 | 0.5% | 2,446 | 78.2% | 991 | 0.1% | 10,459 | 0.4% |
| TOTAL | 1,300,347 | 100% | 3,128 | 100% | 1,679,335 | 100% | 2,982,811 | 100% |
| Thousand shares | ||||||||
| Shareholders | UNIT | % | ||||||
| State of Paraná | 28,986 | 13.7% | ||||||
| BNDESPAR | 131,162 | 61.9% | ||||||
| Free Floating | 51,608 | 24.4% | ||||||
| B3 | 24,602 | 11.6% | ||||||
| NYSE | 26,793 | 12.6% | ||||||
| LATIBEX | 213 | 0.1% | ||||||
| Other | 70 | 0.0% | ||||||
| TOTAL | 211,826 | 100% | ||||||
| |
| Exhibit II-RESULT BY SUBSIDIARY > COPEL GET (CONSOLIDATED) |
| R$'000 | ||||||
| Income Statement | 3Q23 | 3Q22 | Δ% | 9M23 | 9M22 | Δ% |
| OPERATING REVENUES | 1,364,139 | 1,129,706 | 20.8 | 3,902,035 | 3,707,521 | 5.2 |
| Electricity sales to final customers | - | 3 | (97.7) | - | 103 | - |
| Electricity sales to distributors | 1,108,787 | 978,483 | 13.3 | 3,054,871 | 2,819,686 | 8.3 |
| Use of the main transmission grid | 238,372 | 105,436 | - | 744,147 | 752,594 | (1.1) |
| Construction revenue | 8,574 | 33,573 | (74.5) | 80,168 | 98,339 | (18.5) |
| Other operating revenues | 8,406 | 12,211 | (31.2) | 22,849 | 36,799 | (37.9) |
| OPERATING COSTS AND EXPENSES | (938,675) | (749,054) | 25.3 | (2,278,856) | (1,967,562) | 15.8 |
| Electricity purchased for resale | (99,266) | (170,360) | (41.7) | (171,239) | (284,134) | (39.7) |
| Charges of main distribution and transmission grid | (146,550) | (141,381) | 3.7 | (442,346) | (392,132) | 12.8 |
| Personnel and management | (276,159) | (78,058) | - | (501,998) | (238,686) | - |
| Pension and healthcare plans | (20,232) | (19,452) | 4.0 | (61,099) | (59,324) | 3.0 |
| Materials and supplies | (5,868) | (4,585) | 28.0 | (14,792) | (12,921) | 14.5 |
| Materials and supplies for power eletricity | (6,657) | (121) | - | (17,654) | (2,951) | - |
| Third-party services | (66,872) | (59,275) | 12.8 | (201,050) | (151,360) | 32.8 |
| Depreciation and amortization | (205,446) | (183,026) | 12.2 | (611,009) | (553,815) | 10.3 |
| Provisions and reversals | (75,925) | (7,948) | - | (55,240) | (17,874) | - |
| Renegotiation of Hydrological Risk - GSF - HPP Mauá | (6,932) | (27,211) | (74.5) | (68,535) | (79,852) | (14.2) |
| Construction cost | 26,405 | - | - | 26,405 | - | - |
| Other cost and expenses | (55,173) | (57,637) | (50.1) | (160,299) | (174,513) | (23.3) |
| EQUITY IN EARNINGS OF SUBSIDIARIES | 64,156 | 3,365 | - | 240,769 | 324,724 | (25.9) |
| PROFIT BEFORE FINANCIAL RESULTS AND TAXES | 489,620 | 384,017 | 27.5 | 1,863,948 | 2,064,683 | (9.7) |
| FINANCIAL RESULTS | (163,145) | (128,049) | 27.4 | (583,729) | (475,583) | 22.7 |
| Financial income | 83,126 | 56,569 | 46.9 | 255,509 | 186,416 | 37.1 |
| Financial expenses | (246,271) | (184,618) | 33.4 | (839,238) | (661,999) | 26.8 |
| OPERATIONAL EXPENSES/ INCOME | 326,475 | 255,968 | 27.5 | 1,280,219 | 1,589,100 | (19.4) |
| INCOME TAX AND SOCIAL CONTRIBUTION ON PROFIT | 102,134 | (79,073) | - | (162,636) | (416,423) | (60.9) |
| Income tax and social contribution on profit | 32,034 | (109,741) | - | (188,544) | (322,355) | (41.5) |
| Deferred income tax and social contribution on profit | 70,100 | 30,668 | - | 25,908 | (94,068) | - |
| NET INCOME continued operations | 428,609 | 176,895 | - | 1,117,583 | 1,172,677 | (4.7) |
| NET INCOME discontinued operations | (19,800) | (45,663) | (56.6) | (216,105) | (74,428) | - |
| NET INCOME | 408,809 | 131,232 | - | 901,478 | 1,098,249 | (17.9) |
| Attributed to shareholders of the parent company - continuous operations | 431,535 | 181,846 | - | 1,127,695 | 1,186,769 | (5.0) |
| Attributed to the controlling company's shareholders - discontinued operations | (13,839) | (30,827) | (55.1) | (137,766) | (53,911) | - |
| Attributed to non-controlling shareholders | (8,887) | (19,787) | (55.1) | (88,451) | (34,609) | - |
| EBITDA continued operations | 695,066 | 567,043 | 22.6 | 2,474,957 | 2,618,498 | (5.5) |
| |
| Exhibit II-RESULT BY SUBSIDIARY > COPEL DIS |
| R$'000 | ||||||
| Income Statement | 3Q23 | 3Q22 | Δ% | 9M23 | 9M22 | Δ% |
| OPERATING REVENUES | 3,907,992 | 3,567,903 | 9.5 | 11,069,533 | 10,315,857 | 7.3 |
| Electricity sales to final customers | 1,446,878 | 1,171,736 | 23.5 | 4,049,555 | 4,027,924 | 0.5 |
| Electricity sales to distributors | 48,015 | 86,385 | (44.4) | 140,456 | 203,456 | (31.0) |
| Use of the main distribution grid | 1,383,343 | 1,164,444 | 18.8 | 3,918,209 | 3,065,949 | 27.8 |
| Construction revenue | 608,079 | 530,166 | 14.7 | 1,665,959 | 1,493,455 | 11.6 |
| Fair value of assets from the indemnity for the concession | 8,283 | (13,918) | - | 41,898 | 45,045 | (7.0) |
| Sectorial assets and liabilities result | 273,256 | 530,548 | (48.5) | 879,709 | 1,209,056 | (27.2) |
| Other operating revenues | 140,138 | 98,542 | 42.2 | 373,747 | 270,972 | 37.9 |
| OPERATING COSTS AND EXPENSES | (3,870,778) | (3,186,498) | 21.5 | (10,430,291) | (10,153,660) | 2.7 |
| Electricity purchased for resale | (1,528,666) | (1,566,281) | (2.4) | (4,489,552) | (4,433,361) | 1.3 |
| Charges of main transmission grid | (731,154) | (546,033) | 33.9 | (1,971,815) | (1,734,129) | 13.7 |
| Personnel and management | (545,301) | (144,742) | 276.7 | (983,750) | (445,379) | 120.9 |
| Pension and healthcare plans | (41,429) | (41,920) | (1.2) | (125,133) | (127,278) | (1.7) |
| Materials and supplies | (17,244) | (15,472) | 11.5 | (48,957) | (50,059) | (2.2) |
| Third-party services | (163,375) | (123,901) | ��31.9 | (467,631) | (362,280) | 29.1 |
| Depreciation and amortization | (132,378) | (115,108) | 15.0 | (385,557) | (334,669) | 15.2 |
| Provisions and reversals | (69,140) | (46,559) | 48.5 | (146,437) | (211,707) | (30.8) |
| Construction cost | (608,079) | (530,166) | 14.7 | (1,665,959) | (1,493,455) | 11.6 |
| Other cost and expenses | (34,012) | (56,316) | (39.6) | (145,500) | (150,780) | (3.5) |
| Provision for allocation of PIS and Cofins | - | - | - | - | (810,563) | - |
| PROFIT BEFORE FINANCIAL RESULTS AND TAXES | 37,214 | 381,405 | (90.2) | 639,242 | 162,197 | 294.1 |
| FINANCIAL RESULTS | (125,173) | (88,344) | 41.7 | (330,968) | (1,107,205) | (70.1) |
| Financial income | 110,327 | 145,337 | (24.1) | 364,640 | 455,471 | (19.9) |
| Financial expenses | (235,500) | (233,681) | 0.8 | (695,608) | (551,306) | 26.2 |
| Update of provision for allocation of PIS and Cofins credits | - | - | - | - | (1,011,370) | - |
| OPERATIONAL EXPENSES/ INCOME | (87,959) | 293,061 | - | 308,274 | (945,008) | - |
| INCOME TAX AND SOCIAL CONTRIBUTION ON PROFIT | 92,569 | (67,367) | - | (2,444) | 390,967 | - |
| Income tax and social contribution on profit | 1,474 | (38,356) | - | (75,140) | (172,385) | (56.4) |
| Deferred income tax and social contribution on profit | 91,095 | (29,011) | - | 72,696 | 563,352 | (87.1) |
| NET INCOME (LOSS) | 4,610 | 225,694 | (98.0) | 305,830 | (554,041) | - |
| EBITDA | 169,592 | 496,513 | (65.8) | 1,024,799 | 496,866 | 106.3 |
| |
| Exhibit II-RESULT BY SUBSIDIARY > COPEL COM (MERCADO LIVRE) |
| R$'000 | ||||||
| Income Statement | 3Q23 | 3Q22 | Δ% | 9M23 | 9M22 | Δ% |
| OPERATING REVENUES | 987,856 | 1,310,911 | (24.6) | 3,019,731 | 3,659,025 | (17.5) |
| Electricity sales to final customers | 577,462 | 578,946 | (0.3) | 1,705,263 | 1,720,801 | (0.9) |
| Electricity sales to distributors | 438,200 | 730,155 | (40.0) | 1,306,933 | 1,932,347 | (32.4) |
| Other operating revenues | (27,806) | 1,810 | - | 7,535 | 5,877 | 28.2 |
| OPERATING COSTS AND EXPENSES | (1,008,263) | (1,276,146) | (21.0) | (2,931,809) | (3,597,348) | (18.5) |
| Electricity purchased for resale | (994,997) | (1,270,610) | (21.7) | (2,901,011) | (3,579,136) | (18.9) |
| Personnel and management | (8,351) | (3,012) | 177.3 | (17,463) | (9,240) | 89.0 |
| Pension and healthcare plans | (443) | (430) | 3.0 | (1,424) | (1,329) | 7.1 |
| Materials and supplies | (27) | (13) | 107.7 | (60) | (37) | 62.2 |
| Third-party services | (747) | (501) | 49.1 | (2,887) | (2,186) | 32.1 |
| Depreciation and amortization | (433) | (91) | 375.8 | (1,563) | (255) | 512.9 |
| Provisions and reversals | (2,006) | (178) | - | (3,255) | (1,504) | 116.4 |
| Other cost and expenses | (1,259) | (1,311) | (4.0) | (4,146) | (3,661) | 13.2 |
| PROFIT BEFORE FINANCIAL RESULTS AND TAXES | (20,407) | 34,765 | (158.7) | 87,922 | 61,677 | 42.6 |
| FINANCIAL RESULTS | 9,849 | 9,253 | 6.4 | 27,734 | 23,256 | 19.3 |
| Financial income | 9,961 | 9,206 | 8.2 | 27,998 | 23,492 | 19.2 |
| Financial expenses | (112) | 47 | - | (264) | (236) | 11.9 |
| OPERATIONAL EXPENSES/ INCOME | (10,558) | 44,018 | - | 115,656 | 84,933 | 36.2 |
| INCOME TAX AND SOCIAL CONTRIBUTION ON PROFIT | 3,596 | (12,595) | - | (34,780) | (26,430) | 31.6 |
| Income tax and social contribution on profit | �� (7,433) | (5,693) | - | (27,849) | (18,867) | 47.6 |
| Deferred income tax and social contribution on profit | 11,029 | (6,902) | - | (6,931) | (7,563) | (8.4) |
| NET INCOME (LOSS) | (6,962) | 31,423 | - | 80,876 | 58,503 | 38.2 |
| EBITDA | (19,974) | 34,856 | - | 89,485 | 61,932 | 44.5 |
| |
| Exhibit II-RESULT BY SUBSIDIARY > INCOME STATEMENT FOR THE QUARTER BY COMPANY |
| R$'000 | |||||||||||||||
| Income Statement 3Q23 | GET | Distribuição | Compagas | Elejor | UEG Araucária | Serviços | Wind Farms | FDA | Bela Vista | C. Oeste, Marumbi, Uirapuru | Mercado Livre | Holding | Elimination | Consolidated | |
| Geração | Transmissão | ||||||||||||||
| NET OPERATING INCOME | 704,719 | 240,649 | 3,907,992 | 242,573 | 31,036 | - | - | 199,932 | 213,301 | 7,129 | 15,481 | 987,856 | - | (1,006,679) | 5,543,989 |
| Electricity sales to final customers | - | - | 1,446,878 | - | - | - | - | - | - | - | - | 577,462 | - | (403) | 2,023,937 |
| Electricity sales to distributors | 688,765 | - | 48,015 | - | 30,789 | - | - | 199,931 | 213,298 | 7,129 | - | 438,200 | - | (627,527) | 998,600 |
| Use of the main distribution and transmission grid (TUSD/ TUST) | - | 224,613 | 1,383,343 | - | - | - | - | - | - | - | 16,342 | - | - | (121,770) | 1,502,528 |
| Construction revenue | - | 9,442 | 608,079 | 4,265 | - | - | - | - | - | - | (868) | - | - | (4,265) | 616,653 |
| Fair value of assets from the indemnity for the concession | - | - | 8,283 | - | - | - | - | - | - | - | - | - | - | - | 8,283 |
| Distribution of piped gas | - | - | - | 238,304 | - | - | - | - | - | - | - | - | - | (238,304) | - |
| Sectoral assets and liabilities result | - | - | 273,256 | - | - | - | - | - | - | - | - | - | - | - | 273,256 |
| Other operating revenues | 15,954 | 6,594 | 140,138 | 4 | 247 | - | - | 1 | 3 | - | 7 | (27,806) | - | (14,410) | 120,732 |
| OPERATING COSTS AND EXPENSES | (496,114) | (187,398) | (3,870,778) | (202,225) | (23,651) | (22,213) | 357 | (129,313) | (126,847) | (4,499) | (1,590) | (1,008,263) | (70,976) | 983,228 | (5,160,282) |
| Energy purchased for resale | (58,963) | - | (1,528,666) | - | (26) | - | - | (6,421) | (34,156) | (61) | - | (994,997) | - | 627,731 | (1,995,559) |
| Charges of the main distribution and transmission grid | (91,681) | - | (731,154) | - | (6,225) | (9,051) | - | (16,270) | (40,620) | (337) | - | - | - | 130,486 | (764,852) |
| Personnel and management | (156,490) | (114,062) | (545,301) | (12,617) | (1,278) | (1,439) | (15) | (4,479) | (629) | (297) | (206) | (8,351) | (28,037) | 14,059 | (859,142) |
| Private pension and health plans | (11,318) | (8,154) | (41,429) | (1,555) | (44) | (166) | (2) | (620) | (87) | (24) | (29) | (443) | (2,130) | 1,721 | (64,280) |
| Materials and supplies | (3,755) | (1,289) | (17,244) | (609) | (31) | (10) | - | (570) | (242) | (4) | (12) | (27) | (324) | 620 | (23,497) |
| Materials and supplies for power eletricity | (7,175) | - | - | - | - | (432) | - | - | - | - | - | - | - | 432 | (7,175) |
| Natural gas and supplies for gas business | - | - | - | (165,473) | - | - | - | - | - | - | - | - | - | 165,473 | - |
| Third-party services | (28,990) | (13,071) | (163,375) | (3,942) | (3,912) | (5,737) | (132) | (24,602) | (8,946) | (688) | (1,628) | (747) | (31,678) | 21,763 | (265,685) |
| Depreciation and amortization | (94,804) | (4,246) | (132,378) | (10,732) | (8,379) | (5,250) | (373) | (64,275) | (31,897) | (2,860) | (12) | (433) | (768) | 8,629 | (347,778) |
| Provisions and reversals | (39,468) | (36,124) | (69,140) | 734 | - | (3) | - | (161) | - | - | (283) | (2,006) | 633 | 4,647 | (141,171) |
| Construction cost | - | (7,800) | (608,079) | (4,265) | - | - | - | - | - | - | 868 | - | - | 4,265 | (615,011) |
| Renegotiation of Hydrological Risk - GSF - HPP Mauá | 26,405 | - | - | - | - | - | - | - | - | - | - | - | - | - | 26,405 |
| Other operating costs and expenses | (29,875) | (2,652) | (34,012) | (3,766) | (3,756) | (125) | 879 | (11,915) | (10,270) | (228) | (288) | (1,259) | (8,672) | 3,402 | (102,537) |
| EQUITY IN EARNINGS OF SUBSIDIARIES | 217,166 | 79,666 | - | - | - | - | - | 42,565 | - | - | - | - | 569,474 | (841,029) | 67,842 |
| EARNINGS BEFORE INCOME TAXES | 425,771 | 132,917 | 37,214 | 40,348 | 7,385 | (22,213) | 357 | 113,184 | 86,454 | 2,630 | 13,891 | (20,407) | 498,498 | (864,480) | 451,549 |
| FINANCIAL RESULTS | (94,132) | (58,596) | (125,173) | (4,244) | (13,798) | (510) | (140) | (19,280) | 6,546 | 841 | 1,475 | 9,849 | (30,399) | 4,751 | (322,810) |
| Financial income | 26,303 | 14,934 | 110,327 | 11,267 | 18,396 | 1,125 | 86 | 32,205 | 6,726 | 842 | 2,115 | 9,961 | 42,933 | (13,042) | 264,178 |
| Financial expenses | (120,435) | (73,530) | (235,500) | (15,511) | (32,194) | (1,635) | (226) | (51,485) | (180) | (1) | (640) | (112) | (73,332) | 17,793 | (586,988) |
| OPERATIONAL EXPENSES / INCOME | 331,639 | 74,321 | (87,959) | 36,104 | (6,413) | (22,723) | 217 | 93,904 | 93,000 | 3,471 | 15,366 | (10,558) | 468,099 | (859,729) | 128,739 |
| INCOME TAX AND SOCIAL CONTRIBUTION ON PROFIT | 97,453 | 52,049 | 92,569 | (12,649) | 1,528 | - | - | (16,541) | (31,495) | (508) | (1,223) | 3,596 | 108,335 | 15,047 | 308,161 |
| NET INCOME continued operations | 97,453 | 126,370 | 4,610 | - | (4,885) | - | 217 | 77,363 | 61,505 | 2,963 | 14,143 | (6,962) | 576,434 | (512,311) | 436,900 |
| NET INCOME discontinued operations | - | - | - | 23,455 | - | (22,723) | - | - | - | - | - | - | - | 3,531 | 4,263 |
| NET INCOME | 97,453 | 126,370 | 4,610 | 23,455 | (4,885) | (22,723) | 217 | 77,363 | 61,505 | 2,963 | 14,143 | (6,962) | 576,434 | (508,780) | 441,163 |
| Attributed to shareholders of the parent company - continuous operations | 97,453 | 126,370 | 4,610 | - | (3,423) | - | 217 | 77,363 | 61,505 | 2,963 | 14,143 | (6,962) | 576,434 | (508,780) | 441,894 |
| Attributed to the controlling company's shareholders - discontinued operations | - | - | - | 11,963 | - | (18,452) | - | - | - | - | - | - | - | - | (6,489) |
| Attributed to non-controlling shareholders - continuous operations | - | - | - | - | (1,465) | - | - | - | - | - | - | - | - | - | (1,465) |
| Attributed to non-controlling shareholders - discontinued operations | - | - | - | 11,494 | - | (4,271) | - | - | - | - | - | - | - | - | 7,223 |
| EBITDA continued operations | 520,575 | 137,163 | 169,592 | 51,080 | 15,764 | (16,963) | 730 | 177,459 | 118,351 | 5,490 | 13,903 | (19,974) | 499,266 | (873,109) | 799,327 |
| |
| R$'000 | |||||||||||||||
| Income Statement 3Q22 | GET | Distribuição | Compagas | Elejor | UEG Araucária | Serviços | Wind Farms | FDA | Bela Vista | C. Oeste, Marumbi, Uirapuru | Mercado Livre | Holding | Elimination | Consolidated | |
| Geração | Transmissão | ||||||||||||||
| NET OPERATING INCOME | 639,868 | 146,049 | 3,567,903 | 345,970 | 42,635 | 443 | - | 158,275 | 192,910 | 8,244 | 5,420 | 1,310,911 | - | (1,310,186) | 5,108,442 |
| Electricity sales to final customers | 3 | - | 1,171,736 | - | - | - | - | - | - | - | - | 578,946 | - | (610) | 1,750,075 |
| Electricity sales to distributors | 622,731 | - | 86,385 | - | 42,635 | 443 | - | 156,718 | 192,905 | 8,244 | - | 730,155 | - | (843,650) | 996,566 |
| Use of the main distribution and transmission grid (TUSD/ TUST) | - | 103,344 | 1,164,444 | - | - | - | - | - | - | - | 4,608 | - | - | (100,430) | 1,171,966 |
| Construction revenue | - | 32,769 | 530,166 | 2,723 | - | - | - | - | - | - | 806 | - | - | (2,724) | 563,740 |
| Fair value of assets from the indemnity for the concession | - | - | (13,918) | (5,512) | - | - | - | - | - | - | - | - | - | 5,512 | (13,918) |
| Distribution of piped gas | - | - | - | 348,721 | - | - | - | - | - | - | - | - | - | (348,721) | - |
| Sectoral assets and liabilities result | - | - | 530,548 | - | - | - | - | - | - | - | - | - | - | - | 530,548 |
| Other operating revenues | 17,134 | 9,936 | 98,542 | 38 | - | - | - | 1,557 | 5 | - | 6 | 1,810 | - | (19,563) | 109,465 |
| OPERATING COSTS AND EXPENSES | (461,284) | (83,851) | (3,186,499) | (296,964) | (21,271) | (54,061) | (1,477) | (97,728) | (111,808) | (5,034) | (2,933) | (1,276,146) | (25,065) | 1,298,840 | (4,325,281) |
| Energy purchased for resale | (152,691) | - | (1,566,281) | - | (21) | - | - | (3,216) | (15,856) | (701) | - | (1,270,610) | - | 843,160 | (2,166,216) |
| Charges of the main distribution and transmission grid | (90,953) | - | (546,033) | - | (4,526) | (8,709) | - | (13,190) | (39,220) | (322) | - | - | - | 107,767 | (595,186) |
| Personnel and management | (43,185) | (30,316) | (144,742) | (12,517) | (1,196) | (1,437) | 294 | (3,384) | (656) | (307) | (215) | (3,012) | (9,624) | 13,959 | (236,338) |
| Private pension and health plans | (11,164) | (7,751) | (41,920) | (1,466) | (58) | (152) | (821) | (406) | (81) | (22) | (26) | (430) | (1,456) | 1,616 | (64,137) |
| Materials | (2,639) | (1,542) | (15,472) | (33) | 32 | (164) | (2) | (156) | (216) | - | (28) | (13) | (102) | 193 | (20,142) |
| Raw material and supplies - energy production | - | - | - | - | - | (22,959) | - | - | - | - | - | - | - | 22,959 | - |
| Natural gas and supplies for gas business | - | - | - | (263,510) | - | - | - | - | - | - | - | - | - | 263,510 | - |
| Third-party services | (25,293) | (11,018) | (123,901) | (3,718) | (6,171) | (11,060) | (553) | (21,264) | (11,437) | (640) | (1,567) | (501) | (10,540) | 31,553 | (196,110) |
| Depreciation and amortization | (93,416) | (3,964) | (115,108) | (10,591) | (6,571) | (5,930) | (549) | (48,238) | (31,901) | (2,799) | (8) | (91) | (642) | 13,822 | (305,986) |
| Provisions and reversals | (8,949) | 1,034 | (46,559) | 81 | - | - | 186 | (44) | (1) | - | 12 | (178) | 7,460 | (8,630) | (55,588) |
| Construction cost | - | (26,407) | (530,166) | (2,723) | - | - | - | - | - | - | (806) | - | - | 2,724 | (557,378) |
| Other operating costs and expenses | (32,994) | (3,887) | (56,317) | (2,487) | (2,760) | (3,650) | (32) | (7,830) | (12,440) | (243) | (295) | (1,311) | (10,161) | 6,207 | (128,200) |
| EQUITY IN EARNINGS OF SUBSIDIARIES | 70,286 | 1,058 | - | - | - | - | - | 3,174 | - | - | - | - | 424,182 | (489,791) | 8,909 |
| EARNINGS BEFORE INCOME TAXES | 248,870 | 63,256 | 381,404 | 49,006 | 21,364 | (53,618) | (1,477) | 63,721 | 81,102 | 3,210 | 2,487 | 34,765 | 399,117 | (501,137) | 792,070 |
| FINANCIAL RESULTS | (78,080) | (46,442) | (88,344) | 9,440 | (2,846) | 2,998 | 50 | (34,077) | 3,786 | 464 | 902 | 9,253 | (6,546) | 12,957 | (216,485) |
| Financial income | 21,705 | 9,227 | 145,337 | 15,895 | 5,388 | 5,010 | 366 | 30,199 | 3,913 | 464 | 1,672 | 9,206 | 11,802 | (31,887) | 228,297 |
| Financial expenses | (99,785) | (55,669) | (233,681) | (6,455) | (8,234) | (2,012) | (316) | (64,276) | (127) | - | (770) | 47 | (18,348) | 44,844 | (444,782) |
| OPERATIONAL EXPENSES / INCOME | 170,790 | 16,814 | 293,060 | 58,446 | 18,518 | (50,620) | (1,427) | 29,644 | 84,888 | 3,674 | 3,389 | 44,018 | 392,571 | (488,180) | 575,585 |
| INCOME TAX AND SOCIAL CONTRIBUTION ON PROFIT | (41,065) | 4,480 | (67,367) | (14,907) | (6,308) | - | - | (14,753) | (29,097) | (416) | (748) | (12,595) | (29,660) | 17,432 | (195,004) |
| NET INCOME continued operations | 129,725 | 21,294 | 225,693 | - | 12,210 | - | (1,427) | 14,891 | 55,791 | 3,258 | 2,641 | 31,423 | 362,911 | (477,829) | 380,581 |
| NET INCOME discontinued operations | - | - | - | 43,539 | - | (50,620) | - | - | - | - | - | - | - | 4,891 | (2,190) |
| NET INCOME | 129,725 | 21,294 | 225,693 | 43,539 | 12,210 | (50,620) | (1,427) | 14,891 | 55,791 | 3,258 | 2,641 | 31,423 | 362,911 | (472,938) | 378,391 |
| Attributed to shareholders of the parent company - continuous operations | 129,725 | 21,294 | 225,693 | - | 8,548 | - | (1,427) | 14,891 | 55,791 | 3,258 | 2,641 | 31,423 | 362,911 | (472,938) | 381,810 |
| Attributed to the controlling company's shareholders - discontinued operations | - | - | - | 22,205 | - | (41,103) | - | - | - | - | - | - | - | - | (18,898) |
| Attributed to non-controlling shareholders - continuous operations | - | - | - | - | 3,663 | - | - | - | - | - | - | - | - | - | 3,663 |
| Attributed to non-controlling shareholders - discontinued operations | - | - | - | 21,333 | - | (9,517) | - | - | - | - | - | - | - | - | 11,816 |
| EBITDA continued operations | 342,286 | 67,220 | 496,512 | 59,597 | 27,935 | (47,688) | (928) | 111,959 | 113,003 | 6,009 | 2,495 | 34,856 | 399,759 | (514,959) | 1,098,056 |
| |
| Exhibit II-RESULT BY SUBSIDIARY > INCOME STATEMENT BY COMPANY ACCUMULATED |
| R$'000 | |||||||||||||||
| Income Statement 9M23 | GET | Distribuição | Compagas | Elejor | UEG Araucária | Serviços | Wind Farms | FDA | Bela Vista | C. Oeste, Marumbi, Uirapuru | Mercado Livre | Holding | Elimination | Consolidated | |
| Geração | Transmissão | ||||||||||||||
| NET OPERATING INCOME | 1,893,231 | 803,171 | 11,069,533 | 765,757 | 106,292 | - | - | 609,976 | 582,984 | 22,950 | 48,148 | 3,019,731 | - | (3,010,003) | 15,911,770 |
| Electricity sales to final customers | - | - | 4,049,555 | - | - | - | - | - | - | - | - | 1,705,263 | - | (1,141) | 5,753,677 |
| Electricity sales to distributors | 1,847,567 | - | 140,456 | - | 105,591 | - | - | 609,399 | 582,974 | 22,950 | - | 1,306,933 | - | (1,877,160) | 2,738,710 |
| Use of the main distribution and transmission grid (TUSD/ TUST) | - | 703,138 | 3,918,209 | - | - | - | - | - | - | - | 48,466 | - | - | (321,823) | 4,347,990 |
| Construction revenue | - | 80,506 | 1,665,959 | 10,188 | - | - | - | - | - | - | (338) | - | - | (10,188) | 1,746,127 |
| Fair value of assets from the indemnity for the concession | - | - | 41,898 | - | - | - | - | - | - | - | - | - | - | - | 41,898 |
| Distribution of piped gas | - | - | - | 755,565 | - | - | - | - | - | - | - | - | - | (755,565) | - |
| Sectoral assets and liabilities result | - | - | 879,709 | - | - | - | - | - | - | - | - | - | - | - | 879,709 |
| Other operating revenues | 45,664 | 19,527 | 373,747 | 4 | 701 | - | - | 577 | 10 | - | 20 | 7,535 | - | (44,126) | 403,659 |
| OPERATING COSTS AND EXPENSES | (1,157,937) | (406,333) | (10,430,291) | (629,702) | (69,017) | (216,900) | (827) | (391,666) | (336,101) | (14,407) | (6,822) | (2,931,809) | (110,806) | 3,055,146 | (13,647,472) |
| Energy purchased for resale | (96,974) | - | (4,489,552) | - | (1,048) | - | - | (19,628) | (61,983) | (673) | - | (2,901,011) | - | 1,876,743 | (5,694,126) |
| Charges of the main distribution and transmission grid | (281,841) | - | (1,971,815) | - | (17,913) | (26,400) | - | (47,420) | (119,016) | (988) | - | - | - | 346,905 | (2,118,488) |
| Personnel and management | (280,122) | (204,630) | (983,750) | (32,780) | (3,815) | (4,611) | (15) | (13,224) | (2,263) | (1,001) | (758) | (17,463) | (54,649) | 37,391 | (1,561,690) |
| Private pension and health plans | (34,577) | (24,535) | (125,133) | (4,506) | (140) | (519) | (2) | (1,562) | (264) | (71) | (90) | (1,424) | (6,411) | 5,025 | (194,209) |
| Materials and supplies | (8,414) | (4,043) | (48,957) | (1,071) | (190) | (32) | - | (1,111) | (1,072) | (39) | (116) | (60) | (748) | 1,102 | (64,751) |
| Materials and supplies for power eletricity | (17,654) | - | - | - | - | (1,031) | - | - | - | - | - | - | - | 1,031 | (17,654) |
| Natural gas and supplies for gas business | - | - | - | (533,679) | - | - | - | - | - | - | - | - | - | 533,679 | - |
| Third-party services | (76,962) | (36,387) | (467,631) | (10,097) | (12,442) | (16,086) | (382) | (86,991) | (27,334) | (2,336) | (4,911) | (2,887) | (47,449) | 63,543 | (728,352) |
| Depreciation and amortization | (284,112) | (11,985) | (385,557) | (30,367) | (25,396) | (16,432) | (1,457) | (190,345) | (95,695) | (8,483) | (30) | (1,563) | (2,250) | 26,440 | (1,027,232) |
| Provisions and reversals | (17,508) | (45,483) | (146,437) | 602 | - | (150,472) | - | 2,183 | (2) | - | (343) | (3,255) | 11,651 | 144,292 | (204,772) |
| Construction cost | - | (68,873) | (1,665,959) | (10,188) | - | - | - | - | - | - | 338 | - | - | 10,188 | (1,734,494) |
| Renegotiation of Hydrological Risk - GSF - HPP Mauá | 26,405 | - | - | - | - | - | - | - | - | - | - | - | - | - | 26,405 |
| Other operating costs and expenses | (86,178) | (10,397) | (145,500) | (7,616) | (8,073) | (1,317) | 1,029 | (33,568) | (28,472) | (816) | (912) | (4,146) | (10,950) | 8,807 | (328,109) |
| EQUITY IN EARNINGS OF SUBSIDIARIES | 259,457 | 274,716 | - | - | - | - | - | 70,988 | - | - | - | - | 1,519,621 | (1,880,107) | 244,675 |
| EARNINGS BEFORE INCOME TAXES | 994,751 | 671,554 | 639,242 | 136,055 | 37,275 | (216,900) | (827) | 289,298 | 246,883 | 8,543 | 41,326 | 87,922 | 1,408,815 | (1,834,964) | 2,508,973 |
| FINANCIAL RESULTS | (286,619) | (231,133) | (330,968) | (9,171) | (10,221) | 4,298 | (633) | (91,186) | 17,769 | 2,427 | 5,013 | 27,734 | (1,471) | 4,872 | (899,289) |
| Financial income | 80,906 | 44,733 | 364,640 | 24,872 | 85,862 | 9,201 | 359 | 102,134 | 18,255 | 2,428 | 7,053 | 27,998 | 76,069 | (48,060) | 796,450 |
| Financial expenses | (367,525) | (275,866) | (695,608) | (34,043) | (96,083) | (4,903) | (992) | (193,320) | (486) | (1) | (2,040) | (264) | (77,540) | 52,932 | (1,695,739) |
| OPERATIONAL EXPENSES / INCOME | 708,132 | 440,421 | 308,274 | 126,884 | 27,054 | (212,602) | (1,460) | 198,112 | 264,652 | 10,970 | 46,339 | 115,656 | 1,407,344 | (1,830,092) | 1,609,684 |
| INCOME TAX AND SOCIAL CONTRIBUTION ON PROFIT | (15,233) | (5,626) | (2,444) | (43,239) | (6,673) | (13,614) | - | (50,690) | (89,463) | (2,390) | (3,959) | (34,780) | 113,472 | 61,580 | (93,059) |
| NET INCOME continued operations | 692,899 | 434,795 | 305,830 | - | 20,381 | - | (1,460) | 147,422 | 175,189 | 8,580 | 42,380 | 80,876 | 1,520,816 | (1,911,083) | 1,516,625 |
| NET INCOME discontinued operations | - | - | - | 83,645 | - | (226,216) | - | - | - | - | - | - | - | 10,305 | (132,266) |
| NET INCOME | 692,899 | 434,795 | 305,830 | 83,645 | 20,381 | (226,216) | (1,460) | 147,422 | 175,189 | 8,580 | 42,380 | 80,876 | 1,520,816 | (1,900,778) | 1,384,359 |
| Attributed to shareholders of the parent company - continuous operations | 692,899 | 434,795 | 305,830 | - | 14,267 | - | (1,460) | 147,422 | 175,189 | 8,580 | 42,380 | 80,876 | 1,520,816 | (1,900,778) | 1,520,816 |
| Attributed to the controlling company's shareholders - discontinued operations | - | - | - | 42,659 | - | (183,688) | - | - | - | - | - | - | - | - | (141,029) |
| Attributed to non-controlling shareholders - continuous operations | - | - | - | - | 6,114 | - | - | - | - | - | - | - | - | - | 6,114 |
| Attributed to non-controlling shareholders - discontinued operations | - | - | - | 40,986 | - | (42,528) | - | - | - | - | - | - | - | - | (1,542) |
| EBITDA continued operations | 1,278,863 | 683,539 | 1,024,799 | 166,422 | 62,671 | (200,468) | 630 | 479,643 | 342,578 | 17,026 | 41,356 | 89,485 | 1,411,065 | (1,861,404) | 3,536,205 |
| |
| R$'000 | |||||||||||||||
| Income Statement 9M22 | GET | Distribuição | Compagas | Elejor | UEG Araucária | Serviços | Wind Farms | FDA | Bela Vista | C. Oeste, Marumbi, Uirapuru | Mercado Livre | Holding | Elimination | Consolidated | |
| Geração | Transmissão | ||||||||||||||
| NET OPERATING INCOME | 1,871,448 | 794,907 | 10,315,857 | 935,162 | 150,033 | 98,475 | 8,014 | 435,576 | 557,175 | 22,527 | 87,341 | 3,659,025 | - | (3,664,979) | 15,270,561 |
| Electricity sales to final customers | 103 | - | 4,027,924 | - | - | - | - | - | - | - | - | 1,720,801 | - | (1,891) | 5,746,937 |
| Electricity sales to distributors | 1,816,398 | - | 203,456 | - | 150,033 | 98,475 | - | 431,955 | 557,158 | 22,527 | - | 1,932,347 | - | (2,379,437) | 2,832,912 |
| Use of the main distribution and transmission grid (TUSD/ TUST) | - | 674,091 | 3,065,949 | - | - | - | - | - | - | - | 86,189 | - | - | (293,824) | 3,532,405 |
| Construction revenue | - | 97,206 | 1,493,455 | 9,039 | - | - | - | - | - | - | 1,133 | - | - | (9,039) | 1,591,794 |
| Fair value of assets from the indemnity for the concession | - | - | 45,045 | 12,831 | - | - | - | - | - | - | - | - | - | (12,831) | 45,045 |
| Distribution of piped gas | - | - | - | 913,190 | - | - | - | - | - | - | - | - | - | (913,190) | - |
| Sectoral assets and liabilities result | - | - | 1,209,056 | - | - | - | - | - | - | - | - | - | - | - | 1,209,056 |
| Other operating revenues | 54,947 | 23,610 | 270,972 | 102 | - | - | 8,014 | 3,621 | 17 | - | 19 | 5,877 | - | (54,767) | 312,412 |
| OPERATING COSTS AND EXPENSES | (1,160,059) | (245,562) | (10,153,660) | (798,976) | (63,616) | (196,305) | (10,055) | (287,754) | (298,997) | (14,534) | (6,944) | (3,597,348) | (89,402) | 3,623,562 | (13,299,650) |
| Energy purchased for resale | (248,206) | - | (4,433,361) | - | (124) | - | - | (13,881) | (28,941) | (1,442) | - | (3,579,136) | - | 2,280,968 | (6,024,123) |
| Charges of the main distribution and transmission grid | (253,494) | - | (1,734,129) | - | (17,681) | (24,423) | - | (35,243) | (109,398) | (966) | - | - | - | 316,606 | (1,858,728) |
| Personnel and management | (133,083) | (92,467) | (445,379) | (32,245) | (3,593) | (5,074) | (3,387) | (9,637) | (1,961) | (904) | (634) | (9,240) | (27,894) | 37,320 | (728,178) |
| Private pension and health plans | (34,663) | (23,290) | (127,278) | (4,170) | (173) | (456) | (2,924) | (1,034) | (214) | (54) | (69) | (1,329) | (4,683) | 4,625 | (195,712) |
| Materials | (7,908) | (4,048) | (50,059) | (1,084) | (577) | (256) | (50) | (392) | (543) | - | (31) | (37) | (539) | 1,341 | (64,183) |
| Raw material and supplies - energy production | - | - | - | - | - | (112,718) | - | - | - | - | - | - | - | 112,718 | - |
| Natural gas and supplies for gas business | - | - | - | (701,924) | - | - | - | - | - | - | - | - | - | 701,924 | - |
| Third-party services | (66,554) | (27,613) | (362,280) | (10,408) | (11,947) | (25,776) | (2,055) | (58,515) | (27,735) | (1,921) | (4,479) | (2,186) | (29,454) | 85,997 | (544,926) |
| Depreciation and amortization | (280,255) | (10,302) | (334,669) | (31,717) | (22,730) | (17,780) | (1,540) | (144,733) | (102,535) | (8,364) | (23) | (255) | (1,872) | 41,893 | (914,882) |
| Provisions and reversals | (23,578) | - | (211,707) | (2,020) | - | (2,761) | (4) | (258) | (6) | - | (28) | (1,504) | (4,845) | 20,147 | (226,564) |
| Construction cost | - | (78,719) | (1,493,455) | (9,039) | - | - | - | - | - | - | (1,133) | - | - | 9,039 | (1,573,307) |
| Other operating costs and expenses | (112,318) | (9,123) | (150,780) | (6,369) | (6,791) | (7,061) | (95) | (24,061) | (27,664) | (883) | (547) | (3,661) | (20,115) | 10,984 | (358,484) |
| PROVISION FOR ALLOCATION OF PIS AND COFINS | - | - | (810,563) | - | - | - | - | - | - | - | - | - | - | - | (810,563) |
| EQUITY IN EARNINGS OF SUBSIDIARIES | 174,676 | 392,707 | - | - | - | - | - | 20,594 | - | - | - | - | 681,243 | (939,105) | 330,115 |
| EARNINGS BEFORE INCOME TAXES | 886,065 | 942,052 | 162,197 | 136,186 | 86,417 | (97,830) | (2,041) | 168,416 | 258,178 | 7,993 | 80,397 | 61,677 | 591,841 | (980,522) | 2,301,026 |
| FINANCIAL RESULTS | (254,333) | (162,156) | (1,107,205) | 19,820 | (106,735) | 10,246 | 528 | (105,416) | 17,568 | 831 | 2,525 | 23,256 | (60,399) | (4,668) | (1,726,138) |
| Financial income | 81,548 | 39,880 | 455,471 | 39,543 | 13,187 | 16,840 | 1,483 | 77,684 | 17,961 | 831 | 4,818 | 23,492 | 48,925 | (98,058) | 723,605 |
| Financial expenses | (335,881) | (202,036) | (551,306) | (19,723) | (119,922) | (6,594) | (955) | (183,100) | (393) | - | (2,293) | (236) | (109,324) | 93,390 | (1,438,373) |
| Update of provision for allocation of PIS and Cofins credits | - | - | (1,011,370) | - | - | - | - | - | - | - | - | - | - | - | (1,011,370) |
| OPERATIONAL EXPENSES / INCOME | 631,732 | 779,896 | (945,008) | 156,006 | (20,318) | (87,584) | (1,513) | 63,000 | 275,746 | 8,824 | 82,922 | 84,933 | 531,442 | (985,190) | 574,888 |
| INCOME TAX AND SOCIAL CONTRIBUTION ON PROFIT | (159,683) | (119,088) | 390,967 | (42,249) | 6,931 | (940) | - | (38,665) | (93,977) | (985) | (4,389) | (26,430) | (40,712) | 43,553 | (85,667) |
| NET INCOME continued operations | 472,049 | 660,808 | (554,041) | - | (13,387) | - | (1,513) | 24,335 | 181,769 | 7,839 | 78,533 | 58,503 | 490,730 | (916,404) | 489,221 |
| NET INCOME discontinued operations | - | - | - | 113,757 | - | (88,524) | - | - | - | - | - | - | - | 11,357 | 36,590 |
| NET INCOME | 472,049 | 660,808 | (554,041) | 113,757 | (13,387) | (88,524) | (1,513) | 24,335 | 181,769 | 7,839 | 78,533 | 58,503 | 490,730 | (905,047) | 525,811 |
| Attributed to shareholders of the parent company - continuous operations | 472,049 | 660,808 | (554,041) | - | (9,371) | - | (1,513) | 24,335 | 181,769 | 7,839 | 78,533 | 58,503 | 490,730 | (905,046) | 504,595 |
| Attributed to the controlling company's shareholders - discontinued operations | - | - | - | 58,016 | - | (71,881) | - | - | - | - | - | - | - | - | (13,865) |
| Attributed to non-controlling shareholders - continuous operations | - | - | - | - | (4,016) | - | - | - | - | - | - | - | - | - | (4,016) |
| Attributed to non-controlling shareholders - discontinued operations | - | - | - | 55,740 | - | (16,643) | - | - | - | - | - | - | - | - | 39,097 |
| EBITDA continued operations | 1,166,320 | 952,354 | 496,866 | 167,903 | 109,147 | (80,050) | (501) | 313,149 | 360,713 | 16,357 | 80,420 | 61,932 | 593,713 | (1,022,415) | 3,215,908 |
| |
| Exhibit II-RESULT BY SUBSIDIARY > ASSETS BY COMPANY |
| R$'000 | ||||||||||||||
| Assets - September -2023 | Geração e Transmissão | Distribuição | Compagas | Elejor | UEG Araucária | Serviços | Wind Farms | FDA | Bela Vista | Costa Oeste, Marumbi, Uirapuru | Mercado Livre | Holding | Eliminations | Consolidated |
| CURRENT | 2,125,737 | 5,389,773 | 378,798 | 215,810 | 47,088 | 5,916 | 945,651 | 346,673 | 35,121 | 96,096 | 1,024,926 | 4,663,225 | (1,961,075) | 13,313,738 |
| Cash and cash equivalents | 876,014 | 921,693 | 230,338 | 174,615 | 8,783 | 405 | 732,293 | 274,763 | 32,065 | 69,750 | 272,363 | 2,203,831 | (239,120) | 5,557,791 |
| Bonds and securities | - | - | - | - | - | - | - | - | - | - | 96 | - | 96 | |
| Collaterals and escrow accounts | - | - | 258 | - | - | - | - | - | - | - | - | - | (258) | - |
| Customers | 449,984 | 2,829,098 | 103,406 | 21,631 | - | - | 105,246 | 68,060 | 2,448 | 7,902 | 378,988 | - | (347,198) | 3,619,568 |
| Dividends receivable | 100,860 | - | - | - | - | - | 38,318 | - | - | - | 0 | 2,089,981 | (2,188,434) | 40,725 |
| Sectorial financial assets | 38,924 | - | - | - | - | - | - | - | - | - | - | 38,924 | ||
| Account receivable related to concession | 9,232 | - | - | - | - | - | - | - | - | - | - | - | - | 9,232 |
| Contract Assets | 280,258 | - | - | - | - | - | - | - | - | 15,842 | - | - | - | 296,100 |
| Other current receivables | 134,563 | 454,127 | 36,073 | 8,319 | 55 | 3,075 | 13,812 | 12 | - | 678 | 364,910 | 2,301 | (46,243) | 971,681 |
| Inventories | 34,650 | 145,797 | 5,501 | 249 | - | 249 | 4,375 | 372 | - | 205 | - | - | (5,501) | 185,897 |
| Income tax and social contribution | 169,304 | 4,102 | 2,456 | 8,615 | 13,906 | 1,876 | 19,094 | 1,377 | 413 | 1,325 | 7,915 | 51,186 | (16,362) | 265,210 |
| Other current recoverable taxes | 18,755 | 950,190 | 8 | - | 23,836 | 311 | 9,601 | 1,228 | 19 | - | 334 | (0) | (23,844) | 980,436 |
| Prepaid expenses | 9,899 | 37,753 | 759 | 2,381 | 508 | - | 11,689 | 861 | 176 | 395 | 416 | 1,243 | (1,267) | 64,809 |
| Related parties | 13,737 | 8,089 | - | - | - | - | 11,223 | - | - | - | - | 14,519 | (32,224) | 15,344 |
| Assets held for sale | 28,480 | - | - | - | - | - | - | - | - | - | - | 300,068 | 939,377 | 1,267,925 |
| NON-CURRENT | 20,918,024 | 16,466,995 | 782,924 | 602,914 | 59,115 | 40,963 | 8,254,733 | 478,986 | 201,683 | 490,398 | 984,508 | 20,346,368 | (27,239,956) | 42,387,651 |
| Long Term Assets | 5,874,137 | 8,362,882 | 65,551 | 83,584 | 22,709 | 1,788 | 677,586 | 26,630 | 226 | 490,074 | 974,029 | 660,830 | (381,505) | 16,858,518 |
| Bonds and securities | 133,733 | 981 | - | - | - | - | 397,596 | 15,998 | - | 4,328 | 1,835 | - | - | 554,472 |
| Other temporary investments | - | - | - | - | - | 1,204 | - | - | - | - | - | 30,258 | - | 31,462 |
| Customers | - | 114,748 | - | - | - | - | - | - | - | - | - | - | - | 114,748 |
| Judicial deposits | 97,362 | 379,646 | 65 | - | 52 | 583 | 73 | - | 218 | - | 15,278 | 142,418 | (117) | 635,578 |
| Sectoral financial assets | - | 116,773 | - | - | - | - | - | - | - | - | - | - | 116,773 | |
| Account receivable related to concession | 850,733 | 1,786,668 | - | - | - | - | - | - | - | - | - | - | - | 2,637,401 |
| Contract Assets | 4,639,858 | 2,305,994 | 36,326 | - | - | - | - | - | - | 484,813 | - | - | (43,967) | 7,423,024 |
| Other non-current receivables | 73,334 | 39,532 | 29,160 | 2,508 | - | - | - | 10,005 | - | 933 | 956,784 | 19 | (29,160) | 1,083,115 |
| Income tax and social contribution | 504 | 89,827 | - | 1,301 | - | - | - | - | - | - | 71 | - | - | 91,703 |
| Deferred income tax and social contribution | - | 1,275,753 | - | 73,924 | 22,657 | - | - | - | - | - | - | 447,349 | (22,657) | 1,797,026 |
| Other non-current recoverable taxes | 78,613 | 2,252,960 | - | - | - | - | 162 | 627 | 8 | - | 61 | 40,786 | - | 2,373,216 |
| Related parties | - | - | - | 5,851 | - | - | 279,755 | - | - | - | - | - | (285,604) | - |
| Investments | 8,720,267 | 443 | - | - | - | - | 2,794,427 | - | - | - | - | 19,665,640 | (27,614,311) | 3,566,466 |
| Property, plant and equipment, net | 5,182,029 | - | - | 331,157 | 36,372 | 34,504 | 4,751,036 | 308,046 | 196,036 | 251 | 534 | 7,523 | (36,372) | 10,811,117 |
| Intangible assets | 1,075,478 | 7,973,290 | 705,924 | 187,357 | 34 | 938 | 2,669 | 144,310 | 5,421 | 72 | 5,902 | 5,765 | 803,681 | 10,910,839 |
| Right to use an asset | 66,113 | 130,380 | 11,449 | 815 | - | 3,734 | 29,015 | - | - | - | 4,043 | 6,610 | (11,448) | 240,711 |
| TOTAL | 23,043,761 | 21,856,768 | 1,161,722 | 818,724 | 106,203 | 46,879 | 9,200,383 | 825,659 | 236,804 | 586,494 | 2,009,434 | 25,009,593 | (29,201,032) | 55,701,389 |
| |
| R$'000 | ||||||||||||||
| Assets - December-2022 | Geração e Transmissão | Distribuição | Compagas | Elejor | UEG Araucária | Serviços | Wind Farms | FDA | Bela Vista | Costa Oeste, Marumbi, Uirapuru | Mercado Livre | Holding | Eliminations | Consolidated |
| CURRENT | 1,647,236 | 4,937,240 | 282,714 | 224,833 | 97,587 | 6,075 | 937,476 | 376,804 | 26,828 | 94,931 | 990,867 | 1,180,872 | (1,476,214) | 9,327,249 |
| Cash and cash equivalents | 380,955 | 430,121 | 61,059 | 185,916 | 64,991 | 3,748 | 755,355 | 284,624 | 22,934 | 71,141 | 217,736 | 199,877 | - | 2,678,457 |
| Bonds and securities | - | - | - | - | - | - | - | - | - | - | - | 93 | - | 93 |
| Collaterals and escrow accounts | - | 90 | 67 | - | - | - | - | - | - | - | - | - | - | 157 |
| Customers | 389,967 | 2,429,434 | 128,589 | 23,272 | - | - | 97,594 | 88,764 | 2,997 | 7,184 | 475,170 | - | (300,921) | 3,342,050 |
| Dividends receivable | 352,718 | - | - | - | - | - | 45,676 | - | - | - | - | 824,143 | (1,084,207) | 138,330 |
| CRC transferred to the State of Paraná | - | - | - | - | - | - | - | - | - | |||||
| Sectorial financial assets | - | 190,699 | - | - | - | - | - | - | - | - | - | - | - | 190,699 |
| Account receivable related to concession | 8,603 | - | - | - | - | - | - | - | - | - | - | - | - | 8,603 |
| Contract Assets | 205,647 | - | - | - | - | - | - | - | - | 15,013 | - | - | - | 220,660 |
| Other current receivables | 137,224 | 408,462 | 49,518 | 12,237 | 5 | 2 | 5,616 | 2 | - | 66 | 292,962 | 977 | (9,691) | 897,380 |
| Inventories | 30,024 | 158,487 | 5,694 | 195 | - | 249 | - | - | - | 201 | - | - | - | 194,850 |
| Income tax and social contribution | 102,625 | 95,397 | 8,705 | 3,097 | 12,885 | 1,693 | 16,522 | 1,620 | 250 | 1,129 | 3,619 | 107,523 | - | 355,065 |
| Other current recoverable taxes | 11,312 | 1,178,192 | 28,505 | - | 19,705 | 241 | 120 | 1,225 | 16 | - | 378 | - | - | 1,239,694 |
| Prepaid expenses | 13,000 | 37,593 | 577 | 116 | - | 142 | 5,394 | 569 | 631 | 197 | 1,002 | 855 | - | 60,076 |
| Related parties | 15,162 | 8,765 | - | - | - | - | 11,199 | - | - | - | - | 47,404 | (81,395) | 1,135 |
| NON-CURRENT | 20,110,117 | 15,601,575 | 800,999 | 623,364 | 236,832 | 16,870 | 6,623,943 | 561,976 | 210,555 | 496,329 | 818,104 | 20,894,673 | (26,618,884) | 40,376,451 |
| Long Term Assets | 5,924,570 | 8,200,557 | 59,505 | 80,811 | 43,358 | 536 | 476,931 | 15,875 | 15 | 496,232 | 809,498 | 538,071 | (203,812) | 16,442,145 |
| Bonds and securities | 123,022 | 905 | - | - | - | - | 286,623 | 14,750 | - | 3,974 | 1,689 | - | - | 430,963 |
| Other temporary investments | - | - | - | - | - | - | - | - | - | - | - | 25,619 | - | 25,619 |
| Collaterals and escrow accounts | - | - | - | - | - | - | - | - | - | |||||
| Customers | - | 109,472 | - | - | - | - | 347 | - | - | - | - | - | - | 109,819 |
| CRC transferred to the State of Paraná | - | - | - | - | - | - | - | - | - | |||||
| Judicial deposits | 87,125 | 384,425 | 69 | 58 | 7,087 | 536 | 49 | - | - | - | 14,362 | 138,747 | - | 632,458 |
| Sectoral financial assets | - | 190,699 | - | - | - | - | - | - | - | - | - | - | - | 190,699 |
| Account receivable related to concession | 826,871 | 1,442,819 | - | - | - | - | - | - | - | - | - | - | - | 2,269,690 |
| Contract Assets | 4,607,214 | 2,332,171 | 30,032 | - | - | - | - | - | - | 490,785 | - | - | (8,183) | 7,452,019 |
| Other non-current receivables | ��89,225 | 15,020 | 29,394 | 2,508 | - | - | - | 475 | - | 1,473 | 793,339 | 18 | - | 931,452 |
| Income tax and social contribution | 106,729 | 19,723 | - | 1,301 | - | - | - | - | - | - | 71 | - | - | 127,824 |
| Deferred income tax and social contribution | - | 1,203,057 | - | 71,094 | 36,271 | - | - | - | - | - | - | 333,877 | - | 1,644,299 |
| Other non-current recoverable taxes | 84,383 | 2,502,266 | - | - | - | - | 133 | 649 | 15 | - | 37 | 39,810 | - | 2,627,293 |
| Prepaid expenses | - | - | 10 | - | - | - | - | - | - | - | - | - | - | 10 |
| Related parties | - | - | - | 5,851 | - | - | 189,779 | - | - | - | - | - | (195,630) | - |
| Investments | 7,720,268 | 534 | - | - | - | - | 2,402,494 | - | - | - | - | 20,339,344 | (27,136,909) | 3,325,731 |
| Property, plant and equipment, net | 5,278,437 | - | - | 345,813 | 193,421 | 1,977 | 3,720,908 | 315,167 | 205,250 | 5 | 541 | 7,948 | - | 10,069,468 |
| Intangible assets | 1,126,526 | 7,257,827 | 726,107 | 195,778 | 53 | 1,263 | 1,104 | 230,934 | 5,288 | 92 | 6,193 | 4,724 | 721,837 | 10,277,727 |
| Right to use an asset | 60,316 | 142,657 | 15,387 | 962 | - | 13,094 | 22,506 | - | - | - | 1,872 | 4,586 | - | 261,380 |
| TOTAL | 21,757,353 | 20,538,815 | 1,083,713 | 848,198 | 334,418 | 22,946 | 7,561,419 | 938,779 | 237,382 | 591,260 | 1,808,971 | 22,075,545 | (28,095,099) | 49,703,700 |
| |
| Exhibit II-RESULT BY SUBSIDIARY > LIABILITIES BY COMPANY |
| R$'000 | ||||||||||||||
| Liabilities - September -23 | Geração e Transmissão | Distribuição | Compagas | Elejor | UEG Araucária | Serviços | Wind Farms | FDA | Bela Vista | Costa Oeste, Marumbi, Uirapuru | Mercado Livre | Holding | Eliminations | Consolidated |
| CURRENT | 3,040,410 | 5,137,481 | 324,268 | 114,735 | 49,278 | 138 | 570,985 | 142,522 | 1,169 | 10,389 | 862,810 | 895,626 | (2,154,405) | 8,995,410 |
| Social charges and accruals | 288,959 | 595,866 | 11,199 | 569 | 763 | - | 36 | - | 14 | - | 8,535 | 26,409 | (11,963) | 920,387 |
| Associated companies and parent company | 5,317 | 10,831 | - | - | - | 17 | 29,275 | 715 | 196 | 235 | 332 | 1,606 | (48,526) | - |
| Suppliers | 312,529 | 1,609,006 | 68,193 | 5,749 | 6,036 | 102 | 81,818 | 30,220 | 592 | 883 | 368,947 | 16,560 | (323,347) | 2,177,287 |
| Income Tax and Social Contribution payable | - | - | 16,594 | 5,871 | - | - | 11,925 | 95,071 | 246 | 677 | 548 | - | (16,594) | 114,337 |
| Other taxes | 2,209 | 234,700 | 12,508 | 926 | 536 | 2 | 14,680 | 4,481 | 112 | 270 | 18,504 | 475 | (13,043) | 276,366 |
| Loans and financing | 143,227 | 2,577 | - | - | - | - | 119,762 | - | - | 6,213 | - | - | - | 271,780 |
| Debentures | 599,801 | 734,844 | 82,688 | - | - | - | 55,414 | - | - | - | - | - | (82,688) | 1,390,058 |
| Dividends payable | 1,501,852 | 369,784 | 126,864 | - | 41,944 | - | 74,639 | - | - | - | 143,400 | 845,700 | (2,258,483) | 845,700 |
| Post employment benefits | 21,895 | 59,722 | - | - | - | - | - | - | - | - | 124 | 3,816 | - | 85,557 |
| Customer charges due | 16,758 | 44,789 | - | - | - | - | - | 1,515 | - | 297 | - | - | - | 63,359 |
| Research and development and energy efficiency | 68,816 | 275,871 | - | 1,581 | - | - | - | 937 | - | 1,560 | - | - | - | 348,765 |
| Payables related to concession | 2,083 | - | - | 98,000 | - | - | - | - | - | - | - | - | - | 100,083 |
| Sectorial financial liabilities | - | 723,786 | - | - | - | - | - | - | - | - | - | - | - | 723,786 |
| Other accounts payable | 11,007 | 40,687 | 2,805 | 232 | - | 17 | 198 | - | - | - | 156 | 460 | (2,805) | 52,757 |
| Other bills to pay | 65,956 | 155,722 | 3,415 | 1,807 | - | 0 | 183,240 | 9,582 | 9 | 254 | 322,264 | 601 | (3,410) | 739,440 |
| PIS and Cofins to be refunded to consumers | - | 279,295 | - | - | - | - | - | - | - | - | - | - | - | 279,295 |
| Liabilities associated with assets held for sale | - | - | - | - | - | - | - | - | - | - | - | - | 606,454 | 606,454 |
| NON-CURRENT | 7,693,509 | 9,912,786 | 323,545 | 722,413 | 10,159 | 4,317 | 3,090,004 | 51,952 | 2,767 | 46,933 | 785,607 | 860,910 | (307,061) | 23,197,845 |
| Associated companies and parent company | - | - | - | - | - | - | 266,199 | - | - | - | - | 5,851 | (272,050) | - |
| Suppliers | 134,730 | - | - | - | - | - | - | - | - | - | - | - | - | 134,730 |
| Deferred income tax and social contribution | 1,185,517 | - | 27,278 | 1,589 | - | - | 19,832 | 44,844 | 703 | 18,027 | 106,148 | - | 264,599 | 1,668,534 |
| Tax liabilities | 59,478 | 553,639 | - | - | - | 580 | - | - | - | - | 502 | 3,935 | - | 618,134 |
| Loans and financing | 2,134,344 | 749,346 | - | - | - | - | 2,193,574 | - | - | 21,565 | - | - | - | 5,098,831 |
| Debentures | 3,150,664 | 4,733,952 | 220,755 | - | - | - | 495,056 | - | - | - | - | - | (220,755) | 8,379,671 |
| Post-employment benefits | 310,383 | 669,549 | 10,309 | - | 992 | - | - | - | - | - | 3,499 | 22,635 | (11,301) | 1,006,066 |
| Research and development and energy efficiency | - | 200,482 | - | - | 8,453 | - | - | 7,108 | - | 689 | - | - | (8,453) | 208,279 |
| Payables related to the concession | 63,101 | - | - | 720,217 | - | - | - | - | - | - | - | - | - | 783,318 |
| Sectorial financial liabilities | 27,119 | - | - | - | - | - | - | - | - | 27,119 | ||||
| Lease liability | 59,526 | 98,522 | 9,530 | 607 | - | 3,737 | 29,830 | - | - | - | 4,050 | 6,494 | (9,530) | 202,767 |
| Other payables | 49,531 | 3,670 | 39,249 | - | - | - | 78,153 | - | - | 17 | 670,685 | 12,930 | (52,150) | 802,087 |
| PIS/Cofins to be refunded to consumers | 404,329 | - | - | - | - | - | - | - | - | - | - | - | 404,329 | |
| Provision for allocation of PIS and COFINS | 1,910,295 | - | - | - | - | - | - | - | - | - | - | - | 1,910,295 | |
| Provisions for litigation | 546,234 | 561,883 | 16,425 | - | 714 | - | 7,360 | - | 2,064 | 6,636 | 723 | 809,066 | 2,579 | 1,953,685 |
| EQUITY | 12,309,844 | 6,806,502 | 513,911 | (18,425) | 46,765 | 42,424 | 5,539,378 | 631,186 | 232,870 | 529,170 | 361,017 | 23,253,055 | (26,739,563) | 23,508,134 |
| Attributable to controlling shareholders | 12,309,844 | 6,806,502 | 513,911 | (18,425) | 46,765 | 42,424 | 5,539,378 | 631,186 | 232,870 | 529,170 | 361,017 | 23,253,055 | (26,994,642) | 23,253,055 |
| Capital | 6,242,757 | 5,372,206 | 220,966 | 35,503 | 425,662 | 16,685 | 5,156,936 | 409,509 | 223,913 | 275,161 | 237,210 | 12,816,678 | (18,616,510) | 12,816,678 |
| Advance for Future Capital Increase | - | - | - | - | - | 35,250 | 18,681 | - | - | - | - | - | (53,931) | - |
| Legal Reserves | 561,403 | 15,777 | (363) | 3,085 | 137 | (1) | - | - | - | - | (1,113) | 565,957 | (578,925) | 565,957 |
| Profit retention reserve | 877,479 | 306,744 | 44,193 | - | - | - | 47,654 | 46,488 | 376 | 24,970 | 22,794 | 1,512,687 | (1,370,700) | 1,512,687 |
| Additional proposed dividends | 4,157,246 | 928,545 | 165,470 | - | - | - | 437,119 | - | - | 186,658 | 21,250 | 7,867,135 | (5,896,289) | 7,867,135 |
| Accumulated profit | 470,958 | 183,230 | 83,645 | (57,013) | (379,034) | (9,510) | (121,013) | 175,189 | 8,580 | 42,381 | 80,876 | 490,598 | (478,287) | 490,598 |
| Attributable to noncontrolling interests | - | - | - | - | - | - | - | - | - | - | - | - | 255,079 | 255,079 |
| TOTAL | 23,043,763 | 21,856,769 | 1,161,724 | 818,723 | 106,202 | 46,879 | 9,200,367 | 825,660 | 236,806 | 586,493 | 2,009,435 | 25,009,591 | (29,201,029) | 55,701,389 |
| |
| R$'000 | ||||||||||||||
| Liabilities - December-22 | Geração e Transmissão | Distribuição | Compagas | Elejor | UEG Araucária | Serviços | Wind Farms | FDA | Bela Vista | Costa Oeste, Marumbi, Uirapuru | Mercado Livre | Holding | Eliminations | Consolidated |
| CURRENT | 2,077,931 | 3,970,515 | 419,277 | 111,142 | 45,115 | 881 | 490,273 | 297,517 | 4,622 | 34,551 | 790,165 | 390,708 | (1,476,100) | 7,156,597 |
| Social charges and accruals | 77,637 | 154,982 | 9,892 | 352 | 646 | - | 51 | - | 37 | - | 2,587 | 6,605 | - | 252,789 |
| Associated companies and parent company | 5,897 | 8,962 | - | - | - | - | 62,831 | 913 | 241 | 299 | 378 | 1,838 | (81,359) | - |
| Suppliers | 312,042 | 1,447,967 | 97,759 | 3,320 | 5,955 | 76 | 41,489 | 23,378 | 1,357 | 883 | 460,957 | 5,373 | (310,534) | 2,090,022 |
| Income Tax and Social Contribution payable | - | - | 12,534 | - | - | - | 7,371 | 130,875 | 254 | 546 | 4,611 | - | - | 156,191 |
| Other taxes | 35,711 | 182,308 | 24,641 | 1,345 | 358 | 30 | 6,604 | 5,516 | 248 | 247 | 17,908 | 28,690 | - | 303,606 |
| Loans and financing | 173,609 | 6,203 | - | - | - | - | 91,293 | - | - | 7,733 | - | - | - | 278,838 |
| Debentures | 923,657 | 373,634 | - | - | - | - | 49,056 | - | - | - | - | - | - | 1,346,347 |
| Dividends payable | 372,899 | 265,574 | 267,149 | - | 38,156 | - | 86,592 | 125,978 | 1,788 | 24,519 | 39,626 | 344,251 | (1,084,207) | 482,325 |
| Post employment benefits | 18,795 | 51,978 | - | - | - | - | - | - | - | - | 84 | 2,957 | - | 73,814 |
| Customer charges due | 14,914 | 29,032 | - | - | - | - | - | 2,343 | - | 199 | - | - | - | 46,488 |
| Research and development and energy efficiency | 83,566 | 284,305 | - | 1,467 | - | - | - | 826 | - | 80 | - | - | - | 370,244 |
| Payables related to concession | 1,918 | - | - | 103,085 | - | - | - | - | - | - | - | - | - | 105,003 |
| Sectorial financial liabilities | - | 433,914 | - | - | - | - | - | - | - | - | - | - | - | 433,914 |
| Other accounts payable | 10,777 | 48,882 | 3,580 | 169 | - | 774 | 145 | - | - | - | 107 | 436 | - | 64,870 |
| Other bills to pay | 46,509 | 132,247 | 3,722 | 1,404 | - | 1 | 144,841 | 7,688 | 697 | 45 | 263,907 | 558 | - | 601,619 |
| PIS and Cofins to be refunded to consumers | - | 550,527 | - | - | - | - | - | - | - | - | - | - | - | 550,527 |
| NON-CURRENT | 6,889,354 | 9,958,028 | 107,306 | 771,897 | 16,322 | 13,431 | 2,174,205 | 78,093 | 3,108 | 52,623 | 600,024 | 867,473 | (115,986) | 21,415,878 |
| Associated companies and parent company | - | - | - | - | - | - | 189,888 | - | - | - | - | 5,851 | (195,739) | - |
| Suppliers | 125,448 | - | - | - | - | - | - | - | - | - | - | - | - | 125,448 |
| Deferred income tax and social contribution | 1,188,192 | - | 36,200 | - | - | - | 10,632 | 73,025 | 416 | 17,838 | 99,217 | - | 92,162 | 1,517,682 |
| Tax liabilities | 55,695 | 566,826 | - | - | 6,331 | 536 | - | - | - | - | 427 | 3,676 | - | 633,491 |
| Loans and financing | 2,215,315 | 751,805 | - | - | - | - | 1,378,697 | - | - | 25,708 | - | - | - | 4,371,525 |
| Debentures | 2,304,860 | 3,642,973 | - | - | - | - | 509,675 | - | - | - | - | - | - | 6,457,508 |
| Post-employment benefits | 300,979 | 657,867 | 9,294 | - | 901 | - | - | - | - | - | 3,292 | 23,890 | - | 996,223 |
| Research and development and energy efficiency | 5,983 | 223,805 | - | - | 7,698 | - | - | 5,068 | - | 1,960 | - | - | - | 244,514 |
| Payables related to the concession | 61,437 | - | - | 771,102 | - | - | - | - | - | - | - | - | - | 832,539 |
| Sectorial financial liabilities | - | 49,341 | - | - | - | - | - | - | - | - | - | - | - | 49,341 |
| Lease liability | 52,848 | 100,659 | 12,421 | 795 | - | 12,895 | 23,030 | - | - | - | 1,865 | 4,373 | - | 208,886 |
| Other payables | 46,169 | 16,006 | 33,223 | - | - | - | 54,340 | - | - | - | 494,641 | 25,241 | (24,386) | 645,234 |
| PIS/Cofins to be refunded to consumers | - | 1,444,631 | - | - | - | - | - | - | - | - | - | - | - | 1,444,631 |
| Provision for allocation of PIS and Cofins credits | - | 1,851,257 | - | - | - | - | - | - | - | - | - | - | - | 1,851,257 |
| Provisions for litigation | 532,428 | 652,858 | 16,168 | - | 1,392 | - | 7,943 | - | 2,692 | 7,117 | 582 | 804,442 | 11,977 | 2,037,599 |
| EQUITY | 12,790,068 | 6,610,272 | 557,130 | (34,841) | 272,981 | 8,634 | 4,896,941 | 563,169 | 229,652 | 504,086 | 418,782 | 20,817,364 | (26,503,013) | 21,131,225 |
| Attributable to controlling shareholders | 12,790,068 | 6,610,272 | 557,130 | (34,841) | 272,981 | 8,634 | 4,896,941 | 563,169 | 229,652 | 504,086 | 418,782 | 20,817,364 | (26,816,874) | 20,817,364 |
| Capital | 6,242,757 | 5,359,206 | 220,966 | 35,503 | 425,662 | 15,085 | 4,685,823 | 409,509 | 223,913 | 239,000 | 237,210 | 10,800,000 | (18,094,634) | 10,800,000 |
| Advance for Future Capital Increase | - | - | - | - | - | 1,600 | 1,460 | - | - | - | - | - | (3,060) | - |
| Capital reserves | - | - | - | - | - | - | - | - | - | - | - | - | - | - |
| Equity valuation adjustments | 586,054 | 15,777 | (363) | 7,050 | 137 | (1) | - | - | - | - | (1,113) | 593,382 | (607,541) | 593,382 |
| Legal Reserves | 877,479 | 306,744 | 44,193 | - | - | - | 34,835 | 46,488 | 376 | 24,970 | 22,794 | 1,512,687 | (1,357,879) | 1,512,687 |
| Profit retention reserve | 4,241,625 | 928,545 | 292,334 | - | - | - | 382,719 | - | - | 222,819 | 123,934 | 7,911,295 | (6,191,976) | 7,911,295 |
| Additional proposed dividends | 842,153 | - | - | - | - | - | 68,365 | 107,172 | 5,363 | 17,297 | 35,957 | - | (1,076,307) | - |
| Accumulated profit | - | - | - | (77,394) | (152,818) | (8,050) | (276,261) | - | - | - | - | - | 514,523 | - |
| Attributable to noncontrolling interests | - | - | - | - | - | - | - | - | - | - | - | 313,861 | 313,861 | |
| TOTAL | 21,757,353 | 20,538,815 | 1,083,713 | 848,198 | 334,418 | 22,946 | 7,561,419 | 938,779 | 237,382 | 591,260 | 1,808,971 | 22,075,545 | (28,095,099) | 49,703,700 |
| |
| Exhibit III -ENERGY MARKET> DISTRIBUTION MARKET |
| Copel’s Total Market | Number of Customers / Agreements | Energy Sold (GWh) | |||||||||
| Sep-23 | Sep-22 | ∆% | 3Q23 | 3Q22 | Δ% | 9M23 | 9M22 | Δ% | |||
| Copel DIS | 5,075,638 | 4,996,189 | 1.6% | 5,526 | 5,919 | -6.6% | 16,977 | 17,509 | -3.0% | ||
| Captive Market | 5,075,363 | 4,995,872 | 1.6% | 4,772 | 4,591 | 4.0% | 14,853 | 14,624 | 1.6% | ||
| Concessionaries and Licensees | 7 | 7 | - | 20 | 21 | -3.3% | 67 | 69 | -2.8% | ||
| CCEE (Assigments MCSD EN) | 268 | 288 | -6.9% | 75 | 54 | 38.7% | 172 | 159 | 7.8% | ||
| CCEE (MVE) | - | 22 | - | - | 177 | - | - | 524 | - | ||
| CCEE (MCP) 2 | - | - | - | 658 | 1,076 | -38.9% | 1,886 | 2,133 | -11.6% | ||
| Copel GeT | 352 | 280 | 25.7% | 4,501 | 4,256 | 5.8% | 12,513 | 12,893 | -3.0% | ||
| CCEAR (Copel DIS) | 3 | 3 | 0.0% | 29 | 31 | -3.5% | 91 | 91 | 0.1% | ||
| CCEAR (other concessionaries) | 118 | 101 | 16.8% | 1,741 | 547 | 218.2% | 3,189 | 1,649 | 93.4% | ||
| Free Customers | - | - | - | - | - | - | - | - | - | ||
| Bilateral Agreements (Copel Mercado Livre) | 227 | 172 | 32.0% | 2,694 | 3,328 | -19.0% | 9,125 | 10,441 | -12.6% | ||
| Bilateral Agreements 1 | 4 | 4 | - | 36 | 37 | -1.3% | 108 | 109 | -0.6% | ||
| CCEE (MCP) 2 | - | - | - | - | 313 | - | - | 604 | - | ||
| Wind Farms Complex | 600 | 397 | 51.1% | 1,206 | 849 | 42.0% | 3,322 | 2,265 | 46.7% | ||
| 15 | 6 | 150.0% | 31 | 8 | 287.5% | 85 | 23 | 269.6% | |||
| CCEAR (other concessionaries) | 546 | 334 | 63.5% | 577 | 325 | 77.5% | 1,623 | 964 | 68.4% | ||
| CER | 10 | 10 | - | 231 | 231 | - | 684 | 684 | - | ||
| Bilateral Agreements (Copel Mercado Livre) | 13 | 38 | -65.8% | 180 | 91 | 97.8% | 450 | 234 | 92.3% | ||
| Bilateral Agreements | 16 | 9 | 77.8% | 187 | 139 | 34.5% | 448 | 335 | 33.7% | ||
| CCEE (MCP) 2 | - | - | - | - | 55 | - | 32 | 25 | 28.0% | ||
| Copel Mercado Livre | 1,753 | 1,677 | 4.5% | 5,526 | 6,451 | -14.3% | 16,724 | 18,607 | -10.1% | ||
| Free Customers | 1,620 | 1,482 | 9.3% | 3,014 | 2,934 | 2.7% | 8,862 | 8,696 | 1.9% | ||
| Bilateral Agreements (Group Companies) | 24 | 26 | -7.7% | 330 | 625 | -47.2% | 398 | 899 | -55.7% | ||
| Bilateral Agreements | 109 | 169 | -35.5% | 2,182 | 2,854 | -23.5% | 7,221 | 8,898 | -18.8% | ||
| CCEE (MCP) 2 | - | - | - | - | 38 | - | 243 | 114 | 113.2% | ||
| Total Copel | 5,078,343 | 4,998,543 | 1.6% | 16,759 | 17,475 | -4.1% | 49,535 | 51,275 | -3.4% | ||
| Eliminations (operations with Group companies) | 3,264 | 4,083 | -20.1% | 10,251 | 11,690 | -12.3% | |||||
| Total Consolidated Copel | 13,495 | 13,392 | 0.8% | 39,284 | 39,585 | -0.8% | |||||
| Note: Not considering the energy from MRE (Energy Relocation Mechanism) and the energy from TPP Araucária sold in the CCEE Spot Market. 1 Includes Short Term Sales Agreements and CBR 2 Assured Power allocated in the period, after impact of the GSF. CCEE: Electric Power Trade Chamber / CCEAR: Energy Purchase Agreements in the Regulated Market / MCP: Short Term Market / CER: Agreements Reserve Energy / MCSD EN - Mechanism for Compensation of Surpluses and Deficits of New Energy / MVE - MVE - Sale of energy to the free market through the Surplus Selling Mechanism. | |||||||||||
| Copel’s Dis Market | Number of Customers | Consumed Energy (GWh) | |||||||||
| Sep-23 | Sep-22 | ∆% | 3Q23 | 3Q22 | Δ% | 9M23 | 9M22 | Δ% | |||
| Residential | 4,190,534 | 4,108,640 | 2.0 | 2,119 | 1,948 | 8.8 | 6,488 | 6,157 | 5.4 | ||
| Industrial | 69,318 | 70,220 | (1.3) | 3,102 | 3,118 | (0.5) | 9,194 | 9,202 | (0.1) | ||
| Captive | 68,090 | 69,149 | (1.5) | 490 | 543 | (9.7) | 1,464 | 1,595 | (8.2) | ||
| Free | 1,228 | 1,071 | 14.7 | 2,612 | 2,575 | 1.4 | 7,731 | 7,607 | 1.6 | ||
| Commercial | 438,443 | 429,040 | 2.2 | 1,573 | 1,489 | 5.7 | 4,947 | 4,737 | 4.4 | ||
| Captive | 436,796 | 427,641 | 2.1 | 1,041 | 996 | 4.6 | 3,317 | 3,246 | 2.2 | ||
| Free | 1,647 | 1,399 | 17.7 | 532 | 493 | 7.8 | 1,630 | 1,492 | 9.3 | ||
| Rural | 325,182 | 334,480 | (2.8) | 570 | 551 | 3.4 | 1,874 | 1,916 | (2.2) | ||
| Captive | 325,111 | 334,433 | (2.8) | 530 | 519 | 2.2 | 1,754 | 1,821 | (3.7) | ||
| Free | 71 | 47 | 51.1 | 40 | 32 | 23.0 | 120 | 95 | 26.5 | ||
| Others | 54,844 | 53,485 | 2.5 | 593 | 587 | 1.0 | 1,836 | 1,810 | 1.4 | ||
| Captive | 54,832 | 53,473 | 2.5 | 591 | 585 | 1.0 | 1,830 | 1,805 | 1.4 | ||
| Free | 12 | 12 | - | 2 | 2 | - | 5 | 5 | - | ||
| Total Captive Market | 5,075,363 | 4,993,336 | 1.6 | 4,772 | 4,591 | 4.0 | 14,853 | 14,624 | 1.6 | ||
| Total Free Market | 2,958 | 2,529 | 17.0 | 3,185 | 3,102 | 2.7 | 9,486 | 9,198 | 3.1 | ||
| Supply to Concessionaries | 7 | 7 | - | 238 | 230 | 3.4 | 698 | 700 | (0.3) | ||
| Total Grid Market | 5,078,328 | 4,995,872 | 1.7 | 8,195 | 7,923 | 3.4 | 25,036 | 24,522 | 2.1 | ||
| Micro and Mini Distributed Energy Generation | 293,245 | 183,893 | 59.5 | (428) | (233) | 83.7 | (1,280) | (751) | 70.4 | ||
| Total Billed Market | 7,767 | 7,690 | 1.0 | 23,756 | 23,771 | (0.1) | |||||
| |
| Exhibit III -ENERGY MARKET> ELECTRICITY PURCHASED AND CHARGES |
| R$'000 | ||||||
| Electricity Purchased for Resale | 3Q23 | 3Q22 | Δ% | 9M23 | 9M22 | Δ% |
| Purchase of energy in the regulated party - CCEAR | 901,620 | 916,205 | (1.6) | 2,733,586 | 2,620,554 | 4.3 |
| Itaipu Binacional | 262,672 | 378,077 | (30.5) | 727,924 | 1,092,451 | (33.4) |
| Câmara de Comercialização de Energia - CCEE | 126,710 | 135,902 | (6.8) | 351,525 | 302,469 | 16.2 |
| Micro and mini generators and customer repurchase | 280,518 | 153,676 | 82.5 | 779,695 | 477,941 | 63.1 |
| Proinfa | 93,256 | 108,635 | (14.2) | 276,732 | 330,146 | (16.2) |
| Bilateral Agreements | 540,684 | 755,703 | (28.5) | 1,451,261 | 1,939,807 | (25.2) |
| Fair value in the purchase and sale of energy | 6,347 | (13,254) | - | 6,347 | 4,139 | 53.3 |
| (-) PIS/Pasep and Cofins | (216,248) | (268,728) | (19.5) | (632,944) | (743,384) | (14.9) |
| TOTAL | 1,995,559 | 2,166,216 | (7.9) | 5,694,126 | 6,024,123 | (5.5) |
| R$'000 | ||||||
| Charges of the main distribution and transmission grid | 3Q23 | 3Q22 | Δ% | 9M23 | 9M22 | Δ% |
| Itaipu transportation charges | 57,786 | 42,021 | 37.5 | 133,755 | 109,629 | 22.0 |
| System Service Charges - ESS | 28,760 | (2,759) | - | 40,795 | 338,994 | (88.0) |
| System usage charges | 653,420 | 563,572 | 15.9 | 1,825,493 | 1,446,319 | 26.2 |
| Charge reserve energy - EER | 95,034 | 70,130 | 35.5 | 347,788 | 199,596 | 74.2 |
| System usage charges - Provisions | 155 | 587 | (73.6) | 11,680 | 2,105 | 455.0 |
| (-) PIS / Pasep and Cofins taxes on charges for use of power grid | (86,962) | (70,004) | 24.2 | (241,021) | (214,680) | 12.3 |
| TOTAL | 748,193 | 603,547 | 24.0 | 2,118,489 | 1,881,962 | 12.6 |
| |
| Exhibit III -ENERGY MARKET> ENERGY BALANCE |
| (average MW) | |||||
| Energy Balance - Copel GET - sep-23 | 2023 | 2024 | 2025 | 2026 | 2027 |
| Own Resources GeT | 2,111 | 2,114 | 2,116 | 2,116 | 2,102 |
| GeT | 1,498 | 1,491 | 1,491 | 1,491 | 1,470 |
| GPS + Bela Vista + FDA | 613 | 623 | 625 | 625 | 632 |
| Own Resources SPP and Wind Farm | 544 | 544 | 544 | 544 | 544 |
| Purchases | 75 | 42 | 23 | - | - |
| TOTAL OWN RESOURCES + SOLD | 2,730 | 2,700 | 2,683 | 2,660 | 2,646 |
| TOTAL SOLD | 2,451 | 2,134 | 2,024 | 1,568 | 1,376 |
| Sales (Regulated) | 884 | 766 | 781 | 781 | 781 |
| Sales (Regulated) % | 32% | 29% | 29% | 29% | 30% |
| Sales (Free Market) | 1,567 | 1,368 | 1,243 | 787 | 595 |
| Sales (Free Market) % | 57% | 51% | 46% | 30% | 22% |
| Total Available | 280 | 565 | 659 | 1092 | 1271 |
| Total Available (%) | 11% | 20% | 25% | 41% | 48% |
| Avarege price of energy sold (R$) | 204.51 | 179.96 | 170.40 | 177.23 | 182.12 |
| Reference: September/23 | |||||
| Note: Considers Assured Power updated by Ordinance No. 709/2022 for: FDA, Segredo and Salto Caxias. | |||||
| (1) Includes Mauá and Baixo Iguaçu Power Plants (proportional to the stake in the project) and GPS 30% (ex-CCGF). Does not include Elejor and Foz do Chopim. | |||||
| (2) Does not include Voltália Wind Complex. | |||||
| |
| Exhibit III -ENERGY MARKET> TARIFFS |
| Supply Tariff (R$/MWh) | Amount | sep-23 | Sep-22 | Δ% |
| Average MW | ||||
| Copel Geração e Transmissão | 734 | 251.10 | 236.75 | 6.1 |
| Auction CCEAR 2011 - 2040 ( HPP Mauá) | 93 | 287.48 | 274.98 | 4.5 |
| Auction CCEAR 2013 - 2042 (Cavernoso II) | 7 | 308.79 | 294.29 | 4.9 |
| Auction - CCEAR 2015 - 2044 (HPP Colíder) | 120 | 218.79 | 208.96 | 4.7 |
| Auction - CCAR 2018 - 2048 (HPP Baixo Iguaçu) | 36 | 226.92 | 215.82 | 5.1 |
| Auction - CCAR 2009 - 2016 (HPP Salto Caxias)* | 478 | 252.99 | - | |
| Copel Distribuição | ||||
| Concession holders in the State of Paraná | 13 | 273.04 | 262.70 | 3.9 |
| Total / Tariff Weighted Average Supply | 747 | 251.30 | 236.75 | 6.1 |
| Contains PIS and COFINS. Net of ICMS. | ||||
| *Supply contract from May/2023. | ||||
| Purchase Tariff - Copel Distribuição (R$/MWh) | Amount | sep-23 | Sep-22 | Δ% |
| Average MW | ||||
| Itaipu 1 | 516.4 | 241.31 | 305.44 | (21.0) |
| Auction – CCEAR 2010 – H30 | 68.9 | 299.44 | 291.12 | 2.9 |
| Auction – CCEAR 2010 – T15 2 | 60.1 | 199.39 | 191.68 | 4.0 |
| Auction – CCEAR 2011 – H30 | 56.8 | 308.73 | 298.96 | 3.3 |
| Auction – CCEAR 2011 – T15 2 | 54.2 | 259.42 | 245.74 | 5.6 |
| Auction – CCEAR 2012 – T15 2 | 107.5 | 177.61 | 166.78 | 6.5 |
| Auction – CCEAR 2016 – T20 2 | 26.6 | 228.49 | 207.90 | 9.9 |
| Angra | 99.5 | 348.35 | 346.59 | 0.5 |
| CCGF 3 | 514.0 | 162.73 | 137.49 | 18.4 |
| Santo Antônio | 135.8 | 191.60 | 185.53 | 3.3 |
| Jirau | 225.9 | 168.58 | 163.25 | 3.3 |
| Others Auctions 4 | 749.6 | 209.35 | 225.66 | (7.2) |
| Total / Average Purchuse Tariff | 2,615.1 | 211.57 | 218.37 | (3.1) |
| Contains PIS and COFINS | ||||
| 1 Furnas transport charge not included. | ||||
| 2 Average auction price restated according as bilateral payment to vendors. It does not include hiring effects recorded by the CCEE. | ||||
| 3 Contract of quotas of assured power of those HPPs which concessions were extended pursuant the new rules of Law 12783/13. | ||||
| 4 Products average price, does not include PROINFA. | ||||
| *The table has been updated for all periods as new calculation methodology for average prices, a result of the 4th phase of the Public Hearing 78/2011 Aneel approved on 03.28.2016. | ||||
| Retail Tariff - Copel Distribuição (R$/MWh) | sep-23 | Sep-22 | Δ% | |
| Industrial | 560.61 | 538.84 | 4.0 | |
| Residential | 558.28 | 562.97 | (0.8) | |
| Commercial | 634.07 | 671.06 | (5.5) | |
| Rural | 608.38 | 664.56 | (8.5) | |
| Other | 456.41 | 407.75 | 11.9 | |
| Retail Tariff supply average tariff | 623.45 | 627.28 | (0.6) | |
| Demand average tariff (R$/kW) | 37.86 | 29.78 | 27.1 | |
| Does not consider tariff flags, Pis/Pasep and net of ICMS. | ||||
| |
| Exhibit III -ENERGY MARKET> WIND POWER PRICES |
| Wind Farms - Sold | Auction ¹ | Price (R$)² | Amount MW average/year | Start of Supply | End of Supply |
| São Bento Energia, Invest. e Part. S.A. | |||||
| GE Boa Vista S.A. | 2º LFA (08/26/2010) | 297.21 | 5.70 | 01.01.2013 | 12.31.2032 |
| GE Farol S.A. | 288.55 | 9.10 | |||
| GE Olho D’Água S.A. | 288.55 | 14.90 | |||
| GE São Bento do Norte S.A. | 288.55 | 14.00 | |||
| Copel Brisa Potiguar S.A. | |||||
| Nova Asa Branca I Energias Renováveis S.A. | 2º LFA (08/26/2010) | 291.63 | 13.20 | 01.01.2013 | 12.31.2032 |
| Nova Asa Branca II Energias Renováveis S.A. | 291.63 | 12.80 | |||
| Nova Asa Branca III Energias Renováveis S.A. | 291.63 | 12.50 | |||
| Nova Eurus IV Energias Renováveis S.A. | 291.63 | 13.70 | |||
| Santa Maria Energias Renováveis S.A. | 4º LER (08/18/2011) | 205.52 | 15.70 | 07.01.2014 | 06.30.2034 |
| Santa Helena Energias Renováveis S.A. | 205.52 | 16.00 | |||
| Ventos de Santo Uriel S.A. | 203.93 | 9.00 | |||
| Cutia | |||||
| UEE Cutia S.A. | 6º LER (10/31/2014) | 241.75 | 9.60 | 10.01.2017 | 09.30.2037 |
| UEE Esperança do Nordeste S.A. | 241.75 | 9.10 | |||
| UEE Guajiru S.A. | 241.75 | 8.30 | |||
| UEE Jangada S.A. | 241.75 | 10.30 | |||
| UEE Maria Helena S.A. | 241.75 | 12.00 | |||
| UEE Paraíso dos Ventos do Nordeste S.A. | 241.75 | 10.60 | |||
| UEE Potiguar S.A. | 241.75 | 11.30 | |||
| Bento Miguel | |||||
| CGE São Bento do Norte I S.A. | 20ª LEN (11/28/2014) | 228.99 | 9.70 | 01.01.2019 | 12.31.2038 |
| CGE São Bento do Norte II S.A. | 228.99 | 10.00 | |||
| CGE São Bento do Norte III S.A. | 228.99 | 9.60 | |||
| CGE São Miguel I S.A. | 228.99 | 8.70 | |||
| CGE São Miguel II S.A. | 228.99 | 8.40 | |||
| CGE São Miguel III S.A. | 228.99 | 8.40 | |||
| Vilas | |||||
| Vila Ceará I (Antiga Vila Paraíba IV) | 28ª LEN (08/31/2018) | 123.13 | 8.20 | 01.01.2024 | 12.31.2043 |
| Vila Maranhão I | 123.13 | 8.30 | |||
| Vila Maranhão II | 123.13 | 8.30 | |||
| Vila Maranhão III (Antiga Vila Paraíba III) | 123.13 | 8.20 | |||
| Vila Mato Grosso (Antiga Vila Alagoas III) | 29ª LEN (06/28/2019) | 102.71 | 3.30 | 01.01.2023 | 12.31.2042 |
| Jandaira | |||||
| Jandaira I | 30ª LEN (10/18/2019) | 125.61 | 1.60 | 01.01.2025 | 12.31.2044 |
| Jandaira II | 125.61 | 4.10 | |||
| Jandaira III | 125.61 | 4.40 | |||
| Jandaira IV | 125.61 | 4.30 | |||
| Aventura | |||||
| Aventura II | 26º LEN (20/12/2017) | 132.78 | 11.70 | 01.01.2023 | 12.31.2042 |
| Aventura III | 132.78 | 12.80 | |||
| Aventura IV | 132.78 | 14.10 | |||
| Aventura V | 132.78 | 15.00 | |||
| Santa Rosa & Mundo Novo | |||||
| Santa Rosa & Mundo Novo I | 26º LEN (20/12/2017) | 135.52 | 16.50 | 01.01.2023 | 12.31.2042 |
| Santa Rosa & Mundo Novo II | 135.52 | 17.00 | |||
| Santa Rosa & Mundo Novo III | 135.52 | 18.00 | |||
| Santa Rosa & Mundo Novo IV | 135.52 | 7.50 | |||
| Santa Rosa & Mundo Novo V | 135.52 | 8.10 | |||
| Voltália3 | |||||
| Carnaúbas | 04ª LER (08/18/2011) | 199.36 | 13.10 | 07.01.2014 | 06.30.2034 |
| Reduto | 199.36 | 13.90 | |||
| Santo Cristo | 199.36 | 14.80 | |||
| São João | 199.36 | 14.30 | |||
| ¹LFA - Alternative Sources Auction/LER - Reserve Energy Auction/LEN - New Energy Auction. | |||||
| ² Price updated by IPCA until set/2023 (Reference out/23). Source: CCEE | |||||
| 3 Values presented refer to 100% of the Complex. Copel has a 49% stake in the project. | |||||
| |
| Exhibit III -ENERGY MARKET> ENERGY FLOW |
| GWh | ||||||||||||
| Energy Flow | COPEL DIS | COPEL GET + FDA + BELA VISTA | WIND POWER | COPEL COM | ELIMINATIONS | CONSOLIDATED | ||||||
| 3Q23 | 3Q22 | 3Q23 | 3Q22 | 3Q23 | 3Q22 | 3Q23 | 3Q22 | 3Q23 | 3Q22 | 3Q23 | 3Q22 | |
| Own Generation | 5,724 | 6,427 | 1,225 | 969 | 6,949 | 7,396 | ||||||
| Purchased energy | 5,939 | 6,394 | 453 | 741 | 21 | - | 5,526 | 6,451 | 3,264 | 4,083 | 8,675 | 9,503 |
| Copel Mercado Livre | 330 | 625 | - | - | 330 | 625 | - | - | ||||
| Companies of the group | 60 | 39 | - | 2,874 | 3,419 | 2,934 | 3,458 | - | - | |||
| Itaipu | 1,200 | 1,329 | - | 1,200 | 1,329 | |||||||
| Auction – CCEAR | 3,233 | 3,100 | - | 3,233 | 3,100 | |||||||
| CCEE (MCP) | - | - | - | - �� | 85 | 85 | - | |||||
| Angra | 220 | 234 | 220 | 234 | ||||||||
| CCGF | 1,101 | 1,476 | 1,101 | 1,476 | ||||||||
| Proinfa | 110 | 118 | 110 | 118 | ||||||||
| Other (1) | 15 | 98 | 21 | - | 2,555 | 3,032 | 2,591 | 3,130 | ||||
| Elejor | 12 | - | 12 | - | ||||||||
| Dona Francisca | 34 | 34 | 34 | 34 | ||||||||
| MRE Receipt | 89 | 82 | 89 | 82 | ||||||||
| Avaiable | 5,939 | 6,394 | 6,177 | 7,168 | 1,246 | 969 | 5,526 | 6,451 | 3,264 | 4,083 | 15,624 | 16,898 |
| Captive Market | 4,772 | 4,591 | 4,772 | 4,591 | ||||||||
| Concessionaires (2) | 20 | 21 | 20 | 21 | ||||||||
| CCEE concessionaire supply (3) | 36 | 36 | 36 | 36 | ||||||||
| CCEE (MCSD EN Assignments) (4) | 75 | 54 | 75 | 54 | ||||||||
| CCEE (MVE) (5) | - | 177 | - | 177 | ||||||||
| CCEE (MCP) (6) | 658 | 1,076 | -573 | 313 | -56 | 55 | - | 38 | 29 | 1,482 | ||
| Free Customers | - | - | 3,014 | 2,934 | 3,014 | 2,934 | ||||||
| Bilateral Agreements | - | - | 187 | 139 | 2,182 | 2,854 | 2,369 | 2,993 | ||||
| Auction – CCEAR (7) | 1,741 | 547 | 577 | 325 | 2,318 | 872 | ||||||
| MRE assignment (8) | 2,250 | 2,913 | 2,250 | 2,913 | ||||||||
| CER (9) | 231 | 231 | 231 | 231 | ||||||||
| Copel Mercado Livre | 2,694 | 3,328 | 180 | 91 | 2,874 | 3,419 | - | - | ||||
| Companies of the group | 29 | 31 | 31 | 8 | 330 | 625 | 390 | 664 | - | - | ||
| Losses and Differences (10) | 414 | 474 | 96 | 120 | 510 | 594 | ||||||
| |
| Energy Flow | COPEL DIS | COPEL GET + FDA + BELA VISTA | WIND POWER | COPEL COM | ELIMINATIONS | CONSOLIDATED | ||||||
| 9M23 | 9M22 | 9M23 | 9M22 | 9M23 | 9M22 | 9M23 | 9M22 | 9M23 | 9M22 | 9M23 | 9M22 | |
| Own Generation | - | - | 14,850 | 14,957 | 2,860 | 1,898 | 0 | - | - | - | 17,710 | 16,855 |
| Purchased energy | 17,950 | 18,988 | 897 | 2,694 | 127 | 108 | 16,724 | 18,608 | 10,251 | 11,690 | 25,447 | 28,708 |
| Copel Mercado Livre | - | - | 398 | 899 | 106 | - | - | - | 504 | 899 | - | - |
| Companies of the group | 173 | 116 | - | - | - | - | 9,574 | 10,675 | 9,747 | 10,791 | - | - |
| Itaipu | 3,561 | 3,943 | - | - | - | - | - | - | - | - | 3,561 | 3,943 |
| Auction – CCEAR | 9,790 | 9,224 | - | - | - | - | - | - | - | - | 9,790 | 9,224 |
| CCEE (MCP) | - | - | 296 | 63 | - | - | 85 | 12 | - | - | 381 | 75 |
| Angra | 652 | 694 | - | - | - | - | - | - | - | - | 652 | 694 |
| CCGF | 3,409 | 4,396 | - | - | - | - | - | - | - | - | 3,409 | 4,396 |
| Proinfa | 314 | 322 | - | - | - | - | - | - | - | - | 314 | 322 |
| Other (1) | 51 | 293 | - | - | 21 | 108 | 7,033 | 7,921 | - | - | 7,105 | 8,322 |
| Elejor | - | - | - | - | - | - | 32 | - | - | - | 32 | - |
| Dona Francisca | - | - | 100 | 100 | - | - | - | - | - | - | 100 | 100 |
| MRE Receipt | - | - | 103 | 1,632 | - | - | - | - | - | - | 103 | 1,632 |
| Avaiable | 17,950 | 18,988 | 15,747 | 17,651 | 2,987 | 2,006 | 16,724 | 18,608 | 10,251 | 11,690 | 43,157 | 45,562 |
| Captive Market | 14,852 | 14,624 | - | - | - | - | - | - | - | - | 14,852 | 14,624 |
| Concessionaires (2) | 66 | 69 | - | - | - | - | - | - | - | - | 66 | 69 |
| CCEE concessionaire supply (3) | - | - | 121 | 114 | - | - | - | - | - | - | 121 | 114 |
| CCEE (MCSD EN Assignments) (4) | 172 | 159 | - | - | - | - | - | - | - | - | 172 | 159 |
| CCEE (MVE) (5) | - | 525 | - | - | - | - | - | - | - | - | - | 525 |
| CCEE (MCP) (6) | 1,887 | 2,133 | -191 | 605 | -7 | 88 | 243 | 115 | - | - | 1,932 | 2,941 |
| Free Customers | - | - | - | - | - | - | 8,862 | 8,696 | - | - | 8,862 | 8,696 |
| Bilateral Agreements | - | - | 106 | 108 | 449 | 334 | 7,115 | 8,898 | - | - | 7,670 | 9,340 |
| Auction – CCEAR (7) | - | - | 3,189 | 1,649 | 1,626 | 964 | - | - | - | - | 4,815 | 2,613 |
| MRE assignment (8) | - | - | 3,307 | 4,642 | - | - | - | - | - | - | 3,307 | 4,642 |
| CER (9) | - | - | - | - | 685 | 685 | - | - | - | - | 685 | 685 |
| Copel Mercado Livre | - | - | 9,124 | 10,441 | 450 | 234 | - | - | 9,574 | 10,675 | - | - |
| Companies of the group | - | - | 91 | 92 | 82 | 24 | 504 | 899 | 677 | 1,015 | - | - |
| Losses and Differences (10) | 973 | 1,476 | - | - | -298 | -323 | - | - | - | - | 675 | 1,154 |
| (1) Others: Energy purchased by Copel Comercialização. Includes MCSD EM Assignments of Copel Distribuição (purchase) | ||||||||||||
| (2) Energy supply to concessionaires and licensees with their own market below 500GWh/year | ||||||||||||
| (3) Supply of energy to CCEE's agent distributor, through a Regulated Bilateral Contract Agreement - CBR | ||||||||||||
| (4) Assignments MCSD EN - Contractual assignments to other distributors through the New Energy Surplus and Deficit Compensation Mechanism | ||||||||||||
| (5) CCEE (MVE): Financial settlement of energy surpluses from the distributor to the free market through the Surplus Sale Mechanism | ||||||||||||
| (6) CCEE (MCP): Electric Energy Commercialization Chamber (Spot Market). | ||||||||||||
| (7) CCEAR: Energy Trading Agreement in the Regulated Environment. | ||||||||||||
| (8) MRE: Energy Reallocation Mechanism. | ||||||||||||
| (9) CER: Reserve Energy Contract. | ||||||||||||
| (10) Considers the effects of Mini and Micro Distributed Generation (MMGD). | ||||||||||||
| (11) CG: Submarket Center of Gravity (difference between billed and received energy at the CG). | ||||||||||||
| It does not consider the energy produced by UTE Araucária sold on the spot market (MCP). | ||||||||||||
| |
| Exhibit III -ENERGY MARKET> ENERGY FLOW |

| |
| Exhibit IV -OPERATIONAL DATA> INDICATORS SUMMARY |
| MANAGEMENT | ||||||
| Copel Staff List | 2018 | 2019 | 2020 | 2021 | 2022 | Sep-23 |
| Geração e Transmissão | 1,660 | 1,620 | 1,533 | 1,523 | 1,487 | 1,482 |
| Distribuição | 5,364 | 4,964 | 4,641 | 4,430 | 4,257 | 4,224 |
| Telecomunicações | 478 | 412 | 355 | 0 | 0 | 0 |
| Holding | 75 | 61 | 96 | 169 | 84 | 83 |
| Comercialização | 34 | 38 | 42 | 44 | 47 | 41 |
| Serviços | - | - | - | 217 | - | - |
| TOTAL | 7,611 | 7,095 | 6,667 | 6,383 | 5,875 | 5,830 |
| Cotrolated Staff List | 2018 | 2019 | 2020 | 2021 | 2022 | Sep-23 |
| Compagás | 159 | 148 | 142 | 133 | 132 | 129 |
| UEG Araucária | 17 | 16 | 17 | 15 | 15 | 14 |
| Elejor | 7 | 7 | 7 | 7 | 7 | 7 |
| GENERATION | ||||||
| Copel GET | Amount | Installed Capacity (MW) | Assured Power (Average MW) | |||
| Hydroelectric | 18 | 4,868.5 | 2,067.9 | |||
| Thermoelectric | 1 | 20.0 | 17.7 | |||
| Wind | 43 | 1,130.2 | 561.3 | |||
| Copel GET (Interest) | Proportional installed capacity (MW) | Proporcional Assured Power (Average MW) | ||||
| Hydroelectric | 3 | 299.6 | 155.2 | |||
| Thermoelectric | 1 | 294.8 | 162.6 | |||
| Total Copel GET | 66 | 6,613.1 | 2,964.7 | |||
| Other Interest Copel | Proportional installed capacity (MW) | Proporcional Assured Power (Average MW) | ||||
| Hydroelectric | 5 | 201.3 | 109.7 | |||
| Thermoelectric | 1 | 98.3 | 54.2 | |||
| Wind | 4 | 52.9 | 28.0 | |||
| Solar | 1 | 1.1 | - | |||
| Total Other Interest | 11 | 353.6 | 191.9 | |||
| TOTAL Copel Group | 77.0 | 6,966.7 | 3,156.6 | |||
| TRANSMISSION | ||||||
| Copel GeT | Amount | APR (R$ million) | ||||
| Transmission Lines (km) | 3,705 | 1,106.4 | ||||
| Substation (amount) | 43 | |||||
| Interest | Amount | Proporcional APR (R$ million) | ||||
| Transmission Lines (km) | 5,980 | 512.6 | ||||
| Substation (amount) | 8 | |||||
| TOTAL | TL | 9,685 | 1,619.0 | |||
| Substation | 51 | |||||
| DISTRIBUTION | ||||||
| Distribution lines (km) | 208,133 | Captive customers | 5,075,363 | |||
| Substations | 389 | Customers by distribution employee | 1,202 | |||
| Installed power substations (MVA) | 11,815 | DEC (in hundredths of an hour and minute) | 7.97 | |||
| Municipalities served | 395 | FEC (number of outages) | 5.41 | |||
| Locations served | 1,068 | |||||
| MERCADO LIVRE | ||||||
| Number of contracts | 1,753 | |||||
| Energy sold (GWh) | 5,526 | |||||
| |
| Exhibit IV -OPERATIONAL DATA> GENERATION |
| COPEL GET | ||||
| Installed Capacity (MW) | Assured Power (Average MW) | Generation 9M23 (GWh)* | Concession Expires | |
| Hydroelectric Power Plants | 4,868.5 | 2,067.9 | 14,289.3 | |
| Large hydroelectric power plant (HPP) | 4,772.0 | 2,006.8 | 13,926.0 | |
| Gov. Bento Munhoz da Rocha Netto (Foz do Areia)(5) | 1,676.0 | 575.3 | 4,109.6 | 12.21.2024 |
| Gov. Ney Aminthas de B. Braga (Segredo)(5) | 1,260.0 | 558.3 | 3,986.6 | 09.25.2032 |
| Gov. José Richa (Salto Caxias)(5) | 1,240.0 | 575.4 | 3,995.1 | 03.20.2033 |
| Gov. Parigot de Souza (1)(5) | 260.0 | 103.6 | 757.2 | 01.03.2053 |
| - Regime de Cotas (70%) | 182.0 | 72.5 | 530.0 | |
| - Copel GeT(30%) | 78.0 | 31.1 | 227.2 | |
| Colíder(5) | 300.0 | 178.1 | 959.3 | 01.30.2046 |
| Guaricana(5) | 36.0 | 16.1 | 118.2 | 07.21.2028 |
| Small hydroelectric power station (SHP) | 86.9 | 55.9 | 335.8 | |
| Bela Vista(2) | 29.8 | 18.6 | 102.0 | 01.02.2041 |
| Cavernoso (5) | 1.3 | 1.0 | 0.9 | 06.23.2033 |
| Cavernoso II(5) | 19.0 | 10.6 | 70.0 | 12.06.2050 |
| Chaminé (5) | 18.0 | 11.6 | 70.5 | 08.02.2028 |
| Apucaraninha (5) | 10.0 | 6.7 | 45.4 | 01.27.2027 |
| Derivação do Rio Jordão (5) | 6.5 | 5.9 | 36.0 | 06.21.2032 |
| São Jorge (5) | 2.3 | 1.5 | 11.0 | 07.24.2026 |
| hydroelectric power plant (HPP) | 9.6 | 5.2 | 27.5 | |
| Marumbi | 4.8 | 2.4 | 15.9 | (6) |
| Chopim I | 2.0 | 1.5 | 0.5 | (3) |
| Melissa | 1.0 | 0.6 | 4.2 | (3) |
| Salto do Vau | 0.9 | 0.6 | 4.5 | (3) |
| Pitangui | 0.9 | 0.1 | 2.5 | (3) |
| Thermal Power Plant | 20.0 | 17.7 | 40.1 | |
| Figueira | 20.0 | 17.7 | 40.1 | 03.27.2019 |
| Wind Power Plants | 1,130.2 | 561.3 | 2,963.0 | |
| Eólica de Palmas (4) | 2.5 | 0.4 | 1.7 | 09.29.2029 |
| São Bento Energia, Invest. e Part. S.A. | 94.0 | 38.1 | 202.8 | |
| GE Boa Vista S.A. | 14.0 | 5.2 | 24.7 | 04.28.2046 |
| GE Farol S.A. | 20.0 | 8.8 | 43.6 | 04.20.2046 |
| GE Olho D’Água S.A. | 30.0 | 12.8 | 69.7 | 06.01.2046 |
| GE São Bento do Norte S.A. | 30.0 | 11.3 | 64.8 | 05.19.2046 |
| Copel Brisa Potiguar S.A. | 183.6 | 89.4 | 423.7 | |
| Nova Asa Branca I Energias Renováveis S.A. | 27.0 | 12.1 | 58.5 | 04.25.2046 |
| Nova Asa Branca II Energias Renováveis S.A. | 27.0 | 11.9 | 57.8 | 05.31.2046 |
| Nova Asa Branca III Energias Renováveis S.A. | 27.0 | 12.3 | 49.6 | 05.31.2046 |
| Nova Eurus IV Energias Renováveis S.A. | 27.0 | 12.4 | 63.3 | 04.27.2046 |
| Santa Maria Energias Renováveis S.A. | 29.7 | 15.7 | 73.9 | 05.08.2047 |
| Santa Helena Energias Renováveis S.A. | 29.7 | 16.0 | 78.1 | 04.09.2047 |
| Ventos de Santo Uriel S.A. | 16.2 | 9.0 | 42.4 | 04.09.2047 |
| Complexo Eólico Cutia | 180.6 | 71.4 | 423.4 | |
| UEE Cutia S.A. | 23.1 | 9.6 | 59.8 | 01.05.2042 |
| UEE Esperança do Nordeste S.A. | 27.3 | 9.1 | 49.8 | 05.11.2050 |
| UEE Guajiru S.A. | 21.0 | 8.3 | 46.6 | 01.05.2042 |
| UEE Jangada S.A. | 27.3 | 10.3 | 68.2 | 01.05.2042 |
| UEE Maria Helena S.A. | 27.3 | 12.0 | 68.3 | 01.05.2042 |
| UEE Paraíso dos Ventos do Nordeste S.A. | 27.3 | 10.6 | 65.7 | 05.11.2050 |
| UEE Potiguar S.A. | 27.3 | 11.5 | 65.0 | 05.11.2050 |
| Complexo Eólico Bento Miguel | 132.3 | 58.7 | 310.0 | |
| CGE São Bento do Norte I S.A. | 23.1 | 10.1 | 58.0 | 08.04.2050 |
| CGE São Bento do Norte II S.A. | 23.1 | 10.8 | 62.6 | 08.04.2050 |
| CGE São Bento do Norte III S.A. | 23.1 | 10.2 | 50.7 | 08.04.2050 |
| CGE São Miguel I S.A. | 21.0 | 9.3 | 47.1 | 08.04.2050 |
| CGE São Miguel II S.A. | 21.0 | 9.1 | 45.8 | 08.04.2050 |
| CGE São Miguel III S.A. | 21.0 | 9.2 | 45.7 | 08.04.2050 |
| Complexo Eólico Vilas (8) | 186.7 | 98.6 | 443.4 | |
| Vila Ceará I (Antiga Vila Paraíba IV) | 32.0 | 17.8 | 74.4 | 01.14.2054 |
| Vila Maranhão I | 32.0 | 17.8 | 81.8 | 01.11.2054 |
| Vila Maranhão II | 32.0 | 17.8 | 82.9 | 01.14.2054 |
| Vila Maranhão III (Antiga Vila Paraíba III) | 32.0 | 16.6 | 73.6 | 01.14.2054 |
| Vila Mato Grosso (Antiga Vila Alagoas III) | 58.9 | 28.6 | 130.8 | 12.06.2054 |
| Complexo Jandaira | 90.1 | 46.9 | 257.9 | |
| Jandaira I | 10.4 | 5.6 | 34.1 | 04.02.2055 |
| Jandaira II | 24.3 | 12.3 | 73.9 | 04.02.2055 |
| Jandaira III | 27.7 | 14.8 | 72.5 | 04.02.2055 |
| Jandaira IV | 27.7 | 14.2 | 77.4 | 04.02.2055 |
| Aventura 9 | 105.0 | 65.0 | 369.8 | |
| Aventura II | 21.0 | 13.1 | 73.8 | 06.05.2053 |
| Aventura III | 25.2 | 15.5 | 87.6 | 06.11.2053 |
| Aventura IV | 29.4 | 18.5 | 106.0 | 06.05.2053 |
| Aventura V | 29.4 | 17.9 | 102.3 | 06.05.2053 |
| Santa Rosa e Mundo Novo 9 | 155.4 | 92.8 | 530.4 | |
| Santa Rosa e Mundo Novo I | 33.6 | 17.3 | 94.5 | 06.04.2053 |
| Santa Rosa e Mundo Novo II | 29.4 | 17.2 | 108.5 | 06.04.2053 |
| Santa Rosa e Mundo Novo III | 33.6 | 21.5 | 124.6 | 06.04.2053 |
| Santa Rosa e Mundo Novo IV | 33.6 | 21.0 | 123.6 | 06.01.2053 |
| Santa Rosa e Mundo Novo V | 25.2 | 15.8 | 79.2 | 06.01.2053 |
| TOTAL | 6,018.7 | 2,646.9 | 17,292.4 | |
| (1) RAG of R$160.9 million, updated by Aneel's Resolution No. 3,225, of July 18, 2023. (2) In partial operation, entry into commercial operation of the fourth generating unit scheduled for 2022. (3) Power plants exempted from concession, are only registered with ANEEL. (4) Assured power considered the average wind generation. (5) Extension of Grant according to REH 2919/2021, 2932/2021 and 3.242/2023. (6) Under approval by ANEEL. | (7) Assured Power updated by Ordinance N°709/2022 for: FDA, Segredo, Salto Caxias and GPS, effective from January/2023. (8) Started up in test operation on 04/25/2022, according to ANEEL Dispatch No. 1047/2022. In commercial operation since 12/07/2022, by ANEEL order No. 2502/2022. (9) Complexes Aventura and Santa Rosa & Novo Mundo joined the Company's portfolio in Jan/23. * Considers internal consumption of generators and generation in commercial operation. ** Plant do not participate in the MRE. | |||
| |
| Exhibit IV -OPERATIONAL DATA > GENERATION |
| INTEREST | ||||||
| Enterprise | Partners | Installed Capacity (MW) | Assured Power 1 (Average MW) | Proportional installed capacity (MW) | Proporcional Assured Power (Average MW) | Concession Expires |
| Hydroelectric Power Plants | 1,111.7 | 586.8 | 500.9 | 264.9 | ||
| Large hydroelectric power plant (HPP) | 1,076.5 | 561.5 | 486.2 | 254.2 | ||
| HPP Gov. Jayme Canet Junior (Mauá) 6 (Consórcio Energético Cruzeiro do Sul) | COPEL GeT - 51% Eletrosul - 49% | 361.0 | 188.5 | 184.1 | 96.1 | 06.28.2049 |
| HPP Baixo Iguaçu (Consórcio Empreendedor Baixo Iguaçu) | COPEL GeT - 30% Geração Céu Azul - 70% | 350.2 | 172.4 | 105.1 | 51.7 | 12.03.2049 |
| HPP Santa Clara (Elejor) | COPEL - 70% Paineira Participações - 30% | 120.2 | 66.0 | 84.2 | 46.2 | 05.10.2040 |
| HPP Fundão (Elejor) | COPEL - 70% Paineira Participações - 30% | 120.2 | 62.1 | 84.1 | 43.5 | 06.11.2040 |
| HPP Dona Francisca (DFESA) | COPEL - 23,03% Gerdau - 51,82% Celesc - 23,03% Statkraft - 2,12% | 125.0 | 72.5 | 28.8 | 16.7 | 09.21.2037 |
| Small hydroelectric power station (SHP) | 29.1 | 20.4 | 10.4 | 7.3 | ||
| SHP Arturo Andreoli 6 (Foz do Chopim) | COPEL GeT - 35,77% Silea Participações - 64,23% | 29.1 | 20.4 | 10.4 | 7.3 | 07.07.2034 |
| hydroelectric power plant (HPP) | 6.1 | 4.9 | 4.3 | 3.4 | ||
| SHP Santa Clara I (Elejor) | COPEL - 70% Paineira Participações - 30% | 3.6 | 2.8 | 2.5 | 2.0 | (2) |
| SHP Fundão I (Elejor) | COPEL - 70% Paineira Participações - 30% | 2.5 | 2.1 | 1.7 | 1.5 | (2) |
| Thermal Power Plant | 484.2 | 267.0 | 393.1 | 216.8 | ||
| TPP Araucária 3 (UEG Araucária) | COPEL - 20,3% COPEL GeT - 60,9% Petrobras - 18,8% | 484.2 | 267.0 | 393.1 | 216.8 | 12.23.2029 |
| Wind Power Plants | 108.0 | 57.1 | 52.9 | 28.0 | ||
| Voltalia - São Miguel do Gostoso (5 parques) | COPEL- 49% Voltalia- 51% | 108.0 | 57.1 | 52.9 | 28.0 | (4) |
| Solar | 2.3 | - | 1.1 | - | ||
| Solar Paraná 5 | COPEL - 49% | 2.3 | - | 1.1 | - | 09.15.2046 |
| TOTAL | 1,706.2 | 910.9 | 948.0 | 509.7 | ||
| 1 Assured power updated by Ordinance No. 709/2022 of: HPP Mauá, Santa Clara, Fundão and Dona Francisca, effective from January/2023. | ||||||
| 2 Elejor requested the reclassification of its Small Hydroelectric Power Plants - (SHPs) Fundão I and Santa Clara I to Hydroelectric Generating Centers (CGHs), as amended by Art. 8 of Law 9074/1995. This was formalized through ANEEL Authorizing Resolutions 14,744 and 14,745 of 06/20/2023, with the plants exempted from concession, having only registration with ANEEL. | ||||||
| 3 Since February 1, 2014, the plant’s operation has been under the responsibility of UEGA. The Araucária TPP does not have availability agreements and operates under the merchant model. Assured power pursuant to Ordinance SPE/MME 05/2021. The most recent data from SIGA/ANEEL indicate a Assured power of 267 MW. | ||||||
| 4 The Concession Expires of the wind farm concessions are respectively: Carnaúbas (04.09.2047), Reduto (04.16.2047), Santo Cristo (04.18.2047), São João (03.26.2047). | ||||||
| 5 Holding of 6 SCPs operating in the field of distributed generation (photovoltaic plants): Pharma Solar II, Pharma Solar III, Pharma Solar IV, in commercial operation, e Bandeirantes Solar I, Bandeirantes Solar II e Bandeirantes Solar III, in pre-operational. | ||||||
| 6 Extension of Grant according to REH 3.242/2023. | ||||||
| |
| Exhibit IV -OPERATIONAL DATA > TRANSMISSION |
| Subsidiary / SPC | Contract | Enterprise | TL | APR ¹ (R$ milhões) | Concession Expiration | ||
| Extension (km)2 | Amount | MVA | |||||
| Copel GeT | 060/20013 | Several | 2,129 | 33 | 12,440 | 713.8 | 01.01.2043 |
| Copel GeT | 075/20014 | TL Bateias - Jaguariaiva | 138 | - | - | 16.8 | 08.17.2031 |
| Copel GeT | 006/2008 | TL Bateias - Pilarzinho | 32 | - | - | 3.6 | 03.17.2038 |
| Copel GeT | 027/2009 | TL Foz - Cascavel Oeste | 117 | - | - | 16.0 | 11.19.2039 |
| Copel GeT | 010/2010 | TL Araraquara II — Taubaté | 334 | - | - | 43.6 | 10.06.2040 |
| Copel GeT | 015/2010 | SE Cerquilho III | - | 1 | 300 | 7.0 | 10.06.2040 |
| Copel GeT | 022/2012 | TL Foz do Chopim - Salto Osório LT Londrina - Figueira | 102 | - | - | 7.8 | 08.27.2042 |
| Copel GeT | 002/2013 | TL Assis — Paraguaçu Paulista II | 83 | 1 | 150 | 12.2 | 02.25.2043 |
| Copel GeT | 005/2014 | TL Bateias - Curitiba Norte | 31 | 1 | 300 | 12.9 | 01.29.2044 |
| Copel GeT | 021/2014 | TL Foz do Chopim - Realeza | 52 | 1 | 300 | 13.0 | 09.05.2044 |
| Copel GeT | 022/2014 | TL Assis – Londrina | 122 | - | - | 27.1 | 09.05.2044 |
| Copel GeT | 006/165 | Lot E: TL Baixo Iguaçu - Realeza; TL Uberaba - Curitiba Centro; TL Curitiba Leste - Blumenau; SE Medianeira; SE Curitiba Centro; SE Andirá leste; Other Sections | 255 | 4 | 900 | 154.8 | 04.07.2046 |
| Costa Oeste Copel Get - 100% | 001/2012 | TL Cascavel Norte - Cascavel Oeste TL Cascavel Norte - Umuarama Sul SE Umuarama Sul | 159 | 1 | 300 | 23.7 | 01.12.2042 |
| Marumbi Copel GeT - 100% | 008/2012 | TL Curitiba - Curitiba Leste | 29 | 1 | 672 | 27.3 | 05.10.2042 |
| Uirapuru Transmissora Copel GeT - 100% | 002/20056 | TL Ivaiporã - Londrina | 122 | - | - | 26.9 | 03.04.2035 |
| Subtotal Copel GeT 7 | 3,705 | 43 | 15,362 | 1,106.4 | |||
| Caiuá Transmissora Copel GeT - 49% Elecnor - 51% | 007/2012 | TL Guaíra - Umuarama Sul TL Cascavel Norte - Cascavel Oeste SE Santa Quitéria / SE Cascavel Norte | 142 | 2 | 700 | 16.4 | 05.10.2042 |
| Integração Maranhense Copel GeT - 49% Elecnor - 51% | 011/2012 | TL Açailandia - Miranda II | 365 | - | - | 24.7 | 05.10.2042 |
| Matrinchã Copel GeT - 49% State Grid - 51% | 012/2012 | TL Paranaíta - Ribeirãozinho | 2,033 | 4 | 800 | 133.7 | 05.10.2042 |
| Guaraciaba Copel GeT - 49% State Grid - 51% | 013/2012 | TL Ribeirãozinho - Marimbondo | 930 | 1 | - | 69.0 | 05.10.2042 |
| Paranaíba Copel GeT - 24,5% Furnas - 24,5% State Grid - 51% | 007/2012 | TL Barreiras II - Pirapora II | 967 | - | - | 44.5 | 05.02.2043 |
| Cantareira Copel GeT - 49% Elecnor - 51% | 19/2014 | TL Estreito - Fernão Dias | 656 | - | - | 68.1 | 09.05.2044 |
| Mata de Santa Genebra Copel GeT - 50,1% Furnas - 49,9% | 001/14 | TL Araraquara II - Bateias | 887 | 1 | 3,600 | 156.4 | 05.14.2044 |
| Subtotal SPCs 8 | 5,980 | 8 | 5,100 | 512.6 | |||
| Total | 9,685 | 51 | 20,462 | 1,619.0 | |||
| 1 Proportional to Copel's interest in the project. Values referring to the 2023/2024 cycle, effective from July 1, 2023, according to REH 3.216/2023 - Technical Note No. 39/2023 – STR/ANEEL, of September 30, 2023. ² Considers double circuit sections (circuits that share the same transmission tower). ³ Contract renewed according to Law 12,783/13. The O&M portion is part of the RBSE, under the terms of the Law. It will be received until the end of the concession (Jan/2043). The value of the APR for the 2023-2024 cycle, excluding the RBSE, according to REH 3,216/2023, is R$ 146.1 million. This amount refers to additional RAP for reinforcements and improvements, in effect when REH 3,216/2023 was published. 4 As of 10.31.2018, the APR was reduced by 50%. 5 The construction of 38 km of sectioning lines was foreseen in the implementation of the Andirá Leste and Medianeira SEs, 2 km of which for Contract 060/2001 and 36 km for LTs that do not belong to Copel GeT, which, despite being included in the APR, in reason for the investment made, will not be added to Copel's assets. 6 As of 07/09/2021, the APR was reduced by 50%. 7 Consolidated Result. 8 Equity Income. | |||||||
| |
| Exhibit IV -OPERATIONAL DATA > DISTRIBUTION |
| OPERATIONAL DATA | ||||||
| Number of Consumers | Locations served | Cities served | Voltage | Number of Substations | MVA | Km of lines |
| 5,078,328 | 1,068 | 395 | 13,8 kV | - | - | 111,358 |
| 34,5 kV | 236 | 1,646 | 89,356 | |||
| 69 kV | 36 | 2,502 | 767 | |||
| 138 kV | 117 | 7,662 | 6,652 | |||
| 389 | 11,815 | 208,133 | ||||
| Consumer-to-employee ratio DIS | 2018 | 2019 | 2020 | 2021 | 2022 | Sep-23 |
Captive Consumers | 4,637,804 | 4,713,240 | 4,835,852 | 4,926,608 | 5,011,555 | 5,075,363 |
| Copel Dis employees | 5,364 | 4,964 | 4,641 | 4,430 | 4,257 | 4,224 |
| Consum/Emp | 865 | 949 | 1,042 | 1,112 | 1,177 | 1,202 |
| QUALITY OF SUPPLY | ||||||
| Year | DEC ¹ (hours) | FEC ² (outages) | ||||
| 2019 | 9.11 | 6.02 | ||||
| 2020 | 7.83 | 5.61 | ||||
| 2021 | 7.20 | 4.76 | ||||
| 2022 | 7.98 | 5.29 | ||||
| 2023 | 7.97 | 5.41 | ||||
| ¹ DEC measured in hours and hundredths of an hour ² FEC expressed in number of interruptions and hundredths of a number of interruptions year to date * Values of the last 12 months | ||||||
| Period | Technical Loss | Non-Technical Loss | Total loss | |||
| Regulatory (1) | Real (2) | Regulatory (3) | Calculated (4) | Regulatory (5) | Total (6) | |
| Sep-19 | 6.05% | 5.91% | 4.70% | 4.21% | 8.10% | 7.89% |
| Sep-20 | 6.05% | 6.02% | 4.70% | 3.49% | 8.16% | 7.61% |
| Sep-21 | 5.79% | 5.90% | 4.47% | 4.48% | 7.71% | 7.70% |
| Sep-22 | 5.79% | 5.73% | 4.47% | 4.22% | 7.63% | 7.53% |
| Sep-23 | 5.79% | 5.57% | 4.47% | 4.03% | 7.58% | 7.40% |
| (1) Percentage established in the tariff review; | ||||||
| (2) Technical loss calculated and reported monthly to Aneel; | ||||||
| (3) Percentage established in the tariff review; | ||||||
| (4) Difference between reported total losses and technical losses calculated as a percentage established in the review and the total injected energy, also reported monthly to Aneel; | ||||||
| (5) (Regulatory percentage of PNT x informed BT Market + technical losses calculated as a percentage established in the review and the total energy injected) / Injected energy; | ||||||
| (6) Total loss on injected energy. | ||||||
| NOTE: In the calculation of the distributor's total losses, energy losses inherent to the electric power system (technical losses), commercial losses (mainly due to fraud, theft) and differences related to the shift in the billing schedule and the effects of the portion of mini and micro generation distributed in the Company's network | ||||||
SIGNATURE
Pursuant to the requirements of the Securities Exchange Act of 1934, the registrant has duly caused this report to be signed on its behalf by the undersigned, thereunto duly authorized.
Date November 8, 2023
| COMPANHIA PARANAENSE DE ENERGIA – COPEL | ||
| By: | /S/ Daniel Pimentel Slaviero | |
| Daniel Pimentel Slaviero Chief Executive Officer | ||
FORWARD-LOOKING STATEMENTS
This press release may contain forward-looking statements. These statements are statements that are not historical facts, and are based on management's current view and estimates of future economic circumstances, industry conditions, company performance and financial results. The words "anticipates", "believes", "estimates", "expects", "plans" and similar expressions, as they relate to the company, are intended to identify forward-looking statements. Statements regarding the declaration or payment of dividends, the implementation of principal operating and financing strategies and capital expenditure plans, the direction of future operations and the factors or trends affecting financial condition, liquidity or results of operations are examples of forward-looking statements. Such statements reflect the current views of management and are subject to a number of risks and uncertainties. There is no guarantee that the expected events, trends or results will actually occur. The statements are based on many assumptions and factors, including general economic and market conditions, industry conditions, and operating factors. Any changes in such assumptions or factors could cause actual results to differ materially from current expectations.