Table of Contents
As filed with the Securities and Exchange Commission on April 25, 2002.
Registration No. 333-
SECURITIES AND EXCHANGE COMMISSION
Washington, D.C. 20549
FORM S-1
REGISTRATION STATEMENT
Under
THE SECURITIES ACT OF 1933
Fresh Enterprises, Inc.
(Exact name of registrant as specified in its charter)
California | 5812 | 77-0456290 |
(State or other jurisdiction of incorporation or organization) | (Primary Standard Industrial Classification Code number) | (IRS Employer Identification Number) |
225 W. Hillcrest Drive
Suite 351
Thousand Oaks, California 91360
(805) 495-4704
(Address, including zip code, and telephone number, including area code, of registrant’s principal executive offices)
Gregory G. Dollarhyde, Chief Executive Officer and President
Fresh Enterprises, Inc.
225 W. Hillcrest Drive
Suite 351
Thousand Oaks, California 91360
(805) 495-4704
(Name, address, including zip code, and telephone number, including area code, of agent for service)
Copies to:
Anna M. Graves, Esq. | Danielle Carbone, Esq. | |
Pillsbury Winthrop LLP | Shearman & Sterling | |
725 South Figueroa Street | 599 Lexington Avenue | |
Los Angeles, California 90017-5406 | New York, New York 10022-6069 | |
(213) 488-7100 | (212) 848-4000 |
Approximate date of commencement of proposed sale to the public: As soon as practicable after the effective date of this Registration Statement.
If any of the securities being registered on this Form are to be offered on a delayed or continuous basis pursuant to Rule 415 under the Securities Act of 1933, check the following box.¨
If this Form is filed to register additional securities for an offering pursuant to Rule 462(b) under the Securities Act, please check the following box and list the Securities Act registration statement number of the earlier effective registration statement for the same offering.¨
If this Form is a post-effective amendment filed pursuant to Rule 462(c) under the Securities Act, check the following box and list the Securities Act registration statement number of the earlier effective registration statement for the same offering.¨
If this Form is a post-effective amendment filed pursuant to Rule 462(d) under the Securities Act, check the following box and list the Securities Act registration statement number of the earlier effective registration statement for the same offering.¨
If delivery of the prospectus is expected to be made pursuant to Rule 434, check the following box.¨
CALCULATION OF REGISTRATION FEE
Title of Each Class of Securities to be Registered | Proposed Maximum Aggregate Offering Price(1)(2) | Amount of Registration Fee | ||||
| Common Stock, without par value | $ | 57,500,000 | $ | 5,290 | ||
| (1) | Includes [ ] shares issuable upon exercise of the Underwriters’ over-allotment option. |
| (2) | Estimated solely for the purpose of calculating the registration fee in accordance with Rule 457(o) under the Securities Act. |
The Registrant hereby amends this Registration Statement on such date or dates as may be necessary to delay its effective date until the Registrant shall file a further amendment which specifically states that this Registration Statement shall thereafter become effective in accordance with Section 8(a) of the Securities Act of 1933 or until the Registration Statement shall become effective on such date as the Commission, acting pursuant to said Section 8(a), may determine.
Table of Contents
The information in this prospectus is not complete and may be changed. We may not sell these securities until the registration statement filed with the Securities and Exchange Commission is effective. This prospectus is not an offer to sell these securities, and we are not soliciting an offer to buy these securities in any state where the offer or sale is not permitted.
PROSPECTUS
SUBJECT TO COMPLETION DATED , 2002
[ ] Shares

Fresh Enterprises, Inc.
Common Stock
Fresh Enterprises, Inc. is offering shares of common stock in a firmly underwritten offering. This is Fresh Enterprises’ initial public offering, and no public market currently exists for our shares. Fresh Enterprises anticipates that the initial public offering price for our shares will be between $[ ] and $[ ] per share.
Our common stock has been proposed for quotation on the Nasdaq National Market under the symbol “BAJA”.
Investing in our common stock involves risks that are described under “Risk Factors” beginning on page 7 of this prospectus.
Per Share | Total | |||||
| Offering Price | $ | $ | ||||
| Discounts and Commissions to Underwriters | $ | $ | ||||
| Offering Proceeds to Fresh Enterprises, Inc. | $ | $ | ||||
Neither the Securities and Exchange Commission nor any state securities commission has approved or disapproved these securities or determined if this prospectus is truthful or complete. Any representation to the contrary is a criminal offense.
We and the selling shareholders have granted the underwriters the right to purchase up to an additional shares of common stock to cover any over-allotments. The underwriters can exercise this right at any time within thirty days after the offering. Banc of America Securities LLC expects to deliver the shares of common stock to investors on , 2002.
Joint Lead Managers
Banc of America Securities LLC | Credit Suisse First Boston |
Thomas Weisel Partners LLC
The date of this prospectus is , 2002
Table of Contents
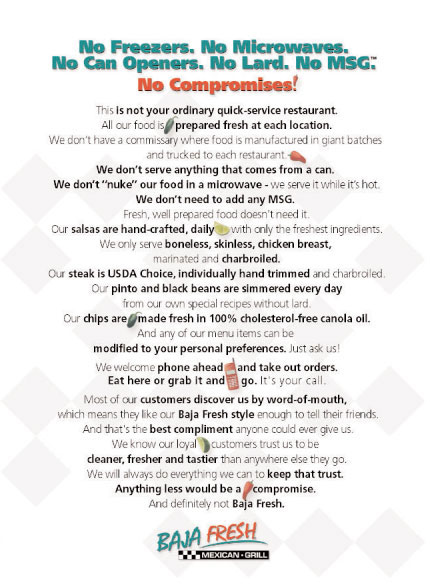
Table of Contents
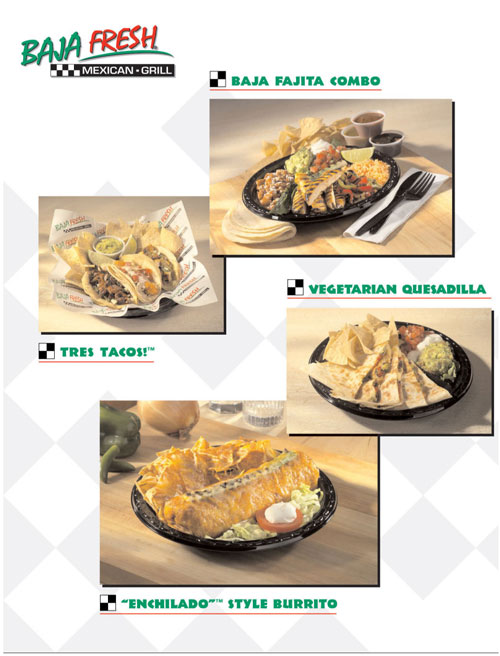
Table of Contents
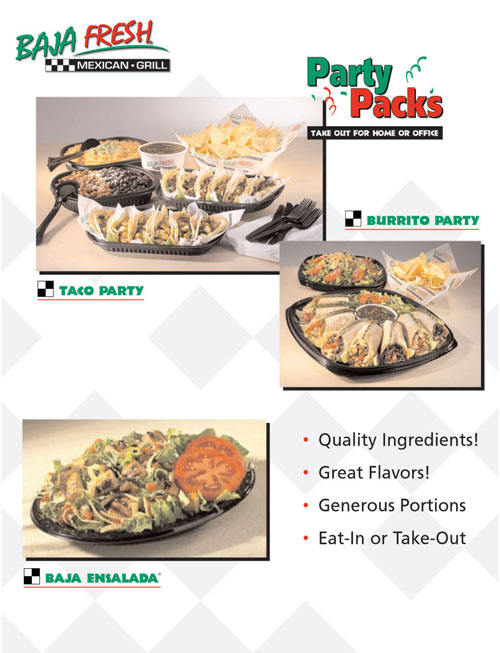
Table of Contents
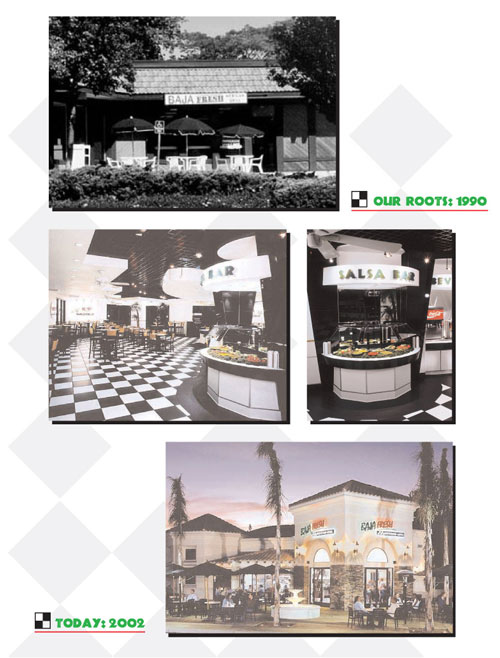
Table of Contents
We have not authorized anyone to provide you with information different from that contained in this prospectus. We are offering to sell, and seeking offers to buy, shares of common stock only in jurisdictions where offers and sales are permitted. The information contained in this prospectus is accurate only as of the date of this prospectus, regardless of the time of delivery of this prospectus or of any sale of our common stock.
Page | ||
| iii | ||
| 1 | ||
| 7 | ||
| 15 | ||
| 16 | ||
| 17 | ||
| 18 | ||
| 19 | ||
| 20 | ||
| 23 | ||
| 35 | ||
| 50 | ||
| 60 | ||
| 62 | ||
| 66 | ||
| 69 | ||
| 71 | ||
| 74 | ||
| 74 | ||
| 74 | ||
| F-1 |
Except as otherwise noted or where the context otherwise requires, all information in this prospectus reflects a three-for-two forward stock split we consummated on June 30, 1999 and assumes no exercise of the underwriters’ over-allotment option.
Throughout this prospectus, our fiscal years ended December 31, 1997, December 31, 1998, January 3, 2000, January 1, 2001 and December 31, 2001 are referred to as years 1997, 1998, 1999, 2000, and 2001, respectively. Our fiscal year consists of 52 or 53 weeks, reported in 13 four-week periods, and ends on the Monday closest to December 31 in each year. Fiscal year 1999 included 53 weeks. All other years shown include 52 weeks.
iii
Table of Contents
INFORMATION ON FRANCHISED RESTAURANTS
This prospectus contains sales information for our franchised restaurants. Such sales information is unaudited and is based on information reported by our franchisees.
INTELLECTUAL PROPERTY
“Baja Fresh” and our stylized logo are our registered service marks. We also have a number of other registered service marks and trademarks and service mark and trademark applications related to our products, services and concepts that we use throughout this prospectus. Other service marks, trademarks and trade names referred to in this prospectus are the property of their respective owners.
iv
Table of Contents
[Map of our restaurant locations, copy of our menu, pictures of our restaurants and food,
list of awards we have received and quotes from reviews about us.]
v
Table of Contents
This summary highlights information contained elsewhere in the prospectus. It does not contain all the information you should consider. You should also read the more detailed information set out in this prospectus, including the “Risk Factors” section and the consolidated financial statements and notes before making an investment.
OUR COMPANY
We are a rapidly-growing owner, operator and franchisor of quick casual restaurants under the name “Baja Fresh Mexican Grill” that serve a wide variety of high quality, freshly prepared, flavorful Mexican food. As of March 25, 2002, we own, operate and franchise 157 restaurants in 14 states and the District of Columbia, of which 72 are company-owned and 85 operate under franchise agreements. With almost 12 years of operating history and 28 consecutive quarters of positive system-wide comparable restaurant sales growth, we believe we have forged a strong brand with high levels of customer satisfaction and expanding geographic appeal. Our vision for the company is to become the leading national restaurant brand known as the defining standard for the highest quality and convenience in fresh Mexican food.
Our approach to fresh food preparation is integral to our concept, and we proudly prepare all of our menu items without the use of freezers, microwaves, can openers, lard, or MSG. We offer generous portions of a wide variety of traditional Mexican food items, including our Baja Burrito™, Original “Baja Style” Tacos™, charbroiled fish tacos, taquitos, ensaladas, quesadillas and other Mexican entrees and appetizers, all made-to-order. Our salsas, which are handcrafted daily on premises, are offered at our signature all-you-can-eat salsa bars, where customers can choose from a variety of mild to spicy salsas, and garnish their food according to their individual tastes. Our savory menu is conveniently offered at lunch and dinner for dine-in or take-out in a clean, upbeat and energetic environment and is served with a strong commitment to absolute customer satisfaction. We believe our high quality food, average guest check of approximately $7.50 and quick casual format provide customers with an exceptional value for quality, flavor and convenience.
We were founded in 1990 and grew steadily to 44 restaurants by mid-1998. In November 1998, Greg Dollarhyde, a seasoned restaurant executive who is our president and chief executive officer, structured a series of transactions to effect a recapitalization. As a result of the recapitalization, a controlling interest in our company was sold to three knowledgeable restaurant and retail industry investors, Mr. Dollarhyde, Louis A. “Pete” Siracusa, our chairman, and other new investors. To further strengthen and expand the depth of the management team, Mr. Dollarhyde recruited Don Breen, our chief financial officer, in July 1999 and Steve Heeley, our senior vice president of operations, in August 1999. Mr. Dollarhyde has since continued to assemble a well-rounded management team with diverse skills that include brand marketing, restaurant operations, real estate site selection and development, information technology and franchising development and operations.
Following the recapitalization and the implementation of our new initiatives, we have enjoyed a period of strong operating performance and increased unit growth. Our management team has established a successful track record of growing our top-line revenue at a compound annual growth rate of 61.3%, from $18.6 million in 1998 to $78.0 million in 2001, while simultaneously improving our restaurant operating margins by over 300 basis points. We have instituted an aggressive and disciplined growth plan. Since the recapitalization, we have grown from 47 restaurants at the end of 1998 to 157 restaurants by opening 56 company-owned and 54 franchise restaurants. By the end of 2002, we expect to have approximately 210 Baja Fresh Mexican Grills open in 18 states and the District of Columbia on a system-wide basis. Some of our highest average unit volumes are generated by restaurants in markets outside our home base of California, which indicates the portability of our concept.
1
Table of Contents
We operate in the relatively new and rapidly growing quick casual segment of the restaurant industry. We believe the quick casual sector has emerged as price differences between the quick service and casual dining sectors widened, and demographic trends in the U.S. began to shift. Customers now demand more convenience than full-service casual dining restaurants provide, and are willing to pay for higher quality and fresher food than quick service restaurants serve. Customers have also become more sophisticated about their food choices, typically opting for menus with more variety, and more healthful and flavorful food. Quick casual restaurants are well positioned to meet these demands because they offer convenient counter and take-out service and provide similar quality food as that served at casual dining restaurants, while still meeting customers’ expectations for fresh preparation, rapid service, and lower prices with no tipping.
OUR STRATEGY
We intend to enhance our market position by capitalizing on the demand for quick casual restaurants and other favorable industry trends and expanding our concept on a nationwide basis. In order to build our brand awareness and achieve our goal, we plan to execute the following strategies:
| • | Offer high quality, fresh Mexican food at an excellent value. Our menu has been developed with freshness, flavor and value in mind. Our diverse menu offerings appeal to a wide variety of different tastes and the high quality of our food and generous portions at affordable prices allow us to appeal to a broad group of consumers. We believe that the quality and freshness of our food, when combined with an average guest check of approximately $7.50, offer our customers an excellent dining value. |
| • | Create a culture focused on concept execution. The cornerstone to building our brand and expanding our nationwide presence is the consistent day-to-day execution of our concept by our team. At our restaurants, we emphasize competent and friendly customer service. We believe high quality service in an appealing atmosphere is critical to providing our customers with a positive experience and driving repeat business. |
| • | Increase existing customer frequency, capture new customers and expand customer loyalty. We believe the keys to our continued success and growth are to build customer loyalty by increasing the frequency of visits by our existing customers and to generate positive word of mouth recommendations. Customer satisfaction surveys conducted by independent restaurant industry consultants demonstrate that we consistently obtain customer satisfaction scores that meet or exceed that of many other well-known and highly regarded restaurant chains. These high levels of customer satisfaction result in increased frequency of repeat visits. |
| • | Continue favorable operating trends. We have successfully achieved 28 consecutive quarters of system-wide comparable restaurant sales increases. Our system-wide comparable restaurant sales increases of 8.1% in 1999, 7.7% in 2000 and 8.0% in 2001 were primarily driven by higher customer counts and an increase in average guest check. This growth was achieved without electronic media advertising or new product discount promotions. |
| • | Maintain strong unit economics. We believe the frequency of visits by new and existing customers and our ability to capture four day-part segments through lunch take-out and dine-in as well as dinner take-out and dine-in has helped us achieve consistent growth in our system-wide same store sales and generate strong returns on investment in our restaurants. We have a relatively low net cash investment for new units of approximately $525,000 to $650,000 per unit, excluding pre-opening costs. In 2001, our 39 company-owned restaurants open for the entire year generated average sales of approximately $1.5 million, or $594 per square foot. Our 17 company-owned restaurants opened for at least two years in 2001 generated average sales of approximately $1.7 million, or $701 per square foot, significantly more than the average sales per square foot of other quick service and casual dining restaurants. In 2001, our 39 company-owned restaurants open for at least one year and 17 open for at least two years had |
2
Table of Contents
average restaurant level cash flow margins of 16.7% and 21.7%, respectively. Based on an average investment of $575,000, these restaurants open for at least one year and open for at least two years in 2001 generated cash on cash returns of 42.3% and 62.3%, respectively.
| • | Continue to roll out stores nationwide through a disciplined growth strategy. Based on demographic studies and other market data, we believe that we are well positioned for growth in both existing and future markets through the development of company-owned restaurants and through selective partnership with experienced and well-capitalized franchisees. In 2001, we opened 55 restaurants, 28 company-owned and 27 franchised, an increase in our total restaurant base of 57.3%. Of the restaurants opened in 2001, eight were opened in five new markets. We intend to develop many of the new restaurants in existing markets, and to selectively enter new markets, improving sales and operating efficiencies as we expand in each market. We plan to open a total of 22 new company-owned restaurants in 2002 and 25 new company-owned restaurants in 2003 and expect our franchisees to open 37 new restaurants in 2002 and 35 new restaurants in 2003. As of March 25, 2002, we had 26 area development agreements with 22 franchisees covering the development of 221 restaurants, 59 of which were open by the end of 2001 and all of which should be open within the next five years pursuant to the terms of the agreements. |
We are a California corporation whose principal executive offices are located at 225 W. Hillcrest Drive, Suite 351, Thousand Oaks, California 91360. Our telephone number is (805) 495-4704. Our web site is located at www.bajafresh.com. Information on our website is not a part of this prospectus.
3
Table of Contents
THE OFFERING
| Common stock offered | [ ] shares | |
| Common stock to be outstanding after the offering | [ ] shares(1) | |
| Use of proceeds | Assuming the midpoint of the filing range, we will receive approximately $[ ] million in net proceeds in this offering, or $[ ] million if the underwriters exercise their over-allotment option in full, after deducting underwriting discounts and commissions and estimated offering expenses. We intend to use: | |
| • $30 million to finance our continued growth and the build-out of company-owned restaurants; | ||
| • $[ ] million to repay outstanding bank debt under our credit agreements; | ||
| • $1.5 million to repay amounts due under a promissory note we issued to Jim Magglos, our founder and director; and | ||
| • the balance for working capital and other general corporate purposes. | ||
| Pending application of the net proceeds, we intend to invest the net proceeds in short-term, investment-grade, interest-bearing securities. | ||
| Proposed Nasdaq National Market Symbol | “BAJA” | |
| Risk factors | See “Risk Factors” and the other information included in this prospectus for a discussion of the factors you should carefully consider before deciding to invest in shares of our common stock. |
| (1) | The number of shares to be outstanding after the offering includes the issuance of 7,596,822 shares of our common stock upon the automatic conversion of our Series A, Series B and Series C convertible preferred stock, concurrently with the offering. This number of shares does not assume the exercise of outstanding options and warrants to purchase 1,125,538 shares of our common stock at a weighted average exercise price of $6.58 per share. |
4
Table of Contents
SUMMARY CONSOLIDATED FINANCIAL AND OPERATING DATA
Fiscal Year | ||||||||||||||||
1998 | 1999 | 2000 | 2001 | |||||||||||||
($ in thousands, except for per share data and footnotes) | ||||||||||||||||
Statements of Operations Data: | ||||||||||||||||
| Restaurant sales | $ | 16,857 | $ | 22,824 | $ | 37,971 | $ | 72,796 | ||||||||
| Royalties, franchise and other revenues | 1,753 | 2,238 | 3,318 | 5,253 | ||||||||||||
| Total revenues | 18,610 | 25,062 | 41,289 | 78,049 | ||||||||||||
| Non-cash stock compensation(1) | — | 872 | 228 | 400 | ||||||||||||
| Operating income (loss) | 174 | 451 | (313 | ) | 956 | |||||||||||
| Interest income | 33 | 82 | 301 | 178 | ||||||||||||
| Interest expense(2) | (313 | ) | (328 | ) | (401 | ) | (769 | ) | ||||||||
| Gain (loss) on disposition of assets | (231 | ) | — | 331 | (54 | ) | ||||||||||
| Income (loss) before income tax provision (benefit) and minority interest | (511 | ) | 202 | (54 | ) | 361 | ||||||||||
| Net income (loss) | (303 | ) | 275 | (134 | ) | 41 | ||||||||||
| Redeemable convertible preferred stock accretion | — | (173 | ) | (197 | ) | (230 | ) | |||||||||
| Net income (loss) attributable to common shareholders(3) | $ | (303 | ) | $ | 102 | $ | (331 | ) | $ | (189 | ) | |||||
| Net income (loss) attributable to common shareholders per share(4): | ||||||||||||||||
| Basic | $ | 0.07 | $ | (0.22 | ) | $ | (0.12 | ) | ||||||||
| Diluted | $ | 0.05 | $ | (0.22 | ) | $ | (0.12 | ) | ||||||||
| Shares used in calculating net income (loss) attributable to common shareholders per share(4): | ||||||||||||||||
| Basic | 1,506,208 | 1,520,225 | 1,520,225 | |||||||||||||
| Diluted | 5,660,400 | 1,520,225 | 1,520,225 | |||||||||||||
Pro Forma Data(5)(6): | ||||||||||||||||
| Net income (loss) attributable to common shareholder | $ | |||||||||||||||
| Net income (loss) attributable to common shareholders per share: | ||||||||||||||||
| Basic | $ | |||||||||||||||
| Diluted | $ | |||||||||||||||
| Shares used in computing net income (loss) attributable to common shareholders per share: | ||||||||||||||||
| Basic | ||||||||||||||||
| Diluted | ||||||||||||||||
Selected Operating Data: | ||||||||||||||||
System-wide restaurant information | ||||||||||||||||
| System-wide restaurants open at end of period | 47 | 57 | 96 | 151 | ||||||||||||
| System-wide sales | $ | 54,924 | $ | 74,797 | $ | 106,807 | $ | 176,690 | ||||||||
| System-wide comparable restaurant sales growth(7) | 8.7 | % | 8.1 | % | 7.7 | % | 8.0 | % | ||||||||
Company-owned restaurant information | ||||||||||||||||
| Company-owned restaurants open at end of period | 13 | 18 | 39 | 67 | ||||||||||||
| Company-owned restaurant sales | $ | 16,857 | $ | 22,824 | $ | 37,971 | $ | 72,796 | ||||||||
| Company-owned restaurant operating costs | 15,114 | 18,470 | 32,379 | 62,942 | ||||||||||||
| Company-owned restaurant level cash flow(8) | $ | 1,743 | $ | 4,354 | $ | 5,592 | $ | 9,854 | ||||||||
| Company-owned restaurant level cash flow margin | 10.3 | % | 19.1 | % | 14.7 | % | 13.5 | % | ||||||||
| Company-owned comparable restaurant sales growth(7) | 5.5 | % | 0.3 | % | 7.4 | % | 6.6 | % | ||||||||
| Operating income before pre-opening costs and non-cash charges(9) | $ | 1,214 | $ | 2,122 | $ | 2,409 | $ | 6,467 | ||||||||
| Operating income before pre-opening costs and non-cash charges margin | 6.5 | % | 8.5 | % | 5.8 | % | 8.3 | % | ||||||||
5
Table of Contents
December 31, 2001 | |||||||
Actual | Pro Forma as Adjusted(10) | ||||||
(unaudited) | |||||||
Balance Sheet Data: | |||||||
| Cash and cash equivalents | $ | 439 | $ | ||||
| Total assets | 41,854 | ||||||
| Total debt, including current portion | 1,686 | ||||||
| Redeemable convertible preferred stock | 45,740 | ||||||
| Put warrant | 354 | ||||||
| Total shareholders’ equity (deficiency) | (17,000 | ) | |||||
| (1) | In connection with our recapitalization in November 1998, we made loans to Messrs. Dollarhyde and Siracusa to purchase shares of our common stock. The loans were limited recourse and, as such, we were required to recognize a non-cash stock compensation expense representing the difference between the estimated fair market value of the common stock at the end of each reporting period and the original purchase price of the related common stock. In April 2002, we reached agreement with Messrs. Dollarhyde and Siracusa to amend these notes to become full recourse, and subsequent to that time, we are no longer required to recognize a non-cash stock compensation expense. These loans are non-amortizing and are due on November 24, 2003. See “Certain Relationships and Related Transactions”. |
| (2) | In November 1998, we issued a put warrant for 75,000 shares that obligates us to reacquire the put warrant from the holder upon the occurrence of certain events. Interest expense for fiscal 2001 includes $298,000 attributable to an increase in the estimated fair market value of the put warrant obligation. |
| (3) | Net income (loss) attributable to common shareholders includes the effect of the accretion of preferred stock to liquidation preference, which reduces net income or increases net loss attributable to common shareholders for the relative periods. |
| (4) | See notes 2 and 11 of the notes to audited consolidated financial statements for an explanation of the method used to calculate the net income (loss) attributable to common shareholders per share and shares used in computing net income (loss) attributable to common shareholders per share, basic and diluted. |
| (5) | Pro forma net income (loss) attributable to common shareholders for 2001 is the result of the elimination of $326,000 in interest expense, net of taxes, related to the repayment of bank debt, the elimination of $117,000 in interest expense, net of taxes, related to the repayment of amounts due under a promissory note we issued to Jim Magglos, our founder and one of our directors, and the elimination of $230,000 in accretion of preferred stock to liquidation preference upon the automatic conversion of our preferred stock. |
| (6) | Pro forma information gives effect, as of the beginning of each period, to the sale of [ ] shares of common stock offered by us in this offering and the conversion of all outstanding shares of our preferred stock into 7,596,822 shares of common stock as of the beginning of 2001. |
| (7) | System-wide and company-owned restaurants are included in the computation of comparable restaurant sales after they have been open for a full 13 four-week periods. In 1999, we intentionally cannibalized a number of company-owned restaurants in the established Southern California market in order to attain greater overall market share. |
| (8) | Company-owned restaurant level cash flow is calculated using total restaurant sales less cost of sales, labor and direct operating and occupancy costs. |
| (9) | Operating income before pre-opening costs and non-cash charges is calculated before pre-opening costs, non-cash stock compensation expense, loss on asset impairment and depreciation and amortization. |
| (10) | Reflects our receipt of estimated net proceeds of $[ ] from the sale of [ ] shares of common stock offered by us at an assumed initial public offering price of $[ ] per share, net of estimated underwriting discounts and estimated offering expenses, the conversion of all outstanding shares of our preferred stock into 7,596,822 shares of common stock, the use of net proceeds to repay $1,500,000 due under a promissory note we issued to Jim Magglos, our founder and one of our directors, and $[ ] , including accrued interest, in bank debt. See “Use of Proceeds”. |
6
Table of Contents
You should read the following risk factors carefully before purchasing any common stock. If any of the risks discussed below actually occur, our business, financial condition, operating results or cash flows, could be materially adversely affected. This impact could cause the trading price of our common stock to decline, and you could lose all or part of your investment.
Risks related to our growth strategy
Our growth strategy requires us and our franchisees to open new restaurants at a rapid pace. We may not be able to achieve this planned expansion.
We are pursuing a rapid and disciplined growth strategy, the success of which will depend in large part on our ability, and the ability of our franchisees, to open new restaurants and to operate these restaurants on a profitable basis. Since our recapitalization in November 1998, we have opened 56 new company-owned restaurants, including one after the recapitalization in 1998, five in 1999, 22 in 2000 and 28 in 2001. We presently anticipate that we will open a total of 22 new company-owned restaurants during 2002, two of which were open as of March 25, 2002, and an additional 25 restaurants in 2003. The success of our planned expansion will be dependent upon numerous factors, many of which are beyond our control, including the following:
| • | the hiring, training and retaining of qualified operating personnel, especially general managers and restaurant managers; |
| • | reliance on the knowledge of our executives and franchisees to identify available and suitable restaurant sites; |
| • | negotiation of favorable lease terms; |
| • | timely development of new restaurants, including the availability of construction materials and labor and the timely turnover of leased sites to us and our franchisees by landlords and developers; |
| • | management of construction and development costs of new restaurants; |
| • | our ability to secure required governmental approvals and permits in a timely manner; |
| • | competition in our markets; and |
| • | general economic conditions. |
Any failure on our part to recognize or respond to these issues may adversely affect the success of our new restaurants, which in turn may adversely affect our operating results.
The success of our growth strategy will depend on our ability to locate a sufficient number of suitable new restaurant sites.
Our biggest challenge in meeting our growth objectives will be to secure an adequate number of suitable new restaurant sites. We require that all proposed restaurant sites, whether such locations are ultimately to contain company-owned or franchised restaurants, fit within strict parameters established by us. We cannot assure you that we will be able to find sufficient suitable locations for our planned expansion in any future period. If we find suitable locations, we will often be required to obtain government permits to construct our restaurants. This could delay our development process and prevent us from opening restaurants in a timely fashion. Delays or failures in opening new restaurants could materially adversely affect our business, financial condition, operating results or cash flows.
7
Table of Contents
If we are unable to attract new franchisees or if our franchisees cannot develop or finance new restaurants, build them on suitable sites or open on schedule, our growth and success will be impeded.
Our business is dependent in part upon our ability to attract new franchisees, as well as the ability of our franchisees to develop new franchised restaurants. We anticipate most new restaurant growth by franchisees will be by those franchisees who are also area developers. To achieve our growth initiatives, we will also need to attract additional franchisees to open new restaurants. Area developers are generally required under their development agreements to develop a predetermined number of restaurants in their areas over the term of their development agreements. These schedules form the basis for our expectations regarding the number and timing of new restaurant openings. In the past, we have agreed to extend or modify development schedules for certain area developers, and we may do so in the future. Area developers may not have access to the financial resources they need to open the restaurants required by their development schedules or may be unable to find suitable sites to develop such restaurants. They also may not be able to negotiate acceptable lease or purchase terms for the sites, obtain the necessary permits and approvals or meet construction schedules. Any of these problems could slow our growth, impair our strategy and reduce our future franchise revenue growth.
We could face labor shortages that could slow our growth.
Our success depends in part upon our ability to attract, motivate and retain a sufficient number of qualified employees, including general managers, restaurant managers, kitchen managers, servers, kitchen staff and cashiers, necessary to keep pace with our expansion schedule. Qualified individuals of the requisite caliber and number needed to fill these positions are in short supply in some areas and the turnover rate in the restaurant industry is high. Additionally, competition for qualified employees could require us to pay higher wages to attract sufficient employees. An inability to recruit and retain a sufficient number of qualified individuals in the future may delay the planned openings of new restaurants. Any such delays or any material increases in employee turnover rates in existing restaurants, or any requirement to pay higher wages could have a material adverse effect on our business, financial condition, operating results or cash flows.
Our restaurant expansion strategy includes further penetration of our existing markets. This strategy can cause cannibalization of sales in some of our and our franchisees’ existing restaurants.
In accordance with our expansion strategy, we will continue to open a significant number of our new restaurants in our existing markets. Since we typically draw customers from the neighborhoods surrounding each of our restaurants, the sales performance and customer counts for restaurants near the area in which a new restaurant opens may decline due to cannibalization.
Our expansion into new markets may present increased risk due to our unfamiliarity with the area.
We anticipate that the initial restaurants opened in a new market will not typically reach system averages in sales and profitability until approximately their third year of operations, due in large part to factors that usually affect new restaurants. These factors include lack of market awareness, inability to attract customers to try our food in a timely manner, inability to hire sufficient staff and other matters. Although we attempt to mitigate these issues by expanding primarily to markets for which we have conducted considerable market reviews and by carefully considering training and staffing needs, we cannot assure you that we will be successful in operating our new restaurants on a profitable basis.
Our expansion may strain our infrastructure. If we are unable to improve our infrastructure to support the expansion of our business, it could adversely affect our operations and financial condition.
As we continue to grow at a rapid pace, we face the risk that our existing systems and processes, including management resources, operating systems and accounting and finance personnel, may be inadequate to support our planned expansion. We are currently implementing changes and enhancements to our existing systems to
8
Table of Contents
support our growth. In addition, to support the reporting obligations of a public entity, we are improving certain of our operations and financial processes and increasing our staffing levels in restaurant and regional management, accounting and finance, and other administrative support departments. We cannot assure you that we will be able to make the necessary changes in our systems or retain the personnel required to respond to the demands of our planned expansion. The implementation of such changes and enhancements to our systems and the retention of additional personnel will require capital expenditures and other increased costs that could have a material adverse impact on our operating results. Failure to implement these systems and secure these resources could also have a material adverse effect on our operating results. For the same reasons, we cannot assure you that we will be able to manage our expanding franchisee system effectively.
Risks related to our business
We may be harmed by actions taken by our area developers and franchisees that are outside of our control.
Area developers and franchisees are generally independent contractors and not our employees. We provide training and support to area developers and franchisees, but the operations of franchised restaurants may be negatively affected by any number of factors beyond our control. Consequently, area developers and franchisees may not successfully operate restaurants in a manner consistent with our standards and requirements, or may not hire and train qualified managers and other restaurant personnel. If they are unable to operate restaurants in accordance with our standards or if they are unable to hire and train the requisite personnel, our image and reputation may suffer, and system-wide sales could decline.
We may be unable to operate our new restaurants on a profitable basis.
We cannot assure you that we, or our franchisees, will be able to operate our new restaurants profitably. Our new restaurants, especially in newer markets, typically take several months or years to reach system averages in sales and profitability, if at all. We cannot assure you that any new restaurant we open will ultimately obtain similar operating results to those of our existing restaurants or if achieved, that they will be able to sustain such results. In addition, we continue to enter new markets in which we have no prior operating experience or brand awareness. These new markets may have different demographic characteristics, competitive conditions, consumer tastes and discretionary spending patterns than our existing markets, which may cause our new restaurants to be less successful in these markets than those restaurants in our existing markets.
We depend on our key management team members.
Our future success depends significantly on the continued services and performance of our senior management, particularly Greg Dollarhyde, our president and chief executive officer. Our future performance will depend on our ability to motivate and retain our executive officers and other key management team members, particularly our regional and district operators and general managers. Competition for these management team members is intense. Currently, we have not entered into any written employment agreements with any of our executive officers other than Greg Dollarhyde. The loss of the services of our senior management or key management team members or the inability to attract additional personnel as needed could materially adversely affect our business, financial condition, operating results or cash flows. We do not maintain any key man insurance with respect to our executive officers.
Our operations are susceptible to changes in food and supply availability and costs that could adversely affect our margins.
Our profitability depends, in part, on our ability to secure the necessary fresh food and supplies and to anticipate and adapt to changes in food and supply costs. Our purchasing personnel negotiate pricing with select suppliers and distributors in each market and we have long-term agreements with certain companies for the supply of some of our products. Various factors beyond our control, including adverse weather conditions, power
9
Table of Contents
shortages and governmental regulations, could cause our food and supply costs to increase. We cannot predict whether we will be able to obtain necessary food and supplies and to anticipate and adapt to changing food and supply costs by adjusting our purchasing practices. A failure to do so could adversely affect our operating results and cash flows.
Changes in consumer preferences or discretionary consumer spending could negatively impact our results.
Our restaurants feature Mexican fare served in a quick casual, limited service format. Our continued success depends, in part, upon the popularity of Mexican cuisine and this style of informal dining. Shifts in consumer preferences away from this type of cuisine or dining style could materially adversely affect our future profitability. Also, our success depends to a significant extent on numerous factors affecting discretionary consumer spending, including economic conditions, disposable consumer income and consumer confidence. Adverse changes in these factors could reduce customer traffic or impose practical limits on pricing, either of which could materially adversely affect our business, financial condition, operating results or cash flows.
We operate in a highly competitive industry.
Competition in the restaurant industry is increasingly intense. We compete on the basis of the taste, quality, and price of food offered, convenience, location and overall dining experience. Our competitors range from independent local operators to well capitalized national restaurant companies. While we believe that our restaurant concept is distinctive, we cannot assure you that other restaurant chains will not adopt a similar concept or be more successful in establishing restaurants using a similar concept. In addition, we compete with other restaurants and with retail establishments for real estate. Many of our competitors are well established and some of our competitors have substantially greater financial, marketing, real estate sourcing and other resources than we do, all of which may affect our ability to compete.
We and our franchisees are subject to extensive government regulations.
We are subject to various federal, state and local government regulations, as are our franchisees. Difficulties or failure in obtaining the required licenses and approvals could result in delaying or canceling the opening of new restaurants. Local authorities may suspend or deny renewal of our food licenses if they determine that our conduct does not meet applicable standards. We sell beer in our Texas restaurants and one of our franchisees sells beer in its Oregon restaurants and therefore we are also subject to those states’ alcoholic beverages licensing regulations and dram shop acts. We are also subject to state and local health code requirements, including regulations relating to food safety and food handling and storage. The failure to maintain the necessary governmental licenses, permits and approvals to operate our restaurants could have a material adverse effect on our operating results.
As a franchisor, we are subject to both regulation by the Federal Trade Commission and state laws regulating the offer and sale of franchises. The FTC and various state laws require us to furnish to prospective franchisees a franchise offering circular containing prescribed information, and a number of state laws require us to register before we may offer or sell franchises to operate in those jurisdictions, or to residents of those jurisdictions. Our failure to obtain or maintain approvals to sell franchises would cause us to lose franchise revenues. If we are unable to sell new franchises, our growth strategy will be significantly harmed. In addition, state laws that regulate substantive aspects of our relationships with our franchisees may limit, among other things, the duration and scope of non-competition provisions, the ability and notice requirements to terminate or refuse to renew a franchise or enforce our agreements, or otherwise resolve conflicts with our franchisees. The failure to comply with these regulations in any jurisdiction or to obtain required approvals could result in a ban or temporary suspension on future franchise sales, fines or require us to make a rescission offer to franchisees, any of which could adversely affect our business and operating results. Because a significant portion of our growth is through franchising, any impairment of our ability to develop new franchised restaurants will negatively affect us and our growth strategy more than if we planned to develop additional company-owned restaurants.
10
Table of Contents
Bills have also been introduced in Congress from time to time which provide for federal regulation of the franchisor-franchisee relationship in certain respects, although none has yet been enacted. Our ability to develop new franchised restaurants and to enforce contractual rights against our franchisees may be adversely affected by these laws and regulations, which could cause our projected franchise revenue growth to decline and adversely affect our growth strategy.
The Federal Americans with Disabilities Act prohibits discrimination on the basis of disability in public accommodations and employment. Although our restaurants are designed to be accessible to the disabled, we could be required to make modifications to our restaurants to provide service to, or make reasonable accommodation for, disabled persons. This could increase our costs and adversely affect our financial condition.
We are subject to regulations that impact our employees.
Various federal and state labor laws govern our relationship with our employees and affect operating costs. These laws include minimum wage requirements, overtime pay, unemployment tax rates, workers’ compensation rates, citizenship requirements and sales taxes. For instance, California has higher minimum wage and other requirements than other states. Additional government-imposed increases in minimum wages, overtime pay, paid leaves of absence and mandated health benefits, or increased tax reporting and tax payment requirements for employees who receive gratuities could materially adversely affect us.
Given the location of many of our restaurants, even though we operate our restaurants in compliance with the requirements of the Immigration and Naturalization Service, our employees may not all meet federal citizenship or residency requirements, which could lead to disruptions in our work force.
We face risk of litigation from customers, employees and in the ordinary course of our business. Litigation diverts our financial and management resources and the adverse publicity arising therefrom may cause customers to avoid our restaurants.
We are sometimes the subject of complaints or litigation from customers alleging illness, injury or other food quality, health or operational concerns. Like other restaurant chains, we can be materially adversely affected by negative publicity concerning food quality, illness, injury, publication of government or industry findings concerning food products served by us, or other health concerns or operating issues stemming from one restaurant or a limited number of restaurants. Adverse publicity resulting from these allegations may materially adversely affect us and our restaurants, regardless of whether the allegations are valid or whether we are liable. We are subject to the same risks of adverse publicity resulting from these sorts of allegations even if the claim actually involves one of our franchisees. Litigation diverts our financial and management resources that would otherwise be devoted to the operation of our company.
Further, we may be subject to employee claims in the future based on, among other things, discrimination, harassment, wrongful termination or employee classification for the determination of overtime pay. We have been subject to these employee claims before and we are currently defending against a putative wage and hour class action lawsuit, as described in more detail in “Business—Legal Proceedings.” We have not taken any reserve for this class action lawsuit. The success of the pending putative wage and hour class action lawsuit, a significant increase in the number of other claims or any increase in the number of successful claims could materially adversely affect our business, financial condition, operating results or cash flows.
63.0% of our restaurants are located in California. As a result, we are particularly susceptible to adverse trends and economic conditions in California.
The majority of our company-owned and franchised restaurants are located in California, with a significant majority of those located in Southern California. As a result, we are particularly susceptible to adverse trends and economic conditions in California. For example, in 2001, we experienced a sharp rise in utility costs in California
11
Table of Contents
as a result of recent power shortages. In addition, given our geographic concentration, negative publicity regarding any of our restaurants, particularly in Southern California, could have a material effect on our business and operations, as could other regional occurrences such as local strikes, earthquakes or other natural disasters.
Our current insurance may not provide adequate levels of coverage against claims.
We currently maintain insurance customary for businesses of our size and type. However, there are types of losses we may incur that cannot be insured against or that we believe are not economically reasonable to insure, such as losses due to earthquakes and other natural disasters. In view of the location of many of our restaurants in California, our operations are particularly susceptible to damage and disruption caused by earthquakes. Such damages could have a material adverse effect on our business and results of operations.
We may not be able to adequately protect our intellectual property, which could harm the value of our brands and branded products and adversely affect our business.
Our brands and branded products are very important to the conduct of our business. We rely on a combination of trademarks, copyrights, service marks, trade secrets and similar intellectual property rights to protect our brands and branded products. We also use our trademarks and other intellectual property on the Internet.
The success of our expansion strategy depends on our continued ability to use our existing trademarks and service marks in order to increase brand awareness and further develop our branded products. We, therefore, devote appropriate resources to the protection of our trademarks and proprietary rights. The protective actions that we take, however, may not be enough to prevent imitation by others, which may harm our image or our brand. We are aware that some businesses are using “Baja” and/or “Fresh” as part of a trademark or service mark associated with quick casual restaurants serving fresh Mexican food and we may not be able to prevent their continued use of these words, particularly in cases where their use predates our federal trademark and service mark registrations. There may be uses of marks similar to ours of which we are unaware, and which could arise from prior users. These uses could limit the expansion of our operations in certain jurisdictions by restricting the use of our marks in these jurisdictions. This could cause us to incur litigation costs or pay damages or licensing fees to a prior user of such similar marks.
We have registered certain marks, including “Baja Fresh,” and have other trademark registrations pending in the U.S. and several foreign jurisdictions. Not all of the marks which we use, or in which we claim rights, have been registered. The “Baja Fresh” mark, and other marks that we currently use have not been registered in all of the countries in which we may seek to do business and may never be registered in all of these countries. Our filings in several countries have been opposed by users of similar marks in those countries and there is no assurance that we will ultimately prevail in our efforts to register our marks in those or other countries.
We cannot assure you that we will be able to adequately protect our trademarks or that our use of these trademarks will not result in liability for trademark infringement, trademark dilution or unfair competition. We cannot assure you that all of the steps we have taken to protect our intellectual property in the U.S. and foreign countries will be adequate. In addition, the laws of some foreign countries do not protect intellectual property rights to the same extent as the laws of the U.S. If our efforts to enforce our trademarks and to protect our intellectual property are not adequate, or if any third party misappropriates or infringes on our intellectual property, either in print or on the Internet, the value of our brands may be harmed, which could have a material adverse effect on our business, including the failure of our brand and branded products to achieve and maintain market acceptance.
12
Table of Contents
Risks related to our capital stock
Our quarterly results may fluctuate and could fall below the expectations of securities analysts and investors due to seasonality and other factors, resulting in a decline in our stock price.
Our operating results will fluctuate because of several factors, including:
| • | costs and availability of food; |
| • | labor costs for our hourly and management personnel, including any increases in federal or state minimum wage requirements; |
| • | the timing of new restaurant openings and related expenses; |
| • | profitability of our new restaurants, especially in new markets; and |
| • | increases or decreases in system-wide comparable restaurant sales. |
In the past, our pre-opening costs have varied significantly primarily due to the timing and location of restaurant openings. In addition, our labor and operating costs for a newly opened restaurant during the first six periods of operation are often materially greater than what can be expected after that time, both in aggregate dollars and as a percentage of restaurant sales. As a result, the volume and timing of new restaurant openings in any quarter has had and is expected to continue to have a significant impact on quarterly pre-opening costs, labor costs and direct operating and occupancy expenses.
In addition, in accordance with accounting principles generally accepted in the United States, we evaluate our property and equipment for impairment by reducing the carrying value of the impaired assets to their estimated fair market value, less costs to sell, in the form of an impairment charge. Such impairment charge in any period will further increase the fluctuations in, and may have a material adverse effect on, our financial position and results of operations.
Our business is subject to seasonal fluctuations. Historically, sales in most of our restaurants have been higher during the summer months. As a result, we expect our highest earnings to occur in those periods. In addition to seasonality, and other factors discussed earlier, our operating results and system-wide comparable unit sales may fluctuate significantly.
Our existing shareholders will continue to control us after this offering, and they may make decisions with which you disagree.
Upon consummation of this offering, and after giving effect to the automatic conversion of all of our outstanding shares of preferred stock into 7,596,822 shares of common stock, our executive officers, directors and principal shareholders and their affiliates will own approximately [ ]% of the outstanding shares of common stock (or [ ]% if the underwriters’ over-allotment option is exercised). As a result, these shareholders will be able to control us and direct our affairs, including the election of directors and approval of significant corporate transactions. This concentration of ownership also may delay, defer or prevent a change in control, and make some transactions more difficult or impossible without the support of these shareholders. These transactions might include proxy contests, mergers, tender offers, open market purchase programs or other purchases of common stock that could give our shareholders the opportunity to realize a premium over the then-prevailing market price for shares of our common stock. See “Principal Shareholders,” which contains information regarding the beneficial ownership of our common stock.
13
Table of Contents
Approximately [ ] percent of our shares of common stock may be sold into the public market in the future, which could depress our stock price.
The [ ] shares of common stock sold in this offering (and shares sold upon exercise of the underwriters’ over-allotment option) will be freely tradable without restriction under the Securities Act of 1933. The 9,117,047 shares of common stock that are outstanding which are not sold upon exercise of the underwriters’ over-allotment option, are “restricted shares” within the meaning of Rule 144 under the Securities Act and sales of these shares are subject to restrictions under the Securities Act. Of these restricted shares, [ ] are subject to lock-up agreements under which the holders have agreed not to sell or otherwise dispose of any of their shares for a period of 180 days after the date of this prospectus without the prior written consent of Banc of America Securities LLC. In its sole discretion and at any time without notice, Banc of America Securities may release all or any portion of the shares subject to the lock-up agreements. All of the restricted shares subject to lock-up agreements will become available for sale in the public market immediately following expiration of the 180-day lock-up period, subject (to the extent applicable) to the volume and other limitations of Rule 144 or Rule 701 under the Securities Act. Beginning 90 days after the date of this prospectus, restricted shares not subject to lock-up agreements or contractual restrictions will become available for sale in the public market, subject to the volume and other limitations of Rule 144 or Rule 701. In addition, after expiration of the lock-up period, some of our security holders have the contractual right to require us to register some of their shares of common stock for future sale.
We intend to file a registration statement on Form S-8 covering shares of common stock issuable upon exercise of stock options in effect on the date of this prospectus and stock options or other stock rights to be granted in the future under our stock option plan. Upon the filing of the registration statement on Form S-8, and after the expiration of any applicable lock-up periods, up to an additional 983,038 shares of common stock, together with any additional shares of common stock that will be issuable pursuant to stock options or other stock rights granted in the future under our stock option plan, will be eligible for sale in the public market.
Sales of substantial amounts of common stock in the public market, or the perception that these sales may occur, could adversely affect the prevailing market price of our common stock and our ability to raise capital through a public offering of our equity securities. See “Shares Eligible for Future Sale,” which describes the circumstances under which restricted shares may be sold in the public market.
Our articles of incorporation permit our board of directors to issue new series of preferred stock that may have the effect of delaying or preventing a change in control of our company. This could adversely affect the value of your shares.
Our articles of incorporation authorize our board of directors to issue up to 15,000,000 shares of preferred stock and to determine the powers, preferences, privileges, rights, including voting rights, qualifications, limitations and restrictions of those shares, without any further vote or action by the shareholders. All of the currently outstanding shares of preferred stock will be converted into shares of common stock in connection with this offering and therefore the full 15,000,000 shares of preferred stock will be available for designation and issuance by our board of directors. The rights of the holders of our common stock will be subject to, and may be adversely affected by, the rights of the holders of any preferred stock that may be issued in the future. The issuance of preferred stock could have the effect of delaying, deterring, or preventing a change in control and could adversely affect the voting power of your shares.
In addition, provisions of California law could make it more difficult for a third party to acquire a majority of our outstanding voting stock by discouraging a hostile bid, or delaying or deterring a merger, acquisition or tender offer in which our shareholders could receive a premium for their shares, or a proxy contest for control of our company or other changes in our management. See “Description of Capital Stock” for a discussion of these provisions.
14
Table of Contents
This prospectus contains forward-looking statements that involve risks and uncertainties. These statements relate to our future plans, objectives, expectations and intentions. These statements may be identified by the use of words such as “expects,” “anticipates,” “intends,” “plans,” and similar expressions. Our actual results could differ materially from those discussed in these statements. Factors that could contribute to these differences include those discussed under “Risk Factors” above and elsewhere in this prospectus. The cautionary statements made in this prospectus should be read as being applicable to all forward-looking statements wherever they appear in this prospectus.
15
Table of Contents
We estimate that the net proceeds from the sale of the [ ] shares of common stock offered by us at an assumed initial public offering price of $[ ] per share, after deducting estimated underwriting discounts and estimated offering expenses, will be approximately $[ ], or $[ ] if the underwriters’ over-allotment option is exercised in full. We will not receive any proceeds from the sale of shares by the selling shareholders.
We intend to use approximately $30 million of the net proceeds from the offering to finance our continued growth and build-out of approximately 22 additional company-owned restaurants in 2002 and of an estimated 25 company-owned restaurants in 2003. We expect that in the future our cash investment, net of landlord contributions, will average approximately $525,000 to $650,000 per restaurant, excluding pre-opening costs, which are anticipated to be approximately $35,000 to $50,000 per restaurant.
We intend to use approximately $[ ] million of the net proceeds from the offering to repay outstanding bank debt under our existing credit agreement with Western Financial Bank. Our credit facility consists of a $16.0 million development line of credit and a $2.0 million revolving line of credit. We have drawn approximately $[ ] million under the development line of credit. Both the development line of credit and the revolving line of credit bear interest at the lending bank’s reference rate as of the date of the borrowing plus 0.25% or at LIBOR plus 3.0%. As of March 25, 2002, the interest rate for both the revolving and development lines of credit was 5.0%. The lines of credit expire on September 30, 2002, and the development line can be extended at our option to December 31, 2002. Upon expiration, the development line of credit converts into a five year term loan. The amount of debt outstanding under the credit facility with Western Financial Bank was used to finance our development and build-out of restaurants.
We intend to use approximately $1.5 million of the net proceeds from the offering to repay amounts due under a promissory note we issued to Jim Magglos, our founder and one of our directors. The note bears interest at a rate of 6.0% per annum and the remaining principal balance of $1.5 million and accrued interest thereon is due and payable on November 24, 2002.
The balance of the net proceeds from this offering will be used for working capital and for general corporate purposes.
Pending application of the net proceeds, we intend to invest the net proceeds in short-term, investment-grade, interest-bearing securities. See “Management’s Discussion and Analysis of Financial Condition and Results of Operations—Liquidity and Capital Resources” for additional information regarding our sources and uses of capital.
16
Table of Contents
We have never declared or paid cash dividends. We currently intend to retain all future earnings for the operation and expansion of our business and do not anticipate paying cash dividends on our common stock in the foreseeable future. Any payment of cash dividends in the future will be at the discretion of our board of directors and will depend upon our results of operations, earnings, capital requirements, contractual restrictions contained in our credit agreements or other agreements, and other factors deemed relevant by our board. In addition, our current credit facility prohibits us from paying any cash dividends without our lender’s consent.
17
Table of Contents
The following table sets forth at December 31, 2001 our capitalization on an actual basis and on a pro forma as adjusted basis to reflect the sale of the shares of common stock offered by us in this offering, the application of the net proceeds from this offering and the conversion of all of our preferred stock into common stock at the public offering price. This table reflects our sale of [ ] shares of common stock in this offering at a price per share of $[ ] and is based on the number of shares of common and preferred stock outstanding at December 31, 2001. This table excludes 1,115,538 shares of common stock issuable upon the exercise of options and warrants outstanding at a weighted average exercise price of $6.58 per share. The capitalization information set forth in the table below is qualified by the more detailed consolidated financial statements and related notes included elsewhere in this prospectus and should be read in conjunction with those financial statements and related notes.
December 31, 2001 | |||||||
Actual | As Adjusted | ||||||
(dollars in thousands) | |||||||
| Cash and cash equivalents | $ | 439 | $ | ||||
| Long-term debt, including current portion | $ | 1,686 | $ | ||||
| Redeemable convertible preferred stock: 15,000,000 shares authorized, 6,232,853 shares issued and outstanding, pro forma as adjusted(1) | 45,740 | ||||||
| Put warrants | 354 | ||||||
| Shareholders’ equity (deficiency): | |||||||
| Common stock | 3,103 | ||||||
| Notes receivable from purchases of common stock | (1,638 | ) | |||||
| Warrants | 90 | ||||||
| Accumulated deficit | (18,555 | ) | |||||
| Total shareholders’ equity (deficiency) | (17,000 | ) | |||||
| Total capitalization | $ | 30,780 | $ | ||||
| (1) | Our preferred stock is divided into three series: Series A convertible preferred stock, without par value, 2,727,941 shares issued and outstanding; Series B convertible preferred stock, without par value, 2,153,507 shares issued and outstanding; and Series C convertible preferred stock, without par value, 1,351,405 shares issued and outstanding. 7,596,822 shares of our common stock will be issued upon the automatic conversion of our preferred stock concurrently with this offering. |
18
Table of Contents
Our net tangible book value as of December 31, 2001, after giving effect to the automatic conversion of all outstanding shares of our preferred stock into 7,596,822 shares of common stock upon consummation of this offering, and after giving effect to the sale of shares of common stock offered by us at an assumed initial public offering price of $[ ] and our receipt of the estimated net proceeds after deducting estimated underwriting discounts and estimated offering expenses, was approximately $[ ] million or $[ ] per share of common stock. This represents an immediate increase in net tangible book value of $[ ] per share to existing shareholders and an immediate dilution of pro forma net tangible book value of $[ ] per share to new investors. If the initial public offering price is higher or lower, the dilution to the new investors will be greater or less. The following table illustrates this per share dilution:
| Assumed initial public offering price per share | $ | |||||
| Net tangible book value per share as of December 31, 2001 | $ | |||||
| Increase in net tangible book value per share attributable to new investors | ||||||
| Pro forma net tangible book value per share after the offering | ||||||
| Dilution per share to new investors | $ | |||||
The following table summarizes as of December 31, 2001, on a pro forma basis, the number of shares of common stock purchased from us, the total consideration paid to us, and the average price per share paid by existing shareholders and by the investors purchasing shares of common stock in this offering (before deducting estimated underwriting discounts and estimated offering expenses):
Shares Purchased | Total Consideration | Average Price Per Share | ||||||||||||||
Number | Percent | Amount | Percent | |||||||||||||
| Existing shareholders | 9,117,047 | [ | ]% | $ | [ | ](1) | [ | ]% | $ | 5. 88 | ||||||
| New investors | $ | [ | ] | |||||||||||||
| Total | 100.0 | % | $ | [ | ] | 100.0 | % | |||||||||
| (1) | Assumes repayment of all outstanding amounts due from certain of our officers and directors pursuant to secured promissory notes. See “Certain Relationships and Related Transactions”. |
The tables and calculations above assume no exercise of outstanding options and warrants to purchase 1,115,538 shares of our common stock at a weighted average exercise price of $6.58 per share. To the extent these options and warrants are exercised, there will be further dilution to new investors. See “Management—Stock Plans” and notes 9 and 10 of the notes to consolidated financial statements for additional information on our outstanding options and the put warrant.
19
Table of Contents
The following selected consolidated financial and operating data for each of the five fiscal years in the period ended December 31, 2001 are derived from our audited consolidated financial statements. The audited consolidated financial statements and notes for each of the three fiscal years in the period ended December 31, 2001, and the report of independent auditors on those years, are included elsewhere in this prospectus. This selected consolidated financial and operating data should be read in conjunction with the consolidated financial statements and notes, “Management’s Discussion and Analysis of Financial Condition and the Results of Operations” and other financial information included elsewhere in this prospectus.
Fiscal Year | ||||||||||||||||||||
1997 | 1998 | 1999 | 2000 | 2001 | ||||||||||||||||
($ in thousands, except per share data and footnotes) | ||||||||||||||||||||
Statements of Operations Data: | ||||||||||||||||||||
| Revenues: | ||||||||||||||||||||
| Restaurant sales | $ | 12,780 | $ | 16,857 | $ | 22,824 | $ | 37,971 | $ | 72,796 | ||||||||||
| Royalties, franchise and other revenues | 1,242 | 1,753 | 2,238 | 3,318 | 5,253 | |||||||||||||||
| Total revenues | 14,022 | 18,610 | 25,062 | 41,289 | 78,049 | |||||||||||||||
| Cost and expenses: | ||||||||||||||||||||
| Restaurant operating costs: | ||||||||||||||||||||
| Cost of sales | 5,729 | 6,974 | 8,046 | 13,368 | 24,716 | |||||||||||||||
| Labor | 4,294 | 5,657 | 7,142 | 12,782 | 23,849 | |||||||||||||||
| Direct operating and occupancy | 1,604 | 2,483 | 3,282 | 6,229 | 14,377 | |||||||||||||||
| Total restaurant operating costs | 11,627 | 15,114 | 18,470 | 32,379 | 62,942 | |||||||||||||||
| General and administrative | 2,800 | 2,282 | 4,470 | 6,501 | 8,640 | |||||||||||||||
| Depreciation and amortization | 302 | 577 | 736 | 1,579 | 3,448 | |||||||||||||||
| Pre-opening | — | — | 63 | 915 | 1,288 | |||||||||||||||
| Non-cash stock compensation(1) | — | — | 872 | 228 | 400 | |||||||||||||||
| Loss on asset impairment | — | 463 | — | — | 375 | |||||||||||||||
| Total costs and expenses | 14,729 | 18,436 | 24,611 | 41,602 | 77,093 | |||||||||||||||
| Operating income (loss) | (707 | ) | 174 | 451 | (313 | ) | 956 | |||||||||||||
| Other income (expense): | ||||||||||||||||||||
| Interest income | 1 | 33 | 82 | 301 | 178 | |||||||||||||||
| Interest expense(2) | (98 | ) | (313 | ) | (328 | ) | (401 | ) | (769 | ) | ||||||||||
| Other income (expense), net(3) | (467 | ) | (174 | ) | (3 | ) | 28 | 50 | ||||||||||||
| Gain (loss) on disposition of assets | — | (231 | ) | — | 331 | (54 | ) | |||||||||||||
| Total other income (expense), net | (564 | ) | (685 | ) | (249 | ) | 259 | (595 | ) | |||||||||||
Income (loss) before income tax provision (benefit) and minority interest | (1,271 | ) | (511 | ) | 202 | (54 | ) | 361 | ||||||||||||
| Income tax provision (benefit) | 1 | 27 | (73 | ) | 80 | 320 | ||||||||||||||
| Minority interest | 163 | 235 | — | — | — | |||||||||||||||
| Net income (loss) | $ | (1,109 | ) | $ | (303 | ) | $ | 275 | $ | (134 | ) | $ | 41 | |||||||
| Redeemable convertible preferred stock accretion | — | — | (173 | ) | (197 | ) | (230 | ) | ||||||||||||
| Net income (loss) attributable to common shareholders(4) | $ | (1,109 | ) | $ | (303 | ) | $ | 102 | $ | (331 | ) | $ | (189 | ) | ||||||
| Net income (loss) attributable to common shareholders per share(5): | ||||||||||||||||||||
| Basic | $ | 0.07 | $ | (0.22 | ) | $ | (0.12 | ) | ||||||||||||
| Diluted | $ | 0.05 | $ | (0.22 | ) | $ | (0.12 | ) | ||||||||||||
| Shares used in calculating net income (loss) attributable to common shareholders per share(5): | ||||||||||||||||||||
| Basic | 1,506,208 | 1,520,225 | 1,520,225 | |||||||||||||||||
| Diluted | 5,660,400 | 1,520,225 | 1,520,225 | |||||||||||||||||
Pro Forma Data(6)(7): | ||||||||||||||||||||
| Net income (loss) attributable to common shareholders | $ | |||||||||||||||||||
| Net income (loss) attributable to common shareholders per share: | ||||||||||||||||||||
| Basic | $ | |||||||||||||||||||
| Diluted | $ | |||||||||||||||||||
| Shares used in calculating net income (loss) attributable to common shareholders per share: | ||||||||||||||||||||
| Basic | ||||||||||||||||||||
| Diluted | ||||||||||||||||||||
20
Table of Contents
Fiscal Year | ||||||||||||||||||||
1997 | 1998 | 1999 | 2000 | 2001 | ||||||||||||||||
Selected Operating Data: | ||||||||||||||||||||
System-wide restaurant information | ||||||||||||||||||||
| System-wide restaurants open at end of period | 34 | 47 | 57 | 96 | 151 | |||||||||||||||
| System-wide sales | $ | 33,731 | $ | 54,924 | $ | 74,797 | $ | 106,807 | $ | 176,690 | ||||||||||
| System-wide comparable restaurants sales growth(8) | 17.2 | % | 8.7 | % | 8.1 | % | 7.7 | % | 8.0 | % | ||||||||||
Company-owned restaurant information | ||||||||||||||||||||
| Company-owned restaurants open at end of period | 12 | 13 | 18 | 39 | 67 | |||||||||||||||
| Company-owned restaurant sales | $ | 12,780 | $ | 16,857 | $ | 22,824 | $ | 37,971 | $ | 72,796 | ||||||||||
| Company-owned restaurant operating costs | 11,627 | 15,114 | 18,470 | 32,379 | 62,942 | |||||||||||||||
| Company-owned restaurant level cash flow(9) | $ | 1,153 | $ | 1,743 | $ | 4,354 | $ | 5,592 | $ | 9,854 | ||||||||||
| Company-owned restaurant level cash flow margin | 9.0 | % | 10.3 | % | 19.1 | % | 14.7 | % | 13.5 | % | ||||||||||
| Company-owned comparable restaurant sales growth(8) | 10.1 | % | 5.5 | % | 0.3 | % | 7.4 | % | 6.6 | % | ||||||||||
| Operating income before pre-opening costs and non-cash charges(10) | $ | (405 | ) | $ | 1,214 | $ | 2,122 | $ | 2,409 | $ | 6,467 | |||||||||
| Operating income before pre-opening costs and non-cash charges margin | (2.9 | )% | 6.5 | % | 8.5 | % | 5.8 | % | 8.3 | % | ||||||||||
Fiscal Year | Pro Forma as Adjusted(11) | |||||||||||||||||||||
1997 | 1998 | 1999 | 2000 | 2001 | ||||||||||||||||||
(unaudited) | ||||||||||||||||||||||
Balance Sheet Data: | ||||||||||||||||||||||
| Cash and cash equivalents | $ | 1,280 | $ | 3,590 | $ | 2,013 | $ | 1,691 | $ | 439 | $ | |||||||||||
| Total assets | 4,413 | 7,164 | 9,880 | 27,039 | 41,854 | |||||||||||||||||
| Total debt, including current portion | 1,908 | 5,244 | 2,587 | 2,329 | 1,686 | |||||||||||||||||
| Redeemable convertible preferred stock | — | 17,590 | 17,762 | 33,407 | 45,740 | |||||||||||||||||
| Total shareholders’ equity (deficiency) | 718 | (18,034 | ) | (17,069 | ) | (17,147 | ) | (17,000 | ) | |||||||||||||
| (1) | In connection with our recapitalization in November 1998, we made loans to Messrs. Dollarhyde and Siracusa to purchase shares of our common stock. The loans were limited recourse and, as such, we were required to recognize a non-cash stock compensation expense representing the difference between the estimated fair market value of the common stock at the end of each reporting period and the original purchase price of the related common stock. In April 2002, we reached agreement with Messrs. Dollarhyde and Siracusa to amend these notes to become full recourse, and subsequent to that time, we are no longer required to recognize a non-cash stock compensation expense. These loans are non-amortizing and are due on November 24, 2003. See “Certain Relationships and Related Transactions”. |
| (2) | In November 1998, we issued a put warrant for 75,000 shares that obligates us to reacquire the put warrant from the holder upon the occurrence of certain events. Interest expense for fiscal 2001 includes $298,000 attributable to an increase in the estimated fair market value of the put warrant obligation. |
| (3) | Other income (expense) for 1997 and 1998 includes $467,000 and $174,000 related to legal settlement costs and other miscellaneous expenses, respectively. |
| (4) | Net income (loss) attributable to common shareholders includes the effect of the accretion of preferred stock to liquidation preference, which reduces net income or increases net loss attributable to common shareholders for the relative periods. |
| (5) | See notes 2 and 11 of the notes to audited consolidated financial statements for an explanation of the method used to calculate the net income (loss) attributable to common shareholders per share and shares used in computing net income (loss) per share, basic and diluted. |
| (6) | Pro forma net income (loss) attributable to common shareholders for 2001 is the result of the elimination of $326,000 in interest expense, net of taxes, related to the repayment of bank debt, the elimination of $117,000 in interest expense, net of taxes, related to the repayment of amounts due under a promissory note we issued to Jim Magglos, our founder and one of our directors, and the elimination of $230,000 in accretion of preferred stock to liquidation preference upon the automatic conversion of our preferred stock. |
| (7) | Pro forma information gives effect, as of the beginning of each period, to the sale of [ ] shares of common stock offered by us in this offering and the conversion of all outstanding shares of our preferred stock into 7,596,822 shares of common stock as of the beginning of 2001. |
21
Table of Contents
| (8) | System-wide and company-owned restaurants are included in the computation of comparable restaurant sales after they have been open for a full 13 four-week periods. In 1999, we intentionally cannibalized a number of company-owned restaurants in the established Southern California market in order to attain greater overall market share. |
| (9) | Company-owned restaurant level cash flow is calculated using total restaurant sales less cost of sales, labor and direct operating and occupancy costs. |
| (10) | Operating income before pre-opening costs and non-cash charges is calculated before pre-opening costs, non-cash stock compensation expense, loss on asset impairment and depreciation and amortization. |
| (11) | Reflects our receipt of estimated net proceeds of $[ ] from the sale of [ ] shares of common stock offered by us at an assumed initial public offering price of $[ ] per share, net of estimated underwriting discounts and estimated offering expenses, the conversion of all outstanding shares of our preferred stock into 7,596,822 shares of common stock, the use of net proceeds to repay $1,500,000 due under a promissory note we issued to Jim Magglos, our founder and one of our directors, and $[ ], including accrued interest, in bank debt. See “Use of Proceeds”. |
22
Table of Contents
CONDITION AND RESULTS OF OPERATIONS
Overview
As of March 25, 2002, we own and operate 72 quick casual restaurants under the name “Baja Fresh Mexican Grill”. We also franchise our concept and have 85 additional restaurants that operate under franchise agreements, for a system-wide total of 157 restaurants in 14 states and the District of Columbia. Our restaurants serve a wide variety of freshly prepared, flavorful Mexican food. During our almost 12 years of operating history, we believe we have developed a strong brand with high levels of customer satisfaction and growing brand awareness across the United States. This is demonstrated by our 28 consecutive quarters of positive system-wide comparable restaurant sales growth.
We opened our first Baja Fresh Mexican Grill in Newbury Park, California in August 1990 and grew steadily to 44 restaurants by mid-1998. In November 1998, Greg Dollarhyde, our president and chief executive officer, structured a series of transactions to effect a recapitalization of our company. As a result of these transactions, three knowledgeable restaurant and retail industry investors, Messrs. Dollarhyde and Siracusa and other new investors acquired a controlling interest in our company through the purchase of shares of our Series A convertible preferred stock. Under the terms of the recapitalization agreements, we redeemed 76.8% of our outstanding shares of common stock from our original shareholders for approximately $18.5 million. Of this amount, $2.0 million was paid in the form of a promissory note to our founder, and the balance was paid in cash. We also issued shares of our common stock to Messrs. Dollarhyde and Siracusa and other new investors, and entered into a $6.0 million line of credit.
Following the recapitalization, Mr. Dollarhyde assembled a professional management team including Don Breen, our chief financial officer, and Steve Heeley, our senior vice president of operations. Our new management team focused us on the consistent execution of our concept, implemented systems for operational efficiencies and prepared us for rapid growth. Since 1998, our new management team has improved purchasing and distribution economics and labor management, instituted a disciplined strategy to grow through franchise and company-owned restaurant development and established a culture of open and honest communication, and mutual respect that is focused on delivering results. We believe these initiatives, coupled with the dining value provided by our high quality, consistently fresh and flavorful food, upbeat and courteous customer service and average guest check of approximately $7.50, have enabled us to achieve system-wide comparable restaurant sales growth of 8.1% in 1999, 7.7% in 2000 and 8.0% in 2001.
Our management team adheres to an aggressive but disciplined growth plan. Since the recapitalization, we grew from 47 restaurants at the end of 1998 to a system-wide total of 157 restaurants by opening 56 company-owned and 54 franchise restaurants. We intend to open 22 new company-owned restaurants in 2002 and 25 new company-owned restaurants in 2003. We also expect our franchisees to open 37 new restaurants in 2002 and 35 new restaurants in 2003.
23
Table of Contents
Our new restaurants typically experience lower revenues and operating margins during the first two years, due to lack of brand awareness and operational inefficiencies. We generally expect all restaurants to reach system averages in sales and profitability in their third year of operations. As a result, we categorize our restaurants into the three groups described in the table below:
Restaurants Open
Stage of Operations(1) | Company/Franchisee | Fiscal Year | ||||||
1999(2) | 2000 | 2001 | ||||||
| Startup (13 periods of operations or less) | Company | 6 | 20 | 30 | ||||
| Franchisee | 6 | 17 | 27 | |||||
| Growing (14 to 26 periods of operations) | Company | 2 | 5 | 20 | ||||
| Franchisee | 10 | 6 | 17 | |||||
| Established (more than 26 periods of operations) | Company | 11 | 12 | 17 | ||||
| Franchisee | 23 | 34 | 40 | |||||
| (1) | We operate on a full 13 four-week periods fiscal year. |
| (2) | Includes one joint venture restaurant. |
Significant accounting policies
Property and equipment
We account for the impairment and disposition of long-lived assets in accordance with SFAS No. 144, “Accounting for Impairment or Disposal of Long-Lived Assets”. In accordance with SFAS No. 144, long-lived assets to be held and used in operations are reviewed for events or changes in circumstances which indicate that their carrying value may not be recoverable. We recognize the impairment of certain property and equipment by reducing the carrying value of the assets to their estimated fair market value based on discounted cash flows of each underperforming restaurant.
Revenue recognition
Revenues from the operation of company-owned restaurants are recognized when sales occur. These sales are primarily made in cash or by credit card.
We account for franchise fees received in accordance with SFAS No. 45, “Accounting for Franchise Fee Revenue”. Revenue from individual and area franchise sales is recognized as income when we have substantially performed all of our material obligations under the franchise agreement and the franchisee has commenced operations. Continuing royalty and service fees, which are a percentage of the gross sales of franchised operations, are accrued as income when earned as revenues by our franchisees.
Stock-based compensation
SFAS No. 123, “Accounting for Stock-Based Compensation,” encourages but does not require a fair-value-based method of accounting for employee stock options or similar equity instruments. SFAS No. 123 allows an entity to elect to continue to measure compensation costs under Accounting Principles Board Opinion (APB) No. 25, “Accounting for Stock Issued to Employees,” but requires pro forma disclosure of net earnings as if the fair-value-based method of accounting had been applied. We elected to continue to apply the provisions of APB No. 25 and provide the pro forma disclosure provisions of SFAS No. 123. (See note 10 of the notes to our audited consolidated financial statements.)
24
Table of Contents
Financial definitions
Revenues. Our revenues are comprised primarily of company-owned restaurant sales. Our restaurant sales are comprised entirely of food and beverage sales. Royalties, franchise fees and other revenues make up the balance of our total revenues. Royalties, franchise fees and other revenues consist primarily of fees associated with area development agreements, fees associated with franchisee store openings and on-going fees based on franchised store revenues.
Cost of sales. Cost of sales include food, beverage and paper supply expenses. The components of costs of sales are substantially variable and increase and decrease with sales volume.
Labor. Labor costs include wages, bonuses, taxes and benefits for unit level management and hourly employees.
Direct operating and occupancy. Direct operating and occupancy costs include restaurant supplies, utilities, fixed rent, percentage rent, common area maintenance charges, real estate taxes, repairs and maintenance and other related costs.
General and administrative. General and administrative costs include all company and administrative functions that support existing operations and provide infrastructure to facilitate our future growth. Components of this category include home office management and support staff and regional supervisory salaries and related employee benefits, travel, information systems, training, corporate rent, professional and consulting fees and promotional expenses.
Depreciation and amortization. Depreciation and amortization costs principally include depreciation and amortization on capital expenditures for restaurants.
Pre-opening. Pre-opening costs, which are expensed as incurred, consist of the costs of hiring and training the initial workforce, travel, relocation, the cost of food used in training, marketing costs and other direct costs related to the opening.
Comparable restaurant sales. In calculating comparable restaurant sales, we include a restaurant in the comparable base after it has been open for a full 13 four-week periods. As of March 25, 2002, we had 43 company-owned restaurants and 56 franchised restaurants that met this criteria.
Restaurant purchases, sales and closures
In August 1999, we bought a restaurant located in Colorado from one of our franchisees. In June 2000, we bought the remaining 50.0% interest in a Baja Fresh Mexican Grill located in California from a joint venture partner. In the fourth quarter of 2000, we sold the restaurant we purchased in 1999 for a combination of cash and notes, and in a separate transaction, we sold a restaurant located in California. The sales were consummated as part of two new separate area development agreements. We expect that we may have additional opportunities in the future to acquire restaurants from franchisees and to sell company-owned restaurants to franchisees.
Prior to the recapitalization in 1998, one of our franchised restaurants in Pasadena, California was closed. After the recapitalization, a restaurant we previously transferred to a franchisee in Colorado in connection with the recapitalization and a franchised restaurant in Ohio were also closed.
25
Table of Contents
Results of operations
Our operating results for 1999, 2000 and 2001 are expressed as a percentage of total revenues below, except for restaurant operating costs, which are expressed as a percentage of restaurant sales:
Fiscal Year | |||||||||
1999 | 2000 | 2001 | |||||||
Statements of Operations Data: | |||||||||
| Revenues: | |||||||||
| Restaurant sales | 91.1 | % | 92.0 | % | 93.3 | % | |||
| Royalties, franchise and other revenues | 8.9 | 8.0 | 6.7 | ||||||
| Total revenues | 100.0 | 100.0 | 100.0 | ||||||
| Cost and expenses: | |||||||||
| Restaurant operating costs: | |||||||||
| Cost of sales | 35.3 | 35.2 | 34.0 | ||||||
| Labor | 31.3 | 33.7 | 32.8 | ||||||
| Direct operating and occupancy | 14.4 | 16.4 | 19.7 | ||||||
| Total restaurant operating costs | 81.0 | 85.3 | 86.5 | ||||||
| General and administrative | 17.8 | 15.7 | 11.1 | ||||||
| Depreciation and amortization | 2.9 | 3.8 | 4.4 | ||||||
| Pre-opening costs | 0.3 | 2.2 | 1.7 | ||||||
| Non-cash stock compensation | 3.5 | 0.6 | 0.5 | ||||||
| Loss on asset impairment | — | — | 0.5 | ||||||
| Total costs and expenses | 98.2 | 100.8 | 98.8 | ||||||
| Operating income (loss) | 1.8 | (0.8 | ) | 1.2 | |||||
| Other income (expense): | |||||||||
| Interest income | 0.3 | 0.7 | 0.2 | ||||||
| Interest expense | (1.3 | ) | (1.0 | ) | (1.0 | ) | |||
| Other income (expense), net | — | 0.1 | 0.1 | ||||||
| Gain (loss) on disposition of assets | — | 0.8 | (0.1 | ) | |||||
| Total other income (expense), net | (1.0 | ) | 0.6 | (0.8 | ) | ||||
| Income (loss) before income tax provision (benefit) | 0.8 | (0.1 | ) | 0.5 | |||||
| Income tax provision (benefit) | (0.3 | ) | 0.2 | 0.4 | |||||
| Net income (loss) | 1.1 | % | (0.3 | )% | 0.1 | % | |||
2001 (52 weeks) compared to 2000 (52 weeks)
Total revenues. Total revenues increased by $36.8 million, or 89.0%, to $78.0 million in 2001 from $41.3 million in 2000 due to a $34.8 million increase in restaurant sales and $1.9 million increase in royalties, franchise and other revenues. The increase in restaurant sales was primarily due to $18.9 million of additional sales from a full year of operations for 21 of the company-owned restaurants that were opened in 2000, $0.6 million in sales from the consolidation of one joint venture restaurant, $16.2 million of sales derived from the 28 company-owned restaurants opened during 2001 and $1.1 million from comparable restaurant sale increases from restaurants open the entire year. This increase in restaurant sales was partially offset by the $2.0 million loss of revenues from the two restaurants which were sold in the fourth quarter of 2000. The increase in comparable restaurant sales was primarily due to higher customer counts and an increase in the average guest check, and also reflect modest price increases and incremental shifts in our menu mix. The increase in royalties, franchise and other revenues was primarily due to 27 new franchised restaurants that opened in 2001, a full year of operations for the 16 new franchised restaurants that were opened in 2000 and comparable restaurant sales increases at franchised restaurants.
26
Table of Contents
Cost of sales. Cost of sales increased by $11.3 million, or 84.9%, to $24.7 million in 2001 from $13.4 million in 2000. The increase in cost of sales was primarily due to the opening of 28 new company-owned restaurants in 2001 and a full year of operations for 21 of the company-owned restaurants that were opened in 2000. Cost of sales as a percentage of restaurant sales decreased to 34.0% in 2001 from 35.2% in 2000. This decrease as a percentage of restaurant sales was a result of a reduction in the cost of chicken and steak and lower dairy costs, coupled with the implementation of an operations initiative to improve kitchen management and food preparation efficiency.
Labor. Labor costs increased by $11.1 million, or 86.6%, to $23.8 million in 2001 from $12.8 million in 2000. Labor costs as a percentage of restaurant sales decreased to 32.8% in 2001 from 33.7% in 2000. This decrease in labor costs as a percentage of restaurant sales was primarily attributable to efficiencies achieved in our existing restaurant base.
The state of California increased its minimum wage by $0.50 per hour on January 1, 2001 to $6.25 per hour. The increase did not have a significant impact on labor expense as a percentage of restaurant sales during 2001, as a majority of our hourly employees earned wages in excess of the new minimum wage requirement. In addition, the state of California increased minimum wage again on January 1, 2002 by another $0.50 per hour to $6.75. We believe the increase in minimum wage in 2002 will not have a material impact on labor expenses as a percentage of total restaurant sales.
Direct operating and occupancy. Direct operating and occupancy costs increased by $8.1 million, or 130.8%, to $14.4 million in 2001 from $6.2 million in 2000. The increase in direct operating and occupancy costs was primarily due to the opening of 28 new company-owned restaurants in 2001 and a full year of operations for 21 of the company-owned restaurants that were opened in 2000. Direct operating and occupancy costs as a percentage of restaurant sales increased to 19.7% in 2001 from 16.4% in 2000. The increase in direct operating and occupancy costs as a percentage of restaurant sales was primarily due to higher occupancy costs in new restaurants, an increase in bank charges as a result of our decision to start accepting credit cards at our restaurants, increased utility costs and increased promotional costs in our newer restaurants to promote trial and brand awareness.
General and administrative. General and administrative costs increased by $2.1 million, or 32.9%, to $8.6 million in 2001 from $6.5 million in 2000. The increase in general and administrative costs was primarily due to the growth in our administrative infrastructure in order to manage our rapid growth plans. General and administrative costs as a percentage of total revenues decreased to 11.1% in 2001 from 15.7% in 2000. The decrease in general and administrative costs as a percentage of total revenues was primarily due to our ability to utilize our existing infrastructure to support new restaurants partially offset by our administrative infrastructure to manage our expansion.
Depreciation and amortization. Depreciation and amortization costs increased $1.9 million, or 118.4%, to $3.4 million in 2001 from $1.6 million in 2000. The increase was primarily due to the additional depreciation and amortization related to the opening of 28 new company-owned restaurants in 2001 and a full year of operations of 21 of the company-owned restaurants that were opened in 2000.
Pre-opening. Pre-opening costs increased by $0.4 million, or 40.8%, to $1.3 million in 2001 from $0.9 million in 2000. The increase in pre-opening costs was primarily due to the opening of 28 new company-owned restaurants in 2001 compared to the opening of 22 new company-owned restaurants in 2000.
Non-cash stock compensation. Non-cash stock compensation costs represent the expense relating to the increase in the estimated fair value of our common stock over its acquisition cost, as the common stock was sold to two of our directors using limited recourse loans. The loans were not full recourse and, as such, we were required to recognize a non-cash stock compensation expense representing the difference between the estimated fair value of the common stock at the end of each reporting period and the original purchase price of the related common stock. Non-cash stock compensation costs increased by $0.2 million to $0.4 million in 2001 from $0.2 million in 2000 due to the related increase in the estimated fair value of our common stock.
27
Table of Contents
Loss on asset impairment. Loss on asset impairment costs was $0.4 million in 2001 due to the write-down of the carrying costs of one of our restaurant locations determined to be impaired in accordance with Statement of Financial Accounting Standards (SFAS) No. 144 “Accounting for Impairment or Disposal of Long-Lived Assets”. We did not recognize any loss on asset impairment in 2000.
Interest income. Interest income decreased by $0.1 million, or 40.9%, to $0.2 million in 2001 from $0.3 million in 2000. The decrease in interest income was primarily due to principal repayments received on certain interest bearing notes receivable during 2001.
Interest expense. Interest expense increased by $0.4 million, or 91.8%, to $0.8 million in 2001 from $0.4 million in 2000. The increase in interest expense was primarily due to an increase in average net borrowings and an increase in the maximum potential obligation of put warrants during 2001. We issued a put warrant for 75,000 shares that obligates us to reacquire the put warrant from the holder upon the occurrence of certain events.
Gain (loss) on disposition of assets. Gain (loss) on disposition of assets decreased $0.4 million, or 116.3%, to $(0.1) million in 2001 from $0.3 million in 2000. This decrease is the result of the sale of two restaurant locations to franchisees in 2000, offset by a write-off of various assets as a result of the relocation of one our restaurants at the end of its lease term.
Income tax provision (benefit). The income tax provision (benefit) in 2001 and 2000 differs from the expected income tax provision derived by applying the effective tax rate primarily as a result of non-cash stock compensation expense which is recognized for financial reporting purposes, but disallowed for federal and state income tax reporting purposes.
Net income (loss). Net income was $41,000 in 2001 as compared to a net loss of $134,000 in 2000. Net income as a percentage of total revenues increased to 0.1% in 2001 from (0.3%) in 2000. The increase was due primarily to increased revenues and operating margins, partially offset by non-cash stock compensation and a loss on asset impairment.
2000 (52 weeks) compared to 1999 (53 weeks)
Total revenues. Total revenues increased by $16.2 million, or 64.7%, to $41.3 million in 2000 from $25.1 million in 1999 due to a $15.1 million increase in restaurant sales and a $1.1 million increase in royalties, franchise and other revenues. The increase in restaurant sales was primarily due to $3.0 million in sales from a full year of operations for the five company-owned restaurants that were opened in 1999, $9.7 million in sales derived from the 22 company-owned restaurants opened in 2000, $1.8 million in comparable restaurant sales increases from restaurants owned for all of 1999 and 2000 and $0.6 million from restaurant sales recognized from the consolidation of one restaurant purchased from a joint venture partner in June 2000. This increase in restaurant sales was partially offset by one less week of operations in 2000 as compared to 1999. The increase in comparable restaurant sales was primarily due to higher customer counts and an increase in the average guest check and also reflect modest price increases and incremental shifts in our menu prices. The increase in royalties, franchise and other revenues was primarily due to 16 new franchised restaurants that opened in 2000, a full year of operations for the six new franchised restaurants that were opened in 1999 and comparable restaurant sales increases at franchised restaurants.
Cost of sales. Cost of sales increased by $5.3 million, or 66.1%, to $13.4 million in 2000 from $8.0 million in 1999. The increase in cost of sales was primarily due to the opening of 22 new company-owned restaurants in 2000 and a full year of operations for the five company-owned restaurants that were opened in 1999. Cost of sales as a percentage of restaurant sales decreased to 35.2% in 2000 from 35.3% in 1999. The decrease as a percentage of restaurant sales was primarily a result of the reduction of the cost of dairy products and produce offset by an increase in meat costs.
28
Table of Contents
Labor. Labor costs increased by $5.6 million, or 79.0%, to $12.8 million in 2000 from $7.1 million in 1999. Labor as a percentage of restaurant sales increased to 33.7% in 2000 from 31.3% in 1999. The increase in labor as a percentage of restaurant sales was primarily due to operating inefficiencies typical of recently opened restaurants, as we opened 22 new company-owned restaurants and more than doubled the number of restaurants in 2000.
Direct operating and occupancy. Direct operating and occupancy costs increased by $2.9 million, or 89.8%, to $6.2 million in 2000 from $3.3 million in 1999. The increase in direct operating and occupancy costs was primarily due to the opening of new company-owned restaurants. Direct operating and occupancy costs as a percentage of restaurant sales increased to 16.4% in 2000 from 14.4% in 1999. The increase in direct operating and occupancy costs as a percentage of restaurant sales was primarily due to higher occupancy costs in new restaurants and increased promotional costs in our newer restaurants to promote trial and brand awareness.
General and administrative. General and administrative costs increased by $2.0 million, or 45.4%, to $6.5 million in 2000 from $4.5 million in 1999. The increase in general and administrative costs was primarily due to the growth in our administrative infrastructure in order to manage our expansion. General and administrative costs as a percentage of total revenues decreased to 15.7% in 2000 from 17.8% in 1999. The decrease in general and administrative costs as a percentage of total revenues was primarily due to our ability to utilize our existing infrastructure to support new restaurants partially offset by our administrative infrastructure to manage our expansion.
Depreciation and amortization. Depreciation and amortization costs increased $0.8 million, or 114.5%, to $1.6 million in 2000 from $0.7 million in 1999. The increase was primarily due to the additional depreciation and amortization related to the opening of 22 new company-owned restaurants in 2000 and a full year of operations of the five company-owned restaurants that were opened in 1999.
Pre-opening. Pre-opening costs increased $0.8 million to $0.9 million in 2000 from $0.1 million in 1999. The increase in pre-opening costs was primarily due to the opening of 22 new company-owned restaurants in 2000 compared to the opening of five new company-owned restaurants in 1999.
Non-cash stock compensation. Non-cash stock compensation costs decreased by $0.6 million to $0.2 million in 2000 from $0.9 million in 1999 due to a higher increase in the estimated fair value of our common stock in 1999 relative to 2000. During April 2002, these notes became full recourse and, subsequent to that date, we are no longer required to recognize a non-cash stock compensation expense. See “Certain Relationships and Related Transactions”.
Interest income. Interest income increased by $0.2 million to $0.3 million in 2000 from $0.1 million in 1999. The increase in interest income was primarily due to an increase in interest bearing notes receivable.
Interest expense. Interest expense increased by $0.1 million to $0.4 million in 2000 from $0.3 million in 1999. The increase in interest expense was primarily due to an increase in average net borrowings.
Gain on disposition of assets. The gain on disposition of assets was $0.3 million in 2000 as a result of the sale of two restaurants to franchisees.
Income tax provision (benefit). The income tax provision (benefit) in 2000 and 1999 differs from the expected income tax provision derived by applying the effective tax rate primarily as a result of non-cash stock compensation expense recognized for financial reporting purposes, but disallowed for federal and state income tax reporting purposes.
Net income (loss). Net loss was $0.1 million in 2000, as compared to net income in fiscal 1999 of $0.3 million. The decrease was due to increased general and administrative costs associated with changing the
29
Table of Contents
management team, higher depreciation, amortization and pre-opening costs associated with new restaurant openings, primarily offset by increased revenues and operating margins and a reduction in non-cash compensation.
Potential fluctuations in quarterly results and seasonality
Our quarterly operating results may fluctuate significantly as a result of a variety of factors, including the timing of new restaurant openings and related expenses, profitability of new restaurants, increases or decreases in comparable restaurant sales, general economic conditions, consumer confidence in the economy, changes in consumer preferences, competitive factors, changes in food costs, changes in labor costs, and weather conditions. In the past we have experienced significant variability in pre-opening costs from quarter to quarter. These fluctuations are primarily a function of the timing of company-owned restaurant openings. We typically incur the most significant portion of pre-opening costs in the eight weeks immediately preceding the opening of a new restaurant. In addition, our experience to date has been that labor and direct operating and occupancy costs associated with a newly opened company-owned restaurant for the first six periods of operation are often materially greater than what will be expected after that time, both in aggregate dollars and a percentage of restaurant sales. Accordingly, the volume and timing of new company-owned restaurant openings in any quarter have had, and are expected to continue to have, a significant impact on quarterly pre-opening costs and labor and direct operating and occupancy costs.
Our business is also subject to seasonal fluctuations. Historically, sales in most of our restaurants have been higher during the summer months. As a result, we expect our highest earnings to occur during that period.
As a consequence of all of these factors, results of any one fiscal quarter are not necessarily indicative of the results to be expected for any other fiscal quarter or for any fiscal year.
Liquidity and capital resources
We have financed our capital requirements primarily with funds generated from operating activities, proceeds from the sale and issuance of our preferred stock and borrowings under our bank credit facility. In November 1998, we completed a recapitalization, including the sale of $17.6 million of Series A convertible preferred stock, net of issuance costs, most of which was purchased by three private equity groups as well as members of management. At that time, we also established a $6.0 million line of credit. In April 2000, we raised $15.5 million, net of issuance costs and note receivables, from the sale of Series B convertible preferred stock, which was predominantly purchased by our existing shareholders and their affiliates. In October and November 2001, we raised $12.1 million, net of issuance costs and note receivables, from the sale of Series C convertible stock, which was entirely purchased by our existing shareholders. In December 2000, we replaced our existing line of credit and increased our borrowing capacity from $6.0 million to $12.0 million. In connection with the Series C convertible preferred stock offering, we increased our borrowing capacity to $18.0 million.
Cash and cash equivalents was $0.4 million at December 31, 2001 compared with $1.7 million at January 1, 2001. Our principal requirements for cash are capital expenditures for the development of new restaurants and maintaining or remodeling existing company-owned restaurants and for enhancements of information systems. For the fiscal year ended December 31, 2001, we met our requirements for capital with cash from operations and proceeds from the issuance of Series C convertible preferred stock and bank borrowings.
For fiscal 2001, net cash provided by operating activities was $4.5 million as compared to $2.3 million for fiscal 2000. Net cash provided by operating activities increased from 2000 to 2001 primarily due to an increase in revenues during 2001 offset by an increase in certain receivables.
For 2001, net cash used in investing activities was $17.9 million compared to $16.3 million for 2000. Net cash used in investing activities increased from 2000 to 2001 primarily due to the increase in the number of
30
Table of Contents
company-owned restaurant openings from 22 in 2000 to 28 in 2001. Capital expenditures consist primarily of restaurant development costs related to the opening of company-owned restaurants and for the maintenance, remodeling and expansion of certain of our existing company-owned restaurants. In 1999, 2000 and 2001, we incurred capital expenditures of approximately $3.4 million, $16.0 million and $17.6 million, respectively. Our capital expenditures for 1999 through 2001 were financed through bank financing and proceeds from our Series A, Series B and Series C convertible preferred stock financings.
For 2001, net cash provided by financing activities was $12.2 million compared to $13.7 million for 2000. Net cash provided by financing activities increased primarily due to the completion of our Series C convertible preferred stock financing in October 2001 offset by a $0.5 million payment on a loan due to shareholder. In October 2001 we increased our borrowing capacity with Western Financial Bank. Our new credit facility consists of a $16.0 million development line of credit and a $2.0 million revolving line of credit. At December 31, 2001, we have drawn approximately $0.5 million under the development line of credit. Both the development line of credit and the revolving line of credit bear interest at the lending bank’s reference rate as of the date of borrowing plus 0.25% or at LIBOR plus 3.0%. As of March 25, 2002, the interest rate for both the revolving and development lines of credit was 5.0%. The lines of credit expire on September 30, 2002, and the development line can be extended at our option to December 31, 2002. Upon expiration, the development line of credit converts into a five year term loan.
We have experienced a working capital deficiency of $6.5 million and $3.6 million at December 31, 2001 and January 1, 2001, respectively. The increase in working capital deficiency from 2000 to 2001 is primarily due to increases in accrued salaries and wages and an increase in the current portion of a loan due to a shareholder.
We currently anticipate spending a total of approximately $20.0 million during fiscal 2002 on capital expenditure activities, principally for the opening of 22 new company-owned restaurants, the acquisition of three franchise restaurants in California and for maintaining, remodeling and expanding certain of our existing company-owned restaurants. We expect that future company-owned restaurants will require, on average, an investment (excluding pre-opening costs which are expensed as incurred) of approximately $525,000 to $650,000, which is net of landlord allowance. In addition, we anticipate spending approximately $[ ] million to repay outstanding bank debt under our existing credit agreements and approximately $1.5 million to repay amounts due under a promissory note we issued to Jim Magglos, our founder and one of our directors. We expect to fund these expenditures principally through internally generated cash flow, borrowings on our revolving lines of credit and the proceeds from this offering.
Our capital requirements, including restaurant development costs related to the opening of company-owned restaurants and for the maintenance, remodeling and expansion of certain of our existing company-owned restaurants have and will continue to be significant. Our future capital requirements and the adequacy of available funds will depend on many factors, including the pace of expansion, real estate markets, site locations and the nature of the arrangements negotiated with landlords. The financial success or lack of success on the part of our franchisees and joint venture partners could also affect our ability to fund our capital requirements.
We believe that our cash flows from operations and the net proceeds from this offering will be sufficient to satisfy our current working capital and capital expenditures requirements through 2003. Changes in our operating plans, acceleration of our expansion plans, lower than anticipated sales, increased expenses or other events may cause us to seek additional financing sooner than anticipated. Additional financing may not be available on acceptable terms, or at all. Failure to obtain additional financing as needed could have a material adverse effect on our business, financial condition and results of operations.
As of March 25, 2002, we had no financing transactions, arrangements or other relationships with any unconsolidated entities or related parties, except as described below in “Related party transactions”. Additionally, we had no financing arrangements involving synthetic leases or trading activities involving commodity contracts. Our operating lease commitments for leased restaurants and office space, long-term debt and amounts due to shareholder are as described below.
31
Table of Contents
Our contractual obligation and commercial commitments include long-term debt, amounts due to shareholder and future minimum obligations under operating leases. The future minimum payments due on our contractual obligations and commercial commitments for the fiscal years succeeding December 31, 2001 are as follows (in thousands):
Fiscal Year | Long-term Debt | Due to Shareholder | Operating Leases | Total | ||||||||
| 2002 | $ | 108 | $ | 1,500 | $ | 6,789 | $ | 8,397 | ||||
| 2003 | 78 | — | 6,936 | 7,014 | ||||||||
| 2004 | — | — | 6,954 | 6,954 | ||||||||
| 2005 | — | — | 6,900 | 6,900 | ||||||||
| 2006 | — | — | 6,814 | 6,814 | ||||||||
| Thereafter | — | — | 27,422 | 27,422 | ||||||||
| Total | $ | 186 | $ | 1,500 | $ | 61,815 | $ | 63,501 | ||||
In November 1998, in connection with obtaining over $6.0 million credit facility, we issued a put warrant for 75,000 shares that obligates us to reacquire the put warrant from the holder upon the occurrence of certain events. We have a remaining maximum potential obligation attributable to the put warrant of $56,000 and $354,000 at January 1, 2001 and December 31, 2001, respectively.
In certain instances, we have assigned, sublet or guaranteed the lease attributable to certain of our franchisees. The total aggregate commitment for leases assigned, sublet or guaranteed totaled approximately $1.6 million at December 31, 2001.
We lease automobiles, restaurant and office facilities under noncancelable operating leases extending through December 31, 2011. Under the term of the majority of the restaurant leases, we are responsible for taxes, insurance and maintenance expenses and have the option to extend the leases.
Certain of our restaurant lease agreements include escalation clauses increasing rental payments over the lease term based on increases in the Consumer Price Index up to a predefined maximum. A number of our leases include clauses that require payment of additional rent based on a percentage of gross sales. Percentage rents on our operating leases have historically not been significant.
Our Business Loan and Commercial Security Agreements with Western Financial Bank contain restrictive covenants and require us to maintain certain financial ratios as are customary for such borrowings, including a restriction that we not experience any net losses on a quarterly basis. For the fiscal year ended December 31, 2001, we were not in compliance with such restrictions as it related to experiencing net losses on a quarterly basis and other restrictive covenants. We obtained a waiver from our lender waiving noncompliance with such covenants.
Quantitative and qualitative disclosures about market risk
Our market risk exposures are related to our cash and cash equivalents. We invest our excess cash in investment grade, highly liquid investments, consisting of money market instruments, bank certificates of deposit and short-term investments in commercial paper. We anticipate investing our net proceeds from this offering in similar investment grade and highly liquid investments pending their use as described in this prospectus. We do not feel these investments are subject to significant market risk. We have no derivative financial instruments or derivative commodity investments in our cash and cash equivalents and investments.
Under our revolving credit facility, we will be exposed to market risk from changes in interest rates on borrowings that bear interest at the lending bank’s reference rate plus 0.25% or at LIBOR plus 3.0%. Because we do not believe that the amount of borrowings under the revolving line of credit will be material to our operations,
32
Table of Contents
we do not believe this risk will be material. All of our transactions are conducted, and our accounts are denominated, in United States dollars. Accordingly, we are not exposed to foreign currency risk.
Many of the food products purchased by us are affected by commodity pricing and are, therefore, subject to price volatility caused by weather, production problems, delivery difficulties and other factors that are outside our control. We believe that substantially all of our food and supplies are available from several sources, which helps to ameliorate food commodity risk. We believe we have the ability to increase menu prices, or vary the menu items offered, if necessary to respond to a food product price increase.
Related party transactions
On August 16, 1999, we entered into an asset purchase agreement to purchase a franchise restaurant owned by certain of our minority shareholders for consideration of approximately $125,000 in cash and $100,000 in notes payable. The assets purchased included a leasehold interest, tenant improvements, furniture and fixtures and restaurant equipment.
During fiscal year 2000, we loaned one of our officers $85,227 for the purchase of Series B convertible preferred stock. The loan bears interest at an annual rate of 10.0% and matures on November 24, 2003. The secured promissory note receivable is a full recourse note supported by a pledge of the officer’s shares of Series B convertible preferred stock. See “Certain Relationships and Related Transactions”.
We have various notes receivable and advances, including accrued interest, due from certain of our shareholders, officers and employees, totaling approximately $1.5 million at December 31, 2001. The principal amount of approximately $1.4 million for such notes receivable was issued in connection with the sale of restricted common stock. The notes bear interest at 4.51%, mature on November 24, 2003 and are secured by the purchased common stock. See “Certain Relationships and Related Transactions” for a discussion of the loan terms. In accordance with accounting principles generally accepted in the United States, we recognized $228,000 and $400,000 of non-cash stock compensation expense in our consolidated results of operations attributable to the sale of restricted common stock during the fiscal years 2000 and 2001, respectively. The non-cash stock compensation expenses did not have an impact on our consolidated cash flows.
During the fiscal year 2001, we loaned one of our shareholders $258,100. The loan bears interest at an annual rate of 10.0% and matures on July 5, 2004. The secured promissory note is supported by a pledge of certain of the shareholder’s shares of common stock. We also loaned two of our officers $157,250 and $34,096 respectively, for the purchase of Series C convertible preferred stock. Both notes bear interest at an annual rate of 6.0% and mature on November 24, 2003. The second promissory notes receivable are full recourse and are also supported by a pledge of the respective shareholder’s shares of Series C convertible preferred stock. See “Certain Relationships and Related Transactions”.
During fiscal year 2002, we loaned $500,000 to one of our officers. As a condition precedent to this loan, the officer agreed to amend the terms of our existing loan to him in the amount of $889,739 to provide for full recourse liability thereunder. The loan bears interest at an annual interest rate of 6.25% and matures in April 2005 or, if earlier, following the termination of the officer’s employment. We also amended our Restricted Stock Purchase Agreement with one of our directors to make a prior limited recourse promissory note full recourse. We issued the director options to purchase 10,000 shares of our common stock at $9.25 per share in consideration of his execution of the amendment and consequently will recognize a non-cash stock compensation charge in the amount of approximately $[ ] during the second quarter of fiscal 2002. The promissory note is due November 24, 2003 or, if earlier, following the termination of the director’s position as a consultant to us. See “Certain Relationships and Related Transactions”.
In connection with our recapitalization, we issued a note payable to one of our shareholders totaling $1.5 million at December 31, 2001. The $1.5 million note bears interest at an annual rate of 6.0% with interest payable quarterly in arrears on the unpaid principal balance. The note payable matures in November 2002.
33
Table of Contents
New accounting pronouncements
In June 2001, the Financial Accounting Standards Board issued SFAS No. 141, “Business Combinations” and SFAS No. 142, “Goodwill and Other Intangible Assets”. SFAS No. 141 requires that the purchase method of accounting be used for all business combinations initiated after June 30, 2001. SFAS No. 141 also includes guidance on the initial recognition and measurement of goodwill and other intangible assets arising from business combinations completed after June 30, 2001. SFAS No. 142 prohibits the amortization of goodwill and intangible assets with indefinite useful lives. SFAS No. 142 requires that these assets be reviewed for impairment at least annually. Intangible assets with finite lives will continue to be amortized over their estimated useful lives. Additionally, SFAS No. 142 requires that goodwill included in the carrying value of equity method investments no longer be amortized. We will apply SFAS No. 141 and SFAS No. 142 beginning in the first quarter of fiscal 2002. We believe that the adoption of SFAS No. 141 and SFAS No. 142 will not have a significant effect on our consolidated financial position or consolidated results of operations.
Changes in and disagreements with accountants on accounting and financial disclosure
We engaged the services of our current accountants Ernst & Young LLP on December 20, 2000 to audit our financial statements for the years ended December 31, 1999 and 2000. Our former accountants PricewaterhouseCoopers LLP had previously audited our financial statements for the year ended December 31 1999. After recommendation by our audit committee and approval by our board of directors, we dismissed our former accountants on December 20, 2000. Our former accountants’ reports on the financial statements for the years ended December 31, 1998 and 1999 contained no adverse opinion or disclaimer of opinion and were not qualified or modified as to uncertainty, audit scope or accounting principle. In connection with its audits for the years ended December 31, 1998 and 1999 and through December 20, 2000 there were no disagreements with the former accountants on any matter of accounting principles or practices, financial statement disclosure, or auditing scope or procedure, which disagreements if not resolved to the satisfaction of the former accountants would have caused them to make reference thereto in their reports on the financial statements for such years.
Inflation
The primary inflationary factors affecting our operations are food and labor costs. A large number of our restaurant personnel are paid at rates based on the applicable minimum wage, and increases in the minimum wage directly affects our labor costs. Many of our leases require us to pay taxes, maintenance, repairs, insurance and utilities, all of which are generally subject to inflationary increases. We believe inflation has not had a material impact on our results of operations in recent years.
34
Table of Contents
Overview
We are a rapidly-growing owner, operator and franchisor of quick casual restaurants that serve a wide variety of freshly prepared, flavorful Mexican food. With almost 12 years of operating history, we believe we have forged a strong brand with high levels of customer satisfaction and expanding geographic appeal. As of March 25, 2002, we have grown to 72 company-owned and 85 franchised restaurants, for a system-wide total of 157 restaurants in 14 states and the District of Columbia. We are well established in our core markets of California, Nevada, Arizona, Oregon and the Washington, D.C. metropolitan area. We believe we have developed a loyal customer base and growing brand awareness in other markets across the United States. Some of our highest average unit volumes are generated by restaurants outside of our home base of California, indicating the portability of our concept.
Our vision is to become the leading national restaurant brand known as the defining standard for the highest quality and convenience in fresh Mexican food. To that end, we proudly prepare fresh and flavorful Mexican food without the use of freezers, microwaves, can openers, lard or MSG. This approach to food preparation is integral to our concept. We offer a wide variety of menu items, including our Baja Burrito™, Original “Baja Style” Tacos™, charbroiled fish tacos, taquitos, ensaladas, tostadas, quesadillas, nachos and other Mexican entrees and appetizers, all made-to-order and served in generous portions. Our salsas, which are handcrafted daily on premises, are offered at our signature all-you-can-eat salsa bar, where customers can choose from a variety of mild to spicy salsas, and garnish their food according to their individual tastes. Our savory menu is conveniently offered at lunch and dinner for dine-in or take-out in a clean, upbeat and energetic environment and is served with a strong commitment to absolute customer satisfaction. We believe our average guest check of approximately $7.50 provides customers with an exceptional value for quality, flavor and convenience.
History
We were founded in 1990 by Jim and Linda Magglos, who used fresh, traditional Mexican ingredients in innovative ways to create tastes that customers could readily distinguish from other Mexican cuisine. The first Baja Fresh restaurant was opened in Newbury Park, California in August 1990. Our first franchise restaurant was opened in November 1994 in Oxnard, California and our first restaurant outside of California was opened in July 1996 in Las Vegas, Nevada.
After Jim and Linda Magglos had grown the business to 44 restaurants by mid-1998, we came to the attention of Greg Dollarhyde, a seasoned restaurant executive who is our president and chief executive officer. Mr. Dollarhyde, working with Jim Magglos, structured our recapitalization in November 1998 which gave us substantially greater financial and management resources and positioned our company for rapid growth. As part of the recapitalization, a controlling interest in our company was issued to affiliates of Catterton Partners, Oak Investment Partners and Grumman Hill Group, knowledgeable restaurant and retail industry investors, Mr. Dollarhyde and other new investors. Mr. Dollarhyde assembled a professional management team with over 75 years of combined restaurant experience, including Pete Siracusa, our chairman of the board, an industry veteran who has founded two popular restaurant chains. To further strengthen and expand the depth of the management team, Mr. Dollarhyde hired Don Breen, our chief financial officer, in July 1999 and Steve Heeley, our senior vice president of operations, in August 1999. In addition to these senior executives, we have built a well-rounded management team with diverse skills that include brand marketing, restaurant operations, real estate site selection and development, information technology and franchising development and operations.
Following the recapitalization and the implementation of our new management team’s initiatives, we have enjoyed a period of strong operating performance and increased unit growth. Our current management team has established a successful track record of growing our top-line revenue at a compound annual growth rate of 61.3% from $18.6 million in 1998 to $78.0 million in 2001, while simultaneously improving our restaurant operating margins by over 300 basis points. We have instituted an aggressive but disciplined growth plan and, since the
35
Table of Contents
recapitalization, have opened 56 company-owned restaurants and 54 franchise locations. Our management team has proven its ability to successfully execute our growth plan as we celebrated the opening of our 150th Baja Fresh Mexican Grill in December 2001. By the end of 2002, we expect to have approximately 210 Baja Fresh Mexican Grills opened in 18 states and the District of Columbia on a system-wide basis.
Industry
Quick casual segment. In the last 10 years, the face of the restaurant industry has changed significantly to meet changing demographic patterns and trends in the United States. In the past, customers’ needs were met by the three major segments of the restaurant industry: quick service, casual dining and fine dining. However, several changes have occurred that have created a growing demand for a fourth category: quick casual.
Historical promotional wars among many of the quick service restaurants (QSRs) have established a perceived average check barrier of approximately $5.00 for restaurants in this category. Although some QSRs have attempted to break through this perceived price barrier by offering additional, non-traditional menu items, the average guest check for 10 major quick service restaurant chains was $4.57 for the fourth quarter 2001. Additionally, casual dining restaurants have faced increasing cost pressures, particularly for labor and real estate, which have forced them to raise prices so that their average guest check is more than $10.00. Such an increase in casual dining prices combined with the barrier on QSR prices has left a broad gap in price points that can be filled by quick casual restaurants. Quick casual prices typically range between $6.00 and $9.00, according to Technomic, Inc., a leading restaurant industry research group.
The demand for quick casual dining is more than just a result of the opportunity gap in average checks between QSRs and casual dining restaurants. We believe that increases in the number of average weekly work hours and the number of dual income families have resulted in a “time famine” in the United States. Customers are demanding more convenience than full service restaurants provide, and are willing to pay for higher quality and fresher food than QSRs provide. Customers have also become more discerning and sophisticated about their food choices, typically opting for menus with more variety, and more healthful and flavorful food. Quick casual restaurants are well positioned to meet these demands because they are smaller restaurants with counter service, which allow them to provide similar quality food served at casual dining restaurants, while still meeting customers’ expectations for rapid service and lower prices with no tipping.
According to the Crest Report, quick casual is the fastest growing segment in the restaurant industry. This growth is fueled by two components—attracting new customers and increasing visit frequency of existing customers. We believe that as demand for the value, quality, flavor and convenience provided by quick casual restaurants grows, brands in this category will become “lifestyle” brands, further increasing the frequency at which customers visit them.
Fresh Mexican segment. Mexican cuisine is one of the most popular ethnic dining categories in the United States, tied with Italian and Chinese food at a 97.0% consumer awareness level, according to the National Restaurant Association. The popularity of Mexican food is also growing faster than other categories. In a study released by the National Restaurant Association in 2000, 34.0% of consumers said they eat Mexican food more often than they did in the previous two to three years, while only 8.0% said they eat it less often. The study also demonstrated that Mexican cuisine appeals to a broad range of demographic groups across the United States.
Traditionally, Mexican restaurant chains have offered two types of fare. Mexican QSRs have focused on low price points, simple food items such as tacos and easily replicable recipes and menu items made from ingredients prepared in offsite commissaries yielding predictable tastes. Conversely, casual-themed Mexican restaurant chains have conditioned customers to “combination plates” employing larger entrée platters that generally contain processed food, an abundance of sauces, melted cheeses and in some cases the use of heavy fats (such as lard) and other ingredients that are perceived to be less healthful. Consumption of alcoholic beverages, especially beer and margaritas, are effectively promoted and are generally critical to sales success in these restaurants.
36
Table of Contents
Fresh Mexican restaurants in a quick casual format are differentiated because they provide a wider variety of menu items from a broader palate profile, utilizing fresh ingredients, open-flame grills and savory spices in both traditional and creative recipes that are more distinctly flavorful and perceived by customers to be more healthful. Since the food is usually prepared on premises, it can be customized to particular consumer tastes.
Our concept and business strategy
Since the opening of our first restaurant in 1990, we have had 12 years of successful operations. The Baja Fresh concept is captured by five principal characteristics: high quality, consistently fresh and flavorful food; generous portions; excellent value for the customer; upbeat and convenient service; and a wide variety of menu offerings. We intend to enhance our market position by capitalizing on the demand for quick casual restaurants and other favorable industry trends and expanding our concept on a nationwide basis. Our primary goal is to become the leading national brand of quick casual restaurants that is known as the defining standard for the highest quality and convenience in fresh Mexican food. In order to build our brand awareness and achieve our goal, we plan to execute the following strategies:
Offer high quality, fresh Mexican food at an excellent value. Our primary strategy is to offer a wide variety of uniquely prepared, fresh food at an excellent value. We emphasize generous portions and high quality ingredients, including fresh fish, boneless, skinless chicken breasts and USDA choice steak, individually hand trimmed. We grill our meat, fish and vegetables over an open flame, which adds to the flavor of our food. We buy choice produce and aromatic spices to make our fresh salsas. We prepare our guacamole in small batches each day to ensure freshness. All food is prepared to order, ensuring that each item will be served fresh and at the proper temperature. We do not use microwaves, can openers, lard or MSG in the preparation of our food, and we don’t have freezers at any of our locations. Our diverse menu offering appeals to a wide variety of different tastes and the high quality of our food at affordable prices allows us to appeal to a broad group of consumers. Our appetizing food is popular for both lunch and dinner as evidenced by our nearly equal split between day and evening sales. In addition, unique décor and appealing atmosphere, balanced with the convenience of our restaurants, enables us to capture sales from both dine-in and take-out. We believe that the quality and freshness of our food, when combined with an average guest check of approximately $7.50, offer our customers an excellent dining value.
Create a culture focused on concept execution. The cornerstone to building our brand and expanding our nationwide presence is the consistent day-to-day execution of our concept. At our restaurants, we emphasize quality customer service because we believe it is a critical factor in providing our customers with a positive experience and driving repeat business. Cashiers, cooks and managers are all expected to maintain an upbeat, courteous and genuine attitude. We believe that if we “live our values,” we will see the results in customers’ repeat business. On a daily basis, we offer an engaging atmosphere through our bright, contemporary décor, clean, crisp design, comfortable lighting and contemporary Latin background music. Our exhibition grill enhances our atmosphere by reassuring our customers of the freshness of their food. Our strict adherence to our quality standards gives our restaurants a sparkling clean appearance throughout the day.
Increase existing customer frequency, capture new customers and expand customer loyalty. We believe the key to our continued success and growth is to build customer loyalty, increase the frequency of use by our existing customers and attract new customers. Customer satisfaction surveys conducted by independent restaurant industry consultants demonstrate that we consistently obtain customer satisfaction scores that meet or exceed that of many other well-known and highly regarded restaurant chains. These high levels of customer satisfaction result in positive word-of-mouth recommendations and high frequency of visits. Many of our customers have reported through company surveys that they visit our restaurant two or three times a week. We capture new customers as we grow in new and existing markets primarily through word of mouth, food giveaways and public relations activities.
37
Table of Contents
Maintain strong unit economics and recent operating trends. The frequency of visits by new and existing customers has helped us achieve consistent growth in our system-wide same store sales and generate strong returns on our restaurants. In 2001, our 39 company-owned restaurants that were open for the entire year generated average sales of approximately $1.5 million, or $594 per square foot. Our 17 company-owned restaurants opened for at least two years in 2001 generated average sales of approximately $1.7 million, or $701 per square foot. We believe the incremental difference in average sales between our restaurants open at least one and at least two years demonstrates our ability to achieve positive system-wide same store sales through increasing customer traffic in our restaurants. Our productivity compares favorably to that reported by other restaurant operators. Industry research indicates that the average sales per square foot in the fourth quarter of 2001 for 17 quick service restaurant companies and 43 casual dining restaurant companies was $457 and $424, respectively. We have successfully achieved 28 consecutive quarters of positive comparable restaurant sales growth. Our system-wide comparable restaurant sales increases were 8.1%, 7.7% and 8.0% in 1999, 2000 and 2001, respectively. Additionally, in the economically challenging fourth quarter of 2001, we were able to generate system-wide comparable restaurant sales increase of 6.1%, illustrating the strength of our concept. We believe our ability to capture four day-part segments through lunch take-out and dine-in as well as dinner take-out and dine-in helps us drive our sales.
We are able to achieve strong operating margins by driving operating efficiencies in our new and existing markets. In 2001, our company-owned restaurants opened for at least one year and at least two years had average restaurant level cash flow margins of 16.7% and 21.7%, respectively. We have relatively low net cash investment for new units of approximately $525,000 to $650,000 per unit, excluding pre-opening costs. Based on an average investment per restaurant of $575,000, our 39 company-owned restaurants open for at least one year and our 17 company-owned restaurants open for at least two years for 2001 generated cash on cash returns of 42.3% and 62.3%, respectively, in 2001.
Growth strategy
Based on demographic studies and other market data, we believe that we are well positioned for growth in both existing and future markets, through the development of both company-owned and franchised restaurants. Our management team adheres to a disciplined expansion strategy. We assess markets for development based on a number of factors including demographic profiles, number of target households, availability of attractive sites, and the presence of entrenched competitors. Once a market is targeted for development, we decide whether to open company-owned or franchised restaurants based on several factors, including our management’s knowledge of, and experience in, that market. Since our recapitalization, we opened 110 restaurants, 56 company-owned and 54 franchised.
Company-owned restaurants. One of our principal vehicles for expansion and growth in the near term will be the addition of new company-owned restaurants. We have adopted an aggressive growth strategy and intend to develop many of our new restaurants in our existing markets and to selectively enter new markets. We analyze demographic patterns such as population density and average income in all our markets to assess expansion opportunities. Our real estate team evaluates new markets and potential locations through on-site visits and the use of local real estate professionals. Our growth plan incorporates a market penetration or cluster strategy, which we believe enhances convenience and ease of access for our customers and results in repeat business and
operational efficiencies. We target end-cap or other high visibility locations for our restaurants and favor sites with ample patio space. We believe that our operating history, experience and culture give us a competitive advantage in securing attractive locations and generating economies of scale. We plan to open a total of 22 new company-owned restaurants in 2002, of which two were opened and 17 had signed leases as of March 25, 2002, and 25 new company-owned restaurants in 2003.
Franchised restaurants. Another key element in executing our growth strategy is the continued development of our franchise units. We expect the number of franchise units to grow through the development of new restaurants by existing franchisees and by the addition of new franchisees. We receive a significant number
38
Table of Contents
of unsolicited inquiries requesting the opportunity to become Baja Fresh franchisees. We are very selective and partner almost exclusively with top quality, experienced restaurant operators. We intend to continue to strengthen our franchise system by selecting only experienced and well-capitalized area developers who are quality-conscious and possess the expertise and capital resources to execute the development of new restaurants on a large scale. We expect our franchisees to open an aggregate of 37 new restaurants in 2002, of which five were opened and 25 had signed leases as of March 25, 2002, and approximately 35 new restaurants in 2003.
The Baja Fresh menu
Our menu has been developed with freshness, flavor and value in mind. We offer generous portions of a wide variety of traditional Mexican food items such as burritos, tacos, fajitas, ensaladas and quesadillas. However, we believe this is where comparisons to many of our competitors end.
Our food is made fresh to order on premises under stringent quality guidelines from proprietary recipes at each of our locations. In fact, our registered trademarks include “No Microwaves, No Can Openers, No Freezers, No Lard, No M.S.G”. This approach to food preparation is integral to our concept. Our food is designed to deliver a full mouth flavor sensation by using both subtle and spicy flavors that are not overpowering. Our lean steak, boneless and skinless chicken breasts, fresh fish and shrimp and select vegetables are grilled over an open flame to order throughout the day. Our black and pinto beans are simmered fresh from scratch using our own special recipes—without lard. We crush only fresh, ripe avocados for our guacamole and make it in small batches throughout the day to ensure freshness. Our chips are also made fresh, several times a day, with 100% cholesterol-free canola oil.
One of our distinguishing features is our complementary all-you-can-eat salsa bar. We offer a variety of fresh, handcrafted salsas from mild to spicy. Our salsas include our signature fire-roasted Salsa BajaTM, our Pico de Gallo flavored with lime and cilantro, our mild green TomatilloTM salsa, and our Enchilada and Spicy Hot salsas, all of which are prepared with choice tomatoes, chilies, onions, peppers and spices. Our salsa bar allows our customers to customize the flavor of their meals according to their individual tastes.
Our emphasis on variety is reflected in our menu. We now offer more than 40 menu items, all of which can be customized. Our specialty items include a selection of six burritos, including our popular Baja BurritoTM, stuffed with charbroiled chicken or steak, melted jack cheese, guacamole and fresh Pico de Gallo, our spicy Grilled Vegetarian BurritoTM, and the oversized Burrito “Dos ManosTM,” an extra large burrito overflowing with delectable ingredients. We offer two varieties of fresh fish tacos, including our charbroiled mahi mahi taco featuring sliced avocado, cabbage, Pico de Gallo and zesty avocado salsa, in addition to our Original “Baja Style” TacosTM stuffed with charbroiled marinated chicken, steak or wild-caught shrimp. For those customers who like to sample more than one menu item, we offer several combination platters, such as Tres Tacos!, a combination of any three of the Original Baja Style TacosTM served with chips and guacamole. We round out our menu with a wide selection of fajitas, nachos, quesadillas, ensaladas and side orders. Many of our menu items are served with our signature cebollita, a fire roasted and seasoned green onion, and our freshly made chips.
Our menu is also designed to satisfy customers who prefer food that is different from our standard offerings. Customers who seek more American-style Mexican food can have any of our burritos prepared EnchiladoTM style, topped with melted jack and cheddar cheese and our homemade Enchilado SalsaTM. For those customers with less adventurous tastes, we offer our very mild Torta (Mexican sandwich) made with grilled chicken or steak and served on a toasted Mexican roll. Additionally, because our food is made-to-order, we can accommodate specific dietary preferences or adapt any menu item to satisfy discriminating palates. For instance, customers can substitute fish, shrimp or vegetables for beef or chicken in any menu item. This flexibility in food preparation eliminates the need to continually change our menu or to add promotional or seasonal items.
39
Table of Contents
Unit level economics
We are able to achieve strong unit level economics that we believe are attractive when compared to other QSR and casual dining operators. Since our unit level sales results are driven almost entirely by word-of-mouth recommendations, trial of our food by customers and quality reviews, our newer restaurants tend to start at lower sales and profitability levels and ramp up to system averages. We generally expect our restaurants to reach system averages in sales and profitability in approximately their third year of operations.
For 2001, our 39 company-owned restaurants open for the entire year averaged approximately $1.5 million in sales and $594 in sales per square foot. Comparatively, our company-owned restaurants open for at least two years in 2001 averaged $1.7 million in sales and $701 in sales per square foot. In 2001, our 39 company-owned restaurants open for at least one year and 17 company-owned restaurants open for at least two years generated restaurant level cash flow of $243,000 and $358,000, respectively, or restaurant level cash flow margins of 16.7% and 21.7%, respectively. Based on an average investment per restaurant of $575,000, our 39 company-owned restaurants open for at least one year and 17 company-owned restaurants open for at least two years in 2001 delivered cash on cash returns of 42.3% and 62.3%, respectively.
The portability of our concept is indicated by the strength of our unit level economics outside of our California markets. In 2001, we had 14 company-owned restaurants outside of California open for at least one year and four company-owned restaurants open for at least two years. These restaurants averaged $1.3 million and $1.4 million in sales and $508 and $542 in sales per square foot, respectively. In 2001, our 14 company-owned restaurants open for at least one year outside of California and four company-owned restaurants open for at least two years outside of California restaurant level cash flow of $176,000 and $297,000, respectively, or restaurant level cash flow margins of 13.2% and 20.6%, respectively. Based on an average investment per restaurant of $575,000, our 14 company-owned restaurants open for one year and four company-owned restaurants open for at least two years in 2001 outside of California delivered cash on cash returns of 30.6% and 51.7%, respectively.
For company-owned restaurants opened in 2001, our cash investment, net of landlord contributions and depending on factors such as geographic location, approximated $525,000 to $650,000 per restaurant, excluding pre-opening costs of approximately $44,000 per restaurant. We expect that for company-owned restaurants opened in 2002, our cash investment, net of landlord contributions and depending on factors such as geographic location, will also approximate $525,000 to $650,000 per restaurant, excluding pre-opening costs of approximately $35,000 to $50,000 per restaurant.
Our current restaurants range in size from 1,100 square feet to 4,200 square feet, with an average of 2,600 square feet. We anticipate that future restaurants will typically range in size from 2,000 square feet to 3,000 square feet, with seating for 50 to 60 customers. From time to time, we expect to lease sites that may be smaller or larger than our targeted range, depending on the attractiveness of particular locations.
Current restaurant locations
We currently own or franchise 157 Baja Fresh Mexican Grills in 14 states and the District of Columbia, of which 72 are company-owned and 85 are franchised. We currently plan to open 59 restaurants during 2002, 22 of which will be company-owned and 37 of which will be franchised.
40
Table of Contents
The following table sets forth company-owned and franchised restaurant sites that have opened and leases that have been signed for future development as of March 25, 2002:
Company-Owned Restaurants | Franchised Restaurants | Total Restaurants | ||||||||||
Location | Open | Leases Signed | Open | Leases Signed | Open | Committed(1) | ||||||
| Arizona | 10 | 4 | – | – | 10 | 14 | ||||||
| California | 42 | 6 | 56 | 8 | 98 | 112 | ||||||
| Colorado | – | – | 2 | 1 | 2 | 3 | ||||||
| Florida | – | – | 2 | 1 | 2 | 3 | ||||||
| Georgia | – | – | 2 | – | 2 | 2 | ||||||
| Illinois | 5 | – | – | – | 5 | 5 | ||||||
| Kansas | – | – | – | 2 | – | 2 | ||||||
| Maryland | 5 | 3 | 3 | 1 | 8 | 12 | ||||||
| Michigan | – | – | – | 1 | – | 1 | ||||||
| Nevada | 4 | 1 | 5 | 1 | 9 | 11 | ||||||
| North Carolina | – | – | 2 | 1 | 2 | 3 | ||||||
| Ohio | – | – | 3 | – | 3 | 3 | ||||||
| Oregon | – | – | 6 | 2 | 6 | 8 | ||||||
| Tennessee | – | – | 1 | 1 | 1 | 2 | ||||||
| Texas | 3 | – | – | – | 3 | 3 | ||||||
| Utah | – | 1 | – | – | – | 1 | ||||||
| Virginia | 2 | 1 | 3 | 2 | 5 | 8 | ||||||
| Washington | – | – | – | 2 | – | 2 | ||||||
| Washington, D.C. | 1 | – | – | – | 1 | 1 | ||||||
| TOTAL | 72 | 16 | 85 | 25 | 157 | 198 | ||||||
| (1) | Total restaurants committed includes restaurants that have been opened and those for which leases have been signed. |
Expansion plans, site selection and development
Company-owned restaurants. We believe that we are well positioned to grow our concept and brand through company-owned and franchised restaurant development. We added 28 new company-owned restaurants in 2001, bringing the total of company-owned restaurants open to 67 at the end of 2001. We plan to add a total of 22 new company-owned restaurants in 2002, two of which have opened as of March 25, 2002, and an additional 25 company-owned restaurants in 2003. We currently have six company-owned restaurants under construction as of March 25, 2002, an additional 10 sites that are leased and in the permitting and design stage and numerous additional sites that have either been accepted by our development committee or are in lease negotiations.
Our restaurant expansion strategy focuses on further penetrating established markets, continuing to develop markets we have recently entered, and entering select new markets with either company-owned restaurants, franchised restaurants or a combination of both. Prior to entering a new area, we do a thorough analysis of the proposed market. We select our site locations and allow our franchisees to open restaurants only in markets with adequate population density to support a sufficient number of restaurants. This clustering approach enables us to increase brand awareness and improve our operating and marketing efficiencies. Clustering also enables us to reduce costs associated with regional supervision of restaurant operations and provides us with the opportunity to spread our marketing costs over a greater number of restaurants. We also believe this approach reduces the risks involved with opening new restaurants given that we better understand the competitive conditions, consumer tastes, demographics and discretionary spending patterns in these markets. In addition, our ability to hire qualified employees is enhanced in markets in which we are well known.
41
Table of Contents
We believe that our trade area and site selection strategy is critical to our success and we devote substantial effort to evaluating each potential site at the highest levels within our organization. We have conducted extensive research to better identify our customer base and utilize this research in selecting specific sites. As part of our typical site selection process, we have developed a proprietary site forecasting model that allows us to profile our target customer and then search for areas within our target markets that have a high concentration of such customers, focusing on such factors as spending patterns, income levels, education levels, self-image, consumption patterns and various other lifestyle factors. To more fully understand our markets, we also conduct on-site visits and employ local real estate experts. We focus on daytime populations, proximity to major traffic generators such as high-end, high-frequency retail stores, office buildings, health clubs and hospitals, and on the availability of personnel. We seek to lease end-cap or highly visible locations with the capability of having an outside patio. Our construction period has typically averaged approximately 16 to 18 weeks, which includes the process of obtaining the requisite permits. As we continue to grow, we have attracted increasing interest from larger developers, which results in our having the opportunity to look at a greater number of potential restaurant sites. We look for locations of 2,000 to 2,500 square feet in high-density, urban markets and 2,500 to 3,000 square feet in suburban markets. Given that our restaurant sites are typically in multi-tenant locations, we operate all of our restaurants under leases.
Franchised restaurants. We believe that franchise development will continue to complement our company-owned restaurant growth strategy. Growth in franchise operations is expected to occur through the development of new restaurants by existing franchisees and through the development of additional franchisee relationships. To assist our franchisees, we make our proprietary site forecasting model available to them. We generally utilize franchise development agreements and have franchisees in markets:
| • | that are located a significant distance from our California home office; |
| • | where we do not have the critical local real estate expertise or detailed knowledge of the local labor force and can capitalize the experience of a locally domiciled franchisee; and |
| • | that need to be developed more quickly than our available resources and personnel may allow. |
Restaurant franchise operations
Our current strategy is to seek franchisees that meet the following characteristics:
| • | a minimum of five to seven years of restaurant experience in an increasing leadership role; |
| • | at least $2.0 million of non-borrowed cash or liquid assets; |
| • | prior multi-unit franchise experience as an owner/operator; |
| • | the resources and capability to open, own and operate eight to 12 locations in three to five years; |
| • | highly motivated to operate within the demands of the Baja Fresh system; and |
| • | prior real estate development experience in the territory of interest. |
Our concept has attracted a strong group of franchisees with minimal sales effort. Our franchisees include founders, senior executives and current or former franchisees of successful casual dining and quick service restaurant chains.
Currently, each of our area developers is required to enter into two types of agreements: an area development agreement, which establishes the timing and number of stores to be developed in an area, and a franchise agreement for each restaurant opened. As of March 25, 2002, we had 26 area development agreements with 22 franchisees covering the development of 221 restaurants, 59 of which were open by the end of 2001 and all of which should be opened within the next five years pursuant to the terms of the agreements. The other 25 existing franchised restaurants were opened under single franchise agreements. During 2001, our franchisees
42
Table of Contents
opened 27 restaurants for a total of 84 at the end of 2001, and we expect them to open an aggregate of 37 restaurants in 2002 and 35 restaurants in 2003.
Our area developers and single unit franchisees execute a separate franchise agreement for each restaurant opened, typically providing for a ten-year initial term, but providing the franchisee with an opportunity to enter into a renewal franchise agreement subject to certain conditions. The terms we currently offer require franchisees to pay a franchise fee of $50,000 for the first restaurant opened and $35,000 for each additional restaurant they open plus a royalty fee of 5.0% of gross sales. If necessary, the terms of a franchise agreement entered into under an area development agreement will be modified to conform to the agreed upon terms under the area development agreement. The franchise agreements typically allow us to assess franchisees an advertising fee in the amount of 1.0% of gross sales, and to establish regions for cooperative advertising and require an additional advertising fee not to exceed 1.5% of gross sales. We have not made an assessment of either of these fees to date. Franchise agreements may be terminated for a number of reasons, including the franchisee’s failure to make timely payments, subject to applicable grace periods and notice requirements that may be imposed by applicable state law. Some of our older franchise agreements contain different terms including, among other things, reduced initial fees, royalties and advertising fee rates.
All of our franchise agreements require that each franchisee operate its restaurant in accordance with our defined operating procedures, adhere to the menu established by us and meet applicable quality, service, health and cleanliness standards. We enforce these high standards by utilizing such tools as mystery shoppers and unannounced quality assurance inspections. We may terminate the franchise rights of any franchisee who does not comply with these standards and requirements. We believe that maintaining superior food quality, a clean and upbeat environment and excellent customer service are critical to the reputation and success of our Baja Fresh concept, and we aggressively enforce these contractual requirements.
Our area development agreement typically has a three to five-year term, with the developer having the opportunity to enter into a renewal area development agreement at the end of the term under certain conditions. The area development agreement establishes the number of restaurants that must be developed in a defined geographic area and the deadlines by which these restaurants must open, usually set in 12 month intervals. The area development agreement can be terminated by us if, among other reasons, the area developer fails to develop its restaurants on schedule.
The terms we currently offer require our area developers to make a pre-payment of $50,000 for the initial franchise fee for the first restaurant and to pay an initial development fee equal to $17,500 multiplied by the total number of restaurants required under the area development agreement (excluding the first restaurant). As each new site is accepted, the developer signs a franchise agreement and lease on the premises and pays an initial franchise fee of $35,000, $17,500 of which is paid in cash and $17,500 of which is paid by crediting a portion of the initial development fee paid by the franchisee. Other than this credit, the development fee is non-refundable.
The area development agreement fixes the amount of the initial franchise fee and royalty rate which will be payable under each franchise agreement even if we change those fees and rates in the future with respect to new franchisees. Accordingly, some of our existing area developers who helped to build our brand at early stages of our development pay lower fees and royalties than we currently charge to new developers and single-unit franchisees.
Operations
Restaurant management. Our management team places tremendous emphasis on day-to-day restaurant level operations. To help ensure that we continue to deliver exceptional restaurant level execution, we have one regional vice president, eight regional operators and two district operators who report to our senior vice president of company operations. Each regional operator typically oversees seven to 10 restaurants and each district operator typically oversees two to four restaurants. Both the regional and district operators supervise the general
43
Table of Contents
manager for each restaurant within his or her area of control, with the goal of maximizing sales and controlling costs. We believe that our regional operators and district operators can accomplish this supervisory task in large part because of the experience and high caliber of our general managers and our restaurant management team.
Our typical restaurant management team consists of a general manager, who oversees the entire operation of the restaurant, and a restaurant manager. The general and restaurant managers of each restaurant are responsible for the day-to-day operation of that restaurant, including hiring, training and development of personnel, as well as operating results. Each restaurant also develops more seasoned hourly team members known as kitchen line managers and shift managers. Our regional, district, general, restaurant and line manager personnel make up our “core” field operations team and their continued development is a significant focus of our senior management. Each member of our restaurant management team is cross-trained in all operational areas. As we grow our restaurants and expand geographically, we expect to add additional regional and district operators. Most of our restaurants employ approximately 20 to 25 hourly employees, many of whom work part-time.
Career opportunities. We attempt to motivate and retain our “core” field operations team by providing them with opportunities for increased responsibilities and advancement, as well as performance-based cash incentives tied to profitability and qualitative measures such as visits by our mystery shoppers and our quality assurance personnel. It is our policy to promote from within wherever possible. We believe we also enjoy the recruiting advantage of offering our general managers restaurants that are easier to manage because they are generally smaller than those of many of our casual-themed competitors and have hours that typically do not begin in the early morning or extend late into the night. Our restaurants are generally open Sunday through Thursday from 11:00 a.m. until 9:00 p.m., and on Friday and Saturday from 11:00 a.m. until 10:00 p.m. We believe these advantages offer our managers a better quality of life compared to many of our competitors. One key benefit of these initiatives is a low turnover rate relative to the industry. Our weighted average “core” field operations team turnover was 29.0% in 2000 and 30.6% in 2001.
Recruiting. We actively recruit and select individuals who demonstrate enthusiasm and dedication and who share our passion for high quality customer service delivered through teamwork, commitment and care of customers. We have employee referral incentives that provide cash and other compensation to our employees who refer new employees to us. To attract high caliber general managers, we have developed a competitive compensation plan that includes a base salary and an attractive benefits package, including participation in a management incentive plan that rewards managers for achieving performance objectives.
Training. We don’t only talk about customer service; it is a part of our cultural fabric. We strive to maintain a team-oriented atmosphere, by providing quality and consistency in each of our restaurants through the careful training and supervision of personnel and the establishment of, and adherence to, high standards relating to personal performance, food preparation and maintenance of our facilities. The team at Baja Fresh undergoes extensive training to assure that our customers receive a consistently pleasant experience, visit after visit. From their first day of training, the Baja Fresh mission and values are ingrained in each of our team members. Restaurant personnel are expected to proudly prepare our fresh and flavorful Mexican food in a clean and upbeat environment and serve it with a genuine smile and concern for our customers’ absolute satisfaction.
We provide all new team members with thorough training to ensure they are equipped with the skills necessary to excel in their position. Our cashiers, cooks and management are trained for their specific position as they move up through the ranks to ensure they are able to meet our customer satisfaction standards. Our general managers and restaurant managers undertake an intensive six-week training program, which includes front and back of the house procedures, customer service, kitchen management and restaurant administration. We have regular monthly meetings with our regional and district operators and quarterly off-site meetings with all of our general managers. In addition to the more formal training process, we have detailed written operating procedures, standards, and controls, food quality assurance systems, and safety programs to complement and reinforce the training received at all levels.
44
Table of Contents
We implement a detailed eight-week countdown procedure in connection with the opening of each new restaurant. During this process, our personnel in new restaurants are trained well before the day the restaurants open to the public. We have four identified and experienced “mobile” training teams and also transfer personnel from existing restaurants to newly opened restaurants for a period of time to provide back-up training and to ensure that the new restaurant is adhering to our standards of operations. We believe the additional support system and training we provide to our newly opened restaurants are important since they help us provide our customers with a quality dining experience from day one. We also make these “mobile” training teams available when our franchisees open their first new restaurant in a new area.
Quality assurance. To ensure consistent operations between our restaurants, we employ five points of contact. First, we have a fully dedicated team of highly trained quality assurance representatives directed at ensuring that all company-owned and franchised restaurants consistently meet our standard of operations. To foster impartiality, our quality assurance team functions independently from operations, unlike most chain operators that integrate this role into regional restaurant supervision. As part of the quality assurance function, each company-owned and franchised restaurant receives a thorough, unannounced monthly inspection from a quality assurance representative. In addition to direct monthly inspections, we utilize an independent company to mystery shop each of our restaurants twice a month to calibrate both dine-in and take-out customer experiences. The mystery shopper evaluates and issues a written report after each visit rating everything from customer service, to the overall quality and taste of the food and the cleanliness of the entire restaurant from a customer’s point of view. As a third and fourth point of contact, we also display our customer service line and e-mail address on our menus and take-out bags. All phone calls, e-mails and letters received by our home office are logged by individual restaurant and are responded to by one of our customer service representatives. Our final quality assurance data point is the comment card. Each restaurant must display comment cards, which customers mail directly to our home office. The compiled results from these initiatives are published and distributed quarterly to our entire system. We take our quality assurance process very seriously and reward or censure those stores and managers at either end of the scale accordingly.
Marketing
Targeted focus. We take a streamlined approach to advertising and historically have spent very little on advertising. We rely on public relations, free samples and word-of-mouth recommendations about our food and locations. We strategically target certain types of marketing activities that are designed to maximize the money we spend by reaching the customers who have the highest propensity to like our concept, use it frequently and help build brand awareness. We do not run mass media ads that reach diverse consumers who may or may not have an interest in our food. Our primary marketing focus is to get our food into the mouths of potential customers. We do this by utilizing one-time samples, “VIP Passes” and other free sample and trial devices in new markets. We do not use discount coupons, buy-one-get-one free offers or promotional discounting to enhance comparable store sales. Based on our marketing approach, we do not expect our marketing expenditures to increase significantly as we add new restaurants and expand into new markets.
New market offers. Upon entering a new market, we begin our marketing campaign by conducting trade area surveys of the local business and residential areas. Through our workplace program, we provide introductory passes for free meals. We believe it is essential to get a potential customer into our restaurant to sample our food for the first time and then to build on customer satisfaction. For the residential segment of the market, we provide one-time sample coupons entitling the recipient to a free meal.
Sampling opportunities, community investment and charity. We frequently participate in events that allow us to reach a broader audience and to provide free food samples. These types of events are generally local, community-sponsored events. In addition, we show our commitment to the communities we serve by offering fundraiser nights and donating a percentage of our sales to charitable organizations.
45
Table of Contents
Other general marketing focuses. We also take advantage of opportunities to present our food to a much wider audience. We believe getting our food into the mouths of celebrities and others with high visibility and access to the public will entice those individuals to talk about our food and frequent our restaurants. Programs targeting celebrities have resulted in publicity for our brand in markets we have not yet entered. We have also appeared in food segments of shows on national and local television stations. We have been mentioned in several local and national publications, including the Los Angeles Times.
Awards. We have won the Ventura County Star’s Reader’s Choice Award for “Best Salsa” in 1996 through 2001 and for “Best Mexican” in 2001, the Los Angeles Daily News’s Reader’s Choice Awards for “Best Take-Out Food” in 1997 through 1999, the Zagat Survey’s “Best Meal Deal” for 1997 and 2000, and The Washingtonion Magazine’s “2001 Washingtonian Best Bargain Restaurant Award,” among numerous other awards.
Management information systems
All of our company-owned restaurants are automated and utilize a Windows NT based touch screen point-of-sale (“POS”) system that is connected to a local area network at each restaurant and integrated with a suite of back office applications, including labor management tools and an ideal food cost tool which is currently in development. Additionally, the POS system is utilized to authorize, batch and transmit credit card transactions, to record employee time clock punches, and to produce a variety of “real-time” management reports. The restaurant managers take a physical inventory of all food and paper items on a weekly basis. The restaurant managers also audit their sales and labor expenses on a daily basis and prepare and submit a weekly flash profit and loss statement.
At our home office, a company-wide communication system is used to poll, distribute and automatically upload the daily restaurant data to a centralized SQL data warehouse. The data captured by our restaurant level systems includes: hourly and daily sales, cash and credit card receipts, daily and hourly menu item sales, transaction counts and daily labor hours and costs. These systems allow us to closely monitor restaurant sales, cost of sales, labor expense and other restaurant trends on a daily, weekly and period basis. We believe these systems and the enhancements under development will enable both restaurant and senior management to adequately manage the operational and financial performance of our company-owned restaurants as necessary to support our planned expansion.
Purchasing
We seek to obtain the highest quality ingredients, products and supplies from reliable sources at competitive prices. Our purchasing staff procures all of our food ingredients, products and supplies from a variety of national, regional and local suppliers at negotiated prices. These sources have demonstrated the ability to meet our standards and specifications for specified items and possess adequate quality controls and the capacity to supply our and our franchisees’ needs promptly and reliably. In order to provide fresh ingredients and products, and to maximize operating efficiencies between purchase and usage, each restaurant’s managers determine its daily usage requirements for food ingredients, products and supplies. The restaurant’s managers order accordingly from approved vendors and distributors and deliveries are made several times per week. We do not maintain a central food product warehouse or food preparation commissary.
We have long-term agreements with several companies that are the sole suppliers for certain products. We believe that these products are available from several qualified suppliers at competitive prices should an alternative source be required.
We have not experienced significant delays in receiving our food or beverage inventories, restaurant supplies or products. We believe that competitively priced, high quality alternative manufacturers, suppliers, vendors, growers and distributors are available should the need arise.
46
Table of Contents
Employees
We consider each of our employees to be a member of our team. We have approximately 2,155 employees working in our company-owned restaurants and 58 employees based out of our home office. We have 1,131 full-time and 1,024 part-time employees working in our company-owned restaurants. Our employees are not covered by any collective bargaining agreement and we have never experienced an organized work stoppage or strike. We believe that the dedication of our employees is critical to our success. We believe we maintain an open and productive line of communications with our employees. We believe that our working conditions and compensation packages are competitive and consider our relations with our employees to be good.
Competition
The restaurant industry is intensely competitive. We compete on the basis of the taste, quality and price of food offered, customer service, ambience, location and overall dining experience. We believe that our concept, attractive price-value relationship, quality and distinctive flavor of our food, cleanliness and competent, genuine service enable us to differentiate ourselves from our competitors. Although we believe we compete favorably with respect to each of these factors, many of our direct and indirect competitors are well-established national, regional or local chains and some have substantially greater financial, marketing, and other resources than we do. We also compete with many other restaurant and retail establishments for site locations and restaurant level employees.
Properties
Our home office is currently located in Thousand Oaks, California. We occupy this facility under a lease that terminates in November 2004, with one option to extend until November 2009. We plan to relocate our home office to a new location in Thousand Oaks and recently signed a new lease for approximately 13,000 square feet of office space. The new lease terminates ten years from the date we take possession of the premises, which we anticipate will be in August 2002, and has one five-year option to extend the terms. We are in negotiations with our landlord to take back possession and are marketing our current facility for sublease.
We lease all of our restaurant facilities. The majority of our leases are for ten-year terms and generally include one or two five-year options to extend the terms. We typically lease our restaurant facilities under “triple net” leases that require us to pay minimum rent, real estate taxes, maintenance costs and insurance premiums, and in some instances, percentage rent based on sales in excess of specified amounts. In addition, most of our leases include exclusive use provisions prohibiting our landlords from leasing space to other restaurants that fall within certain specified criteria.
Insurance
We carry tenants improvements and betterments, inventory, commercial general liability, crime, directors and officers, employee practices liability, franchisor’s errors and omissions and workers’ compensation insurance policies, which we believe are customary for businesses of our size and type. Pursuant to the terms of their franchise agreements, our franchisees are also required to maintain certain minimum standards of insurance with insurance companies that are satisfactory to us, including commercial general liability insurance, workers’ compensation insurance, all risk property and casualty insurance.
Government regulation
Our restaurants are subject to licensing and regulation by state and local health, sanitation, safety, fire and other authorities, including licensing and regulation requirements for the sale of food. To date, we have not experienced an inability to obtain or maintain any necessary licenses, permits or approvals, including restaurant and retail licensing. The development and construction of additional units will also be subject to compliance with applicable zoning, land use and environmental regulations. Various federal and state labor laws also govern our
47
Table of Contents
relationship with our employees and affect operating costs. These laws include minimum wage requirements, overtime, unemployment tax rates, workers’ compensation rates, citizenship requirements and sales taxes. In addition, the federal Americans with Disabilities Act prohibits discrimination on the basis of disability in public accommodations and employment.
We must comply with regulations adopted by the Federal Trade Commission, or the FTC, and with several state laws that regulate the offer and sale of franchises. The FTC’s Trade Regulation Rule on Franchising, or the FTC Rule, and certain state laws require that we furnish prospective franchisees with a franchise offering circular containing information prescribed by the FTC Rule and applicable state laws and regulations.
We also must comply with a number of state laws that regulate some substantive aspects of the franchisor-franchisee relationship. These laws may limit a franchisor’s ability to: terminate or not renew a franchise without good cause; prohibit interference with the right of free association among franchisees; alter franchise agreements; disapprove the transfer of a franchise; discriminate among franchisees with regard to charges, royalties and other fees; and place new stores near existing franchises. Bills intended to regulate certain aspects of franchise relationships have been introduced into Congress on several occasions during the last decade, but none have been enacted.
Trademarks
Our registered trademarks and service marks include, among others, “Baja Fresh” which is registered with the United States Patent and Trademark Office, and “Baja Fresh Mexican Grill,” which is registered under California state law. We have also filed an application for our stylized logo set forth on the front and back pages of this prospectus. We have registered other trademarks which embody our values and philosophy such as “A Taste So Fresh It’s In Our NameTM,” “Baja Fresh Food Cannot Be Made At Microwave SpeedTM,” “It’s About Flavor, It’s About Fresh, It’s About Time!TM,” and “No Microwaves, No Can Openers, No Freezers, No Lard, No M.S.G.TM”. We have also registered the names of several of our most popular menu items such as “Burrito Dos ManosTM,” “Burrito UltimoTM” and “EnchiladoTM”. We have registered or made application to register “Baja Fresh” in several foreign countries. Not all of the marks which we use, or in which we claim rights, have been registered. We also have pending applications in several countries that have been opposed by users of similar marks in those countries, including the European Community, and we have abandoned our efforts to register in Argentina. We can make no assurance that we will ultimately prevail in our efforts to register our marks in those countries where we have made applications or in countries we may seek to register our trademarks and service marks in the future. We have also registered the Internet domain name www.bajafresh.com.
We believe that our trademarks, service marks and other proprietary rights have significant value and are important to our brand-building efforts and the marketing of our restaurant concepts. We have in the past and expect to continue to vigorously protect our proprietary rights. The protective actions that we take, however, may not be enough to prevent imitation by others, including misappropriation by others of restaurant trade dress features based upon, or otherwise similar to, our concept. Further it may be difficult for us to prevent others from copying elements of our concept and any litigation to enforce our rights will likely be costly.
Legal proceedings
Occasionally, we are a defendant in litigation arising in the ordinary course of our business, including claims resulting from “slip and fall” accidents, employment-related claims and claims from guests or employees alleging illness, injury or other food quality, health or operational concerns. To date, none of these types of litigation has had a material effect on us. We have and continue to insure against these types of claims.
On December 27, 2001, one of our former restaurant managers filed an action in Los Angeles County Superior Court against us for himself and on behalf of a putative class of similarly situated restaurant managers and general managers. The complaint alleges restaurant managers and general managers were improperly
48
Table of Contents
classified as “exempt” employees under California’s wage and hour laws and wrongfully denied overtime pay as a result of that misclassification. The plaintiff seeks unpaid overtime for himself and the putative class, in addition to penalties allowed by law. We filed a general denial on or about March 14, 2002. The class has not yet been certified and no significant discovery has been conducted. We intend to vigorously defend against this suit. We are still in the process of gathering information for the purpose of assessing the merits of the plaintiff’s claims. We have not established a reserve in connection with this litigation. If the class is certified and the suit is resolved unfavorably, it may have an adverse effect on our financial condition, results of operations or cash flows.
National Office Partners Limited Partnership, the landlord of one of our former franchisees, San Francisco Concepts, LLC, filed an action in San Francisco County Superior Court on January 25, 2002 against San Francisco Concepts for failure to pay rent and to satisfy certain mechanics’ liens. National Office Partners also sued us and a principal of San Francisco Concepts for unpaid rent (approximately $96,000 as of April 15, 2002), attorney’s fees and costs incurred as a result of the mechanics’ liens, under a guaranty of the leasehold obligations we jointly signed in favor of National Office Partners. Subject to certain conditions, the guaranty terminates at the end of a three year period beginning August 2001. Although we expressly disclaim any liability, in order to avoid needless expense, we have agreed to a stipulated attachment on a bank account which we will initially fund with $96,696 and to which we will add an additional $15,000 each month San Francisco Concepts fails to pay rent. We are entitled to indemnification from a principal of San Francisco Concepts for any amounts we pay under the guaranty. We have not established a reserve in connection with this litigation. If this suit is resolved unfavorably and we are unsuccessful in collecting amounts we are entitled to receive under our indemnification agreement, it may have an adverse effect on our financial condition and operating results.
49
Table of Contents
Executive officers and directors
The following table sets forth information with respect to our executive officers and directors.
Name | Age | Position | ||
| Gregory G. Dollarhyde(3) | 49 | President, Chief Executive Officer and Director | ||
| Donald D. Breen | 43 | Senior Vice President and Chief Financial Officer | ||
| Steve Heeley | 41 | Senior Vice President of Company Operations | ||
| Randall Carucci | 49 | Vice President of Real Estate | ||
| Natascha Kogler Brown | 35 | Vice President of Information Technology | ||
| Timothy J. Thomason | 44 | Vice President of Design and Construction | ||
| Peter J. Whitwell | 42 | Vice President of Franchise Operations and Quality Assurance | ||
| Eugene F. Cameron | 56 | Vice President of Marketing | ||
| Louis A. Siracusa(1)(3) | 65 | Chairman of the Board | ||
| Gerald R. Gallagher(1)(2) | 61 | Director | ||
| James T. Kelsey(1)(2) | 50 | Director | ||
| James Magglos(3) | 47 | Director | ||
| Frank M. Vest, Jr.(2)(3) | 54 | Director |
| (1) | Compensation committee member |
| (2) | Audit committee member |
| (3) | Real estate and franchise development committee (DEVCOM) member |
Gregory G. Dollarhyde has served as our President, Chief Executive Officer and director since November 1998. Prior to structuring our recapitalization, Mr. Dollarhyde was President and Chief Executive Officer of Country Harvest Buffet Restaurants, a chain of buffet-style restaurants, from March 1996 to June 1998. Mr. Dollarhyde had been recruited by the institutional investors in Country Harvest Buffet, including Heller Financial, to restructure their troubled company. As part of the reorganization, Country Harvest Buffet Restaurants filed a voluntary petition for protection under Chapter 11 of the United States Bankruptcy Code on January 28, 1998. From December 1993 to March 1996, Mr. Dollarhyde was employed by Roasters Corporation, the owner and franchisor of the Kenny Rogers Roasters restaurant chain. From December 1993 to May 1995, he served as a Vice President at Roasters Corporation and from May 1995 to March 1996 as Vice Chairman. Mr. Dollarhyde left Roasters Corporation following a series of transactions in which a controlling interest in that company was acquired by a Malaysian conglomerate. Prior to December 1993, Mr. Dollarhyde held senior management positions in various restaurant companies, including President and Chief Executive Officer of Rusty Pelican Restaurants, Inc., Vice President and General Manager of New Concepts of Pizza Hut, Inc. and Chief Financial Officer of TGI Friday’s. His restaurant career has spanned over 30 years.
Donald D. Breen has served as our Senior Vice President and Chief Financial Officer since July 1999. From January 1995 to May 1999, Mr. Breen was employed by Brothers Gourmet Coffees, Inc., a wholesale and retail coffee company, where he served as Executive Vice President and Chief Financial Officer from January 1995 to December 1995, and President, Chief Executive Officer and Chief Financial Officer from January 1996 to May 1999. Mr. Breen was also a director of subsidiaries of Brothers Gourmet Coffees, including Brothers Retail Corp., Brothers Coffee Bars, Inc. and Maryland Club Foods, Inc. On August 27, 1998, Brothers Gourmet Coffees and its subsidiaries filed a voluntary petition for relief under Chapter 11 of the United States Bankruptcy Code. From 1990 to January 1995, Mr. Breen was the Finance Director and Assistant Treasurer for Adolph Coors Company. He has approximately 19 years of experience in various finance capacities for public companies.
50
Table of Contents
Steve Heeley has served as our Senior Vice President of Company Operations since August 1999. From February 1998 to August 1999, Mr. Heeley was Vice President of Operations for Louise’s Trattoria, a regional casual dining Italian restaurant chain. From May 1996 to February 1998, he was Vice President of Operations for Una Mas, Inc., a 50-unit Mexican restaurant chain. From 1992 to 1996, he was the President and Chief Executive Officer of the SIMCO Group, owner and operator of a portfolio of restaurants on San Francisco’s waterfront. From 1982 to 1992, he held various positions at El Torito Restaurants, including General Manager, District Manager and Regional Operations Director. Mr. Heeley has approximately 19 years of chain restaurant operations experience.
Randall Carucci has served as our Vice President of Real Estate since February 2000. From January 1999 to July 1999, Mr. Carucci was Vice President of Development for Jamba Juice Company, the owner and operator of a chain of smoothie drink stores. From October 1997 to January 1999, he was Vice President of Real Estate and Construction for Sunglass Hut International, the owner and operator of a chain of optical ware stores. From February 1996 to October 1997, he was Vice President of Real Estate for Cinnabon International, a chain of cinnamon roll bakeries. Mr. Carucci has approximately 22 years of tenant and landlord experience in real estate and development.
Natascha Kogler Brown has served as our Vice President of Information Technology since May 2001. From November 1999 to April 2001, Ms. Kogler Brown was the Director of Information Technology for PDQuick, a food delivery service company. From November 1998 to November 1999, she was a Systems Consultant and Integration Specialist for Diedrich Coffee Inc., a wholesale and retail coffee company. From June 1997 to November 1998, Ms. Kogler Brown was the Director of Information Technology for The Cheesecake Factory, Inc., a chain of casual dining restaurants, and, from April 1995 to June 1997, she served as the Director of Information Technology for Earls Restaurants Inc., a Canadian restaurant chain.
Timothy J. Thomason has been employed by us since August 1997. Mr. Thomason has served as Vice President of Design and Construction since November 1999. From June 1999 to November 1999, he was our Director of Design and Construction. From August 1997 to June 1999, Mr. Thomason worked in our Quality Assurance department. From 1992 to August 1997, he worked as an independent general contractor, during which time he built, among other projects, two of our company-owned restaurants. Mr. Thomason has approximately 25 years of construction experience and has been a licensed general contractor since 1987.
Peter J. Whitwell has been employed by us since our inception and was the general manager of the first restaurant in Newbury Park, California. From 1991 to our recapitalization in November 1998, Mr. Whitwell held a number of positions in our company, including Training Manager, Franchise Operations Supervisor and Vice President of Operations. In conjunction with our recapitalization, he became Vice President of Franchise Operations and Quality Assurance and currently serves in that position.
Eugene F. Cameron has been employed by us since November 2001 as our first Vice President of Marketing. From January 2000 to October 2001, Mr. Cameron was Vice President of Marketing and Sales at BizRate.com, a company providing web-based resources for on-line shopping. From June 1997 to December 1999, Mr. Cameron was the Group Account Director for Mendelsohn/Ziem, an advertising company. From January 1996 to May 1999, he served as the President of Fotouhi Alonso Cameron Advertising, an advertising firm. From October 1994 to December 1995, Mr. Cameron served as Senior Vice President, Account Director for Ogilvy & Mather, Inc., an advertising firm. From January 1992 to October 1994, he was Vice President of Marketing for the Los Angeles Rams, a professional football team. Prior to 1992, as a senior advertising executive with BBDO and Chiat/Day, Mr. Cameron developed marketing programs for Carl’s Jr., Green Burrito, Pizza Hut, and Sizzler, while also working with leading consumer marketers including Nike, Apple Computer, Porsche, and Nissan.
Louis A. “Pete” Siracusa worked with Greg Dollarhyde on our recapitalization and has served as a director and as a consultant to us since November 1998. From 1988 to November 1998, Mr. Siracusa was a consultant for
51
Table of Contents
several companies, including Country Harvest Buffet, a chain of buffet-style restaurants, and Fresh Island Fish, a chain of restaurants in Hawaii. Mr. Siracusa has extensive experience in the restaurant industry having been one of the co-founders of Chart House Restaurants and the founder of the Ancient Mariner and Rusty Pelican Restaurant chains. He was a founding director of the Bank of Newport and a director of RemedyTemp, Trilogy Excursions and Fresh Island Fish. He served as Commissioner of Cycling for the Los Angeles Olympic Organizing Committee and is a member of the Chief Executives Organization.
Gerald R. Gallagher has served as a director since December 2001. Mr. Gallagher has been a General Partner of Oak Investment Partners, a venture capital firm founded in 1978 that funds high-growth entrepreneurial ventures, since 1987. For 30 years, Mr. Gallagher has been involved with the retail industry, holding such positions as analyst, manager and venture capitalist. Before joining Oak Investment Partners in 1987, he was Vice Chairman of Dayton Hudson Corporation. Mr. Gallagher currently serves on the Board of Directors of Vicinity Corporation and five privately held companies.
James T. Kelsey has served as a director since August 2001. In 1985, Mr. Kelsey co-founded Grumman Hill, a private equity firm. Since its organization, Grumman Hill has raised and invested three private equity funds. Since 1997, he has been the General Partner of Grumman Hill Investments III LP. Mr. Kelsey currently serves on the Board of Directors of AppliedTheory Communications. AppliedTheory Communications filed for protection under Chapter 11 of the United States Bankruptcy Code on April 17, 2002.
James Magglos, our founder, opened the first Baja Fresh restaurant in August 1990. Mr. Magglos has served as a director since our inception and was our President and Chief Executive Officer from inception until our recapitalization in November 1998.
Frank M. Vest, Jr. has served as a director since November 1998. Mr. Vest has been a Managing Director of Catterton Partners IV Management Company, L.L.C., Catterton Partners Management Company, L.L.C. and Catterton Partners Corporation, a private equity firm, since 1993, as President of The Catterton Group, Inc. since 1984 and as Manager/General Partner of Catterton Capital Management, L.L.C., Odyssey Limited Partnership and Anthony Woods, L.L.C. since 1990. Mr. Vest is a member of the boards of directors of Arbos Company Limited (Canada) and Build-A-Bear Workshop, Inc.
Board composition
Our board of directors consists of six members. In accordance with our bylaws, the board may act to change the number of directors as long as the number of directors is not below five or above nine. We are actively searching for an additional independent director to join our board of directors.
Officers are elected at the first board of directors’ meeting following the shareholders’ meeting at which the directors are elected, and serve at the discretion of the board of directors. There are no family relationships among any of our directors or executive officers.
Board committees
The compensation committee of our board of directors recommends, reviews and oversees the salaries and benefits for our employees, consultants and other individuals compensated by us. The compensation committee also administers our option plan. The current members of the compensation committee are Messrs. Siracusa, Gallagher and Kelsey.
The audit committee of our board of directors reviews, acts on and reports to our board with respect to various auditing and accounting matters, including the recommendation of our auditors, the scope of our annual audits, fees to be paid to the auditors, and also evaluates the performance of our independent auditors and our accounting practices. The current members of the audit committee are Messrs. Gallagher, Kelsey and Vest.
52
Table of Contents
The real estate and franchise development committee of the board of directors evaluates targeted new markets, screens and approves franchisees and approves site locations for new franchised restaurants. The current members of the real estate and franchise development committee are Messrs. Dollarhyde, Magglos, Siracusa and Vest.
Director compensation
Our directors do not currently receive any compensation for their services as directors. However, immediately following this offering, each of our independent directors will be granted options to purchase 5,000 shares of our common stock under our 2001 stock plan. In the future, each of our independent directors will receive annual grants of options to purchase shares of our common stock in amounts to be determined. Non-employee directors are reimbursed for reasonable expenses incurred in connection with serving as a director. See “Certain Relationships and Related Transactions”.
Compensation committee interlocks and insider participation
Our compensation committee currently consists of Messrs. Siracusa, Gallagher and Kelsey. No member of the compensation committee has served as one of our officers or employees at any time. None of our executive officers serves as a member of the board of directors or compensation committee of any other company that has one or more executive officers serving as a member of our board of directors or compensation committee.
Mr. Siracusa receives $75,000 annually under a consulting agreement with us, and he previously purchased certain shares in exchange for a promissory note in the principal amount of $547,525. See “Certain Relationships and Related Transactions”.
Indemnification and limitation of director and officer liability
In accordance with provisions of the California Corporations Law, our articles of incorporation provide that the liability for monetary damages of our directors shall be eliminated to the fullest extent permitted by California law. Further, our articles authorize us to provide indemnification to our agents (including our officers and directors). Our bylaws provide for the indemnification of our corporate agents to the maximum extent permitted by California law. Certain of our directors have indemnification arrangements with their affiliated venture funds.
53
Table of Contents
Executive compensation
The following table sets forth information regarding the compensation that we paid during 2001 to our chief executive officer and each of our other four most highly compensated executive officers whose total annual salary and bonus exceeded $100,000 for services rendered in all capacities to us in fiscal 2001. We refer to these individuals as named executive officers.
Summary Compensation Table
Long Term Compensation Awards | |||||||||||
Name and Principal Position | Annual Compensation(1) | Securities Underlying Options | All Other Compensation(2) | ||||||||
Salary | Bonus | ||||||||||
| Gregory G. Dollarhyde Chief Executive Officer and President | $ | 228,972 | $ | — | 62,331 | $ | 600 | ||||
| Donald D. Breen Senior Vice President and Chief Financial Officer | 164,231 | 15,000 | 60,000 | 525 | |||||||
| Steve Heeley Vice President of Company Operations | 140,673 | 20,775 | 40,000 | 480 | |||||||
| Randall Carucci Vice President of Real Estate | 146,923 | — | 7,000 | 450 | |||||||
| Peter J. Whitwell Vice President of Franchise Operations and Quality Assurance | 108,125 | — | 15,000 | 353 | |||||||
| (1) | In accordance with the rules of the Securities and Exchange Commission, the compensation described in this table does not include medical, group life insurance or other benefits received by the named executive officers that are available generally to all of our salaried employees and perquisites and other personal benefits received by the named executive officers that do not exceed the lesser of $50,000 or 10.0% of the officer’s salary and bonus disclosed in this table. |
| (2) | Represents annualized premiums for term life insurance. |
54
Table of Contents
Option grants during 2001
The following table sets forth information concerning stock options that we granted to our named executive officers. We have never issued stock appreciation rights.
Individual Grants | Potential Realizable Value at Assumed Annual Rates of Stock Price Appreciation for Option Term(5) | |||||||||||||||
Name | Number of Securities Underlying Options Granted(1) | Percentage of Total Options Granted to Employees in 2001(2) | Exercise Price (per share)(3) | Expiration Date(4) | 5.0% | 10.0% | ||||||||||
| Gregory G. Dollarhyde(6) | 56,250 | 13.0 | % | $ | 8.00 | 04/30/11 | $ | $ | ||||||||
| 6,081 | 1.4 | 9.25 | 12/19/11 | |||||||||||||
| Donald D. Breen | 20,000 | 4.6 | 8.00 | 01/01/11 | ||||||||||||
| 20,000 | 4.6 | 8.00 | 07/30/11 | |||||||||||||
| 20,000 | 4.6 | 9.25 | 12/19/11 | |||||||||||||
| Steve Heeley | 20,000 | 4.6 | 8.00 | 08/13/11 | ||||||||||||
| 20,000 | 4.6 | 9.25 | 12/19/11 | |||||||||||||
| Randall Carucci | 7,000 | 1.6 | 8.00 | 02/14/11 | ||||||||||||
| Peter J. Whitwell | 15,000 | 3.5 | 8.00 | 06/30/11 | ||||||||||||
| (1) | Represents options we granted to our named executive officers under our 1998 stock plan and our 2001 stock plan to our named executive officers. |
| (2) | Based on 432,831 shares of our common stock underlying options granted to employees in 2001. |
| (3) | We granted each option at an exercise price equal to the fair market value of our common stock as determined by our board of directors on the date of grant. In determining the fair market value of our common stock, the board considered various factors, including our financial condition and business prospects, operating results, the absence of a market for our common stock and the risks normally associated with investments in companies engaged in similar businesses. |
| (4) | See “Management—Stock plans” regarding the terms of options granted under our stock plans. |
| (5) | The 5.0% and 10.0% assumed annual rates of compounded stock price appreciation are mandated by the rules of the Securities and Exchange Commission and do not represent either historical appreciation or our estimate or projection of our future common stock prices. These values have been calculated from an assumed offering date of [ ] , 2002, based on a per share value equal to the assumed initial public offering price rather than the fair market value at the time of grant. |
| (6) | See “Aggregated option exercises in 2001 and year-end option values” regarding options held in trust by Mr. Dollarhyde for the benefit of his ex-wife. |
Aggregated option exercises in 2001 and year-end option values
The following table contains summary information relating to the following for each of our named executive officers (identified in the Summary Compensation Table above):
| • | the shares of common stock acquired in fiscal 2001 upon the exercise of options; |
| • | the value realized upon exercise of stock options in fiscal 2001; and |
| • | the number and value of shares underlying unexercisable and exercisable options at the end of fiscal 2001. |
55
Table of Contents
The value realized and value of unexercised in-the-money options are calculated by determining the difference between the fair market value of the underlying securities and the exercise price. The following table assumes a per share fair market value of [ ], the initial public offering price per share. We have never issued stock appreciation rights. None of our outstanding options have been exercised.
Name | Number of Securities Underlying Unexercised Options at December 31, 2001 | Value of Unexercised In-the-Money Options at December 31, 2001(1) | ||||||||||
Exercisable | Unexercisable | Exercisable | Unexercisable | |||||||||
| Gregory G. Dollarhyde | 147,266 | (2) | 123,493 | (3) | $ | $ | ||||||
| Donald D. Breen | 22,000 | 78,000 | ||||||||||
| Steve Heeley | 15,000 | 65,000 | ||||||||||
| Randall Carucci | 5,700 | 26,300 | ||||||||||
| Peter J. Whitwell | 13,500 | 41,500 | ||||||||||
| (1) | Calculated by determining the difference between the assumed initial public offering price and the exercise price of each officer’s options. |
| (2) | Pursuant to a domestic relations order, options to acquire an aggregate of 66,234 shares of our common stock held by Mr. Dollarhyde are held by him in trust for the benefit of his ex-wife and Mr. Dollarhyde’s ex-wife has sole control over the timing of exercise and disposition of the shares issuable upon exercise of these options. |
| (3) | Options as to 58,880 shares will vest and become exercisable immediately at the completion of this offering. |
Stock plans
As of the date of this prospectus, our employees, consultants and directors hold outstanding stock options for the purchase of 983,038 shares of our common stock. A total of 917,918 additional shares of our common stock are presently available for issuance under our existing stock plan. The following section provides more detailed information concerning our stock plans.
2001 Fresh Enterprises, Inc. Stock Plan
In November 2001, we adopted the 2001 Fresh Enterprises, Inc. Stock Plan (or 2001 stock plan) to assist us in continuing to attract, retain and reward valued employees, directors and consultants by offering them a greater stake in our success and to encourage ownership of our company by these employees, directors and consultants. Our shareholders approved the 2001 stock plan on November 6, 2001. On April 5, 2002, our board of directors approved an amendment to our 2001 stock plan to increase the number of authorized shares available for grant to 1,101,499. Our shareholders approved the amendment on April 19, 2002.
The 2001 stock plan will be administered by the compensation committee of our board of directors following the completion of this offering. The plan provides for the grant of incentive stock options as defined in Section 422 of the Internal Revenue Code, and the grant of non-statutory stock options, restricted stock awards, performance awards, dividend equivalents, deferred stock, stock payment awards and stock appreciation rights.
The board of directors will be able to amend or modify the 2001 stock plan at any time, with shareholder approval, if required. However, any amendment to the 2001 stock plan may not impair an outstanding stock award without the consent of the stock award holder.
A total of 1,101,499 shares were reserved for issuance upon the exercise of options or in the form of stock grants and other awards granted under the 2001 stock plan. To date, options to purchase 183,581 shares of common stock have been granted under the 2001 stock plan. All options that have been granted under the 2001
56
Table of Contents
stock plan are exercisable at an exercise price per share of $9.25 and vest according to the following vesting schedule: options as to 10.0% of the underlying shares vest on the date of grant, and options as to 10.0%, 20.0%, 20.0% and 40.0% of the underlying shares vest on the first, second, third and fourth anniversaries of the date of grant, respectively. Each option granted under the 2001 stock plan will expire 10 years from its date of grant or earlier as may be determined by the compensation committee. Our options may terminate before their expiration dates if the option holder’s status as an employee, director or consultant is terminated or upon the option holder’s death or disability.
The 2001 stock plan includes the following features:
| • | qualified employees who are selected by the compensation committee (including our executive officers) are eligible for the grant of incentive stock options to purchase shares of our common stock or other types of awards granted under the plan; |
| • | qualified non-employee directors and consultants who are selected by the compensation committee are eligible to receive non-statutory options to purchase shares of our common stock or other types of awards under the plan; |
| • | the maximum number of shares issuable upon the exercise of options or in the form of stock awards granted under the plan to any individual in any calendar year may not exceed 262,000; |
| • | the compensation committee will determine the exercise price of options or the purchase price of stock awards, but the option price for incentive stock options will not be less than 100.0% of the fair market value of the underlying shares on the date of grant (or not less than 110.0% of such fair market value for incentive stock options granted to employees who hold more than 10.0% of our outstanding common stock); |
| • | the exercise price or purchase price may, at the discretion of the compensation committee, be paid in cash, or cash equivalents, surrender of our common stock, pursuant to the delivery of a full recourse promissory note, or other forms of consideration as our compensation committee may determine; and |
| • | the compensation committee will determine the vesting schedule and exercisability applicable to stock awards. |
Additionally, options granted under our 2001 stock plan provide for accelerated vesting upon the completion of a sale of all or substantially all of our assets or the acquisition of our company by another entity. In the case of an acquisition, the options will not accelerate if our voting securities outstanding immediately before the transaction continue to represent more than 66.67% of the combined voting power of our voting securities and the voting securities of the acquiring entity or if the acquisition involves a recapitalization of our company in which no person acquires more than 25.0% of the combined voting power of the then outstanding securities. Upon an acceleration event, all unvested options will vest in full and become exercisable.
The 2001 stock plan will remain in effect until November 5, 2010, unless sooner terminated by our board of directors.
1998 Fresh Enterprises, Inc. Stock Plan
On November 24, 1998, we adopted the 1998 Fresh Enterprises, Inc. Stock Plan (or 1998 stock plan), which was designed as an incentive and non-qualified award plan for directors, key employees and consultants. The 1998 stock plan was terminated by our board of directors on November 6, 2001, but outstanding awards were not affected by the termination. The 1998 stock plan provides for the grant of incentive stock options, non-statutory options, restricted stock awards and the other types of awards that may be granted under the 2001 stock plan.
Options to purchase a total of 799,457 shares of common stock that are currently outstanding were granted under the 1998 stock plan. The outstanding options have a weighted average per share exercise price of
57
Table of Contents
approximately $5.93 and generally vest on the same vesting schedule as options granted under the 2001 stock plan. In general, each option granted under the 1998 stock plan will expire 10 years from its date of grant, but may be terminated before its expiration date if the option holder’s status as an employee, director or consultant is terminated. Options granted under our 1998 stock plan include acceleration terms similar to those included in options granted under our 2001 stock plan. Additionally, vesting of options granted to Messrs. Dollarhyde and Siracusa under the 1998 stock plan accelerate concurrently with this offering. We issued a total of 317,045 shares in the form of restricted stock awards under the 1998 stock plan at a per share price of $4.53. All of such shares are fully vested. See “Certain Relationships and Related Transactions”.
Employment agreements and change of control arrangements
Employment agreement with Greg Dollarhyde
In connection with our recapitalization on November 24, 1998, we entered into a four-year employment agreement with Greg Dollarhyde, our president and chief executive officer. The employment agreement provides for automatic one-year extensions following the expiration of the initial term, unless terminated by either party. Mr. Dollarhyde currently receives a base salary of $250,000 per year, which may be adjusted following the completion of pending negotiations between Mr. Dollarhyde and our board of directors to renew or extend the term of the agreement. We are required to pay Mr. Dollarhyde a bonus equal to a percentage of his annual base salary if we reach certain specified performance benchmarks based on our EBITDA, as adjusted (earnings before interest, taxes, depreciation, amortization, pre-opening expenses and non-cash compensation expenses) for the fiscal year. Mr. Dollarhyde will not receive any bonus if we do not achieve at least 90.0% of our budgeted EBITDA, as adjusted. The maximum bonus payable is 100.0% of Mr. Dollarhyde’s annual base salary compensation.
We also granted to Mr. Dollarhyde options to purchase 196,266 additional shares of our common stock under our 1998 stock plan. The options granted under our 1998 stock plan are exercisable at an exercise price of $4.53 per share and will expire on November 23, 2008. The unvested portion of these options will vest in full and become exercisable upon the completion of this offering. The employment agreement further provides that on each anniversary date of his employment (commencing on November 23, 1999), Mr. Dollarhyde is entitled to receive additional options (including incentive stock options) to purchase such number of shares of our common stock, at fair market value, that is equal to 0.4% of our capital stock outstanding on the anniversary date. Through the date of this prospectus, we have granted to Mr. Dollarhyde additional options to purchase 74,493 shares of our common stock at exercise prices per share ranging from $6.00 to $9.25. Except for options to purchase 6,081 shares of our common stock that were granted under our 2001 stock plan, all options were granted under our 1998 stock plan. All such additional options vest according to the vesting schedule described above for options granted under such plans to our other employees and consultants.
If we terminate the employment agreement for cause, Mr. Dollarhyde will be entitled to receive as severance the amount of his base salary for three months following the date of termination. If we terminate his agreement without cause or if Mr. Dollarhyde terminates his employment due to our material breach, Mr. Dollarhyde will be entitled to receive severance in an amount equal to 24 months of his base salary. These severance payments will be payable in equal installments over the one-year period following termination, except that the entire amount of the then-unpaid portion of the severance amount will be payable in full upon the occurrence of a change in control. Mr. Dollarhyde’s employment agreement further provides that in the event of a termination of his employment for any reason, he will be obligated to enter into a consulting agreement with us for a term of one year.
Mr. Dollarhyde may not compete with us in any other Mexican quick service restaurant in the United States for a period of one year following the termination of his employment with us. The obligation not to compete with us after termination of employment may be unenforceable if we do not retain Mr. Dollarhyde as a consultant following any such termination. Mr. Dollarhyde also agreed not to solicit any of our employees until one year after his employment terminates.
58
Table of Contents
Arrangements with other named executive officers
Employment offer letters signed by our other named executive officers set forth the terms of their compensation and other terms and conditions of their employment with us. The employment of these other named executive officers is at will and may be terminated by us or such officer at any time and for any reason. Messrs. Breen, Heeley, Carucci and Whitwell receive annual base salaries of $175,000, $160,000, $150,000 and $117,500, respectively. They also will be entitled to the following discretionary and non-discretionary bonuses:
| • | Mr. Breen is eligible to receive a year-end discretionary bonus equal to 20.0% of his base salary for each year that he is employed with us. We also agreed to pay Mr. Breen a one-time bonus in the amount of $100,000 upon the completion of our initial public offering. |
| • | Mr. Heeley is entitled to receive a performance bonus equal to 20.0% of his base salary if we achieve certain operational milestones and satisfy certain performance benchmarks. |
| • | Mr. Carucci is eligible to receive a year-end discretionary bonus of $25,000 for each year that he is employed with us. |
| • | Mr. Whitwell is eligible to receive a year-end discretionary bonus of $17,625 for each year that he is employed with us. |
Change in control and accelerated vesting
Each of Messrs. Dollarhyde, Breen, Heeley, Carucci and Whitwell have options (including incentive stock options) that provide for accelerated vesting upon the completion of a sale of all or substantially all of our assets or the acquisition of our company by another entity. In the case of an acquisition, the options will not accelerate if our voting securities outstanding immediately before the transaction continue to represent more than 66.67% of the combined voting power of our voting securities and the voting securities of the acquiring entity or if the acquisition involves a recapitalization of our company in which no person acquires more than 25.0% of the combined voting power of the then outstanding securities. Upon an acceleration event, all unvested options granted to these officers will vest in full and become exercisable.
Messrs. Dollarhyde and Siracusa have options that provide for accelerated vesting upon our initial public offering of shares of our common stock.
Our management team members are entitled to receive a change of control success fee. The success fee provides that if we are sold or there is a change of control of our company prior to December 31, 2002, or if we enter into a bona fide letter of intent for such a transaction prior to December 31, 2002 and the transaction closes by March 31, 2003, then a pool of $5.0 million shall be set aside for management. Our chief executive officer and chief financial officer will receive $2.0 million and $1.0 million from the bonus pool, respectively. Our other management members will share in the remaining $2.0 million in such proportions as is determined by our chief executive officer and board of directors.
59
Table of Contents
Pursuant to a Restricted Stock Purchase Agreement dated November 24, 1998 between us and Greg Dollarhyde, our president and chief executive officer, Mr. Dollarhyde purchased 29,453 shares of Series A convertible preferred stock at $6.80 per share for $200,200 in cash and 196,266 shares of our common stock at $4.53 per share for a total purchase price of $889,739. Mr. Dollarhyde paid for the common stock with a secured promissory note which is supported by a pledge of the shares purchased. The loan bears interest at 4.51% per annum, and all principal and interest is payable on the maturity date. The largest aggregate amount of indebtedness outstanding at any time under this loan was $1,023,393, which is also the amount of indebtedness outstanding as of March 25, 2002. Prior to execution of an amendment on April 24, 2002, recourse to Mr. Dollarhyde’s personal assets under the promissory note (other than the pledged shares) was limited. Following execution of the amendment, the promissory note is now full recourse. The loan is due November 24, 2003 or, if earlier, following the termination of Mr. Dollarhyde’s employment with us.
As part of the offering of Series B convertible preferred stock on April 28, 2000, Mr. Dollarhyde purchased 18,414 shares of Series B convertible preferred stock at $7.28 per share for a total purchase price of $134,054. Mr. Dollarhyde paid $48,827 in cash and borrowed the remaining $85,227 from us pursuant to a secured promissory note, which is supported by a pledge of his shares of Series B convertible preferred stock. The loan bears interest at the rate of 10.0% per annum, and all principal and interest is payable on the maturity date. The largest aggregate amount of indebtedness outstanding at any time under this loan was $95,717, which is also the amount of indebtedness outstanding as of March 25, 2002. The loan is due November 24, 2003 or, if earlier, following the termination of Mr. Dollarhyde’s employment with us. As a condition to this loan, 50.0% of any bonus payable to Mr. Dollarhyde must be applied to the repayment of any outstanding balances.
As part of the offering of Series C convertible preferred stock on October 2, 2001, Mr. Dollarhyde purchased 17,000 shares of Series C convertible preferred stock at $9.25 per share for a total purchase price of $157,250. Mr. Dollarhyde borrowed all of the purchase price from us pursuant to a secured promissory note, which is supported by a pledge of his shares of Series C convertible preferred stock. The loan bears interest at the rate of 6.0% per annum, which is due annually in arrears. The largest aggregate amount of indebtedness outstanding at any time under this loan was $161,779, which is also the amount of indebtedness outstanding as of March 25, 2002. The loan is due November 24, 2003 or, if earlier, following the termination of Mr. Dollarhyde’s employment with us.
Pursuant to a secured promissory note dated April 24, 2002, we loaned $500,000 to Mr. Dollarhyde. The loan bears interest at the rate of 6.25% per annum and all principal and interest is payable on April 24, 2005 or, if earlier, following the termination of Mr. Dollarhyde’s employment with us. In support of his obligation under the note, Mr. Dollarhyde pledged 11,707 shares of our Series B convertible preferred stock and 17,000 shares of our Series C convertible preferred stock owned by him, and all options granted to him for the purchase of shares of our common stock. This loan is junior in payment to the existing loans we have made to Mr. Dollarhyde, and the security interests in the shares are subordinate to the previously granted security interests in such shares. As consideration for this loan, Mr. Dollarhyde agreed to amend the terms of an existing loan to him in the amount of $889,739 to provide for full recourse liability thereunder.
Pursuant to a Restricted Stock Purchase Agreement dated November 24, 1998, between us and Pete Siracusa, one of our current directors, Mr. Siracusa purchased 120,779 shares of our common stock at $4.53 per share for a total purchase price of $547,525. Mr. Siracusa paid for the shares with a secured promissory note which is supported by a pledge of the shares purchased. The loan bears interest at 4.51% per annum, and all principal and interest is payable on the maturity date. The largest aggregate amount of indebtedness outstanding at any time under this loan was $629,778, which is also the amount of indebtedness outstanding as of March 25, 2002. Prior to execution of an amendment as of April 19, 2002, recourse to Mr. Siracusa’s personal assets under the promissory note (other than the pledged shares) was limited. Following execution of the amendment, the promissory note is now full recourse. We issued Mr. Siracusa options to purchase 10,000 shares of our common
60
Table of Contents
stock at $9.25 per share in consideration of his execution of the amendment. The promissory note is due November 24, 2003 or, if earlier, following the termination of Mr. Siracusa’s position as a consultant to us.
In connection with our recapitalization in November 1998, we entered into a consulting agreement with Mr. Siracusa, under the terms of which Mr. Siracusa agreed to serve as the chairman of our board of directors and provide such ancillary services as we may reasonably request from time to time. Since expiration of the initial term of the agreement on November 23, 1999, we have renewed the agreement for successive terms of one year each. Under the agreement, Mr. Siracusa receives a salary of $18,750 for each quarter during the engagement period. We also granted to Mr. Siracusa options to purchase 120,779 shares of our common stock at an exercise price of $4.53 per share. All unvested options granted to Mr. Siracusa will vest and become exercisable immediately upon the completion of this offering. We may terminate the agreement at any time without liability, except for the payment of cash compensation payable through the end of the quarter in which such termination occurs.
As part of the offering of Series C convertible preferred stock on October 2, 2001, Don Breen, our senior vice president and chief financial officer, purchased 3,686 shares of Series C convertible preferred stock at $9.25 per share for a total purchase price of $34,095.50. Mr. Breen borrowed all of the purchase price from us pursuant to a secured promissory note, which is supported by a pledge of his shares of Series C convertible preferred stock. The loan bears interest at the rate of 6.0% per annum, which is due annually in arrears. The largest aggregate amount of indebtedness outstanding at any time under this loan was $35,078, which is also the amount of indebtedness outstanding as of March 25, 2002. The loan is due November 24, 2003 or, if earlier, following the termination of Mr. Breen’s employment with us.
In connection with our recapitalization in November 1998, we issued a promissory note to Jim Magglos, our founder and one of our current directors, in the total principal amount of $2 million. The note bears interest at a rate of 6.0% per annum. On November 24, 2001, $500,000 of the principal amount and accrued but unpaid interest was paid, and the remaining principal and interest is due and payable on November 24, 2002. The promissory note is subordinated in right of payment to all of our secured debt.
Pursuant to a promissory note dated July 3, 2001, we loaned $258,100 to our shareholders, John and Coralee Yonkich. The loan bears interest at the rate of 10.0% per annum and all principal and interest is payable on July 5, 2004. In support of their obligations under the note, Mr. and Ms. Yonkich pledged 35,000 shares of our common stock owned by them and have agreed to pledge additional shares of our common stock owned by them if the value of the collateral, as determined by the board of directors, is less than the amount then outstanding under the note. So long as Mr. and Ms. Yonkich comply with the requirement to deposit additional shares of our common stock owned by them as necessary, we will not have any recourse to any other of their personal assets. As a condition to this loan, Mr. and Mrs. Yonkich may not sell any shares of the pledged common stock as long as any portion of the loan is outstanding.
61
Table of Contents
The following table sets forth information with respect to the beneficial ownership of our common stock as of the date of this prospectus and after the offering, in each case as adjusted to reflect the conversion and redemption of our outstanding preferred stock and the sale of the common stock offered by us with respect to:
| • | each person or entity who is known by us to beneficially own five percent or more of our outstanding common stock; |
| • | each of our directors; |
| • | each of our named executive officers; |
| • | all of our directors and executive officers as a group; and |
| • | our selling shareholders. |
Shares Beneficially Owned Prior to the Offering(1) | Shares Beneficially Owned After the Offering(2) | ||||||||
Name of Beneficial Owner | Number | Percentage | Number | Percentage | |||||
| Catterton Partners and affiliates(3) | 4,141,570 | 45.4 | % | % | |||||
| Oak Investment Partners and affiliates(4) | 1,598,018 | 17.5 | |||||||
| Grumman Hill Group and affiliates(5) | 1,500,502 | 16.5 | |||||||
| Frank M. Vest, Jr.(6) | 4,142,070 | 45.4 | |||||||
| Gerald R. Gallagher(7) | 1,598,518 | 17.5 | |||||||
| James T. Kelsey(8) | 1,501,002 | 16.5 | |||||||
| James Magglos(9) | 1,073,750 | 11.8 | |||||||
| Gregory G. Dollarhyde(10) | 487,570 | 5.2 | |||||||
| Louis A. Siracusa(11) | 396,192 | 4.3 | |||||||
| John C. and Coralee Yonkich | 107,151 | 1.2 | |||||||
| Donald D. Breen(12) | 44,570 | * | |||||||
| Peter J. Whitwell(13) | 13,500 | * | |||||||
| Steve Heeley(14) | 15,000 | * | |||||||
| Randall Carucci(15) | 11,400 | * | |||||||
| All directors and officers as a group (13 persons) (16) | 9,296,672 | 97.3 | |||||||
| * | Less than 1.0% |
| (1) | Percentage of ownership is calculated as required by the Rule 13d-3(d)(1) of the 1934 Securities Exchange Act, as amended. Except as indicated in the footnotes to this table, the persons named in this table have sole voting and investment power with respect to all shares of common stock shown as beneficially owned by them, subject to community property laws. The table above includes the number of shares underlying options that are exercisable within 60 days of [ ], 2002 and the number of shares expected to be received upon the conversion of the preferred stock. The share numbers in this section have been rounded to the nearest whole number. |
| (2) | Reflects the number of shares of common stock expected to be issued upon conversion of shares of preferred stock owned by the named shareholder. These numbers do not take into account any exercise of the underwriters’ over-allotment option granted by some of our shareholders, as follows: |
| • | Up to 250,000 shares of our common stock from Jim and Linda Magglos of the 1,055,000 shares of common stock they currently hold. See footnote 9 for information relating to Mr. and Mrs. Magglos’ security ownership and relationship with us. |
| • | Up to 75,000 shares of our common stock from John and Coralee Yonkich of the 107,151 shares of common stock they currently hold. |
62
Table of Contents
| (3) | Represents: |
| • | 2,040,441 shares held by Catterton-Simon Partners III, L.P., assuming conversion of our Series A convertible preferred stock; |
| • | 716,278 shares held by Catterton Partners IV, L.P., assuming conversion of our Series B convertible preferred stock and Series C convertible preferred stock; |
| • | 603,839 shares held by Catterton Partners IV Offshore, L.P., assuming conversion of our Series B convertible preferred stock and Series C convertible preferred stock; |
| • | 21,442 shares held by Catterton Partners IV Special Purpose, L.P., assuming conversion of our Series B convertible preferred stock and Series C convertible preferred stock; |
| • | 251,120 shares held by Catterton Partners IV-A, L.P., assuming conversion of our Series B convertible preferred stock and Series C convertible preferred stock; |
| • | 17,508 shares held by Catterton Partners IV-B, L.P., assuming conversion of our Series B convertible preferred stock and Series C convertible preferred stock; and |
| • | 490,942 shares held by Catterton-Baja Partners LLC, assuming conversion of our Series B convertible preferred stock and Series C convertible preferred stock, which will be distributed to Catterton Partners IV Management Company, L.L.C. and PPM American Private Equity Fund, L.P. immediately following this offering as described below. |
Catterton Partners IV Management Company, L.L.C. is the Management Company Representative for Catterton Partners IV, L.P. and affiliates and the Managing Member of Catterton-Baja Partners, L.L.C. Catterton Partners Management Company, L.L.C. is the Management Company Representative for Catterton-Simon Partners III, L.P. Frank Vest exercises voting and/or investment powers for the shares held by Catterton-Simon Partners III, L.P. as the Managing Director of Catterton Partners Management Company, L.L.C., the Management Company Representative for Catterton-Simon Partners III, L.P. Mr. Vest exercises voting and/or investment powers for the shares held by Catterton Partners IV, L.P., Catterton Partners IV Offshore, L.P., Catterton Partners IV Special Purpose, L.P., Catterton Partners IV-A, L.P. and Catterton Partners IV-B, L.P. as the Managing Director for Catterton Partners IV Management Company, the Management Company Representative for Catterton Partners IV, L.P., Catterton Partners IV Offshore, L.P., Catterton Partners IV Special Purpose, L.P., Catterton Partners IV-A, L.P. and Catterton Partners IV-B, L.P. Mr. Vest exercises voting and/or investment powers for the shares held by Catterton-Baja Partners LLC as the Managing Director of Catterton Partners IV Management Company, L.L.C., the Managing Member of Catterton-Baja Partners, L.L.C. Although Mr. Vest may be deemed to be the beneficial owner, Mr. Vest disclaims beneficial ownership of the shares owned by the above entities.
Immediately following this offering, Catterton-Baja Partners, L.L.C. will distribute 490,942 shares of our common stock to its members, Catterton Partners IV Management Company, L.L.C. and PPM American Private Equity Fund, L.P., thereby reducing the shares attributable to Catterton Partners and its affiliates. In connection with the distribution, Catterton Partners IV Management Company, L.L.C. will receive 6,039 shares of our common stock and PPM American Private Equity Fund, L.P. will receive 484,903 shares of our common stock.
The address for Catterton Partners is 599 West Putnam Avenue, Suite 200, Greenwich, Connecticut 06830.
| (4) | Represents: |
| • | 1,585,258 shares held by Oak Investment Partners, VIII LP, assuming conversion of our Series A convertible preferred stock, Series B convertible preferred stock and Series C convertible preferred stock; and |
| • | 12,760 shares held by Oak VIII Affiliates Fund LP, assuming conversion of our Series B convertible preferred stock and Series C convertible preferred stock. |
63
Table of Contents
Gerald Gallagher exercises voting and/or investment powers for the shares held by Oak Investment Partners, VIII LP as a Managing Member of Oak Associates VIII, L.L.C., the General Partner of Oak Investments Partners VIII, Limited Partnership. Mr. Gallagher exercises voting and/or investment powers for the shares held by Oak VIII Affiliates Fund LP as the Managing Member of Oak VIII Affiliates, the General Partner of Oak VIII Affiliates Fund, Limited Partnership. Although Mr. Gallagher may be deemed to be the beneficial owner, Mr. Gallagher disclaims beneficial ownership of the shares owned by such entities in which he does not have a pecuniary interest.
The address for Oak Investment Partners is One Gorham Island, Westport, Connecticut 06880.
| (5) | Represents shares held by Grumman Hill Investments III, LP, assuming conversion of our Series A convertible preferred stock, Series B convertible preferred stock and Series C convertible preferred stock. |
James Kelsey exercises voting and/or investment powers for the shares held by Grumman Hill Investments III, LP as the Managing Member of Grumman Hill Group, LLC, the General Partner of Grumman Hill Investments III, LP. Although Mr. Kelsey may be deemed to be the beneficial owner, Mr. Kelsey disclaims beneficial ownership of the shares owned by the above entities.
The address for Grumman Hill Investments III, LP is 191 Elm Street, New Canaan, Connecticut 06840.
| (6) | Mr. Vest controls the voting and/or investment power of shares of our common stock as Managing Director of Catterton Partners Management Company, L.L.C., the Management Company Representative for Catterton-Simon Partners III, L.P., as the Managing Director for Catterton Partners IV Management Company, the Management Company Representative for Catterton Partners IV, L.P., Catterton Partners IV Offshore, L.P., Catterton Partners IV Special Purpose, L.P., Catterton Partners IV-A, L.P. and Catterton Partners IV-B, L.P. and as the Managing Director of Catterton Partners IV Management Company, L.L.C., the Managing Member of Catterton-Baja Partners, L.L.C. and may be deemed to be the beneficial owner of the shares held by such entities. Mr. Vest disclaims beneficial ownership of the shares owned by the above entities. This amount includes the vested portion of an option to purchase shares of our common stock which will be granted to our independent directors on the date of our initial public offering of shares of common stock. Mr. Vest’s address is 10 Hale Street, Suite 205, Charleston, West Virginia 25301. |
Immediately following this offering, Catterton-Baja Partners, L.L.C. will distribute 490,942 shares of our common stock to its members, Catterton Partners IV Management Company, L.L.C. and PPM American Private Equity Fund, L.P., thereby reducing the shares attributable to Mr. Vest. In connection with the distribution, Catterton Partners IV Management Company, L.L.C. will receive 6,039 shares of our common stock and PPM American Private Equity Fund, L.P. will receive 484,903 shares of our common stock.
| (7) | Mr. Gallagher controls the voting and/or investment power of shares of our common stock as a Managing Member of Oak Associates VIII, L.L.C., the General Partner of Oak Investments Partners VIII, Limited Partnership and as the Managing Member of Oak VIII Affiliates, the General Partner of Oak VIII Affiliates Fund, Limited Partnership. Mr. Gallagher disclaims beneficial ownership of the shares owned by Oak Investments Partners VIII, Limited Partnership and Oak VIII Affiliates Fund, Limited Partnership. Although Mr. Gallagher may be deemed to be the beneficial owner, Mr. Gallagher disclaims beneficial ownership of the shares owned by such entities in which he does not have a pecuniary interest. This amount includes the vested portion of an option to purchase shares of our common stock which will be granted to our independent directors on the date of our initial public offering of shares of common stock. Mr. Gallagher’s address is 90 So. 7th Street, Suite 4550, Minneapolis, Minnesota 55402. |
| (8) | Mr. Kelsey controls the voting and/or investment power of the shares as a Managing Member of Grumman Hill Group, LLC, the General Partner of the Grumman Hill Investments III, LP. Although Mr. Kelsey may be deemed to be the beneficial owner, Mr. Kelsey disclaims beneficial ownership of the shares owned by Grumman Hill Investments III, LP. This amount includes the vested portion of an option to purchase shares of our common stock which will be granted to our independent directors on the date of our initial public offering of shares of common stock. Mr. Kelsey’s address is 191 Elm Street, New Canaan, CT 06840. |
64
Table of Contents
| (9) | Mr. Magglos, jointly with his wife, Linda Magglos, holds 1,055,000 shares of our common stock, and will be issued 18,750 shares of our common stock upon the exercise of warrants that are immediately exercisable. Mr. Magglos’ address is 6921 Solano Verde Drive, Somis, CA 93066. |
| (10) | Mr. Dollarhyde individually owns a total of 275,798 shares of our common stock, assuming conversion of our Series A convertible preferred stock, Series B convertible preferred stock, and Series C convertible preferred stock. Mr. Dollarhyde holds 5,000 additional shares of our common stock in trust for the benefit of his ex-wife, that will be issued upon conversion of 5,000 shares of Series B convertible preferred stock held by JKG Enterprise Group Money Purchase Pension Plan FBO Greg Dollarhyde, of which Mr. Dollarhyde is trustee. Additionally, Mr. Dollarhyde has options to purchase 270,759 shares of our common stock, of which options to purchase 211,772 shares are immediately exercisable or will be exercisable at the completion of this offering. Pursuant to a domestic relations order, options to acquire an aggregate of 66,234 shares of our common stock held by Mr. Dollarhyde are held by him in trust for the benefit of his ex-wife and Mr. Dollarhyde’s ex-wife controls the timing of exercise and disposition of the shares issuable upon exercise of these options. Pursuant to a domestic relations order, Mr. Dollarhyde will also transfer to his ex-wife an aggregate of 22,059 shares of our common stock issuable upon conversion of 14,706 shares of our Series A convertible preferred stock and 6,707 shares of our Series B convertible preferred stock he owns. |
| (11) | Mr. Siracusa individually owns a total of 265,413 shares of our common stock, assuming conversion of our Series A convertible preferred stock and Series B convertible preferred stock. Mr. Siracusa also has options to purchase 130,779 shares of our common stock, all of which will be exercisable immediately at the completion of this offering. |
| (12) | Mr. Breen individually owns a total of 20,570 shares of our common stock, assuming conversion of our Series B convertible preferred stock and Series C convertible preferred stock. Mr. Breen also has options to purchase 100,000 shares of our common stock, of which options to purchase 24,000 shares are exercisable immediately. |
| (13) | Mr. Whitwell has options to purchase 55,000 shares of our common stock, of which options to purchase 13,500 shares are exercisable immediately. |
| (14) | Mr. Heeley has options to purchase 80,000 shares of our common stock, of which options to purchase 15,000 shares are exercisable immediately. |
| (15) | Mr. Carucci has options to purchase 32,000 shares of our common stock, of which options to purchase 11,400 shares are exercisable immediately. |
| (16) | These 13 individuals include all directors and executive officers detailed in the “Management” section above. See notes 6 through 13 above. Natascha Kogler Brown has options to purchase 4,000 shares of our common stock upon exercise of immediately exercisable options. Timothy J. Thomason has options to purchase 6,100 shares of our common stock upon exercise of immediately exercisable options. Eugene F. Cameron has options to purchase 3,000 shares of our common stock upon exercise of immediately exercisable options. The address for all officers is 225 W. Hillcrest Drive, Suite 351, Thousand Oaks, California 91360. |
65
Table of Contents
Upon the consummation of this offering, our authorized capital stock will consist of 50,000,000 shares of common stock, without par value of which [ ] shares will be issued and outstanding (assuming [ ] shares are sold in this offering), and 15,000,000 shares of preferred stock, without par value, of which no shares will be issued and outstanding. The terms of the Series A convertible preferred stock, Series B convertible preferred stock and Series C convertible preferred stock provide that the shares will automatically convert into a right to receive common stock upon consummation of this offering. Upon conversion, each share of Series A convertible preferred stock will convert into 1.5 shares of common stock, and each share of Series B convertible preferred stock and each share of Series C convertible preferred stock will convert into one share of common stock. All of the shares of outstanding preferred stock that are converted will return to the status of authorized and unissued shares of preferred stock and may be reissued as a part of a new series of preferred stock to be created by resolution or resolutions of the board of directors.
Common stock
Before giving effect to the conversion of preferred stock into common stock in connection with this offering, there are 1,520,225 shares of common stock outstanding as of the date of this prospectus. These shares are held of record by six shareholders. An additional 7,596,822 shares of common stock will be issued upon conversion of the preferred stock, which is currently held by 19 shareholders of record.
Holders of common stock are entitled to one vote per share on all matters to be voted upon by shareholders. In accordance with California law, the affirmative vote of a majority of the shares represented and voting at a duly held meeting at which a quorum is present (which shares voting affirmatively also constitute at least a majority of the required quorum) shall be the act of the shareholders. In accordance with California law, prior to the closing of this offering, holders of common stock were entitled to cumulate votes in the election of directors. However, after consummation of this offering, holders of common stock will no longer be entitled to cumulate votes in the election of directors. The shares of common stock have no preemptive rights, no redemption or sinking fund provisions, and are not liable for further call or assessment.
The holders of common stock are entitled to receive dividends when and as declared by the board of directors out of funds legally available for dividends. We currently intend to retain all future earnings for the operation and expansion of our business and do not anticipate paying cash dividends on the common stock in the foreseeable future.
Upon a liquidation of our company, our creditors and holders of our preferred stock with preferential liquidation rights will be paid before any distribution to holders of our common stock. The holders of common stock would be entitled to receive a pro rata distribution per share of any excess amount.
The rights, preferences and privileges of holders of common stock are subject to, and may be adversely affected by, the rights of the holders of shares of any series of preferred stock that we may designate and issue in the future.
Preferred stock
Our articles of incorporation empower the board of directors to issue up to 15,000,000 shares of preferred stock from time to time in one or more series. The board also may fix the designation, privileges, preferences and rights and the qualifications, limitations and restrictions of those shares, including dividend rights, conversion rights, voting rights, redemption rights, terms of sinking funds, liquidation preferences and the number of shares constituting any series or the designation of the series. Terms selected could decrease the amount of earnings and assets available for distribution to holders of our common stock or adversely affect the rights and power, including voting rights, of the holders of our common stock without any further vote or action by the
66
Table of Contents
shareholders. The rights of holders of common stock will be subject to, and may be adversely affected by, the rights of the holders of any preferred stock that may be issued by us in the future. Upon consummation of this offering, there will be no outstanding shares of our preferred stock. We have no present intention to issue any shares of preferred stock. See “Description of Capital Stock—Potential anti-takeover effect of provisions of charter documents and California law” for information regarding the potential anti-takeover effects of authorized but unissued preferred stock.
Warrants
On November 24, 1998, we issued two warrants, each of which entitles the holder to acquire 18,750 shares of our common stock at an exercise price of $3.33 per share. We also issued a put warrant on November 24, 1998 which entitles the holder to acquire 75,000 shares of our common stock at an exercise price of $4.53 per share and to require us, at its option, to repurchase the warrant upon the occurance of certain events, including an initial public offering. All of these warrants expire on November 24, 2005. The exercise price and number of shares issuable upon exercise are subject to adjustment upon the occurrence of certain events set forth in the warrant agreements. In connection with our acquisition of the remaining 50.0% ownership interest in a restaurant in Encino, California in June 2000, we issued three warrants that collectively entitle the holders of the warrants to acquire 30,000 shares of our common stock at an exercise price of $8.00 per share. As of the date of this prospectus, no warrants have been exercised.
Registration rights
Following this offering the holders of 9,117,047 shares of common stock will be entitled to registration rights with respect to their shares pursuant to an Amended and Restated Registration Rights Agreement dated as of October 2, 2001, as amended on April 19, 2002. The agreement contains a lock-up provision applicable to shareholders participating in an offering while we are in registration and for a period of 180 days following the effective date of a registration statement. Some of our shareholders have the right to make a demand on us to register shares of our common stock beginning as early as six months after the consummation of this offering. In addition, all holders of shares with registration rights have the right to piggyback on any registration for our account or the account of another shareholder. Accordingly, in the event that we propose to register additional shares of common stock under the Securities Act, either for our own account or for the account of any other security holder, the holders of shares having piggyback registration rights are entitled to receive notice of that registration and to include their shares in the registration, subject to limitations described in the agreement. All registration rights are subject to conditions and limitations, among them the right of the underwriters of any offering to limit the number of shares of common stock held by these security holders to be included in the registration. We are generally required to bear all of the expenses of all registrations, except underwriting discounts and selling commissions. Registration of the shares of common stock held by security holders with registration rights would result in these shares becoming freely tradeable without restriction under the Securities Act immediately upon effectiveness of this registration.
Potential anti-takeover effect of provisions of charter documents and California law
Provisions of California law, our articles of incorporation and amended bylaws could make it more difficult for a third party to acquire a majority of our outstanding voting stock, discouraging a hostile bid, or delaying, preventing or deterring a merger, acquisition or tender offer in which our shareholders could receive a premium for their shares, or effect a proxy contest for control of our company or other changes in our management.
California law takeover statute
Section 1203 of the California General Corporations Law includes further provisions that may have the effect of deterring hostile takeovers or delaying or preventing changes in control or management of our company. First, if an “interested person” makes an offer to purchase the shares of some or all of our shareholders, we must obtain an affirmative opinion in writing as to the fairness of the offering price prior to completing the transaction.
67
Table of Contents
California law considers a person to be an “interested person” if the person directly or indirectly controls our company, if the person is directly or indirectly controlled by one of our officers or directors, or if the person is an entity in which one of our officers or directors holds a material financial interest. If after receiving an offer from such an “interested person” we receive a subsequent offer from a neutral third party, then we must notify our shareholders of this offer and afford each of them the opportunity to withdraw their consent to the “interested person” offer.
Elimination of shareholder action by written consent
After this offering, our articles of incorporation will provide that our shareholders may act only at a duly called annual or special meeting of shareholders, and not by written consent.
Advance notice requirements for shareholder proposals
Our amended bylaws establish an advance notice procedure for shareholders to bring any business before any annual meeting of our shareholders. The bylaws provide that at any annual meeting of shareholders only such business may be conducted as has been brought before the meeting by, or at the direction of, the board of directors or by a shareholder who has given timely written notice to the secretary of the company of such shareholder’s intention to bring such business before such meeting. Generally, for notice of business to be brought before an annual meeting to be timely under the amended bylaws, such notice must be received by us not less than 90 days nor more than 120 days prior to the first anniversary of the previous year’s annual meeting (or, if the annual meeting is more than 30 days before or more than 60 days after the anniversary date, not earlier than the 120th day before such meeting and not later than the 90th day prior to such meeting or the 10th day after public announcement of the date of such meeting is first made). Under the amended bylaws, a shareholder’s notice must also contain certain information specified in the bylaws.
Authorized but unissued shares of common stock and preferred stock
Our authorized but unissued shares of common stock and preferred stock are available for future issuance without shareholder approval, subject to limitations imposed by the Nasdaq National Market. These additional shares may be utilized for a variety of corporate purposes, including future public offerings to raise additional capital and for restaurant acquisitions. The existence of authorized but unissued and unreserved common stock and preferred stock could render it more difficult or discourage an attempt to obtain control of us or make removal of management more difficult.
Additionally, the issuance of preferred stock may have the effect of decreasing the market price of our common stock and may adversely affect the voting and other rights of the holders of common stock. Upon consummation of this offering, there will be no outstanding shares of our preferred stock. While we have no present intention to issue any shares of preferred stock, any issuance could have the effect of making it more difficult for a third party to acquire a majority of our outstanding voting stock.
Transfer agent and registrar
American Stock Transfer & Trust Company has been appointed as the transfer agent and registrar for our common stock. The transfer agent’s address is 59 Maiden Lane, New York, NY 10038 and its telephone number is (718) 236-4585.
68
Table of Contents
Prior to this offering, there has been no market for our common stock. Future sales of substantial amounts of our common stock in the public market could adversely affect market prices prevailing from time to time. Upon completion of this offering, we will have outstanding an aggregate of [ ] shares of common stock, assuming no exercise of outstanding options and the conversion of shares of our preferred stock into shares of common stock. Of these shares, the shares sold in this offering will be freely tradeable without restriction or further registration under the Securities Act, except that any shares purchased by “affiliates” of us, as that term is defined in Rule 144 of the Securities Act, may generally only be sold in compliance with the limitations of Rule 144 described below.
Sales of restricted shares
The 9,117,047 shares of common stock held by existing shareholders are “restricted securities” under Rule 144. The number of shares of common stock available for sale in the public market is limited by restrictions under the Securities Act and lock-up agreements under which the holders of [ ] shares have agreed not to sell or otherwise dispose of any of their shares for a period of 180 days after the date of this prospectus without the prior written consent of Banc of America Securities LLC.
In general, under Rule 144 as currently in effect, beginning 90 days after the date of this prospectus, a person (or persons whose shares are aggregated) who has beneficially owned restricted shares for at least one year (including the holding period of any prior owner, except where the prior owner was an affiliate) would be entitled to sell within any three-month period a number of shares that does not exceed the greater of: (a) one percent of the number of shares of our common stock then outstanding (which will equal approximately [ ] shares immediately after the offering); or (b) the average weekly trading volume of our common stock on the Nasdaq National Market during the four calendar weeks preceding the filing of a notice on Form 144 with respect to this sale. Sales under Rule 144 are also subject to manner of sale provisions and notice requirements and to the availability of current public information about us. Under Rule 144(k), a person who is not deemed to have been an affiliate of ours at any time during the 90 days preceding a sale, and who has beneficially owned the shares proposed to be sold for at least two years (including the holding period of any prior owner except where the prior owner was an affiliate), is entitled to sell its shares without complying with the manner of sale, public information, volume limitation or notice provisions of Rule 144. Therefore we, unless otherwise restricted, “144(k) shares” could be sold immediately upon the completion of the offering. On the date of this prospectus, an aggregate of approximately 162,297 shares will qualify as “144(k)” shares.
Upon completion of the offering, the holders of 9,117,047 shares of common stock, or their transferees, will be entitled to rights with respect to the registration of their shares under the Securities Act. Registration of these shares under the Securities Act would result in these shares becoming freely tradeable without restriction under the Securities Act (except for shares purchased by affiliates) immediately upon the effectiveness of this registration.
Options
We intend to file a registration statement on Form S-8 covering all shares of common stock issuable upon exercise of outstanding stock options on the date of this prospectus and stock options or other stock rights to be granted in the future under our stock option plan. Upon this registration statement on Form S-8, and after the expiration of any applicable lock-up period, up to an additional 983,038 shares of common stock issuable upon exercise of currently outstanding stock options, together with any additional shares of common stock that will be issuable pursuant to stock options or other stock rights granted in the future under our stock option plan, will be eligible for sale in the public market.
Subject to certain conditions, Rule 701 under the Securities Act may be relied upon with respect to the resale of securities originally purchased from us by our employees, directors, officers, consultants or advisors
69
Table of Contents
prior to the closing of this offering, under written compensatory benefit plans or written contracts relating to the compensation of these persons. This also applies to stock options we granted prior to this offering, along with the shares acquired upon exercise of those options after the closing of this offering. Beginning 90 days after the date of this prospectus (unless subject to lockup agreements or other contractual restrictions) these shares may be sold by persons other than affiliates subject only to the manner of sale restrictions of Rule 144 and by affiliates under Rule 144 without compliance with the one year minimum holding period requirement.
Sales of substantial amounts of our common stock in the public market, or the perception that these sales may occur, could adversely affect the prevailing market price of our common stock and our ability to raise capital through any offering of our equity securities.
70
Table of Contents
We are offering the shares of our common stock described in this prospectus through a number of underwriters. Banc of America Securities LLC, Credit Suisse First Boston Corporation and Thomas Weisel Partners LLC are the representatives of the underwriters. We have entered into an underwriting agreement with the representatives. Subject to the terms and conditions of the underwriting agreement, we have agreed to sell to the underwriters, and each of the underwriters has severally agreed to purchase, the number of shares of common stock listed next to its name in the following table:
Underwriter | Number of Shares | |
| Banc of America Securities LLC | ||
| Credit Suisse First Boston Corporation | ||
| Thomas Weisel Partners LLC | ||
| Total | ||
The underwriting agreement is subject to a number of terms and conditions and provides that the underwriters must buy all of the shares if they buy any of them. The underwriters will sell the shares to the public when and if the underwriters buy the shares from us.
The underwriters initially will offer the shares to the public at the price specified on the cover page of this prospectus. The underwriters may allow to selected dealers a concession of not more than $[ ] per share. The underwriters also may allow, and any dealers may reallow, a concession of not more than $[ ] per share to selected other dealers. If all the shares are not sold at the public offering price, the underwriters may change the public offering price and the other selling terms. Our common stock is offered subject to a number of conditions, including:
| • | receipt and acceptance of our common stock by the underwriters; and |
| • | the underwriters’ right to reject orders in whole or in part. |
We and the selling shareholders have granted an option to the underwriters to buy up to [ ] and [ ] additional shares of our common stock, respectively. The underwriters may exercise this option solely for the purpose of covering over-allotments, if any, made in connection with this offering. The underwriters have 30 days from the date of this prospectus to exercise this option. If the underwriters exercise this option, they will each purchase additional shares approximately in proportion to the amounts specified in the table above.
The following table shows the per share and total underwriting discounts and commissions to be paid to the underwriters assuming both no exercise and full exercise of the underwriters’ option to purchase additional shares.
No Exercise | Full Exercise | |||
| Per share | ||||
| Total |
The expenses of this offering, not including the underwriting discounts and commissions, are estimated to be $[ ] million and are payable by us.
We, our executive officers and directors and principal shareholders have entered into lock-up agreements with the underwriters. Under these agreements, we and each of these persons may not, without the prior written approval of Banc of America Securities LLC, offer, sell, contract to sell or otherwise dispose of or hedge our common stock or securities convertible into or exchangeable for our common stock. These restrictions will be in
71
Table of Contents
effect for a period of 180 days after the date of this prospectus. At any time and without notice, Banc of America Securities LLC may, in its sole discretion, release all or some of the securities from these lock-up agreements.
We will indemnify the underwriters against some liabilities, including liabilities under the Securities Act. If we are unable to provide this indemnification, we will contribute to payments the underwriters may be required to make in respect of those liabilities.
We have applied for quotation of our common stock on the Nasdaq National Market under the symbol “BAJA”.
In connection with this offering, the underwriters may engage in activities that stabilize, maintain or otherwise affect the price of our common stock, including:
| • | stabilizing transactions; |
| • | short sales; |
| • | syndicate covering transactions; |
| • | imposition of penalty bids; and |
| • | purchases to cover positions created by short sales. |
Stabilizing transactions consist of bids or purchases made for the purpose of preventing or retarding a decline in the market price of our common stock while this offering is in progress. Stabilizing transactions may include making short sales of our common stock, which involves the sale by the underwriters of a greater number of shares of common stock than they are required to purchase in this offering, and purchasing shares of common stock on the open market to cover positions created by short sales. Short sales may be “covered” shorts, which are short positions in an amount not greater than the underwriters’ over-allotment option referred to above, or may be “naked” shorts, which are short positions in excess of that amount.
The underwriters may close out any covered short position either by exercising their over-allotment option, in whole or in part, or by purchasing shares in the open market. In making this determination, the underwriters will consider, among other things, the price of shares available for purchase in the open market compared to the price at which the underwriters may purchase shares through the over-allotment option.
A naked short position is more likely to be created if the underwriters are concerned that there may be downward pressure on the price of the common stock in the open market that could adversely affect investors who purchased in this offering. To the extent that the underwriters create a naked short position, they will purchase shares in the open market to cover the position.
The underwriters also may impose a penalty bid on underwriters and selling group members. This means that if the representatives purchase shares in the open market in stabilizing transactions or to cover short sales, the representatives can require the underwriters that sold those shares as part of this offering to repay the underwriting discount received by them.
As a result of these activities, the price of our common stock may be higher than the price that otherwise might exist in the open market. If the underwriters commence these activities, they may discontinue them at any time. The underwriters may carry out these transactions on the Nasdaq National Market, in the over-the-counter market or otherwise.
The underwriters do not expect sales to discretionary accounts to exceed 5.0% of the total number of shares of common stock offered by this prospectus.
72
Table of Contents
Prior to this offering, there has been no public market for our common stock. The initial public offering price will be negotiated between the underwriters and us. The primary factors to be considered in the negotiations are:
| • | our history and prospects, and the history and prospects of the industry in which we compete; |
| • | our past and present financial performance; |
| • | an assessment of our management; |
| • | the present state of our development; |
| • | our prospects for future earnings; |
| • | the prevailing market conditions of the U.S. securities markets at the time of this offer; |
| • | market valuations of publicly traded companies that we and the underwriters believe to be comparable to us; and |
| • | other factors deemed relevant by the underwriters and us. |
At our request, the underwriters, have reserved for sale to our employees, strategic partners and other individuals associated with us and members of their families, up to [ ]% of the shares being offered by this prospectus at the initial public offering price. The sales will be made by [ ] through a directed share program. We do not know if these persons will choose to purchase all or any portion of these reserved shares, but any purchases they do make will reduce the number of shares available to the general public. These persons must commit to purchase no later than the close of business on the day following the date of this prospectus. Any employees, strategic partners or other persons purchasing such reserved shares will be prohibited from disposing of or hedging such shares for a period of at least 180 days after the date of this prospectus.
The underwriters and their affiliates have provided and may provide certain commercial banking, financial advisory and investment banking services for us for which they receive customary fees.
73
Table of Contents
The validity of the shares of common stock offered in this initial public offering will be passed upon for Fresh Enterprises, Inc. by Pillsbury Winthrop LLP, Los Angeles, California. Legal matters in connection with the common stock offered in this initial public offering will be passed upon for the underwriters by Shearman & Sterling, New York, New York.
The consolidated financial statements of Fresh Enterprises, Inc. at January 1, 2001 and December 31, 2001, and for each of the three fiscal years in the period ended December 31, 2001, appearing in this Prospectus and Registration Statement have been audited by Ernst & Young LLP, independent auditors, as set forth in their report thereon appearing elsewhere herein, and are included in reliance upon such report given on the authority of such firm as experts in accounting and auditing.
We have filed a registration statement on Form S-1 with the Securities and Exchange Commission for the common stock we are offering by this prospectus. This prospectus does not include all the information contained in the registration statement and its exhibits and schedules. You should refer to the registration statement and its exhibits for additional information. Whenever we make reference in this prospectus to any of our contracts, agreements or other documents, the references are not necessarily complete and you should refer to the exhibits attached to the registration statement for complete copies of the actual contract, agreement or other documents. When we complete this offering, we will also be required to file annual, quarterly and special reports, proxy statements and other information with the Securities and Exchange Commission.
You can read our filings with the Securities and Exchange Commission, including the registration statement, over the internet at the SEC’s web site at www.sec.gov. You may read and copy any document we file with the SEC at its Public Reference Room at 450 Fifth Street, N.W., Washington, D.C. 20549. You may also obtain copies of the documents at prescribed rates by writing to the Public Reference Room of the SEC at 450 Fifth Street, N.W., Washington, D.C. 20549. Please call the SEC at 1-800-SEC-0330 for further information on the operation of the Public Reference Room. Our SEC filings are also available at the office of the Nasdaq National Market. For further information on obtaining copies of our public filings at the Nasdaq National Market you should call (212) 656-5060.
74
Table of Contents
FRESH ENTERPRISES, INC. AND SUBSIDIARIES
Years ended January 3, 2000, January 1, 2001 and December 31, 2001
| F-2 | ||
| F-3 | ||
| F-4 | ||
| F-5 | ||
| F-6 | ||
| F-7 |
F-1
Table of Contents
The Board of Directors and Shareholders
Fresh Enterprises, Inc.
We have audited the accompanying consolidated balance sheets of Fresh Enterprises, Inc. and Subsidiaries (the Company) as of January 1, 2001 and December 31, 2001, and the related consolidated statements of operations, shareholders’ deficiency and cash flows for each of the three years in the period ended December 31, 2001. These consolidated financial statements are the responsibility of the Company’s management. Our responsibility is to express an opinion on these financial statements based on our audits.
We conducted our audits in accordance with auditing standards generally accepted in the United States. Those standards require that we plan and perform the audit to obtain reasonable assurance about whether the financial statements are free of material misstatement. An audit includes examining, on a test basis, evidence supporting the amounts and disclosures in the financial statements. An audit also includes assessing the accounting principles used and significant estimates made by management, as well as evaluating the overall financial statement presentation. We believe that our audits provide a reasonable basis for our opinion.
In our opinion, the consolidated financial statements referred to above present fairly, in all material respects, the consolidated financial position of Fresh Enterprises, Inc. and Subsidiaries as of January 1, 2001 and December 31, 2001, and the consolidated results of their operations and their cash flows for each of the three years in the period ended December 31, 2001, in conformity with accounting principles generally accepted in the United States.
/s/ ERNST & YOUNG LLP | ||
Long Beach, California
April 1, 2002
F-2
Table of Contents
FRESH ENTERPRISES, INC. AND SUBSIDIARIES
January 1, 2001 | December 31, 2001 | |||||||
Assets | ||||||||
| Current assets: | ||||||||
| Cash and cash equivalents | $ | 1,691,100 | $ | 439,200 | ||||
| Receivables due from franchisees | 370,100 | 282,300 | ||||||
| Income taxes receivable | 197,800 | 304,600 | ||||||
| Other receivables | 377,700 | 857,300 | ||||||
| Inventories | 196,000 | 425,900 | ||||||
| Current portion of notes receivable | 112,900 | 129,600 | ||||||
| Prepaids and other current assets | 794,300 | 946,200 | ||||||
| Total current assets | 3,739,900 | 3,385,100 | ||||||
| Property and equipment, net | 20,192,600 | 33,961,400 | ||||||
| Investment in unconsolidated joint ventures | 444,900 | 570,800 | ||||||
| Notes receivable, less current portion | 574,400 | 702,100 | ||||||
| Deposits and other assets | 1,491,900 | 2,093,000 | ||||||
| Deferred tax assets, net | 594,800 | 1,141,600 | ||||||
| Total assets | $ | 27,038,500 | $ | 41,854,000 | ||||
Liabilities and shareholders’ deficiency | ||||||||
| Current liabilities: | ||||||||
| Line of credit | $ | 1,187,400 | $ | 1,876,300 | ||||
| Accounts payable | 3,882,300 | 3,959,500 | ||||||
| Accrued salaries and wages | 797,000 | 1,458,100 | ||||||
| Other accrued liabilities | 814,000 | 980,300 | ||||||
| Current portion of long-term debt | 141,500 | 107,700 | ||||||
| Current portion of due to shareholder | 500,000 | 1,500,000 | ||||||
| Total current liabilities | 7,322,200 | 9,881,900 | ||||||
| Long-term debt, less current portion | 187,000 | 78,600 | ||||||
| Due to shareholder, less current portion | 1,500,000 | — | ||||||
| Deferred revenue | 1,466,300 | 2,247,100 | ||||||
| Deferred rent | 246,900 | 552,100 | ||||||
| Redeemable convertible preferred stock: | ||||||||
| Series A, net, no par value; 2,727,941 shares issued and outstanding at January 1, 2001 and December 31, 2001 (liquidation preference of $18,550,000) | 17,936,000 | 18,111,700 | ||||||
| Series B, net, no par value; 2,153,507 shares issued and outstanding at January 1, 2001 and December 31, 2001 (liquidation preference of $15,677,500) | 15,470,600 | 15,497,500 | ||||||
| Series C, net, no par value; 1,351,405 shares issued and outstanding at December 31, 2001 (liquidation preference of $12,500,500) | — | 12,131,000 | ||||||
| Put warrant | 56,000 | 354,000 | ||||||
| Commitments and contingencies | ||||||||
| Shareholders’ deficiency: | ||||||||
| Common stock, no par value; 15,000,000 shares authorized; 1,520,225 shares issued and outstanding at January 1, 2001 and December 31, 2001 | 2,702,600 | 3,102,600 | ||||||
| Notes receivable from purchase of common stock | (1,573,400 | ) | (1,638,200 | ) | ||||
| Warrants | 90,400 | 90,400 | ||||||
| Accumulated deficit | (18,366,100 | ) | (18,554,700 | ) | ||||
| Total shareholders’ deficiency | (17,146,500 | ) | (16,999,900 | ) | ||||
| Total liabilities and shareholders’ deficiency | $ | 27,038,500 | $ | 41,854,000 | ||||
See accompanying notes.
F-3
Table of Contents
FRESH ENTERPRISES, INC. AND SUBSIDIARIES
Year ended | ||||||||||||
January 3, 2000 | January 1, 2001 | December 31, 2001 | ||||||||||
| Revenues: | ||||||||||||
| Restaurant sales | $ | 22,823,700 | $ | 37,970,900 | $ | 72,796,000 | ||||||
| Royalty, franchise and other revenues | 2,238,200 | 3,317,900 | 5,253,000 | |||||||||
| Total revenues | 25,061,900 | 41,288,800 | 78,049,000 | |||||||||
| Costs and expenses: | ||||||||||||
| Restaurant operating costs: | ||||||||||||
| Cost of sales | 8,046,100 | 13,368,000 | 24,716,000 | |||||||||
| Labor | 7,141,700 | 12,781,500 | 23,848,800 | |||||||||
| Direct operating and occupancy | 3,282,100 | 6,228,700 | 14,377,100 | |||||||||
| Total restaurant operating costs | 18,469,900 | 32,378,200 | 62,941,900 | |||||||||
| General and administrative | 4,469,500 | 6,501,100 | 8,640,100 | |||||||||
| Depreciation and amortization | 736,300 | 1,579,200 | 3,448,300 | |||||||||
| Pre-opening | 63,000 | 915,300 | 1,287,900 | |||||||||
| Non-cash stock compensation | 872,000 | 228,000 | 400,000 | |||||||||
| Loss on asset impairment | — | — | 375,000 | |||||||||
| 24,610,700 | 41,601,800 | 77,093,200 | ||||||||||
| Operating income (loss) | 451,200 | (313,000 | ) | 955,800 | ||||||||
| Other income (expense): | ||||||||||||
| Interest income | 81,900 | 301,100 | 177,700 | |||||||||
| Interest expense | (327,700 | ) | (400,600 | ) | (768,800 | ) | ||||||
| Other income (expense), net | (3,300 | ) | 27,000 | 50,600 | ||||||||
| Gain (loss) on disposition of assets | — | 331,300 | (54,100 | ) | ||||||||
| Total other income (expense), net | (249,100 | ) | 258,800 | (594,600 | ) | |||||||
| Income (loss) before income tax provision (benefit) | 202,100 | (54,200 | ) | 361,200 | ||||||||
| Income tax provision (benefit) | (72,500 | ) | 79,600 | 320,000 | ||||||||
| Net income (loss) | 274,600 | (133,800 | ) | 41,200 | ||||||||
| Redeemable convertible preferred stock accretion | (172,300 | ) | (197,400 | ) | (229,800 | ) | ||||||
| Net income (loss) attributable to common shareholders | $ | 102,300 | $ | (331,200 | ) | $ | (188,600 | ) | ||||
| Net income (loss) attributable to common shareholders per share: | ||||||||||||
| Basic | $ | 0.07 | $ | (0.22 | ) | $ | (0.12 | ) | ||||
| Diluted | $ | 0.05 | $ | (0.22 | ) | $ | (0.12 | ) | ||||
| Shares used in calculating net income (loss) attributable to common shareholders per share: | ||||||||||||
| Basic | 1,506,208 | 1,520,225 | 1,520,225 | |||||||||
| Diluted | 5,660,400 | 1,520,225 | 1,520,225 | |||||||||
See accompanying notes.
F-4
Table of Contents
FRESH ENTERPRISES, INC. AND SUBSIDIARIES
Common Stock | Notes Receivable from Purchase of Common Stock | Accumulated Deficit | ||||||||||||||||||
Shares | Amount | Warrants | Total | |||||||||||||||||
| Balance, December 31, 1998 | 1,006,130 | $ | 1,552,600 | $ | (1,449,600 | ) | $ | — | $ | (18,137,200 | ) | $ | (18,034,200 | ) | ||||||
| 3-for-2 stock split effective June 30, 1999 | 503,065 | — | — | — | — | — | ||||||||||||||
| Issuance of common stock | 11,030 | 50,000 | — | — | — | 50,000 | ||||||||||||||
| Accrual of periodic interest on notes receivable from purchase of common stock | — | — | (59,000 | ) | — | — | (59,000 | ) | ||||||||||||
| Accretion of redeemable convertible preferred stock to liquidation preference | — | — | — | — | (172,300 | ) | (172,300 | ) | ||||||||||||
| Non-cash stock compensation | — | 872,000 | — | — | — | 872,000 | ||||||||||||||
| Net income | — | — | — | — | 274,600 | 274,600 | ||||||||||||||
| Balance, January 3, 2000 | 1,520,225 | 2,474,600 | (1,508,600 | ) | — | (18,034,900 | ) | (17,068,900 | ) | |||||||||||
| Accrual of periodic interest on notes receivable from purchase of common stock | — | — | (64,800 | ) | — | — | (64,800 | ) | ||||||||||||
| Accretion of redeemable convertible preferred stock to liquidation preference | — | — | — | — | (197,400 | ) | (197,400 | ) | ||||||||||||
| Issuance of warrants to purchase common stock | — | — | — | 90,400 | — | 90,400 | ||||||||||||||
| Non-cash stock compensation | — | 228,000 | — | — | — | 228,000 | ||||||||||||||
| Net loss | — | — | — | — | (133,800 | ) | (133,800 | ) | ||||||||||||
| Balance, January 1, 2001 | 1,520,225 | 2,702,600 | (1,573,400 | ) | 90,400 | (18,366,100 | ) | (17,146,500 | ) | |||||||||||
| Accrual of periodic interest on notes receivable from purchase of common stock | — | — | (64,800 | ) | — | — | (64,800 | ) | ||||||||||||
| Accretion of redeemable convertible preferred stock to liquidation preference | — | — | — | — | (229,800 | ) | (229,800 | ) | ||||||||||||
| Non-cash stock compensation | — | 400,000 | — | — | — | 400,000 | ||||||||||||||
| Net income | — | — | — | — | 41,200 | 41,200 | ||||||||||||||
| Balance, December 31, 2001 | 1,520,225 | $ | 3,102,600 | $ | (1,638,200 | ) | $ | 90,400 | $ | (18,554,700 | ) | $ | (16,999,900 | ) | ||||||
See accompanying notes.
F-5
Table of Contents
FRESH ENTERPRISES, INC. AND SUBSIDIARIES
Year ended | ||||||||||||
January 3, 2000 | January 1, 2001 | December 31, 2001 | ||||||||||
Operating activities | ||||||||||||
| Net income (loss) | $ | 274,600 | $ | (133,800 | ) | $ | 41,200 | |||||
| Adjustments to reconcile net income (loss) to net cash provided by operating activities: | ||||||||||||
| Accrual of periodic interest on notes receivable from purchase of common stock | (59,000 | ) | (64,800 | ) | (64,800 | ) | ||||||
| Accrual of periodic interest on notes receivable from purchases of preferred stock | — | (5,700 | ) | (11,400 | ) | |||||||
| Change in fair value of put warrants | — | — | 298,000 | |||||||||
| Non-cash stock compensation | 872,000 | 228,000 | 400,000 | |||||||||
| Depreciation and amortization | 736,300 | 1,579,200 | 3,448,300 | |||||||||
| Deferred tax assets | (665,500 | ) | 70,700 | (546,800 | ) | |||||||
| Loss on asset impairment | — | — | 375,000 | |||||||||
| Gain (loss) on disposition of assets | — | (331,300 | ) | 54,100 | ||||||||
| Equity in net loss from unconsolidated joint ventures | 35,600 | 20,100 | 24,100 | |||||||||
| Changes in operating assets and liabilities: | ||||||||||||
| Receivables | (145,300 | ) | (632,900 | ) | (498,600 | ) | ||||||
| Inventories | (45,400 | ) | (88,200 | ) | (229,900 | ) | ||||||
| Prepaids and other current assets | (196,600 | ) | (524,700 | ) | (202,200 | ) | ||||||
| Deposits and other assets | (234,400 | ) | (1,140,100 | ) | (601,100 | ) | ||||||
| Accounts payable | 599,300 | 2,269,200 | 77,300 | |||||||||
| Accrued salaries and wages | 433,900 | 183,400 | 661,100 | |||||||||
| Other accrued liabilities | 328,300 | 9,300 | 166,300 | |||||||||
| Deferred revenue | 645,700 | 780,600 | 780,800 | |||||||||
| Deferred rent | 98,800 | 105,300 | 305,200 | |||||||||
| Net cash provided by operating activities | 2,678,300 | 2,324,300 | 4,476,600 | |||||||||
Investing activities | ||||||||||||
| Purchases of property and equipment | (3,355,800 | ) | (15,966,400 | ) | (17,595,900 | ) | ||||||
| Proceeds from disposal of property and equipment | — | 360,000 | — | |||||||||
| Investment in unconsolidated joint ventures | (249,500 | ) | (475,000 | ) | (150,000 | ) | ||||||
| Acquisition of remaining interests in joint ventures | (125,000 | ) | (275,000 | ) | — | |||||||
| Proceeds from collection of notes receivable | 5,200 | 17,500 | 113,700 | |||||||||
| Proceeds from collection of shareholder receivable | 34,400 | — | — | |||||||||
| Issuance of notes receivable | — | — | (258,100 | ) | ||||||||
| Net cash used in investing activities | (3,690,700 | ) | (16,338,900 | ) | (17,890,300 | ) | ||||||
Financing activities | ||||||||||||
| Net borrowings on line of credit | 184,900 | (1,498,800 | ) | 688,900 | ||||||||
| Repayments on long-term debt | (222,900 | ) | (240,200 | ) | (142,200 | ) | ||||||
| Payment on capital lease obligations | (33,500 | ) | (20,700 | ) | — | |||||||
| Net proceeds from issuance of preferred stock | — | 15,452,800 | 12,115,100 | |||||||||
| Net proceeds from issuance of common stock | 50,000 | — | — | |||||||||
| Repayments on loans due to shareholders and related parties | (543,800 | ) | — | (500,000 | ) | |||||||
| Net cash provided by (used in) financing activities | (565,300 | ) | 13,693,100 | 12,161,800 | ||||||||
| Net decrease in cash and cash equivalents | (1,577,700 | ) | (321,500 | ) | (1,251,900 | ) | ||||||
| Cash and cash equivalents, beginning of year | 3,590,300 | 2,012,600 | 1,691,100 | |||||||||
| Cash and cash equivalents, end of year | $ | 2,012,600 | $ | 1,691,100 | $ | 439,200 | ||||||
See accompanying notes.
F-6
Table of Contents
FRESH ENTERPRISES, INC. AND SUBSIDIARIES
December 31, 2001
1. Description of Business
The Company
The accompanying consolidated financial statements include the accounts of Fresh Enterprises, Inc. (Fresh) and its wholly owned subsidiaries: Baja Fresh Westlake Village, Inc., Triune Corporation and, effective June 17, 2000, Encino Corporation. Hereinafter, Fresh and its wholly owned subsidiaries are collectively referred to as the Company. All intercompany balances and transactions have been eliminated in consolidation.
The Company operates in two business segments consisting of Company-owned and operated restaurants and franchised operations. The Company operates and franchises quick casual restaurants under the name “Baja Fresh Mexican Grill,” serving a wide variety of freshly prepared, flavorful Mexican food. As of December 31, 2001, the Company has grown to 67 company-owned and 84 franchised restaurants, for a system-wide total of 151 restaurants in 14 states and the District of Columbia. The Company operates in California, Nevada, Arizona, Illinois, Texas and the Washington D.C. metropolitan area. Restaurants in operation at January 3, 2000, January 1, 2001 and December 31, 2001 are summarized as follows:
January 3, 2000 | January 1, 2001 | December 31, 2001 | ||||
| Company-owned restaurants | 18 | 39 | 67 | |||
| Franchised restaurants | 39 | 57 | 84 | |||
| Total restaurants | 57 | 96 | 151 | |||
Franchise Operations
The Company grants franchisees the right to operate franchises under the name “Baja Fresh Mexican Grill.” Currently, each of the area developers is required to enter into two types of agreements: an Area Development Agreement (ADA) which establishes the timing and number of stores to be developed in an area, and a franchise agreement for each restaurant opened. For fiscal years 1999, 2000 and 2001, the Company had 39, 57 and 84 franchisee restaurants opened.
Pursuant to the ADA, a franchisee is required to pay a non-refundable $50,000 initial franchise fee for the first restaurant and to pay an initial development fee equal to $15,000 multiplied by the total number of restaurants required under the ADA (excluding the first restaurant). As each new site is accepted, the franchisee signs a franchise agreement and lease on the premises and pays an initial franchise fee of $30,000 ($20,000 for franchisees who had entered into franchise agreements with the Company prior to fiscal year ended 1999), $15,000 of which is paid in cash and $15,000 of which is paid by crediting a portion of the initial development fee paid by the franchisee. Other than this credit, the development fee is non-refundable.
The ADA and single restaurant franchise agreements typically have a 10-year initial term, but provide the franchisee with an opportunity to enter into a renewal franchise agreement subject to certain conditions. The ADA and single restaurant franchise agreements provide for payment to the Company of royalties equal to 5% of gross sales. The Company also has the right to assess franchisees an advertising fee in the amount of 1% of gross sales, and to establish regions for cooperative advertising and require an additional advertising fee not to exceed 1.5% of gross sales. The Company has not made an assessment of either of these advertising fees to date.
F-7
Table of Contents
FRESH ENTERPRISES, INC. AND SUBSIDIARIES
NOTES TO CONSOLIDATED FINANCIAL STATEMENTS—(Continued)
2. Accounting Policies
Fiscal Year-End
The Company operates on a 52 or 53-week fiscal year reported in 13, four-week, periods and ends on the Monday closest to December 31 in each year. The Company’s fiscal years ended January 3, 2000, January 1, 2001 and December 31, 2001 consisted of 53, 52 and 52 weeks, respectively. For purposes of the accompanying consolidated financial statements and notes, the years ended January 3, 2000, January 1, 2001 and December 31, 2001 may be referred to as fiscal 1999, 2000 and 2001, respectively.
Use of Estimates
The preparation of financial statements in conformity with accounting principles generally accepted in the United States requires management to make estimates and assumptions that affect the reported amounts of assets and liabilities and the disclosure of contingent assets and liabilities at the date of the financial statements and the reported amounts of income and expenses during the reporting period. Actual results could differ from those estimates and assumptions.
Cash and Cash Equivalents
Cash and cash equivalents include highly liquid investments with maturities of three months or less at date of purchase. Periodically balances in various bank accounts exceed federally insured limits. No losses have been experienced to date related to such accounts. The Company places its cash with quality financial institutions and believes it is not exposed to significant concentrations of credit risk on cash and cash equivalents.
Inventories
Inventories consist primarily of food and beverage items, and printed materials and are stated at the lower of cost (first-in, first-out method) or market.
Property and Equipment
Property and equipment is stated at cost, less accumulated depreciation and amortization and provisions for impairment. Accumulated depreciation and amortization is provided for principally by using the straight-line method over the estimated useful lives, as follows:
Years | ||
| Computer equipment | 3-5 | |
| Furniture and fixtures | 5 | |
| Vehicles | 5 | |
| Restaurant equipment | 10 | |
| Leasehold improvements | Shorter of 15 years or life of lease |
Expenditures for maintenance and repairs are expensed as incurred. Costs of major replacements and betterments are capitalized. When property and equipment is retired or otherwise disposed of, the cost and accumulated depreciation and amortization are removed from the appropriate accounts and any gain or loss is included in the Company’s consolidated results of operations.
F-8
Table of Contents
FRESH ENTERPRISES, INC. AND SUBSIDIARIES
NOTES TO CONSOLIDATED FINANCIAL STATEMENTS—(Continued)
The Company accounts for the impairment and disposition of long-lived assets in accordance with Statement of Financial Accounting Standards (SFAS) No. 144, “Accounting for Impairment or Disposal of Long- Lived Assets.” In accordance with SFAS No. 144, long-lived assets to be held and used in operations are reviewed for events or changes in circumstances, which indicate that their carrying value may not be recoverable.
Change in Accounting Estimate
Based on a review of the useful lives of certain of the Company’s restaurant equipment and leasehold improvements, management of the Company determined that the actual useful lives for certain asset categories were generally longer than the useful lives previously estimated and used for depreciation and amortization purposes prior to January 3, 2000. As a result, effective January 4, 2000, the Company extended the estimated useful lives of certain of the restaurant equipment and leasehold improvements for the purpose of recognizing depreciation and amortization expense. This change in accounting estimate resulted in a reduction of depreciation and amortization expense for the year ended January 1, 2001 by approximately $300,000.
Investments in Unconsolidated Joint Ventures
The Company accounts for its investments in unconsolidated joint ventures under the equity method of accounting. Under this method, the Company’s investment in its unconsolidated joint ventures is adjusted for capital contributions made, capital distributions received and its proportionate share of equity in earnings or losses from the respective joint venture.
Smallwares
When a restaurant is first opened, the initial purchase of expendable equipment, such as cookware and utensils, is capitalized as smallwares and is not amortized. All replacements of smallwares are expensed. Included in deposits and other assets at January 1, 2001 and December 31, 2001 is approximately $523,000 and $1,054,000, respectively, of smallwares.
Deferred Rent
The Company leases equipment and various facilities, primarily for restaurant operations, under terms of lease agreements expiring on various dates through December 2015. Many of these leases provide for future rent escalations and renewal options. The Company records rent expense on a straight-line basis. The difference between the straight-line rent expense and the actual lease payment is recorded as deferred rent.
Gift Certificates
The Company sells gift certificates and defers the recognition of income, which is included in deferred revenue, for gift certificates outstanding until the gift certificates are redeemed.
Revenue Recognition
Revenues from the operation of company-owned restaurants are recognized when sales occur. These sales are primarily made in cash or by credit card.
F-9
Table of Contents
FRESH ENTERPRISES, INC. AND SUBSIDIARIES
NOTES TO CONSOLIDATED FINANCIAL STATEMENTS—(Continued)
The Company accounts for franchise fees received in accordance with SFAS No. 45, “Accounting for Franchise Fee Revenue.” Revenue from individual and area franchise sales is recognized as income when the Company has substantially performed all of its material obligations under the franchise agreement and the franchisee has commenced operations. Continuing royalty and service fees, which are a percentage of the gross sales of franchised operations, are accrued as income when earned.
At January 1, 2001 and December 31, 2001, the Company had $1,466,300 and $2,247,100 of deferred revenue, respectively, related to the sale of franchises.
Advertising Expenses
Advertising expenses are charged to operations in the fiscal year incurred. The Company incurred advertising expenses totaling $111,800, $4,900 and $183,300 during the fiscal years ended January 3, 2000, January 1, 2001 and December 31, 2001, respectively, which are included in general and administrative expenses in the accompanying consolidated statements of operations.
Pre-Opening Costs
Pre-opening costs include payroll, training, recruiting and other expenses incurred prior to the opening of a new restaurant.
Earnings Per Share
The Company follows SFAS No. 128, “Earnings Per Share” (EPS). SFAS No. 128 requires dual presentation of “Basic” and “Diluted” EPS by entities with complex capital structures. Basic EPS excludes dilution and is computed by dividing net income or loss attributable to common shareholders by the weighted average of common shares outstanding for the period. Diluted EPS reflects the potential dilution that could occur if securities or other contracts to issue common stock (redeemable convertible preferred stock, warrants to purchase common stock and common stock options using the treasury stock method) were exercised or converted into common stock. Potential common shares in the diluted EPS computation are excluded where their effect would be antidilutive.
Income Taxes
The Company accounts for income taxes in accordance with SFAS No. 109, “Accounting for Income Taxes,” which requires the recognition of deferred tax assets and liabilities for the expected future tax consequences of events that have been included in the financial statements or tax returns. Under this method, deferred income taxes are determined based on the difference between the financial statement basis and the income tax basis of assets and liabilities using enacted tax rates in effect for the year in which the differences are expected to reverse. Valuation allowances are established when necessary to reduce deferred tax assets to the amount expected to be realized. The provision for income taxes represents income taxes payable for the period and the change during the period in deferred tax assets and liabilities.
F-10
Table of Contents
FRESH ENTERPRISES, INC. AND SUBSIDIARIES
NOTES TO CONSOLIDATED FINANCIAL STATEMENTS—(Continued)
Stock-Based Compensation
SFAS No. 123, “Accounting for Stock-Based Compensation,” encourages but does not require a fair-value-based method of accounting for employee stock options or similar equity instruments. SFAS No. 123 allows an entity to elect to continue to measure compensation cost under Accounting Principles Board Opinion (APB) No. 25, “Accounting for Stock Issued to Employees,” but requires pro forma disclosure of net earnings as if the fair-value-based method of accounting had been applied. The Company elected to continue to apply the provisions of APB No. 25 and provide the pro forma disclosure provisions of SFAS No. 123.
Concentration of Credit Risk
Financial instruments that potentially subject the Company to concentrations of credit risk consist primarily of cash and cash equivalents. The Company places its cash with financial institutions. At times, the balances in the Company’s cash accounts may exceed the Federal Deposit Insurance Corporation (FDIC) insurance coverage limit of $100,000. Management believes that this credit risk is not significant.
The Company purchases the majority of its food products and supplies from a third-party distributor. A loss of this sole distributor may have a short-term impact on the Company’s operations, but management believes that there would be no material long-term effects since there are several other available distributors. Purchases from this distributor totaled $8,519,400, $13,829,000 and $20,998,000 for the years ended January 3, 2000, January 1, 2001 and December 31, 2001, respectively. At January 1, 2001 and December 31, 2001, the Company owed this distributor $905,000 and $1,753,400, respectively. These amounts are included in accounts payable in the accompanying consolidated balance sheets.
Fair Value of Financial Instruments
The fair value of the Company’s cash and cash equivalents, receivables due from franchisees, accounts payable and all other current liabilities approximate their carrying values because of the short maturities on these instruments.
The fair value of the Company’s debt and put warrants approximate their carrying values as evidenced by their relatively short-term maturity dates and stated rates of interest and terms that approximate current market rates and terms.
The fair value of the Company’s redeemable convertible preferred stock approximates its liquidation preference aggregating $46,728,000 at December 31, 2001.
New Accounting Pronouncements
In June 2001, the Financial Accounting Standards Board issued SFAS No. 141, “Business Combinations” and SFAS No. 142, “Goodwill and Other Intangible Assets.” SFAS No. 141 requires that the purchase method of accounting be used for all business combinations initiated after June 30, 2001. SFAS No. 141 also includes guidance on the initial recognition and measurement of goodwill and other intangible assets arising from business combinations completed after June 30, 2001. SFAS No. 142 prohibits the amortization of goodwill and intangible assets with indefinite useful lives. SFAS No. 142 requires that these assets be reviewed for impairment at least annually. Intangible assets with finite lives will continue to be amortized over their estimated useful lives.
F-11
Table of Contents
FRESH ENTERPRISES, INC. AND SUBSIDIARIES
NOTES TO CONSOLIDATED FINANCIAL STATEMENTS—(Continued)
Additionally, SFAS No. 142 requires that goodwill included in the carrying value of equity method investments no longer be amortized. The Company will apply SFAS No. 141 and SFAS No. 142 beginning in the first quarter of fiscal 2002. Management of the Company believes that the adoption of SFAS No. 141 and SFAS No. 142 will not have a significant impact on the Company’s consolidated financial position or consolidated results of operations.
The Company early adopted SFAS No. 144, “Accounting for the Impairment or Disposal of Long-Lived Assets,” issued in August 2001 by the Financial Accounting Standards Board, which addresses financial accounting and reporting for the impairment or disposal of long-lived assets and supersedes SFAS No. 121, “Accounting for the Impairment of Long-Lived Assets and for Long-Lived Assets to be Disposed Of,” and the accounting and reporting provisions of APB Opinion No. 30, “Reporting the Results of Operations for a Disposal of a Segment of a Business.” The early adoption of SFAS No. 144 did not result in a significant impact on the Company’s consolidated financial position or consolidated results of operations.
Reclassifications
Certain reclassifications have been made to the January 3, 2000 and January 1, 2001 consolidated financial statements to conform with the December 31, 2001 presentation.
3. Notes Receivable
Notes receivable consists of the following:
January 1, 2001 | December 31, 2001 | |||||
| Notes receivable from franchisees | $ | 687,300 | $ | 573,600 | ||
| Notes receivable due from shareholders | — | 258,100 | ||||
| 687,300 | 831,700 | |||||
| Less current portion | 112,900 | 129,600 | ||||
| $ | 574,400 | $ | 702,100 | |||
During 1999, the Company obtained two promissory notes in the amount of $70,000 and $30,000 due from a franchisee as payment for the initial area development fees. The notes bear interest at an annual rate of 10.0% and 8%, respectively, and are payable in 60 monthly installments.
During 2000, the Company obtained two promissory notes in the amount of $360,000 and $250,000 due from a franchisee as payment for the purchase of two restaurant locations. The notes bear interest at an annual rate of 10.0% and are payable in 60 monthly installments.
During 2001, the Company obtained a promissory note in the amount of $258,100 due from shareholders as payment for a cash loan. The note is collateralized by 35,000 shares of the Company’s common stock. The note bears interest at an annual rate of 10.0% with principal and accrued interest payable in full in 2004.
F-12
Table of Contents
FRESH ENTERPRISES, INC. AND SUBSIDIARIES
NOTES TO CONSOLIDATED FINANCIAL STATEMENTS—(Continued)
4. Property and Equipment
Property and equipment consists of the following:
January 1, 2001 | December 31, 2001 | |||||
| Leasehold improvements | $ | 14,077,100 | $ | 26,327,100 | ||
| Restaurant equipment | 3,889,300 | 6,198,300 | ||||
| Furniture and fixtures | 2,510,600 | 4,158,300 | ||||
| Computer equipment | 1,779,700 | 3,295,200 | ||||
| Construction in-progress | 1,154,700 | 741,300 | ||||
| 23,411,400 | 40,720,200 | |||||
| Less accumulated depreciation and amortization | 3,218,800 | 6,758,800 | ||||
| $ | 20,192,600 | $ | 33,961,400 | |||
In accordance with SFAS No. 144, the Company recognizes the impairment of certain property and equipment by reducing the carrying value of the assets to their estimated fair value based on discounted cash flows of each underperforming restaurant. The Company increased accumulated depreciation and amortization and recorded a loss on impairment of property and equipment in the amount of $375,000, during the fiscal year ended December 31, 2001. No recognition of impairment was required during fiscal 1999 and 2000.
5. Investment in Unconsolidated Joint Ventures
During 1998, the Company entered into a joint venture agreement with certain shareholders of the Company to open and operate a Baja Fresh Mexican Grill restaurant in Encino, California (Encino), for which it maintained a 50.0% financial and voting interest. On June 16, 2000, the Company acquired the remaining interests in Encino that it did not already own for a total consideration of $365,400, comprised of $275,000 in cash and the issuance of 30,000 warrants to purchase the Company’s common stock with an estimated value of $90,400. As a result of this acquisition, the Company has consolidated in its financial statements the account balances and transactions of Encino since June 17, 2000. Included in deposits and other assets is the excess consideration over the value of the net assets acquired (goodwill) of $90,400.
During 2000, the Company entered into a joint venture agreement with a third party to operate and develop six Baja Fresh Mexican Grill restaurants in San Diego, California (SD Fresca), for which it maintains a 50.0% financial and voting interest in SD Fresca. The Company made capital contributions to SD Fresca in the amount of $475,000 and $150,000 during fiscal 2000 and 2001, respectively. SD Fresca had three restaurants in operation as of December 31, 2001.
Equity in net loss from the Company’s investment in unconsolidated joint ventures of $35,600, $21,000 and $24,100 is included in other income (expense) for the fiscal years 1999, 2000 and 2001, respectively.
6. Borrowings
Short-Term
During fiscal 2001, the Company entered into an amended Business Loan and Commercial Security Agreement (Business Loan) to increase the aggregate commitment to $18.0 million. The Business Loan has two components, a $2.0 million line of credit and a $16.0 million development line. Interest is payable monthly at the
F-13
Table of Contents
FRESH ENTERPRISES, INC. AND SUBSIDIARIES
NOTES TO CONSOLIDATED FINANCIAL STATEMENTS—(Continued)
prime rate plus 0.25%. (5.0% at December 31, 2001). The Business Loan includes certain restrictive covenants and requires the Company to maintain certain financial ratios as are customary for such borrowings, including a restriction that the Company not experience any losses on a quarterly basis and a prohibition on the extension of loans, the incurrence of obligations as a guarantor, and the making of acquisitions in excess of a $3,000,000 threshold. For the fiscal year ended December 31, 2001, the Company was not in compliance with such restrictions as it related to experiencing net losses on a quarterly basis. The Company obtained a waiver from their lender effective as of December 31, 2001 waiving noncompliance of such covenants through the fiscal year then ended. As of December 31, 2001, there was $1,376,300 outstanding under the line of credit and $500,000 outstanding under the development line. The weighted-average interest rates on short-term borrowings outstanding at January 1, 2000 and December 31, 2001 were 9.75% and 5.0%, respectively.
Long-Term
Long-term debt consists of the following:
January 1, 2001 | December 31, 2001 | |||||
| Note payable to a financial institution, bearing interest at 9.28%, payable in monthly interest and principal payments of $3,029 through June 2003 | $ | 78,400 | $ | 48,100 | ||
| Note payable to a financial institution, bearing interest at 9.42%, payable in monthly interest and principal payments of $2,312 through June 2003 | 61,900 | 36,700 | ||||
| Note payable to a financial institution, bearing interest at 9.11%, payable in monthly interest and principal payments of $3,356 through September 2003 | 97,600 | 64,900 | ||||
| Note payable to a financial institution, bearing interest at 9.26%, payable in monthly interest and principal payments of $1,744 through November 2003 | 52,000 | 36,600 | ||||
| Note payable to a financial institution, bearing interest at 10.16%. Interest and principal were paid in full during October 2001 | 38,600 | — | ||||
| 328,500 | 186,300 | |||||
| Less current portion | 141,500 | 107,700 | ||||
| $ | 187,000 | $ | 78,600 | |||
Annual maturities of long-term debt for the years following December 31, 2001 are as follows:
Fiscal Years | |||
| 2002 | $ | 107,700 | |
| 2003 | 78,600 | ||
| $ | 186,300 | ||
F-14
Table of Contents
FRESH ENTERPRISES, INC. AND SUBSIDIARIES
NOTES TO CONSOLIDATED FINANCIAL STATEMENTS—(Continued)
7. Income Taxes
The income tax provision (benefit) consists of the following:
Year Ended | |||||||||||
January 3, 2000 | January 1, 2001 | December 31, 2001 | |||||||||
| Current: | |||||||||||
| Federal | $ | 431,700 | $ | — | $ | 550,700 | |||||
| State | 161,300 | 8,900 | 148,700 | ||||||||
| 593,000 | 8,900 | 699,400 | |||||||||
| Deferred: | |||||||||||
| Federal | (503,900 | ) | 61,700 | (310,200 | ) | ||||||
| State | (161,600 | ) | 9,000 | (69,200 | ) | ||||||
| (665,500 | ) | 70,700 | (379,400 | ) | |||||||
| $ | (72,500 | ) | $ | 79,600 | $ | 320,000 | |||||
The income tax provision (benefit) differs from the federal statutory rate because of the effect of the following items:
Year Ended | |||||||||
January 3, 2000 | January 1, 2001 | December 31, 2001 | |||||||
| Statutory rate | 34.0 | % | (34.0 | )% | 34.0 | % | |||
| State income taxes, net of federal benefit | 5.9 | (5.7 | ) | 5.8 | |||||
| Non-cash stock compensation | 172.0 | 171.9 | 44.2 | ||||||
| Meals and entertainment | 2.0 | 13.2 | 2.5 | ||||||
| Return to provision adjustment | 18.7 | — | — | ||||||
| Valuation allowance | (273.0 | ) | — | — | |||||
| Other | 4.9 | 3.8 | 1.9 | ||||||
| (35.5 | )% | 149.2 | % | 88.4 | % | ||||
Deferred tax assets and liabilities reflect the net tax effects of temporary differences between the carrying value of assets and liabilities for financial reporting purposes and the amounts used for income tax purposes. The net deferred tax assets consist of the following:
January 1, 2001 | December 31, 2001 | |||||||
| Deferred tax assets: | ||||||||
| Intangible assets | $ | 62,600 | $ | 68,500 | ||||
| Accrued liabilities | 96,200 | 536,300 | ||||||
| Deferred revenue and other deferred items | 702,000 | 995,800 | ||||||
| Other | 17,200 | 114,600 | ||||||
| Total deferred tax assets | 878,000 | 1,715,200 | ||||||
| Deferred tax liabilities: | ||||||||
| Property and equipment | (238,300 | ) | (541,200 | ) | ||||
| State taxes | (44,900 | ) | (32,400 | ) | ||||
| Total deferred tax liabilities | (283,200 | ) | (573,600 | ) | ||||
| Net deferred tax assets | $ | 594,800 | $ | 1,141,600 | ||||
F-15
Table of Contents
FRESH ENTERPRISES, INC. AND SUBSIDIARIES
NOTES TO CONSOLIDATED FINANCIAL STATEMENTS—(Continued)
8. Redeemable Convertible Preferred Stock
Authorized Shares of Redeemable Convertible Preferred Stock
The Company is authorized to issue up to 15,000,000 shares of preferred stock, consisting of shares of Series A Redeemable Convertible Preferred Stock, Series B Redeemable Convertible Preferred Stock and Series C Redeemable Convertible Preferred Stock.
Series A Redeemable Convertible Preferred Stock
Series A redeemable convertible preferred stock consists of the following:
January 1, 2001 | December 31, 2001 | |||||||
| Liquidation preference | $ | 18,550,000 | $ | 18,550,000 | ||||
| Issuance costs | (960,200 | ) | (960,200 | ) | ||||
| Net proceeds upon issuance | 17,589,800 | 17,589,800 | ||||||
| Accretion of preferred stock to liquidation preference | 346,200 | 521,900 | ||||||
| $ | 17,936,000 | $ | 18,111,700 | |||||
At January 1, 2001 and December 31, 2001, 2,727,941 shares of Series A Redeemable Convertible Preferred Stock were issued and outstanding. These shares were issued in connection with the Company’s recapitalization in November 1998 and resulted in proceeds aggregating $17,589,800, net of issuance costs. The Series A Redeemable Convertible Preferred Stock has voting rights.
Subject to ordinary majority class vote, the holders of the Series A Redeemable Convertible Preferred Stock have the right at any time to convert their shares into common stock at a conversion rate (adjusted for stock splits and other similar transactions) equal to one share of common stock for each share of Series A Redeemable Convertible Preferred Stock outstanding. After a June 30, 1999 3-for-2 stock split of the Company’s common stock, the conversion rate of Series A Redeemable Convertible Preferred Stock was adjusted to equal three shares of common stock for each two shares of Series A Redeemable Convertible Preferred Stock. Furthermore, in the event of a qualified initial public offering, subject to certain predefined limitations, the Series A Redeemable Convertible Preferred Stock will automatically convert to common stock. No shares have been converted as of December 31, 2001.
The shares of Series A Redeemable Convertible Preferred Stock are redeemable at $6.80 per share. Mandatory redemption of one-half of the outstanding shares will occur on the fifth anniversary of issuance with all remaining shares to be redeemed on the sixth anniversary of issuance. The Company is periodically accreting the preferred stock to its liquidation preference using the effective interest method.
The holders of the Series A Redeemable Convertible Preferred Stock are entitled to receive, if and when declared, noncumulative dividends equal to their pro rata share of any dividend declared for any other class of stock. Under the terms of the Business Loan, the payment of dividends may be limited. No dividends were declared or paid in fiscal years 2000 or 2001.
F-16
Table of Contents
FRESH ENTERPRISES, INC. AND SUBSIDIARIES
NOTES TO CONSOLIDATED FINANCIAL STATEMENTS—(Continued)
Series B Redeemable Convertible Preferred Stock
Series B Redeemable Convertible Preferred Stock consists of the following:
January 1, 2001 | December 31, 2001 | |||||||
| Liquidation preference | $ | 15,677,500 | $ | 15,677,500 | ||||
| Issuance costs | (139,500 | ) | (139,500 | ) | ||||
| Notes receivable from purchases of preferred stock | (85,200 | ) | (85,200 | ) | ||||
| Net proceeds upon issuance | 15,452,800 | 15,452,800 | ||||||
| Accretion of preferred stock to liquidation preference | 23,500 | 58,900 | ||||||
| 15,476,300 | 15,511,700 | |||||||
| Accrued interest on notes receivable from purchases of preferred stock | (5,700 | ) | (14,200 | ) | ||||
| $ | 15,470,600 | $ | 15,497,500 | |||||
At January 1, 2001 and December 31, 2001, 2,153,507 shares of Series B Redeemable Convertible Preferred Stock were issued and outstanding. These shares were issued on April 28, 2000 and resulted in proceeds aggregating $15,452,800, net of issuance costs and notes receivable from the purchases of preferred stock. The Series B Redeemable Convertible Preferred Stock has voting rights.
Subject to ordinary majority class vote, the holders of the Series B Redeemable Convertible Preferred Stock have the right at any time to convert their shares into common stock at a conversion rate (adjusted for stock splits and other similar transactions) equal to one share of common for each share of Series B Redeemable Convertible Preferred Stock outstanding. Furthermore, in the event of a qualified initial public offering, subject to certain predefined limitations, the Series B Redeemable Convertible Preferred Stock will automatically convert to common stock. No shares have been converted as of December 31, 2001.
The shares of Series B Redeemable Convertible Preferred Stock are redeemable at $7.28 per share. Mandatory redemption of one-half of the outstanding shares of Series B Redeemable Convertible Preferred Stock will occur on November 24, 2003, with all remaining shares to be redeemed on November 24, 2004. The Company is periodically accreting the preferred stock to its liquidation preference using the effective interest method.
The holders of the Series B Redeemable Convertible Preferred Stock are entitled to receive, if and when declared, noncumulative dividends equal to their pro rata share of any dividend declared for any other class of stock.
F-17
Table of Contents
FRESH ENTERPRISES, INC. AND SUBSIDIARIES
NOTES TO CONSOLIDATED FINANCIAL STATEMENTS—(Continued)
Series C Redeemable Convertible Preferred Stock
Series C Redeemable Convertible Preferred Stock consists of the following:
January 1, 2001 | December 31, 2001 | ||||||
| Liquidation preference | $ | — | $ | 12,500,500 | |||
| Issuance costs | — | (194,000 | ) | ||||
| Notes receivable from purchases of preferred stock | — | (191,400 | ) | ||||
| Net proceeds upon issuance | — | 12,115,100 | |||||
| Accretion of preferred stock to liquidation preference | — | 18,800 | |||||
| 12,133,900 | |||||||
| Accrued interest on notes receivable from purchases of preferred stock | — | (2,900 | ) | ||||
| $ | — | $ | 12,131,000 | ||||
In October 2001, the Company authorized the sale and issuance of 1,351,405 shares of Series C Redeemable Convertible Preferred Stock for proceeds aggregating $12,115,100, net of issuance costs and notes receivable from the purchase of preferred stock. The Series C Redeemable Convertible Preferred Stock has voting rights.
Subject to ordinary majority class vote, the holders of the Series C Redeemable Convertible Preferred Stock have the right at any time to convert their shares into common stock at a conversion rate (adjusted for stock splits and other similar transactions) equal to one share of common for each share of Series C Redeemable Convertible Preferred Stock outstanding. Furthermore, in the event of a qualified initial public offering, subject to certain predefined limitations, the Series C Redeemable Convertible Preferred Stock will automatically convert to common stock. No shares have been converted as of December 31, 2001.
The shares of Series C Redeemable Convertible Preferred Stock are redeemable at $9.25 per share. Mandatory redemption of one-half of the outstanding shares of Series C Redeemable Convertible Preferred Stock will occur on November 24, 2003, with all remaining shares to be redeemed on November 24, 2004. The Company is periodically accreting the preferred stock to its liquidation preference using the effective interest method.
The holders of the Series C Redeemable Convertible Preferred Stock are entitled to receive, if and when declared, noncumulative dividends equal to their pro rata share of any dividend declared for any other class of stock.
9. Common Stock
The Company is authorized to issue up to 15,000,000 shares of common stock of which 1,520,225 are issued and outstanding. The holders of the common stock are entitled to one vote for each share held of record on all matters submitted to a vote of the stockholders. In the event of a liquidation, dissolution or winding up of the Company, holders of common stock are entitled to share ratably in all assets remaining after payment of liabilities and the liquidation preference of any then outstanding preferred stock. Holders of common stock have no redemption, conversion or preemptive rights. All outstanding shares of common stock are fully paid and nonassessable.
F-18
Table of Contents
FRESH ENTERPRISES, INC. AND SUBSIDIARIES
NOTES TO CONSOLIDATED FINANCIAL STATEMENTS—(Continued)
Stock Split
On June 30, 1999, the Company’s Board of Directors approved a 3-for-2 stock split of its common stock effective June 30, 1999, and increased the number of authorized shares of common stock from 10,000,000 to 15,000,000 shares. All common shares and per share amounts in the accompanying consolidated financial statements have been restated to reflect the stock split.
Stock Warrants
On November 24, 1998, the Company issued 37,500 warrants that entitle each holder to acquire one share of common stock of the Company at an exercise price of $3.33 per share (adjusted for a 3-for-2 stock split). Also on November 24, 1998, the Company issued a put warrant that entitles the holder to acquire 75,000 shares of common stock of the Company at an exercise price of $4.53 per share (adjusted for a 3-for-2 stock split). The put warrant entitles the holder to obligate the Company to reacquire the put warrant from the holder upon the occurrence of certain events. The Company has a remaining maximum potential obligation attributable to the put warrant of $56,000 and $354,000 at January 1, 2001 and December 31, 2001, respectively. These warrants expire on November 24, 2005. The exercise price and number of shares issuable upon exercise are subject to adjustment upon the occurrence of certain events set forth in the warrant agreements. Under the provisions of the warrant agreements, the Company has reserved 112,500 shares of common stock for future issuance. As of December 31, 2001, no warrants have been exercised nor has the Company been obligated to reacquire the put warrants.
In connection with the Company’s acquisition of the remaining 50.0% ownership interest in Encino during fiscal 2000, the Company issued 30,000 warrants that entitle each holder to acquire one share of the Company’s common stock at an exercise price of $8.00 per share. Management estimated the value of the warrants to be $3.01 upon issuance. As of December 31, 2001, no warrants have been exercised.
Stock Sale
On July 12, 1999, the Company authorized the issuance and sale of 11,030 shares of common stock to an employee for $4.53 per share.
Notes Receivable from Purchase of Common Stock
Notes receivable from the purchase of common stock are due from certain shareholders of the Company and are reflected as a reduction to shareholders’ deficiency on the accompanying consolidated balance sheets.
In accordance with APB No. 25 and FASB’s Interpretation No. 44, the Company recognizes compensation expense on common stock sold to shareholders and officers of the Company when acquired with a nonrecourse note receivable. Compensation expense is recognized periodically based on the difference between the fair value of the related stock and the acquisition cost of the related stock. During fiscal 1999, 2000 and 2001, the Company recognized $872,000, $228,000 and $400,000, respectively, of non-cash stock compensation expense.
10. Stock Option Plan
On November 24, 1998, the Company adopted the 1998 Fresh Enterprises, Inc. Stock Option Plan (1998 Plan), which is an incentive qualified and nonqualified award plan for employees and nonemployees. Under the 1998 Plan, the Company may issue stock options, restricted stock, performance awards, dividend equivalents, deferred stock, stock payment awards or stock appreciation rights. The total number of shares of common stock available for issuance upon exercise of awards under the 1998 Plan was 1,725,000. Substantially all of the terms
F-19
Table of Contents
FRESH ENTERPRISES, INC. AND SUBSIDIARIES
NOTES TO CONSOLIDATED FINANCIAL STATEMENTS—(Continued)
of awards are determined by the 1998 Plan administrator at the date of the grant. The 1998 Plan was terminated effective November 2000.
On November 6, 2001, the Company adopted the 2001 Fresh Enterprises, Inc. Stock Option Plan (2001 Plan), which is an incentive qualified and nonqualified award plan for employees and nonemployees. Under the 2001 Plan, the Company may issue stock options, restricted stock, performance awards, dividend equivalents, stock payment awards or stock appreciation rights. The total number of shares of common stock available for issuance upon exercise of awards under the 2001 Plan is 601,499. Substantially all of the terms of awards are determined by the 2001 Plan administrator at the date of the grant.
During fiscal 1999, the Company granted 138,081 options to purchase common stock to the 1998 Plan participants of the Company for $6.00 per share, the fair value at the date of grant. The options vest 10.0% at grant date, 10.0%, 20.0%, 20.0% and 40.0% on the first, second, third and fourth anniversaries from the grant date, respectively. The options expire 10 years from the date of grant.
During fiscal 2000, the Company granted 119,081 options to purchase common stock to the 1998 Plan participants of the Company for a purchase price of either $7.00 or $8.00 per share, the fair value at the respective grant dates. The options vest 10.0% at grant date, 10.0%, 20.0%, 20.0% and 40.0% on the first, second, third and fourth anniversaries from the grant date, respectively. The options expire 10 years from the date of grant.
During fiscal 2001, the Company granted 259,250 and 173,581 options to purchase common stock to 1998 Plan and 2001 Plan participants, respectively, for a purchase price of either $8.00 or $9.25 per share, the fair value at the respective grant dates. The options vest 10.0% at grant date, 10.0%, 20.0%, 20.0% and 40.0% on the first, second, third and fourth anniversaries from the grant date, respectively. The options expire 10 years from the date of grant.
F-20
Table of Contents
FRESH ENTERPRISES, INC. AND SUBSIDIARIES
NOTES TO CONSOLIDATED FINANCIAL STATEMENTS—(Continued)
The following is a summary of stock option activity and the number of shares reserved for outstanding options for fiscal 1999, 2000 and 2001:
Shares | Weighted Average Exercise Price | ||||
| Options outstanding at December 31, 1998 | 317,045 | $ | 4.53 | ||
| Granted | 138,081 | 6.00 | |||
| Exercised | — | — | |||
| Forfeited | — | — | |||
| Options outstanding at January 3, 2000 | 455,126 | 4.98 | |||
| Granted | 119,081 | 7.51 | |||
| Exercised | — | — | |||
| Forfeited | — | — | |||
| Options outstanding at January 1, 2001 | 574,207 | 5.50 | |||
| Granted | 432,831 | 8.50 | |||
| Exercised | — | — | |||
| Forfeited | 34,000 | 6.85 | |||
| Options outstanding at December 31, 2001 | 973,038 | $ | 6.79 | ||
| Options exercisable at December 31, 2001 | 304,058 | $ | 5.54 | ||
The following table summarizes information regarding options outstanding and options exercisable at December 31, 2001:
Range of Exercise Prices | Number of Shares | Weighted Average Remaining Contractual Life | Weighted Average Exercise Price | Number Exercisable as of December 31, 2001 | Weighted Average Exercise Price | |||||||
| $4.53 | 317,045 | 6.90 | $ | 4.53 | 190,227 | $ | 4.53 | |||||
| 6.00 | 126,081 | 7.68 | $ | 6.00 | 50,432 | $ | 6.00 | |||||
| 7.00—7.99 | 104,081 | 8.49 | $ | 7.59 | 20,816 | $ | 7.59 | |||||
| 8.00 | 252,250 | 9.08 | $ | 8.00 | 25,225 | $ | 8.00 | |||||
| 9.25 | 173,581 | 9.97 | $ | 9.25 | 17,358 | $ | 9.25 | |||||
Under the 2001 Plan, options available for future grant totaled 427,918 shares at December 31, 2001.
Pro forma information regarding net income (loss) is required by SFAS No. 123, which also requires that the information be determined as if the Company had accounted for its employee stock options granted subsequent to December 31, 1994, under the fair value method of SFAS No. 123. The fair value of these options was estimated at the date of grant using a Black-Scholes option pricing model with the following assumptions for the fiscal years ended January 3, 2000, January 1, 2001 and December 31, 2001.
| Risk free interest rate | 5 | % | |
| Expected lives (in years) | 10 | ||
| Dividend yield | 0 | % | |
| Expected volatility | 0 | % |
F-21
Table of Contents
FRESH ENTERPRISES, INC. AND SUBSIDIARIES
NOTES TO CONSOLIDATED FINANCIAL STATEMENTS—(Continued)
The Black-Scholes option valuation model was developed for use in estimating the fair value of the traded options which have no vesting restrictions and are usually transferable. In addition, option valuation models require the input of highly subjective assumptions, including the expected stock price and expected volatility. Because the Company’s employee stock options have characteristics significantly different from those of traded options, and because changes in the subjective input assumptions can materially affect the estimate of fair value, in management’s opinion, the existing models do not necessarily provide a reliable single measure of the fair value of its employee stock options.
The weighted-average remaining contractual life of options outstanding at December 31, 2001 is three years. The weighted-average fair value of options granted during 2001 estimated on the date of grant using the minimum-value method was $3.39. The fair value of options granted is estimated at the date of grant using the following weighted-average assumptions: (a) exercise price equal to the fair market value of stock price; (b) risk-free interest rate of 5%; (c) dividend yield of 0%; and (d) expected option life of ten years.
The Company has adopted the disclosure-only provisions of SFAS No. 123. Accordingly, no compensation expense has been recognized for the 1998 and 2001 Plans in fiscal 1999, 2000 and 2001. Had the Company applied the provisions set forth by SFAS No. 123, its consolidated results of operations attributable to common shareholders would have been decreased by $32,000, $479,000 and $1,030,800 to the pro forma amounts of $70,300, $(810,200) and $(1,219,400) for the fiscal years ended January 3, 2000, January 1, 2001 and December 31, 2001, respectively. In addition, had the Company applied the provisions set forth by SFAS No. 123, its basic net income (loss) attributable to common shareholders per share would have been $0.05, $(0.53) and $(0.80) and its diluted net income (loss) attributable to common shareholders per share would have been $0.04, $(0.53) and $(0.80) for fiscal 1999, 2000 and 2001, respectively. These pro forma amounts may not be representative of future disclosures since the estimated fair value of the stock options is amortized to expense over the vesting period and additional options may be granted in future years.
11. Net Income Per Share
Reconciliation of basic and diluted net income attributable to common shareholders per share in accordance with SFAS No. 128 for the fiscal year ended January 3, 2000 is as follows:
| Numerator: | |||
| Numerator for basic net income attributable to common shareholders per share | $ | 102,300 | |
| Redeemable convertible preferred stock accretion | 172,300 | ||
| Numerator for diluted net income attributable to common shareholders per share | $ | 274,600 | |
| Denominator: | |||
| Denominator for basic net income attributable to common shareholders per share— weighted average shares | 1,506,208 | ||
| Redeemable convertible preferred stock | 4,091,912 | ||
| Warrants | 11,014 | ||
| Stock options | 51,266 | ||
| Denominator for diluted net income per share attributable to common shareholders— weighted average shares | 5,660,400 | ||
For the fiscal years ended January 1, 2001 and December 31, 2001, the Company had a net loss attributable to common shareholders. As a result, common stock equivalents are considered antidilutive for the purposes of this computation.
F-22
Table of Contents
FRESH ENTERPRISES, INC. AND SUBSIDIARIES
NOTES TO CONSOLIDATED FINANCIAL STATEMENTS—(Continued)
12. Commitments and Contingencies
Commitments
The Company leases automobiles, restaurants and office facilities under noncancelable operating leases extending through December 31, 2011. Under the terms of the majority of the restaurant leases, the Company is responsible for taxes, insurance and maintenance expenses and has the option to extend the leases.
Certain restaurant lease agreements include escalation clauses increasing rental payments over the lease term based on increases in the Consumer Price Index up to a predefined maximum. A number of leases include clauses which require payment of additional rent based on a percentage of gross sales. Percentage rents paid were not significant in fiscal 1999, 2000 and 2001.
Total rent expense was approximately $1,192,100, $2,326,200 and $4,656,400 in fiscal 1999, 2000 and 2001, respectively, which is included in direct operating and occupancy expenses, except for rent attributable to the Company’s corporate offices which is included in general and administrative expenses in the accompanying consolidated statements of operations.
The future minimum lease obligations under operating leases for the years following December 31, 2001 are as follows:
| Fiscal year ended: | |||
| 2002 | $ | 6,789,300 | |
| 2003 | 6,936,300 | ||
| 2004 | 6,953,800 | ||
| 2005 | 6,899,600 | ||
| 2006 | 6,813,800 | ||
| Thereafter | 27,421,700 | ||
| $ | 61,814,500 | ||
Leases for franchised stores are typically signed by the franchisee. However, in certain instances, the Company initially signs or guarantees the lease. These leases are then either assigned or the location is sublet to a franchisee. In the event of default by the franchises the Company would be responsible for the lease payments. The total aggregate commitment for leases assigned, sublet or guaranteed totaled approximately $1,584,300 at December 31, 2001.
The Company has an employment agreement with its chief executive officer which expires on November 23, 2002. The agreement provides for a base salary and a bonus based on the Company meeting certain predetermined levels of operating income.
Contingencies
Occasionally, the Company is a defendant in litigation arising in the ordinary course of business, including claims resulting from “slip and fall” accidents, employment-related claims and claims from guests or employees alleging illness, injury or other food quality, health or operational concerns. To date, none of these types of litigation has had a material effect on the consolidated financial position, results of operations or cash flows of the Company. The Company has and will continue to insure against these types of claims.
F-23
Table of Contents
FRESH ENTERPRISES, INC. AND SUBSIDIARIES
NOTES TO CONSOLIDATED FINANCIAL STATEMENTS—(Continued)
On December 27, 2001, a former restaurant manager filed an action in Los Angeles County Superior Court against the Company for himself and on behalf of a putative class of similarly situated restaurant managers and general managers. The complaint alleges restaurant managers and general managers were improperly classified as “exempt” employees under California’s wage and hour laws and wrongfully denied overtime pay as a result of that misclassification. The plaintiff seeks unpaid overtime for himself and the putative class, in addition to penalties allowed by law. The Company filed a general denial on or about March 14, 2002. The class has not yet been certified and no significant discovery has been conducted. The Company intends to vigorously defend against this suit and is in the process of gathering information for the purpose of assessing the merits of the plaintiff’s claims. The Company has not established a reserve in connection with this litigation. If the class is certified and the suit is resolved unfavorably, it may have an adverse effect on our financial position, results of operations or cash flows.
National Office Partners Limited Partnership, the landlord of a former franchisee, San Francisco Concepts, LLC, filed an action in San Francisco County Superior Court on January 25, 2002 against San Francisco Concepts for failure to pay rent and to satisfy certain mechanics’ liens. National Office Partners also sued the Company and a principal of San Francisco Concepts for unpaid rent (approximately $96,000 as of April 1, 2002), attorney’s fees and costs incurred as a result of the mechanics’ liens, under a guaranty of the leasehold obligations the Company jointly signed in favor of National Office Partners. The guaranty terminates at the end of the three year period beginning August 2001. Although the Company expressly disclaims any liability, in order to avoid needless expense, the Company has agreed to a stipulated attachment on a bank account which the Company will initially fund with an amount equal to the unpaid rent and to which the Company will add an additional $15,000 each month San Francisco Concepts fails to pay rent. The Company is entitled to indemnification from a principal of San Francisco Concepts for any amounts paid under the guaranty. The Company has not established a reserve in connection with this litigation. If this suit is resolved unfavorably and the Company is unsuccessful in collecting amounts it is entitled to receive under the indemnification agreement, it may have an adverse effect on the Company’s financial position, results of operations or cash flows.
13. Related Parties
On August 16, 1999, the Company entered into an asset purchase agreement to purchase a franchise restaurant owned by certain shareholders of the Company for approximately $125,000 in cash and $100,000 in notes payable. The assets purchased included a leasehold interest, tenant improvements, furniture and fixtures and restaurant equipment. No goodwill resulted from this transaction.
The Company has various notes receivable and advances, including accrued interest, due from certain shareholders, officers and employees, totaling $1,664,300 and $1,508,600 at January 1, 2001 and December 31, 2001, respectively. The principal amount of $1,437,300 for notes receivable at January 3, 2000 was issued in connection with the sale of restricted common stock. The notes bear interest at 4.51%, mature on November 24, 2003 and are secured by certain of the personal collateral of the related individuals. In accordance with APB No. 25 and related interpretations, the Company recognized $872,000, $228,000 and $400,000 of non-cash stock compensation expense attributable to this sale of restricted common stock during fiscal years 1999, 2000 and 2001, respectively. The non-cash stock compensation charges did not have an impact on the Company’s consolidated cash flows.
During the year ended January 1, 2001, the Company loaned a shareholder $85,200 for the purchase of redeemable convertible preferred stock. The note bears interest at an annual rate of 10.0% and matures on November 24, 2003.
F-24
Table of Contents
FRESH ENTERPRISES, INC. AND SUBSIDIARIES
NOTES TO CONSOLIDATED FINANCIAL STATEMENTS—(Continued)
During the year ended December 31, 2001, the Company loaned a shareholder $258,100. The note bears interest at an annual rate of 10.0% and matures on July 5, 2004.
During the year ended December 31, 2001, the Company issued two notes receivable to the Company’s Chief Executive Officer and Chief Financial Officer for the purchase of Series C Redeemable Convertible Preferred Stock in the amounts of $157,300 and $34,000, respectively. These notes bear interest at an annual rate of 6.0% and mature on November 25, 2003.
The Company has a note payable due to a shareholder totaling $2,000,000 and $1,500,000 at January 1, 2001 and December 31, 2001, respectively. The note bears interest at an annual rate of 6.0% with interest payable quarterly in arrears on the unpaid principal balance. The note payable matures November 24, 2002.
14. Supplemental Disclosure of Cash Flow Information
Supplemental disclosure of cash flow information consists of the following:
Year Ended | |||||||||
January 3, 2000 | January 1, 2001 | December 31, 2001 | |||||||
| Cash paid during the fiscal year for: | |||||||||
| Interest | $ | 273,700 | $ | 533,200 | $ | 511,154 | |||
| Income taxes | $ | 624,500 | $ | 199,700 | $ | 895,796 | |||
| Non-cash investing activities: | |||||||||
| Purchase of property and equipment through issuance of a note receivable | $ | 100,000 | $ | — | $ | — | |||
| Sale of property and equipment through issuance of notes receivable | $ | — | $ | 610,000 | $ | — | |||
| Non-cash financing activities: | |||||||||
| Redeemable convertible preferred stock accretion | $ | 172,300 | $ | 197,400 | $ | 229,800 | |||
| Issuance of note receivable for sale of redeemable convertible preferred stock | $ | — | $ | 85,200 | $ | 191,300 | |||
| Issuance of common stock warrants | $ | — | $ | 90,400 | $ | — | |||
F-25
Table of Contents
FRESH ENTERPRISES, INC. AND SUBSIDIARIES
NOTES TO CONSOLIDATED FINANCIAL STATEMENTS—(Continued)
15. Segment Reporting
The Company identifies its operating segments based on the organizational units used by management to monitor performance and make operating decisions. The Company operates in two business segments consisting of Company-owned and operated restaurants and franchised operations. The Company measures segment net income (loss) as operating income (loss), which is defined as income (loss) before interest income, interest expense, other income (expense), and income tax provision. The Franchise Operations segment includes restaurants operated by franchisees and area licensees. Information on segments is as follows:
Company-Owned and Operated Operations | Franchised Operations | Consolidated and Other Adjustments | Totals | |||||||||||||
Year Ended January 3, 2000 | ||||||||||||||||
| Total revenues | $ | 22,859,200 | $ | 2,202,700 | $ | — | $ | 25,061,900 | ||||||||
| Non-cash stock compensation | (872,000 | ) | — | — | (872,000 | ) | ||||||||||
| Operating income (loss) | (959,500 | ) | 1,410,700 | — | 451,200 | |||||||||||
| Interest income | 75,400 | 6,500 | — | 81,900 | ||||||||||||
| Interest expense | (325,700 | ) | (2,000 | ) | — | (327,700 | ) | |||||||||
| Other income (expense), net | (3,300 | ) | — | — | (3,300 | ) | ||||||||||
| Income (loss) before income tax provision (benefit) and minority interest | (1,213,100 | ) | 1,415,200 | — | 202,100 | |||||||||||
| Net income (loss) | (1,140,600 | ) | 808,400 | 606,800 | 274,600 | |||||||||||
As of January 3, 2000 | ||||||||||||||||
| Total assets | $ | 9,275,000 | $ | 2,825,700 | $ | (2,220,600 | ) | $ | 9,880,100 | |||||||
| Deferred revenue | 20,700 | 665,000 | — | 685,700 | ||||||||||||
| Total shareholders’ equity (deficiency) | (17,416,200 | ) | 924,900 | (577,600 | ) | (17,068,900 | ) | |||||||||
Year Ended January 1, 2001 | ||||||||||||||||
| Total revenues | $ | 37,992,800 | $ | 3,296,000 | $ | — | $ | 41,288,800 | ||||||||
| Non-cash stock compensation | (228,000 | ) | — | — | (228,000 | ) | ||||||||||
| Operating income (loss) | (2,110,900 | ) | 1,797,900 | — | (313,000 | ) | ||||||||||
| Interest income | 289,700 | 11,400 | — | 301,100 | ||||||||||||
| Interest expense | (400,600 | ) | — | — | (400,600 | ) | ||||||||||
| Other income (expense), net | 27,000 | — | — | 27,000 | ||||||||||||
| Income (loss) before income tax provision (benefit) and minority interest | (1,863,500 | ) | 1,809,300 | — | (54,200 | ) | ||||||||||
| Net income (loss) | (1,943,100 | ) | 1,087,000 | 722,300 | (133,800 | ) | ||||||||||
As of January 1, 2001 | ||||||||||||||||
| Total assets | $ | 26,544,900 | $ | 5,683,600 | $ | (5,190,000 | ) | $ | 27,038,500 | |||||||
| Deferred revenue | 21,300 | 1,445,000 | — | 1,466,300 | ||||||||||||
| Total shareholders’ equity (deficiency) | (18,465,300 | ) | 2,011,900 | (693,100 | ) | (17,146,500 | ) | |||||||||
Year Ended December 31, 2001 | ||||||||||||||||
| Total revenues | $ | 72,843,600 | $ | 5,205,400 | $ | — | $ | 78,049,000 | ||||||||
| Non-cash stock compensation | (400,000 | ) | — | — | (400,000 | ) | ||||||||||
| Operating income (loss) | (2,554,800 | ) | 3,510,600 | — | 955,800 | |||||||||||
| Interest income | 168,800 | 8,900 | — | 177,700 | ||||||||||||
| Interest expense | (764,800 | ) | (4,000 | ) | — | (768,800 | ) | |||||||||
| Other income (expense), net | 50,600 | — | — | 50,600 | ||||||||||||
| Income (loss) before income tax provision (benefit) and minority interest | (3,162,200 | ) | 3,523,400 | — | 361,200 | |||||||||||
| Net income (loss) | (3,482,200 | ) | 1,994,000 | 1,529,400 | 41,200 | |||||||||||
As of December 31, 2001 | ||||||||||||||||
| Total assets | $ | 43,732,400 | $ | 12,705,200 | $ | (14,583,600 | ) | $ | 41,854,000 | |||||||
| Deferred revenue | 124,900 | 2,122,200 | — | 2,247,100 | ||||||||||||
| Total shareholders’ equity (deficiency) | (22,506,000 | ) | 6,505,900 | (999,800 | ) | (16,999,900 | ) | |||||||||
F-26
Table of Contents
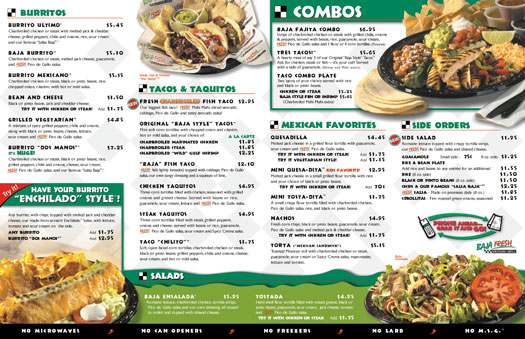
Table of Contents
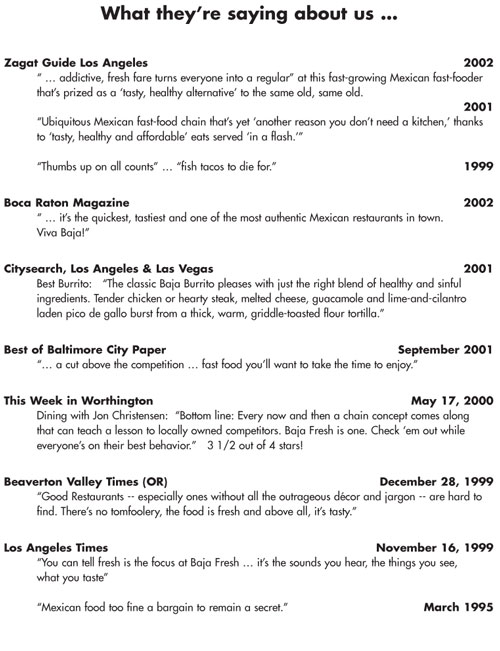
Table of Contents
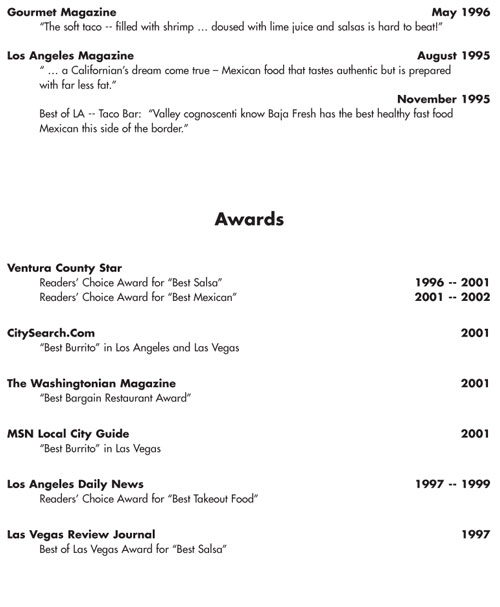
Table of Contents
[ ] Shares
Common Stock
Prospectus
, 2002
Banc of America Securities LLC
Credit Suisse First Boston
Thomas Weisel Partners LLC
Until [ ], 2002, all dealers that buy, sell or trade the common stock may be required to deliver a prospectus regardless of whether they are participating in the offering. This is in addition to the dealers’ obligation to deliver a prospectus when acting as underwriters and with respect to their unsold allotments or subscriptions.
Table of Contents
PART II
INFORMATION NOT REQUIRED IN THE PROSPECTUS
Item 13. Other expenses of issuance and distribution
The following table sets forth the costs and expenses, other than underwriting discounts and commissions, to be paid in connection with the sale of the common stock being registered, all of which will be paid by the Registrant. All amounts are estimates except the registration fee and the NASD filing fee.
| Registration fee | $ | 5,290 | |
| NASD filing fee | |||
| Nasdaq National Market application fee | |||
| Blue Sky fees and expenses | |||
| Accounting fees and expenses | |||
| Legal fees and expenses | |||
| Transfer agent and registrar fees | |||
| Printing and engraving expenses | |||
| Miscellaneous expenses | |||
| Total | $ | ||
Item 14. Indemnification of directors and officers
Section 317 of the California General Corporations Law authorizes a court to award, or a corporation’s board of directors to grant, indemnity to directors and officers who are parties or are threatened to be made parties to any proceeding (with certain exceptions) by reason of the fact that the person is or was an agent of the corporation, against expenses, judgments, fines, settlements and other amounts actually and reasonably incurred in connection with the proceeding if that person acted in good faith and in a manner the person reasonably believed to be in the best interests of the corporation. Section 204 of the law provides that this limitation on liability has no effect on a director’s liability (a) for acts or omissions that involve intentional misconduct or a knowing and culpable violation of law, (b) for acts or omissions that a director believes to be contrary to the best interests of the corporation or its shareholders or that involve the absence of good faith on the part of the director, (c) for any transaction from which a director derived an improper personal benefit, (d) for acts or omissions that show a reckless disregard for the director’s duty to the corporation or its shareholders in circumstances in which the director was aware, or should have been aware, in the ordinary course of performing a director’s duties, of a risk of a serious injury to the corporation or its shareholders, (e) for acts or omissions that constitute an unexcused pattern of inattention that amounts to an abdication of the director’s duty to the corporation or its shareholders, (f) under Section 310 of the law (concerning contracts or transactions between the corporation and a director) or (g) under Section 316 of the law (directors’ liability for improper dividends, loans and guarantees). Section 317 does not extend to acts or omissions of a director in his capacity as an officer. Further, Section 317 has no effect on claims arising under federal or state securities laws and does not affect the availability of injunctions and other equitable remedies available to our shareholders for any violation of a director’s fiduciary duty to us or our shareholders. Although the validity and scope of the legislation underlying Section 317 have not yet been interpreted to any significant extent by the California courts, Section 317 may relieve directors of monetary liability to us for grossly negligent conduct, including conduct in situations involving attempted takeovers of our company.
In accordance with Section 317, our articles of incorporation eliminate the liability of each of our directors for monetary damages to the fullest extent permissible under California law. Our articles further authorize us to provide indemnification to our agents (including our officers and directors), subject to the limitations set forth above. The articles and bylaws further provide for indemnification of our corporate agents to the maximum extent permitted by California law. Additionally, we maintain insurance policies that insure our officers and directors against certain liabilities. Certain of our directors also have indemnification arrangements with their affiliated venture funds. Finally, reference is made to the indemnification and contribution provisions of the Underwriting Agreement filed as an exhibit to this Registration Statement.
II-1
Table of Contents
The foregoing summaries are necessarily subject to the complete text of the statute, our articles, our bylaws and the agreements referred to above and are qualified in their entirety by reference thereto.
Item 15. Recent sales of unregistered securities
Since April 1, 1999, we have sold and issued the following securities:
1. During the period April 1, 1999 to present, the Registrant granted options to purchase an aggregate of 482,412 shares of common stock, at exercise prices ranging from $6.00 per share to $8.00 per share, to key consultants, employees, officers and directors under its 1998 stock plan. These options vest over a period of time ranging from the immediate date of grant to the fourth anniversary of their respective dates of grant.
2. During the period December 20, 2001 to present, the Registrant granted options to purchase an aggregate of 183,581 shares of common stock, at an exercise price of $9.25 per share, to key consultants, employees, officers and directors under its 2001 stock plan. These options vest over a period of time ranging from the immediate date of grant to the fourth anniversary of their respective dates of grant.
3. On April 28, 2000, the Registrant sold 2,153,507 shares of its Series B convertible preferred stock for an aggregate consideration of $15,677,530.96 pursuant to a Stock Purchase Agreement, dated as of April 28, 2000, between the Registrant and existing shareholders.
4. On June 15, 2000, the Registrant granted to Greg Finefrock a warrant to purchase 10,000 shares of common stock for an aggregate consideration of $80,000 pursuant to a Common Stock Purchase Warrant, dated June 15, 2000, between the Registrant and Greg Finefrock.
5. On June 15, 2000, the Registrant granted to the Finefrock Family Trust a warrant to purchase 12,500 shares of common stock for an aggregate consideration of $100,000 pursuant to a Common Stock Purchase Warrant, dated June 15, 2000, between the Registrant and the Finefrock Family Trust.
6. On June 15, 2000, the Registrant granted to Dennis Rhode a warrant to purchase 7,500 shares of common stock for an aggregate consideration of $60,000 pursuant to a Common Stock Purchase Warrant, dated June 15, 2000, between the Registrant and Dennis Rohde.
7. On October 2, 2001, the Registrant sold 1,351,405 shares of Series C convertible preferred stock for an aggregate consideration of $12,500,496.25 pursuant to a Stock Purchase Agreement, dated as of October 2, 2001, between the Registrant and existing shareholders.
The transactions referred to in numbers 1 and 2 were made in reliance upon the exemption from registration provided pursuant to Rule 701 under the Securities Act for securities sold pursuant to certain compensatory benefit plans and contracts relating to compensation. The transactions referred to in numbers 3 and 7 were made in reliance upon the exemption from registration provided pursuant to Rule 506 of Regulation D of the Securities Act, in a transaction by an issuer not involving a public offering. Each purchaser was an accredited investor with the knowledge and experience in financial and business matters sufficient for evaluating the associated merits and risks, represented its intention to acquire the securities for investment purposes only and not with a view to distribution, and received or had access to adequate information about the Registrant. Appropriate legends were affixed to the stock certificates issued in this transaction and there was no general solicitation or advertising. The transactions referred to in numbers 4, 5, and 6 were made in reliance upon the exemption from registration provided pursuant to Section 4(2) of the Securities Act, in a transaction by an issuer not involving a public offering. Each purchaser was an accredited investor with the knowledge and experience in financial and business matters sufficient for evaluating the associated merits and risks, represented its intention to acquire the securities for investment purposes only and not with a view to distribution, and received or had access to adequate information about the Registrant. There was no general solicitation or advertising. No underwriters were involved in connection with the above-referenced sales of securities.
II-2
Table of Contents
Item 16. Exhibits and financial statement schedules
a. Exhibits
EXHIBIT INDEX
Number | Description | Page | ||
| 1.1* | Form of Underwriting Agreement | |||
| 3.1 | Amended and Restated Articles of Incorporation, and amendment thereto | |||
| 3.2 | Amended and Restated Bylaws, and amendment thereto | |||
| 4.1* | Specimen Common Stock Certificate | |||
| 4.2 | Amended and Restated Registration Rights Agreement, dated October 2, 2001, among Fresh Enterprises, Inc. and the entities and individuals listed on Schedule A attached thereto, and amendment thereto | |||
| 4.3* | Form of Lock-Up Agreement | |||
| 5.1* | Opinion of Pillsbury Winthrop LLP | |||
| 10.1 | 1998 Fresh Enterprises, Inc. Stock Option Plan, and amendments thereto | |||
| 10.2 | 2001 Fresh Enterprises, Inc. Stock Option Plan, and amendment thereto | |||
| 10.3 | Form of Fresh Enterprises, Inc. Incentive Stock Option Agreement | |||
| 10.4 | Form of Fresh Enterprises, Inc. Non-Qualified Stock Option Agreement | |||
| 10.5 | Business Loan Agreement, dated December 12, 2000, among Fresh Enterprises, Inc., Baja Fresh Westlake Village, Inc., and Western Financial Bank, and amendments thereto | |||
| 10.6 | Promissory Note relating to an operations line of credit, dated December 12, 2000, issued by Fresh Enterprises, Inc. and Baja Fresh Westlake Village, Inc. in favor of Western Financial Bank, and amendment thereto | |||
| 10.7 | Promissory Note relating to a development line of credit, dated December 12, 2000, issued by Fresh Enterprises, Inc. and Baja Fresh Westlake Village, Inc. in favor of Western Financial Bank, and amendment thereto | |||
| 10.8 | Commercial Security Agreement, dated December 12, 2000, among Fresh Enterprises, Inc., Baja Fresh Westlake Village, Inc., Triune Corporation, and Western Financial Bank | |||
| 10.9 | Commercial Guaranty, dated September 27, 2001, among Fresh Enterprises, Inc., Baja Fresh Westlake Village, Inc., Triune Corporation, and Western Financial Bank | |||
| 10.10 | Subordination Agreement, dated September 27, 2001, among Fresh Enterprises, Inc., Baja Fresh Westlake Village, Inc., James Magglos, and Western Financial Bank | |||
| 10.11 | Promissory Note, dated November 24, 1998, issued by Fresh Enterprises, Inc. in favor of James Magglos | |||
| 10.12 | Employment Agreement, dated November 24, 1998, between Fresh Enterprises, Inc. and Gregory G. Dollarhyde | |||
| 10.13 | Restricted Stock Purchase Agreement, dated November 24, 1998, between Fresh Enterprises, Inc. and Gregory G. Dollarhyde | |||
| 10.14 | Repayment and Stock Pledge Agreement, dated November 24, 1998, between Fresh Enterprises, Inc. and Gregory G. Dollarhyde, and amendment thereto |
II-3
Table of Contents
Number | Description | Page | ||
| 10.15 | Secured Promissory Note, dated November 24, 1998, issued by Gregory G. Dollarhyde in favor of Fresh Enterprises, Inc. | |||
| 10.16 | Repayment and Stock Pledge Agreement, dated April 28, 2000, between Fresh Enterprises, Inc. and Gregory G. Dollarhyde | |||
| 10.17 | Secured Promissory Note, dated April 28, 2000, issued by Gregory G. Dollarhyde in favor of Fresh Enterprises, Inc. | |||
| 10.18 | Repayment and Stock Pledge Agreement, dated October 2, 2001, between Fresh Enterprises, Inc. and Gregory G. Dollarhyde | |||
| 10.19 | Secured Promissory Note, dated October 2, 2001, issued by Gregory G. Dollarhyde in favor of Fresh Enterprises, Inc. | |||
| 10.20* | Repayment and Stock Pledge Agreement, dated April 24, 2002, by and between Fresh Enterprises, Inc. and Gregory G. Dollarhyde | |||
| 10.21* | Secured Promissory Note, dated April 24, 2002 issued by Gregory G. Dollarhyde in favor of Fresh Enterprises, Inc. | |||
| 10.22 | Consulting Agreement, dated November 24, 1998, between Fresh Enterprises, Inc. and Louis A. Siracusa | |||
| 10.23 | Restricted Stock Purchase Agreement, dated November 24, 1998 between Fresh Enterprises, Inc. and Louis A. Siracusa | |||
| 10.24 | Repayment and Stock Pledge Agreement, dated November 24, 1998 between Fresh Enterprises, Inc. and Louis A. Siracusa | |||
| 10.25 | Secured Promissory Note, dated November 24, 1998, issued by Louis A. Siracusa in favor of Fresh Enterprises, Inc. | |||
| 10.26 | Repayment and Stock Pledge Agreement, dated October 2, 2001, between Fresh Enterprises, Inc. and Donald D. Breen | |||
| 10.27 | Secured Promissory Note, dated October 2, 2001, issued by Donald D. Breen in favor of Fresh Enterprises, Inc. | |||
| 10.28 | Amended and Restated Shareholders’ Agreement, dated October 2, 2001, among Fresh Enterprises, Inc. and the investors named therein, and amendment thereto. | |||
| 10.29 | Stock Purchase Agreement, dated as of April 28, 2000, among Fresh Enterprises, Inc. and those persons listed on Schedule 1 thereto. | |||
| 10.30 | Stock Purchase Agreement, dated as of October 2, 2001, among Fresh Enterprises, Inc. and those persons listed on Schedule 1 thereto. | |||
| 16.1 | Letter of PricewaterhouseCoopers LLP required by Item 304 of Regulation S-K | |||
| 21.1* | Subsidiaries of Fresh Enterprises, Inc. | |||
| 23.1* | Consent of Pillsbury Winthrop LLP (included in Exhibit 5.1) | |||
| 23.2 | Consent of Ernst & Young LLP | |||
| 24.1 | Power of Attorney (contained on page II-6) |
| *To | be filed by amendment |
II-4
Table of Contents
(b) Financial Statement Schedules
Item 17. Undertakings
(a) The undersigned Registrant hereby undertakes to provide to the Underwriters, at the closing specified in the Underwriting Agreement, certificates in such denominations and registered in such names as required by the Underwriters to permit prompt delivery to each purchaser.
(b) Insofar as indemnification for liabilities arising under the Securities Act may be permitted to directors, officers and controlling persons of the Registrant pursuant to the foregoing provisions, or otherwise, the Registrant has been advised that in the opinion of the Securities and Exchange Commission such indemnification is against public policy as expressed in the Securities Act and is, therefore, unenforceable. In the event that a claim for indemnification against such liabilities (other than the payment by the Registrant of expenses incurred or paid by a director, officer or controlling person of the Registrant in the successful defense of any action, suit or proceeding) is asserted by such director, officer or controlling person in connection with the securities being registered, the Registrant will, unless in the opinion of its counsel the matter has been settled by controlling precedent, submit to a court of appropriate jurisdiction the question whether such indemnification by it is against public policy as expressed in the Securities Act and will be governed by the final adjudication of such issue.
(c) The undersigned Registrant hereby undertakes that:
(1) For purposes of determining any liability under the Securities Act, the information omitted from the form of prospectus filed as part of this Registration Statement in reliance upon Rule 430A and contained in a form of prospectus filed as part of this Registration Statement in reliance upon Rule 430A and contained in a form of prospectus filed by the Registrant pursuant to Rule 424(b)(1) or (4) or 497(h) under the Securities Act shall be deemed to be part of this Registration Statement as of the time it was declared effective.
(2) For the purpose of determining any liability under the Securities Act, each post-effective amendment that contains a form of prospectus shall be deemed to be a new registration statement relating to the securities offered therein, and the offering of such securities at that time shall be deemed to be the initial bona fide offering thereof.
II-5
Table of Contents
SIGNATURES
Pursuant to the requirements of the Securities Act, the Registrant has duly caused this Registration Statement to be signed on its behalf by the undersigned, hereunto duly authorized, in the City of Los Angeles, State of California, on April 24, 2002.
| Fresh Enterprises, Inc. | ||
| By: | /s/ GREGORY G. DOLLARHYDE | |
Name: Gregory G. Dollarhyde Title: Chief Executive Officer and President, and Director | ||
II-6
Table of Contents
POWER OF ATTORNEY
KNOW ALL PERSONS BY THESE PRESENTS, that each person whose signature appears below constitutes and appoints Gregory G. Dollarhyde and Donald D. Breen, and either of them, as the person’s true and lawful attorneys-in-fact and agents, with full power of substitution and resubstitution, for the person and in the person’s name, place and stead, in any and all capacities, to sign any and all amendments (including post-effective amendments) to this Registration Statement, and to file the same, with all exhibits thereto, and other documents in connection therewith, with the Securities and Exchange Commission and any other regulatory authority, granting unto said attorneys-in-fact and agents, and each of them, full power and authority to do and perform each and every act and thing requisite and necessary to be done in connection therewith, as fully to all intents and purposes as the person might or could do in person, hereby ratifying and confirming all that said attorneys-in-fact and agents, or either of them, or their or the person’s substitute or substitutes, may lawfully do or cause to be done by virtue hereof.
Pursuant to the requirements of the Securities Act, this Registration Statement has been signed below by the following persons in the capacities and on the dates indicated:
Name | Title | Date | ||
/s/ GREGORY G. DOLLARHYDE Gregory G. Dollarhyde | President, Chief Executive Officer (Principal Executive Officer) and Director | April 24, 2002 | ||
/s/ DONALD D. BREEN Donald D. Breen | Senior Vice President and Chief Financial Officer (Principal Financial Officer) and Accounting Officer | April 24, 2002 | ||
/s/ LOUIS A. SIRACUSA Louis A. Siracusa | Chairman of the Board | April 24, 2002 | ||
/s/ GERALD R. GALLAGHER Gerald R. Gallagher | Director | April 24, 2002 | ||
/s/ JAMES T. KELSEY James T. Kelsey | Director | April 24, 2002 | ||
/s/ JAMES MAGGLOS James Magglos | Director | April 24, 2002 | ||
/s/ FRANK M. VEST, JR. Frank M. Vest, Jr. | Director | April 24, 2002 |
II-7
Table of Contents
EXHIBIT INDEX
Number | Description | Page | ||
| 1.1* | Form of Underwriting Agreement | |||
| 3.1 | Amended and Restated Articles of Incorporation, and amendment thereto | |||
| 3.2 | Amended and Restated Bylaws, and amendment thereto | |||
| 4.1* | Specimen Common Stock Certificate | |||
| 4.2 | Amended and Restated Registration Rights Agreement, dated October 2, 2001, among Fresh Enterprises, Inc. and the entities and individuals listed on Schedule A attached thereto, and amendment thereto | |||
| 4.3* | Form of Lock-Up Agreement | |||
| 5.1* | Opinion of Pillsbury Winthrop LLP | |||
| 10.1 | 1998 Fresh Enterprises, Inc. Stock Option Plan, and amendments thereto | |||
| 10.2 | 2001 Fresh Enterprises, Inc. Stock Option Plan, and amendment thereto | |||
| 10.3 | Form of Fresh Enterprises, Inc. Incentive Stock Option Agreement | |||
| 10.4 | Form of Fresh Enterprises, Inc. Non-Qualified Stock Option Agreement | |||
| 10.5 | Business Loan Agreement, dated December 12, 2000, among Fresh Enterprises, Inc., Baja Fresh Westlake Village, Inc., and Western Financial Bank, and amendments thereto | |||
| 10.6 | Promissory Note relating to an operations line of credit, dated December 12, 2000, issued by Fresh Enterprises, Inc. and Baja Fresh Westlake Village, Inc. in favor of Western Financial Bank, and amendment thereto | |||
| 10.7 | Promissory Note relating to a development line of credit, dated December 12, 2000, issued by Fresh Enterprises, Inc. and Baja Fresh Westlake Village, Inc. in favor of Western Financial Bank, and amendment thereto | |||
| 10.8 | Commercial Security Agreement, dated December 12, 2000, among Fresh Enterprises, Inc., Baja Fresh Westlake Village, Inc., Triune Corporation, and Western Financial Bank | |||
| 10.9 | Commercial Guaranty, dated September 27, 2001, among Fresh Enterprises, Inc., Baja Fresh Westlake Village, Inc., Triune Corporation, and Western Financial Bank | |||
| 10.10 | Subordination Agreement, dated September 27, 2001, among Fresh Enterprises, Inc., Baja Fresh Westlake Village, Inc., James Magglos, and Western Financial Bank | |||
| 10.11 | Promissory Note, dated November 24, 1998, issued by Fresh Enterprises, Inc. in favor of James Magglos | |||
| 10.12 | Employment Agreement, dated November 24, 1998, between Fresh Enterprises, Inc. and Gregory G. Dollarhyde | |||
| 10.13 | Restricted Stock Purchase Agreement, dated November 24, 1998, between Fresh Enterprises, Inc. and Gregory G. Dollarhyde | |||
| 10.14 | Repayment and Stock Pledge Agreement, dated November 24, 1998, between Fresh Enterprises, Inc. and Gregory G. Dollarhyde, and amendment thereto | |||
| 10.15 | Secured Promissory Note, dated November 24, 1998, issued by Gregory G. Dollarhyde in favor of Fresh Enterprises, Inc. | |||
| 10.16 | Repayment and Stock Pledge Agreement, dated April 28, 2000, between Fresh Enterprises, Inc. and Gregory G. Dollarhyde | |||
| 10.17 | Secured Promissory Note, dated April 28, 2000, issued by Gregory G. Dollarhyde in favor of Fresh Enterprises, Inc. |
Table of Contents
Number | Description | Page | ||
| 10.18 | Repayment and Stock Pledge Agreement, dated October 2, 2001, between Fresh Enterprises, Inc. and Gregory G. Dollarhyde | |||
| 10.19 | Secured Promissory Note, dated October 2, 2001, issued by Gregory G. Dollarhyde in favor of Fresh Enterprises, Inc. | |||
| 10.20* | Repayment and Stock Pledge Agreement, dated April 24, 2002, between Fresh Enterprises, Inc. and Gregory G. Dollarhyde | |||
| 10.21* | Secured Promissory Note, dated April 24, 2002, issued by Gregory G. Dollarhyde in favor of Fresh Enterprises, Inc. | |||
| 10.22 | Consulting Agreement, dated November 24, 1998, between Fresh Enterprises, Inc. and Louis A. Siracusa | |||
| 10.23 | Restricted Stock Purchase Agreement, dated November 24, 1998, between Fresh Enterprises, Inc. and Louis A. Siracusa | |||
| 10.24 | Repayment and Stock Pledge Agreement, dated November 24, 1998, between Fresh Enterprises, Inc. and Louis A. Siracusa | |||
| 10.25 | Secured Promissory Note, dated November 24, 1998, issued by Louis A. Siracusa in favor of Fresh Enterprises, Inc. | |||
| 10.26 | Repayment and Stock Pledge Agreement, dated October 2, 2001, between Fresh Enterprises, Inc. and Donald D. Breen | |||
| 10.27 | Secured Promissory Note, dated October 2, 2001, issued by Donald D. Breen in favor of Fresh Enterprises, Inc. | |||
| 10.28 | Amended and Restated Shareholders’ Agreement, dated October 2, 2001, among Fresh Enterprises, Inc. and the investors named therein, and amendment thereto. | |||
| 10.29 | Stock Purchase Agreement, dated as of April 28, 2000, among Fresh Enterprises, Inc. and those persons listed on Schedule 1 thereto. | |||
| 10.30 | Stock Purchase Agreement, dated as of October 2, 2001, among Fresh Enterprises, Inc. and those persons listed on Schedule 1 thereto. | |||
| 16.1 | Letter of PricewaterhouseCoopers LLP required by Item 304 of Regulation S-K | |||
| 21.1* | Subsidiaries of Fresh Enterprises, Inc. | |||
| 23.1* | Consent of Pillsbury Winthrop LLP (included in Exhibit 5.1) | |||
| 23.2 | Consent of Ernst & Young LLP | |||
| 24.1 | Power of Attorney (contained on page II-6) |
| *To | be filed by amendment |