0 © 2012 Piedmont Office Realty Trust, Inc. May 2012
1 Piedmont Office Realty Trust, Inc. (“Piedmont” or the “Company”) (NYSE: PDM) is a fully-integrated and self-managed real estate investment trust (“REIT”) specializing in the acquisition, ownership, management, development and disposition of primarily high-quality Class A office buildings located predominately in large U.S. office markets and leased principally to high-credit-quality tenants. Since its first acquisition in 1998, the Company has acquired $5.9 billion of office and industrial properties (inclusive of joint ventures). Rated as an investment-grade company by Standard & Poor’s and Moody’s, Piedmont has maintained a low-leverage strategy while acquiring its properties. Approximately 82% of our Annualized Lease Revenue ("ALR") is derived from our office properties located within the ten largest U.S. office markets, including Chicago, Washington, D.C., the New York metropolitan area, Boston and greater Los Angeles. We use market data and industry forecasts and projections throughout this presentation which have been obtained from publicly available industry publications. These sources are believed to be reliable, but the accuracy and completeness of the information are not guaranteed. Certain statements contained in this presentation constitute forward-looking statements which we intend to be covered by the safe-harbor provisions for forward-looking statements contained in Section 27A of the Securities Act of 1933 and Section 21E of the Securities Exchange Act of 1934, as applicable. Such information is subject to certain risks and uncertainties, as well as known and unknown risks, which could cause actual results to differ materially from those projected or anticipated. Therefore, such statements are not intended to be a guarantee of our performance in future periods. Such forward-looking statements can generally be identified by our use of forward-looking terminology such as “may,” “will,” “expect,” “intend,” “anticipate,” “believe,” “continue” or similar words or phrases that are predictions of future events or trends and which do not relate solely to historical matters. Some examples of risk factors that could cause our actual results and expectations to differ materially from those described in our forward-looking statements are detailed in our most recent Annual Report on Form 10-K and other documents we file with the Securities and Exchange Commission. Readers are cautioned not to place undue reliance on these forward-looking statements, which speak only as of the date of this presentation. Unless the context indicates otherwise, the term “properties” as used in this document and the statistical information presented in this document regarding our properties includes our wholly owned office properties and our office properties owned through our consolidated joint ventures, but excludes our interests in five properties owned through our unconsolidated joint ventures and our two industrial properties. The information and non-GAAP financial terms contained in this presentation do not contain all of the information and definitions that may be important to you and should be read in conjunction with our Annual Report on Form 10-K for the year ended December 31, 2011 and our quarterly reports on Form 10-Q for the periods ended June 30, 2011, September 30, 2011, and March 31, 2012 and our other filings with the Securities and Exchange Commission. Such documents are available at www.sec.gov and under the heading Investor Relations on our website at www.piedmontreit.com. © 2012 Piedmont Office Realty Trust, Inc. Introduction (Unless otherwise noted, all the information contained in this presentation is as of March 31, 2012)
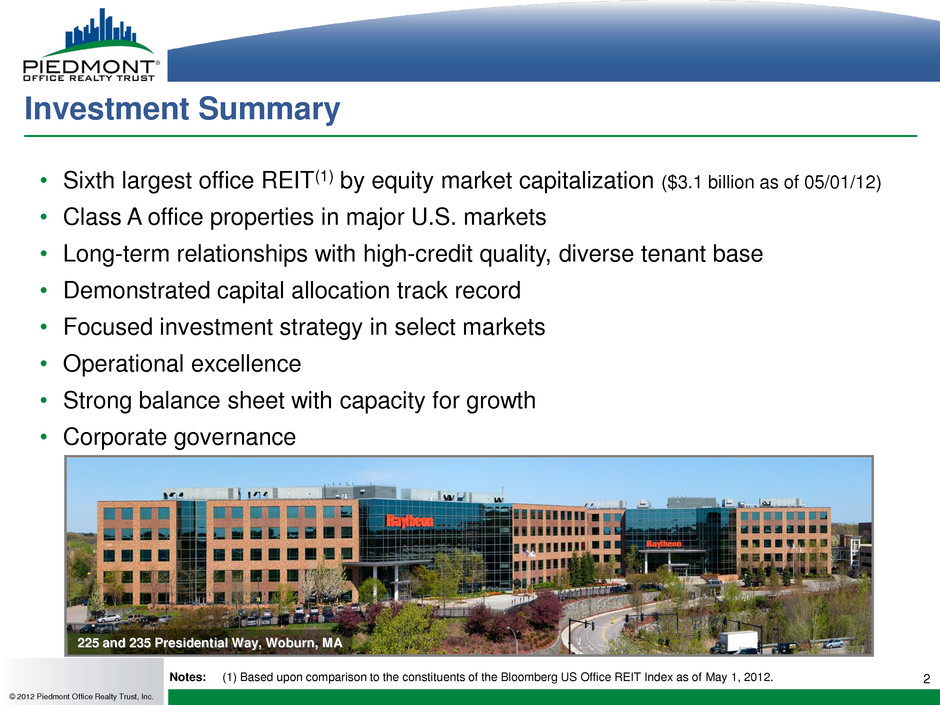
2 Investment Summary • Sixth largest office REIT(1) by equity market capitalization ($3.1 billion as of 05/01/12) • Class A office properties in major U.S. markets • Long-term relationships with high-credit quality, diverse tenant base • Demonstrated capital allocation track record • Focused investment strategy in select markets • Operational excellence • Strong balance sheet with capacity for growth • Corporate governance © 2012 Piedmont Office Realty Trust, Inc. Notes: (1) Based upon comparison to the constituents of the Bloomberg US Office REIT Index as of May 1, 2012. 225 and 235 Presidential Way, Woburn, MA
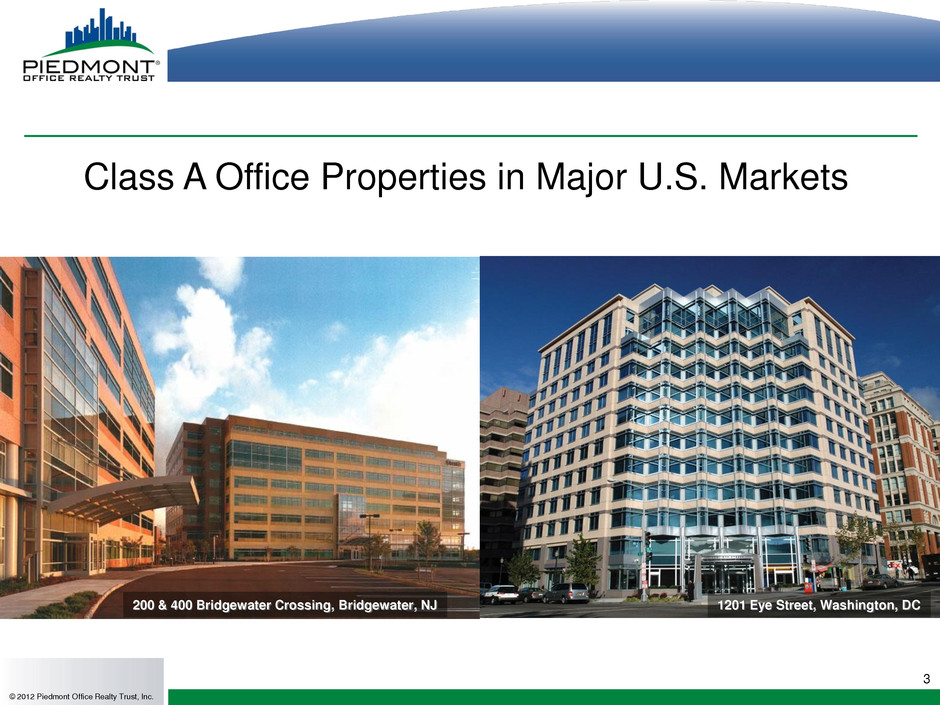
3 Class A Office Properties in Major U.S. Markets © 2012 Piedmont Office Realty Trust, Inc. 200 & 400 Bridgewater Crossing, Bridgewater, NJ 1201 Eye Street, Washington, DC
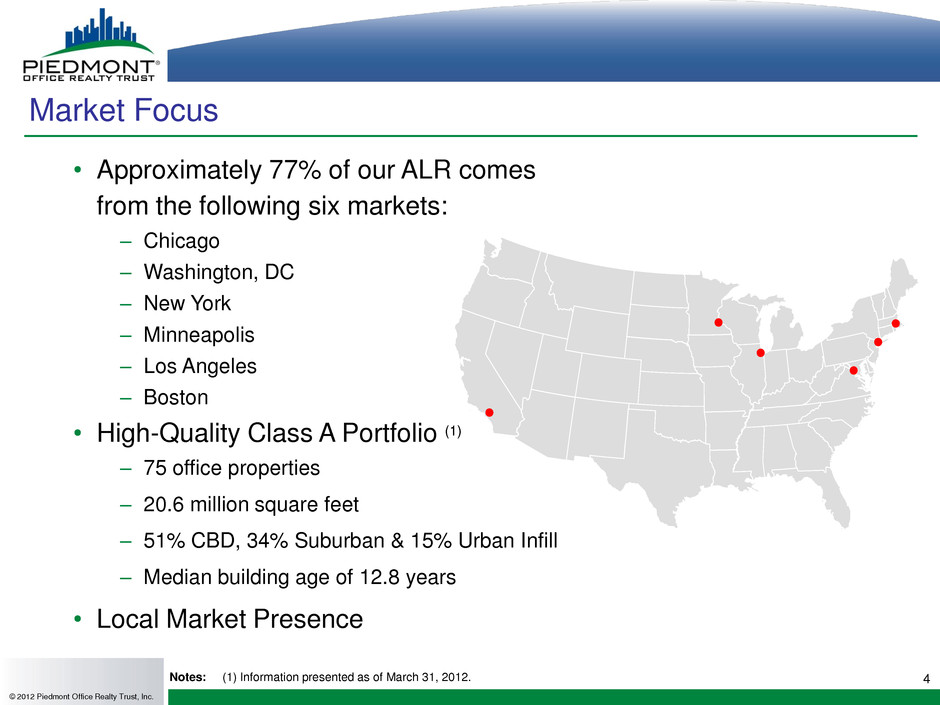
4 Market Focus © 2012 Piedmont Office Realty Trust, Inc. • Approximately 77% of our ALR comes from the following six markets: – Chicago – Washington, DC – New York – Minneapolis – Los Angeles – Boston • High-Quality Class A Portfolio (1) – 75 office properties – 20.6 million square feet – 51% CBD, 34% Suburban & 15% Urban Infill – Median building age of 12.8 years • Local Market Presence Notes: (1) Information presented as of March 31, 2012.
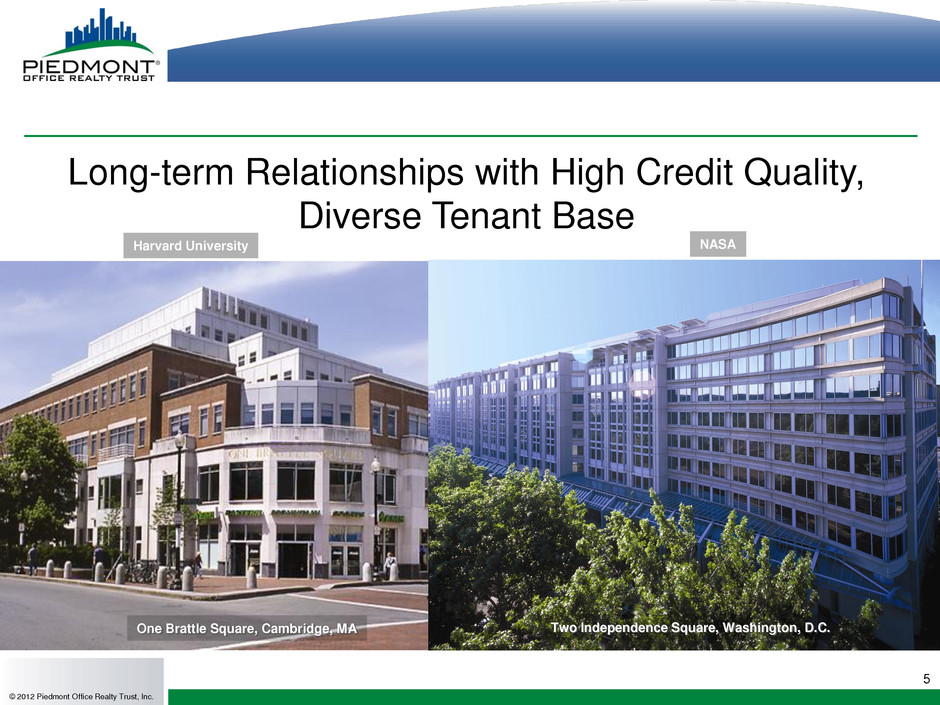
5 Long-term Relationships with High Credit Quality, Diverse Tenant Base One Brattle Square, Cambridge, MA © 2012 Piedmont Office Realty Trust, Inc. Harvard University Two Independence Square, Washington, D.C. NASA
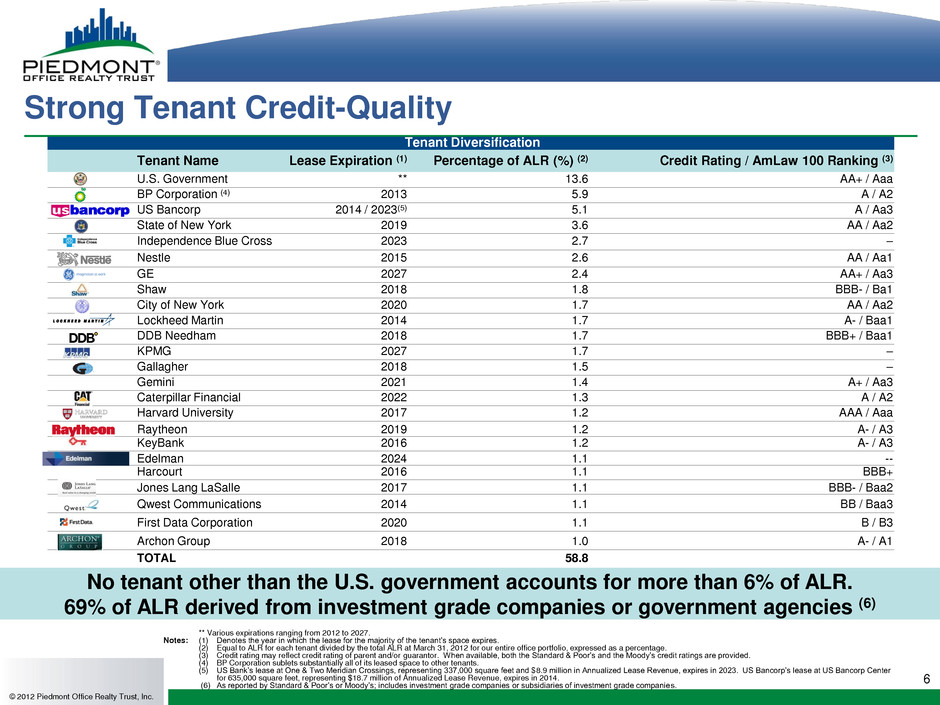
6 ** Various expirations ranging from 2012 to 2027. Notes: (1) Denotes the year in which the lease for the majority of the tenant’s space expires. (2) Equal to ALR for each tenant divided by the total ALR at March 31, 2012 for our entire office portfolio, expressed as a percentage. (3) Credit rating may reflect credit rating of parent and/or guarantor. When available, both the Standard & Poor’s and the Moody’s credit ratings are provided. (4) BP Corporation sublets substantially all of its leased space to other tenants. (5) US Bank’s lease at One & Two Meridian Crossings, representing 337,000 square feet and $8.9 million in Annualized Lease Revenue, expires in 2023. US Bancorp’s lease at US Bancorp Center for 635,000 square feet, representing $18.7 million of Annualized Lease Revenue, expires in 2014. (6) As reported by Standard & Poor’s or Moody’s; includes investment grade companies or subsidiaries of investment grade companies. Strong Tenant Credit-Quality Tenant Diversification Tenant Name Lease Expiration (1) Percentage of ALR (%) (2) Credit Rating / AmLaw 100 Ranking (3) U.S. Government ** 13.6 AA+ / Aaa BP Corporation (4) 2013 5.9 A / A2 US Bancorp 2014 / 2023(5) 5.1 A / Aa3 State of New York 2019 3.6 AA / Aa2 Independence Blue Cross 2023 2.7 – Nestle 2015 2.6 AA / Aa1 GE 2027 2.4 AA+ / Aa3 Shaw 2018 1.8 BBB- / Ba1 City of New York 2020 1.7 AA / Aa2 Lockheed Martin 2014 1.7 A- / Baa1 DDB Needham 2018 1.7 BBB+ / Baa1 KPMG 2027 1.7 – Gallagher 2018 1.5 – Gemini 2021 1.4 A+ / Aa3 Caterpillar Financial 2022 1.3 A / A2 Harvard University 2017 1.2 AAA / Aaa Raytheon 2019 1.2 A- / A3 KeyBank 2016 1.2 A- / A3 Edelman 2024 1.1 -- Harcourt 2016 1.1 BBB+ Jones Lang LaSalle 2017 1.1 BBB- / Baa2 Qwest Communications 2014 1.1 BB / Baa3 First Data Corporation 2020 1.1 B / B3 Archon Group 2018 1.0 A- / A1 TOTAL 58.8 © 2012 Piedmont Office Realty Trust, Inc. No tenant other than the U.S. government accounts for more than 6% of ALR. 69% of ALR derived from investment grade companies or government agencies (6)
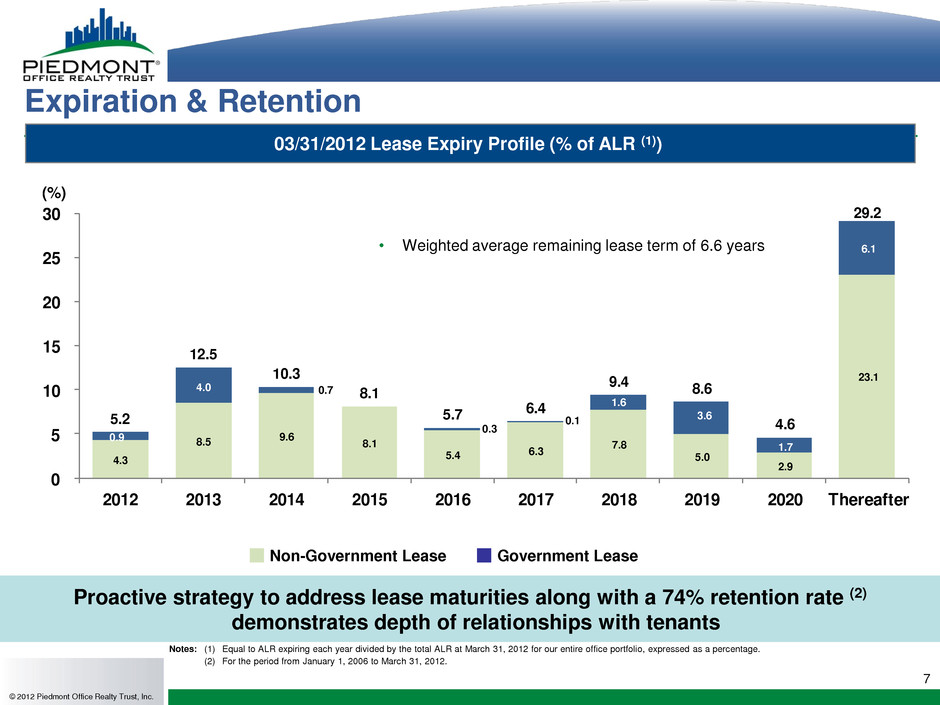
4.3 8.5 9.6 8.1 5.4 6.3 7.8 5.0 2.9 23.1 0.9 4.0 0.7 0.3 0.1 1.6 3.6 1.7 6.1 5.2 12.5 10.3 8.1 5.7 6.4 9.4 8.6 4.6 29.2 0 5 10 15 20 25 30 2012 2013 2014 2015 2016 2017 2018 2019 2020 Thereafter 7 Expiration & Retention (%) Notes: (1) Equal to ALR expiring each year divided by the total ALR at March 31, 2012 for our entire office portfolio, expressed as a percentage. (2) For the period from January 1, 2006 to March 31, 2012. 03/31/2012 Lease Expiry Profile (% of ALR (1)) Proactive strategy to address lease maturities along with a 74% retention rate (2) demonstrates depth of relationships with tenants Non-Government Lease Government Lease © 2012 Piedmont Office Realty Trust, Inc. • Weighted average remaining lease term of 6.6 years
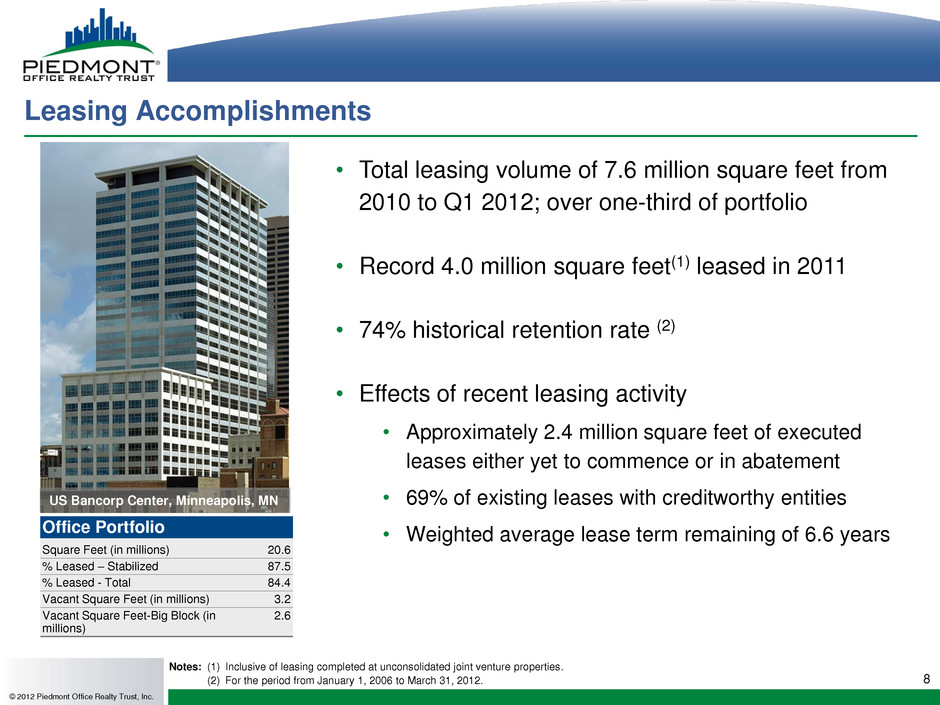
8 © 2012 Piedmont Office Realty Trust, Inc. 800 N. Brand Blvd., Glendale, CA Notes: (1) Inclusive of leasing completed at unconsolidated joint venture properties. (2) For the period from January 1, 2006 to March 31, 2012. US Bancorp Center, Minneapolis, MN Leasing Accomplishments • Total leasing volume of 7.6 million square feet from 2010 to Q1 2012; over one-third of portfolio • Record 4.0 million square feet(1) leased in 2011 • 74% historical retention rate (2) • Effects of recent leasing activity • Approximately 2.4 million square feet of executed leases either yet to commence or in abatement • 69% of existing leases with creditworthy entities • Weighted average lease term remaining of 6.6 years Office Portfolio Square Feet (in millions) 20.6 % Leased – Stabilized 87.5 % Leased - Total 84.4 Vacant Square Feet (in millions) 3.2 Vacant Square Feet-Big Block (in millions) 2.6
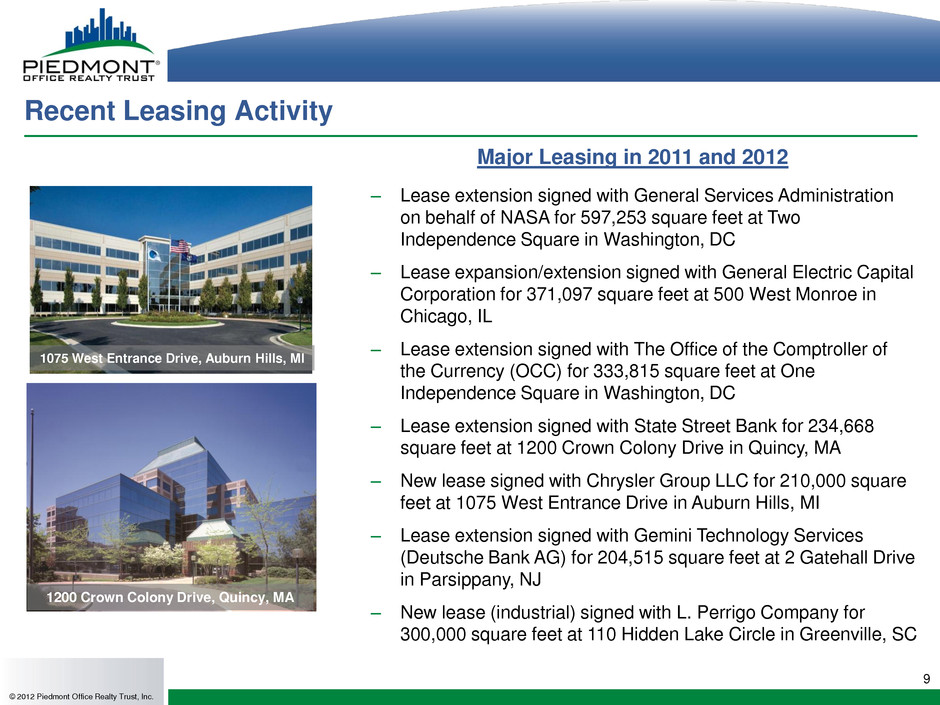
9 © 2012 Piedmont Office Realty Trust, Inc. 800 N. Brand Blvd., Glendale, CA Major Leasing in 2011 and 2012 1075 West Entrance Drive, Auburn Hills, MI Recent Leasing Activity – Lease extension signed with General Services Administration on behalf of NASA for 597,253 square feet at Two Independence Square in Washington, DC – Lease expansion/extension signed with General Electric Capital Corporation for 371,097 square feet at 500 West Monroe in Chicago, IL – Lease extension signed with The Office of the Comptroller of the Currency (OCC) for 333,815 square feet at One Independence Square in Washington, DC – Lease extension signed with State Street Bank for 234,668 square feet at 1200 Crown Colony Drive in Quincy, MA – New lease signed with Chrysler Group LLC for 210,000 square feet at 1075 West Entrance Drive in Auburn Hills, MI – Lease extension signed with Gemini Technology Services (Deutsche Bank AG) for 204,515 square feet at 2 Gatehall Drive in Parsippany, NJ – New lease (industrial) signed with L. Perrigo Company for 300,000 square feet at 110 Hidden Lake Circle in Greenville, SC 1200 Crown Colony Drive, Quincy, MA
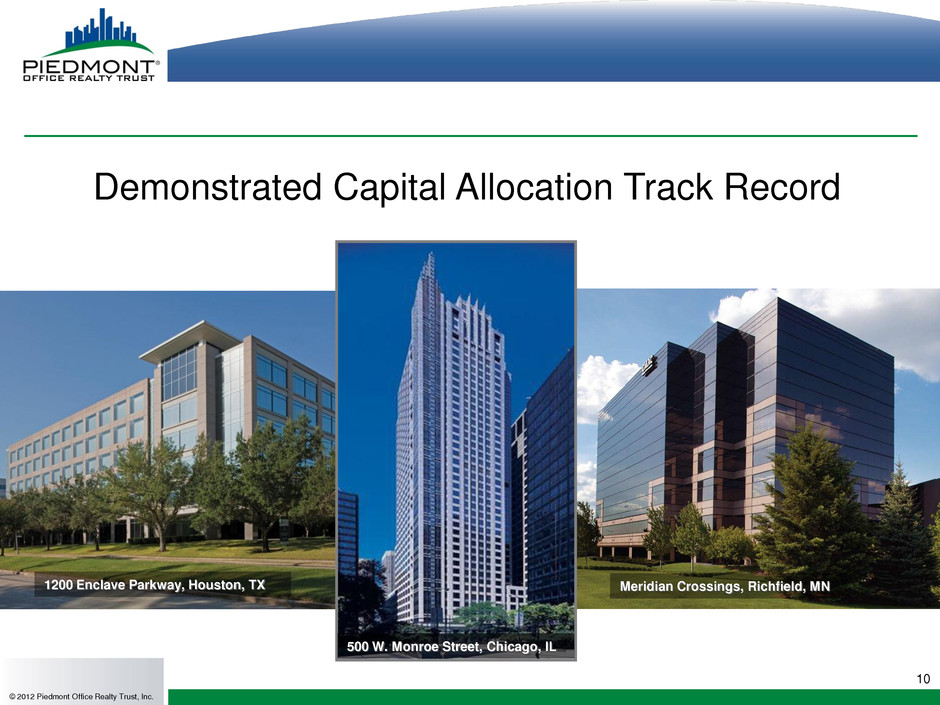
10 Demonstrated Capital Allocation Track Record © 2012 Piedmont Office Realty Trust, Inc. 1200 Enclave Parkway, Houston, TX Meridian Crossings, Richfield, MN 500 W. Monroe Street, Chicago, IL
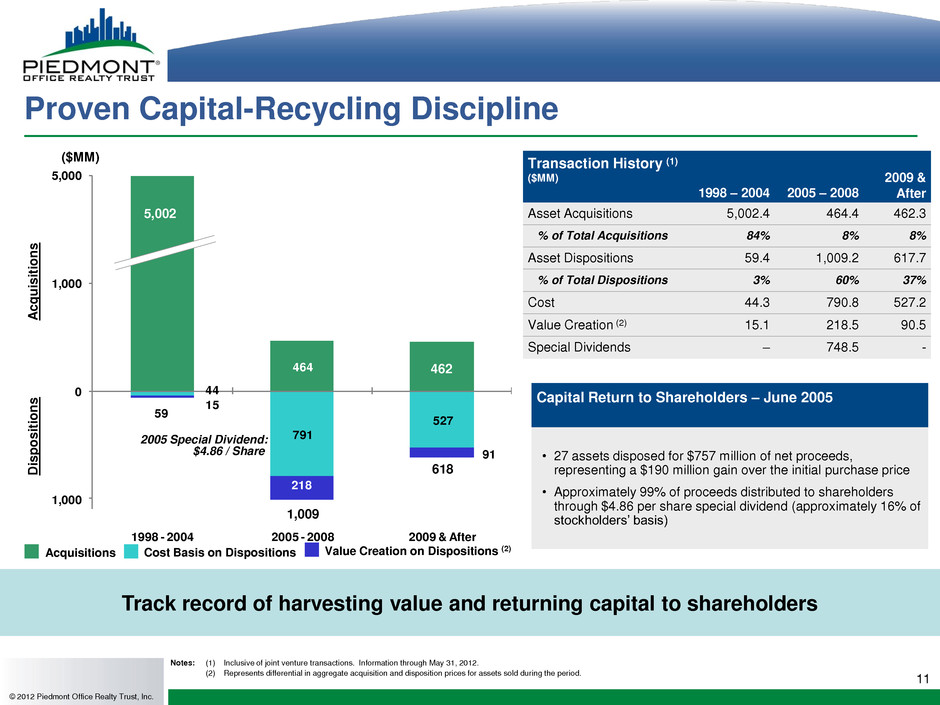
11 44 791 527 15 218 91 464 59 5,000 1,000 0 1,000 1998 - 2004 2005 - 2008 2009 & After 11 Proven Capital-Recycling Discipline 2005 Special Dividend: $4.86 / Share ($MM) Acquisitions Transaction History (1) ($MM) 1998 – 2004 2005 – 2008 2009 & After Asset Acquisitions 5,002.4 464.4 462.3 % of Total Acquisitions 84% 8% 8% Asset Dispositions 59.4 1,009.2 617.7 % of Total Dispositions 3% 60% 37% Cost 44.3 790.8 527.2 Value Creation (2) 15.1 218.5 90.5 Special Dividends – 748.5 - Notes: (1) Inclusive of joint venture transactions. Information through May 31, 2012. (2) Represents differential in aggregate acquisition and disposition prices for assets sold during the period. Track record of harvesting value and returning capital to shareholders Capital Return to Shareholders – June 2005 • 27 assets disposed for $757 million of net proceeds, representing a $190 million gain over the initial purchase price • Approximately 99% of proceeds distributed to shareholders through $4.86 per share special dividend (approximately 16% of stockholders’ basis) A cq u is it io n s Disp o siti o n s © 2012 Piedmont Office Realty Trust, Inc. Cost Basis on Dispositions Value Creation on Dispositions (2) 1,009 5,002 462 618
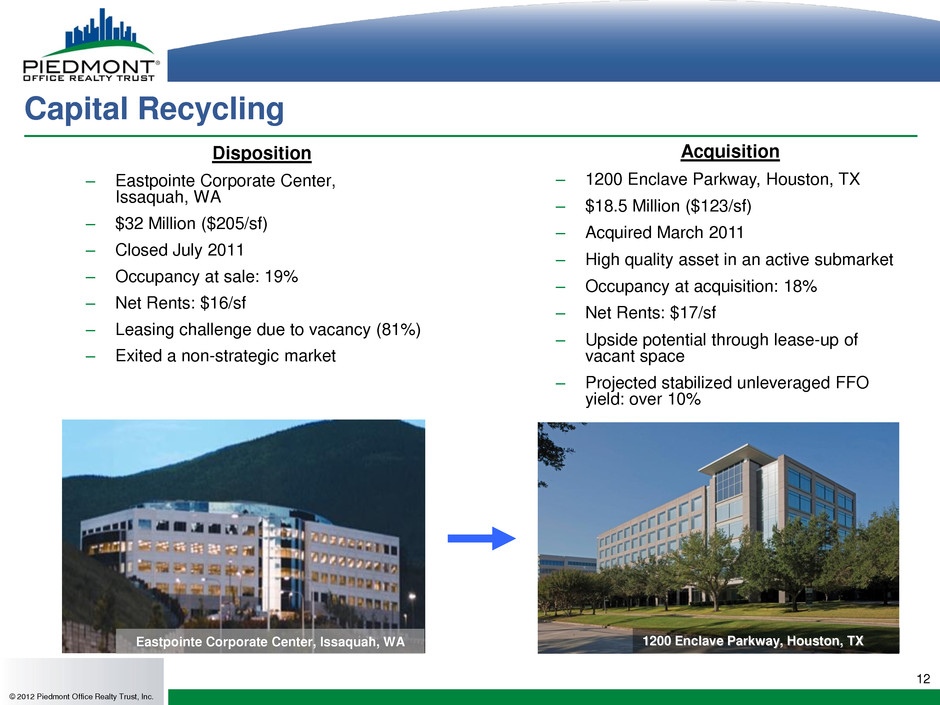
12 Capital Recycling Disposition – Eastpointe Corporate Center, Issaquah, WA – $32 Million ($205/sf) – Closed July 2011 – Occupancy at sale: 19% – Net Rents: $16/sf – Leasing challenge due to vacancy (81%) – Exited a non-strategic market © 2012 Piedmont Office Realty Trust, Inc. Acquisition – 1200 Enclave Parkway, Houston, TX – $18.5 Million ($123/sf) – Acquired March 2011 – High quality asset in an active submarket – Occupancy at acquisition: 18% – Net Rents: $17/sf – Upside potential through lease-up of vacant space – Projected stabilized unleveraged FFO yield: over 10% 1200 Enclave Parkway, Houston, TX Eastpointe Corporate Center, Issaquah, WA
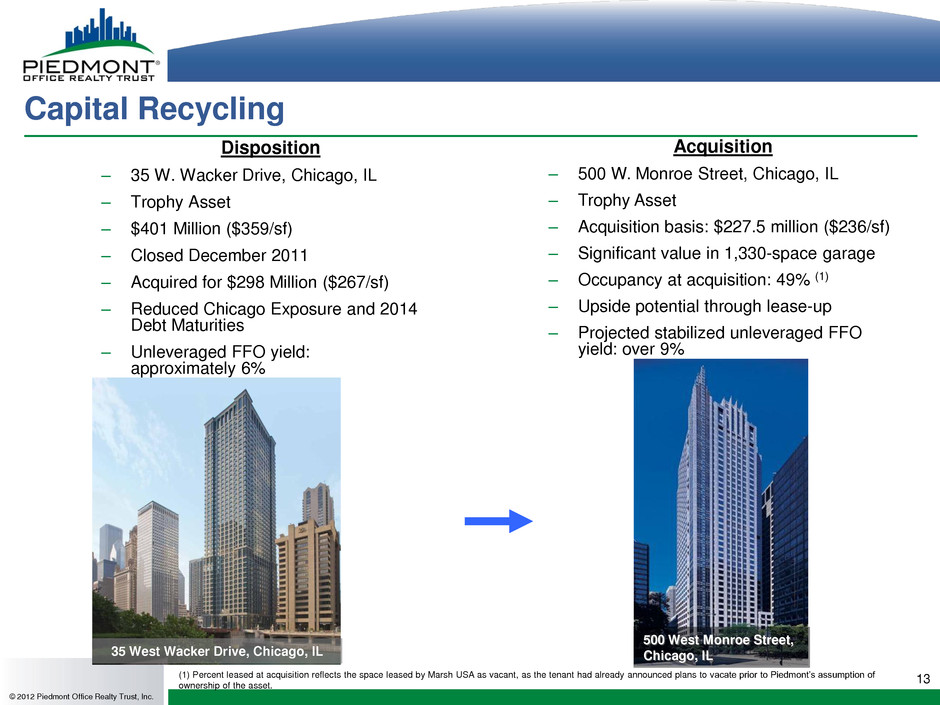
13 Capital Recycling Disposition – 35 W. Wacker Drive, Chicago, IL – Trophy Asset – $401 Million ($359/sf) – Closed December 2011 – Acquired for $298 Million ($267/sf) – Reduced Chicago Exposure and 2014 Debt Maturities – Unleveraged FFO yield: approximately 6% © 2012 Piedmont Office Realty Trust, Inc. Acquisition – 500 W. Monroe Street, Chicago, IL – Trophy Asset – Acquisition basis: $227.5 million ($236/sf) – Significant value in 1,330-space garage – Occupancy at acquisition: 49% (1) – Upside potential through lease-up – Projected stabilized unleveraged FFO yield: over 9% 35 West Wacker Drive, Chicago, IL 500 West Monroe Street, Chicago, IL (1) Percent leased at acquisition reflects the space leased by Marsh USA as vacant, as the tenant had already announced plans to vacate prior to Piedmont’s assumption of ownership of the asset.
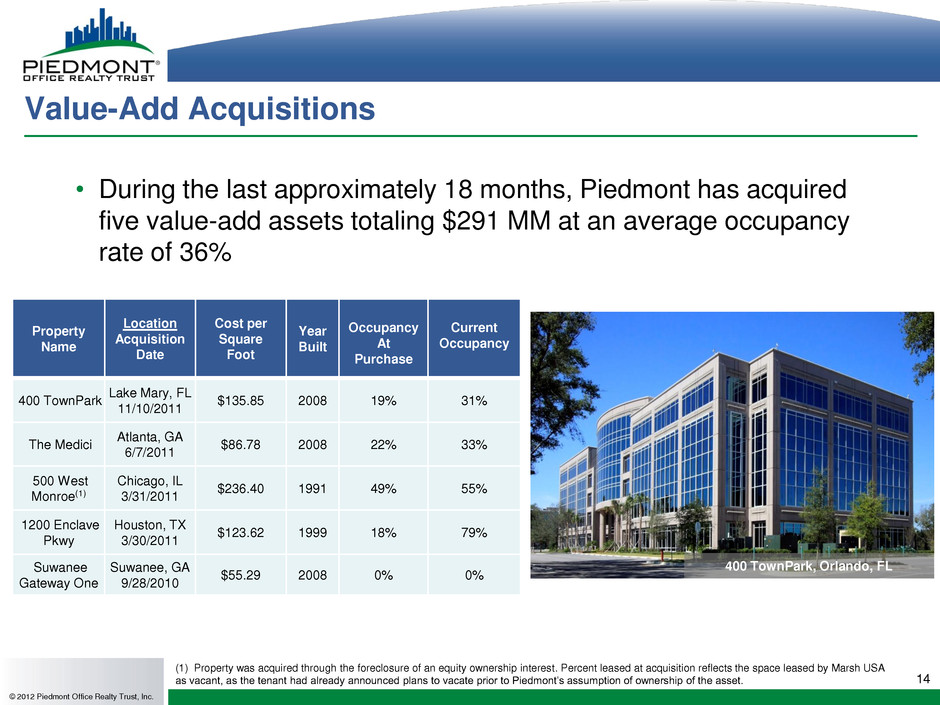
14 Value-Add Acquisitions • During the last approximately 18 months, Piedmont has acquired five value-add assets totaling $291 MM at an average occupancy rate of 36% © 2012 Piedmont Office Realty Trust, Inc. Property Name Location Acquisition Date Cost per Square Foot Year Built Occupancy At Purchase Current Occupancy 400 TownPark Lake Mary, FL 11/10/2011 $135.85 2008 19% 31% The Medici Atlanta, GA 6/7/2011 $86.78 2008 22% 33% 500 West Monroe(1) Chicago, IL 3/31/2011 $236.40 1991 49% 55% 1200 Enclave Pkwy Houston, TX 3/30/2011 $123.62 1999 18% 79% Suwanee Gateway One Suwanee, GA 9/28/2010 $55.29 2008 0% 0% (1) Property was acquired through the foreclosure of an equity ownership interest. Percent leased at acquisition reflects the space leased by Marsh USA as vacant, as the tenant had already announced plans to vacate prior to Piedmont’s assumption of ownership of the asset. 400 TownPark, Orlando, FL
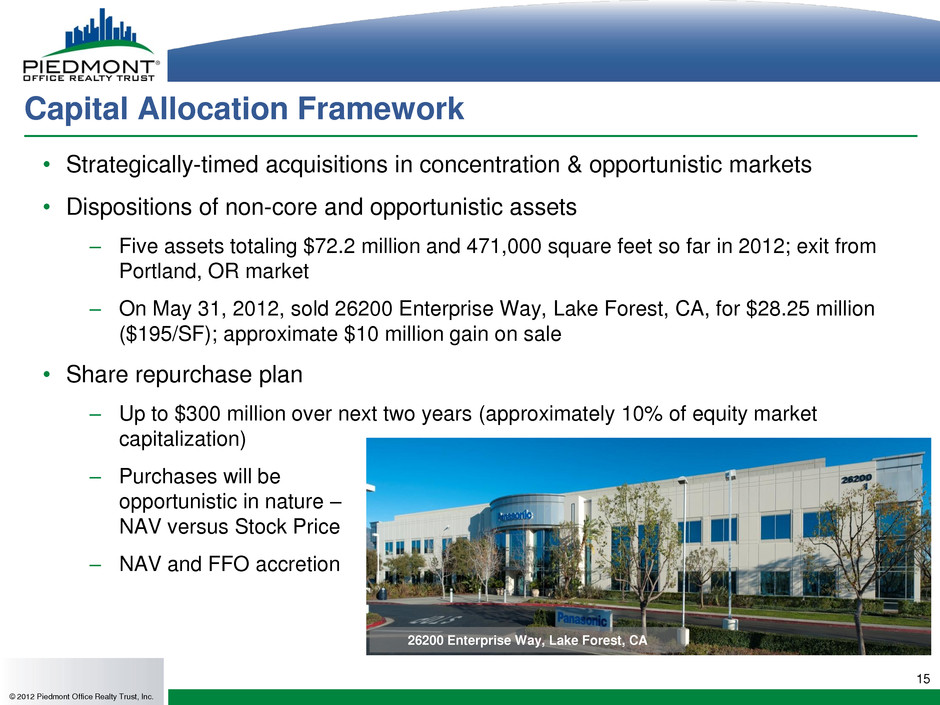
15 Capital Allocation Framework • Strategically-timed acquisitions in concentration & opportunistic markets • Dispositions of non-core and opportunistic assets – Five assets totaling $72.2 million and 471,000 square feet so far in 2012; exit from Portland, OR market – On May 31, 2012, sold 26200 Enterprise Way, Lake Forest, CA, for $28.25 million ($195/SF); approximate $10 million gain on sale • Share repurchase plan – Up to $300 million over next two years (approximately 10% of equity market capitalization) – Purchases will be opportunistic in nature – NAV versus Stock Price – NAV and FFO accretion © 2012 Piedmont Office Realty Trust, Inc. 26200 Enterprise Way, Lake Forest, CA
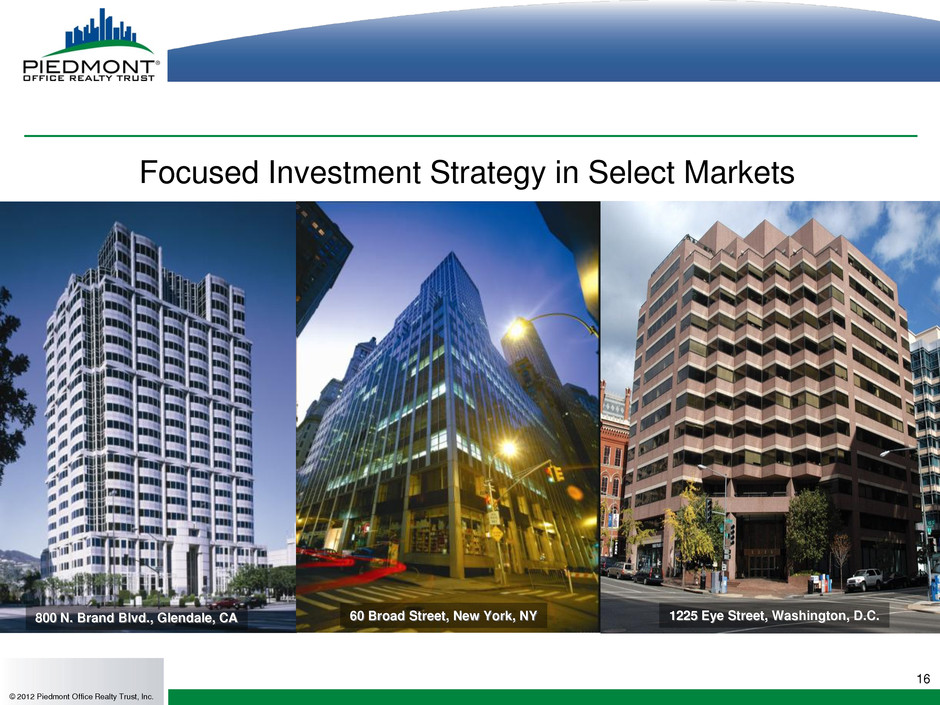
16 Focused Investment Strategy in Select Markets © 2012 Piedmont Office Realty Trust, Inc. 800 N. Brand Blvd., Glendale, CA 1225 Eye Street, Washington, D.C. 60 Broad Street, New York, NY
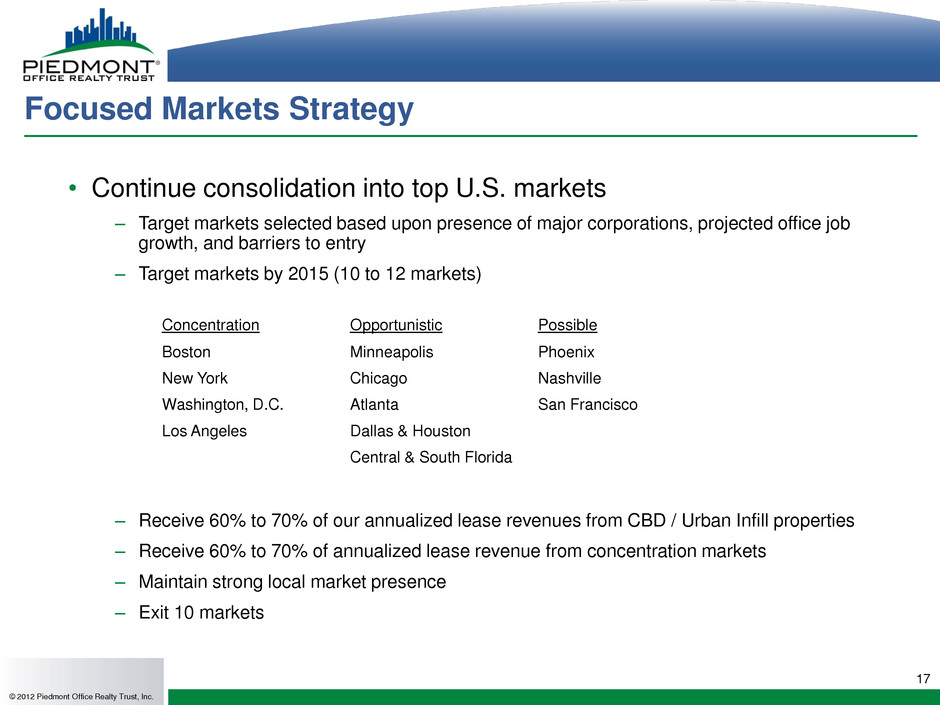
17 Focused Markets Strategy © 2012 Piedmont Office Realty Trust, Inc. • Continue consolidation into top U.S. markets – Target markets selected based upon presence of major corporations, projected office job growth, and barriers to entry – Target markets by 2015 (10 to 12 markets) Concentration Opportunistic Possible Boston Minneapolis Phoenix New York Chicago Nashville Washington, D.C. Atlanta San Francisco Los Angeles Dallas & Houston Central & South Florida – Receive 60% to 70% of our annualized lease revenues from CBD / Urban Infill properties – Receive 60% to 70% of annualized lease revenue from concentration markets – Maintain strong local market presence – Exit 10 markets
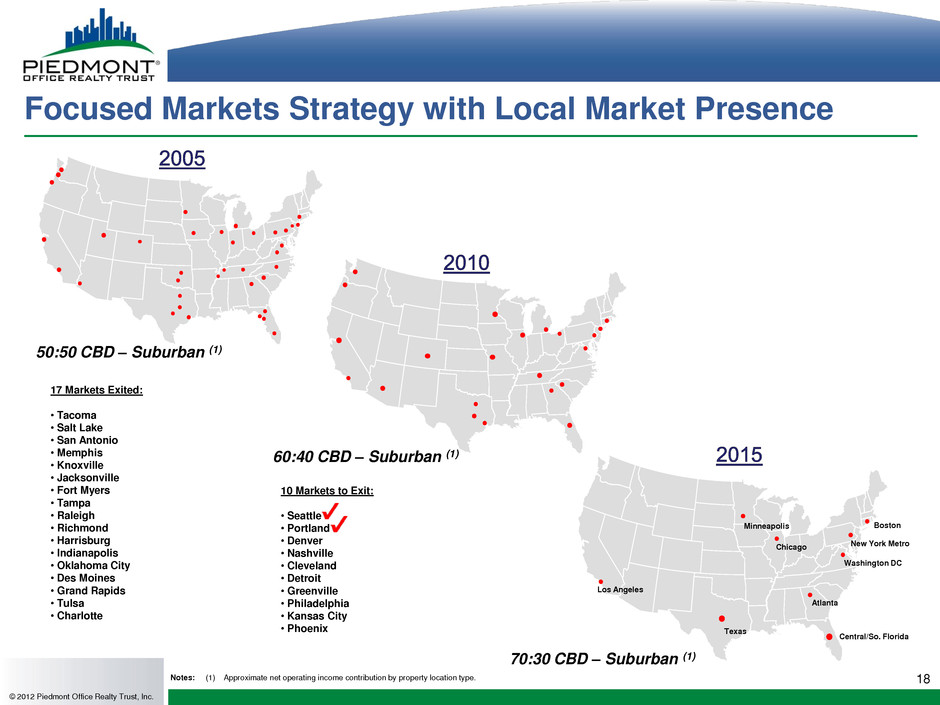
18 Focused Markets Strategy with Local Market Presence © 2012 Piedmont Office Realty Trust, Inc. 17 Markets Exited: • Tacoma • Salt Lake • San Antonio • Memphis • Knoxville • Jacksonville • Fort Myers • Tampa • Raleigh • Richmond • Harrisburg • Indianapolis • Oklahoma City • Des Moines • Grand Rapids • Tulsa • Charlotte 10 Markets to Exit: • Seattle • Portland • Denver • Nashville • Cleveland • Detroit • Greenville • Philadelphia • Kansas City • Phoenix Los Angeles Texas Atlanta Minneapolis Chicago Boston New York Metro Washington DC 50:50 CBD – Suburban (1) 60:40 CBD – Suburban (1) 70:30 CBD – Suburban (1) Central/So. Florida Notes: (1) Approximate net operating income contribution by property location type.
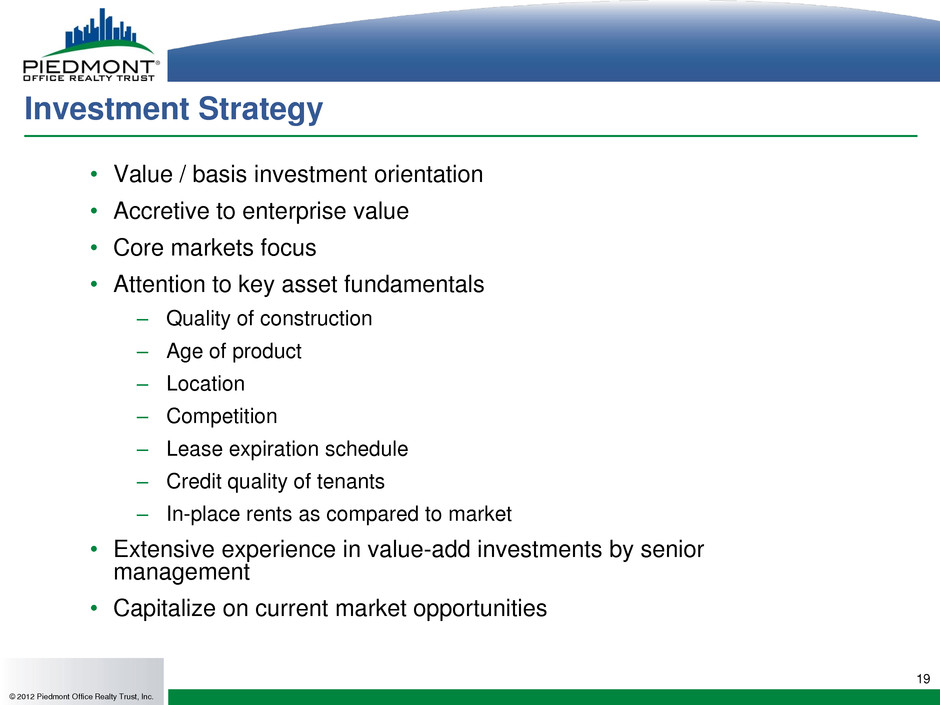
19 Investment Strategy • Value / basis investment orientation • Accretive to enterprise value • Core markets focus • Attention to key asset fundamentals – Quality of construction – Age of product – Location – Competition – Lease expiration schedule – Credit quality of tenants – In-place rents as compared to market • Extensive experience in value-add investments by senior management • Capitalize on current market opportunities © 2012 Piedmont Office Realty Trust, Inc.
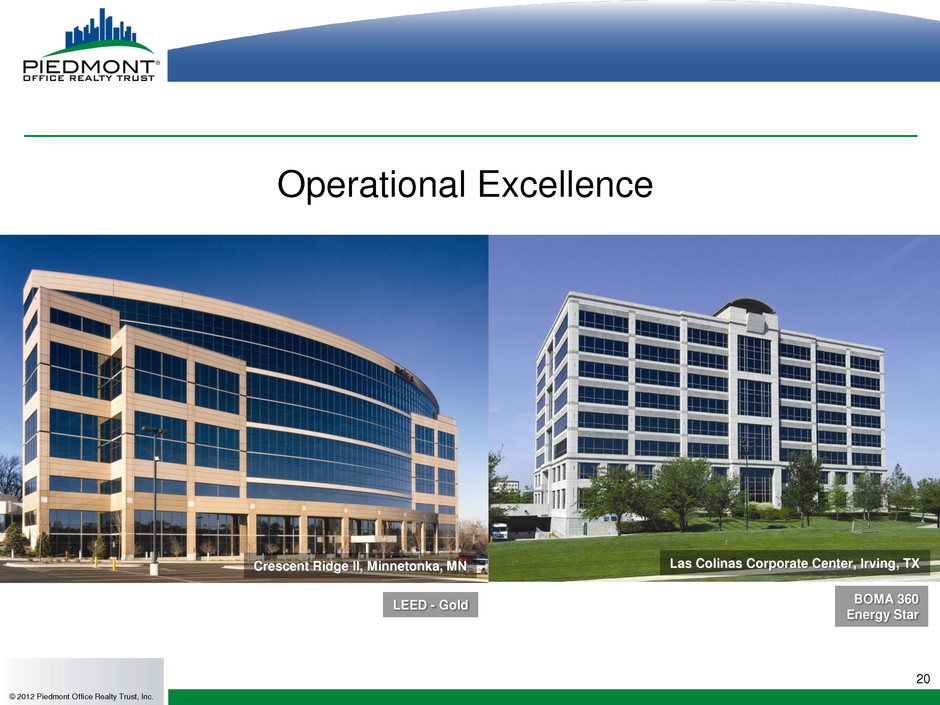
Operational Excellence 20 © 2012 Piedmont Office Realty Trust, Inc. Las Colinas Corporate Center, Irving, TX Crescent Ridge II, Minnetonka, MN LEED - Gold BOMA 360 Energy Star
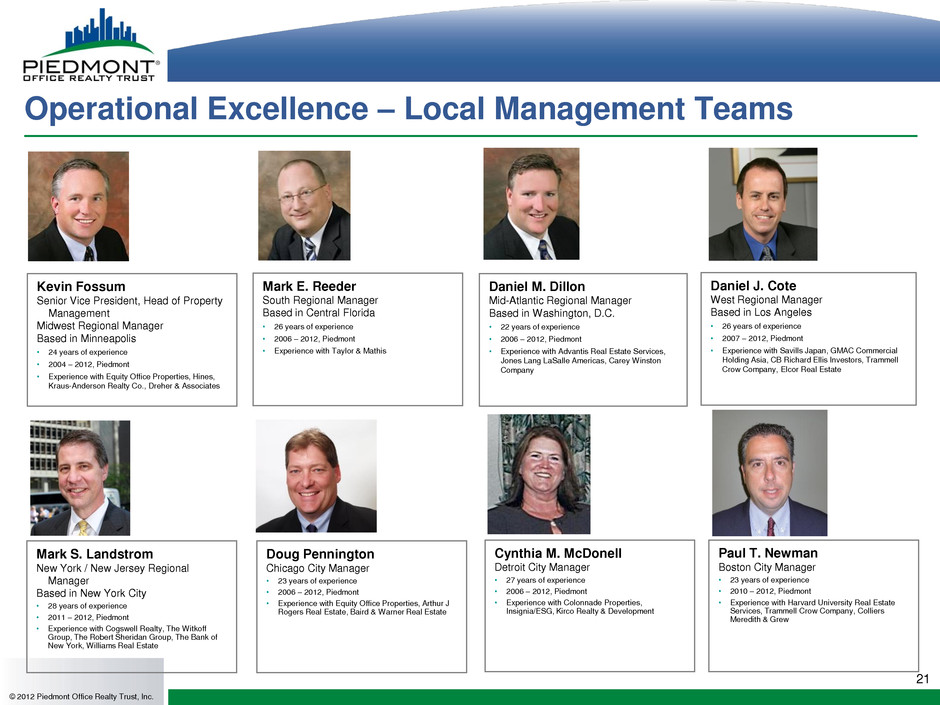
21 Operational Excellence – Local Management Teams Mark E. Reeder South Regional Manager Based in Central Florida • 26 years of experience • 2006 – 2012, Piedmont • Experience with Taylor & Mathis © 2012 Piedmont Office Realty Trust, Inc. Daniel M. Dillon Mid-Atlantic Regional Manager Based in Washington, D.C. • 22 years of experience • 2006 – 2012, Piedmont • Experience with Advantis Real Estate Services, Jones Lang LaSalle Americas, Carey Winston Company Daniel J. Cote West Regional Manager Based in Los Angeles • 26 years of experience • 2007 – 2012, Piedmont • Experience with Savills Japan, GMAC Commercial Holding Asia, CB Richard Ellis Investors, Trammell Crow Company, Elcor Real Estate Cynthia M. McDonell Detroit City Manager • 27 years of experience • 2006 – 2012, Piedmont • Experience with Colonnade Properties, Insignia/ESG, Kirco Realty & Development Mark S. Landstrom New York / New Jersey Regional Manager Based in New York City • 28 years of experience • 2011 – 2012, Piedmont • Experience with Cogswell Realty, The Witkoff Group, The Robert Sheridan Group, The Bank of New York, Williams Real Estate Doug Pennington Chicago City Manager • 23 years of experience • 2006 – 2012, Piedmont • Experience with Equity Office Properties, Arthur J Rogers Real Estate, Baird & Warner Real Estate Paul T. Newman Boston City Manager • 23 years of experience • 2010 – 2012, Piedmont • Experience with Harvard University Real Estate Services, Trammell Crow Company, Colliers Meredith & Grew Kevin Fossum Senior Vice President, Head of Property Management Midwest Regional Manager Based in Minneapolis • 24 years of experience • 2004 – 2012, Piedmont • Experience with Equity Office Properties, Hines, Kraus-Anderson Realty Co., Dreher & Associates
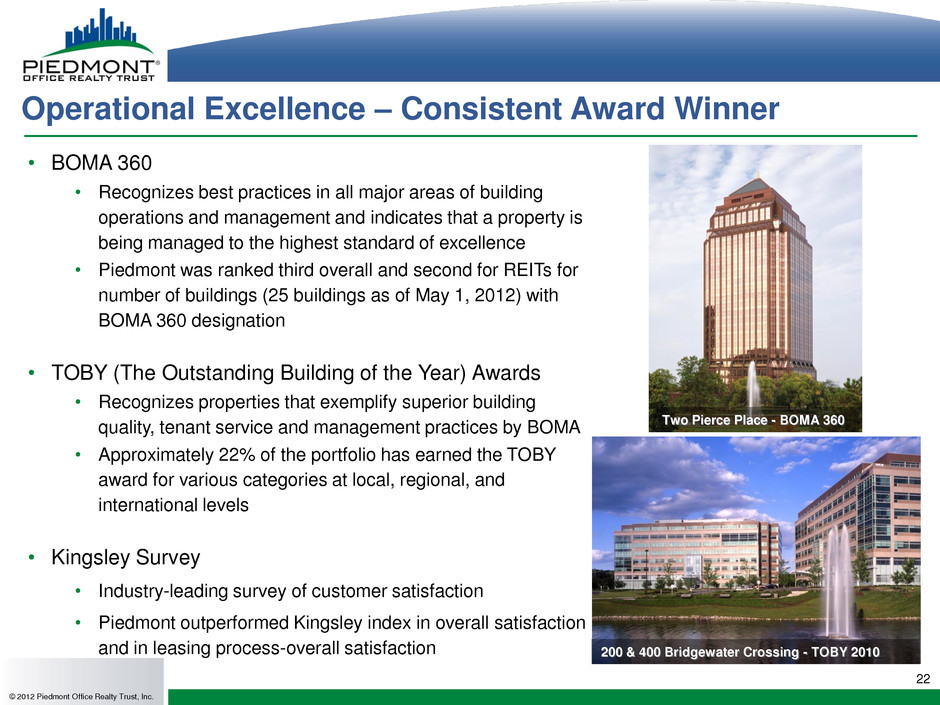
22 © 2012 Piedmont Office Realty Trust, Inc. • BOMA 360 • Recognizes best practices in all major areas of building operations and management and indicates that a property is being managed to the highest standard of excellence • Piedmont was ranked third overall and second for REITs for number of buildings (25 buildings as of May 1, 2012) with BOMA 360 designation • TOBY (The Outstanding Building of the Year) Awards • Recognizes properties that exemplify superior building quality, tenant service and management practices by BOMA • Approximately 22% of the portfolio has earned the TOBY award for various categories at local, regional, and international levels • Kingsley Survey • Industry-leading survey of customer satisfaction • Piedmont outperformed Kingsley index in overall satisfaction and in leasing process-overall satisfaction Operational Excellence – Consistent Award Winner 200 & 400 Bridgewater Crossing - TOBY 2010 Two Pierce Place - BOMA 360
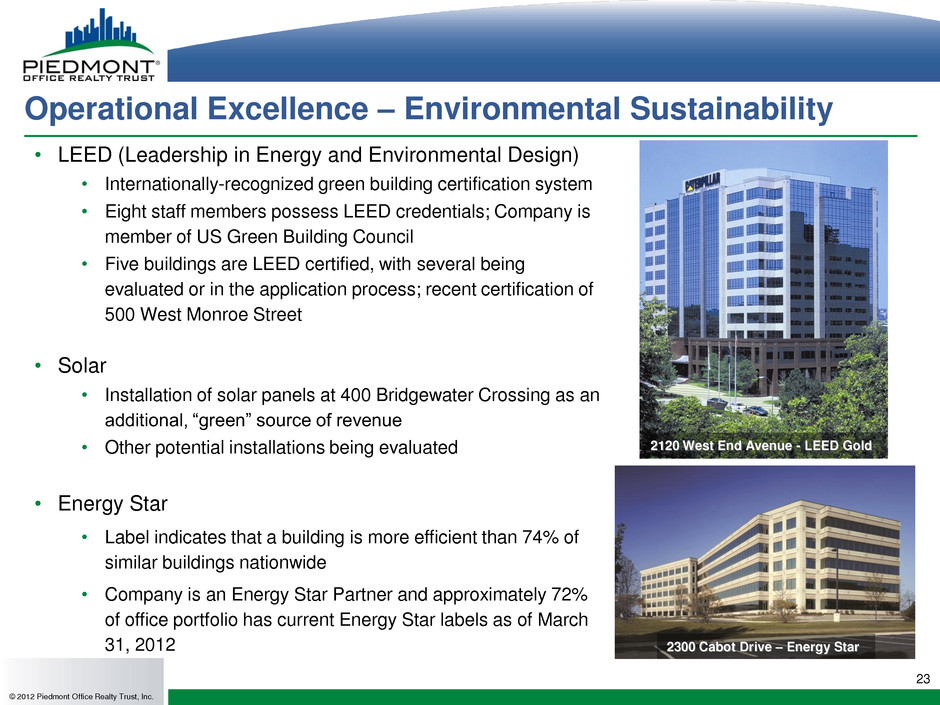
23 © 2012 Piedmont Office Realty Trust, Inc. • LEED (Leadership in Energy and Environmental Design) • Internationally-recognized green building certification system • Eight staff members possess LEED credentials; Company is member of US Green Building Council • Five buildings are LEED certified, with several being evaluated or in the application process; recent certification of 500 West Monroe Street • Solar • Installation of solar panels at 400 Bridgewater Crossing as an additional, “green” source of revenue • Other potential installations being evaluated • Energy Star • Label indicates that a building is more efficient than 74% of similar buildings nationwide • Company is an Energy Star Partner and approximately 72% of office portfolio has current Energy Star labels as of March 31, 2012 Operational Excellence – Environmental Sustainability 2120 West End Avenue - LEED Gold 2300 Cabot Drive – Energy Star
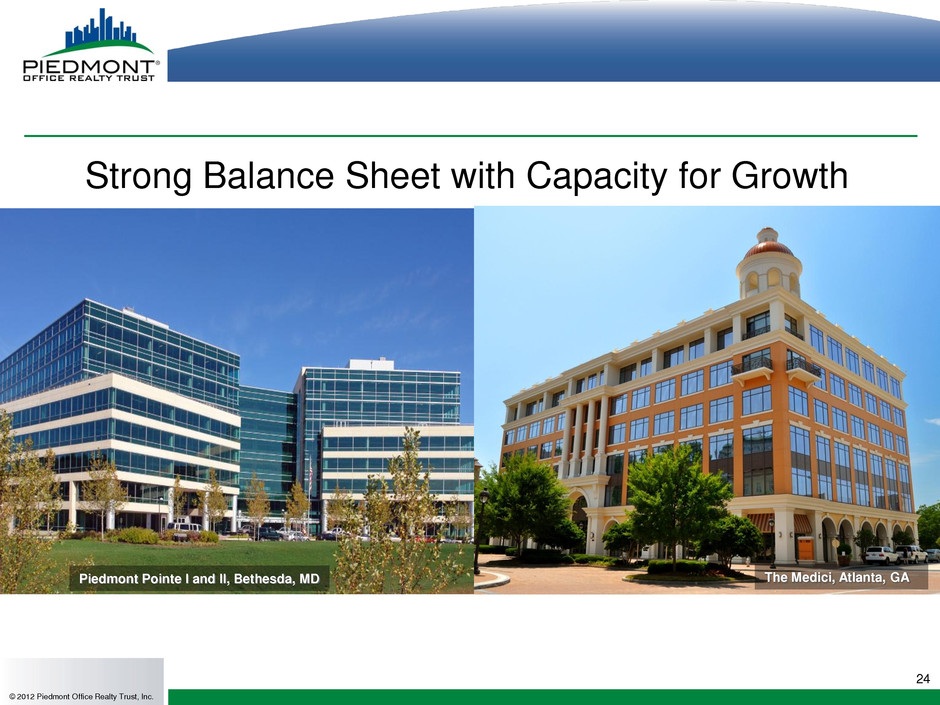
24 Strong Balance Sheet with Capacity for Growth © 2012 Piedmont Office Realty Trust, Inc. Piedmont Pointe I and II, Bethesda, MD The Medici, Atlanta, GA
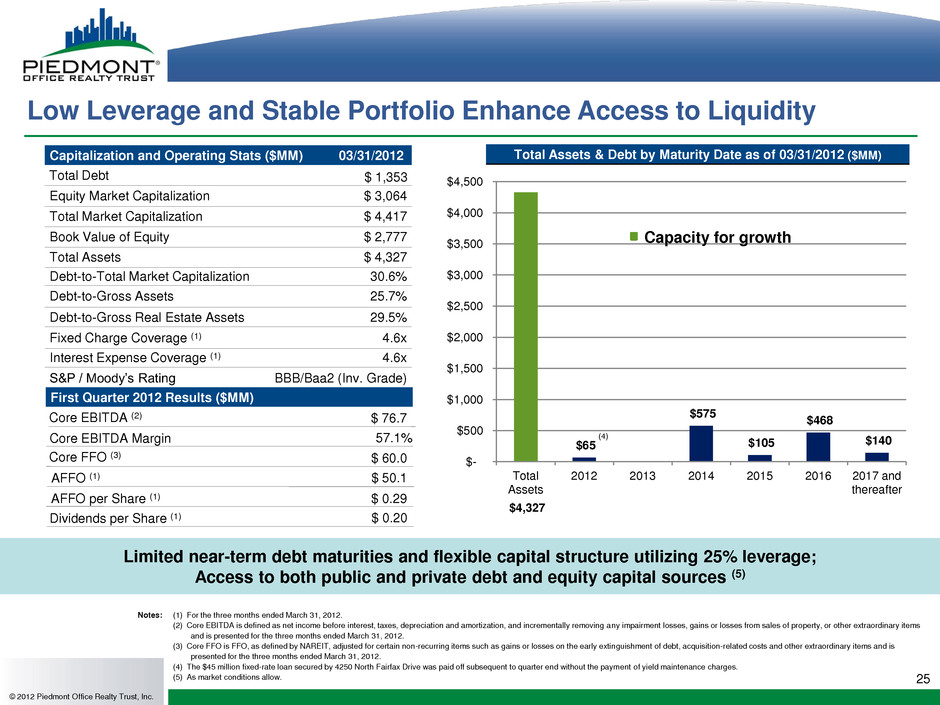
$4,327 $65 $575 $105 $468 $140 $- $500 $1,000 $1,500 $2,000 $2,500 $3,000 $3,500 $4,000 $4,500 Total Assets 2012 2013 2014 2015 2016 2017 and thereafter 25 Capitalization and Operating Stats ($MM) 03/31/2012 Equity Market Capitalization $ 3,064 Total Market Capitalization $ 4,417 Book Value of Equity $ 2,777 Total Assets $ 4,327 Debt-to-Total Market Capitalization 30.6% Debt-to-Gross Assets 25.7% Debt-to-Gross Real Estate Assets 29.5% Fixed Charge Coverage (1) 4.6x Interest Expense Coverage (1) 4.6x S&P / Moody’s Rating BBB/Baa2 (Inv. Grade) Low Leverage and Stable Portfolio Enhance Access to Liquidity Notes: (1) For the three months ended March 31, 2012. (2) Core EBITDA is defined as net income before interest, taxes, depreciation and amortization, and incrementally removing any impairment losses, gains or losses from sales of property, or other extraordinary items and is presented for the three months ended March 31, 2012. (3) Core FFO is FFO, as defined by NAREIT, adjusted for certain non-recurring items such as gains or losses on the early extinguishment of debt, acquisition-related costs and other extraordinary items and is presented for the three months ended March 31, 2012. (4) The $45 million fixed-rate loan secured by 4250 North Fairfax Drive was paid off subsequent to quarter end without the payment of yield maintenance charges. (5) As market conditions allow. Limited near-term debt maturities and flexible capital structure utilizing 25% leverage; Access to both public and private debt and equity capital sources (5) © 2012 Piedmont Office Realty Trust, Inc. Total Assets & Debt by Maturity Date as of 03/31/2012 ($MM) Total Debt $ 1,353 AFFO (1) Core FFO (3) Dividends per Share (1) Core EBITDA Margin Core EBITDA (2) AFFO per Share (1) $ 76.7 $ 60.0 $ 50.1 $ 0.20 57.1% $ 0.29 (4) Capacity for growth First Quarter 2012 Results ($MM)
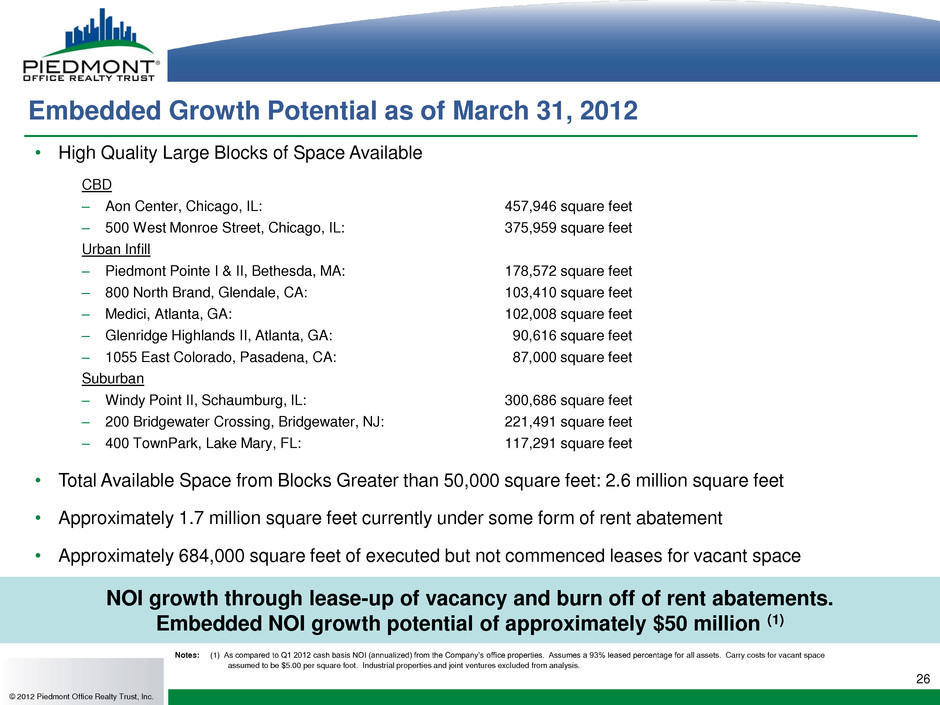
26 © 2012 Piedmont Office Realty Trust, Inc. • High Quality Large Blocks of Space Available CBD – Aon Center, Chicago, IL: 457,946 square feet – 500 West Monroe Street, Chicago, IL: 375,959 square feet Urban Infill – Piedmont Pointe I & II, Bethesda, MA: 178,572 square feet – 800 North Brand, Glendale, CA: 103,410 square feet – Medici, Atlanta, GA: 102,008 square feet – Glenridge Highlands II, Atlanta, GA: 90,616 square feet – 1055 East Colorado, Pasadena, CA: 87,000 square feet Suburban – Windy Point II, Schaumburg, IL: 300,686 square feet – 200 Bridgewater Crossing, Bridgewater, NJ: 221,491 square feet – 400 TownPark, Lake Mary, FL: 117,291 square feet • Total Available Space from Blocks Greater than 50,000 square feet: 2.6 million square feet • Approximately 1.7 million square feet currently under some form of rent abatement • Approximately 684,000 square feet of executed but not commenced leases for vacant space NOI growth through lease-up of vacancy and burn off of rent abatements. Embedded NOI growth potential of approximately $50 million (1) Embedded Growth Potential as of March 31, 2012 Notes: (1) As compared to Q1 2012 cash basis NOI (annualized) from the Company’s office properties. Assumes a 93% leased percentage for all assets. Carry costs for vacant space assumed to be $5.00 per square foot. Industrial properties and joint ventures excluded from analysis.
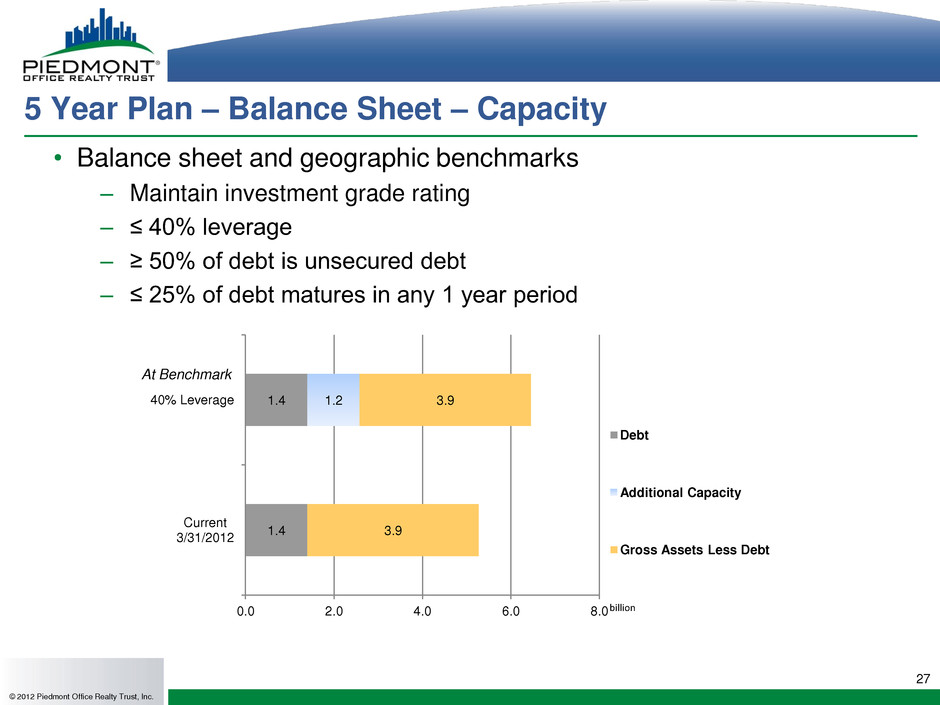
27 5 Year Plan – Balance Sheet – Capacity © 2012 Piedmont Office Realty Trust, Inc. • Balance sheet and geographic benchmarks – Maintain investment grade rating – ≤ 40% leverage – ≥ 50% of debt is unsecured debt – ≤ 25% of debt matures in any 1 year period billion 1.4 1.4 1.2 3.9 3.9 0.0 2.0 4.0 6.0 8.0 Current 3/31/2012 40% Leverage Debt Additional Capacity Gross Assets Less Debt At Benchmark
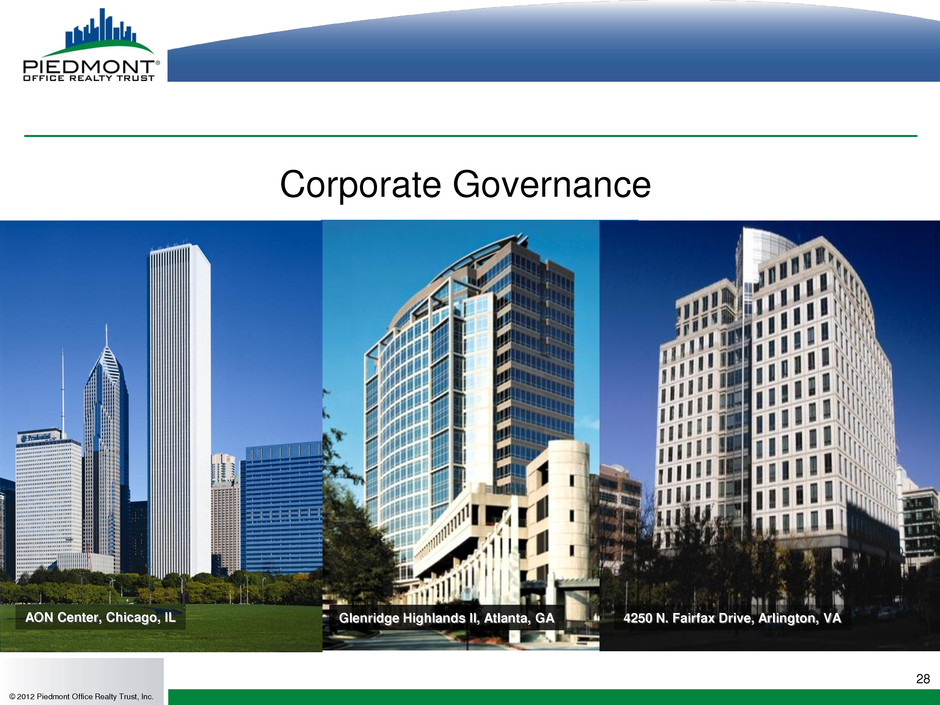
Corporate Governance 28 © 2012 Piedmont Office Realty Trust, Inc. Glenridge Highlands II, Atlanta, GA AON Center, Chicago, IL 4250 N. Fairfax Drive, Arlington, VA
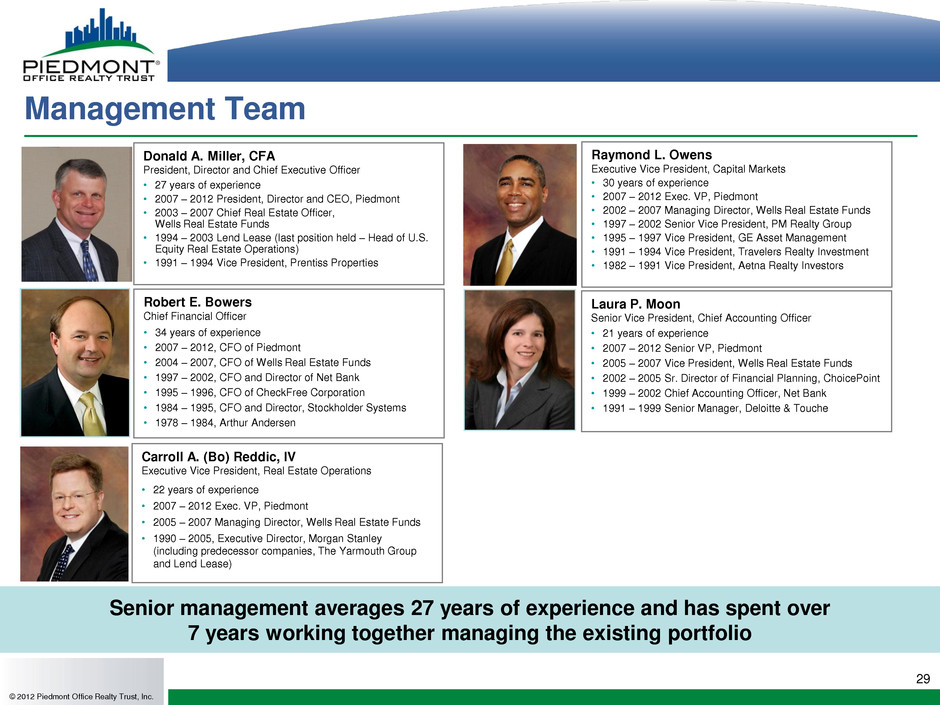
29 Management Team Donald A. Miller, CFA President, Director and Chief Executive Officer • 27 years of experience • 2007 – 2012 President, Director and CEO, Piedmont • 2003 – 2007 Chief Real Estate Officer, Wells Real Estate Funds • 1994 – 2003 Lend Lease (last position held – Head of U.S. Equity Real Estate Operations) • 1991 – 1994 Vice President, Prentiss Properties Carroll A. (Bo) Reddic, IV Executive Vice President, Real Estate Operations • 22 years of experience • 2007 – 2012 Exec. VP, Piedmont • 2005 – 2007 Managing Director, Wells Real Estate Funds • 1990 – 2005, Executive Director, Morgan Stanley (including predecessor companies, The Yarmouth Group and Lend Lease) Robert E. Bowers Chief Financial Officer • 34 years of experience • 2007 – 2012, CFO of Piedmont • 2004 – 2007, CFO of Wells Real Estate Funds • 1997 – 2002, CFO and Director of Net Bank • 1995 – 1996, CFO of CheckFree Corporation • 1984 – 1995, CFO and Director, Stockholder Systems • 1978 – 1984, Arthur Andersen Raymond L. Owens Executive Vice President, Capital Markets • 30 years of experience • 2007 – 2012 Exec. VP, Piedmont • 2002 – 2007 Managing Director, Wells Real Estate Funds • 1997 – 2002 Senior Vice President, PM Realty Group • 1995 – 1997 Vice President, GE Asset Management • 1991 – 1994 Vice President, Travelers Realty Investment • 1982 – 1991 Vice President, Aetna Realty Investors Laura P. Moon Senior Vice President, Chief Accounting Officer • 21 years of experience • 2007 – 2012 Senior VP, Piedmont • 2005 – 2007 Vice President, Wells Real Estate Funds • 2002 – 2005 Sr. Director of Financial Planning, ChoicePoint • 1999 – 2002 Chief Accounting Officer, Net Bank • 1991 – 1999 Senior Manager, Deloitte & Touche Senior management averages 27 years of experience and has spent over 7 years working together managing the existing portfolio © 2012 Piedmont Office Realty Trust, Inc.
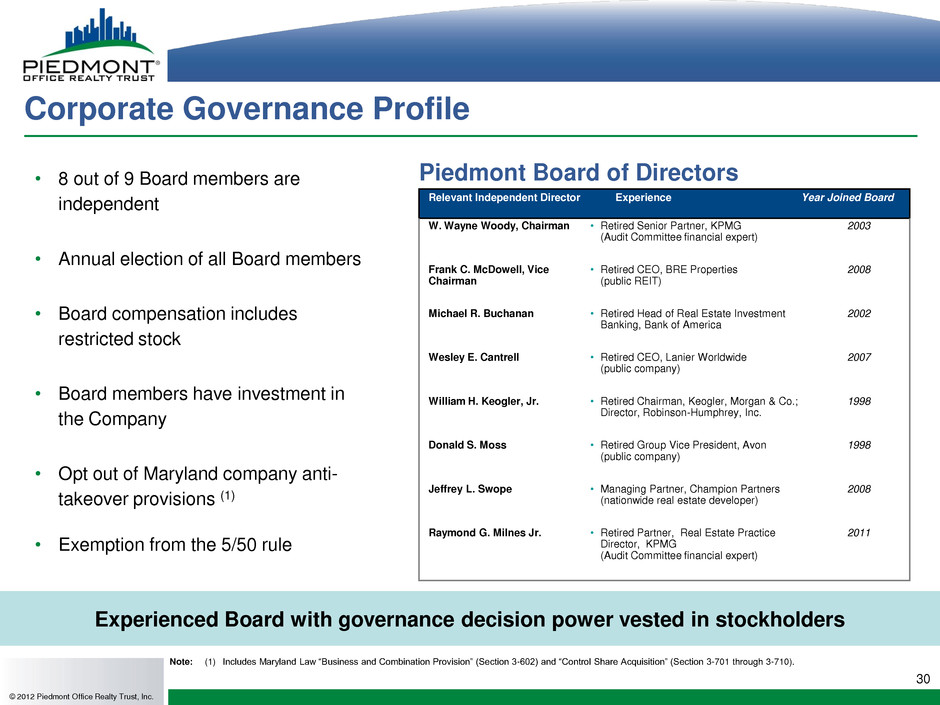
Note: (1) Includes Maryland Law “Business and Combination Provision” (Section 3-602) and “Control Share Acquisition” (Section 3-701 through 3-710). 30 Corporate Governance Profile Experienced Board with governance decision power vested in stockholders © 2012 Piedmont Office Realty Trust, Inc. • 8 out of 9 Board members are independent • Annual election of all Board members • Board compensation includes restricted stock • Board members have investment in the Company • Opt out of Maryland company anti- takeover provisions (1) • Exemption from the 5/50 rule Relevant Independent Director Experience Year Joined Board W. Wayne Woody, Chairman • Retired Senior Partner, KPMG (Audit Committee financial expert) 2003 Frank C. McDowell, Vice Chairman • Retired CEO, BRE Properties (public REIT) 2008 Michael R. Buchanan • Retired Head of Real Estate Investment Banking, Bank of America 2002 Wesley E. Cantrell • Retired CEO, Lanier Worldwide (public company) 2007 William H. Keogler, Jr. • Retired Chairman, Keogler, Morgan & Co.; Director, Robinson-Humphrey, Inc. 1998 Donald S. Moss • Retired Group Vice President, Avon (public company) 1998 Jeffrey L. Swope • Managing Partner, Champion Partners (nationwide real estate developer) 2008 Raymond G. Milnes Jr. • Retired Partner, Real Estate Practice Director, KPMG (Audit Committee financial expert) 2011 Piedmont Board of Directors
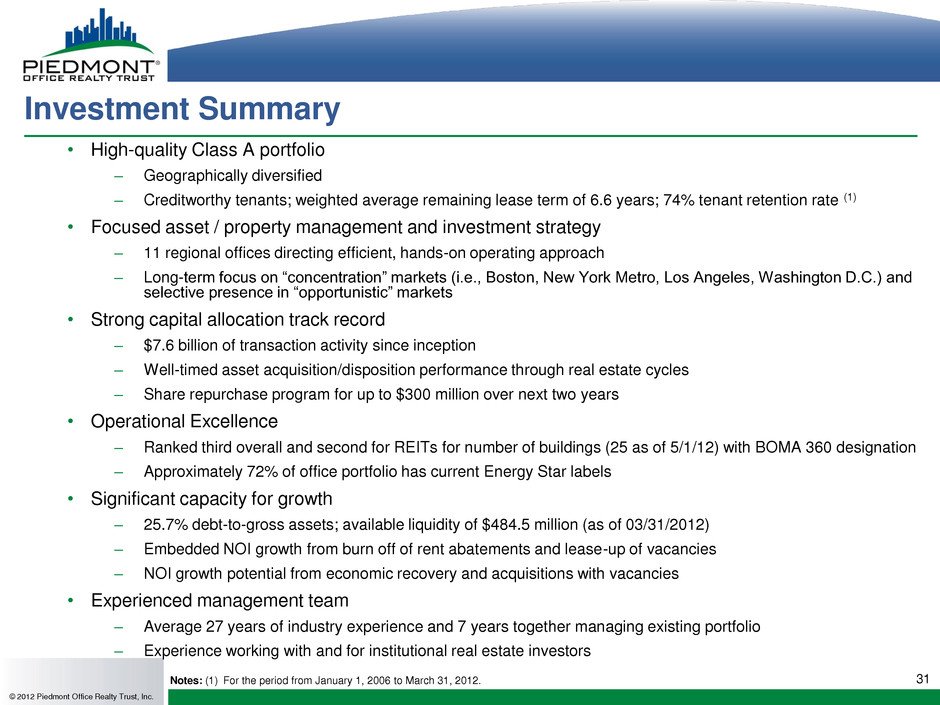
31 Investment Summary • High-quality Class A portfolio – Geographically diversified – Creditworthy tenants; weighted average remaining lease term of 6.6 years; 74% tenant retention rate (1) • Focused asset / property management and investment strategy – 11 regional offices directing efficient, hands-on operating approach – Long-term focus on “concentration” markets (i.e., Boston, New York Metro, Los Angeles, Washington D.C.) and selective presence in “opportunistic” markets • Strong capital allocation track record – $7.6 billion of transaction activity since inception – Well-timed asset acquisition/disposition performance through real estate cycles – Share repurchase program for up to $300 million over next two years • Operational Excellence – Ranked third overall and second for REITs for number of buildings (25 as of 5/1/12) with BOMA 360 designation – Approximately 72% of office portfolio has current Energy Star labels • Significant capacity for growth – 25.7% debt-to-gross assets; available liquidity of $484.5 million (as of 03/31/2012) – Embedded NOI growth from burn off of rent abatements and lease-up of vacancies – NOI growth potential from economic recovery and acquisitions with vacancies • Experienced management team – Average 27 years of industry experience and 7 years together managing existing portfolio – Experience working with and for institutional real estate investors Notes: (1) For the period from January 1, 2006 to March 31, 2012. © 2012 Piedmont Office Realty Trust, Inc.
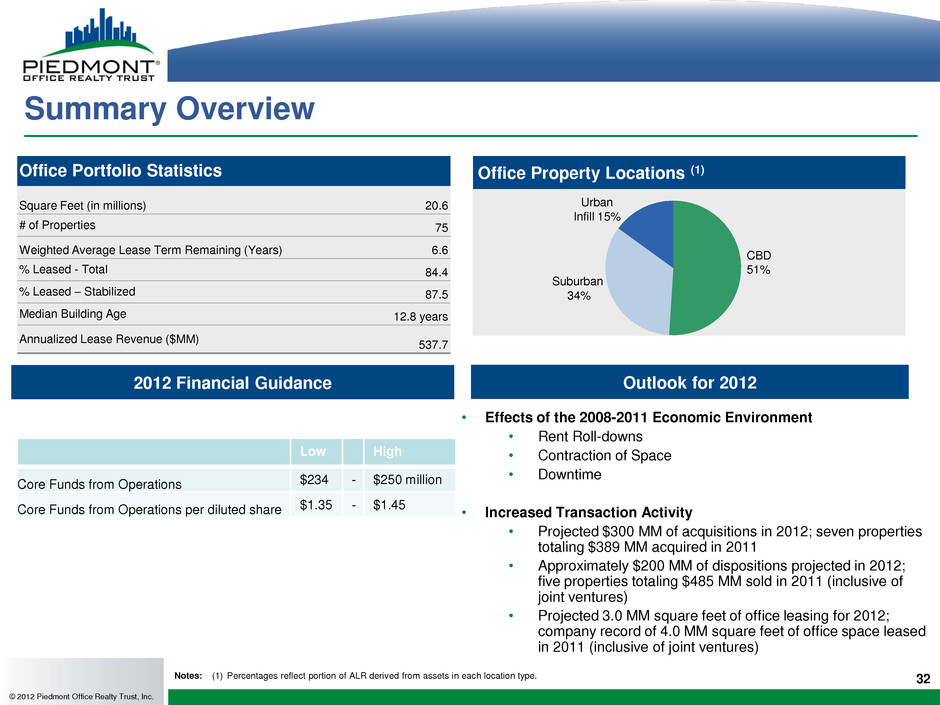
Summary Overview • Effects of the 2008-2011 Economic Environment • Rent Roll-downs • Contraction of Space • Downtime • Increased Transaction Activity • Projected $300 MM of acquisitions in 2012; seven properties totaling $389 MM acquired in 2011 • Approximately $200 MM of dispositions projected in 2012; five properties totaling $485 MM sold in 2011 (inclusive of joint ventures) • Projected 3.0 MM square feet of office leasing for 2012; company record of 4.0 MM square feet of office space leased in 2011 (inclusive of joint ventures) Outlook for 2012 32 © 2012 Piedmont Office Realty Trust, Inc. 2012 Financial Guidance Low High Core Funds from Operations $234 - $250 million Core Funds from Operations per diluted share $1.35 - $1.45 Office Property Locations (1) CBD 51% Suburban 34% Urban Infill 15% Office Portfolio Statistics Square Feet (in millions) 20.6 # of Properties 75 Weighted Average Lease Term Remaining (Years) 6.6 % Leased - Total 84.4 % Leased – Stabilized 87.5 Median Building Age 12.8 years Annualized Lease Revenue ($MM) 537.7 Notes: (1) Percentages reflect portion of ALR derived from assets in each location type.
33 © 2012 Piedmont Office Realty Trust, Inc. Appendix
34 © 2012 Piedmont Office Realty Trust, Inc.
35 © 2012 Piedmont Office Realty Trust, Inc.
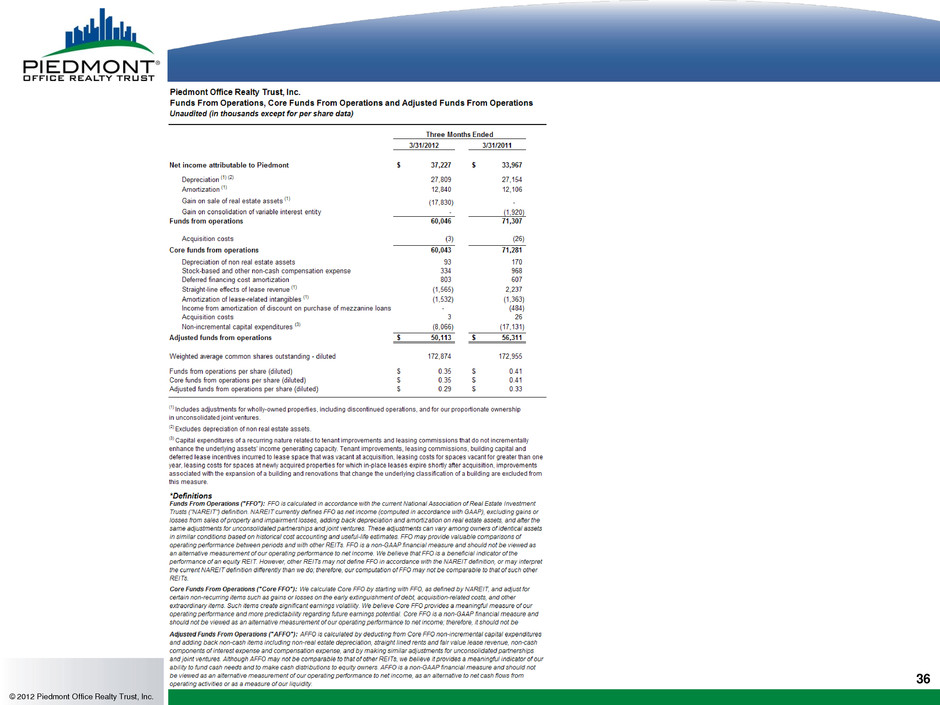
36 © 2012 Piedmont Office Realty Trust, Inc.
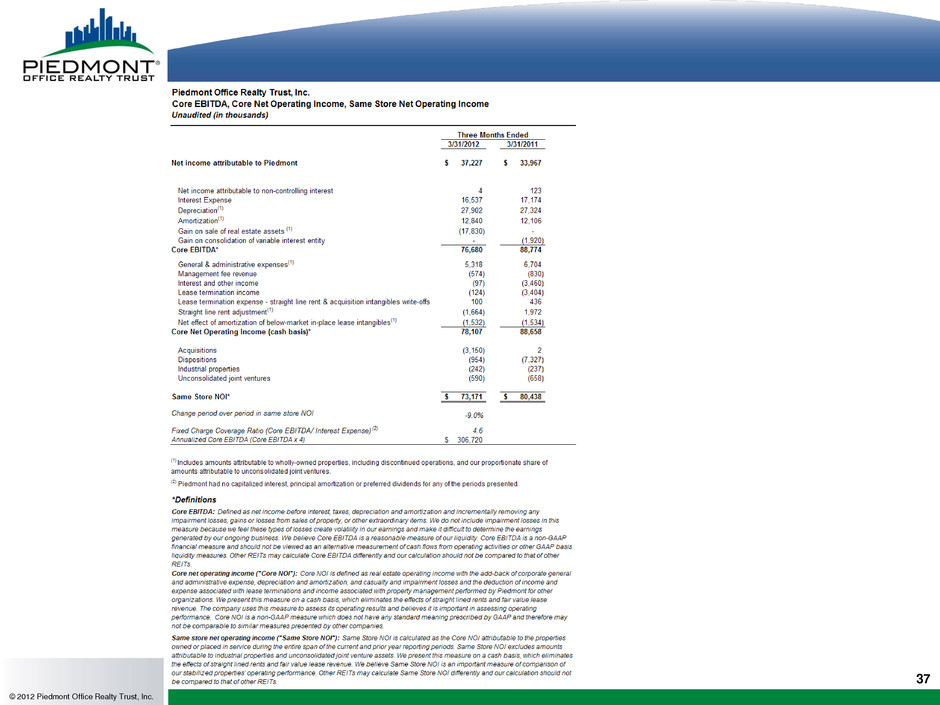
37 © 2012 Piedmont Office Realty Trust, Inc.
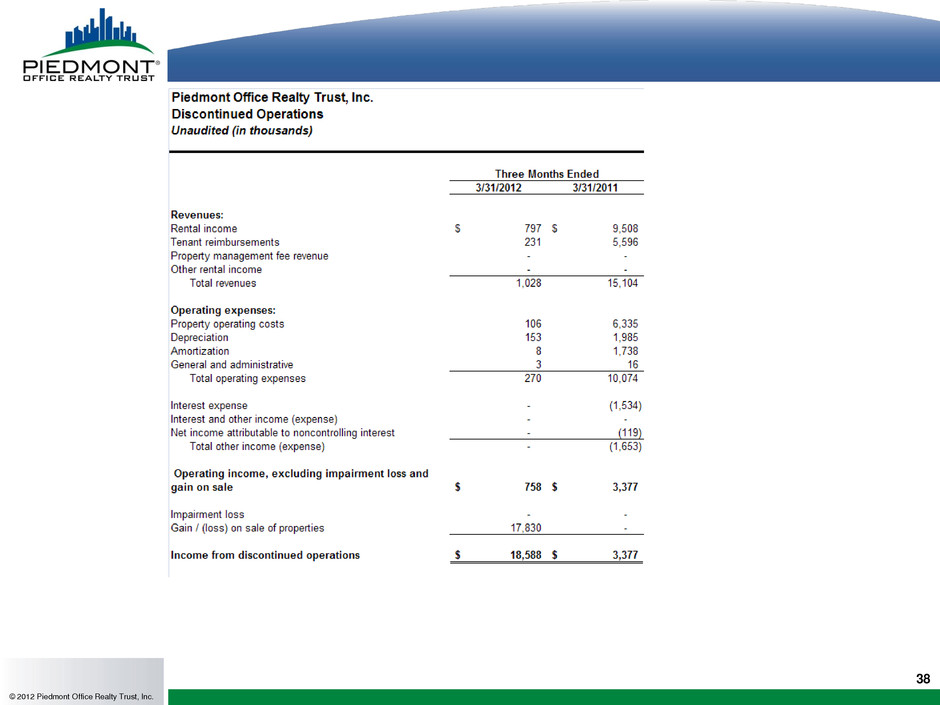
38 © 2012 Piedmont Office Realty Trust, Inc.
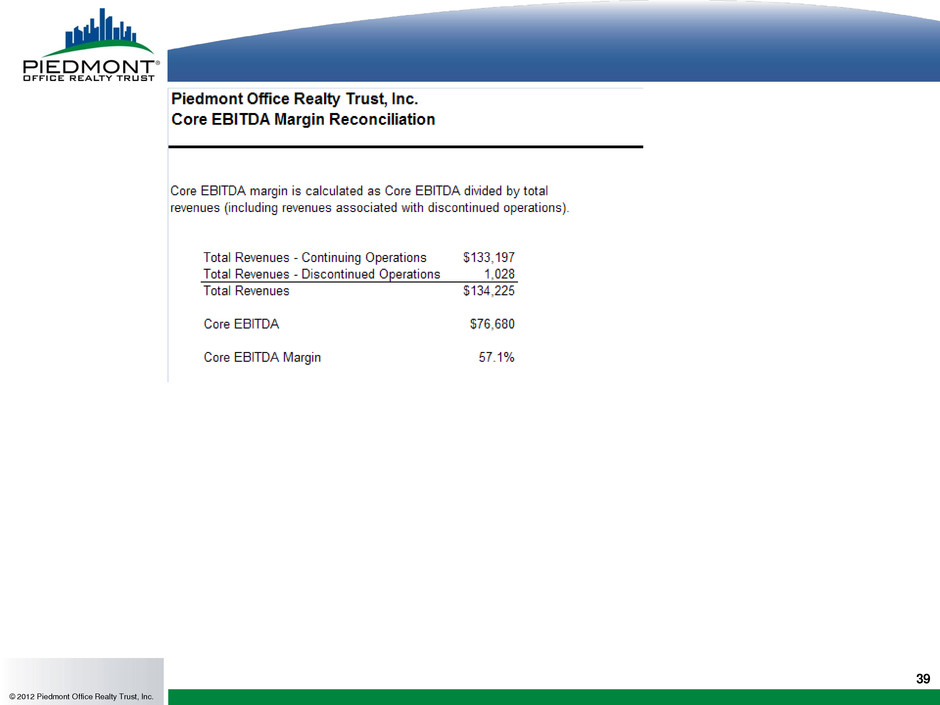
39 © 2012 Piedmont Office Realty Trust, Inc.


