
© 2014 Piedmont Office Realty Trust, Inc. 500 West Monroe One Lincoln Park 1201 Eye Street 60 Broad Street Glenridge Highlands II Chicago Dallas Washington D.C. New York Atlanta November 2014 Strategic Review

Piedmont Office Realty Trust, Inc. (also referred to herein as “Piedmont” or the “Company”) (NYSE: PDM) is a fully-integrated and self- managed real estate investment trust (REIT) specializing in the ownership and management of high-quality Class A office buildings located primarily in some of the largest U.S. office markets. Approximately 90% of the Company’s Annualized Lease Revenue (“ALR”) is generated from properties located in Atlanta, Boston, Chicago, Dallas, Houston, Los Angeles, Minneapolis, New York and Washington, D.C. Approximately 73% of the Company's ALR is from tenants that are investment grade-rated or governmental tenants or large, nationally- recognized companies not requiring investment ratings. The Company is headquartered in Atlanta, GA, with local management offices in each of its major markets. Investment grade-rated by Standard & Poor's (BBB) and Moody's (Baa2), Piedmont has maintained a relatively low leverage strategy throughout its sixteen year operating history. We use market data and industry forecasts and projections throughout this presentation which have been obtained from publicly available industry publications. These sources are believed to be reliable, but the accuracy and completeness of the information are not guaranteed. Certain statements contained in this presentation constitute forward-looking statements which we intend to be covered by the safe-harbor provisions for forward-looking statements contained in Section 27A of the Securities Act of 1933 and Section 21E of the Securities Exchange Act of 1934, as applicable. Such information is subject to certain risks and uncertainties, as well as known and unknown risks, which could cause actual results to differ materially from those projected or anticipated. Therefore, such statements are not intended to be a guarantee of our performance in future periods. Such forward-looking statements can generally be identified by our use of forward-looking terminology such as “may,” “will,” “expect,” “intend,” “anticipate,” “believe,” “continue” or similar words or phrases that are predictions of future events or trends and which do not relate solely to historical matters. Some examples of risk factors that could cause our actual results and expectations to differ materially from those described in our forward-looking statements are detailed in our most recent Annual Report on Form 10-K and other documents we file with the Securities and Exchange Commission. Readers are cautioned not to place undue reliance on these forward- looking statements, which speak only as of the date of this presentation. Unless the context indicates otherwise, the term “properties” as used in this document and the statistical information presented in this document regarding our properties includes our wholly-owned office properties and our office properties owned through consolidated joint ventures, but excludes our interests in one property owned through an unconsolidated joint venture and one out-of-service property as of September 30, 2014. The information and non-GAAP financial terms contained in this presentation do not contain all of the information and definitions that may be important to you and should be read in conjunction with our Annual Report on Form 10-K for the year ended December 31, 2013 and our quarterly reports on Form 10-Q for the periods ended March 31, 2014, June 30, 2014, and September 30, 2014, and our other filings with the Securities and Exchange Commission. Other information important to you may be found in documents that we furnish to the Securities and Exchange Commission, such as our Quarterly Supplemental Information dated as of September 30, 2014. Such documents are available at www.sec.gov and under the heading Investor Relations on our website at www.piedmontreit.com. Introduction (Unless otherwise noted, all the information contained in this presentation is as of September 30, 2014)
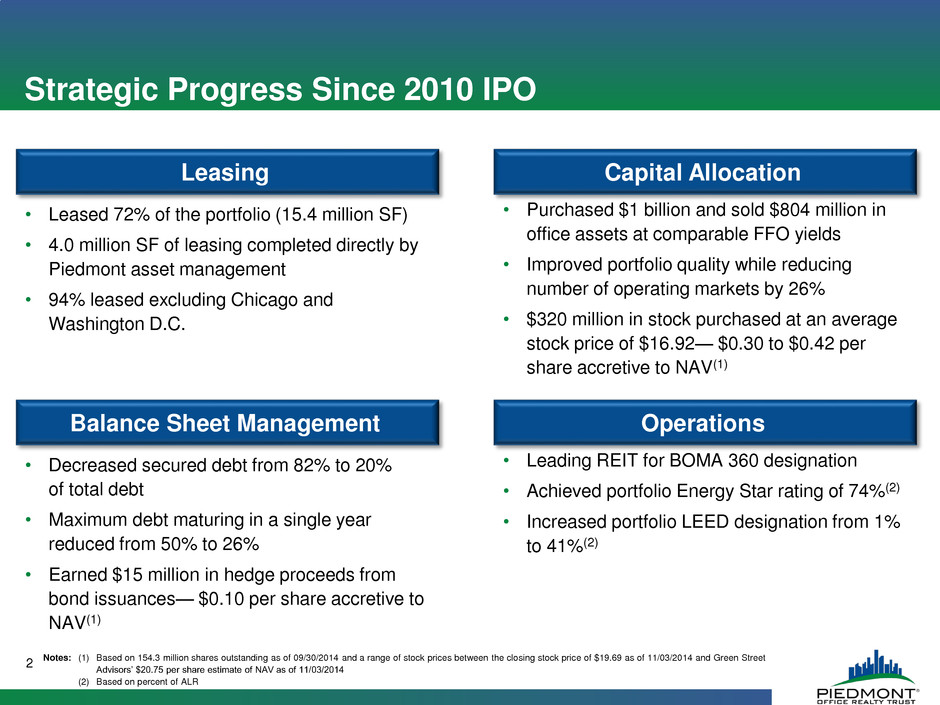
Strategic Progress Since 2010 IPO 2 • Leased 72% of the portfolio (15.4 million SF) • 4.0 million SF of leasing completed directly by Piedmont asset management • 94% leased excluding Chicago and Washington D.C. • Purchased $1 billion and sold $804 million in office assets at comparable FFO yields • Improved portfolio quality while reducing number of operating markets by 26% • $320 million in stock purchased at an average stock price of $16.92— $0.30 to $0.42 per share accretive to NAV(1) Leasing Capital Allocation • Decreased secured debt from 82% to 20% of total debt • Maximum debt maturing in a single year reduced from 50% to 26% • Earned $15 million in hedge proceeds from bond issuances— $0.10 per share accretive to NAV(1) Balance Sheet Management • Leading REIT for BOMA 360 designation • Achieved portfolio Energy Star rating of 74%(2) • Increased portfolio LEED designation from 1% to 41%(2) Operations Notes: (1) Based on 154.3 million shares outstanding as of 09/30/2014 and a range of stock prices between the closing stock price of $19.69 as of 11/03/2014 and Green Street Advisors’ $20.75 per share estimate of NAV as of 11/03/2014 (2) Based on percent of ALR
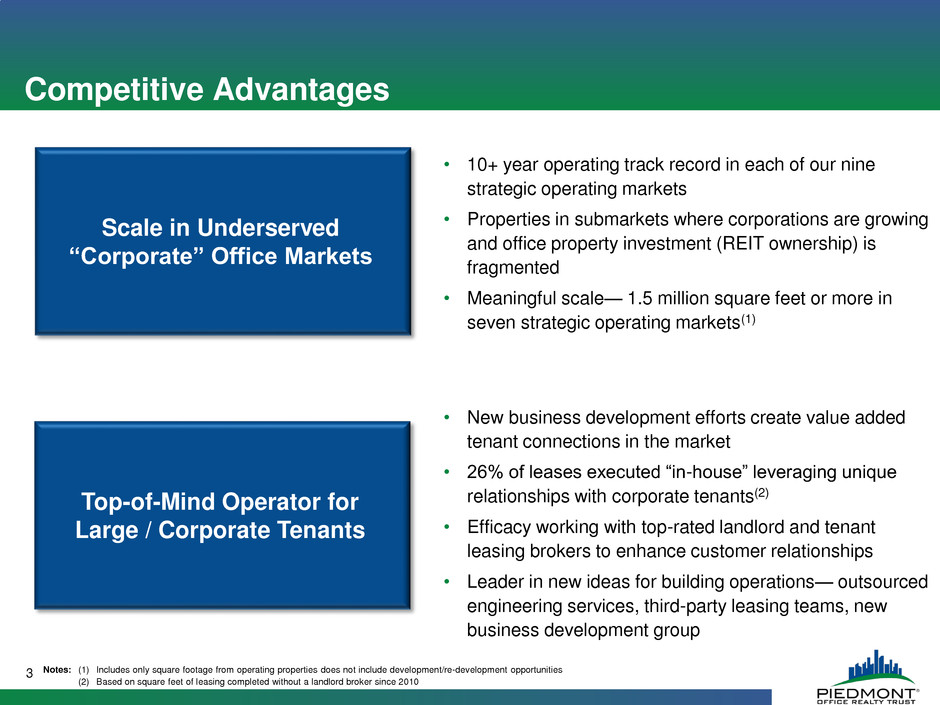
Competitive Advantages 3 Top-of-Mind Operator for Large / Corporate Tenants • 10+ year operating track record in each of our nine strategic operating markets • Properties in submarkets where corporations are growing and office property investment (REIT ownership) is fragmented • Meaningful scale— 1.5 million square feet or more in seven strategic operating markets(1) • New business development efforts create value added tenant connections in the market • 26% of leases executed “in-house” leveraging unique relationships with corporate tenants(2) • Efficacy working with top-rated landlord and tenant leasing brokers to enhance customer relationships • Leader in new ideas for building operations— outsourced engineering services, third-party leasing teams, new business development group Scale in Underserved “Corporate” Office Markets Notes: (1) Includes only square footage from operating properties does not include development/re-development opportunities (2) Based on square feet of leasing completed without a landlord broker since 2010
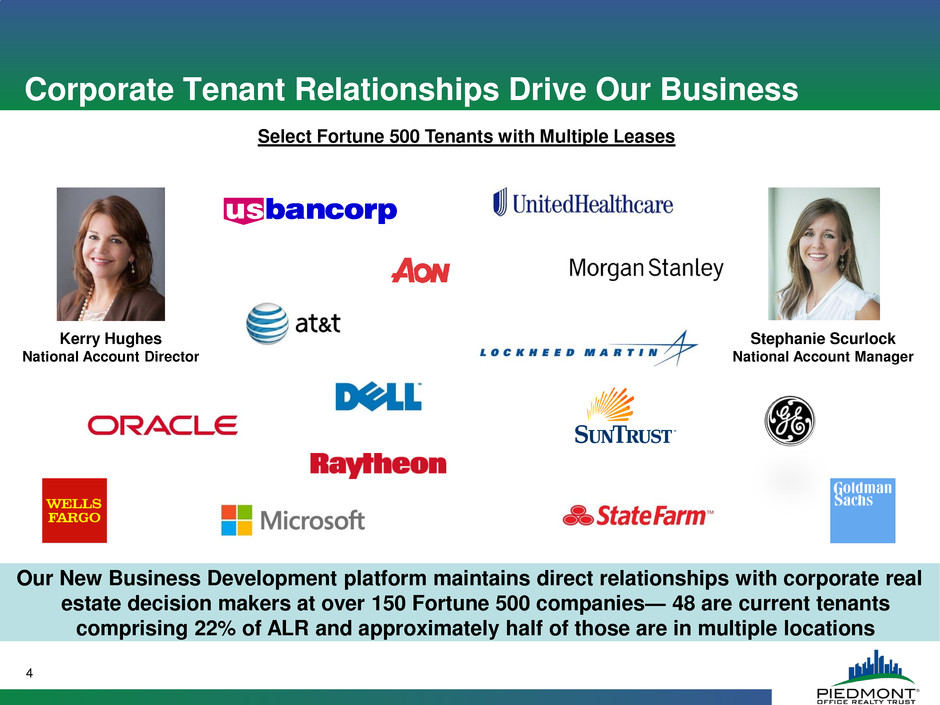
Corporate Tenant Relationships Drive Our Business 4 Our New Business Development platform maintains direct relationships with corporate real estate decision makers at over 150 Fortune 500 companies— 48 are current tenants comprising 22% of ALR and approximately half of those are in multiple locations Stephanie Scurlock National Account Manager Kerry Hughes National Account Director Select Fortune 500 Tenants with Multiple Leases

Investment Philosophies and Strategic Results 5 Reduced secured debt by $706 million Leverage maintained below 38%(2) Upside of Cycle Unwavering focus on basis Stock price influences capital allocation decisions Invest in value-add assets and land on downside of market cycle Invest in core assets and develop on upside of market cycle Balance sheet flexibility to pursue portfolio and strategic opportunities 2011 - 2012 2013 - 2014 Completed nine build-to-suits in our history 18.5% average unlevered IRR Value-add: $ 290 Core: $ 105 Value-add: $ 5 Core: $ 510 $320 million of stock purchased at an average price of $16.92 per share; NAV greater than $20 per share Downside of Cycle Notes: (1) Based on acquisition price of each property and management's estimate of replacement cost for a similar type property in the same market at the date of acquisition (2) Based on debt to gross assets Acquired ~$900 million of properties at greater than 30% discount to replacement cost(1) Investment Type ($ million)

Recent SoCal Corporate Departures • Occidental Petroleum corporate HQ to Texas • Toyota Motor Sales corporate HQ to Texas • Honda North America HQ to Ohio • Chevron moving thousands of jobs to Texas • ThermaSol corporate HQ to Texas • Raytheon’s Space and Airborne Systems HQ to Ohio Chicago Boston New York Metro Washington D.C. Dallas Atlanta Houston 18 Fortune 500 2.6 per MM pop Targeting Corporate America 6 Notes: (1) 2014 economic strength ranking of the 381 metropolitan areas as defined by the federal government. The ranking is based on an area’s economic behavior, considering earnings/standard of living, flow of money coming into the area and the percentage of population enrolled in government assistance programs Fortune 500 Companies and Economic Strength Rankings(1) Los Angeles 17 Fortune 500 4.9 per MM pop Phoenix Economic Strength Rank Out of 381 Markets(1) (3) Washington D.C. (11) Houston (18) Dallas (20) Boston (27) New York Metro (35) Atlanta (51) Chicago (71) Minneapolis (77) Phoenix (102) Los Angeles (117) Orlando 19 Fortune 500 1.5 per MM pop 5 Fortune 500 1.1 per MM pop 28 Fortune 500 4.4 per MM pop 1 Fortune 500 0.4 per MM pop 16 Fortune 500 2.9 MM pop 17 Fortune 500 2.9 per MM pop 69 Fortune 500 3.5 per MM pop 10 Fortune 500 2.1 per MM pop 33 Fortune 500 3.5 per MM pop Minneapolis Orlando

7 Local Market Experts in Our Strategic Operating Markets Mid-Atlantic Midwest Southwest Southeast Bob Wiberg 25 Years Market Experience Bob.Wiberg@piedmontreit.com 202-651-6434 Chicago Boston New York Metro Washington D.C. Dallas Atlanta Houston George Wells 18 Years Market Experience George.Wells@piedmontreit.com 770-418-8606 Joe Pangburn 30 Years Market Experience Joe.Pangburn@piedmontreit.com 214-939-7140 Tom Prescott 29 Years Market Experience Tom.Prescott@piedmontreit.com 312-553-6116 Minneapolis Orlando
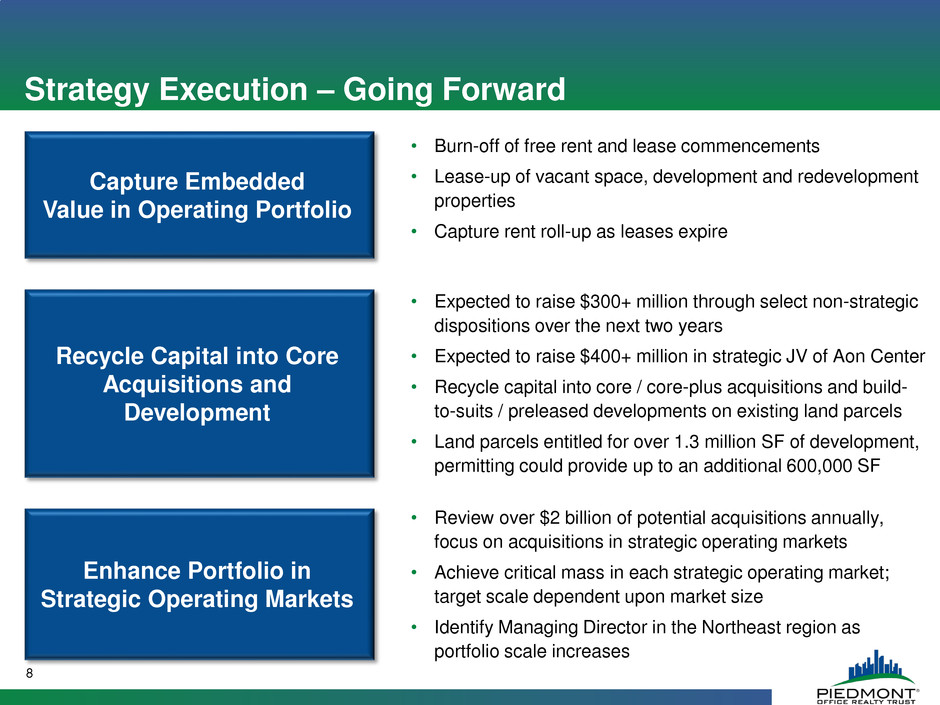
Strategy Execution – Going Forward 8 Recycle Capital into Core Acquisitions and Development Enhance Portfolio in Strategic Operating Markets • Expected to raise $300+ million through select non-strategic dispositions over the next two years • Expected to raise $400+ million in strategic JV of Aon Center • Recycle capital into core / core-plus acquisitions and build- to-suits / preleased developments on existing land parcels • Land parcels entitled for over 1.3 million SF of development, permitting could provide up to an additional 600,000 SF • Review over $2 billion of potential acquisitions annually, focus on acquisitions in strategic operating markets • Achieve critical mass in each strategic operating market; target scale dependent upon market size • Identify Managing Director in the Northeast region as portfolio scale increases Capture Embedded Value in Operating Portfolio • Burn-off of free rent and lease commencements • Lease-up of vacant space, development and redevelopment properties • Capture rent roll-up as leases expire

Piedmont in the REIT Marketplace Competitive Metrics Multiple on Cons. 2015 FFO(2) Multiple on Cons. 2015 AFFO(2) Div. Yield(3) (%) Prem / (Disc) to NAV(4) Weighted Lease Term Remain. (Yrs.) Cumulative Maturities 2015 - 2017 SS NOI Growth 2014 - 2016(4) Median Age Leverage Leased Office % Competitive Set(1) 15.7 23.2 2.7% (2%) 5.4 32% 8% 22 38% 91% PDM 12.1 18.5 4.4% (8%) 7.3 19% 18% 15 38% 88% We believe Piedmont offers investors the best relative value in its competitive set 9 Notes: (1) Competitive Set includes HIW, CUZ, OFC, BDN, KRC, BXP, CXP, PKY, and DEI (2) Based on FactSet consensus 2015 data and closing stock prices as of October 29, 2014 (3) Based on October 29, 2014 closing stock price and most recently announced quarterly dividend, annualized (4) Data sourced from Green Street Advisors Office Sector Update as of August 29, 2014. Competitive set for this metric excludes PKY and CXP because they are not covered by Green Street Advisors

Appendix 10 AON Center Arlington Gateway Chicago Washington D.C. 5 Wall Street One Lincoln Park Dallas Boston 400 TownPark Orlando US Bancorp Center Minneapolis Atlanta 1155 Perimeter Center West

Our Tenants’ Perspectives on the Office Market 11 Leasing Plans for the Next 12 Months 2014 2012 Tenant Utilizing Alternative Workplace Strategies (e.g., virtual work, hoteling, etc.) Reduction in Space Due to Alternative Workplace Strategies Green Building Important to Tenant Importance of Landlord Reputation Space Implication of New Accounting Standards More space Same space Less space 0% - 10% 10% - 20% Over 20% More space Same space Less space Yes Yes Not Important Important Very Important 31% 46% 23% 46% 32% 22% 6% 88% 6% 83% 66% 0% 41% 59% 27% 30% 43% 59% 28% 13% 3% 89% 8% 84% 67% 0% 50% 50%

12 Investment Focus: Atlanta Core Central Perimeter Sources: REIS 2Q 2014, JLL Research 3Q 2014, Bureau of Labor Statistics August 2014 Notes: (1) Represents a two year compound annual growth rate (“CAGR”) using 2014 to 2016 estimates Non-Strategic 8.0% Metro Unemployment 16.1% Class A Vacancy 3.1% 2014 – 2016 Job Growth(1) 788,000 / 80% Under Construction SF / % Preleased 2.9 Fortune 500 HQs per Million of Population Target Submarket Performance Submarket Class A Vacancy Rent Growth LTM Next 24 Months(1) Buckhead 15.6% 2.1% 5.8% Central Perimeter 11.5% 2.1% 5.5% Land Parcel Buckhead Bold/Italics denotes acquisition in past 24 months Property Overview Property SF % Leased Ce n tr al P e ri m e te r Glenridge Highlands Two 427,000 97.9% 1155 Perimeter Center West 377,000 100.0% The Dupree 138,000 100.0% Land – Glenridge Highlands Three N/A N/A B u ckhea d The Medici 156,000 83.3% Land – The Gavitello N/A N/A N o n S tr a t Suwanee Gateway One 142,000 0.0% 3750 Brookside Parkway 105,000 91.4% 11695 Johns Creek Parkway 101,000 87.1%

13 Investment Focus: Boston Core Sources: REIS 2Q 2014, JLL Research 3Q 2014, Bureau of Labor Statistics August 2014 Notes: (1) Represents a two year compound annual growth rate (“CAGR”) using 2014 to 2016 estimates Non-Strategic 5.5% Metro Unemployment 11.9% Class A Vacancy 2.2% 2014 – 2016 Job Growth(1) 2,250,000 / 76% Under Construction SF / % Preleased 2.1 Fortune 500 HQs per Million of Population Target Submarket Performance Submarket Class A Vacancy Rent Growth LTM Next 24 Months(1) Cambridge 5.8% 5.3% 3.7% Route 128 North 4.5% 4.0% 5.8% Property Overview Property SF % Leased R o u te 12 8 N o rt h 5 & 15 Wayside Road 271,000 100.0% 235 Presidential Way 238,000 100.0% 225 Presidential Way 202,000 100.0% 5 Wall Street 182,000 100.0% Ca m b ri d g e One Brattle Square 95,000 100.0% 1414 Massachusetts Avenue 78,000 100.0% N o n S tr a t 1200 Crown Colony Drive 235,000 100.0% 90 Central Street 175,000 100.0% Cambridge Route 128 North Bold/Italics denotes acquisition in past 24 months
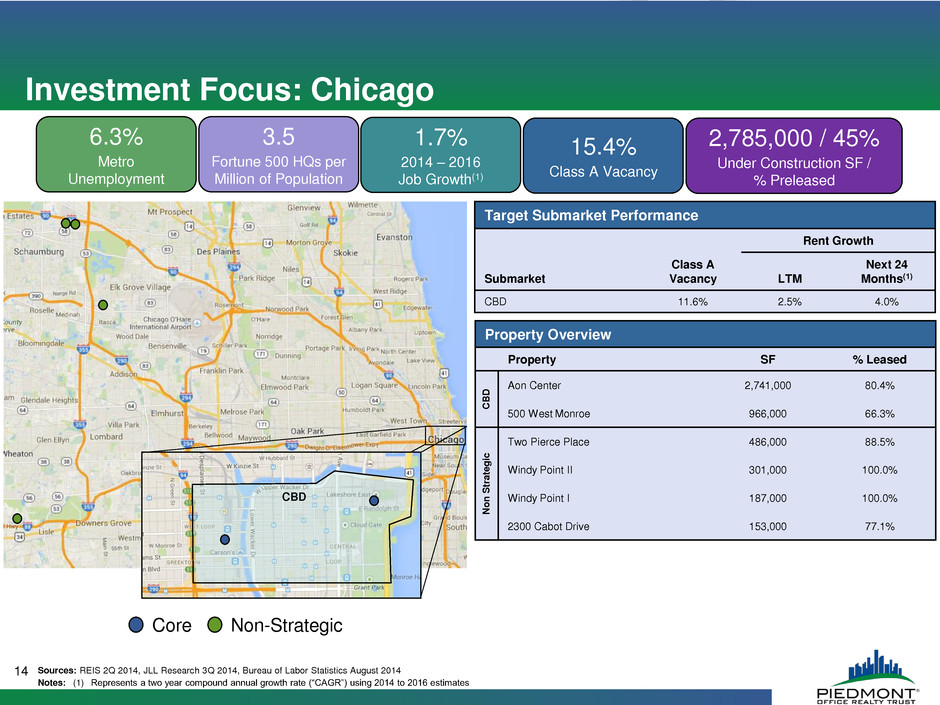
Property Overview Property SF % Leased C B D Aon Center 2,741,000 80.4% 500 West Monroe 966,000 66.3% N o n S tr a te g ic Two Pierce Place 486,000 88.5% Windy Point II 301,000 100.0% Windy Point I 187,000 100.0% 2300 Cabot Drive 153,000 77.1% Target Submarket Performance Submarket Class A Vacancy Rent Growth LTM Next 24 Months(1) CBD 11.6% 2.5% 4.0% 14 Investment Focus: Chicago Core Sources: REIS 2Q 2014, JLL Research 3Q 2014, Bureau of Labor Statistics August 2014 Notes: (1) Represents a two year compound annual growth rate (“CAGR”) using 2014 to 2016 estimates Non-Strategic 6.3% Metro Unemployment 15.4% Class A Vacancy 1.7% 2014 – 2016 Job Growth(1) 2,785,000 / 45% Under Construction SF / % Preleased 3.5 Fortune 500 HQs per Million of Population CBD

Property Overview Property SF % Leased L as C o li n a s 6011/6021/6031 Connection Drive 606,000 100.0% Las Colinas Corporate Center I & II 387,000 99.2% 6565 North MacArthur 260,000 92.7% 161 Corporate Center 105,000 99.0% Land – Royal Lane N/A N/A Land – State Highway 161 N/A N/A P C One Lincoln Park 262,000 90.8% N o n S tr a t 5601 Headquarters Drive 166,000 100.0% 3900 Dallas Parkway 120,000 100.0% Target Submarket Performance Submarket Class A Vacancy Rent Growth LTM Next 24 Months(1) Las Colinas (Irving) 15.4% 5.2% 3.7% Preston Center 7.6% 3.4% 4.3% 15 Core Sources: REIS 2Q 2014, JLL Research 3Q 2014, Bureau of Labor Statistics August 2014 Notes: (1) Represents a two year compound annual growth rate (“CAGR”) using 2014 to 2016 estimates Non-Strategic 5.5% Metro Unemployment 17.0% Class A Vacancy 3.8% 2014 – 2016 Job Growth(1) 4,679,000 / 63% Under Construction SF / % Preleased 2.6 Fortune 500 HQs per Million of Population Land Parcel PC: Preston Center Bold/Italics denotes acquisition in past 24 months Las Colinas Preston Center Investment Focus: Dallas

Property Overview Property SF % Leased E n e rg y C o rr id o r 1430 Enclave Parkway 313,000 100.0% Development – Enclave Place Summer 2015 Estimated Delivery 302,000 N/A Target Submarket Performance Submarket Class A Vacancy Rent Growth LTM Next 24 Months(1) Energy Corridor 4.2% 4.9% 6.1% 16 Investment Focus: Houston Core Sources: REIS 2Q 2014, JLL Research 3Q 2014, Bureau of Labor Statistics August 2014 Notes: (1) Represents a two year compound annual growth rate (“CAGR”) using 2014 to 2016 estimates 5.4% Metro Unemployment 10.8% Class A Vacancy 3.6% 2014 – 2016 Job Growth(1) 15,636,000 / 58% Under Construction SF / % Preleased 4.3 Fortune 500 HQs per Million of Population East Loop Energy Corridor
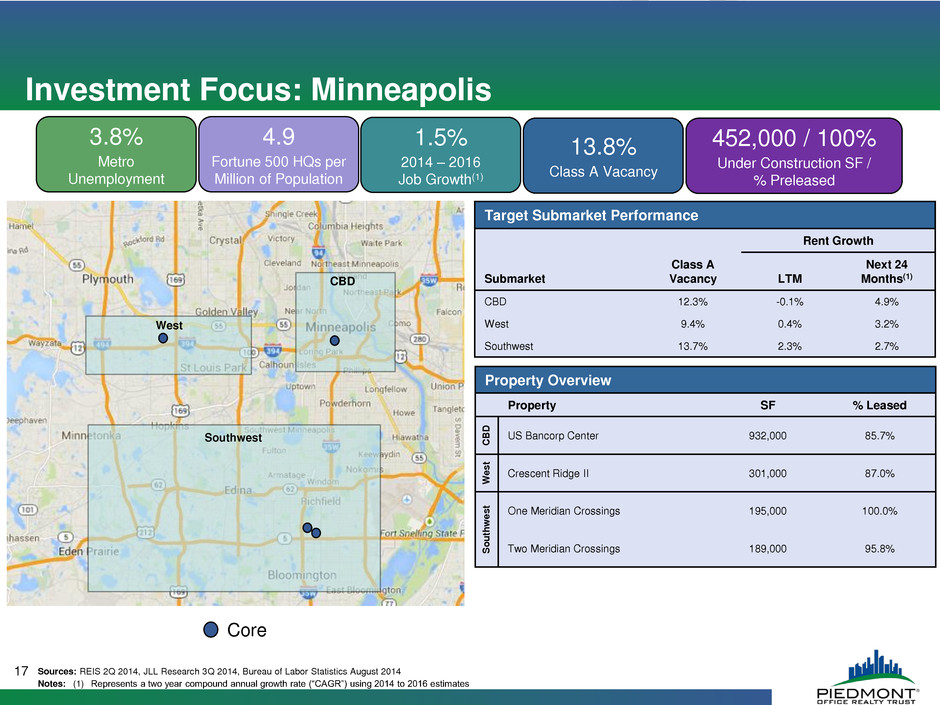
Property Overview Property SF % Leased C B D US Bancorp Center 932,000 85.7% W es t Crescent Ridge II 301,000 87.0% S o u th w es t One Meridian Crossings 195,000 100.0% Two Meridian Crossings 189,000 95.8% Target Submarket Performance Submarket Class A Vacancy Rent Growth LTM Next 24 Months(1) CBD 12.3% -0.1% 4.9% West 9.4% 0.4% 3.2% Southwest 13.7% 2.3% 2.7% 17 Investment Focus: Minneapolis Core Sources: REIS 2Q 2014, JLL Research 3Q 2014, Bureau of Labor Statistics August 2014 Notes: (1) Represents a two year compound annual growth rate (“CAGR”) using 2014 to 2016 estimates 3.8% Metro Unemployment 13.8% Class A Vacancy 1.5% 2014 – 2016 Job Growth(1) 452,000 / 100% Under Construction SF / % Preleased 4.9 Fortune 500 HQs per Million of Population CBD Southwest West

Property Overview Property SF % Leased D o w n to w n 60 Broad Street 1,028,000 98.1% NJ N o d e s 200 Bridgewater Crossing 309,000 93.9% 400 Bridgewater Crossing 299,000 100.0% N o n S tr a te g ic 2 Gatehall Drive 405,000 100.0% Copper Ridge Center 268,000 86.6% 600 Corporate Drive 125,000 100.0% Target Submarket Performance Submarket Class A Vacancy Rent Growth LTM Next 24 Months(1) Downtown 10.1% 8.0% 6.3% Midtown 8.8% 3.8% 4.9% NJ Nodes 15.8% 2.2% 3.9% 18 Investment Focus: New York Metro Core Sources: REIS 2Q 2014, JLL Research 3Q 2014, Bureau of Labor Statistics August 2014 Notes: (1) Represents a two year compound annual growth rate (“CAGR”) using 2014 to 2016 estimates Non-Strategic 6.3% Metro Unemployment 8.8% Class A Vacancy 2.1% 2014 – 2016 Job Growth(1) 5,425,000 / 58% Under Construction SF / % Preleased 3.5 Fortune 500 HQs per Million of Population Midtown Downtown NJ Nodes

Property Overview Property SF % Leased L ak e M a ry 400 TownPark 176,000 93.2% Land – Lake Mary(3) N/A N/A Target Submarket Performance Submarket Class A Vacancy Rent Growth LTM Next 24 Months(1) Lake Mary 10.2%(2) 1.7% 2.5% 19 Investment Focus: Orlando Core Sources: REIS 2Q 2014, JLL Research 3Q 2014, Bureau of Labor Statistics August 2014 Notes: (1) Represents a two year compound annual growth rate (“CAGR”) using 2014 to 2016 estimates (2) Represents vacancy for TownPark, the location of Piedmont’s properties; broader Lake Mary area class-A vacancy rate is 22.1% (3) Lake Mary land is under contract and is scheduled to close in 4Q 2014 6.3% Metro Unemployment 17.1% Class A Vacancy 3.0% 2014 – 2016 Job Growth(1) 30,000 / 80% Under Construction SF / % Preleased 0.4 Fortune 500 HQs per Million of Population Lake Mary Bold/Italics denotes acquisition in past 24 months Land Parcel

20 Investment Focus: Washington DC Core Sources: REIS 2Q 2014, JLL Research 3Q 2014, Bureau of Labor Statistics August 2014 Notes: (1) Represents a two year compound annual growth rate (“CAGR”) using 2014 to 2016 estimates Non-Strategic 5.6% Metro Unemployment 15.8% Class A Vacancy 2.3% 2014 – 2016 Job Growth(1) 4,620,000 / 57% Under Construction SF / % Preleased 2.9 Fortune 500 HQs per Million of Population Target Submarket Performance Submarket Class A Vacancy Rent Growth LTM Next 24 Months(1) District 11.7% 1.6% 3.9% Rosslyn / Ballston 19.5% -0.6% 2.9% Bethesda 21.1% 1.0% 4.0% Bold denotes acquisition in past 24 months Property Overview Property SF % Leased Dis tr ic t One & Two Independence Square 940,000 64.6% 1201 & 1225 Eye Street 494,000 78.1% 400 Virginia Ave 224,000 87.1% R o ss ly n Ball s to n Arlington Gateway 324,000 96.3% 4250 North Fairfax 305,000 36.7% Redevelopment – 3100 Clarendon 250,000 N/A Be th - esd a Piedmont Pointe I & II 409,000 63.3% N o n S tr a t 9200, 9211, and 9221 Corporate Blvd 339,000 50.0% Bold/Italics denotes acquisition in past 24 months Bethesda District