EXHIBIT 99.2
Quarterly Supplemental Information
March 31, 2018
|
| | |
| Corporate Headquarters | Institutional Analyst Contact | Investor Relations |
| 5565 Glenridge Connector, Suite 450 | Telephone: 770.418.8592 | Telephone: 866.354.3485 |
| Atlanta, GA 30342 | research.analysts@piedmontreit.com | investor.services@piedmontreit.com |
| Telephone: 770.418.8800 | | www.piedmontreit.com |
Piedmont Office Realty Trust, Inc.
Quarterly Supplemental Information
Index
|
| | | | |
| | Page | | | Page |
| | | | | |
| Introduction | | | Other Investments | |
| Corporate Data | | | Other Investments Detail | |
| Investor Information | | | Supporting Information | |
| Financial Highlights | | | Definitions | |
| Financials | | | Research Coverage | |
| Balance Sheets | | | Non-GAAP Reconciliations & Other Detail | |
| Income Statements | | | Property Detail - In-Service Portfolio | |
| Key Performance Indicators | | | Risks, Uncertainties and Limitations | |
| Funds From Operations / Adjusted Funds From Operations | | | | |
| Same Store Analysis | | | | |
| Capitalization Analysis | | | | |
| Debt Summary | | | | |
| Debt Detail | | | | |
| Debt Covenant & Ratio Analysis | | | | |
| Operational & Portfolio Information - Office Investments | | | | |
| Tenant Diversification | | | | |
| Tenant Credit Rating & Lease Distribution Information | | | | |
| Leased Percentage Information | | | | |
| Rental Rate Roll Up / Roll Down Analysis | | | | |
| Lease Expiration Schedule | | | | |
| Quarterly Lease Expirations | | | | |
| Annual Lease Expirations | | | | |
| Capital Expenditures & Commitments | | | | |
| Contractual Tenant Improvements & Leasing Commissions | | | | |
| Geographic Diversification | | | | |
| Geographic Diversification by Location Type | | | | |
| Industry Diversification | | | | |
| Property Investment Activity | | | | |
|
|
| Notice to Readers: |
Please refer to page 47 for a discussion of important risks related to the business of Piedmont Office Realty Trust, Inc., as well as an investment in its securities, including risks that could cause actual results and events to differ materially from results and events referred to in the forward-looking information. Considering these risks, uncertainties, assumptions, and limitations, the forward-looking statements about leasing, financial operations, leasing prospects, etc. contained in this quarterly supplemental information report may differ from actual results. |
| Certain prior period amounts have been reclassified to conform to the current period financial statement presentation. In addition, many of the schedules herein contain rounding to the nearest thousands or millions and, therefore, the schedules may not total due to this rounding convention. |
To supplement the presentation of the Company’s financial results prepared in accordance with U.S. generally accepted accounting principles (GAAP), this report contains certain financial measures that are not prepared in accordance with GAAP, including FFO, Core FFO, AFFO, Same Store NOI, Property NOI, EBITDAre and Core EBITDA. Definitions and reconciliations of these non-GAAP measures to their most comparable GAAP metrics are included beginning on page 39. Each of the non-GAAP measures included in this report has limitations as an analytical tool and should not be considered in isolation or as a substitute for an analysis of the Company’s results calculated in accordance with GAAP. In addition, because not all companies use identical calculations, the Company’s presentation of non-GAAP measures in this report may not be comparable to similarly titled measures disclosed by other companies, including other REITs. The Company may also change the calculation of any of the non-GAAP measures included in this report from time to time in light of its then existing operations to include other adjustments that may affect its operations.
|
In certain presentations herein, the Company has provided disaggregated financial and operational data (for example, some pieces of information are displayed by geography, industry, or lease expiration year) for informational purposes for readers; however, regardless of the various presentation approaches taken herein, we continue to evaluate and utilize our consolidated financial results in making operating decisions, allocating resources, and assessing our performance.
|
Piedmont Office Realty Trust, Inc.
Corporate Data
Piedmont Office Realty Trust, Inc. (also referred to herein as "Piedmont" or the "Company") (NYSE: PDM) is an owner, manager, developer, and operator of high-quality, Class A office properties in select sub-markets located primarily within eight major Eastern U.S. office markets. Its geographically-diversified, almost $5 billion portfolio is comprised of approximately
17 million square feet (as of the date of release of this report). The Company is a fully-integrated, self-managed real estate investment trust ("REIT") with local management offices in each of its major markets and is investment-grade rated by Standard & Poor’s and Moody’s. Piedmont is headquartered in Atlanta, GA.
This data supplements the information provided in our reports filed with the Securities and Exchange Commission and should be reviewed in conjunction with such filings.
|
| | | | | |
| | | | |
| | As of | | As of |
| | March 31, 2018 | | December 31, 2017 |
Number of consolidated office properties (1) | 53 | | 67 |
Rentable square footage (in thousands) (1) | 16,172 | | 19,061 |
Percent leased (2) | 91.3 | % | | 89.7 | % |
| Capitalization (in thousands): | | | |
| Total debt - principal amount outstanding (excludes premiums, discounts, and deferred financing costs) | $1,697,434 | | $1,733,670 |
Equity market capitalization (3) | $2,287,138 | | $2,791,659 |
Total market capitalization (3) | $3,984,572 | | $4,525,329 |
Total debt / Total market capitalization (3) | 42.6 | % | | 38.3 | % |
| Average net debt to Core EBITDA | 5.4 x |
| | 5.6 x |
|
| Total debt / Total gross assets | 37.5 | % | | 34.3 | % |
| Common stock data: | | | |
| High closing price during quarter | $19.86 | | $20.40 |
| Low closing price during quarter | $16.78 | | $19.21 |
| Closing price of common stock at period end | $17.59 | | $19.61 |
| Weighted average fully diluted shares outstanding during quarter (in thousands) | 136,183 | | 144,503 |
| Shares of common stock issued and outstanding at period end (in thousands) | 130,025 | | 142,359 |
Annual regular dividend per share (4) | $0.84 | | $0.84 |
| Annual special dividend per share | NA |
| | $0.50 |
| Rating / Outlook | | | |
| Standard & Poor's | BBB / Stable |
| | BBB / Stable |
|
| Moody's | Baa2 / Stable |
| | Baa2 / Stable |
|
| Employees | 131 | | 136 |
|
| |
| (1) | As of March 31, 2018, our consolidated office portfolio consisted of 53 properties (exclusive of one property that was taken out of service for redevelopment on January 1, 2018, Two Pierce Place in Itasca, IL), whereas it consisted of 67 properties at December 31, 2017. During the first quarter of 2018, the Company sold a 14-property portfolio consisting of 2.6 million square feet (additional details about which can be found on page 37), and we acquired 501 West Church Street, a 182,000 square foot office building located in Orlando, FL. |
| (2) | Calculated as square footage associated with commenced leases plus square footage associated with executed but uncommenced leases for vacant spaces, divided by total rentable square footage, all as of the relevant date, expressed as a percentage. This measure is presented for our consolidated office properties and, as of January 1, 2018, excludes one out of service property. Please refer to page 27 for additional analyses regarding Piedmont's leased percentage. |
| (3) | Reflects common stock closing price, shares outstanding and outstanding debt as of the end of the reporting period, as appropriate. |
| (4) | Total of the per share regular dividends declared over the prior four quarters. |
Piedmont Office Realty Trust, Inc.
Investor Information
|
|
| Corporate |
| 5565 Glenridge Connector, Suite 450 |
| Atlanta, Georgia 30342 |
| 770.418.8800 |
| www.piedmontreit.com |
|
| | | |
| Executive Management |
| | | | |
| Donald A. Miller, CFA | Robert E. Bowers | C. Brent Smith | Edward H. Guilbert, III |
| Chief Executive Officer, President | Chief Financial Officer and Executive | Chief Investment Officer and Executive | Senior Vice President, Finance and |
| and Director | Vice President | Vice President, Northeast Region | Treasurer - Investor Relations Contact |
| | | | |
| | | | |
| Christopher A. Kollme | Laura P. Moon | Joseph H. Pangburn | Thomas R. Prescott |
| Executive Vice President, | Chief Accounting Officer and | Executive Vice President, | Executive Vice President, |
| Finance & Strategy | Senior Vice President | Southwest Region | Midwest Region |
| | | | |
| | | | |
| Carroll A. Reddic, IV | George Wells | Robert K. Wiberg | |
| Executive Vice President, | Executive Vice President, | Executive Vice President, | |
| Real Estate Operations and Assistant | Southeast Region | Mid-Atlantic Region and | |
| Secretary | | Head of Development | |
| | | | |
| Board of Directors |
| | | | |
| Frank C. McDowell | Dale H. Taysom | Kelly H. Barrett | Wesley E. Cantrell |
| Director, Chairman of the | Director and Vice Chairman of the | Director, Member of Audit and | Director and Chairman of |
| Board of Directors and Chairman | Board of Directors | Governance Committees | Governance Committee |
| of Compensation Committee | | | |
| | | | |
| Barbara B. Lang | Donald A. Miller, CFA | Raymond G. Milnes, Jr. | Jeffery L. Swope |
| Director, Member of Compensation and | Chief Executive Officer, President | Director and Chairman of | Director and Chairman of |
| Governance Committees | and Director | Audit Committee | Capital Committee |
| | | | |
| | | | |
| | | | |
| | | | |
| | | | |
|
| |
| Transfer Agent | Corporate Counsel |
| | |
| Computershare | King & Spalding |
| P.O. Box 30170 | 1180 Peachtree Street, NE |
| College Station, TX 77842-3170 | Atlanta, GA 30309 |
| Phone: 866.354.3485 | Phone: 404.572.4600 |
Piedmont Office Realty Trust, Inc.
Financial Highlights
As of March 31, 2018
Financial Results (1)
Net income attributable to Piedmont for the quarter ended March 31, 2018 was $57.8 million, or $0.42 per share (diluted), compared to $15.1 million, or $0.10 per share (diluted), for the same quarter in 2017. The increase in net income attributable to Piedmont during the three months ended March 31, 2018 when compared to the same period in 2017 was primarily related to gains on sale recognized at the closing of a 14-property portfolio sale on January 4, 2018.
Funds from operations (FFO) for the quarter ended March 31, 2018 was $56.3 million, or $0.41 per share (diluted), compared to $66.2 million, or $0.45 per share (diluted), for the same quarter in 2017. The decrease in FFO for the three months ended March 31, 2018 when compared to the same period in 2017 was primarily attributable to net disposition activity completed over the past twelve months amounting to approximately $760 million, including the sales of Two Independence Square in Washington, D.C., in July 2017 and a 14-property portfolio in January 2018.
Core funds from operations (Core FFO) for the quarter ended March 31, 2018 was $58.0 million, or $0.43 per share (diluted), compared to $66.2 million, or $0.45 per share (diluted), for the same quarter in 2017. The decrease in Core FFO for the three months ended March 31, 2018 when compared to the same period in 2017 was primarily attributable to the net disposition activity described above for changes in FFO.
Adjusted funds from operations (AFFO) for the quarter ended March 31, 2018 was $45.8 million, compared to $54.1 million for the same quarter in 2017. The decrease in AFFO for the three months ended March 31, 2018 when compared to the same period in 2017 was primarily due to the net disposition activity described above for changes in FFO and Core FFO.
Operations and Leasing
Within its portfolio, Piedmont has 53 office properties located primarily in eight major office markets in the eastern portion of the United States and one re-development property. The Company's redevelopment property is Two Pierce Place, a 486,000 square foot office property located in the Chicago market. Due to its redevelopment status, this property is excluded from Piedmont's in-service operating portfolio for the purposes of statistical reporting throughout this supplemental report. For additional information regarding this redevelopment project, please refer to page 38 of this report.
On a square footage leased basis, our total in-service office portfolio was 91.3% leased as of March 31, 2018, as compared to 89.7% in the prior quarter and 91.5% a year earlier. Please refer to page 27 for additional leased percentage information. The increase in overall leased percentage is primarily attributable to the change in office property population due to the sale of a 14-property portfolio on January 4, 2018.
The weighted average remaining lease term of our in-service portfolio was 6.7 years(2) as of March 31, 2018 as compared to 6.5 years at December 31, 2017.
|
| |
| (1) | FFO, Core FFO and AFFO are supplemental non-GAAP financial measures. See page 39 for definitions of these non-GAAP financial measures, and pages 15 and 41 for reconciliations of FFO, Core FFO and AFFO to Net Income. |
| (2) | Remaining lease term (after taking into account leases for vacant spaces which had been executed but not commenced as of March 31, 2018) is weighted based on Annualized Lease Revenue, as defined on page 39. |
During the three months ended March 31, 2018, the Company completed 341,191 square feet of total leasing. Of the total leasing activity completed during the quarter, we signed new tenant leases for 148,995 square feet and renewal leases for 192,196 square feet. The average committed capital cost per square foot per year of lease term for all leasing activity completed during the period (net of commitment expirations during the period) was $2.84 (see page 33).
During the three months ended March 31, 2018, we executed nine leases greater than 10,000 square feet with lengths of term of more than one year at our consolidated office properties. Information on those leases is set forth below. |
| | | | | |
| Tenant | Property | Property Location | Square Feet Leased | Expiration Year | Lease Type |
| Holland & Knight, LLP | SunTrust Center | Orlando, FL | 50,655 | 2024 | Renewal |
| Amneal Pharmaceuticals, LLC | 400 Bridgewater Crossing | Bridgewater, NJ | 40,110 | 2024 | Expansion |
| Smithsonian Institution | 5 & 15 Wayside Road | Burlington, MA | 33,165 | 2028 | New |
| Robinhood Markets, Inc. | 500 TownPark | Lake Mary, FL | 27,999 | 2026 | Renewal / Expansion |
| Rule Joy Trammell + Rubio, LLC | Galleria 300 | Atlanta, GA | 22,806 | 2030 | Renewal |
| Cumberland Group, LLC | Galleria 300 | Atlanta, GA | 18,502 | 2026 | Renewal / Expansion |
| Wiss, Janney, Elstner Associates, Inc. | Las Colinas Corporate Center II | Irving, TX | 13,250 | 2024 | Renewal / Expansion |
| Marcum, LLP | 500 West Monroe Street | Chicago, IL | 11,967 | 2023 | New |
| CK Galleria Associates, LLC | Galleria 300 | Atlanta, GA | 11,962 | 2023 | Renewal |
At the end of the first quarter of 2018, there were two tenants whose leases individually contributed greater than 1% in Annualized Lease Revenue expiring during the eighteen month period following March 31, 2018. Information regarding the leasing status of the spaces associated with these tenants' leases is presented below.
|
| | | | | | |
| Tenant | Property | Property Location | Net Square Footage Expiring | Net Percentage of Current Quarter Annualized Lease Revenue Expiring (%) | Expiration | Current Leasing Status |
| Technip | 1430 Enclave Parkway | Houston, TX | 149,983 | 1.1% | Q4 2018 | The space is actively being marketed for lease. Approximately 40% of Technip's space is currently occupied (under a sublease) by the same tenant leasing the remaining approximately 163,000 square feet in the building. The Company is in discussions with that tenant to take the sublease space on a long-term basis. |
| State of New York | 60 Broad Street | New York, NY | 480,708 | 5.1% | Q1 2019 | The Company is in discussions with the tenant regarding a potential renewal of the lease. |
Future Lease Commencements and Abatements
As of March 31, 2018, our overall leased percentage was 91.3% and our economic leased percentage was 85.9%. The difference between overall leased percentage and economic leased percentage is attributable to two factors:
| |
| 1) | leases which have been contractually entered into for currently vacant spaces but have not yet commenced (amounting to 322,808 square feet of leases as of March 31, 2018, or 2.0% of the office portfolio); and |
| |
| 2) | leases which have commenced but are within rental abatement periods (amounting to 733,767 square feet of leases as of March 31, 2018, or a 3.4% impact to leased percentage on an economic basis). |
As anticipated and previously communicated, this gap continued to narrow after the end of the fourth quarter of 2017, primarily attributable to the burn off of several large abatements after December 31, 2017 and the removal of components related to the 14-property disposition. The gap between reported leased percentage and economic leased percentage has narrowed from a high of almost 13% in 2014 to its current level and is expected to generally remain around 5% in the future. This gap, however, will fluctuate over time as (1) new leases are signed for vacant spaces, (2) abatements associated with existing or newly executed leases commence and expire (see page 7 for more detail on existing large leases with abatements), and/or (3) properties are bought and sold.
Piedmont has leases with many large corporate office space users. The average size of lease in the Company's portfolio is approximately 20,000 square feet. Due to the large size and length of term of new leases, Piedmont typically signs leases several months in advance of their anticipated lease commencement dates. Presented below is a schedule of uncommenced leases greater than 50,000 square feet and their anticipated commencement dates. Lease renewals are excluded from this schedule.
|
| | | | | | |
| Tenant | Property | Property Location | Square Feet Leased | Space Status | Estimated Commencement Date | New / Expansion |
United States of America (Social Security Administration Commissioner) | One Independence Square | Washington, DC | 52,720 | Vacant | Q3 2018 (1) | New |
| US Bancorp | US Bancorp Center | Minneapolis, MN | 51,280 | Vacant | Q2 2018 | Expansion |
International Food Policy Research Institute (2) | 1201 Eye Street | Washington, DC | 56,461 | Vacant | Q2 2018 | New |
| Gartner, Inc. | 6011 Connection Drive | Irving, TX | 152,086 | Not Vacant | Q3 2018 (98,134 SF)(3) Q3 2019 (27,198 SF) Q3 2020 (26,754 SF) | New |
| salesforce.com (formerly Demandware, Inc.) | 5 Wall Street | Burlington, MA | 127,408 | Not Vacant | Q4 2019 (75,495 SF) Q3 2021 (51,913 SF) | New |
| Children's Hospital Los Angeles | 800 North Brand Boulevard | Glendale, CA | 50,285 | Not Vacant | Q2 2021 | New |
New leases frequently provide rental abatement concessions to tenants and these abatements typically occur at the beginning of the leases. The Company's currently reported cash net operating income and AFFO are negatively impacted by new leases with abatements. Presented below are two schedules related to abatements. The first is a schedule of leases with abatements of 50,000 square feet or greater that expired during the first quarter of 2018, and the second is a schedule of leases with abatements of 50,000 square feet or greater that are either currently under abatement or will be so within the next twelve months.
Abatements Expired During Quarter
|
| | | | | | |
| Tenant | Property | Property Location | Abated Square Feet | Lease Commencement Date | Abatement Schedule | Lease Expiration |
| Applied Predictive Technologies, Inc. | 4250 North Fairfax Drive | Arlington, VA | 87,786 | Q2 2017 | June 2017 through February 2018
| Q2 2028 |
| Mitsubishi Hitachi Power Systems | 400 TownPark | Lake Mary, FL | 75,321 | Q1 2015 | February and March 2018 | Q1 2026 |
Current / Future Abatements
|
| | | | | | |
| Tenant | Property | Property Location | Abated Square Feet | Lease Commencement Date | Remaining Abatement Schedule | Lease Expiration |
| RaceTrac Petroleum, Inc. | Galleria 200 | Atlanta, GA | 133,707 | Q4 2016 | July 2017 through May 2018 | Q3 2032 |
| Applied Predictive Technologies, Inc. | 4250 North Fairfax Drive | Arlington, VA | 102,324 | Q2 2017 | March through May 2018 | Q2 2028 |
| US Bancorp | US Bancorp Center | Minneapolis, MN | 51,280 | Q2 2018 | April through June 2018 | Q2 2024 |
| International Food Policy Research Institute | 1201 Eye Street | Washington, DC | 101,937 | Q2 2017 | May 2018 through April 2019 | Q2 2029 |
United States of America (Social Security Administration Commissioner) | One Independence Square | Washington, DC | 52,720 | Q3 2018 (1) | July 2018 through June 2019 | Q2 2028 |
| Gartner, Inc. | 6011 Connection Drive | Irving, TX | 98,134 | Q3 2018 | September 2018 through June 2019 | Q2 2034 |
| Norris, McLaughlin & Marcus | 400 Bridgewater Crossing | Bridgewater, NJ | 61,642 | Q4 2016 | October through December 2018; November and December 2019 | Q4 2029 |
| Holland & Knight, LLP | SunTrust Center | Orlando, FL | 50,655 | Q4 2018 (4) | December 2018 through February 2019 | Q1 2024 |
|
| |
| (1) | The estimated lease commencement date is July 1, 2018. |
| (2) | The first phase of the lease, which consists of 45,476 square feet of previously vacant space, commenced in the second quarter of 2017. The second phase, consisting of 56,461 square feet, will commence in the second quarter of 2018. |
| (3) | While the commencement of the Gartner lease will be phased, only the first phase of 98,134 square feet will receive ten months of rental abatements (during the first quarter of 2018, Gartner increased the amount of space to be taken during the first lease phase from 71,439 square feet to 98,134 square feet, thereby accelerating the phased commencement of and the revenue stream from the lease). The other two phases will not receive rental abatements. |
| (4) | Represents the commencement date of the renewal term. |
Financing and Capital Activity
Among Piedmont's stated strategic objectives is to harvest capital through the disposition of non-core assets and assets in which the Company believes values have been maximized and to use the sale proceeds to:
| |
| • | invest in real estate assets with higher overall return prospects and/or strategic merits in one of our identified operating markets where we have a significant operating presence with a competitive advantage and that otherwise meet our strategic criteria; |
| |
| • | reduce leverage levels by repaying outstanding debt; and/or |
| |
| • | repurchase Company stock when it is believed to be trading at a significant discount to NAV. |
Information on the Company's recent accomplishments in furtherance of its strategic objectives is presented below.
Dispositions
On January 4, 2018, Piedmont completed the sale of a 2.6 million square foot, 76% leased, 14-asset portfolio comprised of non-strategic assets, as well as assets in which the Company believed value potential had been realized, to two buyers for a total amount of $430.4 million (inclusive of a $4.5 million earnout payment received in April 2018), or $166 per square foot. The sale of this portfolio of assets allowed the Company to complete its exit from the Phoenix, Detroit, Nashville and South Florida office markets, as well as reduce its suburban holdings in the Chicago, Washington, DC, Boston and Atlanta markets. The majority of the sale proceeds were used to:
| |
| • | Acquire Norman Pointe I in Bloomington, MN, a high-quality, value-add asset within one of our core markets and in close proximity to other Piedmont properties at a significant discount to replacement cost; |
| |
| • | Acquire 501 West Church Street in Orlando, FL, a value-add asset with significant upside potential in the CBD submarket; |
| |
| • | Repurchase approximately $230 million of Piedmont stock at what the Company estimates to be a substantial discount to net asset value; and |
| |
| • | Pay a $0.50 per share special dividend. |
The assets included in the disposition transaction were:
|
| | | |
| Property | City | State | Rentable Square
Footage |
| Desert Canyon 300 | Phoenix | AZ | 148 |
| 5601 Hiatus Road | Tamarac | FL | 100 |
| 2001 NW 64th Street | Ft. Lauderdale | FL | 48 |
| Auburn Hills Corporate Center | Auburn Hills | MI | 120 |
| 1075 West Entrance Drive | Auburn Hills | MI | 210 |
| 2120 West End Avenue | Nashville | TN | 312 |
| 5301 Maryland Way | Brentwood | TN | 201 |
| Piedmont Pointe I | Bethesda | MD | 189 |
| Piedmont Pointe II | Bethesda | MD | 238 |
| Windy Point I | Schaumburg | IL | 187 |
| Windy Point II | Schaumburg | IL | 301 |
| 2300 Cabot Drive | Lisle | IL | 153 |
| 1200 Crown Colony Drive | Quincy | MA | 235 |
| Suwanee Gateway One | Suwanee | GA | 143 |
| Total | | | 2,585 |
Acquisitions
On February 23, 2018, Piedmont completed the purchase of 501 West Church Street, a 182,000 square foot, 100% leased, five-story, Class A office building with a connected parking structure located in Orlando, FL, for $28.0 million, or $153 per square foot. The property is situated between two major event venues, Amway Center (home to the Orlando Magic) and Orlando City Stadium (home to the Orlando City Soccer Club), one block west of Interstate 4, in Orlando's Central Business District, in close proximity to the Creative Village, a nearly 70-acre transit-oriented, mixed-use development anchored by the University of Central Florida's downtown innovation campus, and the remainder of the Piedmont downtown Orlando office property portfolio. The asset is of strong strategic fit for the Company in terms of physical quality, location within one of its strategic submarkets, and proximity to other Piedmont-owned assets, which will allow the Company to realize additional marketing and operating synergies. While the building is currently leased through early 2024, there is significant upside potential through the resetting of the in-place, below market rental rates and the capturing of event parking revenue. The acquisition was completed at a significant discount to replacement cost of approximately 50%. Refer to the investment rationale presentation available in the Investor Relations section of the Company's website for more detailed information.
For additional information on acquisitions and dispositions completed over the previous eighteen months, please refer to page 37.
Development / Redevelopment
The Company had no developments underway as of March 31, 2018. During the first quarter of 2018, the Company continued a nearly $14 million redevelopment at Two Pierce Place in Itasca, IL. The project includes a renovation of the property's lobby and exterior plaza, an elevator modernization, the enhancement and addition of building amenities, and the acquisition and improving of additional land to increase the building's parking ratio. Additional detail on the Company's developable land parcels, all of which are located adjacent to existing Piedmont properties, as well as information on the current redevelopment project, can be found on page 38.
Finance
As of March 31, 2018, our ratio of debt to total gross assets was 37.5%. This debt ratio is based on total principal amount outstanding for our various loans at March 31, 2018.
As of March 31, 2018, our average net debt to Core EBITDA ratio was 5.4 x, and the same measure at December 31, 2017 was 5.6 x.
On March 29, 2018, Piedmont entered into a $250 million, seven-year unsecured term loan that will mature on March 31, 2025. The main objectives of the financing were to reduce exposure to near-term debt maturities and ladder out the Company's debt maturity schedule. Using proceeds from dispositions and the new term loan financing, along with a draw on the Company's revolving line of credit, two debt facilities totaling $470 million with near-term maturities were paid off, allowing the Company to extend its debt maturity profile. The debt facilities that were repaid were:
| |
| • | a $170 million, floating-rate unsecured term loan maturing in May 2018; and |
| |
| • | a $300 million, fixed-rate (through interest rate swaps) unsecured term loan maturing in January 2019. |
With the repayment of these two loans, Piedmont has no maturing debt until 2020. There were no prepayment costs associated with the repayment of the loans and the Company received approximately $800,000 in net cash proceeds from the termination of several related interest rate swap agreements.
The new term loan has a stated variable interest rate; however, in an effort to reduce the Company's exposure to floating interest rates, the Company entered into:
| |
| • | a total of $100 million of interest rate swap agreements with terms of seven years at an all-in fixed rate of 4.21% (inclusive of the credit spread); and |
| |
| • | a $50 million interest rate swap agreement for a term of two years at an all-in fixed rate of 3.93% (inclusive of the credit spread). |
The loan is not subject to prepayment penalties after the first two years of term. The length of term of the two-year interest rate swap agreement was selected to align with the burn off of the prepayment penalties, providing the Company with additional debt prepayment flexibility at that point in time. For principal amounts not subject to the interest rate swap agreements, Piedmont may select from multiple interest rate options under the facility, including the prime rate and various length LIBOR locks. The selected interest rate is subject to an additional spread based on Piedmont's then current credit rating. As of March 31, 2018, the interest rate for LIBOR based loans was LIBOR + 160 basis points.
Stock Repurchase Program
The Board of Directors of Piedmont renewed the Company's stock repurchase program on February 21, 2018 by authorizing up to $200 million of additional share repurchases over the next two years. Repurchases of stock under the program will be made at the Company's discretion and will depend on market conditions, other investment opportunities and other factors that the Company deems relevant.
During the first quarter of 2018, the Company repurchased approximately 12.5 million shares of common stock under its share repurchase program at an average price of $18.56 per share, or approximately $231.7 million (before the consideration of transaction costs). Since the stock repurchase program began in December 2011, the Company has repurchased approximately 43.9 million shares at an average price of $17.74 per share, or approximately $779.8 million in aggregate (before the consideration of transaction costs). As of quarter end, Board-approved capacity remaining for additional repurchases totaled approximately $156.4 million under the stock repurchase plan.
Dividend
On February 7, 2018, the Board of Directors of Piedmont declared a dividend for the first quarter of 2018 in the amount of $0.21 per common share outstanding to stockholders of record as of the close of business on February 23, 2018. The dividend was paid on March 16, 2018. The Company's dividend payout percentage (for dividends declared) for the three months ended March 31, 2018 was 49% of Core FFO and 62% of AFFO.
Subsequent Events
On May 1, 2018, the Board of Directors of Piedmont declared a dividend for the second quarter of 2018 in the amount of $0.21 per common share outstanding to stockholders of record as of the close of business on May 23, 2018. The dividend is expected to be paid on June 15, 2018.
Guidance for 2018
The following financial guidance for calendar year 2018 has been raised and narrowed primarily due to stock repurchase activity and is based upon management's expectations at this time.
|
| | | |
| | Low | | High |
| | | | |
| Net Income | $93 million | to | $97 million |
| Add: | | | |
| Depreciation | 108 million | to | 111 million |
| Amortization | 61 million | to | 63 million |
| Less: | | | |
| Gain on Sale of Real Estate Assets | (45) million | to | (46) million |
| NAREIT Funds from Operations applicable to Common Stock | $217 million | | $225 million |
| NAREIT Funds from Operations per diluted share | $1.66 | to | $1.72 |
| | | | |
| Less: | | | |
| Loss on Extinguishment of Debt | $2 million | to | $2 million |
| Core Funds From Operations | $219 million | to | $227 million |
| Core Funds from Operations per diluted share | $1.68 | to | $1.74 |
These estimates reflect management’s view of current market conditions and incorporate certain economic and operational assumptions and projections. Actual results could differ from these estimates. Note that individual quarters may fluctuate on both a cash basis and an accrual basis due to the timing of lease commencements and expirations, abatement periods, repairs and maintenance, capital expenditures, capital markets activities, seasonal general and administrative expenses, accrued potential performance-based compensation expenses, and one-time revenue or expense events. In addition, the Company’s guidance is based on information available to management as of the date of this supplemental report.
Piedmont Office Realty Trust, Inc.
Consolidated Balance Sheets
Unaudited (in thousands)
|
| | | | | | | | | | | | | | | | | | | |
| | March 31, 2018 |
| December 31, 2017 |
| September 30, 2017 |
| June 30, 2017 |
| March 31, 2017 |
| Assets: |
| | | | | | | | |
| Real estate, at cost: |
| | | | | | | | |
| Land assets | $ | 547,602 |
| | $ | 544,794 |
| | $ | 540,436 |
| | $ | 540,436 |
| | $ | 542,640 |
|
| Buildings and improvements | 3,236,330 |
| | 3,203,229 |
| | 3,178,184 |
| | 3,168,725 |
| | 3,178,655 |
|
| Buildings and improvements, accumulated depreciation | (811,760 | ) | | (785,206 | ) | | (758,800 | ) | | (733,568 | ) | | (722,397 | ) |
| Intangible lease asset | 158,338 |
| | 176,950 |
| | 171,965 |
| | 179,540 |
| | 205,061 |
|
| Intangible lease asset, accumulated amortization | (83,063 | ) | | (99,145 | ) | | (93,265 | ) | | (94,551 | ) | | (113,129 | ) |
| Construction in progress | 15,226 |
| | 11,710 |
| | 7,560 |
| | 14,671 |
| | 18,664 |
|
| Real estate assets held for sale, gross | — |
| | 501,526 |
| | 546,979 |
| | 860,302 |
| | 858,320 |
|
| Real estate assets held for sale, accumulated depreciation & amortization | — |
| | (169,116 | ) | | (167,305 | ) | | (252,583 | ) | | (248,651 | ) |
| Total real estate assets | 3,062,673 |
| | 3,384,742 |
| | 3,425,754 |
| | 3,682,972 |
| | 3,719,163 |
|
| Investments in and amounts due from unconsolidated joint ventures | 10 |
| | 10 |
| | 49 |
| | 7,762 |
| | 7,654 |
|
| Cash and cash equivalents | 6,729 |
| | 7,382 |
| | 36,108 |
| | 9,596 |
| | 6,808 |
|
| Tenant receivables, net of allowance for doubtful accounts | 12,040 |
| | 12,139 |
| | 12,802 |
| | 24,269 |
| | 25,194 |
|
| Straight line rent receivable | 167,535 |
| | 163,160 |
| | 157,289 |
| | 152,084 |
| | 144,513 |
|
| Notes receivable | 3,200 |
| | — |
| | — |
| | — |
| | — |
|
| Escrow deposits and restricted cash | 1,464 |
| | 1,373 |
| | 1,260 |
| | 1,290 |
| | 1,253 |
|
| Prepaid expenses and other assets | 25,028 |
| | 22,517 |
| | 27,893 |
| | 29,866 |
| | 21,214 |
|
| Goodwill | 98,918 |
| | 98,918 |
| | 98,918 |
| | 98,918 |
| | 98,918 |
|
| Interest rate swap | 725 |
| | 688 |
| | 34 |
| | — |
| | — |
|
| Deferred lease costs, less accumulated amortization | 257,368 |
| | 261,907 |
| | 253,608 |
| | 257,677 |
| | 268,328 |
|
| Other assets held for sale | — |
| | 47,131 |
| | 46,935 |
| | 55,878 |
| | 57,695 |
|
| Total assets | $ | 3,635,690 |
| | $ | 3,999,967 |
| | $ | 4,060,650 |
| | $ | 4,320,312 |
| | $ | 4,350,740 |
|
| Liabilities: | | | | | | | | | |
| Unsecured debt, net of discount | $ | 1,498,339 |
| | $ | 1,535,311 |
| | $ | 1,511,663 |
| | $ | 1,720,986 |
| | $ | 1,733,343 |
|
| Secured debt | 191,305 |
| | 191,616 |
| | 191,923 |
| | 332,196 |
| | 332,471 |
|
| Accounts payable, accrued expenses, and accrued capital expenditures | 83,786 |
| | 216,653 |
| | 108,120 |
| | 111,011 |
| | 116,077 |
|
| Deferred income | 29,751 |
| | 29,582 |
| | 29,970 |
| | 27,416 |
| | 30,683 |
|
| Intangible lease liabilities, less accumulated amortization | 42,699 |
| | 38,458 |
| | 40,662 |
| | 42,905 |
| | 45,148 |
|
| Interest rate swaps | 222 |
| | 1,478 |
| | 3,915 |
| | 5,061 |
| | 5,475 |
|
| Other liabilities held for sale | — |
| | 380 |
| | 402 |
| | 423 |
| | 446 |
|
| Total liabilities | $ | 1,846,102 |
| | $ | 2,013,478 |
| | $ | 1,886,655 |
| | $ | 2,239,998 |
| | $ | 2,263,643 |
|
| Stockholders' equity: | | | | | | | | | |
| Common stock | 1,300 |
| | 1,424 |
| | 1,453 |
| | 1,455 |
| | 1,453 |
|
| Additional paid in capital | 3,680,241 |
| | 3,677,360 |
| | 3,676,706 |
| | 3,675,562 |
| | 3,675,575 |
|
| Cumulative distributions in excess of earnings | (1,904,404 | ) | | (1,702,281 | ) | | (1,511,428 | ) | | (1,603,119 | ) | | (1,596,276 | ) |
| Other comprehensive loss | 10,639 |
| | 8,164 |
| | 5,400 |
| | 4,547 |
| | 4,466 |
|
| Piedmont stockholders' equity | 1,787,776 |
| | 1,984,667 |
| | 2,172,131 |
| | 2,078,445 |
| | 2,085,218 |
|
| Non-controlling interest | 1,812 |
| | 1,822 |
| | 1,864 |
| | 1,869 |
| | 1,879 |
|
| Total stockholders' equity | 1,789,588 |
| | 1,986,489 |
| | 2,173,995 |
| | 2,080,314 |
| | 2,087,097 |
|
| Total liabilities, redeemable common stock and stockholders' equity | $ | 3,635,690 |
| | $ | 3,999,967 |
| | $ | 4,060,650 |
| | $ | 4,320,312 |
| | $ | 4,350,740 |
|
| Common stock outstanding at end of period | 130,025 |
| | 142,359 |
| | 145,295 |
| | 145,490 |
| | 145,320 |
|
Piedmont Office Realty Trust, Inc.
Consolidated Statements of Income
Unaudited (in thousands except for per share data)
|
| | | | | | | | | | | | | | | | | | | | |
| | | Three Months Ended |
| | | 3/31/2018 | | 12/31/2017 | | 9/30/2017 | | 6/30/2017 | | 3/31/2017 |
| Revenues: | | | | | | | | | | |
| Rental income | | $ | 101,454 |
| | $ | 109,726 |
| | $ | 108,868 |
| | $ | 118,492 |
| | $ | 118,039 |
|
| Tenant reimbursements | | 22,994 |
| | 24,764 |
| | 24,253 |
| | 24,285 |
| | 24,837 |
|
| Property management fee revenue | | 309 |
| | 356 |
| | 454 |
| | 400 |
| | 525 |
|
| Other property related income | | 5,143 |
| | 4,598 |
| | 4,012 |
| | 5,502 |
| | 5,062 |
|
| | | 129,900 |
| | 139,444 |
| | 137,587 |
| | 148,679 |
| | 148,463 |
|
| Expenses: | | | | | | | | | | |
| Property operating costs | | 51,859 |
| | 55,806 |
| | 54,518 |
| | 56,287 |
| | 55,830 |
|
| Depreciation | | 27,145 |
| | 28,461 |
| | 30,000 |
| | 30,059 |
| | 30,768 |
|
| Amortization | | 16,733 |
| | 17,515 |
| | 18,123 |
| | 19,314 |
| | 20,415 |
|
Impairment loss on real estate assets (1) | | — |
| | 46,461 |
| | — |
| | — |
| | — |
|
| General and administrative | | 6,552 |
| | 7,451 |
| | 6,190 |
| | 7,528 |
| | 8,150 |
|
| | | 102,289 |
| | 155,694 |
| | 108,831 |
| | 113,188 |
| | 115,163 |
|
| Real estate operating income | | 27,611 |
| | (16,250 | ) | | 28,756 |
| | 35,491 |
| | 33,300 |
|
| Other income / (expense): | | | | | | | | | | |
| Interest expense | | (13,758 | ) | | (15,463 | ) | | (16,183 | ) | | (18,421 | ) | | (18,057 | ) |
| Other income / (expense) | | 446 |
| | 429 |
| | 290 |
| | 38 |
| | (100 | ) |
| Equity in income / (loss) of unconsolidated joint ventures | | — |
| | (27 | ) | | 3,754 |
| | 107 |
| | 11 |
|
| Gain / (loss) on extinguishment of debt | | (1,680 | ) | | — |
| | — |
| | — |
| | — |
|
| | | (14,992 | ) | | (15,061 | ) | | (12,139 | ) | | (18,276 | ) | | (18,146 | ) |
| Income from continuing operations | | 12,619 |
| | (31,311 | ) | | 16,617 |
| | 17,215 |
| | 15,154 |
|
| Discontinued operations: | | | | | | | | | | |
| Operating income, excluding impairment loss | | — |
| | — |
| | — |
| | — |
| | — |
|
| Gain / (loss) on sale of properties | | — |
| | — |
| | — |
| | — |
| | — |
|
| Income / (loss) from discontinued operations | | — |
| | — |
| | — |
| | — |
| | — |
|
Gain / (loss) on sale of real estate (2) | | 45,209 |
| | (77 | ) | | 109,512 |
| | 6,492 |
| | (53 | ) |
| Net income | | 57,828 |
| | (31,388 | ) | | 126,129 |
| | 23,707 |
| | 15,101 |
|
| Less: Net (income) / loss attributable to noncontrolling interest | | 2 |
| | 5 |
| | 4 |
| | 3 |
| | 3 |
|
| Net income attributable to Piedmont | | $ | 57,830 |
| | $ | (31,383 | ) | | $ | 126,133 |
| | $ | 23,710 |
| | $ | 15,104 |
|
| Weighted average common shares outstanding - diluted | | 136,183 |
| | 144,503 |
| | 145,719 |
| | 145,813 |
| | 145,833 |
|
| Net income per share available to common stockholders - diluted | | $ | 0.42 |
| | $ | (0.21 | ) | | $ | 0.87 |
| | $ | 0.16 |
| | $ | 0.10 |
|
| Common stock outstanding at end of period | | 130,025 |
| | 142,359 |
| | 145,295 |
| | 145,490 |
| | 145,320 |
|
|
| |
| (1) | The impairment loss on real estate assets recorded in the fourth quarter of 2017 was related to certain properties within the 14-property portfolio disposition that closed at the beginning of 2018. Accounting standards require that any anticipated loss from an asset sale be recorded as an impairment charge when the likelihood of a sale becomes probable. Conversely, any gain on the sale of an asset is not recorded until the sale transaction closes. Therefore, during the fourth quarter of 2017, Piedmont recorded impairment losses associated with the 14-property portfolio disposition totaling $46.5 million; however, it recorded a nearly equal amount of gains relating to other properties within the same transaction totaling $45.2 million during the first quarter of 2018. |
| (2) | The gain on sale of real estate reflected in the first quarter of 2018 was related to certain assets within the 14-property portfolio sale on which the company recorded a total of $45.2 million in gains. The gain on sale of real estate reflected in the third quarter of 2017 was related to the sale of Two Independence Square in Washington, DC, on which the Company recorded a $109.5 million gain. The gain on sale of real estate reflected in the second quarter of 2017 was related to the sale of Sarasota Commerce Center II in Sarasota, FL, on which the Company recorded a $6.5 million gain. |
Piedmont Office Realty Trust, Inc.
Consolidated Statements of Income
Unaudited (in thousands except for per share data)
|
| | | | | | | | | | | | |
| | Three Months Ended |
| | 3/31/2018 | 3/31/2017 | | Change ($) | Change (%) |
| Revenues: | | | | | |
| Rental income | $ | 101,454 |
| $ | 118,039 |
| | $ | (16,585 | ) | (14.1 | )% |
| Tenant reimbursements | 22,994 |
| 24,837 |
| | (1,843 | ) | (7.4 | )% |
| Property management fee revenue | 309 |
| 525 |
| | (216 | ) | (41.1 | )% |
| Other property related income | 5,143 |
| 5,062 |
| | 81 |
| 1.6 | % |
| | 129,900 |
| 148,463 |
| | (18,563 | ) | (12.5 | )% |
| Expenses: | | | | | |
| Property operating costs | 51,859 |
| 55,830 |
| | 3,971 |
| 7.1 | % |
| Depreciation | 27,145 |
| 30,768 |
| | 3,623 |
| 11.8 | % |
| Amortization | 16,733 |
| 20,415 |
| | 3,682 |
| 18.0 | % |
| Impairment loss on real estate assets | — |
| — |
| | — |
|
|
|
| General and administrative | 6,552 |
| 8,150 |
| | 1,598 |
| 19.6 | % |
| | 102,289 |
| 115,163 |
| | 12,874 |
| 11.2 | % |
| Real estate operating income | 27,611 |
| 33,300 |
| | (5,689 | ) | (17.1 | )% |
| Other income / (expense): | | | | | |
| Interest expense | (13,758 | ) | (18,057 | ) | | 4,299 |
| 23.8 | % |
| Other income / (expense) | 446 |
| (100 | ) | | 546 |
| 546.0 | % |
| Equity in income / (loss) of unconsolidated joint ventures | — |
| 11 |
| | (11 | ) | (100.0 | )% |
| Gain / (loss) on extinguishment of debt | (1,680 | ) | — |
| | (1,680 | ) | (100.0 | )% |
| | (14,992 | ) | (18,146 | ) | | 3,154 |
| 17.4 | % |
| Income from continuing operations | 12,619 |
| 15,154 |
| | (2,535 | ) | (16.7 | )% |
| Discontinued operations: | | | | | |
| Operating income, excluding impairment loss | — |
| — |
| | — |
|
|
|
| Gain / (loss) on sale of properties | — |
| — |
| | — |
|
|
|
| Income / (loss) from discontinued operations | — |
| — |
| | — |
|
|
|
Gain / (loss) on sale of real estate (1) | 45,209 |
| (53 | ) | | 45,262 |
| 85,400.0 | % |
| Net income | 57,828 |
| 15,101 |
| | 42,727 |
| 282.9 | % |
| Less: Net (income) / loss attributable to noncontrolling interest | 2 |
| 3 |
| | (1 | ) | (33.3 | )% |
| Net income attributable to Piedmont | $ | 57,830 |
| $ | 15,104 |
| | $ | 42,726 |
| 282.9 | % |
| Weighted average common shares outstanding - diluted | 136,183 |
| 145,833 |
| | | |
| Net income per share available to common stockholders - diluted | $ | 0.42 |
| $ | 0.10 |
| | | |
| Common stock outstanding at end of period | 130,025 |
| 145,320 |
| | | |
|
| |
| (1) | The gain on sale of real estate for the three months ended March 31, 2018 was primarily related to certain assets within the 14-property portfolio sale on which the company recorded a total of $45.2 million in gains. |
Piedmont Office Realty Trust, Inc.
Key Performance Indicators
Unaudited (in thousands except for per share data)
|
|
This section of our supplemental report includes non-GAAP financial measures, including, but not limited to, Earnings Before Interest, Taxes, Depreciation, and Amortization for real estate (EBITDAre), Core Earnings Before Interest, Taxes, Depreciation, and Amortization (Core EBITDA), Funds from Operations (FFO), Core Funds from Operations (Core FFO), and Adjusted Funds from Operations (AFFO). Definitions of these non-GAAP measures are provided on page 39 and reconciliations are provided beginning on page 41. |
|
| | | | | | | | | | | | | | | |
| | Three Months Ended |
| | | | | | | | | | | |
| | | | | | | | | | | |
| Selected Operating Data | 3/31/2018 | | 12/31/2017 | | 9/30/2017 | | 6/30/2017 | | 3/31/2017 | |
| | | | | | | | | | |
Percent leased (1) | 91.3 | % | | 89.7 | % | | 89.2 | % | | 91.0 | % | | 91.5 | % | |
Percent leased - economic (1) (2) | 85.9 | % | | 82.1 | % | | 83.4 | % | | 84.4 | % | | 84.1 | % | |
| Rental income | $101,454 | | $109,726 | | $108,868 | | $118,492 | | $118,039 | |
| Total revenues | $129,900 | | $139,444 | | $137,587 | | $148,679 | | $148,463 | |
| Total operating expenses | $102,289 | | $155,694 | | $108,831 | | $113,188 | | $115,163 | |
| Core EBITDA | $71,912 |
| $76,509 |
| $77,242 |
| $85,041 |
| $84,505 | |
| Core FFO applicable to common stock | $57,986 |
| $60,896 |
| $60,819 |
| $66,465 |
| $66,198 | |
| Core FFO per share - diluted | $0.43 |
| $0.42 |
| $0.42 |
| $0.46 |
| $0.45 | |
| AFFO applicable to common stock | $45,840 |
| $42,948 |
| $52,370 |
| $50,870 |
| $54,124 | |
Gross regular dividends (3) | $28,284 | | $30,276 | | $30,549 | | $30,553 | | $30,517 | |
| Regular dividends per share | $0.21 | | $0.21 | | $0.21 | | $0.21 | | $0.21 | |
Gross special dividends (3) (4) | $0 | | $71,367 | | $0 | | $0 | | $0 | |
| Special dividends per share | NA |
| | $0.50 | | NA |
| | NA |
| | NA |
| |
| Selected Balance Sheet Data | | | | | | | | | | |
| Total real estate assets | $3,062,673 |
| $3,384,742 |
| $3,425,754 |
| $3,682,972 |
| $3,719,163 | |
| Total assets | $3,635,690 |
| $3,999,967 |
| $4,060,650 |
| $4,320,312 |
| $4,350,740 | |
| Total liabilities | $1,846,102 |
| $2,013,478 |
| $1,886,655 |
| $2,239,998 |
| $2,263,643 | |
| Ratios & Information for Debt Holders | | | | | | | | | | |
Core EBITDA margin (5) | 55.4 | % | | 54.9 | % | | 56.1 | % | | 57.2 | % | | 56.9 | % | |
Fixed charge coverage ratio (6) | 5.1 x |
| | 4.9 x |
| | 4.7 x |
| | 4.6 x |
| | 4.6 x |
| |
Average net debt to Core EBITDA (7) | 5.4 x |
| | 5.6 x |
| | 5.6 x |
| | 6.0 x |
| | 6.1 x |
| |
| Total gross real estate assets | $3,957,496 | | $4,438,209 | | $4,445,124 | | $4,763,674 | | $4,803,340 | |
Net debt (8) | $1,689,241 | | $1,724,915 | | $1,673,535 | | $2,050,246 | | $2,066,298 | |
|
| |
| (1) | Please refer to page 27 for additional leased percentage information. |
| (2) | Economic leased percentage excludes the square footage associated with executed but not commenced leases for currently vacant spaces and the square footage associated with tenants receiving rental abatements (after proportional adjustments for tenants receiving only partial rental abatements). Due to variations in rental abatement structures whereby some abatements are provided for the first few months of each lease year as opposed to being provided entirely at the beginning of the lease, there will be variability to the economic leased percentage over time as abatements commence and expire. Please see the Future Lease Commencements and Abatements section of Financial Highlights for details on near-term abatements for large leases. |
| (3) | Dividends are reflected in the quarter in which they were declared. |
| (4) | On December 13, 2017, the Board of Directors of Piedmont declared a special dividend in the amount of $0.50 per common share outstanding to stockholders of record as of the close of business on December 26, 2017 as a result of taxable gains realized on property sales occurring during 2017. |
| (5) | Core EBITDA margin is calculated as Core EBITDA divided by total revenues (including revenues associated with discontinued operations). |
| (6) | The fixed charge coverage ratio is calculated as Core EBITDA divided by the sum of interest expense, principal amortization, capitalized interest and preferred dividends. The Company had no preferred dividends during any of the periods presented; the Company had capitalized interest of $106,873 for the quarter ended March 31, 2018, $37,908 for the quarter ended December 31, 2017, $37,259 for the quarter ended September 30, 2017, $35,376 for the quarter ended June 30, 2017, and $78,939 for the quarter ended March 31, 2017; the Company had principal amortization of $236,041 for the quarter ended March 31, 2018, $232,796 for the quarter ended December 31, 2017, $229,596 for the quarter ended September 30, 2017, $226,439 for the quarter ended June 30, 2017, and $223,326 for the quarter ended March 31, 2017. |
| (7) | For the purposes of this calculation, we annualize the period's Core EBITDA and use the average daily balance of debt outstanding during the period, less cash and cash equivalents and escrow deposits and restricted cash as of the end of the period. |
| (8) | Net debt is calculated as the total principal amount of debt outstanding minus cash and cash equivalents and escrow deposits and restricted cash as of the end of the period. The decrease in net debt during the third quarter of 2017 was primarily attributable to the use of the proceeds from the sale of Two Independence Square in Washington, DC, to repay debt. |
Piedmont Office Realty Trust, Inc.
Funds From Operations, Core Funds From Operations and Adjusted Funds From Operations
Unaudited (in thousands except for per share data)
|
| | | | | | | | |
| | | Three Months Ended |
| | | 3/31/2018 |
| 3/31/2017 |
| | | | | |
| GAAP net income applicable to common stock | | $ | 57,830 |
| | $ | 15,104 |
|
Depreciation (1) (2) | | 26,969 |
| | 30,629 |
|
Amortization (1) | | 16,716 |
| | 20,406 |
|
Loss / (gain) on sale of properties (1) | | (45,209 | ) | | 53 |
|
| NAREIT funds from operations applicable to common stock | | 56,306 |
| | 66,192 |
|
| Adjustments: | | | | |
| Acquisition costs | | — |
| | 6 |
|
| Loss / (gain) on extinguishment of debt | | 1,680 |
| | — |
|
| Core funds from operations applicable to common stock | | 57,986 |
| | 66,198 |
|
| Adjustments: | | | | |
| Amortization of debt issuance costs, fair market adjustments on notes payable, and discount on senior notes | | 466 |
| | 630 |
|
| Depreciation of non real estate assets | | 169 |
| | 195 |
|
Straight-line effects of lease revenue (1) | | (3,473 | ) | | (5,703 | ) |
| Stock-based and other non-cash compensation expense | | 288 |
| | 2,041 |
|
Amortization of lease-related intangibles (1) | | (1,643 | ) | | (1,559 | ) |
| Acquisition costs | | — |
| | (6 | ) |
Non-incremental capital expenditures (3) | | (7,953 | ) | | (7,672 | ) |
| Adjusted funds from operations applicable to common stock | | $ | 45,840 |
| | $ | 54,124 |
|
| | | | | |
| Weighted average common shares outstanding - diluted | | 136,183 |
| | 145,833 |
|
| | | | | |
| Funds from operations per share (diluted) | | $ | 0.41 |
| | $ | 0.45 |
|
| Core funds from operations per share (diluted) | | $ | 0.43 |
| | $ | 0.45 |
|
| | | | | |
| Common stock outstanding at end of period | | 130,025 |
|
| 145,320 |
|
|
| |
| (1) | Includes our proportionate share of amounts attributable to consolidated properties and unconsolidated joint ventures. |
| (2) | Excludes depreciation of non real estate assets. |
| (3) | Non-incremental capital expenditures are defined on page 39. |
Piedmont Office Realty Trust, Inc.
Same Store Net Operating Income (Cash Basis)
Unaudited (in thousands)
|
| | | | | | | | |
| | Three Months Ended | |
| | 3/31/2018 | | 3/31/2017 | |
| Net income attributable to Piedmont | $ | 57,830 |
| | $ | 15,104 |
| |
| Net income / (loss) attributable to noncontrolling interest | (2 | ) | | (3 | ) | |
Interest expense (1) | 13,758 |
| | 18,057 |
| |
Depreciation (1) (2) | 27,139 |
| | 30,824 |
| |
Amortization (1) (2) | 16,716 |
| | 20,406 |
| |
Impairment loss (1) | — |
| | — |
| |
Loss / (gain) on sale of properties (1) | (45,209 | ) | | 53 |
| |
| EBITDAre | 70,232 |
| | 84,441 |
| |
| (Gain) / loss on extinguishment of debt | 1,680 |
| | — |
| |
| Acquisition costs | — |
| | 6 |
| |
Net (recoveries) / loss from casualty events (1) | — |
| | 58 |
| |
| Core EBITDA | 71,912 |
| | 84,505 |
| |
General & administrative expenses (1) | 6,552 |
| | 8,155 |
| |
Management fee revenue (3) | (150 | ) | | (329 | ) | |
Other (income) / expense (1) (4) | (230 | ) | | 36 |
| |
Straight-line effects of lease revenue (1) | (3,473 | ) | | (5,703 | ) | |
Amortization of lease-related intangibles (1) | (1,643 | ) | | (1,559 | ) | |
| Property net operating income (cash basis) | 72,968 |
| | 85,105 |
| |
| |
| |
| |
| Deduct net operating (income) / loss from: |
| |
| |
Acquisitions (5) | (666 | ) | | — |
| |
Dispositions (6) | (182 | ) | | (15,590 | ) | |
Other investments (7) | (1,517 | ) | | (1,767 | ) | |
| Same store net operating income (cash basis) | $ | 70,603 |
| | $ | 67,748 |
| |
| Change period over period | 4.2 | % | | N/A |
| |
|
| |
| (1) | Includes our proportionate share of amounts attributable to consolidated properties and unconsolidated joint ventures. |
| (2) | Excludes amounts attributable to noncontrolling interests. Depreciation related to noncontrolling interests for the three months ended March 31, 2018 and 2017 amounted to (in thousands) $7 and $7, respectively. Amortization related to noncontrolling interests for the three months ended March 31, 2018 and 2017 amounted to (in thousands) $16 and $17, respectively. |
| (3) | Presented net of related operating expenses incurred to earn the revenue; therefore, the information presented on this line will not tie to the data presented on the income statements. Expenses incurred to earn the revenue for the three months ended March 31, 2018 and 2017 amounted to (in thousands) $160 and $196, respectively. |
| (4) | Figures presented on this line may not tie back to the relevant sources as some activity is attributable to property operations and is, therefore, presented in property net operating income. Certain prior period amounts have been reclassified to conform to the current period financial statement presentation. Amounts attributable to property operations for the three months ended March 31, 2018 and 2017 were (in thousands) $216 and $0, respectively. |
| (5) | Acquisitions consist of Norman Pointe I in Bloomington, MN, purchased on December 28, 2017; and 501 West Church Street in Orlando, FL, purchased on February 23, 2018. |
| (6) | Dispositions consist of Sarasota Commerce Center II in Sarasota, FL, sold on June 16, 2017; Two Independence Square in Washington, DC, sold on July 5, 2017; and the 14-property portfolio sale completed on January 4, 2018 (comprised of 2300 Cabot Drive in Lisle, IL; Windy Point I and II in Schaumburg, IL; Suwanee Gateway One and land in Suwanee, GA; 1200 Crown Colony Drive in Quincy, MA; Piedmont Pointe I and II in Bethesda, MD; 1075 West Entrance Drive and Auburn Hills Corporate Center in Auburn Hills, MI; 5601 Hiatus Road in Tamarac, FL; 2001 NW 64th Street in Ft. Lauderdale, FL; Desert Canyon 300 in Phoenix, AZ; 5301 Maryland Way in Brentwood, TN; and 2120 West End Avenue in Nashville, TN). |
| (7) | Other investments consist of our interests in unconsolidated joint ventures, active redevelopment and development projects, land, and recently completed redevelopment and development projects for which some portion of operating expenses were capitalized during the current and/or prior year reporting periods. Additional information on our land holdings can be found on page #SectionPage#. The operating results from 500 TownPark in Lake Mary, FL, and Two Pierce Place in Itasca, IL, are included in this line item. |
Piedmont Office Realty Trust, Inc.
Same Store Net Operating Income (Cash Basis)
Unaudited (in thousands)
|
| | | | | | | | | | | | |
| Same Store Net Operating Income (Cash Basis) | | | | | | |
| Contributions from Strategic Operating Markets | Three Months Ended | |
| | 3/31/2018 | | 3/31/2017 | |
| | $ | % | | $ | % | |
New York (1) | $ | 11,389 |
| 16.1 |
| | $ | 10,130 |
| 14.9 |
| |
Boston (2) | 8,377 |
| 11.9 |
| | 9,828 |
| 14.5 |
| |
| Atlanta | 8,282 |
| 11.7 |
| | 7,986 |
| 11.8 |
| |
Dallas (3) | 7,697 |
| 10.9 |
| | 7,023 |
| 10.4 |
| |
| Minneapolis | 6,909 |
| 9.8 |
| | 6,503 |
| 9.6 |
| |
Orlando (4) | 6,703 |
| 9.5 |
| | 5,767 |
| 8.5 |
| |
Chicago (5) | 6,216 |
| 8.8 |
| | 4,300 |
| 6.3 |
| |
Washington, D.C. (6) | 6,152 |
| 8.7 |
| | 7,560 |
| 11.2 |
| |
| Other | 8,878 |
| 12.6 |
| | 8,651 |
| 12.8 |
| |
| Total | $ | 70,603 |
| 100.0 |
| | $ | 67,748 |
| 100.0 |
| |
| | | | | | | |
|
| |
| NOTE: | The Company has provided disaggregated financial data for informational purposes for readers; however, regardless of the presentation approach used, we continue to evaluate and utilize our consolidated financial results in making operating decisions, allocating resources, and assessing our performance.
|
| (1) | The increase in metropolitan New York Same Store Net Operating Income for the three months ended March 31, 2018 as compared to the same period in 2017 was primarily related to increased economic occupancy at 200 and 400 Bridgewater Crossing in Bridgewater, NJ. |
| (2) | The decrease in Boston Same Store Net Operating Income for the three months ended March 31, 2018 as compared to the same period in 2017 was primarily related to the receipt of lease restructuring income in 2017 which was not repeated in 2018 at 5 & 15 Wayside Road in Burlington, MA. |
| (3) | The increase in Dallas Same Store Net Operating Income for the three months ended March 31, 2018 as compared to the same period in 2017 was principally due to increased economic occupancy at One Lincoln Park in Dallas, TX, and 750 West John Carpenter Freeway in Irving, TX, as well as the recognition of refunds attributable to successful prior years' property tax appeals at 6565 North MacArthur Boulevard in Irving, TX. |
| (4) | The increase in Orlando Same Store Net Operating Income for the three months ended March 31, 2018 as compared to the same period in 2017 was primarily attributable to increased economic occupancy at CNL Center II in Orlando, FL, as well as increased parking income at SunTrust Center in Orlando, FL. |
| (5) | The increase in Chicago Same Store Net Operating Income for the three months ended March 31, 2018 as compared to the same period in 2017 was primarily a result of increased economic occupancy at 500 West Monroe Street in Chicago, IL. |
| (6) | The decrease in Washington, D.C. Same Store Net Operating Income for the three months ended March 31, 2018 as compared to the same period in 2017 was primarily due to decreased economic occupancy associated with lease expirations at Arlington Gateway in Arlington, VA, and 1201 Eye Street in Washington, D.C., which was partially offset by increased economic occupancy at One Independence Square in Washington, D.C. |
Piedmont Office Realty Trust, Inc.
Same Store Net Operating Income (Accrual Basis)
Unaudited (in thousands)
|
| | | | | | | | |
| | Three Months Ended | |
| | 3/31/2018 | | 3/31/2017 | |
| Net income attributable to Piedmont | $ | 57,830 |
| | $ | 15,104 |
| |
| Net income / (loss) attributable to noncontrolling interest | (2 | ) | | (3 | ) | |
Interest expense (1) | 13,758 |
| | 18,057 |
| |
Depreciation (1) (2) | 27,139 |
| | 30,824 |
| |
Amortization (1) (2) | 16,716 |
| | 20,406 |
| |
Impairment loss (1) | — |
| | — |
| |
Loss / (gain) on sale of properties (1) | (45,209 | ) | | 53 |
| |
| EBITDAre | 70,232 |
| | 84,441 |
| |
| (Gain) / loss on extinguishment of debt | 1,680 |
| | — |
| |
| Acquisition costs | — |
| | 6 |
| |
Net (recoveries) / loss from casualty events (1) | — |
| | 58 |
| |
| Core EBITDA | 71,912 |
| | 84,505 |
| |
General & administrative expenses (1) | 6,552 |
| | 8,155 |
| |
Management fee revenue (3) | (150 | ) | | (329 | ) | |
Other (income) / expense (1) (4) | (230 | ) | | 36 |
| |
| Property net operating income (accrual basis) | 78,084 |
| | 92,367 |
| |
| | | | | |
| Deduct net operating (income) / loss from: | | | | |
Acquisitions (5) | (862 | ) | | — |
| |
Dispositions (6) | (173 | ) | | (14,387 | ) | |
Other investments (7) | (1,438 | ) | | (2,223 | ) | |
| Same store net operating income (accrual basis) | $ | 75,611 |
| | $ | 75,757 |
| |
| Change period over period | (0.2 | )% | | N/A |
| |
|
| |
| (1) | Includes our proportionate share of amounts attributable to consolidated properties and unconsolidated joint ventures. |
| (2) | Excludes amounts attributable to noncontrolling interests. Depreciation related to noncontrolling interests for the three months ended March 31, 2018 and 2017 amounted to (in thousands) $7 and $7, respectively. Amortization related to noncontrolling interests for the three months ended March 31, 2018 and 2017 amounted to (in thousands) $16 and $17, respectively. |
| (3) | Presented net of related operating expenses incurred to earn the revenue; therefore, the information presented on this line will not tie to the data presented on the income statements. Expenses incurred to earn the revenue for the three months ended March 31, 2018 and 2017 amounted to (in thousands) $160 and $196, respectively. |
| (4) | Figures presented on this line may not tie back to the relevant sources as some activity is attributable to property operations and is, therefore, presented in property net operating income. Certain prior period amounts have been reclassified to conform to the current period financial statement presentation. Amounts attributable to property operations for the three months ended March 31, 2018 and 2017 were (in thousands) $216 and $0, respectively. |
| (5) | Acquisitions consist of Norman Pointe I in Bloomington, MN, purchased on December 28, 2017; and 501 West Church Street in Orlando, FL, purchased on February 23, 2018. |
| (6) | Dispositions consist of Sarasota Commerce Center II in Sarasota, FL, sold on June 16, 2017; Two Independence Square in Washington, DC, sold on July 5, 2017; and the 14-property portfolio sale completed on January 4, 2018 (comprised of 2300 Cabot Drive in Lisle, IL; Windy Point I and II in Schaumburg, IL; Suwanee Gateway One and land in Suwanee, GA; 1200 Crown Colony Drive in Quincy, MA; Piedmont Pointe I and II in Bethesda, MD; 1075 West Entrance Drive and Auburn Hills Corporate Center in Auburn Hills, MI; 5601 Hiatus Road in Tamarac, FL; 2001 NW 64th Street in Ft. Lauderdale, FL; Desert Canyon 300 in Phoenix, AZ; 5301 Maryland Way in Brentwood, TN; and 2120 West End Avenue in Nashville, TN). |
| (7) | Other investments consist of our interests in unconsolidated joint ventures, active redevelopment and development projects, land, and recently completed redevelopment and development projects for which some portion of operating expenses were capitalized during the current and/or prior year reporting periods. Additional information on our land holdings can be found on page 38. The operating results from 500 TownPark in Lake Mary, FL, and Two Pierce Place in Itasca, IL, are included in this line item. |
Piedmont Office Realty Trust, Inc.
Same Store Net Operating Income (Accrual Basis)
Unaudited (in thousands)
|
| | | | | | | | | | | | |
| Same Store Net Operating Income (Accrual Basis) | | | | | | |
| Contributions from Strategic Operating Markets | Three Months Ended | |
| | 3/31/2018 | | 3/31/2017 | |
| | $ | % | | $ | % | |
| New York | $ | 10,464 |
| 13.8 |
| | $ | 10,034 |
| 13.3 |
| |
| Atlanta | 9,633 |
| 12.7 |
| | 9,709 |
| 12.8 |
| |
Boston (1) | 9,401 |
| 12.4 |
| | 10,125 |
| 13.4 |
| |
Washington, D.C. (2) | 8,306 |
| 11.0 |
| | 9,829 |
| 13.0 |
| |
| Dallas | 8,144 |
| 10.8 |
| | 7,682 |
| 10.1 |
| |
| Orlando | 7,413 |
| 9.8 |
| | 7,068 |
| 9.3 |
| |
| Minneapolis | 6,430 |
| 8.5 |
| | 6,131 |
| 8.1 |
| |
Chicago (3) | 6,392 |
| 8.5 |
| | 5,462 |
| 7.2 |
| |
| Other | 9,428 |
| 12.5 |
| | 9,717 |
| 12.8 |
| |
| Total | $ | 75,611 |
| 100.0 |
| | $ | 75,757 |
| 100.0 |
| |
| | | | | | | |
|
| |
| NOTE: | The Company has provided disaggregated financial data for informational purposes for readers; however, regardless of the presentation approach used, we continue to evaluate and utilize our consolidated financial results in making operating decisions, allocating resources, and assessing our performance.
|
| (1) | The decrease in Boston Same Store Net Operating Income for the three months ended March 31, 2018 as compared to the same period in 2017 was primarily related to the receipt of lease restructuring income in 2017 which was not repeated in 2018 at 5 & 15 Wayside Road in Burlington, MA. |
| (2) | The decrease in Washington, D.C. Same Store Net Operating Income for the three months ended March 31, 2018 as compared to the same period in 2017 was primarily due to the loss of rental income associated with lease expirations at Arlington Gateway in Arlington, VA, and 1201 Eye Street in Washington, D.C. |
| (3) | The increase in Chicago Same Store Net Operating Income for the three months March 31, 2018 as compared to the same period in 2017 was primarily attributable to increased rental income resulting from the commencement of several new leases at 500 West Monroe Street in Chicago, IL. |
Piedmont Office Realty Trust, Inc.
Capitalization Analysis
Unaudited (in thousands except for per share data)
|
| | | | | | | | |
| | | As of | | As of |
| | | March 31, 2018 | | December 31, 2017 |
| | | | | |
| Market Capitalization | | | | |
Common stock price (1) | | $ | 17.59 |
| | $ | 19.61 |
|
| Total shares outstanding | | 130,025 |
| | 142,359 |
|
Equity market capitalization (1) | | $ | 2,287,138 |
| | $ | 2,791,659 |
|
| Total debt - principal amount outstanding (excludes premiums, discounts, and deferred financing costs) | | $ | 1,697,434 |
| | $ | 1,733,670 |
|
Total market capitalization (1) | | $ | 3,984,572 |
| | $ | 4,525,329 |
|
Total debt / Total market capitalization (1) | | 42.6 | % | | 38.3 | % |
| Ratios & Information for Debt Holders | | | | |
Total gross real estate assets (2) | | $ | 3,957,496 |
| | $ | 4,438,209 |
|
Total debt / Total gross real estate assets (2) | | 42.9 | % | | 39.1 | % |
Total debt / Total gross assets (3) | | 37.5 | % | | 34.3 | % |
Average net debt to Core EBITDA (4) | | 5.4 x |
| | 5.6 x |
|
|
| |
| (1) | Reflects common stock closing price, shares outstanding, and outstanding debt as of the end of the reporting period, as appropriate. |
| (2) | Gross real estate assets is defined as total real estate assets with the add-back of accumulated depreciation and accumulated amortization related to real estate assets. |
| (3) | Gross assets is defined as total assets with the add-back of accumulated depreciation and accumulated amortization related to real estate assets. |
| (4) | For the purposes of this calculation, we annualize the Core EBITDA for the quarter and use the average daily balance of debt outstanding during the quarter, less cash and cash equivalents and escrow deposits and restricted cash as of the end of the quarter. |
Piedmont Office Realty Trust, Inc.
Debt Summary
As of March 31, 2018
Unaudited ($ in thousands)
|
| | | | | |
| Floating Rate & Fixed Rate Debt | | | |
Debt (1) | Principal Amount Outstanding | Weighted Average Stated Interest Rate (2) | Weighted Average Maturity |
| | | | | |
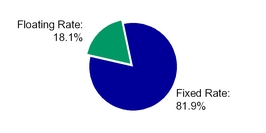
| Floating Rate | $307,000 | (3) | 3.07% | 45.3 months |
| | | | | |
| Fixed Rate | 1,390,434 |
| | 3.82% | 56.7 months |
| | | | | |
| Total | $1,697,434 | | 3.69% | 54.7 months |
|
| | | | | | |
| Unsecured & Secured Debt |
Debt (1) | Principal Amount Outstanding | Weighted Average Stated Interest Rate (2) | Weighted Average Maturity |
| | | | | | |
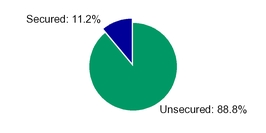
| Unsecured | $1,507,000 | | 3.67% | | 55.3 months |
| | | | | | |
| Secured | 190,434 |
| | 3.81% | | 49.6 months |
| | | | | | |
| Total | $1,697,434 | | 3.69% | | 54.7 months |
|
| | | | | | | |
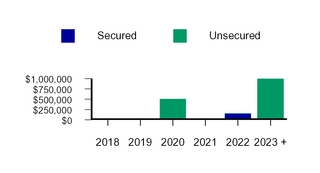
| Debt Maturities |
| Maturity Year | Secured Debt - Principal Amount Outstanding (1) | Unsecured Debt - Principal Amount Outstanding (1) | Weighted Average Stated Interest Rate (2) | Percentage of Total |
| | | | | | | | |
| 2018 | $— | | $— | | N/A | | —% |
| 2019 | — | | — | | N/A | | —% |
| 2020 | — | | 507,000 | (4) | 3.15% | | 29.9% |
| 2021 | 30,434 | | — | | 5.55% | (5) | 1.8% |
| 2022 | 160,000 | | — | | 3.48% | | 9.4% |
| 2023 + | — | | 1,000,000 | | 3.93% | | 58.9% |
| | | | | | | | |
| Total | $190,434 | | $1,507,000 | | 3.69% | | 100.0% |
|
| |
| (1) | All of Piedmont's outstanding debt as of March 31, 2018, was interest-only debt with the exception of the $30.4 million of debt associated with 5 Wall Street located in Burlington, MA. |
| (2) | Weighted average stated interest rate is calculated based upon the principal amounts outstanding. |
| (3) | Amount of floating rate debt represents the $207 million outstanding balance as of March 31, 2018 on the $500 million unsecured revolving credit facility and the $100 million in principal amount of the $250 million unsecured term loan that remained unhedged as of March 31, 2018. The $300 million unsecured term loan that closed in 2011 and the $250 million unsecured term loan that closed in 2018, have stated variable rates. However, Piedmont entered into $300 million in notional amount of interest rate swap agreements which effectively fix the interest rate on the 2011 unsecured term loan at 3.35% through its maturity date of January 15, 2020, assuming no credit rating change for the company. For the $250 million unsecured term loan, Piedmont entered into $100 million in notional amount of seven-year interest rate swap agreements and $50 million in notional amount of two-year interest rate swap agreements, resulting in an effectively fixed interest rate a) on $150 million of the term loan at 4.11% through March 29, 2020 and b) on $100 million of the term loan at 4.21% from March 30, 2020 through the loan's maturity date of March 31, 2025, assuming no credit rating change for the Company. |
| (4) | The initial maturity date of the $500 million unsecured revolving credit facility is June 18, 2019; however, there are two, six-month extension options available under the facility providing for a final extended maturity date of June 18, 2020. For the purposes of this schedule, we reflect the maturity date of the facility as the final extended maturity date of June 2020. |
| (5) | The $35.0 million fixed-rate loan has a stated interest rate of 5.55%; however, upon acquiring 5 Wall Street and assuming the loan, the Company marked the debt to its estimated fair value as of that time, resulting in an effective interest rate of 3.75%. |
Piedmont Office Realty Trust, Inc.
Debt Detail
Unaudited ($ in thousands)
|
| | | | | | | | |
Facility (1) | Property | Stated Rate | Maturity | Principal Amount Outstanding as of March 31, 2018 |
| | | | | | |
| Secured | | | | | |
$35.0 Million Fixed-Rate Loan (2) | 5 Wall Street | 5.55 | % | (3) | 9/1/2021 | $ | 30,434 |
|
| $160.0 Million Fixed-Rate Loan | 1901 Market Street | 3.48 | % | (4) | 7/5/2022 | 160,000 |
|
Subtotal / Weighted Average (5) | | 3.81 | % | | | $ | 190,434 |
|
| | | | | | |
| Unsecured | | | | | |
| $300.0 Million Unsecured 2011 Term Loan | N/A | 3.35 | % | (6) | 1/15/2020 | 300,000 |
|
$500.0 Million Unsecured Line of Credit (7) | N/A | 2.87 | % | (8) | 6/18/2020 | 207,000 |
|
| $350.0 Million Unsecured Senior Notes | N/A | 3.40 | % | (9) | 6/1/2023 | 350,000 |
|
| $400.0 Million Unsecured Senior Notes | N/A | 4.45 | % | (10) | 3/15/2024 | 400,000 |
|
| $250.0 Million Unsecured Term Loan | N/A | 3.86 | % | (11) | 3/31/2025 | 250,000 |
|
Subtotal / Weighted Average (5) | | 3.67 | % | | | $ | 1,507,000 |
|
| | | | | | |
Total Debt - Principal Amount Outstanding / Weighted Average Stated Rate (5) | 3.69 | % | | | $ | 1,697,434 |
|
GAAP Accounting Adjustments (12) | | | | | (7,790 | ) |
| Total Debt - GAAP Amount Outstanding | | | | $ | 1,689,644 |
|
|
| |
| (1) | All of Piedmont’s outstanding debt as of March 31, 2018, was interest-only debt with the exception of the $30.4 million of debt associated with 5 Wall Street located in Burlington, MA. |
| (2) | The loan is amortizing based on a 25-year amortization schedule. |
| (3) | The loan has a stated interest rate of 5.55%; however, upon acquiring 5 Wall Street and assuming the loan, the Company marked the debt to its estimated fair value as of that time, resulting in an effective interest rate of 3.75%. |
| (4) | The stated interest rate on the $160 million fixed-rate loan is 3.48%. After the application of interest rate hedges, the effective cost of the financing is approximately 3.58%. |
| (5) | Weighted average is based on the principal amounts outstanding and interest rates at March 31, 2018. |
| (6) | The $300 million unsecured term loan that closed in 2011 has a stated variable rate; however, Piedmont entered into interest rate swap agreements which effectively fix the interest rate on this loan at 3.35% through its maturity date of January 15, 2020, assuming no credit rating change for the Company. |
| (7) | All of Piedmont’s outstanding debt as of March 31, 2018, was term debt with the exception of $207 million outstanding on our unsecured revolving credit facility. The $500 million unsecured revolving credit facility has an initial maturity date of June 18, 2019; however, there are two, six-month extension options available under the facility providing for a total extension of up to one year to June 18, 2020. The final extended maturity date is presented on this schedule. |
| (8) | The interest rate presented for the $500 million unsecured revolving credit facility is the weighted average interest rate for all outstanding draws as of March 31, 2018. Piedmont may select from multiple interest rate options with each draw under the facility, including the prime rate and various length LIBOR locks. All LIBOR selections are subject to an additional spread (1.00% as of March 31, 2018) over the selected rate based on Piedmont’s then current credit rating. |
| (9) | The $350 million unsecured senior notes were offered for sale at 99.601% of the principal amount. The resulting effective cost of the financing is approximately 3.45% before the consideration of transaction costs and proceeds from interest rate hedges. After the application of proceeds from interest rate hedges, the effective cost of the financing is approximately 3.43%. |
| (10) | The $400 million unsecured senior notes were offered for sale at 99.791% of the principal amount. The resulting effective cost of the financing is approximately 4.48% before the consideration of transaction costs and proceeds from interest rate hedges. After the application of proceeds from interest rate hedges, the effective cost of the financing is approximately 4.10%. |
| (11) | Piedmont closed on the $250 million unsecured term loan on March 29, 2018. The loan has a stated variable rate; however, Piedmont entered into $100 million in notional amount of seven-year interest rate swap agreements and $50 million in notional amount of two-year interest rate swap agreements, resulting in an effectively fixed interest rate a) on $150 million of the term loan at 4.11% through March 29, 2020 and b) on $100 million of the term loan at 4.21% from March 30, 2020 through the loan's maturity date of March 31, 2025, assuming no credit rating change for the Company. For the portion of the loan that continues to have a variable interest rate, Piedmont may select from multiple interest rate options, including the prime rate and various length LIBOR locks. All LIBOR selections are subject to an additional spread (1.60% as of March 31, 2018) over the selected interest rate based on Piedmont's then current credit rating.
|
| (12) | The GAAP accounting adjustments relate to original issue discounts, third-party fees, and lender fees resulting from the procurement processes for our various debt facilities, along with debt fair value adjustments associated with the assumed 5 Wall Street debt. The original issue discounts and fees, along with the debt fair value adjustments, are amortized to interest expense over the contractual term of the related debt. |
Piedmont Office Realty Trust, Inc.
Debt Covenant & Ratio Analysis (for Debt Holders)
As of March 31, 2018
Unaudited
|
| | | | | | |
| | | Three Months Ended |
Bank Debt Covenant Compliance (1) | Required | 3/31/2018 | 12/31/2017 | 9/30/2017 | 06/30/2017 | 3/31/2017 |
|
| |
| | | |
| Maximum leverage ratio | 0.60 | 0.35 | 0.34 | 0.34 | 0.38 | 0.38 |
Minimum fixed charge coverage ratio (2) | 1.50 | 4.38 | 4.29 | 4.24 | 4.19 | 4.19 |
| Maximum secured indebtedness ratio | 0.40 | 0.04 | 0.04 | 0.04 | 0.06 | 0.06 |
| Minimum unencumbered leverage ratio | 1.60 | 2.93 | 3.09 | 3.09 | 2.79 | 2.77 |
Minimum unencumbered interest coverage ratio (3) | 1.75 | 5.05 | 5.11 | 5.15 | 5.01 | 5.12 |
|
| | | | | | |
| | | Three Months Ended |
Bond Covenant Compliance (4) | Required | 3/31/2018 | 12/31/2017 | 9/30/2017 | 06/30/2017 | 3/31/2017 |
| | | | | | | |
| Total debt to total assets | 60% or less | 42.7% | 38.9% | 38.1% | 43.1% | 43.0% |
| Secured debt to total assets | 40% or less | 4.8% | 4.3% | 4.3% | 6.9% | 6.9% |
| Ratio of consolidated EBITDA to interest expense | 1.50 or greater | 5.07 | 4.95 | 4.93 | 4.97 | 4.98 |
| Unencumbered assets to unsecured debt | 150% or greater | 244% | 269% | 276% | 248% | 249% |
|
| | |
| Three Months Ended | Twelve Months Ended |
| Other Debt Coverage Ratios for Debt Holders | March 31, 2018 | December 31, 2017 |
| | |
Average net debt to core EBITDA (5) | 5.4 x | 5.8 x |
Fixed charge coverage ratio (6) | 5.1 x | 4.7 x |
Interest coverage ratio (7) | 5.2 x | 4.7 x |
|
| |
| (1) | Bank debt covenant compliance calculations relate to specific calculations detailed in the relevant credit agreements. |
| (2) | Defined as EBITDA for the trailing four quarters (including the Company's share of EBITDA from unconsolidated interests), less one-time or non-recurring gains or losses, less a $0.15 per square foot capital reserve, and excluding the impact of straight line rent leveling adjustments and amortization of intangibles divided by the Company's share of fixed charges, as more particularly described in the credit agreements. This definition of fixed charge coverage ratio as prescribed by our credit agreements is different from the fixed charge coverage ratio definition employed elsewhere within this report. |
| (3) | Defined as net operating income for the trailing four quarters for unencumbered assets (including the Company's share of net operating income from partially-owned entities and subsidiaries that are deemed to be unencumbered) less a $0.15 per square foot capital reserve divided by the Company's share of interest expense associated with unsecured financings only, as more particularly described in the credit agreements. |
| (4) | Bond covenant compliance calculations relate to specific calculations prescribed in the relevant debt agreements. Please refer to the Indenture dated May 9, 2013, and the Indenture and the Supplemental Indenture dated March 6, 2014, for detailed information about the calculations. |
| (5) | For the purposes of this calculation, we use the average daily balance of debt outstanding during the period, less cash and cash equivalents and escrow deposits and restricted cash as of the end of the period. |
| (6) | Fixed charge coverage ratio is calculated as Core EBITDA divided by the sum of interest expense, principal amortization, capitalized interest and preferred dividends. The Company had no preferred dividends during the periods ended March 31, 2018 and December 31, 2017. The Company had capitalized interest of $106,873 for the three months ended March 31, 2018 and $189,482 for the twelve months ended December 31, 2017. The Company had principal amortization of $236,041 for the three months ended March 31, 2018 and $912,157 for the twelve months ended December 31, 2017. |
| (7) | Interest coverage ratio is calculated as Core EBITDA divided by the sum of interest expense and capitalized interest. The Company had capitalized interest of $106,873 for the three months ended March 31, 2018 and $189,482 for the twelve months ended December 31, 2017. |
Piedmont Office Realty Trust, Inc.
Tenant Diversification (1)
As of March 31, 2018
(in thousands except for number of properties)
|
| | | | | | | | | |
| Tenant | Credit Rating (2) | Number of Properties | Lease Expiration (3) | Annualized Lease Revenue | Percentage of Annualized Lease Revenue (%) | Leased Square Footage | Percentage of Leased Square Footage (%) |
| State of New York | AA+ / Aa1 | 1 | 2019 |
| $25,839 | 5.1 | | 481 | 3.2 |
| US Bancorp | A+ / A1 | 3 | 2023 / 2024 |
| 24,441 | 4.9 | | 783 | 5.3 |
| Independence Blue Cross | No Rating Available | 1 | 2033 |
| 18,731 | 3.7 | | 801 | 5.4 |
| GE | A / A2 | 1 | 2027 |
| 17,087 | 3.4 | | 452 | 3.1 |
| Nestle | AA- / Aa2 | 1 | 2021 |
| 12,343 | 2.5 | | 401 | 2.7 |
| City of New York | AA / Aa2 | 1 | 2020 |
| 10,984 | 2.2 | | 313 | 2.1 |
| U.S. Government | AA+ / Aaa | 4 | 2018 - 2032 | (4) | 10,652 | 2.1 | | 229 | 1.5 |
| Motorola | BBB- / Baa3 | 1 | 2028 |
| 8,531 | 1.7 | | 206 | 1.4 |
| Nuance Communications | BB- / Ba3 | 2 | 2018 /2030 | (5) | 8,326 | 1.7 | | 247 | 1.7 |
| Harvard University | AAA / Aaa | 2 | 2032 / 2033 |
| 7,885 | 1.6 | | 129 | 0.9 |
| District of Columbia | AA / Aa1 | 2 | 2028 |
| 7,163 | 1.4 | | 146 | 1.0 |
| Raytheon | A / A3 | 2 | 2024 | | 6,466 | 1.3 | | 440 | 3.0 |
| First Data Corporation | B+ / B1 | 1 | 2027 | | 6,097 | 1.2 | | 201 | 1.4 |
| Schlumberger Technology | AA- / A1 | 1 | 2020 | | 6,041 | 1.2 | | 163 | 1.1 |
| Epsilon Data Management | No Rating Available | 1 | 2026 |
| 5,956 | 1.2 | | 222 | 1.5 |
| CVS Caremark | BBB / Baa1 | 1 | 2022 |
| 5,786 | 1.2 | | 208 | 1.4 |
| Goldman Sachs | BBB+ / A3 | 2 | 2018 |
| 5,703 | 1.1 | | 207 | 1.4 |
| SunTrust Bank | BBB+ / Baa1 | 3 | 2019 / 2025 | (6) | 5,646 | 1.1 | | 145 | 1.0 |
| International Food Policy Research Institute | No Rating Available | 1 | 2029 | | 5,581 | 1.1 | | 102 | 0.7 |
| Technip | BBB+ / Baa2 | 1 | 2018 | | 5,551 | 1.1 | | 150 | 1.0 |
| Applied Predictive Technologies | A / A2 | 1 | 2028 | | 4,849 | 1.0 | | 113 | 0.8 |
| Other |
|
| Various | | 292,029 | 58.2 | | 8,626 | 58.4 |
| Total |
|
|
| | $501,687 | 100.0 | | 14,765 | 100.0 |
Tenant Diversification
Percentage of Annualized Leased Revenue (%)
March 31, 2018 as compared to December 31, 2017
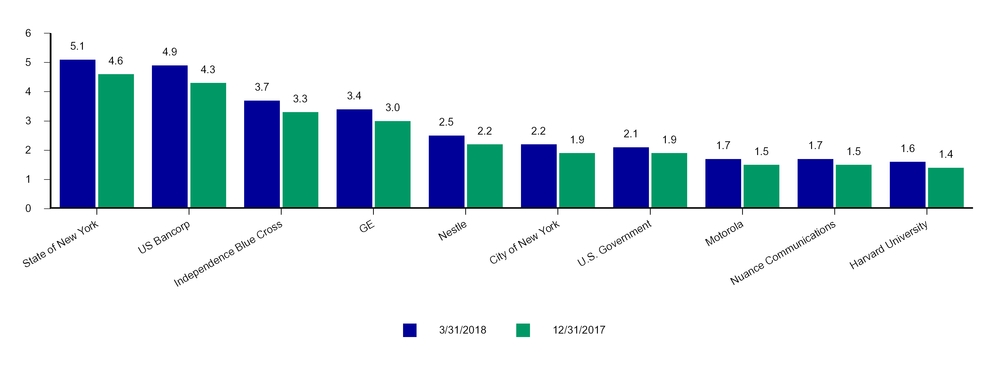
|
| |
| (1) | This schedule presents all tenants contributing 1.0% or more to Annualized Lease Revenue. |
| (2) | Credit rating may reflect the credit rating of the parent or a guarantor. When available, both the Standard & Poor's credit rating and the Moody's credit rating are provided. The absence of a credit rating for a tenant is not an indication of the creditworthiness of the tenant; in most cases, the lack of a credit rating reflects that the tenant has not sought such a rating. |
| (3) | Unless otherwise indicated, Lease Expiration represents the expiration year of the majority of the square footage leased by the tenant. |
| (4) | There are several leases with several different agencies of the U.S. Government with expiration years ranging from 2018 to 2032. Of the total population of U.S. Government leases, leases contributing 1.7% to Annualized Lease Revenue expire in 2025 and after. |
| (5) | Of the total amount of space leased to the tenant, the lease for approximately 46,000 square feet expires in 2018 and the lease for approximately 201,000 square feet expires in 2030. |
| (6) | Of the total amount of space leased to the tenant, the leases for approximately 129,000 square feet expire in 2019 and the lease for approximately 16,000 square feet expires in 2025. |
| | |
Piedmont Office Realty Trust, Inc.
Tenant Credit Rating & Lease Distribution Information
As of March 31, 2018
Tenant Credit Rating (1)
|
| | | |
| Rating Level | Annualized Lease Revenue (in thousands) | Percentage of Annualized Lease Revenue (%) |
| | | |
| AAA / Aaa | $22,034 | 4.4 |
| AA / Aa | 75,947 | 15.1 |
| A / A | 88,772 | 17.7 |
| BBB / Baa | 54,721 | 10.9 |
| BB / Ba | 24,073 | 4.8 |
| B / B | 28,962 | 5.8 |
| Below | 1,517 |
| 0.3 |
Not rated (2) | 205,661 | 41.0 |
| Total | $501,687 | 100.0 |
| | | |
Lease Distribution
|
| | | | | | | |
| Lease Size | Number of Leases | Percentage of Leases (%) | Annualized Lease Revenue (in thousands) | Percentage of Annualized Lease Revenue (%) | Leased Square Footage (in thousands) | Percentage of Leased Square Footage (%) |
| | | | | | | |
| 2,500 or Less | 242 | 32.4 | $24,220 | 4.8 | 195 |
| 1.3 |
| 2,501 - 10,000 | 261 | 35.0 | 46,463 | 9.3 | 1,346 |
| 9.1 |
| 10,001 - 20,000 | 91 | 12.2 | 41,971 | 8.4 | 1,266 |
| 8.6 |
| 20,001 - 40,000 | 70 | 9.4 | 69,506 | 13.8 | 2,022 |
| 13.7 |
| 40,001 - 100,000 | 44 | 5.9 | 93,247 | 18.6 | 2,644 |
| 17.9 |
| Greater than 100,000 | 38 | 5.1 | 226,280 | 45.1 | 7,292 |
| 49.4 |
| Total | 746 | 100.0 | $501,687 | 100.0 | 14,765 |
| 100.0 |
| | | | | | | |
|
| |
| (1) | Credit rating may reflect the credit rating of the parent or a guarantor. Where differences exist between the Standard & Poor's credit rating for a tenant and the Moody's credit rating for a tenant, the higher credit rating is selected for this analysis. |
| (2) | The classification of a tenant as "not rated" is not an indication of the creditworthiness of the tenant; in most cases, the lack of a credit rating reflects that the tenant has not sought such a rating. Included in this category are such tenants as Independence Blue Cross, Piper Jaffray, Brother International, and RaceTrac Petroleum. |
Piedmont Office Realty Trust, Inc.
Leased Percentage Information
(in thousands)
|
| | | | | | | | | | | | | | | |
| | | Three Months Ended | | Three Months Ended | |
| | | March 31, 2018 | | March 31, 2017 | |
| | | Leased Square Footage | Rentable Square Footage | Percent Leased (1) | | Leased Square Footage | Rentable Square Footage | Percent Leased (1) | |
| | As of December 31, 20xx | 17,091 |
| 19,061 |
| 89.7 | % | | 17,996 |
| 19,581 |
| 91.9 | % | (2) |
| | Leases signed during the period | 341 |
| | | | 394 |
|
| | |
| | Less: lease renewals signed during period | (192 | ) | | | | (241 | ) |
| | |
| | New leases signed during period | 149 |
|
|
| | | 153 |
|
|
| | |
| | Less: new leases signed during period for currently occupied space | (1 | ) | | | | (54 | ) | | | |
| | New leases commencing during period | 148 |
| | | | 99 |
| | | |
| | Leases expired during period and other | (215 | ) | — |
|
| | (170 | ) | 18 |
|
| |
| | Subtotal | 17,024 |
| 19,061 |
| 89.3 | % | | 17,925 |
| 19,599 |
| 91.5 | % | |
| | Acquisitions and properties placed in service during period (3) | 182 |
| 182 |
| | | — |
| — |
| | |
| | Dispositions and properties taken out of service during period (3) | (2,441 | ) | (3,071 | ) | | | — |
| — |
| | |
| | As of March 31, 20xx | 14,765 |
| 16,172 |
| 91.3 | % | | 17,925 |
| 19,599 |
| 91.5 | % | |
| | | | | | | | | | |
| | | | | | | | | | |
|
| | | | | | | | | | | | | | | |
| | Same Store Analysis | | | | | | | | |
| | Less acquisitions / dispositions after March 31, 2017 and developments / redevelopments (3) (4) | (333 | ) | (396 | ) | 84.1 | % | | (3,392 | ) | (3,827 | ) | 88.6 | % | |
| | Same Store Leased Percentage | 14,432 |
| 15,776 |
| 91.5 | % | | 14,533 |
| 15,772 |
| 92.1 | % | |
| | | | | | | | | | |
| | | | | | | | | | |
|
| |
| (1) | Calculated as square footage associated with commenced leases as of period end with the addition of square footage associated with uncommenced leases for spaces vacant as of period end, divided by total rentable square footage as of period end, expressed as a percentage. |
| (2) | Leased Square Footage and Rentable Square Footage as of December 31, 2016 have been restated to include two development properties and one re-development property that were placed into service effective January 1, 2017. The development properties that were placed in service are Enclave Place, a 301,000 square foot office property located in Houston, TX, and 500 TownPark, a 134,000 square foot office property located in Lake Mary, FL; the re-development property that was placed in service is 3100 Clarendon Boulevard, a 261,000 square foot office property located in Arlington, VA. |
| (3) | For additional information on acquisitions and dispositions completed during the last year and current developments and redevelopments, please refer to pages 37 and 38, respectively. |
| (4) | Dispositions completed during the previous twelve months are deducted from the previous period data and acquisitions completed during the previous twelve months are deducted from the current period data. Redevelopments commenced during the previous twelve months are deducted from the previous period data and developments and redevelopments placed in service during the previous twelve months are deducted from the current period data. |
Piedmont Office Realty Trust, Inc.
Rental Rate Roll Up / Roll Down Analysis (1)
(in thousands)
|
| | | | | | |
| | Three Months Ended | |
| | March 31, 2018 | |
| | Square Feet | % of Total Signed During Period | % of Rentable Square Footage | % Change Cash Rents (2) | % Change Accrual Rents (3) (4) | |
| | | | | | | |
| Leases executed for spaces vacant one year or less | 286 | 83.9% | 1.8% | 9.6% | 22.6% | |
| Leases executed for spaces excluded from analysis | 55 | 16.1% | | | | |
|
| |
| (1) | The population analyzed consists of consolidated office leases executed during the period with lease terms of greater than one year. Leases associated with storage spaces, management offices, newly acquired assets for which there is less than one year of operating history, and unconsolidated joint venture assets are excluded from this analysis. |
| (2) | For the purposes of this analysis, the last twelve months of cash paying rents of the previous leases are compared to the first twelve months of cash paying rents of the new leases in order to calculate the percentage change. |
| (3) | For the purposes of this analysis, the accrual basis rents of the previous leases are compared to the accrual basis rents of the new leases in order to calculate the percentage change. For newly signed leases which have variations in accrual basis rents, whether because of known future expansions, contractions, lease expense recovery structure changes, or other similar reasons, the weighted average of such varying accrual basis rents is used for the purposes of this analysis. |
| (4) | For leases under which a tenant may use, at its discretion, a portion of its tenant improvement allowance for expenses other than those related to improvements to its space, an assumption is made that the tenant elects to use any such portion of its tenant improvement allowance for improvements to its space prior to the commencement of its lease, unless the Company is notified otherwise by the tenant. This assumption is made based upon historical usage patterns of tenant improvement allowances by the Company's tenants. |
Piedmont Office Realty Trust, Inc.
Lease Expiration Schedule
As of March 31, 2018
(in thousands)
|
| | | | | |
| | | |
| Expiration Year | | Annualized Lease Revenue (1) | Percentage of Annualized Lease Revenue (%) | Rentable Square Footage | Percentage of Rentable Square Footage (%) |
| Vacant | | $— | — | 1,407 | 8.7 |
2018 (2) | | 16,800 | 3.4 | 556 | 3.4 |
2019 (3) | | 59,697 | 11.9 | 1,589 | 9.8 |
| 2020 | | 43,088 | 8.6 | 1,382 | 8.5 |
| 2021 | | 29,745 | 5.9 | 930 | 5.8 |
| 2022 | | 40,088 | 8.0 | 1,221 | 7.6 |
| 2023 | | 33,210 | 6.6 | 1,085 | 6.7 |
| 2024 | | 60,057 | 12.0 | 2,169 | 13.4 |
| 2025 | | 21,067 | 4.2 | 607 | 3.8 |
| 2026 | | 28,804 | 5.7 | 871 | 5.4 |
| 2027 | | 44,917 | 9.0 | 1,252 | 7.7 |
| 2028 | | 36,583 | 7.3 | 888 | 5.5 |
| 2029 | | 21,809 | 4.3 | 564 | 3.5 |
| 2030 | | 13,046 | 2.6 | 353 | 2.2 |
| Thereafter | | 52,776 | 10.5 | 1,298 | 8.0 |
| Total / Weighted Average | | $501,687 | 100.0 | 16,172 | 100.0 |
|
| |
| Average Lease Term Remaining |
| 3/31/2018 | 6.7 years |
| 12/31/2017 | 6.5 years |
|
| |
| (1) | Annualized rental income associated with each newly executed lease for currently occupied space is incorporated herein only at the expiration date for the current lease. Annualized rental income associated with each such new lease is removed from the expiry year of the current lease and added to the expiry year of the new lease. These adjustments effectively incorporate known roll ups and roll downs into the expiration schedule. |
| (2) | Includes leases with an expiration date of March 31, 2018, comprised of 122,000 square feet and Annualized Lease Revenue of $3.0 million. |
| (3) | Leases and other revenue-producing agreements on a month-to-month basis, comprised of approximately 12,000 square feet and Annualized Lease Revenue of $0.5 million, are assigned a lease expiration date of a year and a day beyond the period end date. |
| | |
Piedmont Office Realty Trust, Inc.
Lease Expirations by Quarter
As of March 31, 2018
(in thousands)
|
| | | | | | | | | | | | |
| | | Q2 2018 (1) | | Q3 2018 | | Q4 2018 | | Q1 2019 |
| Location | | Expiring Square Footage | Expiring Lease Revenue (2) | | Expiring Square Footage | Expiring Lease Revenue (2) | | Expiring Square Footage | Expiring Lease Revenue (2) | | Expiring Square Footage | Expiring Lease Revenue (2) |
| | | | | | | | | | | | | |
| Atlanta | | 23 | $627 | | 26 | $775 | | 2 | $28 | | 18 | $577 |
| Boston | | 13 | 408 | | 2 | 45 | | 81 | 2,490 | | — | — |
| Chicago | | 6 | 300 | | — | — | | — | 1 | | — | — |
| Dallas | | 65 | 1,745 | | 42 | 797 | | 31 | 833 | | 9 | 277 |
| Minneapolis | | 2 | 53 | | 2 | 83 | | — | — | | — | 5 |
| New York | | 30 | 1,087 | | — | — | | — | 22 | | 480 | 25,839 |
| Orlando | | 2 | 120 | | 10 | 300 | | 1 | 51 | | 14 | 487 |
| Washington, D.C. | | 12 | 615 | | — | — | | 5 | 176 | | — | — |
| Other | | 52 | 1,590 | | — | — | | 150 | 5,571 | | — | — |
Total / Weighted Average (3) | | 205 | $6,545 | | 82 | $2,000 | | 270 | $9,172 | | 521 | $27,185 |
|
| |
| (1) | Includes leases with an expiration date of March 31, 2018, comprised of 122,000 square feet and expiring lease revenue of $3.7 million. No such adjustments are made to other periods presented. |
| (2) | Expiring Lease Revenue is calculated as expiring square footage multiplied by the gross rent per square foot of the tenant currently leasing the space. |
| (3) | Total expiring lease revenue in any given year will not tie to the expiring Annualized Lease Revenue presented on the Lease Expiration Schedule on the previous page as the Lease Expiration Schedule accounts for the revenue effects of newly signed leases. Reflected herein are expiring revenues based on in-place rental rates. |
| | |
Piedmont Office Realty Trust, Inc.
Lease Expirations by Year
As of March 31, 2018
(in thousands)
|
| | | | | | | | | | | | | | |
| | 12/31/2018 (1) | | 12/31/2019 | | 12/31/2020 | | 12/31/2021 | | 12/31/2022 |
| Location | Expiring Square Footage | Expiring Lease Revenue (2) | | Expiring Square Footage | Expiring Lease Revenue (2) | | Expiring Square Footage | Expiring Lease Revenue (2) | | Expiring Square Footage | Expiring Lease Revenue (2) | | Expiring Square Footage | Expiring Lease Revenue (2) |
| Atlanta | 51 | $1,430 | | 442 | $12,424 | | 184 | $4,729 | | 147 | $4,262 | | 370 | $10,364 |
| Boston | 96 | 2,943 | | 8 | 325 | | 156 | 3,397 | | 78 | 1,576 | | 91 | 4,109 |
| Chicago | 7 | 301 | | 4 | 142 | | 17 | 426 | | — | — | | 6 | 289 |
| Dallas | 137 | 3,375 | | 182 | 5,742 | | 130 | 3,740 | | 102 | 3,014 | | 405 | 12,136 |
| Minneapolis | 3 | 136 | | 143 | 4,418 | | 112 | 4,246 | | 91 | 3,112 | | 62 | 2,183 |
| New York | 30 | 1,109 | | 489 | 26,499 | | 503 | 15,974 | | 92 | 4,272 | | 79 | 2,667 |
| Orlando | 13 | 471 | | 270 | 9,193 | | 50 | 1,251 | | 29 | 863 | | 112 | 3,460 |
| Washington, D.C. | 17 | 791 | | 51 | 2,334 | | 67 | 3,351 | | 92 | 4,339 | | 96 | 4,966 |
| Other | 202 | 7,161 | | — | — | | 163 | 6,041 | | 299 | 9,281 | | — | 2 |
Total / Weighted Average (3) | 556 | $17,717 | | 1,589 | $61,077 | | 1,382 | $43,155 | | 930 | $30,719 | | 1,221 | $40,176 |
|
| |
| (1) | Includes leases with an expiration date of March 31, 2018, comprised of 122,000 square feet and expiring lease revenue of $3.7 million. No such adjustments are made to other periods presented. |
| (2) | Expiring Lease Revenue is calculated as expiring square footage multiplied by the gross rent per square foot of the tenant currently leasing the space. |
| (3) | Total expiring lease revenue in any given year will not tie to the expiring Annualized Lease Revenue presented on the Lease Expiration Schedule on page 29 as the Lease Expiration Schedule accounts for the revenue effects of newly signed leases. Reflected herein are expiring revenues based on in-place rental rates. |
| | |
Piedmont Office Realty Trust, Inc.
Capital Expenditures & Commitments
For the quarter ended March 31, 2018
Unaudited (in thousands)
|
| | | | | | | | | | | | | | | | | | | |
| | For the Three Months Ended |
| | 3/31/2018 | | 12/31/2017 | | 9/30/2017 | | 6/30/2017 | | 3/31/2017 |
| Non-incremental | | | | | | | | | |
| Building / construction / development | $ | 804 |
| | $ | 2,081 |
| | $ | 984 |
| | $ | 2,883 |
| | $ | 1,070 |
|
| Tenant improvements | 5,965 |
| | 3,909 |
| | 2,450 |
| | 4,619 |
| | 4,797 |
|
| Leasing costs | 1,184 |
| | 7,473 |
| | 1,795 |
| | 1,571 |
| | 1,805 |
|
| Total non-incremental | 7,953 |
| | 13,463 |
| | 5,229 |
| | 9,073 |
| | 7,672 |
|
| Incremental | | | | | | | | | |
| Building / construction / development | 2,429 |
| | 4,932 |
| | 2,365 |
| | 1,689 |
| | 6,348 |
|
| Tenant improvements | 5,671 |
| | 4,317 |
| | 9,501 |
| | 12,345 |
| | 15,784 |
|
| Leasing costs | 1,110 |
| | 2,412 |
| | 2,359 |
| | 3,251 |
| | 1,473 |
|
| Total incremental | 9,210 |
| | 11,661 |
| | 14,225 |
| | 17,285 |
| | 23,605 |
|
| Total capital expenditures | $ | 17,163 |
| | $ | 25,124 |
| | $ | 19,454 |
| | $ | 26,358 |
| | $ | 31,277 |
|
|
| | | | | | | |
| | | | | |
| | Non-incremental tenant improvement commitments (1) | | | |
| | Non-incremental tenant improvement commitments outstanding as of December 31, 2017 | | $ | 42,001 |
| |
| | New non-incremental tenant improvement commitments related to leases executed during period | | 4,094 |
| |
| | Non-incremental tenant improvement expenditures | (5,965 | ) | | |
| | Tenant improvement expenditures fulfilled through accrued liabilities already presented on Piedmont's balance sheet, expired commitments or other adjustments | (5,426 | ) | | |
| | Non-incremental tenant improvement commitments fulfilled, expired or other adjustments | | (11,391 | ) | |
| | Total as of March 31, 2018 | | $ | 34,704 |
| |
| | | | | |
|
| |
| NOTE: | The information presented on this page is for all consolidated assets. |
| (1) | Commitments are unexpired contractual non-incremental tenant improvement obligations for leases executed in current and prior periods that have not yet been incurred, are due over the next five years, and have not otherwise been presented on Piedmont's financial statements. The four largest commitments total approximately $21.6 million, or 62% of the total outstanding commitments. |
| | |
Piedmont Office Realty Trust, Inc.
Contractual Tenant Improvements and Leasing Commissions
|
| | | | | | | | | | | | | | | |
| | | Three Months
Ended March 31, 2018 | For the Year Ended | 2013 to YTD 2018
(Weighted Average
or Total) |
| | | 2017 | 2016 | 2015 | 2014 | 2013 |
| Renewal Leases | | | | | | | | | | | | | | |
| | Number of leases | 23 | | 64 | | 79 | | 74 | | 56 | | 56 | | 352 | |
| | Square feet | 191,578 | | 1,198,603 | | 880,289 | | 1,334,398 | | 959,424 | | 2,376,177 | | 6,940,469 | |
| | Tenant improvements per square foot (1) | $18.86 | | $7.84 | | $7.36 | | $16.91 | | $19.02 | | $14.24 | | $13.57 | |
| | Leasing commissions per square foot | $4.17 | | $4.80 | | $5.76 | | $8.29 | | $8.33 | | $4.66 | | $6.02 | |
| | Total per square foot | $23.03 | | $12.64 | | $13.12 | | $25.20 | | $27.35 | | $18.90 | | $19.59 | |
| | Tenant improvements per square foot per year of lease term | $3.92 | | $1.84 | | $1.35 | | $2.90 | | $2.97 | | $1.88 | | $2.20 | |
| | Leasing commissions per square foot per year of lease term | $0.87 | | $1.12 | | $1.05 | | $1.42 | | $1.30 | | $0.62 | | $0.98 | |
| | Total per square foot per year of lease term | $4.79 | | $2.96 | | $2.40 | | $4.32 | (2) | $4.27 | (3) | $2.50 | | $3.18 | |
| New Leases | | | | | | | | | | |
| | | |
| | Number of leases | 18 | | 74 | | 93 | | 90 | | 98 | | 87 | | 460 | |
| | Square feet | 148,995 | | 855,069 | | 1,065,630 | | 1,563,866 | | 1,142,743 | | 1,050,428 | | 5,826,731 | |
| | Tenant improvements per square foot (1) | $26.16 | | $41.19 | | $40.78 | | $60.41 | | $34.46 | | $35.74 | | $43.59 | |
| | Leasing commissions per square foot | $13.80 | | $15.90 | | $15.13 | | $20.23 | | $15.19 | | $12.94 | | $16.19 | |
| | Total per square foot | $39.96 | | $57.09 | | $55.91 | | $80.64 | | $49.65 | | $48.68 | | $59.78 | |
| | Tenant improvements per square foot per year of lease term | $3.65 | | $4.73 | | $5.01 | | $5.68 | | $3.78 | | $4.17 | | $4.77 | |
| | Leasing commissions per square foot per year of lease term | $1.92 | | $1.83 | | $1.86 | | $1.90 | | $1.66 | | $1.51 | | $1.77 | |
| | Total per square foot per year of lease term | $5.57 | | $6.56 | | $6.87 | | $7.58 | (4) | $5.44 | | $5.68 | | $6.54 | |
| Total | | | | | | | | | | |
| | | |
| | Number of leases | 41 | | 138 | | 172 | | 164 | | 154 | | 143 | | 812 | |
| | Square feet | 340,573 | | 2,053,672 | | 1,945,919 | | 2,898,264 | | 2,102,167 | | 3,426,605 | | 12,767,200 | |
| | Tenant improvements per square foot (1) | $22.06 | | $21.73 | | $25.66 | | $40.38 | | $27.41 | | $20.83 | | $27.27 | |
| | Leasing commissions per square foot | $8.38 | | $9.42 | | $10.89 | | $14.73 | | $12.06 | | $7.20 | | $10.66 | |
| | Total per square foot | $30.44 | | $31.15 | | $36.55 | | $55.11 | | $39.47 | | $28.03 | | $37.93 | |
| | Tenant improvements per square foot per year of lease term | $3.77 | | $3.55 | | $3.70 | | $4.79 | | $3.48 | | $2.64 | | $3.62 | |
| | Leasing commissions per square foot per year of lease term | $1.43 | | $1.54 | | $1.57 | | $1.75 | | $1.53 | | $0.91 | | $1.42 | |
| | Total per square foot per year of lease term | $5.20 | | $5.09 | | $5.27 | | $6.54 | (4) | $5.01 | (3) | $3.55 | | $5.04 | |
Less Adjustment for Current Period Commitment Expirations (5) | | | | | | | | | | | | | | |
| | Expired tenant improvements (not paid out) per square foot | -$13.81 | | -$2.73 | | -$1.12 | | -$2.77 | | -$5.60 | | -$5.47 | | -$4.00 | |
| | | | | | | | | | | | | | | | |
| | Adjusted total per square foot | $16.63 | | $28.42 | | $35.43 | | $52.34 | | $33.87 | | $22.56 | | $33.93 | |
| | Adjusted total per square foot per year of lease term | $2.84 | | $4.65 | | $5.11 | | $6.21 | | $4.30 | | $2.86 | | $4.51 | |
|
| |
| NOTE: | This information is presented for our consolidated office assets only and excludes activity associated with storage and license spaces. |
| (1) | For leases under which a tenant may use, at its discretion, a portion of its tenant improvement allowance for expenses other than those related to improvements to its space, an assumption is made that the tenant elects to use any such portion of its tenant improvement allowance for improvements to its space prior to the commencement of its lease, unless the Company is notified otherwise by the tenant. This assumption is made based upon historical usage patterns of tenant improvement allowances by the Company's tenants. |
| (2) | The average committed capital cost per square foot per year of lease term for renewal leases completed during 2015 was higher than our historical performance on this measure primarily as a result of four large lease renewals, two of which were completed in the Washington, D.C. market, that involved higher capital commitments. If the costs associated with those renewals were to be removed from the average committed capital cost calculation, the average committed capital cost per square foot per year of lease term for renewal leases completed during 2015 would be $3.33. |
| (3) | During 2014, we completed one large, 15-year lease renewal and expansion with a significant capital commitment with Jones Lang LaSalle at Aon Center in Chicago, IL. If the costs associated with this lease were to be removed from the average committed capital cost calculation, the average committed capital cost per square foot per year of lease term for renewal leases and total leases completed during 2014 would be $2.12 and $4.47, respectively. |
| (4) | During 2015, we completed seven new leases in Washington, D.C., and Chicago, IL, comprising 680,035 square feet with above-average capital commitments. If the costs associated with those new leases were to be removed from the average committed capital cost calculation, the average committed capital cost per square foot per year of lease term for new leases and total leases completed during 2015 would be $5.42 and $4.88, respectively. |
| (5) | The Company has historically reported capital committed in leasing transactions at lease signing with no subsequent updates for variations and/or changes in tenants' uses of tenant improvement allowances. Many times, tenants do not use the full allowance provided in their leases or let portions of their tenant improvement allowances expire. In an effort to provide additional clarity on the actual cost of completed leasing transactions, tenant improvement allowances that expired in the current period or can no longer be used by tenants is disclosed in this section and are deducted from the current period's capital commitments per square foot of leased space in an effort to provide a better estimation of leasing transaction costs over time. |
Piedmont Office Realty Trust, Inc.
Geographic Diversification
As of March 31, 2018
($ and square footage in thousands)
|
| | | | | | | | |
| Location | Number of Properties | Annualized Lease Revenue | Percentage of Annualized Lease Revenue (%) | Rentable Square Footage | Percentage of Rentable Square Footage (%) | Leased Square Footage | Percent Leased (%) |
| Washington, D.C. | 7 | $70,094 | 14.0 | | 1,947 | 12.0 | 1,408 | 72.3 |
| New York | 4 | 69,600 | 13.9 | | 1,771 | 10.9 | 1,744 | 98.5 |
| Atlanta | 7 | 61,305 | 12.2 | | 2,249 | 13.9 | 2,181 | 97.0 |
| Minneapolis | 5 | 57,420 | 11.4 | | 1,833 | 11.3 | 1,723 | 94.0 |
| Dallas | 10 | 54,533 | 10.8 | | 2,114 | 13.1 | 1,936 | 91.6 |
| Orlando | 6 | 52,192 | 10.4 | | 1,755 | 10.9 | 1,662 | 94.7 |
| Boston | 9 | 48,009 | 9.6 | | 1,594 | 9.9 | 1,548 | 97.1 |
| Chicago | 1 | 40,510 | 8.1 | | 967 | 6.0 | 922 | 95.3 |
| Other | 4 | 48,024 | 9.6 | | 1,942 | 12.0 | 1,641 | 84.5 |
| Total / Weighted Average | 53 | $501,687 | 100.0 | | 16,172 | 100.0 | 14,765 | 91.3 |
Piedmont Office Realty Trust, Inc.
Geographic Diversification by Location Type
As of March 31, 2018
(square footage in thousands)
|
| | | | | | | | | | | | | | | | |
| | | | CBD / URBAN INFILL | | SUBURBAN | | TOTAL |
| Location | State | | Number of Properties | Percentage of Annualized Lease Revenue (%) | Rentable Square Footage | Percentage of Rentable Square Footage (%) | | Number of Properties | Percentage of Annualized Lease Revenue (%) | Rentable Square Footage | Percentage of Rentable Square Footage (%) | | Number of Properties | Percentage of Annualized Lease Revenue (%) | Rentable Square Footage | Percentage of Rentable Square Footage (%) |
| Washington, D.C. | DC, VA, MD | | 7 | 14.0 | 1,947 | 12.0 | | — | — | — | — | | 7 | 14.0 | 1,947 | 12.0 |
| New York | NY, NJ | | 1 | 9.7 | 1,033 | 6.4 | | 3 | 4.2 | 738 | 4.5 | | 4 | 13.9 | 1,771 | 10.9 |
| Atlanta | GA | | 6 | 11.5 | 2,111 | 13.0 | | 1 | 0.7 | 138 | 0.9 | | 7 | 12.2 | 2,249 | 13.9 |
| Minneapolis | MN | | 1 | 6.5 | 934 | 5.8 | | 4 | 4.9 | 899 | 5.5 | | 5 | 11.4 | 1,833 | 11.3 |
| Dallas | TX | | 2 | 2.8 | 440 | 2.7 | | 8 | 8.0 | 1,674 | 10.4 | | 10 | 10.8 | 2,114 | 13.1 |
| Orlando | FL | | 4 | 8.8 | 1,445 | 9.0 | | 2 | 1.6 | 310 | 1.9 | | 6 | 10.4 | 1,755 | 10.9 |
| Boston | MA | | 2 | 2.5 | 174 | 1.1 | | 7 | 7.1 | 1,420 | 8.8 | | 9 | 9.6 | 1,594 | 9.9 |
| Chicago | IL | | 1 | 8.1 | 967 | 6.0 | | — | — | — | — | | 1 | 8.1 | 967 | 6.0 |
| Other |
| | 2 | 7.3 | 1,328 | 8.2 | | 2 | 2.3 | 614 | 3.8 | | 4 | 9.6 | 1,942 | 12.0 |
| Total / Weighted Average | | 26 | 71.2 | 10,379 | 64.2 | | 27 | 28.8 | 5,793 | 35.8 | | 53 | 100.0 | 16,172 | 100.0 |
Piedmont Office Realty Trust, Inc.
Industry Diversification
As of March 31, 2018
($ and square footage in thousands)
|
| | | | | | | |
| | | | | Percentage of | | |
| | Number of | Percentage of Total | Annualized Lease | Annualized Lease | Leased Square | Percentage of Leased |
| Industry | Tenants | Tenants (%) | Revenue | Revenue (%) | Footage | Square Footage (%) |
| Business Services | 69 | 11.4 | $54,350 | 10.8 | | 1,683 | 11.4 |
| Governmental Entity | 4 | 0.7 | 47,520 | 9.5 | | 956 | 6.5 |
| Depository Institutions | 17 | 2.8 | 39,451 | 7.9 | | 1,195 | 8.1 |
| Engineering, Accounting, Research, Management & Related Services | 72 | 11.9 | 29,784 | 5.9 | | 878 | 5.9 |
| Insurance Carriers | 15 | 2.5 | 27,956 | 5.6 | | 1,089 | 7.4 |
| Security & Commodity Brokers, Dealers, Exchanges & Services | 41 | 6.8 | 23,411 | 4.7 | | 727 | 4.9 |
| Legal Services | 45 | 7.4 | 21,843 | 4.4 | | 671 | 4.5 |
| Nondepository Credit Institutions | 13 | 2.1 | 19,446 | 3.9 | | 523 | 3.5 |
| Communications | 41 | 6.8 | 19,183 | 3.8 | | 559 | 3.8 |
| Electronic & Other Electrical Equipment & Components, Except Computer | 11 | 1.8 | 16,903 | 3.4 | | 467 | 3.2 |
| Real Estate | 34 | 5.6 | 16,732 | 3.3 | | 496 | 3.4 |
| Automotive Repair, Services & Parking | 8 | 1.3 | 15,019 | 3.0 | | 4 | — |
| Eating & Drinking Places | 41 | 6.8 | 15,009 | 3.0 | | 456 | 3.1 |
| Holding and Other Investment Offices | 28 | 4.6 | 12,587 | 2.5 | | 389 | 2.6 |
| Food & Kindred Products | 2 | 0.3 | 12,419 | 2.5 | | 403 | 2.7 |
| Other | 164 | 27.2 | 130,074 | 25.8 | | 4,269 | 29.0 |
| Total | 605 | 100.0 | $501,687 | 100.0 | | 14,765 | 100.0 |
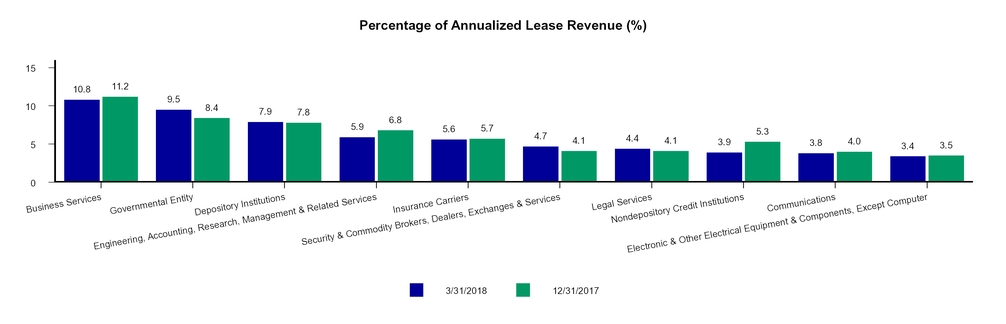
Piedmont Office Realty Trust, Inc.
Property Investment Activity
As of March 31, 2018
($ and square footage in thousands)
Acquisitions Over Previous Eighteen Months
|
| | | | | | | | |
| Property | | Location | Acquisition Date | Percent Ownership (%) | Year Built | Purchase Price | Rentable Square Footage | Percent Leased at Acquisition (%) |
| Galleria 200 | | Atlanta, GA | 10/7/2016 | 100 | 1984 | $69,604 | 432 | 89 |
| 750 West John Carpenter Freeway | | Irving, TX | 11/30/2016 | 100 | 1999 | 49,585 | 315 | 78 |
| John Carpenter Freeway Land | | Irving, TX | 11/30/2016 | 100 | N/A | 1,000 | N/A | N/A |
| Norman Pointe I | | Bloomington, MN | 12/28/2017 | 100 | 2000 | 35,159 | 214 | 71 |
| 501 West Church Street | | Orlando, FL | 2/23/2018 | 100 | 2003 | 28,000 | 182 | 100 |
| Total / Weighted Average | | | | | | $183,348 | 1,143 | 84 |
Dispositions Over Previous Eighteen Months
|
| | | | | | | | |
| Property | | Location | Disposition Date | Percent Ownership (%) | Year Built | Sale Price | Rentable Square Footage | Percent Leased at Disposition (%) |
| 11695 Johns Creek Parkway | | Johns Creek, GA | 12/22/2016 | 100 | 2001 | $14,000 | 101 | 91 |
| Braker Pointe III | | Austin, TX | 12/29/2016 | 100 | 2001 | 49,250 | 196 | 18 |
| Sarasota Commerce Center II | | Sarasota, FL | 6/16/2017 | 100 | 1999 | 23,500 | 149 | 92 |
| Two Independence Square | | Washington, DC | 7/5/2017 | 100 | 1991 | 359,600 | 606 | 100 |
8560 Upland Drive (1) | | Englewood, CO | 7/27/2017 | 72 | 2001 | 17,600 | 149 | 100 |
14-Property Portfolio Sale (2) | | Various | 1/4/2018 | 100 | Various | 430,385 | 2,585 | 76 |
| Total / Weighted Average | | | | | | $894,335 | 3,786 | 79 |
|
| |
| (1) | The sale price and rentable square footage presented for 8560 Upland Drive are gross figures and have not been adjusted for Piedmont's ownership percentage; however, the weighted average percent leased at disposition for dispositions completed over the previous eighteen months includes this property at the Company's pro rata share of ownership. |
| (2) | On January 4, 2018, Piedmont completed the disposition of a 14-property portfolio comprised of 2300 Cabot Drive in Lisle, IL; Windy Point I and II in Schaumburg, IL; Suwanee Gateway One and land in Suwanee, GA; 1200 Crown Colony Drive in Quincy, MA; Piedmont Pointe I and II in Bethesda, MD; 1075 West Entrance Drive and Auburn Hills Corporate Center in Auburn Hills, MI; 5601 Hiatus Road in Tamarac, FL; 2001 NW 64th Street in Ft. Lauderdale, FL; Desert Canyon 300 in Phoenix, AZ; 5301 Maryland Way in Brentwood, TN; and 2120 West End Avenue in Nashville, TN. The sale price presented for the 14-property portfolio includes a $4.5 million earnout payment attributable to approximately 150,000 square feet of additional "in-process" leasing activity that was completed at the properties subsequent to the sale. |
Piedmont Office Realty Trust, Inc.
Other Investments
As of March 31, 2018
($ and square footage in thousands)
Developable Land Parcels
|
| | | | |
| Property | Location | Adjacent Piedmont Property | Acres | Real Estate Book Value |
| Gavitello | Atlanta, GA | The Medici | 2.0 | $2,686 |
| Glenridge Highlands Three | Atlanta, GA | Glenridge Highlands One and Two | 3.0 | 1,938 |
| State Highway 161 | Irving, TX | Las Colinas Corporate Center I and II, 161 Corporate Center | 4.5 | 3,320 |
| Royal Lane | Irving, TX | 6011, 6021 and 6031 Connection Drive | 10.6 | 2,834 |
| John Carpenter Freeway | Irving, TX | 750 West John Carpenter Freeway | 3.5 | 1,000 |
| TownPark | Lake Mary, FL | 400 and 500 TownPark | 18.9 | 6,242 |
| Total | | | 42.5 | $18,020 |
Development and / or Redevelopment Projects in Process
|
| | | | | | | | | |
| Property | Location | Adjacent Piedmont Property | Construction Type | Targeted Completion Date | Percent Leased (%) | Square Feet | Current Asset Basis (Accrual) | Project Capital Expended (Cash) | Estimated Additional Capital Required (Cash) |
| Two Pierce Place | Itasca, IL | Not Applicable | Redevelopment | Q4 2018 (1) | 39 | 486.5 | $60.6 million | $6.6 million | $7.5 million |
| | | | | | | | | | |
|
| |
| (1) | The majority of the project will be completed by the end of the second quarter of 2018; however, several elements will not be completed until the fourth quarter of 2018. |
Piedmont Office Realty Trust, Inc.
Supplemental Definitions
|
|
Included below are definitions of various terms used throughout this supplemental report, including definitions of certain non-GAAP financial measures and the reasons why the Company’s management believes these measures provide useful information to investors about the Company’s financial condition and results of operations. Reconciliations of any non-GAAP financial measures defined below are included beginning on page 41.
|
Adjusted Funds From Operations ("AFFO"): The Company calculates AFFO by starting with Core FFO and adjusting for non-incremental capital expenditures and acquisition-related costs (that are not capitalized) and then adding back non-cash items including: non-real estate depreciation, straight-lined rents and fair value lease adjustments, non-cash components of interest expense and compensation expense, and by making similar adjustments for unconsolidated partnerships and joint ventures. AFFO is a non-GAAP financial measure and should not be viewed as an alternative to net income calculated in accordance with GAAP as a measurement of the Company’s operating performance. The Company believes that AFFO is helpful to investors as a meaningful supplemental comparative performance measure of our ability to make incremental capital investments. Other REITs may not define AFFO in the same manner as the Company; therefore, the Company’s computation of AFFO may not be comparable to that of other REITs. |
Annualized Lease Revenue ("ALR"): ALR is calculated by multiplying (i) rental payments (defined as base rent plus operating expense reimbursements, if payable by the tenant on a monthly basis under the terms of a lease that has been executed, but excluding a) rental abatements and b) rental payments related to executed but not commenced leases for space that was covered by an existing lease), by (ii) 12. In instances in which contractual rents or operating expense reimbursements are collected on an annual, semi-annual, or quarterly basis, such amounts are multiplied by a factor of 1, 2, or 4, respectively, to calculate the annualized figure. For leases that have been executed but not commenced relating to un-leased space, ALR is calculated by multiplying (i) the monthly base rental payment (excluding abatements) plus any operating expense reimbursements for the initial month of the lease term, by (ii) 12. Unless stated otherwise, this measure excludes revenues associated with our unconsolidated joint venture properties and development / re-development properties, if any. |
Core EBITDA: The Company calculates Core EBITDA as net income (computed in accordance with GAAP) before interest, taxes, depreciation and amortization and incrementally removing any impairment losses, gains or losses from sales of property and other significant infrequent items that create volatility within our earnings and make it difficult to determine the earnings generated by our core ongoing business. Core EBITDA is a non-GAAP financial measure and should not be viewed as an alternative to net income calculated in accordance with GAAP as a measurement of the Company’s operating performance. The Company believes that Core EBITDA is helpful to investors as a supplemental performance measure because it provides a metric for understanding the performance of the Company’s results from ongoing operations without taking into account the effects of non-cash expenses (such as depreciation and amortization), as well as items that are not part of normal day-to-day operations of the Company’s business. Other REITs may not define Core EBITDA in the same manner as the Company; therefore, the Company’s computation of Core EBITDA may not be comparable to that of other REITs. |
Core Funds From Operations ("Core FFO"): The Company calculates Core FFO by starting with FFO, as defined by NAREIT, and adjusting for gains or losses on the extinguishment of swaps and/or debt, acquisition-related expenses (that are not capitalized) and any significant non-recurring items. Core FFO is a non-GAAP financial measure and should not be viewed as an alternative to net income calculated in accordance with GAAP as a measurement of the Company’s operating performance. The Company believes that Core FFO is helpful to investors as a supplemental performance measure because it excludes the effects of certain items which can create significant earnings volatility, but which do not directly relate to the Company’s core business operations. As a result, the Company believes that Core FFO can help facilitate comparisons of operating performance between periods and provides a more meaningful predictor of future earnings potential. Other REITs may not define Core FFO in the same manner as the Company; therefore, the Company’s computation of Core FFO may not be comparable to that of other REITs. |
EBITDA: EBITDA is defined as net income before interest, taxes, depreciation and amortization. |
EBITDAre: The Company calculates EBITDAre in accordance with the current National Association of Real Estate Investment Trusts (“NAREIT”) definition. NAREIT currently defines EBITDAre as net income (computed in accordance with GAAP) adjusted for gains or losses from sales of property, impairment losses, depreciation on real estate assets, amortization on real estate assets, interest expense and taxes, along with the same adjustments for unconsolidated partnerships and joint ventures. Some of the adjustments mentioned can vary among owners of identical assets in similar conditions based on historical cost accounting and useful-life estimates. EBITDAre is a non-GAAP financial measure and should not be viewed as an alternative to net income calculated in accordance with GAAP as a measurement of the Company’s operating performance. The Company believes that EBITDAre is helpful to investors as a supplemental performance measure because it provides a metric for understanding the Company’s results from ongoing operations without taking into account the effects of non-cash expenses (such as depreciation and amortization) and capitalization and capital structure expenses (such as interest expense and taxes). The Company also believes that EBITDAre can help facilitate comparisons of operating performance between periods and with other REITs. However, other REITs may not define EBITDAre in accordance with the NAREIT definition, or may interpret the current NAREIT definition differently than the Company; therefore, the Company’s computation of EBITDAre may not be comparable to that of such other REITs. |
Funds From Operations ("FFO"): The Company calculates FFO in accordance with the current National Association of Real Estate Investment Trusts (“NAREIT”) definition. NAREIT currently defines FFO as net income (computed in accordance with GAAP), excluding gains or losses from sales of property and impairment losses, adding back depreciation and amortization on real estate assets, and after the same adjustments for unconsolidated partnerships and joint ventures. These adjustments can vary among owners of identical assets in similar conditions based on historical cost accounting and useful-life estimates. FFO is a non-GAAP financial measure and should not be viewed as an alternative to net income calculated in accordance with GAAP as a measurement of the Company’s operating performance. The Company believes that FFO is helpful to investors as a supplemental performance measure because it excludes the effects of depreciation, amortization and gains or losses from sales of real estate, all of which are based on historical costs, which implicitly assumes that the value of real estate diminishes predictably over time. The Company also believes that FFO can help facilitate comparisons of operating performance between periods and with other REITs. However, other REITs may not define FFO in accordance with the NAREIT definition, or may interpret the current NAREIT definition differently than the Company; therefore, the Company’s computation of FFO may not be comparable to that of such other REITs. |
Gross Assets: Gross Assets is defined as total assets with the add-back of accumulated depreciation and accumulated amortization related to real estate assets. |
Gross Real Estate Assets: Gross Real Estate Assets is defined as total real estate assets with the add-back of accumulated depreciation and accumulated amortization related to real estate assets. |
Incremental Capital Expenditures: Incremental Capital Expenditures are defined as capital expenditures of a non-recurring nature that incrementally enhance the underlying assets' income generating capacity. Tenant improvements, leasing commissions, building capital and deferred lease incentives ("Leasing Costs") incurred to lease space that was vacant at acquisition, Leasing Costs for spaces vacant for greater than one year, Leasing Costs for spaces at newly acquired properties for which in-place leases expire shortly after acquisition, improvements associated with the expansion of a building and renovations that change the underlying classification of a building are included in this measure. |
NOI from Unconsolidated Joint Ventures: NOI from Unconsolidated Joint Ventures is defined as Property NOI attributable to our interests in properties owned through unconsolidated partnerships. We present this measure on an accrual basis and a cash basis, which eliminates the effects of straight lined rents and fair value lease revenue. NOI from Unconsolidated Joint Ventures is a non-GAAP measure and therefore may not be comparable to similarly defined data provided by other REITs. |
Non-Incremental Capital Expenditures: Non-Incremental Capital Expenditures are defined as capital expenditures of a recurring nature related to tenant improvements and leasing commissions that do not incrementally enhance the underlying assets' income generating capacity. We exclude first generation tenant improvements and leasing commissions from this measure, in addition to other capital expenditures that qualify as Incremental Capital Expenditures, as defined above. |
Property Net Operating Income ("Property NOI"): The Company calculates Property NOI by starting with Core EBITDA and adjusting for general and administrative expense, income associated with property management performed by Piedmont for other organizations and other income or expense items for the Company, such as interest income from loan investments or costs from the pursuit of non-consummated transactions. The Company may present this measure on an accrual basis or a cash basis. When presented on a cash basis, the effects of straight lined rents and fair value lease revenue are also eliminated. Property NOI is a non-GAAP financial measure and should not be viewed as an alternative to net income calculated in accordance with GAAP as a measurement of the Company’s operating performance. The Company believes that Property NOI is helpful to investors as a supplemental comparative performance measure of income generated by its properties alone without the administrative overhead of the Company. Other REITs may not define Property NOI in the same manner as the Company; therefore, the Company’s computation of Property NOI may not be comparable to that of other REITs. |
Same Store Net Operating Income ("Same Store NOI"): The Company calculates Same Store NOI as Property NOI attributable to the properties for which the following criteria were met during the entire span of the current and prior year reporting periods: (i) they were owned, (ii) they were not under development / redevelopment, and (iii) none of the operating expenses for which were capitalized. Same Store NOI also excludes amounts attributable to unconsolidated joint venture and land assets. The Company may present this measure on an accrual basis or a cash basis. When presented on a cash basis, the effects of straight lined rents and fair value lease revenue are also eliminated. Same Store NOI is a non-GAAP financial measure and should not be viewed as an alternative to net income calculated in accordance with GAAP as a measurement of the Company’s operating performance. The Company believes that Same Store NOI is helpful to investors as a supplemental comparative performance measure of the income generated from the same group of properties from one period to the next. Other REITs may not define Same Store NOI in the same manner as the Company; therefore, the Company’s computation of Same Store NOI may not be comparable to that of other REITs. |
Same Store Properties: Same Store Properties is defined as those properties for which the following criteria were met during the entire span of the current and prior year reporting periods: (i) they were owned, (ii) they were not under development / redevelopment, and (iii) none of the operating expenses for which were capitalized. Same Store Properties excludes unconsolidated joint venture and land assets. |
Piedmont Office Realty Trust, Inc.
Research Coverage
Equity Research Coverage
|
| | | |
| Barry Oxford | Jed Reagan | Anthony Paolone, CFA | |
| D.A. Davidson & Company | Green Street Advisors | JP Morgan | |
| 260 Madison Avenue, 8th Floor | 660 Newport Center Drive, Suite 800 | 383 Madison Avenue | |
| New York, NY 10016 | Newport Beach, CA 92660 | 34th Floor | |
| Phone: (212) 240-9871 | Phone: (949) 640-8780 | New York, NY 10179 | |
| | | Phone: (212) 622-6682 | |
| | | | |
| | | | |
| David Rodgers, CFA | John W. Guinee, III | Michael Lewis, CFA | |
| Robert W. Baird & Co. | Stifel, Nicolaus & Company | SunTrust Robinson Humphrey | |
| 200 Public Square | One South Street | 711 Fifth Avenue, 14th Floor | |
| Suite 1650 | 16th Floor | New York, NY 10022 | |
| Cleveland, OH 44139 | Baltimore, MD 21202 | Phone: (212) 319-5659 | |
| Phone: (216) 737-7341 | Phone: (443) 224-1307 | | |
| | | | |
| | | | |
| | | | |
| | | | |
Fixed Income Research Coverage
|
| | |
| Mark S. Streeter, CFA | | |
| JP Morgan | | |
| 383 Madison Avenue | | |
| 3rd Floor | | |
| New York, NY 10179 | | |
| Phone: (212) 834-5086 | | |
| | | |
| | | |
| | | |
Piedmont Office Realty Trust, Inc.
Funds From Operations, Core Funds From Operations, and Adjusted Funds From Operations Reconciliations
Unaudited (in thousands)
|
| | | | | | | | | | | | | | | | | | | |
| | Three Months Ended |
| | 3/31/2018 | | 12/31/2017 | | 9/30/2017 | | 6/30/2017 | | 3/31/2017 |
| | | | | | | | | | |
| GAAP net income applicable to common stock | $ | 57,830 |
| | $ | (31,383 | ) | | $ | 126,133 |
| | $ | 23,710 |
| | $ | 15,104 |
|
Depreciation (1) (2) | 26,969 |
| | 28,242 |
| | 29,774 |
| | 29,932 |
| | 30,629 |
|
Amortization (1) | 16,716 |
| | 17,499 |
| | 18,107 |
| | 19,315 |
| | 20,406 |
|
Impairment loss (1) | — |
| | 46,461 |
| | — |
| | — |
| | — |
|
Loss / (gain) on sale of properties (1) | (45,209 | ) | | 77 |
| | (113,195 | ) | | (6,492 | ) | | 53 |
|
| NAREIT funds from operations applicable to common stock | 56,306 |
| | 60,896 |
| | 60,819 |
| | 66,465 |
| | 66,192 |
|
| Adjustments: | | | | | | | | | |
| Acquisition costs | — |
| | — |
| | — |
| | — |
| | 6 |
|
| Loss / (gain) on extinguishment of debt | 1,680 |
| | — |
| | — |
| | — |
| | — |
|
| Core funds from operations applicable to common stock | 57,986 |
| | 60,896 |
| | 60,819 |
| | 66,465 |
| | 66,198 |
|
| Adjustments: | | | | | | | | | |
| Amortization of debt issuance costs, fair market adjustments on notes payable, and discount on senior notes | 466 |
| | 604 |
| | 634 |
| | 628 |
| | 630 |
|
| Depreciation of non real estate assets | 169 |
| | 212 |
| | 218 |
| | 184 |
| | 195 |
|
Straight-line effects of lease revenue (1) | (3,473 | ) | | (5,553 | ) | | (3,602 | ) | | (6,634 | ) | | (5,703 | ) |
| Stock-based and other non-cash compensation expense | 288 |
| | 1,937 |
| | 1,250 |
| | 911 |
| | 2,041 |
|
Amortization of lease-related intangibles (1) | (1,643 | ) | | (1,685 | ) | | (1,720 | ) | | (1,611 | ) | | (1,559 | ) |
| Acquisition costs | — |
| | — |
| | — |
| | — |
| | (6 | ) |
| Non-incremental capital expenditures | (7,953 | ) | | (13,463 | ) | | (5,229 | ) | | (9,073 | ) | | (7,672 | ) |
| Adjusted funds from operations applicable to common stock | $ | 45,840 |
| | $ | 42,948 |
| | $ | 52,370 |
| | $ | 50,870 |
| | $ | 54,124 |
|
|
| |
| (1) | Includes our proportionate share of amounts attributable to consolidated properties and unconsolidated joint ventures. |
| (2) | Excludes depreciation of non real estate assets. |
Piedmont Office Realty Trust, Inc.
Same Store Net Operating Income (Cash Basis)
Unaudited (in thousands)
|
| | | | | | | | | | | | | | | | | | | |
| | Three Months Ended |
| | 3/31/2018 | | 12/31/2017 | | 9/30/2017 | | 6/30/2017 | | 3/31/2017 |
| | | | | | | | | | |
| Net income attributable to Piedmont | $ | 57,830 |
| | $ | (31,383 | ) | | $ | 126,133 |
| | $ | 23,710 |
| | $ | 15,104 |
|
| Net income / (loss) attributable to noncontrolling interest | (2 | ) | | (5 | ) | | (4 | ) | | (3 | ) | | (3 | ) |
| Interest expense | 13,758 |
| | 15,463 |
| | 16,183 |
| | 18,421 |
| | 18,057 |
|
| Depreciation | 27,139 |
| | 28,454 |
| | 29,993 |
| | 30,116 |
| | 30,824 |
|
| Amortization | 16,716 |
| | 17,499 |
| | 18,107 |
| | 19,315 |
| | 20,406 |
|
| Impairment loss | — |
| | 46,461 |
| | — |
| | — |
| | — |
|
| Loss / (gain) on sale of properties | (45,209 | ) | | 77 |
| | (113,195 | ) | | (6,492 | ) | | 53 |
|
| EBITDAre | 70,232 |
| | 76,566 |
| | 77,217 |
| | 85,067 |
| | 84,441 |
|
| (Gain) / loss on extinguishment of debt | 1,680 |
| | — |
| | — |
| | — |
| | — |
|
| Acquisition costs | — |
| | — |
| | — |
| | — |
| | 6 |
|
| Net (recoveries) / loss from casualty events | — |
| | (57 | ) | | 25 |
| | (26 | ) | | 58 |
|
| Core EBITDA | 71,912 |
| | 76,509 |
| | 77,242 |
| | 85,041 |
| | 84,505 |
|
| General & administrative expenses | 6,552 |
| | 7,466 |
| | 6,202 |
| | 7,551 |
| | 8,155 |
|
| Management fee revenue | (150 | ) | | (161 | ) | | (253 | ) | | (180 | ) | | (329 | ) |
| Other (income) / expense | (230 | ) | | (156 | ) | | (171 | ) | | (12 | ) | | 36 |
|
| Straight-line effects of lease revenue | (3,473 | ) | | (5,553 | ) | | (3,602 | ) | | (6,634 | ) | | (5,703 | ) |
| Amortization of lease-related intangibles | (1,643 | ) | | (1,685 | ) | | (1,720 | ) | | (1,611 | ) | | (1,559 | ) |
| Property net operating income (cash basis) | 72,968 |
| | 76,420 |
| | 77,698 |
| | 84,155 |
| | 85,105 |
|
| Deduct net operating (income) / loss from: | | | | | | | | | |
| Acquisitions | (666 | ) | | (23 | ) | | — |
| | — |
| | — |
|
| Dispositions | (182 | ) | | (6,749 | ) | | (8,001 | ) | | (15,486 | ) | | (15,590 | ) |
| Other investments | (1,517 | ) | | (2,442 | ) | | (2,339 | ) | | (2,171 | ) | | (1,767 | ) |
| Same store net operating income (cash basis) | $ | 70,603 |
| | $ | 67,206 |
| | $ | 67,358 |
| | $ | 66,498 |
| | $ | 67,748 |
|
Piedmont Office Realty Trust, Inc.
Unconsolidated Joint Venture Net Operating Income Reconciliations
Pro rata and unaudited (in thousands)
|
| | | | | | | | | | | | | | | | | | | |
| | Three Months Ended |
| | 3/31/2018 | | 12/31/2017 | | 9/30/2017 | | 6/30/2017 | | 3/31/2017 |
| | | | | | | | | | |
| Equity in income of unconsolidated joint ventures | $ | — |
| | $ | (27 | ) | | $ | 3,754 |
| | $ | 107 |
| | $ | 11 |
|
| | | | | | | | | | |
| Interest expense | — |
| | — |
| | — |
| | — |
| | — |
|
| | | | | | | | | | |
| Depreciation | — |
| | — |
| | — |
| | 65 |
| | 64 |
|
| | | | | | | | | | |
| Amortization | — |
| | — |
| | — |
| | 16 |
| | 8 |
|
| | | | | | | | | | |
| Impairment loss | — |
| | — |
| | — |
| | — |
| | — |
|
| | | | | | | | | | |
| Loss / (gain) on sale of properties | — |
| | — |
| | (3,683 | ) | | — |
| | — |
|
| | | | | | | | | | |
| EBITDAre and Core EBITDA | — |
| | (27 | ) | | 71 |
| | 188 |
| | 83 |
|
| | | | | | | | | | |
| General and administrative expenses | — |
| | 15 |
| | 13 |
| | 22 |
| | 5 |
|
| | | | | | | | | | |
| Other (income) / expense | — |
| | — |
| | — |
| | — |
| | — |
|
| | | | | | | | | | |
| Property net operating income (accrual basis) | — |
| | (12 | ) | | 84 |
| | 210 |
| | 88 |
|
| | | | | | | | | | |
| Straight-line effects of lease revenue | — |
| | — |
| | (41 | ) | | (95 | ) | | 2 |
|
| | | | | | | | | | |
| Amortization of lease-related intangibles | — |
| | — |
| | — |
| | — |
| | — |
|
| | | | | | | | | | |
| Property net operating income (cash basis) | $ | — |
| | $ | (12 | ) | | $ | 43 |
| | $ | 115 |
| | $ | 90 |
|
Piedmont Office Realty Trust, Inc.
Property Detail - In-Service Portfolio (1)
As of March 31, 2018
(in thousands)
|
| | | | | | | | | | | |
| Property | City | State | Percent Ownership | Year Built / Major Refurbishment | Rentable Square Footage Owned | Leased Percentage | Commenced Leased Percentage | Economic
Leased
Percentage (2) |
| | | | | | | | | |
| Atlanta | | | | | | | | |
| Glenridge Highlands Two | Atlanta | GA | 100.0% | 2000 | 426 | 100.0 | % | 97.4 | % | 97.4 | % |
| The Dupree | Atlanta | GA | 100.0% | 1997 | 138 | 100.0 | % | 100.0 | % | 100.0 | % |
| The Medici | Atlanta | GA | 100.0% | 2008 | 156 | 100.0 | % | 100.0 | % | 96.8 | % |
| 1155 Perimeter Center West | Atlanta | GA | 100.0% | 2000 | 377 | 100.0 | % | 100.0 | % | 100.0 | % |
| Galleria 300 | Atlanta | GA | 100.0% | 1987 | 432 | 97.9 | % | 97.0 | % | 91.7 | % |
| Glenridge Highlands One | Atlanta | GA | 100.0% | 1998 | 288 | 97.2 | % | 95.5 | % | 95.5 | % |
| Galleria 200 | Atlanta | GA | 100.0% | 1984 | 432 | 88.2 | % | 87.3 | % | 54.4 | % |
| Metropolitan Area Subtotal / Weighted Average | | | | | 2,249 | 97.0 | % | 95.9 | % | 88.4 | % |
| Boston | | | | | | | | |
| 80 Central Street | Boxborough | MA | 100.0% | 1988 | 150 | 85.3 | % | 85.3 | % | 85.3 | % |
| 90 Central Street | Boxborough | MA | 100.0% | 2001 | 175 | 100.0 | % | 100.0 | % | 100.0 | % |
| 1414 Massachusetts Avenue | Cambridge | MA | 100.0% | 1873 / 1956 | 78 | 100.0 | % | 100.0 | % | 100.0 | % |
| One Brattle Square | Cambridge | MA | 100.0% | 1991 | 96 | 99.0 | % | 99.0 | % | 97.9 | % |
| 225 Presidential Way | Woburn | MA | 100.0% | 2001 | 202 | 100.0 | % | 100.0 | % | 100.0 | % |
| 235 Presidential Way | Woburn | MA | 100.0% | 2000 | 238 | 100.0 | % | 100.0 | % | 100.0 | % |
| 5 & 15 Wayside Road | Burlington | MA | 100.0% | 1999 & 2001 | 272 | 91.5 | % | 91.5 | % | 91.5 | % |
| 5 Wall Street | Burlington | MA | 100.0% | 2008 | 182 | 100.0 | % | 100.0 | % | 100.0 | % |
| One Wayside Road | Burlington | MA | 100.0% | 1997 | 201 | 100.0 | % | 100.0 | % | 100.0 | % |
| Metropolitan Area Subtotal / Weighted Average | | | | | 1,594 | 97.1 | % | 97.1 | % | 97.1 | % |
| Chicago | | | | | | | | |
| 500 West Monroe Street | Chicago | IL | 100.0% | 1991 | 967 | 95.3 | % | 95.3 | % | 93.7 | % |
| Metropolitan Area Subtotal / Weighted Average | | | | | 967 | 95.3 | % | 95.3 | % | 93.7 | % |
|
| | | | | | | | | | | |
| Property | City | State | Percent Ownership | Year Built / Major Refurbishment | Rentable Square Footage Owned | Leased Percentage | Commenced Leased Percentage | Economic
Leased
Percentage (2) |
| Dallas |
|
|
|
|
|
|
|
|
| 6031 Connection Drive | Irving | TX | 100.0% | 1999 | 232 | 74.6 | % | 74.6 | % | 62.9 | % |
| 6021 Connection Drive | Irving | TX | 100.0% | 2000 | 222 | 100.0 | % | 100.0 | % | 100.0 | % |
| 6011 Connection Drive | Irving | TX | 100.0% | 1999 | 152 | 100.0 | % | 100.0 | % | 100.0 | % |
| Las Colinas Corporate Center I | Irving | TX | 100.0% | 1998 | 159 | 88.1 | % | 88.1 | % | 88.1 | % |
| Las Colinas Corporate Center II | Irving | TX | 100.0% | 1998 | 228 | 89.9 | % | 88.6 | % | 86.8 | % |
| 6565 North MacArthur Boulevard | Irving | TX | 100.0% | 1998 | 260 | 94.2 | % | 92.7 | % | 90.0 | % |
| One Lincoln Park | Dallas | TX | 100.0% | 1999 | 262 | 99.6 | % | 99.6 | % | 99.6 | % |
| 161 Corporate Center | Irving | TX | 100.0% | 1998 | 105 | 100.0 | % | 100.0 | % | 100.0 | % |
| Park Place on Turtle Creek | Dallas | TX | 100.0% | 1986 | 178 | 89.9 | % | 89.9 | % | 89.3 | % |
| 750 West John Carpenter Freeway | Irving | TX | 100.0% | 1999 | 316 | 86.4 | % | 86.4 | % | 78.2 | % |
| Metropolitan Area Subtotal / Weighted Average |
|
|
|
| 2,114 | 91.6 | % | 91.2 | % | 88.2 | % |
| Minneapolis |
|
|
|
|
|
|
|
|
| Crescent Ridge II | Minnetonka | MN | 100.0% | 2000 | 301 | 90.4 | % | 90.4 | % | 90.0 | % |
| US Bancorp Center | Minneapolis | MN | 100.0% | 2000 | 934 | 98.5 | % | 92.8 | % | 92.1 | % |
| One Meridian Crossings | Richfield | MN | 100.0% | 1997 | 195 | 100.0 | % | 100.0 | % | 100.0 | % |
| Two Meridian Crossings | Richfield | MN | 100.0% | 1998 | 189 | 97.9 | % | 97.9 | % | 97.9 | % |
| Norman Pointe I | Bloomington | MN | 100.0% | 2000 | 214 | 70.6 | % | 70.6 | % | 67.3 | % |
| Metropolitan Area Subtotal / Weighted Average |
|
|
|
| 1,833 | 94.0 | % | 91.1 | % | 90.3 | % |
| New York |
|
|
|
|
|
|
|
|
| 200 Bridgewater Crossing | Bridgewater | NJ | 100.0% | 2002 | 309 | 97.7 | % | 95.8 | % | 95.8 | % |
| 60 Broad Street | New York | NY | 100.0% | 1962 | 1,033 | 98.1 | % | 98.1 | % | 98.1 | % |
| 600 Corporate Drive | Lebanon | NJ | 100.0% | 2005 | 125 | 100.0 | % | 100.0 | % | 100.0 | % |
| 400 Bridgewater Crossing | Bridgewater | NJ | 100.0% | 2002 | 304 | 100.0 | % | 100.0 | % | 100.0 | % |
| Metropolitan Area Subtotal / Weighted Average |
|
|
|
| 1,771 | 98.5 | % | 98.1 | % | 98.1 | % |
| Orlando |
|
|
|
|
|
|
|
|
| 400 TownPark | Lake Mary | FL | 100.0% | 2008 | 176 | 80.7 | % | 72.2 | % | 30.1 | % |
| 500 TownPark | Lake Mary | FL | 100.0% | 2016 | 134 | 100.0 | % | 79.1 | % | 79.1 | % |
| SunTrust Center | Orlando | FL | 100.0% | 1988 | 646 | 92.7 | % | 92.7 | % | 88.9 | % |
| 501 West Church Street | Orlando | FL | 100.0% | 2003 | 182 | 100.0 | % | 100.0 | % | 100.0 | % |
| CNL Center I | Orlando | FL | 99.0% | 1999 | 347 | 98.6 | % | 98.6 | % | 96.5 | % |
| CNL Center II | Orlando | FL | 99.0% | 2006 | 270 | 97.4 | % | 92.6 | % | 92.6 | % |
| Metropolitan Area Subtotal / Weighted Average |
|
|
|
| 1,755 | 94.7 | % | 91.5 | % | 85.5 | % |
| Washington, D.C. |
|
|
|
|
|
|
|
|
| 1201 Eye Street | Washington | DC | 98.6% (3) | 2001 | 269 | 47.6 | % | 26.8 | % | 15.2 | % |
| 1225 Eye Street | Washington | DC | 98.1% (3) | 1986 | 225 | 94.7 | % | 94.7 | % | 89.3 | % |
| 3100 Clarendon Boulevard | Arlington | VA | 100.0% | 1987 / 2015 | 261 | 54.4 | % | 45.6 | % | 39.1 | % |
| 400 Virginia Avenue | Washington | DC | 100.0% | 1985 | 224 | 66.5 | % | 66.5 | % | 61.6 | % |
| 4250 North Fairfax Drive | Arlington | VA | 100.0% | 1998 | 308 | 92.9 | % | 84.7 | % | 51.9 | % |
| One Independence Square | Washington | DC | 100.0% | 1991 | 334 | 93.7 | % | 77.8 | % | 77.2 | % |
| Arlington Gateway | Arlington | VA | 100.0% | 2005 | 326 | 54.3 | % | 48.5 | % | 46.0 | % |
| Metropolitan Area Subtotal / Weighted Average |
|
|
|
| 1,947 | 72.3 | % | 63.3 | % | 53.9 | % |
|
| | | | | | | | | | | |
| Property | City | State | Percent Ownership | Year Built / Major Refurbishment | Rentable
Square
Footage
Owned | Leased Percentage | Commenced Leased Percentage | Economic
Leased
Percentage (2) |
| | | | | | | | | |
| Other |
|
|
|
|
|
|
|
|
| 800 North Brand Boulevard | Glendale | CA | 100.0% | 1990 | 527 | 100.0 | % | 100.0 | % | 100.0 | % |
| 1901 Market Street | Philadelphia | PA | 100.0% | 1987 / 2014 | 801 | 100.0 | % | 100.0 | % | 100.0 | % |
| Enclave Place | Houston | TX | 100.0% | 2015 | 301 | — | % | — | % | — | % |
| 1430 Enclave Parkway | Houston | TX | 100.0% | 1994 | 313 | 100.0 | % | 100.0 | % | 100.0 | % |
| Subtotal / Weighted Average |
|
|
|
| 1,942 | 84.5 | % | 84.5 | % | 84.5 | % |
|
|
|
|
|
|
|
|
|
| Grand Total |
|
| 16,172 | 91.3 | % | 89.3 | % | 85.9 | % |
|
|
|
|
|
|
|
|
|
| | | | | | | | | |
| | | | | | | | | |
|
| |
| NOTE: | The Company has provided disaggregated financial and operational data for informational purposes for readers; however, regardless of the presentation approach used, we continue to evaluate and utilize our consolidated financial results in making operating decisions, allocating resources, and assessing our performance.
|
| (1) | This schedule includes information for Piedmont's in-service portfolio of properties only. Information on investments excluded from this schedule can be found on page 38. |
| (2) | Economic leased percentage excludes the square footage associated with executed but not commenced leases for currently vacant spaces and the square footage associated with tenants receiving rental abatements (after proportional adjustments for tenants receiving only partial rental abatements). |
| (3) | Although Piedmont owns 98.6% of 1201 Eye Street and 98.1% of 1225 Eye Street, it is entitled to 100% of the cash flows for each asset pursuant to the terms of each property ownership entity's joint venture agreement. |
Piedmont Office Realty Trust, Inc.
Supplemental Operating & Financial Data
Risks, Uncertainties and Limitations
Certain statements contained in this supplemental package constitute forward-looking statements within the meaning of Section 27A of the Securities Act of 1933, as amended (the “Securities Act”) and Section 21E of the Securities Exchange Act of 1934, as amended (the “Exchange Act”). We intend for all such forward-looking statements to be covered by the safe-harbor provisions for forward-looking statements contained in Section 27A of the Securities Act and Section 21E of the Exchange Act, as applicable. Such information is subject to certain risks and uncertainties, as well as known and unknown risks, which could cause actual results to differ materially from those projected or anticipated. Therefore, such statements are not intended to be a guarantee of our performance in future periods. Such forward-looking statements can generally be identified by our use of forward-looking terminology such as “may,” “will,” “expect,” “intend,” “anticipate,” "estimate," “believe,” “continue” or similar words or phrases that are predictions of future events or trends and which do not relate solely to historical matters. Examples of such statements in this supplemental package include our estimated Core FFO and Core FFO per diluted share for calendar year 2017 and certain expected future financing requirements and expenditures.
The following are some of the factors that could cause our actual results and expectations to differ materially from those described in our forward-looking statements: economic, regulatory and / or socio-economic changes (including accounting standards) that impact the real estate market generally or that could affect the patterns of use of commercial office space; the success of our real estate strategies and investment objectives, including our ability to identify and consummate suitable acquisitions and divestitures; lease terminations or lease defaults, particularly by one of our large lead tenants; the impact of competition on our efforts to renew existing leases or re-let space on terms similar to existing leases; changes in the economies and other conditions affecting the office sector in general and the specific markets in which we operate, particularly in Washington, D.C., the New York metropolitan area, and Chicago where we have high concentrations of office properties; the illiquidity of real estate investments, including the resulting impediment on our ability to quickly respond to adverse changes in the performance of our properties; the risks and uncertainties associated with the acquisition of properties, many of which risks and uncertainties may not be known at the time of acquisition; development and construction delays and resultant increased costs and risks; our real estate development strategies may not be successful; future acts of terrorism in any of the major metropolitan areas in which we own properties or future cybersecurity attacks against us or any of our tenants; additional risks and costs associated with directly managing properties occupied by government tenants; the effect on us of adverse market and economic conditions, including any resulting impairment charges on both our long-lived assets or goodwill; availability of financing and our lending banks' ability to honor existing line of credit commitments; costs of complying with governmental laws and regulations; the effect of future offerings of debt or equity securities or changes in market interest rates on the value of our common stock; uncertainties associated with environmental and other regulatory matters; potential changes in political environment and reduction in federal and/or state funding of our governmental tenants; any change in the financial condition of any of our large lead tenants; the effect of any litigation to which we are, or may become, subject; changes in tax laws impacting REITs and real estate in general, as well as our ability to continue to qualify as a REIT under the Internal Revenue Code of 1986; the future effectiveness of our internal controls and procedures; and other factors detailed in our most recent Annual Report on Form 10-K and other documents we file with the Securities and Exchange Commission.
Readers are cautioned not to place undue reliance on these forward-looking statements, which speak only as of the date of this supplemental report. We cannot guarantee the accuracy of any such forward-looking statements contained in this supplemental report, and we do not intend to publicly update or revise any forward-looking statements, whether as a result of new information, future events, or otherwise.