| EXHIBIT 99.2 | |||||

Piedmont Office Realty Trust, Inc.
Quarterly Supplemental Information
Index
| Page | Page | |||||||||||||
| Introduction | Other Investments | |||||||||||||
| Corporate Data | Other Investments Detail | |||||||||||||
| Investor Information | Supporting Information | |||||||||||||
| Earnings Release | Definitions | |||||||||||||
| Key Performance Indicators | Research Coverage | |||||||||||||
| Financials | Non-GAAP Reconciliations | |||||||||||||
| Balance Sheets | Property Detail - In-Service Portfolio | |||||||||||||
| Income Statements | Major Leases Not Yet Commenced and Major Abatements | |||||||||||||
| Funds From Operations / Adjusted Funds From Operations | Risks, Uncertainties and Limitations | |||||||||||||
| Same Store Analysis | ||||||||||||||
| Capitalization Analysis | ||||||||||||||
| Debt Summary | ||||||||||||||
| Debt Detail | ||||||||||||||
| Debt Covenant & Ratio Analysis | ||||||||||||||
| Operational & Portfolio Information - Office Property Investments | ||||||||||||||
| Tenant Diversification | ||||||||||||||
| Tenant Credit Rating & Lease Distribution Information | ||||||||||||||
| Leased Percentage Information | ||||||||||||||
| Rental Rate Roll Up / Roll Down Analysis | ||||||||||||||
| Lease Expiration Schedule | ||||||||||||||
| Quarterly Lease Expirations | ||||||||||||||
| Annual Lease Expirations | ||||||||||||||
| Capital Expenditures | ||||||||||||||
| Contractual Tenant Improvements & Leasing Commissions | ||||||||||||||
| Geographic Diversification | ||||||||||||||
| Geographic Diversification by Location Type | ||||||||||||||
| Industry Diversification | ||||||||||||||
| Property Investment Activity | ||||||||||||||
| Notice to Readers: | ||
Please refer to page 43 for a discussion of important risks related to the business of Piedmont Office Realty Trust, Inc., as well as an investment in its securities, including risks that could cause actual results and events to differ materially from results and events referred to in the forward-looking information. Considering these risks, uncertainties, assumptions, and limitations, the forward-looking statements about leasing, financial operations, leasing prospects, acquisitions, dispositions, etc. contained in this quarterly supplemental information report may differ from actual results. | ||
| Certain prior period amounts have been reclassified to conform to the current period financial statement presentation. In addition, many of the schedules herein contain rounding to the nearest thousands or millions and, therefore, the schedules may not total due to this rounding convention. | ||
To supplement the presentation of the Company’s financial results prepared in accordance with U.S. generally accepted accounting principles (GAAP), this report contains certain financial measures that are not prepared in accordance with GAAP, including FFO, Core FFO, AFFO, Same Store NOI, Property NOI, EBITDAre and Core EBITDA. Definitions and reconciliations of these non-GAAP measures to their most comparable GAAP metrics are included beginning on page 36. Each of the non-GAAP measures included in this report has limitations as an analytical tool and should not be considered in isolation or as a substitute for an analysis of the Company’s results calculated in accordance with GAAP. In addition, because not all companies use identical calculations, the Company’s presentation of non-GAAP measures in this report may not be comparable to similarly titled measures disclosed by other companies, including other REITs. The Company may also change the calculation of any of the non-GAAP measures included in this report from time to time in light of its then existing operations. | ||
Piedmont Office Realty Trust, Inc.
Corporate Data
Piedmont Office Realty Trust, Inc. (also referred to herein as "Piedmont" or the "Company") (NYSE: PDM) is an owner, manager, developer, redeveloper and operator of high-quality, Class A office properties in select submarkets located primarily within seven major Eastern U.S. office markets, with over half of its revenue generated from the Sunbelt. Its geographically-diversified, approximately $5 billion portfolio is comprised of approximately 17 million square feet (as of the date of release of this report). The Company is a fully-integrated, self-managed real estate investment trust ("REIT") with local management offices in each of its markets and is investment-grade rated by Standard & Poor’s and Moody’s. The Company was designated an Energy Star Partner of the Year for 2021, and it is the only REIT headquartered in the Southeast to receive that designation. At the end of the fourth quarter of 2021, approximately 80% of the Company's portfolio was Energy Star certified and approximately 45% was LEED certified. Piedmont is headquartered in Atlanta, GA.
This data supplements the information provided in our reports filed with the Securities and Exchange Commission and should be reviewed in conjunction with such filings.
| As of | As of | ||||||||||
| December 31, 2021 | December 31, 2020 | ||||||||||
Number of consolidated in-service office properties (1) | 55 | 54 | |||||||||
Rentable square footage (in thousands) (1) | 17,051 | 16,428 | |||||||||
Percent leased (2) | 85.5 | % | 86.8 | % | |||||||
| Capitalization (in thousands): | |||||||||||
| Total debt - principal amount outstanding (excludes premiums, discounts, and deferred financing costs) | $1,890,000 | $1,632,610 | |||||||||
Equity market capitalization (3) | $2,262,150 | $2,009,914 | |||||||||
Total market capitalization (3) | $4,152,150 | $3,642,524 | |||||||||
Total debt / Total market capitalization (3) | 45.5 | % | 44.8 | % | |||||||
| Average net debt to Core EBITDA - quarterly | 6.0 x | 5.8 x | |||||||||
| Average net debt to Core EBITDA - trailing twelve months | 5.7 x | 5.8 x | |||||||||
| Total debt / Total gross assets | 37.1 | % | 34.4 | % | |||||||
| Common stock data: | |||||||||||
| High closing price during quarter | $19.37 | $16.95 | |||||||||
| Low closing price during quarter | $17.11 | $11.42 | |||||||||
| Closing price of common stock at period end | $18.38 | $16.23 | |||||||||
| Weighted average fully diluted shares outstanding during quarter (in thousands) | 124,412 | 125,544 | |||||||||
| Shares of common stock issued and outstanding at period end (in thousands) | 123,077 | 123,839 | |||||||||
Annual regular dividend per share (4) | $0.84 | $0.84 | |||||||||
| Rating / Outlook: | |||||||||||
| Standard & Poor's | BBB / Stable | BBB / Stable | |||||||||
| Moody's | Baa2 / Stable | Baa2 / Stable | |||||||||
| Employees | 134 | 137 | |||||||||
| (1) | As of December 31, 2021, our consolidated office portfolio consisted of 55 properties (exclusive of one 127,000 square foot property that was out of service for redevelopment, 222 South Orange Avenue in Orlando, FL). | ||||
| (2) | Calculated as square footage associated with commenced leases plus square footage associated with executed but uncommenced leases for vacant spaces at our in-service properties, divided by total rentable in-service square footage, all as of the relevant date, expressed as a percentage. Please refer to page 24 for additional analyses regarding Piedmont's leased percentage. | ||||
| (3) | Reflects common stock closing price, shares outstanding and outstanding debt as of the end of the reporting period, as appropriate. | ||||
| (4) | Total of the regular dividends per share for which record dates occurred over the prior four quarters. | ||||
3
Piedmont Office Realty Trust, Inc.
Investor Information
| Corporate | ||
| 5565 Glenridge Connector, Suite 450 | ||
| Atlanta, Georgia 30342 | ||
| 770.418.8800 | ||
| www.piedmontreit.com | ||
| Executive Management | |||||||||||
| C. Brent Smith | Robert E. Bowers | George Wells | |||||||||
| Chief Executive Officer, President | Chief Financial and Administrative Officer | Chief Operating Officer and | |||||||||
| and Director | and Executive Vice President | Executive Vice President | |||||||||
| Edward H. Guilbert, III | Christopher A. Kollme | Laura P. Moon | Joseph H. Pangburn | ||||||||
| Executive Vice President, Finance, | Executive Vice President, | Chief Accounting Officer and | Executive Vice President, | ||||||||
| Assistant Secretary and Treasurer | Investments | Senior Vice President | Southwest Region | ||||||||
| Investor Relations Contact | |||||||||||
| Thomas R. Prescott | Alex Valente | Robert K. Wiberg | |||||||||
| Executive Vice President, | Executive Vice President, | Executive Vice President, | |||||||||
| Midwest Region and Co-Head of | Southeast Region | Northeast Region and Co-Head of | |||||||||
| Development | Development | ||||||||||
| Board of Directors | |||||||||||
| Frank C. McDowell | Dale H. Taysom | Kelly H. Barrett | Wesley E. Cantrell | ||||||||
| Director, Chair of the Board of Directors, | Director, Vice Chair of the | Director, Chair of the Audit Committee, | Director and Member of the Governance | ||||||||
| Chair of the Compensation Committee, and | Board of Directors, and Member of the | and Member of the Governance Committee | and Compensation Committees | ||||||||
| Member of the Governance Committee | Audit and Capital Committees | ||||||||||
| Glenn G. Cohen | Barbara B. Lang | C. Brent Smith | Jeffery L. Swope | ||||||||
| Director and Member of the Audit and Capital | Director, Chair of the Governance Committee, | Chief Executive Officer, President | Director, Chair of the Capital | ||||||||
| Committees | and Member of the Compensation | and Director | Committee, and Member of the | ||||||||
| Committee | Compensation Committee | ||||||||||
| Transfer Agent | Corporate Counsel | Institutional Analyst Contact | Investor Relations | ||||||||
| Computershare | King & Spalding | Phone: 770.418.8592 | Phone: 866.354.3485 | ||||||||
| P.O. Box 30170 | 1180 Peachtree Street, NE | research.analysts@piedmontreit.com | investor.services@piedmontreit.com | ||||||||
| College Station, TX 77842-3170 | Atlanta, GA 30309 | www.piedmontreit.com | |||||||||
| Phone: 866.354.3485 | Phone: 404.572.4600 | ||||||||||
4
Piedmont Office Realty Trust, Inc.
Earnings Release
ATLANTA, February 7, 2022--Piedmont Office Realty Trust, Inc. ("Piedmont" or the "Company") (NYSE:PDM), an owner of Class A office properties located primarily in seven major Eastern U.S. markets with a majority of its revenue being generated from the Sunbelt, today announced its results for the quarter and year ended December 31, 2021.
Highlights for the Quarter and Year Ended December 31, 2021:
Financial Results:
•The Company recognized a net loss applicable to Piedmont of $31.8 million, or $0.26 per diluted share, and $1.2 million, or $0.01 per diluted share, for the quarter and year ended December 31, 2021, respectively. Both the fourth quarter and year end results reflect a $41.0 million impairment charge due to a change in the holding period assumptions made during the fourth quarter for Piedmont's last remaining Chicago asset.
•Because of the infrequent nature and variability of gains or losses on sales of real estate assets and the impairment charge noted above, the Company is also reporting for comparison purposes Income per share before gains, losses, and impairments, reflecting growth of approximately 10% on a year-over-year basis.
•Piedmont reported Core Funds From Operations ("Core FFO") per share of $0.51 and $1.97 per diluted share for the quarter and year ended December 31, 2021, respectively.
•Piedmont reported a 5.8% and 5.2% increase in Same Store Net Operating Income ("Same Store NOI") on a cash and accrual basis, respectively, for the quarter ended December 31, 2021.
•The Company is introducing 2022 financial guidance of $1.97 to $2.07 per diluted share of Core FFO.
Leasing:
•The Company completed approximately 2.3 million square feet of leasing during the year ended December 31, 2021, including approximately 400,000 square feet during the fourth quarter.
•Piedmont reported an approximately 8% and 16% roll up in cash and accrual basis rents, respectively, for the year ended December 31, 2021.
•The portfolio was approximately 86% leased as of December 31, 2021.
Capital Markets (Including Subsequent Events):
•During the three months ended December 31, 2021, Piedmont acquired 999 Peachtree Street in Atlanta, GA for $223.9 million.
•On January 25, 2022, Piedmont sold Two Pierce Place, the Company's last remaining Chicago-area asset, for $24.0 million.
•On January 28, 2022, the Company completed the previously announced sale of 225 & 235 Presidential Way in Boston for $129.0 million.
Balance Sheet:
•The Company's annualized quarterly and annual average net debt-to-Core EBITDA ratios as of December 31, 2021 were 6.0 x and 5.7x, respectively.
•The Company's Debt-to-Gross Assets ratio was 37.1% as of December 31, 2021.
ESG and Operations:
•2021 marked Piedmont's first year as an Energy Star Partner of the Year.
•During 2021, Piedmont funded its first scholarships to provide need-based, scholastic support to minority students interested in pursuing a career related to the real estate industry.
5
Commenting on fourth quarter and annual results, Brent Smith, President and Chief Executive Officer, said, "We were very pleased to continue the new tenant leasing momentum in the fourth quarter that we began to experience during the third quarter of 2021, which resulted in the execution of approximately 200,000 square feet of new tenant leasing. Combined with
another 200,000 square feet of renewal activity during the fourth quarter and our leasing from earlier in the year, our 2021 leasing activity totaled approximately 2.3 million square feet, slightly ahead of our historical, pre-COVID levels, bolstering our optimism around the office sector’s recovery, particularly for high-quality, modernized, amenity-rich environments such as ours.
"Transactional activity during the fourth quarter also increased. As a result of our acquisition of 999 Peachtree Street in October, as well as the recent completion of two non-core dispositions, approximately 63% of our current annual lease revenues now comes from our Sunbelt properties. We are excited to start 2022 with continued leasing momentum and an 87%-leased portfolio, pro forma for our non-core sales in January, with the majority of vacancy and lease expirations over the next 12-months in our Sunbelt markets. Furthermore, we believe Piedmont is well positioned for continued progress towards our strategic capital recycling goals in 2022, bolstered by numerous buildings expected to be marketed in addition to our ongoing off-market dialogue," Smith added.
Financial Highlights
As a result of recording a $41.0 million, or $0.33 per diluted share, impairment charge associated with changing the holding period assumptions for its last remaining Chicago-area asset, Piedmont recognized a net loss applicable to Piedmont of $31.8 million, or $0.26 per diluted share, and $1.2 million, or $0.01 per diluted share, for the quarter and year ended December 31, 2021, respectively. Net income applicable to Piedmont for the quarter and year ended December 31, 2020 was $22.6 million, or $0.18 per diluted share, and $232.7 million, or $1.85 per diluted share, respectively. The results for the quarter and year ended December 31, 2020 included $14.6 million, or $0.12 per diluted share, and $205.7 million, or $1.63 per diluted share, of gains on sale of real estate assets. The year ended December 31, 2020 also included a $9.3 million, or $0.07 per diluted share, non-recurring loss on early extinguishment of debt due to the early repayment of a mortgage on one of the assets sold during 2020.
Due to the infrequent nature and variability of the real estate items noted above, the Company is also reporting for comparison purposes, Income per share before gains, losses, and impairments of $0.07 and $0.32 per diluted share, for the quarter and year ended December 31, 2021, respectively, as compared to $0.06 and $0.29 per diluted share, for the quarter and year ended December 31, 2020, respectively.
FFO and Core FFO, which remove the impact of gains and losses on sales of real estate assets and impairment charges mentioned above, as well as depreciation and amortization, were both $0.51 per diluted share and $0.46 per diluted share for the quarter ended December 31, 2021 and 2020, respectively, reflecting an 11% increase. FFO for the year ended December 31, 2021 was $1.97 per diluted share, as compared with $1.82 per diluted share for the year ended December 31, 2020. Core FFO, which further removes the 2020 non-recurring loss on early extinguishment of debt mentioned above, was $1.97 per diluted share for the year ended December 31, 2021, as compared with $1.89 per diluted share for the year ended December 31, 2020. The increases in both FFO and Core FFO were primarily attributable to accretive capital recycling activity and rental rate growth, partially offset by an approximately 1% decrease in portfolio occupancy during the year ended December 31, 2021.
Leasing Update
During the three months ended December 31, 2021, Piedmont completed approximately 400,000 square feet of leasing, bringing total leasing for the year to 2.3 million square feet, slightly ahead of pre-COVID average leasing levels. Approximately half of the fourth quarter's executed leases related to new tenant leasing and marked the Company's second consecutive quarter at pre-COVID leasing levels.
The weighted average lease term for the approximately 40 leases executed during the fourth quarter was 6.5 years. Activity was well dispersed throughout the portfolio with only one lease completed during the fourth quarter larger than 50,000 square feet, that being a 13-year new headquarters lease with an undisclosed Fortune 500 tenant for approximately 55,000 square feet at 6031 Connection Drive in Dallas, TX.
Leases executed during the fourth quarter of 2021 for recently occupied space reflected a 3.0% and 6.9% roll up in cash and accrual rents, respectively. For the year ended December 31, 2021, leases executed reflected an overall roll up of 7.5% and 15.6% for cash and accrual basis rents, respectively.
As of December 31, 2021, the Company's reported leased percentage and weighted average remaining lease term were approximately 86% and 6.0 years, respectively. The average lease size was approximately 15,000 square feet and adjusted annualized lease revenue per square foot was approximately $37.50. The leased percentage as of December 31, 2021 was slightly impacted by the acquisition of the 77% leased 999 Peachtree Street in October 2021 further discussed below. 2022 is a low lease expiration year for Piedmont, with approximately 6% of the Company's Annualized Lease Revenue scheduled to expire during the year ending December 31, 2022.
6
Same Store NOI increased 5.8% and 5.2% on a cash and accrual basis, respectively, for the quarter ended December 31, 2021 as compared to the quarter ended December 31, 2020. Same Store NOI for the year ended December 31, 2021 increased 6.5% and 3.4% on a cash and accrual basis, respectively, compared to the year ended December 31, 2020. The increase in both metrics for both periods was primarily attributable to increased rental rates and decreased operating expenses, particularly real estate taxes, as well as the expiration of abatements at certain properties. These increases were partially offset by an approximately 1% overall reduction in portfolio occupancy during 2021 due to slower new tenant touring and leasing activity in 2020 as a result of the COVID-19 pandemic. As of December 31, 2021, the Company had approximately 750,000 square feet of executed leases for vacant space yet to commence or under rental abatement.
Transactional Activity (Including Subsequent Events)
As previously announced, during the three months ended December 31, 2021, Piedmont acquired 999 Peachtree Street, a 622,000 square foot, approximately 77% leased, LEED-Platinum, 28-story, office building located in Atlanta, GA for $223.9 million, or $360 per square foot. Located at the corner of Peachtree and 10th Streets in the heart of Midtown, the property offers spectacular views of the Midtown skyline and nearby Piedmont Park. Superior accessibility to the interstate, MARTA (commuter rail system) and the Midtown/ Beltline bike path, along with premier amenities and close proximity to Georgia Tech and more than 30,000 residents within a 1-mile radius, make 999 Peachtree Street a compelling location for prospective tenants. The acquisition marks Piedmont's entry into Midtown Atlanta, one of the most vibrant, active submarkets in the country. Piedmont plans an exciting redevelopment project to revitalize the asset and deliver a premiere tenant experience.
Also during the three months ended December 31, 2021, the Company purchased the last remaining common area and undeveloped land that it did not already own within its Atlanta Galleria office park for $4 million. Piedmont plans a significant redevelopment of the land including Galleria's park area with food and beverage offerings, a redesigned garden experience, outdoor collaboration space and other amenities which will elevate the surrounding office environment and experience for Piedmont's Atlanta Galleria tenants. The acquisition of these remaining parcels also secures Piedmont's continued involvement in the pending path of travel redesign, which will reimagine the direct, walkable connection of Truist Park and The Battery with the Atlanta Galleria office complex.
On January 25, 2022, Piedmont sold the Two Pierce Place building, located in Itasca, IL for $24.0 million, completing the Company's exit from the Chicago market. Piedmont anticipates that it will recognize minimal gain on this sale during the first quarter of 2022 due to the recognition of an impairment charge related to this asset during the fourth quarter of 2021.
On January 28, 2022, the Company completed the previously announced sale of 225 & 235 Presidential Way in Woburn, MA for $129.0 million, or $293 per square foot. Piedmont anticipates recognizing a gain on sale of real estate assets of approximately $50 million related to this sale during the first quarter of 2022.
On a proforma basis, after consideration of the two January disposition transactions mentioned above, Piedmont's portfolio would have been approximately 87% leased as of December 31, 2021. The Company estimates that approximately 63% of its Annualized Lease Revenue is now generated from its properties located in the Sunbelt.
Balance Sheet
With the application of the net sales proceeds received from the two January dispositions mentioned above, the Company's pro forma quarterly average net debt-to-Core EBITDA ratio and debt-to-gross assets ratio as of December 31, 2021 would have been approximately 5.6 x and 35%, respectively.
As of December 31, 2021, the Company had no secured debt and $210 million of available capacity on its $500 million line of credit. After closing the above dispositions and receiving the related proceeds, available capacity on the $500 million line of credit is currently approximately $321 million.
During the fourth quarter, approximately 1.1 million shares of the Company's common stock were repurchased at an average price of $17.76 per share, leaving approximately $150 million in authorized capacity under the program as of December 31, 2021.
7
ESG and Other Operational Initiatives
2021 marked Piedmont's first year as an Energy Star Partner of the Year, one of only 69 companies selected in the United States, and the only REIT headquartered in the Southeast to be selected.
During 2021, Piedmont began partnering with two Historically Black Colleges and Universities to provide need-based, scholastic support to minority students interested in pursuing a career related to the real estate industry. The scholarships are designed to be awarded to selected rising sophomores and to continue for their junior and senior years at Howard University in Washington, D.C. and Morehouse College in Atlanta, GA. The first recipient is from Houston, TX, a sophomore majoring in Finance at Howard University in Washington, D.C. Recipients will have the opportunity for further industry exposure through an internship with the Company.
First Quarter 2022 Dividend Declaration
On February 2, 2022, the board of directors of Piedmont declared a dividend for the first quarter of 2022 in the amount of $0.21 per share on its common stock to stockholders of record as of the close of business on February 25, 2022, payable on March 18, 2022.
Guidance for 2022
The Company is introducing financial guidance for calendar year 2022 of $1.97 to $2.07 per diluted share of Core FFO. This financial guidance is based upon management's assumptions, estimates and expectations based on information available to management as of the date of this release. Included within the financial guidance are the following assumptions:
•a gradual increase in the physical utilization of our buildings by our customers over the course of the year to a level near pre-pandemic utilization by the end of the year;
•excluding the recently completed sales of the Presidential Way and Two Pierce Place assets, neutral asset recycling during the year with about $350 to $450 million each of acquisitions and dispositions;
•general and administrative expense of about $29 to $31 million for the year;
•excluding acquisition and disposition activity, Same Store NOI on a cash and accrual basis are expected to be flat and to grow 1-3%, respectively, during 2022, impacted by slower leasing transactions during the pandemic; and
•leased percentage is expected to grow to approximately 88% during 2022, excluding acquisition and disposition activity.
Actual results could differ materially from these estimates based on a variety of factors as discussed under "Forward-Looking Statements" below.
| (in millions, except per share data) | Low | High | ||||||||||||
| Net income | $74 | $81 | ||||||||||||
| Add: | ||||||||||||||
| Depreciation | 136 | 142 | ||||||||||||
| Amortization | 82 | 85 | ||||||||||||
| Deduct: | ||||||||||||||
| Gain on sale of real estate assets | (48) | (52) | ||||||||||||
| NAREIT FFO and Core FFO applicable to common stock | $244 | $256 | ||||||||||||
| NAREIT FFO and Core FFO per diluted share | $1.97 | $2.07 | ||||||||||||
Note that individual quarters may fluctuate on both a cash basis and an accrual basis due to the timing of lease commencements and expirations, abatement periods, repairs and maintenance expenses, capital expenditures, capital markets activities, seasonal general and administrative expenses, accrued potential performance-based compensation expenses, and one-time revenue or expense events.
8
Piedmont Office Realty Trust, Inc.
Key Performance Indicators
Unaudited (in thousands except for per share data)
This section of our supplemental report includes non-GAAP financial measures, including, but not limited to, Earnings Before Interest, Taxes, Depreciation, and Amortization for real estate (EBITDAre), Core Earnings Before Interest, Taxes, Depreciation, and Amortization (Core EBITDA), Funds from Operations (FFO), Core Funds from Operations (Core FFO), and Adjusted Funds from Operations (AFFO). Definitions of these non-GAAP measures are provided on page 36 and reconciliations are provided beginning on page 38. | ||
| Three Months Ended | |||||||||||||||||||||||||||||||||||
| Selected Operating Data | 12/31/2021 | 9/30/2021 | 6/30/2021 | 3/31/2021 | 12/31/2020 | ||||||||||||||||||||||||||||||
Percent leased (1) | 85.5 | % | 85.9 | % | 85.9 | % | 86.0 | % | 86.8 | % | |||||||||||||||||||||||||
Percent leased - economic (1) (2) | 81.5 | % | 81.6 | % | 82.6 | % | 80.6 | % | 82.0 | % | |||||||||||||||||||||||||
| Total revenues | $138,164 | $131,071 | $130,218 | $129,257 | $131,529 | ||||||||||||||||||||||||||||||
| Net income / (loss) applicable to Piedmont | -$31,750 | $11,306 | $9,947 | $9,344 | $22,609 | ||||||||||||||||||||||||||||||
| Net income / (loss) per share applicable to common stockholders - diluted | -$0.26 | $0.09 | $0.08 | $0.08 | $0.18 | ||||||||||||||||||||||||||||||
| Core EBITDA | $77,130 | $74,686 | $72,980 | $72,938 | $70,582 | ||||||||||||||||||||||||||||||
| Core FFO applicable to common stock | $63,009 | $62,004 | $60,353 | $60,056 | $57,229 | ||||||||||||||||||||||||||||||
| Core FFO per share - diluted | $0.51 | $0.50 | $0.48 | $0.48 | $0.46 | ||||||||||||||||||||||||||||||
| AFFO applicable to common stock | $39,399 | $41,213 | $41,661 | $37,861 | $36,291 | ||||||||||||||||||||||||||||||
Gross regular dividends (3) | $26,048 | $26,068 | $26,068 | $26,046 | $26,145 | ||||||||||||||||||||||||||||||
Regular dividends per share (3) | $0.21 | $0.21 | $0.21 | $0.21 | $0.21 | ||||||||||||||||||||||||||||||
Same store net operating income - cash basis (4) | 5.8 | % | 11.6 | % | 4.8 | % | 3.9 | % | -5.9 | % | |||||||||||||||||||||||||
Same store net operating income - accrual basis (4) | 5.2 | % | 5.0 | % | 4.7 | % | -1.2 | % | -5.0 | % | |||||||||||||||||||||||||
Rental rate roll up / roll down - cash rents (5) | 3.0 | % | 10.5 | % | 18.2 | % | -2.8 | % | -2.2 | % | |||||||||||||||||||||||||
Rental rate roll up / roll down - accrual rents (5) | 6.9 | % | 16.1 | % | 27.4 | % | 7.0 | % | 5.3 | % | |||||||||||||||||||||||||
| Selected Balance Sheet Data | |||||||||||||||||||||||||||||||||||
| Total real estate assets, net | $3,245,311 | $3,085,457 | $3,079,707 | $3,061,259 | $3,056,034 | ||||||||||||||||||||||||||||||
| Total assets | $3,930,665 | $3,760,648 | $3,758,311 | $3,737,874 | $3,739,810 | ||||||||||||||||||||||||||||||
| Total liabilities | $2,143,242 | $1,900,029 | $1,885,803 | $1,850,529 | $1,841,849 | ||||||||||||||||||||||||||||||
| Ratios & Information for Debt Holders | |||||||||||||||||||||||||||||||||||
Core EBITDA margin (6) | 55.8 | % | 57.0 | % | 56.0 | % | 56.4 | % | 53.7 | % | |||||||||||||||||||||||||
Fixed charge coverage ratio (7) | 5.2 x | 5.5 x | 5.4 x | 5.4 x | 5.1 x | ||||||||||||||||||||||||||||||
Average net debt to Core EBITDA - quarterly (8) | 6.0 x | 5.5 x | 5.7 x | 5.6 x | 5.8 x | ||||||||||||||||||||||||||||||
| Total gross real estate assets | $4,206,993 | $4,012,060 | $3,979,955 | $3,926,798 | $3,891,426 | ||||||||||||||||||||||||||||||
Net debt (9) | $1,881,140 | $1,663,718 | $1,666,300 | $1,658,995 | $1,623,396 | ||||||||||||||||||||||||||||||
| (1) | Please refer to page 24 for additional leased percentage information. | ||||
| (2) | Economic leased percentage excludes the square footage associated with executed but not commenced leases for currently vacant spaces and the square footage associated with tenants receiving rental abatements (after proportional adjustments for tenants receiving only partial rental abatements). Due to variations in rental abatement structures, there will be variability to the economic leased percentage over time as abatements commence and expire. | ||||
| (3) | Dividends are reflected in the quarter in which the record date occurred. | ||||
| (4) | Please refer to the two pages starting with page 14 for additional same store net operating income information. The statistic provided for each of the prior quarters is based on the same store property population applicable at the time that the metric was initially reported. | ||||
| (5) | Please refer to page 25 for additional roll up / roll down analysis information. | ||||
| (6) | Core EBITDA margin is calculated as Core EBITDA divided by total revenues. | ||||
| (7) | The fixed charge coverage ratio is calculated as Core EBITDA divided by the sum of interest expense, principal amortization, capitalized interest and preferred dividends. The Company had no preferred dividends during any of the periods presented; the Company had capitalized interest of $994,675 for the quarter ended December 31, 2021, $1,009,904 for the quarter ended September 30, 2021, $875,804 for the quarter ended June 30, 2021, $812,649 for the quarter ended March 31, 2021, and $368,965 for the quarter ended December 31, 2020; the Company had no principal amortization for the quarters ended December 31, 2021 and September 30, 2021, as its last remaining amortizing loan was repaid during the second quarter of 2021; the Company had principal amortization of $187,087 for the quarter ended June 30, 2021, $185,368 for the quarter ended March 31, 2021, and $365,644 for the quarter ended December 31, 2020. | ||||
| (8) | For the purposes of this calculation, we annualize the period's Core EBITDA and use the average daily balance of debt outstanding during the period, less cash and cash equivalents and escrow deposits and restricted cash as of the end of the period. | ||||
| (9) | Net debt is calculated as the total principal amount of debt outstanding minus cash and cash equivalents and escrow deposits and restricted cash as of the end of the period. | ||||
9
Piedmont Office Realty Trust, Inc.
Consolidated Balance Sheets
Unaudited (in thousands)
| December 31, 2021 | September 30, 2021 | June 30, 2021 | March 31, 2021 | December 31, 2020 | |||||||||||||||||||||||||
| Assets: | |||||||||||||||||||||||||||||
| Real estate, at cost: | |||||||||||||||||||||||||||||
| Land assets | $ | 529,941 | $ | 476,717 | $ | 476,717 | $ | 476,717 | $ | 476,716 | |||||||||||||||||||
| Buildings and improvements | 3,374,903 | 3,259,369 | 3,203,286 | 3,170,152 | 3,123,042 | ||||||||||||||||||||||||
| Buildings and improvements, accumulated depreciation | (861,206) | (829,832) | (804,400) | (776,577) | (751,521) | ||||||||||||||||||||||||
| Intangible lease asset | 178,157 | 148,945 | 155,002 | 155,634 | 158,444 | ||||||||||||||||||||||||
| Intangible lease asset, accumulated amortization | (83,777) | (80,072) | (79,149) | (72,475) | (67,850) | ||||||||||||||||||||||||
| Construction in progress | 43,406 | 48,226 | 67,033 | 47,498 | 56,749 | ||||||||||||||||||||||||
| Real estate assets held for sale, gross | 80,586 | 78,803 | 77,917 | 76,797 | 76,475 | ||||||||||||||||||||||||
| Real estate assets held for sale, accumulated depreciation & amortization | (16,699) | (16,699) | (16,699) | (16,487) | (16,021) | ||||||||||||||||||||||||
| Total real estate assets | 3,245,311 | 3,085,457 | 3,079,707 | 3,061,259 | 3,056,034 | ||||||||||||||||||||||||
| Cash and cash equivalents | 7,419 | 8,189 | 8,122 | 10,689 | 7,331 | ||||||||||||||||||||||||
| Tenant receivables, net of allowance for doubtful accounts | 2,995 | 8,678 | 6,530 | 4,545 | 8,448 | ||||||||||||||||||||||||
| Straight line rent receivable | 162,632 | 159,871 | 156,912 | 153,727 | 148,797 | ||||||||||||||||||||||||
| Notes receivable | 118,500 | 118,500 | 118,500 | 118,500 | 118,500 | ||||||||||||||||||||||||
| Escrow deposits and restricted cash | 1,441 | 6,093 | 1,578 | 1,741 | 1,883 | ||||||||||||||||||||||||
| Prepaid expenses and other assets | 20,485 | 24,915 | 29,469 | 22,647 | 23,277 | ||||||||||||||||||||||||
| Goodwill | 98,918 | 98,918 | 98,918 | 98,918 | 98,918 | ||||||||||||||||||||||||
| Deferred lease costs, gross | 469,671 | 437,020 | 441,488 | 439,342 | 444,211 | ||||||||||||||||||||||||
| Deferred lease costs, accumulated amortization | (205,100) | (195,255) | (191,045) | (181,499) | (171,817) | ||||||||||||||||||||||||
| Other assets held for sale, gross | 9,389 | 9,258 | 9,128 | 8,941 | 5,030 | ||||||||||||||||||||||||
| Other assets held for sale, accumulated amortization | (996) | (996) | (996) | (936) | (802) | ||||||||||||||||||||||||
| Total assets | $ | 3,930,665 | $ | 3,760,648 | $ | 3,758,311 | $ | 3,737,874 | $ | 3,739,810 | |||||||||||||||||||
| Liabilities: | |||||||||||||||||||||||||||||
| Unsecured debt, net of discount | $ | 1,877,790 | $ | 1,665,101 | $ | 1,666,570 | $ | 1,633,819 | $ | 1,594,068 | |||||||||||||||||||
| Secured debt | — | — | — | 27,628 | 27,936 | ||||||||||||||||||||||||
| Accounts payable, accrued expenses, and accrued capital expenditures | 140,501 | 127,675 | 111,562 | 92,183 | 137,680 | ||||||||||||||||||||||||
| Deferred income | 80,686 | 73,614 | 70,594 | 56,638 | 36,891 | ||||||||||||||||||||||||
| Intangible lease liabilities, less accumulated amortization | 39,341 | 26,924 | 29,761 | 32,607 | 35,440 | ||||||||||||||||||||||||
| Interest rate swaps | 4,924 | 6,715 | 7,316 | 7,654 | 9,834 | ||||||||||||||||||||||||
| Total liabilities | $ | 2,143,242 | $ | 1,900,029 | $ | 1,885,803 | $ | 1,850,529 | $ | 1,841,849 | |||||||||||||||||||
| Stockholders' equity: | |||||||||||||||||||||||||||||
| Common stock | 1,231 | 1,241 | 1,241 | 1,240 | 1,238 | ||||||||||||||||||||||||
| Additional paid in capital | 3,701,798 | 3,700,208 | 3,698,656 | 3,697,801 | 3,693,996 | ||||||||||||||||||||||||
| Cumulative distributions in excess of earnings | (1,899,081) | (1,822,441) | (1,807,679) | (1,791,558) | (1,774,856) | ||||||||||||||||||||||||
| Other comprehensive loss | (18,154) | (20,036) | (21,368) | (21,813) | (24,100) | ||||||||||||||||||||||||
| Piedmont stockholders' equity | 1,785,794 | 1,858,972 | 1,870,850 | 1,885,670 | 1,896,278 | ||||||||||||||||||||||||
| Non-controlling interest | 1,629 | 1,647 | 1,658 | 1,675 | 1,683 | ||||||||||||||||||||||||
| Total stockholders' equity | 1,787,423 | 1,860,619 | 1,872,508 | 1,887,345 | 1,897,961 | ||||||||||||||||||||||||
| Total liabilities, redeemable common stock and stockholders' equity | $ | 3,930,665 | $ | 3,760,648 | $ | 3,758,311 | $ | 3,737,874 | $ | 3,739,810 | |||||||||||||||||||
| Common stock outstanding at end of period | 123,077 | 124,136 | 124,132 | 124,029 | 123,839 | ||||||||||||||||||||||||
10
Piedmont Office Realty Trust, Inc.
Consolidated Statements of Income
Unaudited (in thousands except for per share data)
| Three Months Ended | ||||||||||||||||||||||||||||||||
| 12/31/2021 | 9/30/2021 | 6/30/2021 | 3/31/2021 | 12/31/2020 | ||||||||||||||||||||||||||||
| Revenues: | ||||||||||||||||||||||||||||||||
Rental income (1) | $ | 111,203 | $ | 105,592 | $ | 105,209 | $ | 105,170 | $ | 104,560 | ||||||||||||||||||||||
Tenant reimbursements (1) | 23,110 | 21,835 | 21,758 | 20,742 | 23,712 | |||||||||||||||||||||||||||
| Property management fee revenue | 576 | 626 | 536 | 758 | 721 | |||||||||||||||||||||||||||
| Other property related income | 3,275 | 3,018 | 2,715 | 2,587 | 2,536 | |||||||||||||||||||||||||||
| 138,164 | 131,071 | 130,218 | 129,257 | 131,529 | ||||||||||||||||||||||||||||
| Expenses: | ||||||||||||||||||||||||||||||||
| Property operating costs | 56,083 | 51,767 | 51,658 | 51,424 | 55,302 | |||||||||||||||||||||||||||
| Depreciation | 31,952 | 30,562 | 29,998 | 28,103 | 27,236 | |||||||||||||||||||||||||||
| Amortization | 22,014 | 20,373 | 20,693 | 22,912 | 22,324 | |||||||||||||||||||||||||||
| Impairment loss on real estate assets | 41,000 | — | — | — | — | |||||||||||||||||||||||||||
| General and administrative | 7,835 | 6,955 | 8,211 | 7,251 | 7,415 | |||||||||||||||||||||||||||
| 158,884 | 109,657 | 110,560 | 109,690 | 112,277 | ||||||||||||||||||||||||||||
| Other income / (expense): | ||||||||||||||||||||||||||||||||
| Interest expense | (13,917) | (12,450) | (12,345) | (12,580) | (13,048) | |||||||||||||||||||||||||||
| Other income / (expense) | 2,882 | 2,337 | 2,631 | 2,356 | 1,770 | |||||||||||||||||||||||||||
Gain / (loss) on sale of real estate (2) | — | — | — | — | 14,634 | |||||||||||||||||||||||||||
| Net income / (loss) | (31,755) | 11,301 | 9,944 | 9,343 | 22,608 | |||||||||||||||||||||||||||
| Less: Net (income) / loss applicable to noncontrolling interest | 5 | 5 | 3 | 1 | 1 | |||||||||||||||||||||||||||
| Net income / (loss) applicable to Piedmont | $ | (31,750) | $ | 11,306 | $ | 9,947 | $ | 9,344 | $ | 22,609 | ||||||||||||||||||||||
| Weighted average common shares outstanding - diluted | 123,742 | 124,627 | 124,704 | 124,450 | 125,544 | |||||||||||||||||||||||||||
| Net income / (loss) per share applicable to common stockholders - diluted | $ | (0.26) | $ | 0.09 | $ | 0.08 | $ | 0.08 | $ | 0.18 | ||||||||||||||||||||||
| Common stock outstanding at end of period | 123,077 | 124,136 | 124,132 | 124,029 | 123,839 | |||||||||||||||||||||||||||
| (1) | The presentation method used for this line is not in conformance with GAAP. To be in conformance with the current GAAP standard, the Company would need to combine amounts presented on the rental income line with amounts presented on the tenant reimbursements line and present that aggregated figure on one line entitled "rental and tenant reimbursement revenue." The amounts presented on this line were determined based upon the Company's interpretation of the rental charges and billing method provisions in each of the Company's lease documents. | ||||
| (2) | The gain on sale of real estate reflected in the fourth quarter of 2020 was primarily related to the net sale of a three property portfolio in northern New Jersey. | ||||
11
Piedmont Office Realty Trust, Inc.
Consolidated Statements of Income
Unaudited (in thousands except for per share data)
| Three Months Ended | Twelve Months Ended | ||||||||||||||||||||||||||||||||||
| 12/31/2021 | 12/31/2020 | Change ($) | Change (%) | 12/31/2021 | 12/31/2020 | Change ($) | Change (%) | ||||||||||||||||||||||||||||
| Revenues: | |||||||||||||||||||||||||||||||||||
Rental income (1) | $ | 111,203 | $ | 104,560 | $ | 6,643 | 6.4 | % | $ | 427,174 | $ | 433,841 | $ | (6,667) | (1.5) | % | |||||||||||||||||||
Tenant reimbursements (1) | 23,110 | 23,712 | (602) | (2.5) | % | 87,445 | 86,112 | 1,333 | 1.5 | % | |||||||||||||||||||||||||
| Property management fee revenue | 576 | 721 | (145) | (20.1) | % | 2,496 | 2,867 | (371) | (12.9) | % | |||||||||||||||||||||||||
| Other property related income | 3,275 | 2,536 | 739 | 29.1 | % | 11,595 | 12,204 | (609) | (5.0) | % | |||||||||||||||||||||||||
| 138,164 | 131,529 | 6,635 | 5.0 | % | 528,710 | 535,024 | (6,314) | (1.2) | % | ||||||||||||||||||||||||||
| Expenses: | |||||||||||||||||||||||||||||||||||
| Property operating costs | 56,083 | 55,302 | (781) | (1.4) | % | 210,932 | 214,933 | 4,001 | 1.9 | % | |||||||||||||||||||||||||
| Depreciation | 31,952 | 27,236 | (4,716) | (17.3) | % | 120,615 | 110,575 | (10,040) | (9.1) | % | |||||||||||||||||||||||||
| Amortization | 22,014 | 22,324 | 310 | 1.4 | % | 85,992 | 93,294 | 7,302 | 7.8 | % | |||||||||||||||||||||||||
| Impairment loss on real estate assets | 41,000 | — | (41,000) | (100.0) | % | 41,000 | — | (41,000) | (100.0) | % | |||||||||||||||||||||||||
| General and administrative | 7,835 | 7,415 | (420) | (5.7) | % | 30,252 | 27,464 | (2,788) | (10.2) | % | |||||||||||||||||||||||||
| 158,884 | 112,277 | (46,607) | (41.5) | % | 488,791 | 446,266 | (42,525) | (9.5) | % | ||||||||||||||||||||||||||
| Other income / (expense): | |||||||||||||||||||||||||||||||||||
| Interest expense | (13,917) | (13,048) | (869) | (6.7) | % | (51,292) | (54,990) | 3,698 | 6.7 | % | |||||||||||||||||||||||||
| Other income / (expense) | 2,882 | 1,770 | 1,112 | 62.8 | % | 10,206 | 2,587 | 7,619 | 294.5 | % | |||||||||||||||||||||||||
| Gain / (loss) on extinguishment of debt | — | — | — | — | (9,336) | 9,336 | 100.0 | % | |||||||||||||||||||||||||||
Gain / (loss) on sale of real estate (2) | — | 14,634 | (14,634) | (100.0) | % | — | 205,666 | (205,666) | (100.0) | % | |||||||||||||||||||||||||
| Net income / (loss) | (31,755) | 22,608 | (54,363) | (240.5) | % | (1,167) | 232,685 | (233,852) | (100.5) | % | |||||||||||||||||||||||||
| Less: Net (income) / loss applicable to noncontrolling interest | 5 | 1 | 4 | 400.0 | % | 14 | 3 | 11 | 366.7 | % | |||||||||||||||||||||||||
| Net income / (loss) applicable to Piedmont | $ | (31,750) | $ | 22,609 | $ | (54,359) | (240.4) | % | $ | (1,153) | $ | 232,688 | $ | (233,841) | (100.5) | % | |||||||||||||||||||
| Weighted average common shares outstanding - diluted | 123,742 | 125,544 | 123,978 | 126,104 | |||||||||||||||||||||||||||||||
| Net income / (loss) per share applicable to common stockholders - diluted | $ | (0.26) | $ | 0.18 | $ | (0.01) | $ | 1.85 | |||||||||||||||||||||||||||
| Common stock outstanding at end of period | 123,077 | 123,839 | 123,077 | 123,839 | |||||||||||||||||||||||||||||||
| Reconciliation of Net income / (loss) applicable to Piedmont to Income before gains, losses, and impairments: | |||||||||||||||||||||||||||||||||||
| Net income / (loss) applicable to Piedmont | $ | (31,750) | $ | 22,609 | $ | (1,153) | $ | 232,688 | |||||||||||||||||||||||||||
| Plus: | |||||||||||||||||||||||||||||||||||
| Impairment loss on real estate assets | 41,000 | — | 41,000 | — | |||||||||||||||||||||||||||||||
| Loss on extinguishment of debt | — | — | — | 9,336 | |||||||||||||||||||||||||||||||
| Less: | |||||||||||||||||||||||||||||||||||
| Gain on sale of real estate | — | 14,634 | — | 205,666 | |||||||||||||||||||||||||||||||
| Income before gains, losses, and impairments: | $ | 9,250 | $ | 7,975 | $ | 39,847 | $ | 36,358 | |||||||||||||||||||||||||||
| Change period over period | 16 | % | 10 | % | |||||||||||||||||||||||||||||||
Weighted average common shares outstanding - diluted (3) | 124,412 | 125,544 | 124,455 | 126,104 | |||||||||||||||||||||||||||||||
| Income per share before gains, losses, and impairments - diluted | $ | 0.07 | $ | 0.06 | $ | 0.32 | $ | 0.29 | |||||||||||||||||||||||||||
| (1) | The presentation method used for this line is not in conformance with GAAP. To be in conformance with the current GAAP standard, the Company would need to combine amounts presented on the rental income line with amounts presented on the tenant reimbursements line and present that aggregated figure on one line entitled "rental and tenant reimbursement revenue." The amounts presented on this line were determined based upon the Company's interpretation of the rental charges and billing method provisions in each of the Company's lease documents. | ||||
| (2) | The gain on sale of real estate for the three months ended December 31, 2020 was primarily related to the net sale of a three property portfolio in northern New Jersey. The gain on sale of real estate for the twelve months ended December 31, 2020 was primarily related to the sale of 1901 Market Street in Philadelphia, PA. | ||||
| (3) | Includes potential dilution under the treasury stock method that would occur if our remaining unvested and potential stock awards vested and resulted in additional common shares outstanding. Such dilution is not included when calculating Net loss per diluted share applicable to Piedmont for the quarter and year ended December 31, 2021 as it would reduce the loss per share presented. | ||||
12
Piedmont Office Realty Trust, Inc.
Funds From Operations, Core Funds From Operations and Adjusted Funds From Operations
Unaudited (in thousands except for per share data)
| Three Months Ended | Twelve Months Ended | |||||||||||||||||||||||||
| 12/31/2021 | 12/31/2020 | 12/31/2021 | 12/31/2020 | |||||||||||||||||||||||
| GAAP net income / (loss) applicable to common stock | $ | (31,750) | $ | 22,609 | $ | (1,153) | $ | 232,688 | ||||||||||||||||||
Depreciation (1) (2) | 31,756 | 26,942 | 119,629 | 109,326 | ||||||||||||||||||||||
Amortization (1) | 22,003 | 22,312 | 85,946 | 93,242 | ||||||||||||||||||||||
| Impairment loss | 41,000 | — | 41,000 | — | ||||||||||||||||||||||
| Loss / (gain) on sale of properties | — | (14,634) | — | (205,666) | ||||||||||||||||||||||
| NAREIT funds from operations and core funds from operations applicable to common stock | 63,009 | 57,229 | 245,422 | 229,590 | ||||||||||||||||||||||
| Adjustments: | ||||||||||||||||||||||||||
| Loss / (gain) on extinguishment of debt | — | — | — | 9,336 | ||||||||||||||||||||||
| Core funds from operations applicable to common stock | 63,009 | 57,229 | 245,422 | 238,926 | ||||||||||||||||||||||
| Adjustments: | ||||||||||||||||||||||||||
| Amortization of debt issuance costs, fair market adjustments on notes payable, and discount on senior notes | 781 | 653 | 2,857 | 2,833 | ||||||||||||||||||||||
| Depreciation of non real estate assets | 187 | 286 | 949 | 1,216 | ||||||||||||||||||||||
Straight-line effects of lease revenue (1) | (1,939) | (2,223) | (10,566) | (22,601) | ||||||||||||||||||||||
| Stock-based compensation adjustments | 2,772 | 2,733 | 7,924 | 7,014 | ||||||||||||||||||||||
Amortization of lease-related intangibles (1) | (3,098) | (2,767) | (11,290) | (12,284) | ||||||||||||||||||||||
Non-incremental capital expenditures (3) | (22,313) | (19,620) | (75,162) | (77,682) | ||||||||||||||||||||||
| Adjusted funds from operations applicable to common stock | $ | 39,399 | $ | 36,291 | $ | 160,134 | $ | 137,422 | ||||||||||||||||||
| Weighted average common shares outstanding - diluted | 124,412 | 125,544 | 124,455 | 126,104 | ||||||||||||||||||||||
| Funds from operations per share (diluted) | $ | 0.51 | $ | 0.46 | $ | 1.97 | $ | 1.82 | ||||||||||||||||||
| Core funds from operations per share (diluted) | $ | 0.51 | $ | 0.46 | $ | 1.97 | $ | 1.89 | ||||||||||||||||||
| Change period over period | 11 | % | 4 | % | ||||||||||||||||||||||
| Common stock outstanding at end of period | 123,077 | 123,839 | 123,077 | 123,839 | ||||||||||||||||||||||
| (1) | Includes our proportionate share of amounts attributable to consolidated properties. | ||||
| (2) | Excludes depreciation of non real estate assets. | ||||
| (3) | Non-incremental capital expenditures are defined on page 36. | ||||
13
Piedmont Office Realty Trust, Inc.
Same Store Net Operating Income (Cash Basis)
Unaudited (in thousands)
| Three Months Ended | Twelve Months Ended | ||||||||||||||||||||||
| 12/31/2021 | 12/31/2020 | 12/31/2021 | 12/31/2020 | ||||||||||||||||||||
| Net income / (loss) applicable to Piedmont | $ | (31,750) | $ | 22,609 | $ | (1,153) | $ | 232,688 | |||||||||||||||
| Net income / (loss) applicable to noncontrolling interest | (5) | (1) | (14) | (3) | |||||||||||||||||||
| Interest expense | 13,917 | 13,048 | 51,292 | 54,990 | |||||||||||||||||||
Depreciation (1) | 31,943 | 27,228 | 120,578 | 110,542 | |||||||||||||||||||
Amortization (1) | 22,003 | 22,312 | 85,946 | 93,242 | |||||||||||||||||||
| Depreciation and amortization attributable to noncontrolling interests | 22 | 20 | 84 | 85 | |||||||||||||||||||
| Impairment loss | 41,000 | — | 41,000 | — | |||||||||||||||||||
| (Gain) / loss on sale of properties | — | (14,634) | — | (205,666) | |||||||||||||||||||
| EBITDAre | 77,130 | 70,582 | 297,733 | 285,878 | |||||||||||||||||||
| (Gain) / loss on extinguishment of debt | — | — | — | 9,336 | |||||||||||||||||||
Core EBITDA (2) | 77,130 | 70,582 | 297,733 | 295,214 | |||||||||||||||||||
| General & administrative expenses | 7,835 | 7,415 | 30,252 | 27,464 | |||||||||||||||||||
Non-cash general reserve for uncollectible accounts (3) | (965) | (278) | (553) | 4,553 | |||||||||||||||||||
Management fee revenue (4) | (323) | (397) | (1,269) | (1,495) | |||||||||||||||||||
Other (income) / expense (1) (5) | (2,667) | (1,554) | (9,089) | (1,724) | |||||||||||||||||||
Straight-line effects of lease revenue (1) | (1,939) | (2,223) | (10,566) | (22,601) | |||||||||||||||||||
| Straight-line effects of lease revenue attributable to noncontrolling interests | 1 | (4) | 3 | (16) | |||||||||||||||||||
Amortization of lease-related intangibles (1) | (3,098) | (2,767) | (11,290) | (12,284) | |||||||||||||||||||
| Property net operating income (cash basis) | 75,974 | 70,774 | 295,221 | 289,111 | |||||||||||||||||||
| Deduct net operating (income) / loss from: | |||||||||||||||||||||||
Acquisitions (6) | (10,232) | (7,795) | (34,446) | (23,115) | |||||||||||||||||||
Dispositions (7) | (1) | (824) | (204) | (21,049) | |||||||||||||||||||
Other investments (8) | 203 | 162 | 783 | 550 | |||||||||||||||||||
| Same store net operating income (cash basis) | $ | 65,944 | $ | 62,317 | $ | 261,354 | $ | 245,497 | |||||||||||||||
| Change period over period | 5.8 | % | N/A | 6.5 | % | N/A | |||||||||||||||||
| (1) | Includes our proportionate share of amounts attributable to consolidated properties. | ||||
| (2) | The Company has historically recognized approximately $2 to $3 million of termination income on an annual basis. Given the size of its asset base and the number of tenants with which it conducts business, Piedmont considers termination income of that magnitude to be a normal part of its operations and a recurring part of its revenue stream; however, the recognition of termination income is typically variable between quarters and throughout any given year and is dependent upon when during the year the Company receives termination notices from tenants. During the three months ended December 31, 2021, Piedmont recognized $0.2 million of termination income, as compared with $0.8 million during the same quarterly period in 2020. During the twelve months ended December 31, 2021, Piedmont recognized $3.0 million in termination income, as compared with $2.3 million during the same period in 2020. | ||||
| (3) | As a result of COVID-19 and as a precautionary measure, during the second quarter of 2020, the Company established a general reserve for potential future losses on customer accounts. The general reserve is non-cash in nature and, therefore, any changes in the reserve are removed from the calculation of cash basis same store net operating income. No such reserves were made in any periods prior to the second quarter of 2020. | ||||
| (4) | Presented net of related operating expenses incurred to earn the revenue; therefore, the information presented on this line will not tie to the data presented on the income statements. | ||||
| (5) | Figures presented on this line may not tie back to the relevant sources as some activity is attributable to property operations and is, therefore, presented in property net operating income. | ||||
| (6) | Acquisitions include One Galleria Tower, Two Galleria Tower and Three Galleria Tower in Dallas, TX, purchased on February 12, 2020, and 999 Peachtree Street in Atlanta, GA, purchased on October 22, 2021. | ||||
| (7) | Dispositions include 1901 Market Street in Philadelphia, PA, sold on June 25, 2020, and the New Jersey property portfolio sold on October 28, 2020 (consisting of the Company's final remaining assets in the state, 200 and 400 Bridgewater Crossing in Bridgewater, NJ, and 600 Corporate Drive in Lebanon, NJ). | ||||
| (8) | Other investments include active out-of-service redevelopment and development projects, land, and recently completed redevelopment and development projects. Additional information on our land holdings can be found on page 35. The operating results from 222 South Orange Avenue in Orlando, FL, are included in this line item. | ||||
14
Piedmont Office Realty Trust, Inc.
Same Store Net Operating Income (Accrual Basis)
Unaudited (in thousands)
| Three Months Ended | Twelve Months Ended | ||||||||||||||||||||||
| 12/31/2021 | 12/31/2020 | 12/31/2021 | 12/31/2020 | ||||||||||||||||||||
| Net income / (loss) applicable to Piedmont | $ | (31,750) | $ | 22,609 | $ | (1,153) | $ | 232,688 | |||||||||||||||
| Net income / (loss) applicable to noncontrolling interest | (5) | (1) | (14) | (3) | |||||||||||||||||||
| Interest expense | 13,917 | 13,048 | 51,292 | 54,990 | |||||||||||||||||||
Depreciation (1) | 31,943 | 27,228 | 120,578 | 110,542 | |||||||||||||||||||
Amortization (1) | 22,003 | 22,312 | 85,946 | 93,242 | |||||||||||||||||||
| Depreciation and amortization attributable to noncontrolling interests | 22 | 20 | 84 | 85 | |||||||||||||||||||
| Impairment loss | 41,000 | — | 41,000 | — | |||||||||||||||||||
| (Gain) / loss on sale of properties | — | (14,634) | — | (205,666) | |||||||||||||||||||
| EBITDAre | 77,130 | 70,582 | 297,733 | 285,878 | |||||||||||||||||||
| (Gain) / loss on extinguishment of debt | — | — | — | 9,336 | |||||||||||||||||||
Core EBITDA (2) | 77,130 | 70,582 | 297,733 | 295,214 | |||||||||||||||||||
| General & administrative expenses | 7,835 | 7,415 | 30,252 | 27,464 | |||||||||||||||||||
Management fee revenue (3) | (323) | (397) | (1,269) | (1,495) | |||||||||||||||||||
Other (income) / expense (1) (4) | (2,667) | (1,554) | (9,089) | (1,724) | |||||||||||||||||||
| Property net operating income (accrual basis) | 81,975 | 76,046 | 317,627 | 319,459 | |||||||||||||||||||
| Deduct net operating (income) / loss from: | |||||||||||||||||||||||
Acquisitions (5) | (12,476) | (9,151) | (41,720) | (30,397) | |||||||||||||||||||
Dispositions (6) | (1) | (784) | (205) | (22,113) | |||||||||||||||||||
Other investments (7) | 261 | 218 | 1,009 | 769 | |||||||||||||||||||
| Same store net operating income (accrual basis) | $ | 69,759 | $ | 66,329 | $ | 276,711 | $ | 267,718 | |||||||||||||||
| Change period over period | 5.2 | % | N/A | 3.4 | % | N/A | |||||||||||||||||
| (1) | Includes our proportionate share of amounts attributable to consolidated properties. | ||||
| (2) | The Company has historically recognized approximately $2 to $3 million of termination income on an annual basis. Given the size of its asset base and the number of tenants with which it conducts business, Piedmont considers termination income of that magnitude to be a normal part of its operations and a recurring part of its revenue stream; however, the recognition of termination income is typically variable between quarters and throughout any given year and is dependent upon when during the year the Company receives termination notices from tenants. During the three months ended December 31, 2021, Piedmont recognized $0.2 million of termination income, as compared with $0.8 million during the same quarterly period in 2020. During the twelve months ended December 31, 2021, Piedmont recognized $3.0 million in termination income, as compared with $2.3 million during the same period in 2020. | ||||
| (3) | Presented net of related operating expenses incurred to earn the revenue; therefore, the information presented on this line will not tie to the data presented on the income statements. | ||||
| (4) | Figures presented on this line may not tie back to the relevant sources as some activity is attributable to property operations and is, therefore, presented in property net operating income. | ||||
| (5) | Acquisitions include One Galleria Tower, Two Galleria Tower and Three Galleria Tower in Dallas, TX, purchased on February 12, 2020, and 999 Peachtree Street in Atlanta, GA, purchased on October 22, 2021. | ||||
| (6) | Dispositions include 1901 Market Street in Philadelphia, PA, sold on June 25, 2020, and the New Jersey property portfolio sold on October 28, 2020 (consisting of the Company's final remaining assets in the state, 200 and 400 Bridgewater Crossing in Bridgewater, NJ, and 600 Corporate Drive in Lebanon, NJ). | ||||
| (7) | Other investments include active out-of-service redevelopment and development projects, land, and recently completed redevelopment and development projects. Additional information on our land holdings can be found on page 35. The operating results from 222 South Orange Avenue in Orlando, FL, are included in this line item. | ||||
15
Piedmont Office Realty Trust, Inc.
Same Store Net Operating Income (Financial Components)
Unaudited (in thousands)
| Three Months Ended | Twelve Months Ended | |||||||||||||||||||||||||||||||
| 12/31/2021 | 12/31/2020 | Change ($) | Change (%) | 12/31/2021 | 12/31/2020 | Change ($) | Change (%) | |||||||||||||||||||||||||
| Revenue | ||||||||||||||||||||||||||||||||
Cash rental income (1) | $ | 93,976 | $ | 89,684 | $ | 4,292 | 4.8 | % | $ | 366,608 | $ | 345,895 | $ | 20,713 | 6.0 | % | ||||||||||||||||
Tenant reimbursements (2) | 19,079 | 19,957 | (878) | (4.4) | % | 73,070 | 73,598 | (528) | (0.7) | % | ||||||||||||||||||||||
Straight line effects of lease revenue (3) | 1,441 | 2,285 | (844) | (36.9) | % | 9,006 | 20,334 | (11,328) | (55.7) | % | ||||||||||||||||||||||
| Amortization of lease-related intangibles | 1,409 | 1,449 | (40) | (2.8) | % | 5,798 | 6,440 | (642) | (10.0) | % | ||||||||||||||||||||||
| Total rents | 115,905 | 113,375 | 2,530 | 2.2 | % | 454,482 | 446,267 | 8,215 | 1.8 | % | ||||||||||||||||||||||
Other property related income (4) | 2,769 | 2,439 | 330 | 13.5 | % | 10,657 | 12,064 | (1,407) | (11.7) | % | ||||||||||||||||||||||
| Total revenue | 118,674 | 115,814 | 2,860 | 2.5 | % | 465,139 | 458,331 | 6,808 | 1.5 | % | ||||||||||||||||||||||
Property operating expense (5) | 49,131 | 49,700 | 569 | 1.1 | % | 189,290 | 191,476 | 2,186 | 1.1 | % | ||||||||||||||||||||||
| Property other income / (expense) | 216 | 215 | 1.0 | 0.5 | % | 862 | 863 | (1.0) | (0.1) | % | ||||||||||||||||||||||
| Same store net operating income (accrual) | $ | 69,759 | $ | 66,329 | $ | 3,430 | 5.2 | % | $ | 276,711 | $ | 267,718 | $ | 8,993 | 3.4 | % | ||||||||||||||||
| Less: | ||||||||||||||||||||||||||||||||
| Straight line effects of lease revenue | (1,441) | (2,285) | 844 | 36.9 | % | (9,006) | (20,334) | 11,328 | 55.7 | % | ||||||||||||||||||||||
| Amortization of lease-related intangibles | (1,409) | (1,449) | 40 | 2.8 | % | (5,798) | (6,440) | 642 | 10.0 | % | ||||||||||||||||||||||
| Non-cash general reserve for uncollectible accounts | (965) | (278) | (687) | (247.1) | % | (553) | 4,553 | (5,106) | (112.1) | % | ||||||||||||||||||||||
| Same store net operating income (cash) | $ | 65,944 | $ | 62,317 | $ | 3,627 | 5.8 | % | $ | 261,354 | $ | 245,497 | $ | 15,857 | 6.5 | % | ||||||||||||||||
| (1) | The increase in cash rental income for the three months and the twelve months ended December 31, 2021 as compared to the same periods in 2020 was primarily due to the burn off of significant rental abatements at several properties in the portfolio, including Enclave Place in Houston, TX, rental rate roll ups on new leases and regular annual rental rate increases on existing leases. | ||||
| (2) | The decrease in tenant reimbursements for the three months and the twelve months ended December 31, 2021 as compared to the same periods in 2020 was principally related to decreased property tax expense at several properties in the portfolio, including 60 Broad Street in New York, NY. Partially offsetting the decrease in tenant reimbursements was the favorable effect of the expiration of an operating expense recovery abatement at Enclave Place in Houston, TX. | ||||
| (3) | The decrease in straight line effects of lease revenue for the three months and the twelve months ended December 31, 2021 as compared to the same periods in 2020 was primarily due to the expiration of the rental abatement periods of several large new and renewal leases in the portfolio. | ||||
| (4) | The increase in other property related income for the three months ended December 31, 2021 as compared to the same period in 2020 was primarily related to increased transient parking demand across the portfolio as a result of increased business activity during the fourth quarter of 2021. The decrease in other property related income for the twelve months ended December 31, 2021 as compared to the same period in 2020 was primarily the result of pandemic-related decreased transient parking activity across the portfolio principally driven by parking activity differences from the first quarter which compared a pre-pandemic period in 2020 to a pandemic period in 2021. | ||||
| (5) | The decrease in property operating expense for the three months and the twelve months ended December 31, 2021 as compared to the same periods in 2020 was largely associated with lower property tax expense at several properties in the portfolio, including 60 Broad Street in New York, NY. | ||||
16
Piedmont Office Realty Trust, Inc.
Capitalization Analysis
Unaudited (in thousands except for per share data)
| As of | As of | ||||||||||
| December 31, 2021 | December 31, 2020 | ||||||||||
| Market Capitalization | |||||||||||
| Common stock price | $18.38 | $16.23 | |||||||||
| Total shares outstanding | 123,077 | 123,839 | |||||||||
Equity market capitalization (1) | $2,262,150 | $2,009,914 | |||||||||
| Total debt - principal amount outstanding (excludes premiums, discounts, and deferred financing costs) | $1,890,000 | $1,632,610 | |||||||||
Total market capitalization (1) | $4,152,150 | $3,642,524 | |||||||||
Total debt / Total market capitalization (1) | 45.5 | % | 44.8 | % | |||||||
| Ratios & Information for Debt Holders | |||||||||||
Total gross assets (2) | $5,098,443 | $4,747,821 | |||||||||
Total debt / Total gross assets (2) | 37.1 | % | 34.4 | % | |||||||
Average net debt to Core EBITDA - quarterly (3) | 6.0 x | 5.8 x | |||||||||
Average net debt to Core EBITDA - trailing twelve months (4) | 5.7 x | 5.8 x | |||||||||
| (1) | Reflects common stock closing price, shares outstanding, and outstanding debt as of the end of the reporting period, as appropriate. | ||||
| (2) | Total gross assets is defined as total assets with the add-back of accumulated depreciation and accumulated amortization related to real estate assets and accumulated amortization related to deferred lease costs. | ||||
| (3) | For the purposes of this calculation, we annualize the Core EBITDA for the quarter and use the average daily balance of debt outstanding during the quarter, less cash and cash equivalents and escrow deposits and restricted cash as of the end of the quarter. | ||||
| (4) | For the purposes of this calculation, we use the sum of Core EBITDA for the trailing four quarters and the average daily balance of debt outstanding for the trailing four quarters, less the average of cash and cash equivalents and escrow deposits and restricted cash as of the end of each quarter in the trailing four quarter period. | ||||
17
Piedmont Office Realty Trust, Inc.
Debt Summary
As of December 31, 2021
Unaudited ($ in thousands)
| Floating Rate & Fixed Rate Debt |  | ||||||||||||||||
Debt (1) | Principal Amount Outstanding | Weighted Average Stated Interest Rate (2) | Weighted Average Maturity | ||||||||||||||
| Floating Rate | $440,000 | (3) | 1.02% | 27.1 months | |||||||||||||
| Fixed Rate | 1,450,000 | 3.51% | 61.0 months | ||||||||||||||
| Total | $1,890,000 | 2.93% | 53.1 months | ||||||||||||||
| Unsecured & Secured Debt |  | ||||||||||||||||
Debt (1) | Principal Amount Outstanding | Weighted Average Stated Interest Rate (2) | Weighted Average Maturity | ||||||||||||||
| Unsecured | $1,890,000 | 2.93% | 53.1 months | ||||||||||||||
| Secured | — | —% | N/A | ||||||||||||||
| Total | $1,890,000 | 2.93% | 53.1 months | ||||||||||||||
Debt Maturities (4) | ||||||||||||||||||||
| Maturity Year | Unsecured Debt - Principal Amount Outstanding (1) | Weighted Average Stated Interest Rate (2) | Percentage of Total |  | ||||||||||||||||
| 2022 | — | N/A | —% | |||||||||||||||||
| 2023 | 640,000 | 2.32% | 33.9% | |||||||||||||||||
| 2024 | 400,000 | 4.45% | 21.2% | |||||||||||||||||
| 2025 | 250,000 | 2.05% | 13.2% | |||||||||||||||||
| 2026 | — | N/A | —% | |||||||||||||||||
| 2027 + | 600,000 | 2.95% | 31.7% | |||||||||||||||||
| Total | $1,890,000 | 2.93% | 100.0% | |||||||||||||||||
| (1) | All of Piedmont's outstanding debt as of December 31, 2021, was unsecured, interest-only debt. | ||||
| (2) | Weighted average stated interest rate is calculated based upon the principal amounts outstanding. | ||||
| (3) | The amount of floating rate debt is comprised of the $290 million outstanding balance as of December 31, 2021 on the $500 million unsecured revolving credit facility and $150 million in principal amount of the $250 million unsecured term loan that closed in 2018 that remained unhedged as of December 31, 2021. The $250 million unsecured term loan that closed in 2018 has a stated variable rate. However, Piedmont entered into $100 million in notional amount of seven-year interest rate swap agreements resulting in an effectively fixed interest rate for $100 million in principal amount of the term loan (at 3.56% as of December 31, 2021; this rate can change only with a credit rating change for the Company) through the loan's maturity date of March 31, 2025. Additional details regarding the floating rate debt can be found on the following page. | ||||
| (4) | For loans which provide extension options that are conditional solely upon the Company providing proper notice to the loan's administrative agent and the payment of an extension fee, the final extended maturity date is reflected herein. | ||||
18
Piedmont Office Realty Trust, Inc.
Debt Detail
Unaudited ($ in thousands)
Facility (1) | Stated Rate | Maturity | Principal Amount Outstanding as of December 31, 2021 | ||||||||||||||
| $350.0 Million Unsecured 2013 Senior Notes | 3.40 | % | (2) | 6/1/2023 | $ | 350,000 | |||||||||||
$500.0 Million Unsecured Line of Credit (3) | 1.01 | % | (4) | 9/29/2023 | 290,000 | ||||||||||||
| $400.0 Million Unsecured 2014 Senior Notes | 4.45 | % | (5) | 3/15/2024 | 400,000 | ||||||||||||
| $250.0 Million Unsecured 2018 Term Loan | 2.05 | % | (6) | 3/31/2025 | 250,000 | ||||||||||||
| $300.0 Million Unsecured 2020 Senior Notes | 3.15 | % | (7) | 8/15/2030 | 300,000 | ||||||||||||
| $300.0 Million Unsecured 2021 Senior Notes | 2.75 | % | (8) | 4/1/2032 | 300,000 | ||||||||||||
Total Debt - Principal Amount Outstanding / Weighted Average Stated Rate (9) | 2.93 | % | $ | 1,890,000 | |||||||||||||
GAAP Accounting Adjustments (10) | (12,210) | ||||||||||||||||
| Total Debt - GAAP Amount Outstanding | $ | 1,877,790 | |||||||||||||||
| (1) | All of Piedmont’s outstanding debt as of December 31, 2021, was unsecured, interest-only debt. | ||||
| (2) | The $350 million unsecured senior notes were offered for sale at 99.601% of the principal amount. The resulting effective cost of the financing is approximately 3.45% before the consideration of transaction costs and proceeds from interest rate hedges. After the application of proceeds from interest rate hedges, the effective cost of the financing is approximately 3.43%. | ||||
| (3) | All of Piedmont’s outstanding debt as of December 31, 2021, was term debt with the exception of $290 million outstanding on our unsecured revolving credit facility. The $500 million unsecured revolving credit facility has an initial maturity date of September 30, 2022; however, there are two, six-month extension options available under the facility providing for a total extension of up to one year to September 29, 2023. The final extended maturity date is presented on this schedule. | ||||
| (4) | The interest rate presented for the $500 million unsecured revolving credit facility is the weighted average interest rate for all outstanding draws as of December 31, 2021. Piedmont may select from multiple interest rate options with each draw under the facility, including the prime rate and various length LIBOR locks. The all-in interest rate associated with each LIBOR interest period selection is comprised of the relevant base LIBOR interest rate plus a credit spread (0.90% as of December 31, 2021) based on Piedmont's then current credit rating. | ||||
| (5) | The $400 million unsecured senior notes were offered for sale at 99.791% of the principal amount. The resulting effective cost of the financing is approximately 4.48% before the consideration of transaction costs and proceeds from interest rate hedges. After the application of proceeds from interest rate hedges, the effective cost of the financing is approximately 4.10%. | ||||
| (6) | The $250 million unsecured term loan that closed in 2018 has a stated variable interest rate; however, Piedmont entered into $100 million in notional amount of seven-year interest rate swap agreements that effectively fixed the interest rate on $100 million of the term loan (at 3.56% as of December 31, 2021; this rate can change only with a credit rating change for the Company) through the loan's maturity date of March 31, 2025. For the portion of the loan that continues to have a variable interest rate, Piedmont may select from multiple interest rate options, including the prime rate and various length LIBOR locks. The all-in interest rate associated with each LIBOR interest period selection is comprised of the relevant base LIBOR interest rate plus a credit spread (0.95% as of December 31, 2021) based on Piedmont's then current credit rating. | ||||
| (7) | The $300 million unsecured senior notes were offered for sale at 99.236% of the principal amount. The resulting effective cost of the financing is approximately 3.24% before the consideration of transaction costs and the impact of interest rate hedges. After incorporating the results of the related interest rate hedging activity, the effective cost of the financing is approximately 3.90%. | ||||
| (8) | The $300 million unsecured senior notes were offered for sale at 99.510% of the principal amount. The resulting effective cost of the financing is approximately 2.80% before the consideration of transaction costs and the impact of interest rate hedges. After incorporating the results of the related interest rate hedging activity, the effective cost of the financing is approximately 2.78%. | ||||
| (9) | Weighted average is based on the principal amounts outstanding and interest rates at December 31, 2021. | ||||
| (10) | The GAAP accounting adjustments relate to original issue discounts, third-party fees, and lender fees resulting from the procurement processes for our various debt facilities. The original issue discounts and fees are amortized to interest expense over the contractual term of the related debt. | ||||
19
Piedmont Office Realty Trust, Inc.
Debt Covenant & Ratio Analysis (for Debt Holders)
As of December 31, 2021
Unaudited
| Three Months Ended | ||||||||||||||||||||
Bank Debt Covenant Compliance (1) | Required | 12/31/2021 | 9/30/2021 | 6/30/2021 | 3/31/2021 | 12/31/2020 | ||||||||||||||
| Maximum leverage ratio | 0.60 | 0.38 | 0.35 | 0.35 | 0.36 | 0.35 | ||||||||||||||
Minimum fixed charge coverage ratio (2) | 1.50 | 5.32 | 5.28 | 5.15 | 4.96 | 4.71 | ||||||||||||||
| Maximum secured indebtedness ratio | 0.40 | — | — | — | 0.01 | 0.01 | ||||||||||||||
| Minimum unencumbered leverage ratio | 1.60 | 2.49 | 2.74 | 2.74 | 2.72 | 2.77 | ||||||||||||||
Minimum unencumbered interest coverage ratio (3) | 1.75 | 5.36 | 5.49 | 5.48 | 5.44 | 5.26 | ||||||||||||||
| Three Months Ended | ||||||||||||||||||||
Bond Covenant Compliance (4) | Required | 12/31/2021 | 9/30/2021 | 6/30/2021 | 3/31/2021 | 12/31/2020 | ||||||||||||||
| Total debt to total assets | 60% or less | 43.5% | 40.4% | 40.8% | 41.1% | 40.6% | ||||||||||||||
| Secured debt to total assets | 40% or less | —% | —% | —% | 0.7% | 0.7% | ||||||||||||||
| Ratio of consolidated EBITDA to interest expense | 1.50 or greater | 6.13 | 6.11 | 6.06 | 5.93 | 5.66 | ||||||||||||||
| Unencumbered assets to unsecured debt | 150% or greater | 230% | 248% | 245% | 243% | 247% | ||||||||||||||
| Three Months Ended | Twelve Months Ended | Twelve Months Ended | |||||||||
| Other Debt Coverage Ratios for Debt Holders | December 31, 2021 | December 31, 2021 | December 31, 2020 | ||||||||
Average net debt to core EBITDA (5) | 6.0 x | 5.7 x | 5.8 x | ||||||||
Fixed charge coverage ratio (6) | 5.2 x | 5.4 x | 5.2 x | ||||||||
Interest coverage ratio (7) | 5.2 x | 5.4 x | 5.3 x | ||||||||
| (1) | Bank debt covenant compliance calculations relate to specific calculations detailed in the relevant credit agreements. | ||||
| (2) | Defined as EBITDA for the trailing four quarters (including the Company's share of EBITDA from unconsolidated interests), excluding one-time or non-recurring gains or losses, less a $0.15 per square foot capital reserve, and excluding the impact of straight line rent leveling adjustments and amortization of intangibles divided by the Company's share of fixed charges, as more particularly described in the credit agreements. This definition of fixed charge coverage ratio as prescribed by our credit agreements is different from the fixed charge coverage ratio definition employed elsewhere within this report. | ||||
| (3) | Defined as net operating income for the trailing four quarters for unencumbered assets (including the Company's share of net operating income from partially-owned entities and subsidiaries that are deemed to be unencumbered) less a $0.15 per square foot capital reserve divided by the Company's share of interest expense associated with unsecured financings only, as more particularly described in the credit agreements. | ||||
| (4) | Bond covenant compliance calculations relate to specific calculations prescribed in the relevant debt agreements. Please refer to the Indenture dated May 9, 2013, the Indenture and the First Supplemental Indenture dated March 6, 2014, the Second Supplemental Indenture dated August 12, 2020, and the Third Supplemental Indenture dated September 20, 2021 for detailed information about the calculations. | ||||
| (5) | For the purposes of this calculation, we use the average daily balance of debt outstanding during the identified period, less cash and cash equivalents and escrow deposits and restricted cash as of the end of the period. | ||||
| (6) | Fixed charge coverage ratio is calculated as Core EBITDA divided by the sum of interest expense, principal amortization, capitalized interest and preferred dividends. The Company had no preferred dividends during the periods ended December 31, 2021 and December 31, 2020. The Company had capitalized interest of $994,675 for the three months ended December 31, 2021, $3,693,032 for the twelve months ended December 31, 2021 and $965,142 for the twelve months ended December 31, 2020. The Company had no principal amortization for the three months ended December 31, 2021, as it repaid its last remaining amortizing loan during the second quarter of 2021; the Company had principal amortization of $372,455 for the twelve months ended December 31, 2021 and $1,076,993 for the twelve months ended December 31, 2020. | ||||
| (7) | Interest coverage ratio is calculated as Core EBITDA divided by the sum of interest expense and capitalized interest. The Company had capitalized interest of $994,675 for the three months ended December 31, 2021, $3,693,032 for the twelve months ended December 31, 2021 and $965,142 for the twelve months ended December 31, 2020. | ||||
20
Piedmont Office Realty Trust, Inc.
Tenant Diversification (1)
As of December 31, 2021
(in thousands except for number of properties)
| Tenant | Credit Rating (2) | Number of Properties | Lease Expiration (3) | Annualized Lease Revenue | Percentage of Annualized Lease Revenue (%) | Leased Square Footage | Percentage of Leased Square Footage (%) | ||||||||||||||||||||||
| US Bancorp | A+ / A2 | 3 | 2023 / 2024 | $27,052 | 5.0 | 787 | 5.4 | ||||||||||||||||||||||
| State of New York | AA+ / Aa2 | 1 | 2024 / 2039 | 26,968 | 5.0 | 502 | 3.4 | ||||||||||||||||||||||
| City of New York | AA / Aa2 | 1 | 2026 | 14,602 | 2.7 | 313 | 2.2 | ||||||||||||||||||||||
| Amazon | AA / A1 | 4 | 2024 / 2025 | 14,560 | 2.7 | 337 | 2.3 | ||||||||||||||||||||||
| Transocean | CCC / Caa3 | 1 | 2036 | 10,902 | 2.0 | 301 | 2.1 | ||||||||||||||||||||||
| Harvard University | AAA / Aaa | 2 | 2032 / 2033 | 8,820 | 1.6 | 129 | 0.9 | ||||||||||||||||||||||
| Raytheon | A- / Baa1 | 2 | 2031 | 8,115 | 1.5 | 440 | 3.0 | ||||||||||||||||||||||
| Schlumberger Technology | A / A2 | 1 | 2028 | 7,819 | 1.5 | 254 | 1.7 | ||||||||||||||||||||||
| Gartner | BB+ / Ba2 | 2 | 2034 | 7,522 | 1.4 | 207 | 1.4 | ||||||||||||||||||||||
| Salesforce.com | A+ / A2 | 1 | 2029 | 7,096 | 1.3 | 182 | 1.3 | ||||||||||||||||||||||
| Fiserv | BBB / Baa2 | 1 | 2027 | 6,980 | 1.3 | 195 | 1.3 | ||||||||||||||||||||||
| VMware, Inc. | BBB- / Baa3 | 1 | 2027 | 6,917 | 1.3 | 215 | 1.5 | ||||||||||||||||||||||
| Nuance Communications | BB- / Ba3 | 1 | 2030 | 6,907 | 1.3 | 201 | 1.4 | ||||||||||||||||||||||
| Epsilon Data Management / subsidiary of Publicis | BBB / Baa2 | 1 | 2026 | 6,668 | 1.2 | 222 | 1.5 | ||||||||||||||||||||||
| Applied Predictive Technologies / subsidiary of MasterCard | A+ / A1 | 1 | 2028 | 6,316 | 1.2 | 133 | 0.9 | ||||||||||||||||||||||
| CVS Caremark | BBB / Baa2 | 1 | 2022 | 6,261 | 1.2 | 208 | 1.4 | ||||||||||||||||||||||
| Eversheds Sutherland | No Rating Available | 1 | 2026 | 6,254 | 1.2 | 180 | 1.2 | ||||||||||||||||||||||
| International Food Policy Research Institute | No Rating Available | 1 | 2029 | 6,194 | 1.2 | 102 | 0.7 | ||||||||||||||||||||||
| Ryan | No Rating Available | 1 | 2023 | 6,012 | 1.1 | 170 | 1.2 | ||||||||||||||||||||||
| Cargill | A / A2 | 1 | 2023 | 5,370 | 1.0 | 268 | 1.8 | ||||||||||||||||||||||
| Bank of America | A- / A2 | 5 | 2024 / 2025 | 5,217 | 1.0 | 100 | 0.7 | ||||||||||||||||||||||
| Other | Various | 334,252 | 62.3 | 9,137 | 62.7 | ||||||||||||||||||||||||
| Total | $536,804 | 100.0 | 14,583 | 100.0 | |||||||||||||||||||||||||
| (1) | This schedule presents all tenants contributing 1.0% or more to Annualized Lease Revenue. | ||||
| (2) | Credit rating may reflect the credit rating of the parent or a guarantor. When available, both the Standard & Poor's credit rating and the Moody's credit rating are provided. The absence of a credit rating for a tenant is not an indication of the creditworthiness of the tenant; in most cases, the lack of a credit rating reflects that the tenant has not sought such a rating. | ||||
| (3) | Unless otherwise indicated, Lease Expiration represents the expiration year of the majority of the square footage leased by the tenant. | ||||
21
Piedmont Office Realty Trust, Inc.
Tenant Diversification
As of December 31, 2021
Percentage of Annualized Leased Revenue (%)
December 31, 2021 as compared to December 31, 2020
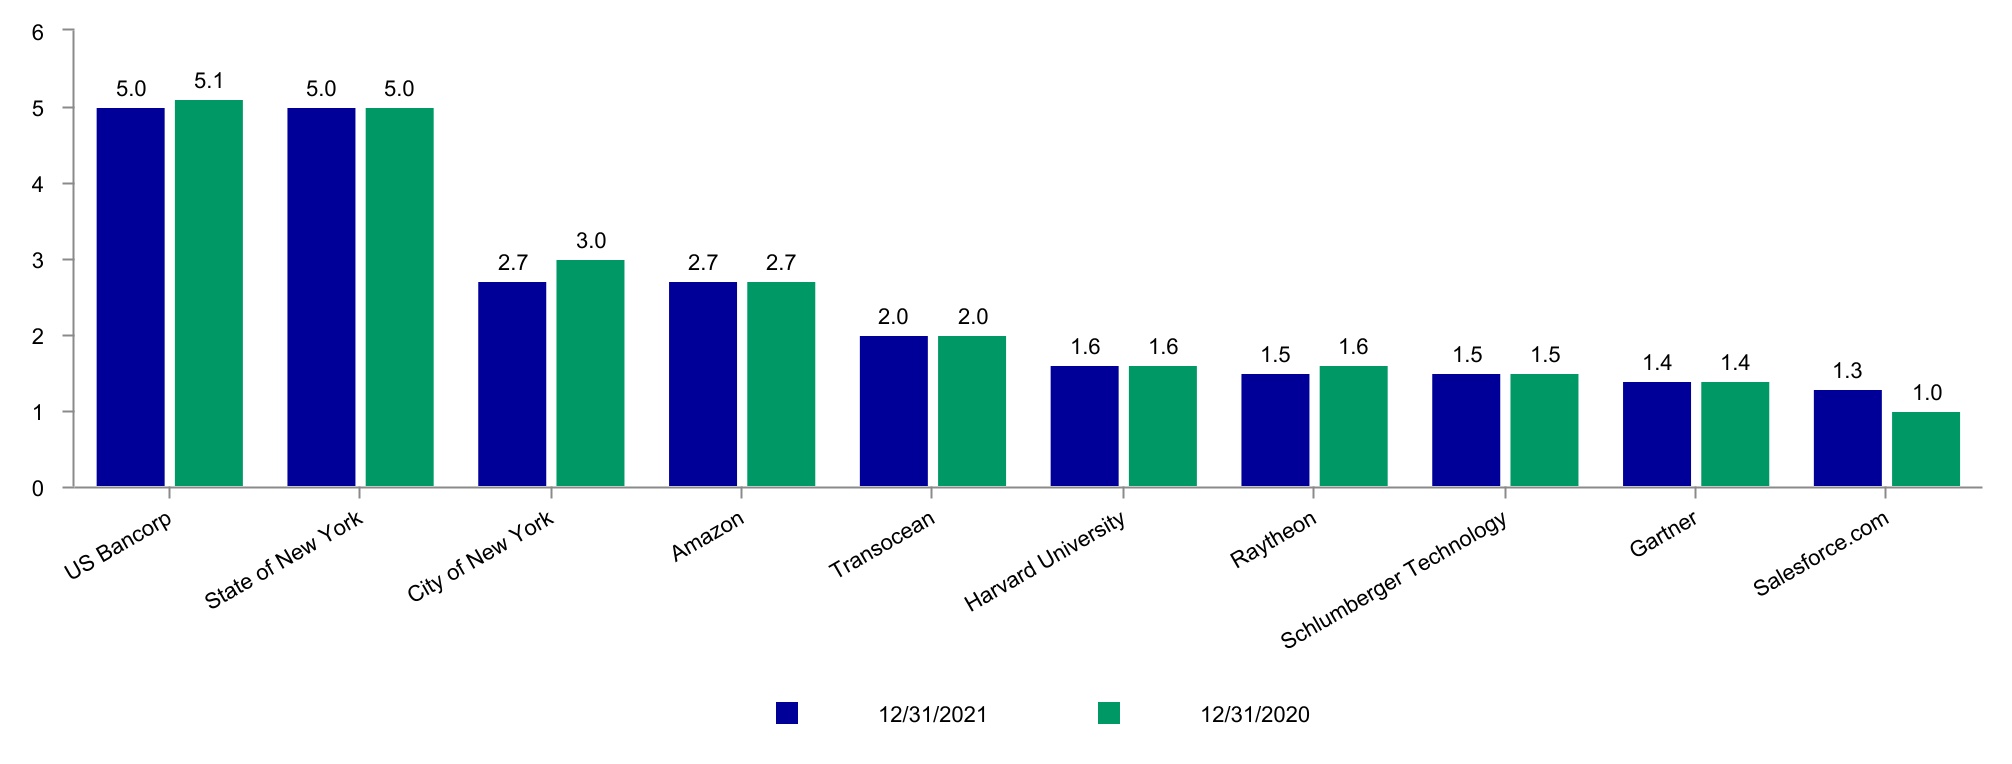
22
Piedmont Office Realty Trust, Inc.
Tenant Credit Rating & Lease Distribution Information
As of December 31, 2021
Tenant Credit Rating (1)
| Rating Level | Annualized Lease Revenue (in thousands) | Percentage of Annualized Lease Revenue (%) | ||||||
| AAA / Aaa | $22,806 | 4.2 | ||||||
| AA / Aa | 60,426 | 11.3 | ||||||
| A / A | 92,743 | 17.3 | ||||||
| BBB / Baa | 54,363 | 10.1 | ||||||
| BB / Ba | 28,793 | 5.4 | ||||||
| B / B | 10,245 | 1.9 | ||||||
| Below | 17,516 | 3.3 | ||||||
Not rated (2) | 249,912 | 46.5 | ||||||
| Total | $536,804 | 100.0 | ||||||
Lease Distribution
| Lease Size | Number of Leases | Percentage of Leases (%) | Annualized Lease Revenue (in thousands) | Percentage of Annualized Lease Revenue (%) | Leased Square Footage (in thousands) | Percentage of Leased Square Footage (%) | ||||||||||||||
| 2,500 or Less | 372 | 37.4 | $23,297 | 4.3 | 271 | 1.9 | ||||||||||||||
| 2,501 - 10,000 | 348 | 35.0 | 66,524 | 12.4 | 1,781 | 12.2 | ||||||||||||||
| 10,001 - 20,000 | 111 | 11.2 | 56,636 | 10.6 | 1,541 | 10.6 | ||||||||||||||
| 20,001 - 40,000 | 87 | 8.8 | 88,130 | 16.4 | 2,408 | 16.5 | ||||||||||||||
| 40,001 - 100,000 | 44 | 4.4 | 102,337 | 19.1 | 2,644 | 18.1 | ||||||||||||||
| Greater than 100,000 | 32 | 3.2 | 199,880 | 37.2 | 5,938 | 40.7 | ||||||||||||||
| Total | 994 | 100.0 | $536,804 | 100.0 | 14,583 | 100.0 | ||||||||||||||
| (1) | Credit rating may reflect the credit rating of the parent or a guarantor. Where differences exist between the Standard & Poor's credit rating for a tenant and the Moody's credit rating for a tenant, the higher credit rating is selected for this analysis. | ||||
| (2) | The classification of a tenant as "not rated" is not an indication of the creditworthiness of the tenant; in most cases, the lack of a credit rating reflects that the tenant has not sought such a rating. Included in this category are such tenants as Piper Sandler, Ernst & Young, KPMG, BDO, and RaceTrac Petroleum. | ||||
23
Piedmont Office Realty Trust, Inc.
Leased Percentage Information
(in thousands)
| Three Months Ended | Three Months Ended | ||||||||||||||||||||||||||||
| December 31, 2021 | December 31, 2020 | ||||||||||||||||||||||||||||
Leased Square Footage | Rentable Square Footage | Percent Leased (1) | Leased Square Footage | Rentable Square Footage | Percent Leased (1) | ||||||||||||||||||||||||
| As of September 30, 20xx | 14,106 | 16,428 | 85.9 | % | 14,912 | 17,165 | 86.9 | % | |||||||||||||||||||||
| Leases signed during the period | 399 | 189 | |||||||||||||||||||||||||||
Less: | |||||||||||||||||||||||||||||
| Lease renewals signed during period | (198) | (137) | |||||||||||||||||||||||||||
| New leases signed during period for currently occupied space | (36) | (13) | |||||||||||||||||||||||||||
| Leases expired during period and other | (164) | 1 | (138) | 2 | |||||||||||||||||||||||||
| Subtotal | 14,107 | 16,429 | 85.9 | % | 14,813 | 17,167 | 86.3 | % | |||||||||||||||||||||
Acquisitions and properties placed in service during period (2) | 476 | 622 | — | — | |||||||||||||||||||||||||
Dispositions and properties taken out of service during period (2) | — | — | (553) | (739) | |||||||||||||||||||||||||
| As of December 31, 20xx | 14,583 | 17,051 | 85.5 | % | 14,260 | 16,428 | 86.8 | % | |||||||||||||||||||||
| Twelve Months Ended | Twelve Months Ended | ||||||||||||||||||||||||||||
| December 31, 2021 | December 31, 2020 | ||||||||||||||||||||||||||||
Leased Square Footage | Rentable Square Footage | Percent Leased (1) | Leased Square Footage | Rentable Square Footage | Percent Leased (1) | ||||||||||||||||||||||||
| As of December 31, 20xx | 14,260 | 16,428 | 86.8 | % | 14,633 | 16,046 | 91.2 | % | |||||||||||||||||||||
| Properties placed in service | — | — | 204 | 487 | |||||||||||||||||||||||||
| Restated As of December 31, 20xx | 14,260 | 16,428 | 86.8 | % | 14,837 | 16,533 | 89.7 | % | |||||||||||||||||||||
| Leases signed during the period | 2,250 | 1,106 | |||||||||||||||||||||||||||
Less: | |||||||||||||||||||||||||||||
| Lease renewals signed during period | (1,521) | (844) | |||||||||||||||||||||||||||
| New leases signed during period for currently occupied space | (144) | (60) | |||||||||||||||||||||||||||
| Leases expired during period and other | (738) | 1 | (792) | — | |||||||||||||||||||||||||
| Subtotal | 14,107 | 16,429 | 85.9 | % | 14,247 | 16,533 | 86.2 | % | |||||||||||||||||||||
Acquisitions during period (2) | 476 | 622 | 1,367 | 1,435 | |||||||||||||||||||||||||
Dispositions and properties taken out of service during period (2) | — | — | (1,354) | (1,540) | |||||||||||||||||||||||||
As of December 31, 20xx(3) | 14,583 | 17,051 | 85.5 | % | 14,260 | 16,428 | 86.8 | % | |||||||||||||||||||||
| Same Store Analysis | |||||||||||||||||||||||||||||
Less acquisitions / dispositions after December 31, 2020 and developments / out-of-service redevelopments (2) (4) | (526) | (622) | 84.6 | % | — | — | — | % | |||||||||||||||||||||
| Same Store Leased Percentage | 14,057 | 16,429 | 85.6 | % | 14,260 | 16,428 | 86.8 | % | |||||||||||||||||||||
| (1) | Calculated as square footage associated with commenced leases as of period end with the addition of square footage associated with uncommenced leases for spaces vacant as of period end at our in-service properties, divided by total rentable in-service square footage as of period end, expressed as a percentage. | ||||
| (2) | |||||
| (3) | Subsequent to year end, Piedmont disposed of 225 & 235 Presidential Way, a 100% leased 440,000 square foot project, in Woburn, MA, and Two Pierce Place, a 34% leased 485,000 square foot property, in Itasca, IL. If these properties were removed from the Company's in-service portfolio as of December 31, 2021, the portfolio leased percentage would have increased to approximately 87%. | ||||
| (4) | Dispositions completed during the previous twelve months are deducted from the previous period data and acquisitions completed during the previous twelve months are deducted from the current period data. Redevelopments that commenced during the previous twelve months that were taken out of service are deducted from the previous period data and developments and redevelopments placed in service during the previous twelve months are deducted from the current period data. | ||||
24
Piedmont Office Realty Trust, Inc.
Rental Rate Roll Up / Roll Down Analysis (1)
(in thousands)
| Three Months Ended | ||||||||||||||||||||
| December 31, 2021 | ||||||||||||||||||||
| Square Feet | % of Total Signed During Period | % of Rentable Square Footage | % Change Cash Rents (2) | % Change Accrual Rents (3) (4) | ||||||||||||||||
| Leases executed for spaces vacant one year or less | 194 | 48.6% | 1.1% | 3.0% | 6.9% | |||||||||||||||
Leases executed for spaces excluded from analysis (5) | 205 | 51.4% | ||||||||||||||||||
| Twelve Months Ended | ||||||||||||||||||||
| December 31, 2021 | ||||||||||||||||||||
| Square Feet | % of Total Signed During Period | % of Rentable Square Footage | % Change Cash Rents (2) | % Change Accrual Rents (3) (4) | ||||||||||||||||
| Leases executed for spaces vacant one year or less | 1,435 | 63.8% | 8.4% | 7.5% | 15.6% | |||||||||||||||
Leases executed for spaces excluded from analysis (5) | 815 | 36.2% | ||||||||||||||||||
| (1) | The populations analyzed for this analysis consist of consolidated leases executed during the relevant period with lease terms of greater than one year. Leases associated with storage spaces, retail spaces, management offices, and newly acquired assets for which there is less than one year of operating history, along with percentage rent leases, are excluded from this analysis. | ||||
| (2) | For the purposes of this analysis, the last twelve months of cash paying rents of the previous leases are compared to the first twelve months of cash paying rents of the new leases in order to calculate the percentage change. | ||||
| (3) | For the purposes of this analysis, the accrual basis rents of the previous leases are compared to the accrual basis rents of the new leases in order to calculate the percentage change. For newly signed leases which have variations in accrual basis rents, whether because of known future expansions, contractions, lease expense recovery structure changes, or other similar reasons, the weighted average of such varying accrual basis rents is used for the purposes of this analysis. | ||||
| (4) | For leases under which a tenant may use, at its discretion, a portion of its tenant improvement allowance for expenses other than those related to improvements to its space, an assumption is made that the tenant elects to use any such portion of its tenant improvement allowance for improvements to its space prior to the commencement of its lease, unless the Company is notified otherwise by the tenant. This assumption is made based upon historical usage patterns of tenant improvement allowances by the Company's tenants. | ||||
| (5) | Represents leases signed at our consolidated office assets that do not qualify for inclusion in the analysis, primarily because the spaces for which the new leases were signed had been vacant for more than one year. | ||||
25
Piedmont Office Realty Trust, Inc.
Lease Expiration Schedule
As of December 31, 2021
(in thousands)
| Expiration Year | Annualized Lease Revenue (1) | Percentage of Annualized Lease Revenue (%) | Rentable Square Footage | Percentage of Rentable Square Footage (%) | |||||||||||||
| Vacant | $— | — | 2,468 | 14.5 | |||||||||||||
2022 (2) | 34,295 | 6.4 | 1,024 | 6.0 | |||||||||||||
2023 (3) | 55,639 | 10.4 | 1,698 | 10.0 | |||||||||||||
| 2024 | 59,025 | 11.0 | 1,752 | 10.3 | |||||||||||||
| 2025 | 57,364 | 10.7 | 1,595 | 9.4 | |||||||||||||
| 2026 | 59,308 | 11.0 | 1,609 | 9.4 | |||||||||||||
| 2027 | 52,749 | 9.8 | 1,438 | 8.4 | |||||||||||||
| 2028 | 49,937 | 9.3 | 1,382 | 8.1 | |||||||||||||
| 2029 | 31,479 | 5.9 | 803 | 4.7 | |||||||||||||
| 2030 | 21,991 | 4.1 | 595 | 3.5 | |||||||||||||
| 2031 | 15,537 | 2.9 | 669 | 3.9 | |||||||||||||
| 2032 | 20,950 | 3.9 | 514 | 3.0 | |||||||||||||
| 2033 | 10,291 | 1.9 | 203 | 1.2 | |||||||||||||
| Thereafter | 68,239 | 12.7 | 1,301 | 7.6 | |||||||||||||
| Total / Weighted Average | $536,804 | 100.0 | 17,051 | 100.0 | |||||||||||||
| Average Lease Term Remaining | |||||
| 12/31/2021 | 6.0 years | ||||
| 12/31/2020 | 6.1 years | ||||
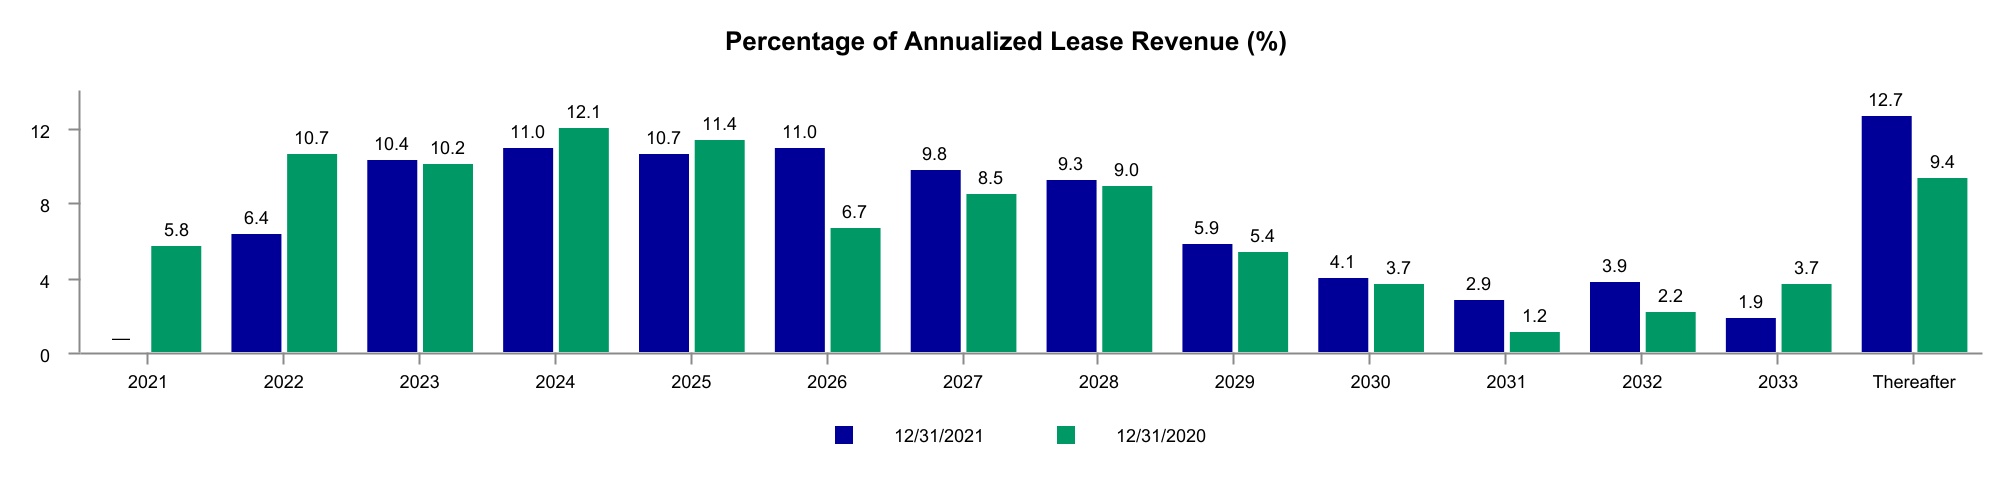
| (1) | Annualized rental income associated with each newly executed lease for currently occupied space is incorporated herein only at the expiration date for the current lease. Annualized rental income associated with each such new lease is removed from the expiry year of the current lease and added to the expiry year of the new lease. These adjustments effectively incorporate known roll ups and roll downs into the expiration schedule. | ||||
| (2) | Includes leases with an expiration date of December 31, 2021, comprised of approximately 58,000 square feet and Annualized Lease Revenue of $1.5 million. | ||||
| (3) | Leases and other revenue-producing agreements on a month-to-month basis, comprised of approximately 28,000 square feet and Annualized Lease Revenue of $0.6 million, are assigned a lease expiration date of a year and a day beyond the period end date. | ||||
26
Piedmont Office Realty Trust, Inc.
Lease Expirations by Quarter
As of December 31, 2021
(in thousands)
Q1 2022 (1) | Q2 2022 | Q3 2022 | Q4 2022 | |||||||||||||||||||||||||||||||||||
| Location | Expiring Square Footage | Expiring Lease Revenue (2) | Expiring Square Footage | Expiring Lease Revenue (2) | Expiring Square Footage | Expiring Lease Revenue (2) | Expiring Square Footage | Expiring Lease Revenue (2) | ||||||||||||||||||||||||||||||
| Atlanta | 101 | $2,969 | 147 | $4,845 | 65 | $2,103 | 48 | $1,666 | ||||||||||||||||||||||||||||||
| Boston | 2 | 95 | 8 | 349 | 15 | 1,437 | 7 | 916 | ||||||||||||||||||||||||||||||
| Dallas | 27 | 1,094 | 55 | 1,806 | 55 | 1,971 | 308 | 9,631 | ||||||||||||||||||||||||||||||
| Minneapolis | 16 | 614 | — | 1 | 11 | 416 | 10 | 160 | ||||||||||||||||||||||||||||||
| New York | 2 | 95 | 2 | 79 | 3 | 159 | — | — | ||||||||||||||||||||||||||||||
| Orlando | 12 | 449 | 2 | 189 | 18 | 691 | 43 | 1,392 | ||||||||||||||||||||||||||||||
| Washington, D.C. | 3 | 112 | 12 | 584 | 16 | 666 | 32 | 1,630 | ||||||||||||||||||||||||||||||
| Other | — | 25 | — | 6 | 2 | 6 | 2 | 44 | ||||||||||||||||||||||||||||||
Total / Weighted Average (3) | 163 | $5,453 | 226 | $7,859 | 185 | $7,449 | 450 | $15,439 | ||||||||||||||||||||||||||||||
| (1) | Includes leases with an expiration date of December 31, 2021, comprised of approximately 58,000 square feet and expiring lease revenue of $1.8 million. No such adjustments are made to other periods presented. | ||||
| (2) | Expiring Lease Revenue is calculated as expiring square footage multiplied by the gross rent per square foot of the tenant currently leasing the space. | ||||
| (3) | Total expiring lease revenue in any given year will not tie to the expiring Annualized Lease Revenue presented on the Lease Expiration Schedule on the previous page as the Lease Expiration Schedule accounts for the revenue effects of newly signed leases. Reflected herein are expiring revenues based on in-place rental rates. | ||||
27
Piedmont Office Realty Trust, Inc.
Lease Expirations by Year
As of December 31, 2021
(in thousands)
12/31/2022 (1) | 12/31/2023 | 12/31/2024 | 12/31/2025 | 12/31/2026 | ||||||||||||||||||||||||||||||||||||||||
| Location | Expiring Square Footage | Expiring Lease Revenue (2) | Expiring Square Footage | Expiring Lease Revenue (2) | Expiring Square Footage | Expiring Lease Revenue (2) | Expiring Square Footage | Expiring Lease Revenue (2) | Expiring Square Footage | Expiring Lease Revenue (2) | ||||||||||||||||||||||||||||||||||
| Atlanta | 361 | $11,583 | 270 | $8,997 | 323 | $10,895 | 429 | $13,672 | 468 | $16,339 | ||||||||||||||||||||||||||||||||||
| Boston | 32 | 2,797 | 124 | 4,943 | 39 | 2,732 | 148 | 5,078 | 36 | 1,156 | ||||||||||||||||||||||||||||||||||
| Dallas | 445 | 14,503 | 468 | 16,362 | 222 | 8,119 | 441 | 17,595 | 341 | 10,803 | ||||||||||||||||||||||||||||||||||
| Minneapolis | 37 | 1,190 | 709 | 20,334 | 531 | 18,973 | 260 | 10,194 | 40 | 1,465 | ||||||||||||||||||||||||||||||||||
| New York | 7 | 332 | 3 | 630 | 69 | 3,717 | 7 | 375 | 313 | 14,614 | ||||||||||||||||||||||||||||||||||
| Orlando | 76 | 2,722 | 80 | 2,586 | 382 | 8,671 | 237 | 7,248 | 266 | 8,521 | ||||||||||||||||||||||||||||||||||
| Washington, D.C. | 63 | 2,992 | 40 | 2,153 | 173 | 8,653 | 32 | 2,309 | 104 | 5,057 | ||||||||||||||||||||||||||||||||||
| Other | 3 | 81 | 4 | 137 | 13 | 414 | 41 | 1,098 | 41 | 1,090 | ||||||||||||||||||||||||||||||||||
Total / Weighted Average (3) | 1,024 | $36,200 | 1,698 | $56,142 | 1,752 | $62,174 | 1,595 | $57,569 | 1,609 | $59,045 | ||||||||||||||||||||||||||||||||||
| (1) | Includes leases with an expiration date of December 31, 2021, comprised of approximately 58,000 square feet and expiring lease revenue of $1.8 million. No such adjustments are made to other periods presented. | ||||
| (2) | Expiring Lease Revenue is calculated as expiring square footage multiplied by the gross rent per square foot of the tenant currently leasing the space. | ||||
| (3) | Total expiring lease revenue in any given year will not tie to the expiring Annualized Lease Revenue presented on the Lease Expiration Schedule on page 26 as the Lease Expiration Schedule accounts for the revenue effects of newly signed leases. Reflected herein are expiring revenues based on in-place rental rates. | ||||
28
Piedmont Office Realty Trust, Inc.
Capital Expenditures
For the quarter ended December 31, 2021
Unaudited (in thousands)
| For the Three Months Ended | |||||||||||||||||||||||||||||
| 12/31/2021 | 9/30/2021 | 6/30/2021 | 3/31/2021 | 12/31/2020 | |||||||||||||||||||||||||
| Non-incremental | |||||||||||||||||||||||||||||
| Building / construction / development | $ | 7,660 | $ | 8,598 | $ | 4,231 | $ | 12,921 | $ | 9,334 | |||||||||||||||||||
| Tenant improvements | 10,223 | 5,941 | 9,504 | 3,225 | 9,839 | ||||||||||||||||||||||||
| Leasing costs | 4,430 | 4,101 | 3,127 | 1,201 | 447 | ||||||||||||||||||||||||
| Total non-incremental | 22,313 | 18,640 | 16,862 | 17,347 | 19,620 | ||||||||||||||||||||||||
| Incremental | |||||||||||||||||||||||||||||
| Building / construction / development | 10,892 | 10,348 | 9,757 | 7,065 | 9,913 | ||||||||||||||||||||||||
| Tenant improvements | 8,783 | 4,282 | 4,835 | 2,544 | 2,014 | ||||||||||||||||||||||||
| Leasing costs | 5,795 | 1,471 | 2,484 | 618 | 444 | ||||||||||||||||||||||||
| Total incremental | 25,470 | 16,101 | 17,076 | 10,227 | 12,371 | ||||||||||||||||||||||||
| Total capital expenditures | $ | 47,783 | $ | 34,741 | $ | 33,938 | $ | 27,574 | $ | 31,991 | |||||||||||||||||||
| NOTE: | The information presented on this page is for our consolidated assets. | ||||
29
Piedmont Office Realty Trust, Inc.
Contractual Tenant Improvements and Leasing Commissions
| Three Months Ended December 31, 2021 | Twelve Months Ended December 31, 2021 | For the Year Ended | 2016 to 2021 (Weighted Average Total) | |||||||||||||||||||||||||||||||||||||||||||||||||||||||||||||||||
| 2020 | 2019 | 2018 | 2017 | 2016 | ||||||||||||||||||||||||||||||||||||||||||||||||||||||||||||||||
| Renewal Leases | ||||||||||||||||||||||||||||||||||||||||||||||||||||||||||||||||||||
Square feet | 196,119 | 1,517,414 | 841,020 | 2,032,452 | 735,969 | 1,198,603 | 880,289 | 7,205,747 | ||||||||||||||||||||||||||||||||||||||||||||||||||||||||||||
Tenant improvements per square foot per year of lease term (1) | $4.72 | $1.86 | $3.15 | $4.28 | $4.15 | $1.84 | $1.35 | $3.02 | ||||||||||||||||||||||||||||||||||||||||||||||||||||||||||||
| Leasing commissions per square foot per year of lease term | $2.07 | $1.53 | $1.75 | $1.63 | $1.69 | $1.12 | $1.05 | $1.49 | ||||||||||||||||||||||||||||||||||||||||||||||||||||||||||||
| Total per square foot per year of lease term | $6.79 | (2) | $3.39 | $4.90 | $5.91 | (3) | $5.84 | (4) | $2.96 | $2.40 | $4.51 | |||||||||||||||||||||||||||||||||||||||||||||||||||||||||
| New Leases | ||||||||||||||||||||||||||||||||||||||||||||||||||||||||||||||||||||
| Square feet | 201,293 | 729,952 | 262,228 | 697,880 | 864,113 | 855,069 | 1,065,630 | 4,474,872 | ||||||||||||||||||||||||||||||||||||||||||||||||||||||||||||
Tenant improvements per square foot per year of lease term (1) | $3.84 | $3.91 | $6.22 | $4.07 | $4.58 | $4.73 | $5.01 | $4.59 | ||||||||||||||||||||||||||||||||||||||||||||||||||||||||||||
| Leasing commissions per square foot per year of lease term | $1.48 | $1.85 | $2.13 | $1.85 | $1.73 | $1.83 | $1.86 | $1.83 | ||||||||||||||||||||||||||||||||||||||||||||||||||||||||||||
| Total per square foot per year of lease term | $5.32 | $5.76 | $8.35 | (5) | $5.92 | $6.31 | (4) | $6.56 | $6.87 | $6.42 | ||||||||||||||||||||||||||||||||||||||||||||||||||||||||||
| Total | ||||||||||||||||||||||||||||||||||||||||||||||||||||||||||||||||||||
| Square feet | 397,412 | 2,247,366 | 1,103,248 | 2,730,332 | 1,600,082 | 2,053,672 | 1,945,919 | 11,680,619 | ||||||||||||||||||||||||||||||||||||||||||||||||||||||||||||
Tenant improvements per square foot per year of lease term (1) | $4.18 | $2.78 | $4.30 | $4.21 | $4.46 | $3.55 | $3.70 | $3.81 | ||||||||||||||||||||||||||||||||||||||||||||||||||||||||||||
| Leasing commissions per square foot per year of lease term | $1.71 | $1.67 | $1.89 | $1.70 | $1.72 | $1.54 | $1.57 | $1.66 | ||||||||||||||||||||||||||||||||||||||||||||||||||||||||||||
| Total per square foot per year of lease term | $5.89 | (2) | $4.45 | $6.19 | (5) | $5.91 | (3) | $6.18 | (4) | $5.09 | $5.27 | $5.47 | ||||||||||||||||||||||||||||||||||||||||||||||||||||||||
Less Adjustment for Commitment Expirations (6) | ||||||||||||||||||||||||||||||||||||||||||||||||||||||||||||||||||||
| Expired tenant improvements (not paid out) per square foot per year of lease term | -$0.20 | -$0.20 | -$0.40 | -$0.05 | -$0.54 | -$0.44 | -$0.16 | -$0.26 | ||||||||||||||||||||||||||||||||||||||||||||||||||||||||||||
| Adjusted total per square foot per year of lease term | $5.69 | $4.25 | $5.79 | $5.86 | $5.64 | $4.65 | $5.11 | $5.21 | ||||||||||||||||||||||||||||||||||||||||||||||||||||||||||||
| NOTE: | This information is presented for our consolidated office assets only and excludes activity associated with storage and license spaces. | ||||
| (1) | For leases under which a tenant may use, at its discretion, a portion of its tenant improvement allowance for expenses other than those related to improvements to its space, an assumption is made that the tenant elects to use any such portion of its tenant improvement allowance for improvements to its space prior to the commencement of its lease, unless the Company is notified otherwise by the tenant. This assumption is made based upon historical usage patterns of tenant improvement allowances by the Company's tenants. | ||||
| (2) | During the fourth quarter of 2021, we completed three significant lease renewals (amounting to approximately 70,000 square feet in total) which required equivalent capital commitments to new lease transactions. If the costs associated with those leases were to be removed from the average committed capital cost calculation, the average committed capital cost per square foot per year of lease term for renewal leases and total leases completed during the three months ended December 31, 2021 would be $4.75 and $5.18, respectively. | ||||
| (3) | During 2019, we completed three large lease renewals with significant capital commitments: VMware at 1155 Perimeter Center West in Atlanta, GA, Siemens at Crescent Ridge II in Minnetonka, MN, and the State of New York at 60 Broad Street in New York, NY. If the costs associated with those leases were to be removed from the average committed capital cost calculation, the average committed capital cost per square foot per year of lease term for renewal leases and total leases completed during the twelve months ended December 31, 2019 would be $3.41 and $5.04, respectively. | ||||
| (4) | During 2018, we completed two large leasing transactions in the Houston, TX market with large capital commitments: a 254,000 square foot lease renewal and expansion with Schlumberger Technology Corporation at 1430 Enclave Parkway and a 301,000 square foot, full-building lease with Transocean Offshore Deepwater Drilling at Enclave Place. If the costs associated with those leases were to be removed from the average committed capital cost calculation, the average committed capital cost per square foot per year of lease term for renewal leases, new leases and total leases completed during the twelve months ended December 31, 2018 would be $5.27, $6.02, and $5.70, respectively. | ||||
| (5) | During 2020, we completed five new leasing transactions (amounting to 93,000 square feet in total) in the Washington, DC market with large capital commitments. If the costs associated with those leases were to be removed from the average committed capital cost calculation, the average committed capital cost per square foot per year of lease term for new leases and total leases completed during the twelve months ended December 31, 2020 would be $5.62 and $5.06, respectively. | ||||
| (6) | The Company has historically reported the maximum amount of capital to which it committed in leasing transactions as of the signing of the leases with no subsequent updates for variations and/or changes in tenants' uses of tenant improvement allowances. Many times, tenants do not fully use the allowances provided in their leases or let portions of their tenant improvement allowances expire. In an effort to provide additional clarity on the actual costs of completed leasing transactions, tenant improvement allowances that expired or became no longer available to tenants are disclosed in this section and are deducted from the capital commitments per square foot of leased space in the periods in which they expired in an effort to provide a better estimation of leasing transaction costs over time. | ||||
30
Piedmont Office Realty Trust, Inc.
Geographic Diversification
As of December 31, 2021
($ and square footage in thousands)
| Location | Number of Properties | Annualized Lease Revenue | Percentage of Annualized Lease Revenue (%) | Rentable Square Footage | Percentage of Rentable Square Footage (%) | Leased Square Footage | Percent Leased (%) | |||||||||||||||||||
| Atlanta | 10 | $111,739 | 20.8 | 4,016 | 23.6 | 3,379 | 84.1 | |||||||||||||||||||
| Dallas | 13 | 104,979 | 19.6 | 3,544 | 20.8 | 3,005 | 84.8 | |||||||||||||||||||
| Washington, D.C. | 6 | 67,463 | 12.6 | 1,620 | 9.5 | 1,307 | 80.7 | |||||||||||||||||||
| Minneapolis | 6 | 64,571 | 12.0 | 2,104 | 12.3 | 1,906 | 90.6 | |||||||||||||||||||
| Boston | 10 | 61,435 | 11.4 | 1,885 | 11.1 | 1,736 | 92.1 | |||||||||||||||||||
| Orlando | 6 | 54,796 | 10.2 | 1,754 | 10.3 | 1,603 | 91.4 | |||||||||||||||||||
| New York | 1 | 48,103 | 9.0 | 1,029 | 6.0 | 921 | 89.5 | |||||||||||||||||||
| Other | 3 | 23,718 | 4.4 | 1,099 | 6.4 | 726 | 66.1 | |||||||||||||||||||
| Total / Weighted Average | 55 | $536,804 | 100.0 | 17,051 | 100.0 | 14,583 | 85.5 | |||||||||||||||||||
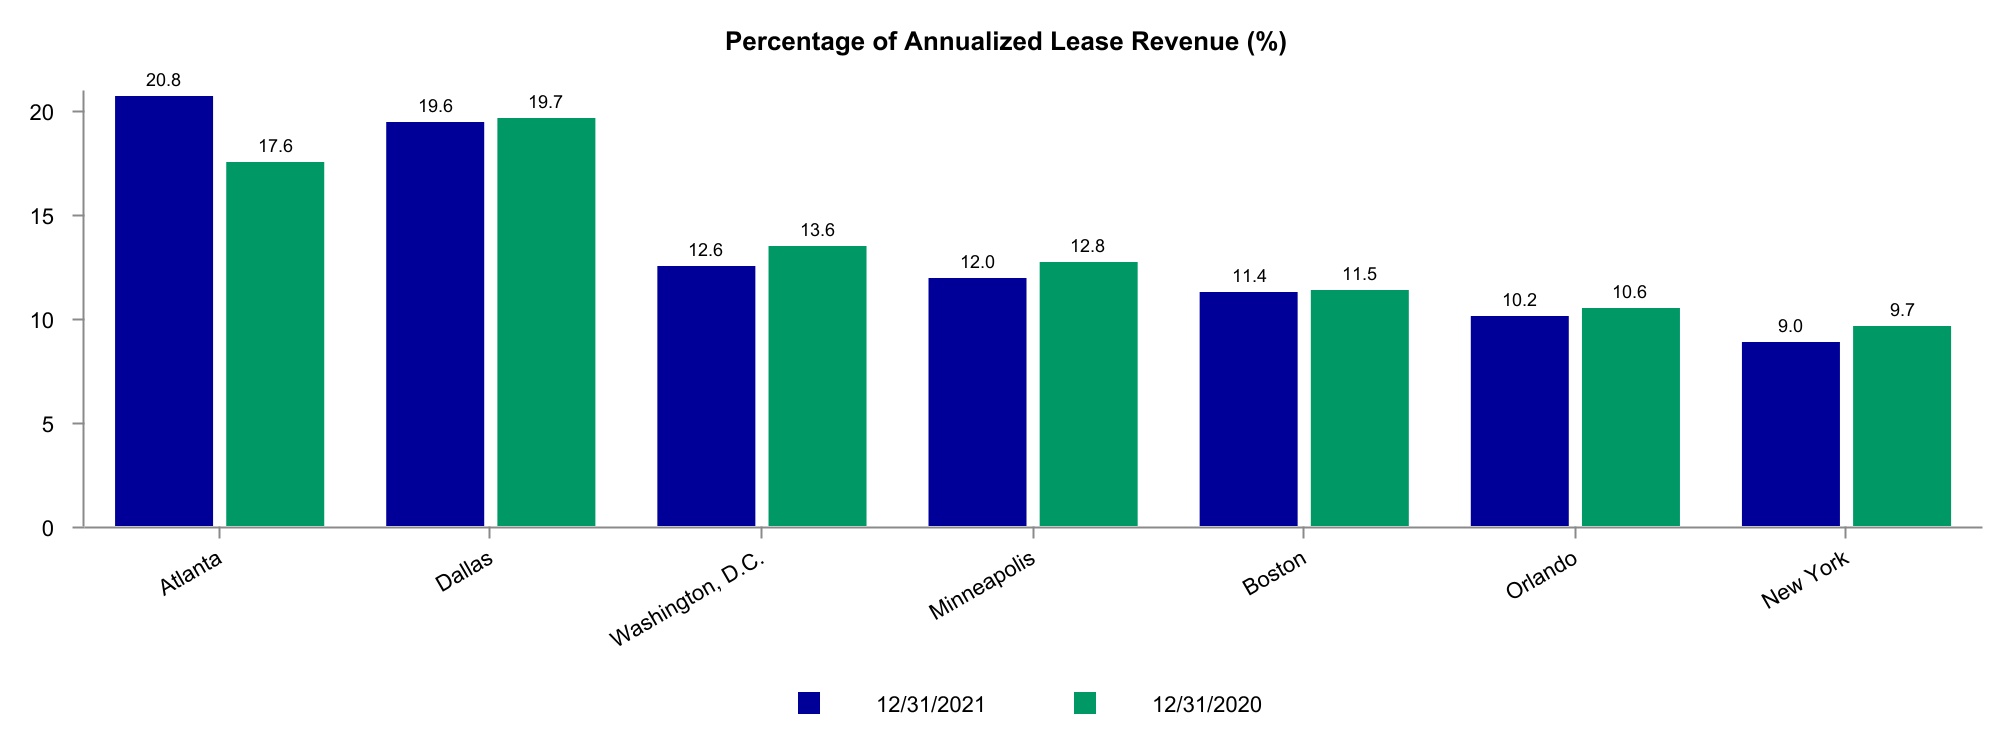
31
Piedmont Office Realty Trust, Inc.
Geographic Diversification by Location Type
As of December 31, 2021
(square footage in thousands)
| CBD | URBAN INFILL / SUBURBAN | TOTAL | ||||||||||||||||||||||||||||||||||||||||||||||||
| Location | State | Number of Properties | Percentage of Annualized Lease Revenue (%) | Rentable Square Footage | Percentage of Rentable Square Footage (%) | Number of Properties | Percentage of Annualized Lease Revenue (%) | Rentable Square Footage | Percentage of Rentable Square Footage (%) | Number of Properties | Percentage of Annualized Lease Revenue (%) | Rentable Square Footage | Percentage of Rentable Square Footage (%) | |||||||||||||||||||||||||||||||||||||
| Atlanta | GA | 1 | 3.5 | 622 | 3.7 | 9 | 17.3 | 3,394 | 19.9 | 10 | 20.8 | 4,016 | 23.6 | |||||||||||||||||||||||||||||||||||||
| Dallas | TX | — | — | — | — | 13 | 19.6 | 3,544 | 20.8 | 13 | 19.6 | 3,544 | 20.8 | |||||||||||||||||||||||||||||||||||||
| Washington, D.C. | DC, VA | 3 | 5.7 | 722 | 4.2 | 3 | 6.9 | 898 | 5.3 | 6 | 12.6 | 1,620 | 9.5 | |||||||||||||||||||||||||||||||||||||
| Minneapolis | MN | 1 | 6.3 | 937 | 5.5 | 5 | 5.7 | 1,167 | 6.8 | 6 | 12.0 | 2,104 | 12.3 | |||||||||||||||||||||||||||||||||||||
| Boston | MA | — | — | — | — | 10 | 11.4 | 1,885 | 11.1 | 10 | 11.4 | 1,885 | 11.1 | |||||||||||||||||||||||||||||||||||||
| Orlando | FL | 4 | 8.4 | 1,445 | 8.5 | 2 | 1.8 | 309 | 1.8 | 6 | 10.2 | 1,754 | 10.3 | |||||||||||||||||||||||||||||||||||||
| New York | NY | 1 | 9.0 | 1,029 | 6.0 | — | — | — | — | 1 | 9.0 | 1,029 | 6.0 | |||||||||||||||||||||||||||||||||||||
| Other | — | — | — | — | 3 | 4.4 | 1,099 | 6.4 | 3 | 4.4 | 1,099 | 6.4 | ||||||||||||||||||||||||||||||||||||||
| Total / Weighted Average | 10 | 32.9 | 4,755 | 27.9 | 45 | 67.1 | 12,296 | 72.1 | 55 | 100.0 | 17,051 | 100.0 | ||||||||||||||||||||||||||||||||||||||
32
Piedmont Office Realty Trust, Inc.
Industry Diversification
As of December 31, 2021
($ and square footage in thousands)
| Percentage of | |||||||||||||||||||||||
| Number of | Percentage of Total | Annualized Lease | Annualized Lease | Leased Square | Percentage of Leased | ||||||||||||||||||
| Industry | Tenants | Tenants (%) | Revenue | Revenue (%) | Footage | Square Footage (%) | |||||||||||||||||
| Business Services | 95 | 12.9 | $84,695 | 15.8 | 2,356 | 16.2 | |||||||||||||||||
| Engineering, Accounting, Research, Management & Related Services | 104 | 14.1 | 68,023 | 12.7 | 1,785 | 12.2 | |||||||||||||||||
| Governmental Entity | 6 | 0.8 | 48,974 | 9.1 | 970 | 6.7 | |||||||||||||||||
| Legal Services | 80 | 10.8 | 39,551 | 7.4 | 1,088 | 7.5 | |||||||||||||||||
| Depository Institutions | 18 | 2.4 | 37,637 | 7.0 | 1,021 | 7.0 | |||||||||||||||||
| Real Estate | 41 | 5.6 | 23,432 | 4.4 | 753 | 5.2 | |||||||||||||||||
| Miscellaneous Retail | 9 | 1.2 | 22,157 | 4.1 | 589 | 4.0 | |||||||||||||||||
| Oil and Gas Extraction | 3 | 0.4 | 18,803 | 3.5 | 557 | 3.8 | |||||||||||||||||
| Security & Commodity Brokers, Dealers, Exchanges & Services | 49 | 6.6 | 17,263 | 3.2 | 469 | 3.2 | |||||||||||||||||
| Health Services | 32 | 4.3 | 16,257 | 3.0 | 429 | 2.9 | |||||||||||||||||
| Holding and Other Investment Offices | 30 | 4.1 | 14,542 | 2.7 | 391 | 2.7 | |||||||||||||||||
| Measuring, Analyzing, And Controlling Instruments; Medical and Other Goods | 5 | 0.7 | 12,471 | 2.3 | 587 | 4.0 | |||||||||||||||||
| Educational Services | 6 | 0.8 | 11,899 | 2.2 | 206 | 1.4 | |||||||||||||||||
| Insurance Agents, Brokers & Services | 18 | 2.4 | 11,447 | 2.1 | 348 | 2.4 | |||||||||||||||||
| Membership Organizations | 16 | 2.2 | 10,703 | 2.0 | 189 | 1.3 | |||||||||||||||||
| Other | 226 | 30.7 | 98,950 | 18.5 | 2,845 | 19.5 | |||||||||||||||||
| Total | 738 | 100.0 | $536,804 | 100.0 | 14,583 | 100.0 | |||||||||||||||||
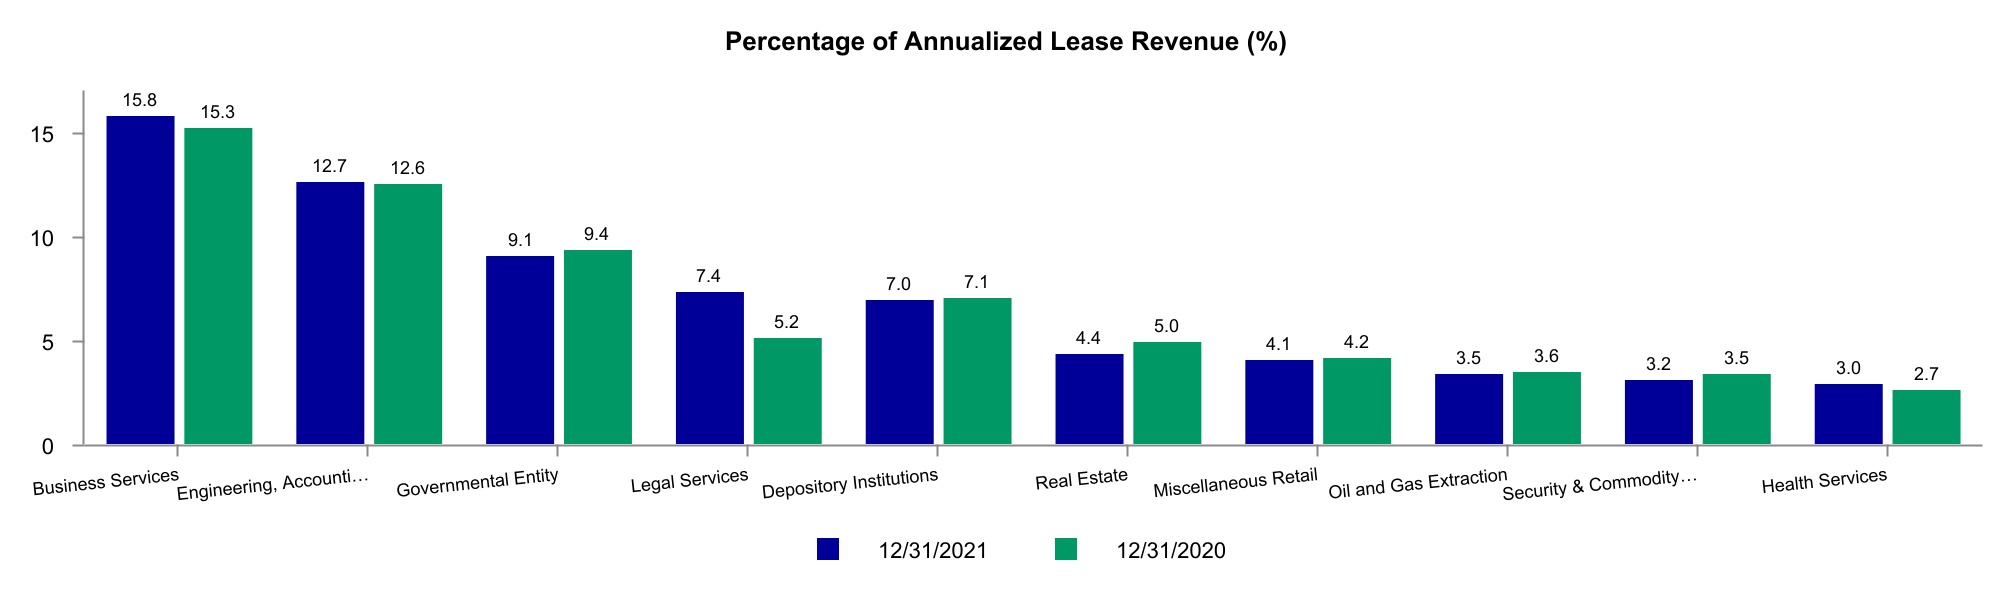
33
Piedmont Office Realty Trust, Inc.
Property Investment Activity
As of December 31, 2021
($ and square footage in thousands)
Acquisitions Over Previous Eighteen Months
| Property | Market / Submarket | Acquisition Date | Percent Ownership (%) | Year Built | Purchase Price | Rentable Square Footage | Percent Leased at Acquisition (%) | |||||||||||||||||||
| 222 South Orange Avenue | Orlando / CBD | 10/29/2020 | 100 | 1959 | $20,000 | 127 | — | |||||||||||||||||||
| 999 Peachtree Street | Atlanta / Midtown | 10/22/2021 | 100 | 1987 | 223,900 | 622 | 77 | |||||||||||||||||||
| Galleria Atlanta Land | Atlanta / Northwest | 11/19/2021 | 100 | N/A | 4,000 | N/A | N/A | |||||||||||||||||||
| Total / Weighted Average | $247,900 | 749 | 64 | |||||||||||||||||||||||
Dispositions Over Previous Eighteen Months
| Property | Market / Submarket | Disposition Date | Percent Ownership (%) | Year Built | Sale Price | Rentable Square Footage | Percent Leased at Disposition (%) | |||||||||||||||||||
New Jersey Portfolio (1) | New York / Route 78 | 10/28/2020 | 100 | Various | $130,000 | 739 | 75 | |||||||||||||||||||
Dispositions Subsequent to Quarter End
| Property | Market / Submarket | Disposition Date | Percent Ownership (%) | Year Built | Sale Price | Rentable Square Footage | Percent Leased at Disposition (%) | |||||||||||||||||||
| Two Pierce Place | Chicago / Northwest | 1/25/2022 | 100 | 1991 | $24,000 | 485 | 34 | |||||||||||||||||||
| 225 and 235 Presidential Way | Boston / Route 128 | 1/28/2022 | 100 | 2001 and 2000 | 129,000 | 440 | 100 | |||||||||||||||||||
| Total / Weighted Average | $153,000 | 925 | 65 | |||||||||||||||||||||||
| (1) | The New Jersey Portfolio was comprised of Piedmont's remaining three assets in New Jersey: 200 Bridgewater Crossing and 400 Bridgewater Crossing in Bridgewater, NJ; and 600 Corporate Drive in Lebanon, NJ. | ||||
34
Piedmont Office Realty Trust, Inc.
Other Investments
As of December 31, 2021
($ and square footage in thousands)
Developable Land Parcels
| Property | Market / Submarket | Adjacent Piedmont Property | Acres | Real Estate Book Value | ||||||||||
| Gavitello | Atlanta / Buckhead | The Medici | 2.0 | $2,621 | ||||||||||
| Glenridge Highlands Three | Atlanta / Central Perimeter | Glenridge Highlands One and Two | 3.0 | 2,015 | ||||||||||
| Galleria Atlanta | Atlanta / Northwest | Galleria 100, 200, 300, 400 and 600 | 16.3 | 24,176 | ||||||||||
| State Highway 161 | Dallas / Las Colinas | Las Colinas Corporate Center I and II, 161 Corporate Center | 4.5 | 3,320 | ||||||||||
| Royal Lane | Dallas / Las Colinas | 6011, 6021 and 6031 Connection Drive | 10.6 | 2,837 | ||||||||||
| John Carpenter Freeway | Dallas / Las Colinas | 750 West John Carpenter Freeway | 3.5 | 1,000 | ||||||||||
| Galleria Dallas | Dallas / Lower North Tollway | One Galleria Tower, Two Galleria Tower, Three Galleria Tower | 1.9 | 4,160 | ||||||||||
| TownPark | Orlando / Lake Mary | 400 and 500 TownPark | 18.9 | 8,405 | ||||||||||
| Total | 60.7 | $48,534 | ||||||||||||
Redevelopment
| Property | Market / Submarket | Adjacent Piedmont Property | Construction Type | Percent Leased (%) | Square Feet | Current Asset Basis (Accrual) | |||||||||||||||||||||||
222 South Orange Avenue (1) | Orlando / CBD | 200 South Orange Avenue | Redevelopment | — | 127 | $22.1 million | |||||||||||||||||||||||
Loan Investments
| Loan Type | Collateral | Location of Collateral | Maturity Date | Book Value ($'s in thousands) | Interest Rate | ||||||||||||
Senior Loan (2) | 200 and 400 Bridgewater Crossing | Bridgewater, NJ | 10/31/2023 | $102,800 | 6.0% | ||||||||||||
Mezzanine Loan (2) | Equity interests in 200 and 400 Bridgewater Crossing | Bridgewater, NJ | 10/31/2023 | 15,700 | 13.6% | ||||||||||||
| Total / Weighted Average | $118,500 | 7.0% | |||||||||||||||
| (1) | The property was acquired on October 29, 2020 and shares a common lobby and atrium with the Company's 200 South Orange Avenue property. The redevelopment will include an enhanced window line, allowing more light and air into tenant spaces, along with renovations to the lobby, common areas and restrooms. | ||||
| (2) | Piedmont provided seller financing with the sale of 200 and 400 Bridgewater Crossing in Bridgewater, NJ, on October 28, 2020. | ||||
35
Piedmont Office Realty Trust, Inc.
Supplemental Definitions
Included below are definitions of various terms used throughout this supplemental report, including definitions of certain non-GAAP financial measures and the reasons why the Company’s management believes these measures provide useful information to investors about the Company’s financial condition and results of operations. Reconciliations of any non-GAAP financial measures defined below are included beginning on page 38. | ||
Adjusted Funds From Operations ("AFFO"): The Company calculates AFFO by starting with Core FFO and adjusting for non-incremental capital expenditures and then adding back non-cash items including: non-real estate depreciation, straight-lined rents and fair value lease adjustments, non-cash components of interest expense and compensation expense, and by making similar adjustments for joint ventures. AFFO is a non-GAAP financial measure and should not be viewed as an alternative to net income calculated in accordance with GAAP as a measurement of the Company’s operating performance. The Company believes that AFFO is helpful to investors as a meaningful supplemental comparative performance measure of our ability to make incremental capital investments. Other REITs may not define AFFO in the same manner as the Company; therefore, the Company’s computation of AFFO may not be comparable to that of other REITs. | ||
Annualized Lease Revenue ("ALR"): ALR is calculated by multiplying (i) rental payments (defined as base rent plus operating expense reimbursements, if payable by the tenant on a monthly basis under the terms of a lease that has been executed, but excluding a) rental abatements and b) rental payments related to executed but not commenced leases for space that was covered by an existing lease), by (ii) 12. In instances in which contractual rents or operating expense reimbursements are collected on an annual, semi-annual, or quarterly basis, such amounts are multiplied by a factor of 1, 2, or 4, respectively, to calculate the annualized figure. For leases that have been executed but not commenced relating to un-leased space, ALR is calculated by multiplying (i) the monthly base rental payment (excluding abatements) plus any operating expense reimbursements for the initial month of the lease term, by (ii) 12. Unless stated otherwise, this measure excludes revenues associated with development properties and properties taken out of service for redevelopment, if any. | ||
Core EBITDA: The Company calculates Core EBITDA as net income (computed in accordance with GAAP) before interest, taxes, depreciation and amortization and incrementally removing any impairment losses, gains or losses from sales of property and other significant infrequent items that create volatility within our earnings and make it difficult to determine the earnings generated by our core ongoing business. Core EBITDA is a non-GAAP financial measure and should not be viewed as an alternative to net income calculated in accordance with GAAP as a measurement of the Company’s operating performance. The Company believes that Core EBITDA is helpful to investors as a supplemental performance measure because it provides a metric for understanding the performance of the Company’s results from ongoing operations without taking into account the effects of non-cash expenses (such as depreciation and amortization), as well as items that are not part of normal day-to-day operations of the Company’s business. Other REITs may not define Core EBITDA in the same manner as the Company; therefore, the Company’s computation of Core EBITDA may not be comparable to that of other REITs. | ||
Core Funds From Operations ("Core FFO"): The Company calculates Core FFO by starting with FFO, as defined by NAREIT, and adjusting for gains or losses on the extinguishment of swaps and/or debt and any significant non-recurring items. Core FFO is a non-GAAP financial measure and should not be viewed as an alternative to net income calculated in accordance with GAAP as a measurement of the Company’s operating performance. The Company believes that Core FFO is helpful to investors as a supplemental performance measure because it excludes the effects of certain items which can create significant earnings volatility, but which do not directly relate to the Company’s core business operations. As a result, the Company believes that Core FFO can help facilitate comparisons of operating performance between periods and provides a more meaningful predictor of future earnings potential. Other REITs may not define Core FFO in the same manner as the Company; therefore, the Company’s computation of Core FFO may not be comparable to that of other REITs. | ||
EBITDA: EBITDA is defined as net income before interest, taxes, depreciation and amortization. | ||
EBITDAre: The Company calculates EBITDAre in accordance with the current National Association of Real Estate Investment Trusts (“NAREIT”) definition. NAREIT currently defines EBITDAre as net income (computed in accordance with GAAP) adjusted for gains or losses from sales of property, impairment losses, depreciation on real estate assets, amortization on real estate assets, interest expense and taxes, along with the same adjustments for joint ventures. Some of the adjustments mentioned can vary among owners of identical assets in similar conditions based on historical cost accounting and useful-life estimates. EBITDAre is a non-GAAP financial measure and should not be viewed as an alternative to net income calculated in accordance with GAAP as a measurement of the Company’s operating performance. The Company believes that EBITDAre is helpful to investors as a supplemental performance measure because it provides a metric for understanding the Company’s results from ongoing operations without taking into account the effects of non-cash expenses (such as depreciation and amortization) and capitalization and capital structure expenses (such as interest expense and taxes). The Company also believes that EBITDAre can help facilitate comparisons of operating performance between periods and with other REITs. However, other REITs may not define EBITDAre in accordance with the NAREIT definition, or may interpret the current NAREIT definition differently than the Company; therefore, the Company’s computation of EBITDAre may not be comparable to that of such other REITs. | ||
Funds From Operations ("FFO"): The Company calculates FFO in accordance with the current National Association of Real Estate Investment Trusts (“NAREIT”) definition. NAREIT currently defines FFO as net income (calculated in accordance with GAAP), excluding depreciation and amortization related to real estate, gains and losses from the sale of certain real estate assets, gains and losses from change in control, and impairment write-downs of certain real estate assets and investment in entities when the impairment is directly attributable to decreases in the value of depreciable real estate held by the entity, along with appropriate adjustments to those reconciling items for joint ventures. These adjustments can vary among owners of identical assets in similar conditions based on historical cost accounting and useful-life estimates. FFO is a non-GAAP financial measure and should not be viewed as an alternative to net income calculated in accordance with GAAP as a measurement of the Company’s operating performance. The Company believes that FFO is helpful to investors as a supplemental performance measure because it excludes the effects of depreciation, amortization and gains or losses from sales of real estate, all of which are based on historical costs, which implicitly assumes that the value of real estate diminishes predictably over time. The Company also believes that FFO can help facilitate comparisons of operating performance between periods and with other REITs. However, other REITs may not define FFO in accordance with the NAREIT definition, or may interpret the current NAREIT definition differently than the Company; therefore, the Company’s computation of FFO may not be comparable to that of such other REITs. | ||
Gross Assets: Gross Assets is defined as total assets with the add-back of accumulated depreciation and accumulated amortization related to real estate assets and accumulated amortization related to deferred lease costs. | ||
Gross Real Estate Assets: Gross Real Estate Assets is defined as total real estate assets with the add-back of accumulated depreciation and accumulated amortization related to real estate assets. | ||
Incremental Capital Expenditures: Incremental Capital Expenditures are defined as capital expenditures of a non-recurring nature that incrementally enhance the underlying assets' income generating capacity. Tenant improvements, leasing commissions, building capital and deferred lease incentives ("Leasing Costs") incurred to lease space that was vacant at acquisition, Leasing Costs for spaces vacant for greater than one year, Leasing Costs for spaces at newly acquired properties for which in-place leases expire shortly after acquisition, improvements associated with the expansion of a building, renovations that change the underlying classification of a building, and deferred building maintenance capital identified at and completed shortly after acquisition are included in this measure. | ||
Non-Incremental Capital Expenditures: Non-Incremental Capital Expenditures are defined as capital expenditures of a recurring nature related to tenant improvements and leasing commissions that do not incrementally enhance the underlying assets' income generating capacity. We exclude first generation tenant improvements and leasing commissions from this measure, in addition to other capital expenditures that qualify as Incremental Capital Expenditures, as defined above. | ||
Property Net Operating Income ("Property NOI"): The Company calculates Property NOI by starting with Core EBITDA and adjusting for general and administrative expense, income associated with property management performed by Piedmont for other organizations and other income or expense items for the Company, such as interest income from loan investments or costs from the pursuit of non-consummated transactions. The Company may present this measure on an accrual basis or a cash basis. When presented on a cash basis, the effects of straight lined rents and fair value lease revenue are also eliminated. Property NOI is a non-GAAP financial measure and should not be viewed as an alternative to net income calculated in accordance with GAAP as a measurement of the Company’s operating performance. The Company believes that Property NOI is helpful to investors as a supplemental comparative performance measure of income generated by its properties alone without the administrative overhead of the Company. Other REITs may not define Property NOI in the same manner as the Company; therefore, the Company’s computation of Property NOI may not be comparable to that of other REITs. | ||
Same Store Net Operating Income ("Same Store NOI"): The Company calculates Same Store NOI as Property NOI attributable to the properties for which the following criteria were met during the entire span of the current and prior year reporting periods: (i) they were owned, (ii) they were not under development / redevelopment, and (iii) none of the operating expenses for which were capitalized. Same Store NOI also excludes amounts attributable to land assets. The Company may present this measure on an accrual basis or a cash basis. When presented on a cash basis, the effects of straight lined rents and fair value lease revenue are also eliminated. Same Store NOI is a non-GAAP financial measure and should not be viewed as an alternative to net income calculated in accordance with GAAP as a measurement of the Company’s operating performance. The Company believes that Same Store NOI is helpful to investors as a supplemental comparative performance measure of the income generated from the same group of properties from one period to the next. Other REITs may not define Same Store NOI in the same manner as the Company; therefore, the Company’s computation of Same Store NOI may not be comparable to that of other REITs. | ||
Same Store Properties: Same Store Properties is defined as those properties for which the following criteria were met during the entire span of the current and prior year reporting periods: (i) they were owned, (ii) they were not under development / redevelopment, and (iii) none of the operating expenses for which were capitalized. Same Store Properties excludes land assets. | ||
36
Piedmont Office Realty Trust, Inc.
Research Coverage
Equity Research Coverage
| Daniel Ismail, CFA | Anthony Paolone, CFA | David Rodgers, CFA | Michael Lewis, CFA | ||||||||
| Green Street Advisors | JP Morgan | Robert W. Baird & Co. | Truist Securities | ||||||||
| 100 Bayview Circle, Suite 400 | 383 Madison Avenue | 200 Public Square | 711 Fifth Avenue, 4th Floor | ||||||||
| Newport Beach, CA 92660 | 32nd Floor | Suite 1650 | New York, NY 10022 | ||||||||
| Phone: (949) 640-8780 | New York, NY 10179 | Cleveland, OH 44139 | Phone: (212) 319-5659 | ||||||||
| Phone: (212) 622-6682 | Phone: (216) 737-7341 | ||||||||||
Fixed Income Research Coverage
| Mark S. Streeter, CFA | ||||||||
| JP Morgan | ||||||||
| 383 Madison Avenue | ||||||||
| 3rd Floor | ||||||||
| New York, NY 10179 | ||||||||
| Phone: (212) 834-5086 | ||||||||
37
Piedmont Office Realty Trust, Inc.
Funds From Operations, Core Funds From Operations, and Adjusted Funds From Operations Reconciliations
Unaudited (in thousands)
| Three Months Ended | Twelve Months Ended | ||||||||||||||||||||||||||||||||||||||||
| 12/31/2021 | 9/30/2021 | 6/30/2021 | 3/31/2021 | 12/31/2020 | 12/31/2021 | 12/31/2020 | |||||||||||||||||||||||||||||||||||
| GAAP net income / (loss) applicable to common stock | $ | (31,750) | $ | 11,306 | $ | 9,947 | $ | 9,344 | $ | 22,609 | $ | (1,153) | $ | 232,688 | |||||||||||||||||||||||||||
| Depreciation | 31,756 | 30,336 | 29,725 | 27,812 | 26,942 | 119,629 | 109,326 | ||||||||||||||||||||||||||||||||||
| Amortization | 22,003 | 20,362 | 20,681 | 22,900 | 22,312 | 85,946 | 93,242 | ||||||||||||||||||||||||||||||||||
| Impairment loss | 41,000 | — | — | — | — | 41,000 | — | ||||||||||||||||||||||||||||||||||
| Loss / (gain) on sale of properties | — | — | — | — | (14,634) | — | (205,666) | ||||||||||||||||||||||||||||||||||
| NAREIT funds from operations applicable to common stock | 63,009 | 62,004 | 60,353 | 60,056 | 57,229 | 245,422 | 229,590 | ||||||||||||||||||||||||||||||||||
| Adjustments: | |||||||||||||||||||||||||||||||||||||||||
| Loss / (gain) on extinguishment of debt | — | — | — | — | — | — | 9,336 | ||||||||||||||||||||||||||||||||||
| Core funds from operations applicable to common stock | 63,009 | 62,004 | 60,353 | 60,056 | 57,229 | 245,422 | 238,926 | ||||||||||||||||||||||||||||||||||
| Adjustments: | |||||||||||||||||||||||||||||||||||||||||
| Amortization of debt issuance costs, fair market adjustments on notes payable, and discount on senior notes | 781 | 849 | 573 | 654 | 653 | 2,857 | 2,833 | ||||||||||||||||||||||||||||||||||
| Depreciation of non real estate assets | 187 | 216 | 264 | 282 | 286 | 949 | 1,216 | ||||||||||||||||||||||||||||||||||
| Straight-line effects of lease revenue | (1,939) | (2,122) | (2,402) | (4,103) | (2,223) | (10,566) | (22,601) | ||||||||||||||||||||||||||||||||||
| Stock-based compensation adjustments | 2,772 | 1,637 | 2,404 | 1,111 | 2,733 | 7,924 | 7,014 | ||||||||||||||||||||||||||||||||||
| Amortization of lease-related intangibles | (3,098) | (2,731) | (2,669) | (2,792) | (2,767) | (11,290) | (12,284) | ||||||||||||||||||||||||||||||||||
| Non-incremental capital expenditures | (22,313) | (18,640) | (16,862) | (17,347) | (19,620) | (75,162) | (77,682) | ||||||||||||||||||||||||||||||||||
| Adjusted funds from operations applicable to common stock | $ | 39,399 | $ | 41,213 | $ | 41,661 | $ | 37,861 | $ | 36,291 | $ | 160,134 | $ | 137,422 | |||||||||||||||||||||||||||
38
Piedmont Office Realty Trust, Inc.
Same Store Net Operating Income (Cash Basis)
Unaudited (in thousands)
| Three Months Ended | Twelve Months Ended | ||||||||||||||||||||||||||||||||||||||||
| 12/31/2021 | 9/30/2021 | 6/30/2021 | 3/31/2021 | 12/31/2020 | 12/31/2021 | 12/31/2020 | |||||||||||||||||||||||||||||||||||
| Net income / (loss) applicable to Piedmont | $ | (31,750) | $ | 11,306 | $ | 9,947 | $ | 9,344 | $ | 22,609 | $ | (1,153) | $ | 232,688 | |||||||||||||||||||||||||||
| Net income / (loss) applicable to noncontrolling interest | (5) | (5) | (3) | (1) | (1) | (14) | (3) | ||||||||||||||||||||||||||||||||||
| Interest expense | 13,917 | 12,450 | 12,345 | 12,580 | 13,048 | 51,292 | 54,990 | ||||||||||||||||||||||||||||||||||
| Depreciation | 31,943 | 30,552 | 29,989 | 28,094 | 27,228 | 120,578 | 110,542 | ||||||||||||||||||||||||||||||||||
| Amortization | 22,003 | 20,362 | 20,681 | 22,900 | 22,312 | 85,946 | 93,242 | ||||||||||||||||||||||||||||||||||
| Depreciation and amortization attributable to noncontrolling interests | 22 | 21 | 21 | 21 | 20 | 84 | 85 | ||||||||||||||||||||||||||||||||||
| Impairment loss | 41,000 | — | — | — | — | 41,000 | — | ||||||||||||||||||||||||||||||||||
| (Gain) / loss on sale of properties | — | — | — | — | (14,634) | — | (205,666) | ||||||||||||||||||||||||||||||||||
| EBITDAre | 77,130 | 74,686 | 72,980 | 72,938 | 70,582 | 297,733 | 285,878 | ||||||||||||||||||||||||||||||||||
| (Gain) / loss on extinguishment of debt | — | — | — | — | — | — | 9,336 | ||||||||||||||||||||||||||||||||||
| Core EBITDA | 77,130 | 74,686 | 72,980 | 72,938 | 70,582 | 297,733 | 295,214 | ||||||||||||||||||||||||||||||||||
| General & administrative expenses | 7,835 | 6,955 | 8,211 | 7,251 | 7,415 | 30,252 | 27,464 | ||||||||||||||||||||||||||||||||||
| Non-cash general reserve for uncollectible accounts | (965) | — | — | 412 | (278) | (553) | 4,553 | ||||||||||||||||||||||||||||||||||
| Management fee revenue | (323) | (309) | (247) | (390) | (397) | (1,269) | (1,495) | ||||||||||||||||||||||||||||||||||
| Other (income) / expense | (2,667) | (2,121) | (2,162) | (2,141) | (1,554) | (9,089) | (1,724) | ||||||||||||||||||||||||||||||||||
| Straight-line effects of lease revenue | (1,939) | (2,122) | (2,402) | (4,103) | (2,223) | (10,566) | (22,601) | ||||||||||||||||||||||||||||||||||
| Straight-line effects of lease revenue attributable to noncontrolling interests | 1 | 1 | — | 1 | (4) | 3 | (16) | ||||||||||||||||||||||||||||||||||
| Amortization of lease-related intangibles | (3,098) | (2,731) | (2,669) | (2,792) | (2,767) | (11,290) | (12,284) | ||||||||||||||||||||||||||||||||||
| Property net operating income (cash basis) | 75,974 | 74,359 | 73,711 | 71,176 | 70,774 | 295,221 | 289,111 | ||||||||||||||||||||||||||||||||||
| Deduct net operating (income) / loss from: | |||||||||||||||||||||||||||||||||||||||||
| Acquisitions | (10,232) | (8,012) | (8,761) | (7,440) | (7,795) | (34,446) | (23,115) | ||||||||||||||||||||||||||||||||||
| Dispositions | (1) | (359) | (258) | 413 | (824) | (204) | (21,049) | ||||||||||||||||||||||||||||||||||
| Other investments | 203 | 254 | 182 | 144 | 162 | 783 | 550 | ||||||||||||||||||||||||||||||||||
| Same store net operating income (cash basis) | $ | 65,944 | $ | 66,242 | $ | 64,874 | $ | 64,293 | $ | 62,317 | $ | 261,354 | $ | 245,497 | |||||||||||||||||||||||||||
39
Piedmont Office Realty Trust, Inc.
Property Detail - In-Service Portfolio (1)
As of December 31, 2021
(in thousands)
| Property | City | State | Percent Ownership | Year Built / Renovation | Rentable Square Footage Owned | Leased Percentage | Commenced Leased Percentage | Economic Leased Percentage (2) | Annualized Lease Revenue | ||||||||||||||||||||
| Atlanta | |||||||||||||||||||||||||||||
| Glenridge Highlands One | Atlanta | GA | 100.0% | 1998 / 2021 | 288 | 93.1 | % | 93.1 | % | 89.6 | % | $9,141 | |||||||||||||||||
| Glenridge Highlands Two | Atlanta | GA | 100.0% | 2000 | 424 | 99.5 | % | 99.5 | % | 86.8 | % | 14,876 | |||||||||||||||||
| 1155 Perimeter Center West | Atlanta | GA | 100.0% | 2000 | 377 | 79.0 | % | 79.0 | % | 79.0 | % | 10,012 | |||||||||||||||||
| Galleria 100 | Atlanta | GA | 100.0% | 1982 / 2019 | 415 | 83.6 | % | 79.8 | % | 79.8 | % | 11,152 | |||||||||||||||||
| Galleria 200 | Atlanta | GA | 100.0% | 1984 / 2021 | 433 | 87.5 | % | 82.0 | % | 79.4 | % | 11,859 | |||||||||||||||||
| Galleria 300 | Atlanta | GA | 100.0% | 1987 | 437 | 91.1 | % | 91.1 | % | 89.5 | % | 11,738 | |||||||||||||||||
| Galleria 400 | Atlanta | GA | 100.0% | 1999 | 430 | 93.7 | % | 91.4 | % | 91.4 | % | 12,812 | |||||||||||||||||
| Galleria 600 | Atlanta | GA | 100.0% | 2002 | 434 | 44.2 | % | 44.2 | % | 41.9 | % | 5,821 | |||||||||||||||||
| The Medici | Atlanta | GA | 100.0% | 2008 | 156 | 93.6 | % | 93.6 | % | 93.6 | % | 5,348 | |||||||||||||||||
| 999 Peachtree Street | Atlanta | GA | 100.0% | 1987 | 622 | 84.6 | % | 76.4 | % | 75.6 | % | 18,980 | |||||||||||||||||
| Metropolitan Area Subtotal / Weighted Average | 4,016 | 84.1 | % | 81.6 | % | 79.2 | % | 111,739 | |||||||||||||||||||||
| Boston | |||||||||||||||||||||||||||||
| 1414 Massachusetts Avenue | Cambridge | MA | 100.0% | 1873 / 1956 | 78 | 100.0 | % | 100.0 | % | 100.0 | % | 5,477 | |||||||||||||||||
| One Brattle Square | Cambridge | MA | 100.0% | 1991 | 96 | 95.8 | % | 95.8 | % | 95.8 | % | 7,852 | |||||||||||||||||
| One Wayside Road | Burlington | MA | 100.0% | 1997 | 201 | 100.0 | % | 100.0 | % | 100.0 | % | 6,915 | |||||||||||||||||
| 5 & 15 Wayside Road | Burlington | MA | 100.0% | 1999 & 2001 | 272 | 100.0 | % | 75.4 | % | 75.4 | % | 10,775 | |||||||||||||||||
| 5 Wall Street | Burlington | MA | 100.0% | 2008 | 182 | 100.0 | % | 100.0 | % | 100.0 | % | 7,099 | |||||||||||||||||
| 25 Burlington Mall Road | Burlington | MA | 100.0% | 1987 / 2021 | 291 | 83.5 | % | 81.8 | % | 64.3 | % | 9,863 | |||||||||||||||||
| 225 Presidential Way | Woburn | MA | 100.0% | 2001 | 202 | 100.0 | % | 100.0 | % | 100.0 | % | 3,743 | |||||||||||||||||
| 235 Presidential Way | Woburn | MA | 100.0% | 2000 | 238 | 100.0 | % | 100.0 | % | 100.0 | % | 4,372 | |||||||||||||||||
| 80 Central Street | Boxborough | MA | 100.0% | 1988 | 150 | 35.3 | % | 35.3 | % | 35.3 | % | 1,222 | |||||||||||||||||
| 90 Central Street | Boxborough | MA | 100.0% | 2001 | 175 | 100.0 | % | 100.0 | % | 100.0 | % | 4,117 | |||||||||||||||||
| Metropolitan Area Subtotal / Weighted Average | 1,885 | 92.1 | % | 88.3 | % | 85.6 | % | 61,435 | |||||||||||||||||||||
| Dallas | |||||||||||||||||||||||||||||
| 161 Corporate Center | Irving | TX | 100.0% | 1998 | 105 | 80.0 | % | 80.0 | % | 80.0 | % | 2,337 | |||||||||||||||||
| 750 West John Carpenter Freeway | Irving | TX | 100.0% | 1999 | 316 | 93.4 | % | 91.5 | % | 91.5 | % | 8,519 | |||||||||||||||||
| 6011 Connection Drive | Irving | TX | 100.0% | 1999 | 152 | 100.0 | % | 100.0 | % | 100.0 | % | 5,599 | |||||||||||||||||
| 6021 Connection Drive | Irving | TX | 100.0% | 2000 | 222 | 100.0 | % | 100.0 | % | 100.0 | % | 6,672 | |||||||||||||||||
| 6031 Connection Drive | Irving | TX | 100.0% | 1999 / 2018 | 232 | 80.2 | % | 56.5 | % | 56.5 | % | 6,357 | |||||||||||||||||
| 6565 North MacArthur Boulevard | Irving | TX | 100.0% | 1998 | 255 | 78.8 | % | 72.5 | % | 68.2 | % | 6,079 | |||||||||||||||||
| Las Colinas Corporate Center I | Irving | TX | 100.0% | 1998 / 2021 | 161 | 38.5 | % | 38.5 | % | 38.5 | % | 1,890 | |||||||||||||||||
| Las Colinas Corporate Center II | Irving | TX | 100.0% | 1998 / 2021 | 225 | 72.4 | % | 72.4 | % | 67.6 | % | 5,071 | |||||||||||||||||
| One Lincoln Park | Dallas | TX | 100.0% | 1999 | 262 | 82.4 | % | 65.6 | % | 64.9 | % | 8,067 | |||||||||||||||||
| Park Place on Turtle Creek | Dallas | TX | 100.0% | 1986 / 2018 | 177 | 84.2 | % | 84.2 | % | 83.1 | % | 6,692 | |||||||||||||||||
| One Galleria Tower | Dallas | TX | 100.0% | 1982 / 2018 | 470 | 80.2 | % | 80.2 | % | 80.2 | % | 14,010 | |||||||||||||||||
| Two Galleria Tower | Dallas | TX | 100.0% | 1985 / 2018 | 435 | 89.7 | % | 89.7 | % | 89.7 | % | 15,143 | |||||||||||||||||
| Three Galleria Tower | Dallas | TX | 100.0% | 1991 | 532 | 95.5 | % | 95.5 | % | 95.5 | % | 18,543 | |||||||||||||||||
| Metropolitan Area Subtotal / Weighted Average | 3,544 | 84.8 | % | 81.4 | % | 80.6 | % | 104,979 | |||||||||||||||||||||
40
| Property | City | State | Percent Ownership | Year Built / Renovation | Rentable Square Footage Owned | Leased Percentage | Commenced Leased Percentage | Economic Leased Percentage (2) | Annualized Lease Revenue | ||||||||||||||||||||
| Minneapolis | |||||||||||||||||||||||||||||
| US Bancorp Center | Minneapolis | MN | 100.0% | 2000 | 937 | 92.6 | % | 92.6 | % | 92.5 | % | 33,876 | |||||||||||||||||
| Crescent Ridge II | Minnetonka | MN | 100.0% | 2000 / 2021 | 301 | 75.1 | % | 72.8 | % | 72.8 | % | 7,604 | |||||||||||||||||
| Norman Pointe I | Bloomington | MN | 100.0% | 2000 / 2020 | 214 | 85.0 | % | 85.0 | % | 84.1 | % | 6,039 | |||||||||||||||||
| 9320 Excelsior Boulevard | Hopkins | MN | 100.0% | 2010 | 268 | 100.0 | % | 100.0 | % | 100.0 | % | 5,370 | |||||||||||||||||
| One Meridian Crossings | Richfield | MN | 100.0% | 1997 | 195 | 100.0 | % | 100.0 | % | 100.0 | % | 6,302 | |||||||||||||||||
| Two Meridian Crossings | Richfield | MN | 100.0% | 1998 | 189 | 88.4 | % | 88.4 | % | 88.4 | % | 5,380 | |||||||||||||||||
| Metropolitan Area Subtotal / Weighted Average | 2,104 | 90.6 | % | 90.3 | % | 90.1 | % | 64,571 | |||||||||||||||||||||
| New York | |||||||||||||||||||||||||||||
| 60 Broad Street | New York | NY | 100.0% | 1962 | 1,029 | 89.5 | % | 89.5 | % | 84.5 | % | 48,103 | |||||||||||||||||
| Metropolitan Area Subtotal / Weighted Average | 1,029 | 89.5 | % | 89.5 | % | 84.5 | % | 48,103 | |||||||||||||||||||||
| Orlando | |||||||||||||||||||||||||||||
| 400 TownPark | Lake Mary | FL | 100.0% | 2008 | 175 | 98.9 | % | 93.7 | % | 93.7 | % | 5,159 | |||||||||||||||||
| 500 TownPark | Lake Mary | FL | 100.0% | 2016 | 134 | 100.0 | % | 100.0 | % | 100.0 | % | 4,480 | |||||||||||||||||
| 200 South Orange Avenue | Orlando | FL | 100.0% | 1988 / 2021 | 646 | 80.7 | % | 78.0 | % | 77.1 | % | 20,051 | |||||||||||||||||
| 501 West Church Street | Orlando | FL | 100.0% | 2003 | 182 | 100.0 | % | 100.0 | % | 100.0 | % | 1,741 | |||||||||||||||||
| CNL Center I | Orlando | FL | 99.0% | 1999 | 347 | 100.0 | % | 89.3 | % | 87.6 | % | 13,485 | |||||||||||||||||
| CNL Center II | Orlando | FL | 99.0% | 2006 | 270 | 91.1 | % | 91.1 | % | 91.1 | % | 9,880 | |||||||||||||||||
| Metropolitan Area Subtotal / Weighted Average | 1,754 | 91.4 | % | 87.8 | % | 87.1 | % | 54,796 | |||||||||||||||||||||
| Washington, D.C. | |||||||||||||||||||||||||||||
| 400 Virginia Avenue | Washington | DC | 100.0% | 1985 | 226 | 82.7 | % | 63.7 | % | 62.4 | % | 9,071 | |||||||||||||||||
| 1201 Eye Street | Washington | DC | 98.6% (3) | 2001 | 271 | 57.9 | % | 54.6 | % | 54.6 | % | 10,224 | |||||||||||||||||
| 1225 Eye Street | Washington | DC | 98.1% (3) | 1986 | 225 | 85.3 | % | 85.3 | % | 83.6 | % | 10,954 | |||||||||||||||||
| 3100 Clarendon Boulevard | Arlington | VA | 100.0% | 1987 / 2015 | 261 | 82.8 | % | 80.8 | % | 75.9 | % | 9,111 | |||||||||||||||||
| 4250 North Fairfax Drive | Arlington | VA | 100.0% | 1998 | 308 | 86.0 | % | 86.0 | % | 86.0 | % | 13,142 | |||||||||||||||||
| Arlington Gateway | Arlington | VA | 100.0% | 2005 | 329 | 88.1 | % | 88.1 | % | 87.8 | % | 14,961 | |||||||||||||||||
| Metropolitan Area Subtotal / Weighted Average | 1,620 | 80.7 | % | 77.2 | % | 75.9 | % | 67,463 | |||||||||||||||||||||
| Other | |||||||||||||||||||||||||||||
| 1430 Enclave Parkway | Houston | TX | 100.0% | 1994 | 313 | 82.7 | % | 82.7 | % | 81.8 | % | 7,888 | |||||||||||||||||
| Enclave Place | Houston | TX | 100.0% | 2015 | 301 | 100.0 | % | 100.0 | % | 100.0 | % | 10,907 | |||||||||||||||||
| Two Pierce Place | Itasca | IL | 100.0% | 1991 / 2018 | 485 | 34.2 | % | 34.2 | % | 33.8 | % | 4,923 | |||||||||||||||||
| Subtotal/Weighted Average | 1,099 | 66.1 | % | 66.1 | % | 65.6 | % | 23,718 | |||||||||||||||||||||
| Grand Total | 17,051 | 85.5 | % | 83.1 | % | 81.5 | % | $536,804 | |||||||||||||||||||||
| (1) | This schedule includes information for Piedmont's in-service portfolio of properties only. Information on investments excluded from this schedule can be found on page 35. | ||||
| (2) | Economic leased percentage excludes the square footage associated with executed but not commenced leases for currently vacant spaces and the square footage associated with tenants receiving rental abatements (after proportional adjustments for tenants receiving only partial rental abatements). | ||||
| (3) | Although Piedmont owns 98.6% of 1201 Eye Street and 98.1% of 1225 Eye Street, it is entitled to 100% of the cash flows for each asset pursuant to the terms of each property ownership entity's joint venture agreement. | ||||
41
Piedmont Office Realty Trust, Inc.
Major Leases Not Yet Commenced and Major Abatements
As of December 31, 2021, the Company had approximately 750,000 square feet of executed leases for vacant space yet to commence or under rental abatement.
Presented below is a schedule of uncommenced new leases greater than 50,000 square feet and their anticipated commencement dates. Lease renewals are excluded from this schedule.
| Tenant | Property | Market | Square Feet Leased | Space Status | Estimated Commencement Date | New / Expansion | ||||||||||||||
| Microsoft Corporation | 5 & 15 Wayside Road | Boston | 154,535 | 66,892 SF Vacant | Q4 2022 (66,892 SF) Q4 2023 (33,101 SF) | Expansion | ||||||||||||||
| District of Columbia Department of General Services | 400 Virginia Avenue | Washington, DC | 56,042 | 42,955 SF Vacant | Q1 2022 | New | ||||||||||||||
| Undisclosed Fortune 500 Tenant | 6031 Connection Drive | Dallas | 55,456 | Vacant | Q3 2022 | New | ||||||||||||||
Presented below is a schedule of leases with abatements of 50,000 square feet or greater that either were under abatement as of December 31, 2021 or will be under abatement within the next twelve months. (1)
| Tenant | Property | Market | Abated Square Feet | Lease Commencement Date | Remaining Abatement Schedule | Lease Expiration | ||||||||||||||
| Ascend Learning, LLC | 25 Burlington Mall Road | Boston | 52,558 | Q3 2021 | Mid-July 2021 through Mid-January 2022 | Q1 2034 | ||||||||||||||
| Greensky, LLC | Glenridge Highlands Two | Atlanta | 51,474 | Q2 2022 | August 2021 through February 2022 | Q4 2029 | ||||||||||||||
| District of Columbia Department of General Services | 400 Virginia Avenue | Washington, DC | 56,042 | Q1 2022 | January 2022 through early July 2022 | Q4 2032 | ||||||||||||||
| VMware, Inc. | 1155 Perimeter Center West | Atlanta | 159,838 | Q1 2022 | April, May and July 2022 | Q3 2027 | ||||||||||||||
| Undisclosed Fortune 500 Tenant | 6031 Connection Drive | Dallas | 55,456 | Q3 2022 | July 2022 through June 2023 | Q2 2035 | ||||||||||||||
| (1) | The State of New York lease at 60 Broad Street in New York, NY, does not contain any rental abatement provisions. The tenant's space will be reconstructed over a period of up to four years. During the construction period, the tenant will not be required to pay rental charges for certain spaces that are under construction and not usable by the tenant. The amount of space for which the tenant will not be required to pay rent will vary over time and is expected to average approximately 80,000 square feet over the construction time period. | ||||
42
Piedmont Office Realty Trust, Inc.
Supplemental Operating & Financial Data
Risks, Uncertainties and Limitations
Certain statements contained in this supplemental package constitute forward-looking statements within the meaning of Section 27A of the Securities Act of 1933, as amended (the “Securities Act”) and Section 21E of the Securities Exchange Act of 1934, as amended (the “Exchange Act”). We intend for all such forward-looking statements to be covered by the safe-harbor provisions for forward-looking statements contained in Section 27A of the Securities Act and Section 21E of the Exchange Act, as applicable. Such information is subject to certain risks and uncertainties, as well as known and unknown risks, which could cause actual results to differ materially from those projected or anticipated. Therefore, such statements are not intended to be a guarantee of our performance in future periods. Such forward-looking statements can generally be identified by our use of forward-looking terminology such as “may,” “will,” “expect,” “intend,” “anticipate,” "estimate," “believe,” “continue” or similar words or phrases that are predictions of future events or trends and which do not relate solely to historical matters. Examples of such statements in this supplemental package include: whether Piedmont is well positioned for continued progress towards its strategic goals in 2022; whether Piedmont will recognize a gain on sale of real estate assets of approximately $50 million related to the sale of 225/235 Presidential Way during the first quarter of 2022; whether approximately 63% of Piedmont's Annualized Lease Revenue is now generated from its properties located in the Sunbelt; and the Company's estimated range of Net Income, Depreciation, Amortization, NAREIT FFO/Core FFO and NAREIT FFO/Core FFO per diluted share for the year ending December 31, 2022. These statements are based on beliefs and assumptions of Piedmont’s management, which in turn are based on information available at the time the statements are made.
The following are some of the factors that could cause our actual results and expectations to differ materially from those described in our forward-looking statements: economic, regulatory, socio-economic changes, and/or technology changes (including accounting standards) that impact the real estate market generally, or that could affect patterns of use of commercial office space; the impact of competition on our efforts to renew existing leases or re-let space on terms similar to existing leases; changes in the economies and other conditions affecting the office sector in general and specifically the seven markets in which we primarily operate where we have high concentrations of our annualized lease revenue; lease terminations, lease defaults, lease contractions, or changes in the financial condition of our tenants, particularly by one of our large lead tenants; adverse market and economic conditions, including any resulting impairment charges on both our long-lived assets or goodwill resulting therefrom; the success of our real estate strategies and investment objectives, including our ability to identify and consummate suitable acquisitions and divestitures; the illiquidity of real estate investments, including regulatory restrictions to which real estate investment trusts ("REITs") are subject and the resulting impediment on our ability to quickly respond to adverse changes in the performance of our properties; the risks and uncertainties associated with our acquisition and disposition of properties, many of which risks and uncertainties may not be known at the time of acquisition or disposition; development and construction delays and resultant increased costs and risks; our real estate development strategies may not be successful; future acts of terrorism, civil unrest, or armed hostilities in any of the major metropolitan areas in which we own properties, or future cybersecurity attacks against any of our tenants; risks related to the occurrence of cyber incidents, or a deficiency in our cybersecurity, which could negatively impact our business by causing a disruption to our operations, a compromise or corruption of our confidential information, and/or damage to our business relationships; costs of complying with governmental laws and regulations; uninsured losses or losses in excess of our insurance coverage, and our inability to obtain adequate insurance coverage at a reasonable cost; additional risks and costs associated with directly managing properties occupied by government tenants, including an increased risk of default by government tenants during periods in which state or federal governments are shut down or on furlough; significant price and volume fluctuations in the public markets, including on the exchange which we listed our common stock; changes in interest rates and changes in the method pursuant to which the LIBOR rates are determined and the planned phasing out of USD LIBOR after June 2023; rising interest rates which could affect our return on investments and/or our ability to finance or refinance properties; the effect of future offerings of debt or equity securities or changes in market interest rates on the value of our common stock; uncertainties associated with environmental and other regulatory matters; potential changes in the political environment and reduction in federal and/or state funding of our governmental tenants; changes in the financial condition of our tenants directly or indirectly resulting from geopolitical developments that could negatively affect international trade, the termination or threatened termination of existing international trade agreements, or the implementation of tariffs or retaliatory tariffs on imported or exported goods; the effect of any litigation to which we are, or may become, subject; additional risks and costs associated with owning properties occupied by tenants in particular industries, such as oil and gas, hospitality, travel, co-working, etc., including risks of default during start-up and during economic downturns; changes in tax laws impacting REITs and real estate in general, as well as our ability to continue to qualify as a REIT under the Internal Revenue Code of 1986, as amended, or other tax law changes which may adversely affect our stockholders; the future effectiveness of our internal controls and procedures; actual or threatened public health epidemics or outbreaks, such as the ongoing COVID-19 pandemic, as well as governmental and private measures taken to combat such health crises, could have a material adverse effect on our business operations and financial results; the adequacy of our general reserve related to tenant lease-related assets or the establishment of any other reserve in the future; and other factors, including the risk factors discussed under Item 1A. of Piedmont’s most recent Annual Report on Form 10-K and other documents we file with the Securities and Exchange Commission.
Readers are cautioned not to place undue reliance on these forward-looking statements, which speak only as of the date of this supplemental report. We cannot guarantee the accuracy of any such forward-looking statements contained in this supplemental report, and we do not intend to publicly update or revise any forward-looking statements, whether as a result of new information, future events, or otherwise.
43

44