Piedmont Office Realty Trust, Inc.
Quarterly Supplemental Information
Index
| | | | | | | | | | | | | | |
| Page | | | Page |
| | | | |
| Introduction | | | Other Investments | |
| Corporate Data | | | Other Investments Detail | |
| Investor Information | | | Supporting Information | |
| Earnings Release | | | Definitions | |
| Key Performance Indicators | | | Research Coverage | |
| Financials | | | Non-GAAP Reconciliations | |
| Balance Sheets | | | In-Service Portfolio Detail | |
| Income Statements | | | Major Leases Not Yet Commenced and Major Abatements | |
| Funds From Operations / Adjusted Funds From Operations | | | Risks, Uncertainties and Limitations | |
| Same Store Analysis | | | | |
| Capitalization Analysis | | | | |
| Debt Summary | | | | |
| Debt Detail | | | | |
| Debt Covenant & Ratio Analysis | | | | |
| Operational & Portfolio Information - Office Property Investments | | | | |
| Tenant Diversification | | | | |
| Tenant Credit Rating & Lease Distribution Information | | | | |
| Leased Percentage Information | | | | |
| Rental Rate Roll Up / Roll Down Analysis | | | | |
| Lease Expiration Schedule | | | | |
| Quarterly Lease Expirations | | | | |
| Annual Lease Expirations | | | | |
| Contractual Tenant Improvements & Leasing Commissions | | | | |
| Geographic Diversification | | | | |
| Geographic Diversification by Location Type | | | | |
| Industry Diversification | | | | |
| Property Investment Activity | | | | |
| | |
| Notice to Readers: |
Please refer to page 40 for a discussion of important risks related to the business of Piedmont Office Realty Trust, Inc., as well as an investment in its securities, including risks that could cause actual results and events to differ materially from results and events referred to in the forward-looking information. Considering these risks, uncertainties, assumptions, and limitations, the forward-looking statements about leasing, financial operations, leasing prospects, acquisitions, dispositions, etc. contained in this quarterly supplemental information report may differ from actual results. |
| Certain prior period amounts have been reclassified to conform to the current period financial statement presentation. In addition, many of the schedules herein contain rounding to the nearest thousands or millions and, therefore, the schedules may not total due to this rounding convention. |
To supplement the presentation of the Company’s financial results prepared in accordance with U.S. generally accepted accounting principles (GAAP), this report contains certain financial measures that are not prepared in accordance with GAAP, including FFO, Core FFO, AFFO, Same Store NOI, Property NOI, EBITDAre and Core EBITDA. Definitions and reconciliations of these non-GAAP measures to their most comparable GAAP metrics are included beginning on page 33. Each of the non-GAAP measures included in this report has limitations as an analytical tool and should not be considered in isolation or as a substitute for an analysis of the Company’s results calculated in accordance with GAAP. In addition, because not all companies use identical calculations, the Company’s presentation of non-GAAP measures in this report may not be comparable to similarly titled measures disclosed by other companies, including other REITs. The Company may also change the calculation of any of the non-GAAP measures included in this report from time to time in light of its then existing operations. |
|
Piedmont Office Realty Trust, Inc.
Corporate Data
Piedmont Office Realty Trust, Inc. (also referred to herein as "Piedmont" or the "Company") (NYSE: PDM) is an owner, manager, developer, redeveloper and operator of high-quality, Class A office properties located primarily in major U.S. Sunbelt markets. The Company is a fully-integrated, self-managed real estate investment trust ("REIT") with local management offices in each of its markets and is investment-grade rated by Standard & Poor’s and Moody’s. The Company was designated an Energy Star Partner of the Year for 2021, 2022 and 2023, and it was the only office REIT headquartered in the Southeast to receive those designations. Currently, approximately 87% of the Company's square footage is Energy Star certified and approximately 64% is LEED certified. Piedmont is headquartered in Atlanta, GA.
This data supplements the information provided in our reports filed with the Securities and Exchange Commission and should be reviewed in conjunction with such filings.
| | | | | | | | | | | |
| | | |
| As of | | As of |
| June 30, 2023 | | December 31, 2022 |
Number of consolidated in-service office properties (1) | 51 | | 51 |
Rentable square footage (in thousands) (1) | 16,672 | | 16,658 |
Percent leased (2) | 86.2 | % | | 86.7 | % |
| Capitalization (in thousands): | | | |
| Total debt - GAAP | $2,049,236 | | $1,983,681 |
| Total principal amount of debt outstanding (excludes premiums, discounts, and deferred financing costs) | $2,062,000 | | $1,997,000 |
Equity market capitalization (3) | $899,238 | | $1,131,941 |
Total market capitalization (3) | $2,961,238 | | $3,128,941 |
Total principal amount of debt / Total market capitalization (3) | 69.6 | % | | 63.8 | % |
Average net principal amount of debt to Core EBITDA - quarterly (4) | 6.4 x | | 6.4 x |
Average net principal amount of debt to Core EBITDA - trailing twelve months (5) | 6.3 x | | 6.0 x |
Total principal amount of debt / Total gross assets (6) | 38.4 | % | | 37.6 | % |
| Common stock data: | | | |
| High closing price during quarter | $7.39 | | $10.92 |
| Low closing price during quarter | $6.10 | | $8.80 |
| Closing price of common stock at period end | $7.27 | | $9.17 |
| Weighted average fully diluted shares outstanding during quarter (in thousands) | 123,749 | | 123,633 |
| Shares of common stock issued and outstanding at period end (in thousands) | 123,692 | | 123,440 |
Annual regular dividend per share (7) | $0.84 | | $0.84 |
| Ratings (Standard & Poor's / Moody's) | BBB / Baa2 | | BBB / Baa2 |
| Employees | 147 | | 149 |
| | | |
| | | | | |
| (1) | As of June 30, 2023, our consolidated office portfolio consisted of 51 properties (exclusive of one 127,000 square foot property that was out of service for redevelopment, 222 South Orange Avenue in Orlando, FL). |
| (2) | Calculated as square footage associated with commenced leases plus square footage associated with executed but uncommenced leases for vacant spaces at our in-service properties, divided by total rentable in-service square footage, all as of the relevant date, expressed as a percentage. Please refer to page 22 for additional analyses regarding Piedmont's leased percentage. |
| (3) | Reflects common stock closing price, shares outstanding and principal amount of debt outstanding as of the end of the reporting period, as appropriate. |
| (4) | For the purposes of this calculation, we annualize the Core EBITDA for the quarter and use the average daily principal balance of debt outstanding during the quarter, less cash and cash equivalents and escrow deposits and restricted cash as of the end of each month of the quarter. |
| (5) | For the purposes of this calculation, we use the sum of Core EBITDA for the trailing four quarters and the average daily principal balance of debt outstanding for the trailing four quarters, less the average of cash and cash equivalents and escrow deposits and restricted cash as of the end of each month in the trailing four quarter period. |
| (6) | Total gross assets is defined as total assets with the add-back of accumulated depreciation and accumulated amortization related to real estate assets and accumulated amortization related to deferred lease costs. |
| (7) | Total of the regular dividends per share for which record dates occurred over the last four quarters. |
Piedmont Office Realty Trust, Inc.
| | |
| Corporate |
| 5565 Glenridge Connector, Suite 450 |
| Atlanta, Georgia 30342 |
| 770.418.8800 |
| www.piedmontreit.com |
| | | | | | | | | | | |
| Executive Management |
| | | |
| C. Brent Smith | Robert E. Bowers | George Wells | |
| Chief Executive Officer, President | Chief Financial and Administrative Officer | Chief Operating Officer and | |
| and Director | and Executive Vice President | Executive Vice President | |
| | | |
| Kevin D. Fossum | Edward H. Guilbert, III | Christopher A. Kollme | Damian J. Miller |
| Executive Vice President, | Executive Vice President, Finance, | Executive Vice President, | Executive Vice President, |
| Property Management | Assistant Secretary and Treasurer | Investments | Dallas |
| Investor Relations Contact | | |
| | | |
| Laura P. Moon | Alex Valente | Robert K. Wiberg | |
| Chief Accounting Officer and | Executive Vice President, | Executive Vice President, | |
| Senior Vice President | Southeast Region | Northeast Region and Co-Head of | |
| | Development | |
| | | |
| Board of Directors |
| | | |
| Frank C. McDowell | Dale H. Taysom | Kelly H. Barrett | Glenn G. Cohen |
| Director, Chair of the Board of Directors, and | Director, Vice Chair of the | Director, Chair of the Audit Committee, | Director, Chair of the Compensation |
| Member of the Compensation and Governance | Board of Directors, and Member of the | and Member of the Governance Committee | Committee, and Member of the Audit |
| Committees | Audit and Capital Committees | | and Capital Committees |
| | | |
| Venkatesh S. Durvasula | Mary Hager | Barbara B. Lang | C. Brent Smith |
| Director and Member of the Capital Committee | Director and Member of the | Director, Chair of the Governance Committee | Chief Executive Officer, President |
| Governance Committee | (including ESG), and Member of the | and Director |
| | Compensation Committee | |
| Jeffrey L. Swope | | | |
| Director, Chair of the Capital | | | |
| Committee, and Member of the | | | |
| Compensation Committee | | | |
| | | |
| | | | | | | | | | | |
| Transfer Agent | Corporate Counsel | Institutional Analyst Contact | Investor Relations |
| | | |
| Computershare | King & Spalding | Phone: 770.418.8592 | Phone: 866.354.3485 |
| P.O. Box 43006 | 1180 Peachtree Street, NE | research.analysts@piedmontreit.com | investor.services@piedmontreit.com |
| Providence, RI 02940-3078 | Atlanta, GA 30309 | | www.piedmontreit.com |
| Phone: 866.354.3485 | Phone: 404.572.4600 | | |
Piedmont Office Realty Trust, Inc.
Earnings Release
Piedmont Office Realty Trust Reports Second Quarter 2023 Results
ATLANTA, July 20, 2023--Piedmont Office Realty Trust, Inc. ("Piedmont" or the "Company") (NYSE:PDM), an owner of Class A office properties located primarily in major U.S. Sunbelt markets, announced today that its operating partnership, Piedmont Operating Partnership, LP, has completed the issuance of $400 million aggregate principal amount of 9.25% senior unsecured notes due 2028 (the "2028 Notes"), rated BBB by S&P and Baa2 by Moody's. The net proceeds from the issuance will be used to fund the Company's pending tender offer for its outstanding unsecured senior notes due 2024 (the "2024 Notes").
Additionally, the Company announced its results for the quarter ended June 30, 2023 as set forth below and is rescheduling its second quarter earnings call to this afternoon at 5pm ET in order to provide analysts and investors with a real time update regarding the refinancing activity, quarterly results, and revised guidance.
Commenting on the refinancing activity, Brent Smith, Piedmont's President and Chief Executive Officer, said, "With the completion of our latest unsecured notes offering, we have now addressed all of the Company’s debt previously scheduled to mature in 2023 and 2024. The offering was successful despite the extreme volatility and increased economic uncertainty weighing on the financing markets which has drastically reduced new unsecured offerings and mortgage originations, particularly for the office sector. Raising debt capital at this scale in the most challenging commercial real estate market since the global financial crisis is a testament to the strength and credit worthiness of the Piedmont balance sheet.” Continuing, Smith said "Operationally, quarterly results continued to demonstrate the resiliency of our leasing pipeline with over 580,000 square feet leased with an approximately 70% retention ratio and over 14% higher cash rental rates. Furthermore, 240,000 square feet were leased to new tenants, building on the success of the past several quarters. Our well-capitalized, flexible balance sheet and strategic focus on small to medium enterprises continues to drive leasing success. Today, the pipeline remains robust with approximately 250,000 square feet of leasing already in documentation in the third quarter and we continue to project that we will be approximately 87% leased by the end of 2023."
Highlights for the Three Months Ended June 30, 2023:
Financial Results:
| | | | | | | | | | | |
| Three Months Ended | | |
| (in 000s other than per share amounts) | June 30, 2023 | June 30, 2022 | | | |
| Net income/(loss) applicable to Piedmont | $(1,988) | $7,966 | | | |
| Net income/(loss) per share applicable to common stockholders - diluted | $(0.02) | $0.06 | | | |
| | | | | |
| | | | | |
| Interest expense | $23,389 | $13,775 | | | |
| Core Funds From Operations ("Core FFO") applicable to common stock | $55,535 | $61,620 | | | |
| Core FFO per diluted share | $0.45 | $0.50 | | | |
| | | | | |
| | | | | |
| Adjusted Funds From Operations applicable to common stock | $44,444 | $48,900 | | | |
•Net loss applicable to Piedmont for the three months ended June 30, 2023 was $2.0 million, as compared to net income applicable to Piedmont of $8.0 million for the three months ended June 30, 2022.
•Core FFO was $0.45 per diluted share for the second quarter of 2023, as compared to $0.50 per diluted share for the second quarter of 2022. The $0.05 per diluted share decrease was almost exclusively attributable to a $9.6 million, or $0.08 per diluted share, increase in interest expense during the second quarter of 2023, partially offset by continued growth in Property Net Operating Income, as compared to the second quarter of 2022.
Leasing:
| | | | | | | |
| Three Months Ended June 30, 2023 | | |
| # of lease transactions | 49 | | | |
| Total leasing sf | 581,031 | | |
| New tenant leasing sf | 236,448 | | |
| Cash rent roll up | 14.3 | % | | |
| Accrual rent roll up | 19.6 | % | | |
| Quarterly retention ratio | 69.3 | % | | |
| Leased percentage as of period end | 86.2 | % | | |
•The Company completed approximately 581,000 square feet of leasing transactions during the second quarter, over 40% of which, or approximately 236,000 square feet, was for new tenant leasing.
•The average size lease executed during the second quarter of 2023 was approximately 12,000 square feet and the weighted average lease term was approximately six years.
•The two largest leases completed during the quarter were both for new tenants at Galleria Atlanta:
◦An insurance company leased approximately 70,000 square feet through 2036 at Galleria 300; and
◦An owner operator of single family residences leased approximately 51,000 square feet through 2035 at Galleria 600.
•Cash and accrual basis rents on leases executed during the quarter ended June 30, 2023 for space vacant one year or less increased approximately 14% and 20%, respectively.
•The Company's scheduled lease expirations for the remainder of 2023 represent less than 3% of its annualized lease revenue.
•During the second quarter of 2023, Same Store NOI - Cash basis increased 0.2% as new leases commencing or with expiring abatements began to outweigh leases that expired during the first six months of 2023. Same Store NOI on an accrual basis decreased 3.7% during the three months ended June 30, 2023 as compared to the same period in the prior year. The decrease was attributable to a combination of a decline in our overall leased percentage during the current period as compared to the prior period; an increase in leases under operating expense abatement due to recent leasing activity; and an increase in leases which are executed but not yet commenced.
•As of June 30, 2023, the Company had approximately 1.3 million square feet of executed leases for vacant space yet to commence or under rental abatement, representing approximately $37 million of future additional annual cash revenue; consequently, the Company continues to estimate that Same Store NOI, on both a cash and accrual basis, will increase approximately 1-3% on an annual basis in 2023.
•The Company's leased percentage as of June 30, 2023 increased slightly to 86.2% from 86.1% at March 31, 2023. The Company projects its estimated year end leased percentage will be approximately 87%.
Balance Sheet:
| | | | | | | | | | | |
| (in 000s except for ratios) | June 30, 2023 | | December 31, 2022 |
| | | |
| Total Real Estate Assets | $3,512,128 | | $3,500,624 |
| Total Assets | $4,094,349 | | $4,085,525 |
| | | |
| | | |
| Total Debt | $2,049,236 | | $1,983,681 |
| Weighted Average Cost of Debt | 4.49 | % | | 3.89 | % |
| Debt-to-Gross Assets Ratio | 38.4 | % | | 37.6 | % |
| Average Net Debt-to-Core EBITDA (ttm) | 6.3 x | | 6.0 x |
•During the three months ended June 30, 2023, the Company repaid $350 million of maturing unsecured senior notes utilizing $170 million of cash and investments on hand and its $600 million line of credit. The balance outstanding on the line of credit as of June 30, 2023 was $200 million.
ESG and Operations:
•The Company published its 2022 ESG report which is available electronically at www.piedmontreit.com/ ESG / Annual ESG Reports.
•The Company renewed its WELL Health-Safety Rating for its entire 17 million square foot portfolio spanning 51 managed properties.
•US Bancorp Center in Minneapolis, MN won an International The Outstanding Building of the Year ("TOBY") award.
•All five Atlanta Galleria properties, as well as 4250 North Fairfax in Arlington, VA, achieved LEED Gold status, bringing the percentage of the portfolio that is LEED certified to 64%.
•The Company increased its financial needs-based scholarship program to six students for the 2023-24 academic year at Howard University in Washington, D.C. and Morehouse College in Atlanta, GA.
Guidance for 2023
The Company is updating its previously issued guidance for the year ending December 31, 2023 to reflect the continuing rise in interest rates and to specifically reflect the net impact of additional interest expense associated with the issuance of $400 million in aggregate principal amount of 2028 Notes discussed above and the anticipated extinguishment of $300 million of its outstanding $400 million in aggregate principal amount of 2024 Notes in connection with the Company's pending tender offer as follows:
| | | | | | | | | | | | | | | | | | | | | | | | | | |
| Previous | | Revised | |
| (in millions, except per share data) | Low | | High | | Low | | High | | | |
| Net income/(loss) | $ | (1) | | | $ | 1 | | | $ | (19) | | | $ | (17) | | | | |
| Add: | | | | | | | | | | |
| Depreciation | 144 | | | 151 | | | 148 | | | 151 | | | | |
| Amortization | 80 | | | 84 | | | 87 | | | 89 | | | | |
| | | | | | | | | | |
| | | | | | | | | | |
| Core FFO applicable to common stock | $ | 223 | | | $ | 236 | | | $ | 216 | | | $ | 223 | | | | |
| Core FFO applicable to common stock per diluted share | $1.80 | | $1.90 | | $1.74 | | $1.80 | | | |
| | | | | | | | | | |
The approximately 5% difference between the stated interest rate on the 2024 Notes and the new 2028 Notes will result in an approximately $20.2 million increase in annual interest expense.
This guidance is based on information available to management as of the date of this release and reflects management's view of current market conditions. This guidance assumes that the Company’s pending tender offer to purchase any and all of the Company’s outstanding 2024 Notes is completed as expected and that the Company repurchases $300 million of the outstanding $400 million in aggregate principal amount of 2024 Notes pursuant to the tender offer. No speculative acquisitions or dispositions are included in the above guidance. The Company will adjust guidance throughout the year as such transactions occur, and if interest rate impacts differ from current assumptions.
Note that actual results could differ materially from these estimates and individual quarters may fluctuate on both a cash basis and an accrual basis due to the timing of any future dispositions, significant lease commencements and expirations, abatement periods, repairs and maintenance expenses, capital expenditures, capital markets activities, seasonal general and administrative expenses, accrued potential performance-based compensation expense, one-time revenue or expense events, the actual results of the Company's pending tender offer, and other factors discussed under "Risks, Uncertainties and Limitations" below.
Piedmont Office Realty Trust, Inc.
Key Performance Indicators
Unaudited (in thousands except for per share data and ratios)
| | |
This section of our supplemental report includes non-GAAP financial measures, including, but not limited to, Earnings Before Interest, Taxes, Depreciation, and Amortization for real estate (EBITDAre), Core Earnings Before Interest, Taxes, Depreciation, and Amortization (Core EBITDA), Funds from Operations (FFO), Core Funds from Operations (Core FFO), Adjusted Funds from Operations (AFFO), and Same Store Net Operating Income (Same Store NOI). Definitions of these non-GAAP measures are provided on page 33 and reconciliations are provided beginning on page 35. |
| | | | | | | | | | | | | | | | | | | | | | | | | | | | | | | | | | | |
| Three Months Ended | |
| | | | | | | | | | | |
| | | | | | | | | | | |
| Selected Operating Data | 6/30/2023 | | 3/31/2023 | | 12/31/2022 | | 9/30/2022 | | 6/30/2022 | | |
| | | | | | | | | | |
| Percent leased | 86.2 | % | | 86.1 | % | | 86.7 | % | | 86.8 | % | | 87.0 | % | | |
Percent leased - economic (1) | 80.0 | % | | 79.6 | % | | 81.1 | % | | 80.6 | % | | 80.7 | % | | |
| Total revenues | $143,072 | | $142,367 | | $147,208 | | $144,100 | | $136,309 | | |
| Net income / (loss) applicable to Piedmont | -$1,988 | | -$1,367 | | $75,569 | | $3,331 | | $7,966 | | |
| Net income / (loss) per share applicable to common stockholders - diluted | -$0.02 | | -$0.01 | | $0.61 | | $0.03 | | $0.06 | | |
| Core EBITDA | $79,212 | | $78,541 | | $82,186 | | $78,805 | | $75,591 | | |
| Core FFO applicable to common stock | $55,535 | | $56,344 | | $61,235 | | $61,352 | | $61,620 | | |
| Core FFO per share - diluted | $0.45 | | $0.46 | | $0.50 | | $0.50 | | $0.50 | | |
| AFFO applicable to common stock | $44,444 | | $36,792 | | $47,082 | | $43,482 | | $48,900 | | |
Gross regular dividends (2) | $25,975 | | $25,965 | | $25,918 | | $25,913 | | $25,912 | | |
Regular dividends per share (2) | $0.21 | | $0.21 | | $0.21 | | $0.21 | | $0.21 | | |
| | | | | | | | | | | |
| | | | | | | | | | | |
Same store net operating income - accrual basis (3) | -3.7 | % | | -2.8 | % | | -0.7 | % | | 0.3 | % | | 2.8 | % | | |
Same store net operating income - cash basis (3) | 0.2 | % | | -1.5 | % | | 1.6 | % | | -0.3 | % | | 1.8 | % | | |
| Rental rate roll up / roll down - accrual rents | 19.6 | % | | 9.9 | % | | 11.5 | % | | 37.6 | % | | 12.2 | % | | |
| Rental rate roll up / roll down - cash rents | 14.3 | % | | 5.7 | % | | 6.5 | % | | 33.1 | % | | 2.5 | % | | |
| Selected Balance Sheet Data | | | | | | | | | | | |
| Total real estate assets, net | $3,512,128 | | $3,486,797 | | $3,500,624 | | $3,572,591 | | $3,139,587 | | |
| Total assets | $4,094,349 | | $4,237,460 | | $4,085,525 | | $4,185,493 | | $3,695,554 | | |
| Total liabilities | $2,297,015 | | $2,417,363 | | $2,236,270 | | $2,388,162 | | $1,879,891 | | |
| Ratios & Information for Debt Holders | | | | | | | | | | | |
| Core EBITDA to total revenues | 55.4 | % | | 55.2 | % | | 55.8 | % | | 54.7 | % | | 55.5 | % | | |
Fixed charge coverage ratio (4) | 3.2 x | | 3.4 x | | 3.8 x | | 4.3 x | | 5.1 x | | |
Average net principal amount of debt to Core EBITDA - quarterly (5) | 6.4 x | | 6.3 x | | 6.4 x | | 6.1 x | | 5.5 x | | |
| Total gross real estate assets | $4,576,943 | | $4,518,003 | | $4,506,328 | | $4,587,669 | | $4,117,177 | | |
| Total debt - GAAP | $2,049,236 | | $2,197,955 | | $1,983,681 | | $2,145,408 | | $1,674,778 | | |
Net principal amount of debt (6) | $2,051,778 | | $2,037,224 | | $1,977,400 | | $2,146,156 | | $1,681,144 | | |
| | | | | |
| (1) | Economic leased percentage excludes the square footage associated with executed but not commenced leases for currently vacant spaces and the square footage associated with tenants receiving rental abatements (after proportional adjustments for tenants receiving only partial rental abatements). Due to variations in rental abatement structures, there will be variability to the economic leased percentage over time as abatements commence and expire. |
| (2) | Dividends are reflected in the quarter in which the record date occurred. |
| (3) | Please refer to the three pages starting with page 13 for reconciliations to net income and additional same store net operating income information. The statistic provided for each of the prior quarters is based on the same store property population applicable at the time that the metric was initially reported. |
| (4) | The fixed charge coverage ratio is calculated as Core EBITDA divided by the sum of interest expense, principal amortization (none during periods presented), capitalized interest and preferred dividends (none during periods presented). The Company had capitalized interest of $1.4 million for the quarter ending June 30, 2023, $1.2 million for the quarter ending March 31, 2023, $1.0 million for the quarter ended December 31, 2022, $1.1 million for the quarter ended September 30, 2022, and $1.1 million for the quarter ended June 30, 2022. |
| (5) | For the purposes of this calculation, we annualize the Core EBITDA for the quarter and use the average daily principal balance of debt outstanding during the quarter, less cash and cash equivalents and escrow deposits and restricted cash as of the end of each month of the quarter. |
| (6) | Net principal amount of debt is calculated and defined as the total principal amount of debt outstanding minus cash and cash equivalents and escrow deposits and restricted cash all as of the end of the period. |
Piedmont Office Realty Trust, Inc.
Consolidated Balance Sheets
| | | | | | | | | | | | | | | | | | | | | | | | | | | | | |
| 6/30/2023 | | 3/31/2023 | | 12/31/2022 | | 9/30/2022 | | 6/30/2022 |
| Assets: | | | | | | | | | |
| Real estate, at cost: | | | | | | | | | |
| Land assets | $ | 567,244 | | | $ | 567,244 | | | $ | 567,244 | | | $ | 578,722 | | | $ | 521,789 | |
| Buildings and improvements | 3,768,456 | | | 3,714,572 | | | 3,682,000 | | | 3,751,722 | | | 3,389,650 | |
| Buildings and improvements, accumulated depreciation | (981,052) | | | (947,209) | | | (915,010) | | | (926,357) | | | (892,131) | |
| Intangible lease asset | 182,127 | | | 190,180 | | | 205,074 | | | 212,248 | | | 164,194 | |
| Intangible lease asset, accumulated amortization | (83,763) | | | (83,997) | | | (90,694) | | | (88,721) | | | (85,459) | |
| Construction in progress | 59,116 | | | 46,007 | | | 52,010 | | | 44,977 | | | 41,544 | |
| | | | | | | | | |
| | | | | | | | | |
| Total real estate assets | 3,512,128 | | | 3,486,797 | | | 3,500,624 | | | 3,572,591 | | | 3,139,587 | |
| | | | | | | | | |
| Cash and cash equivalents | 5,167 | | | 170,593 | | | 16,536 | | | 10,653 | | | 6,397 | |
| Tenant receivables, net of allowance for doubtful accounts | 5,387 | | | 6,280 | | | 4,762 | | | 7,796 | | | 5,164 | |
| Straight line rent receivable | 180,339 | | | 176,320 | | | 172,019 | | | 173,122 | | | 168,797 | |
| | | | | | | | | |
| Escrow deposits and restricted cash | 5,055 | | | 4,183 | | | 3,064 | | | 2,191 | | | 1,459 | |
| Prepaid expenses and other assets | 23,566 | | | 26,810 | | | 17,152 | | | 23,925 | | | 26,955 | |
| Goodwill | 82,937 | | | 82,937 | | | 82,937 | | | 98,918 | | | 98,918 | |
| Interest rate swap | 5,693 | | | 2,899 | | | 4,183 | | | 3,760 | | | 996 | |
| | | | | | | | | |
| Deferred lease costs, gross | 482,149 | | | 486,694 | | | 505,979 | | | 510,936 | | | 459,038 | |
| Deferred lease costs, accumulated amortization | (208,072) | | | (206,053) | | | (221,731) | | | (218,399) | | | (211,757) | |
| | | | | | | | | |
| | | | | | | | | |
| Total assets | $ | 4,094,349 | | | $ | 4,237,460 | | | $ | 4,085,525 | | | $ | 4,185,493 | | | $ | 3,695,554 | |
| Liabilities: | | | | | | | | | |
| Unsecured debt, net of discount | $ | 1,852,236 | | | $ | 2,000,955 | | | $ | 1,786,681 | | | $ | 1,948,408 | | | $ | 1,674,778 | |
| Secured debt | 197,000 | | | 197,000 | | | 197,000 | | | 197,000 | | | — | |
| Accounts payable, accrued expenses, and accrued capital expenditures | 107,629 | | | 98,464 | | | 135,663 | | | 111,262 | | | 99,724 | |
| Deferred income | 89,815 | | | 67,056 | | | 59,977 | | | 70,798 | | | 72,422 | |
| Intangible lease liabilities, less accumulated amortization | 50,335 | | | 53,494 | | | 56,949 | | | 60,694 | | | 32,967 | |
| Interest rate swaps | — | | | 394 | | | — | | | — | | | — | |
| | | | | | | | | |
| Total liabilities | 2,297,015 | | | 2,417,363 | | | 2,236,270 | | | 2,388,162 | | | 1,879,891 | |
| Stockholders' equity: | | | | | | | | | |
| Common stock | 1,237 | | | 1,236 | | | 1,234 | | | 1,234 | | | 1,234 | |
| Additional paid in capital | 3,712,688 | | | 3,710,767 | | | 3,711,005 | | | 3,709,234 | | | 3,707,833 | |
| Cumulative distributions in excess of earnings | (1,911,188) | | | (1,883,225) | | | (1,855,893) | | | (1,905,544) | | | (1,882,962) | |
| Other comprehensive loss | (6,977) | | | (10,266) | | | (8,679) | | | (9,194) | | | (12,050) | |
| Piedmont stockholders' equity | 1,795,760 | | | 1,818,512 | | | 1,847,667 | | | 1,795,730 | | | 1,814,055 | |
| Non-controlling interest | 1,574 | | | 1,585 | | | 1,588 | | | 1,601 | | | 1,608 | |
| Total stockholders' equity | 1,797,334 | | | 1,820,097 | | | 1,849,255 | | | 1,797,331 | | | 1,815,663 | |
| Total liabilities, redeemable common stock and stockholders' equity | $ | 4,094,349 | | | $ | 4,237,460 | | | $ | 4,085,525 | | | $ | 4,185,493 | | | $ | 3,695,554 | |
| Common stock outstanding at end of period | 123,692 | | | 123,643 | | | 123,440 | | | 123,395 | | | 123,390 | |
Piedmont Office Realty Trust, Inc.
Consolidated Statements of Income
Unaudited (in thousands except for per share data)
| | | | | | | | | | | | | | | | | | | | | | | | | | | | | | | | |
| | Three Months Ended |
| | 6/30/2023 | | 3/31/2023 | | 12/31/2022 | | 9/30/2022 | | 6/30/2022 |
| Revenues: | | | | | | | | | | |
Rental income (1) | | $ | 112,238 | | | $ | 112,560 | | | $ | 117,148 | | | $ | 114,280 | | | $ | 110,244 | |
Tenant reimbursements (1) | | 25,265 | | | 24,269 | | | 24,958 | | | 25,292 | | | 21,907 | |
| Property management fee revenue | | 437 | | | 507 | | | 395 | | | 303 | | | 326 | |
| Other property related income | | 5,132 | | | 5,031 | | | 4,707 | | | 4,225 | | | 3,832 | |
| | 143,072 | | | 142,367 | | | 147,208 | | | 144,100 | | | 136,309 | |
| Expenses: | | | | | | | | | | |
| Property operating costs | | 58,368 | | | 57,791 | | | 59,763 | | | 59,039 | | | 53,634 | |
| Depreciation | | 36,475 | | | 35,797 | | | 34,788 | | | 34,941 | | | 32,372 | |
| Amortization | | 21,333 | | | 22,031 | | | 23,915 | | | 23,290 | | | 21,480 | |
Impairment loss (2) | | — | | | — | | | 25,981 | | | — | | | — | |
| General and administrative | | 7,279 | | | 7,691 | | | 7,915 | | | 6,590 | | | 7,027 | |
| | 123,455 | | | 123,310 | | | 152,362 | | | 123,860 | | | 114,513 | |
| Other income / (expense): | | | | | | | | | | |
| Interest expense | | (23,389) | | | (22,077) | | | (20,739) | | | (17,244) | | | (13,775) | |
| Other income / (expense) | | 1,787 | | | 1,656 | | | 408 | | | 335 | | | (57) | |
| | | | | | | | | | |
| | | | | | | | | | |
| | | | | | | | | | |
| | | | | | | | | | |
Gain / (loss) on sale of real estate (2) | | — | | | — | | | 101,055 | | | — | | | 1 | |
| Net income / (loss) | | (1,985) | | | (1,364) | | | 75,570 | | | 3,331 | | | 7,965 | |
| Less: Net (income) / loss applicable to noncontrolling interest | | (3) | | | (3) | | | (1) | | | — | | | 1 | |
| Net income / (loss) applicable to Piedmont | | $ | (1,988) | | | $ | (1,367) | | | $ | 75,569 | | | $ | 3,331 | | | $ | 7,966 | |
| Weighted average common shares outstanding - diluted | | 123,671 | | | 123,550 | | | 123,633 | | | 123,697 | | | 123,679 | |
| Net income / (loss) per share applicable to common stockholders - diluted | | $ | (0.02) | | | $ | (0.01) | | | $ | 0.61 | | | $ | 0.03 | | | $ | 0.06 | |
| Common stock outstanding at end of period | | 123,692 | | | 123,643 | | | 123,440 | | | 123,395 | | | 123,390 | |
| | | | | |
| (1) | The presentation method used for this line is not in conformance with GAAP. To be in conformance with the current GAAP standard, the Company would combine amounts presented on the rental income line with amounts presented on the tenant reimbursements line and present that aggregated figure on one line entitled "rental and tenant reimbursement revenue." |
| (2) | The gain on sale of real estate reflected in the fourth quarter of 2022 was primarily related to the sales of One Brattle Square and 1414 Massachusetts Avenue, both in Cambridge, MA. The impairment loss reflected in the fourth quarter of 2022 was related to (a) a partial write down of the Company's goodwill balance; and (b) the write down of one property. |
Piedmont Office Realty Trust, Inc.
Consolidated Statements of Income
Unaudited (in thousands except for per share data)
| | | | | | | | | | | | | | | | | | | | | | | | | | | | | | | | | | | |
| Three Months Ended | | Six Months Ended |
| 6/30/2023 | 6/30/2022 | | Change ($) | Change (%) | | 6/30/2023 | 6/30/2022 | | Change ($) | Change (%) |
| Revenues: | | | | | | | | | | | |
Rental income (1) | $ | 112,238 | | $ | 110,244 | | | $ | 1,994 | | 1.8 | % | | $ | 224,798 | | $ | 219,976 | | | $ | 4,822 | | 2.2 | % |
Tenant reimbursements (1) | 25,265 | | 21,907 | | | 3,358 | | 15.3 | % | | 49,534 | | 44,087 | | | 5,447 | | 12.4 | % |
| Property management fee revenue | 437 | | 326 | | | 111 | | 34.0 | % | | 944 | | 977 | | | (33) | | (3.4) | % |
| Other property related income | 5,132 | | 3,832 | | | 1,300 | | 33.9 | % | | 10,163 | | 7,418 | | | 2,745 | | 37.0 | % |
| 143,072 | | 136,309 | | | 6,763 | | 5.0 | % | | 285,439 | | 272,458 | | | 12,981 | | 4.8 | % |
| Expenses: | | | | | | | | | | | |
| Property operating costs | 58,368 | | 53,634 | | | (4,734) | | (8.8) | % | | 116,159 | | 107,256 | | | (8,903) | | (8.3) | % |
| Depreciation | 36,475 | | 32,372 | | | (4,103) | | (12.7) | % | | 72,272 | | 63,887 | | | (8,385) | | (13.1) | % |
| Amortization | 21,333 | | 21,480 | | | 147 | | 0.7 | % | | 43,364 | | 43,732 | | | 368 | | 0.8 | % |
| | | | | | | | | | | |
| General and administrative | 7,279 | | 7,027 | | | (252) | | (3.6) | % | | 14,970 | | 14,622 | | | (348) | | (2.4) | % |
| 123,455 | | 114,513 | | | (8,942) | | (7.8) | % | | 246,765 | | 229,497 | | | (17,268) | | (7.5) | % |
| Other income / (expense): | | | | | | | | | | | |
| Interest expense | (23,389) | | (13,775) | | | (9,614) | | (69.8) | % | | (45,466) | | (27,673) | | | (17,793) | | (64.3) | % |
| Other income / (expense) | 1,787 | | (57) | | | 1,844 | | 3,235.1 | % | | 3,443 | | 1,967 | | | 1,476 | | 75.0 | % |
| | | | | | | | | | | |
| | | | | | | | | | | |
| | | | | | | | | | | |
| | | | | | | | | | | |
Gain / (loss) on sale of real estate (2) | — | | 1 | | | (1) | | (100.0) | % | | — | | 50,674 | | | (50,674) | | (100.0) | % |
| Net income / (loss) | (1,985) | | 7,965 | | | (9,950) | | (124.9) | % | | (3,349) | | 67,929 | | | (71,278) | | (104.9) | % |
| Less: Net (income) / loss applicable to noncontrolling interest | (3) | | 1 | | | (4) | | (400.0) | % | | (6) | | 1 | | | (7) | | (700.0) | % |
| Net income / (loss) applicable to Piedmont | $ | (1,988) | | $ | 7,966 | | | $ | (9,954) | | (125.0) | % | | $ | (3,355) | | $ | 67,930 | | | $ | (71,285) | | (104.9) | % |
| Weighted average common shares outstanding - diluted | 123,671 | | 123,679 | | | | | | 123,611 | | 123,617 | | | | |
| Net income / (loss) per share applicable to common stockholders - diluted | $ | (0.02) | | $ | 0.06 | | | | | | $ | (0.03) | | $ | 0.55 | | | | |
| Common stock outstanding at end of period | 123,692 | | 123,390 | | | | | | 123,692 | | 123,390 | | | | |
| | | | | |
| (1) | The presentation method used for this line is not in conformance with GAAP. To be in conformance with the current GAAP standard, the Company would combine amounts presented on the rental income line with amounts presented on the tenant reimbursements line and present that aggregated figure on one line entitled "rental and tenant reimbursement revenue." |
| (2) | The gain on sale of real estate for the six months ended June 30, 2022 was primarily related to the sales of 225 and 235 Presidential Way in Woburn, MA. |
| |
Piedmont Office Realty Trust, Inc.
Funds From Operations, Core Funds From Operations and Adjusted Funds From Operations
Unaudited (in thousands except for per share data) | | | | | | | | | | | | | | | | | | | | | | | | | | |
| | Three Months Ended | | Six Months Ended |
| | 6/30/2023 | | 6/30/2022 | | 6/30/2023 | | 6/30/2022 |
| | | | | | | | |
| GAAP net income / (loss) applicable to common stock | | $ | (1,988) | | | $ | 7,966 | | | $ | (3,355) | | | $ | 67,930 | |
Depreciation for real estate assets (1) | | 36,200 | | | 32,187 | | | 71,890 | | | 63,519 | |
Amortization (1) | | 21,323 | | | 21,468 | | | 43,344 | | | 43,708 | |
| | | | | | | | |
| Loss / (gain) on sale of properties | | — | | | (1) | | | — | | | (50,674) | |
| | | | | | | | |
| NAREIT funds from operations and core funds from operations applicable to common stock | | 55,535 | | | 61,620 | | | 111,879 | | | 124,483 | |
| | | | | | | | |
| | | | | | | | |
| | | | | | | | |
| | | | | | | | |
| | | | | | | | |
| | | | | | | | |
| Adjustments: | | | | | | | | |
| Amortization of debt issuance costs and discounts on debt | | 1,312 | | | 763 | | | 2,551 | | | 1,541 | |
| Depreciation of non real estate assets | | 264 | | | 175 | | | 361 | | | 348 | |
Straight-line effects of lease revenue (1) | | (2,755) | | | (3,029) | | | (5,942) | | | (5,606) | |
| Stock-based compensation adjustments | | 2,095 | | | 1,718 | | | 2,278 | | | 1,166 | |
Amortization of lease-related intangibles (1) | | (3,119) | | | (3,009) | | | (6,531) | | | (6,171) | |
| | | | | | | | |
Non-incremental capital expenditures (2) | | | | | | | | |
| Building/Construction/Development | | (2,914) | | | (4,748) | | | (7,666) | | | (8,254) | |
| Tenant Improvements | | (2,228) | | | (3,402) | | | (7,927) | | | (14,908) | |
| Leasing Costs | | (3,746) | | | (1,188) | | | (7,767) | | | (5,123) | |
| Adjusted funds from operations applicable to common stock | | $ | 44,444 | | | $ | 48,900 | | | $ | 81,236 | | | $ | 87,476 | |
| | | | | | | | |
| Weighted average common shares outstanding - diluted | | 123,749 | | | 123,679 | | | 123,696 | | | 123,617 | |
| | | | | | | | |
| Funds from operations per share (diluted) | | $ | 0.45 | | | $ | 0.50 | | | $ | 0.90 | | | $ | 1.01 | |
| Core funds from operations per share (diluted) | | $ | 0.45 | | | $ | 0.50 | | | $ | 0.90 | | | $ | 1.01 | |
| | | | | | | | |
| Common stock outstanding at end of period | | 123,692 | | | 123,390 | | | 123,692 | | | 123,390 | |
| | | | | |
| (1) | Includes our proportionate share of amounts attributable to consolidated properties. |
| (2) | Non-incremental capital expenditures are defined on page 33. |
Piedmont Office Realty Trust, Inc.
Same Store Net Operating Income (Cash Basis)
| | | | | | | | | | | | | | | | | | | | | | | |
| Three Months Ended | | Six Months Ended |
| 6/30/2023 | | 6/30/2022 | | 6/30/2023 | | 6/30/2022 |
| Net income / (loss) applicable to Piedmont | $ | (1,988) | | | $ | 7,966 | | | $ | (3,355) | | | $ | 67,930 | |
| Net income / (loss) applicable to noncontrolling interest | 3 | | | (1) | | | 6 | | | (1) | |
| Interest expense | 23,389 | | | 13,775 | | | 45,466 | | | 27,673 | |
Depreciation (1) | 36,464 | | | 32,362 | | | 72,251 | | | 63,867 | |
Amortization (1) | 21,323 | | | 21,468 | | | 43,344 | | | 43,708 | |
| Depreciation and amortization attributable to noncontrolling interests | 21 | | | 22 | | | 41 | | | 44 | |
| | | | | | | |
| (Gain) / loss on sale of properties | — | | | (1) | | | — | | | (50,674) | |
| | | | | | | |
| | | | | | | |
| | | | | | | |
| | | | | | | |
| | | | | | | |
| | | | | | | |
EBITDAre and Core EBITDA (2) | 79,212 | | | 75,591 | | | 157,753 | | | 152,547 | |
| General & administrative expenses | 7,279 | | | 7,027 | | | 14,970 | | | 14,622 | |
| Non-cash general reserve for uncollectible accounts | — | | | (1,000) | | | (400) | | | (1,000) | |
Management fee revenue (3) | (254) | | | (203) | | | (546) | | | (565) | |
Other (income) / expense (1) (4) | (1,571) | | | 273 | | | (3,012) | | | (1,536) | |
Straight-line effects of lease revenue (1) | (2,755) | | | (3,029) | | | (5,942) | | | (5,606) | |
| Straight-line effects of lease revenue attributable to noncontrolling interests | (1) | | | (1) | | | (6) | | | (1) | |
Amortization of lease-related intangibles (1) | (3,119) | | | (3,009) | | | (6,531) | | | (6,171) | |
| Property net operating income (cash basis) | 78,791 | | | 75,649 | | | 156,286 | | | 152,290 | |
| Deduct net operating (income) / loss from: | | | | | | | |
Acquisitions (5) | (5,770) | | | — | | | (10,843) | | | — | |
Dispositions (6) | 48 | | | (2,704) | | | 74 | | | (5,785) | |
Other investments (7) | 173 | | | 138 | | | 337 | | | 328 | |
| Same store net operating income (cash basis) | $ | 73,242 | | | $ | 73,083 | | | $ | 145,854 | | | $ | 146,833 | |
| Change period over period | 0.2 | % | | N/A | | (0.7) | % | | N/A |
| | | | | |
| (1) | Includes our proportionate share of amounts attributable to consolidated properties. |
| (2) | The Company has historically recognized approximately $2 to $3 million of termination income on an annual basis. Given the size of its asset base and the number of tenants with which it conducts business, Piedmont considers termination income of that magnitude to be a normal part of its operations and a recurring part of its revenue stream; however, the recognition of termination income is typically variable between quarters and throughout any given year and is dependent upon when during the year the Company receives termination notices from tenants. During the three months ended June 30 2023, Piedmont recognized $0.2 million of termination income, as compared with $0.4 million during the same period in 2022. During the six months ended June 30, 2023, Piedmont recognized $0.4 million of termination income, as compared with $0.6 million during the same period in 2022. |
| (3) | Presented net of related operating expenses incurred to earn the revenue; therefore, the information presented on this line will not tie to the data presented on the income statements. |
| (4) | Figures presented on this line may not tie back to the relevant sources as some activity is attributable to property operations and is, therefore, presented in property net operating income. |
| (5) | Acquisitions includes 1180 Peachtree Street in Atlanta, GA, purchased in the third quarter of 2022. |
| (6) | Dispositions include Two Pierce Place in Itasca, IL and 225 and 235 Presidential Way in Woburn, MA, sold in the first quarter of 2022, and One Brattle Square and 1414 Massachusetts Avenue in Cambridge, MA, sold in the fourth quarter of 2022. |
| (7) | Other investments include active out-of-service redevelopment and development projects, land, and recently completed redevelopment and development projects. Additional information on our land holdings can be found on page 32.The operating results from 222 South Orange Avenue in Orlando, FL, are included in this line item. |
| |
Piedmont Office Realty Trust, Inc.
Same Store Net Operating Income (Accrual Basis)
Unaudited (in thousands)
| | | | | | | | | | | | | | | | | | | | | | | |
| Three Months Ended | | Six Months Ended |
| 6/30/2023 | | 6/30/2022 | | 6/30/2023 | | 6/30/2022 |
| Net income / (loss) applicable to Piedmont | $ | (1,988) | | | $ | 7,966 | | | $ | (3,355) | | | $ | 67,930 | |
| Net income / (loss) applicable to noncontrolling interest | 3 | | | (1) | | | 6 | | | (1) | |
| Interest expense | 23,389 | | | 13,775 | | | 45,466 | | | 27,673 | |
Depreciation (1) | 36,464 | | | 32,362 | | | 72,251 | | | 63,867 | |
Amortization (1) | 21,323 | | | 21,468 | | | 43,344 | | | 43,708 | |
| Depreciation and amortization attributable to noncontrolling interests | 21 | | | 22 | | | 41 | | | 44 | |
| | | | | | | |
| (Gain) / loss on sale of properties | — | | | (1) | | | — | | | (50,674) | |
| | | | | | | |
| | | | | | | |
| | | | | | | |
| | | | | | | |
| | | | | | | |
| | | | | | | |
EBITDAre and Core EBITDA (2) | 79,212 | | | 75,591 | | | 157,753 | | | 152,547 | |
| General & administrative expenses | 7,279 | | | 7,027 | | | 14,970 | | | 14,622 | |
Management fee revenue (3) | (254) | | | (203) | | | (546) | | | (565) | |
Other (income) / expense (1) (4) | (1,571) | | | 273 | | | (3,012) | | | (1,536) | |
| Property net operating income (accrual basis) | 84,666 | | | 82,688 | | | 169,165 | | | 165,068 | |
| Deduct net operating (income) / loss from: | | | | | | | |
Acquisitions (5) | (7,612) | | | — | | | (14,980) | | | — | |
Dispositions (6) | 49 | | | (2,697) | | | 74 | | | (5,857) | |
Other investments (7) | 70 | | | 130 | | | 132 | | | 377 | |
| Same store net operating income (accrual basis) | $ | 77,173 | | | $ | 80,121 | | | $ | 154,391 | | | $ | 159,588 | |
| Change period over period | (3.7) | % | | N/A | | (3.3) | % | | N/A |
| | | | | |
| (1) | Includes our proportionate share of amounts attributable to consolidated properties. |
| (2) | The Company has historically recognized approximately $2 to $3 million of termination income on an annual basis. Given the size of its asset base and the number of tenants with which it conducts business, Piedmont considers termination income of that magnitude to be a normal part of its operations and a recurring part of its revenue stream; however, the recognition of termination income is typically variable between quarters and throughout any given year and is dependent upon when during the year the Company receives termination notices from tenants. During the three months ended June 30 2023, Piedmont recognized $0.2 million of termination income, as compared with $0.4 million during the same period in 2022. During the six months ended June 30, 2023, Piedmont recognized $0.4 million of termination income, as compared with $0.6 million during the same period in 2022. |
| (3) | Presented net of related operating expenses incurred to earn the revenue; therefore, the information presented on this line will not tie to the data presented on the income statements. |
| (4) | Figures presented on this line may not tie back to the relevant sources as some activity is attributable to property operations and is, therefore, presented in property net operating income. |
| (5) | Acquisitions includes 1180 Peachtree Street in Atlanta, GA, purchased in the third quarter of 2022. |
| (6) | Dispositions include Two Pierce Place in Itasca, IL and 225 and 235 Presidential Way in Woburn, MA, sold in the first quarter of 2022, and One Brattle Square and 1414 Massachusetts Avenue in Cambridge, MA, sold in the fourth quarter of 2022. |
| (7) | Other investments include active out-of-service redevelopment and development projects, land, and recently completed redevelopment and development projects. Additional information on our land holdings can be found on page 32. The operating results from 222 South Orange Avenue in Orlando, FL, are included in this line item. |
Piedmont Office Realty Trust, Inc.
Same Store Net Operating Income (Financial Components)
Unaudited (in thousands)
| | | | | | | | | | | | | | | | | | | | | | | | | | | | | | | | |
| | | | | | | | | | |
| | Three Months Ended | | Six Months Ended |
| | 6/30/2023 | 6/30/2022 | Change ($) | Change (%) | | 6/30/2023 | 6/30/2022 | Change ($) | Change (%) |
| | | | | | | | | | |
| Revenue | | | | | | | | | |
| Cash rental income | $ | 100,259 | | $ | 101,158 | | $ | (899) | | (0.9) | % | | $ | 200,562 | | $ | 201,460 | | $ | (898) | | (0.4) | % |
| Tenant reimbursements (1) | 23,841 | | 21,341 | | 2,500 | | 11.7 | % | | 46,779 | | 42,818 | | 3,961 | | 9.3 | % |
| Straight line effects of lease revenue | 1,905 | | 2,974 | | (1,069) | | (35.9) | % | | 3,801 | | 5,473 | | (1,672) | | (30.5) | % |
| Amortization of lease-related intangibles | 2,026 | | 3,064 | | (1,038) | | (33.9) | % | | 4,336 | | 6,282 | | (1,946) | | (31.0) | % |
| Total rents | 128,031 | | 128,537 | | (506) | | (0.4) | % | | 255,478 | | 256,033 | | (555) | | (0.2) | % |
| | | | | | | | | | |
| Other property related income (2) | 4,487 | | 3,828 | | 659 | | 17.2 | % | | 9,097 | | 7,604 | | 1,493 | | 19.6 | % |
| Total revenue | 132,518 | | 132,365 | | 153 | | 0.1 | % | | 264,575 | | 263,637 | | 938 | | 0.4 | % |
| | | | | | | | | | |
Property operating expense (3) | 55,560 | | 52,459 | | (3,101) | | (5.9) | % | | 110,615 | | 104,480 | | (6,135) | | (5.9) | % |
| | | | | | | | | | |
| Property other income / (expense) | 215 | | 215 | | — | | — | % | | 431 | | 431 | | — | | — | % |
| | | | | | | | | | |
| Same store net operating income (accrual) | $ | 77,173 | | $ | 80,121 | | $ | (2,948) | | (3.7) | % | | $ | 154,391 | | $ | 159,588 | | $ | (5,197) | | (3.3) | % |
| | | | | | | | | | |
| Less: | | | | | | | | | |
| Straight line effects of lease revenue | (1,905) | | (2,974) | | 1,069 | | 35.9 | % | | (3,801) | | (5,473) | | 1,672 | | 30.5 | % |
| Amortization of lease-related intangibles | (2,026) | | (3,064) | | 1,038 | | 33.9 | % | | (4,336) | | (6,282) | | 1,946 | | 31.0 | % |
| Non-cash general reserve for uncollectible accounts | — | | (1,000) | | 1,000 | | 100.0 | % | | (400) | | (1,000) | | 600 | | 60.0 | % |
| | | | | | | | | | |
| Same store net operating income (cash) | $ | 73,242 | | $ | 73,083 | | $ | 159 | | 0.2 | % | | $ | 145,854 | | $ | 146,833 | | $ | (979) | | (0.7) | % |
| | | | | | | | | | |
| | | | | |
| (1) | The increase in tenant reimbursements for the three months and the six months ended June 30, 2023 as compared to the same periods in 2022 was primarily the result of an increase in recoverable operating expenses in 2023 in comparison to 2022 due to the increased physical utilization of our buildings. |
| (2) | The increase in other property related income for the three months and the six months ended June 30, 2023 as compared to the same periods in 2022 was primarily related to increased parking demand across the portfolio as a result of post-pandemic increased business activity. |
| (3) | The increase in property operating expense for the three months and the six months ended June 30, 2023 as compared to the same periods in 2022 was primarily associated with increased variable operating costs as a result of increasing physical office space utilization by tenants across our portfolio. |
Piedmont Office Realty Trust, Inc.
Capitalization Analysis
Unaudited (in thousands except for per share data and ratios)
| | | | | | | | | | | |
| | | |
| As of | | As of |
| June 30, 2023 | | December 31, 2022 |
| | | |
| Market Capitalization | | | |
| Common stock price | $7.27 | | $9.17 |
| Total shares outstanding | 123,692 | | 123,440 |
Equity market capitalization (1) | $899,238 | | $1,131,941 |
| Total debt - GAAP | $2,049,236 | | $1,983,681 |
| Total principal amount of debt outstanding (excludes premiums, discounts, and deferred financing costs) | $2,062,000 | | $1,997,000 |
Total market capitalization (1) | $2,961,238 | | $3,128,941 |
Total principal amount of debt / Total market capitalization (1) | 69.6 | % | | 63.8 | % |
| Ratios & Information for Debt Holders | | | |
Total gross assets (2) | $5,367,236 | | $5,312,960 |
Total principal amount of debt / Total gross assets (2) | 38.4 | % | | 37.6 | % |
Average net principal amount of debt to Core EBITDA - quarterly (3) | 6.4 x | | 6.4 x |
Average net principal amount of debt to Core EBITDA - trailing twelve months (4) | 6.3 x | | 6.0 x |
| | | | | |
| (1) | Reflects common stock closing price, shares outstanding, and principal amount of debt outstanding as of the end of the reporting period, as appropriate. |
| (2) | Total gross assets is defined as total assets with the add-back of accumulated depreciation and accumulated amortization related to real estate assets and accumulated amortization related to deferred lease costs. |
| (3) | For the purposes of this calculation, we annualize the Core EBITDA for the quarter and use the average daily principal balance of debt outstanding during the quarter, less cash and cash equivalents and escrow deposits and restricted cash as of the end of each month of the quarter. |
| (4) | For the purposes of this calculation, we use the sum of Core EBITDA for the trailing four quarters and the average daily principal balance of debt outstanding for the trailing four quarters, less the average of cash and cash equivalents and escrow deposits and restricted cash as of the end of each month in the trailing four quarter period. |
Piedmont Office Realty Trust, Inc.
Debt Summary
As of June 30, 2023
Unaudited ($ in thousands)
| | | | | | | | | | | | | | | |
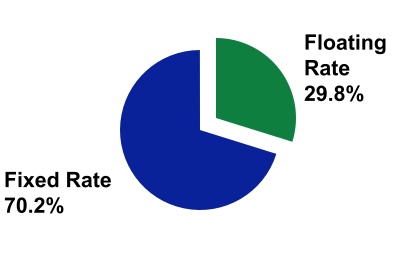
| Floating Rate & Fixed Rate Debt | | | | |
Debt (1) | Principal Amount Outstanding | Weighted Average Stated Interest Rate (2) | Weighted Average Maturity |
| | | | |
| Floating Rate | $615,000 | (3) | 6.14% | 30.0 months |
| | | | |
| Fixed Rate | 1,447,000 | | | 3.80% | 54.1 months |
| | | | |
| Total | $2,062,000 | | 4.49% | 46.9 months |
| | | | |
| | | | | | | | | | | | | | | |
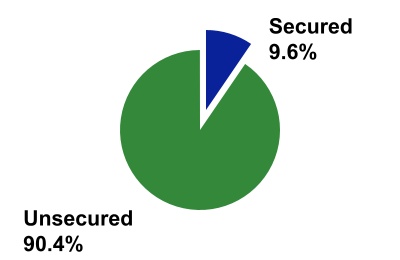
| Unsecured & Secured Debt | |
Debt (1) | Principal Amount Outstanding | Weighted Average Stated Interest Rate (2) | Weighted Average Maturity |
| | | | |
| Unsecured | $1,865,000 | | 4.54% | 45.2 months |
| Secured | 197,000 | | | 4.10% | 63.1 months |
| | | | |
| Total | $2,062,000 | | 4.49% | 46.9 months |
| | | | |
| | | | | | | | | | | | | | | | | | | | | | | | |
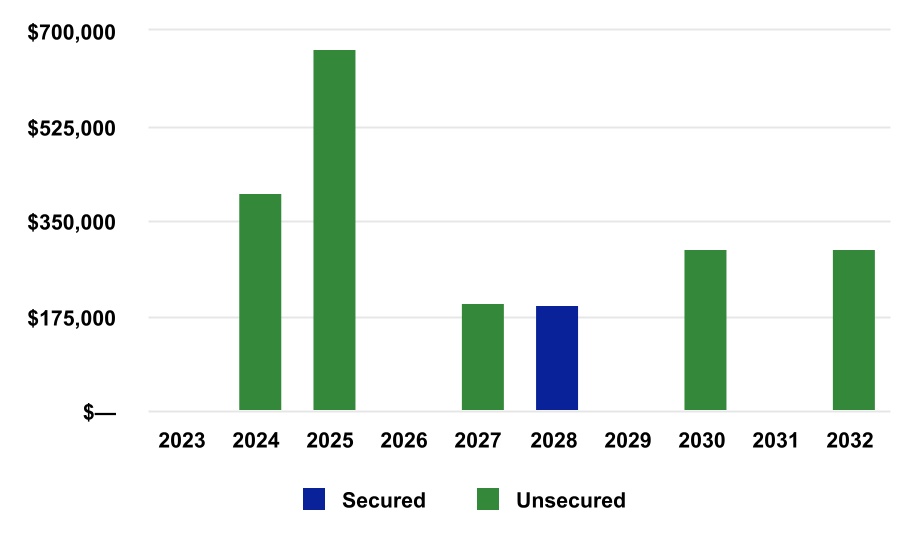
Debt Maturities (4) | |
| Maturity Year | Secured Debt - Principal Amount Outstanding (1) | Unsecured Debt - Principal Amount Outstanding (1) | Weighted Average Stated Interest Rate (2) | Percentage of Total |
| | | | | | | |
| 2023 | $— | | | $— | | | N/A | | —% |
| 2024 | — | | | 400,000 | | | 4.45% | | 19.4% |
| 2025 | — | | | 665,000 | | | 5.58% | | 32.3% |
| 2026 | — | | | — | | | N/A | | —% |
| 2027 | — | | | 200,000 | | | 6.00% | | 9.7% |
| 2028 | 197,000 | | | — | | | 4.10% | | 9.6% |
| 2029 | — | | | — | | | N/A | | —% |
| 2030 | — | | | 300,000 | | | 3.15% | | 14.5% |
| 2031 | — | | | — | | | N/A | | —% |
| 2032 | — | | | 300,000 | | | 2.75% | | 14.5% |
| | | | | | | |
| Total | $197,000 | | $1,865,000 | | 4.49% | | 100.0% |
| | | | | | | |
| | | | | | | |
| | | | | |
| (1) | All of Piedmont's outstanding debt as of June 30, 2023, was interest-only debt or in an interest-only payment period. |
| (2) | Weighted average stated interest rate is calculated based upon the principal amounts outstanding. |
| (3) | The amount of floating rate debt is comprised of the $200 million outstanding balance as of June 30, 2023 on the $600 million unsecured revolving credit facility, the entire principal balance of the $200 million unsecured term loan that closed in 2022, and the entire principal balance of the $215 million unsecured term loan that closed in 2023. |
| (4) | For loans which provide extension options that are conditional solely upon the Company providing proper notice to the loan's administrative agent and the payment of an extension fee, the final extended maturity date is reflected herein. |
Piedmont Office Realty Trust, Inc.
Debt Detail
Unaudited ($ in thousands) | | | | | | | | | | | | | | | | | |
Facility (1) | Property | Stated Rate | Maturity | Principal Amount Outstanding as of June 30, 2023 |
| | | | | |
| Secured | | | | | |
| $197.0 Million Fixed-Rate Mortgage | 1180 Peachtree Street | 4.10 | % | (2) | 10/1/2028 | $ | 197,000 | |
Subtotal / Weighted Average (3) | | 4.10 | % | | | $ | 197,000 | |
| | | | | |
| Unsecured | | | | | |
| $400.0 Million Unsecured 2014 Senior Notes | N/A | 4.45 | % | (4) | 3/15/2024 | 400,000 | |
$215.0 Million Unsecured 2023 Term Loan (5) | N/A | 6.20 | % | (6) | 1/31/2025 | 215,000 | |
| $250.0 Million Unsecured 2018 Term Loan | N/A | 4.54 | % | (7) | 3/31/2025 | 250,000 | |
$200.0 Million Unsecured 2022 Term Loan (8) | N/A | 6.20 | % | (9) | 6/18/2025 | 200,000 | |
$600.0 Million Unsecured Line of Credit (10) | N/A | 6.00 | % | (11) | 6/30/2027 | 200,000 | |
| $300.0 Million Unsecured 2020 Senior Notes | N/A | 3.15 | % | (12) | 8/15/2030 | 300,000 | |
| $300.0 Million Unsecured 2021 Senior Notes | N/A | 2.75 | % | (13) | 4/1/2032 | 300,000 | |
Subtotal / Weighted Average (3) | | 4.54 | % | | | $ | 1,865,000 | |
| | | | | |
Total Debt - Principal Amount Outstanding / Weighted Average Stated Rate (3) | 4.49 | % | | | $ | 2,062,000 | |
GAAP Accounting Adjustments (14) | | | | | (12,764) | |
| Total Debt - GAAP Amount Outstanding | | | | $ | 2,049,236 | |
| | | | | |
| (1) | All of Piedmont’s outstanding debt as of June 30, 2023, was interest-only debt or in an interest-only payment period. |
| (2) | Upon acquiring the property, Piedmont assumed the mortgage. The stated interest rate of the loan was estimated to be an at-market rate as of the date of closing. The loan is interest-only through September 2023; effective October 1, 2023, the loan will begin amortizing based on a 30-year amortization schedule. |
| (3) | Weighted average is based on the principal amounts outstanding and interest rates at June 30, 2023. |
| (4) | The $400 million unsecured senior notes were offered for sale at 99.791% of the principal amount. The resulting effective cost of the financing is approximately 4.48% before the consideration of transaction costs and proceeds from interest rate hedges. After the application of proceeds from interest rate hedges, the effective cost of the financing is approximately 4.10%. |
| (5) | The $215 million unsecured term loan has an initial maturity date of January 31, 2024. There is a one-year extension option available under the facility for a final maturity of January 31, 2025. The final extended maturity date is presented on this schedule. |
| (6) | The $215 million unsecured term loan has a variable interest rate. Piedmont may select from multiple interest rate options, including the prime rate and various SOFR rates. The all-in interest rate associated with each SOFR interest period selection is comprised of the relevant adjusted SOFR rate (comprised of the relevant base SOFR interest rate plus a fixed adjustment of 0.10%) plus a credit spread (1.05% as of June 30, 2023) based on Piedmont's then current credit rating. |
| (7) | The $250 million unsecured term loan has a stated variable interest rate; however, Piedmont entered into various interest rate swap agreements in a total notional amount equal to the size of the facility which effectively fix the interest rate for the term loan (at 4.54% as of June 30, 2023; this rate can change only with a credit rating change for the Company) through the loan's maturity date of March 31, 2025. |
| (8) | The $200 million unsecured term loan has an initial maturity date of December 16, 2024. There is a six-month extension option available under the facility for a final maturity of June 18, 2025. The final extended maturity date is presented on this schedule. |
| (9) | The $200 million unsecured term loan has a variable interest rate. Piedmont may select from multiple interest rate options, including the prime rate and various term SOFR rates. The all-in interest rate associated with each SOFR interest period selection is comprised of the relevant adjusted SOFR rate (comprised of the relevant base SOFR interest rate plus a fixed adjustment of 0.10%) plus a credit spread (1.00% as of June 30, 2023) based on Piedmont's then current credit rating. |
| (10) | All of Piedmont’s outstanding debt as of June 30, 2023 was term debt with the exception of the $200 million balance on our unsecured revolving credit facility. The $600 million unsecured revolving credit facility has an initial maturity date of June 30, 2026; however, there are two, six-month extension options available under the facility providing for a total extension of up to one year to June 30, 2027. The final extended maturity date is presented on this schedule. |
| (11) | The interest rate presented for the $600 million unsecured revolving credit facility is the weighted average interest rate for all outstanding draws as of June 30, 2023. Piedmont may select from multiple interest rate options with each draw under the facility, including the prime rate and various SOFR rates. The all-in interest rate associated with each SOFR interest period selection is comprised of the relevant adjusted SOFR rate (comprised of the relevant base SOFR interest rate plus a fixed adjustment of 0.10%) plus a credit spread (0.85% as of June 30, 2023) based on Piedmont's then current credit rating. |
| (12) | The $300 million unsecured senior notes were offered for sale at 99.236% of the principal amount. The resulting effective cost of the financing is approximately 3.24% before the consideration of transaction costs and the impact of interest rate hedges. After incorporating the results of the related interest rate hedging activity, the effective cost of the financing is approximately 3.90%. |
| (13) | The $300 million unsecured senior notes were offered for sale at 99.510% of the principal amount. The resulting effective cost of the financing is approximately 2.80% before the consideration of transaction costs and the impact of interest rate hedges. After incorporating the results of the related interest rate hedging activity, the effective cost of the financing is approximately 2.78%. |
| (14) | The GAAP accounting adjustments relate to original issue discounts, third-party fees, and lender fees resulting from the procurement processes for our various debt facilities. The original issue discounts and fees are amortized to interest expense over the contractual term of the related debt. |
Piedmont Office Realty Trust, Inc.
Debt Covenant & Ratio Analysis (for Debt Holders)
As of June 30, 2023
Unaudited
| | | | | | | | | | | | | | | | | | | | |
| | Three Months Ended |
Bank Debt Covenant Compliance (1) | Required | 6/30/2023 | 3/31/2023 | 12/31/2022 | 9/30/2022 | 6/30/2022 |
| | | | | | |
| Maximum leverage ratio | 0.60 | 0.37 | 0.38 | 0.39 | 0.40 | 0.35 |
Minimum fixed charge coverage ratio (2) | 1.50 | 3.52 | 3.91 | 4.36 | 4.82 | 5.21 |
| Maximum secured indebtedness ratio | 0.40 | 0.04 | 0.04 | 0.04 | 0.04 | — |
| Minimum unencumbered leverage ratio | 1.60 | 2.66 | 2.64 | 2.56 | 2.46 | 2.87 |
Minimum unencumbered interest coverage ratio (3) | 1.75 | 3.67 | 4.10 | 4.55 | 4.93 | 5.26 |
| | | | | | | | | | | | | | | | | | | | |
| | Three Months Ended |
Bond Covenant Compliance (4) | Required | 6/30/2023 | 3/31/2023 | 12/31/2022 | 9/30/2022 | 6/30/2022 |
| | | | | | |
| Total debt to total assets | 60% or less | 44.8% | 47.1% | 44.0% | 46.8% | 40.9% |
| Secured debt to total assets | 40% or less | 4.3% | 4.2% | 4.3% | 4.3% | —% |
| Ratio of consolidated EBITDA to interest expense | 1.50 or greater | 3.97 | 4.44 | 4.95 | 5.49 | 5.92 |
| Unencumbered assets to unsecured debt | 150% or greater | 223% | 211% | 227% | 212% | 245% |
| | | | | | |
| | | | | | | | | | | | | |
| Three Months Ended | | Six Months Ended | Twelve Months Ended | |
| Other Debt Coverage Ratios for Debt Holders | June 30, 2023 | | June 30, 2023 | December 31, 2022 | |
| | | | | |
Average net principal amount of debt to core EBITDA (5) | 6.4 x | | 6.3 x | 6.0 x | |
Fixed charge coverage ratio (6) | 3.2 x | | 3.3 x | 4.5 x | |
Interest coverage ratio (7) | 3.2 x | | 3.3 x | 4.5 x | |
| | | | | |
| (1) | Bank debt covenant compliance calculations relate to the most restrictive of the specific calculations detailed in the relevant credit agreements. Please refer to such agreements for relevant defined terms. |
| (2) | Defined as EBITDA for the trailing four quarters (including the Company's share of EBITDA from unconsolidated interests), excluding one-time or non-recurring gains or losses, less a $0.15 per square foot capital reserve, and excluding the impact of straight line rent leveling adjustments and amortization of intangibles divided by the Company's share of fixed charges, as more particularly described in the credit agreements. This definition of fixed charge coverage ratio as prescribed by our credit agreements is different from the fixed charge coverage ratio definition employed elsewhere within this report. |
| (3) | Defined as net operating income for the trailing four quarters for unencumbered assets (including the Company's share of net operating income from partially-owned entities and subsidiaries that are deemed to be unencumbered) less a $0.15 per square foot capital reserve divided by the Company's share of interest expense associated with unsecured financings only, as more particularly described in the credit agreements. |
| (4) | Bond covenant compliance calculations relate to specific calculations prescribed in the relevant debt agreements. Please refer to the Indenture dated May 9, 2013, the Indenture and the First Supplemental Indenture dated March 6, 2014, the Second Supplemental Indenture dated August 12, 2020, and the Third Supplemental Indenture dated September 20, 2021 for defined terms and detailed information about the calculations. |
| (5) | For the purposes of this calculation, we use the average daily principal balance of debt outstanding during the identified period, less the average of cash and cash equivalents and escrow deposits and restricted cash as of the end of each month in the relevant period. |
| (6) | Fixed charge coverage ratio is calculated as Core EBITDA divided by the sum of interest expense, principal amortization (none during periods presented), capitalized interest and preferred dividends (none during periods presented). The Company had capitalized interest of $1.4 million for the three months ended June 30, 2023, $2.6 million for the six months ended June 30, 2023, and $4.2 million for the twelve months ended December 31, 2022. |
| (7) | Interest coverage ratio is calculated as Core EBITDA divided by the sum of interest expense and capitalized interest. The Company had capitalized interest of $1.4 million for the three months ended June 30, 2023, $2.6 million for the six months ended June 30, 2023, and $4.2 million for the twelve months ended December 31, 2022. |
Piedmont Office Realty Trust, Inc.
Tenant Diversification (1)
As of June 30, 2023
(in thousands except for number of properties)
| | | | | | | | | | | | | | | | | | | | | | | | | | | |
| Tenant | Credit Rating (2) | Number of
Properties | Lease Term Remaining (3) | Annualized Lease
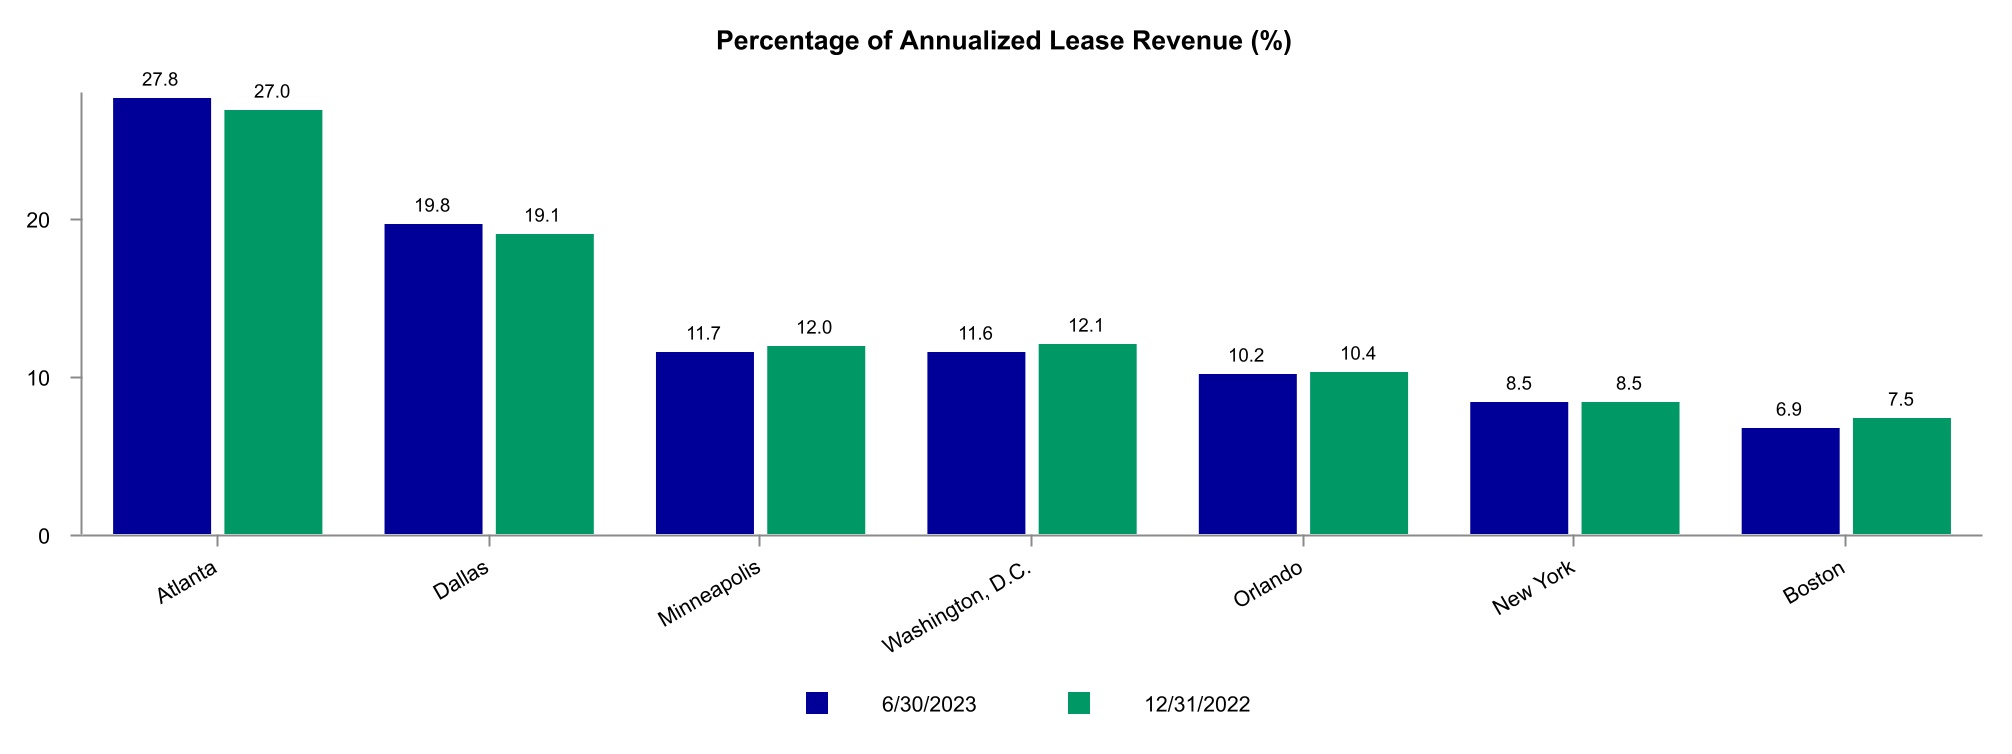
Revenue | Percentage of
Annualized Lease
Revenue (%) | Leased
Square Footage | Percentage of
Leased
Square Footage (%) |
| US Bancorp | A / A3 | 3 | 0.9 | | $28,092 | 5.0 | | 787 | 5.5 |
| State of New York | AA+ / Aa1 | 1 | 13.3 | | 25,564 | 4.5 | | 482 | 3.4 |
| Amazon | AA / A1 | 4 | 1.5 | | 16,474 | 2.9 | | 337 | 2.3 |
| City of New York | AA / Aa2 | 1 | 2.9 | | 15,513 | 2.7 | | 313 | 2.2 |
| Microsoft | AAA / Aaa | 2 | 7.9 | | 13,475 | 2.4 | | 355 | 2.5 |
| King & Spalding | No Rating Available | 1 | 7.7 | | 12,628 | 2.2 | | 272 | 1.9 |
| Transocean | CCC / Caa1 | 1 | 12.8 | | 11,392 | 2.0 | | 301 | 2.1 |
| Ryan | No Rating Available | 1 | 2.6 | | 9,344 | 1.6 | | 178 | 1.2 |
| VMware, Inc. | BBB- / Baa3 | 1 | 4.1 | | 8,786 | 1.6 | | 215 | 1.5 |
| Schlumberger Technology | A / A2 | 1 | 5.5 | | 8,106 | 1.4 | | 254 | 1.8 |
| Gartner | BB+ / Ba1 | 2 | 11.0 | | 7,761 | 1.4 | | 207 | 1.4 |
| Salesforce.com | A+ / A2 | 1 | 6.1 | | 7,465 | 1.3 | | 182 | 1.3 |
| Fiserv | BBB / Baa2 | 1 | 4.1 | | 7,373 | 1.3 | | 195 | 1.4 |
| Epsilon Data Management / subsidiary of Publicis | BBB+ / Baa1 | 1 | 3.0 | | 6,905 | 1.2 | | 222 | 1.5 |
| Applied Predictive Technologies / subsidiary of MasterCard | A+ / Aa3 | 1 | 4.9 | | 6,783 | 1.2 | | 133 | 0.9 |
| Eversheds Sutherland | No Rating Available | 1 | 2.8 | | 6,567 | 1.2 | | 180 | 1.2 |
| International Food Policy Research Institute | No Rating Available | 1 | 5.8 | | 6,479 | 1.1 | | 102 | 0.7 |
| Cargill | A / A2 | 1 | 0.5 | | 5,625 | 1.0 | | 268 | 1.9 |
| | | | | | | | | |
| | | | | | | | | |
| | | | | | | | | |
| | | | | | | | | |
| | | | | | | | | |
| Other | | | Various | | 363,232 | 64.0 | | 9,382 | 65.3 |
| Total | | | | | $567,564 | 100.0 | | 14,365 | 100.0 |
| | | | | |
| (1) | This schedule presents all tenants contributing 1.0% or more to Annualized Lease Revenue. |
| (2) | Credit rating may reflect the credit rating of the parent or a guarantor. When available, both the Standard & Poor's credit rating and the Moody's credit rating are provided. The absence of a credit rating for a tenant is not an indication of the creditworthiness of the tenant; in most cases, the lack of a credit rating reflects that the tenant has not sought such a rating. |
| (3) | The metrics presented are the weighted average lease terms remaining in years weighted by Annualized Lease Revenue. |
| |
| |
Piedmont Office Realty Trust, Inc.
Tenant Credit Rating & Lease Distribution Information
As of June 30, 2023
Tenant Credit Rating (1)
| | | | | | | | |
| Rating Level | Annualized
Lease Revenue
(in thousands) | Percentage of
Annualized Lease
Revenue (%) |
| | |
| AAA / Aaa | $22,300 | 3.9 |
| AA / Aa | 71,201 | 12.5 |
| A / A | 76,894 | 13.6 |
| BBB / Baa | 55,063 | 9.7 |
| BB / Ba | 19,400 | 3.4 |
| B / B | 9,290 | 1.6 |
| Below | 18,425 | | 3.3 |
Not rated (2) | 294,991 | 52.0 |
| Total | $567,564 | 100.0 |
| | |
Lease Distribution
| | | | | | | | | | | | | | | | | | | | |
| Lease Size | Number of Leases | Percentage of
Leases (%) | Annualized
Lease Revenue
(in thousands) | Percentage of
Annualized Lease
Revenue (%) | Leased
Square Footage
(in thousands) | Percentage of
Leased
Square Footage (%) |
| | | | | | |
| 2,500 or Less | 360 | 36.9 | $24,746 | 4.4 | 245 | | 1.7 |
| 2,501 - 10,000 | 348 | 35.6 | 69,711 | 12.3 | 1,797 | | 12.5 |
| 10,001 - 20,000 | 102 | 10.4 | 53,096 | 9.3 | 1,396 | | 9.7 |
| 20,001 - 40,000 | 90 | 9.2 | 94,480 | 16.6 | 2,438 | | 17.0 |
| 40,001 - 100,000 | 48 | 4.9 | 116,292 | 20.5 | 2,963 | | 20.6 |
| Greater than 100,000 | 29 | 3.0 | 209,239 | 36.9 | 5,526 | | 38.5 |
| Total | 977 | 100.0 | $567,564 | 100.0 | 14,365 | | 100.0 |
| | | | | | |
| | | | | |
| (1) | Credit rating may reflect the credit rating of the parent or a guarantor. Where differences exist between the Standard & Poor's credit rating for a tenant and the Moody's credit rating for a tenant, the higher credit rating is selected for this analysis. |
| (2) | The classification of a tenant as "not rated" is not an indication of the creditworthiness of the tenant; in most cases, the lack of a credit rating reflects that the tenant has not sought such a rating. Included in this category are such tenants as Piper Sandler, Ernst & Young, KPMG, BDO, and RaceTrac Petroleum. |
Piedmont Office Realty Trust, Inc.
Leased Percentage Information
| | | | | | | | | | | | | | | | | | | | | | | | | | | | | |
| | Three Months Ended | | Three Months Ended | |
| | June 30, 2023 | | June 30, 2022 | |
| | Leased Square Footage | Rentable Square Footage | Percent Leased (1) | | Leased Square Footage | Rentable Square Footage | Percent Leased (1) | |
| As of March 31, 20xx | 14,352 | | 16,674 | | 86.1 | % | | 14,026 | | 16,126 | | 87.0 | % | |
| | | | | | | | | |
| | | | | | | | | |
| Leases signed during the period | 581 | | | | | 724 | | | | |
| Less: | | | | | | | | |
| Lease renewals signed during period | (345) | | | | | (491) | | | | |
| New leases signed during period for currently occupied space | (64) | | | | | (36) | | | | |
| Leases expired during period and other | (159) | | (2) | | | | (194) | | 3 | | | |
| Subtotal | 14,365 | | 16,672 | | 86.2 | % | | 14,029 | | 16,129 | | 87.0 | % | |
| Acquisitions and properties placed in service during period (2) | — | | — | | | | — | | — | | | |
| Dispositions and properties taken out of service during period (2) | — | | — | | | | — | | — | | | |
| As of June 30, 20xx | 14,365 | | 16,672 | | 86.2 | % | | 14,029 | | 16,129 | | 87.0 | % | |
| | | | | | | | | |
| | | | | | | | | |
| | | | | | | | | |
| | | | | | | | | | | | | | | | | | | | | | | | | | | | | |
| | | | | | | | | |
| | Six Months Ended | | Six Months Ended | |
| | June 30, 2023 | | June 30, 2022 | |
| | Leased Square Footage | Rentable Square Footage | Percent Leased (1) | | Leased Square Footage | Rentable Square Footage | Percent Leased (1) | |
| As of December 31, 20xx | 14,440 | | 16,658 | | 86.7 | % | | 14,583 | | 17,051 | | 85.5 | % | |
| | | | | | | | | |
| | | | | | | | | |
| Leases signed during the period | 1,125 | | | | | 1,276 | | | | |
| Less: | | | | | | | | |
| Lease renewals signed during period | (619) | | | | | (800) | | | | |
| New leases signed during period for currently occupied space | (110) | | | | | (56) | | | | |
| Leases expired during period and other | (471) | | 14 | | | | (368) | | 3 | | | |
| Subtotal | 14,365 | | 16,672 | | 86.2 | % | | 14,635 | | 17,054 | | 85.8 | % | |
| Acquisitions and properties placed in service during period (2) | — | | — | | | | — | | — | | | |
| Dispositions and properties taken out of service during period (2) | — | | — | | | | (606) | | (925) | | | |
| As of June 30, 20xx | 14,365 | | 16,672 | | 86.2 | % | | 14,029 | | 16,129 | | 87.0 | % | |
| | | | | | | | | |
| | | | | | | | | | | | | | | | | | | | | | | | | | | | | |
| Same Store Analysis | | | | | | | | |
| Less acquisitions / dispositions after June 30, 2022 and developments / out-of-service redevelopments (2) (3) | (664) | | (691) | | 96.1 | % | | (170) | | (174) | | 97.7 | % | |
| Same Store Leased Percentage | 13,701 | | 15,981 | | 85.7 | % | | 13,859 | | 15,955 | | 86.9 | % | |
| | | | | | | | | |
| | | | | |
| (1) | Calculated as square footage associated with commenced leases as of period end with the addition of square footage associated with uncommenced leases for spaces vacant as of period end at our in-service properties, divided by total rentable in-service square footage as of period end, expressed as a percentage. |
| (2) | For additional information on acquisitions and dispositions completed during the last year and current developments and out-of-service redevelopments, please refer to pages 31 and 32, respectively. |
| (3) | Dispositions completed during the previous twelve months are deducted from the previous period data and acquisitions completed during the previous twelve months are deducted from the current period data. Redevelopments that commenced during the previous twelve months that were taken out of service are deducted from the previous period data and developments and previously out of service redevelopments that were placed in service during the previous twelve months are deducted from the current period data. |
Piedmont Office Realty Trust, Inc.
Rental Rate Roll Up / Roll Down Analysis (1)
(in thousands)
| | | | | | | | | | | | | | | | | | | | |
| Three Months Ended | |
| June 30, 2023 | |
| Square Feet | % of Total Signed
During Period | % of Rentable
Square Footage | % Change Cash Rents (2) | % Change Accrual Rents (3) | |
| | | | | | |
| Leases executed for spaces vacant one year or less | 216 | 37.2% | 1.3% | 14.3% | 19.6% | |
Leases executed for spaces excluded from analysis (4) | 365 | 62.8% | | | | |
| | | | | | | | | | | | | | | | | | | | |
| | | | | | |
| Six Months Ended | |
| June 30, 2023 | |
| Square Feet | % of Total Signed
During Period | % of Rentable
Square Footage | % Change Cash Rents (2) | % Change Accrual Rents (3) | |
| | | | | | |
| Leases executed for spaces vacant one year or less | 499 | 44.4% | 3.0% | 9.4% | 14.1% | |
Leases executed for spaces excluded from analysis (4) | 626 | 55.6% | | | | |
| | | | | | |
| | | | | |
| (1) | The populations analyzed for this analysis consist of consolidated leases executed during the relevant period with lease terms of greater than one year. Leases associated with storage spaces, retail spaces, management offices, and newly acquired assets for which there is less than one year of operating history, along with percentage rent leases, are excluded from this analysis. |
| (2) | For the purposes of this analysis, the last twelve months of cash paying rents of the previous leases are compared to the first twelve months of cash paying rents of the new leases in order to calculate the percentage change. |
| (3) | For the purposes of this analysis, the accrual basis rents of the previous leases are compared to the accrual basis rents of the new leases in order to calculate the percentage change. For newly signed leases which have variations in accrual basis rents, whether because of known future expansions, contractions, lease expense recovery structure changes, or other similar reasons, the weighted average of such varying accrual basis rents is used for the purposes of this analysis. |
| (4) | Represents leases signed at our consolidated office assets that do not qualify for inclusion in the analysis, primarily because the spaces for which the new leases were signed had been vacant for more than one year. |
| |
Piedmont Office Realty Trust, Inc.
Lease Expiration Schedule
As of June 30, 2023
(in thousands)
| | | | | | | | | | | | | | | | | |
| | |
| Expiration Year | | Annualized Lease Revenue (1) | Percentage of Annualized Lease Revenue (%) | Rentable Square Footage | Percentage of Rentable Square Footage (%) |
| Vacant | | $— | — | 2,307 | 13.8 |
| | | | | |
| | | | | |
| | | | | |
| | | | | |
| | | | | |
| | | | | |
2023 (2) | | 15,951 | 2.8 | 558 | 3.3 |
2024 (3) | | 64,619 | 11.4 | 1,830 | 11.0 |
| 2025 | | 68,484 | 12.1 | 1,712 | 10.3 |
| 2026 | | 62,599 | 11.0 | 1,598 | 9.6 |
| 2027 | | 52,972 | 9.3 | 1,399 | 8.4 |
| 2028 | | 69,830 | 12.3 | 1,809 | 10.8 |
| 2029 | | 53,001 | 9.3 | 1,273 | 7.6 |
| 2030 | | 24,655 | 4.4 | 666 | 4.0 |
| 2031 | | 25,780 | 4.5 | 661 | 4.0 |
| 2032 | | 22,736 | 4.0 | 567 | 3.4 |
| 2033 | | 10,337 | 1.8 | 228 | 1.4 |
| 2034 | | 19,044 | 3.4 | 488 | 2.9 |
| 2035 | | 18,714 | 3.3 | 492 | 3.0 |
| Thereafter | | 58,842 | 10.4 | 1,084 | 6.5 |
| Total | | $567,564 | 100.0 | 16,672 | 100.0 |
| | | | | |
| Average Lease Term Remaining |
| 6/30/2023 | 5.7 years |
| 12/31/2022 | 5.6 years |
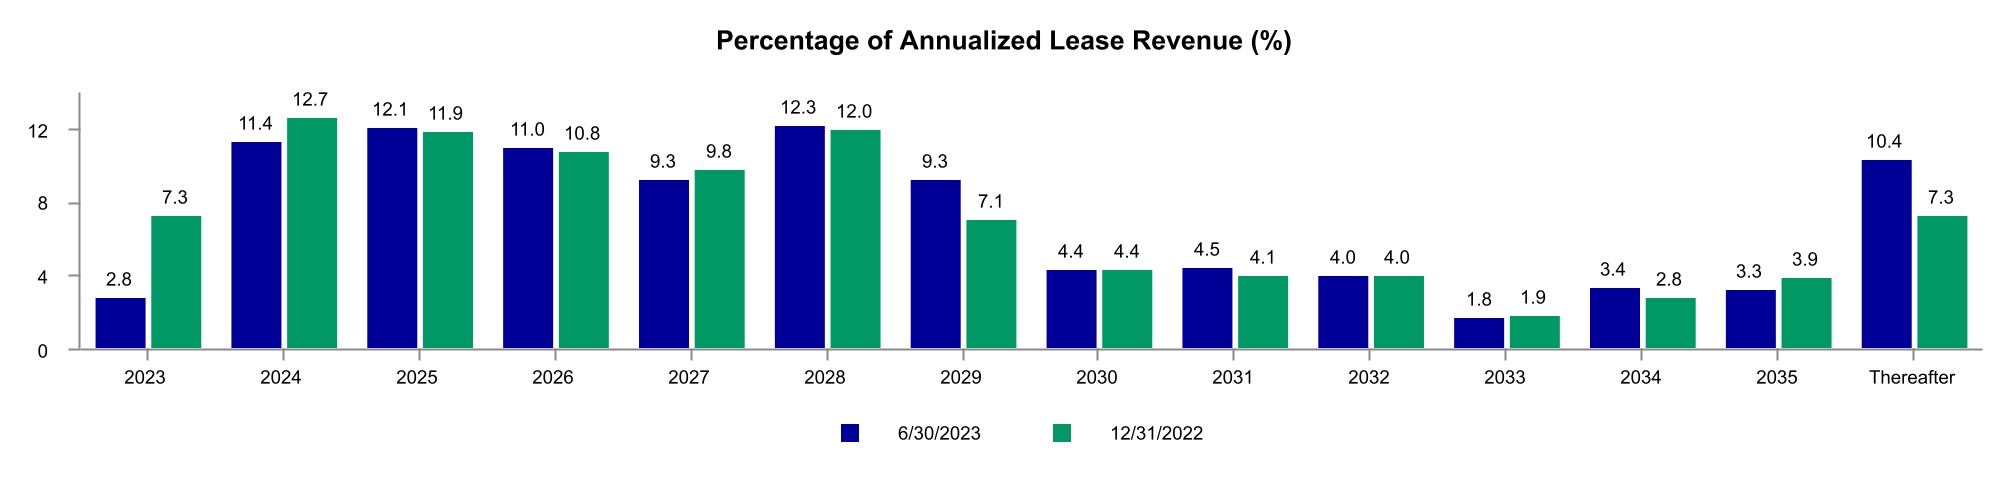
| | | | | |
| (1) | Annualized rental income associated with each newly executed lease for currently occupied space is incorporated herein only at the expiration date for the current lease. Annualized rental income associated with each such new lease is removed from the expiry year of the current lease and added to the expiry year of the new lease. These adjustments effectively incorporate known roll ups and roll downs into the expiration schedule. |
| (2) | Includes leases with an expiration date of June 30, 2023, comprised of approximately 19,000 square feet and Annualized Lease Revenue of $0.7 million. |
| (3) | Leases and other revenue-producing agreements on a month-to-month basis, comprised of approximately 40,000 square feet and Annualized Lease Revenue of $1.8 million, are assigned a lease expiration date of a year and a day beyond the period end date. |
Piedmont Office Realty Trust, Inc.
Lease Expirations by Quarter
As of June 30, 2023
(in thousands)
| | | | | | | | | | | | | | | | | | | | | | | | | | | | | | | | | | | | | | |
| | Q3 2023 (1) | | Q4 2023 | | Q1 2024 | | Q2 2024 |
| Location | | Expiring Square Footage | Expiring Lease Revenue (2) | | Expiring Square Footage | Expiring Lease Revenue (2) | | Expiring Square Footage | Expiring Lease Revenue (2) | | Expiring Square Footage | Expiring Lease Revenue (2) |
| | | | | | | | | | | | |
| Atlanta | | 48 | $1,705 | | 33 | $1,211 | | 22 | $850 | | 43 | $1,527 |
| Boston | | 15 | 579 | | — | — | | 7 | 306 | | — | — |
| Dallas | | 19 | 987 | | 66 | 2,633 | | 4 | 180 | | 72 | 2,675 |
| Minneapolis | | 8 | 364 | | 296 | 6,739 | | 17 | 588 | | 789 | 28,184 |
| New York | | 3 | 164 | | — | — | | 2 | 85 | | — | — |
| Orlando | | 2 | 85 | | 51 | 1,194 | | 228 | 3,398 | | 40 | 1,452 |
| Washington, D.C. | | 1 | 53 | | 12 | 637 | | 75 | 4,002 | | 54 | 2,661 |
| Other | | — | — | | 4 | 69 | | — | — | | — | 5 |
Total (3) | | 96 | $3,937 | | 462 | $12,483 | | 355 | $9,409 | | 998 | $36,504 |
| | | | | |
| (1) | Includes leases with an expiration date of June 30, 2023, comprised of approximately 19,000 square feet and expiring lease revenue of $0.9 million. No such adjustments are made to other periods presented. |
| (2) | Expiring Lease Revenue is calculated as expiring square footage multiplied by the gross rent per square foot of the tenant currently leasing the space. |
| (3) | Total expiring lease revenue in any given year will not tie to the expiring Annualized Lease Revenue presented on the Lease Expiration Schedule on the previous page as the Lease Expiration Schedule accounts for the revenue effects of newly signed leases. Reflected herein are expiring revenues based on in-place rental rates. |
| |
Piedmont Office Realty Trust, Inc.
Lease Expirations by Year
As of June 30, 2023
(in thousands)
| | | | | | | | | | | | | | | | | | | | | | | | | | | | | | | | | | | | | | | | | | | | |
| 12/31/2023 (1) | | 12/31/2024 | | 12/31/2025 | | 12/31/2026 | | 12/31/2027 |
| Location | Expiring Square Footage | Expiring Lease Revenue (2) | | Expiring Square Footage | Expiring Lease Revenue (2) | | Expiring Square Footage | Expiring Lease Revenue (2) | | Expiring Square Footage | Expiring Lease Revenue (2) | | Expiring Square Footage | Expiring Lease Revenue (2) |
| Atlanta | 80 | $2,916 | | 246 | $9,325 | | 423 | $14,649 | | 471 | $17,481 | | 605 | $23,033 |
| Boston | 15 | 580 | | 13 | 549 | | 145 | 5,270 | | 16 | 534 | | 27 | 788 |
| Dallas | 85 | 3,620 | | 166 | 6,442 | | 630 | 22,565 | | 381 | 12,837 | | 219 | 7,625 |
| Minneapolis | 305 | 7,103 | | 893 | 31,887 | | 261 | 10,386 | | 28 | 1,053 | | 218 | 7,493 |
| New York | 3 | 164 | | 35 | 1,977 | | 10 | 507 | | 313 | 15,525 | | 14 | 724 |
| Orlando | 53 | 1,279 | | 311 | 6,588 | | 211 | 7,061 | | 286 | 9,773 | | 212 | 7,654 |
| Washington, D.C. | 13 | 690 | | 166 | 8,457 | | 32 | 2,416 | | 103 | 5,353 | | 104 | 5,654 |
| Other | 4 | 69 | | — | 5 | | — | — | | — | — | | — | 5 |
Total (3) | 558 | $16,421 | | 1,830 | $65,230 | | 1,712 | $62,854 | | 1,598 | $62,556 | | 1,399 | $52,976 |
| | | | | |
| (1) | Includes leases with an expiration date of June 30, 2023, comprised of approximately 19,000 square feet and expiring lease revenue of $0.9 million. No such adjustments are made to other periods presented. |
| (2) | Expiring Lease Revenue is calculated as expiring square footage multiplied by the gross rent per square foot of the tenant currently leasing the space. |
| (3) | Total expiring lease revenue in any given year will not tie to the expiring Annualized Lease Revenue presented on the Lease Expiration Schedule on page 24 as the Lease Expiration Schedule accounts for the revenue effects of newly signed leases. Reflected herein are expiring revenues based on in-place rental rates. |
| |
Piedmont Office Realty Trust, Inc.
Contractual Tenant Improvements and Leasing Commissions | | | | | | | | | | | | | | | | | | | | | | | | | | | | | | | | | | | | | | | | | | | | | |
| | | | | | | | | | | | | | | | | | | | | |
| | Three Months Ended
June 30, 2023 | Six Months Ended
June 30, 2023 | | For the Year Ended | | | | | | | 2019 to 2023 (Weighted Average Total) | | |
| | 2022 | 2021 | 2020 | 2019 | | | | | |
| | | | | | | | | | | | | | | | | | | | |
| | | | | | | | | | | | | | | | | | | | | |
| | | | | | | | | | | | | | | | | | | | | |
| | | | | | | | | | | | | | | | | | | | | |
| | | | | | | | | | | | | | | | | | | | | |
| | | | | | | | | | | | | | | | | | | | |
| | | | | | | | | | | | | | | | | | | | | |
| | | | | | | | | | | | | | | | | | | | | |
| | | | | | | | | | | | | | | | | | | | | |
| | | | | | | | | | | | | | | | | | | | | |
| Total Leasing Transactions | | | | | | | | | | | | | | | | | | | | |
| Square feet | 581,031 | | 1,124,591 | | 2,142,852 | 2,247,366 | | 1,103,248 | | 2,730,332 | | | | | | | | 9,348,389 | | |
| Tenant improvements per square foot per year of lease term (1) | $4.24 | | $4.09 | | $3.22 | $2.78 | | $4.30 | | $4.21 | | | | | | | | $3.67 | | |
| Leasing commissions per square foot per year of lease term | $2.26 | | $2.31 | | $2.22 | $1.67 | | $1.89 | | $1.70 | | | | | | | | $1.88 | | |
| Total per square foot per year of lease term | $6.50 |
| $6.40 | (2) | $5.44 | $4.45 | | $6.19 | | $5.91 | | | | | | | | $5.55 | | |
Less Adjustment for Commitment Expirations (2) | | | | | | | | | | | | | | | | | | | | |
| Expired tenant improvements (not paid out)
per square foot per year of lease term | -$0.06 | | -$0.11 | | -$0.10 | -$0.20 | | -$0.40 | | -$0.05 | | | | | | | | -$0.14 | | |
| | | | | | | | | | | | | | | | | | | | | |
| Adjusted total per square foot per year of lease term | $6.44 | | $6.29 | | $5.34 | $4.25 | | $5.79 | | $5.86 | | | | | | | | $5.41 | | |
| | | | | | | | | | | | | | | | | | | | | |
| | | | | |
| NOTE: | This information is presented for our consolidated office assets only and excludes activity associated with storage and license spaces. |
| (1) | For leases under which a tenant may use, at its discretion, a portion of its tenant improvement allowance for expenses other than those related to improvements to its space, an assumption is made that the tenant elects to use any such portion of its tenant improvement allowance for improvements to its space prior to the commencement of its lease, unless the Company is notified otherwise by the tenant. This assumption is made based upon historical usage patterns of tenant improvement allowances by the Company's tenants. |
| (2) | The Company has historically reported the maximum amount of capital to which it committed in leasing transactions as of the signing of the leases with no subsequent updates for variations and/or changes in tenants' uses of tenant improvement allowances. Many times, tenants do not fully use the allowances provided in their leases or let portions of their tenant improvement allowances expire. In an effort to provide additional clarity on the actual costs of completed leasing transactions, tenant improvement allowances that expired or became no longer available to tenants are disclosed in this section and are deducted from the capital commitments per square foot of leased space in the periods in which they expired in an effort to provide a better estimation of leasing transaction costs over time. |
Piedmont Office Realty Trust, Inc.
Geographic Diversification
As of June 30, 2023
($ and square footage in thousands)
| | | | | | | | | | | | | | | | | | | | | | | | | | |
| Location | Number of
Properties | Annualized
Lease Revenue | Percentage of
Annualized Lease
Revenue (%) | Rentable
Square Footage | Percentage of
Rentable Square
Footage (%) | Leased Square Footage | Percent Leased (%) |
| Atlanta | 11 | $157,541 | 27.8 | | 4,721 | 28.3 | 4,149 | 87.9 |
| Dallas | 13 | 112,619 | 19.8 | | 3,534 | 21.2 | 2,860 | 80.9 |
| Minneapolis | 6 | 66,470 | 11.7 | | 2,104 | 12.6 | 1,907 | 90.6 |
| Washington, D.C. | 6 | 65,954 | 11.6 | | 1,620 | 9.7 | 1,239 | 76.5 |
| Orlando | 6 | 58,026 | 10.2 | | 1,764 | 10.6 | 1,657 | 93.9 |
| New York | 1 | 48,222 | 8.5 | | 1,045 | 6.3 | 912 | 87.3 |
| Boston | 6 | 39,153 | 6.9 | | 1,270 | 7.6 | 1,081 | 85.1 |
| Other | 2 | 19,579 | 3.5 | | 614 | 3.7 | 560 | 91.2 |
| Total / Weighted Average | 51 | $567,564 | 100.0 | | 16,672 | 100.0 | 14,365 | 86.2 |
Piedmont Office Realty Trust, Inc.
Geographic Diversification by Location Type
As of June 30, 2023
(square footage in thousands)
| | | | | | | | | | | | | | | | | | | | | | | | | | | | | | | | | | | | | | | | | | | | | | | | | | |
| | | CBD | | URBAN INFILL / SUBURBAN | | TOTAL |
| Location | State | | Number of
Properties | Percentage
of
Annualized
Lease
Revenue
(%) | Rentable
Square
Footage | Percentage
of Rentable
Square
Footage
(%) | | Number of
Properties | Percentage
of
Annualized
Lease
Revenue
(%) | Rentable
Square
Footage | Percentage
of Rentable
Square
Footage
(%) | | Number of
Properties | Percentage
of
Annualized
Lease
Revenue
(%) | Rentable
Square
Footage | Percentage
of Rentable
Square
Footage
(%) |
| Atlanta | GA | | 2 | 9.6 | 1,315 | 7.9 | | 9 | 18.2 | 3,406 | 20.4 | | 11 | 27.8 | 4,721 | 28.3 |
| Dallas | TX | | — | — | — | — | | 13 | 19.8 | 3,534 | 21.2 | | 13 | 19.8 | 3,534 | 21.2 |
| Minneapolis | MN | | 1 | 5.9 | 937 | 5.6 | | 5 | 5.8 | 1,167 | 7.0 | | 6 | 11.7 | 2,104 | 12.6 |
| Washington, D.C. | DC, VA | | 3 | 5.1 | 722 | 4.3 | | 3 | 6.5 | 898 | 5.4 | | 6 | 11.6 | 1,620 | 9.7 |
| Orlando | FL | | 4 | 8.4 | 1,455 | 8.7 | | 2 | 1.8 | 309 | 1.9 | | 6 | 10.2 | 1,764 | 10.6 |
| New York | NY | | 1 | 8.5 | 1,045 | 6.3 | | — | — | — | — | | 1 | 8.5 | 1,045 | 6.3 |
| Boston | MA | | — | — | — | — | | 6 | 6.9 | 1,270 | 7.6 | | 6 | 6.9 | 1,270 | 7.6 |
| Other | | | — | — | — | — | | 2 | 3.5 | 614 | 3.7 | | 2 | 3.5 | 614 | 3.7 |
| | | | | | | | | | | | | | | | |
| Total | | 11 | 37.5 | 5,474 | 32.8 | | 40 | 62.5 | 11,198 | 67.2 | | 51 | 100.0 | 16,672 | 100.0 |
Piedmont Office Realty Trust, Inc.
Industry Diversification
As of June 30, 2023
($ and square footage in thousands)
| | | | | | | | | | | | | | | | | | | | | | | |
| | | | Percentage of | | |
| Number of | Percentage of Total | Annualized Lease | Annualized Lease | Leased Square | Percentage of Leased |
| Industry | Tenants | Tenants (%) | Revenue | Revenue (%) | Footage | Square Footage (%) |
| Business Services | 82 | 11.4 | $85,782 | 15.1 | | 2,218 | 15.4 |
| Engineering, Accounting, Research, Management & Related Services | 95 | 13.2 | 79,159 | 13.9 | | 1,902 | 13.2 |
| Legal Services | 79 | 11.0 | 57,171 | 10.1 | | 1,417 | 9.9 |
| Governmental Entity | 5 | 0.7 | 48,115 | 8.5 | | 938 | 6.5 |
| Depository Institutions | 22 | 3.1 | 38,705 | 6.8 | | 1,042 | 7.3 |
| Real Estate | 49 | 6.8 | 28,404 | 5.0 | | 834 | 5.8 |
| Oil and Gas Extraction | 5 | 0.7 | 22,193 | 3.9 | | 631 | 4.4 |
| Miscellaneous Retail | 9 | 1.3 | 20,885 | 3.7 | | 467 | 3.3 |
| Holding and Other Investment Offices | 36 | 5.0 | 20,293 | 3.6 | | 497 | 3.5 |
| Security & Commodity Brokers, Dealers, Exchanges & Services | 52 | 7.2 | 19,226 | 3.4 | | 492 | 3.4 |
| Health Services | 32 | 4.4 | 14,726 | 2.6 | | 376 | 2.6 |
| Automotive Repair, Services & Parking | 9 | 1.3 | 13,149 | 2.3 | | 8 | 0.1 |
| Insurance Agents, Brokers & Services | 20 | 2.8 | 11,768 | 2.1 | | 341 | 2.4 |
| Membership Organizations | 16 | 2.2 | 10,544 | 1.9 | | 204 | 1.4 |
| Eating & Drinking Places | 31 | 4.3 | 8,638 | 1.5 | | 224 | 1.6 |
| Other | 178 | 24.6 | 88,806 | 15.6 | | 2,774 | 19.2 |
| Total | 720 | 100.0 | $567,564 | 100.0 | | 14,365 | 100.0 |
Piedmont Office Realty Trust, Inc.
Property Investment Activity
As of June 30, 2023
($ and square footage in thousands)
Acquisitions Completed During Prior Year and Current Year | | | | | | | | | | | | | | | | | | | | | | | | | | |
| Property | | Market / Submarket | Acquisition Period | Percent
Ownership (%) | Year Built | Purchase Price | Rentable Square
Footage | Percent Leased at
Acquisition (%) |
| 1180 Peachtree Street | | Atlanta / Midtown | Q3 2022 | 100 | 2005 | $465,665 | 691 | 96 |
| | | | | | | | |
Dispositions Completed During Prior Year and Current Year | | | | | | | | | | | | | | | | | | | | | | | | | | |
| Property | | Market / Submarket | Disposition Period | Percent
Ownership (%) | Year Built | Sale Price | Rentable Square
Footage | Percent Leased at
Disposition (%) |
| Two Pierce Place | | Chicago / Northwest | Q1 2022 | 100 | 1991 | $24,000 | 485 | 34 |
| 225 and 235 Presidential Way | | Boston / Route 128 | Q1 2022 | 100 | 2001 and 2000 | 129,000 | 440 | 100 |
| Cambridge Portfolio | | Boston / Cambridge | Q4 2022 | 100 | Various | 160,225 | 175 | 94 |
| Total / Weighted Average | | | | | | $313,225 | 1,100 | 70 |
| | | | | | | | |
| | | | | | | | |
Piedmont Office Realty Trust, Inc.
Other Investments
As of June 30, 2023
($ and square footage in thousands)
Developable Land Parcels | | | | | | | | | | | | | | |
| Property | Market / Submarket | Adjacent Piedmont Project | Acres | Real Estate Book Value |
| Gavitello | Atlanta / Buckhead | The Medici | 2.0 | $2,596 |
| Glenridge Highlands Three | Atlanta / Central Perimeter | Glenridge Highlands | 3.0 | 2,015 |
| Galleria Atlanta | Atlanta / Northwest | Galleria | 16.3 | 24,228 |
| State Highway 161 | Dallas / Las Colinas | Las Colinas Corporate Center | 4.5 | 3,320 |
| Royal Lane | Dallas / Las Colinas | 6011, 6021 & 6031 Connection Drive | 10.6 | 2,837 |
| John Carpenter Freeway | Dallas / Las Colinas | 750 West John Carpenter Freeway | 3.5 | 1,000 |
| Galleria Dallas | Dallas / Lower North Tollway | Galleria Office Towers | 1.9 | 5,927 |
| TownPark | Orlando / Lake Mary | 400 & 500 TownPark Commons | 18.9 | 9,116 |
| Total | | | 60.7 | $51,039 |
Out-of-Service Redevelopment
| | | | | | | | | | | | | | | | | | | | | | | |
| Property | Market / Submarket | Adjacent Piedmont Property | Construction Type | | Percent Leased (%) | Square Feet | Current Asset Basis | | |
222 South Orange Avenue (1) | Orlando / CBD | 200 South Orange Avenue | Redevelopment | | 14.6 | 127 | $27.9 million | | |
| | | | | |
| (1) | The property was acquired on October 29, 2020 and was vacant at the time of acquisition. It shares a common lobby and atrium with the Company's 200 South Orange Avenue property. The redevelopment includes an enhanced window line and balconies, allowing more light and air into tenant spaces, along with renovations to the lobby, common areas and restrooms. |
| |
Piedmont Office Realty Trust, Inc.
| | |
Included below are definitions of various terms used throughout this supplemental report, including definitions of certain non-GAAP financial measures and the reasons why the Company’s management believes these measures provide useful information to investors about the Company’s financial condition and results of operations. Reconciliations of any non-GAAP financial measures defined below are included beginning on page 35. |
Adjusted Funds From Operations ("AFFO"): The Company calculates AFFO by starting with Core FFO and adjusting for non-incremental capital expenditures and then adding back non-cash items including: non-real estate depreciation, straight-lined rents and fair value lease adjustments, non-cash components of interest expense and compensation expense, and by making similar adjustments for joint ventures, if any. AFFO is a non-GAAP financial measure and should not be viewed as an alternative to net income calculated in accordance with GAAP as a measurement of the Company’s operating performance. The Company believes that AFFO is helpful to investors as a meaningful supplemental comparative performance measure of our ability to make incremental capital investments. Other REITs may not define AFFO in the same manner as the Company; therefore, the Company’s computation of AFFO may not be comparable to that of other REITs. |
Annualized Lease Revenue ("ALR"): ALR is calculated by multiplying (i) rental payments (defined as base rent plus operating expense reimbursements, if payable by the tenant on a monthly basis under the terms of a lease that has been executed, but excluding a) rental abatements and b) rental payments related to executed but not commenced leases for space that was covered by an existing lease), by (ii) 12. In instances in which contractual rents or operating expense reimbursements are collected on an annual, semi-annual, or quarterly basis, such amounts are multiplied by a factor of 1, 2, or 4, respectively, to calculate the annualized figure. For leases that have been executed but not commenced relating to un-leased space, ALR is calculated by multiplying (i) the monthly base rental payment (excluding abatements) plus any operating expense reimbursements for the initial month of the lease term, by (ii) 12. Unless stated otherwise, this measure excludes revenues associated with development properties and properties taken out of service for redevelopment, if any. |
Core EBITDA: The Company calculates Core EBITDA as net income/(loss) (computed in accordance with GAAP) before interest, taxes, depreciation and amortization and removing any impairment losses, gains or losses from sales of property and other significant infrequent items that create volatility within our earnings and make it difficult to determine the earnings generated by our core ongoing business. Core EBITDA is a non-GAAP financial measure and should not be viewed as an alternative to net income calculated in accordance with GAAP as a measurement of the Company’s operating performance. The Company believes that Core EBITDA is helpful to investors as a supplemental performance measure because it provides a metric for understanding the performance of the Company’s results from ongoing operations without taking into account the effects of non-cash expenses (such as depreciation and amortization), as well as items that are not part of normal day-to-day operations of the Company’s business. Other REITs may not define Core EBITDA in the same manner as the Company; therefore, the Company’s computation of Core EBITDA may not be comparable to that of other REITs. |
Core Funds From Operations ("Core FFO"): The Company calculates Core FFO by starting with FFO, as defined by NAREIT, and adjusting for gains or losses on the extinguishment of swaps and/or debt and any significant non-recurring items. Core FFO is a non-GAAP financial measure and should not be viewed as an alternative to net income calculated in accordance with GAAP as a measurement of the Company’s operating performance. The Company believes that Core FFO is helpful to investors as a supplemental performance measure because it excludes the effects of certain infrequent or non-recurring items which can create significant earnings volatility, but which do not directly relate to the Company’s core business operations. As a result, the Company believes that Core FFO can help facilitate comparisons of operating performance between periods and provides a more meaningful predictor of future earnings potential. Other REITs may not define Core FFO in the same manner as the Company; therefore, the Company’s computation of Core FFO may not be comparable to that of other REITs. |
EBITDA: EBITDA is defined as net income/(loss) before interest, taxes, depreciation and amortization. |
EBITDAre: The Company calculates EBITDAre in accordance with the current National Association of Real Estate Investment Trusts (“NAREIT”) definition. NAREIT currently defines EBITDAre as net income/(loss) (computed in accordance with GAAP) adjusted for gains or losses from sales of property, impairment losses, depreciation on real estate assets, amortization on real estate assets, interest expense and taxes, along with the same adjustments for joint ventures. Some of the adjustments mentioned can vary among owners of identical assets in similar conditions based on historical cost accounting and useful-life estimates. EBITDAre is a non-GAAP financial measure and should not be viewed as an alternative to net income calculated in accordance with GAAP as a measurement of the Company’s operating performance. The Company believes that EBITDAre is helpful to investors as a supplemental performance measure because it provides a metric for understanding the Company’s results from ongoing operations without taking into account the effects of non-cash expenses (such as depreciation and amortization) and capitalization and capital structure expenses (such as interest expense and taxes). The Company also believes that EBITDAre can help facilitate comparisons of operating performance between periods and with other REITs. However, other REITs may not define EBITDAre in accordance with the NAREIT definition, or may interpret the current NAREIT definition differently than the Company; therefore, the Company’s computation of EBITDAre may not be comparable to that of such other REITs. |
Funds From Operations ("FFO"): The Company calculates FFO in accordance with the current National Association of Real Estate Investment Trusts (“NAREIT”) definition. NAREIT currently defines FFO as net income/(loss) (calculated in accordance with GAAP), excluding depreciation and amortization related to real estate, gains and losses from the sale of certain real estate assets, gains and losses from change in control, and impairment write-downs of certain real estate assets and investment in entities when the impairment is directly attributable to decreases in the value of depreciable real estate held by the entity, along with appropriate adjustments to those reconciling items for joint ventures, if any. These adjustments can vary among owners of identical assets in similar conditions based on historical cost accounting and useful-life estimates. FFO is a non-GAAP financial measure and should not be viewed as an alternative to net income calculated in accordance with GAAP as a measurement of the Company’s operating performance. The Company believes that FFO is helpful to investors as a supplemental performance measure because it excludes the effects of depreciation, amortization and gains or losses from sales of real estate, all of which are based on historical costs, which implicitly assumes that the value of real estate diminishes predictably over time. The Company also believes that FFO can help facilitate comparisons of operating performance between periods and with other REITs. However, other REITs may not define FFO in accordance with the NAREIT definition, or may interpret the current NAREIT definition differently than the Company; therefore, the Company’s computation of FFO may not be comparable to that of such other REITs. |
Incremental Capital Expenditures: Incremental Capital Expenditures are defined as capital expenditures of a non-recurring nature that incrementally enhance the underlying assets' income generating capacity. Tenant improvements, leasing commissions, building capital and deferred lease incentives ("Leasing Costs") incurred to lease space that was vacant at acquisition, Leasing Costs for spaces vacant for greater than one year, Leasing Costs for spaces at newly acquired properties for which in-place leases expire shortly after acquisition, improvements associated with the expansion of a building, renovations that change the underlying classification of a building, and deferred building maintenance capital identified at and completed shortly after acquisition are included in this measure. |
Non-Incremental Capital Expenditures: Non-Incremental Capital Expenditures are defined as capital expenditures of a recurring nature related to tenant improvements and leasing commissions that do not incrementally enhance the underlying assets' income generating capacity. We exclude first generation tenant improvements and leasing commissions from this measure, in addition to other capital expenditures that qualify as Incremental Capital Expenditures, as defined above. |
Property Net Operating Income ("Property NOI"): The Company calculates Property NOI by starting with Core EBITDA and adjusting for general and administrative expense, income associated with property management performed by Piedmont for other organizations and other income or expense items for the Company, such as interest income from loan investments or costs from the pursuit of non-consummated transactions. The Company may present this measure on an accrual basis or a cash basis. When presented on a cash basis, the effects of non-cash general reserve for uncollectible accounts, straight lined rents and fair value lease revenue are also eliminated. Property NOI is a non-GAAP financial measure and should not be viewed as an alternative to net income calculated in accordance with GAAP as a measurement of the Company’s operating performance. The Company believes that Property NOI is helpful to investors as a supplemental comparative performance measure of income generated by its properties alone without the administrative overhead of the Company. Other REITs may not define Property NOI in the same manner as the Company; therefore, the Company’s computation of Property NOI may not be comparable to that of other REITs. |
Same Store Net Operating Income ("Same Store NOI"): The Company calculates Same Store NOI as Property NOI attributable to the properties for which the following criteria were met during the entire span of the current and prior year reporting periods: (i) they were owned, (ii) they were not under development / redevelopment, and (iii) none of the operating expenses for which were capitalized. Same Store NOI also excludes amounts attributable to land assets. The Company may present this measure on an accrual basis or a cash basis. Same Store NOI is a non-GAAP financial measure and should not be viewed as an alternative to net income calculated in accordance with GAAP as a measurement of the Company’s operating performance. The Company believes that Same Store NOI is helpful to investors as a supplemental comparative performance measure of the income generated from the same group of properties from one period to the next. Other REITs may not define Same Store NOI in the same manner as the Company; therefore, the Company’s computation of Same Store NOI may not be comparable to that of other REITs. |
Same Store Properties: Same Store Properties is defined as those properties for which the following criteria were met during the entire span of the current and prior year reporting periods: (i) they were owned, (ii) they were not under development / redevelopment, and (iii) none of the operating expenses for which were capitalized. Same Store Properties excludes land assets. |
Total Gross Assets: Total Gross Assets is defined as total assets with the add-back of accumulated depreciation and accumulated amortization related to real estate assets and accumulated amortization related to deferred lease costs. |
Total Gross Real Estate Assets: Total Gross Real Estate Assets is defined as total real estate assets with the add-back of accumulated depreciation and accumulated amortization related to real estate assets. |
Piedmont Office Realty Trust, Inc.
Research Coverage
Equity Research Coverage | | | | | | | | | | | |
| Dylan Burzinski | Anthony Paolone, CFA | Nicholas Thillman | Michael Lewis, CFA |
| Green Street Advisors | JP Morgan | Robert W. Baird & Co. | Truist Securities |
| 100 Bayview Circle, Suite 400 | 383 Madison Avenue | 777 East Wisconsin Avenue | 711 Fifth Avenue, 4th Floor |
| Newport Beach, CA 92660 | 32nd Floor | Milwaukee, WI 53202 | New York, NY 10022 |
| Phone: (949) 640-8780 | New York, NY 10179 | Phone: (414) 298-5053 | Phone: (212) 319-5659 |
| Phone: (212) 622-6682 | | |
| | | |
| | | |
| | | |
| | | |
| | | |
| | | |
| | | |
| | | |
| | | |
| | | |
| | | |
Fixed Income Research Coverage | | | | | | | | |
| Mark S. Streeter, CFA | | |
| JP Morgan | | |
| 383 Madison Avenue | | |
| 3rd Floor | | |
| New York, NY 10179 | | |
| Phone: (212) 834-5086 | | |
| | |
| | |
Piedmont Office Realty Trust, Inc.
Funds From Operations, Core Funds From Operations, and Adjusted Funds From Operations Reconciliations
Unaudited (in thousands)
| | | | | | | | | | | | | | | | | | | | | | | | | | | | | | | | | | | | | | | | | |
| Three Months Ended | | Six Months Ended |
| 6/30/2023 | | 3/31/2023 | | 12/31/2022 | | 9/30/2022 | | 6/30/2022 | | 6/30/2023 | | 6/30/2022 |
| | | | | | | | | | | | | |
| GAAP net income / (loss) applicable to common stock | $ | (1,988) | | | $ | (1,367) | | | $ | 75,569 | | | $ | 3,331 | | | $ | 7,966 | | | $ | (3,355) | | | $ | 67,930 | |
| Depreciation | 36,200 | | | 35,690 | | | 34,587 | | | 34,743 | | | 32,187 | | | 71,890 | | | 63,519 | |
| Amortization | 21,323 | | | 22,021 | | | 23,905 | | | 23,278 | | | 21,468 | | | 43,344 | | | 43,708 | |
| Impairment loss | — | | | — | | | 25,981 | | | — | | | — | | | — | | | — | |
| Loss / (gain) on sale of properties | — | | | — | | | (101,055) | | | — | | | (1) | | | — | | | (50,674) | |
| | | | | | | | | | | | | |
| NAREIT funds from operations applicable to common stock | 55,535 | | | 56,344 | | | 58,987 | | | 61,352 | | | 61,620 | | | 111,879 | | | 124,483 | |
| Adjustments: | | | | | | | | | | | | | |
| Severance costs associated with fourth quarter 2022 management reorganization | — | | | — | | | 2,248 | | | — | | | — | | | — | | | — | |
| | | | | | | | | | | | | |
| | | | | | | | | | | | | |
| | | | | | | | | | | | | |
| Core funds from operations applicable to common stock | 55,535 | | | 56,344 | | | 61,235 | | | 61,352 | | | 61,620 | | | 111,879 | | | 124,483 | |
| Adjustments: | | | | | | | | | | | | | |
| Amortization of debt issuance costs and discounts on debt | 1,312 | | | 1,239 | | | 926 | | | 922 | | | 763 | | | 2,551 | | | 1,541 | |
| Depreciation of non real estate assets | 264 | | | 97 | | | 191 | | | 189 | | | 175 | | | 361 | | | 348 | |
| Straight-line effects of lease revenue | (2,755) | | | (3,187) | | | (2,356) | | | (3,268) | | | (3,029) | | | (5,942) | | | (5,606) | |
| Stock-based compensation adjustments | 2,095 | | | 183 | | | 1,717 | | | 1,950 | | | 1,718 | | | 2,278 | | | 1,166 | |
| Amortization of lease-related intangibles | (3,119) | | | (3,412) | | | (3,713) | | | (3,542) | | | (3,009) | | | (6,531) | | | (6,171) | |
| | | | | | | | | | | | | |
| Non-incremental capital expenditures | | | | | | | | | | | | | |
| Building/Construction/Development | (2,914) | | | (4,752) | | | (3,967) | | | (6,897) | | | (4,748) | | | (7,666) | | | (8,254) | |
| Tenant Improvements | (2,228) | | | (5,699) | | | (2,934) | | | (3,146) | | | (3,402) | | | (7,927) | | | (14,908) | |
| Leasing Costs | (3,746) | | | (4,021) | | | (4,017) | | | (4,078) | | | (1,188) | | | (7,767) | | | (5,123) | |
| | | | | | | | | | | | | |
| Adjusted funds from operations applicable to common stock | $ | 44,444 | | | $ | 36,792 | | | $ | 47,082 | | | $ | 43,482 | | | $ | 48,900 | | | $ | 81,236 | | | $ | 87,476 | |
Piedmont Office Realty Trust, Inc.
Same Store Net Operating Income (Cash Basis)
Unaudited (in thousands)
| | | | | | | | | | | | | | | | | | | | | | | | | | | | | | | | | | | | | | | | | |
| Three Months Ended | | Six Months Ended |
| 6/30/2023 | | 3/31/2023 | | 12/31/2022 | | 9/30/2022 | | 6/30/2022 | | 6/30/2023 | | 6/30/2022 |
| | | | | | | | | | | | | |
| Net income / (loss) applicable to Piedmont | $ | (1,988) | | | $ | (1,367) | | | $ | 75,569 | | | $ | 3,331 | | | $ | 7,966 | | | $ | (3,355) | | | $ | 67,930 | |
| Net income / (loss) applicable to noncontrolling interest | 3 | | | 3 | | | 1 | | | — | | | (1) | | | 6 | | | (1) | |
| Interest expense | 23,389 | | | 22,077 | | | 20,739 | | | 17,244 | | | 13,775 | | | 45,466 | | | 27,673 | |
| Depreciation | 36,464 | | | 35,787 | | | 34,778 | | | 34,931 | | | 32,362 | | | 72,251 | | | 63,867 | |
| Amortization | 21,323 | | | 22,021 | | | 23,905 | | | 23,278 | | | 21,468 | | | 43,344 | | | 43,708 | |
| Depreciation and amortization attributable to noncontrolling interests | 21 | | | 20 | | | 20 | | | 21 | | | 22 | | | 41 | | | 44 | |
| Impairment loss | — | | | — | | | 25,981 | | | — | | | — | | | — | | | — | |
| (Gain) / loss on sale of properties | — | | | — | | | (101,055) | | | — | | | (1) | | | — | | | (50,674) | |
| | | | | | | | | | | | | |
| EBITDAre | 79,212 | | | 78,541 | | | 79,938 | | | 78,805 | | | 75,591 | | | 157,753 | | | 152,547 | |
| Severance costs associated with fourth quarter 2022 management reorganization | — | | | — | | | 2,248 | | | — | | | — | | | — | | | — | |
| | | | | | | | | | | | | |
| | | | | | | | | | | | | |
| | | | | | | | | | | | | |
| Core EBITDA | 79,212 | | | 78,541 | | | 82,186 | | | 78,805 | | | 75,591 | | | 157,753 | | | 152,547 | |
| General & administrative expenses | 7,279 | | | 7,691 | | | 5,668 | | | 6,590 | | | 7,027 | | | 14,970 | | | 14,622 | |
| Non-cash general reserve for uncollectible accounts | — | | | (400) | | | (1,000) | | | (1,000) | | | (1,000) | | | (400) | | | (1,000) | |
| Management fee revenue | (254) | | | (293) | | | (261) | | | (177) | | | (203) | | | (546) | | | (565) | |
| Other (income) / expense | (1,571) | | | (1,440) | | | (193) | | | (119) | | | 273 | | | (3,012) | | | (1,536) | |
| Straight-line effects of lease revenue | (2,755) | | | (3,187) | | | (2,356) | | | (3,268) | | | (3,029) | | | (5,942) | | | (5,606) | |
| Straight-line effects of lease revenue attributable to noncontrolling interests | (1) | | | (4) | | | (4) | | | (4) | | | (1) | | | (6) | | | (1) | |
| Amortization of lease-related intangibles | (3,119) | | | (3,412) | | | (3,713) | | | (3,542) | | | (3,009) | | | (6,531) | | | (6,171) | |
| Property net operating income (cash basis) | 78,791 | | | 77,496 | | | 80,327 | | | 77,285 | | | 75,649 | | | 156,286 | | | 152,290 | |
| Deduct net operating (income) / loss from: | | | | | | | | | | | | | |
| Acquisitions | (5,770) | | | (5,073) | | | (5,313) | | | (2,867) | | | — | | | (10,843) | | | — | |
| Dispositions | 48 | | | 25 | | | (2,343) | | | (2,587) | | | (2,704) | | | 74 | | | (5,785) | |
| Other investments | 173 | | | 164 | | | 224 | | | 211 | | | 138 | | | 337 | | | 328 | |
| Same store net operating income (cash basis) | $ | 73,242 | | | $ | 72,612 | | | $ | 72,895 | | | $ | 72,042 | | | $ | 73,083 | | | $ | 145,854 | | | $ | 146,833 | |
Piedmont Office Realty Trust, Inc.
In-Service Portfolio Detail (1)
As of June 30, 2023
(in thousands)
| | | | | | | | | | | | | | | | | | | | | | | | | | | | | | | | | |
| | | | | | | | | | | |
| Project Name | Energy Star Certification | LEED Certification | BOMA 360 Certification | Percent Ownership | Number of Buildings | Rentable Square Footage Owned | Percent Leased | Commenced Leased Percentage | Economic Leased Percentage (2) | Annualized Lease Revenues | |
| | | | | | | | | | | |
| Atlanta | | | | | | | | | | | |
| 999 Peachtree Street | P | P | P | 100.0% | 1 | 624 | 86.9 | % | 79.8 | % | 77.9 | % | 21,351 | | |
| 1180 Peachtree Street | P | P | P | 100.0% | 1 | 691 | 96.1 | % | 95.5 | % | 95.2 | % | 33,406 | | |
| Galleria | P | P | P | 100.0% | 5 | 2,159 | 84.7 | % | 77.7 | % | 69.5 | % | 60,408 | | |
| Glenridge Highlands | P | P | P | 100.0% | 2 | 714 | 89.8 | % | 89.8 | % | 86.1 | % | 23,531 | | |
| 1155 Perimeter Center West | P | P | P | 100.0% | 1 | 377 | 87.3 | % | 85.7 | % | 83.3 | % | 13,203 | | |
| The Medici | P | | P | 100.0% | 1 | 156 | 92.3 | % | 92.3 | % | 84.6 | % | 5,642 | | |
| Metropolitan Area Subtotal / Weighted Average | | | | | 11 | 4,721 | 87.9 | % | 83.5 | % | 78.5 | % | 157,541 | | |
| Boston | | | | | | | | | | | |
| 5 Wall Street | P | P | P | 100.0% | 1 | 182 | 100.0 | % | 100.0 | % | 100.0 | % | 7,468 | | |
| Wayside Office Park | P | | P | 100.0% | 2 | 473 | 96.8 | % | 89.9 | % | 89.9 | % | 18,029 | | |
| 25 Burlington Mall Road | P | | P | 100.0% | 1 | 291 | 54.6 | % | 54.6 | % | 51.5 | % | 6,817 | | |
| 80 & 90 Central Street | P | | P | 100.0% | 2 | 324 | 87.0 | % | 79.0 | % | 70.7 | % | 6,839 | | |
| Metropolitan Area Subtotal / Weighted Average | | | | | 6 | 1,270 | 85.1 | % | 80.5 | % | 77.6 | % | 39,153 | | |
| Dallas | | | | | | | | | | | |
| Galleria Office Towers | P | P | P | 100.0% | 3 | 1,439 | 91.6 | % | 86.9 | % | 86.5 | % | 57,264 | | |
| One Lincoln Park | P | P | P | 100.0% | 1 | 257 | 58.4 | % | 58.0 | % | 58.0 | % | 6,483 | | |
| Park Place on Turtle Creek | P | | P | 100.0% | 1 | 177 | 83.1 | % | 78.0 | % | 78.0 | % | 7,316 | | |
| 6565 North MacArthur Boulevard | P | P | P | 100.0% | 1 | 255 | 80.0 | % | 80.0 | % | 78.4 | % | 6,441 | | |
| 750 West John Carpenter Freeway | P | P | P | 100.0% | 1 | 315 | 46.3 | % | 46.3 | % | 43.5 | % | 4,714 | | |
| 6011, 6021 & 6031 Connection Drive | P | | P | 100.0% | 3 | 605 | 91.9 | % | 91.9 | % | 80.5 | % | 19,098 | | |
| Las Colinas Corporate Center | P | | P | 100.0% | 3 | 486 | 69.8 | % | 54.5 | % | 45.9 | % | 11,303 | | |
| Metropolitan Area Subtotal / Weighted Average | | | | | 13 | 3,534 | 80.9 | % | 76.7 | % | 73.0 | % | 112,619 | | |
| Minneapolis | | | | | | | | | | | |
| US Bancorp Center | P | P | P | 100.0% | 1 | 937 | 90.1 | % | 89.0 | % | 88.9 | % | 33,514 | | |
| One & Two Meridian Crossings | P | | P | 100.0% | 2 | 384 | 93.2 | % | 93.2 | % | 93.2 | % | 12,132 | | |
| Crescent Ridge II | P | P | P | 100.0% | 1 | 301 | 84.7 | % | 80.1 | % | 77.4 | % | 9,089 | | |
| Norman Pointe I | P | | P | 100.0% | 1 | 214 | 85.0 | % | 85.0 | % | 84.1 | % | 6,110 | | |
| 9320 Excelsior Boulevard | | | | 100.0% | 1 | 268 | 100.0 | % | 100.0 | % | 100.0 | % | 5,625 | | |
| Metropolitan Area Subtotal / Weighted Average | | | | | 6 | 2,104 | 90.6 | % | 89.5 | % | 89.0 | % | 66,470 | | |
| New York | | | | | | | | | | | |
| 60 Broad Street | | | P | 100.0% | 1 | 1,045 | 87.3 | % | 86.4 | % | 86.3 | % | 48,222 | | |
| Metropolitan Area Subtotal / Weighted Average | | | | | 1 | 1,045 | 87.3 | % | 86.4 | % | 86.3 | % | 48,222 | | |
| | | | | | | | | | | |
| | | | | | | | | | | | | | | | | | | | | | | | | | | | | | | | | |
| | | | | | | | | | | |
| Project Name | Energy Star Certification | LEED Certification | BOMA 360 Certification | Percent Ownership | Number of Buildings | Rentable Square Footage Owned | Percent Leased | Commenced Leased Percentage | Economic Leased Percentage (2) | Annualized Lease Revenues | |
| | | | | | | | | | | |
| Orlando | | | | | | | | | | | |
| 200 South Orange Avenue | P | P | P | 100.0% | 1 | 653 | 90.0 | % | 82.4 | % | 71.7 | % | 22,333 | | |
| CNL Center I & II | P | | P | 99.0% | 2 | 620 | 93.2 | % | 93.2 | % | 93.2 | % | 23,552 | | |
| 501 West Church Street | | | | 100.0% | 1 | 182 | 100.0 | % | 100.0 | % | 100.0 | % | 1,741 | | |
| 400 & 500 TownPark Commons | P | P | P | 100.0% | 2 | 309 | 100.0 | % | 100.0 | % | 99.4 | % | 10,400 | | |
| Metropolitan Area Subtotal / Weighted Average | | | | | 6 | 1,764 | 93.9 | % | 91.1 | % | 87.0 | % | 58,026 | | |
| Washington, D.C. | | | | | | | | | | | |
| 4250 North Fairfax Drive | P | P | P | 100.0% | 1 | 308 | 87.3 | % | 86.0 | % | 86.0 | % | 14,087 | | |
| Arlington Gateway | P | P | P | 100.0% | 1 | 329 | 79.3 | % | 75.4 | % | 69.6 | % | 13,309 | | |
| 3100 Clarendon Boulevard | P | P | P | 100.0% | 1 | 261 | 82.4 | % | 82.4 | % | 82.0 | % | 9,587 | | |
| 1201 & 1225 Eye Street | P | P | P | (3) | 2 | 496 | 68.3 | % | 68.3 | % | 66.9 | % | 21,002 | | |
| 400 Virginia Avenue | P | P | P | 100.0% | 1 | 226 | 68.6 | % | 68.6 | % | 68.6 | % | 7,969 | | |
| Metropolitan Area Subtotal / Weighted Average | | | | | 6 | 1,620 | 76.5 | % | 75.4 | % | 73.8 | % | 65,954 | | |
| Other | | | | | | | | | | | |
| Enclave Place | P | P | P | 100.0% | 1 | 301 | 100.0 | % | 100.0 | % | 100.0 | % | 11,397 | | |
| 1430 Enclave Parkway | P | P | P | 100.0% | 1 | 313 | 82.7 | % | 82.7 | % | 81.8 | % | 8,182 | | |
| Metropolitan Area Subtotal / Weighted Average | | | | | 2 | 614 | 91.2 | % | 91.2 | % | 90.7 | % | 19,579 | | |
| | | | | | | | | | | |
| Grand Total | | | | | 51 | 16,672 | 86.2 | % | 83.1 | % | 80.0 | % | 567,564 | | |
| | | | | | | | | | | |
| | | | | |
| (1) | This schedule includes information for Piedmont's in-service portfolio of properties only. Information on investments excluded from this schedule can be found on page 32. |
| (2) | Economic leased percentage excludes the square footage associated with executed but not commenced leases for currently vacant spaces and the square footage associated with tenants receiving rental abatements (after proportional adjustments for tenants receiving only partial rental abatements). |
| (3) | Piedmont owns 98.6% of 1201 Eye Street and 98.1% of 1225 Eye Street; however, it is entitled to 100% of the cash flows for each asset pursuant to the terms of each property ownership entity's joint venture agreement. |
Piedmont Office Realty Trust, Inc.
Major Leases Not Yet Commenced and Major Abatements
As of June 30, 2023, the Company had approximately 1.3 million square feet of executed leases for vacant space yet to commence or under rental abatement.
Presented below is a schedule of uncommenced new leases greater than 50,000 square feet and their anticipated commencement dates. Lease renewals are excluded from this schedule.
| | | | | | | | | | | | | | | | | | | | |
| Tenant | Property | Market | Square Feet
Leased | Space Status | Estimated
Commencement
Date | New /
Expansion |
| OneDigital | Galleria 300 | Atlanta | 70,445 | 23,506 SF Vacant | 23,506 SF Q1 2024
46,939 SF Q3 2025 | New |
| Javelin Energy Partners | Las Colinas Corporate Center I | Dallas | 70,053 | Vacant | Q1 2024 | New |
| Kimley-Horn and Associates | 200 and 222 South Orange Avenue | Orlando | 61,348 | Vacant | Q4 2023 | New |
| Undisclosed Tenant | One Galleria Tower | Dallas | 58,297 | Vacant | Q4 2023 | New |
| FirstKey Homes | Galleria 600 | Atlanta | 51,442 | Vacant | Q3 2024 | New |
Presented below is a schedule of leases with abatements of 50,000 square feet or greater that either were under abatement as of June 30, 2023 or will be under abatement within the next twelve months.
| | | | | | | | | | | | | | | | | | | | |
| Tenant | Property | Market | Abated Square Feet | Lease Commencement Date | Remaining Abatement Schedule | Lease Expiration |
| Builders FirstSource | 6031 Connection Drive | Dallas | 55,456 | Q3 2022 | July 2022 through June 2023 | Q2 2035 |
| Brand Industrial Services | Galleria 600 | Atlanta | 50,380 | Q1 2023 | Early February 2023 through Early February 2024; March 2025 | Q3 2034 |
| Kimley-Horn and Associates | 200 and 222 South Orange Avenue | Orlando | 61,348 | Q4 2023 | November 2023 through October 2024 | Q4 2034 |
| Institute for Justice | Arlington Gateway | Washington, DC | 58,285 | Q1 2024 | January 2024 through June 2025 | Q2 2037 |
| Undisclosed Tenant | One Galleria Tower | Dallas | 50,130 | Q4 2023 | January 2024 through June 2025 | Q2 2035 |
| OneDigital | Galleria 300 | Atlanta | 70,445 | Q1 2024 | March 2024 through February 2025 (23,506 SF); September 2025 through August 2026 (46,939 SF) | Q4 2036 |
| Javelin Energy Partners | Las Colinas Corporate Center I | Dallas | 70,053 | Q1 2024 | March 2024 through February 2025 | Q1 2035 |
Piedmont Office Realty Trust, Inc.
Supplemental Operating & Financial Data
Risks, Uncertainties and Limitations
Certain statements contained in this supplemental package constitute forward-looking statements within the meaning of Section 27A of the Securities Act of 1933, as amended (the “Securities Act”) and Section 21E of the Securities Exchange Act of 1934, as amended (the “Exchange Act”). We intend for all such forward-looking statements to be covered by the safe-harbor provisions for forward-looking statements contained in Section 27A of the Securities Act and Section 21E of the Exchange Act, as applicable. Such information is subject to certain known and unknown risks and uncertainties, which could cause actual results to differ materially from those anticipated. Therefore, such statements are not intended to be a guarantee of our performance in future periods. Such forward-looking statements can generally be identified by our use of forward-looking terminology such as “may,” “will,” “expect,” “intend,” “anticipate,” "estimate," “believe,” “continue” or similar words or phrases that indicate predictions of future events or trends or that do not relate solely to historical matters. Examples of such statements in this supplemental package include: the Company's estimated range of Net Income/(Loss), Depreciation, Amortization, Core FFO and Core FFO per diluted share, leasing activity, leased percentage, and estimated increase in Same Store NOI for the year ending December 31, 2023. These statements are based on beliefs and assumptions of Piedmont’s management, which in turn are based on information available at the time the statements are made.
Important assumptions relating to the forward-looking statements include, among others, assumptions regarding the demand for office space in the markets in which we operate, competitive conditions, and general economic conditions. These assumptions could prove inaccurate. The forward-looking statements also involve certain known and unknown risks and uncertainties, which could cause our actual results and expectations to differ materially from those described in our forward-looking statements. Many of these factors are beyond our ability to control or predict. Such factors include, but are not limited to, the following: economic, regulatory, socio-economic (including work from home), technological (e.g. Metaverse, Zoom, etc.), and other changes that impact the real estate market generally, the office sector or the patterns of use of commercial office space in general, or the markets where we primarily operate or have high concentrations of Annualized Lease Revenue; the impact of competition on our efforts to renew existing leases or re-let space on terms similar to existing leases; lease terminations, lease defaults, lease contractions, or changes in the financial condition of our tenants, particularly by one of our large lead tenants; impairment charges on our long-lived assets or goodwill resulting therefrom; the success of our real estate strategies and investment objectives, including our ability to implement successful redevelopment and development strategies or identify and consummate suitable acquisitions and divestitures; the illiquidity of real estate investments, including economic changes, such as rising interest rates, which could impact the number of buyers/sellers of our target properties, and regulatory restrictions to which real estate investment trusts ("REITs") are subject and the resulting impediment on our ability to quickly respond to adverse changes in the performance of our properties; the risks and uncertainties associated with our acquisition and disposition of properties, many of which risks and uncertainties may not be known at the time of acquisition or disposition; development and construction delays, including the potential of supply chain disruptions, and resultant increased costs and risks; future acts of terrorism, civil unrest, or armed hostilities in any of the major metropolitan areas in which we own properties, or future cybersecurity attacks against any of our properties or our tenants; risks related to the occurrence of cyber incidents, or a deficiency in our cybersecurity, which could negatively impact our business by causing a disruption to our operations, a compromise or corruption of our confidential information, and/or damage to our business relationships; costs of complying with governmental laws and regulations, including environmental standards imposed on office building owners; uninsured losses or losses in excess of our insurance coverage, and our inability to obtain adequate insurance coverage at a reasonable cost; additional risks and costs associated with directly managing properties occupied by government tenants, such as potential changes in the political environment, a reduction in federal or state funding of our governmental tenants, or an increased risk of default by government tenants during periods in which state or federal governments are shut down or on furlough; significant price and volume fluctuations in the public markets, including on the exchange which we listed our common stock; risks associated with incurring mortgage and other indebtedness, including changing capital reserve requirements on our lenders and rapidly rising interest rates in the public bond markets, could impact our ability to finance properties or refinance existing debt or significantly increase operating/financing costs; a downgrade in our credit rating could materially adversely affect our business and financial condition; the effect of future offerings of debt or equity securities on the value of our common stock; additional risks and costs associated with inflation and continuing increases in the rate of inflation, including the possibility of a recession that could negatively impact our operations and the operations of our tenants and their ability to pay rent; uncertainties associated with environmental and regulatory matters; changes in the financial condition of our tenants directly or indirectly resulting from geopolitical developments that could negatively affect important supply chains and international trade, the termination or threatened termination of existing international trade agreements, or the implementation of tariffs or retaliatory tariffs on imported or exported goods; the effect of any litigation to which we are, or may become, subject; additional risks and costs associated with owning properties occupied by tenants in particular industries, such as oil and gas, hospitality, travel, co-working, etc., including risks of default during start-up and during economic downturns; changes in tax laws impacting REITs and real estate in general, as well as our ability to continue to qualify as a REIT under the Internal Revenue Code of 1986, as amended (the "Code"), or other tax law changes which may adversely affect our stockholders; the future effectiveness of our internal controls and procedures; actual or threatened public health epidemics or outbreaks, such as the COVID-19 pandemic, as well as governmental and private measures taken to combat such health crises, could have a material adverse effect on our business operations and financial results; the adequacy of our general reserve related to tenant lease-related assets or the establishment of any other reserve in the future; and other factors, including the risk factors discussed under Item 1A. of our Annual Report on Form 10-K for the year ended December 31, 2022 and Quarterly Report on Form 10-Q for the quarters ended March 31, 2023 and June 30, 2023.
Readers are cautioned not to place undue reliance on these forward-looking statements, which speak only as of the date of this supplemental report. We cannot guarantee the accuracy of any such forward-looking statements contained in this supplemental report, and we do not intend to and undertake no obligations to publicly update or revise any forward-looking statements, whether as a result of new information, future events, or otherwise.