 © 2007 Piedmont Office Realty Trust, Inc. March 2009 COMPANY HIGHLIGHTS Exhibit 99.2 |
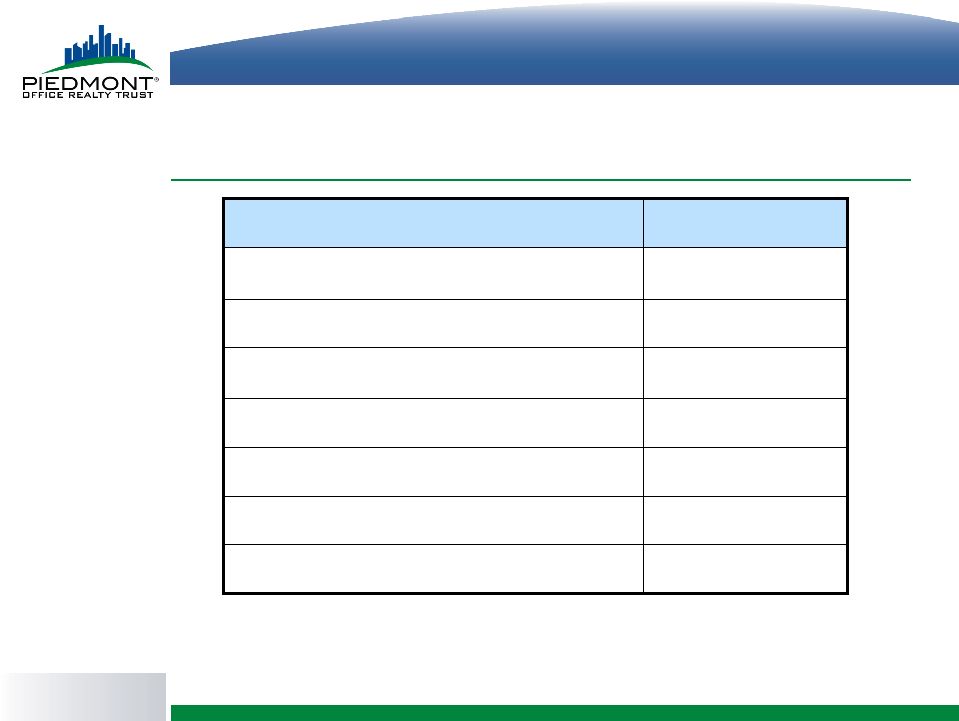 © 2007 Piedmont Office Realty Trust, Inc. Portfolio Characteristics 92% % Leased 34% Leverage Ratio (NAV basis) 85% % Leased – Office Building Industry Average 63% Leverage Ratio – Publicly Traded REIT Office Average 4 6 Weighted Average Lease Term Remaining (years) 76 # of Properties 21,012 Square Feet (in thousands) As of December 31, 2008 1 Excludes eight unconsolidated joint-venture properties 2 Source: Jones Lang LaSalle North America Office Report Q4 2008 3 Calculated as total liabilities / current value of assets 4 Source: Green Street Advisors, Inc. March 18, 2009 1 1 1 1 2 3 |
 © 2007 Piedmont Office Realty Trust, Inc. Tenant Base Tenant Name (Ranked by % of AGR) Annualized Gross Rental Revenues ($000's) Percentage of Annualized Gross Rental Revenues S&P Credit Rating US Government (11 agencies) 61,823 11.4% AAA BP Corporation 25,565 4.7% AA Leo Burnett (Publicis)¹ 20,959 3.9% BBB+ State of New York 19,873 3.7% AA- Nestle 18,311 3.4% AA US Bancorp 17,311 3.2% AA Sanofi-Aventis 17,070 3.1% AA- Kirkland & Ellis² 15,775 2.9% N/A Independence Blue Cross 15,565 2.9% N/A Winston & Strawn³ 14,468 2.7% N/A Zurich American 10,395 1.9% AA- DDB Needham (Omnicom) 4 10,065 1.8% A- Shaw Facilities 9,514 1.7% BB+ Lockheed Martin 9,186 1.7% A- State Street Bank 8,694 1.6% AA Other 5 269,715 49.4% 544,289 100.0% Tenant diversification (as of December 31, 2008) Rating is for parent company, Publicis Groupe SA Kirkland & Ellis is ranked # 7 by The America Lawyer’s 2007 AmLaw 100 Rankings Winston & Strawn is ranked # 33 by The America Lawyer’s 2007 AmLaw 100 Rankings Rating is for parent company, Omnicom Group Includes leases which terminated effective December 31, 2008 4 1 2 3 5 |
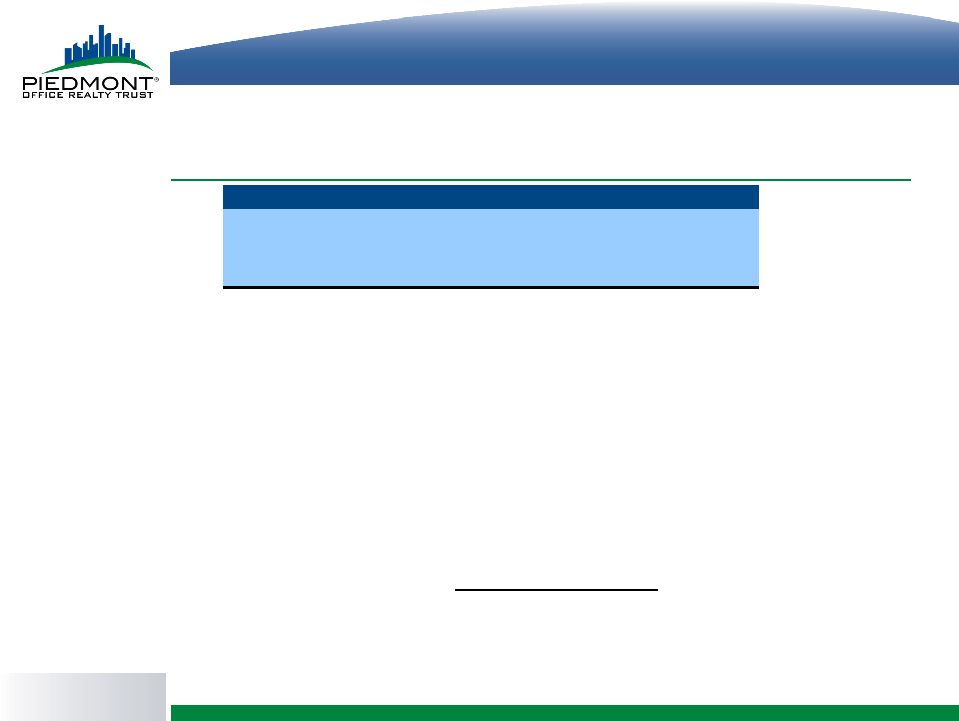
 © 2007 Piedmont Office Realty Trust, Inc. 25% 19% 16% 6% 6% 4% 4% 4% 3% 3% 2% 2% 1% 1% 4% 0.0% 2.0% 4.0% 6.0% 8.0% 10.0% 12.0% 14.0% 16.0% 18.0% 20.0% 22.0% 24.0% 26.0% 28.0% 30.0% Geographic Diversification Percentage of annualized gross rental revenues (as of December 31, 2008) |
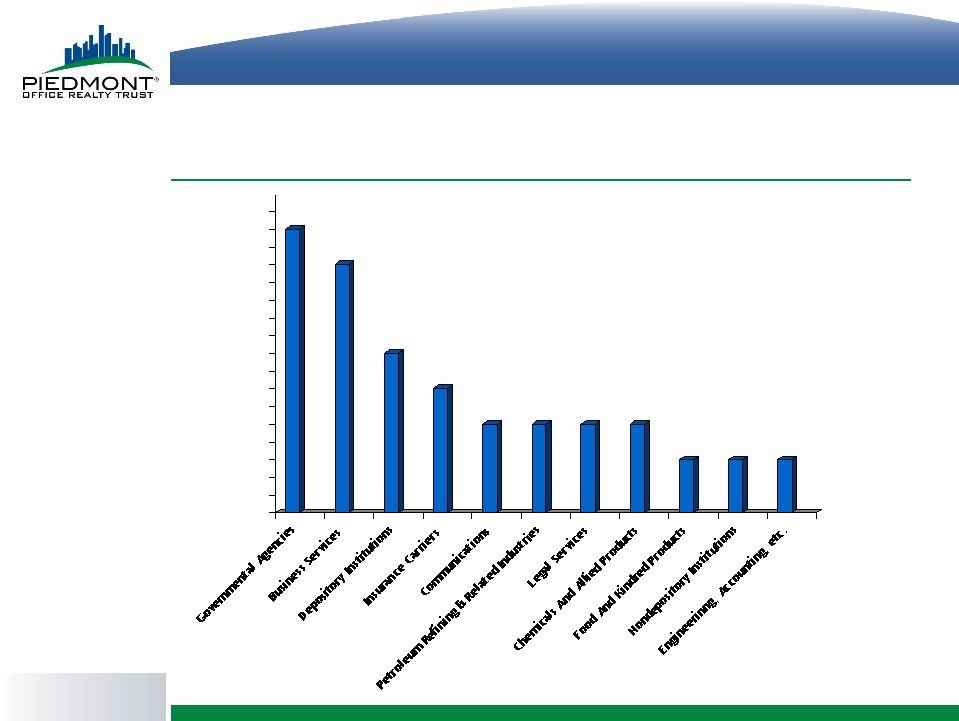 © 2007 Piedmont Office Realty Trust, Inc. Industry Diversification Percentage of annualized gross rental revenues (as of December 31, 2008) for all industries representing 3% or greater 16% 14% 9% 7% 5% 5% 5% 5% 3% 3% 0.0% 1.0% 2.0% 3.0% 4.0% 5.0% 6.0% 7.0% 8.0% 9.0% 10.0% 11.0% 12.0% 13.0% 14.0% 15.0% 16.0% 17.0% 18.0% 3% |
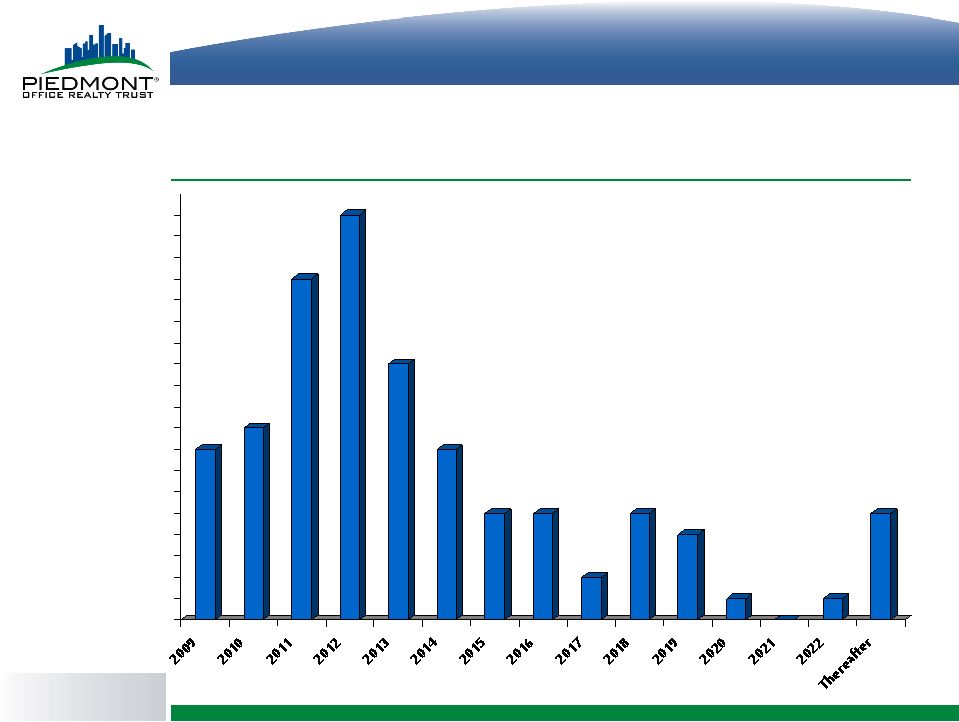 © 2007 Piedmont Office Realty Trust, Inc. 8% 9% 16% 19% 12% 8% 5% 5% 2% 5% 4% 1% 0% 1% 5% 0.0% 1.0% 2.0% 3.0% 4.0% 5.0% 6.0% 7.0% 8.0% 9.0% 10.0% 11.0% 12.0% 13.0% 14.0% 15.0% 16.0% 17.0% 18.0% 19.0% 20.0% Lease Expiration Schedule Percentage of annualized gross rental revenues (as of December 31, 2008) |
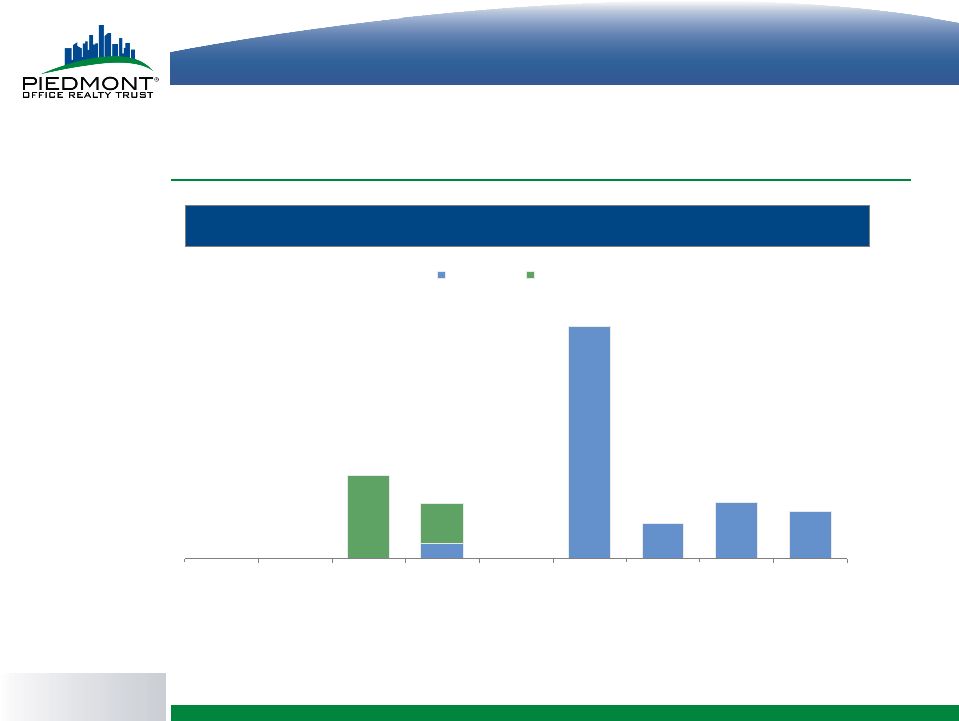 © 2007 Piedmont Office Realty Trust, Inc. Debt Maturities $695 $105 $168 $140 $45 $121 $250 2009 2010 2011 2012 2013 2014 2015 2016 2017 Secured debt Unsecured debt Debt maturity schedule as of December 31, 2008 ($ in millions) 1 1 1 The schedule assumes one-year extensions for the $250 Million Unsecured Term Loan and for the $500 Million Unsecured Line of Credit. |
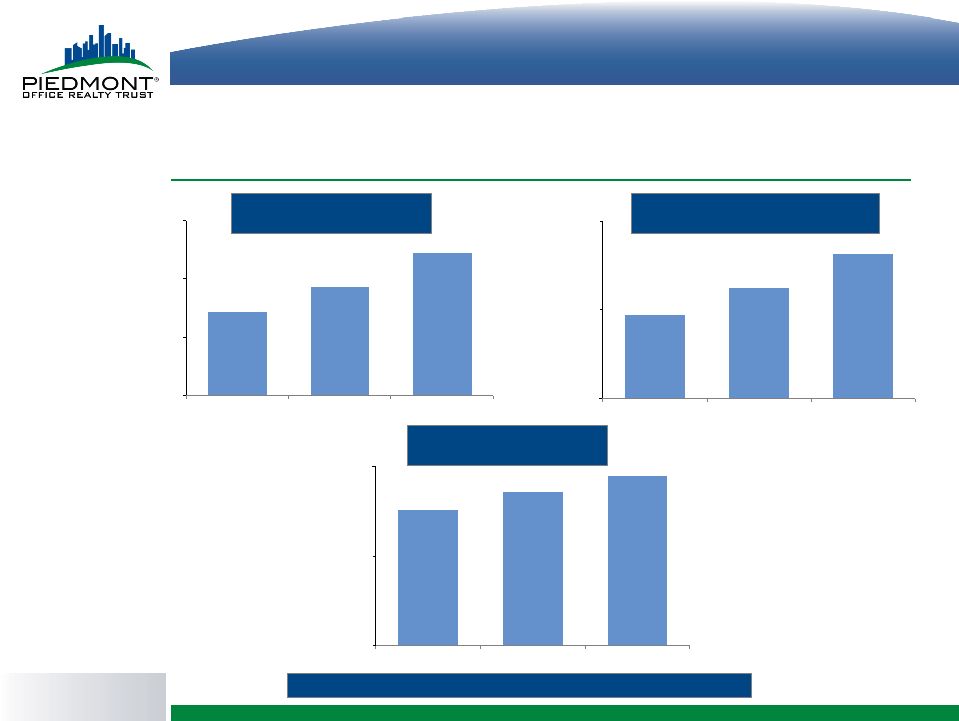 © 2007 Piedmont Office Realty Trust, Inc. Financial Highlights $593.2 $622.0 $571.4 $500.0 $550.0 $600.0 $650.0 2006 2007 2008 $285.5 $294.9 $275.8 $200.0 $250.0 $300.0 2006 2007 2008 Funds From Operations Revenues For years ended December 31, 2006, 2007 and 2008 (in millions) $112.1 $131.3 $96.9 $50.0 $100.0 $150.0 2006 2007 2008 Income From Continuing Operations 4% 5% 16% 17% 4% 3% |
 © 2007 Piedmont Office Realty Trust, Inc. Investor Payback on Initial Capital Outlay Percentage of Initial Outlay Paid Back Based on Investment Year 0% 10% 20% 30% 40% 50% 60% 70% 80% 90% 100% 2004 2003 2002 2001 2000 1999 Investment Year Note: Analysis assumes all shares are purchased on the first day of any given Investment Year. |