 © 2007 Piedmont Office Realty Trust, Inc. Investor Presentation Donald A. Miller, CFA President & CEO Exhibit 99.1 |
 © 2007 Piedmont Office Realty Trust, Inc. What Piedmont Wants You To Know Certain statements contained herein may be deemed to be forward-looking statements under the federal securities laws, and Piedmont intends that such forward- looking statements be subject to the safe-harbor provisions. All forward-looking statements are qualified in their entirety by this cautionary statement. Such statements generally can be identified by our use of words such as “may,” “will,” “can,” “intend,” “anticipate,” “estimate,” “think,” “continue,” or other similar words. Legislative, economic, and financial factors could cause actual results to vary materially from those expressed in forward-looking statements. • The points made in this presentation represent the intentions of Piedmont’s management team to focus on putting the investor first. • Uncertainties in the regulatory, economic, and real estate markets may adversely affect the company’s ability to meet it’s objectives. • If Real Estate initiatives cannot attract financially stable tenants, vacancies or defaults may occur that may reduce the portfolio’s return. • Properties that incur vacancies may be difficult to sell or re-lease. • Future financial performance of the company and the performance of real estate is difficult to predict. • Information is accurate at the time of the presentation; however, lease dates and the ability to meet our stated objectives are subject to change. • Data presented reflects Piedmont portfolio as of December 31, 2008. |
 © 2007 Piedmont Office Realty Trust, Inc. History • June 1998 – Active operations commenced • December 2003 – Closed fourth and final offering – $5.2bn of equity raised (including DRP proceeds) • April 2005 – 27 property portfolio sale – $189.5mm gain – $748.5mm special dividend • April 2007 – Advisor internalization – 76 employees of the former advisor became our employees • July 2007 – Received investment grade credit ratings – BBB from S&P and Baa3 from Moody’s (reaffirmed Feb. 2009) • August 2007 – Name change and new website – Changed name from Wells REIT to Piedmont Office Realty Trust – Launched new website (www.piedmontreit.com) • December 2007 – Liquidity event extension approved – Extended for up to 3 years from January 30, 2008 • Subject to SEC reporting/filing since inception |
 © 2007 Piedmont Office Realty Trust, Inc. Portfolio Characteristics 92% % Leased 1 34% Leverage Ratio (estimated NAV basis) 3 85% % Leased – Office Building Industry Average 2 63% Leverage Ratio – Publicly Traded REIT Office Average 4 6 Weighted Average Lease Term Remaining (years) 1 76 # of Properties 1 21,012 Square Feet (in thousands) 1 As of December 31, 2008 1 Excludes eight unconsolidated joint-venture properties 2 Source: Jones Lang LaSalle North America Office Report Q4 2008 3 Calculated as total liabilities / current value of assets 4 Source: Green Street Advisors, Inc. March 18, 2009 |
 © 2007 Piedmont Office Realty Trust, Inc. Senior Management Carroll A. (Bo) Reddic, IV EVP, Real Estate Operations Donald A. Miller, CFA President & CEO Robert E. Bowers CFO Raymond L. Owens EVP, Capital Markets Lisa M. Tyler Director, Human Resources Laura P. Moon Chief Accounting Officer Alison M. Mills Director, Risk Management |
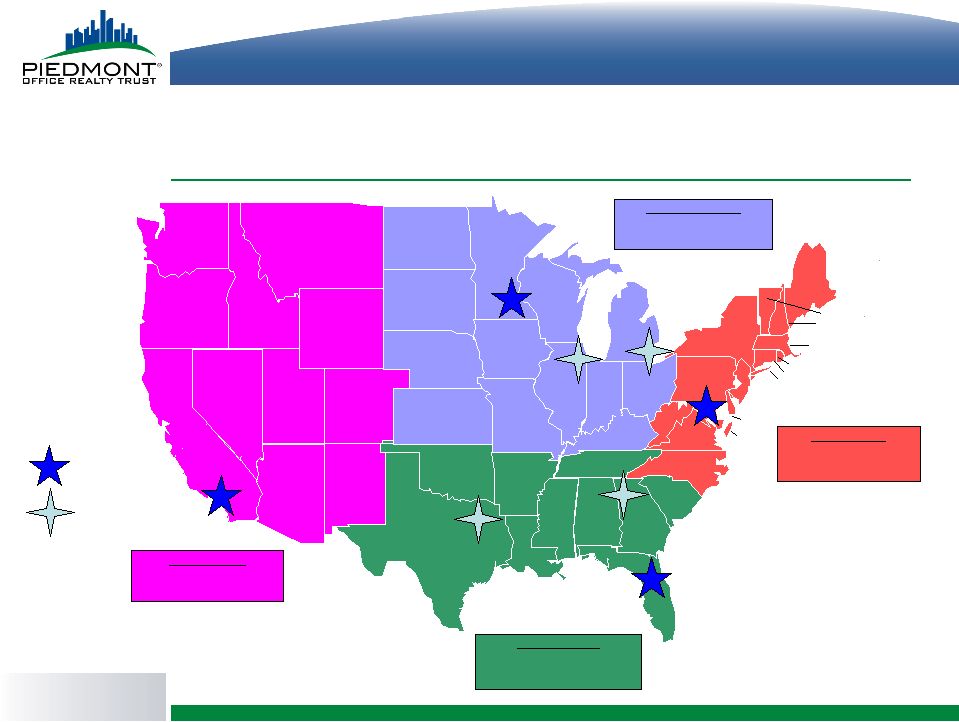 © 2007 Piedmont Office Realty Trust, Inc. Property Management Offices New Hampshire W. Virginia Maine Rhode Island Connecticut Manhattan / L.I. New Jersey Delaware Maryland D.C. Massachusetts Vermont New York Pennsylvania N.Carolina Virginia Washington Oregon California Nevada Utah Arizona Idaho Montana Wyoming Colorado New Mexico Tennessee Oklahoma Louisiana Missis- sippi Alabama Arkansas Georgia Florida Texas S. Carolina Nebraska South Dakota North Dakota Iowa Minnesota Wisconsin Kentucky Indiana Michigan Kansas Missouri Illinois Ohio Regional Office City Office SOUTH REGION Tampa 5.3 Million SF Managed MIDWEST REGION Minneapolis 5.9 Million SF Managed WEST REGION Los Angeles 2.9 Million SF Managed EAST REGION Washington DC 4.0 Million SF Managed |
 © 2007 Piedmont Office Realty Trust, Inc. Foundations of Conservative Real Estate Investment Strategy • High-quality properties/stable income stream • Real estate diversification • Lower leverage |
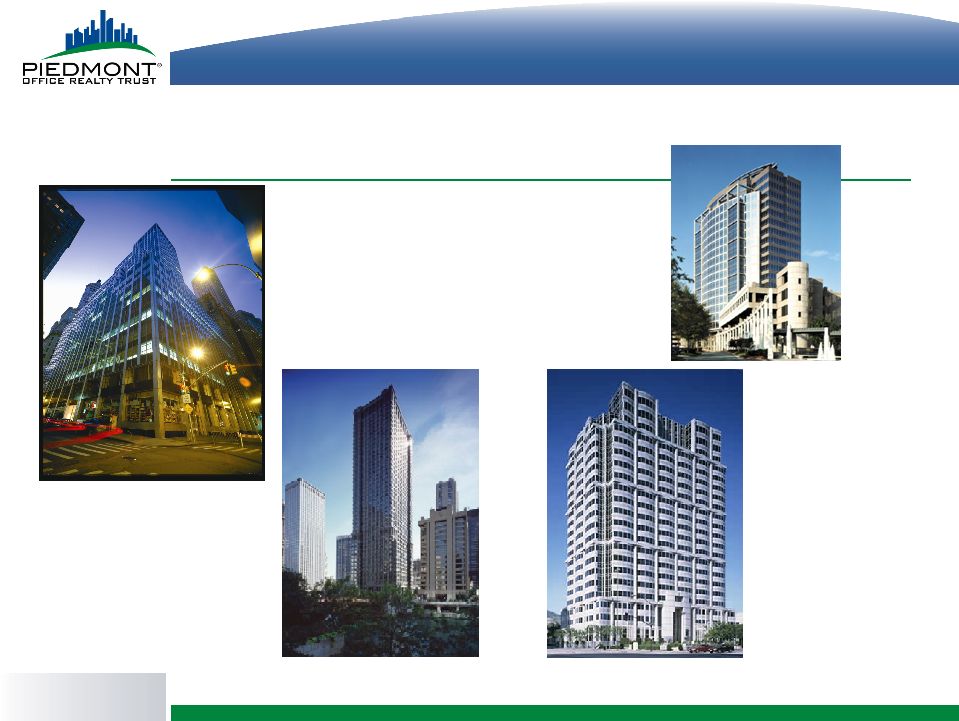
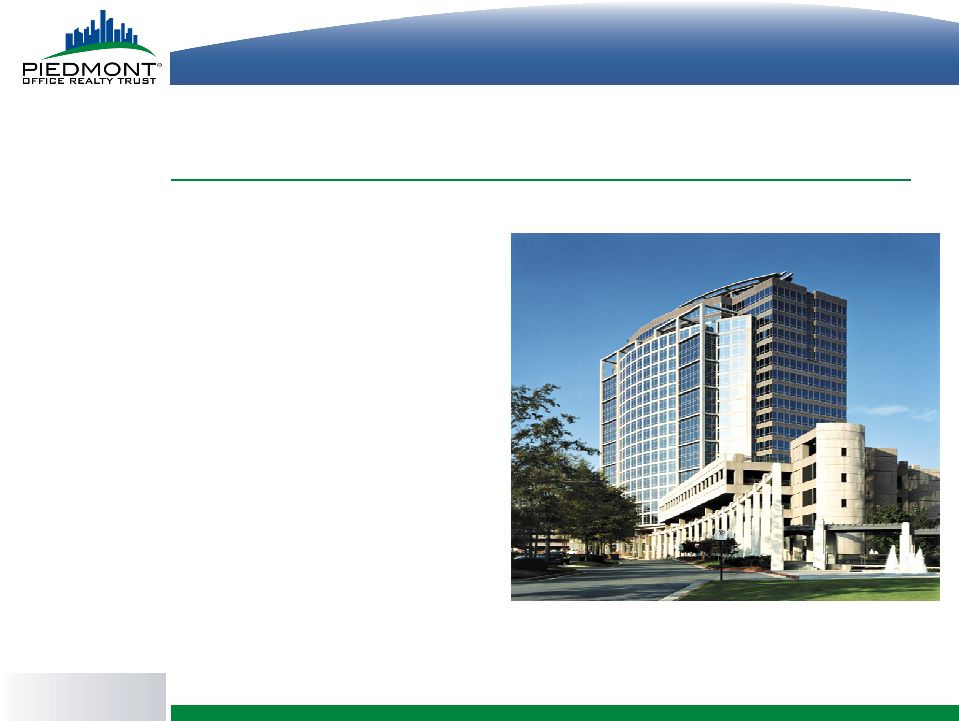
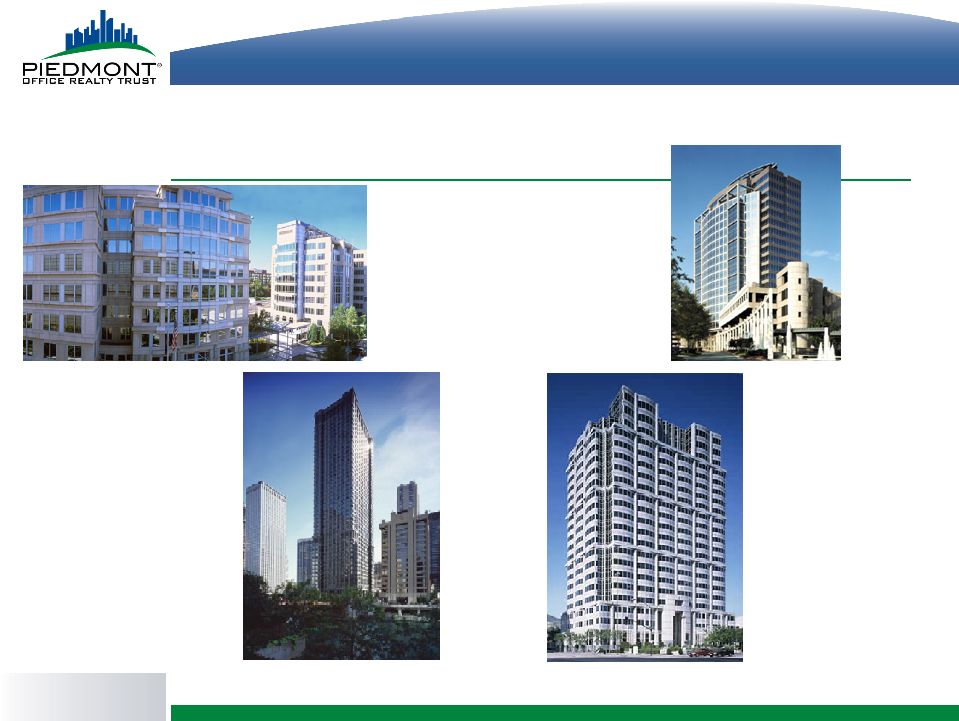 © 2007 Piedmont Office Realty Trust, Inc. Quality Properties One & Two Independence Square Washington, D.C. 35 West Wacker Drive Chicago, IL 800 North Brand Boulevard Glendale, CA Glenridge Highlands II Atlanta, GA |
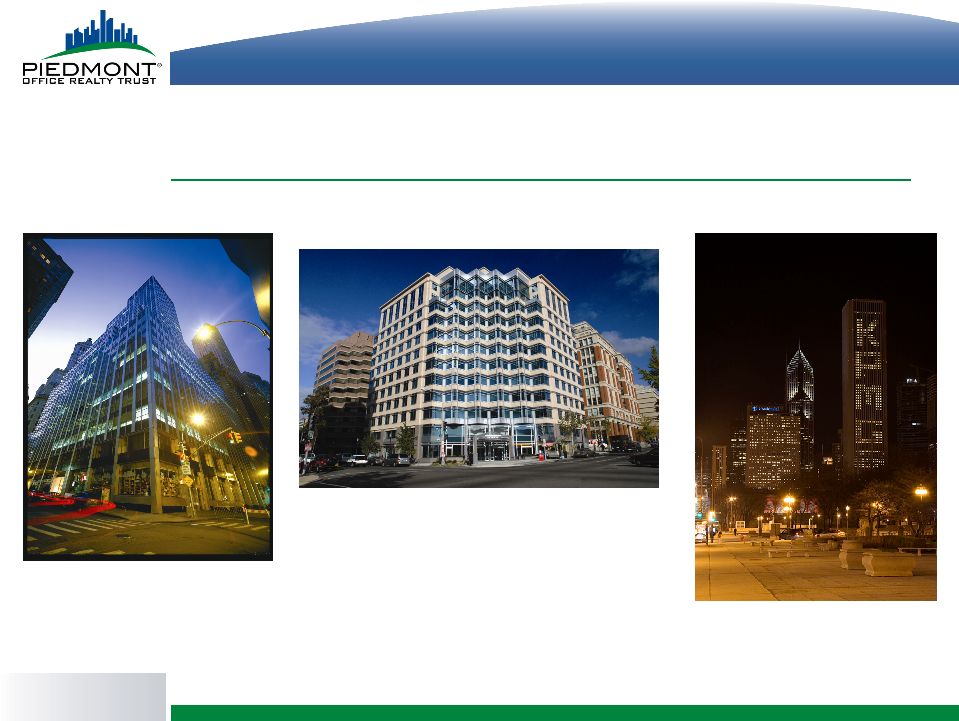 © 2007 Piedmont Office Realty Trust, Inc. 60 Broad Street New York, NY Piedmont Properties AON Center 200 East Randolph Drive Chicago, IL 1201 Eye Street Washington, D.C. |
 © 2007 Piedmont Office Realty Trust, Inc. Piedmont Properties 200 & 400 Crossing Boulevard Bridgewater, NJ 1901 Market Street Philadelphia, PA Nine Polito Avenue Lyndhurst, NJ |
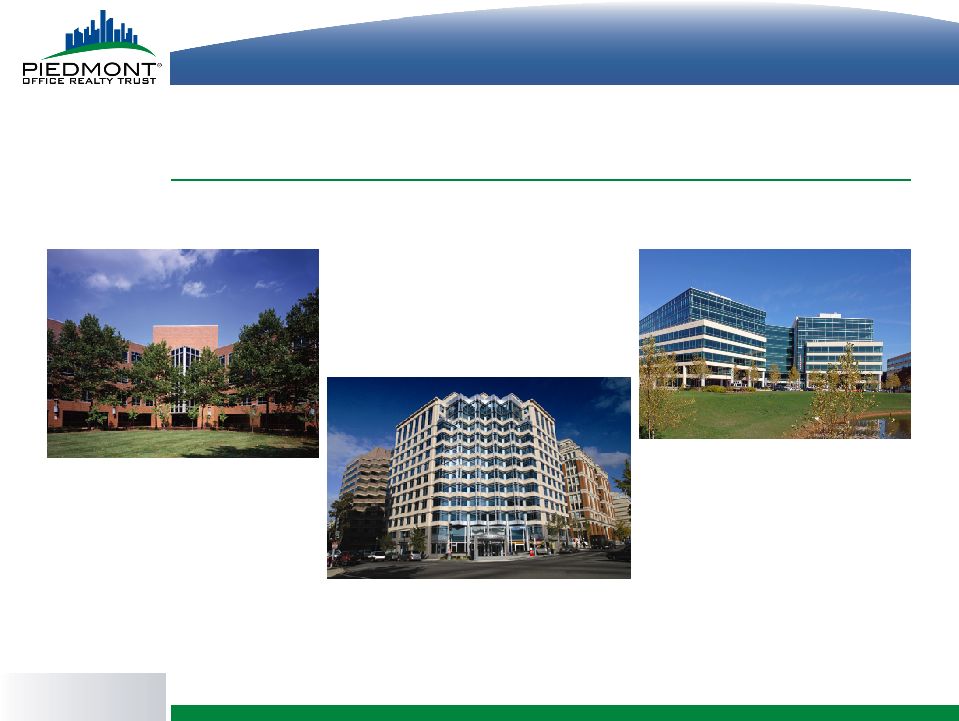 © 2007 Piedmont Office Realty Trust, Inc. Piedmont Properties Lockheed Martin I & II Corporate Boulevard Rockville, MD Piedmont Pointe I & II Rockledge Drive Bethesda, MD 1201 Eye Street Washington, D.C. |
 © 2007 Piedmont Office Realty Trust, Inc. Quality Properties 35 West Wacker Drive Chicago, IL 800 North Brand Boulevard Glendale, CA Glenridge Highlands II Atlanta, GA 60 Broad Street New York, NY |
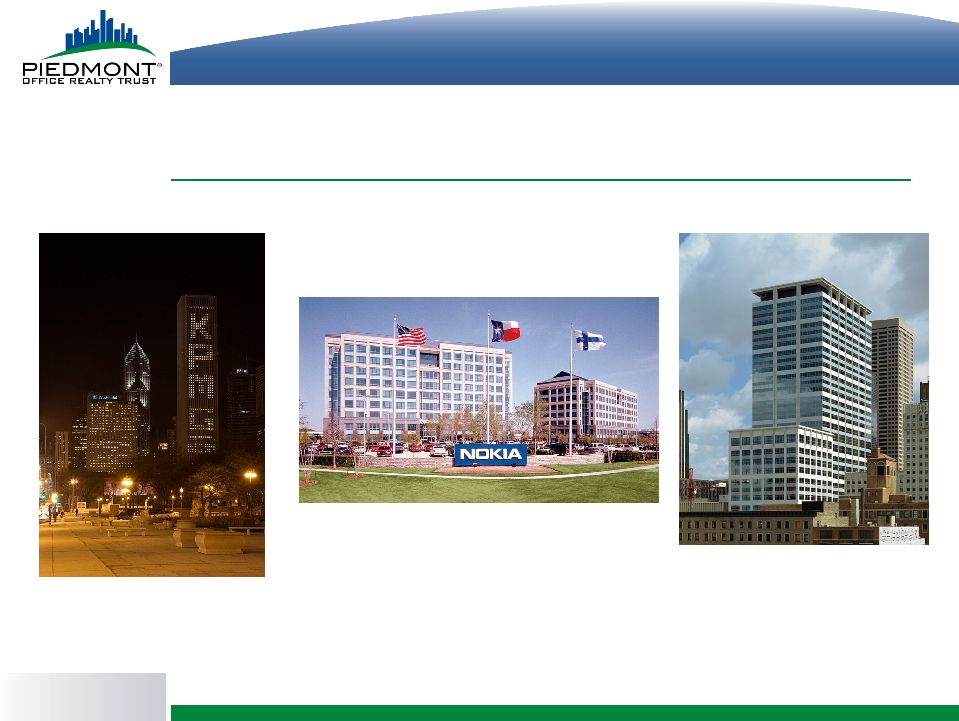 © 2007 Piedmont Office Realty Trust, Inc. Piedmont Properties AON Center 200 East Randolph Drive Chicago, IL Nokia Connection Drive Irving, TX US Bancorp 800 Nicollet Mall Minneapolis, MN |
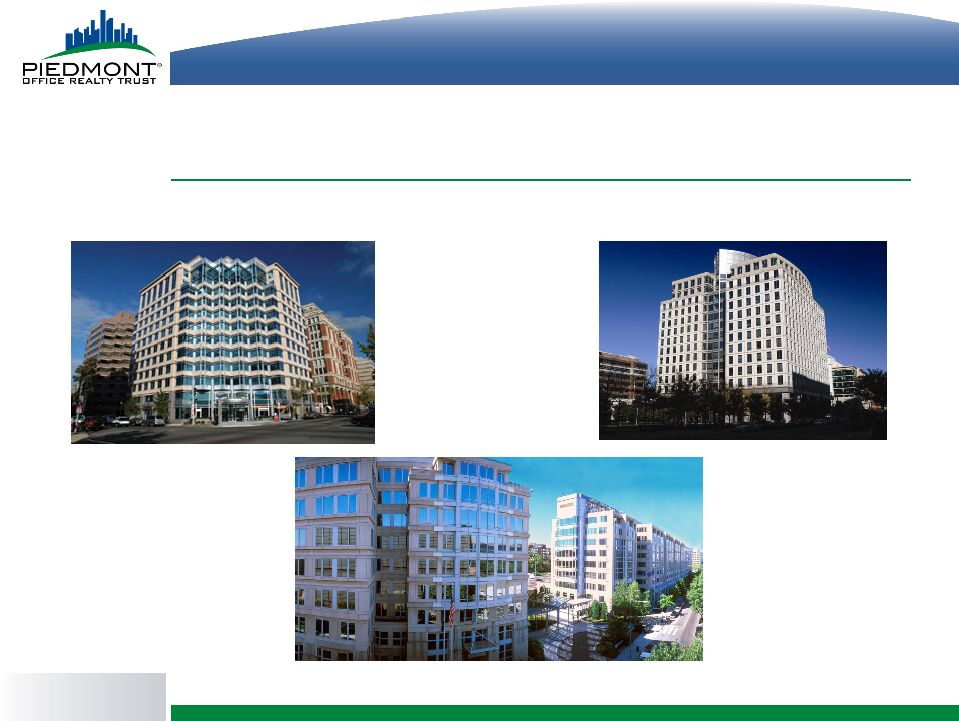 © 2007 Piedmont Office Realty Trust, Inc. Piedmont Properties One & Two Independence Square Washington D.C. 1201 Eye Street Washington D.C. 4250 N. Fairfax Arlington, VA |
 © 2007 Piedmont Office Realty Trust, Inc. 60 Broad Street New York, NY Piedmont Properties AON Center 200 East Randolph Drive Chicago, IL Glenridge Highlands II 5565 Glenridge Connector Atlanta, GA |
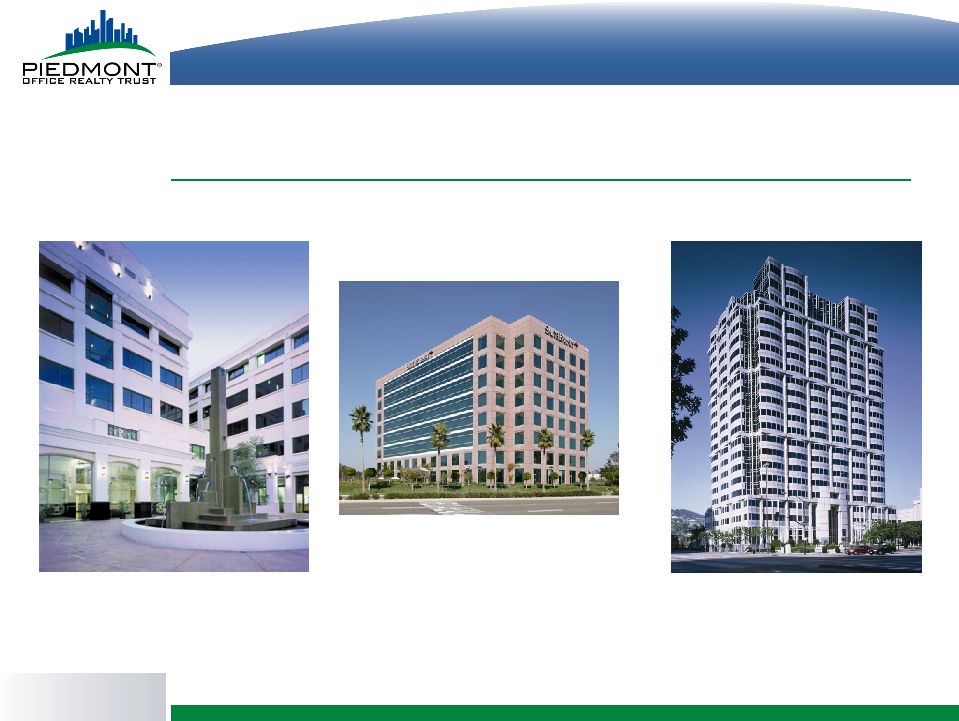 © 2007 Piedmont Office Realty Trust, Inc. Piedmont Properties 1055 East Colorado Pasadena, CA Nestle 800 North Brand Boulevard Glendale, CA 1901 Main Street Irvine, CA |
 © 2007 Piedmont Office Realty Trust, Inc. Piedmont Properties Las Colinas Corporate Center I & II North State Hwy. 161 Irving, TX Nokia Connection Drive Irving, TX Harcourt North MoPac Expressway Austin, TX |
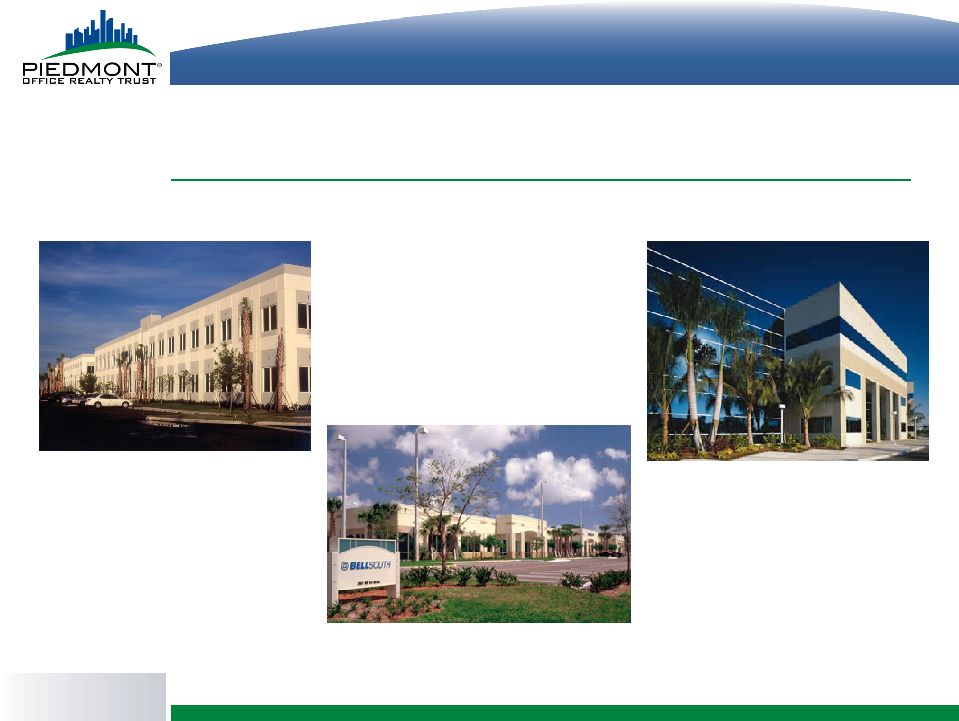 © 2007 Piedmont Office Realty Trust, Inc. th Piedmont Properties Bellsouth Advertising 2001 NW 64 Street Ft. Lauderdale, FL Convergys 5601 Hiatus Road Tamarac, FL Sarasota Commerce Center II 101 Arthur Anderson Parkway Sarasota, FL |
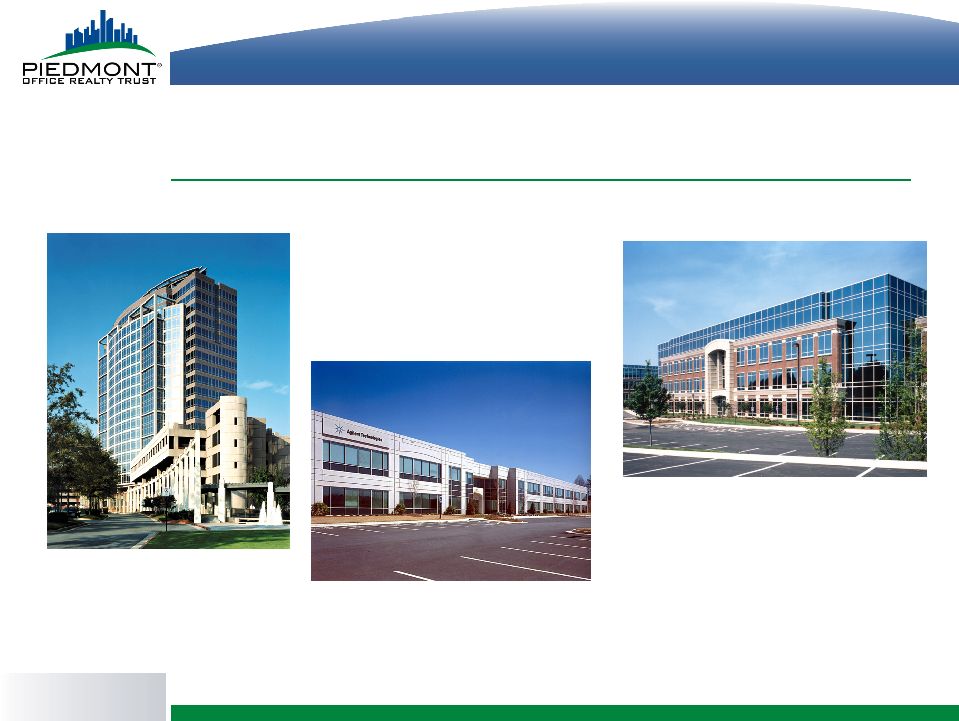 © 2007 Piedmont Office Realty Trust, Inc. Piedmont Properties 3750 Brookside Parkway Alpharetta, GA 11695 Johns Creek Parkway Johns Creek, GA Glenridge Highlands II 5565 Glenridge Connector Atlanta, GA |
 © 2007 Piedmont Office Realty Trust, Inc. Piedmont Properties US Bancorp 800 Nicollet Mall Minneapolis, MN Crescent Ridge II 10900 Wayzata Boulevard Minnetonka, MN Two Pierce Place Itasca, IL |
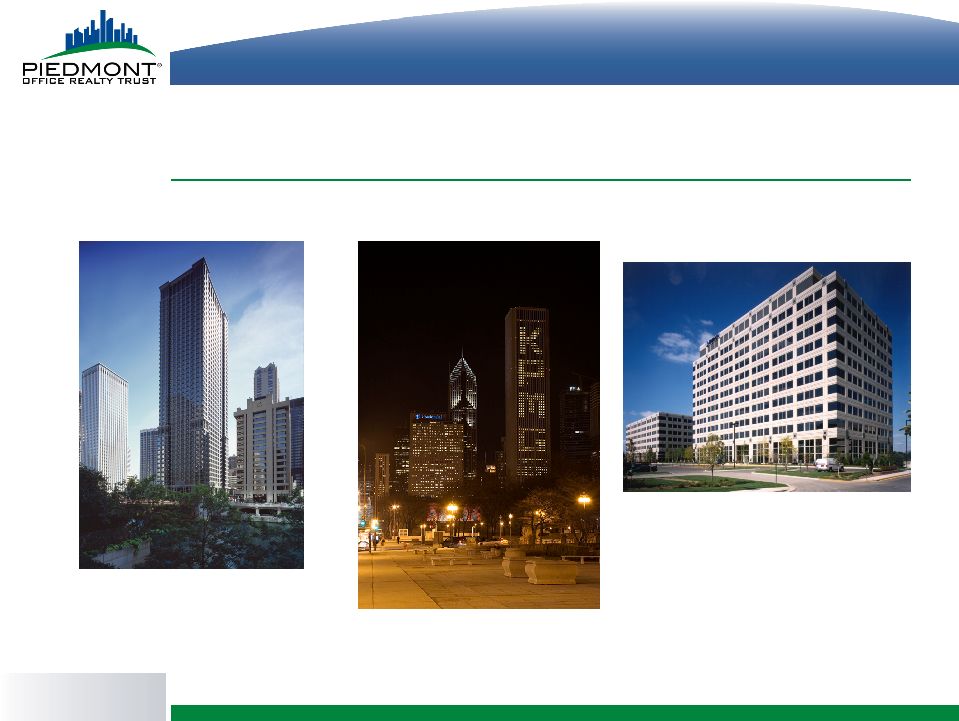 © 2007 Piedmont Office Realty Trust, Inc. Piedmont Properties 35 W. Wacker Chicago, IL Windy Pointe I & II McConnor Parkway Schaumburg, IL AON Center 200 East Randolph Drive Chicago, IL |
 © 2007 Piedmont Office Realty Trust, Inc. Piedmont Properties AON Center 200 East Randolph Drive Chicago, IL Glenridge Highlands II 5565 Glenridge Connector Atlanta, GA 1901 Market Street Philadelphia, PA |
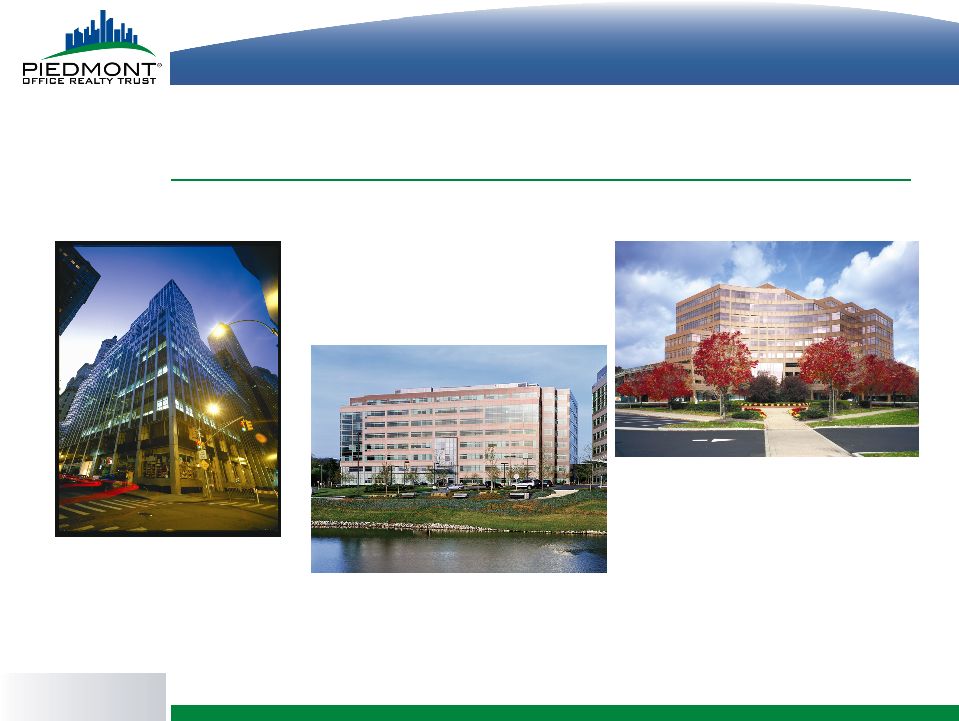 © 2007 Piedmont Office Realty Trust, Inc. Piedmont Properties 200 & 400 Crossing Boulevard Bridgewater, NJ Nine Polito Avenue Lyndhurst, NJ 60 Broad Street New York, NY |
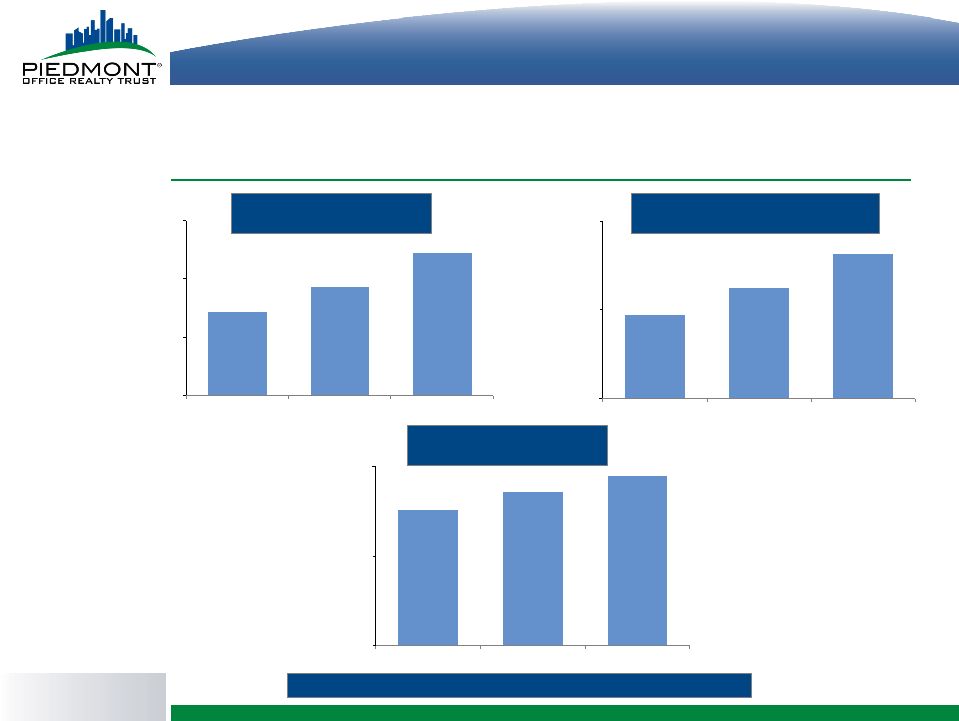 © 2007 Piedmont Office Realty Trust, Inc. Financial Highlights $593.2 $622.0 $571.4 $500.0 $550.0 $600.0 $650.0 2006 2007 2008 $285.5 $294.9 $275.8 $200.0 $250.0 $300.0 2006 2007 2008 Funds From Operations Revenues For years ended December 31, 2006, 2007 and 2008 (in millions) $112.1 $131.3 $96.9 $50.0 $100.0 $150.0 2006 2007 2008 Income From Continuing Operations 4% 5% 16% 17% 4% 3% |
 © 2007 Piedmont Office Realty Trust, Inc. Tenant Base Tenant diversification (as of December 31, 2008) Tenant Name (Ranked by % of AGR) Annualized Gross Rental Revenues ($000's) Percentage of Annualized Gross Rental Revenues S&P Credit Rating US Government (11 agencies) 61,823 11.4% AAA BP Corporation 25,565 4.7% AA Leo Burnett (Publicis) 1 20,959 3.9% BBB+ State of New York 19,873 3.7% AA- Nestle 18,311 3.4% AA US Bancorp 17,311 3.2% AA Sanofi-Aventis 17,070 3.1% AA- Kirkland & Ellis 2 15,775 2.9% N/A Independence Blue Cross 15,565 2.9% N/A Winston & Strawn 3 14,468 2.7% N/A Zurich American 10,395 1.9% AA- DDB Needham (Omnicom) 4 10,065 1.8% A- Shaw Facilities 9,514 1.7% BB+ Lockheed Martin 9,186 1.7% A- State Street Bank 8,694 1.6% AA Other 5 269,715 49.4% 544,289 100.0% 1 Rating is for parent company, Publicis Groupe SA 2 Kirkland & Ellis is ranked # 7 by The America Lawyer’s 2007 AmLaw 100 Rankings 3 Winston & Strawn is ranked # 33 by The America Lawyer’s 2007 AmLaw 100 Rankings 4 Rating is for parent company, Omnicom Group 5 Includes leases which terminated effective December 31, 2008 |
 © 2007 Piedmont Office Realty Trust, Inc. Real Estate Diversification |
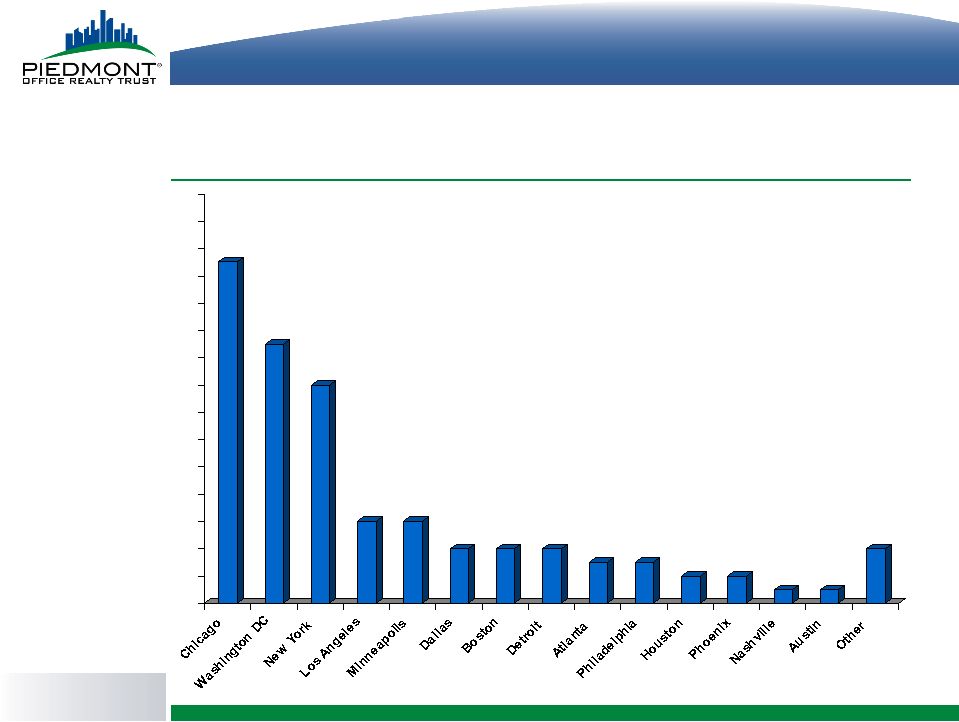 © 2007 Piedmont Office Realty Trust, Inc. Geographic Diversification Percentage of annualized gross rental revenues (as of December 31, 2008) 25% 19% 16% 6% 6% 4% 4% 4% 3% 3% 2% 2% 1% 1% 4% 0.0% 2.0% 4.0% 6.0% 8.0% 10.0% 12.0% 14.0% 16.0% 18.0% 20.0% 22.0% 24.0% 26.0% 28.0% 30.0% |
 © 2007 Piedmont Office Realty Trust, Inc. Industry Diversification Percentage of annualized gross rental revenues (as of December 31, 2008) for all industries representing 3% or greater 16% 14% 9% 7% 5% 5% 5% 5% 3% 3% 3% 0.0% 1.0% 2.0% 3.0% 4.0% 5.0% 6.0% 7.0% 8.0% 9.0% 10.0% 11.0% 12.0% 13.0% 14.0% 15.0% 16.0% 17.0% 18.0% |
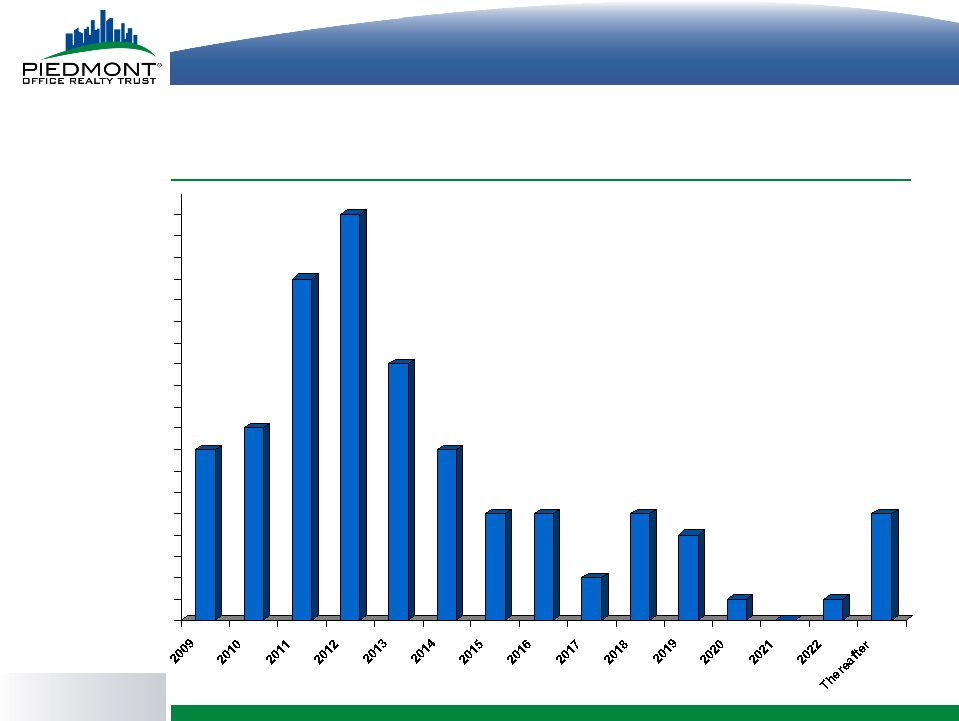 © 2007 Piedmont Office Realty Trust, Inc. Lease Expiration Schedule Percentage of annualized gross rental revenues (as of December 31, 2008) 8% 9% 16% 19% 12% 8% 5% 5% 2% 5% 4% 1% 0% 1% 5% 0.0% 1.0% 2.0% 3.0% 4.0% 5.0% 6.0% 7.0% 8.0% 9.0% 10.0% 11.0% 12.0% 13.0% 14.0% 15.0% 16.0% 17.0% 18.0% 19.0% 20.0% |
 © 2007 Piedmont Office Realty Trust, Inc. Leverage |
 2 2 © 2007 Piedmont Office Realty Trust, Inc. Leverage Ratios Piedmont (Based on estimated NAV of $7.40 per share) 34% Publicly Traded REIT Office Sector Average 63% All Publicly Traded REIT Sectors Average 66% Leverage Ratio 1 1 Total liabilities as a percentage of current value of assets. 2 Source: Green Street Advisors, Inc. March 18, 2009 |
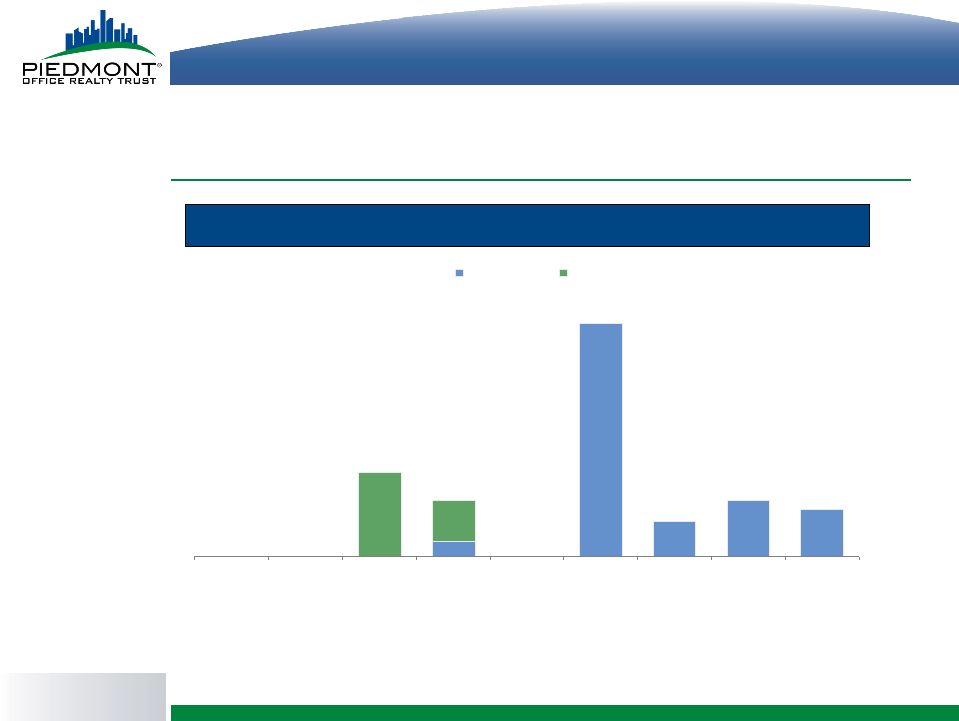 © 2007 Piedmont Office Realty Trust, Inc. Debt Maturities $695 $45 $140 $168 $105 $250 $121 2009 2010 2011 2012 2013 2014 2015 2016 2017 Secured debt Unsecured debt 1 The schedule assumes one-year extensions for the $250 Million Unsecured Term Loan and for the $500 Million Unsecured Line of Credit. 1 1 Debt maturity schedule as of December 31, 2008 ($ in millions) |
 © 2007 Piedmont Office Realty Trust, Inc. 6.0% 6.1% 6.4% 7.3% 6.0% 5.8% 5.4% 4.3% 6.0% 5.4% 4.4% 1.3% 0.0% 2.0% 4.0% 6.0% 8.0% 10.0% 5.50% Rate 6.50% Rate 7.50% Rate Interest Rate 0% Loan-to-Value 25% Loan-to-Value 50% Loan-to-Value 75% Loan-to-Value Assumptions: • Initial Cap Rate = 7.0% • Initial After Fee Return = 6.0% • 10-yr Note = 4.50% • Borrowing Rate = 5.50% • Interest-Only Debt • Assume interest rates increase • Assume portfolio is refinanced Hypothetical – for illustrative purposes only and do not represent the past or future performance of any product. Hypothetical Effects of Interest Rates and Cap Rates on a Leveraged Real Estate Portfolio |
 © 2007 Piedmont Office Realty Trust, Inc. Assumptions: • Initial Cap Rate = 7.0% • Initial After-Fee Return = 6.0% • 10-yr Note = 4.50% • Assume interest rates increase by 100-200 basis points • Increase in interest rate leads to commensurate increase in cap rates • Increased cap rate results in a decline in the market value of the portfolio Hypothetical Effects of Interest Rates and Cap Rates on a Leveraged Real Estate Portfolio Market Value 0.0% 0.0% 0.0% 0.0% -12.5% -16.7% -25.0% -50.0% -22.2% -29.6% -44.4% -88.8% - 90.0% - 80.0% -70.0% - 60.0% - 50.0% - 40.0% - 30.0% -20.0% -10.0% 0.0% 7.00% Rate 8.00% Rate 9.00% Rate Capitalization Rate 0% Loan-to-Value 25% Loan-to-Value 50% Loan-to-Value 75% Loan-to-Value Hypothetical – for illustrative purposes only and do not represent the past or future performance of any product. |
 © 2007 Piedmont Office Realty Trust, Inc. Investment Strategy |
 © 2007 Piedmont Office Realty Trust, Inc. Execution of Investment Strategy • Strive to produce attractive risk adjusted returns • Tenant relationships/landlord of choice • Expense management/strong stewardship • Opportunities to create value/leasing activity • Capitalize on (selective) strategic investment opportunities • Create an attractive liquidity event (while keeping all options open) as soon as practical |
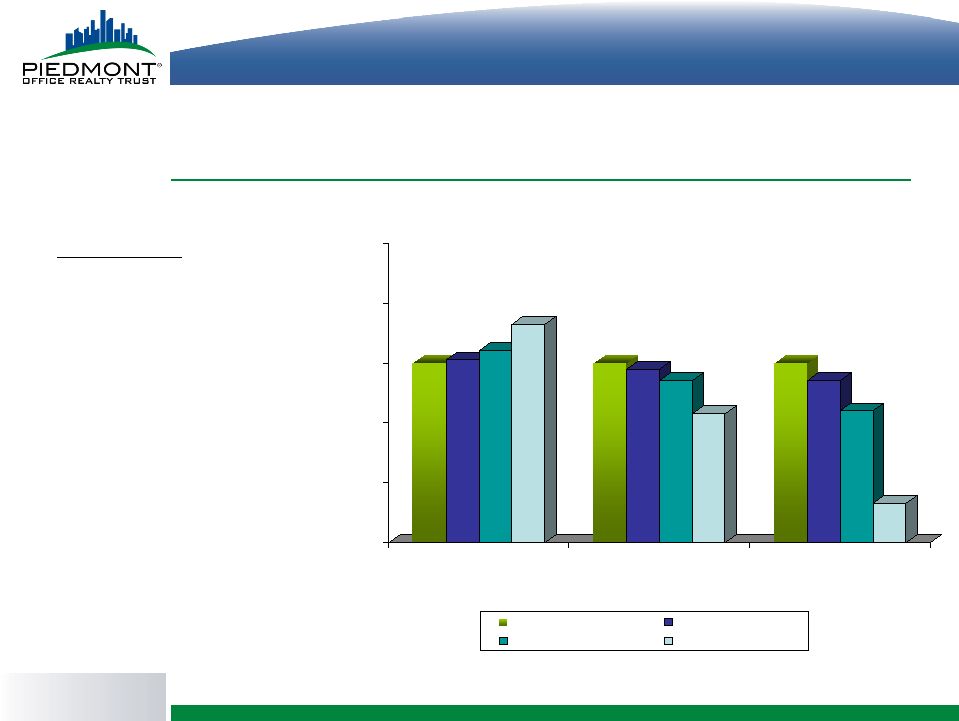
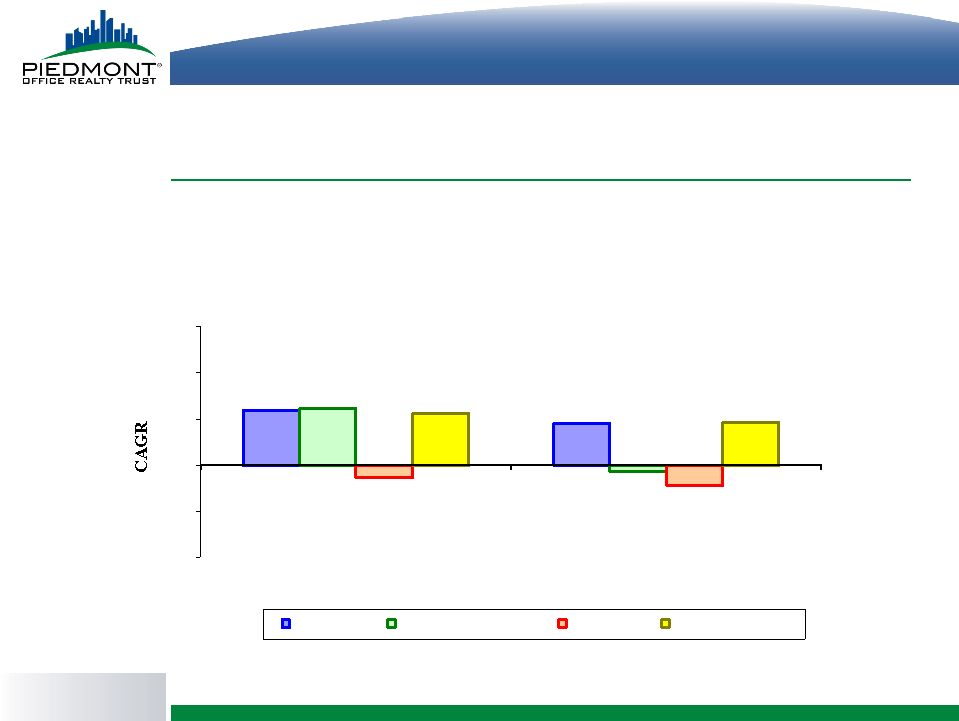 © 2007 Piedmont Office Realty Trust, Inc. Investor Performance Comparison – 1999 and 2004 Investor Compound Annual Growth Rate of Piedmont vs. Other Indices Over a 5-Year and 10-Year Hold Period -10% -5% 0% 5% 10% 15% 10-Year Hold 5-Year Hold Piedmont NAREIT (Office Only) S&P 500 BC Agg Bond Index Note: Piedmont returns are net of investment management fees. 1/1/99 to 12/31/08 1/1/04 to 12/31/08 |
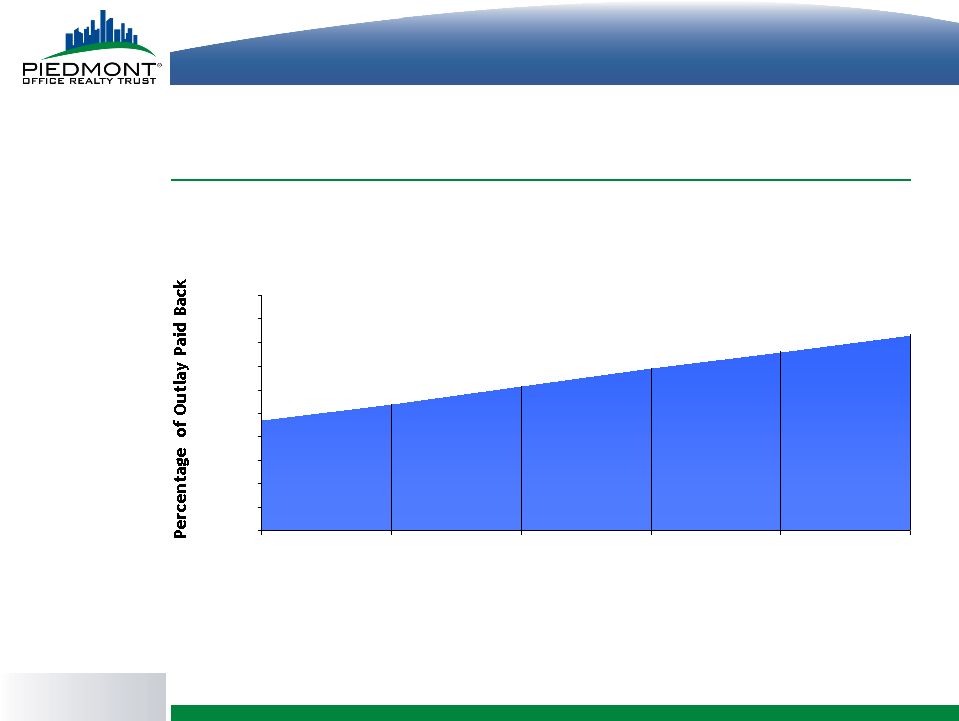 © 2007 Piedmont Office Realty Trust, Inc. Investor Payback on Initial Capital Outlay Note: Analysis assumes all shares are purchased on the first day of any given Investment Year. Percentage of Initial Outlay Paid Back Based on Investment Year 0% 10% 20% 30% 40% 50% 60% 70% 80% 90% 100% 2004 2003 2002 2001 2000 1999 Investment Year |
 © 2007 Piedmont Office Realty Trust, Inc. Opportunities to Create Value |
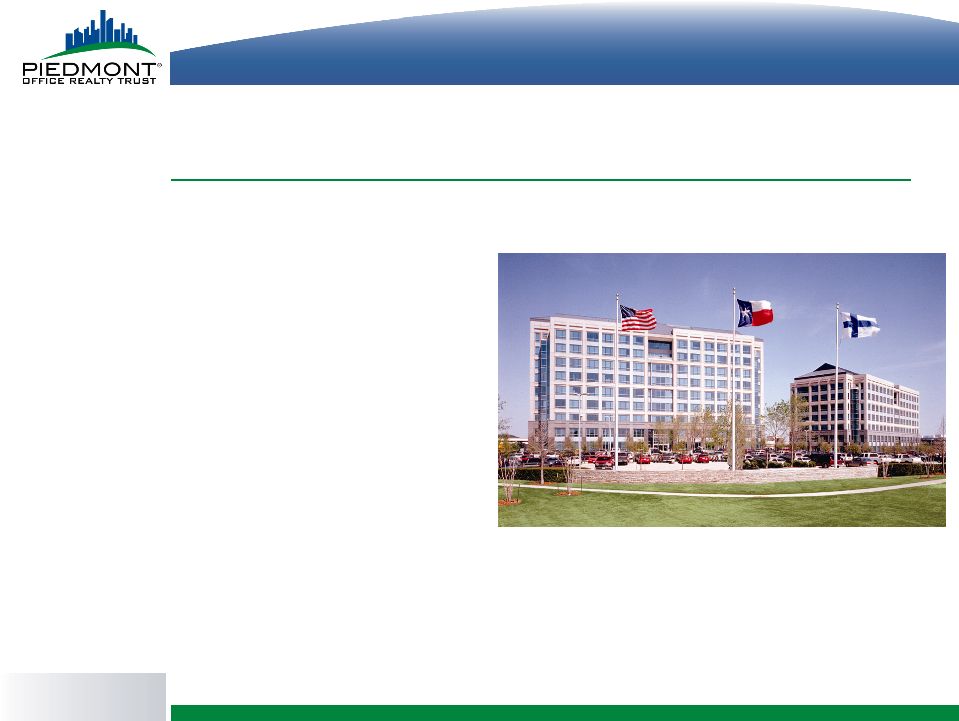 © 2007 Piedmont Office Realty Trust, Inc. Lease Extensions/Restructuring • Three-building Nokia complex acquired in August 2002 • Originally Building I and III leased through July 2009 • Early termination of Building III lease effective July 2006 with concurrent re-lease to Goldman Sachs affiliate from January 2007 through March 2018 • Mid 2007, negotiated early termination of Building I lease effective July 2008 and extended Building II lease through December 2015 • Goldman Sachs affiliate expanded into Building I for an additional 82,686 SF through March 2018, concurrent with Building III lease • Signed one floor lease (28,000 SF) with Interstate Bakeries through 2014 for Building I • Lease restructuring offers extended term and Goldman Sachs credit (S&P A) Dallas, TX 604,243 SF $119.9mm Purchase Price |
 © 2007 Piedmont Office Realty Trust, Inc. • Acquired December 2000 • Sysco Corporation leased 106,516 SF through September 2008 • Shaw Group leased 206,048 SF through December 2010 • Sysco started construction on a corporate campus in 2005 to consolidate operations • Shaw Group executed an early renewal and expansion in 2008 for the entire building through December 2018 • Shaw Group renewal and expansion maintains 100% occupancy and eliminates downtime Lease Extension/Restructuring Houston, TX 312,564 SF $45mm Purchase Price |
 © 2007 Piedmont Office Realty Trust, Inc. Atlanta, GA 406,241 SF $84mm Purchase Price • Acquired August 2003 • Originally 76% leased to Cingular through December 2010 • AT&T acquired Cingular in 2006 and exercised termination option effective December 2008 • First Data Corp consolidating operations from Denver and Omaha • Executed lease with First Data Corp for 183,375 SF through February 2020 • First Data lease backfills nearly 60% of terminated space with little downtime Leasing Activity |
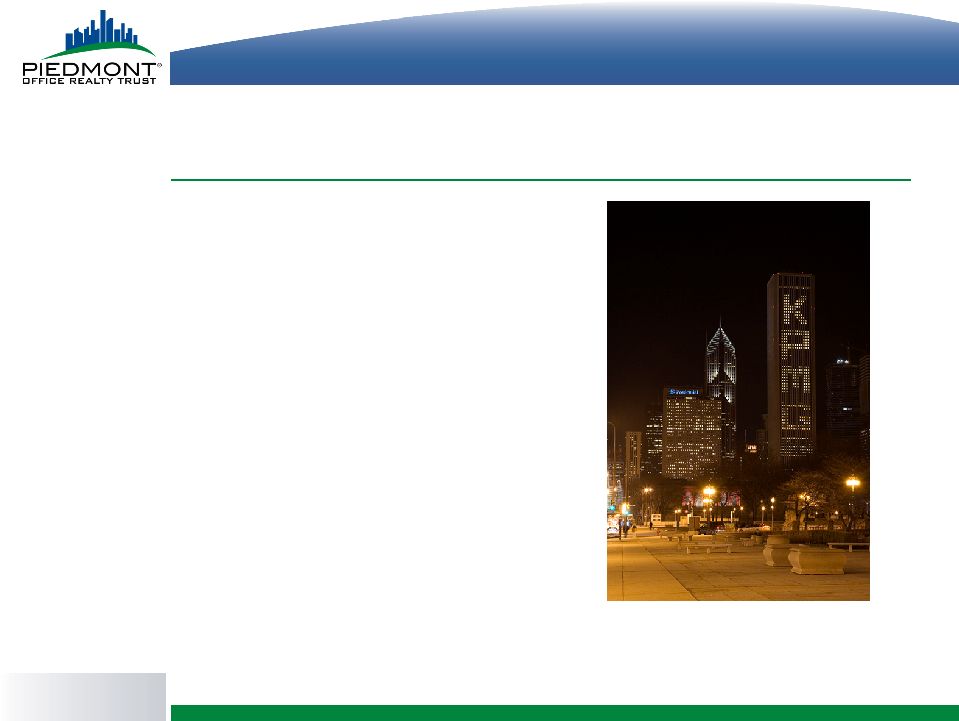 © 2007 Piedmont Office Realty Trust, Inc. • Kirkland & Ellis lease for 497,800 SF expires in December 2011 • KPMG leased 260,641 SF of the Kirkland & Ellis space through August 2027 • Federal Home Loan Bank of Chicago subleased 63,402 SF through December 2013 and converts to a direct lease through December 2024 • Microsoft leased 78,163 SF through October 2019, absorbing 3% of vacant space • Increased occupancy from 88% to 93% and reduced rollover risk Leasing Activity Chicago, IL 2,678,252 SF $465.2mm Purchase Price |
 © 2007 Piedmont Office Realty Trust, Inc. Recent Decisions |
 © 2007 Piedmont Office Realty Trust, Inc. Recent Decisions By Piedmont Board • Estimated net asset value reduced from $8.70 to $7.40 • Dividend reduced from $0.5868 to $0.42 per share per annum • Reset DRP pricing – 95% of NAV ($7.03) • Reset SRP pricing – lower of cost or 95% of NAV ($7.03) • Limited SRP to $100 million in 2009 – estimated proceeds from the dividend reinvestment plan |
 © 2007 Piedmont Office Realty Trust, Inc. Determination of Estimated Net Asset Value • By prospectus, update valuations each year • Average cost/share = $8.38 (original cost – return of capital) • Valuation to date: September 30, 2005 $8.70 September 30, 2006 $8.93 December 31, 2007 $8.70 December 31, 2008 $7.40 • Hired outside appraisal firm to value all properties • Take estimated current value of properties, debt and receivables, enter into balance sheet and divide by number of shares |
 © 2007 Piedmont Office Realty Trust, Inc. Dividend Cuts (Source- Morgan Keegan) • 56 of 121 US publicly traded REITs have reduced dividends by an average of 61% since 2008 • 9 of 13 office REITs have reduced dividends by average of 46% • Other industries – many blue chip companies have cut dividends drastically (JP Morgan, GE, Bank of America, Dow Chemical, Alcoa, Pfizer – all over 50%) |
 © 2007 Piedmont Office Realty Trust, Inc. Reasons For Dividend Reduction • Proactively provide sufficient liquidity for debt maturing in 2011 • Provide cash flow for lease activity in future years • Provide funding for selective acquisitions • Enhance the stability of investment grade rating |
 © 2007 Piedmont Office Realty Trust, Inc. Looking Ahead |
 © 2007 Piedmont Office Realty Trust, Inc. Piedmont Objectives If the economy continues to falter: • Closely monitor tenant credit status • Conserve cash position to retain and attract quality tenants and pay down debt • Strive to maintain a predictable revenue source and cash flow When the economy begins to recover: • Look for accretive acquisitions • Recycle capital to improve quality of the portfolio in anticipation of a liquidity event |
 © 2007 Piedmont Office Realty Trust, Inc. Piedmont Objectives • Continue to focus on office properties • Continue to follow our low leverage strategy • Continue to pursue high quality tenants and premium properties • Continue to be good stewards of all that has been entrusted to us, and • Continue to creatively explore all liquidity options for stockholders |