1201 Eye Street, Washington, D.C. © 2010 Piedmont Office Realty Trust, Inc. Exhibit 99.1 |
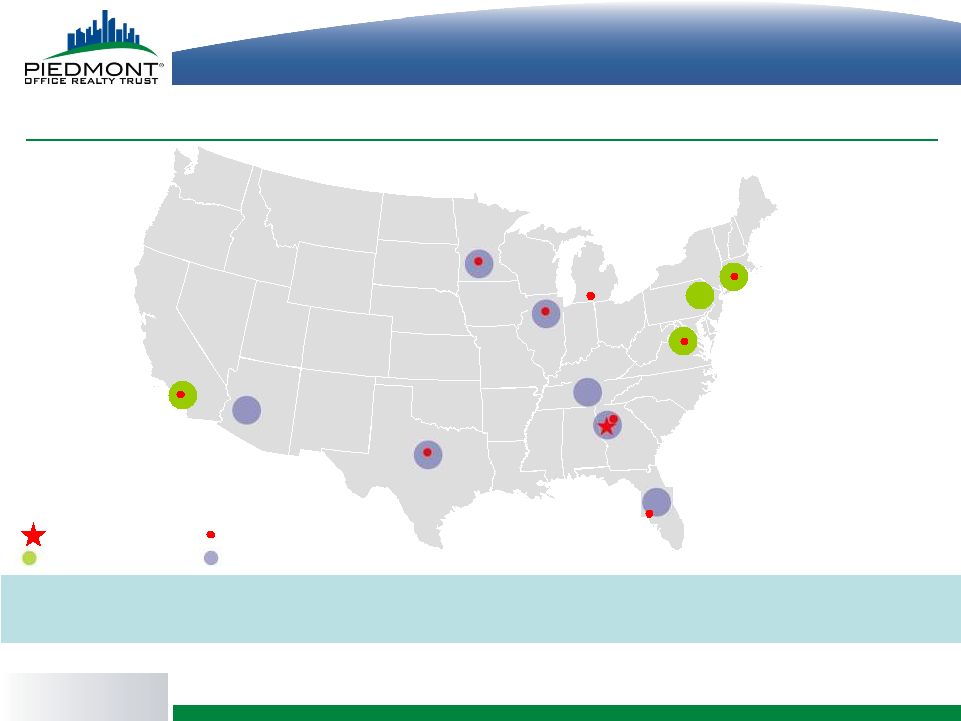
1 1 Piedmont Office Realty Trust, Inc. (NYSE: PDM) is a fully-integrated and self-managed real estate investment trust (“REIT”) specializing in the acquisition, ownership, management, development and disposition of primarily high-quality Class A office buildings located predominately in large U.S. office markets and leased principally to high-credit-quality tenants. Since its first acquisition in 1998, the Company has acquired over $5.5 billion of office and industrial properties (inclusive of joint ventures). Rated as an investment-grade company by Standard & Poor’s and Moody’s, Piedmont has maintained a low-leverage strategy while acquiring its properties. Over 87% of our Annualized Lease Revenue ("ALR") is derived from our office properties located within the ten largest U.S. office markets, including Chicago, Washington, D.C., the New York metropolitan area, Boston and greater Los Angeles. We use market data and industry forecasts and projections throughout this presentation. We have obtained certain market and industry data from publicly available industry publications. These sources generally state that the information they provide has been obtained from sources believed to be reliable, but that the accuracy and completeness of the information are not guaranteed. The forecasts and projections are based on industry surveys and the preparers’ experience in the industry, and there is no assurance that any of the projected amounts will be achieved. We believe that the surveys and market research others have performed are reliable, but we have not independently verified this information. Unless otherwise noted herein, all the information contained in this presentation is presented as of March 31, 2010. Unless the context indicates otherwise, the term “properties” as used in this document and the statistical information presented in this document regarding our properties includes our wholly owned office properties and our office properties owned through our consolidated joint ventures, but excludes our interest in eight properties owned through our equity interests in our unconsolidated joint ventures and our two industrial properties. Unless otherwise indicated, all information in this document gives effect to, and all share and per share amounts have been retroactively adjusted to give effect to, the Recapitalization. The information contained in this presentation does not contain all of the information that may be important to you and should be read in conjunction with our Annual Report on Form 10-K for the year ended December 31, 2009 and our quarterly report on Form 10-Q for the period ended March 31, 2010 and our other filings with the Securities and Exchange Commission. Such documents are available at www.sec.gov and under the heading Investor Relations on our website at www.piedmontreit.com. 1 Introduction © 2010 Piedmont Office Realty Trust, Inc. |
2 2 Certain statements contained in this presentation constitute forward-looking statements within the meaning of Section 27A of the Securities Act of 1933, as amended (the “Securities Act”) and Section 21E of the Securities Exchange Act of 1934, as amended (the “Exchange Act”). We intend for all such forward-looking statements to be covered by the safe-harbor provisions for forward-looking statements contained in Section 27A of the Securities Act and Section 21E of the Exchange Act, as applicable. Such information is subject to certain risks and uncertainties, as well as known and unknown risks, which could cause actual results to differ materially from those projected or anticipated. Therefore, such statements are not intended to be a guarantee of our performance in future periods. Such forward- looking statements can generally be identified by our use of forward-looking terminology such as “may,” “will,” “expect,” “intend,” “anticipate,” “believe,” “continue” or similar words or phrases that are predictions of future events or trends and which do not relate solely to historical matters. The following are some of the factors that could cause the Company’s actual results and its expectations to differ materially from those described in the Company’s forward-looking statements: the Company’s ability to successfully identify and consummate suitable acquisitions; current adverse market and economic conditions; lease terminations or lease defaults, particularly by one of the Company’s large lead tenants; the impact of competition on the Company’s efforts to renew existing leases or re-let space; changes in the economies and other conditions of the office market in general and of the specific markets in which the Company operates; economic and regulatory changes; additional risks and costs associated with directly managing properties occupied by government tenants; adverse market and economic conditions and related impairments to the Company’s real estate assets and other intangible assets; the success of the Company’s real estate strategies and investment objectives; availability of financing; costs of complying with governmental laws and regulations; uncertainties associated with environmental and other regulatory matters; the Company’s ability to continue to qualify as a REIT under the Internal Revenue Code; and other factors detailed in our most recent Annual Report on Form 10-K and other documents we file with the Securities and Exchange Commission. Readers are cautioned not to place undue reliance on these forward-looking statements, which speak only as of the date of this presentation. We cannot guarantee the accuracy of any such forward-looking statements contained in this presentation, and we do not intend to publicly update or revise any forward-looking statements, whether as a result of new information, future events, or otherwise. This release contains certain non-GAAP financial measures such as FFO, AFFO, Core FFO, Core EBITDA, and Annualized Lease Revenue (ALR). Please refer to our supplemental information package for definitions of these metrics on our website under the Investor Relations section at www.piedmontreit.com. 2 Forward-Looking Statements © 2010 Piedmont Office Realty Trust, Inc. |
3 3 Investment Summary • Class A office properties in major U.S. markets • Strong relationships with high-credit quality, diverse tenant base • Demonstrated capital allocation track record • Focused investment strategy in select markets • “Fortress” balance sheet with capacity for growth • Experienced and committed management team 3 © 2010 Piedmont Office Realty Trust, Inc. Crescent Ridge II, Minnetonka, MN Crescent Ridge II, Minnetonka, MN 4250 N. Fairfax Drive, Arlington, VA 4250 N. Fairfax Drive, Arlington, VA |
4 4 Class A Office Properties in Major U.S. Markets © 2010 Piedmont Office Realty Trust, Inc. 200 & 400 Bridgewater Crossing, Bridgewater, NJ 200 & 400 Bridgewater Crossing, Bridgewater, NJ 1055 East Colorado Boulevard, Pasadena, CA 1055 East Colorado Boulevard, Pasadena, CA |
5 5 High-Quality Class A Portfolio (1) 35 W. Wacker Drive, Chicago, IL 35 W. Wacker Drive, Chicago, IL © 2010 Piedmont Office Realty Trust, Inc. • 73 office properties • 20.2 million square feet • 52% CBD, 34% Suburban & 14% Urban In-fill • Weighted average remaining lease term of 5.7 years • Median building age of 11 years • 68% of Annualized Lease Revenue comes from government or investment grade tenants. Notes: (1) Information presented as of March 31, 2010. |
6 6 6 6 High-Quality Class A Office Buildings in Key Markets (1) © 2010 Piedmont Office Realty Trust, Inc. Washington DC New York Metro Phoenix Florida Detroit Boston (2) 6% Minneapolis 6% Los Angeles 4% Nashville Tampa Atlanta 20% “Opportunistic” Markets “Concentration” Markets Headquarters Regional Office Chicago 26% 4% Among the ten largest publicly traded office REITs with the majority of assets (3) located in the top ten U.S. office markets Notes: (1) Reflects*Piedmont’s*percentage *of*ALR*in*concentration,*opportunistic*and*regional *office*markets*as*of*March*31,*2010. (2) In May 2010, Piedmont announced the opening of a regional office in Boston. (3) Over 87% of ALR is derived from the ten largest U.S. office markets based on rentable square footage as of March 31, 2010. 16% 4% 2% Dallas 1% 1% 1% |
7 7 Strong Relationships with High Credit Quality, Diverse Tenant Base One Brattle Square, Cambridge, MA One Brattle Square, Cambridge, MA One Independence Square, Washington, D.C. One Independence Square, Washington, D.C. © 2010 Piedmont Office Realty Trust, Inc. |
8 ** Various expirations ranging from 2011 to 2025. Notes: (1) Denotes the year in which the lease for the majority of the tenant’s space expires. (2) Equal to ALR for each tenant divided by the total ALR at March 31, 2010 for our entire office portfolio, expressed as a percentage. (3) Credit rating may reflect credit rating of parent and/or guarantor or the 2009 AmLaw 100 ranking issued by The American Lawyer Magazine. (4) BP Corporation sublets substantially all of its leased space to other tenants. (5) Kirkland & Ellis will depart upon the expiration of its lease in 2011. A substantial portion of its space has been re-leased to KPMG LLP effective August 2012. (6) State Street Bank extended its lease by ten years in May 2010; the lease will now expire in 2021. (7) Piedmont previously announced the pending sale of the property which is scheduled to close in December 2010. (8) No “other” tenant individually represents more than 1% of ALR. (9) As reported by Standard & Poor’s; includes investment grade companies or subsidiaries of investment grade companies. 8 8 8 Strong Tenant Credit-Quality Tenant Diversification Tenant Name Lease Expiration (1) Percentage of ALR (%) (2) S&P Credit Rating / AmLaw 100 Ranking (3) U.S. Government ** 13.0 AAA BP Corporation (4) 2013 5.5 AA Leo Burnett 2019 4.8 BBB+ US Bancorp 2014 3.8 A+ Winston & Strawn 2024 3.2 AmLaw #34 Nestle 2015 3.2 AA State of New York 2019 3.1 AA Sanofi-aventis 2012 3.0 AA- Independence Blue Cross 2023 2.6 – Kirkland & Ellis LLP (5) 2011 2.0 AmLaw #7 Zurich 2011 1.8 AA- State Street Bank (6) 2021 1.6 AA- Shaw 2018 1.6 BB+ DDB Needham 2018 1.5 A- Lockheed Martin 2014 1.5 A- City of New York 2020 1.3 AA Citicorp (7) 2010 1.3 A Gemini 2013 1.3 A+ Caterpillar Financial 2022 1.2 A Gallagher 2018 1.2 – Other (8) Various 41.5 – Total 100.0 © 2010 Piedmont Office Realty Trust, Inc. No tenant other than the U.S. government accounts for more than 6% of ALR. 68% of ALR derived from government agencies or investment grade companies (9) |
9 9 9 9 Robust Industry Diversification Industry Diversification (1) (% of ALR (2) ) © 2010 Piedmont Office Realty Trust, Inc. (%) 2.1 1.7 16.2 2.3 17.5 6.2 6.7 9.6 12.0 5.5 4.3 3.7 3.3 3.3 3.0 2.6 0 5 10 15 20 No industry other than a government entity accounts for more than 12% of ALR Notes: (1) Industry determinations are made generally in accordance with the Standard Industry Classification (SIC) system definitions promulgated by the U.S. Department of Labor. (2) Equal to ALR for each industry divided by the total ALR at March 31, 2010 for our entire office portfolio, expressed as a percentage. (3) No “other” industry individually represents more than 2% of ALR. |
5.2 9.3 7.7 11.3 8.7 7.2 4.7 2.5 6.0 20.0 5.5 12.6 14.0 11.5 9.3 7.2 4.9 2.7 7.5 0.3 0.2 0.2 0.6 0.2 3.3 6.3 1.5 4.8 24.8 0 5 10 15 20 25 2010 2011 2012 2013 2014 2015 2016 2017 2018 Thereafter 10 10 Expiration & Retention (%) Notes: (1) Equal to ALR expiring each year divided by the total ALR at March 31, 2010 for our entire office portfolio, expressed as a percentage. 3/31/2010 Lease Expiry Profile (% of ALR (1) ) Proactive strategy to address lease maturities along with a 77% retention rate demonstrates depth of relationships with tenants Non-Government Lease Government Lease © 2010 Piedmont Office Realty Trust, Inc. |
Two Pierce Place, Itasca, IL Two Pierce Place, Itasca, IL 11 11 Demonstrated Capital Allocation Track Record © 2010 Piedmont Office Realty Trust, Inc. 1901 Market Street, Philadelphia, PA 1901 Market Street, Philadelphia, PA 2120 West End Ave., Nashville, TN 2120 West End Ave., Nashville, TN |
791 44 218 15 5,002 464 59 5,000 1,000 0 1,000 1998 - 2004 2005 - 2010 12 12 12 12 12 Proven Capital-Recycling Discipline 2005 Special Dividend: $4.86 / Share ($MM) Acquisitions Transaction History (1) ($MM) 1998 – 2004 2005 – 2010 Asset Acquisitions 5,002.4 464.4 % of Total Acquisitions 92% 8% Asset Dispositions (3) 59.4 1,009.2 % of Total Dispositions 6% 94% Cost 44.3 790.8 Value Creation (2) 15.1 218.5 Special Dividends – 748.5 Notes: (1) Inclusive of joint venture transactions. (2) Represents differential in aggregate acquisition and disposition prices during the period. (3) Does not include 111 Sylvan Avenue in Englewood Cliffs, NJ which is under a binding sale contract for $55.0 million. Track record of harvesting value and returning capital to shareholders Capital Return to Shareholders – June 2005 • 27 assets disposed of for $757 million of net proceeds, representing a $190 million gain over the initial purchase price • Approximately 99% of proceeds distributed to shareholders through $4.86 per share special dividend (approximately 16% of stockholders’ basis) © 2010 Piedmont Office Realty Trust, Inc. Cost Basis on Dispositions Value Creation on Dispositions (2) 1,009 (3) |
13 13 Focused Investment Strategy in Select Markets © 2010 Piedmont Office Realty Trust, Inc. 800 N. Brand Blvd., Glendale, CA 800 N. Brand Blvd., Glendale, CA 1225 Eye Street, Washington, D.C. 1225 Eye Street, Washington, D.C. 60 Broad Street, New York, NY 60 Broad Street, New York, NY |
14 14 14 Acquisitions • “Concentration” Markets – High barriers to entry, i.e. high replacement cost, limited land supply, challenging entitlement process, local environmental restrictions – Long-term growth opportunities and greater market stability – Boston, Los Angeles, New York Metro and Washington D.C. • “Opportunistic” Markets – Solid markets with strong fundamentals but lower barriers to entry and greater variability in supply and demand for office space – Opportunities for strategically timed investments with high quality properties and attractive bases – Atlanta, Chicago, Dallas, Florida, Minneapolis, Nashville and Phoenix Focus on major U.S. markets characterized by a diverse employment base, attractive supply / demand trends and an active institutional investor base © 2010 Piedmont Office Realty Trust, Inc. Portfolio Evolution ($MM) 1998 – 2004 2005 – 2010 Net Transactions in “Concentration” Markets 2,065 149 Net Transactions in Non- Concentration Markets 2,878 (694) Target Geographic Allocation (Percentage of ALR) 60 – 70% “Concentration” (Currently 46% of ALR) |
15 15 15 Dispositions • Non-strategic Markets – Low barriers to entry, i.e. high development propensity, abundant supply of land – Limited growth opportunities and/or greater market volatility ��� Detroit, Denver, Cleveland, Austin, Houston, Portland, Seattle • Timing Plays in Opportunistic Markets – Atlanta, Chicago, Dallas, Florida, Minneapolis, Nashville and Phoenix • Small Number of Lower Quality Assets in Concentration Markets – 111 Sylvan Avenue, Englewood Cliffs, NJ • Potential to Sell Joint Venture Interests to Control Exposure to Specific Geographic Markets Focus on non-strategic assets © 2010 Piedmont Office Realty Trust, Inc. – Sold 36 Properties – Exited 16 Non-Concentration Markets – Majority of Sold Assets: – Were Lower Quality and Less Functional – Had Concentrated 2011-2012 Lease Expirations Dispositions: 2005 and After |
16 16 “Fortress” Balance Sheet with Capacity for Growth © 2010 Piedmont Office Realty Trust, Inc. Piedmont Pointe I and II, Washington D.C. Piedmont Pointe I and II, Washington D.C. Eastpointe Corp. Center, Issaquah, WA Eastpointe Corp. Center, Issaquah, WA |
17 17 17 17 Capitalization and Operating Stats ($MM) 3/31/2010 Total Debt $ 1,403 Equity Market Capitalization $ 3,424 Total Market Capitalization $ 4,827 Book Value of Equity $ 2,844 Net Book Value $ 4,428 Debt-to-Total Market Capitalization 29.1% Debt-to-Gross Assets 26.6% Debt-to-Gross Real Estate Assets 30.7% Fixed Charge Coverage 4.6x Interest Expense Coverage 4.6x S&P / Moody’s Rating BBB/Baa2 Low Leverage and Stable Portfolio Enhance Access to Liquidity Notes: (1) All of Piedmont’s outstanding debt as of March 31, 2010 is interest-only debt. (2) Core EBITDA is defined as net income before interest, taxes, depreciation and amortization, and incrementally adding back any impairment losses and extraordinary items. (3) Core FFO is FFO, as defined by NAREIT, adjusted for impairment losses and extraordinary items. (4) Piedmont has notified its lender that it intends to extend the maturity date of the $250 Million Unsecured Term Loan by one year to June 2011 as allowed in the debt agreement. (5) Piedmont has no outstanding balance on the $500 Million Unsecured Line of Credit as of March 31, 2010 and intends to exercise the option to extend the maturity of the Line of Credit to August 2012, as allowed in the debt agreement. (6) As market conditions allow. Limited near-term debt maturities and flexible capital structure utilizing 27% leverage; Access to both public and private debt and equity capital sources (6) © 2010 Piedmont Office Realty Trust, Inc. Core EBITDA (2) $ 88.6 Core FFO (3) $ 69.2 AFFO $ 60.6 Dividends per Share $ 0.315 Core EBITDA Margin 59.7% Core FFO Payout % 77.7% AFFO Payout % 88.8% $0 $45 $0 $413 $695 $250 $0 $500 $1,000 $1,500 $2,000 $2,500 $3,000 $3,500 $4,000 $4,500 $4,428 Total Assets 2010 2011 2012 2013 2014 2015+ thereafter Total Assets and Debt (1) by Maturity Date ($MM) (4) (5) |
Experienced & Committed Management Team 18 18 © 2010 Piedmont Office Realty Trust, Inc. Glenridge Highlands II, Atlanta, GA Glenridge Highlands II, Atlanta, GA AON Center, Chicago, IL AON Center, Chicago, IL Copper Ridge Center, Lyndhurst, NJ Copper Ridge Center, Lyndhurst, NJ |
19 19 19 Management Team Donald A. Miller, CFA President, Director and Chief Executive Officer • 25 years of experience • 2007 – 2010 President, Director and CEO, Piedmont • 2003 – 2007 Chief Real Estate Officer, Wells Real Estate Funds • 1994 – 2003 Lend Lease (last position held – Head of U.S. Equity Real Estate Operations) • 1991 – 1994 Vice President, Prentiss Properties Carroll A. (Bo) Reddic, IV Executive Vice President, Real Estate Operations • 20 years of experience • 2007 – 2010 Exec. VP, Piedmont • 2005 – 2007 Managing Director, Wells Real Estate Funds • 1990 – 2005, Executive Director, Morgan Stanley (including predecessor companies, The Yarmouth Group and Lend Lease) Robert E. Bowers Chief Financial Officer • 32 years of experience • 2007 – 2010, CFO of Piedmont • 2004 – 2007, CFO of Wells Real Estate Funds • 1997 – 2002, CFO and Director of Net Bank • 1995 – 1996, CFO of CheckFree Corporation • 1984 – 1995, CFO and Director, Stockholder Systems • 1978 – 1984, Arthur Andersen Raymond L. Owens Executive Vice President, Capital Markets • 27 years of experience • 2007 – 2010 Exec. VP, Piedmont • 2002 – 2007 Managing Director, Wells Real Estate Funds • 1997 – 2002 Senior Vice President, PM Realty Group • 1995 – 1997 Vice President, GE Asset Management • 1991 – 1994 Vice President, Travelers Realty Investment • 1982 – 1991 Vice President, Aetna Realty Investors Laura P. Moon Senior Vice President, Chief Accounting Officer • 18 years of experience • 2007 – 2010 Senior VP, Piedmont • 2005 – 2007 Vice President, Wells Real Estate Funds • 2002 – 2005 Sr. Director of Financial Planning, ChoicePoint • 1999 – 2002 Chief Accounting Officer, Net Bank • 1991 – 1999 Senior Manager, Deloitte & Touche Senior management averages 24 years of experience and has spent over 5 years working together managing the existing portfolio © 2010 Piedmont Office Realty Trust, Inc. |
Note: (1) Includes Maryland Law “Business and Combination Provision” (Section 3-602) and “Control Share Acquisition” (Section 3-701 through 3-710). 20 20 20 Corporate Governance Profile Experienced Board with governance decision power vested in stockholders © 2010 Piedmont Office Realty Trust, Inc. Piedmont Board of Directors Piedmont Board of Directors • 7 out of 8 Board members are independent • Annual election of all Board members • Board compensation includes restricted stock • Board members have investment in the Company • Opt out of Maryland company anti- takeover provisions (1) • Exemption from the 5/50 rule Relevant Independent Director Experience Year Joined Board W. Wayne Woody, Chairman • Retired Senior Partner, KPMG 2003 Frank C. McDowell, Vice Chairman • Retired CEO, BRE Properties 2008 Michael R. Buchanan • Retired Head of Real Estate Investment Banking, Bank of America 2002 Wesley E. Cantrell • Retired CEO, Lanier Worldwide 2007 William H. Keogler, Jr. • Retired Chairman, Keogler, Morgan & Co.; Director, Robinson-Humphrey, Inc. 1998 Donald S. Moss • Retired Group Vice President, Avon 1998 Jeffrey L. Swope • Managing Partner, Champion Partners 2008 |
21 21 21 Investment Highlights • High-quality Class A portfolio – Geographically diversified with 73 office buildings comprising over 20 million square feet – 68% of ALR from government agencies or investment grade companies – Weighted average remaining lease term of 5.7 years • Focused asset / property management and investment strategy – 8 regional offices directing efficient, hands-on operating approach – 77% tenant retention rate since inception (1) – Long-term focus on “concentration” markets (i.e., Boston, New York Metro, Los Angeles, Washington D.C.) and selective presence in “opportunistic” markets • Strong capital allocation track record – $6.5 billion of transaction activity since inception – 92% of acquisitions between 1998 and 2004 and 94% of dispositions between 2005 and 2010 – $748.5 million special dividend in 2005 following 27 asset portfolio sale • Significant capacity for growth – 27% debt-to-gross assets – Available liquidity of $567 million – Focused investment strategy • Experienced management team – Average 24 years of industry experience and 5 years together managing existing portfolio – Experience working with and for institutional real estate investors Notes: (1) Based on square feet that has become available for renewal since inception. Piedmont’s tenant retention rate for the three months ended March 31, 2010 was 64% of tenants based on square feet that became available in Q1 2010. © 2010 Piedmont Office Realty Trust, Inc. |
22 22 22 2010 Recent Events • Financing and Capital Activity – Issuer rating upgraded by Moody’s from Baa3 with a positive outlook to Baa2 with a stable outlook – Under contract to sell 111 Sylvan Avenue in Englewood Cliffs, NJ © 2010 Piedmont Office Realty Trust, Inc. 111 Sylvan Avenue, Englewood Cliffs, NJ |
23 23 23 2010 Recent Events • Operations – Lease extension signed with State Street Bank for 234,668 square feet at 1200 Crown Colony Drive in Quincy, MA – Lease extension and expansion signed with Advanced Micro Devices for 132,857 square feet at 90 Central Street in Boxborough, MA – Lease extension and expansion signed with Internal Revenue Service for 101,178 square feet at 5000 Corporate Court in Holtsville, NY – New lease signed with Oracle America, Inc. for 55,760 square feet at 6031 Connection Drive in Irving, TX – New lease signed with ResMed Corporation for 174,000 square feet at 110 Hidden Lake Circle in Duncan, SC – Regional management office open in Boston, MA © 2010 Piedmont Office Realty Trust, Inc. 1200 Crown Colony Drive, Quincy, MA 6031 Connection Drive, Irving, TX |