
DRIVING GROWTH NASDAQ: HILL June 7, 2013 Sidoti & Company’s Semi-Annual Microcap Conference Dot Hill Systems Corp.
Safe Harbor Statements contained in this presentation regarding matters that are not historical facts are “forward- looking statements” within the meaning of the Private Securities Litigation Reform Act. Because such statements are subject to risks and uncertainties, actual results may differ materially from those expressed or implied by such forward-looking statements. Such statements include statements regarding future opportunities for additional business and the stage of such opportunities relative to a final binding agreement, prospects for Dot Hill’s continued growth, and Dot Hill’s projected financial results for the second quarter and full year of 2013. The risks that contribute to the uncertain nature of the forward- looking statements include, among other things: the risk that actual financial results for the second quarter and full year of 2013 may be different from the financial guidance provided in this press release; the risks associated with macroeconomic factors that are outside of Dot Hill’s control; the risk that projected future opportunities may never fully develop into ongoing business relationships and/or binding contractual agreements; the fact that no Dot Hill customer agreements provide for mandatory minimum purchase requirements; the risk that one or more of Dot Hill’s OEM or other customers may cancel or reduce orders, not order as forecasted or terminate their agreements with Dot Hill; the risk that Dot Hill’s new products may not prove to be popular; the risk that one or more of Dot Hill’s suppliers or subcontractors may fail to perform or may terminate their agreements with Dot Hill; the risk that Vertical Markets’ sales may not ramp as expected; unforeseen product quality, technological, intellectual property, personnel or engineering issues and any costs that may result from such issues; and the additional risks set forth in Dot Hill’s most recent Form 10-Q and Form10-K filings with the Securities and Exchange Commission. All forward-looking statements contained in this presentation speak only as of the date on which they were made. Dot Hill undertakes no obligation to update such statements to reflect events that occur or circumstances that exist after the date on which they were made. June 7, 2013 NASDAQ HILL 2
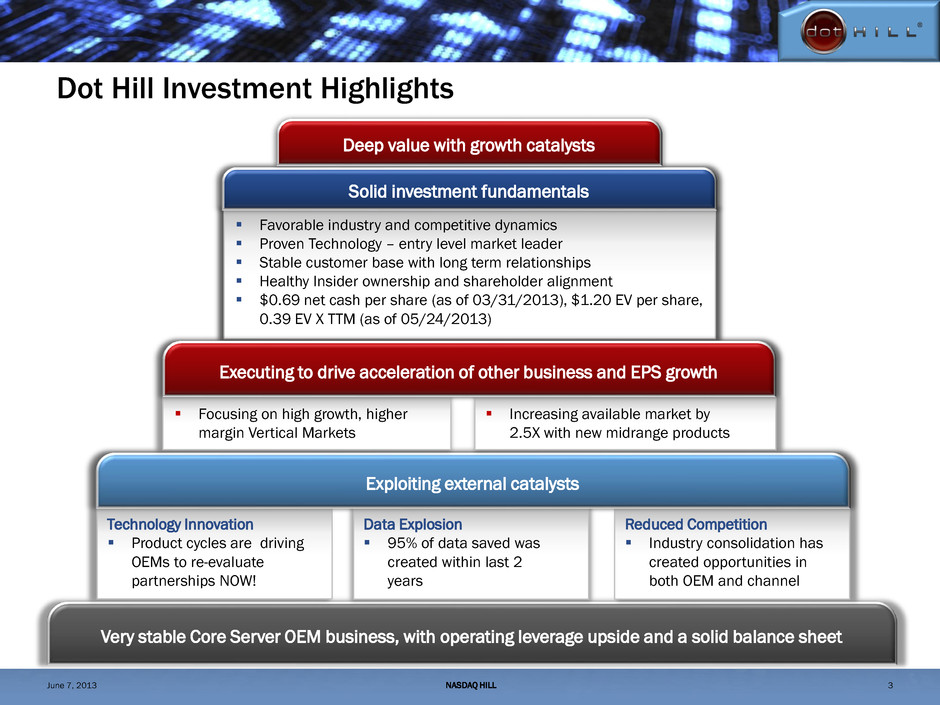
Dot Hill Investment Highlights Very stable Core Server OEM business, with operating leverage upside and a solid balance sheet Solid investment fundamentals Favorable industry and competitive dynamics Proven Technology – entry level market leader Stable customer base with long term relationships Healthy Insider ownership and shareholder alignment $0.69 net cash per share (as of 03/31/2013), $1.20 EV per share, 0.39 EV X TTM (as of 05/24/2013) Exploiting external catalysts Technology Innovation Product cycles are driving OEMs to re-evaluate partnerships NOW! Data Explosion 95% of data saved was created within last 2 years Reduced Competition Industry consolidation has created opportunities in both OEM and channel Focusing on high growth, higher margin Vertical Markets Increasing available market by 2.5X with new midrange products Executing to drive acceleration of other business and EPS growth Deep value with growth catalysts NASDAQ HILL 3 June 7, 2013

Dot Hill: Providing Storage Solutions Financial Services Streaming Video Retail Transactions ERP & Email Voicemail Dot Hill Storage Applications Server Virtualization Design, manufacture & market enterprise storage solutions and Virtual RAID Adapters Sold through OEMs & Branded Channel Partners 600,000+ systems installed NASDAQ HILL 4 June 7, 2013
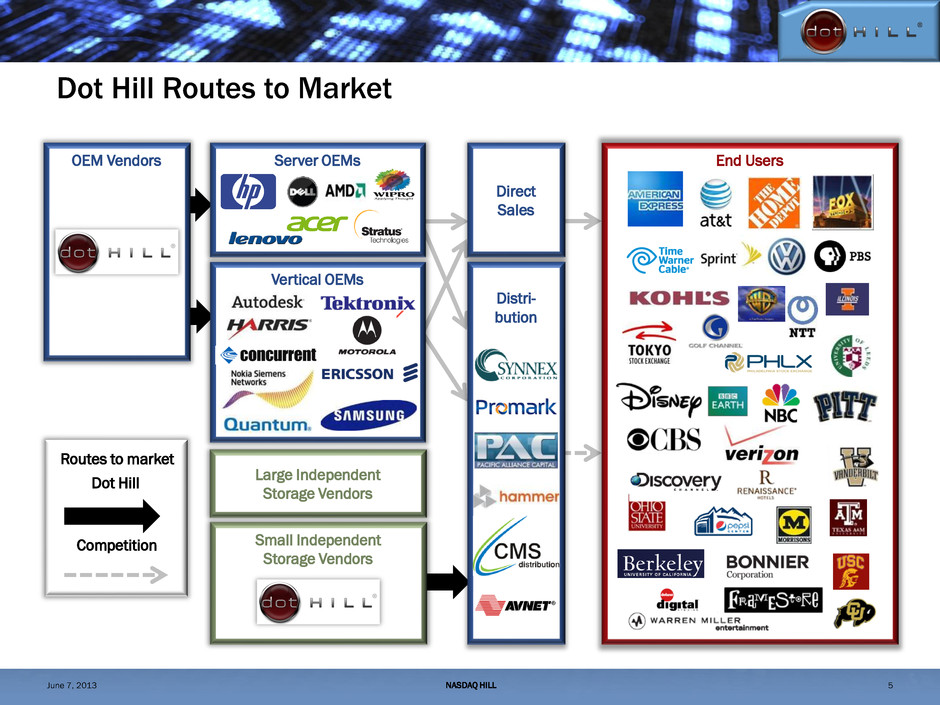
Dot Hill Routes to Market Small Independent Storage Vendors OEM Vendors Server OEMs Vertical OEMs Large Independent Storage Vendors Direct Sales End Users Distri- bution Routes to market Dot Hill Competition NASDAQ HILL 5 June 7, 2013
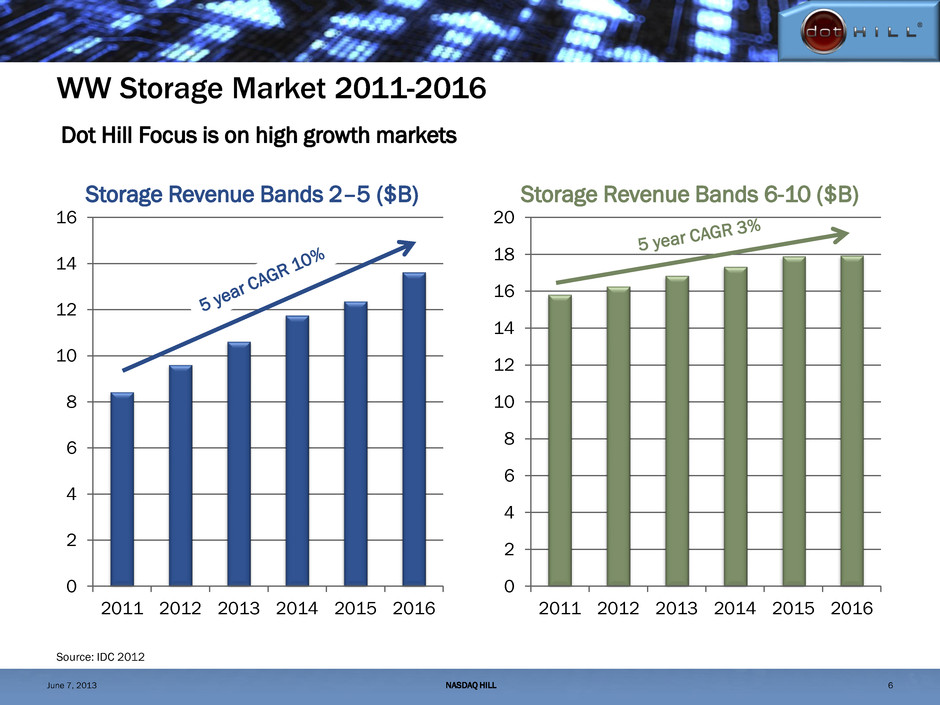
WW Storage Market 2011-2016 0 2 4 6 8 10 12 14 16 2011 2012 2013 2014 2015 2016 Source: IDC 2012 Storage Revenue Bands 2–5 ($B) 0 2 4 6 8 10 12 14 16 18 20 2011 2012 2013 2014 2015 2016 Storage Revenue Bands 6-10 ($B) NASDAQ HILL 6 Dot Hill Focus is on high growth markets June 7, 2013
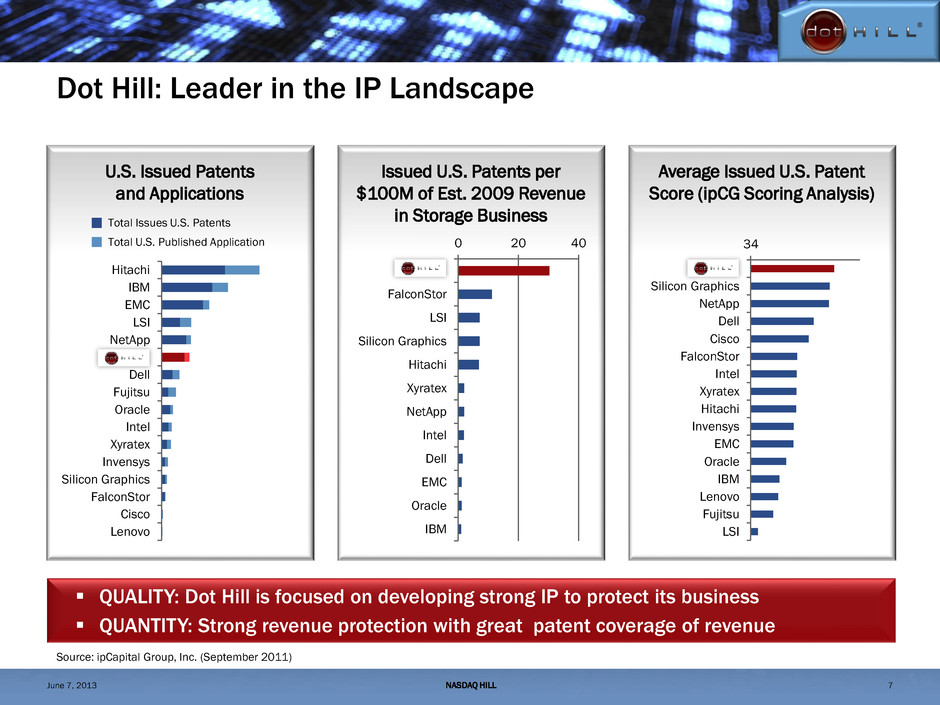
Dot Hill: Leader in the IP Landscape Source: ipCapital Group, Inc. (September 2011) QUALITY: Dot Hill is focused on developing strong IP to protect its business QUANTITY: Strong revenue protection with great patent coverage of revenue U.S. Issued Patents and Applications Issued U.S. Patents per $100M of Est. 2009 Revenue in Storage Business Average Issued U.S. Patent Score (ipCG Scoring Analysis) 34 Dot Hill Silicon Graphics NetApp Dell Cisco FalconStor Intel Xyratex Hitachi Invensys EMC Oracle IBM Lenovo Fujitsu LSI 0 20 40 Dot Hill FalconStor LSI Silicon Graphics Hitachi Xyratex NetApp Intel Dell EMC Oracle IBM Hitachi IBM EMC LSI NetApp Dot Hill Dell Fujitsu Oracle Intel Xyratex Invensys Silicon Graphics FalconStor Cisco Lenovo Total Issues U.S. Patents Total U.S. Published Application NASDAQ HILL 7 June 7, 2013

Dot Hill’s Server OEM Foundation AssuredVRA Server OEMs Customer Since 2009 Customer Since 2010 Server OEM business provides a solid technology and financial foundation to grow the Vertical Markets business and expand into Midrange products Customer Since 2007 HP: Cornerstone of Dot Hill’s Technology and Financial Foundation WW Entry-level market share leader, shipping 3rd generation of AssuredSAN (IDC Bands 2-3) products Agreement with HP has been extended to October 2016 Highly integrated development and supply chain engagement model High volumes allows economy of scale leverage to other customers Customer Since 2006 Customer Since 2012 Customer Since 2010 AssuredSAN Server OEMs Customer Since 2013 NASDAQ HILL 8 June 7, 2013
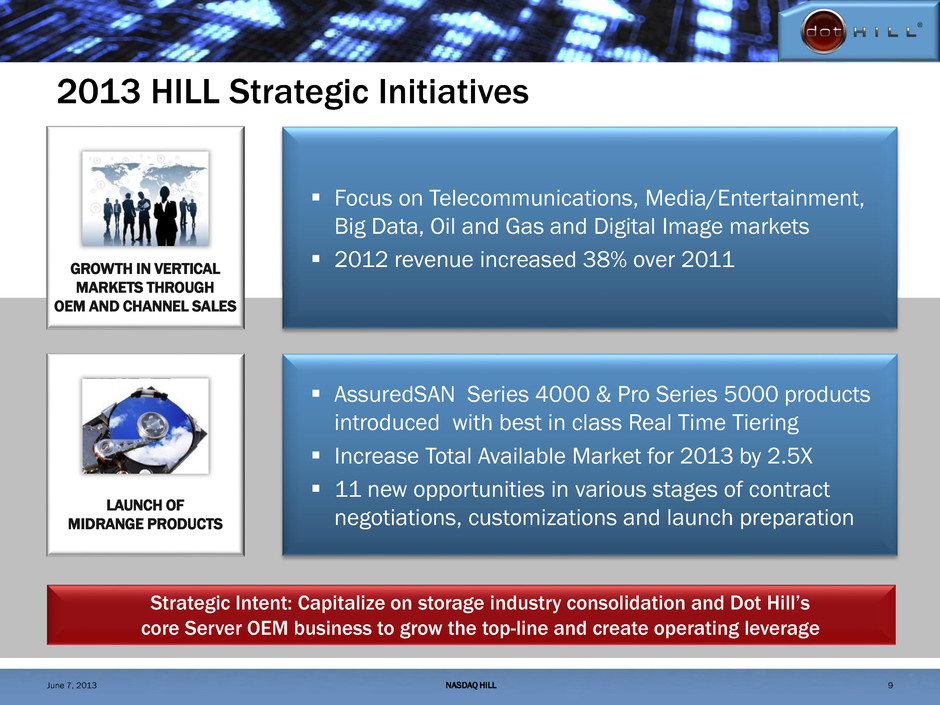
Look Back to 2010 HILL Strategic Initiatives CHANNELS SOFTWARE SYSTEMS Channels GOAL: Diversify revenues at higher margins Smoother revenue stream from more customers Add-on Professional Services Focus on Telecommunications, Media/Entertainment, Big Data, Oil and Gas and Digital Image markets 2012 revenue increased 38% over 2011 GROWTH IN VERTICAL MARKETS THROUGH OEM AND CHANNEL SALES AssuredSAN Series 4000 & Pro Series 5000 products introduced with best in class Real Time Tiering Increase Total Available Market for 2013 by 2.5X 11 new opportunities in various stages of contract negotiations, customizations and launch preparation LAUNCH OF MIDRANGE PRODUCTS Strategic Intent: Capitalize on storage industry consolidation and Dot Hill’s core Server OEM business to grow the top-line and create operating leverage 2013 HILL Strategic Initiatives NASDAQ HILL 9 June 7, 2013
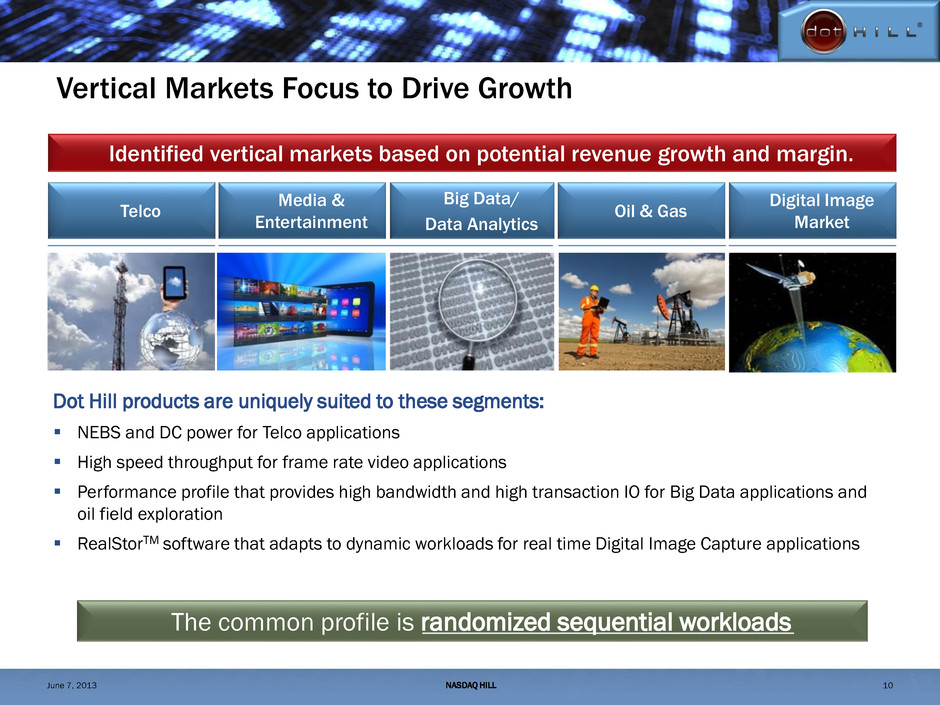
Identified vertical markets based on potential revenue growth and margin. Vertical Markets Focus to Drive Growth Telco Media & Entertainment Big Data/ Data Analytics Oil & Gas Digital Image Market Dot Hill products are uniquely suited to these segments: NEBS and DC power for Telco applications High speed throughput for frame rate video applications Performance profile that provides high bandwidth and high transaction IO for Big Data applications and oil field exploration RealStorTM software that adapts to dynamic workloads for real time Digital Image Capture applications The common profile is randomized sequential workloads NASDAQ HILL 10 June 7, 2013

Vertical Markets: Annual Revenue ($M) $0 $10 $20 $30 $40 $50 $60 2010 2011 2012 38% growth in 2012 over 2011 NASDAQ HILL 11 June 7, 2013

AssuredSAN Pro 5000 Series Real-time tiering intelligence for high performance SSD and high capacity HDD storage for dynamic workloads $4.15B Price Band 5 AssuredSAN 4000 Series High performance with maximum flexibility $2.45B Price Band 4 AssuredSAN 3000 Series Rock solid performance $2.11B Price Band 3 AssuredSAN 2000 Series Affordable, entry-level performance $1.91B Price Band 2 Midrange AssuredSAN Product Positioning DISRUPTIVELY SIMPLE SERIOUSLY SMART PRO 5000 ROCK SOLID 3000 WICKED FAST 4000 VALUE 2000 2013 MARKET TAM BY PRICE BAND New midrange products increase TAM by $6.7B Total Available Market $10.62B NASDAQ HILL 12 Source: IDC 2012 June 7, 2013
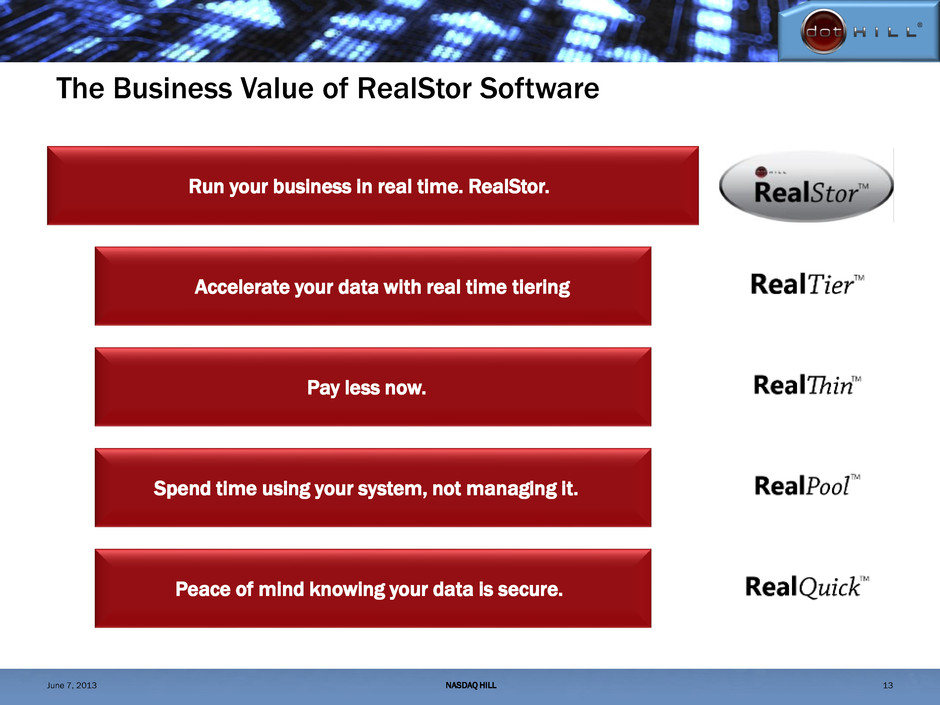
The Business Value of RealStor Software Run your business in real time. RealStor. Accelerate your data with real time tiering Pay less now. Spend time using your system, not managing it. Peace of mind knowing your data is secure. NASDAQ HILL 13 June 7, 2013
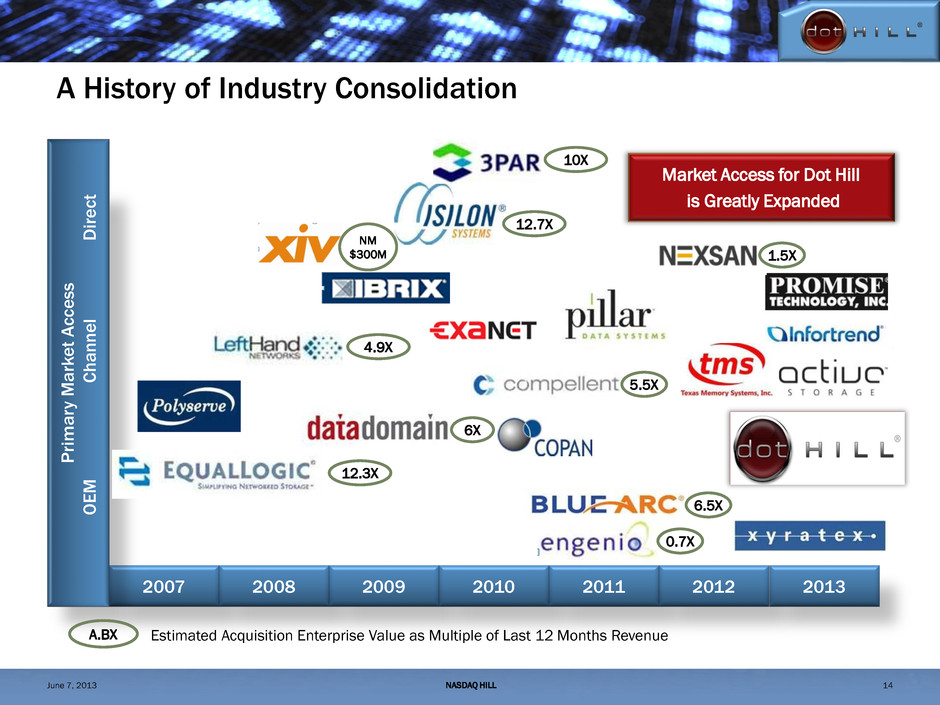
A History of Industry Consolidation 2007 2008 2009 2010 2011 2012 2013 Pr ima ry Ma rk e t A cc e ss OEM Ch a n n el D ir ec t Market Access for Dot Hill is Greatly Expanded Estimated Acquisition Enterprise Value as Multiple of Last 12 Months Revenue A.BX 12.3X 4.9X 10X 12.7X 6X 5.5X 6.5X 0.7X 1.5X NM $300M NASDAQ HILL 14 June 7, 2013
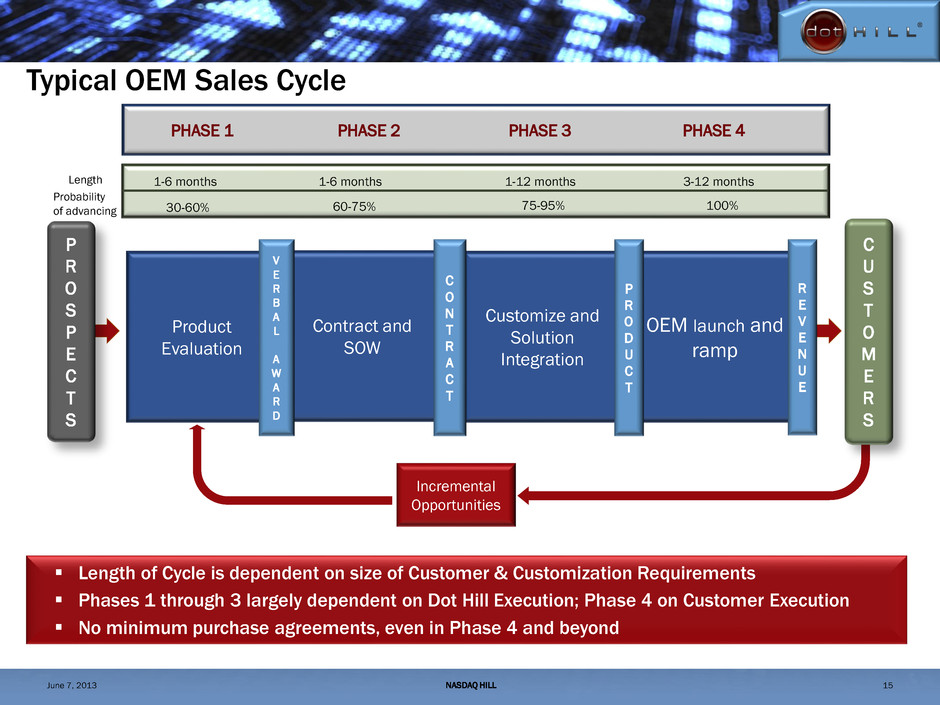
Typical OEM Sales Cycle Length of Cycle is dependent on size of Customer & Customization Requirements Phases 1 through 3 largely dependent on Dot Hill Execution; Phase 4 on Customer Execution No minimum purchase agreements, even in Phase 4 and beyond Incremental Opportunities PHASE 1 PHASE 2 PHASE 3 PHASE 4 Contract and SOW Product Evaluation V E R B A L A W A R D Customize and Solution Integration OEM launch and ramp R E V E N U E C O N T R A C T P R O D U C T P R O S P E C T S C U S T O M E R S NASDAQ HILL 15 1-6 months 1-6 months 1-12 months 3-12 months 30-60% 60-75% 75-95% 100% Length Probability of advancing June 7, 2013
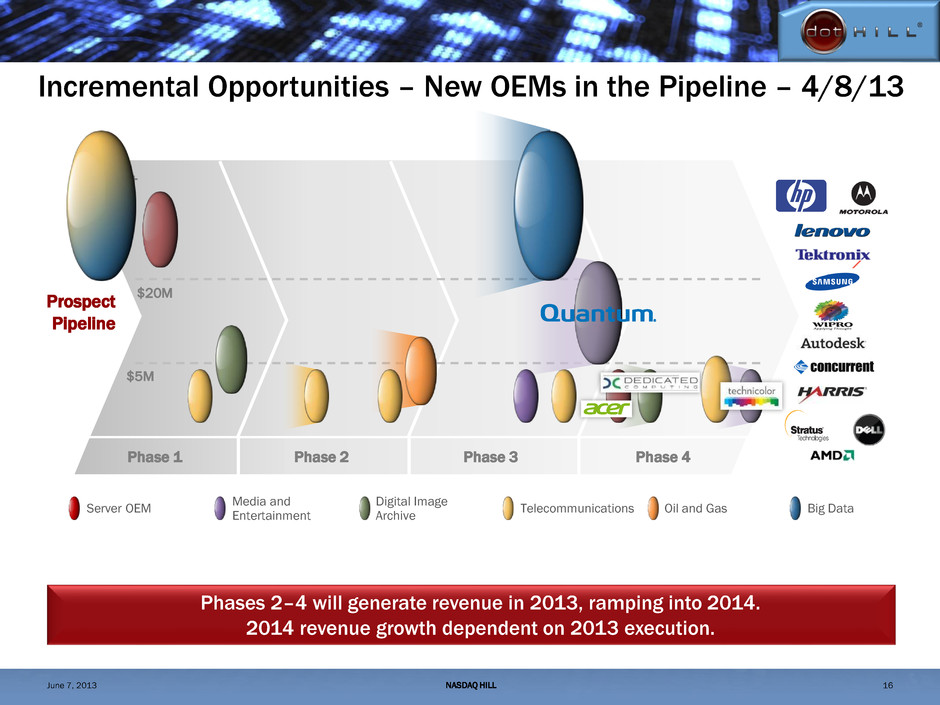
Incremental Opportunities – New OEMs in the Pipeline – 4/8/13 Prospect Pipeline $50M+ $5M $20M Server OEM Digital Image Archive Media and Entertainment Telecommunications Oil and Gas Big Data Phase 1 Phase 4 Phase 2 Phase 3 Phases 2–4 will generate revenue in 2013, ramping into 2014. 2014 revenue growth dependent on 2013 execution. NASDAQ HILL 16 June 7, 2013
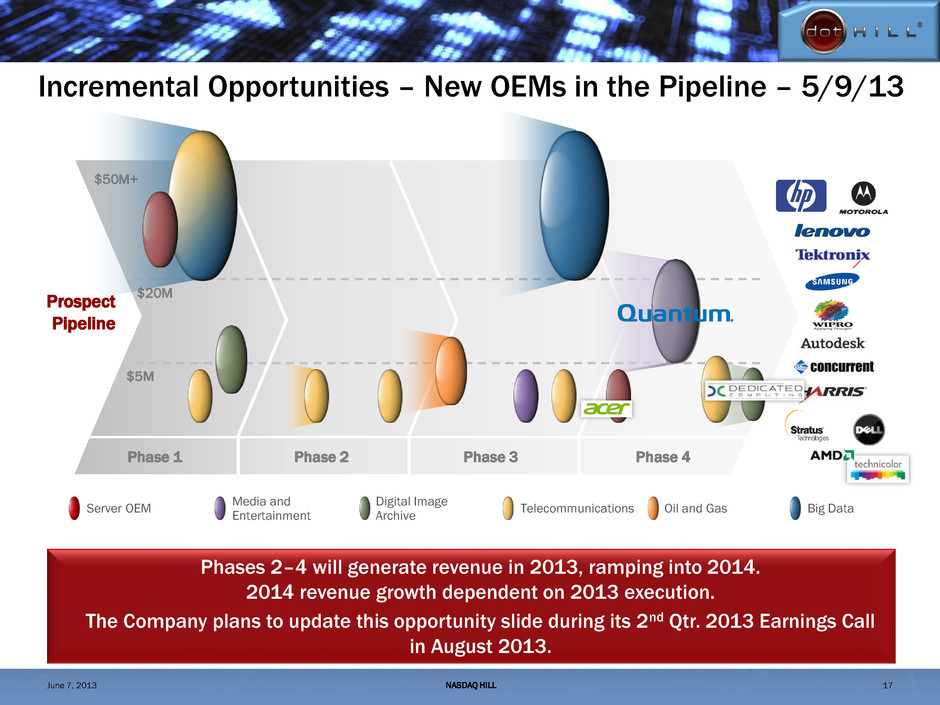
Incremental Opportunities – New OEMs in the Pipeline – 5/9/13 Prospect Pipeline $50M+ $5M $20M Server OEM Digital Image Archive Media and Entertainment Telecommunications Oil and Gas Big Data Phase 1 Phase 4 Phase 2 Phase 3 Phases 2–4 will generate revenue in 2013, ramping into 2014. 2014 revenue growth dependent on 2013 execution. The Company plans to update this opportunity slide during its 2nd Qtr. 2013 Earnings Call in August 2013. NASDAQ HILL 17 June 7, 2013

DRIVING GROWTH NASDAQ: HILL June 7, 2013 Financials and Business Model A STRONG FOUNDATION FOR
About Non-GAAP Financial Measures In 2012 and/or 2013, the Company’s non-GAAP financial measures exclude the impact of stock-based compensation expense, legal settlements and associated expenses, intangible asset amortization, restructuring and severance charges, charges or credits for contingent consideration adjustments, charges for impairment of goodwill and other long-lived assets, specific and significant warranty claims arising from a supplier’s defective products, the impact of our discontinued AssuredUVS software business and the effects of foreign currency gains or losses. The non-GAAP financial measures include the recognition of revenues and directly related costs associated with long term AssuredVRA software contracts, which were deferred and amortized in the Company’s GAAP financial statements. The Company used these non-GAAP measures when evaluating its financial results as well as for internal resource management, planning and forecasting purposes. These non-GAAP measures should not be viewed in isolation from or as a substitute for the Company’s financial results in accordance with GAAP. A reconciliation of GAAP to non-GAAP measures is included in this investor presentation. NASDAQ HILL 19 June 7, 2013
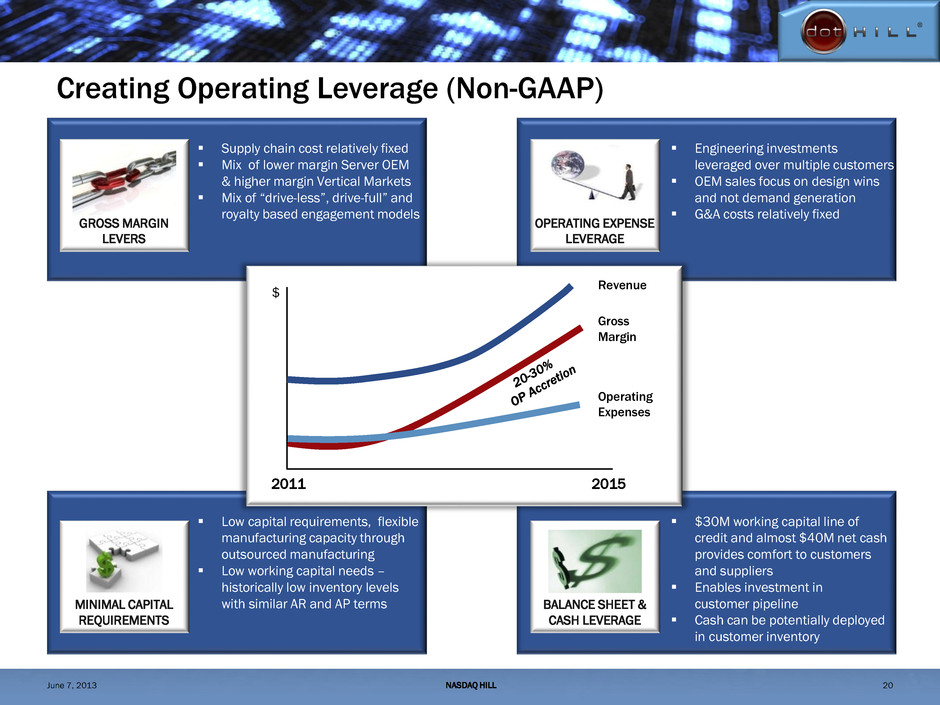
Creating Operating Leverage (Non-GAAP) Revenue Gross Margin Operating Expenses 2011 2015 $ Supply chain cost relatively fixed Mix of lower margin Server OEM & higher margin Vertical Markets Mix of “drive-less”, drive-full” and royalty based engagement models Engineering investments leveraged over multiple customers OEM sales focus on design wins and not demand generation G&A costs relatively fixed Low capital requirements, flexible manufacturing capacity through outsourced manufacturing Low working capital needs – historically low inventory levels with similar AR and AP terms $30M working capital line of credit and almost $40M net cash provides comfort to customers and suppliers Enables investment in customer pipeline Cash can be potentially deployed in customer inventory GROSS MARGIN LEVERS MINIMAL CAPITAL REQUIREMENTS OPERATING EXPENSE LEVERAGE BALANCE SHEET & CASH LEVERAGE NASDAQ HILL 20 June 7, 2013
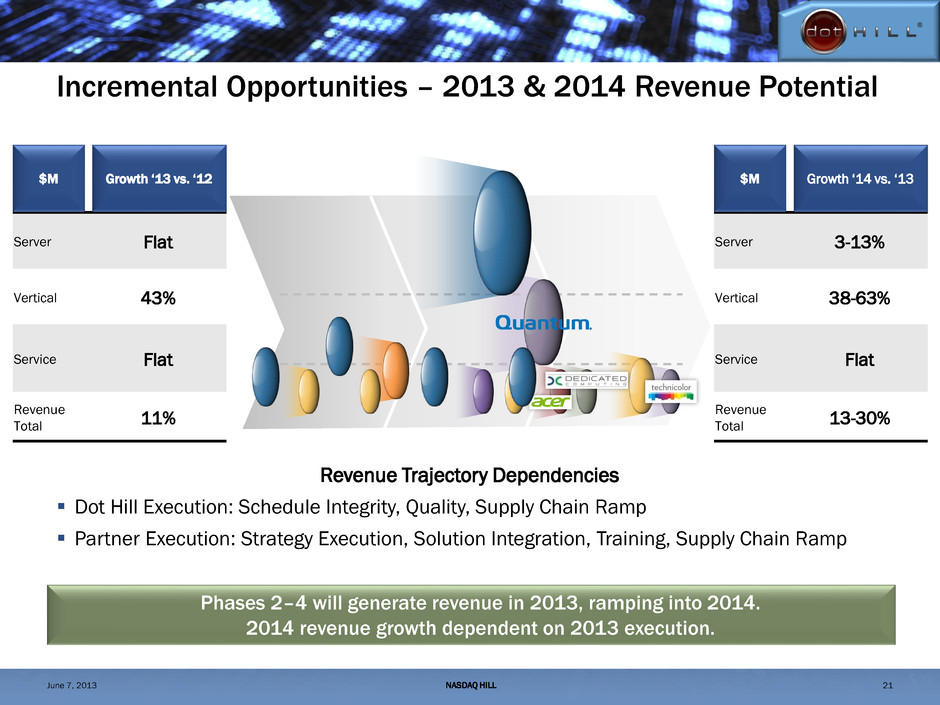
Incremental Opportunities – 2013 & 2014 Revenue Potential Phases 2–4 will generate revenue in 2013, ramping into 2014. 2014 revenue growth dependent on 2013 execution. Server OEM 141 141 Vertical Mkts 48 69 Service 7 7 Revenue Total 197 216 2012 Actuals 2013 Midpoint $M Server OEM 141 145-160 Vertical Mkts 58-80 80-130 Service 7 7 Revenue Total 205-227 231-301 2013 Ranges 2014 Ranges $M Revenue Trajectory Dependencies Dot Hill Execution: Schedule Integrity, Quality, Supply Chain Ramp Partner Execution: Strategy Execution, Solution Integration, Training, Supply Chain Ramp er Flat 43% Flat 11% Growth ‘13 vs. ‘12 er 3-13% 38-63% Flat 13-30% Growth ‘14 vs. ‘13 NASDAQ HILL 21 June 7, 2013
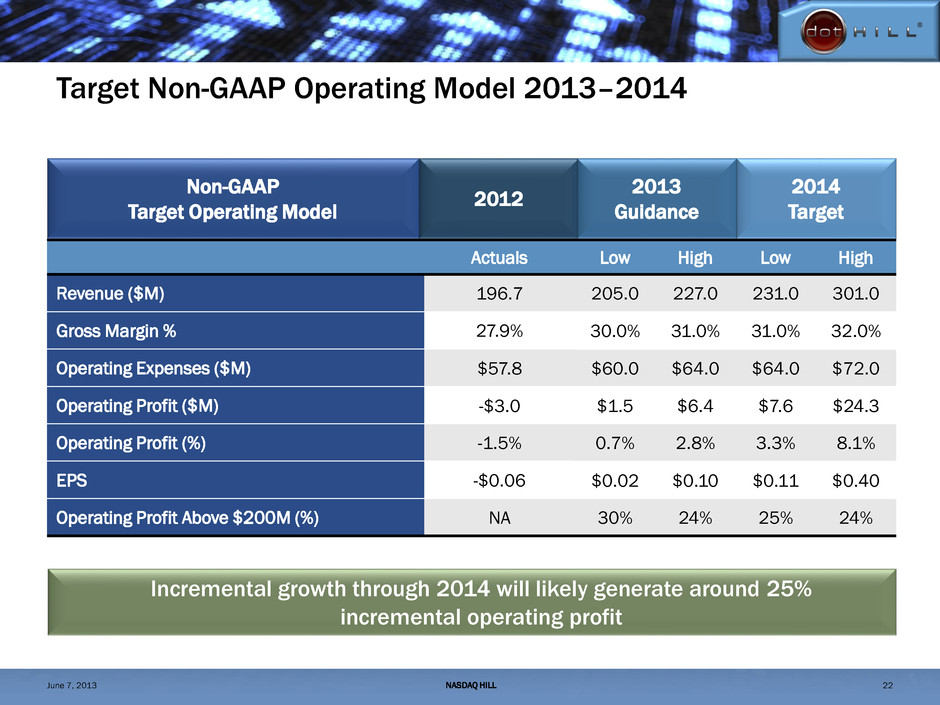
Target Non-GAAP Operating Model 2013–2014 Actuals Revenue ($M) 196.7 Gross Margin % 27.9% Operating Expenses ($M) $57.8 Operating Profit ($M) -$3.0 Operating Profit (%) -1.5% EPS -$0.06 Operating Profit Above $200M (%) NA 2012 Non-GAAP Target Operating Model Incremental growth through 2014 will likely generate around 25% incremental operating profit Low High 205.0 227.0 30.0% 31.0% $60.0 $64.0 $1.5 $6.4 0.7% 2.8% $0.02 $0.10 30% 24% 2013 Guidance Low High 231.0 301.0 31.0% 32.0% $64.0 $72.0 $7.6 $24.3 3.3% 8.1% $0.11 $0.40 25% 24% 2014 Target NASDAQ HILL 22 June 7, 2013
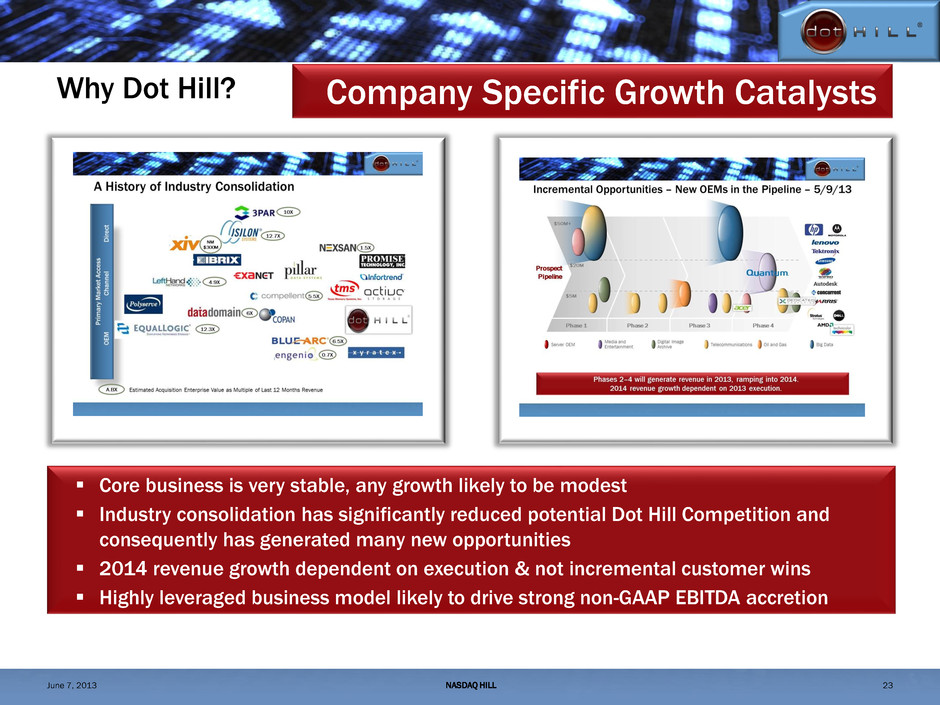
Why Dot Hill? Core business is very stable, any growth likely to be modest Industry consolidation has significantly reduced potential Dot Hill Competition and consequently has generated many new opportunities 2014 revenue growth dependent on execution & not incremental customer wins Highly leveraged business model likely to drive strong non-GAAP EBITDA accretion Company Specific Growth Catalysts NASDAQ HILL 23 June 7, 2013

DRIVING GROWTH NASDAQ: HILL June 7, 2013 Appendix I: Select Financial Results, Q2 and 2013 Guidance A STRONG FOUNDATION FOR
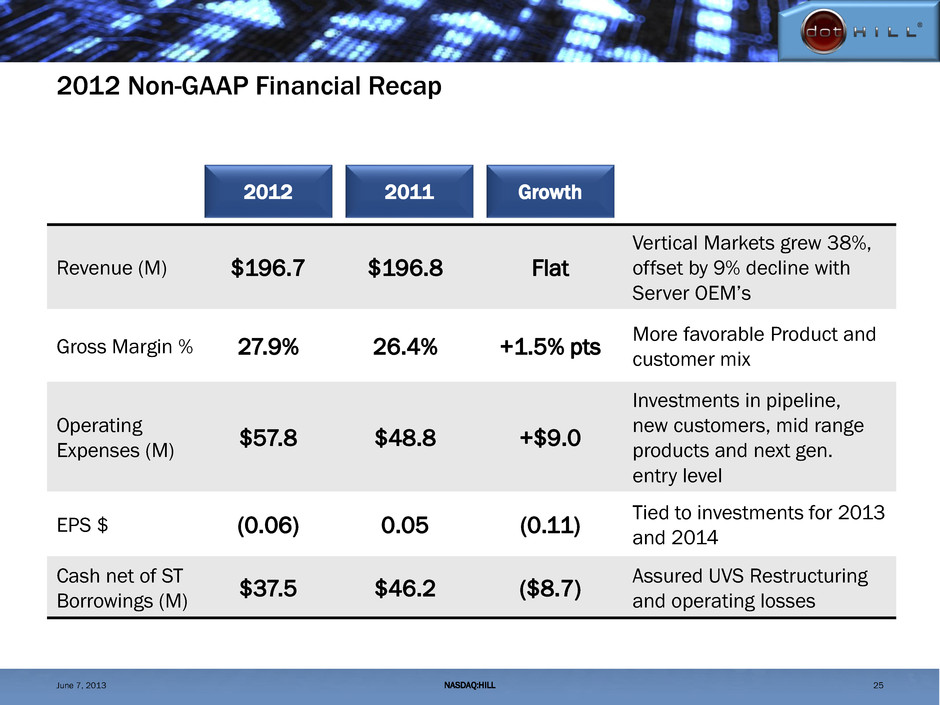
2012 Non-GAAP Financial Recap 25 Revenue (M) $196.7 $196.8 Flat Vertical Markets grew 38%, offset by 9% decline with Server OEM’s Gross Margin % 27.9% 26.4% +1.5% pts More favorable Product and customer mix Operating Expenses (M) $57.8 $48.8 +$9.0 Investments in pipeline, new customers, mid range products and next gen. entry level EPS $ (0.06) 0.05 (0.11) Tied to investments for 2013 and 2014 Cash net of ST Borrowings (M) $37.5 $46.2 ($8.7) Assured UVS Restructuring and operating losses 2012 2011 Growth NASDAQ:HILL June 7, 2013
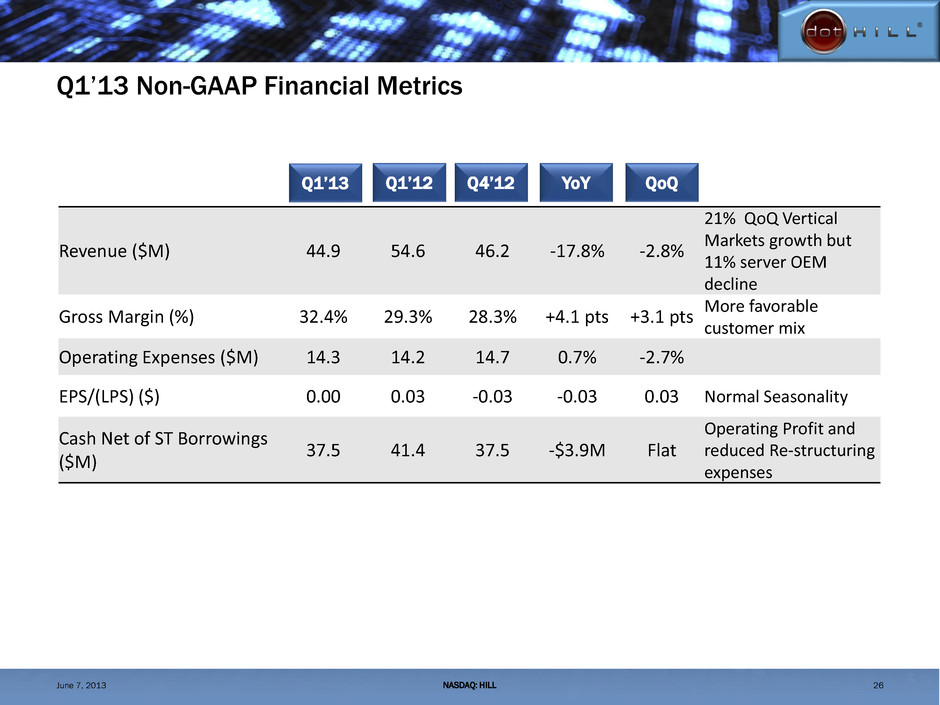
Q1’13 Non-GAAP Financial Metrics NASDAQ: HILL 26 Revenue ($M) 44.9 54.6 46.2 -17.8% -2.8% 21% QoQ Vertical Markets growth but 11% server OEM decline Gross Margin (%) 32.4% 29.3% 28.3% +4.1 pts +3.1 pts More favorable customer mix Operating Expenses ($M) 14.3 14.2 14.7 0.7% -2.7% EPS/(LPS) ($) 0.00 0.03 -0.03 -0.03 0.03 Normal Seasonality Cash Net of ST Borrowings ($M) 37.5 41.4 37.5 -$3.9M Flat Operating Profit and reduced Re-structuring expenses Q1’13 Q1’12 Q4’12 YoY QoQ June 7, 2013
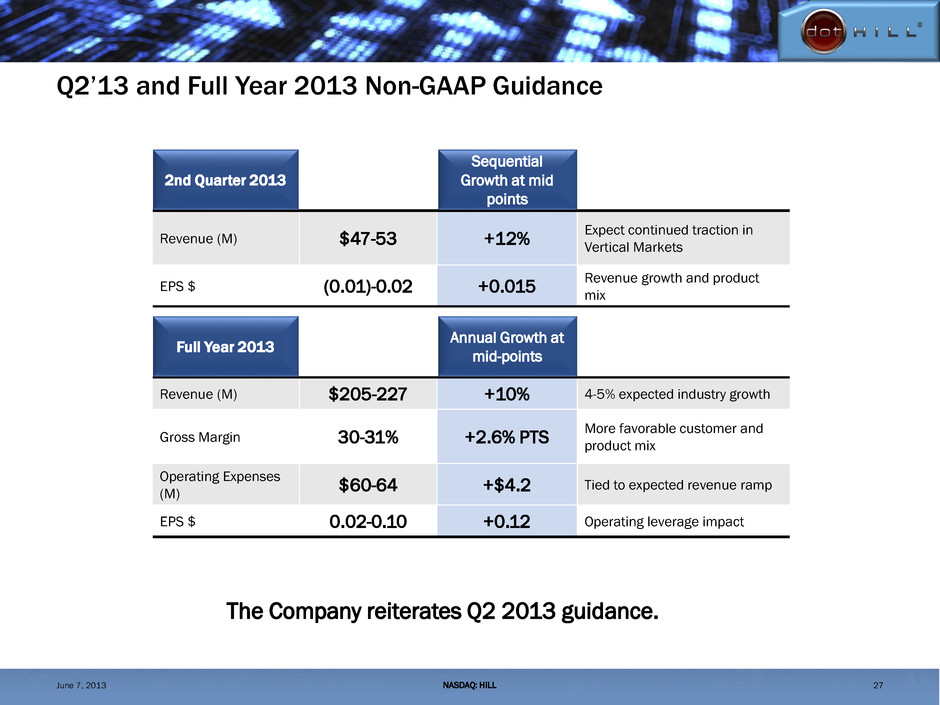
Q2’13 and Full Year 2013 Non-GAAP Guidance 27 Revenue (M) $47-53 +12% Expect continued traction in Vertical Markets EPS $ (0.01)-0.02 +0.015 Revenue growth and product mix 2nd Quarter 2013 Sequential Growth at mid points Revenue (M) $205-227 +10% 4-5% expected industry growth Gross Margin 30-31% +2.6% PTS More favorable customer and product mix Operating Expenses (M) $60-64 +$4.2 Tied to expected revenue ramp EPS $ 0.02-0.10 +0.12 Operating leverage impact Full Year 2013 Annual Growth at mid-points NASDAQ: HILL June 7, 2013 The Company reiterates Q2 2013 guidance.
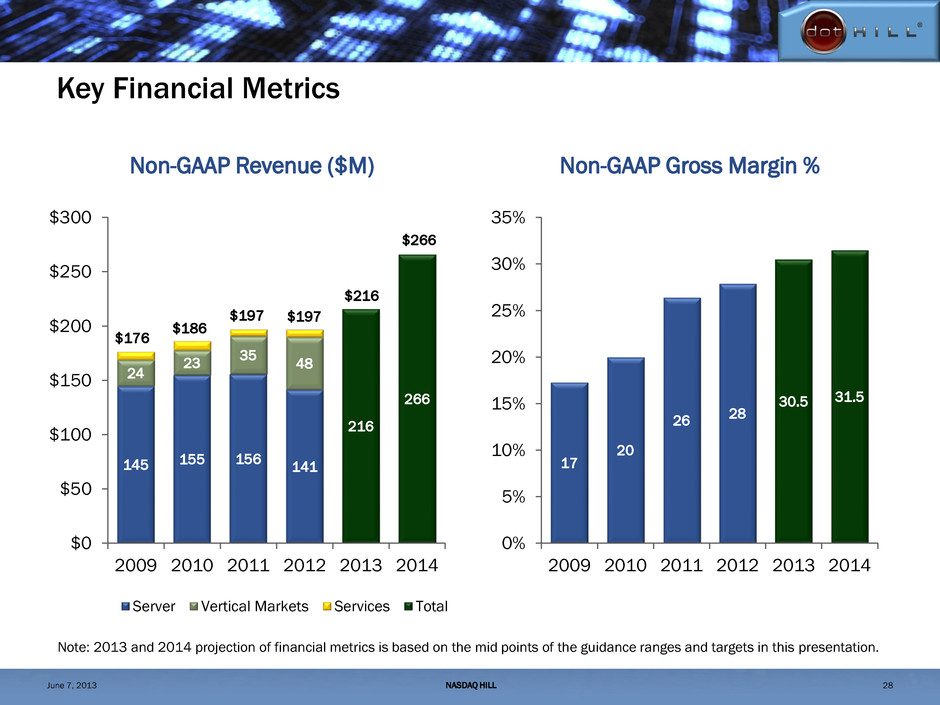
Key Financial Metrics 145 155 156 141 24 23 35 48 216 266 $0 $50 $100 $150 $200 $250 $300 2009 2010 2011 2012 2013 2014 Server Vertical Markets Services Total Non-GAAP Revenue ($M) Non-GAAP Gross Margin % Note: 2013 and 2014 projection of financial metrics is based on the mid points of the guidance ranges and targets in this presentation. $176 $186 $197 $197 $216 $266 17 20 26 28 30.5 31.5 0% 5% 10% 15% 20% 25% 30% 35% 2009 2010 2011 2012 2013 2014 NASDAQ HILL 28 June 7, 2013
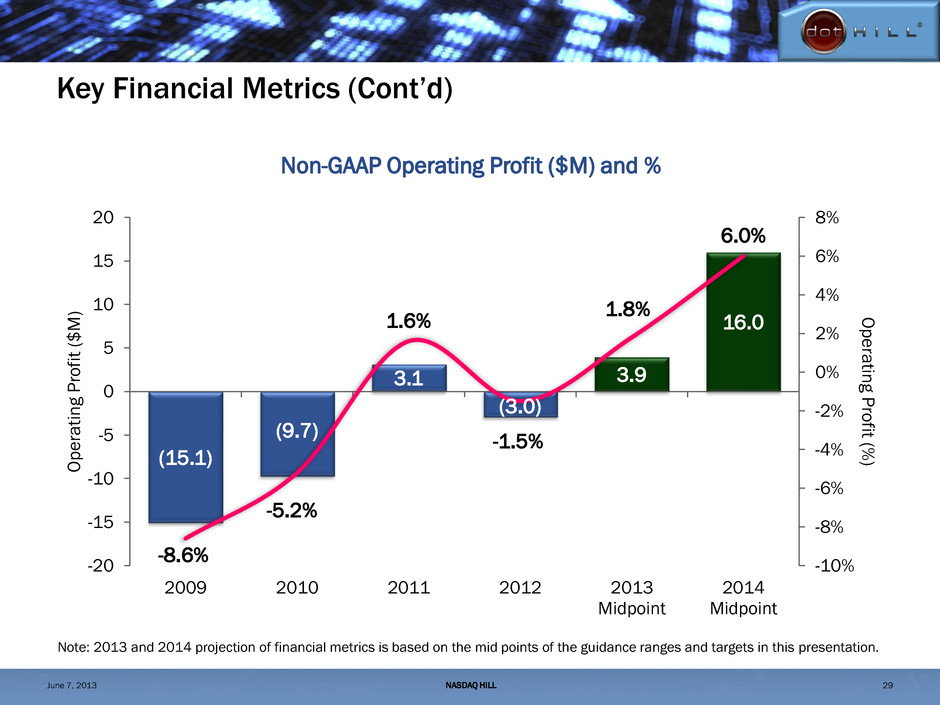
Key Financial Metrics (Cont’d) (15.1) (9.7) 3.1 (3.0) 3.9 16.0 -8.6% -5.2% 1.6% -1.5% 1.8% 6.0% -10% -8% -6% -4% -2% 0% 2% 4% 6% 8% -20 -15 -10 -5 0 5 10 15 20 2009 2010 2011 2012 2013 Midpoint 2014 Midpoint O p e ratin g P ro fit (% ) Operat in g P ro fit ($ M ) Non-GAAP Operating Profit ($M) and % Note: 2013 and 2014 projection of financial metrics is based on the mid points of the guidance ranges and targets in this presentation. NASDAQ HILL 29 June 7, 2013

DRIVING GROWTH NASDAQ: HILL June 7, 2013 Appendix II: Reconciliation of GAAP to Non-GAAP Financial Measures A STRONG FOUNDATION FOR
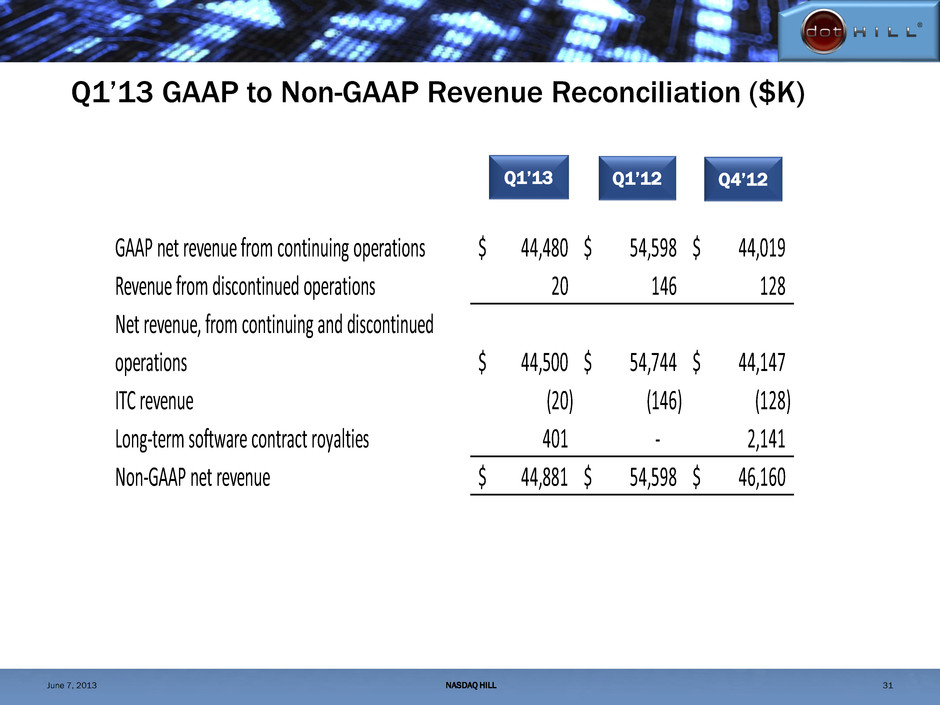
Q1’13 GAAP to Non-GAAP Revenue Reconciliation ($K) Q1’13 Q1’12 Q4’12 GAAP net revenue from continuing operations 44,480$ 54,598$ 44,019$ Revenue from discontinued operations 20 146 128 Net revenue, from continuing and discontinued operations 44,500$ 54,744$ 44,147$ ITC revenue (20) (146) (128) Long-term software contract royalties 401 - 2,141 Non-GAAP net revenue 44,881$ 54,598$ 46,160$ NASDAQ HILL 31 June 7, 2013

Q1’13 GAAP to Non-GAAP Gross Profit Reconciliation ($K) Q1’13 Q1’12 Q4’12 GAAP gross profit from continuing operations 14,440$ 15,565$ 7,877$ Gross margin % from continuing operations 32.5% 28.5% 17.9% Gross profit from discontinued operations (111) (391) - Gross profit from continuing and discontinued operations 14,329 15,174 7,877 Gross margin % from continuing and discontinued operations 32.2% 27.7% 17.8% Stock-based compensation 96 172 135 Severance costs 23 6 4 Power supply component failures (808) - - ITC revenue (20) (147) (128) ITC expe ses 129 356 128 Long-term software contract royalties 401 - 2,141 Long-term software contract cost 256 - 2,885 Intangible asset amortization - 441 - Non-GAAP gross profit 14,406$ 16,002$ 13,042$ Non-GAAP gross margin % 32.1% 29.3% 28.3% NASDAQ HILL 32 June 7, 2013
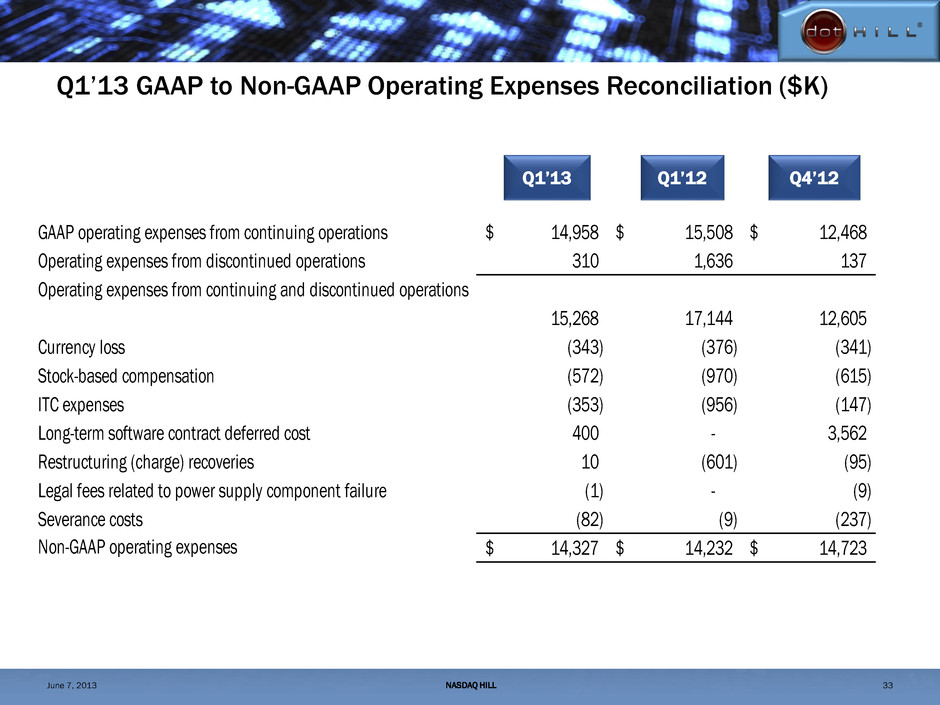
Q1’13 GAAP to Non-GAAP Operating Expenses Reconciliation ($K) Q1’13 Q1’12 Q4’12 GAAP operating expenses from continuing operations 14,958$ 15,508$ 12,468$ Operating expenses from discontinued operations 310 1,636 137 Operating expenses from continuing and discontinued operations 15,268 17,144 12,605 Currency loss (343) (376) (341) Stock-based compensation (572) (970) (615) ITC expenses (353) (956) (147) Long-term software contract deferred cost 400 - 3,562 Restructuring (charge) recoveries 10 (601) (95) Legal fees related to power supply component failure (1) - (9) Severance costs (82) (9) (237) Non-GAAP operating expenses 14,327$ 14,232$ 14,723$ NASDAQ HILL 33 June 7, 2013
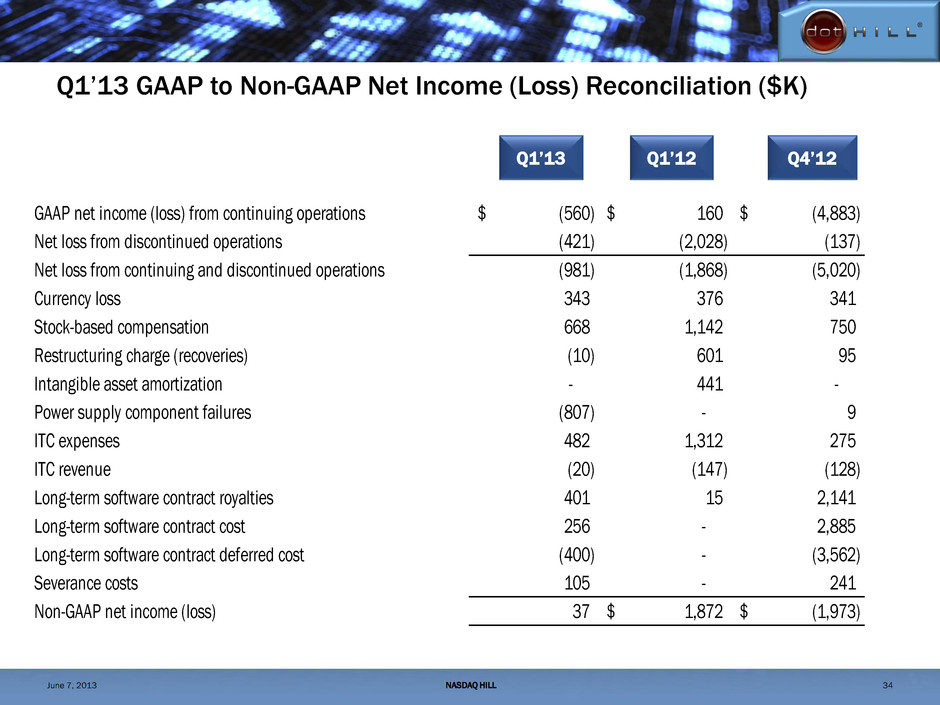
Q1’13 GAAP to Non-GAAP Net Income (Loss) Reconciliation ($K) Q1’13 Q1’12 Q4’12 GAAP net income (loss) from continuing operations (560)$ 160$ (4,883)$ Net loss from discontinued operations (421) (2,028) (137) Net loss from continuing and discontinued operations (981) (1,868) (5,020) Currency loss 343 376 341 Stock-based compensation 668 1,142 750 Restructuring charge (recoveries) (10) 601 95 Intangible asset amortization - 441 - Power supply component failures (807) - 9 ITC expenses 482 1,312 275 ITC revenue (20) (147) (128) Long-term software contract royalties 401 15 2,141 Long-term software contract cost 256 - 2,885 Long-term software contract deferred cost (400) - (3,562) Severance costs 105 - 241 Non-GAAP net income (loss) 37 1,872$ (1,973)$ NASDAQ HILL 34 June 7, 2013

Q1’13 GAAP to Non-GAAP EPS (LPS) Reconciliation Q1’13 Q1’12 Q4’12 GAAP earnings (loss) per share from continuing operations (0.01)$ -$ (0.08)$ Loss per share from discontinued operations (0.01) (0.04) (0.00) Loss per share from continuing and discontinued operations* (0.02) (0.03) (0.09) Currency loss 0.01 0.01 0.01 Intangible asset amortization - 0.01 - Stock-based compensation 0.01 0.02 0.01 ITC expenses 0.01 0.02 - Long-term software contract royalties 0.01 - 0.04 Long-term software contract cost - - 0.05 Long-term software contract deferred cost (0.01) - (0.06) Other adjustments (0.01) - 0.01 Non-GAAP earnings (loss) per share* -$ 0.03$ (0.03)$ Weighted average shares used to calculate earnings (loss) per share: Basic 58,001 56,030 57,501 Diluted 58,473 56,558 57,501 NASDAQ HILL 35 *Per share data may not always add to the total for the period because each figure is independently calculated June 7, 2013
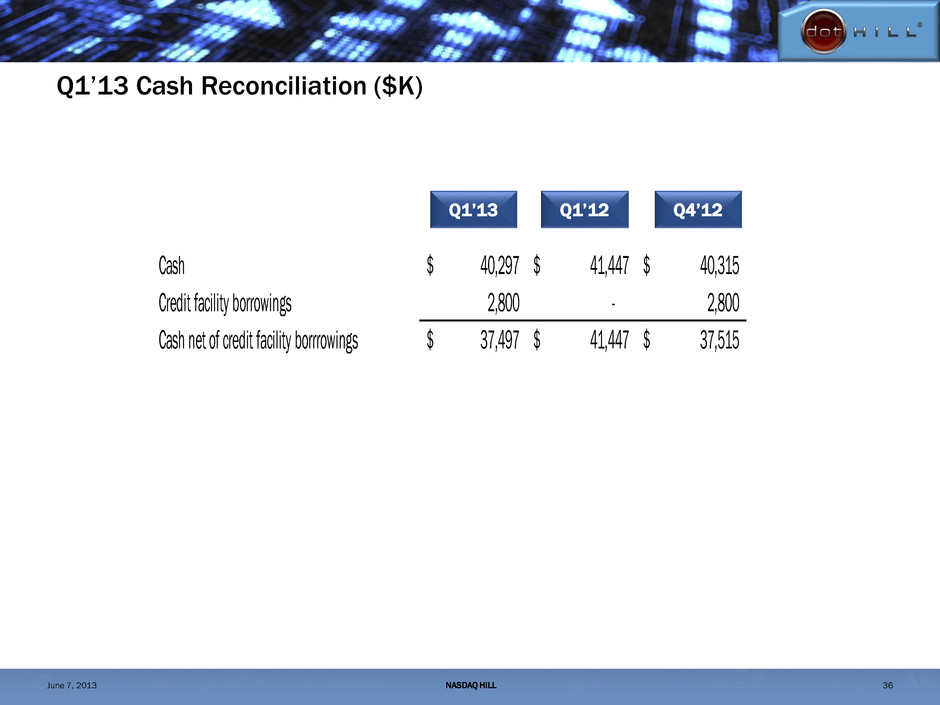
Q1’13 Cash Reconciliation ($K) Q1’13 Q1’12 Q4’12 Cash 40,297$ 41,447$ 40,315$ Credit facility borrowings 2,800 - 2,800 Cash net of credit facility borrrowings 37,497$ 41,447$ 37,515$ NASDAQ HILL 36 June 7, 2013


