EXHIBIT 99.2
Equity One, Inc. Supplemental Information Package |
Equity One, Inc. | ||
1600 N.E. Miami Gardens Drive | ||
North Miami Beach, Florida 33179 | ||
Tel: (305) 947-1664 Fax: (305) 947-1734 | ||
www.equityone.net |
Equity One, Inc.
SUPPLEMENTAL INFORMATION
September 30, 2005
(unaudited)
TABLE OF CONTENTS | |
Page | |
DISCLOSURES | 3 |
FINANCIAL HIGHLIGHTS - OPERATING RATIOS | 4 |
FINANCIAL HIGHLIGHTS - DEBT RATIOS - QUARTERLY BREAKOUT | 5 |
EARNINGS BEFORE INTEREST, TAXES, DEPRECIATION and AMORTIZATION (EBITDA) | 6 |
NET OPERATING INCOME | 7 |
MARKET CAPITALIZATION - QUARTERLY BREAKOUT | 8 |
CONSOLIDATED STATEMENTS OF OPERATIONS | 9 |
CONSOLIDATED STATEMENTS OF OPERATIONS - QUARTERLY BREAKOUT | 10 |
PRO FORMA FINANCIAL INFORMATION FOR DISCONTINUED OPERATIONS | 11 |
CONSOLIDATED STATEMENTS OF FUNDS FROM OPERATIONS | 13 |
CONSOLIDATED STATEMENTS OF FUNDS FROM OPERATIONS - QUARTERLY BREAKOUT | 14 |
CONSOLIDATED STATEMENTS OF FUNDS AVAILABLE FOR DISTRIBUTION | 15 |
CONSOLIDATED STATEMENTS OF FUNDS AVAILABLE FOR DISTRIBUTION - QUARTERLY BREAKOUT | 16 |
CONSOLIDATED BALANCE SHEETS | 17 |
DEBT SUMMARY | 18 |
DEBT MATURITIES | 22 |
PROPERTY STATUS REPORT | 23 |
ANNUAL MINIMUM RENT BY STATE | 32 |
LEASING ACTIVITY AND OCCUPANCY STATISTICS | 33 |
TENANT CONCENTRATION SCHEDULES | 35 |
SHOPPING CENTER LEASE EXPIRATION SCHEDULES | 37 |
REAL ESTATE DEVELOPMENTS AND REDEVELOPMENTS | 41 |
REAL ESTATE ACQUISITIONS AND DISPOSITIONS | 42 |
ANALYST COVERAGE | 43 |
EQUITY ONE, INC. AND SUBSIDIARIES
DISCLOSURES
As of September 30, 2005
Forward Looking Statements
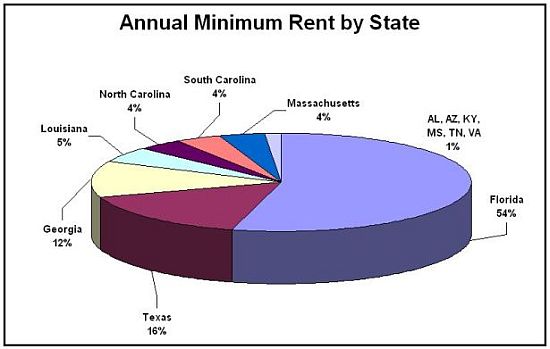
Certain information contained in this Supplemental Information Package constitute forward-looking statements within the meaning of the federal securities laws. Although Equity One believes that the expectations reflected in such forward-looking statements are based upon reasonable assumptions, it can give no assurance that these expectations will be achieved. Factors that could cause actual results to differ materially from current expectations include changes in macro-economic conditions and the demand for retail space in Florida, Texas, Georgia, Massachusetts and the other states in which Equity One owns properties; the continuing financial success of Equity One's current and prospective tenants; continuing supply constraints in its geographic markets; the availability of properties for acquisition; the success of its efforts to lease up vacant space; the effects of natural and other disasters; the ability of Equity One to successfully integrate the operations and systems of acquired companies and properties; and other risks, which are described in Equity One's filings with the Securities and Exchange Commission.
Basis of Presentation
The information contained in the Supplemental Information Package does not purport to disclose all items required by GAAP. The Company 's Form 10-K for the year ended December 31, 2004 and Form 10-Q for the period ended September 30, 2005 should be read in conjunction with the above information. The results of operations of any property acquired are included in our financial statements since the date of its acquisition.
Use of EBITDA as a Non-GAAP Financial Measure
EBITDA is a widely used performance measure and is provided as a supplemental measure of operating performance. We compute EBITDA as the sum of net income before extraordinary items, depreciation and amortization, income taxes, interest expense, gain (loss) on disposal of income producing properties, and impariment of real estate. Given the nature of the Company's business as a real estate owner and operator, the Company believes that the use of EBITDA as opposed to earnings in various financial ratios is helpful to investors as a measure of our operational performance because EBITDA excludes various items included in earnings that do not relate to or are not indicative of our operating performance, such as gains and losses on sales of real estate and real estate related depreciation and amortization, and includes the results of operations of real estate properties that were sold or classified as real estate held for sale either during or subsequent to the end of a particular reporting period, which are included in earnings on a net basis. Accordingly, we believe that the use of EBITDA as opposed to earnings in various ratios provides a meaningful performance measure as it relates to our ability to meet various coverage tests for the stated periods.
EBITDA should not be considered as an alternative to earnings as an indicator of our financial performance, or as an alternative to cash flow from operating activities as a measure of our liquidity. Our computation of EBITDA may differ from the methodology utilized by other companies to calculate EBITDA. Investors are cautioned that items excluded from EBITDA are significant components in understanding and assessing the Company's financial performance.
Use of Funds from Operations as a Non-GAAP Financial Measure
We believe Funds from Operations (FFO) (combined with the primary GAAP presentations) is a useful supplemental measure of our operating performance that is a recognized metric used extensively by the real estate industry, particularly REITs. NAREIT stated in its April 2002 White Paper on FFO, "Historical cost accounting for real estate assets implicity assumes that the value of real estate assets diminishes predictably over time.Since real estate values have historically risen or fallen with market conditions many industry investors have considered presentations of operating results for real estate companies that use historical cost accounting to be insufficient by themselves." FFO, as defined by NAREIT, is "net income (computed in accordance with GAAP), excluding (gains or losses) from sales of property, plus depreciation and amortization, and after adjustments for unconsolidated partnerships and joint ventures. Adjustments for unconsolidated partnerships and joint ventures will be calculated to reflect funds from operations on the same basis."
We believe that financial analysts, investors and stockholders are better served by the presentation of comparable period operating results generated from our FFO measure. Our method of calculating FFO may be different from methods used by other REITs and accordingly, may not be comparable to such other REITs. FFO is presented to assist investors in analyzing our operating performance. FFO (i) does not represent cash flow from operations as defined by GAAP, (ii) is not indicative of cash available to fund all cash flow needs, including the ability to make distributions, (iii) is not an alternative to cashflow as measure of liquidity, and (iv) should not be considered as an alternative to net income (which is determined in accordance with GAAP) for purposes of evaluating our operating performance. We believe net income is the most directly comparable GAAP measure to FFO.
Page 3
EQUITY ONE, INC. AND SUBSIDIARIES | ||||||||||||||||
FINANCIAL HIGHLIGHTS - OPERATING RATIOS | ||||||||||||||||
As of September 30, 2005 | ||||||||||||||||
(in thousands, except per share data) | ||||||||||||||||
For the three months ended | For the nine months ended | For the year ended | ||||||||||||||
Sep 30, 2005 | Sep 30, 2004 | Sep 30, 2005 | Sep 30, 2004 | Dec 31, 2004 | ||||||||||||
Selected Operating Items: | ||||||||||||||||
Total rental revenue* | $ | 62,023 | $ | 59,973 | $ | 189,590 | $ | 174,788 | $ | 239,087 | ||||||
Property operating expenses* | 16,329 | 16,780 | 48,232 | 46,538 | 63,395 | |||||||||||
General & administrative expenses (G&A)* | 4,232 | 3,722 | 12,942 | 10,980 | 16,601 | |||||||||||
Net income | $ | 28,041 | $ | 30,701 | $ | 74,974 | $ | 69,475 | $ | 76,628 | ||||||
Net income per diluted share | 0.37 | 0.43 | 1.00 | 0.98 | 1.37 | |||||||||||
Income from continuing operations | $ | 17,576 | $ | 13,258 | $ | 49,685 | $ | 37,961 | $ | 52,942 | ||||||
Income from continuing operations per diluted share | 0.23 | 0.19 | 0.67 | 0.54 | 0.75 | |||||||||||
Funds from operations (FFO) | $ | 32,906 | $ | 28,050 | $ | 95,906 | $ | 83,297 | $ | 113,471 | ||||||
FFO per diluted share | 0.44 | 0.39 | 1.28 | 1.16 | 1.58 | |||||||||||
Funds available for distribution (FAD) | $ | 25,670 | $ | 22,748 | $ | 74,005 | $ | 68,612 | $ | 92,613 | ||||||
FAD per diluted share | 0.34 | 0.31 | 0.99 | 0.96 | 1.29 | |||||||||||
Total dividends paid per share | $ | 0.29 | $ | 0.28 | $ | 0.87 | $ | 0.84 | $ | 1.13 | ||||||
Operating Ratios: | ||||||||||||||||
Net operating income margin (see page 7)* | 73.7 | % | 72.0 | % | 74.6 | % | 73.4 | % | 73.5 | % | ||||||
Expense recovery ratio (expense recoveries/operating expenses)* | 78.5 | % | 78.5 | % | 82.1 | % | 79.0 | % | 79.2 | % | ||||||
EBITDA margin (see page 6)* | 69.7 | % | 66.5 | % | 69.0 | % | 67.4 | % | 66.9 | % | ||||||
EBITDA to interest coverage ratio* | 3.4 | 3.3 | 3.5 | 3.4 | 3.4 | |||||||||||
G&A as % of total revenues* | 6.2 | % | 6.1 | % | 6.6 | % | 6.2 | % | 6.9 | % | ||||||
G&A as % of total assets (annualized) | 0.84 | % | 0.79 | % | 0.86 | % | 0.78 | % | 0.83 | % | ||||||
Dividend / FFO payout ratio | 65.9 | % | 71.8 | % | 68.0 | % | 72.4 | % | 71.5 | % | ||||||
FFO multiple (annualized if < 12 months) | 13.2 | 12.6 | 13.6 | 12.7 | 15.0 | |||||||||||
Dividend / FAD payout ratio | 85.3 | % | 90.3 | % | 87.9 | % | 87.5 | % | 87.6 | % | ||||||
FAD multiple (annualized if < 12 months) | 17.1 | 15.8 | 17.6 | 15.3 | 18.4 |
* The indicated line item includes amounts reported in discontinued operations (except for any gain/(loss) on the disposal of income producing property).
Page 4
EQUITY ONE, INC. AND SUBSIDIARIES | ||||||||||||||||||||||
FINANCIAL HIGHLIGHTS - DEBT RATIOS - QUARTERLY BREAKOUT | ||||||||||||||||||||||
As of September 30, 2005 | ||||||||||||||||||||||
(in thousands, except per share data) | ||||||||||||||||||||||
As of | ||||||||||||||||||||||
Sep 30, 2005 | Jun 30, 2005 | Mar 31, 2005 | Dec 31, 2004 | Sep 30, 2004 | Jun 30, 2004 | Mar 31, 2004 | ||||||||||||||||
Fixed rate debt | $ | 819,546 | $ | 701,513 | $ | 733,982 | $ | 742,317 | $ | 730,739 | $ | 747,741 | $ | 720,263 | ||||||||
Fixed rate debt - swapped to variable rate | 100,000 | 100,000 | 100,000 | 100,000 | 100,000 | 100,000 | 100,000 | |||||||||||||||
Variable rate debt - swapped to fixed rate | - | - | - | - | - | 20,000 | 20,000 | |||||||||||||||
Variable rate debt - unhedged | 39,000 | 184,161 | 144,763 | 147,000 | 64,000 | 71,616 | 30,879 | |||||||||||||||
Total debt* | $ | 958,546 | $ | 985,674 | $ | 978,745 | $ | 989,317 | $ | 894,739 | $ | 939,357 | $ | 871,142 | ||||||||
% Fixed rate debt | 85.50 | % | 71.17 | % | 74.99 | % | 75.03 | % | 81.67 | % | 79.60 | % | 82.68 | % | ||||||||
% Fixed rate debt - swapped to variable rate | 10.43 | % | 10.15 | % | 10.22 | % | 10.11 | % | 11.18 | % | 10.65 | % | 11.48 | % | ||||||||
% Variable rate debt - swapped to fixed rate | - | - | - | - | - | 2.13 | % | 2.30 | % | |||||||||||||
% Variable rate debt - unhedged | 4.07 | % | 18.68 | % | 14.79 | % | 14.86 | % | 7.15 | % | 7.62 | % | 3.54 | % | ||||||||
Total | 100.00 | % | 100.00 | % | 100.00 | % | 100.00 | % | 100.00 | % | 100.00 | % | 100.00 | % | ||||||||
% Variable rate debt - total | 14.50 | % | 28.83 | % | 25.01 | % | 24.97 | % | 18.33 | % | 18.27 | % | 15.02 | % | ||||||||
Secured mortgage debt | $ | 449,546 | $ | 454,203 | $ | 488,817 | $ | 495,056 | $ | 480,739 | $ | 497,741 | $ | 470,263 | ||||||||
Unsecured debt | 509,000 | 531,471 | 489,928 | 494,261 | 414,000 | 441,616 | 400,879 | |||||||||||||||
Total debt* | $ | 958,546 | $ | 985,674 | $ | 978,745 | $ | 989,317 | $ | 894,739 | $ | 939,357 | $ | 871,142 | ||||||||
% Secured mortgage debt | 46.90 | % | 46.08 | % | 49.94 | % | 50.04 | % | 53.73 | % | 52.99 | % | 53.98 | % | ||||||||
% Unsecured debt | 53.10 | % | 53.92 | % | 50.06 | % | 49.96 | % | 46.27 | % | 47.01 | % | 46.02 | % | ||||||||
Total | 100.00 | % | 100.00 | % | 100.00 | % | 100.00 | % | 100.00 | % | 100.00 | % | 100.00 | % | ||||||||
Total market capitalization (from page 8) | $ | 2,710,423 | $ | 2,690,123 | $ | 2,515,416 | $ | 2,746,539 | $ | 2,321,138 | $ | 2,235,352 | $ | 2,242,810 | ||||||||
% Secured mortgage debt | 16.59 | % | 16.88 | % | 19.43 | % | 18.02 | % | 20.71 | % | 22.27 | % | 20.97 | % | ||||||||
% Unsecured debt | 18.78 | % | 19.76 | % | 19.48 | % | 18.00 | % | 17.84 | % | 19.76 | % | 17.87 | % | ||||||||
Total debt : Total market capitalization | 35.37 | % | 36.64 | % | 38.91 | % | 36.02 | % | 38.55 | % | 42.02 | % | 38.84 | % | ||||||||
Weighted-average interest rate on secured mortgage debt | 7.24 | % | 7.24 | % | 7.26 | % | 7.26 | % | 7.22 | % | 7.25 | % | 7.40 | % | ||||||||
Weighted-average interest rate on senior unsecured notes** | 5.42 | % | 5.08 | % | 5.10 | % | 5.12 | % | 5.14 | % | 5.16 | % | 5.18 | % | ||||||||
Weighted-average interest rate on revolving credit facilities | 4.15 | % | 3.69 | % | 3.19 | % | 2.80 | % | 2.13 | % | 2.05 | % | 2.15 | % | ||||||||
Weighted-average maturity on mortgage debt | 5.6 years | 5.8 years | 5.6 years | 5.8 years | 5.9 years | 6.1 years | 6.4 years | |||||||||||||||
Weighted-average maturity on senior unsecured notes | 4.8 years | 3.3 years | 3.5 years | 3.7 years | 3.9 years | 4.2 years | 4.5 years |
* | excluding unamortized premium/discount | |
** | excluding the effect of interest rate swaps |
Page 5
EQUITY ONE, INC. AND SUBSIDIARIES | ||||||||||||||||
EARNINGS BEFORE INTEREST, TAXES, DEPRECIATION and AMORTIZATION (EBITDA) | ||||||||||||||||
For the quarter ended September 30, 2005 | ||||||||||||||||
(in thousands, except per share data) | ||||||||||||||||
For the | ||||||||||||||||
For the three months ended | For the nine months ended | year ended | ||||||||||||||
Sep 30, 2005 | Sep 30, 2004 | Sep 30, 2005 | Sep 30, 2004 | Dec 31, 2004 | ||||||||||||
Net income | $ | 28,041 | $ | 30,701 | $ | 74,974 | $ | 69,475 | $ | 97,804 | ||||||
Minority interest* | 48 | 239 | 144 | 642 | 689 | |||||||||||
Interest expense* | 13,889 | 12,415 | 39,170 | 34,892 | 47,129 | |||||||||||
(Gain)/loss on disposal of income producing property | (6,088 | ) | (12,215 | ) | (11,460 | ) | (13,767 | ) | (22,176 | ) | ||||||
Amortization of deferred financing fees* | 372 | 409 | 1,120 | 1,080 | 1,459 | |||||||||||
Rental property depreciation and amortization* | 10,926 | 9,276 | 32,308 | 26,798 | 37,023 | |||||||||||
EBITDA* | $ | 47,188 | $ | 40,825 | $ | 136,256 | $ | 119,120 | $ | 161,928 | ||||||
Interest expense* | $ | 13,889 | $ | 12,415 | $ | 39,170 | $ | 34,892 | $ | 47,129 | ||||||
EBITDA : interest coverage ratio* | 3.4 | 3.3 | 3.5 | 3.4 | 3.4 | |||||||||||
Revenue | ||||||||||||||||
Total rental revenue* | $ | 62,023 | $ | 59,973 | $ | 189,590 | $ | 174,788 | $ | 239,087 | ||||||
Investment income | 5,593 | 1,210 | 7,516 | 1,612 | 2,346 | |||||||||||
Other income | 133 | 174 | 324 | 297 | 537 | |||||||||||
Total revenue* | $ | 67,749 | $ | 61,357 | $ | 197,430 | $ | 176,697 | $ | 241,970 | ||||||
EBITDA margin (EBITDA/total revenue)* | 69.7 | % | 66.5 | % | 69.0 | % | 67.4 | % | 66.9 | % | ||||||
Total market capitalization (see page 8) | $ | 2,710,423 | $ | 2,235,352 | $ | 2,710,423 | $ | 2,235,352 | $ | 2,746,539 | ||||||
Total market capitalization to EBITDA multiple* | 14.4 | 13.7 | 14.9 | 14.1 | 17.0 |
* The indicated line item includes amounts reported in discontinued operations (except for any gain/(loss) on the disposal of income producing property).
Page 6
EQUITY ONE, INC. AND SUBSIDIARIES | |||||||||||||||||||
NET OPERATING INCOME | |||||||||||||||||||
For the quarter ended September 30, 2005 | |||||||||||||||||||
(in thousands, except per share data) | |||||||||||||||||||
For the three months ended | Percent | For the nine months ended | Percent | ||||||||||||||||
Sep 30, 2005 | Sep 30, 2004 | Change | Sep 30, 2005 | Sep 30, 2004 | Change | ||||||||||||||
_____________ | _____________ | _____________ | _____________ | ||||||||||||||||
Net operating income (1) | |||||||||||||||||||
Total rental revenue | 62,023 | 59,973 | 3.4 | % | 189,590 | 174,788 | 8.5 | % | |||||||||||
Property operating expenses (2) | 16,329 | 16,780 | (2.7 | %) | 48,232 | 46,538 | 3.6 | % | |||||||||||
Net operating income | 45,694 | 43,193 | 5.8 | % | 141,358 | 128,250 | 10.2 | % | |||||||||||
NOI margin (NOI/total rental revenue) | 73.7 | % | 72.0 | % | 74.6 | % | 73.4 | % | |||||||||||
Net operating income (NOI) from continuing operations | |||||||||||||||||||
Total rental revenue | $ | 51,507 | $ | 46,585 | 10.6 | % | $ | 155,888 | $ | 135,242 | 15.3 | % | |||||||
Property operating expenses (2) | 13,310 | 12,413 | 7.2 | % | 38,432 | 35,114 | 9.4 | % | |||||||||||
Net operating income | $ | 38,197 | $ | 34,172 | 11.8 | % | $ | 117,456 | $ | 100,128 | 17.3 | % | |||||||
NOI margin (NOI/total rental revenue) | 74.2 | % | 73.4 | % | 75.3 | % | 74.0 | % | |||||||||||
Same property NOI (3) | |||||||||||||||||||
Total rental revenue | $ | 55,439 | $ | 54,005 | 2.7 | % | $ | 153,047 | $ | 145,343 | 5.3 | % | |||||||
Property operating expenses | 15,548 | 15,414 | 0.9 | % | 42,336 | 40,697 | 4.0 | % | |||||||||||
Net operating income | $ | 39,891 | $ | 38,591 | 3.4 | % | $ | 110,711 | $ | 104,646 | 5.8 | % | |||||||
Growth in same property NOI | 3.4 | % | 5.8 | % | |||||||||||||||
Growth in same property NOI, excluding termination fees | 1.6 | % | 2.7 | % | |||||||||||||||
Number of properties included in analysis | 163 | 153 | |||||||||||||||||
Same property occupancy | 93.7 | % | 94.6 | % | 93.4 | % | 94.5 | % |
(1) | Amounts included in discontinued operations have been included for purposes of this presentation of net operating income. | |
(2) | Net of intercompany expenses. | |
(3) | Excludes the effects of straight line rent, and prior year expense recoveries and adjustments, if any. |
Page 7
MARKET CAPITALIZATION - QUARTERLY BREAKOUT | |||||||||||||||||||||||||
(in thousands, except per share data) | |||||||||||||||||||||||||
As of | |||||||||||||||||||||||||
Sep 30, 2005 | Jun 30, 2005 | Mar 31, 2005 | Sep 30, 2004 | Jun 30, 2004 | Mar 31, 2004 | ||||||||||||||||||||
Closing market price of common stock | $ | 23.25 | $ | 22.70 | $ | 20.59 | $ | 23.73 | $ | 19.62 | $ | 18.08 | $ | 19.22 | |||||||||||
Dividend yield (based on current annualized dividend) | 4.99 | % | 5.11 | % | 5.63 | % | 4.89 | % | 5.71 | % | 6.19 | % | 5.83 | % | |||||||||||
Dividends paid per share | $ | 0.29 | $ | 0.29 | $ | 0.29 | $ | 0.29 | $ | 0.28 | $ | 0.28 | $ | 0.28 | |||||||||||
Net book value per share (fully diluted, end of period) | $ | 12.83 | $ | 12.73 | $ | 12.64 | $ | 12.54 | $ | 12.35 | $ | 11.86 | $ | 11.87 | |||||||||||
Liquidity | |||||||||||||||||||||||||
Cash and cash equivalents | $ | - | $ | - | $ | - | $ | 5,122 | $ | 10,722 | $ | 5,814 | $ | 1,901 | |||||||||||
Revolving credit facilities | |||||||||||||||||||||||||
Gross potential available under current credit facilities | 345,000 | 345,000 | 345,000 | 345,000 | 345,000 | 345,000 | 345,000 | ||||||||||||||||||
less: Outstanding balance | (39,000 | ) | (179,387 | ) | (144,763 | ) | (147,000 | ) | (64,000 | ) | (80,541 | ) | (50,879 | ) | |||||||||||
Holdback for letters of credit | (1,283 | ) | (1,283 | ) | (1,289 | ) | (1,339 | ) | (1,378 | ) | (1,456 | ) | (1,378 | ) | |||||||||||
Net potential available under credit facilities | $ | 304,717 | $ | 164,330 | $ | 198,948 | $ | 196,661 | $ | 279,622 | $ | 263,003 | $ | 292,743 | |||||||||||
Equity market capitalization (end of period) | |||||||||||||||||||||||||
Common stock shares (in thousands) | |||||||||||||||||||||||||
Basic common shares | 74,522.955 | 74,029.497 | 73,561.218 | 72,904.922 | 72,069.799 | 70,241.851 | 69,580.460 | ||||||||||||||||||
Diluted common shares | |||||||||||||||||||||||||
Unvested restricted common shares | 525.954 | 582.787 | 576.122 | 692.699 | 700.632 | 513.131 | 524.799 | ||||||||||||||||||
Walden Woods shares | 93.656 | 93.656 | 93.656 | 93.656 | 93.656 | 93.656 | 93.656 | ||||||||||||||||||
IRT Partners operating partnership units | - | - | - | - | - | 734.266 | 734.266 | ||||||||||||||||||
Common stock options (treasury method, closing price) | 399.136 | 379.914 | 400.907 | 575.229 | 383.661 | 419.820 | 532.424 | ||||||||||||||||||
Fully diluted common shares | 75,541.701 | 75,085.854 | 74,631.903 | 74,266.506 | 73,247.748 | 72,002.724 | 71,465.605 | ||||||||||||||||||
Total debt (excluding unamortized premium/discount) | $ | 954,078 | $ | 985,674 | $ | 978,745 | $ | 989,317 | $ | 894,739 | $ | 939,357 | $ | 871,142 | |||||||||||
Cash and cash equivalents | - | - | - | (5,122 | ) | (10,722 | ) | (5,814 | ) | (1,901 | ) | ||||||||||||||
Net debt | 985,674 | 978,745 | 984,195 | 884,017 | 933,543 | 869,241 | |||||||||||||||||||
Equity market capitalization (fully diluted, end of period) | 1,704,449 | 1,536,671 | 1,762,344 | 1,437,121 | 1,301,809 | 1,373,569 | |||||||||||||||||||
Total market capitalization | $ | 2,710,423 | $ | 2,690,123 | $ | 2,515,416 | $ | 2,746,539 | $ | 2,321,138 | $ | 2,235,352 | $ | 2,242,810 | |||||||||||
Net debt to total market capitalization | 36.6 | % | 38.9 | % | 35.8 | % | 38.1 | % | 41.8 | % | 38.8 | % | |||||||||||||
Gross real estate and securities investments | $ | 2,029,002 | $ | 2,044,861 | $ | 2,016,111 | $ | 2,006,266 | $ | 1,865,041 | $ | 1,885,082 | $ | 1,795,632 | |||||||||||
Net debt to gross real estate and securities investments | 48.2 | % | 48.5 | % | 49.1 | % | 47.4 | % | 49.5 | % | 48.4 | % |
Page 8
EQUITY ONE, INC. AND SUBSIDIARIES | |||||||||||||||||||
CONSOLIDATED STATEMENTS OF OPERATIONS | |||||||||||||||||||
For the quarter ended September 30, 2005 | |||||||||||||||||||
(in thousands, except per share data) | |||||||||||||||||||
For the three months ended | Percent | For the nine months ended | Percent | ||||||||||||||||
Sep 30, 2005 | Sep 30, 2004 | Change | Sep 30, 2005 | Sep 30, 2004 | Change | ||||||||||||||
_____________ | _____________ | _____________ | _____________ | ||||||||||||||||
Rental revenue: | |||||||||||||||||||
Minimum rents | $ | 40,108 | $ | 36,147 | $ | 119,129 | $ | 105,113 | |||||||||||
Expense recoveries | 10,480 | 10,011 | 31,354 | 27,837 | |||||||||||||||
Termination fees | 818 | 145 | 3,863 | 498 | |||||||||||||||
Percentage rent | 101 | 282 | 1,542 | 1,794 | |||||||||||||||
Total rental revenue | 10.6 | % | 135,242 | 15.3 | % | ||||||||||||||
Costs and expenses: | |||||||||||||||||||
Property operating expenses | 13,310 | 12,413 | 38,432 | 35,114 | |||||||||||||||
Rental property depreciation and amortization | 21,178 | ||||||||||||||||||
General and administrative expenses | 4,232 | 3,719 | 12,936 | 10,976 | |||||||||||||||
Total costs and expenses | 26,300 | 23,485 | 12.0 | % | 77,243 | 67,268 | 14.8 | % | |||||||||||
Income before other income and expenses, minority interest and discontinued operations | 25,207 | 23,100 | 78,645 | 67,974 | |||||||||||||||
Other income and expenses: | |||||||||||||||||||
Interest expense | (12,952 | ) | (10,705 | ) | (35,580 | ) | (30,425 | ) | |||||||||||
Amortization of deferred financing fees | (357 | ) | (371 | ) | (1,076 | ) | (968 | ) | |||||||||||
Investment income | 1,612 | ||||||||||||||||||
Other income | 133 | 174 | 324 | 297 | |||||||||||||||
Income before minority interest and discontinued operations | 17,624 | 13,408 | 49,829 | 38,490 | |||||||||||||||
Minority interest | (48 | ) | (150 | ) | (144 | ) | (529 | ) | |||||||||||
Income from continuing operations | 17,576 | 13,258 | 32.6 | % | 49,685 | 37,961 | 30.9 | % | |||||||||||
Discontinued operations: | |||||||||||||||||||
Income from rental properties sold or held for sale | 4,377 | 5,317 | 13,829 | 17,860 | |||||||||||||||
Gain (loss) on disposal of income producing properties | 6,088 | 12,215 | 11,460 | 13,767 | |||||||||||||||
Minority interest | - | (89 | ) | - | (113 | ) | |||||||||||||
Income from discontinued operations | 31,514 | ||||||||||||||||||
Net income | $ | 28,041 | $ | 30,701 | -8.7 | % | $ | 74,974 | $ | 69,475 | 7.9 | % | |||||||
Basic earnings per share | |||||||||||||||||||
Income from continuing operations | $ | 0.24 | $ | 0.19 | 26.3 | % | $ | 0.68 | $ | 0.55 | 23.6 | % | |||||||
Income from discontinued operations | 0.14 | 0.24 | 0.34 | 0.45 | |||||||||||||||
Net income | $ | 0.38 | $ | 0.43 | -11.6 | % | $ | 1.02 | $ | 1.00 | 2.0 | % | |||||||
Diluted earnings per share | |||||||||||||||||||
Income from continuing operations | $ | 0.23 | $ | 0.19 | 21.1 | % | $ | 0.66 | $ | 0.54 | 24.1 | % | |||||||
Income from discontinued operations | 0.14 | 0.24 | 0.34 | 0.44 | |||||||||||||||
Net income | $ | 0.37 | $ | 0.43 | -14.0 | % | $ | 1.00 | $ | 0.98 | 3.1 | % | |||||||
Weighted average shares outstanding | |||||||||||||||||||
Basic | 74,087 | 70,626 | 73,592 | 69,820 | |||||||||||||||
Diluted | 75,144 | 72,327 | 74,637 | 71,525 |
Page 9
EQUITY ONE, INC. AND SUBSIDIARIES | ||||||||||||||||||||||
CONSOLIDATED STATEMENTS OF OPERATIONS - QUARTERLY BREAKOUT | ||||||||||||||||||||||
For the quarter ended September 30, 2005 | ||||||||||||||||||||||
(in thousands, except per share data) | ||||||||||||||||||||||
For the three months ended | ||||||||||||||||||||||
Sep 30, 2005 | Jun 30, 2005 | Mar 31, 2005 | Dec 31, 2004 | Sep 30, 2004 | Jun 30, 2004 | Mar 31, 2004 | ||||||||||||||||
Rental revenue: | ||||||||||||||||||||||
Minimum rents | $ | 40,108 | $ | 39,653 | $ | 39,368 | $ | 39,025 | $ | 36,147 | $ | 35,667 | $ | 33,299 | ||||||||
Expense recoveries | 10,480 | 10,728 | 10,146 | 10,244 | 10,011 | 8,684 | 9,142 | |||||||||||||||
Termination fees | 818 | 2,617 | 428 | 2,918 | 145 | 307 | 46 | |||||||||||||||
Percentage rent | 101 | 329 | 1,112 | 40 | 282 | 257 | 1,255 | |||||||||||||||
Total rental revenue | 51,507 | 53,327 | 51,054 | 52,227 | 46,585 | 44,915 | ||||||||||||||||
Costs and expenses: | ||||||||||||||||||||||
Property operating expenses | 13,310 | 12,796 | 12,326 | 13,071 | 12,413 | 11,594 | 11,107 | |||||||||||||||
Rental property depreciation and amortization | 8,758 | 8,707 | 8,410 | 8,322 | 7,353 | 7,185 | ||||||||||||||||
General and administrative expenses | 4,232 | 4,367 | 4,337 | 5,616 | 3,719 | 3,807 | 3,450 | |||||||||||||||
Total costs and expenses | 26,300 | 25,870 | 25,073 | 27,009 | 23,485 | 22,586 | 21,197 | |||||||||||||||
Income before other income and expenses, minority interest and discontinued operations | 25,207 | 27,457 | 25,981 | 25,218 | 23,100 | 22,329 | 22,545 | |||||||||||||||
Other income and expenses: | ||||||||||||||||||||||
Interest expense | (12,952 | ) | (11,876 | ) | (10,752 | ) | (10,796 | ) | (10,705 | ) | (10,459 | ) | (9,261 | ) | ||||||||
Amortization of deferred financing fees | (357 | ) | (354 | ) | (365 | ) | (369 | ) | (371 | ) | (367 | ) | (230 | ) | ||||||||
Investment income | 5,593 | 1,214 | 709 | 734 | 1,210 | 194 | ||||||||||||||||
Other income | 133 | 127 | 64 | 241 | 174 | 59 | 64 | |||||||||||||||
Income before minority interest and discontinued operations | 17,624 | 16,568 | 15,637 | 15,028 | 13,408 | 11,756 | 13,326 | |||||||||||||||
Minority interest | (48 | ) | (46 | ) | (50 | ) | (47 | ) | (150 | ) | (177 | ) | (202 | ) | ||||||||
Income from continuing operations | 17,576 | 16,522 | 15,587 | 14,981 | 13,258 | 11,579 | 13,124 | |||||||||||||||
Discontinued operations: | ||||||||||||||||||||||
Income from rental properties sold or held for sale | 4,377 | 4,864 | 4,588 | 4,940 | 5,317 | 7,450 | 5,093 | |||||||||||||||
Gain (loss) on disposal of income producing properties | 6,088 | 3,757 | 1,615 | 8,409 | 12,215 | (483 | ) | 2,035 | ||||||||||||||
Minority interest | - | - | - | - | (89 | ) | (11 | ) | (13 | ) | ||||||||||||
Income from discontinued operations | 10,465 | 8,621 | 6,203 | 13,349 | 17,443 | 6,956 | ||||||||||||||||
Net income | $ | 28,041 | $ | 25,143 | $ | 21,790 | $ | 28,330 | $ | 30,701 | $ | 18,535 | $ | 20,239 | ||||||||
Basic earnings per share | ||||||||||||||||||||||
Income from continuing operations | $ | 0.24 | $ | 0.22 | $ | 0.21 | $ | 0.21 | $ | 0.19 | $ | 0.17 | $ | 0.19 | ||||||||
Income from discontinued operations | 0.14 | 0.12 | 0.09 | 0.18 | 0.24 | 0.10 | 0.10 | |||||||||||||||
Net income | $ | 0.38 | $ | 0.34 | $ | 0.30 | $ | 0.39 | $ | 0.43 | $ | 0.27 | $ | 0.29 | ||||||||
Diluted earnings per share | ||||||||||||||||||||||
Income from continuing operations | $ | 0.22 | $ | 0.21 | $ | 0.21 | $ | 0.19 | $ | 0.16 | ||||||||||||
Income from discontinued operations | 0.14 | 0.12 | 0.08 | 0.18 | 0.24 | 0.10 | 0.10 | |||||||||||||||
Net income | $ | 0.37 | $ | 0.34 | $ | 0.29 | $ | 0.39 | $ | 0.43 | $ | 0.26 | $ | 0.29 | ||||||||
Weighted average shares outstanding | ||||||||||||||||||||||
Basic | 74,087 | 73,636 | 73,043 | 72,315 | 70,626 | 69,711 | 69,115 | |||||||||||||||
Diluted | 75,144 | 74,656 | 74,193 | 73,616 | 72,327 | 71,419 | 71,021 |
All prior figures have been restated to reflect the effects of reporting for discontinued operations
Page 10
EQUITY ONE, INC. AND SUBSIDIARIES | |||||||||||||||||||||||||||||||
PRO FORMA FINANCIAL INFORMATION FOR DISCONTINUED OPERATIONS | |||||||||||||||||||||||||||||||
For the quarter ended September 30, 2005 | |||||||||||||||||||||||||||||||
(in thousands, except per share data) | |||||||||||||||||||||||||||||||
For the three months ended | For the nine months ended | ||||||||||||||||||||||||||||||
Sep 30, 2005 | Sept 30, 2005 | ||||||||||||||||||||||||||||||
As | Discontinued Operations | Pre SFAS | As | Discontinued Operations | Pre SFAS | ||||||||||||||||||||||||||
Reported | Total | Held for Sale | Sold | No. 144 | Reported | Total | Held for Sale | Sold | No. 144 | ||||||||||||||||||||||
Rental revenue: | |||||||||||||||||||||||||||||||
Minimum rents | $ | 40,108 | $ | 8,139 | $ | 7,988 | $ | 151 | $ | 48,247 | $ | 119,129 | $ | 25,269 | $ | 23,887 | $ | 1,382 | $ | 144,398 | |||||||||||
Expense recoveries | 10,480 | 2,343 | 2,327 | 16 | 12,823 | 31,354 | 8,238 | 7,864 | 374 | 39,592 | |||||||||||||||||||||
Termination fees | 818 | 26 | 17 | 9 | 844 | 3,863 | 161 | 153 | 8 | 4,024 | |||||||||||||||||||||
Percentage rent | 101 | 8 | 8 | - | 109 | 1,542 | 34 | 30 | 4 | 1,576 | |||||||||||||||||||||
Total rental revenue | 51,507 | 10,516 | 10,340 | 176 | 62,023 | 155,888 | 33,702 | 31,934 | 1,768 | 189,590 | |||||||||||||||||||||
Costs and expenses: | |||||||||||||||||||||||||||||||
Property operating expenses | 13,310 | 3,019 | 2,916 | 103 | 16,329 | 38,432 | 9,800 | 9,132 | 668 | 48,232 | |||||||||||||||||||||
Rental property depreciation and amortization | 8,758 | 2,168 | 2,132 | 36 | 10,926 | 25,875 | 6,433 | 6,151 | 282 | 32,308 | |||||||||||||||||||||
General and administrative expenses | 4,232 | - | - | - | 4,232 | 12,936 | 6 | 6 | - | 12,942 | |||||||||||||||||||||
Total costs and expenses | 26,300 | 5,187 | 5,048 | 139 | 31,487 | 77,243 | 16,239 | 15,289 | 950 | 93,482 | |||||||||||||||||||||
Income before other income and expenses, minority interest and discontinued operations | 25,207 | 5,329 | 5,292 | 37 | 30,536 | 78,645 | 17,463 | 16,645 | 818 | 96,108 | |||||||||||||||||||||
Other income and expenses: | |||||||||||||||||||||||||||||||
Interest expense | (12,952 | ) | (937 | ) | (922 | ) | (15 | ) | (13,889 | ) | (35,580 | ) | (3,590 | ) | (3,357 | ) | (233 | ) | (39,170 | ) | |||||||||||
Amortization of deferred financing fees | (357 | ) | (15 | ) | (15 | ) | - | (372 | ) | (1,076 | ) | (44 | ) | (44 | ) | - | (1,120 | ) | |||||||||||||
Investment income | 5,593 | - | - | - | 5,593 | 7,516 | - | - | - | 7,516 | |||||||||||||||||||||
Other income | 133 | - | - | - | 133 | 324 | - | - | - | 324 | |||||||||||||||||||||
Income before minority interest and discontinued operations | 17,624 | 4,377 | 4,355 | 22 | 22,001 | 49,829 | 13,829 | 13,244 | 585 | 63,658 | |||||||||||||||||||||
Minority interest | (48 | ) | - | - | - | (48 | ) | (144 | ) | - | - | - | (144 | ) | |||||||||||||||||
Income from continuing operations | 17,576 | 4,377 | 4,355 | 22 | 21,953 | 49,685 | 13,829 | 13,244 | 585 | 63,514 | |||||||||||||||||||||
Discontinued operations: | |||||||||||||||||||||||||||||||
Income from rental properties sold or held for sale | 4,377 | (4,377 | ) | (4,355 | ) | (22 | ) | - | 13,829 | (13,829 | ) | (13,244 | ) | (585 | ) | - | |||||||||||||||
Gain on disposal of income producing properties | 6,088 | - | - | - | 6,088 | 11,460 | - | - | - | 11,460 | |||||||||||||||||||||
Minority interest | - | - | - | - | - | - | - | - | - | - | |||||||||||||||||||||
Income from discontinued operations | 10,465 | (4,377 | ) | (4,355 | ) | (22 | ) | 6,088 | 25,289 | (13,829 | ) | (13,244 | ) | (585 | ) | 11,460 | |||||||||||||||
Net income | $ | 28,041 | $ | - | $ | - | $ | - | $ | 28,041 | $ | 74,974 | $ | - | $ | - | $ | - | $ | 74,974 |
Note: | The Company adopted SFAS No. 144, "Accounting for the Impairment or Disposal of Long-Lived Assets" ("SFAS No. 144"), effective January 1, 2002. This standard requires that operating results of income producing real estate assets that are sold or held for sale be included in discontinued operations in the statement of earnings for all periods presented. The above table presents the results as reported pursuant to SFAS No. 144, results of the assets sold or held for sale and the results before the impact of SFAS No. 144. |
Page 11
PRO FORMA FINANCIAL INFORMATION FOR DISCONTINUED OPERATIONS | |||||||||||||||||||||||||||||||
For the quarter ended September 30, 2005 | |||||||||||||||||||||||||||||||
(in thousands, except per share data) | |||||||||||||||||||||||||||||||
For the three months ended | For the nine months ended | ||||||||||||||||||||||||||||||
Sep 30, 2004 | Sep 30, 2004 | ||||||||||||||||||||||||||||||
As | Discontinued Operations | Pre SFAS | As | Discontinued Operations | Pre SFAS | ||||||||||||||||||||||||||
Reported | Total | Held for Sale | Sold | No. 144 | Reported | Total | Held for Sale | Sold | No. 144 | ||||||||||||||||||||||
Rental revenue: | |||||||||||||||||||||||||||||||
Minimum rents | $ | 36,147 | $ | 10,105 | $ | 7,724 | $ | 2,381 | $ | 46,252 | $ | 105,113 | $ | 29,366 | $ | 21,039 | $ | 8,327 | $ | 134,479 | |||||||||||
Expense recoveries | 10,011 | 3,167 | 2,616 | 551 | 13,178 | 27,837 | 8,917 | 7,131 | 1,786 | 36,754 | |||||||||||||||||||||
Termination fees | 145 | 89 | 21 | 68 | 234 | 498 | 911 | 46 | 865 | 1,409 | |||||||||||||||||||||
Percentage rent | 282 | 27 | - | 27 | 309 | 1,794 | 352 | 77 | 275 | 2,146 | |||||||||||||||||||||
Total rental revenue | 46,585 | 13,388 | 10,361 | 3,027 | 59,973 | 135,242 | 39,546 | 28,293 | 11,253 | 174,788 | |||||||||||||||||||||
Costs and expenses: | |||||||||||||||||||||||||||||||
Property operating expenses | 12,413 | 4,367 | 3,080 | 1,287 | 16,780 | 35,114 | 11,424 | 8,325 | 3,099 | 46,538 | |||||||||||||||||||||
Rental property depreciation and amortization | 7,353 | 1,923 | 1,473 | 450 | 9,276 | 21,178 | 5,620 | 4,248 | 1,372 | 26,798 | |||||||||||||||||||||
General and administrative expenses | 3,719 | 3 | 3 | - | 3,722 | 10,976 | 4 | 4 | - | 10,980 | |||||||||||||||||||||
Total costs and expenses | 23,485 | 6,293 | 4,556 | 1,737 | 29,778 | 67,268 | 17,048 | 12,577 | 4,471 | 84,316 | |||||||||||||||||||||
Income before other income and expenses, minority interest and discontinued operations | 23,100 | 7,095 | 5,805 | 1,290 | 30,195 | 67,974 | 22,498 | 15,716 | 6,782 | 90,472 | |||||||||||||||||||||
Other income and expenses: | |||||||||||||||||||||||||||||||
Interest expense | (10,705 | ) | (1,710 | ) | (1,298 | ) | (412 | ) | (12,415 | ) | (30,425 | ) | (4,467 | ) | (3,220 | ) | (1,247 | ) | (34,892 | ) | |||||||||||
Amortization of deferred financing fees | (371 | ) | (38 | ) | (8 | ) | (30 | ) | (409 | ) | (968 | ) | (112 | ) | (22 | ) | (90 | ) | (1,080 | ) | |||||||||||
Investment income | 1,210 | - | - | - | 1,210 | 1,612 | - | - | - | 1,612 | |||||||||||||||||||||
Other income | 174 | - | - | - | 174 | 297 | - | - | - | 297 | |||||||||||||||||||||
Equity in loss of joint ventures | - | (30 | ) | - | (30 | ) | (30 | ) | - | (59 | ) | - | (59 | ) | (59 | ) | |||||||||||||||
Income before minority interest and discontinued operations | 13,408 | 5,317 | 4,499 | 818 | 18,725 | 38,490 | 17,860 | 12,474 | 5,386 | 56,350 | |||||||||||||||||||||
Minority interest | (150 | ) | (89 | ) | - | (89 | ) | (239 | ) | (529 | ) | (113 | ) | - | (113 | ) | (642 | ) | |||||||||||||
Income from continuing operations | 13,258 | 5,228 | 4,499 | 729 | 18,486 | 37,961 | 17,747 | 12,474 | 5,273 | 55,708 | |||||||||||||||||||||
Discontinued operations: | |||||||||||||||||||||||||||||||
Income from rental properties sold or held for sale | 5,317 | (5,317 | ) | (4,499 | ) | (818 | ) | - | 17,860 | (17,860 | ) | (12,474 | ) | (5,386 | ) | - | |||||||||||||||
Gain on disposal of income producing properties | 12,215 | - | - | - | 12,215 | 13,767 | - | - | - | 13,767 | |||||||||||||||||||||
Minority interest | (89 | ) | 89 | - | 89 | - | (113 | ) | 113 | - | 113 | - | |||||||||||||||||||
Income from discontinued operations | 17,443 | (5,228 | ) | (4,499 | ) | (729 | ) | 12,215 | 31,514 | (17,747 | ) | (12,474 | ) | (5,273 | ) | 13,767 | |||||||||||||||
Net income | $ | 30,701 | $ | - | $ | - | $ | - | $ | 30,701 | $ | 69,475 | $ | - | $ | - | $ | - | $ | 69,475 |
Note: | The Company adopted SFAS No. 144, "Accounting for the Impairment or Disposal of Long-Lived Assets" ("SFAS No. 144"), effective January 1, 2002. This standard requires that operating results of income producing real estate assets that are sold or held for sale be included in discontinued operations in the statement of earnings for all periods presented. The above table presents the results as reported pursuant to SFAS No. 144, results of the assets sold or held for sale and the results before the impact of SFAS No. 144. |
Page 12
EQUITY ONE, INC. AND SUBSIDIARIES | ||||||||||||||||
CONSOLIDATED STATEMENTS OF FUNDS FROM OPERATIONS | ||||||||||||||||
For the quarter ended September 30, 2005 | ||||||||||||||||
(in thousands, except per share data) | ||||||||||||||||
For the | ||||||||||||||||
For the three months ended | For the nine months ended | year ended | ||||||||||||||
Sep 30, 2005 | Sep 30, 2004 | Sep 30, 2005 | Sep 30, 2004 | Dec 31, 2004 | ||||||||||||
Net income | $ | 28,041 | $ | 30,701 | $ | 74,974 | $ | 69,475 | $ | 97,804 | ||||||
Adjustments: | ||||||||||||||||
Rental property depreciation and amortization, including discontinued operations | 10,926 | 9,276 | 32,310 | 26,797 | 37,023 | |||||||||||
Gain on disposal of income producing properties | (6,088 | ) | (12,215 | ) | (11,460 | ) | (13,767 | ) | (22,176 | ) | ||||||
Minority interest | 27 | 223 | 82 | 596 | 623 | |||||||||||
Other items: | ||||||||||||||||
Pro-rata share of real estate depreciation from joint ventures | - | 65 | - | 196 | 197 | |||||||||||
Funds from operations | $ | 95,906 | $ | 83,297 | $ | 113,471 | ||||||||||
Increase | 17.3 | % | 15.1 | % | ||||||||||||
Earnings per diluted share* | $ | 0.37 | $ | 0.43 | $ | 1.00 | $ | 0.98 | $ | 1.37 | ||||||
Adjustments: | ||||||||||||||||
Rental property depreciation and amortization, including discontinued operations | 0.15 | 0.13 | 0.43 | 0.37 | 0.52 | |||||||||||
Gain on disposal of income producing properties | (0.08 | ) | (0.17 | ) | (0.15 | ) | (0.19 | ) | (0.31 | ) | ||||||
Other items: | ||||||||||||||||
Pro-rata share of real estate depreciation from joint ventures | - | - | - | - | - | |||||||||||
Funds from operations per diluted share | $ | 1.28 | $ | 1.16 | $ | 1.58 | ||||||||||
Increase | 12.8 | % | 10.3 | % |
* Earnings per diluted share include the add-back of those minority interests which are convertible to shares of our common stock.
Page 13
EQUITY ONE, INC. AND SUBSIDIARIES | ||||||||||||||||||||||
CONSOLIDATED STATEMENTS OF FUNDS FROM OPERATIONS - QUARTERLY BREAKOUT | ||||||||||||||||||||||
For the quarter ended September 30, 2005 | ||||||||||||||||||||||
(in thousands, except per share data) | ||||||||||||||||||||||
For the three months ended | ||||||||||||||||||||||
Sep 30, 2005 | Jun 30, 2005 | Mar 31, 2005 | Dec 31, 2004 | Sep 30, 2004 | Jun 30, 2004 | Mar 31, 2004 | ||||||||||||||||
Net income | $ | 28,041 | $ | 25,143 | $ | 21,790 | $ | 28,330 | $ | 30,701 | $ | 18,535 | $ | 20,239 | ||||||||
Adjustments: | ||||||||||||||||||||||
Rental property depreciation and amortization, including discontinued operations | 10,926 | 10,938 | 10,446 | 10,226 | 9,276 | 9,089 | 8,432 | |||||||||||||||
(Gain) loss on disposal of income producing properties | (6,088 | ) | (3,757 | ) | (1,615 | ) | (8,409 | ) | (12,215 | ) | 483 | (2,035 | ) | |||||||||
Minority interest | 27 | 27 | 28 | 27 | 223 | 174 | 199 | |||||||||||||||
Other items: | ||||||||||||||||||||||
Pro-rata share of real estate depreciation from joint ventures | - | - | - | - | 65 | 66 | 65 | |||||||||||||||
Funds from operations | $ | 32,906 | $ | 32,351 | $ | 30,649 | $ | 30,174 | $ | 28,050 | $ | 28,347 | $ | 26,900 | ||||||||
Sequential increase (decrease) | 1.7 | % | 5.6 | % | 1.6 | % | 7.6 | % | (1.0 | %) | 5.4 | % | ||||||||||
Earnings per diluted share* | $ | 0.37 | $ | 0.34 | $ | 0.29 | $ | 0.39 | $ | 0.43 | $ | 0.26 | $ | 0.29 | ||||||||
Adjustments: | ||||||||||||||||||||||
Rental property depreciation and amortization, including discontinued operations | 0.15 | 0.14 | 0.14 | 0.14 | 0.13 | 0.13 | 0.12 | |||||||||||||||
(Gain) loss on disposal of income producing properties | (0.08 | ) | (0.05 | ) | (0.02 | ) | (0.12 | ) | (0.17 | ) | 0.01 | (0.03 | ) | |||||||||
Other items: | ||||||||||||||||||||||
Pro-rata share of real estate depreciation from joint ventures | - | - | - | - | - | - | ||||||||||||||||
Funds from operations per diluted share | $ | 0.44 | $ | 0.43 | $ | 0.41 | $ | 0.41 | $ | 0.39 | $ | 0.40 | $ | 0.38 | ||||||||
Sequential increase (decrease) | 2.3 | % | 4.9 | % | - | 5.1 | % | (2.5 | %) | 5.3 | % |
* Earnings per diluted share include the add-back of those minority interests which are convertible to shares of our common stock
Page 14
EQUITY ONE, INC. AND SUBSIDIARIES | ||||||||||||||||
CONSOLIDATED STATEMENTS OF FUNDS AVAILABLE FOR DISTRIBUTION | ||||||||||||||||
For the quarter ended September 30, 2005 | ||||||||||||||||
(in thousands, except per share data) | ||||||||||||||||
For the | ||||||||||||||||
For the three months ended | For the nine months ended | year ended | ||||||||||||||
Sep 30, 2005 | Sep 30, 2004 | Sep 30, 2005 | Sep 30, 2004 | Dec 31, 2004 | ||||||||||||
Funds from operations | $ | 32,906 | $ | 28,050 | $ | 95,906 | $ | 83,297 | $ | 113,471 | ||||||
Adjust for certain non-cash items: | ||||||||||||||||
Amortization of deferred financing fees | 372 | 409 | 1,120 | 1,080 | 1,459 | |||||||||||
Amortization of above/below market rent intangibles | (240 | ) | (48 | ) | (752 | ) | (65 | ) | (192 | ) | ||||||
Amortization of restricted stock | 1,523 | 1,428 | 4,475 | 3,978 | 5,163 | |||||||||||
Straight line rents | (1,157 | ) | (1,100 | ) | (3,510 | ) | (2,714 | ) | (3,835 | ) | ||||||
Capitalized interest | (876 | ) | (676 | ) | (2,299 | ) | (2,208 | ) | (3,204 | ) | ||||||
Amortization of debt premium/discount | (1,274 | ) | (1,230 | ) | (3,895 | ) | (3,692 | ) | (4,958 | ) | ||||||
Total non-cash items | (1,652 | ) | (1,217 | ) | (4,861 | ) | (3,621 | ) | (5,567 | ) | ||||||
Adjust for recurring capital expenditures: | ||||||||||||||||
Tenant improvements | (1,624 | ) | (295 | ) | (4,363 | ) | (934 | ) | (1,504 | ) | ||||||
Leasing commissions and costs | (1,027 | ) | (871 | ) | (3,419 | ) | (2,007 | ) | (2,744 | ) | ||||||
Other capital expenditures | (386 | ) | (405 | ) | (1,302 | ) | (931 | ) | (1,236 | ) | ||||||
Total recurring capital expenditures | (3,037 | ) | (1,571 | ) | (9,084 | ) | (3,872 | ) | (5,484 | ) | ||||||
Funds available for distribution before debt payments | 28,217 | 25,262 | 81,961 | 75,804 | 102,420 | |||||||||||
Scheduled debt payments | (2,547 | ) | (2,514 | ) | (7,956 | ) | (7,192 | ) | (9,807 | ) | ||||||
Funds available for distribution | $ | 25,670 | $ | 22,748 | $ | 74,005 | $ | 68,612 | $ | 92,613 | ||||||
Increase | 12.8 | % | 7.9 | % | ||||||||||||
Funds available for distribution per diluted share | $ | 0.34 | $ | 0.31 | $ | 0.99 | $ | 0.96 | $ | 1.29 | ||||||
Increase | 9.7 | % | 3.1 | % | ||||||||||||
Cash dividends | $ | 21,683 | $ | 20,272 | $ | 64,684 | $ | 59,627 | $ | 80,903 | ||||||
Page 15
EQUITY ONE, INC. AND SUBSIDIARIES | ||||||||||||||||||||||
CONSOLIDATED STATEMENTS OF FUNDS AVAILABLE FOR DISTRIBUTION - QUARTERLY BREAKOUT | ||||||||||||||||||||||
For the quarter ended September 30, 2005 | ||||||||||||||||||||||
(in thousands, except per share data) | ||||||||||||||||||||||
For the three months ended | ||||||||||||||||||||||
Sep 30, 2005 | Jun 30, 2005 | Mar 31, 2005 | Dec 31, 2004 | Sep 30, 2004 | Jun 30, 2004 | Mar 31, 2004 | ||||||||||||||||
Funds from operations | $ | 32,906 | $ | 32,351 | $ | 30,649 | $ | 30,174 | $ | 28,050 | $ | 28,347 | $ | 26,900 | ||||||||
Adjust for certain non-cash items: | ||||||||||||||||||||||
Amortization of deferred financing fees | 372 | 370 | 378 | 381 | 409 | 404 | 267 | |||||||||||||||
Amortization of above/below market rent intangibles | (240 | ) | (364 | ) | (148 | ) | (127 | ) | (48 | ) | (15 | ) | (2 | ) | ||||||||
Amortization of restricted stock | 1,523 | 1,466 | 1,486 | 1,363 | 1,428 | 1,378 | 1,172 | |||||||||||||||
Straight line rents | (1,157 | ) | (1,086 | ) | (1,267 | ) | (1,120 | ) | (1,100 | ) | (1,070 | ) | (544 | ) | ||||||||
Capitalized interest | (876 | ) | (790 | ) | (633 | ) | (996 | ) | (676 | ) | (720 | ) | (812 | ) | ||||||||
Amortization of debt premium/discount | (1,274 | ) | (1,335 | ) | (1,286 | ) | (1,265 | ) | (1,230 | ) | (1,247 | ) | (1,215 | ) | ||||||||
Total non-cash items | (1,652 | ) | (1,739 | ) | (1,470 | ) | (1,764 | ) | (1,217 | ) | (1,270 | ) | (1,134 | ) | ||||||||
Adjust for recurring capital expenditures: | ||||||||||||||||||||||
Tenant improvements | (1,624 | ) | (2,374 | ) | (365 | ) | (570 | ) | (295 | ) | (409 | ) | (230 | ) | ||||||||
Leasing commissions and costs | (1,027 | ) | (881 | ) | (1,511 | ) | (737 | ) | (871 | ) | (967 | ) | (169 | ) | ||||||||
Other capital expenditures | (386 | ) | (502 | ) | (414 | ) | (305 | ) | (405 | ) | (285 | ) | (241 | ) | ||||||||
Total recurring capital expenditures | (3,037 | ) | (3,757 | ) | (2,290 | ) | (1,612 | ) | (1,571 | ) | (1,661 | ) | (640 | ) | ||||||||
Funds available for distribution before debt payments | 28,217 | 26,855 | 26,889 | 26,798 | 25,262 | 25,416 | 25,126 | |||||||||||||||
Scheduled debt payments | (2,547 | ) | (2,655 | ) | (2,754 | ) | (2,600 | ) | (2,514 | ) | (2,405 | ) | (2,273 | ) | ||||||||
Funds available for distribution | $ | 25,670 | $ | 24,200 | $ | 24,135 | $ | 24,198 | $ | 22,748 | $ | 23,011 | $ | 22,853 | ||||||||
Sequential increase (decrease) | 6.1 | % | 0.3 | % | (0.3 | %) | 6.4 | % | (1.1 | %) | 0.7 | % | ||||||||||
Funds available for distribution per diluted share | $ | 0.34 | $ | 0.32 | $ | 0.33 | $ | 0.33 | $ | 0.31 | $ | 0.32 | $ | 0.32 | ||||||||
Sequential increase (decrease) | 6.3 | % | (3.0 | %) | - | 6.5 | % | (3.1 | %) | - | ||||||||||||
Cash dividends | $ | 21,683 | $ | 21,575 | $ | 21,426 | $ | 21,276 | $ | 20,272 | $ | 19,725 | $ | 19,630 |
Page 16
EQUITY ONE, INC. AND SUBSIDIARIES | ||||||||||||||||||||||
CONSOLIDATED BALANCE SHEETS | ||||||||||||||||||||||
(in thousands, except per share data) | ||||||||||||||||||||||
As of | ||||||||||||||||||||||
Sep 30, 2005 | Jun 30, 2005 | Mar 31, 2005 | Dec 31, 2004 | Sep 30, 2004 | Jun 30, 2004 | Mar 31, 2004 | ||||||||||||||||
Assets | ||||||||||||||||||||||
Properties | ||||||||||||||||||||||
Income producing | $ | 1,644,783 | $ | 1,488,652 | $ | 1,911,819 | $ | 1,915,216 | $ | 1,777,783 | $ | 1,780,145 | $ | 1,740,063 | ||||||||
Less: accumulated depreciation | (102,620 | ) | (86,123 | ) | (104,718 | ) | (95,934 | ) | (86,871 | ) | (78,492 | ) | (74,485 | ) | ||||||||
Rental property | 1,542,163 | 1,402,529 | 1,807,101 | 1,819,282 | 1,690,912 | 1,701,653 | 1,665,578 | |||||||||||||||
Construction in progress and land held for development | 57,950 | 52,818 | 50,026 | 41,759 | 44,652 | 38,803 | 54,338 | |||||||||||||||
Property held for sale | 287,099 | 432,936 | 9,199 | 12,646 | 12,232 | 44,185 | 1,231 | |||||||||||||||
Properties, net | 1,887,212 | 1,888,283 | 1,866,326 | 1,873,687 | 1,747,796 | 1,784,641 | 1,721,147 | |||||||||||||||
Cash and cash equivalents | - | - | - | 5,122 | 1,988 | - | 17 | |||||||||||||||
Cash held in escrow | 3,308 | - | - | - | 8,734 | 5,814 | 1,884 | |||||||||||||||
Accounts and other receivables, net | 13,978 | 12,643 | 10,204 | 15,699 | 12,135 | 9,403 | 8,919 | |||||||||||||||
Securities | 27,601 | 52,303 | 44,593 | 35,756 | 29,405 | 18,287 | - | |||||||||||||||
Goodwill | 12,007 | 13,807 | 13,807 | 14,020 | 14,184 | 14,477 | 14,578 | |||||||||||||||
Other assets | 59,506 | 48,333 | 57,719 | 48,008 | 61,014 | 46,958 | 45,554 | |||||||||||||||
Total | $ | 2,003,612 | $ | 2,015,369 | $ | 1,992,649 | $ | 1,992,292 | $ | 1,875,256 | $ | 1,879,580 | $ | 1,792,099 | ||||||||
Liabilities and stockholders' equity | ||||||||||||||||||||||
Liabilities | ||||||||||||||||||||||
Mortgage notes payable | 391,801 | $ | 389,907 | $ | 488,817 | $ | 495,056 | $ | 480,739 | $ | 497,741 | $ | 470,263 | |||||||||
Mortgage notes payable related to properties held for sale | 57,745 | 64,296 | - | - | - | - | - | |||||||||||||||
Unsecured revolving credit facilities | 39,000 | 179,387 | 144,763 | 147,000 | 64,000 | 80,541 | 50,879 | |||||||||||||||
Unsecured senior notes payable | 465,532 | 347,310 | 345,165 | 347,261 | 350,000 | 350,000 | 350,000 | |||||||||||||||
Payable for securities | - | 4,774 | - | - | - | 11,075 | - | |||||||||||||||
Total debt | 954,078 | 985,674 | 978,745 | 989,317 | 894,739 | 939,357 | 871,142 | |||||||||||||||
Unamortized premium/discount on notes payable | 17,093 | 18,984 | 20,318 | 21,603 | 20,354 | 21,585 | 23,894 | |||||||||||||||
Total notes payable | 971,171 | 1,004,658 | 999,063 | 1,010,920 | 915,093 | 960,942 | 895,036 | |||||||||||||||
Accounts payable and other liabilities | 62,115 | 53,446 | 48,787 | 48,587 | 54,521 | 52,192 | 36,639 | |||||||||||||||
Total liabilities | 1,033,286 | 1,058,104 | 1,047,850 | 1,059,507 | 969,614 | 1,013,134 | 931,675 | |||||||||||||||
Minority interest | 1,457 | 1,437 | 1,417 | 1,397 | 1,388 | 12,400 | 12,444 | |||||||||||||||
Stockholders' equity | 968,869 | 955,828 | 943,382 | 931,388 | 904,254 | 854,046 | 847,980 | |||||||||||||||
Total | $ | 2,003,612 | $ | 2,015,369 | $ | 1,992,649 | $ | 1,992,292 | $ | 1,875,256 | $ | 1,879,580 | $ | 1,792,099 |
Page 17
EQUITY ONE, INC. AND SUBSIDIARIES | ||||||||||||||||||||||
DEBT SUMMARY | ||||||||||||||||||||||
As of September 30, 2005 | ||||||||||||||||||||||
(in thousands) |
Maturity | Sep 30, 2005 | Dec 31, 2004 | Percent of total | |||||||||||||
Debt Instrument | date | Rate (1) | balance | balance | indebtedness | |||||||||||
Mortgage debt | ||||||||||||||||
Lantana Village | 03/15/05 | 6.950% | $ | - | $ | 3,512 | NA | |||||||||
Elmwood Oaks | 06/01/05 | 8.375% | - | 7,500 | NA | |||||||||||
Benchmark Crossing (2) | 08/01/05 | 9.250% | - | 3,226 | NA | |||||||||||
Sterling Plaza (2) | 09/01/05 | 8.750% | - | 3,874 | NA | |||||||||||
Woodruff (2) | 09/10/05 | 7.580% | - | 2,969 | NA | |||||||||||
Townsend Square (2) | 10/01/05 | 8.500% | - | 4,768 | NA | |||||||||||
Green Oaks (2) | 11/01/05 | 8.375% | - | 2,937 | NA | |||||||||||
Melbourne Plaza (2) | 11/01/05 | 8.375% | - | 1,698 | NA | |||||||||||
Walden Woods | 08/01/06 | 7.875% | 2,180 | 2,272 | 0.22 | % | ||||||||||
Big Curve (3) | 10/01/06 | 9.190% | - | 5,310 | NA | |||||||||||
Highland Square | 12/01/06 | 8.870% | 3,874 | 3,951 | 0.40 | % | ||||||||||
Park Northern | 12/01/06 | 8.370% | - | 2,182 | NA | |||||||||||
Crossroads Square | 12/01/06 | 8.440% | 12,175 | 12,324 | 1.25 | % | ||||||||||
Rosemeade | 12/01/07 | 8.295% | 3,051 | 3,109 | 0.31 | % | ||||||||||
Colony Plaza | 01/01/08 | 7.540% | 2,943 | 2,976 | 0.30 | % | ||||||||||
Parkwood | 01/01/08 | 7.280% | 6,040 | 6,110 | 0.62 | % | ||||||||||
Richwood | 01/01/08 | 7.280% | 3,111 | 3,147 | 0.32 | % | ||||||||||
Commonwealth | 02/15/08 | 7.000% | 2,542 | 2,636 | 0.26 | % | ||||||||||
Mariners Crossing | 03/01/08 | 7.080% | 3,293 | 3,332 | 0.34 | % | ||||||||||
Pine Island/Ridge Plaza | 07/01/08 | 6.910% | 24,296 | 24,582 | 2.50 | % | ||||||||||
Forestwood | 01/01/09 | 5.070% | 7,003 | 7,128 | 0.72 | % | ||||||||||
North Port Shopping Center | 02/08/09 | 6.650% | 3,929 | 4,008 | 0.40 | % | ||||||||||
Prosperity Centre | 03/01/09 | 7.875% | 5,727 | 6,022 | 0.59 | % | ||||||||||
Ibis Shopping Center | 09/01/09 | 6.730% | 5,546 | 5,687 | 0.57 | % | ||||||||||
Tamarac Town Square | 10/01/09 | 9.190% | 6,053 | 6,122 | 0.62 | % | ||||||||||
Park Promenade | 02/01/10 | 8.100% | 6,191 | 6,241 | 0.64 | % |
Page 18
EQUITY ONE, INC. AND SUBSIDIARIES | ||||||||||||||||||||||
DEBT SUMMARY | ||||||||||||||||||||||
As of September 30, 2005 | ||||||||||||||||||||||
(in thousands) |
Maturity | Sep 30, 2005 | Dec 31, 2004 | Percent of total | |||||||||||||
Debt Instrument | date | Rate (1) | balance | balance | indebtedness | |||||||||||
Skipper Palms | 03/01/10 | 8.625% | $ | 3,502 | $ | 3,526 | 0.36 | % | ||||||||
Jonathan's Landing | 05/01/10 | 8.050% | 2,841 | 2,868 | 0.29 | % | ||||||||||
Bluff's Square | 06/01/10 | 8.740% | 9,938 | 10,005 | 1.02 | % | ||||||||||
Kirkman Shoppes | 06/01/10 | 8.740% | 9,385 | 9,448 | 0.97 | % | ||||||||||
Ross Plaza | 06/01/10 | 8.740% | 6,545 | 6,589 | 0.67 | % | ||||||||||
Boynton Plaza | 07/01/10 | 8.030% | 7,365 | 7,423 | 0.76 | % | ||||||||||
Pointe Royale | 07/15/10 | 7.950% | 4,085 | 4,284 | 0.42 | % | ||||||||||
Westgate Marketplace | 07/31/10 | 4.880% | 29,279 | 29,625 | 3.01 | % | ||||||||||
Shops at Skylake | 08/01/10 | 7.650% | 13,975 | 14,266 | 1.44 | % | ||||||||||
Parkwest Crossing | 09/01/10 | 8.100% | 4,649 | 4,684 | 0.48 | % | ||||||||||
Spalding Village | 09/01/10 | 8.190% | 9,984 | 10,231 | 1.03 | % | ||||||||||
Minyards | 11/01/10 | 8.320% | 2,443 | 2,473 | 0.25 | % | ||||||||||
Charlotte Square | 02/01/11 | 9.190% | 3,498 | 3,550 | 0.36 | % | ||||||||||
Forest Village | 04/01/11 | 7.270% | 4,402 | 4,441 | 0.45 | % | ||||||||||
Boca Village | 05/01/11 | 7.200% | 8,140 | 8,211 | 0.84 | % | ||||||||||
MacLand Pointe | 05/01/11 | 7.250% | 5,748 | 5,798 | 0.59 | % | ||||||||||
Pine Ridge Square | 05/01/11 | 7.020% | 7,207 | 7,273 | 0.74 | % | ||||||||||
Sawgrass Promenade | 05/01/11 | 7.200% | 8,140 | 8,211 | 0.84 | % | ||||||||||
Presidential Markets | 06/01/11 | 7.650% | 26,947 | 27,159 | 2.77 | % | ||||||||||
Lake Mary | 11/01/11 | 7.250% | 24,082 | 24,282 | 2.48 | % | ||||||||||
Lake St. Charles | 11/01/11 | 7.130% | 3,801 | 3,833 | 0.39 | % | ||||||||||
Belfair Towne Village | 12/01/11 | 7.320% | 11,039 | 11,197 | 1.14 | % | ||||||||||
Marco Town Center | 01/01/12 | 6.700% | 8,455 | 8,578 | 0.87 | % | ||||||||||
Riverside Square | 03/01/12 | 9.190% | 7,503 | 7,589 | 0.77 | % | ||||||||||
Sparkleberry Square (4) | 11/30/12 | 6.170% | 6,559 | 6,655 | 0.68 | % | ||||||||||
Cashmere Corners | 11/01/12 | 5.880% | 5,060 | 5,141 | 0.52 | % | ||||||||||
Eastwood | 11/01/12 | 5.880% | 6,029 | 6,126 | 0.62 | % |
Page 19
EQUITY ONE, INC. AND SUBSIDIARIES | ||||||||||||||||||||||
DEBT SUMMARY | ||||||||||||||||||||||
As of September 30, 2005 | ||||||||||||||||||||||
(in thousands) |
Maturity | Sep 30, 2005 | Dec 31, 2004 | Percent of total | |||||||||||||
Debt Instrument | date | Rate (1) | balance | balance | indebtedness | |||||||||||
Meadows Shopping Center | 11/01/12 | 5.870% | $ | 6,336 | $ | 6,438 | 0.65 | % | ||||||||
Lutz Lake | 12/01/12 | 6.280% | 7,500 | 7,500 | 0.77 | % | ||||||||||
Summerlin Square | 02/01/14 | 6.750% | 3,402 | 3,622 | 0.35 | % | ||||||||||
Bird Ludlum | 02/15/15 | 7.680% | 9,203 | 9,690 | 0.95 | % | ||||||||||
Treasure Coast Plaza | 04/01/15 | 8.000% | 4,314 | 4,532 | 0.44 | % | ||||||||||
Shoppes of Silverlakes | 07/01/15 | 7.750% | 2,503 | 2,627 | 0.26 | % | ||||||||||
Medford | 02/01/16 | 8.690% | 5,285 | 5,512 | 0.54 | % | ||||||||||
Swampscott | 02/01/16 | 8.690% | 2,296 | 2,395 | 0.24 | % | ||||||||||
Plymouth | 02/01/16 | 8.690% | 3,863 | 4,029 | 0.40 | % | ||||||||||
Grassland Crossing | 12/01/16 | 7.870% | 5,701 | 5,827 | 0.59 | % | ||||||||||
Mableton Crossing | 08/15/18 | 6.850% | 3,987 | 4,062 | 0.41 | % | ||||||||||
Sparkleberry Square (4) | 06/30/20 | 6.750% | 7,695 | 7,918 | 0.79 | % | ||||||||||
BridgeMill | 05/05/21 | 7.940% | 9,265 | 9,395 | 0.95 | % | ||||||||||
Westport Plaza | 08/24/23 | 7.490% | 4,806 | 4,876 | 0.49 | % | ||||||||||
Chastain Square | 02/28/24 | 6.500% | 3,744 | 3,821 | 0.39 | % | ||||||||||
Daniel Village | 02/28/24 | 6.500% | 4,093 | 4,177 | 0.42 | % | ||||||||||
Douglas Commons | 02/28/24 | 6.500% | 4,876 | 4,976 | 0.50 | % | ||||||||||
Fairview Oaks | 02/28/24 | 6.500% | 4,616 | 4,710 | 0.48 | % | ||||||||||
Madison Centre | 02/28/24 | 6.500% | 3,745 | 3,821 | 0.39 | % | ||||||||||
Paulding Commons | 02/28/24 | 6.500% | 6,358 | 6,487 | 0.65 | % | ||||||||||
Siegen Village | 02/28/24 | 6.500% | 4,137 | 4,221 | 0.43 | % | ||||||||||
Wesley Chapel Crossing | 02/28/24 | 6.500% | 3,266 | 3,332 | 0.34 | % | ||||||||||
Total mortgage debt (65 loans) | 7.24% | 449,546 | 495,056 | 46.29 | % | |||||||||||
Net interest premium/discount | (wtd-avg maturity) | (wtd-avg interest rate) | 11,401 | 12,721 | 1.17 | % | ||||||||||
Total mortgage debt (including net interest premium/discount) | $ | 460,947 | $ | 507,777 | 47.46 | % |
Page 20
EQUITY ONE, INC. AND SUBSIDIARIES | ||||||||||||||||||||||
DEBT SUMMARY | ||||||||||||||||||||||
As of September 30, 2005 | ||||||||||||||||||||||
(in thousands) |
Maturity | Sep 30, 2005 | Dec 31, 2004 | Percent of total | |||||||||||||
Debt Instrument | date | Rate (1) | balance | balance | indebtedness | |||||||||||
Unsecured senior notes payable | ||||||||||||||||
7.77% senior notes | 04/01/06 | 7.770 | $ | 50,000 | $ | 50,000 | 5.15 | % | ||||||||
7.25% senior notes | 08/15/07 | 7.250 | 75,000 | 75,000 | 7.72 | % | ||||||||||
3.875% senior notes (5) | 04/15/09 | 3.875 | 200,000 | 200,000 | 20.59 | % | ||||||||||
Fair value of interest rate swap | 04/15/09 | 6-month Libor + 0.4375 | (4,468 | ) | (2,739 | ) | -0.46 | % | ||||||||
7.84% senior notes | 01/23/12 | 7.840 | 25,000 | 25,000 | 2.57 | % | ||||||||||
5.375% senior notes | 10/15/15 | 5.375 | 120,000 | - | 12.36 | % | ||||||||||
Total unsecured senior notes payable | 5.42% | 465,532 | 347,261 | 47.94 | % | |||||||||||
Net interest premium/discount | (wtd-avg maturity) | (wtd-avg interest rate) | 5,692 | 8,882 | 0.59 | % | ||||||||||
Total unsecured senior notes payable (including net interest premium/discount) | $ | 471,224 | $ | 356,143 | 48.52 | % | ||||||||||
Revolving credit facilities | ||||||||||||||||
$340MM Wells Fargo Unsecured | 02/12/06 | 4.15% | 39,000 | 147,000 | 4.02 | % | ||||||||||
$5MM City National Bank Unsecured | 11/11/05 | NA | - | - | 0.00 | % | ||||||||||
Total revolving credit facilities | $ | 39,000 | $ | 147,000 | 4.02 | % | ||||||||||
Total debt | 954,078 | 989,317 | 98.24 | % | ||||||||||||
Net interest premium/discount | 17,093 | 21,603 | 1.76 | % | ||||||||||||
Total debt (including net interest premium/discount) | $ | 971,171 | $ | 1,010,920 | 100.00 | % | ||||||||||
Senior Unsecured Debt Ratings | ||||||||||||||||
Moody's | Baa3 (Positive) | Baa3 (Stable) | ||||||||||||||
S&P | BBB- (Stable) | BBB- (Stable) |
Page 21
DEBT MATURITIES | |||||||||||||||||||
As of September 30, 2005 | |||||||||||||||||||
(in thousands) | |||||||||||||||||||
Secured Debt | Unsecured Debt | ||||||||||||||||||
Maturity schedule | Scheduled | Balloon | Revolving | Senior | Percent of | ||||||||||||||
by year | amortization | payments (6) | Credit Facilities (6) | Notes (7) | Total | debt maturing | |||||||||||||
2005 | $ | 2,621 | $ | - | $ | - | $ | - | $ | 2,621 | 0.3 | % | |||||||
2006 | 10,847 | 17,737 | 39,000 | 50,000 | 117,584 | 12.3 | % | ||||||||||||
2007 | 11,252 | 2,864 | - | 75,000 | 89,116 | 9.3 | % | ||||||||||||
2008 | 11,391 | 40,104 | - | - | 51,495 | 5.4 | % | ||||||||||||
2009 | 11,125 | 24,332 | - | 200,000 | 235,457 | 24.6 | % | ||||||||||||
2010 | 10,224 | 98,471 | - | - | 108,695 | 11.3 | % | ||||||||||||
2011 | 8,490 | 93,433 | - | - | 101,923 | 10.6 | % | ||||||||||||
2012 | 7,324 | 40,056 | - | 25,000 | 72,380 | 7.6 | % | ||||||||||||
2013 | 7,020 | - | - | - | 7,020 | 0.7 | % | ||||||||||||
2014 | 7,110 | - | - | - | 7,110 | 0.7 | % | ||||||||||||
Thereafter | 35,130 | 10,015 | - | 120,000 | 165,145 | 17.2 | % | ||||||||||||
Total | $ | 122,534 | $ | 327,012 | $ | 39,000 | $ | 470,000 | $ | 958,546 | 100.0 | % |
(1) | The rate in effect on September 30, 2005. |
(2) | These loans have been paid off prior to the stated maturity without incurring any pre-payment penalties. |
(3) | This loan was assumed by the buyer in connection with the sale of this property. |
(4) | The Sparkleberry property is encumbered by two separate mortgages. |
(5) | $100M of the outstanding balance has been swapped to a floating interest rate based on six-month LIBOR in arrears, plus 0.4375%. The indicated rate and weighted average rate for the unsecured notes does not reflect the effect of the interest rate swap. |
(6) | Represents the entire principal balance of a maturing loan on the maturity date. Credit facilities are shown as due on the initial maturity dates, though certain extension options are available. Includes amounts payable for securities. |
(7) | Excludes the adjustment attributable to the fair value of the associated interest rate swap. |
Page 22
EQUITY ONE, INC. AND SUBSIDIARIES | ||||||||||||
PROPERTY STATUS REPORT | ||||||||||||
As of September 30, 2005 | ||||||||||||
Year | Total | number | Supermarket anchor | Average | ||||||||
built / | square footage | Percent | of tenants | owned | shadow | name | base rent | |||||
Property | City | renovated | owned | leased | leased | vacant | SF | SF | expiration date | Other anchor tenants | per leased SF | |
ALABAMA (2) | ||||||||||||
Madison Centre | Madison | 1997 | 64,837 | 97.5% | 12 | 1 | 37,912 | Publix | Rite Aid | $ 9.56 | ||
(6/1/2017) | ||||||||||||
West Gate Plaza | Mobile | 1974, 1995 / 1985 | 64,378 | 99.2% | 8 | 1 | 44,000 | Winn-Dixie | Rite Aid | 7.19 | ||
(7/19/2015) | ||||||||||||
TOTAL SHOPPING CENTERS ALABAMA (2) | 129,215 | 98.4% | 20 | 2 | 81,912 | 0 | $ 8.37 | |||||
FLORIDA (78) | ||||||||||||
North Florida (13) | ||||||||||||
Atlantic Village | Atlantic Beach | 1984 / 1998 | 100,559 | 96.4% | 23 | 2 | 39,795 | Publix | JoAnn Fabrics, Dollar Tree | 10.37 | ||
(10/31/2008) | ||||||||||||
Beauclerc Village | Jacksonville | 1962 / 1988 | 70,429 | 86.9% | 10 | 1 | Big Lots, Goodwill, Bealls Outlet | 8.00 | ||||
Commonwealth | Jacksonville | 1984 / 1998 | 81,467 | 89.1% | 13 | 3 | 48,997 | Winn-Dixie/Save Rite | 8.36 | |||
(2/28/2018) | ||||||||||||
Forest Village | Tallahassee | 2000 | 71,526 | 90.5% | 12 | 5 | 37,866 | Publix | 10.32 | |||
(4/30/2020) | ||||||||||||
Ft. Caroline | Jacksonville | 1985 / 1995 | 74,546 | 82.3% | 10 | 3 | 45,500 | Winn-Dixie | 7.48 | |||
(5/31/2015) | ||||||||||||
Mandarin Landing | Jacksonville | 1976 / 2000 | 141,565 | 96.4% | 34 | 3 | 34,400 | Publix | Office Depot | 10.03 | ||
(2/14/2007) | ||||||||||||
Medical & Merchants | Jacksonville | 1993 | 152,761 | 97.8% | 15 | 2 | 55,999 | Publix | Memorial Health Group, Blockbuster | 11.83 | ||
(2/10/2013) | ||||||||||||
Middle Beach | Panama City Beach | 1994 | 69,277 | 100.0% | 9 | 0 | 56,077 | Publix | Movie Gallery | 9.57 | ||
(9/30/2014) | ||||||||||||
Monument Point | Jacksonville | 1985 / 1997 | 75,128 | 100.0% | 12 | 0 | 46,772 | Winn-Dixie | CVS Pharmacy | 6.80 | ||
(3/27/2010) | ||||||||||||
Oak Hill | Jacksonville | 1985 / 1997 | 78,492 | 100.0% | 19 | 0 | 39,795 | Publix | Beall's | 7.18 | ||
(3/11/2010) | ||||||||||||
Parkmore Plaza | Milton | 1986 | 159,093 | 100.0% | 13 | 0 | Bealls, Big Lots | 3.71 | ||||
Pensacola Plaza | Pensacola | 1985 | 56,098 | 100.0% | 3 | 0 | 42,848 | FoodWorld | 4.52 | |||
(12/31/2009) | ||||||||||||
South Beach | Jacksonville Beach | 1990, 1991 | 289,964 | 93.2% | 42 | 9 | 29,000 | Food Lion | Home Depot, Stein Mart, Bealls | 10.12 | ||
(3/31/2010) | ||||||||||||
Central Florida (11) | ||||||||||||
Alafaya Commons | Orlando | 1987 | 123,133 | 99.2% | 28 | 1 | 54,230 | Publix | Blockbuster | 11.99 | ||
(11/30/2007) | ||||||||||||
Conway Crossing | Orlando | 2002 | 76,321 | 100.0% | 18 | 0 | 44,271 | Publix | 11.89 | |||
(4/30/2022) | ||||||||||||
Eastwood | Orlando | 1997 | 69,037 | 100.0% | 13 | 0 | 51,512 | Publix | 11.45 | |||
(11/1/2017) | ||||||||||||
Eustis Square | Eustis | 1983 / 1997 / 2004 | 126,791 | 93.6% | 20 | 7 | 15,872 | Save-a-Lot | Accent Marketing, Goodwill | $ 5.51 | ||
(5/31/2013) | ||||||||||||
Hunters Creek | Orlando | 1998 | 68,032 | 24.7% | 8 | 1 | 19.09 |
Page 23
EQUITY ONE, INC. AND SUBSIDIARIES
PROPERTY STATUS REPORT
As of September 30, 2005
Year | Total | number | Supermarket anchor | Average | ||||||||
built / | square footage | Percent | of tenants | owned | shadow | name | base rent | |||||
Property | City | renovated | owned | leased | leased | vacant | SF | SF | expiration date | Other anchor tenants | per leased SF | |
Kirkman Shoppes | Orlando | 1973 | 88,820 | 100.0% | 30 | 0 | 17.06 | |||||
Lake Mary | Orlando | 1988 / 2001 | 342,384 | 98.9% | 66 | 20 | 63,139 | Albertsons (6/30/2012) | Kmart, Lifestyle Fitness, Sunstar Movie Theatres | 12.39 | ||
Park Promenade | Orlando | 1987 / 2000 | 125,818 | 97.9% | 25 | 1 | 55,000 | Publix* (2/9/2007) | Orange County Library, Blockbuster, Goodwill | 9.04 | ||
Town & Country | Kissimmee | 1993 | 72,043 | 98.3% | 12 | 1 | 52,883 | Albertsons | 7.38 | |||
(10/31/2018) | ||||||||||||
Unigold | Winter Park | 1987 | 117,527 | 98.8% | 24 | 1 | 52,500 | Winn-Dixie (4/30/2007) | Blockbuster, Lifestyle Family Fitness | 10.91 | ||
Walden Woods | Plant City | 1985 / 1998, 2003 | 75,874 | 82.9% | 12 | 1 | Dollar Tree, Aaron Rents, Dollar General | 6.71 | ||||
Florida West Coast (17) | ||||||||||||
Bay Pointe Plaza | St. Petersburg | 1984 / 2002 | 103,986 | 95.6% | 20 | 4 | 52,610 | Publix (11/30/2021) | Bealls Outlet, West Marine | 9.49 | ||
Carrollwood | Tampa | 1970 / 2002 | 94,203 | 89.8% | 29 | 7 | 27,887 | Publix (11/30/2022) | Floors Today | 12.24 | ||
Charlotte Square | Port Charlotte | 1980 | 96,188 | 99.1% | 23 | 1 | 44,024 | Publix* (1/31/2011) | Pet Supermarket | 8.32 | ||
Chelsea Place | New Port Richey | 1992 | 81,144 | 98.8% | 17 | 1 | 48,890 | Publix (5/27/2012) | CVS Pharmacy | 11.18 | ||
Lake St. Charles | Tampa | 1999 | 57,015 | 100.0% | 8 | 0 | 46,295 | Kash n' Karry (6/30/2019) | 9.86 | |||
Lutz Lake | Lutz | 2002 | 64,985 | 98.2% | 14 | 1 | 44,270 | Publix (5/31/2022) | 13.77 | |||
Marco Town Center | Marco Island | 2001 | 109,830 | 98.8% | 42 | 1 | 27,887 | Publix (1/31/2018) | West Marine | 17.69 | ||
Mariners Crossing | Spring Hill | 1989 / 1999 | 85,507 | 98.5% | 14 | 1 | 48,315 | Kash n' Karry (8/15/2020) | 8.43 | |||
Pavilion | Naples | 1982 | 167,745 | 93.6% | 40 | 2 | 50,795 | Publix (2/28/2013) | Pavillion 6 Theatre, Anthony's | 14.72 | ||
Regency Crossing | Port Richey | 1986 / 2001 | 85,864 | 83.5% | 14 | 11 | 44,270 | Publix (2/28/2021) | 10.42 | |||
Ross Plaza | Tampa | 1984 / 1996 | 85,359 | 98.4% | 17 | 2 | Ross Dress for Less, Laminate Kingdom | 10.15 | ||||
Seven Hills | Spring Hill | 1991 | 64,590 | 100.0% | 12 | 0 | 48,890 | Publix (9/25/2011) | 9.84 | |||
Shoppes of North Port | North Port | 1991 | 84,705 | 100.0% | 22 | 0 | 48,890 | Publix (12/11/2011) | Bealls Outlet | 10.05 | ||
Skipper Palms | Tampa | 1984 | 88,000 | 87.8% | 13 | 4 | 53,440 | Winn-Dixie (5/31/2016) | 8.52 | |||
Summerlin Square | Fort Myers | 1986 / 1998 | 109,156 | 90.8% | 21 | 7 | 45,500 | Winn-Dixie (6/4/2006) | CVS Pharmacy, West Marine | 10.63 | ||
Venice Plaza | Venice | 1971/ 1979 / 1999 | 148,779 | 84.2% | 14 | 2 | 42,582 | Kash n' Karry (9/30/2018) | TJ Maxx, Blockbuster | 5.52 | ||
Venice Shopping Center | Venice | 1968 / 2000 | 111,934 | 98.1% | 14 | 1 | 44,271 | Publix (12/31/2026) | Beall's Outlet, Dollar Tree, Wachovia Bank | 5.38 |
Page 24
EQUITY ONE, INC. AND SUBSIDIARIES
PROPERTY STATUS REPORT
As of September 30, 2005
Year | Total | number | Supermarket anchor | Average | ||||||||
built / | square footage | Percent | of tenants | owned | shadow | name | base rent | |||||
Property | City | renovated | owned | leased | leased | vacant | SF | SF | expiration date | Other anchor tenants | per leased SF | |
Florida Treasure Coast (8) | ||||||||||||
Bluffs Square | Jupiter | 1986 | 132,395 | 99.5% | 47 | 2 | 39,795 | Publix | Walgreens | $ 12.48 | ||
(10/22/2006) | ||||||||||||
Cashmere Corners | Port St. Lucie | 2001 | 89,234 | 100.0% | 18 | 0 | 59,448 | Albertsons | 8.19 | |||
(4/30/2025) | ||||||||||||
Jonathan's Landing | Jupiter | 1997 | 26,820 | 100.0% | 12 | 0 | 53,850 | Albertsons | Blockbuster | 18.99 | ||
New Smyrna Beach | New Smyrna Beach | 1987 | 118,451 | 98.5% | 33 | 1 | 42,112 | Publix (9/30/2007) | Walgreens* (Bealls Outlet), Bealls Home Outlet, Blockbuster | 9.79 | ||
Old King Commons | Palm Coast | 1988 | 84,759 | 100.0% | 19 | 0 | Wal-Mart* (Bealls Outlet) | 8.19 | ||||
Ryanwood | Vero Beach | 1987 | 114,925 | 100.0% | 32 | 0 | 39,795 | Publix | Bealls Outlet, Books-A-Million | 9.94 | ||
(3/23/2017) | ||||||||||||
Salerno Village | Stuart | 1987 | 79,903 | 97.4% | 18 | 2 | 45,802 | Winn-Dixie | CVS Pharmacy | 10.52 | ||
(3/23/2024) | ||||||||||||
Treasure Coast | Vero Beach | 1983 | 133,781 | 95.7% | 22 | 3 | 59,450 | Winn-Dixie | TJ Maxx | 8.81 | ||
(4/12/2015) | ||||||||||||
South Florida / Atlantic Coast (29) | ||||||||||||
Bird Ludlum | Miami | 1988 / 1998 | 192,282 | 97.9% | 44 | 1 | 44,400 | Winn-Dixie | CVS Pharmacy, Blockbuster, Goodwill | 15.32 | ||
(12/31/2007) | ||||||||||||
Boca Village | Boca Raton | 1978 | 93,428 | 100.0% | 22 | 0 | 36,000 | Publix | CVS Pharmacy | 15.76 | ||
(3/31/2007) | ||||||||||||
Boynton Plaza | Boynton Beach | 1978 / 1999 | 99,324 | 100.0% | 29 | 0 | 37,664 | Publix | CVS Pharmacy, Hollywood Video | 11.28 | ||
(8/31/2008) | ||||||||||||
Countryside Shops | Cooper City | 1986, 1988, 1991 | 179,561 | 100.0% | 47 | 0 | 39,795 | Publix | CVS Pharmacy, Stein Mart | 12.93 | ||
(12/4/2010) | ||||||||||||
Crossroads Square | Ft. Lauderdale | 1973 | 270,206 | 98.6% | 25 | 2 | Lowe's, CVS Pharmacy, 99 Cent Stuff | 7.84 | ||||
CVS Plaza | Miami | 2004 | 29,204 | 100.0% | 8 | 0 | CVS Pharmacy | 14.95 | ||||
El Novillo | Miami Beach | 1970 / 2000 | 10,000 | 100.0% | 1 | 0 | Jumbo Buffet | 15.94 | ||||
Homestead Gas Station | Homestead | 1959 | 2,136 | 100.0% | 1 | 0 | 20.33 | |||||
Greenwood | Palm Springs | 1982, 1994 | 132,325 | 94.8% | 33 | 5 | 50,032 | Publix (12/5/2014) | Bealls Outlet, World Savings Bank | 12.22 | ||
Lago Mar | Miami | 1995 | 82,613 | 97.3% | 20 | 1 | 42,323 | Publix | Blockbuster | 12.86 | ||
(9/13/2015) | ||||||||||||
Lantana Village | Lantana | 1976 / 1999 | 181,780 | 99.2% | 24 | 2 | 39,473 | Winn-Dixie (2/15/2011) | Kmart, Rite Aid* (Family Dollar), Hollywood Video | 7.15 | ||
Meadows | Miami | 1997 | 75,524 | 100.0% | 21 | 0 | 47,955 | Publix | 12.84 | |||
(7/9/2017) | ||||||||||||
Oakbrook Square | Palm Beach Gardens | 1974 / 2000, 2003 | 212,074 | 91.8% | 27 | 3 | 44,400 | Publix (11/30/2020) | Stein Mart, Homegoods, CVS, Basset Furniture | 13.61 | ||
Pine Island | Davie | 1983 / 1999 | 254,907 | 96.8% | 46 | 1 | 39,943 | Publix | Home Depot Expo, Bealls Outlet | 10.47 | ||
(11/30/2013) | ||||||||||||
Pine Ridge Square | Coral Springs | 1986 / 1998, 1999 | 117,399 | 98.3% | 33 | 2 | 17,441 | Fresh Market (6/30/2009) | Bed Bath & Beyond, Off Main Furniture, Blockbuster | 13.78 | ||
Plaza Alegre | Miami | 2003 | 91,611 | 98.7% | 20 | 1 | 44,271 | Publix | Goodwill, Blockbuster | 14.74 | ||
(3/14/2023) | ||||||||||||
Point Royale | Miami | 1970 / 2000 | 209,863 | 98.2% | 25 | 1 | 45,350 | Winn-Dixie (2/18/2011) | Best Buy, CVS Pharmacy* (Anna's Linens) | 6.47 |
Page 25
EQUITY ONE, INC. AND SUBSIDIARIES
PROPERTY STATUS REPORT
As of September 30, 2005
Page 26
EQUITY ONE, INC. AND SUBSIDIARIES
PROPERTY STATUS REPORT
As of September 30, 2005
Year | Total | number | Supermarket anchor | Average | ||||||||
built / | square footage | Percent | of tenants | owned | shadow | name | base rent | |||||
Property | City | renovated | owned | leased | leased | vacant | SF | SF | expiration date | Other anchor tenants | per leased SF | |
Macland Pointe | Marietta | 1992-1993 | 79,699 | 98.5% | 16 | 1 | 55,999 | Publix | 9.68 | |||
(12/29/2012) | ||||||||||||
Market Place | Norcross | 1976 | 77,706 | 94.3% | 19 | 4 | Peachtree Cinema | 10.94 | ||||
Paulding Commons | Dallas | 1991 | 192,391 | 95.9% | 27 | 4 | 49,700 | Kroger (2/28/2011) | Kmart | $ 8.04 | ||
Powers Ferry Plaza | Marietta | 1979, 1987 / 1998 | 86,473 | 91.5% | 20 | 5 | Micro Center | 10.49 | ||||
Presidential Markets | Snellville | 1993-2000 | 396,408 | 98.5% | 33 | 2 | 56,146 | Publix (12/31/2019) | Bed Bath & Beyond, GAP, TJ Maxx, Shoe Carnival, Borders, Ross Dress for Less, Marshalls, Carmike Cinema, Office Depot | 10.43 | ||
Shops of Huntcrest | Lawrenceville | 2003 | 97,040 | 100.0% | 26 | 0 | 54,340 | Publix | 13.67 | |||
(1/31/2023) | ||||||||||||
Wesley Chapel Crossing | Decatur | 1989 | 170,792 | 37.9% | 17 | 8 | 32,000 | Ingles* (9/25/2009) | CVS Pharmacy | 8.10 | ||
West Towne Square | Rome | 1988 | 89,596 | 84.4% | 13 | 5 | Big Lots, Eckerd* | 5.44 | ||||
Williamsburg @ Dunwoody | Dunwoody | 1983 | 44,928 | 100.0% | 27 | 0 | 18.17 | |||||
Central Georgia (3) | ||||||||||||
Daniel Village | Augusta | 1956 / 1997 | 171,932 | 95.4% | 35 | 4 | 45,971 | Bi-Lo | Eckerd, St. Joseph Home Health Care | 8.02 | ||
(3/25/2022) | ||||||||||||
Spalding Village | Griffin | 1989 | 235,318 | 67.3% | 21 | 8 | 59,431 | Kroger | JC Penney, Blockbuster | 7.85 | ||
(5/31/2014) | ||||||||||||
Walton Plaza | Augusta | 1990 | 43,460 | 97.9% | 7 | 1 | 32,960 | Harris Teeter* (Omni Fitness) (4/1/2011) | 9.56 | |||
South Georgia (2) | ||||||||||||
Colony Square | Fitzgerald | 1987 | 50,000 | 71.6% | 2 | 5 | 32,200 | Food Lion* (Harvey's) | 5.86 | |||
(12/31/2007) | ||||||||||||
McAlpin Square | Savannah | 1979 | 176,807 | 94.4% | 25 | 2 | 43,600 | Kroger (8/31/2015) | US Post Office, Big Lots, In Fashion Menswear Outlet | 7.51 | ||
TOTAL SHOPPING CENTERS GEORGIA (14) | 2,743,854 | 88.1% | 446 | 70 | 931,198 | 0 | $ 10.09 | |||||
KENTUCKY (1) | ||||||||||||
Scottsville Square | Bowling Green | 1986 | 38,450 | 79.2% | 9 | 3 | Hancock Fabrics | 4.21 | ||||
TOTAL SHOPPING CENTERS KENTUCKY (1) | 38,450 | 79.2% | 9 | 3 | 0 | 0 | $ 4.21 | |||||
LOUISIANA (14) | ||||||||||||
Ambassador Row | Lafayette | 1980, 1991 | 193,978 | 84.3% | 22 | 4 | Conn's Appliances, Big Lots, Chuck E Cheese, Goody's | 8.81 | ||||
Ambassador Row Courtyard | Lafayette | 1986, 1991 / 2005 | 146,697 | 93.1% | 20 | 3 | Bed. Bath & Beyond, Marshall's, Hancock Fabrics | 9.36 | ||||
Bluebonnet Village | Baton Rouge | 1983 | 90,215 | 98.4% | 19 | 2 | 33,387 | Matherne's | Ace Hardware | 8.25 | ||
(11/30/2010) | ||||||||||||
Boulevard | Lafayette | 1976, 1994 | 68,012 | 96.8% | 14 | 1 | Piccadilly, Harbor Freight Tools, Golfballs.com | 7.37 | ||||
Country Club Plaza | Slidell | 1982 / 1994 | 64,686 | 94.6% | 10 | 1 | 33,387 | Winn-Dixie (1/31/2008) | Dollar General | 5.92 | ||
Crossing | Slidell | 1988, 1993 | 113,989 | 94.7% | 13 | 2 | 58,432 | Save A Center (9/29/2009) | A-1 Home Appliance, Piccadilly | 5.48 |
Page 27
EQUITY ONE, INC. AND SUBSIDIARIES | ||||||||||||
PROPERTY STATUS REPORT | ||||||||||||
As of September 30, 2005 | ||||||||||||
Year | Total | number | Supermarket anchor | Average | ||||||||
built / | square footage | Percent | of tenants | owned | shadow | name | base rent | |||||
Property | City | renovated | owned | leased | leased | vacant | SF | SF | expiration date | Other anchor tenants | per leased SF | |
Elmwood Oaks | Harahan | 1989 | 133,995 | 88.4% | 9 | 2 | Academy Sports, Dollar Tree, Advance Auto* (Goodwill) | 9.56 | ||||
Grand Marche (ground lease) | Lafayette | 1969 | 200,585 | 100.0% | 1 | 0 | Academy Sports, JoAnn Fabrics | 0.14 | ||||
Plaza Acadienne | Eunice | 1980 | 105,419 | 52.6% | 6 | 2 | 28,092 | Super 1 Store (6/30/2010) | Fred's, Howard Brothers* | $ 4.09 | ||
Sherwood South | Baton Rouge | 1972, 1988, 1992 | 77,107 | 87.4% | 8 | 1 | Burke's Outlet, Harbor Freight Tools, Blockbuster | 7.01 | ||||
Siegen Village | Baton Rouge | 1988 | 170,416 | 99.5% | 19 | 1 | Office Depot, Big Lots, Dollar Tree, Stage, Party City | 8.41 | ||||
Tarpon Heights | Galliano | 1982 | 56,605 | 85.6% | 7 | 3 | CVS Pharmacy, Stage, Dollar General | 4.77 | ||||
Village at Northshore | Slidell | 1988 | 144,638 | 97.6% | 12 | 1 | Marshalls, Dollar Tree, Kirschman's, Bed Bath & Beyond, Office Depot | 8.45 | ||||
Wal-Mart Mathews | Mathews | 1985 | 54,223 | 100.0% | 1 | 0 | Wal-Mart | 2.90 | ||||
TOTAL SHOPPING CENTERS LOUISIANA (14) | 1,620,565 | 91.3% | 161 | 23 | 153,298 | 0 | $ 6.60 | |||||
MASSACHUSETTS (6) | ||||||||||||
Cambridge Star Market | Cambridge | 1953 / 1997 | 66,108 | 100.0% | 1 | 0 | 66,108 | Star Market | 23.90 | |||
(1/2/2016) | ||||||||||||
Medford Shaw's Supermarket | Medford | 1995 | 60,356 | 100.0% | 1 | 0 | 60,356 | Shaw's | 21.37 | |||
(1/1/2016) | ||||||||||||
Plymouth Shaw's Supermarket | Plymouth | 1993 | 59,726 | 100.0% | 1 | 0 | 59,726 | Shaw's | 15.79 | |||
(1/1/2016) | ||||||||||||
Quincy Star Market | Quincy | 1965 / 1995 | 100,741 | 100.0% | 1 | 0 | 100,741 | Star Market | 15.43 | |||
(1/2/2016) | ||||||||||||
Swampscott Whole Foods | Swampscott | 1967 / 2005 | 35,907 | 100.0% | 1 | 0 | 35,907 | Whole Foods | 21.00 | |||
(1/1/2016) | ||||||||||||
West Roxbury Shaw's Plaza | West Roxbury | 1973 / 1995 | 68,141 | 100.0% | 7 | 0 | 54,928 | Shaw's | 21.28 | |||
(1/2/2016) | ||||||||||||
TOTAL SHOPPING CENTERS MASSACHUSETTS (6) | 390,979 | 100.0% | 12 | 0 | 377,766 | 0 | $ 19.37 | |||||
MISSISSIPPI (1) | ||||||||||||
Shipyard Plaza | Pascagoula | 1987 | 66,857 | 98.2% | 6 | 1 | Rite Aid, Big Lots | 5.71 | ||||
TOTAL SHOPPING CENTERS MISSISSIPPI (1) | 66,857 | 98.2% | 6 | 1 | 0 | 0 | $ 5.71 | |||||
NORTH CAROLINA (12) | ||||||||||||
Centre Pointe Plaza | Smithfield | 1989 | 163,642 | 95.7% | 22 | 2 | Belk's, Goody's, Dollar Tree | 6.10 | ||||
Chestnut Square | Brevard | 1985 | 39,640 | 96.0% | 6 | 1 | 21,000 | Food Lion* | Dollar General | 4.78 | ||
(9/28/2010) | ||||||||||||
Galleria | Wrightsville Beach | 1986, 1990 | 92,114 | 86.4% | 32 | 6 | 28,000 | Harris Teeter (4/5/2006) | Eckerd | 9.39 | ||
Parkwest Crossing | Durham | 1990 | 85,602 | 98.4% | 16 | 1 | 38,052 | Food Lion | 10.30 | |||
(12/14/2010) | ||||||||||||
Plaza North | Hendersonville | 1986 | 47,240 | 94.9% | 7 | 2 | 25,590 | Bi-Lo* | CVS Pharmacy | 7.04 | ||
(8/31/2006) | ||||||||||||
Page 28
EQUITY ONE, INC. AND SUBSIDIARIES | ||||||||||||
PROPERTY STATUS REPORT | ||||||||||||
As of September 30, 2005 | ||||||||||||
Year | Total | number | Supermarket anchor | Average | ||||||||
built / | square footage | Percent | of tenants | owned | shadow | name | base rent | |||||
Property | City | renovated | owned | leased | leased | vacant | SF | SF | expiration date | Other anchor tenants | per leased SF | |
Providence Square | Charlotte | 1973 | 85,930 | 90.7% | 18 | 7 | 35,702 | Harris Teeter* | Eckerd | 8.20 | ||
(4/30/2006) | ||||||||||||
Riverview Shopping Center | Durham | 1973 / 1995 | 127,498 | 96.5% | 11 | 2 | 53,538 | Kroger | Upchurch Drugs, Blockbuster | 7.19 | ||
(12/31/2014) | ||||||||||||
Salisbury Marketplace | Salisbury | 1987 | 79,732 | 93.9% | 17 | 3 | 31,762 | Food Lion | $ 10.09 | |||
(2/11/2023) | ||||||||||||
Shelby Plaza | Shelby | 1972 | 103,200 | 100.0% | 8 | 0 | Big Lots, Aaron Rents* (Hancock Fabrics), Tractor Supply Company | 3.16 | ||||
Stanley Market Place | Stanley | 1980, 1987 | 40,400 | 29.7% | 2 | 1 | Family Dollar | 3.99 | ||||
Thomasville Commons | Thomasville | 1991 | 148,754 | 99.0% | 12 | 1 | 32,000 | Ingles | Kmart, CVS Pharmacy | 5.91 | ||
(9/29/2012) | ||||||||||||
Willowdaile Shopping Center | Durham | 1986 | 121,376 | 84.4% | 22 | 6 | 53,368 | Harris Teeter | Eckerd* (Family Dollar) | 10.53 | ||
(5/14/2009) | ||||||||||||
TOTAL SHOPPING CENTERS NORTH CAROLINA (12) | 1,135,128 | 92.0% | 173 | 32 | 319,012 | 0 | $ 7.35 | |||||
SOUTH CAROLINA (8) | ||||||||||||
Belfair Towne Village | Bluffton | 2000-2003 | 125,389 | 98.9% | 28 | 1 | 55,696 | Kroger | Blockbuster | 13.81 | ||
(10/31/2019) | ||||||||||||
Lancaster Plaza | Lancaster | 1971 / 1990 | 77,400 | 32.6% | 2 | 2 | 19,200 | Bi-Lo | 2.86 | |||
(9/30/2010) | ||||||||||||
Lancaster Shopping Center | Lancaster | 1963, 1987 | 29,047 | 100.0% | 2 | 0 | Sweet Union Furniture | 2.07 | ||||
North Village Center | North Myrtle Beach | 1984 | 60,356 | 94.6% | 11 | 3 | 24,806 | Bi-Lo | Dollar General, Gold's Gym | 8.50 | ||
(5/31/2009) | ||||||||||||
Sparkleberry Square | Columbia | 1997 / 2004 | 339,051 | 99.5% | 25 | 2 | 67,943 | Kroger | Kohl's, Ross Dress for Less, Circuit City, Bed Bath & Beyond, Petsmart, Pier One | 11.24 | ||
(8/31/2017) | ||||||||||||
Spring Valley | Columbia | 1978 / 1997 | 75,415 | 95.2% | 15 | 3 | 45,070 | Bi-Lo | 9.11 | |||
(12/31/2017) | ||||||||||||
Windy Hill | North Myrtle Beach | 1968 / 1988 | 64,465 | 100.0% | 2 | 0 | Rose's Store, Family Dollar Store | 5.35 | ||||
Woodruff | Greenville | 1995 | 68,055 | 100.0% | 10 | 0 | 47,955 | Publix | Blockbuster | 10.27 | ||
(8/6/2015) | ||||||||||||
TOTAL SHOPPING CENTERS SOUTH CAROLINA (8) | 839,178 | 92.6% | 95 | 11 | 260,670 | 0 | $ 10.06 | |||||
TENNESSEE (1) | ||||||||||||
Smyrna Village | Smyrna | 1992 | 83,334 | 96.6% | 11 | 1 | 59,214 | Kroger | 8.33 | |||
(2/29/2012) | ||||||||||||
TOTAL SHOPPING CENTERS TENNESSEE (1) | 83,334 | 96.6% | 11 | 1 | 59,214 | 0 | $ 8.33 | |||||
TEXAS (32) | ||||||||||||
Houston (17) | ||||||||||||
** | Barker Cypress | Houston | 1999 | 66,945 | 86.8% | 12 | 5 | 41,320 | H.E.B. | 12.44 | ||
(1/31/2014) | ||||||||||||
** | Beechcrest | Houston | 1981 / 2001 | 90,647 | 98.7% | 14 | 1 | 40,345 | Randall's* | Walgreens* | 8.67 | |
(6/24/2016) | ||||||||||||
** | Benchmark Crossing | Houston | 1986 | 58,384 | 100.0% | 5 | 0 | Bally's Fitness | 12.70 | |||
** | Bissonnet | Houston | 1999 | 15,542 | 73.6% | 7 | 1 | 63,000 | Kroger | Blockbuster | 16.51 | |
** | Colony Plaza | Sugarland | 1997 | 26,513 | 95.0% | 14 | 1 | 19.01 | ||||
Page 29
EQUITY ONE, INC. AND SUBSIDIARIES | ||||||||||||
PROPERTY STATUS REPORT | ||||||||||||
As of September 30, 2005 | ||||||||||||
Year | Total | number | Supermarket anchor | Average | ||||||||
built / | square footage | Percent | of tenants | owned | shadow | name | base rent | |||||
Property | City | renovated | owned | leased | leased | vacant | SF | SF | expiration date | Other anchor tenants | per leased SF | |
** | Copperfield | Houston | 1994 | 133,984 | 98.9% | 32 | 1 | JoAnn Fabrics, Dollar Tree, 24 Hour Fitness | $ 12.50 | |||
** | Forestwood | Houston | 1993 | 88,760 | 95.2% | 15 | 1 | 59,334 | Kroger | Blockbuster | 11.18 | |
(7/31/2013) | ||||||||||||
** | Grogan's Mill | The Woodlands | 1986 | 118,493 | 96.4% | 24 | 2 | 56,558 | Randall's* (99¢ Store) | Petco. Blockbuster | 12.16 | |
(6/24/2016) | ||||||||||||
** | Hedwig | Houston | 1974 | 69,504 | 74.3% | 12 | 2 | Ross Dress for Less | 14.91 | |||
** | Highland Square | Sugarland | 1998 | 64,171 | 97.6% | 26 | 2 | 17.52 | ||||
** | Market at First Colony | Sugarland | 1988 | 107,301 | 98.1% | 34 | 1 | 62,000 | Kroger | TJ Maxx, CVS Pharmacy | 16.39 | |
** | Mason Park | Katy | 1998 | 160,047 | 90.8% | 34 | 5 | 58,890 | Kroger | Walgreens* (Eloise Collectibles), Palais Royal, Petco | 9.76 | |
** | Mission Bend | Houston | 1980 / 1999 | 131,575 | 85.7% | 23 | 4 | 46,112 | Randall's | Remarkable Furniture | 8.78 | |
(6/24/2016) | ||||||||||||
** | Spring Shadows | Houston | 1999 | 106,995 | 96.1% | 17 | 1 | 65,161 | H.E.B. | 9.84 | ||
(4/30/2023) | ||||||||||||
** | Steeplechase | Jersey Village | 1985 | 105,152 | 88.7% | 19 | 6 | 56,208 | Randall's | 10.91 | ||
(6/24/2016) | ||||||||||||
** | Sutherland Lumber | Marble Falls | 1985 | 53,571 | 100.0% | 1 | 0 | Sutherland Lumber | 2.82 | |||
** | Westgate | Houston | 1996 / 1998 | 298,354 | 100.0% | 25 | 0 | 75,154 | H.E.B. (12/31/2015) | Kohl's, Oshman's Sporting Goods, Office Max, Pier One Imports | 11.75 | |
Dallas (12) | ||||||||||||
** | Creekside | Arlington | 1997 / 1998 | 101,016 | 100.0% | 17 | 0 | 60,932 | Kroger | Hollywood Video | 12.26 | |
(11/30/2021) | ||||||||||||
** | DeSoto Shopping Center | DeSoto | 1996 | 69,090 | 100.0% | 5 | 0 | 58,960 | Tom Thumb | Blockbuster | 9.53 | |
(11/15/2021) | ||||||||||||
** | Green Oaks | Arlington | 1983 | 65,091 | 66.5% | 22 | 12 | 58,000 | Kroger | 11.59 | ||
** | Melbourne Plaza | Hurst | 1983 | 47,517 | 95.8% | 17 | 1 | 11.58 | ||||
** | Minyards | Garland | 2000 | 65,295 | 100.0% | 2 | 0 | 58,695 | Minyards/Sack N Save | 6.12 | ||
(4/30/2020) | ||||||||||||
** | Parkwood | Plano | 1985 | 81,590 | 89.7% | 17 | 3 | 62,000 | Albertsons | Hollywood Video | 13.28 | |
** | Richwood | Richardson | 1984 | 54,871 | 93.4% | 24 | 3 | 61,877 | Albertsons | Blockbuster | 12.71 | |
** | Rosemeade | Carrollton | 1986 | 51,231 | 28.3% | 6 | 12 | Blockbuster | 13.67 | |||
** | Southlake Village | Southlake | 1996 | 118,092 | 88.9% | 19 | 3 | 60,932 | Kroger | 12.95 | ||
(10/31/2021) | ||||||||||||
** | Sterling Plaza | Irving | 1989 | 65,765 | 93.1% | 14 | 2 | Bank One, Irving City Library, 99 Cent Only Store | 14.33 | |||
** | Townsend Square | Desoto | 1990 | 146,953 | 82.3% | 30 | 8 | 60,349 | Albertsons | Bealls, Victory Gym, Dollar General | 8.94 | |
** | Village by the Park | Arlngton | 1988 | 44,523 | 96.6% | 9 | 1 | Petco, Movie Trading | 17.14 | |||
Page 30
Total square footage does not include shadow anchor square footage which is not owned or controlled by Equity One.
* | Indicates a tenant which continues to pay rent, but has closed its store and ceased operations. The subtenant, if any, is shown in ( ). |
** | Indicates properties that were classified as held for sale as of September 30, 2005. |
Page 31
ANNUAL MINIMUM RENT BY STATE | ||||||||||||||
As of September 30, 2005 | ||||||||||||||
State | Count | Total SF | # Leased | # Vacant | Leased % | AMR | ||||||||
Florida | 79 | 9,153,921 | 1,777 | 155 | 96.3% | $ 108,491,698 | ||||||||
Texas | 32 | 2,970,506 | 547 | 84 | 91.9% | 31,132,114 | ||||||||
Georgia | 24 | 2,743,854 | 446 | 70 | 88.1% | 24,383,953 | ||||||||
Louisiana | 14 | 1,620,565 | 161 | 23 | 91.3% | 9,757,916 | ||||||||
North Carolina | 12 | 1,135,128 | 173 | 32 | 92.0% | 7,667,895 | ||||||||
South Carolina | 8 | 839,178 | 95 | 11 | 92.6% | 7,818,779 | ||||||||
Massachusetts | 6 | 390,979 | 12 | 0 | 100.0% | 7,571,871 | ||||||||
Virginia | 1 | 126,841 | 14 | 0 | 100.0% | 758,289 | ||||||||
Alabama | 2 | 129,215 | 20 | 2 | 98.4% | 1,064,192 | ||||||||
Tennessee | 1 | 83,334 | 11 | 1 | 96.6% | 671,083 | ||||||||
Mississippi | 1 | 66,857 | 6 | 1 | 98.2% | 375,128 | ||||||||
Kentucky | 1 | 38,450 | 9 | 3 | 79.2% | 128,163 | ||||||||
Total | 181 | 19,298,828 | 3,271 | 382 | 93.7% | $ 199,821,081 | ||||||||
Note: Excludes six development parcels and four commercial properties. |
Page 32
EQUITY ONE, INC. AND SUBSIDIARIES | ||||||||||
LEASING ACTIVITY | ||||||||||
For the three months ended September 30, 2005 | ||||||||||
Renewals | ||||||||||
# of Leases | Square Feet | Average Size | Average Expiring Rent psf | Average New Rent psf | Annualized Minimum Rent | |||||
87 | 165,930 | 1,907 | $15.60 | $ 16.19 | $2,686,850 | |||||
% Increase psf | 3.8% | |||||||||
Net Increase (AMR) | $98,291 | |||||||||
New Leases | ||||||||||
# of Leases | Square Feet | Average Size | Average New Rent psf | Annualized Minimum Rent | ||||||
94 | 378,162 | 4,023 | $10.35 | $3,912,517 | ||||||
Lost Leases | ||||||||||
# of Leases | Square Feet | Average Size | Average Expiring Rent psf | Annualized Minimum Rent | ||||||
96 | 337,333 | 3,514 | $10.25 | $3,458,762 | ||||||
Net Absorption | 40,829 | New Leases - Lost Leases | ||||||||
Leasing Spread | 1.0% | New Leases versus Lost Leases (rate psf) | ||||||||
Net AMR Gain | $552,047 | |||||||||
Page 33
EQUITY ONE, INC. AND SUBSIDIARIES | ||||||||||
LEASING ACTIVITY | ||||||||||
For the nine months ended September 30, 2005 | ||||||||||
Renewals | ||||||||||
# of Leases | Square Feet | Average Size | Average Expiring Rent psf | Average New Rent psf | Annualized Minimum Rent | |||||
265 | 565,201 | 2,133 | $14.59 | $15.22 | $8,601,268 | |||||
% Increase psf | 4.3% | |||||||||
Net Increase (AMR) | $352,732 | |||||||||
New Leases | ||||||||||
# of Leases | Square Feet | Average Size | Average New Rent psf | Annualized Minimum Rent | ||||||
262 | 1,229,882 | 4,694 | $9.68 | $11,909,661 | ||||||
Lost Leases | ||||||||||
# of Leases | Square Feet | Average Size | Average Expiring Rent psf | Annualized Minimum Rent | ||||||
255 | 1,365,982 | 5,357 | $8.20 | $11,198,385 | ||||||
Net Absorption | (136,100) | New Leases - Lost Leases | ||||||||
Leasing Spread | 18.0% | New Leases versus Lost Leases (rate psf) | ||||||||
Net AMR Gain | $1,064,009 | |||||||||
Page 34
EQUITY ONE, INC. AND SUBSIDIARIES |
OCCUPANCY STATISTICS |
For the three months ended September 30, 2005 |
Note: Reflects those properties held in the core portfolio at the end of each indicated quarter.
Note: Reflects 153 properties owned by Equity One in each of the previous nine quarters.
Page 35
EQUITY ONE, INC. AND SUBSIDIARIES |
OCCUPANCY STATISTICS |
For the three months ended September 30, 2005 |
Note: The charts reflect a state-by-state breakdown of 153 properties owned by Equity One in each of the previous nine quarters.
Page 36
EQUITY ONE, INC. AND SUBSIDIARIES | |||||||
TENANT CONCENTRATION SCHEDULE | |||||||
As of September 30, 2005 | |||||||
Tenant | Number of stores | Square feet | % of total square feet | Annualized minimum rent | % of total annualized minimum rent | Average annual minimum rent per square foot | |
Top ten tenants | |||||||
Publix | 50 | 2,210,144 | 11.5% | $ 16,093,541 | 8.1% | $ 7.28 | |
Kroger | 16 | 935,367 | 4.8% | 7,784,396 | 3.9% | 8.32 | |
Albertsons/Shaw's | 9 | 570,286 | 3.0% | 7,567,853 | 3.8% | 13.27 | |
Winn Dixie | 14 | 653,987 | 3.4% | 4,462,868 | 2.2% | 6.82 | |
H.E. Butt Grocery | 4 | 256,262 | 1.3% | 2,775,355 | 1.4% | 10.83 | |
Blockbuster | 30 | 174,892 | 0.9% | 2,822,373 | 1.4% | 16.14 | |
CVS Pharmacy | 19 | 193,889 | 1.0% | 2,153,197 | 1.1% | 11.11 | |
Bed Bath & Beyond | 7 | 227,689 | 1.2% | 2,192,531 | 1.1% | 9.63 | |
Safeway/Randalls | 5 | 258,183 | 1.3% | 1,927,503 | 1.0% | 7.47 | |
Food Lion/Kash N' Karry | 9 | 292,256 | 1.5% | 1,965,651 | 1.0% | 6.73 | |
Sub-total top ten tenants | 163 | 5,772,955 | 29.9% | $ 49,745,268 | 24.9% | $ 8.62 | |
Remaining tenants | 3,108 | 12,306,079 | 63.8% | 150,075,813 | 75.1% | 12.20 | |
Sub-total all tenants | 3,271 | 18,079,034 | 93.7% | $ 199,821,081 | 100.0% | $ 11.05 | |
Vacant | 382 | 1,219,794 | 6.3% | NA | NA | NA | |
Total including vacant | 3,653 | 19,298,828 | 100.0% | $ 199,821,081 | 100.0% | $ 10.35 | |
Note: Excludes six development parcels and four commercial properties.
Page 37
EQUITY ONE, INC. AND SUBSIDIARIES | |||||||||||||
SHOPPING CENTER LEASE EXPIRATION SCHEDULE | |||||||||||||
As of September 30, 2005 | |||||||||||||
ALL TENANTS | |||||||||||||
Date | Number of tenants | Square feet | Percent of total square feet | Annualized minimum rent at expiration | Percent of total annualized minimum rent | Average annual minimum rent per square foot | |||||||
M-T-M | 121 | 239,186 | 1.2% | $ 2,830,330 | 1.4% | 11.83 | |||||||
2005 | 201 | 551,968 | 2.9% | 5,816,859 | 2.9% | 10.54 | |||||||
2006 | 694 | 2,056,565 | 10.7% | 25,307,191 | 12.8% | 12.31 | |||||||
2007 | 660 | 2,093,040 | 10.8% | 26,016,468 | 13.2% | 12.43 | |||||||
2008 | 589 | 1,802,169 | 9.3% | 24,324,976 | 12.3% | 13.50 | |||||||
2009 | 371 | 1,753,384 | 9.1% | 19,364,997 | 9.8% | 11.04 | |||||||
2010 | 328 | 1,631,467 | 8.5% | 18,200,443 | 9.2% | 11.16 | |||||||
2011 | 59 | 952,048 | 4.9% | 7,953,655 | 4.0% | 8.35 | |||||||
2012 | 49 | 930,787 | 4.8% | 7,819,781 | 4.0% | 8.40 | |||||||
2013 | 34 | 664,694 | 3.4% | 6,160,217 | 3.1% | 9.27 | |||||||
2014 | 34 | 763,469 | 4.0% | 6,172,513 | 3.1% | 8.08 | |||||||
Thereafter | 131 | 4,640,257 | 24.0% | 47,463,856 | 24.1% | 10.23 | |||||||
Sub-total / average | 3,271 | 18,079,034 | 93.7% | $ 197,431,286 | 99.9% | $ 10.92 | |||||||
Vacant | 382 | 1,219,794 | 6.3% | NA | NA | NA | |||||||
Total / average | 3,653 | 19,298,828 | 100.0% | $ 197,431,286 | 99.9% | $ 10.23 | |||||||
Note: Excludes six development parcels and four commercial properties.
Page 38
EQUITY ONE, INC. AND SUBSIDIARIES | |||||||||||||
SHOPPING CENTER LEASE EXPIRATION SCHEDULE | |||||||||||||
As of September 30, 2005 | |||||||||||||
ANCHOR TENANTS (SF >= 10,000) | |||||||||||||
Date | Number of tenants | Square feet | Percent of total square feet | Annualized minimum rent at expiration | Percent of total annualized minimum rent | Average annual minimum rent per square foot | |||||||
M-T-M | 3 | 34,594 | 0.3% | $ 275,811 | 0.3% | $ 7.97 | |||||||
2005 | 5 | 66,798 | 0.6% | 440,273 | 0.5% | 6.59 | |||||||
2006 | 27 | 679,771 | 5.6% | 3,926,033 | 4.3% | 5.78 | |||||||
2007 | 31 | 799,805 | 6.6% | 5,475,643 | 6.0% | 6.85 | |||||||
2008 | 24 | 580,928 | 4.8% | 3,999,967 | 4.4% | 6.89 | |||||||
2009 | 37 | 976,148 | 8.0% | 6,330,732 | 6.9% | 6.49 | |||||||
2010 | 45 | 990,212 | 8.2% | 6,293,176 | 6.9% | 6.36 | |||||||
2011 | 21 | 848,161 | 7.0% | 5,558,674 | 6.1% | 6.55 | |||||||
2012 | 22 | 829,581 | 6.8% | 5,570,295 | 6.1% | 6.71 | |||||||
2013 | 15 | 589,538 | 4.9% | 4,590,453 | 5.0% | 7.79 | |||||||
2014 | 15 | 684,976 | 5.6% | 4,689,677 | 5.1% | 6.85 | |||||||
Thereafter | 97 | 4,537,704 | 37.4% | 44,149,596 | 48.5% | 9.73 | |||||||
Sub-total / average | 342 | 11,618,216 | 95.8% | $ 91,300,330 | 100.1% | $ 7.86 | |||||||
Vacant | 19 | 513,985 | 4.2% | NA | NA | NA | |||||||
Total / average | 361 | 12,132,201 | 100.0% | $ 91,300,330 | 100.1% | $ 7.53 | |||||||
Note: Excludes six development parcels and four commercial properties.
Page 39
SHOPPING CENTER LEASE EXPIRATION SCHEDULE | ||||||
As of September 30, 2005 | ||||||
LOCAL TENANTS (SF < 10,000) | ||||||
Date | Number of tenants | Square feet | Percent of total square feet | Annualized minimum rent at expiration | Percent of total annualized minimum rent | Average annual minimum rent per square foot |
M-T-M | 118 | 204,592 | 2.9% | $ 2,554,519 | 2.4% | $ 12.49 |
2005 | 196 | 485,170 | 6.8% | 5,376,586 | 5.1% | 11.08 |
2006 | 667 | 1,376,794 | 19.2% | 21,381,158 | 20.1% | 15.53 |
2007 | 629 | 1,293,235 | 18.0% | 20,540,825 | 19.4% | 15.88 |
2008 | 565 | 1,221,241 | 17.0% | 20,325,009 | 19.2% | 16.64 |
2009 | 334 | 777,236 | 10.7% | 13,034,265 | 12.3% | 16.77 |
2010 | 283 | 641,255 | 8.9% | 11,907,267 | 11.2% | 18.57 |
2011 | 38 | 103,887 | 1.4% | 2,394,981 | 2.3% | 23.05 |
2012 | 27 | 101,206 | 1.4% | 2,249,486 | 2.1% | 22.23 |
2013 | 19 | 75,156 | 1.0% | 1,569,764 | 1.5% | 20.89 |
2014 | 19 | 78,493 | 1.0% | 1,482,836 | 1.4% | 18.89 |
Thereafter | 34 | 102,553 | 1.4% | 3,314,260 | 3.1% | 32.32 |
Sub-total / average | 2,929 | 6,460,818 | 90.2% | $ 106,130,956 | 100.1% | $ 16.43 |
Vacant | 363 | 705,809 | 9.8% | NA | NA | NA |
Total / average | 3,292 | 7,166,627 | 100.0% | $ 106,130,956 | 100.1% | $ 14.81 |
Note: Excludes six development parcels and four commercial properties.
Page 40
REAL ESTATE DEVELOPMENTS AND REDEVELOPMENTS | ||||||||||
As of September 30, 2005 | ||||||||||
(in thousands, except square footage data) | ||||||||||
Project | Location | Project Description | Target Completion Date | Estimated Cost Including Land | Funded as of 9/30/2005 | Balance to Complete | ||||
Developments | ||||||||||
River Green | Canton, GA | 11.2 acres held for future development. Prospecting for tenants(s). | TBD | $ | 4,945 | $ | 3,566 | $ | 1,379 | |
Shops at St. Lucie | Port St. Lucie, FL | Develop a 19,400 sf retail center and out parcel. Prospecting for new tenant(s) | First quarter 2006 | 4,945 | 2,194 | 2,751 | ||||
Shops at Skylake | N. Miami Beach, FL | Add additional space to existing development | First quarter 2006 | 6,320 | 3,087 | 3,233 | ||||
Sunlake | Tampa, FL | 155 acre mixed-use development project | TBD | 23,602 | 13,409 | 10,193 | ||||
Westridge | McDonough, GA | Develop a supermarket anchored center | First quarter 2006 | 8,627 | 3,537 | 5,090 | ||||
Winchester Plaza | Huntsville, AL | Develop a supermarket anchored center. | Second Quarter 2006 | 11,514 | 2,734 | 8,780 | ||||
Subtotal - Developments | 59,953 | 28,527 | 31,426 | |||||||
Major Redevelopments | ||||||||||
Spalding Village | Griffin, GA | Reconfigure the former K Mart space into multi-tenant space; Approx. 20,000 sq ft has been leased and prospecting for new tenants for the remainder of the space. | TBD | 2,373 | 2,373 | - | ||||
Subtotal - Major Redevelopments | 2,373 | 2,373 | - | |||||||
Out parcel Developments/Expansions | ||||||||||
Belfair Towne Village | Bluffton, SC | Prospecting for new tenant(s) on land held for development/expansion | Third quarter 2006 | 4,664 | 1,446 | 3,218 | ||||
Bluebonnet | Baton Rouge, LA | Construction of additional 11,000 sq ft out parcel building has commenced. | Fourth quarter of 2005 | 1,500 | 1,246 | 254 | ||||
Cashmere Corners | Port St. Lucie, FL | Prospecting for one or more tenants for out parcels | TBD | 511 | 511 | - | ||||
Forest Village | Tallahassee, FL | Prospecting for new tenant(s) on land held for development/expansion | TBD | 1,775 | 1,775 | - | ||||
Mariners Crossing | Spring Hill, FL | The development of a Goodyear out parcel is underway; one other out pacel is planned | Fourth quarter 2005 | 1,820 | 783 | 1,037 | ||||
Riverview | Durham, NC | Construction of additional 5,000 sq ft out parcel building has commenced. | Second quarter 2006 | 770 | 199 | 571 | ||||
West Roxbury | West Roxbury, MA | Construction of additional 8,400 sq ft out parcel building has commenced. | Fourth quarter 2005 | 1,850 | 897 | 953 | ||||
Westport | Davie, FL | Prospecting for one or more tenants for out parcels | TBD | 597 | 597 | - | ||||
Windy Hill | North Myrtle Beach, SC | Construction of additional 4,000 sq ft out parcel building has commenced. | Fourth quarter 2005 | 677 | 582 | 95 | ||||
Young Circle | Hollywood, FL | Future mixed-use development | TBD | 9,724 | 9,724 | - | ||||
Subtotal - Out parcel Developments/Expansions | 23,888 | 17,760 | 6,128 | |||||||
All other development activity | 9,339 | 9,290 | 49 | |||||||
Total Development Activity - Continuing Operations | 95,553 | 57,950 | 37,603 | |||||||
Development activity for properties held for sale | 7,739 | 7,739 | - | |||||||
Total - All Development Activity | $ | 103,292 | $ | 65,689 | $ | 37,603 |
Page 41
REAL ESTATE ACQUISITIONS AND DISPOSITIONS | |||||||||||
As of September 30, 2005 | |||||||||||
(in thousands, except square footage data) | |||||||||||
2005 Acquisition Activity | |||||||||||
Date Purchased | Property Name | City | State | Square Feet/ Acres | Purchase Price | ||||||
Feb. 1, 2005 | Sunlake Development Parcel | Tampa | FL | 155 acres | $ | 12,600 | |||||
Feb. 28, 2005 | Winchester Plaza | Huntsville | AL | 33 acres | 2,326 | ||||||
May 19, 2005 | Young Circle | Hollywood | FL | 65,834 | 22,000 | ||||||
Aug. 25, 2005 | Hairston Center | Decatur | GA | 13,000 | 2,175 | ||||||
Sep. 27, 2005 | Banco Popular Building | N. Miami Beach | FL | 32,737 | 5,200 | ||||||
Sep. 27, 2005 | River Green Land | Canton | GA | 11.2 acres | 3,600 | ||||||
Total | $ | 47,901 | |||||||||
2005 Disposition Activity | |||||||||||
Date Sold | Property Name | City | State | Square Feet/ Acres | Sales Price | Gain on Sale | |||||
Jan. 31, 2005 | North River Village | North Ellenton | FL | 177,128 | $ | 14,880 | $ | 1,615 | |||
April 6, 2005 | Big Curve | Yuma | AZ | 126,402 | 13,640 | 3,757 | |||||
July 29, 2005 | Waterlick Plaza | Lynchburg | VA | 98,694 | 8,485 | 2,253 | |||||
Aug. 3, 2005 | Park Northern | Phoenix | AZ | 126,852 | 8,155 | 3,835 | |||||
Total | $ | 45,160 | $ | 11,460 | |||||||
Properties Held for Sale as of September 30, 2005 | |||||||||||
Property Name | City | State | |||||||||
32 property portfolio sale | Various | Texas | |||||||||
Page 42
ANALYST COVERAGE | |||||||
As of September 30, 2005 | |||||||
BB&T Capital Markets | Bear Stearns & Co. Inc. | Credit Suisse First Boston | Deutsche Bank Securities Inc. | ||||
Stephanie M. Krewson | Ross Smotrich | Jessica Tully | Louis W. Taylor | ||||
804-782-8784 | 212-272-8046 | 404-897-2820 | 212-250-4912 | ||||
Rob Whittemore | Amy L. Young, CFA | Christopher A. Capalongo | |||||
804-782-8796 | 212-272-3523 | 212-250-7726 | |||||
Friedman Billings Ramsey | JP Morgan Securities Inc. | Legg Mason Wood Walker, Inc. | McDonald Investments Inc. | ||||
Paul Morgan | Michael W. Meuller, CFA | David M. Fick, CPA | Richard C. Moore II, CFA | ||||
703-469-1255 | 212-622-6689 | 410-454-5018 | 216-443-2815 | ||||
Michael Blank | Joshua Bederman | Nathen Isbee | |||||
703-469-1115 | 212-622-6530 | 410-454-4143 | |||||
Raymond James & Associates | Stifel, Nicolaus & Company, Inc. | UBS Securities LLC | Harris Nesbitt | ||||
Paul D. Puryear | Philip Martin | Scott Crow | Paul Adornato | ||||
727-567-2253 | 312-454-3985 | 212-713-8602 | 212-885-4170 | ||||
Ken Avalos | Jackson Eisenpresser | ||||||
727-567-2660 | 212-713-3226 |
Page 43