| Equity One, Inc. |
| Supplemental Information Package |
March 31, 2009
Equity One, Inc.
1600 N.E. Miami Gardens Drive
North Miami Beach, Florida 33179
Tel: (305) 947-1664 Fax: (305) 947-1734
www.equityone.net
| Equity One, Inc. |
| |
| SUPPLEMENTAL INFORMATION |
| March 31, 2009 |
| (unaudited) |
| |
| TABLE OF CONTENTS |
| | Page |
| Overview | |
| Analyst Coverage | 3 |
| Disclosures | 4 |
| Summary Financial Results and Ratios | 5 |
| | |
| Assets, Liabilities, and Equity | |
| Consolidated Balance Sheets | 6 |
| Market Capitalization | 7 |
| Debt Summary | 8 |
| Debt Maturity Schedule | 9 |
| | |
| Income, EBITDA, and FFO | |
| Consolidated Statements of Operations | 10 |
| Pro Forma Financial Information for Discontinued Operations | 11-12 |
| Net Operating Income | 13 |
| EBITDA | 14 |
| Consolidated Statements of Funds from Operations | 15 |
| Additional Disclosures | 16 |
| | |
| Leasing Data | |
| Tenant Concentration - Top Twenty Tenants | 17 |
| Recent Leasing Activity | 18 |
| Shopping Center Lease Expiration Schedule - All Tenants, Anchors, Shops | 19-21 |
| Shopping Center Lease Expiration by Year Graph | 22 |
| | |
| Property Data | |
| Annual Minimum Rent of Operating Properties by Metro/Market Breakout | 23 |
| Property Status Report | 24-33 |
| Real Estate Acquisitions and Dispositions | 34 |
| Real Estate Developments and Redevelopments | 35 |
| | |
| Debt Schedule Detail | |
| Consolidated Debt Summary - Property Mortgage Detail | 36-38 |
| Consolidated Debt Summary - Unsecured Notes, Lines of Credit, and Total | 39 |
| | |
| Joint Venture Section | 40-47 |
|
| ANALYST COVERAGE |
| As of March 31, 2009 |
| |
| | | |
| Barclays Capital | Ross Smotrich | (212) 526-2306 |
| | Ryan Bennett | (212) 526-5309 |
| | | |
| BMO Capital Markets | Paul Adornato | (212) 885-4170 |
| | | |
| Credit Suisse | Andrew Rosivach | 011 612 8205 4362 |
| | | |
| Green Street Advisors | Jim Sullivan | (949) 640-8780 |
| | Nick Vedder | (949) 640-8780 |
| | | |
| JP Morgan Securities Inc. | Michael W. Mueller, CFA | (212) 622-6689 |
| | Joseph Dazio | (212) 622-6416 |
| | | |
| Macquarie Capital (USA) Inc. | David Wigginton | (212) 231-6380 |
| | | |
| Merrill Lynch | Craig Schmidt | (212) 449-1944 |
| | | |
| Raymond James & Assoc. | Paul D. Puryear | (727) 567-2253 |
| | R.J. Milligan | (727) 567-2660 |
| | | |
| Royal Bank of Canada | Richard Moore | (440) 715-2646 |
| | Wes Golladay | (440) 715-2650 |
| | | |
| Stifel, Nicolaus & Co., Inc. | David M. Fick, CPA | (410) 454-5018 |
| | Nathan Isbee | (410) 454-4143 |
| | | |
| Miller Tabak | Tom Mitchell | (212) 370-0040 x8163 |
| EQUITY ONE, INC. |
| DISCLOSURES |
| As of March 31, 2009 |
| |
Forward Looking Statements
Certain information contained in this Supplemental Information Package constitute forward-looking statements within the meaning of the federal securities laws. Although Equity One believes that the expectations reflected in such forward-looking statements are based upon reasonable assumptions, it can give no assurance that these expectations will be achieved. Factors that could cause actual results to differ materially from current expectations include changes in macro-economic conditions and the demand for retail space in Florida, Georgia, Massachusetts and the other states in which Equity One owns properties; the continuing financial success of Equity One's current and prospective tenants; continuing supply constraints in its geographic markets; the availability of properties for acquisition; the success of its efforts to lease up vacant space; the effects of natural and other disasters; the ability of Equity One to successfully integrate the operations and systems of acquired companies and properties; and other risks, which are described in Equity One's filings with the Securities and Exchange Commission.
Basis of Presentation
The information contained in the Supplemental Information Package does not purport to disclose all items required by GAAP. The Company's Form 10-K for the year ended December 31, 2008 and Form 10-Q for the period ended March 31, 2009 should be read in conjunction with the above information. The results of operations of any property acquired are included in our financial statements since the date of its acquisition.
On January 14, 2009, we acquired an additional 1,237,676 ordinary shares of DIM Vastgoed, N.V. ("DIM") from Homburg Invest Inc. (“Homburg”) in a stock exchange agreement. Under the agreement, we issued 866,373 shares of our common stock in exchange for a total of 1,237,676 DIM shares or share equivalents (based on an exchange ratio of 0.7 Equity One shares for 1 DIM share).
In addition, we obtained from Homburg voting rights (the “Partex shares”) with respect to another 766,573 DIM shares that Homburg has the right to acquire on October 1, 2010 at a subsequent closing occurring no later than November 2010. Subject to certain conditions, the agreement also provides for us to acquire these DIM shares or share equivalents at the same 0.7 exchange ratio (or an aggregate of 536,601 shares of Equity One common stock) from Homburg once Homburg has acquired them. The agreement also provides for customary registration rights with respect to the Equity One common stock issued to Homburg. As a result of the initial exchange and the voting rights agreement, we now have voting control over 74.6% of DIM’s ordinary shares, including 65.2% economic ownership
Pursuant to the provisions in FASB No. 141(R), "Business Combinations", we have consolidated the results of DIM during the first quarter of 2009.
EBITDA is a widely used performance measure and is provided as a supplemental measure of operating performance. We compute EBITDA as the sum of net income before extraordinary items, depreciation and amortization, income taxes, interest expense, gain (loss) on disposal of income producing properties, and impairment of real estate. Given the nature of the Company's business as a real estate owner and operator, the Company believes that the use of EBITDA as opposed to earnings in various financial ratios is helpful to investors as a measure of our operational performance because EBITDA excludes various items included in earnings that do not relate to or are not indicative of our operating performance, such as gains and losses on sales of real estate and real estate related depreciation and amortization, and includes the results of operations of real estate properties that were sold or classified as real estate held for sale either during or subsequent to the end of a particular reporting period, which are included in earnings on a net basis. Accordingly, we believe that the use of EBITDA as opposed to earnings in various ratios provides a meaningful performance measure as it relates to our ability to meet various coverage tests for the stated periods.
EBITDA should not be considered as an alternative to earnings as an indicator of our financial performance, or as an alternative to cash flow from operating activities as a measure of our liquidity. Our computation of EBITDA may differ from the methodology utilized by other companies to calculate EBITDA. Investors are cautioned that items excluded from EBITDA are significant components in understanding and assessing the Company's financial performance.
Use of Funds from Operations as a Non-GAAP Financial Measure
We believe Funds from Operations (FFO) (combined with the primary GAAP presentations) is a useful supplemental measure of our operating performance that is a recognized metric used extensively by the real estate industry, particularly REITs. NAREIT stated in its April 2002 White Paper on FFO, "Historical cost accounting for real estate assets implicitly assumes that the value of real estate assets diminishes predictably over time. Since real estate values have historically risen or fallen with market conditions many industry investors have considered presentations of operating results for real estate companies that use historical cost accounting to be insufficient by themselves." FFO, as defined by NAREIT, is "net income (computed in accordance with GAAP), excluding (gains or losses) from sales of property, plus depreciation and amortization, and after adjustments for unconsolidated partnerships and joint ventures. Adjustments for unconsolidated partnerships and joint ventures will be calculated to reflect funds from operations on the same basis."
We believe that financial analysts, investors and stockholders are better served by the presentation of comparable period operating results generated from our FFO measure. Our method of calculating FFO may be different from methods used by other REITs and accordingly, may not be comparable to such other REITs. FFO is presented to assist investors in analyzing our operating performance. FFO (i) does not represent cash flow from operations as defined by GAAP, (ii) is not indicative of cash available to fund all cash flow needs, including the ability to make distributions, (iii) is not an alternative to cash flow as measure of liquidity, and (iv) should not be considered as an alternative to net income (which is determined in accordance with GAAP) for purposes of evaluating our operating performance. We believe net income is the most directly comparable GAAP measure to FFO.
| EQUITY ONE, INC. |
| SUMMARY FINANCIAL RESULTS AND RATIOS |
| As of March 31, 2009 |
| (in thousands, except per share data) |
| |
| | | For the three months ended | |
| | | Mar 31, 2009 | | | Mar 31, 2008 | |
| Summary Financial Results | | | | | | |
| Total revenues* | | $ | 69,365 | | | $ | 63,401 | |
| EBITDA | | | 43,156 | | | | 46,824 | |
| Property net operating income | | | 49,888 | | | | 47,138 | |
General & administrative expenses (G&A)* - Adjusted (1) | | | 8,056 | | | | 6,885 | |
| | | | | | | | | |
| Net income attributable to Equity One | | $ | 43,833 | | | $ | 20,855 | |
| Net income per diluted share | | | 0.57 | | | | 0.28 | |
| | | | | | | | | |
| Funds from operations (FFO) | | $ | 57,938 | | | $ | 32,651 | |
| FFO per diluted share | | | 0.75 | | | | 0.44 | |
| | | | | | | | | |
| Total dividends paid per share | | $ | 0.30 | | | $ | 0.30 | |
| | | | | | | | | |
| Weighted average diluted shares | | | 77,410 | | | | 73,499 | |
| | | | | | | | | |
| Summary Operating and Financial Ratios | | | | | | | | |
Operating shopping center portfolio occupancy (see pages 24-31) (2) | | | 91.5 | % | | | 92.7 | % |
Same-property NOI growth - cash basis (see page 13) (2) | | | -2.7 | % | | NA | |
| NOI margin (see page 13) | | | 72.5 | % | | | 74.6 | % |
| Expense recovery ratio* | | | 76.2 | % | | | 85.5 | % |
New, renewal and option rent spread - cash basis (see page 18) (2) | | | -2.1 | % | | | 9.1 | % |
| G&A expense to total revenues | | | 11.6 | % | | | 10.7 | % |
| Debt to market capitalization (see page 7) | | | 57.3 | % | | | 39.1 | % |
| EBITDA to interest expense* (see page 14) | | | 2.2 | | | | 2.9 | |
| EBITDA to fixed charges* (see page 14) | | | 1.8 | | | | 2.5 | |
| | |
* The indicated line item includes amounts reported in discontinued operations.
(1) G&A expense deducting one-time severance costs and acquisition costs associated with acquisition of controlling interest in DIM Vastgoed of $4.2 million.
(2) Excludes DIM Vastgoed.
| EQUITY ONE, INC. |
| CONSOLIDATED BALANCE SHEETS |
| As of March 31, 2009 |
| (in thousands) | |
| |
| | | | | | | | | | |
| | | Mar 31, 2009 | | | Dec 31, 2008 | | | Dec 31, 2007 | |
| Assets | | | | | | | | | |
| Properties | | | | | | | | | |
| Income producing | | $ | 2,290,026 | | | $ | 1,900,513 | | | $ | 2,047,993 | |
| Less: accumulated depreciation | | | (206,895 | ) | | | (196,151 | ) | | | (172,651 | ) |
| Income-producing property, net | | | 2,083,131 | | | | 1,704,362 | | | | 1,875,342 | |
| Construction in progress and land held for development | | | 73,677 | | | | 74,371 | | | | 81,574 | |
| Properties held for sale | | | - | | | | - | | | | 323 | |
| Properties, net | | | 2,156,808 | | | | 1,778,733 | | | | 1,957,239 | |
| | | | | | | | | | | | | |
| Cash and cash equivalents | | | 3,183 | | | | 5,355 | | | | 1,313 | |
| Cash held in escrow | | | - | | | | - | | | | 54,460 | |
| Accounts and other receivables, net | | | 8,052 | | | | 12,209 | | | | 14,148 | |
| Investments and advances in real estate joint ventures | | | 11,724 | | | | 11,745 | | | | - | |
| Marketable Securities | | | 73,990 | | | | 160,585 | | | | 72,299 | |
| Goodwill | | | 11,845 | | | | 11,845 | | | | 12,496 | |
Other assets (1) | | | 104,467 | | | | 55,791 | | | | 62,429 | |
| | | | | | | | | | | | | |
| Total Assets | | $ | 2,370,069 | | | $ | 2,036,263 | | | $ | 2,174,384 | |
| | | | | | | | | | | | | |
| Liabilities and stockholders' equity | | | | | | | | | | | | |
| Liabilities | | | | | | | | | | | | |
| Mortgage notes payable | | $ | 629,288 | | | $ | 371,077 | | | $ | 397,112 | |
| Unsecured revolving credit facilities | | | 10,000 | | | | 35,500 | | | | 37,000 | |
| Unsecured senior notes payable | | | 627,431 | | | | 657,913 | | | | 744,685 | |
| Total debt | | | 1,266,719 | | | | 1,064,490 | | | | 1,178,797 | |
| Unamortized/unaccreted premium/(discount) on notes payable | | | (25,340 | ) | | | 5,225 | | | | 10,042 | |
| Total notes payable | | | 1,241,379 | | | | 1,069,715 | | | | 1,188,839 | |
| | | | | | | | | | | | | |
| Deferred tax payable, net | | | 54,903 | | | | 1,409 | | | | 0 | |
Accounts payable and other liabilities (1) | | | 84,515 | | | | 54,652 | | | | 68,624 | |
| Total liabilities | | | 1,380,797 | | | | 1,125,776 | | | | 1,257,463 | |
| | | | | | | | | | | | | |
| Total Stockholders' equity of Equity One | | | 963,085 | | | | 909,498 | | | | 915,932 | |
| | | | | | | | | | | | | |
| Noncontrolling interest | | | 26,187 | | | | 989 | | | | 989 | |
| | | | | | | | | | | | | |
| Total Liabilities and Stockholders' Equity | | $ | 2,370,069 | | | $ | 2,036,263 | | | $ | 2,174,384 | |
| | | | | | | | | | | | | |
| | |
| | |
Note: Amounts in 2009 include consolidation of DIM Vastgoed.
(1) Amounts have been reclassified to conform to the 2009 presentation.
| EQUITY ONE, INC. |
| MARKET CAPITALIZATION |
|
| (in thousands) |
| |
| | | | | | | | | | |
| | | Mar 31, 2009 | | | Dec 31, 2008 | | | Dec 31, 2007 | |
| | | | | | | | | | |
| Closing market price of common stock | | $ | 12.19 | | | $ | 17.70 | | | $ | 23.03 | |
| | | | | | | | | | | | | |
| Common stock shares (in thousands) | | | | | | | | | | | | |
| Basic common shares | | | 76,655.230 | | | | 76,198.420 | | | | 73,300.107 | |
| Diluted common shares | | | | | | | | | | | | |
| Unvested restricted common shares | | | 68.629 | | | | 29.360 | | | | 55.707 | |
| DownREIT units (convertible into shares) | | | 93.656 | | | | 93.656 | | | | 93.656 | |
| Common stock options (treasury method, closing price) | | | 5.846 | | | | 23.178 | | | | 60.573 | |
| Shares for DIM Vastgoed Contingent Consideration | | | 453.130 | | | | - | | | | - | |
| Diluted common shares | | | 77,276.491 | | | | 76,344.614 | | | | 73,510.043 | |
| | | | | | | | | | | | | |
| Equity market capitalization | | $ | 942,000 | | | $ | 1,351,300 | | | $ | 1,692,936 | |
| | | | | | | | | | | | | |
| | | | | | | | | | | | | |
| Total debt (excluding unamortized/unaccreted premium/(discount)) | | $ | 1,266,719 | | | $ | 1,064,490 | | | $ | 1,178,797 | |
| Cash and equivalents (including cash held in escrow) | | | (3,183 | ) | | | (5,355 | ) | | | (55,773 | ) |
| Net debt | | | 1,263,536 | | | | 1,059,135 | | | | 1,123,024 | |
| Equity market capitalization | | | 942,000 | | | | 1,351,300 | | | | 1,692,936 | |
| Total market capitalization | | $ | 2,205,536 | | | $ | 2,410,435 | | | $ | 2,815,961 | |
| | | | | | | | | | | | | |
| Net debt to total market capitalization | | | 57.3 | % | | | 43.9 | % | | | 39.9 | % |
| | | | | | | | | | | | | |
| | | | | | | | | | | | | |
| Gross real estate and securities investments | | $ | 2,437,693 | | | $ | 2,135,469 | | | $ | 2,202,189 | |
| | | | | | | | | | | | | |
| Net debt to gross real estate and securities investments | | | 51.8 | % | | | 49.6 | % | | | 51.0 | % |
| | | | | | | | | | | | | |
Note: Amounts in 2009 include consolidation of DIM Vastgoed.
| EQUITY ONE, INC. |
| DEBT SUMMARY |
| As of March 31, 2009 |
| (in thousands) |
| |
| | | | | | | | | | |
| | | Mar 31, 2009 | | | Dec 31, 2008 | | | Dec 31, 2007 | |
| | | | | | | | | | |
| Fixed rate debt | | $ | 1,155,793 | | | $ | 928,041 | | | $ | 1,042,112 | |
| Fixed rate debt - swapped to variable rate | | | 100,926 | | | | 100,949 | | | | 99,685 | |
| Variable rate debt - unhedged | | | 10,000 | | | | 35,500 | | | | 37,000 | |
| Total debt* | | $ | 1,266,719 | | | $ | 1,064,490 | | | $ | 1,178,797 | |
| | | | | | | | | | | | | |
| % Fixed rate debt | | | 91.2 | % | | | 87.2 | % | | | 88.4 | % |
| % Fixed rate debt - swapped to variable rate | | | 8.0 | % | | | 9.5 | % | | | 8.5 | % |
| % Variable rate debt - unhedged | | | 0.8 | % | | | 3.3 | % | | | 3.1 | % |
| Total | | | 100.0 | % | | | 100.0 | % | | | 100.0 | % |
| | | | | | | | | | | | | |
| % Variable rate debt - total | | | 8.8 | % | | | 12.8 | % | | | 11.6 | % |
| | | | | | | | | | | | | |
| | | | | | | | | | | | | |
| Secured mortgage debt | | $ | 629,289 | | | $ | 371,077 | | | $ | 397,112 | |
| Unsecured debt** | | | 637,430 | | | | 693,413 | | | | 781,685 | |
| Total debt* | | $ | 1,266,719 | | | $ | 1,064,490 | | | $ | 1,178,797 | |
| | | | | | | | | | | | | |
| % Secured mortgage debt | | | 49.7 | % | | | 34.9 | % | | | 33.7 | % |
| % Unsecured debt | | | 50.3 | % | | | 65.1 | % | | | 66.3 | % |
| Total | | | 100.0 | % | | | 100.0 | % | | | 100.0 | % |
| | | | | | | | | | | | | |
| | | | | | | | | | | | | |
| Total market capitalization (from page 7) | | $ | 2,205,536 | | | $ | 2,410,435 | | | $ | 2,815,960 | |
| | | | | | | | | | | | | |
| % Secured mortgage debt | | | 28.5 | % | | | 15.4 | % | | | 14.1 | % |
| % Unsecured debt | | | 28.9 | % | | | 28.8 | % | | | 27.8 | % |
| Total debt : Total market capitalization | | | 57.4 | % | | | 44.2 | % | | | 41.9 | % |
| | | | | | | | | | | | | |
| | | | | | | | | | | | | |
| Weighted-average interest rate on secured mortgage debt* | | | 6.8 | % | | | 7.2 | % | | | 7.4 | % |
| Weighted-average interest rate on senior unsecured notes** | | | 5.4 | % | | | 5.7 | % | | | 5.7 | % |
| Interest rate on revolving credit facilities | | | 3.3 | % | | | 2.1 | % | | | 5.0 | % |
| | | | | | | | | | | | | |
| | | | | | | | | | | | | |
| Weighted-average maturity on mortgage debt* | | 5.0 years | | | 5.0 years | | | 4.5 years | |
| Weighted-average maturity on senior unsecured notes | | 5.6 years | | | 6.5 years | | | 6.7 years | |
| | | | | | | | | | | | | |
Note: Amounts in 2009 include consolidation of DIM Vastgoed.
| * | Excluding unamortized premium/discount. |
| ** | Including the effect of interest rate swaps. |
EQUITY ONE, INC.
CONSOLIDATED DEBT MATURITY SCHEDULE
March 31, 2009
(in thousands)
| | | Secured Debt * | | | Unsecured Debt | | | | | | | | | | |
| | | | | | | | Revolving Credit Facilities (1) | | | | | | Total | | | Weighted Average Interest Rate at Maturity | | | | |
| | | | | | | | | | | | | | | | | | | | | | |
| 2009 | | | 11,116 | | | | 52,027 | | | | 0 | | | | 171,630 | | | | 234,773 | | | | 4.79 | % | | | 18.6 | % |
| 2010 | | | 13,421 | | | | 72,076 | | | | 0 | | | | 0 | | | | 85,497 | | | | 8.23 | % | | | 6.8 | % |
| 2011 | | | 12,434 | | | | 68,570 | | | | 10,000 | | | | 0 | | | | 91,004 | | | | 6.79 | % | | | 7.2 | % |
| 2012 | | | 11,529 | | | | 44,479 | | | | 0 | | | | 10,000 | | | | 66,008 | | | | 6.97 | % | | | 5.2 | % |
| 2013 | | | 11,017 | | | | 54,126 | | | | 0 | | | | 0 | | | | 65,143 | | | | 6.25 | % | | | 5.1 | % |
| 2014 | | | 9,824 | | | | 24,950 | | | | 0 | | | | 0 | | | | 34,774 | | | | 5.77 | % | | | 2.7 | % |
| 2015 | | | 7,057 | | | | 69,092 | | | | 0 | | | | 111,570 | | | | 187,719 | | | | 5.31 | % | | | 14.8 | % |
| 2016 | | | 5,397 | | | | 51,489 | | | | 0 | | | | 106,500 | | | | 163,386 | | | | 5.96 | % | | | 12.9 | % |
| 2017 | | | 4,746 | | | | 17,241 | | | | 0 | | | | 226,805 | | | | 248,792 | | | | 6.10 | % | | | 19.7 | % |
| 2018 | | | 4,566 | | | | 56,623 | | | | 0 | | | | 0 | | | | 61,189 | | | | 6.27 | % | | | 4.8 | % |
| Thereafter | | | 19,200 | | | | 8,308 | | | | 0 | | | | 0 | | | | 27,508 | | | | 7.83 | % | | | 2.2 | % |
| Total | | $ | 110,307 | | | $ | 518,981 | | | $ | 10,000 | | | $ | 626,505 | | | $ | 1,265,793 | | | | 5.95 | % | | | 100.0 | % |
| (1) | Represents the entire principal balance of a maturing loan on the maturity date. Credit facilities are shown as due on the initial maturity dates, though certain extension options may be available. |
| (2) | Excludes the adjustment attributable to the fair value of the associated interest rate swap. |
| * | Includes 22 loans related to DIM Vastgoed properties. |
| EQUITY ONE, INC. |
| CONSOLIDATED STATEMENTS OF OPERATIONS |
| For the quarter ended March 31, 2009 |
| (in thousands, except per share data) |
| |
| | | Three months ended | | | Percent | |
| | | Mar 31, 2009 | | | Mar 31, 2008 | | | Change | |
| REVENUE: | | | | | | | | | |
| Minimum rent | | $ | 53,215 | | | $ | 47,975 | | | | |
| Expense recoveries | | | 14,423 | | | | 13,664 | | | | |
| Percentage rent | | | 1,140 | | | | 1,449 | | | | |
| Management and leasing services | | | 550 | | | | 183 | | | | |
| Total revenue | | | 69,328 | | | | 63,271 | | | | 9.6 | % |
| | | | | | | | | | | | | |
| COSTS AND EXPENSES: | | | | | | | | | | | | |
| Property operating | | | 18,922 | | | | 16,067 | | | | | |
| Rental property depreciation and amortization | | | 15,291 | | | | 11,764 | | | | | |
| General and administrative | | | 12,256 | | | | 6,885 | | | | | |
| Total costs and expenses | | | 46,469 | | | | 34,716 | | | | 33.9 | % |
| | | | | | | | | | | | | |
INCOME BEFORE OTHER INCOME AND EXPENSE AND DISCONTINUED OPERATIONS | | | 22,859 | | | | 28,555 | | | | | |
| | | | | | | | | | | | | |
| OTHER INCOME AND EXPENSE: | | | | | | | | | | | | |
| Investment income | | | 2,057 | | | | 6,162 | | | | | |
| Equity in real estate joint ventures | | | (7 | ) | | | - | | | | | |
| Other income | | | 1,050 | | | | 43 | | | | | |
| Interest expense | | | (19,563 | ) | | | (15,982 | ) | | | | |
| Amortization of deferred financing fees | | | (444 | ) | | | (429 | ) | | | | |
| Gain on acquisition of controlling interest in subsidiary | | | 26,866 | | | | - | | | | | |
| (Loss) on sale of real estate | | | - | | | | (42 | ) | | | | |
| Gain on extinguishment of debt | | | 8,691 | | | | 2,380 | | | | | |
INCOME FROM CONTINUING OPERATIONS BEFORE TAXES AND DISCONTINUED OPERATIONS | | | 41,509 | | | | 20,687 | | | | | |
| Income tax benefit of taxable REIT subsidiaries | | | 639 | | | | 83 | | | | | |
| INCOME FROM CONTINUING OPERATIONS | | | 42,148 | | | | 20,770 | | | | 102.9 | % |
| | | | | | | | | | | | | |
| DISCONTINUED OPERATIONS: | | | | | | | | | | | | |
| Operations of income-producing properties sold or held for sale | | | 31 | | | | 85 | | | | | |
| Gain on disposal of income-producing properties | | | 1,178 | | | | - | | | | | |
| INCOME FROM DISCONTINUED OPERATIONS | | | 1,209 | | | | 85 | | | | | |
| | | | | | | | | | | | | |
| NET INCOME | | $ | 43,357 | | | $ | 20,855 | | | | 107.9 | % |
| Net loss attributable to noncontrolling interest | | | 476 | | | | - | | | | | |
| NET INCOME ATTRIBUTABLE TO EQUITY ONE | | $ | 43,833 | | | $ | 20,855 | | | | | |
| | | | | | | | | | | | | |
| EARNINGS PER COMMON SHARE - BASIC: | | | | | | | | | | | | |
| Continuing operations | | | 0.55 | | | | 0.28 | | | | | |
| Discontinued operations | | | 0.02 | | | | - | | | | | |
| NET INCOME | | $ | 0.57 | | | $ | 0.28 | | | | 104.6 | % |
| | | | | | | | | | | | | |
| EARNINGS PER COMMON SHARE - DILUTED: | | | | | | | | | | | | |
| Continuing operations | | | 0.54 | | | | 0.28 | | | | | |
| Discontinued operations | | | 0.02 | | | | 0 | | | | | |
| NET INCOME | | $ | 0.56 | | | $ | 0.28 | | | | 100.0 | % |
| | | | | | | | | | | | | |
| Weighted average shares outstanding | | | | | | | | | | | | |
| Basic | | | 76,764 | | | | 73,324 | | | | | |
| Diluted | | | 77,410 | | | | 73,499 | | | | | |
| | |
Note: Amounts in 2009 include consolidation of DIM Vastgoed.
| EQUITY ONE, INC. |
| PRO FORMA FINANCIAL INFORMATION FOR DISCONTINUED OPERATIONS |
| For the quarter ended March 31, 2009 |
| (in thousands) |
| |
| | | Three months ended | |
| | | Mar 31, 2009 | |
| | | As | | | Disc. Ops | | | Pre Disc | |
| | | Reported | | | Total | | | Ops | |
| REVENUE: | | | | | | | | | |
| Minimum rent | | $ | 53,215 | | | $ | 30 | | | $ | 53,245 | |
| Expense recoveries | | | 14,423 | | | | 7 | | | | 14,430 | |
| Percentage rent | | | 1,140 | | | | - | | | | 1,140 | |
| Management and leasing services | | | 550 | | | | - | | | | 550 | |
| Total revenue | | | 69,328 | | | | 37 | | | | 69,365 | |
| | | | | | | | | | | | | |
| COSTS AND EXPENSES: | | | | | | | | | | | | |
| Property operating | | | 18,922 | | | | 5 | | | | 18,927 | |
| Rental property depreciation and amortization | | | 15,291 | | | | 1 | | | | 15,292 | |
| General and administrative | | | 12,256 | | | | - | | | | 12,256 | |
| Total costs and expenses | | | 46,469 | | | | 6 | | | | 46,475 | |
| | | | | | | | | | | | | |
| INCOME BEFORE OTHER INCOME AND EXPENSE AND DISCONTINUED OPERATIONS | | | 22,859 | | | | 31 | | | | 22,890 | |
| | | | | | | | | | | | | |
| OTHER INCOME AND EXPENSE: | | | | | | | | | | | | |
| Investment income | | | 2,057 | | | | - | | | | 2,057 | |
| Equity in real estate joint ventures | | | (7 | ) | | | - | | | | (7 | ) |
| Other income | | | 1,050 | | | | - | | | | 1,050 | |
| Interest expense | | | (19,563 | ) | | | - | | | | (19,563 | ) |
| Amortization of deferred financing fees | | | (444 | ) | | | - | | | | (444 | ) |
| Gain on acquisition of controlling interest in subsidiary | | | 26,866 | | | | - | | | | 26,866 | |
| Gain on disposal of income-producing properties | | | - | | | | 1,178 | | | | 1,178 | |
| Gain on extinguishment of debt | | | 8,691 | | | | - | | | | 8,691 | |
| INCOME FROM CONTINUING OPERATIONS BEFORE TAXES AND DISCONTINUED OPERATIONS | | | 41,509 | | | | 1,209 | | | | 42,718 | |
Income tax benefit of taxable REIT subsidiaries | | | 639 | | | | | | | | 639 | |
| INCOME FROM CONTINUING OPERATIONS | | | 42,148 | | | | 1,209 | | | | 43,357 | |
| | | | | | | | | | | | | |
| DISCONTINUED OPERATIONS: | | | | | | | | | | | | |
| Operations of income-producing properties sold | | | 31 | | | | (31 | ) | | | - | |
| Gain on disposal of income-producing properties | | | 1,178 | | | | (1,178 | ) | | | - | |
| Income (loss) from discontinued operations | | | 1,209 | | | | (1,209 | ) | | | - | |
| | | | | | | | | | | | | |
| Net loss attributable to noncontrolling interest | | | 476 | | | | - | | | | 476 | |
| | | | | | | | | | | | | |
| NET INCOME ATTRIBUTABLE TO EQUITY ONE | | $ | 43,833 | | | $ | - | | | $ | 43,833 | |
| | | | | | | | | | | | | |
| | |
| Note: | The Company adopted SFAS No. 144, "Accounting for the Impairment or Disposal of Long-Lived Assets" ("SFAS No. 144"), effective January 1, 2002. This standard requires that operating results of income producing real estate assets that are sold or held for sale be included in discontinued operations in the statement of earnings for all periods presented. The above table presents the results as reported pursuant to SFAS No. 144, results of the assets sold or held for sale and the results before the impact of SFAS No. 144. |
Amounts in 2009 include consolidation of DIM Vastgoed.
| EQUITY ONE, INC. |
| PRO FORMA FINANCIAL INFORMATION FOR DISCONTINUED OPERATIONS |
| For the quarter ended March 31, 2009 |
| (in thousands) |
| |
| | | Three months ended | |
| | | Mar 31, 2008 | |
| | | As | | | Disc. Ops | | | Pre Disc | |
| | | Reported | | | Total | | | Ops | |
| REVENUE: | | | | | | | | | |
| Minimum rent | | $ | 47,975 | | | $ | 50 | | | $ | 48,025 | |
| Expense recoveries | | | 13,664 | | | | 80 | | | | 13,744 | |
| Percentage rent | | | 1,449 | | | | - | | | | 1,449 | |
| Management and leasing services | | | 183 | | | | - | | | | 183 | |
| Total revenue | | | 63,271 | | | | 130 | | | | 63,401 | |
| | | | | | | | | | | | | |
| COSTS AND EXPENSES: | | | | | | | | | | | | |
| Property operating | | | 16,067 | | | | 13 | | | | 16,080 | |
| Rental property depreciation and amortization | | | 11,764 | | | | 32 | | | | 11,796 | |
| General and administrative | | | 6,885 | | | | - | | | | 6,885 | |
| Total costs and expenses | | | 34,716 | | | | 45 | | | | 34,761 | |
| | | | | | | | | | | | | |
| INCOME BEFORE OTHER INCOME AND EXPENSE AND DISCONTINUED OPERATIONS | | | 28,555 | | | | 85 | | | | 28,640 | |
| | | | | | | | | | | | | |
| OTHER INCOME AND EXPENSE: | | | | | | | | | | | | |
| Investment income | | | 6,162 | | | | - | | | | 6,162 | |
| Other income | | | 43 | | | | - | | | | 43 | |
| Interest expense | | | (15,982 | ) | | | - | | | | (15,982 | ) |
| Amortization of deferred financing fees | | | (429 | ) | | | - | | | | (429 | ) |
| (Loss) on sale of real estate | | | (42 | ) | | | - | | | | (42 | ) |
| Gain on extinguishment of debt | | | 2,380 | | | | - | | | | 2,380 | |
| INCOME FROM CONTINUING OPERATIONS BEFORE TAXES AND DISCONTINUED OPERATIONS | | | 20,687 | | | | 113 | | | | 20,800 | |
Income tax benefit of taxable REIT subsidiaries | | | 83 | | | | - | | | | 83 | |
| INCOME FROM CONTINUING OPERATIONS | | | 20,770 | | | | 85 | | | | 20,855 | |
| | | | | | | | | | | | | |
| DISCONTINUED OPERATIONS: | | | | | | | | | | | | |
| Operations of income-producing properties sold or held for sale | | | 85 | | | | (85 | ) | | | - | |
| Gain on disposal of income-producing properties | | | - | | | | - | | | | - | |
| Income from discontinued operations | | | 85 | | | | (85 | ) | | | - | |
| | | | | | | | | | | | | |
| NET INCOME ATTRIBUTABLE TO EQUITY ONE | | $ | 20,855 | | | $ | - | | | $ | 20,855 | |
| Note: | The Company adopted SFAS No. 144, "Accounting for the Impairment or Disposal of Long-Lived Assets" ("SFAS No. 144"), effective January 1, 2002. This standard requires that operating results of income producing real estate assets that are sold or held for sale be included in discontinued operations in the statement of earnings for all periods presented. The above table presents the results as reported pursuant to SFAS No. 144, results of the assets sold or held for sale and the results before the impact of SFAS No. 144. |
Amounts in 2009 include consolidation of DIM Vastgoed.
| EQUITY ONE, INC. |
| NET OPERATING INCOME |
| For the quarter ended March 31, 2009 |
| (in thousands) |
| |
| | | Three months ended | | | Percent | |
| | | Mar 31, 2009 | | | Mar 31, 2008 | | | Change | |
| | | | | | | | | | |
| | | | | | | | | | |
Total net operating income (1) | | | | | | | | | |
| Total rental revenue | | $ | 68,815 | | | $ | 63,218 | | | | 8.9 | % |
| Property operating expenses | | | 18,927 | | | | 16,080 | | | | 17.7 | % |
| Net operating income | | $ | 49,888 | | | $ | 47,138 | | | | 5.8 | % |
| | | | | | | | | | | | | |
| NOI margin (NOI / Total rental revenue) | | | 72.5 | % | | | 74.6 | % | | | | |
| | | | | | | | | | | | | |
| | | | | | | | | | | | | |
Same-property NOI (2) | | | | | | | | | | | | |
| Total rental revenue | | $ | 55,807 | | | $ | 55,688 | | | | 0.2 | % |
Property operating expenses (3) | | | 17,309 | | | | 16,137 | | | | 7.3 | % |
| Net operating income | | $ | 38,498 | | | $ | 39,551 | | | | (2.7 | %) |
| | | | | | | | | | | | | |
| Growth in same property NOI | | | (2.7 | %) | | | | | | | | |
| | | | | | | | | | | | | |
| Number of properties included in analysis | | | 150 | | | | | | | | | |
| Same-property occupancy | | | 91.4 | % | | | 92.3 | % | | | | |
| | |
Note: Amounts in 2009 include consolidation of DIM Vastgoed.
| | (1) | Amounts included in discontinued operations have been included for purposes of this presentation of net operating income. |
| | (2) | Retail centers only. Excludes the effects of straight-line rent, SFAS 141 / 142, lease termination fees, and prior year expense recoveries and adjustments, if any. |
| | (3) | Property operating expenses include intercompany management fee expense. |
| EQUITY ONE, INC. |
| EARNINGS BEFORE INTEREST, TAXES, DEPRECIATION and AMORTIZATION (EBITDA) |
| For the quarter ended March 31, 2009 |
| (in thousands) |
| |
| | | Three months ended | |
| | | Mar 31, 2009 | | | Mar 31, 2008 | |
| | | | | | | |
| Net income | | $ | 43,357 | | | $ | 20,855 | |
| Net loss attributable to noncontrolling interest | | | 476 | | | | - | |
| Rental property depreciation and amortization* | | | 15,292 | | | | 11,796 | |
| Other depreciation and amortization | | | 213 | | | | 183 | |
| Interest expense* | | | 19,563 | | | | 15,982 | |
| Amortization of deferred financing fees* | | | 444 | | | | 429 | |
| (Loss) on sale of real estate | | | - | | | | 42 | |
| Gain on extinguishment of debt | | | (8,691 | ) | | | (2,380 | ) |
| Gain on acquisition of controlling interest in subsidiary | | | (26,866 | ) | | | - | |
| Benefit for income taxes | | | (639 | ) | | | (83 | ) |
| Equity in real estate joint ventures | | | 7 | | | | - | |
| EBITDA* | | $ | 43,156 | | | $ | 46,824 | |
| | | | | | | | | |
| | $ | 19,563 | | | $ | 15,982 | |
| | | | | | | | | |
| EBITDA to interest expense* | | | 2.2 | | | | 2.9 | |
| | | | | | | | | |
| Fixed charges | | | | | | | | |
| | $ | 19,563 | | | $ | 15,982 | |
Scheduled principal amortization (2) | | | 3,986 | | | | 2,743 | |
| Total fixed charges | | $ | 23,549 | | | $ | 18,725 | |
| | | | | | | | | |
| EBITDA to fixed charges* | | | 1.8 | | | | 2.5 | |
| | | | | | | | | |
| Total market capitalization (see page 7) | | $ | 2,205,536 | | | $ | 2,410,435 | |
| | |
Note: Amounts in 2009 include consolidation of DIM Vastgoed.
* The indicated line item includes amounts reported in discontinued operations.
(1) Interest expense for March 31, 2009 includes $918K of debt (discount) attributable to DIM.
(2) Excludes balloon payments upon maturity.
| EQUITY ONE, INC. |
| CONSOLIDATED STATEMENTS OF FUNDS FROM OPERATIONS |
| For the quarter ended March 31, 2009 |
| (in thousands, except per share data) |
| |
| | | Three months ended | |
| | | Mar 31, 2009 | | | Mar 31, 2008 | |
| | | | | | | |
| Net income attributable to Equity One | | $ | 43,833 | | | $ | 20,855 | |
| Adjustments: | | | | | | | | |
| Rental property depreciation and amortization, net of noncontrolling interest, including discontinued operations | | | 13,744 | | | | 11,796 | |
| Pro rata share of real estate depreciation from unconsolidated JV | | | 361 | | | | - | |
| Funds from operations | | $ | 57,938 | | | $ | 32,651 | |
| Change | | | 77.4 | % | | | | |
| | | | | | | | | |
| | | | | | | | | |
| Earnings per diluted share attributable to Equity One | | $ | 0.56 | | | $ | 0.28 | |
| Adjustments: | | | | | | | | |
| Rental property depreciation and amortization, net of noncontrolling interest, including discontinued operations | | | 0.18 | | | | 0.16 | |
| Pro rata share of real estate depreciation from unconsolidated joint ventures | | | - | | | | - | |
Net adjustment for unvested shares and noncontrolling interest (1) | | | 0.01 | | | | - | |
| Funds from operations per diluted share | | $ | 0.75 | | | $ | 0.44 | |
| Change | | | 69.9 | % | | | | |
| | |
| Weighted average diluted shares | | | 77,410 | | | | 73,499 | |
| | |
| | |
Note: Amounts in 2009 include consolidation of DIM Vastgoed.
| (1) | Includes net effect of (a) an adjustment for unvested awards of share-based payments with rights to receive dividends or dividend equivalents and (b) an adjustment related to the possible share issuance in the fourth quarter of 2010 pursuant to the DIM stock exchange agreement. |
| EQUITY ONE, INC. |
| ADDITIONAL DISCLOSURES |
| For the quarter ended March 31, 2009 |
| (in thousands) |
| |
| | | | | | Three months ended | |
| | | | | | Mar 31, 2009 | | | Mar 31, 2008 | |
| | | | | | | | | | |
| Certain non-cash items: | | | | | | | | | |
| Amortization of deferred financing fees | | | | | $ | 444 | | | $ | 429 | |
| Amortization of above/below market rent intangibles | | | | | | (1,525 | ) | | | (1,109 | ) |
| Amortization of restricted stock and stock option expense | | | | | | 3,195 | | | | 1,634 | |
| Straight line rents | | | | | | (516 | ) | | | (271 | ) |
| Capitalized interest | | | | | | (315 | ) | | | (790 | ) |
| Amortization of debt premium/discount | | | | | | 591 | | | | (538 | ) |
| Total non-cash items | | | | | $ | 1,874 | | | $ | (645 | ) |
| | | | | | | | | | | | |
| Certain capital expenditures: | | | | | | | | | | | |
| Tenant improvements | | | | | $ | 3,538 | | | $ | 1,672 | |
| Leasing commissions and costs | | | | | | 972 | | | | 2,222 | |
| Total tenant improvements and leasing costs | | | | | $ | 4,510 | | | $ | 3,894 | |
| | | | | | | | | | | | |
| Certain balance sheet accounts at 03/31/09: | | | | | | | | | | | |
| Straight-line rent receivable | | $ | 14,626 | | | | | | | | | |
| Lease intangible asset, net | | | 42,679 | | | | | | | | | |
| Lease intangibles liability, net | | | (43,579 | ) | | | | | | | | |
| Deferred expenses, net | | | 26,035 | | | | | | | | | |
| Total balance sheet accounts | | $ | 39,761 | | | | | | | | | |
| | |
Note: Amounts in 2009 include consolidation of DIM Vastgoed.
| EQUITY ONE, INC. |
| TENANT CONCENTRATION SCHEDULE |
| CONSOLIDATED PROPERTIES |
| As of March 31, 2009 |
| |
| Tenant | | Number of stores | | | Square feet | | | % of total square feet | | | Annualized minimum rent | | | % of total annualized minimum rent | | | Average annual minimum rent per square foot | |
| | | | | | | | | | | | | | | | | | | |
| Top twenty tenants | | | | | | | | | | | | | | | | | | |
| Publix | | | 52 | | | | 2,303,366 | | | | 14.4 | % | | $ | 18,097,419 | | | | 10.5 | % | | $ | 7.86 | |
| Supervalu | | | 7 | | | | 458,273 | | | | 2.9 | % | | | 8,302,236 | | | | 4.8 | % | | | 18.12 | |
| Kroger | | | 12 | | | | 679,082 | | | | 4.2 | % | | | 5,379,703 | | | | 3.1 | % | | | 7.92 | |
| Bed Bath & Beyond | | | 8 | | | | 261,332 | | | | 1.6 | % | | | 3,079,214 | | | | 1.8 | % | | | 11.78 | |
| Winn Dixie | | | 9 | | | | 398,128 | | | | 2.5 | % | | | 2,940,815 | | | | 1.7 | % | | | 7.39 | |
| LA Fitness | | | 3 | | | | 144,307 | | | | 0.9 | % | | | 2,517,941 | | | | 1.5 | % | | | 17.45 | |
| CVS Pharmacy | | | 13 | | | | 143,460 | | | | 0.9 | % | | | 2,315,237 | | | | 1.4 | % | | | 16.14 | |
| TJ Maxx Companies | | | 8 | | | | 248,658 | | | | 1.6 | % | | | 2,239,515 | | | | 1.3 | % | | | 9.01 | |
| Blockbuster | | | 21 | | | | 110,669 | | | | 0.7 | % | | | 2,220,755 | | | | 1.3 | % | | | 20.07 | |
| Office Depot | | | 7 | | | | 179,837 | | | | 1.1 | % | | | 2,062,123 | | | | 1.2 | % | | | 11.47 | |
| Kmart Corp. | | | 5 | | | | 439,558 | | | | 2.8 | % | | | 1,939,705 | | | | 1.1 | % | | | 4.41 | |
| Food Lion | | | 6 | | | | 241,934 | | | | 1.5 | % | | | 1,850,161 | | | | 1.1 | % | | | 7.65 | |
| Bi-Lo | | | 4 | | | | 149,016 | | | | 0.9 | % | | | 1,372,730 | | | | 0.8 | % | | | 9.21 | |
| Dollar Tree | | | 17 | | | | 184,420 | | | | 1.2 | % | | | 1,299,092 | | | | 0.8 | % | | | 7.04 | |
| Stein Mart | | | 4 | | | | 158,472 | | | | 1.0 | % | | | 1,207,286 | | | | 0.7 | % | | | 7.62 | |
| Walgreens | | | 5 | | | | 78,699 | | | | 0.5 | % | | | 1,167,746 | | | | 0.7 | % | | | 14.84 | |
| H&R Block | | | 31 | | | | 49,764 | | | | 0.3 | % | | | 1,043,920 | | | | 0.6 | % | | | 20.98 | |
| Albertsons | | | 3 | | | | 175,470 | | | | 1.1 | % | | | 991,390 | | | | 0.6 | % | | | 5.65 | |
| Big Lots | | | 5 | | | | 169,741 | | | | 1.1 | % | | | 978,213 | | | | 0.6 | % | | | 5.76 | |
| Memorial Healthcare Group | | | 1 | | | | 61,000 | | | | 0.4 | % | | | 925,836 | | | | 0.5 | % | | | 15.18 | |
| | | | | | | | | | | | | | | | | | | | | | | | | |
| Sub-total top ten tenants | | | 221 | | | | 6,635,186 | | | | 41.6 | % | | $ | 61,931,037 | | | | 36.1 | % | | $ | 9.33 | |
| | | | | | | | | | | | | | | | | | | | | | | | | |
| Remaining tenants | | | 2,299 | | | | 7,948,674 | | | | 49.9 | % | | | 109,671,569 | | | | 63.9 | % | | | 13.80 | |
| | | | | | | | | | | | | | | | | | | | | | | | | |
| Sub-total all tenants | | | 2,520 | | | | 14,583,860 | | | | 91.5 | % | | $ | 171,602,606 | | | | 100.0 | % | | $ | 11.93 | |
| | | | | | | | | | | | | | | | | | | | | | | | | |
| Vacant | | | 512 | | | | 1,358,948 | | | | 8.5 | % | | NA | | | NA | | | NA | |
| | | | | | | | | | | | | | | | | | | | | | | | | |
| Total including vacant | | | 3,032 | | | | 15,942,808 | | | | 100.0 | % | | $ | 171,602,606 | | | | 100.0 | % | | NA | |
Note: Excludes developments, non-retail properties, and DIM properties.
| EQUITY ONE, INC. |
| RECENT LEASING ACTIVITY |
| For the three months ended March 31, 2009 |
| |
| Category | | Total Leases | | | Total Sq. Ft. | | | Same Space Sq. Ft. | | | Prior Rent PSF | | | New Rent PSF | | | Rent Spread PSF | | | Same Space TIs PSF | |
New Leases (1) | | | 30 | | | | 100,068 | | | | 82,184 | | | $ | 15.55 | | | $ | 14.20 | | | | -8.7 | % | | $ | 5.38 | |
| Renewals | | | 79 | | | | 188,453 | | | | 188,453 | | | | 14.85 | | | | 14.89 | | | | 0.3 | % | | | 0.45 | |
| Options | | | 7 | | | | 10,242 | | | | 10,242 | | | | 18.19 | | | | 19.40 | | | | 6.6 | % | | | - | |
| Total New, Renewals & Options | | | 116 | | | | 298,763 | | | | 280,879 | | | $ | 15.18 | | | $ | 14.85 | | | | -2.1 | % | | $ | 1.88 | |
| | |
| Note: | Prior rent and new rent are presented on a "cash basis", not on a straight-line basis. |
| Note: | Excludes developments, non-retail properties, and DIM properties. |
| (1) | Rent spreads for new leases reflect same-space leasing where amount of rent paid by prior tenant is available. |
| EQUITY ONE, INC. |
| SHOPPING CENTER LEASE EXPIRATION SCHEDULE |
| CONSOLIDATED PROPERTIES |
| As of March 31, 2009 |
| |
ALLTENANTS
| Date | | | Number of leases | | | Square feet | | | Percent of total square feet | | | Annualized minimum rent at expiration | | | Percent of total annualized minimum rent | | | Average annual minimum rent per square foot | |
| | | | | | | | | | | | | | | | | | | | |
| M-T-M | | | | 74 | | | | 152,679 | | | | 1.0 | % | | $ | 2,006,520 | | | | 1.1 | % | | $ | 13.14 | |
| 2009 | | | | 435 | | | | 1,330,268 | | | | 8.3 | % | | | 16,796,101 | | | | 9.3 | % | | | 12.63 | |
| 2010 | | | | 533 | | | | 2,023,846 | | | | 12.7 | % | | | 23,407,672 | | | | 13.0 | % | | | 11.57 | |
| 2011 | | | | 498 | | | | 2,144,255 | | | | 13.4 | % | | | 27,098,414 | | | | 15.0 | % | | | 12.64 | |
| 2012 | | | | 336 | | | | 1,746,504 | | | | 11.0 | % | | | 20,691,345 | | | | 11.5 | % | | | 11.85 | |
| 2013 | | | | 300 | | | | 1,533,114 | | | | 9.6 | % | | | 20,736,266 | | | | 11.5 | % | | | 13.53 | |
| 2014 | | | | 125 | | | | 1,155,358 | | | | 7.3 | % | | | 11,155,657 | | | | 6.2 | % | | | 9.66 | |
| 2015 | | | | 32 | | | | 353,140 | | | | 2.2 | % | | | 4,115,870 | | | | 2.3 | % | | | 11.66 | |
| 2016 | | | | 37 | | | | 927,869 | | | | 5.8 | % | | | 14,132,221 | | | | 7.9 | % | | | 15.23 | |
| 2017 | | | | 27 | | | | 495,943 | | | | 3.1 | % | | | 6,332,535 | | | | 3.5 | % | | | 12.77 | |
| 2018 | | | | 29 | | | | 378,600 | | | | 2.4 | % | | | 4,454,504 | | | | 2.5 | % | | | 11.77 | |
| Thereafter | | | | 94 | | | | 2,342,284 | | | | 14.7 | % | | | 29,166,732 | | | | 16.2 | % | | | 12.45 | |
| | | | | | | | | | | | | | | | | | | | | | | | | | | |
| Sub-total / average | | | | 2,520 | | | | 14,583,860 | | | | 91.5 | % | | $ | 180,093,837 | | | | 100.0 | % | | $ | 12.35 | |
| | | | | | | | | | | | | | | | | | . | | | | | | | | | |
| Vacant | | | | 512 | | | | 1,358,948 | | | | 8.5 | % | | NA | | | NA | | | NA | |
| | | | | | | | | | | | | | | | | | | | | | | | | | | |
| Total / average | | | | 3,032 | | | | 15,942,808 | | | | 100.0 | % | | $ | 180,093,837 | | | | 100.0 | % | | NA | |
Note: Excludes developments, non-retail properties, and DIM properties.
| EQUITY ONE, INC. |
| SHOPPING CENTER LEASE EXPIRATION SCHEDULE |
| CONSOLIDATED PROPERTIES |
| As of March 31, 2009 |
| |
ANCHOR TENANTS (SF >= 10,000)
| Date | | | Number of leases | | | Square feet | | | Percent of total square feet | | | Annualized minimum rent at expiration | | | Percent of total annualized minimum rent | | | Average annual minimum rent per square foot | |
| | | | | | | | | | | | | | | | | | | | |
| M-T-M | | | | 1 | | | | 12,000 | | | | 0.1 | % | | $ | 30,960 | | | | 0.0 | % | | $ | 2.58 | |
| 2009 | | | | 15 | | | | 487,233 | | | | 4.9 | % | | | 3,526,360 | | | | 4.1 | % | | $ | 7.24 | |
| 2010 | | | | 36 | | | | 1,014,604 | | | | 10.1 | % | | | 6,066,441 | | | | 7.0 | % | | $ | 5.98 | |
| 2011 | | | | 41 | | | | 1,162,463 | | | | 11.6 | % | | | 8,804,526 | | | | 10.2 | % | | $ | 7.57 | |
| 2012 | | | | 31 | | | | 1,054,728 | | | | 10.5 | % | | | 6,949,072 | | | | 8.1 | % | | $ | 6.59 | |
| 2013 | | | | 27 | | | | 870,263 | | | | 8.7 | % | | | 6,504,645 | | | | 7.5 | % | | $ | 7.47 | |
| 2014 | | | | 29 | | | | 898,121 | | | | 9.0 | % | | | 6,279,946 | | | | 7.3 | % | | $ | 6.99 | |
| 2015 | | | | 9 | | | | 277,831 | | | | 2.8 | % | | | 2,328,013 | | | | 2.7 | % | | $ | 8.38 | |
| 2016 | | | | 17 | | | | 853,255 | | | | 8.5 | % | | | 12,483,738 | | | | 14.4 | % | | $ | 14.63 | |
| 2017 | | | | 11 | | | | 413,474 | | | | 4.1 | % | | | 4,591,709 | | | | 5.3 | % | | $ | 11.11 | |
| 2018 | | | | 10 | | | | 317,861 | | | | 3.2 | % | | | 2,891,047 | | | | 3.3 | % | | $ | 9.10 | |
| Thereafter | | | | 55 | | | | 2,209,344 | | | | 22.1 | % | | | 26,045,614 | | | | 30.1 | % | | $ | 11.79 | |
| | | | | | | | | | | | | | | | | | | | | | | | | | | |
| Sub-total / average | | | | 282 | | | | 9,571,177 | | | | 95.6 | % | | $ | 86,502,071 | | | | 100.0 | % | | $ | 9.04 | |
| | | | | | | | | | | | | | | | | | | | | | | | | | | |
| Vacant | | | | 18 | | | | 436,140 | | | | 4.4 | % | | NA | | | NA | | | NA | |
| | | | | | | | | | | | | | | | | | | | | | | | | | | |
| Total / average | | | | 300 | | | | 10,007,317 | | | | 100.0 | % | | $ | 86,502,071 | | | | 100.0 | % | | NA | |
Note: Excludes developments, non-retail properties, and DIM properties.
| EQUITY ONE, INC. |
| SHOPPING CENTER LEASE EXPIRATION SCHEDULE |
| CONSOLIDATED PROPERTIES |
| As of March 31, 2009 |
| |
SHOP TENANTS (SF < 10,000)
| Date | | | Number of leases | | | Square feet | | | Percent of total square feet | | | Annualized minimum rent at expiration | | | Percent of total annualized minimum rent | | | Average annual minimum rent per square foot | |
| | | | | | | | | | | | | | | | | | | | |
| M-T-M | | | | 73 | | | | 140,679 | | | | 2.4 | % | | $ | 1,975,560 | | | | 2.1 | % | | $ | 14.04 | |
| 2009 | | | | 420 | | | | 843,035 | | | | 14.2 | % | | | 13,269,741 | | | | 14.2 | % | | | 15.74 | |
| 2010 | | | | 497 | | | | 1,009,242 | | | | 17.0 | % | | | 17,341,231 | | | | 18.5 | % | | | 17.18 | |
| 2011 | | | | 457 | | | | 981,792 | | | | 16.5 | % | | | 18,293,888 | | | | 19.5 | % | | | 18.63 | |
| 2012 | | | | 305 | | | | 691,776 | | | | 11.7 | % | | | 13,742,273 | | | | 14.7 | % | | | 19.87 | |
| 2013 | | | | 273 | | | | 662,851 | | | | 11.2 | % | | | 14,231,621 | | | | 15.2 | % | | | 21.47 | |
| 2014 | | | | 96 | | | | 257,237 | | | | 4.3 | % | | | 4,875,711 | | | | 5.2 | % | | | 18.95 | |
| 2015 | | | | 23 | | | | 75,309 | | | | 1.3 | % | | | 1,787,857 | | | | 1.9 | % | | | 23.74 | |
| 2016 | | | | 20 | | | | 74,614 | | | | 1.3 | % | | | 1,648,483 | | | | 1.8 | % | | | 22.09 | |
| 2017 | | | | 16 | | | | 82,469 | | | | 1.4 | % | | | 1,740,826 | | | | 1.9 | % | | | 21.11 | |
| 2018 | | | | 19 | | | | 60,739 | | | | 1.0 | % | | | 1,563,457 | | | | 1.7 | % | | | 25.74 | |
| Thereafter | | | | 39 | | | | 132,940 | | | | 2.2 | % | | | 3,121,118 | | | | 3.3 | % | | | 23.48 | |
| | | | | | | | | | | | | | | | | | | | | | | | | | | |
| Sub-total / average | | | | 2,238 | | | | 5,012,683 | | | | 84.5 | % | | $ | 93,591,766 | | | | 100.0 | % | | $ | 18.67 | |
| | | | | | | | | | | | | | | | | | | | | | | | | | | |
| Vacant | | | | 494 | | | | 922,808 | | | | 15.5 | % | | NA | | | NA | | | NA | |
| | | | | | | | | | | | | | | | | | | | | | | | | | | |
| Total / average | | | | 2,732 | | | | 5,935,491 | | | | 100.0 | % | | $ | 93,591,766 | | | | 100.0 | % | | NA | |
Note: Excludes developments, non-retail properties, and DIM properties.
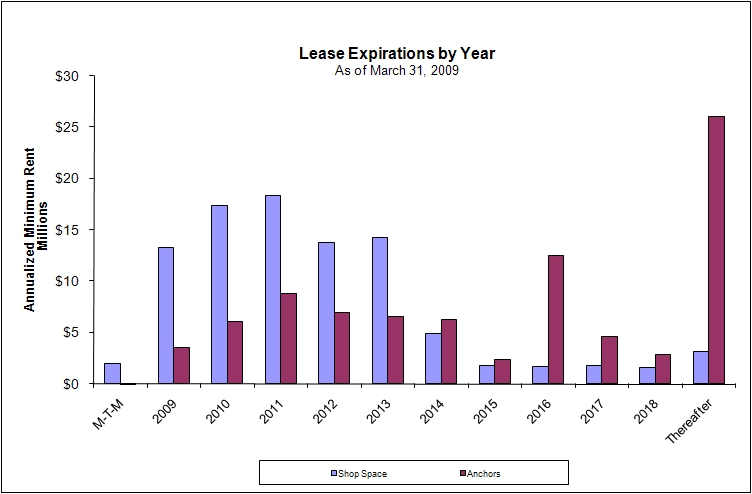
| EQUITY ONE, INC. |
| SHOPPING CENTER LEASE EXPIRATION GRAPH |
| CONSOLIDATED PROPERTIES |
| As of March 31, 2009 |
Note: Excludes developments, non-retail properties, and DIM properties.
| EQUITY ONE, INC. |
| ANNUAL MINIMUM RENT OF OPERATING PROPERTIES BY METRO/REGION |
| As of March 31, 2009 |
| |
| Metro or Region | | # Properties | | | Total SF | | | AMR | | | % of AMR | |
| Broward County, FL | | | 13 | | | | 1,933,454 | | | | 25,230,354 | | | | 14.7 | % |
| Miami Dade County, FL | | | 11 | | | | 1,236,895 | | | | 17,430,817 | | | | 10.1 | % |
| Palm Beach County, FL | | | 10 | | | | 1,090,884 | | | | 13,515,406 | | | | 7.9 | % |
| South Florida | | | 34 | | | | 4,261,233 | | | | 56,176,577 | | | | 32.7 | % |
| Atlanta, GA | | | 19 | | | | 1,933,631 | | | | 22,658,646 | | | | 13.2 | % |
| Orlando, FL | | | 10 | | | | 1,129,335 | | | | 13,376,337 | | | | 7.8 | % |
| Tampa- St. Petersburg, FL | | | 12 | | | | 1,094,802 | | | | 10,486,351 | | | | 6.1 | % |
| Naples/Cape Coral/Venice, FL | | | 8 | | | | 885,156 | | | | 8,362,249 | | | | 4.9 | % |
| Jacksonville, FL | | | 6 | | | | 781,644 | | | | 8,249,245 | | | | 4.8 | % |
| Boston, MA | | | 6 | | | | 401,454 | | | | 8,511,791 | | | | 5.0 | % |
| Florida Treasure/Northeast Coast | | | 8 | | | | 711,278 | | | | 7,864,499 | | | | 4.6 | % |
| Lafayette, LA | | | 5 | | | | 714,691 | | | | 3,756,927 | | | | 2.2 | % |
| New Orleans, LA | | | 4 | | | | 458,125 | | | | 3,639,820 | | | | 2.1 | % |
| Baton Rouge, LA | | | 3 | | | | 349,146 | | | | 3,157,475 | | | | 1.8 | % |
| Raleigh Durham, NC | | | 3 | | | | 357,701 | | | | 2,963,374 | | | | 1.7 | % |
| Florida Panhandle | | | 2 | | | | 140,803 | | | | 1,337,876 | | | | 0.8 | % |
| Greenville, SC | | | 2 | | | | 164,176 | | | | 2,194,887 | | | | 1.3 | % |
| Hilton Head-Beaufort, SC | | | 1 | | | | 166,639 | | | | 2,141,658 | | | | 1.2 | % |
| Hartford, CT | | | 1 | | | | 213,323 | | | | 2,320,704 | | | | 1.4 | % |
| Other | | | 22 | | | | 2,179,671 | | | | 14,404,190 | | | | 8.4 | % |
| | | | | | | | | | | | | | | | | |
| Total | | | 146 | | | | 15,942,808 | | | $ | 171,602,606 | | | | 100.0 | % |
| | | | | | | | | | | | | | | | | |
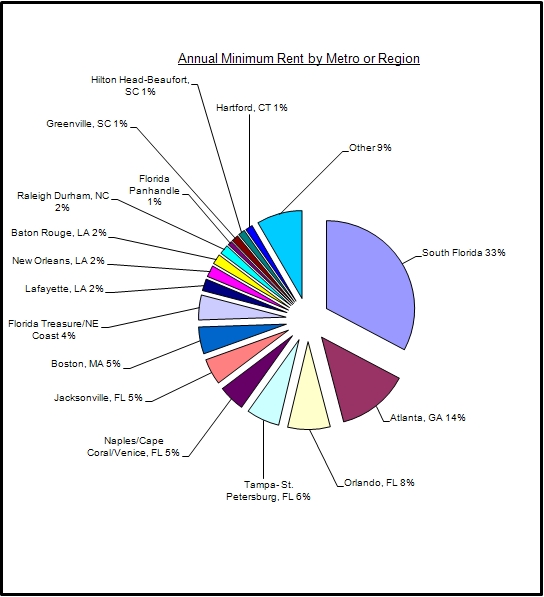
Note: Excludes developments, non-retail properties, and DIM properties.
| EQUITY ONE, INC. |
| PROPERTY STATUS REPORT |
| As of March 31, 2009 |
| | | | | Year | | Total | | | | Number | | Supermarket anchor | | Other | | Average |
| | | | | Built / | | Sq. Ft. | | Percent | | of tenants | | Owned | | | | Expiration | | anchor | | base rent |
Property | | City | | Renovated | | Owned | | Leased | | Leased | | Vacant | | sq. ft. | | Name | | Date | | tenants | | per leased SF |
| | | | | | | | | | | | | | | | | | | | | | | |
| ALABAMA (2) | | | | | | | | | | | | | | | | | | | | | | |
| Madison Centre | | Madison | | 1997 | | 64,837 | | 97.5% | | 12 | | 1 | | 37,912 | | Publix | | 06/01/17 | | Rite Aid | | $ 9.83 |
| | | | | | | | | | | | | | | | | | | | | | | |
| Winchester Plaza | | Huntsville | | 2006 | | 75,700 | | 90.2% | | 14 | | 5 | | 45,600 | | Publix | | 08/31/26 | | | | 11.57 |
| | | | | | | | | | | | | | | | | | | | | | | |
| TOTAL SHOPPING CENTERS ALABAMA (2) | | 140,537 | | 93.6% | | 26 | | 6 | | 83,512 | | | | | | | | $ 10.73 |
| | | | | | | | | | | | | | | | | | | | | | | |
| CONNECTICUT (1) | | | | | | | | | | | | | | | | | | | | | | |
| | | | | | | | | | | | | | | | | | | | | | | |
| Brookside Plaza** | | Enfield | | 1985 / 2006 | | 213,323 | | 92.6% | | 25 | | 3 | | 59,648 | | Shaw's | | 08/31/10 | | Bed Bath & Beyond / Walgreens / Staples / Petsmart | | $ 11.74 |
| | | | | | | | | | | | | | | | | | | | | | | |
| TOTAL SHOPPING CENTERS CONNECTICUT (1) | | 213,323 | | 92.6% | | 25 | | 3 | | 59,648 | | | | | | | | $ 11.74 |
| | | | | | | | | | | | | | | | | | | | | | | |
| FLORIDA (80) | | | | | | | | | | | | | | | | | | | | | | |
| | | | | | | | | | | | | | | | | | | | | | | |
| Orlando / Central Florida (10) | | | | | | | | | | | | | | | | | | | | | | |
| | | | | | | | | | | | | | | | | | | | | | | |
| Alafaya Commons | | Orlando | | 1987 | | 126,333 | | 97.2% | | 28 | | 2 | | 54,230 | | Publix | | 11/30/10 | | | | $ 14.24 |
| | | | | | | | | | | | | | | | | | | | | | | |
Alafaya Village | | Orlando | | 1986 | | 38,118 | | 72.5% | | 10 | | 7 | | | | | | | | Metro Fitness (shadow) | | 21.19 |
| | | | | | | | | | | | | | | | | | | | | | | |
| Conway Crossing | | Orlando | | 2002 | | 76,321 | | 81.6% | | 12 | | 6 | | 44,271 | | Publix | | 04/30/22 | | | | 11.39 |
| | | | | | | | | | | | | | | | | | | | | | | |
| Eastwood, Shoppes of | | Orlando | | 1997 | | 69,037 | | 100.0% | | 13 | | - | | 51,512 | | Publix | | 11/01/17 | | | | 12.37 |
| | | | | | | | | | | | | | | | | | | | | | | |
| Hunter's Creek | | Orlando | | 1998 | | 73,204 | | 100.0% | | 10 | | - | | | | | | | | Office Depot / Lifestyle Family Fitness | | 13.90 |
| | | | | | | | | | | | | | | | | | | | | | | |
| Kirkman Shoppes | | Orlando | | 1973 | | 88,820 | | 98.6% | | 29 | | 1 | | | | | | | | Party America | | 18.67 |
| | | | | | | | | | | | | | | | | | | | | | | |
| Lake Mary Centre | | Orlando | | 1988 / 2001 | | 339,084 | | 94.0% | | 64 | | 23 | | 63,139 | | Albertsons | | 06/30/12 | | Kmart / Lifestyle Fitness Center / Office Depot | | 13.16 |
| | | | | | | | | | | | | | | | | | | | | | | |
| Park Promenade | | Orlando | | 1987 / 2000 | | 128,848 | | 82.0% | | 19 | | 7 | | | | | | | | Beauty Depot / Orange County Library | | 7.82 |
| | | | | | | | | | | | | | | | | | | | | | | |
| Town & Country | | Kissimmee | | 1993 | | 72,043 | | 95.6% | | 12 | | 2 | | 52,883 | | Albertsons* | | 10/31/18 | | | | 8.41 |
| | | | | | | | | | | | | | | | | (Ross Dress For Less) | | | | | | |
| | | | | | | | | | | | | | | | | | | | | | | |
| Unigold Shopping Center | | Winter Park | | 1987 | | 117,527 | | 86.2% | | 21 | | 4 | | 52,500 | | Winn-Dixie | | 04/30/12 | | Lifestyle Family Fitness | | 12.09 |
| | | | | | | | | | | | | | | | | | | | | | | |
| Jacksonville / North Florida (8) | | | | | | | | | | | | | | | | |
| | | | | | | | | | | | | | | | | | | | | | | |
| Atlantic Village | | Atlantic Beach, FL | | 1984 | | 100,559 | | 89.9% | | 20 | | 5 | | 39,795 | | Publix | | 10/31/13 | | Jo-Ann Fabric & Crafts | | 11.28 |
| | | | | | | | | | | | | | | | | | | | | | | |
| Beauclerc Village | | Jacksonville | | 1962 / 1988 | | 68,846 | | 93.9% | | 7 | | 4 | | | | | | | | Big Lots / Goodwill / Bealls Outlet | | 8.92 |
| | | | | | | | | | | | | | | | | | | | | | | |
| Forest Village | | Tallahassee | | 2000 | | 71,526 | | 86.7% | | 13 | | 3 | | 37,866 | | Publix | | 04/30/20 | | | | 10.79 |
| | | | | | | | | | | | | | | | | | | | | | | |
| Ft. Caroline | | Jacksonville | | 1985 / 1995 | | 74,546 | | 87.0% | | 7 | | 6 | | 45,500 | | Winn-Dixie | | 05/31/15 | | Citi Trends | | 7.28 |
| EQUITY ONE, INC. |
| PROPERTY STATUS REPORT |
| As of March 31, 2009 |
| | | | | Year | | Total | | | | Number | | Supermarket anchor | | Other | | Average |
| | | | | Built / | | Sq. Ft. | | Percent | | of tenants | | Owned | | | | Expiration | | anchor | | base rent |
Property | | City | | Renovated | | Owned | | Leased | | Leased | | Vacant | | sq. ft. | | Name | | Date | | tenants | | per leased SF |
| | | | | | | | | | | | | | | | | | | | | | | |
| | | | | | | | | | | | | | | | | | | | | | | |
| Medical & Merchants | | Jacksonville | | 1993 | | 156,153 | | 91.6% | | 13 | | 4 | | 55,999 | | Publix | | 02/10/13 | | Memorial Hospital | | $ 13.21 |
| | | | | | | | | | | | | | | | | | | | | | | |
| Middle Beach | | Panama City Beach | | 1994 | | 69,277 | | 98.7% | | 8 | | 1 | | 56,077 | | Publix | | 09/30/14 | | | | 9.78 |
| | | | | | | | | | | | | | | | | | | | | | | |
| Oak Hill | | Jacksonville | | 1985 / 1997 | | 78,492 | | 94.3% | | 17 | | 3 | | 39,795 | | Publix | | 03/11/15 | | Beall's | | 7.80 |
| | | | | | | | | | | | | | | | | | | | | | | |
| South Beach** | | Jacksonville Beach | | 1990 / 1991 | | 303,048 | | 96.7% | | 43 | | 5 | | | | | | | | Beall's / Bed Bath & Beyond / Home Depot / Stein Mart / Staples | | 12.67 |
| | | | | | | | | | | | | | | | | | | | | | | |
| Miami-Dade / Broward / Palm Beach (34) | | | | | | | | | | | | | | |
| | | | | | | | | | | | | | | | | | | | | | | |
| Bird Ludlum | | Miami | | 1988 / 1998 | | 192,282 | | 96.3% | | 40 | | 3 | | 44,400 | | Winn-Dixie | | 12/31/12 | | CVS Pharmacy / Bird Executive / Goodwill | | 17.15 |
| | | | | | | | | | | | | | | | | | | | | | | |
| Boca Village | | Boca Raton | | 1978 | | 93,428 | | 92.2% | | 18 | | 3 | | 36,000 | | Publix Greenwise | | 03/31/12 | | CVS Pharmacy | | 16.23 |
| | | | | | | | | | | | | | | | | | | | | | | |
| Boynton Plaza | | Boynton Beach | | 1978 / 1999 | | 99,324 | | 91.9% | | 23 | | 6 | | 37,664 | | Publix | | 08/31/13 | | CVS Pharmacy | | 13.07 |
| | | | | | | | | | | | | | | | | | | | | | | |
| Bluffs Square | | Jupiter | | 1986 | | 132,395 | | 90.6% | | 39 | | 5 | | 39,795 | | Publix | | 10/22/11 | | Walgreens | | 13.74 |
| | | | | | | | | | | | | | | | | | | | | | | |
| Chapel Trail | | Pembroke Pines | | 2007 | | 56,378 | | 97.2% | | 3 | | 1 | | | | | | | | LA Fitness | | 22.05 |
| | | | | | | | | | | | | | | | | | | | | | | |
| Coral Reef Shopping Center | | Palmetto Bay | | 1968 / 1990 | | 74,680 | | 100.0% | | 16 | | - | | | | | | | | Office Depot / Walgreen's | | 19.47 |
| | | | | | | | | | | | | | | | | | | | | | | |
| Countryside Shops | | Cooper City | | 1986 / 1988 / 1991 | | 179,561 | | 96.8% | | 40 | | 5 | | 39,795 | | Publix | | 12/04/10 | | CVS Pharmacy / Stein Mart | | 13.87 |
| | | | | | | | | | | | | | | | | | | | | | | |
| Crossroads Square | | Pembroke Pines | | 1973 | | 84,387 | | 73.6% | | 20 | | 6 | | | | | | | | CVS Pharmacy | | 17.96 |
| | | | | | | | | | | | | | | | | | | | | | | |
| CVS Plaza | | Miami | | 2004 | | 29,204 | | 91.1% | | 7 | | 1 | | | | | | | | CVS Pharmacy | | 17.35 |
| | | | | | | | | | | | | | | | | | | | | | | |
| El Novillo | | Miami Beach | | 1970 / 2000 | | 10,000 | | 100.0% | | 1 | | - | | | | | | | | Jumbo Buffet | | 22.05 |
| | | | | | | | | | | | | | | | | | | | | | | |
| Greenwood | | Palm Springs | | 1982 / 1994 | | 132,325 | | 87.7% | | 30 | | 6 | | 50,032 | | Publix | | 12/05/14 | | Bealls Outlet | | 12.74 |
| | | | | | | | | | | | | | | | | | | | | | | |
| Jonathan's Landing | | Jupiter | | 1997 | | 26,820 | | 68.3% | | 10 | | 2 | | | | Publix | | | | | | 23.19 |
| | | | | | | | | | | | | | | | | (shadow) | | | | | | |
| Lago Mar | | Miami | | 1995 | | 82,613 | | 92.4% | | 18 | | 4 | | 42,323 | | Publix | | 09/13/15 | | | | 13.94 |
| | | | | | | | | | | | | | | | | | | | | | | |
| Lantana Village | | Lantana | | 1976 / 1999 | | 181,780 | | 96.1% | | 23 | | 2 | | 39,473 | | Winn-Dixie | | 02/15/11 | | Kmart / Rite Aid* (Family Dollar) | | 7.28 |
| | | | | | | | | | | | | | | | | | | | | | | |
| Meadows | | Miami | | 1997 | | 75,524 | | 97.4% | | 18 | | 2 | | 47,955 | | Publix | | 07/09/17 | | | | 13.83 |
| | | | | | | | | | | | | | | | | | | | | | | |
| Oakbrook Square | | Palm Beach Gardens | | 1974 / 2000 / 2003 | | 199,633 | | 95.4% | | 26 | | 4 | | 44,400 | | Publix | | 11/30/20 | | Stein Mart / Home Goods / CVS / Basset Furniture / Duffy's | | 14.33 |
| | | | | | | | | | | | | | | | | | | | | | | |
| Oaktree Plaza | | North Palm Beach | | 1985 | | 23,745 | | 82.0% | | 16 | | 4 | | | | | | | | | | 16.50 |
| | | | | | | | | | | | | | | | | | | | | | | |
| Pine Island | | Davie | | 1983 / 1999 | | 254,907 | | 94.5% | | 40 | | 6 | | 39,943 | | Publix | | 11/30/13 | | Home Depot Expo* / Staples | | 12.00 |
| | | | | | | | | | | | | | | | | | | | | | | |
| Pine Ridge Square | | Coral Springs | | 1986 / 1998 / 1999 | | 117,399 | | 89.6% | | 27 | | 8 | | 17,441 | | Fresh Market | | 07/31/09 | | Bed Bath & Beyond / Nordic Interiors | | 14.55 |
| EQUITY ONE, INC. |
| PROPERTY STATUS REPORT |
| As of March 31, 2009 |
| | | | | Year | | Total | | | | Number | | Supermarket anchor | | Other | | Average |
| | | | | Built / | | Sq. Ft. | | Percent | | of tenants | | Owned | | | | Expiration | | anchor | | base rent |
Property | | City | | Renovated | | Owned | | Leased | | Leased | | Vacant | | sq. ft. | | Name | | Date | | tenants | | per leased SF |
| | | | | | | | | | | | | | | | | | | | | | | |
| Plaza Alegre | | Miami | | 2003 | | 91,611 | | 96.1% | | 19 | | 2 | | 44,271 | | Publix | | 03/14/23 | | Goodwill | | $ 16.15 |
| | | | | | | | | | | | | | | | | | | | | | | |
| Point Royale | | Miami | | 1970 / 2000 | | 216,760 | | 96.9% | | 24 | | 2 | | 45,350 | | Winn-Dixie | | 02/15/10 | | Best Buy | | 7.56 |
| | | | | | | | | | | | | | | | | | | | | | | |
| Prosperity Centre | | Palm Beach Gardens | | 1993 | | 122,014 | | 96.6% | | 9 | | 1 | | | | | | | | Office Depot / CVS / Bed Bath & Beyond / TJ Maxx | | 17.98 |
| | | | | | | | | | | | | | | | | | | | | | | |
| Ridge Plaza | | Davie | | 1984 / 1999 | | 155,204 | | 99.0% | | 28 | | 1 | | | | | | | | AMC Theater / Kabooms / Wachovia* (United Collection) / Round Up / Goodwill | | 11.77 |
| | | | | | | | | | | | | | | | | | | | | | | |
| Riverside Square | | Coral Springs | | 1987 | | 104,241 | | 84.3% | | 26 | | 8 | | 39,795 | | Publix | | 02/18/12 | | | | 13.44 |
| | | | | | | | | | | | | | | | | | | | | | | |
| Sawgrass Promenade | | Deerfield Beach | | 1982 / 1998 | | 107,092 | | 86.6% | | 22 | | 7 | | 36,464 | | Publix | | 12/15/14 | | Walgreens | | 11.62 |
| | | | | | | | | | | | | | | | | | | | | | | |
| Sheridan Plaza | | Hollywood | | 1973 / 1991 | | 504,495 | | 94.8% | | 54 | | 9 | | 65,537 | | Publix | | 10/09/11 | | Kohl's / Ross / Bed Bath & Beyond / Office Depot / LA Fitness / USA Baby & Child Space / Assoc. in Neurology | | 14.18 |
| | | | | | | | | | | | | | | | | | | | | | | |
| Shoppes of Andros Isles | | West Palm Beach | | 2000 | | 79,420 | | 91.2% | | 14 | | 3 | | 51,420 | | Publix | | 02/29/20 | | | | 12.84 |
| | | | | | | | | | | | | | | | | | | | | | | |
| Shoppes of Silverlakes | | Pembroke Pines | | 1995 / 1997 | | 126,788 | | 95.9% | | 37 | | 3 | | 47,813 | | Publix | | 06/14/15 | | | | 17.77 |
| | | | | | | | | | | | | | | | | | | | | | | |
| Shops at Skylake | | North Miami Beach | | 1999 / 2005 / 2006 | | 283,943 | | 100.0% | | 49 | | - | | 51,420 | | Publix | | 07/31/19 | | TJMaxx / LA Fitness / Goodwill | | 16.18 |
| | | | | | | | | | | | | | | | | | | | | | | |
| Tamarac Town Square | | Tamarac | | 1987 | | 127,635 | | 80.7% | | 27 | | 12 | | 37,764 | | Publix | | 12/15/14 | | Dollar Tree | | 11.50 |
| | | | | | | | | | | | | | | | | | | | | | | |
| Waterstone | | Homestead | | 2005 | | 79,531 | | 97.8% | | 11 | | 1 | | 45,600 | | Publix | | 07/31/25 | | Walgreens | | 14.94 |
| | | | | | | | | | | | | | | | | | | | | | | |
| West Lakes Plaza | | Miami | | 1984 / 2000 | | 100,747 | | 100.0% | | 27 | | - | | 46,216 | | Winn-Dixie | | 05/22/16 | | Navarro Pharmacy | | 12.63 |
| | | | | | | | | | | | | | | | | | | | | | | |
| Westport Plaza | | Davie | | 2002 | | 49,533 | | 100.0% | | 8 | | - | | 27,887 | | Publix | | 11/30/22 | | | | 17.89 |
| | | | | | | | | | | | | | | | | | | | | | | |
| Young Circle | | Hollywood | | 1962 / 1997 | | 65,834 | | 98.1% | | 9 | | 1 | | 23,124 | | Publix | | 11/30/16 | | Walgreens | | 15.45 |
| | | | | | | | | | | | | | | | | | | | | | | |
| Florida Treasure / Northeast Coast (8) | | | | | | | | | | | | | | | | |
| | | | | | | | | | | | | | | | | | | | | | | |
| Cashmere Corners | | Port St. Lucie | | 2001 | | 92,734 | | 96.0% | | 16 | | 2 | | 59,448 | | Albertsons | | 04/30/25 | | | | 9.58 |
| | | | | | | | | | | | | | | | | | | | | | | |
| New Smyrna Beach | | New Smyrna Beach | | 1987 | | 118,451 | | 100.0% | | 34 | | - | | 42,112 | | Publix | | 09/30/12 | | Bealls Outlet | | 11.68 |
| | | | | | | | | | | | | | | | | | | | | | | |
| Old King Commons | | Palm Coast | | 1988 | | 84,759 | | 94.7% | | 16 | | 3 | | | | | | | | Wal-Mart / Staples / Bealls Outlet | | 8.70 |
| | | | | | | | | | | | | | | | | | | | | | | |
| Ryanwood | | Vero Beach | | 1987 | | 114,925 | | 96.3% | | 30 | | 2 | | 39,795 | | Publix | | 03/23/17 | | Bealls Outlet / Books-A-Million | | 11.39 |
| | | | | | | | | | | | | | | | | | | | | | | |
| Salerno Village | | Stuart | | 1987 | | 82,477 | | 92.8% | | 16 | | 4 | | 45,802 | | Winn-Dixie | | 03/23/24 | | CVS Pharmacy | | 10.76 |
| | | | | | | | | | | | | | | | | | | | | | | |
| Shops at St. Lucie | | Port St. Lucie | | 2006 | | 19,361 | | 100.0% | | 10 | | - | | | | | | | | | | 22.96 |
| | | | | | | | | | | | | | | | | | | | | | | |
| South Point Center | | Vero Beach | | 2003 | | 64,790 | | 88.1% | | 10 | | 6 | | 44,840 | | Publix | | 11/30/23 | | | | 15.67 |
| EQUITY ONE, INC. |
| PROPERTY STATUS REPORT |
| As of March 31, 2009 |
| | | | | Year | | Total | | | | Number | | Supermarket anchor | | Other | | Average |
| | | | | Built / | | Sq. Ft. | | Percent | | of tenants | | Owned | | | | Expiration | | anchor | | base rent |
Property | | City | | Renovated | | Owned | | Leased | | Leased | | Vacant | | sq. ft. | | Name | | Date | | tenants | | per leased SF |
| | | | | | | | | | | | | | | | | | | | | | | |
| Treasure Coast | | Vero Beach | | 1983 | | 133,781 | | 96.6% | | 21 | | 3 | | 59,450 | | Publix | | 07/31/26 | | TJ Maxx | | $ 11.66 |
| | | | | | | | | | | | | | | | | | | | | | | |
| Tampa / St. Petersburg / Venice / Cape Coral / Naples (20) | | | | | | | | | | | | |
| | | | | | | | | | | | | | | | | | | | | | | |
| Bay Pointe Plaza | | St. Petersburg | | 1984 / 2002 | | 103,986 | | 95.6% | | 20 | | 4 | | 52,610 | | Publix | | 11/30/21 | | Bealls Outlet | | 10.22 |
| | | | | | | | | | | | | | | | | | | | | | | |
| Carrollwood | | Tampa | | 1970 / 2002 | | 94,203 | | 92.9% | | 29 | | 7 | | 27,887 | | Publix | | 11/30/22 | | Golf Locker | | 13.43 |
| | | | | | | | | | | | | | | | | | | | | | | |
| Charlotte Square | | Port Charlotte | | 1980 | | 96,188 | | 78.2% | | 15 | | 9 | | 44,024 | | Publix* | | 01/31/11 | | Seafood Buffet | | 7.83 |
| | | | | | | | | | | | | | | | | (American Signature Furniture) | | | | | | |
| | | | | | | | | | | | | | | | | | | | | | | |
| Chelsea Place | | New Port Richey | | 1992 | | 81,144 | | 96.5% | | 16 | | 2 | | 48,890 | | Publix | | 05/27/12 | | | | 11.76 |
| | | | | | | | | | | | | | | | | | | | | | | |
| Dolphin Village | | St. Petersburg | | 1967/1990 | | 138,129 | | 75.2% | | 27 | | 20 | | 33,238 | | Publix | | 11/07/13 | | Dollar Tree, CVS | | 12.01 |
| | | | | | | | | | | | | | | | | | | | | | | |
| Lake St. Charles | | Tampa | | 1999 | | 57,015 | | 100.0% | | 8 | | - | | 46,295 | | Sweet Bay | | 06/30/19 | | | | 10.22 |
| | | | | | | | | | | | | | | | | | | | | | | |
| Lutz Lake | | Lutz | | 2002 | | 64,985 | | 95.8% | | 13 | | 2 | | 44,270 | | Publix | | 05/31/22 | | | | 13.95 |
| | | | | | | | | | | | | | | | | | | | | | | |
| Marco Town Center | | Marco Island | | 2001 | | 109,830 | | 86.8% | | 35 | | 7 | | 27,887 | | Publix | | 01/31/18 | | | | 18.06 |
| | | | | | | | | | | | | | | | | | | | | | | |
| Mariners Crossing | | Spring Hill | | 1989 / 1999 | | 97,812 | | 91.9% | | 16 | | 2 | | 48,315 | | Sweet Bay | | 08/15/20 | | | | 10.57 |
| | | | | | | | | | | | | | | | | | | | | | | |
| Midpoint Center | | Cape Coral | | 2002 | | 75,386 | | 100.0% | | 10 | �� | - | | 60,667 | | Publix | | 10/31/22 | | | | 12.29 |
| | | | | | | | | | | | | | | | | | | | | | | |
| Pavilion | | Naples | | 1982 | | 167,745 | | 90.3% | | 32 | | 8 | | 50,795 | | Publix | | 02/28/13 | | Pavilion 6 Theatre | | 13.65 |
| | | | | | | | | | | | | | | | | | | | | | | |
| Regency Crossing | | Port Richey | | 1986 / 2001 | | 85,864 | | 81.6% | | 15 | | 10 | | 44,270 | | Publix | | 02/28/21 | | | | 10.27 |
| | | | | | | | | | | | | | | | | | | | | | | |
| Ross Plaza | | Tampa | | 1984 / 1996 | | 90,826 | | 95.3% | | 20 | | 2 | | | | | | | | Ross Dress for Less / Deals | | 12.18 |
| | | | | | | | | | | | | | | | | | | | | | | |
| Seven Hills | | Spring Hill | | 1991 | | 72,590 | | 87.8% | | 12 | | 6 | | 48,890 | | Publix | | 09/25/11 | | | | 10.48 |
| | | | | | | | | | | | | | | | | | | | | | | |
| Shoppes of North Port | | North Port | | 1991 | | 84,705 | | 94.7% | | 18 | | 3 | | 48,890 | | Publix | | 12/11/11 | | Bealls Outlet | | 10.11 |
| | | | | | | | | | | | | | | | | | | | | | | |
| Summerlin Square | | Fort Myers | | 1986 / 1998 | | 109,156 | | 77.0% | | 13 | | 15 | | 45,500 | | Winn-Dixie | | 06/04/11 | | Lee County Sheriff's Office | | 10.93 |
| | | | | | | | | | | | | | | | | | | | | | | |
| Sunpoint Shopping Center | | Ruskin | | 1984 | | 132,374 | | 60.0% | | 17 | | 7 | | | | | | | | Goodwill / Ozzie's Buffet / Big Lots | | 9.14 |
| | | | | | | | | | | | | | | | | | | | | | | |
| Venice Plaza | | Venice | | 1971 / 1979 / 1999 | | 132,345 | | 97.5% | | 13 | | 2 | | 42,582 | | Sweet Bay | | 09/30/18 | | TJ Maxx / Blockbuster | | 6.00 |
| | | | | | | | | | | | | | | | | | | | | | | |
| Venice Shopping Center | | Venice | | 1968 / 2000 | | 109,801 | | 92.7% | | 13 | | 1 | | 44,271 | | Publix | | 12/31/26 | | Beall's Outlet | | 5.45 |
| | | | | | | | | | | | | | | | | | | | | | | |
| Walden Woods | | Plant City | | 1985 / 1998 / 2003 | | 75,874 | | 91.8% | | 12 | | 3 | | | | | | | | Dollar Tree / Aaron Rents / Dollar General | | 7.97 |
| | | | | | | | | | | | | | | | | | | | | | | |
| TOTAL SHOPPING CENTERS FLORIDA (80) | | 9,004,251 | | 92.4% | | 1,632 | | 331 | | 2,686,177 | | | | | | | | $ 12.72 |
| EQUITY ONE, INC. |
| PROPERTY STATUS REPORT |
| As of March 31, 2009 |
| | | | | Year | | Total | | | | Number | | Supermarket anchor | | Other | | Average |
| | | | | Built / | | Sq. Ft. | | Percent | | of tenants | | Owned | | | | Expiration | | anchor | | base rent |
| Property | | City | | Renovated | | Owned | | Leased | | Leased | | Vacant | | sq. ft. | | Name | | Date | | tenants | | per leased SF |
| | | | | | | | | | | | | | | | | | | | | | | |
| GEORGIA (24) | | | | | | | | | | | | | | |
| | | | | | | | | | | | | | | | | | | | | | | |
| Atlanta (20) | | | | | | | | | | | | | | |
| | | | | | | | | | | | | | | | | | | | | | | |
| BridgeMill | | Canton | | 2000 | | 89,102 | | 91.0% | | 26 | | 4 | | 37,888 | | Publix | | 01/31/20 | | | | $ 15.49 |
| | | | | | | | | | | | | | | | | | | | | | | |
| Buckhead Station | | Atlanta | | 1996 | | 233,930 | | 89.7% | | 15 | | 4 | | | | | | | | Bed Bath & Beyond / TJ Maxx / Old Navy / Toys R Us / DSW / Golfsmith / Ulta 3 | | 19.84 |
| | | | | | | | | | | | | | | | | | | | | | | |
| Butler Creek | | Acworth | | 1990 | | 95,597 | | 91.9% | | 17 | | 3 | | 59,997 | | Kroger | | 01/31/18 | | | | 10.82 |
| | | | | | | | | | | | | | | | | | | | | | | |
| Chastain Square | | Atlanta | | 1981 / 2001 | | 91,637 | | 97.4% | | 25 | | 3 | | 37,366 | | Publix | | 05/31/24 | | | | 17.92 |
| | | | | | | | | | | | | | | | | | | | | | | |
| Commerce Crossing | | Commerce | | 1988 | | 100,668 | | 62.4% | | 8 | | 3 | | 32,000 | | Ingles | | 09/26/09 | | Fred's Store | | 4.80 |
| | | | | | | | | | | | | | | | | | | | | | | |
| Douglas Commons | | Douglasville | | 1988 | | 97,027 | | 97.5% | | 16 | | 2 | | 59,431 | | Kroger | | 08/31/13 | | | | 10.68 |
| | | | | | | | | | | | | | | | | | | | | | | |
| Fairview Oaks | | Ellenwood | | 1997 | | 77,052 | | 93.9% | | 11 | | 3 | | 54,498 | | Kroger | | 09/30/16 | | | | 11.29 |
| | | | | | | | | | | | | | | | | | | | | | | |
| Grassland Crossing | | Alpharetta | | 1996 | | 90,906 | | 97.3% | | 12 | | 2 | | 70,086 | | Kroger | | 06/30/16 | | | | 11.44 |
| | | | | | | | | | | | | | | | | | | | | | | |
| Hairston Center | | Decatur | | 2000 | | 13,000 | | 38.5% | | 3 | | 6 | | | | | | | | | | 13.62 |
| | | | | | | | | | | | | | | | | | | | | | | |
| Hamilton Ridge | | Buford | | 2002 | | 90,996 | | 81.6% | | 12 | | 9 | | 54,166 | | Kroger | | 11/30/22 | | | | 11.68 |
| | | | | | | | | | | | | | | | | | | | | | | |
| Mableton Crossing | | Mableton | | 1997 | | 86,819 | | 97.1% | | 15 | | 2 | | 63,419 | | Kroger | | 08/31/17 | | | | 10.66 |
| | | | | | | | | | | | | | | | | | | | | | | |
| Macland Pointe | | Marietta | | 1992-93 | | 79,699 | | 98.5% | | 16 | | 1 | | 55,999 | | Publix | | 12/29/12 | | | | 10.19 |
| | | | | | | | | | | | | | | | | | | | | | | |
| Market Place | | Norcross | | 1976 | | 77,706 | | 89.4% | | 19 | | 4 | | | | | | | | Galaxy Cinema | | 12.33 |
| | | | | | | | | | | | | | | | | | | | | | | |
| Paulding Commons | | Hiram | | 1991 | | 192,391 | | 94.9% | | 25 | | 5 | | 49,700 | | Kroger | | 02/28/11 | | Kmart | | 8.03 |
| | | | | | | | | | | | | | | | | | | | | | | |
| Piedmont Peachtree Crossing | | Buckhead | | 1978 / 1998 | | 152,239 | | 100.0% | | 28 | | - | | 55,520 | | Kroger | | 05/31/10 | | Cost Plus Store / Binders Art Supplies | | 17.16 |
| | | | | | | | | | | | | | | | | | | | | | | |
| Powers Ferry Plaza | | Marietta | | 1979 / 1987 / 1998 | | 86,473 | | 91.3% | | 20 | | 5 | | | | | | | | Micro Center | | 9.84 |
| | | | | | | | | | | | | | | | | | | | | | | |
| Shops of Huntcrest | | Lawrenceville | | 2003 | | 97,040 | | 91.2% | | 21 | | 5 | | 54,340 | | Publix | | 01/31/23 | | | | 13.64 |
| | | | | | | | | | | | | | | | | | | | | | | |
| Shops of Westridge | | McDonough | | 2006 | | 66,297 | | 83.1% | | 11 | | 7 | | 38,997 | | Publix | | 04/30/26 | | | | 13.75 |
| | �� | | | | | | | | | | | | | | | | | | | | | |
| Wesley Chapel | | Decatur | | 1989 | | 170,792 | | 61.9% | | 13 | | 13 | | 32,000 | | Ingles* | | 09/25/09 | | CVS Pharmacy / Corinthian College | | 6.21 |
| | | | | | | | | | | | | | | | | | | | | | | |
| Williamsburg @ Dunwoody | | Dunwoody | | 1983 | | 44,928 | | 97.4% | | 25 | | 1 | | | | | | | | | | 20.18 |
| EQUITY ONE, INC. |
| PROPERTY STATUS REPORT |
| As of March 31, 2009 |
| | | | | Year | | Total | | | | Number | | Supermarket anchor | | Other | | Average |
| | | | | Built / | | Sq. Ft. | | Percent | | of tenants | | Owned | | | | Expiration | | anchor | | base rent |
Property | | City | | Renovated | | Owned | | Leased | | Leased | | Vacant | | sq. ft. | | Name | | Date | | tenants | | per leased SF |
| | | | | | | | | | | | | | | | | | | | | | | |
| Central / South Georgia (4) | | | | | | | | | | | | | | | | | | |
| | | | | | | | | | | | | | | | | | | | | | | |
| Daniel Village | | Augusta | | 1956 / 1997 | | 171,932 | | 92.1% | | 31 | | 8 | | 45,971 | | Bi-Lo | | 03/25/22 | | St. Joseph Home Health Care | | $ 8.60 |
| | | | | | | | | | | | | | | | | | | | | | | |
| McAlpin Square | | Savannah | | 1979 | | 176,807 | | 87.1% | | 23 | | 2 | | 43,600 | | Kroger | | 08/31/15 | | Big Lots / U.S Post Office | | 8.02 |
| | | | | | | | | | | | | | | | | | | | | | | |
| Spalding Village | | Griffin | | 1989 | | 235,318 | | 67.3% | | 20 | | 8 | | 59,431 | | Kroger | | 05/31/14 | | JC Penney* / Blockbuster / Fred's Store | | 7.94 |
| | | | | | | | | | | | | | | | | | | | | | | |
| Walton Plaza | | Augusta | | 1990 | | 43,460 | | 94.5% | | 6 | | 2 | | 32,960 | | Harris Teeter* (Omni Fitness) | | 04/01/11 | | | | 10.27 |
| | | | | | | | | | | | | | | | | | | | | | | |
| TOTAL SHOPPING CENTERS GEORGIA (24) | | 2,661,816 | | 87.0% | | 418 | | 102 | | 937,369 | | | | | | | | $ 11.76 |
| | | | | | | | | | | | | | | | | | | | | | | |
| LOUISIANA (14) | | | | | | | | | | | | | | | | | | |
| | | | | | | | | | | | | | | | | | | | | | | |
| Ambassador Row | | Lafayette | | 1980 / 1991 | | 193,978 | | 69.7% | | 23 | | 3 | | | | | | | | Conn's Appliances / Big Lots / Chuck E Cheese | | $ 10.28 |
| | | | | | | | | | | | | | | | | | | | | | | |
| Ambassador Row Courtyard | | Lafayette | | 1986 / 1991 / 2005 | | 146,697 | | 100.0% | | 23 | | - | | | | | | | | Bed Bath & Beyond / Marshall's / Hancock Fabrics / United Training Academy / Tuesday Morning | | 10.27 |
| | | | | | | | | | | | | | | | | | | | | | | |
| Bluebonnet Village | | Baton Rouge | | 1983 | | 101,623 | | 98.0% | | 24 | | 2 | | 33,387 | | Matherne's | | 11/30/10 | | Office Depot | | 11.94 |
| | | | | | | | | | | | | | | | | | | | | | | |
| Boulevard | | Lafayette | | 1976 / 1994 | | 68,012 | | 98.4% | | 13 | | 1 | | | | | | | | Piccadilly / Harbor Freight Tools / Golfballs.com | | 8.77 |
| | | | | | | | | | | | | | | | | | | | | | | |
| Country Club Plaza | | Slidell | | 1982 / 1994 | | 64,686 | | 95.2% | | 8 | | 2 | | 33,387 | | Winn-Dixie | | 01/31/13 | | | | 6.51 |
| | | | | | | | | | | | | | | | | | | | | | | |
| Crossing | | Slidell | | 1988 / 1993 | | 114,806 | | 99.0% | | 15 | | 1 | | 58,432 | | Save A Center | | 09/29/09 | | A-1 Home Appliance / Piccadilly | | 5.87 |
| | | | | | | | | | | | | | | | | | | | | | | |
| Elmwood Oaks | | Harahan | | 1989 | | 133,995 | | 100.0% | | 11 | | - | | | | | | | | Academy Sports / Dollar Tree / Home Décor | | 9.92 |
| | | | | | | | | | | | | | | | | | | | | | | |
| Grand Marche (ground lease) | | Lafayette | | 1969 | | 200,585 | | 100.0% | | 1 | | - | | | | | | | | | | NA |
| | | | | | | | | | | | | | | | | | | | | | | |
| Plaza Acadienne | | Eunice | | 1980 | | 105,419 | | 54.2% | | 6 | | 2 | | 28,092 | | Super 1 Store | | 06/30/10 | | Fred's Store | | 4.24 |
| | | | | | | | | | | | | | | | | | | | | | | |
| Sherwood South | | Baton Rouge | | 1972 / 1988 / 1992 | | 77,107 | | 86.0% | | 8 | | 1 | | | | | | | | Burke's Outlet / Harbor Freight Tools / Fred's Store | | 6.24 |
| | | | | | | | | | | | | | | | | | | | | | | |
| Siegen Village | | Baton Rouge | | 1988 | | 170,416 | | 98.7% | | 18 | | 2 | | | | | | | | Office Depot / Big Lots / Dollar Tree / Stage / Party City | | 9.24 |
| | | | | | | | | | | | | | | | | | | | | | | |
| Tarpon Heights | | Galliano | | 1982 | | 56,605 | | 78.4% | | 7 | | 3 | | | | | | | | Stage / Dollar General | | 5.06 |
| | | | | | | | | | | | | | | | | | | | | | | |
| Village at Northshore | | Slidell | | 1988 | | 144,638 | | 98.9% | | 13 | | 1 | | | | | | | | Marshalls / Dollar Tree / Kirschman's* / Bed Bath & Beyond / Office Depot | | 8.69 |
| | | | | | | | | | | | | | | | | | | | | | | |
| Wal-Mart Mathews | | Mathews | | 1985 | | 54,223 | | 100.0% | | 1 | | - | | | | | | | | Wal-Mart* | | 2.90 |
| | | | | | | | | | | | | | | | | | | | | | | |
| TOTAL SHOPPING CENTERS LOUISIANA (14) | | 1,632,790 | | 91.4% | | 171 | | 18 | | 153,298 | | | | | | | | $ 8.45 |
| EQUITY ONE, INC. |
| PROPERTY STATUS REPORT |
| As of March 31, 2009 |
| | | | | Year | | Total | | | | Number | | Supermarket anchor | | Other | | Average |
| | | | | Built / | | Sq. Ft. | | Percent | | of tenants | | Owned | | | | Expiration | | anchor | | base rent |
Property | | City | | Renovated | | Owned | | Leased | | Leased | | Vacant | | sq. ft. | | Name | | Date | | tenants | | per leased SF |
| | | | | | | | | | | | | | | | | | | | | | | |
| MASSACHUSETTS (7) | | | | | | | | | | | | | | | | | | | | | | |
| | | | | | | | | | | | | | | | | | | | | | | |
| Cambridge Star Market | | Cambridge | | 1953 / 1997 | | 66,108 | | 100.0% | | 1 | | - | | 66,108 | | Star Market | | 01/02/16 | | | | $ 26.89 |
| | | | | | | | | | | | | | | | | | | | | | | |
| Medford Shaw's Supermarket | | Medford | | 1995 | | 62,656 | | 100.0% | | 2 | | - | | 60,356 | | Shaw's | | 01/01/16 | | | | 23.94 |
| | | | | | | | | | | | | | | | | | | | | | | |
| Plymouth Shaw's Supermarket | | Plymouth | | 1993 | | 59,726 | | 100.0% | | 1 | | - | | 59,726 | | Shaw's | | 01/01/16 | | | | 17.77 |
| | | | | | | | | | | | | | | | | | | | | | | |
| Quincy Star Market | | Quincy | | 1965 / 1995 | | 100,741 | | 100.0% | | 1 | | - | | 100,741 | | Star Market | | 01/02/16 | | | | 17.36 |
| | | | | | | | | | | | | | | | | | | | | | | |
| Swampscott Whole Foods | | Swampscott | | 1967 / 2005 | | 35,907 | | 100.0% | | 1 | | - | | 35,907 | | Whole Foods | | 01/01/26 | | | | 22.89 |
| | | | | | | | | | | | | | | | | | | | | | | |
| Webster Plaza | | Webster | | 1963 / 1998 | | 199,425 | | 100.0% | | 14 | | - | | 56,766 | | Shaw's | | 02/28/23 | | K Mart / Family Dollar / Dollar Tree | | 8.00 |
| | | | | | | | | | | | | | | | | | | | | | | |
| West Roxbury Shaw's Plaza | | West Roxbury | | 1973 / 1995/ 2006 | | 76,316 | | 90.6% | | 9 | | 2 | | 54,928 | | Shaw's | | 01/02/16 | | | | 23.16 |
| | | | | | | | | | | | | | | | | | | | | | | |
| TOTAL SHOPPING CENTERS MASSACHUSETTS (7) | | 600,879 | | 98.8% | | 29 | | 2 | | 434,532 | | | | | | | | $ 17.02 |
| | | | | | | | | | | | | | | | | | | | | | | |
| MISSISSIPPI (1) | | | | | | | | | | | | | | | | | | | | | | |
| | | | | | | | | | | | | | | | | | | | | | | |
| Shipyard Plaza | | Pascagoula | | 1987 | | 66,857 | | 100.0% | | 8 | | - | | | | | | | | Big Lots / Buffalo Wild Wings | | $ 7.18 |
| | | | | | | | | | | | | | | | | | | | | | | |
| TOTAL SHOPPING CENTERS MISSISSIPPI (1) | | 66,857 | | 100.0% | | 8 | | - | | - | | | | | | | | $ 7.18 |
| | | | | | | | | | | | | | | | | | | | | | | |
| NORTH CAROLINA (9) | | | | | | | | | | | | | | | | | | | | | | |
| | | | | | | | | | | | | | | | | | | | | | | |
| Centre Pointe Plaza | | Smithfield | | 1989 | | 163,642 | | 75.9% | | 20 | | 4 | | | | | | | | Belk's / Dollar Tree / Aaron Rents | | $ 6.81 |
| | | | | | | | | | | | | | | | | | | | | | | |
| Chestnut Square | | Brevard | | 1985 / 2008 | | 34,260 | | 90.7% | | 6 | | 2 | | | | | | | | Walgreens | | 15.30 |
| | | | | | | | | | | | | | | | | | | | | | | |
| Galleria | | Wrightsville Beach | | 1986 / 1990 | | 92,114 | | 90.6% | | 29 | | 6 | | 28,000 | | Harris Teeter* | | 04/05/11 | | | | 10.48 |
| | | | | | | | | | | | | | | | | | | | | | | |
| Parkwest Crossing | | Durham | | 1990 | | 85,602 | | 93.0% | | 15 | | 2 | | 38,052 | | Food Lion | | 12/14/10 | | | | 10.55 |
| | | | | | | | | | | | | | | | | | | | | | | |
| Riverview Shopping Center | | Durham | | 1973 / 1995 | | 128,498 | | 95.7% | | 13 | | 3 | | 53,538 | | Kroger | | 12/31/14 | | Upchurch Drugs / Riverview Galleries | | 7.99 |
| | | | | | | | | | | | | | | | | | | | | | | |
| Salisbury Marketplace | | Salisbury | | 1987 | | 79,732 | | 76.9% | | 13 | | 7 | | 31,762 | | Food Lion | | 02/11/23 | | | | 11.00 |
| | | | | | | | | | | | | | | | | | | | | | | |
| Stanley Market Place | | Stanley | | 2007 | | 53,228 | | 93.4% | | 5 | | 2 | | 34,928 | | Food Lion | | 05/15/27 | | Family Dollar | | 9.85 |
| | | | | | | | | | | | | | | | | | | | | | | |
| Thomasville Commons | | Thomasville | | 1991 | | 148,754 | | 96.2% | | 11 | | 2 | | 32,000 | | Ingles | | 09/29/12 | | Kmart | | 5.81 |
| | | | | | | | | | | | | | | | | | | | | | | |
| Willowdaile Shopping Center | | Durham | | 1986 | | 143,601 | | 93.4% | | 19 | | 7 | | 48,000 | | Harris Teeter | | 10/31/24 | | Hall of Fitness | | 8.50 |
| | | | | | | | | | | | | | | | | | | | | | | |
| TOTAL SHOPPING CENTERS NORTH CAROLINA (9) | | 929,431 | | 89.3% | | 131 | | 35 | | 266,280 | | | | | | | | $ 8.62 |
| EQUITY ONE, INC. |
| PROPERTY STATUS REPORT |
| As of March 31, 2009 |
| | | | | Year | | Total | | | | Number | | Supermarket anchor | | Other | | Average |
| | | | | Built / | | Sq. Ft. | | Percent | | of tenants | | Owned | | | | Expiration | | anchor | | base rent |
Property | | City | | Renovated | | Owned | | Leased | | Leased | | Vacant | | sq. ft. | | Name | | Date | | tenants | | per leased SF |
| | | | | | | | | | | | | | | | | | | | | | | |
| SOUTH CAROLINA (7) | | | | | | | | | | | | | | | | | | |
| | | | | | | | | | | | | | | | | | | | | | | |
| Belfair Towne Village | | Bluffton | | 2000 / 2003 / 2006 | | 166,639 | | 96.5% | | 32 | | 2 | | 55,696 | | Kroger | | 10/31/19 | | Stein Mart | | $ 13.32 |
| | | | | | | | | | | | | | | | | | | | | | | |
| Lancaster Plaza | | Lancaster | | 1971 / 1990 | | 77,400 | | 64.9% | | 3 | | 2 | | 19,200 | | Bi-Lo | | 09/30/10 | | Tractor Supply | | 3.13 |
| | | | | | | | | | | | | | | | | | | | | | | |
| Lancaster Shopping Center | | Lancaster | | 1963 / 1987 | | 29,047 | | 100.0% | | 2 | | - | | | | | | | | Sweet Union Furniture | | 2.11 |
| | | | | | | | | | | | | | | | | | | | | | | |
| Milestone Plaza | | Greenville | | 1995 | | 96,121 | | 97.5% | | 11 | | 1 | | 59,039 | | Bi-Lo | | 03/31/30 | | | | 15.84 |
| | | | | | | | | | | | | | | | | | | | | | | |
| North Village Center | | North Myrtle Beach | | 1984 | | 60,356 | | 70.3% | | 6 | | 7 | | 24,806 | | Bi-Lo* | | 05/31/09 | | Dollar General | | 8.75 |
| | | | | | | | | | | | | | | | | | | | | | | |
| Windy Hill | | North Myrtle Beach | | 1968 / 1988 / 2006 | | 68,465 | | 96.5% | | 3 | | 2 | | | | | | | | Rose's Store / Family Dollar Store | | 6.15 |
| | | | | | | | | | | | | | | | | | | | | | | |
| Woodruff | | Greenville | | 1995 | | 68,055 | | 98.7% | | 9 | | 1 | | 47,955 | | Publix | | 08/06/15 | | | | 10.57 |
| | | | | | | | | | | | | | | | | | | | | | | |
| TOTAL SHOPPING CENTERS SOUTH CAROLINA (7) | | 566,083 | | 90.0% | | 66 | | 15 | | 206,696 | | | | | | | | $ 10.47 |
| | | | | | | | | | | | | | | | | | | | | | | |
| VIRGINIA (1) | | | | | | | | | | | | | | | | | | | | | | |
| | | | | | | | | | | | | | | | | | | | | | | |
| Smyth Valley Crossing | | Marion | | 1989 | | 126,841 | | 100.0% | | 14 | | - | | 32,000 | | Ingles | | 09/25/10 | | Wal-Mart | | $ 6.05 |
| | | | | | | | | | | | | | | | | | | | | | | |
| TOTAL SHOPPING CENTERS VIRGINIA (1) | | 126,841 | | 100.0% | | 14 | | - | | 32,000 | | | | | | | | $ 6.05 |
| | | | | | | | | | | | | | | | | | | | | | | |
| TOTAL CORE SHOPPING CENTER PORTFOLIO (146) | | 15,942,808 | | 91.5% | | 2,520 | | 512 | | 4,859,512 | | | | | | | | $ 11.93 |
| | | | | | | | | | | | | | | | | | | | | | | |
| OTHER PROPERTIES (6) | | | | | | | | | | | | | | | | | | | | | | |
| | | | | | | | | | | | | | | | | | | | | | | |
| 4101 South I-85 Industrial | | Charlotte, NC | | 1956 / 1963 | | 188,513 | | 38.0% | | 2 | | 7 | | | | | | | | | | |
| | | | | | | | | | | | | | | | | | | | | | | |
| Banco Popular Office Building | | Miami, FL | | 1971 | | 32,737 | | 88.8% | | 16 | | 3 | | | | | | | | | | |
| | | | | | | | | | | | | | | | | | | | | | | |
| Laurel Walk Apartments | | Charlotte, NC | | 1985 | | 106,480 | | 96.0% | | 95 | | 3 | | | | | | | | | | |
| | | | | | | | | | | | | | | | | | | | | | | |
| Mandarin Mini-Storage | | Jacksonville, FL | | 1982 | | 52,300 | | 72.0% | | 351 | | 193 | | | | | | | | | | |
| | | | | | | | | | | | | | | | | | | | | | | |
| Prosperity Office Building | | Palm Beach Gdns, FL | | 1972 | | 3,200 | | 0.0% | | - | | 1 | | | | | | | | | | |
| | | | | | | | | | | | | | | | | | | | | | | |
| Providence Square | | Charlotte, NC | | 1973 | | 85,930 | | 28.5% | | 10 | | 15 | | | | | | | | | | |
| | | | | | | | | | | | | | | | | | | | | | | |
| TOTAL OTHER PROPERTIES (6) | | 469,160 | | 56.0% | | 474 | | 222 | | | | | | | | | | |
| EQUITY ONE, INC. |
| PROPERTY STATUS REPORT |
| As of March 31, 2009 |
| | | | | Year | | Total | | | | Number | | Supermarket anchor | | Other | | Average |
| | | | | Built / | | Sq. Ft. | | Percent | | of tenants | | Owned | | | | Expiration | | anchor | | base rent |
Property | | City | | Renovated | | Owned | | Leased | | Leased | | Vacant | | sq. ft. | | Name | | Date | | tenants | | per leased SF |
| | | | | | | | | | | | | | | | | | | | | | | |
| DIM VASTGOED PROPERTIES (21) | | | | | | | | | | | | | | | | | | |
| | | | | | | | | | | | | | | | | | | | | | | |
| Eustis Village | | Eustis | | 2002 | | 156,927 | | 100.0% | | 20 | | - | | 44,271 | | Publix | | 10/31/22 | | Beall's Department Store | | $ 11.49 |
| | | | | | | | | | | | | | | | | | | | | | | |
| Glengary Shoppes | | Sarasota | | 1995 | | 99,182 | | 95.1% | | 6 | | 1 | | | | | | | | Best Buy / Barnes & Noble | | 17.69 |
| | | | | | | | | | | | | | | | | | | | | | | |
| Hammocks Town Center | | Miami | | 1987 / 1993 | | 172,810 | | 93.5% | | 39 | | 5 | | 39,795 | | Publix | | 06/24/12 | | Metro Dade Library / CVS Pharmacy / Porky's Gym | | 13.87 |
| | | | | | | | | | | | | | | | | | | | | | | |
| Magnolia Shoppes | | Fort Lauderdale | | 1998 | | 114,118 | | 89.7% | | 17 | | 6 | | | | | | | | Regal Cinemas / Deal$ | | 11.27 |
| | | | | | | | | | | | | | | | | | | | | | | |
| Sunrise Town Center | | Fort Lauderdale | | 1989 | | 128,124 | | 84.5% | | 13 | | 11 | | | | | | | | L.A. Fitness / Office Depot | | 11.00 |
| | | | | | | | | | | | | | | | | | | | | | | |
| Dublin Village | | Dublin | | 2005 | | 98,540 | | 97.4% | | 15 | | 2 | | 70,225 | | Kroger | | 08/03/25 | | | | 7.00 |
| | | | | | | | | | | | | | | | | | | | | | | |
| Freehome Village | | Canton | | 2003 | | 74,340 | | 82.9% | | 10 | | 7 | | 44,840 | | Publix | | 12/31/23 | | | | 14.39 |
| | | | | | | | | | | | | | | | | | | | | | | |
| Golden Park Village | | Buford | | 2000 | | 68,738 | | 91.9% | | 11 | | 2 | | 44,270 | | Publix | | 02/29/20 | | | | 11.93 |
| | | | | | | | | | | | | | | | | | | | | | | |
| Governors Town Square | | Acworth | | 2005 | | 68,658 | | 98.0% | | 13 | | 1 | | 44,840 | | Publix | | 02/28/25 | | | | 15.83 |
| | | | | | | | | | | | | | | | | | | | | | | |
| Grayson Village | | Loganville | | 2002 | | 83,154 | | 80.8% | | 13 | | 10 | | 44,271 | | Publix | | 01/31/22 | | | | 11.62 |
| | | | | | | | | | | | | | | | | | | | | | | |
| Keith Bridge Commons | | Atlanta | | 2002 | | 94,886 | | 91.2% | | 17 | | 4 | | 54,139 | | Kroger | | 08/10/22 | | | | 13.23 |
| | | | | | | | | | | | | | | | | | | | | | | |
| Loganville Town Center | | Loganville | | 1997 | | 77,661 | | 100.0% | | 15 | | - | | 51,420 | | Publix | | 08/01/17 | | | | 13.21 |
| | | | | | | | | | | | | | | | | | | | | | | |
| Salem Road Station | | Atlanta | | 2000 | | 67,270 | | 90.3% | | 12 | | 5 | | 44,270 | | Publix | | 09/30/20 | | | | 11.92 |
| | | | | | | | | | | | | | | | | | | | | | | |
| The Shops at Lake Tuscaloosa | | Tuscaloosa | | 2003 / 2005 | | 70,242 | | 87.0% | | 12 | | 4 | | 44,271 | | Publix | | 12/31/23 | | | | 13.14 |
| | | | | | | | | | | | | | | | | | | | | | | |
| The Vineyards at Chateau Elan | | Braselton | | 2002 | | 79,047 | | 97.4% | | 19 | | 1 | | 44,271 | | Publix | | 01/31/23 | | | | 14.37 |
| | | | | | | | | | | | | | | | | | | | | | | |
| Wilmington Island Shopping Center | | Wilmington Island | | 1985 / 1998 / 2003 | | 87,818 | | 77.5% | | 16 | | 7 | | 42,156 | | Kroger | | 09/16/18 | | | | 12.91 |
| | | | | | | | | | | | | | | | | | | | | | | |
| South Plaza Shopping Center | | St. Mary's County | | 2005 | | 92,335 | | 100.0% | | 9 | | - | | | | | | | | Ross Dress For Less / Best Buy / Old Navy / Petco | | 16.88 |
| | | | | | | | | | | | | | | | | | | | | | | |
| Brawley Commons | | Charlotte | | 1997 / 1998 | | 119,189 | | 79.7% | | 28 | | 12 | | 42,142 | | Lowe's Foods | | 04/30/17 | | Eckerd Drug | | 12.58 |
| | | | | | | | | | | | | | | | | | | | | | | |
| Carolina Pavilion | | Charlotte | | 1996 | | 731,703 | | 87.7% | | 23 | | 4 | | | | | | | | AMC Theatres / Value City Furniture / Old Navy / Ross Dress For Less / Sports Authority / Baby Superstore / Michaels Crafts / Sears Retail Outlet Store / DSW Shoe Warehouse / Cost Plus World Market / OfficeMax/Gregg Appliances / Petco / Dollar Tree / Dress Barn / Bed Bath & Beyond / Kohl's | | 11.43 |
| EQUITY ONE, INC. |
| PROPERTY STATUS REPORT |
| As of March 31, 2009 |
| | | | | Year | | Total | | | | Number | | Supermarket anchor | | Other | | Average |
| | | | | Built / | | Sq. Ft. | | Percent | | of tenants | | Owned | | | | Expiration | | anchor | | base rent |
| Property | | City | | Renovated | | Owned | | Leased | | Leased | | Vacant | | sq. ft. | | Name | | Date | | tenants | | per leased SF |
| | | | | | | | | | | | | | | | | | | | | | | |
| Whitaker Square | | Winston-Salem | | 1996 | | 82,760 | | 100.0% | | 12 | | - | | 51,890 | | Harris Teeter | | 02/28/16 | | Rugged Warehouse | | $ 12.25 |
| | | | | | | | | | | | | | | | | | | | | | | |
| Greensboro Village Shopping Center | | Gallatin | | 2005 | | 70,203 | | 98.0% | | 15 | | 1 | | 45,600 | | Publix | | 11/30/25 | | | | 14.14 |
| | | | | | | | | | | | | | | | | | | | | | | |
| TOTAL DIM VASTGOED PROPERTIES (21) | | 2,637,705 | | 90.6% | | 335 | | 83 | | 752,671 | | | | | | | | $ 12.54 |
| | | | | | | | | | | | | | | | | | | | | | | |
| TOTAL EXCLUDING DEVELOPMENTS, REDEVELOPMENTS & LAND (173) | | 19,049,673 | | 90.5% | | 3,329 | | 817 | | 5,612,183 | | | | | | | | |
| | | | | | | | | | | | | | | | | | | | | | | |
| DEVELOPMENTS, REDEVELOPMENTS & LAND (8) | | | | | | | | | | | | | | | | | | |
| | | | | | | | | | | | | | | | | | | | | | | |
| Developments (3) | | Various - See Schedule on Page 34. | | | | | | | | | | | | | | | | | | | | |
| | | | | | | | | | | | | | | | | | | | | | | |
| Redevelopments (1) | | Various - See Schedule on Page 34. | | | | | | | | | | | | | | | | | | | | |
| | | | | | | | | | | | | | | | | | | | | | | |
| Land Held for Development (4) | | Various | | | | | | | | | | | | | | | | | | | | |
| | | | | | | | | | | | | | | | | | | | | | | |
| TOTAL CONSOLIDATED - 181 Properties | | | | | | | | | | | | | | | | | | |
Total square footage does not include shadow anchor square footage that is not owned by Equity One.
| * | Indicates a tenant which continues to pay rent, but has closed its store and ceased operations. The subtenant, if any, is shown in ( ). |
| ** | Future contractual lease obligations included. |
| EQUITY ONE, INC. |
| REAL ESTATE ACQUISITIONS AND DISPOSITIONS |
| As of March 31, 2009 |
| (in thousands, except acreage) |
| |
| 2009 Disposition Activity | | | | | | | | | | | |
| Date Sold | | Property Name | | City | | State | | Square Feet / Acres | | | Gross Sales Price | | | Gain on Sale | |
| | | | | | | | | | | | | | | | |
| Real estate sale | | | | | | | | | | | | | | | |
| March 31, 2009 | | Waterstone - Pollo Tropical outparcel | | Homestead | | FL | | | 3,000 | | | $ | 788 | | | $ | 553 | |
| March 31, 2009 | | Winchester Plaza - McDonald's outparcel | | Huntsville | | AL | | | 2,844 | | | $ | 920 | | | $ | 625 | |
| | | | | | | | | | | | | | | | | | | |
| Total sold | | | | | | | | | | | | $ | 1,708 | | | $ | 1,178 | |
| EQUITY ONE, INC. |
| REAL ESTATE DEVELOPMENTS AND REDEVELOPMENTS |
| As of March 31, 2009 |
| (in thousands, except square footage data) |
| |
| Project | | Location | | Project GLA* | | | Total GLA** | | Anchors | | Target Stabilization Date | | | Estimated Gross Cost (1) | | | Estimated Net Cost (2) | | | Funded as of 03/31/09 | | | Balance to Complete (Gross Cost) | |
| Developments | | | | | | | | | | | | | | | | | | | | | | | | |
| Shops at Hampton Oaks | | Fairburn, GA (Atlanta) | | | 21,000 | | | | 21,000 | | CVS (not owned) | | 4Q09 | | | $ | 8,583 | | | $ | 4,920 | | | $ | 7,582 | | | $ | 1,001 | |
Sunlake (3) | | Tampa, FL | | | 123,889 | | | | 123,889 | | Publix | | 4Q10 | | | | 40,305 | | | | 30,328 | | | | 36,607 | | | | 3,698 | |
| River Green | | Canton, GA (Atlanta) | | | 59,997 | | | | 59,997 | | CVS (not owned) | | TBD | | | | 10,803 | | | | 8,811 | | | | 3,386 | | | | 7,417 | |
| Subtotal | | | | | 204,886 | | | | 204,886 | | | | | | | | $ | 59,691 | | | $ | 44,059 | | | $ | 47,575 | | | $ | 12,116 | |
| | | | | | | | | | | | | | | | | | | | | | | | | | | | | | | | |
| Redevelopments / Expansions / Outparcels | | | | | | | | | | | | | | | | | | | | | | | | | | | | | |
| Mandarin Landing | | Jacksonville, FL | | | 50,000 | | | | 139,620 | | Whole Foods | | 4Q09 | | | | 8,780 | | | | 8,780 | | | | 7,998 | | | | 782 | |
| Subtotal | | | | | 50,000 | | | | 139,620 | | | | | | | | $ | 8,780 | | | $ | 8,780 | | | $ | 7,998 | | | $ | 782 | |
| | | | | | | | | | | | | | | | | | | | | | | | | | | | | | | | |
| Total Development Activity | | | | | 254,886 | | | | 344,506 | | | | | | | | $ | 68,471 | | | $ | 52,839 | | | $ | 55,573 | | | $ | 12,898 | |
| | | | | | | | | | | | | | | | | | | | | | | | | | | | | | | | |
| | |
(1) Includes actual / allocated cost of land.
(2) After sales of outparcels and construction cost reimbursements.
(3) Being developed in a JV. Equity One funds all capital, on which it receives an 8% preferred return, and receives 60% of the project's residual cash flow.
| * | Project GLA is subject to change based upon changes related to build-to-suit requests and other tenant driven changes. |
| ** | Owned GLA (for redevelopments, includes portions of center not subject to redevelopment). |
| EQUITY ONE, INC. |
| CONSOLIDATED DEBT SUMMARY |
| As of March 31, 2009 |
| (in thousands) |
| Debt Instrument | | Maturity date | | Rate (1) | | | Mar 31, 2009 balance | | | Dec 31, 2008 balance | | | Percent of overall debt maturing | |
| | | | | | | | | | | | | | | |
| Mortgage debt - Equity One | | | | | | | | | | | | | | |
| Park Promenade | | 02/01/10 | | | 8.100% | | | | 5,910 | | | | 5,935 | | | | 0.5 | % |
| Jonathan's Landing | | 05/01/10 | | | 8.050% | | | | 2,694 | | | | 2,706 | | | | 0.2 | % |
| Bluff's Square | | 06/01/10 | | | 8.740% | | | | 9,556 | | | | 9,590 | | | | 0.8 | % |
| Kirkman Shoppes | | 06/01/10 | | | 8.740% | | | | 9,024 | | | | 9,056 | | | | 0.7 | % |
| Ross Plaza | | 06/01/10 | | | 8.740% | | | | 6,293 | | | | 6,316 | | | | 0.5 | % |
| Shoppes of Andros Isle | | 06/10/10 | | | 7.900% | | | | 6,041 | | | | 6,086 | | | | 0.5 | % |
| Boynton Plaza | | 07/01/10 | | | 8.030% | | | | 7,040 | | | | 7,069 | | | | 0.6 | % |
| Pointe Royale | | 07/15/10 | | | 7.950% | | | | 2,978 | | | | 3,068 | | | | 0.2 | % |
| Shops at Skylake | | 08/01/10 | | | 7.650% | | | | 12,375 | | | | 12,504 | | | | 1.0 | % |
| Parkwest Crossing | | 09/01/10 | | | 8.100% | | | | 4,449 | | | | 4,467 | | | | 0.4 | % |
| Spalding Village | | 09/01/10 | | | 8.190% | | | | 8,610 | | | | 8,722 | | | | 0.7 | % |
| Charlotte Square | | 02/01/11 | | | 9.190% | | | | 3,200 | | | | 3,224 | | | | 0.3 | % |
| Forest Village | | 04/01/11 | | | 7.270% | | | | 4,191 | | | | 4,209 | | | | 0.3 | % |
| Boca Village | | 05/01/11 | | | 7.200% | | | | 7,749 | | | | 7,782 | | | | 0.6 | % |
| MacLand Pointe | | 05/01/11 | | | 7.250% | | | | 5,475 | | | | 5,498 | | | | 0.4 | % |
| Pine Ridge Square | | 05/01/11 | | | 7.020% | | | | 6,849 | | | | 6,880 | | | | 0.6 | % |
| Sawgrass Promenade | | 05/01/11 | | | 7.200% | | | | 7,749 | | | | 7,782 | | | | 0.6 | % |
| Lake Mary Centre | | 11/01/11 | | | 7.250% | | | | 22,980 | | | | 23,074 | | | | 1.9 | % |
| Lake St. Charles | | 11/01/11 | | | 7.130% | | | | 3,623 | | | | 3,638 | | | | 0.3 | % |
| Belfair Towne Village | | 12/01/11 | | | 7.320% | | | | 10,174 | | | | 10,243 | | | | 0.8 | % |
| Marco Town Center | | 01/01/12 | | | 6.700% | | | | 7,791 | | | | 7,846 | | | | 0.6 | % |
| Riverside Square | | 03/01/12 | | | 9.190% | | | | 7,018 | | | | 7,058 | | | | 0.6 | % |
| Cashmere Corners | | 11/01/12 | | | 5.880% | | | | 4,628 | | | | 4,662 | | | | 0.4 | % |
| Eastwood | | 11/01/12 | | | 5.880% | | | | 5,515 | | | | 5,555 | | | | 0.4 | % |
| Meadows Shopping Center | | 11/01/12 | | | 5.870% | | | | 5,795 | | | | 5,837 | | | | 0.5 | % |
| Lutz Lake Crossing | | 01/01/13 | | | 6.280% | | | | 7,397 | | | | 7,420 | | | | 0.6 | % |
| Midpoint Center | | 07/10/13 | | | 5.770% | | | | 6,337 | | | | 6,381 | | | | 0.5 | % |
| Buckhead Station | | 09/01/13 | | | 6.880% | | | | 26,656 | | | | 26,806 | | | | 2.1 | % |
| Alafaya Village | | 11/11/13 | | | 5.990% | | | | 3,953 | | | | 3,970 | | | | 0.3 | % |
| Summerlin Square | | 02/01/14 | | | 6.750% | | | | 2,216 | | | | 2,311 | | | | 0.2 | % |
| South Point | | 07/10/14 | | | 5.720% | | | | 7,771 | | | | 7,821 | | | | 0.6 | % |
| Bird Ludlum | | 02/15/15 | | | 7.680% | | | | 6,526 | | | | 6,742 | | | | 0.5 | % |
| Treasure Coast Plaza | | 04/01/15 | | | 8.000% | | | | 3,104 | | | | 3,202 | | | | 0.3 | % |
| Shoppes of Silverlakes I | | 07/01/15 | | | 7.750% | | | | 1,820 | | | | 1,875 | | | | 0.1 | % |
| Grassland Crossing | | 12/01/16 | | | 7.870% | | | | 5,002 | | | | 5,058 | | | | 0.4 | % |
| EQUITY ONE, INC. |
| CONSOLIDATED DEBT SUMMARY |
| As of March 31, 2009 |
| (in thousands) |
| Debt Instrument | | Maturity date | | Rate (1) | | | Mar 31, 2009 balance | | | Dec 31, 2008 balance | | | Percent of overall debt maturing | |
| Mableton Crossing | | 08/15/18 | | | 6.850% | | | | 3,579 | | | | 3,611 | | | | 0.3 | % |
| Sheridan Plaza | | 10/10/18 | | | 6.250% | | | | 64,688 | | | | 64,876 | | | | 5.2 | % |
| BridgeMill | | 05/05/21 | | | 7.940% | | | | 8,550 | | | | 8,608 | | | | 0.7 | % |
| Westport Plaza | | 08/24/23 | | | 7.490% | | | | 4,425 | | | | 4,456 | | | | 0.4 | % |
| Chastain Square | | 02/28/24 | | | 6.500% | | | | 3,333 | | | | 3,365 | | | | 0.3 | % |
| Daniel Village | | 02/28/24 | | | 6.500% | | | | 3,643 | | | | 3,679 | | | | 0.3 | % |
| Douglas Commons | | 02/28/24 | | | 6.500% | | | | 4,341 | | | | 4,383 | | | | 0.3 | % |
| Fairview Oaks | | 02/28/24 | | | 6.500% | | | | 4,108 | | | | 4,148 | | | | 0.3 | % |
| Madison Centre | | 02/28/24 | | | 6.500% | | | | 3,333 | | | | 3,365 | | | | 0.3 | % |
| Paulding Commons | | 02/28/24 | | | 6.500% | | | | 5,658 | | | | 5,714 | | | | 0.5 | % |
| Siegen Village | | 02/28/24 | | | 6.500% | | | | 3,682 | | | | 3,718 | | | | 0.3 | % |
| Wesley Chapel Crossing | | 02/28/24 | | | 6.500% | | | | 2,907 | | | | 2,935 | | | | 0.2 | % |
| Webster Plaza | | 08/15/24 | | | 8.070% | | | | 7,785 | | | | 7,826 | | | | 0.6 | % |
| Total mortgage debt - Equity One (48 loans outstanding) | | | | | 6.94% | | | $ | 368,521 | | | $ | 371,077 | | | | 29.7 | % |
| Unamortized/unaccreted premium/(discount) | | (wtd-avg maturity) | | (wtd-avg interest rate) | | | | 6,018 | | | | 6,360 | | | | 0.5 | % |
| Total mortgage debt - Equity One (including unamortized/unaccreted premium/(discount)) | | | | | | | | $ | 374,539 | | | $ | 377,437 | | | | 30.2 | % |
| | | | | | | | | | | | | | | | | | | |
| Mortgage debt - DIM Vastgoed | | | | | | | | | | | | | | | | | | |
| Carolina Pavilion | | 09/30/09 | | | 7.730% | | | | 40,236 | | | | - | | | | 3.2 | % |
| Carolina Pavilion | | 09/30/09 | | | 8.020% | | | | 12,901 | | | | - | | | | 1.0 | % |
| Hammocks Town Center | | 06/26/12 | | | 6.950% | | | | 11,972 | | | | - | | | | 1.0 | % |
| Salem Road Station | | 10/31/12 | | | 6.000% | | | | 5,926 | | | | - | | | | 0.5 | % |
| Brawley Commons | | 07/01/13 | | | 6.250% | | | | 6,850 | | | | - | | | | 0.6 | % |
| Keith Bridge Commons | | 09/17/13 | | | 4.800% | | | | 8,890 | | | | - | | | | 0.7 | % |
| Sunrise Town Center | | 04/30/14 | | | 5.690% | | | | 10,449 | | | | - | | | | 0.8 | % |
| The Vineyards at Chateau Elan | | | | | 5.880% | | | | 9,953 | | | | - | | | | 0.8 | % |
| Grayson Village | | 12/14/14 | | | 5.210% | | | | 9,951 | | | | - | | | | 0.7 | % |
| Golden Park Village | | 12/22/14 | | | 5.250% | | | | 7,438 | | | | - | | | | 0.6 | % |
| The Shops at Lake Tuscaloosa | | 12/22/14 | | | 5.450% | | | | 7,230 | | | | - | | | | 0.6 | % |
| Eustis Village | | 05/10/15 | | | 5.450% | | | | 13,467 | | | | - | | | | 1.1 | % |
| Freehome Village | | 05/18/15 | | | 5.150% | | | | 10,018 | | | | - | | | | 0.8 | % |
| Governors Town Square | | 07/01/15 | | | 5.200% | | | | 10,542 | | | | - | | | | 0.8 | % |
| Loganville Town Center | | 07/28/15 | | | 4.890% | | | | 10,226 | | | | - | | | | 0.8 | % |
| Wilmington Island Shopping Center | | 08/29/15 | | | 5.050% | | | | 9,684 | | | | - | | | | 0.8 | % |
| South Plaza Shopping Center | | 12/08/15 | | | 5.420% | | | | 17,005 | | | | - | | | | 1.4 | % |
| Glengary Shoppes | | 03/30/16 | | | 5.750% | | | | 16,960 | | | | - | | | | 1.4 | % |
| EQUITY ONE, INC. |
| CONSOLIDATED DEBT SUMMARY |
| As of March 31, 2009 |
| (in thousands) |
| Debt Instrument | | Maturity date | | Rate (1) | | | Mar 31, 2009 balance | | | Dec 31, 2008 balance | | | Percent of overall debt maturing | |
| Magnolia Shoppes | | 05/18/16 | | 6.160% | | | | 14,610 | | | | - | | | | 1.2 | % |
| Dublin Village | | 12/11/16 | | 5.780% | | | | 6,800 | | | | - | | | | 0.5 | % |
| Greensboro Village Shopping Center | | 01/11/17 | | 5.520% | | | | 9,910 | | | | - | | | | 0.8 | % |
| Whitaker Square | | 11/21/17 | | 6.320% | | | | 9,749 | | | | - | | | | 0.8 | % |
| Total mortgage debt - DIM Vastgoed (22 loans outstanding) | | 4.87 years | | 6.21% | | | $ | 260,767 | | | $ | - | | | | 20.9 | % |
| Unamortized/unaccreted premium/(discount) | | (wtd-avg maturity) | | (wtd-avg interest rate) | | | | (30,311 | ) | | | - | | | | (2.4 | %) |
| Total mortgage debt - DIM Vastgoed (including unamortized/unaccreted premium/(discount)) | | | | | | | $ | 230,456 | | | $ | - | | | | 18.5 | % |
| | | | | | | | | | | | | | | | | | |
| Total mortgage debt - Consolidated (70 loans outstanding) | | 4.85 years | | 6.80% | | | $ | 629,288 | | | $ | 371,077 | | | | 50.6 | % |
| Unamortized/unaccreted premium/(discount) | | (wtd-avg maturity) | | (wtd-avg interest rate) | | | | (24,293 | ) | | | 6,360 | | | | (1.9 | %) |
| Total mortgage debt - Consolidated (including unamortized/unaccreted premium/(discount)) | | | | | | | $ | 604,995 | | | $ | 377,437 | | | | 48.7 | % |
| EQUITY ONE, INC. |
| CONSOLIDATED DEBT SUMMARY |
| As of March 31, 2009 |
| (in thousands) |
| Debt Instrument | | Maturity date | | Rate (1) | | | Mar 31, 2009 balance | | | Dec 31, 2008 balance | | | Percent of overall debt maturing | |
| | | | | | | | | | | | | | | |
| Unsecured senior notes payable | | | | | | | | | | | | | | |
3.875% senior notes (3) | | 04/15/09 | | | 3.875% | | | $ | 171,630 | | | $ | 176,185 | | | | 13.8 | % |
| Fair value of $100MM fixed-to-floating interest rate swap | | 04/15/09 | | 6-month Libor + 0.4375% | | | | 926 | | | | 949 | | | | 0.1 | % |
| 7.84% senior notes | | 01/23/12 | | | 7.840% | | | | 10,000 | | | | 10,000 | | | | 0.8 | % |
| 5.375% senior notes | | 10/15/15 | | | 5.375% | | | | 111,570 | | | | 117,000 | | | | 9.0 | % |
| 6.00% senior notes | | 09/15/16 | | | 6.000% | | | | 106,500 | | | | 106,500 | | | | 8.5 | % |
| 6.25% senior notes | | 01/15/17 | | | 6.250% | | | | 104,130 | | | | 115,000 | | | | 8.5 | % |
| 6.00% senior notes | | 09/15/17 | | | 6.000% | | | | 122,674 | | | | 132,279 | | | | 9.9 | % |
| | | | | | | | | | | | | | | | | | | |
| Total unsecured senior notes payable | | 5.57 years | | | 5.35% | | | $ | 627,430 | | | $ | 657,913 | | | | 50.6 | % |
| Unamortized/unaccreted premium/(discount) | | (wtd-avg maturity) | | (wtd-avg interest rate) | | | | (1,047 | ) | | | (1,135 | ) | | | (0.1 | %) |
| Total unsecured senior notes payable (including unamortized/unaccreted premium/(discount)) | | | $ | 626,384 | | | $ | 656,778 | | | | 50.5 | % |
| | | | | | | | | | | | | | | | | | | |
| Revolving credit facilities | | | | | | | | | | | | | | | | | | |
| $227MM Wells Fargo Unsecured | | 10/17/11 | | | 3.250% | | | $ | 10,000 | | | $ | 35,500 | | | | 0.8 | % |
| $15MM City National Bank Unsecured | | 10/11/09 | | | N/A | | | | - | | | | - | | | | 0.0 | % |
| Total revolving credit facilities | | | | | | | | $ | 10,000 | | | $ | 35,500 | | | | 0.8 | % |
| | | | | | | | | | | | | | | | | | | |
| Total debt | | | | | | | | $ | 1,266,719 | | | $ | 1,064,490 | | | | 102.0 | % |
| Unamortized/unaccreted premium/(discount) | | | | | | | | | (25,340 | ) | | | 5,225 | | | | (2.0 | %) |
| Total debt (including net interest premium/discount) | | | | | | | | $ | 1,241,379 | | | $ | 1,069,715 | | | | 100.0 | % |
| | | | | | | | | | | | | | | | | | | |
| Senior Unsecured Debt Ratings | | | | | | | | | | | | | | | | | | |
| Moody's | | | | | | | | Baa3 (Stable) | | | | | | | | | |
| S&P | | | | | | | | BBB- (Stable) | | | | | | | | | |
Note: Total debt is gross over net due to $23m of unamortized/unaccreted discount.
| | (1) | The rate in effect on March 31, 2009. |
| | (3) | $100,000 of the outstanding balance has been swapped to a floating interest rate based on a six month LIBOR in arrears, plus 0.4375%. The indicated rate and the weighted rate for the unsecured notes reflects the effect of the interest rate swap. |
| EQUITY ONE, INC. |
| UNCONSOLIDATED BALANCE SHEET - GRI-EQY I, LLC |
| As of March 31, 2009 |
| |
| | | As of | |
| | | March 31, 2009 | |
| Assets | | (in thousands) | |
| Properties | | | |
| Income producing | | | 252,664 | |
| Less: accumulated depreciation | | | (3,710 | ) |
| Rental property | | $ | 248,954 | |
| | | | | |
| Cash and cash equivalents | | | 1,823 | |
| Accounts and other receivables, net | | | 3,124 | |
| Other assets | | | 19,807 | |
| | | | | |
| Total | | $ | 273,708 | |
| | | | | |
| | | | | |
| Liabilities and joint ventures' equity | | | | |
| Liabilities | | | | |
| Mortgage notes payable | | | 131,956 | |
| Accounts payable and other liabilities | | | 43,437 | |
| Total liabilities | | $ | 175,393 | |
| | | | | |
| Joint venture equity | | | 98,315 | |
| | | | | |
| Total | | $ | 273,708 | |
Note: Eight properties were contributed to GRI-EQY I, LLC during second quarter of 2008 and two properties were contributed during fourth quarter of 2008, accordingly there is no activity prior to 2Q 2008. Equity One has a 10% interest in the joint venture.
| EQUITY ONE, INC. |
| UNCONSOLIDATED STATEMENT OF OPERATIONS - GRI-EQY I, LLC |
| As of March 31, 2009 |
| |
| | | Three months ended | |
| | | March 31, 2009 | | | March 31, 2008 | |
| | | (in thousands) | | | (in thousands) | |
| | | | | | | |
| REVENUES | | $ | 6,955 | | | $ | - | |
| | | | | | | | | |
| COSTS AND EXPENSES | | | | | | | | |
| Property operating | | | 1,979 | | | | - | |
| Rental property depreciation and amortization | | | 1,957 | | | | - | |
| Interest expense | | | 2,057 | | | | - | |
| Total costs and expenses | | $ | 5,993 | | | $ | - | |
| | | | | | | | | |
| NET INCOME | | $ | 962 | | | $ | - | |
Note: Eight properties were contributed to GRI-EQY I, LLC during second quarter of 2008 and two properties were contributed during fourth quarter of 2008, accordingly there is no activity prior to 2Q 2008. Equity One has a 10% interest in the joint venture.
| EQUITY ONE, INC. |
| UNCONSOLIDATED PROPERTY STATUS REPORT - GRI-EQY I, LLC |
| As of March 31, 2009 |
| | | | | Year | | | | | | Number | | Supermarket anchor | | Other | | Average |
| | | | | Built / | | Total | | Percent | | of tenant | | | | | | Expiration | | anchor | | base rent |
Property | | City | | Renovated | | Sq. Ft. | | Leased | | Leased | | Vacant | | sq. ft. | | Name | | Date | | tenants | | per leased SF |
| Airpark Plaza Shopping Center | | Miami | | 1971 / 1998 / 2004 / 2008 | | 172,095 | | 99.3% | | 36 | | 1 | | 30,000 | | Publix | | 10/31/24 | | Home Depot Expo / Office Depot | | $ 14.73 |
| | | | | | | | | | | | | | | | | | | | | | | |
| Concord Shopping Plaza | | Miami | | 1962 / 1992 / 1993 | | 298,397 | | 99.3% | | 23 | | 1 | | 78,000 | | Winn-Dixie | | 09/30/09 | | Home Depot / Big Lots / Dollar Tree | | 10.62 |
| | | | | | | | | | | | | | | | | | | | | | | |
| Presidential Markets | | Snellville | | 1993 / 2000 | | 396,408 | | 96.0% | | 32 | | 5 | | 56,146 | | Publix | | 12/31/19 | | Marshall's / TJ Maxx / Bed Bath & Beyond / Carmike Cinemas / Ross Dress For Less / Office Depot / Shoe Carnival / Grand Harbor Import Co. / Borders | | 11.40 |
| | | | | | | | | | | | | | | | | | | | | | | |
| Shoppes of Ibis | | West Palm Beach | | 1999 | | 79,420 | | 92.9% | | 14 | | 4 | | 51,420 | | Publix | | 05/31/19 | | | | 12.97 |
| | | | | | | | | | | | | | | | | | | | | | | |
| Shoppes at Quail Roost | | Miami | | 2005 | | 73,550 | | 96.8% | | 18 | | 2 | | 44,840 | | Publix | | 06/30/25 | | | | 15.72 |
| | | | | | | | | | | | | | | | | | | | | | | |
| Shoppes of Sunset | | Miami | | 1979 | | 21,704 | | 88.7% | | 14 | | 3 | | | | | | | | | | 18.88 |
| | | | | | | | | | | | | | | | | | | | | | | |
| Shoppes of Sunset II | | Miami | | 1980 | | 27,754 | | 64.5% | | 10 | | 7 | | | | | | | | | | 19.87 |
| | | | | | | | | | | | | | | | | | | | | | | |
| Sparkleberry Square | | Columbia | | 1997 / 2004 | | 154,217 | | 78.5% | | 10 | | 1 | | | | | | | | PETsMART / Bed Bath and Beyond / Pier 1 Imports / Ross Dress for Less | | 12.49 |
| | | | | | | | | | | | | | | | | | | | | | | |
| Sparkleberry Kohl's | | Columbia | | 1997 / 2004 | | 85,961 | | 100.0% | | 1 | | - | | | | | | | | Kohl's | | 7.74 |
| | | | | | | | | | | | | | | | | | | | | | | |
| Sparkleberry Kroger | | Columbia | | 1997 / 2004 | | 98,623 | | 98.4% | | 13 | | 1 | | 67,943 | | Kroger | | 08/31/17 | | | | 13.28 |
| | | | | | | | | | | | | | | | | | | | | | | |
| TOTAL GRI-EQY I, LLC SHOPPING CENTER PORTFOLIO (10) | | 1,408,129 | | 94.7% | | 171 | | 25 | | 328,349 | | | | | | | | $ 12.19 |
| | | | | | | | | | | | | | | | | | | | | | | |
| | | | | | | | | | | | | | | | | | | | | | | |
| Equity One has a 10% interest in the joint venture. |
| EQUITY ONE, INC. |
| UNCONSOLIDATED DEBT SUMMARY - GRI-EQY I, LLC |
| As of March 31, 2009 |
| (in thousands) |
| | | | | | | | | | | | | | | | |
| | | Equity One's | | | Maturity | | | | | | Mar 31, 2009 | | | Dec 31, 2008 | |
| Debt Instrument | | Ownership | | | date | | | Rate (1) | | | balance | | | balance | |
| | | | | | | | | | | | | | | | |
| Mortgage debt | | | | | | | | | | | | | | | |
Floating rate loan (2) | | | 10 | % | | 07/01/13 | | | LIBOR + 1.95% | | | $ | 120,000 | | | $ | 120,000 | |
| Sparkleberry Square (Kohl's) | | | 10 | % | | 11/30/12 | | | 6.170% | | | | 6,045 | | | | 6,087 | |
| Sparkleberry Square (Kroger) | | | 10 | % | | 06/30/20 | | | 6.750% | | | | 6,491 | | | | 6,587 | |
| | | | | | | | | | | | | | | | | | | |
| Total mortgage debt (3 loans outstanding) | | | | | | 4.33 | | | 5.866% | | | $ | 132,536 | | | $ | 132,674 | |
| | | | | | | (wtd-avg maturity) | | | (Net effective int rate) | | | | | | | | | |
| Net interest premium/(discount) | | | | | | | | | | | | | $ | (580 | ) | | $ | (593 | ) |
| | | | | | | | | | | | | | | | | | | | |
| Total mortgage debt (including net interest premium/discount) | | | | | | | | | | $ | 131,956 | | | $ | 132,081 | |
| | | | | | | | | | | | | | | | | | | | |
| Interest Rate Swap | | | | | | | | | | | | | | | | | | | |
| | | | | | | | | | | | | | | | | | | | |
| Fair value of $120MM floating-to-fixed interest rate swap | | | 10 | % | | 06/01/13 | | | 3.685% | | | $ | 11,917 | | | $ | 11,531 | |
| | | | | | | | | | | | | | | | | | | | |
| Total debt (including net interest premium/discount) | | | | | | | | | | | | | $ | 143,873 | | | $ | 143,612 | |
| | | | | | | | | | | | | | | | | | | | |
| Equity One's pro-rata share of unconsolidated debt | | | 10 | % | | | | | | | | | $ | 14,387 | | | $ | 14,361 | |
(1) The rate in effect on March 31, 2009.
(2) Mortgage encumbers GRI-EQY (Airpark Plaza) LLC, GRI-EQY (Concord) LLC, GRI-EQY (IBIS) LLC, GRI-EQY (Presidential Markets) LLC, GRI-EQY (Quail Roost) LLC and GRI-EQY (Sparkleberry Square) LLC. The full balance has been swapped to a fixed rate of 3.685%
| EQUITY ONE, INC. |
| UNCONSOLIDATED BALANCE SHEET - G&I VI SOUTH FLORIDA PORTFOLIO SPE LLC |
| As of March 31, 2009 |
| |
| | | As of | |
| | | March 31, 2009 | |
| Assets | | (in thousands) | |
| Properties | | | |
| Income producing | | | 50,805 | |
| Less: accumulated depreciation | | | (608 | ) |
| Rental property | | $ | 50,197 | |
| | | | | |
| Cash and cash equivalents | | | 143 | |
| Accounts and other receivables, net | | | (64 | ) |
| Other assets | | | 6,574 | |
| | | | | |
| Total | | $ | 56,850 | |
| | | | | |
| | | | | |
| Liabilities and joint ventures' equity | | | | |
| Liabilities | | | | |
| Mortgage notes payable | | | 37,589 | |
| Accounts payable and other liabilities | | | 5,078 | |
| Total liabilities | | $ | 42,667 | |
| | | | | |
| Joint venture equity | | | 14,183 | |
| | | | | |
| Total | | $ | 56,850 | |
Note: Properties were purchased during third quarter of 2008, accordingly there is no activity prior to 3Q 2008. Equity One has a 20% interest in the joint venture.
| EQUITY ONE, INC. |
| UNCONSOLIDATED STATEMENT OF OPERATIONS - G&I VI SOUTH FLORIDA PORTFOLIO SPE LLC |
| As of March 31, 2009 |
| |
| |
| | | Three months ended | |
| | | March 31, 2009 | | | March 31, 2008 | |
| | | (in thousands) | | | (in thousands) | |
| | | | | | | |
| REVENUES | | $ | 1,641 | | | $ | - | |
| | | | | | | | | |
| COSTS AND EXPENSES | | | | | | | | |
| Property operating | | | 713 | | | | - | |
| Rental property depreciation and amortization | | | 827 | | | | - | |
| Interest expense | | | 615 | | | | - | |
| Total costs and expenses | | $ | 2,155 | | | $ | - | |
| | | | | | | | | |
| NET (LOSS) INCOME | | $ | (514 | ) | | $ | - | |
Note: Properties were purchased during third quarter of 2008, accordingly there is no activity prior to 3Q 2008. Equity One has a 20% interest in the joint venture.
| EQUITY ONE, INC. |
| UNCONSOLIDATED PROPERTY STATUS REPORT - G&I VI SOUTH FLORIDA PORTFOLIO SPE LLC |
| As of March 31, 2009 |
| | | | | Year | | | | | | Number | | Supermarket anchor | | Other | | Average |
| | | | | Built / | | Total | | Percent | | of tenant | | | | | | Expiration | | anchor | | base rent |
Property | | City | | Renovated | | Sq. Ft. | | Leased | | Leased | | Vacant | | sq. ft. | | Name | | Date | | tenants | | per leased SF |
| 1900/2000 Offices | | Boca Raton | | 1979 / 1982 / 1986 / 2007 | | 116,777 | | 42.7% | | 15 | | 11 | | | | | | | | RN Network / Corporate Executive Suites | | $18.28 |
| | | | | | | | | | | | | | | | | | | | | | | |
| Penn Dutch Plaza | | Margate | | 1989 | | 155,628 | | 75.7% | | 20 | | 21 | | 70,358 | | Penn Dutch Food Center | | 12/31/13 | | Walgreens | | 9.11 |
| | | | | | | | | | | | | | | | | | | | | | | |
| Plantation Marketplace | | Plantation | | 1963 / 1998 | | 230,330 | | 69.1% | | 27 | | 12 | | 43,386 | | Winn-Dixie | | 11/05/09 | | Beall's / Just Fit / Big Lots / CVS | | 10.45 |
| | | | | | | | | | | | | | | | | | | | | | | |
| TOTAL G&I VI South Florida Portfolio SPE LLC SHOPPING CENTER PORTFOLIO (3) | | 502,735 | | 65.0% | | 62 | | 44 | | 113,744 | | | | | | | | $ 11.16 |
Equity One has a 20% interest in the joint venture.
| EQUITY ONE, INC. |
| UNCONSOLIDATED DEBT SUMMARY - G&I VI South Florida Portfolio SPE LLC |
| As of March 31, 2009 |
| (in thousands) |
| | | | | | | | | | | | | | | | |
| | | Equity One's | | | Maturity | | | | | | Mar 31, 2009 | | | Dec 31, 2008 | |
| Debt Instrument | | Ownership | | | date | | | Rate (1) | | | balance | | | balance | |
| | | | | | | | | | | | | | | | |
| Mortgage debt | | | | | | | | | | | | | | | |
| Fixed rate loan | | | 20 | % | | 11/11/14 | | | 5.5605 | | | $ | 38,492 | | | $ | 38,657 | |
| Net interest premium/(discount) | | | - | | | - | | | - | | | | (903 | ) | | | (938 | ) |
| | | | | | | | | | | | | | | | | | | | | |
| Total mortgage debt | | | | | | 5.45 | | | 5.560% | | | $ | 37,589 | | | $ | 37,719 | |
| | | | | | | (wtd-avg maturity) | | | (Net effective int rate) | | | | | | | | | |
| Equity One's pro-rata share of unconsolidated debt | | | | | | | | | | | | | | $ | 7,518 | | | $ | 7,544 | |
(1) The rate in effect on March 31, 2009.