(1) Excludes EQY developments/redevelopments non-retail properties, land held, EQY joint ventures and DIM Vastgoed properties. 2008 NOI is Cash NOI and includes management fee expense.
(2) Data is for a 3-mile radius applicable to our respective properties based on the weighted average AMR. Demographic data is as of December 31, 2007.
(3) Figures calculated based on average per square foot sales, using last available year of sales and rent figures as of December 31, 2008. Major grocers include Publix, Kroger, Winn-Dixie, Supervalu, Albertsons, Food Lion, and Bi-Lo.
(4) DIM’s reported occupancy as of March 31, 2009 was 90.6%.
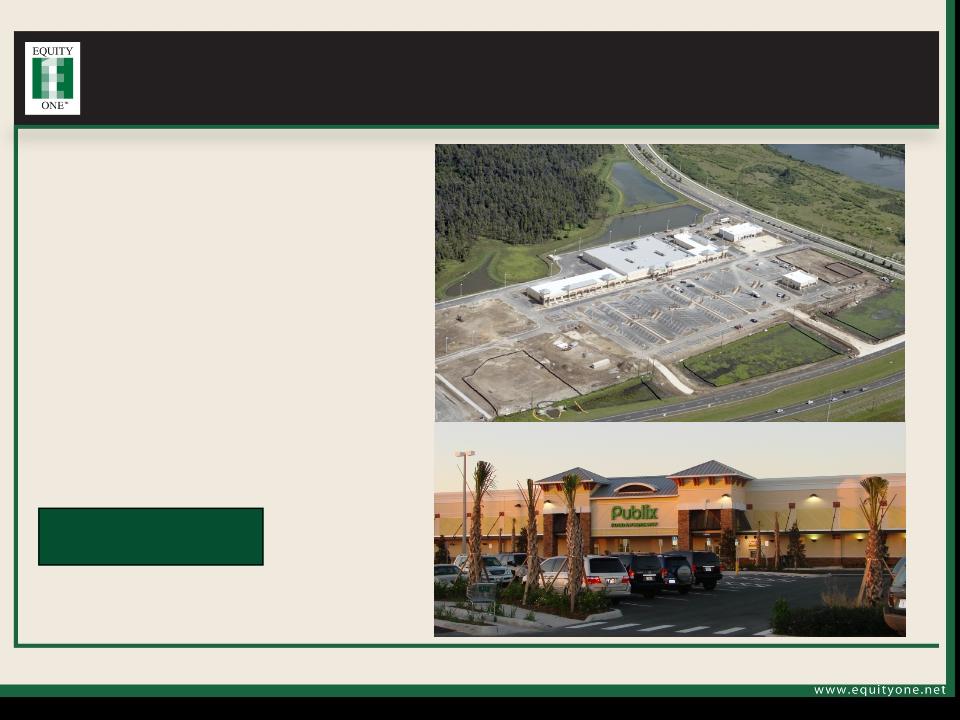
We have well-located and productive properties, with
limited exposure to troubled big-box retailers.
2
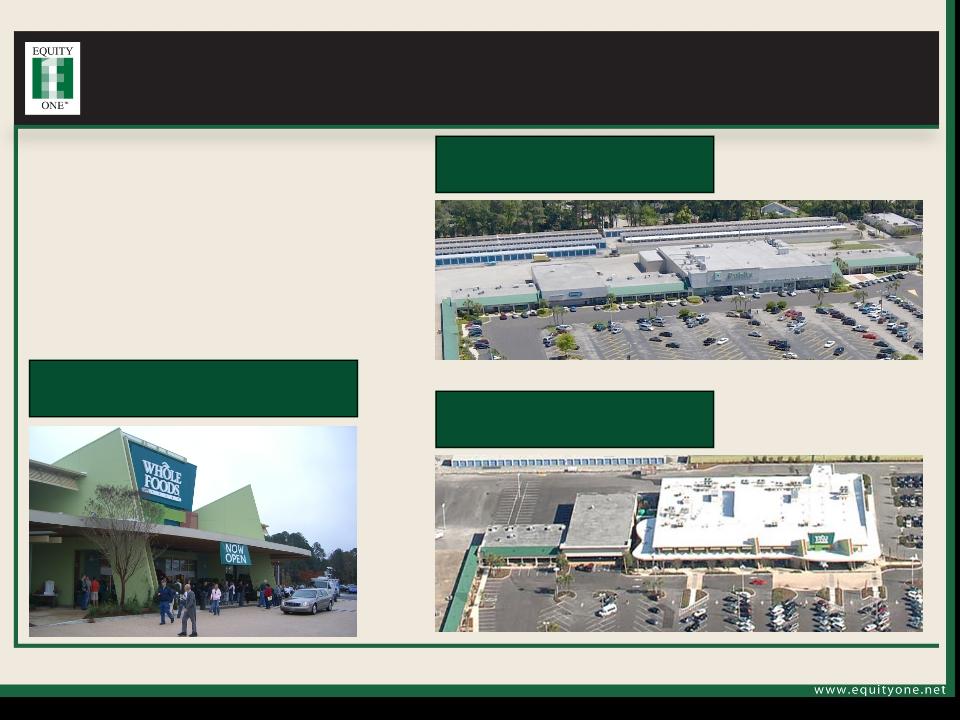
• We are an owner and operator of grocer-anchored neighborhood shopping centers. As of
December 31, 2008, 79% of our NOI was derived from core properties that have a grocery store,
one of the highest ratios in our sector. (1)
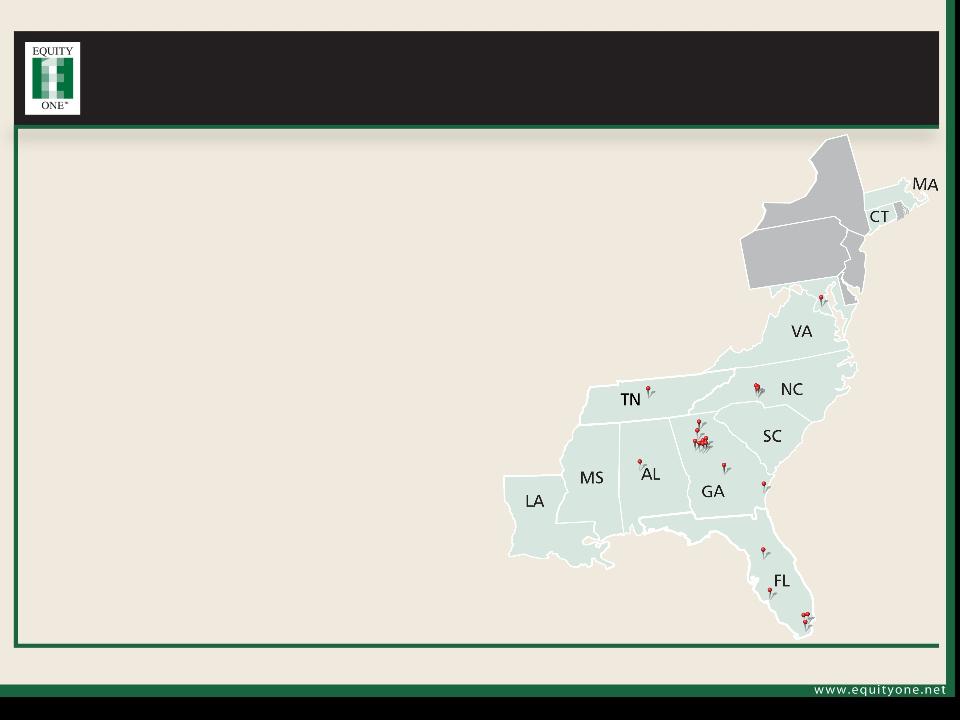
• Our core properties are primarily found in in-fill markets with healthy trade area demographics(2):
– Average population: 79,262
– Average household income: $71,721
• Our grocers are productive and have below market rents:
– Our average major grocer generates sales of approximately $500/sf while paying an
average rent of less than $10/sf.(3)
– Our Publix stores generated sales of $584/sf in 2008.(3)
– Our Kroger stores generated sales of $398/sf in 2008.(3)
– Our Supervalu stores generated sales of $389/sf in 2008.(3)
• We have limited exposure to troubled big-box retailers.
• Occupancy as of March 31, 2009 was 91.5%, down 60bps as compared to 4Q08 and 3Q08. (4)