Exhibit 99.1
Investor Presentation
August 2009
Equity One is a safe harbor in the storm.
1
1. Well-located, high quality, and productive grocery-anchored shopping centers
2. A healthy financial structure including a strong balance sheet, modest leverage
and ample liquidity
and ample liquidity
3. A team who has proven to be disciplined allocators of capital
4. A portfolio with limited development commitments with anchors in place
5. A management team focused on building a long-term track record of relative
outperformance and operational excellence.
An investment in Equity One is an investment in:
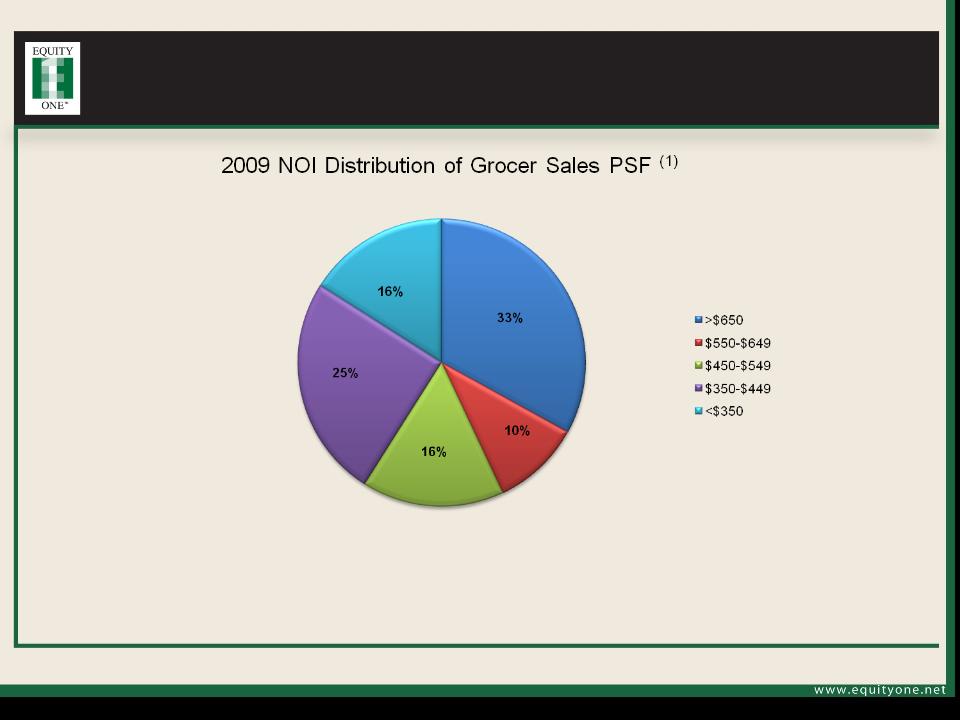
(1) Excludes EQY developments/redevelopments non-retail properties, land held, EQY joint ventures and DIM Vastgoed properties. NOI is Cash NOI and includes management fee expense.
(2) Figures calculated based on average per square foot sales, using last available year of sales and rent figures as of December 31, 2008. Major grocers include Publix, Kroger, Winn-Dixie, Supervalu, Albertsons, and Food Lion.
(3) Occupancy for EQY core portfolio excluding DIM. DIM’s reported occupancy as of June 30, 2009 was 91.9% as compared to 90.6% on March 31, 2009.
Our portfolio is focused on necessity-based consumer
spending.
spending.
2
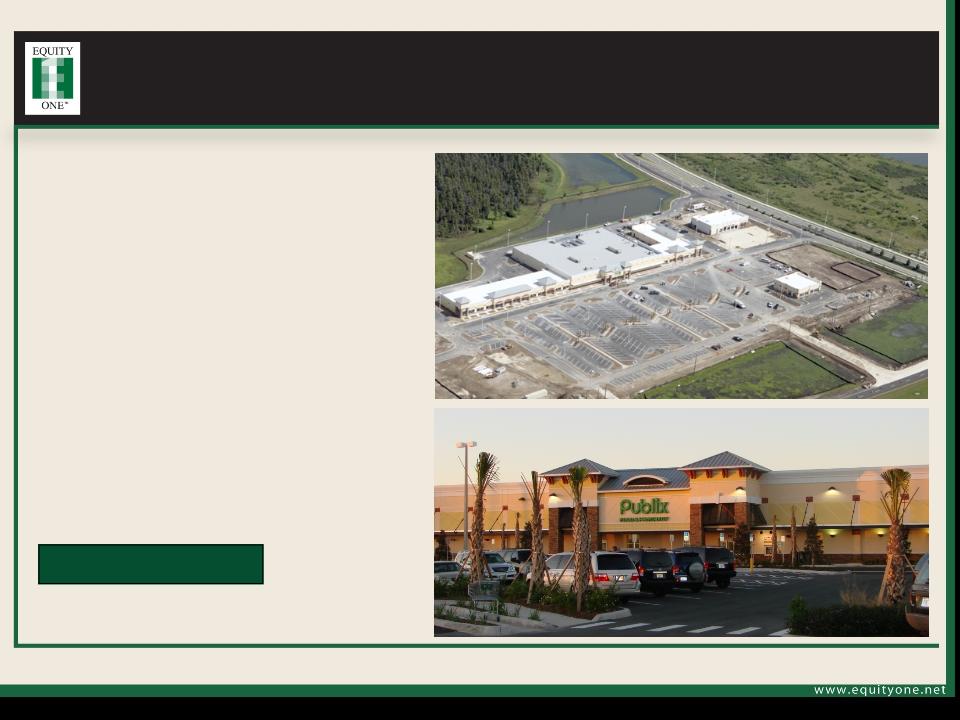
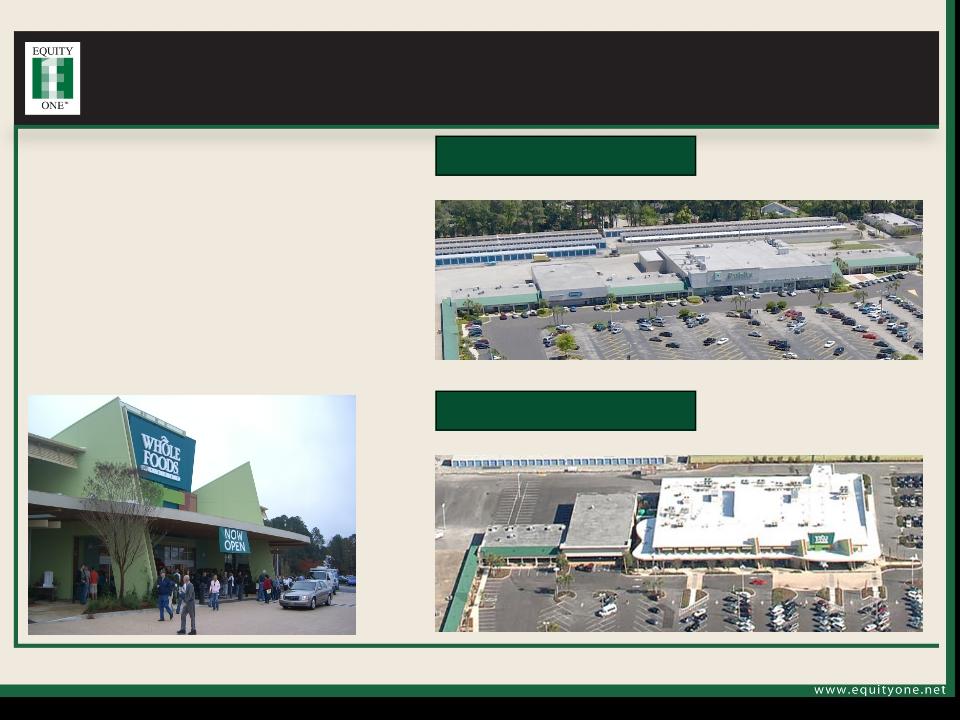
• We are an owner and operator of grocer-anchored neighborhood shopping centers. As of June 30, 2009, 82% of our
NOI was derived from core properties that have a grocery store or drug store, one of the highest ratios in our sector. (1)
• Our grocers are productive and have below market rents:
– Our average major grocer generates sales of approximately $500/sf while paying an average rent of less than
$10/sf.(2)
$10/sf.(2)
– Our Publix stores generated sales of $584/sf in 2008.(2)
– Our Kroger stores generated sales of $398/sf in 2008.(2)
– Our Supervalu stores generated sales of $389/sf in 2008.(2)
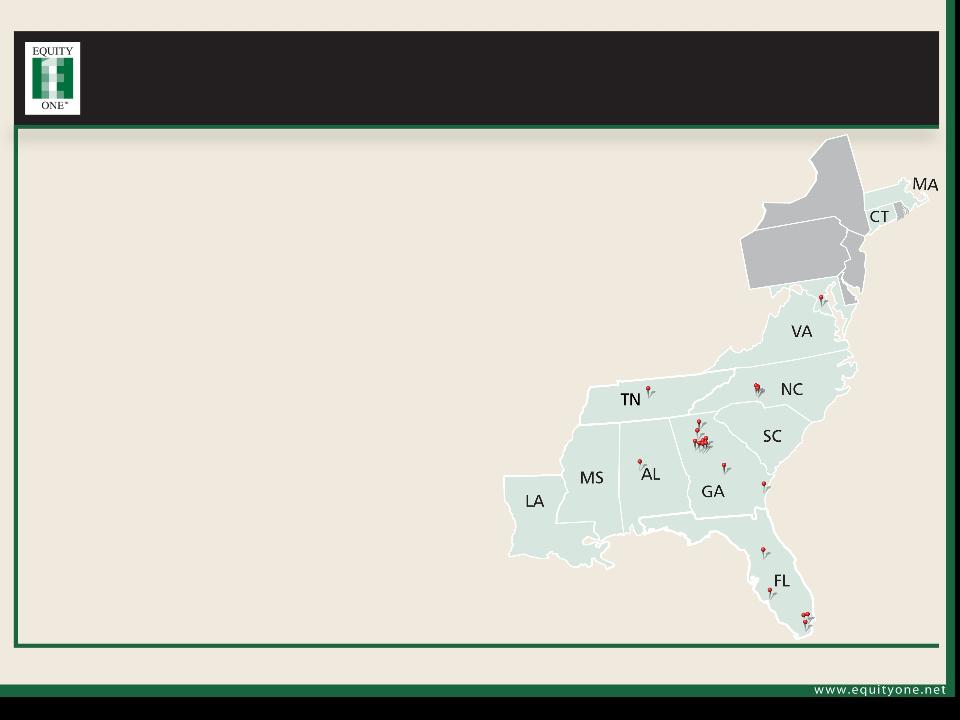
• Our properties are primarily found in in-fill markets with healthy trade area demographics(1):
– Average population: 79,262
– Average household income: $71,721
• Our properties are well-located in mature trade areas. The average age of our core portfolio is nearly 23 years old and
we only own five centers that have been built in the last five years, representing less than 2% of our total annualized
base rent.
we only own five centers that have been built in the last five years, representing less than 2% of our total annualized
base rent.
• Percentage rent accounts for less than 1% of our rental income.
• Occupancy as of June 30, 2009 was 90.7% compared to 91.5% as of March 31, 2009. (3)
The quality of our portfolio is reflected in the NOI we
derive from highly productive grocer anchors.
3
(1) Excludes EQY developments/redevelopments, non-retail properties, land held, EQY joint ventures and DIM Vastgoed properties. Excludes centers that do not have grocers or those where
grocers do not report sales. Based on Cash NOI through June 30, 2009 and includes management fee expense. Sales figures as of December 31, 2008.
Strong grocer sales are a critical data point supporting leasing
efforts and the overall valuation of our centers.
Tenant Concentration as of June 30, 2009(1)
4
(1)Excludes EQY developments, non-retail properties, EQY joint ventures and DIM Vastgoed properties.
Tenant | Units | Square Feet | % of Total Sq Ft | AMR | % of AMR | Avg AMR PSF | |
Top twenty tenants | |||||||
Publix | 52 | 2,303,366 | 14.5% | $ 18,097,419 | 10.6% | $ 7.86 | |
Supervalu | 7 | 458,273 | 2.9% | 8,302,236 | 4.9% | 18.12 | |
Kroger | 12 | 679,082 | 4.2% | 5,379,703 | 3.1% | 7.92 | |
Bed, Bath & Beyond | 8 | 261,332 | 1.6% | 3,079,214 | 1.8% | 11.78 | |
Winn Dixie | 9 | 398,128 | 2.5% | 2,892,815 | 1.7% | 7.27 | |
LA Fitness | 3 | 144,307 | 0.9% | 2,609,347 | 1.5% | 18.08 | |
CVS Pharmacy | 13 | 143,460 | 0.9% | 2,315,237 | 1.4% | 16.14 | |
TJ Maxx | 8 | 248,658 | 1.6% | 2,253,890 | 1.3% | 9.06 | |
Office Depot | 7 | 179,837 | 1.1% | 2,062,123 | 1.2% | 11.47 | |
Kmart | 5 | 439,558 | 2.8% | 1,939,705 | 1.1% | 4.41 | |
Blockbuster | 19 | 96,847 | 0.6% | 1,915,971 | 1.1% | 19.78 | |
Food Lion | 6 | 241,934 | 1.5% | 1,850,161 | 1.1% | 7.65 | |
Dollar Tree | 17 | 184,420 | 1.1% | 1,316,132 | 0.8% | 7.14 | |
Stein Mart | 4 | 158,472 | 1.0% | 1,207,286 | 0.7% | 7.62 | |
Bi-Lo | 3 | 124,210 | 0.8% | 1,173,583 | 0.7% | 9.45 | |
H&R Block | 30 | 48,764 | 0.3% | 1,032,105 | 0.6% | 21.17 | |
Walgreens | 4 | 64,868 | 0.4% | 992,746 | 0.6% | 15.30 | |
Albertsons | 3 | 175,470 | 1.1% | 991,390 | 0.6% | 5.65 | |
Big Lots | 5 | 169,741 | 1.1% | 978,213 | 0.6% | 5.76 | |
Memorial Healthcare | 1 | 61,000 | 0.4% | 944,352 | 0.5% | 15.48 | |
Sub-total top twenty tenants | 216 | 6,581,727 | 41.3% | $ 61,333,628 | 35.9% | $ 9.32 | |
Remaining tenants | 2,255 | 7,869,100 | 49.4% | 109,303,643 | 64.1% | 13.89 | |
Sub-total all tenants | 2,471 | 14,450,827 | 90.7% | $ 170,637,271 | 100.0% | $ 11.97 | |
Vacant | 562 | 1,478,760 | 9.3% | NA | NA | NA | |
Total including vacant | 3,033 | 15,929,587 | 100.0% | $ 170,637,271 | 100.0% | NA |
We maintain a healthy balance sheet with modest
leverage, ample liquidity, and investment-grade metrics.
5
• Key leverage ratios:
• Net debt to total market cap as of June 30, 2009 (1): 49%
• Net debt as a % of FMV of assets as of June 30, 2009 (1) (3): 40%
• Net Debt to EBITDA coverage of 6.7X as of June 30, 2009 (1)(4).
• EBITDA to interest expense coverage of 2.5X as of June 30, 2009. (1)
• Investment grade credit ratings (Baa3/BBB-) with stable outlooks from both Moody’s
and S&P.
and S&P.
• Key liquidity measures:
• As of June 30, 2009, we had approximately $244.3M of available liquidity in cash,
marketable securities, and our line of credit. (1)
• As of June 30, 2009, we had $192.7M of debt maturing through 2011.(1) (2)
(1) Includes DIM Vastgoed properties.
(2) Does not include scheduled principal amortization. All maturities pertain to secured debt.
(3) Based on net debt and estimated investment property asset FMV as of June 30, 2009.
(4) Based on net debt as of June 30, 2009 and EBITDA (excluding debt extinsuishment and outparcel gains) calculated by annualizing second quarter numbers as reported in the June 30, 2009 supplement filing.
6
(1) Does not include scheduled principal amortization and excludes $40M of outstanding borrowings on line of credit which can be extended until 2012. All maturities pertain to secured
debt. Interest rates shown above represent weighted average interest rates. Amounts shown include DIM Vastgoed properties.
We are disciplined allocators of capital
7
• Strong balance sheets are not coincidental! Since April 2006, we have:
– Sold over $700M of assets on favorable terms (more than 30% of current asset base)
– Formed over $275M in joint venture partnerships with CalPERS and DRA Advisors
– Completed 2 equity offerings totaling $181M (3Q08 and 2Q09)
– Raised $340M in long-term debt at an average rate of 6.1%
– Recast our $227M line of credit which does not mature until Oct 2011, with a one year
option to extend.
option to extend.
• Recent Transactions:
– Acquired majority control of DIM Vastgoed in 1Q09 in a stock-for-stock transaction.
– Acquired a 9.6% interest in Ramco-Gershenson for $9.0M.
– YTD through July 31, we repurchased $44.2M of our debt at 71¢ on the dollar resulting in a
gain of approximately $12.4M. In 2008, we repurchased $88M of our own debt which
generated a $6.4M gain.
gain of approximately $12.4M. In 2008, we repurchased $88M of our own debt which
generated a $6.4M gain.
– YTD through July 31, we sold 7 outparcels generating proceeds of $11.6M at a 7.6%
average cap rate. (1)
– Completing the redevelopments of Sheridan Plaza and Mandarin Landing for a total
investment of $9.4M generating a 20.2% incremental yield as of June 30, 2009. (2)
– Discontinued development business in 1Q07.
(1) Based on estimated closing costs for July transactions.
(2) Figures represent estimated net costs after sales of outparcels and construction cost reimbursements. Figures do not include actual/allocated costs of land.
We now own a majority of DIM Vastgoed, a Dutch
company that owns 21 shopping centers in our markets.
8
• In 1Q09, we acquired approximately 1.2 million
shares of DIM in exchange for issuing 0.9 million
shares of our common stock.
shares of DIM in exchange for issuing 0.9 million
shares of our common stock.
• We also agreed to buy another approximately 0.8
million shares of DIM for cash or stock on or before
January 1, 2011 and, in connection with this
agreement, acquired the current voting rights of
these shares.
million shares of DIM for cash or stock on or before
January 1, 2011 and, in connection with this
agreement, acquired the current voting rights of
these shares.
• Taking into account the company’s previous
holdings of DIM common stock, Equity One has
voting control of approximately 74.6% of DIM’s
outstanding common stock.
holdings of DIM common stock, Equity One has
voting control of approximately 74.6% of DIM’s
outstanding common stock.
• Tom Caputo has been elected to the Supervisory
Board.
Board.
• Effective June 1, 2009, EQY assumed responsibility
for leasing the DIM portfolio.
(1) Based on DIM’s 2008 annual report (page 2). Figure as of December 31, 2008.
(2) Figures calculated based on average per square foot sales, using last available year of sales.
(3) Balances do not include any scheduled amortization.
DIM Vastgoed
9
• DIM Vastgoed owns 21 shopping centers with a total value of $395M as of December 31, 2008.(1)
• 16 of DIM’s 21 centers are grocery-anchored (11 Publix, 3 Kroger, 1 Lowe’s Foods, and 1 Harris
Teeter).
Teeter).
• DIM’s centers are well-located in markets where Equity One already has a significant presence (10
in Georgia, 5 in Florida, 3 in North Carolina, and 3 in other states).
• Occupancy was 91.9% as of June 30, 2009 as compared to 90.6% as of March 31, 2009.
• DIM incurred $2.5M in administrative expenses in 2008.
• Total indebtedness was $259.4M with a weighted average interest rate of 6.1% as of June 30,
2009. Maturities - - 2009 - $52.5M, 2012 - $17.8M, 2013 - $15.7M, 2014 - $44.8M, and
2015-2017 - $128.6M. (3)
Sheridan Plaza, Hollywood, FL
Total Investment(1): $1.7M
Project Summary:
Replaced an old
underperforming AMC
Theatre and five adjacent
tenants with a new
underperforming AMC
Theatre and five adjacent
tenants with a new
102,666 sf two-story Kohl’s
(completed 2Q 08)
(completed 2Q 08)
Relocated inline Starbucks
and Eastern Financial to a
vacant outparcel (completed
1Q08)
and Eastern Financial to a
vacant outparcel (completed
1Q08)
Further upgrades include
landscaping improvements,
re-tenanting of Conine's with
Azteca Mexican Restaurant,
and the construction of an
additional outparcel where
we have already executed a
new deal with TD Bank.
landscaping improvements,
re-tenanting of Conine's with
Azteca Mexican Restaurant,
and the construction of an
additional outparcel where
we have already executed a
new deal with TD Bank.
After
Before
(1) Represents estimated net costs after sales of outparcels and construction cost reimbursements. Figure includes a portion of the actual/allocated costs of land.
10
Limited Development Commitments
11
• The cost to complete our three currently active projects is estimated to be only $4.4M.(1)
• At each center, the anchor deals are complete:
– Publix opened at Sunlake in December 2008.
– Whole Foods opened at Mandarin Landing in December 2008.
– Land sold to CVS Pharmacy at Hampton Oaks.
• Grocery anchors at Sunlake and Mandarin started paying $1.5M of annual rent in
December 2008.
December 2008.
(1) As June 30, 2009.
Our ground-up development at Sunlake
features Publix’s latest prototype store.
12
Project:
Sunlake
Tampa, Florida
Development Summary:
Publix anchored shopping center as part
of a 155 acre mixed used development
project.
of a 155 acre mixed used development
project.
Total Investment(1): $30.7M
Total GLA upon Completion:123,889 SF
Stabilization: 4Q10
(1) As of June 30, 2009. Figure represents estimated net costs after sales of outparcels and construction cost reimbursements. Figure includes actual / allocated cost of land.
Our Mandarin Landing redevelopment features
the first and only Whole Foods in Jacksonville.
13
Project:
Mandarin Landing
Jacksonville, Florida
Redevelopment Summary:
Replaced a former Publix with a brand new
Whole Foods and renovated the center.
Total Investment(1): $8.8M
Before Redevelopment
After Redevelopment
(1) As of June 30, 2009. Figure represents estimated net costs after sales of outparcels and construction cost reimbursements. Figure includes actual/allocated costs of land.
Equity One is led by a dedicated and
focused management team.
14
Relative Stock Performance
15
(1) Source: Bloomberg 3 August 2009.
(2) Ramco-Gershenson has been excluded from the YTD average. If Ramco-Gershenson had been included, the average would have been -0.1%.
Total Return (1) | ||||||
YTD | 2008 | 2007 | ||||
Acadia | 5.0% | -39.3% | 6.5% | |||
Federal Realty | -1.5% | -21.7% | -0.6% | |||
Kimco | -36.8% | -46.8% | -16.0% | |||
Saul Centers | -10.2% | -22.8% | 0.1% | |||
Cedar | -23.7% | -24.9% | -31.4% | |||
Regency | -25.2% | -23.3% | -14.6% | |||
Weingarten | -14.1% | -28.3% | -28.5% | |||
Developers Diversified | 47.8% | -86.5% | -36.0% | |||
Ramco-Gershenson (2) | -68.0% | -40.4% | ||||
Average | -7.3% | -40.2% | -17.9% | |||
Equity One | -6.7% | -18.5% | -9.4% | |||
EQY Outperformance | +60 bps | +2170 bps | +850 bps |
Operational Excellence
16
• We are committed to maximizing the value of our existing centers through aggressive
leasing efforts, attentive property management, and property enhancements.
• Our leasing efforts involve staying very close to the market with weekly calls and
frequent canvassing combined with aggressive pricing and incentives utilized to drive
results.
frequent canvassing combined with aggressive pricing and incentives utilized to drive
results.
• Our tenant relations team carefully monitors credit risk and regularly performs portfolio
reviews with all major retailers to assess opportunities and strengthen relationships.
• We are allocating increased resources toward collection efforts.
• We have rebid our largest property management contracts in an effort to reduce
expenses.
expenses.
• We are committed to continue investing in our properties when many other landlords
are not in a position to do so.
Equity One: Stability, Sound Management, and Growth
17
We are poised to withstand economic uncertainty and emerge stronger due to our:
1. Well-located, high quality, and productive grocery-anchored shopping centers
2. A healthy financial structure including a strong balance sheet, modest leverage and
ample liquidity
ample liquidity
3. Disciplined capital allocation philosophy
4. Limited development commitments - existing projects already have anchors in place
5. A dedicated and disciplined management team
Forward Looking Statements
18
Certain matters discussed by Equity One in this presentation constitute forward-looking
statements within the meaning of the federal securities laws. Although Equity One believes
that the expectations reflected in such forward-looking statements are based upon
reasonable assumptions, it can give no assurance that these expectations will be achieved.
Factors that could cause actual results to differ materially from current expectations include
changes in macroeconomic conditions and the demand for retail space in the states in which
Equity One owns properties; the continuing financial success of Equity One’s current and
prospective tenants; continuing supply constraints in its geographic markets; the availability
of properties for acquisition; the success of its efforts to lease up vacant space; the effects of
natural and other disasters; the ability of Equity One to successfully integrate the operations
and systems of acquired companies and properties; and other risks, which are described in
Equity One’s filings with the Securities and Exchange Commission.