Exhibit 99.1
The Supermarket REIT
www.equityone.net
April 2005
Forward Looking Statements
Certain matters discussed in this presentation constitute forward-looking statements within the meaning of the federal securities laws. Although Equity One believes that the expectations reflected in such forward-looking statements are based upon reasonable assumptions, it can give no assurance that these expectations will be achieved. Factors that could cause actual results to differ materially from current expectations include changes in macro-economic conditions and the demand for retail space in Florida, Texas, Georgia, Massachusetts and the other states in which Equity One owns properties; the continuing financial success of Equity One’s current and prospective tenants; continuing supply constraints in Equity One’s geographic markets; the availability of properties for acquisition; the success of Equity One’s efforts to lease up vacant properties; the effects of natural and other disasters; the ability of Equity One to successfully integrate the operations and systems of acquired companies and properties; and other risks, which are described in Equity One’s filings with the Securities and Exchange Commission.

Mission Statement
Equity One will be a dominant supermarket-anchored shopping center REIT in its target markets
3
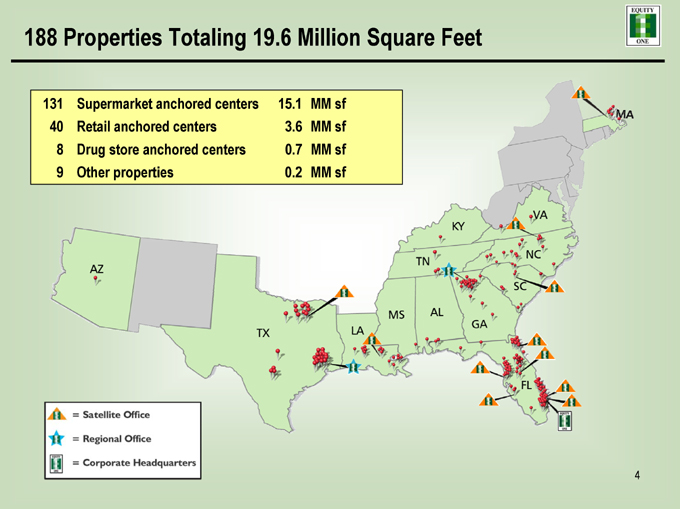
188 Properties Totaling 19.6 Million Square Feet
Satelite Office
Regional Office
Corporate Headquarters
131 Supermarket anchored centers 15.1 MM sf
40 Retail anchored centers 3.6 MM sf
8 Drug store anchored centers 0.7 MM sf
9 Other properties 0.2 MM sf
4
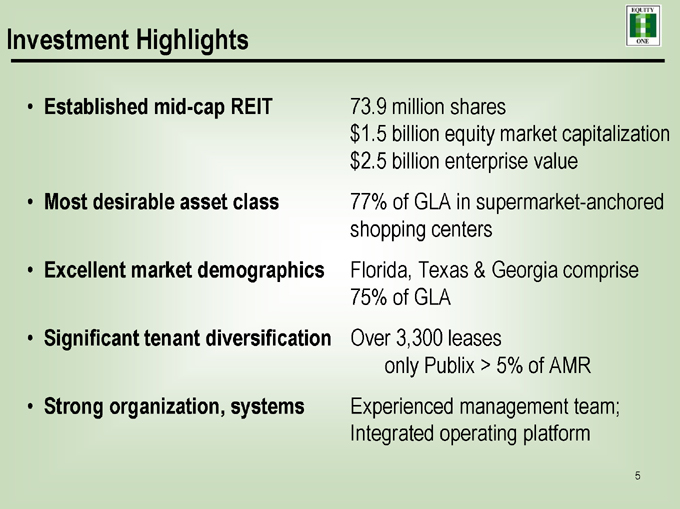
Investment Highlights
Established mid-cap REIT Most desirable asset class Excellent market demographics Significant tenant diversification Strong organization, systems
73.9 million shares $1.5 billion equity market capitalization $2.5 billion enterprise value 77% of GLA in supermarket-anchored shopping centers Florida, Texas & Georgia comprise 75% of GLA
Over 3,300 leases only Publix > 5% of AMR Experienced management team; Integrated operating platform
5
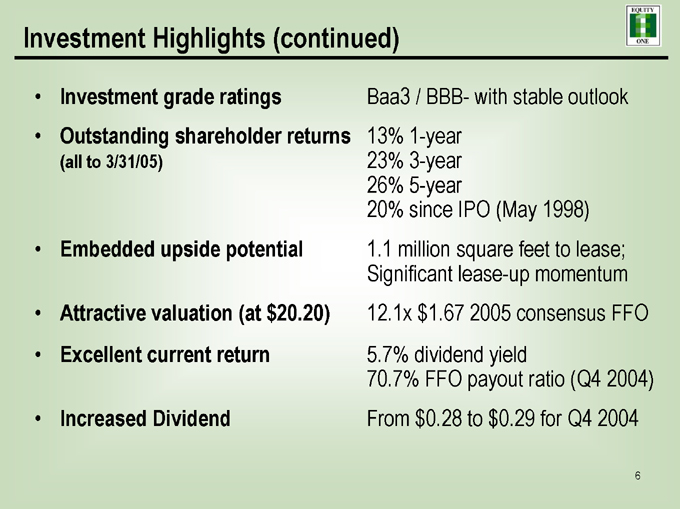
Investment Highlights (continued)
Investment grade ratings Outstanding shareholder returns
(all to 3/31/05)
Embedded upside potential
Attractive valuation (at $20.20) Excellent current return
Increased Dividend
Baa3 / BBB- with stable outlook 13% 1-year 23% 3-year 26% 5-year 20% since IPO (May 1998) 1.1 million square feet to lease; Significant lease-up momentum 12.1x $1.67 2005 consensus FFO 5.7% dividend yield 70.7% FFO payout ratio (Q4 2004) From $0.28 to $0.29 for Q4 2004
6
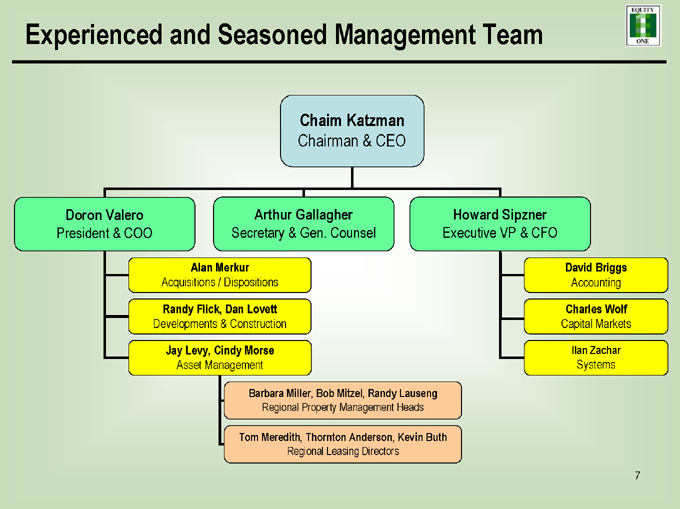
Experienced and Seasoned Management Team
Chaim Katzman
Chairman & CEO
Doron Valero
President & COO
Arthur Gallagher
Secretary & Gen. Counsel
Howard Sipzner
Executive VP & CFO
Alan Merkur
Acquisitions / Dispositions
Randy Flick, Dan Lovett
Developments & Construction
Jay Levy, Cindy Morse
Asset Management
David Briggs
Accounting
Charles Wolf
Capital Markets
IIan Zachar
Systems
Barbara Miller, Bob Mitzel, Randy Lauseng
Regional Property Management Heads
Tom Meredith, Thornton Anderson, Kevin Buth
Regional Leasing Directors
7

Company Timeline
Indexed Total Return
450 400 350 300 250 200 150 100 50
244.0% Cumulative Total Return (IPO to Present) $120MM Boston Portfolio Purchase $200MM Unsecured 5-YR Bond Sale
3MM Share Equity Offering
3MM Share Equity Offering
9.7% Equity Stake in CDR
$763MM IRT Acquisition
3.45MM Share Equity Offering $281MM CEFUS
Acquisition $148MM UIRT Acquisition
4.7MM Share IPO
Nov-04
May-04
Nov-03
May-03
Nov-02
May-02
Nov-01
May-01
Nov-00
May-00
Nov-99
May- 99
Nov-98
May-98
Note: Data is through March 31, 2005.
8
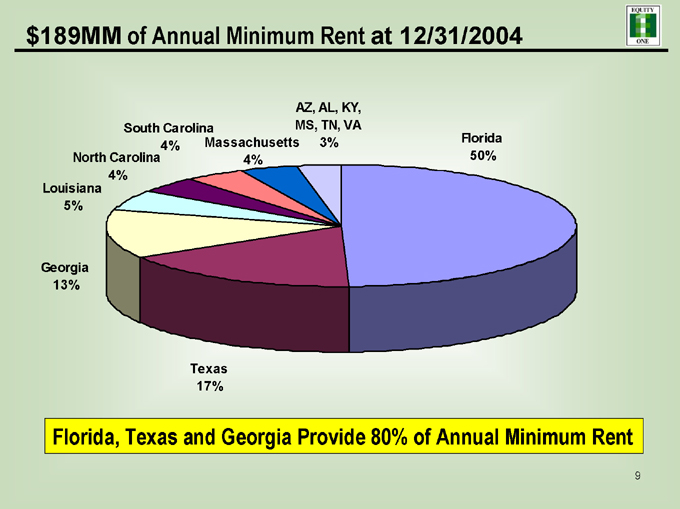
$189MM of Annual Minimum Rent at 12/31/2004
AZ, AL, KY, South Carolina MS, TN, VA
Massachusetts 3% Florida 4% North Carolina 4% 50% 4% Louisiana 5%
Georgia 13%
Texas 17%
Florida, Texas and Georgia Provide 80% of Annual Minimum Rent
9
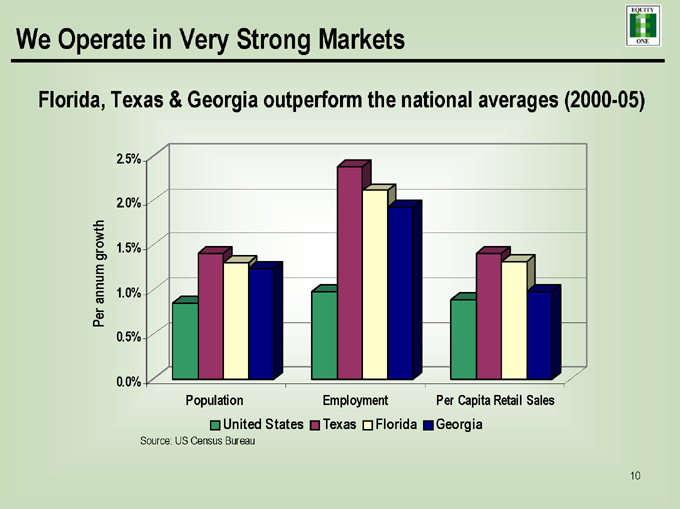
We Operate in Very Strong Markets
Florida, Texas & Georgia outperform the national averages (2000-05)
2.5%
2.0%
1.5%
Per annum growth 1.0% 0.5%
0.0%
Population Employment Per Capita Retail Sales
United States Texas Florida Georgia
Source: US Census Bureau
10

Our Supermarkets are Top Performers
Sales AMR AMR /
PSF AMR PSF Sales(1)
$511 $15.7MM $7.20 1.4%
$337 $8.0MM $8.31 2.3%
$433 $6.6MM $19.62 4.2%
$266 $5.1MM $6.93 2.6%
$681 $2.8MM $10.83 1.8%
$284 $2.0MM $6.66 2.5%
$366 $1.4MM $7.19 2.0%
$308 $1.0MM $4.53 2.2%
(1) Data is limited to stores that provide sales data.
Note: Kash n’ Karry data also includes Food Lion figures; both companies are owned by Delhaize Group.
11
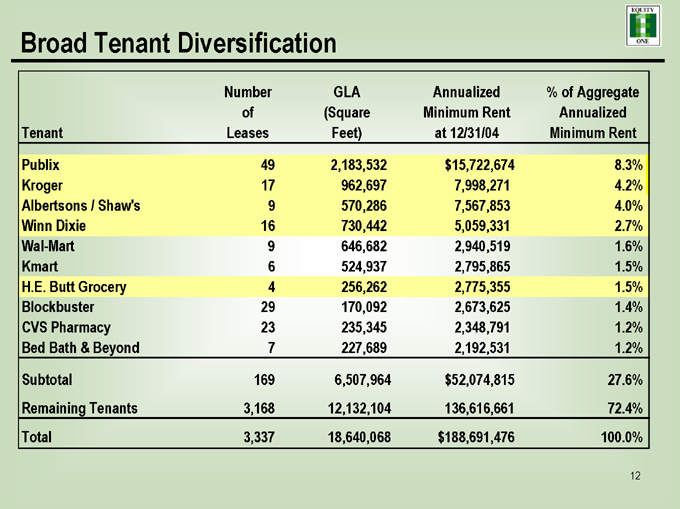
Broad Tenant Diversification
Number GLA Annualized % of Aggregate
of (Square Minimum Rent Annualized
Tenant Leases Feet) at 12/31/04 Minimum Rent
Publix 49 2,183,532 $15,722,674 8.3%
Kroger 17 962,697 7,998,271 4.2%
Albertsons / Shaw’s 9 570,286 7,567,853 4.0%
Winn Dixie 16 730,442 5,059,331 2.7%
Wal-Mart 9 646,682 2,940,519 1.6%
Kmart 6 524,937 2,795,865 1.5%
H.E. Butt Grocery 4 256,262 2,775,355 1.5%
Blockbuster 29 170,092 2,673,625 1.4%
CVS Pharmacy 23 235,345 2,348,791 1.2%
Bed Bath & Beyond 7 227,689 2,192,531 1.2%
Subtotal 169 6,507,964 $52,074,815 27.6%
Remaining Tenants 3,168 12,132,104 136,616,661 72.4%
Total 3,337 18,640,068 $188,691,476 100.0%
12
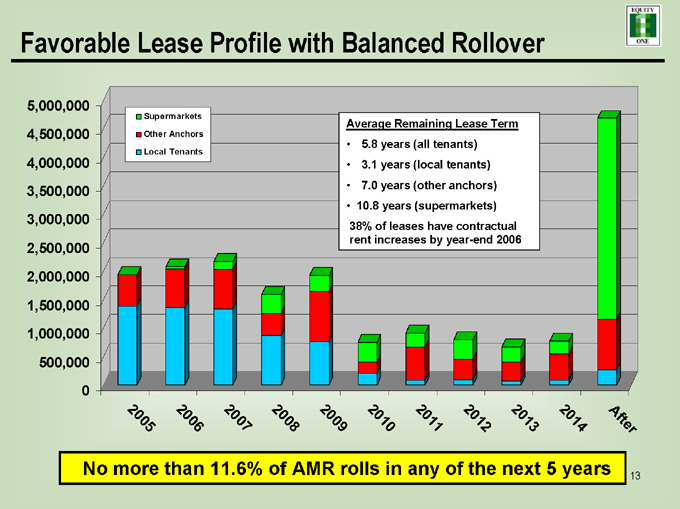
Favorable Lease Profile with Balanced Rollover
5,000,000 4,500,000 4,000,000 3,500,000 3,000,000 2,500,000 2,000,000 1,500,000 1,000,000 500,000 0
Supermarkets Other Anchors Local Tenants
Average Remaining Lease Term
5.8 years (all tenants) 3.1 years (local tenants) 7.0 years (other anchors) 10.8 years (supermarkets)
38% of leases have contractual rent increases by year-end 2006
After
2014
2013
2012
2011
2010
2009
2008
2007
2006
2005
No more than 11.6% of AMR rolls in any of the next 5 years 13
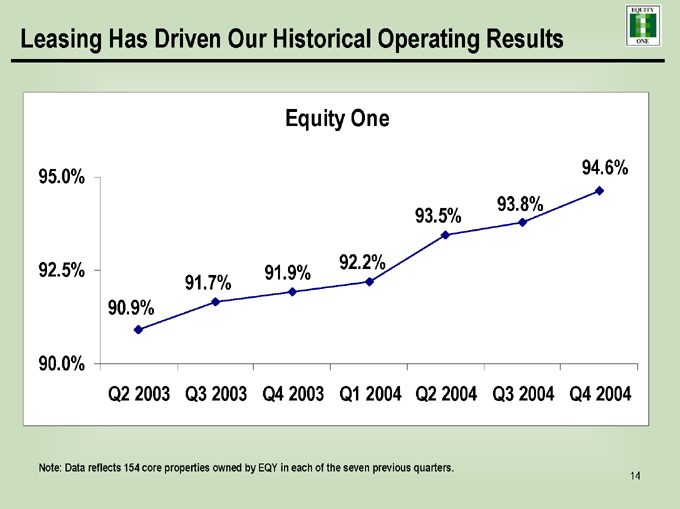
Leasing Has Driven Our Historical Operating Results
Equity One
95.0% 92.5% 90.0%
90.9%
91.7%
91.9%
92.2%
93.5%
93.8%
94.6%
Q2 2003 Q3 2003 Q4 2003 Q1 2004 Q2 2004 Q3 2004 Q4 2004
Note: Data reflects 154 core properties owned by EQY in each of the seven previous quarters.
14
15
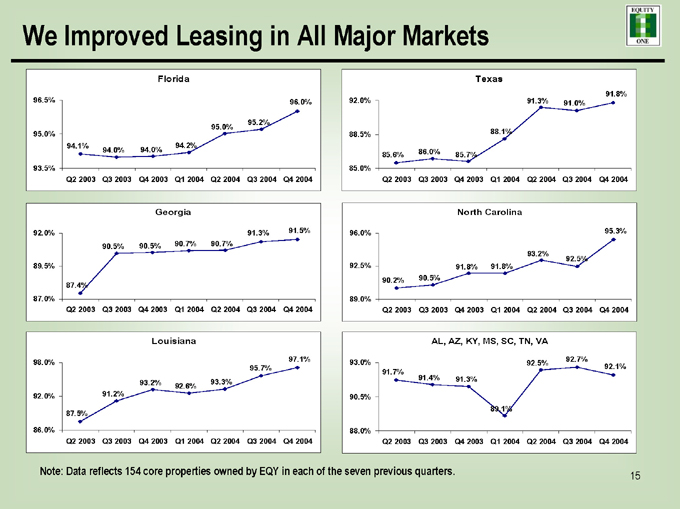
We Improved Leasing in All Major Markets
Florida
96.5% 96.0%
95.2% 95.0% 95.0% 94.1% 94.2% 94.0% 94.0%
93.5%
Q2 2003 Q3 2003 Q4 2003 Q1 2004 Q2 2004 Q3 2004 Q4 2004
Georgia
92.0% 91.3% 91.5% 90.5% 90.5% 90.7% 90.7%
89.5%
87.4% 87.0%
Q2 2003 Q3 2003 Q4 2003 Q1 2004 Q2 2004 Q3 2004 Q4 2004
Louisiana
98.0% 97.1% 95.7% 93.2% 93.3% 92.6% 92.0% 91.2% 87.5%
86.0%
Q2 2003 Q3 2003 Q4 2003 Q1 2004 Q2 2004 Q3 2004 Q4 2004
Texas
91.8% 92.0% 91.3% 91.0%
88.5% 88.1% 85.6% 86.0% 85.7% 85.0%
Q2 2003 Q3 2003 Q4 2003 Q1 2004 Q2 2004 Q3 2004 Q4 2004
North Carolina
96.0% 95.3%
93.2%
92.5% 92.5% 91.8% 91.8% 90.2% 90.5%
89.0%
Q2 2003 Q3 2003 Q4 2003 Q1 2004 Q2 2004 Q3 2004 Q4 2004
AL, AZ, KY, MS, SC, TN, VA
93.0% 92.7% 92.5%
92.1% 91.7% 91.4% 91.3% 90.5% 89.1%
88.0%
Q2 2003 Q3 2003 Q4 2003 Q1 2004 Q2 2004 Q3 2004 Q4 2004
Note: Data reflects 154 core properties owned by EQY in each of the seven previous quarters.
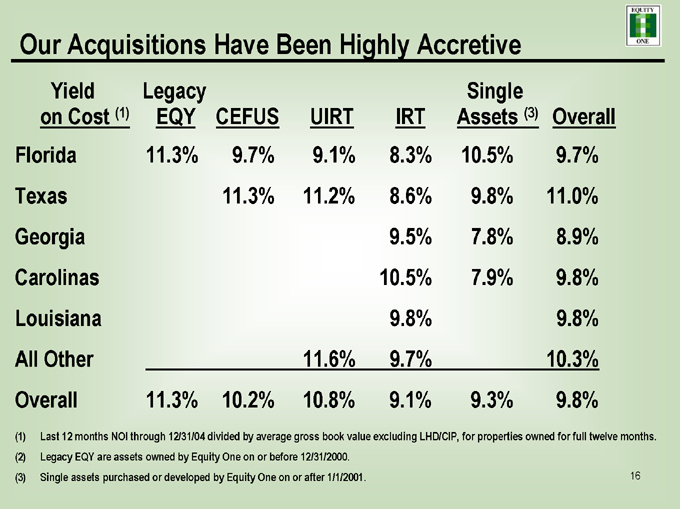
(1) Last 12 months NOI through 12/31/04 divided by average gross book value excluding LHD/CIP, for properties owned for full twelve months. (2) Legacy EQY are assets owned by Equity One on or before 12/31/2000.
(3) Single assets purchased or developed by Equity One on or after 1/1/2001. 16
Our Acquisitions Have Been Highly Accretive
Yield Legacy Single
on Cost (1) EQY CEFUS UIRT IRT Assets (3) Overall
Florida 11.3% 9.7% 9.1% 8.3% 10.5% 9.7%
Texas 11.3% 11.2% 8.6% 9.8% 11.0%
Georgia 9.5% 7.8% 8.9%
Carolinas 10.5% 7.9% 9.8%
Louisiana 9.8% 9.8%
All Other 11.6% 9.7% 10.3%
Overall 11.3% 10.2% 10.8% 9.1% 9.3% 9.8%
17
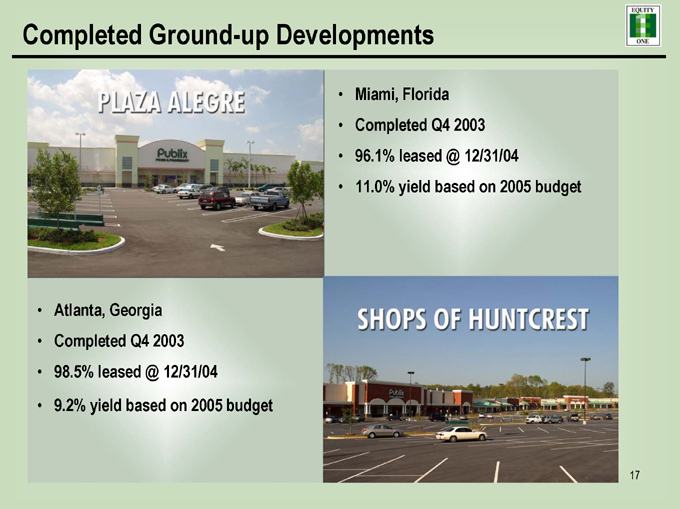
Completed Ground-up Developments
Miami, Florida Completed Q4 2003 96.1% leased @ 12/31/04
11.0% yield based on 2005 budget
PLAZA ALEGRE
Atlanta, Georgia Completed Q4 2003 98.5% leased @ 12/31/04 9.2% yield based on 2005 budget
SHOPS OF HUNTCREST
18
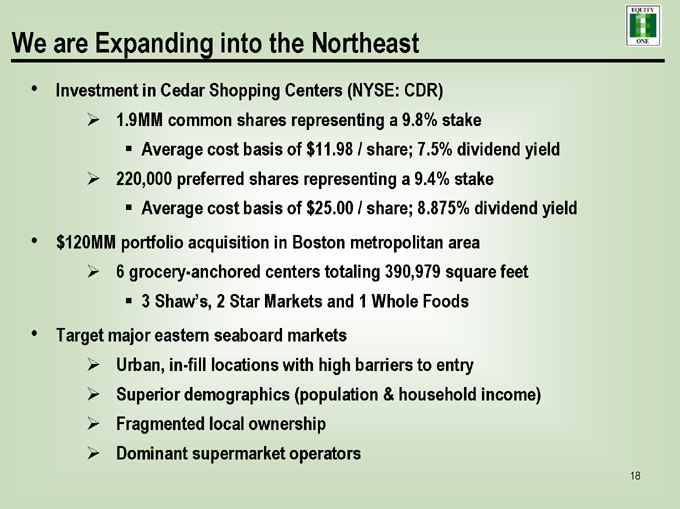
We are Expanding into the Northeast
Investment in Cedar Shopping Centers (NYSE: CDR)
1.9MM common shares representing a 9.8% stake
Average cost basis of $11.98 / share; 7.5% dividend yield
220,000 preferred shares representing a 9.4% stake
Average cost basis of $25.00 / share; 8.875% dividend yield $120MM portfolio acquisition in Boston metropolitan area
6 grocery-anchored centers totaling 390,979 square feet
3 Shaw’s, 2 Star Markets and 1 Whole Foods
Target major eastern seaboard markets
Urban, in-fill locations with high barriers to entry
Superior demographics (population & household income) Fragmented local ownership Dominant supermarket operators
19
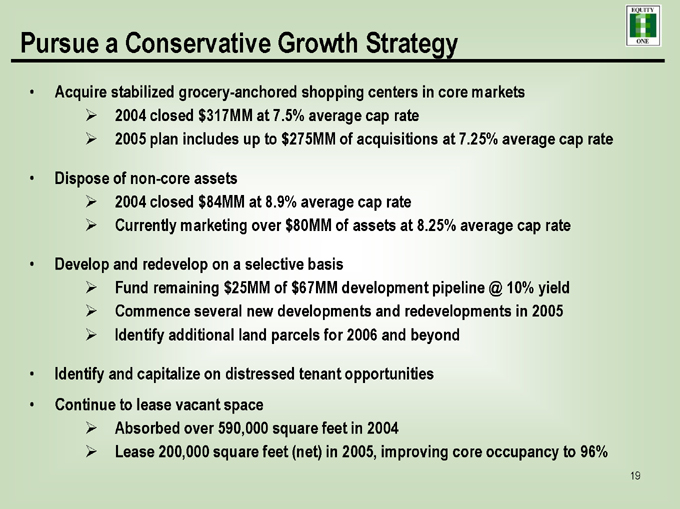
Pursue a Conservative Growth Strategy
Acquire stabilized grocery-anchored shopping centers in core markets
2004 closed $317MM at 7.5% average cap rate
2005 plan includes up to $275MM of acquisitions at 7.25% average cap rate
Dispose of non-core assets
2004 closed $84MM at 8.9% average cap rate
Currently marketing over $80MM of assets at 8.25% average cap rate
Develop and redevelop on a selective basis
Fund remaining $25MM of $67MM development pipeline @ 10% yield Commence several new developments and redevelopments in 2005 Identify additional land parcels for 2006 and beyond
Identify and capitalize on distressed tenant opportunities Continue to lease vacant space
Absorbed over 590,000 square feet in 2004
Lease 200,000 square feet (net) in 2005, improving core occupancy to 96%
20
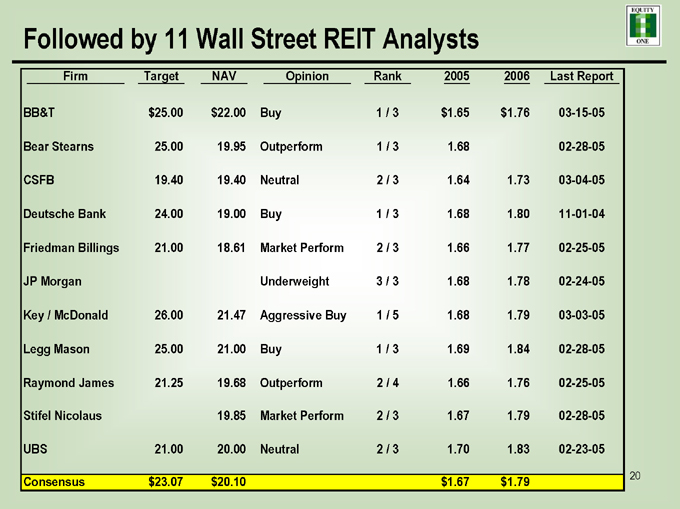
Followed by 11 Wall Street REIT Analysts
Firm Target NAV Opinion Rank 2005 2006 Last Report
BB&T $25.00 $22.00 Buy 1 / 3 $1.65 $1.76 03-15-05
Bear Stearns 25.00 19.95 Outperform 1 / 3 1.68 02-28-05
CSFB 19.40 19.40 Neutral 2 / 3 1.64 1.73 03-04-05
Deutsche Bank 24.00 19.00 Buy 1 / 3 1.68 1.80 11-01-04
Friedman Billings 21.00 18.61 Market Perform 2 / 3 1.66 1.77 02-25-05
JP Morgan Underweight 3 / 3 1.68 1.78 02-24-05
Key / McDonald 26.00 21.47 Aggressive Buy 1 / 5 1.68 1.79 03-03-05
Legg Mason 25.00 21.00 Buy 1 / 3 1.69 1.84 02-28-05
Raymond James 21.25 19.68 Outperform 2 / 4 1.66 1.76 02-25-05
Stifel Nicolaus 19.85 Market Perform 2 / 3 1.67 1.79 02-28-05
UBS 21.00 20.00 Neutral 2 / 3 1.70 1.83 02-23-05
Consensus $23.07 $20.10 $1.67 $1.79
21
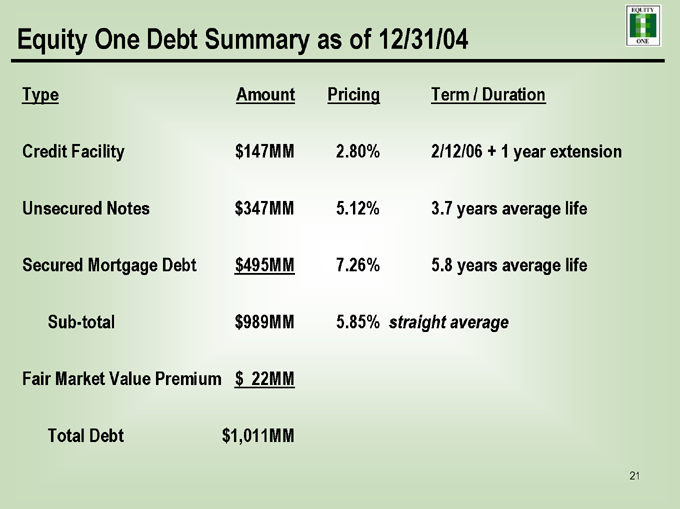
Equity One Debt Summary as of 12/31/04
Type Amount Pricing Term / Duration
Credit Facility $147MM 2.80% 2/12/06 + 1 year extension
Unsecured Notes $347MM 5.12% 3.7 years average life
Secured Mortgage Debt $495MM 7.26% 5.8 years average life
Sub-total $989MM 5.85% straight average
Fair Market Value Premium $22MM
Total Debt $1,011MM
Credit Facilities Unsecured Notes Balloon Amortization
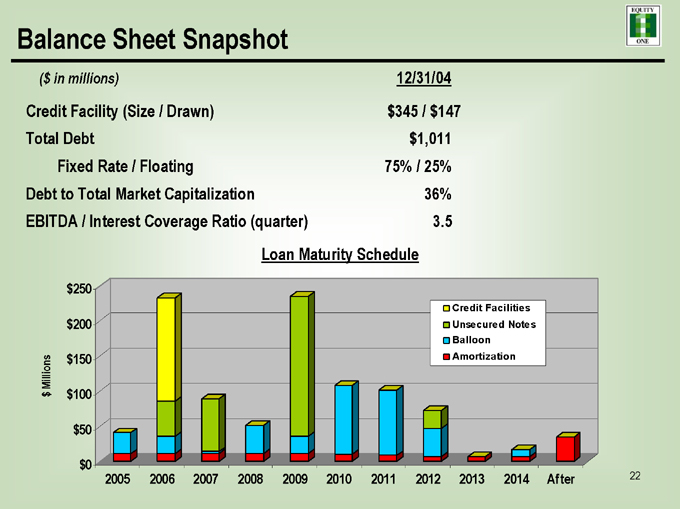
Balance Sheet Snapshot
($in millions) 12/31/04
Credit Facility (Size / Drawn) $345 / $147
Total Debt $1,011
Fixed Rate / Floating 75% / 25%
Debt to Total Market Capitalization 36%
EBITDA / Interest Coverage Ratio (quarter) 3.5
Loan Maturity Schedule $250 $200 $150 $100 $50 $0 $Millions
2005 2006 2007 2008 2009 2010 2011 2012 2013 2014 After
22
23
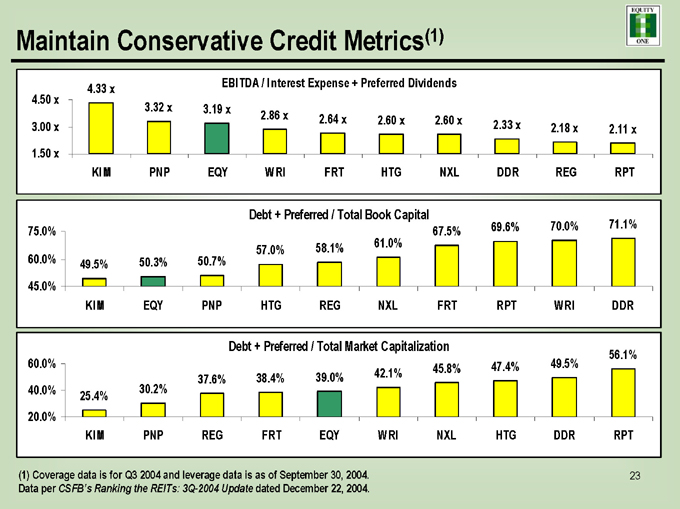
Maintain Conservative Credit Metrics(1)
4.33x EBITDA / Interest Expense + Preferred Dividends 4.50x 3.32x 3.19x 2.86x 2.64x 2.60x 2.60x
3.00x 2.33x 2.18x 2.11x 1.50x KIM PNP EQY WRI FRT HTG NXL DDR REG RPT
Debt + Preferred / Total Book Capital
69.6% 70.0% 71.1% 75.0% 67.5% 58.1% 61.0% 57.0% 60.0% 49.5% 50.3% 50.7% 45.0% KIM EQY PNP HTG REG NXL FRT RPT WRI DDR
Debt + Preferred / Total Market Capitalization
56.1% 60.0% 45.8% 47.4% 49.5% 37.6% 38.4% 39.0% 42.1% 40.0% 30.2% 25.4% 20.0% KIM PNP REG FRT EQY WRI NXL HTG DDR RPT
(1) Coverage data is for Q3 2004 and leverage data is as of September 30, 2004. Data per CSFB’s Ranking the REITs: 3Q-2004 Update dated December 22, 2004.
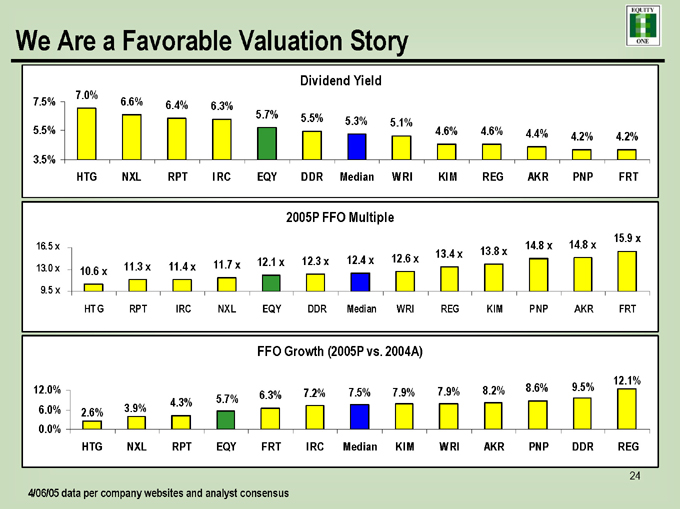
4/06/05 data per company websites and analyst consensus
We Are a Favorable Valuation Story
Dividend Yield
7.0%
7.5% 6.6% 6.4% 6.3%
5.7% 5.5%
5.3% 5.1%
5.5% 4.6% 4.6% 4.4%
4.2% 4.2% 3.5% HTG NXL RPT IRC EQY DDR Median WRI KIM REG AKR PNP FRT
2005P FFO Multiple
15.9x 16.5x 14.8x 14.8x 13.4x 13.8x 12.1x 12.3x 12.4x 12.6x 13.0x 11.3x 11.4x 11.7x 10.6x
9.5x
HTG RPT IRC NXL EQY DDR Median WRI REG KIM PNP AKR FRT
FFO Growth (2005P vs. 2004A)
12.1% 12.0% 7.5% 7.9% 7.9% 8.2% 8.6% 9.5% 5.7% 6.3% 7.2% 3.9% 4.3% 6.0% 2.6% 0.0% HTG NXL RPT EQY FRT IRC Median KIM WRI AKR PNP DDR REG
24
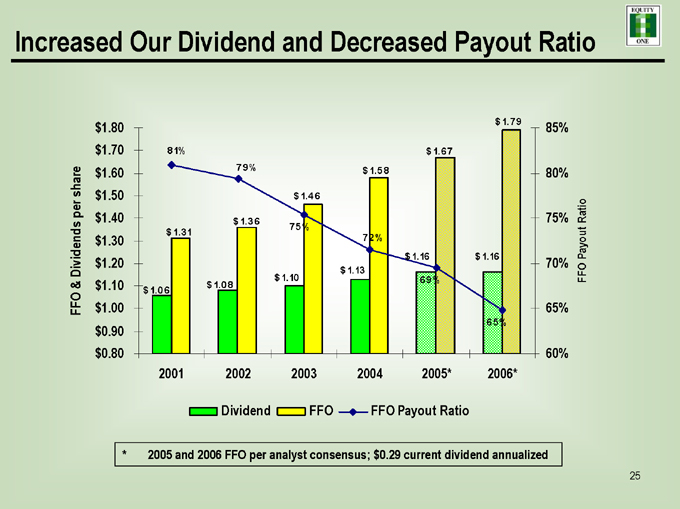
FFO & Dividends per share
Increased Our Dividend and Decreased Payout Ratio $1.80 $1.70 $1.60 $1.50 $1.40 $1.30 $1.20 $1.10 $1.00 $0.90 $0.80 $1.79 85% 81% $1.67 79% $1.58 80% $1.46 $1.36 75% Ratio 75%
$1.31 Payout
72% $1.16 $1.16 70% $1.13 $1.10 69% FFO $1.08 $1.06
65%
65%
60% 2001 2002 2003 2004 2005* 2006*
Dividend FFO FFO Payout Ratio
* 2005 and 2006 FFO per analyst consensus; $0.29 current dividend annualized
25
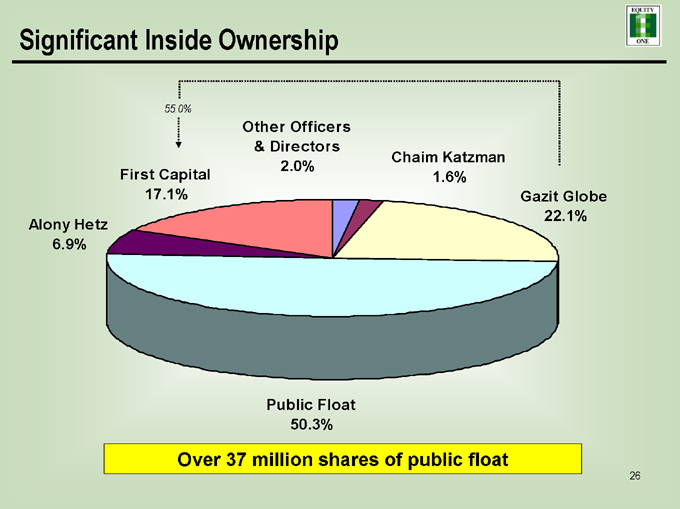
Significant Inside Ownership
55.0%
Other Officers & Directors
Chaim Katzman 2.0% First Capital 1.6%
17.1% Gazit Globe 22.1% Alony Hetz 6.9%
Public Float 50.3%
Over 37 million shares of public float
26
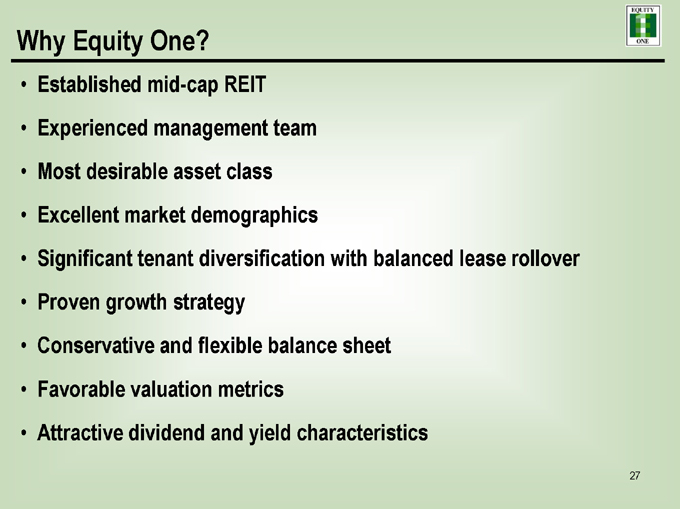
Why Equity One?
Established mid-cap REIT Experienced management team Most desirable asset class Excellent market demographics
Significant tenant diversification with balanced lease rollover Proven growth strategy Conservative and flexible balance sheet Favorable valuation metrics Attractive dividend and yield characteristics
27