 INVESTOR PRESENTATION MARCH 2012 |
 Forward Looking Statements 1 Certain matters discussed by Equity One in this presentation constitute forward-looking statements within the meaning of the federal securities laws. Although Equity One believes that the expectations reflected in such forward-looking statements are based upon reasonable assumptions, it can give no assurance that these expectations will be achieved. Factors that could cause actual results to differ materially from current expectations include changes in macro-economic conditions and the demand for retail space in the states in which Equity One owns properties; the continuing financial success of Equity One’s current and prospective tenants; the risks that Equity One may not be able to proceed with or obtain necessary approvals for development or redevelopment projects or that it may take more time to complete such projects or incur costs greater than anticipated; the availability of properties for acquisition; the extent to which continuing supply constraints occur in geographic markets where Equity One owns properties; the success of its efforts to lease up vacant space; the effects of natural and other disasters; the ability of Equity One to successfully integrate the operations and systems of acquired companies and properties; changes in Equity One’s credit ratings; and other risks, which are described in Equity One’s filings with the Securities and Exchange Commission. This presentation also contains non-GAAP financial measures, including Funds from Operations, or FFO. Reconciliations of these non-GAAP financial measures to the most directly comparable GAAP measures can be found in Equity One’s quarterly supplemental information package and in filings made with the SEC which are available on its website at www.equityone.net. |
 Corporate Mission 2 Our mission is to be the leading owner, operator, developer and asset manager of neighborhood and community shopping centers in the most supply constrained markets of the United States. |
 Corporate Overview 3 (1) As of 12/31/11 and includes acquisitions & dispositions under contract as of 03/01/12. Additionally, we had joint venture interests in seventeen shopping centers and two office buildings totaling approximately 2.8 million square feet. (2) Ranked by percentage of total estimated fair value as of 12/31/11 inclusive of all acquisitions and dispositions currently under contract as of 03/01/12. Does not include unconsolidated JV properties. (3) • Equity One specializes in the acquisition, asset management, development and redevelopment of quality retail properties primarily located in the coastal markets across the United States • We own 167 properties in 13 states (1) • Our largest markets as measured by approximate fair market values are: South Florida (30%), California (23%), Northeast (21%) , North Florida (10%), and Atlanta (8%) (2) • Total equity capitalization / total enterprise value as of 12/31/11: $2.1 billion / $3.3 billion • Investment grade credit ratings (Baa3/BBB-) from both Moody’s and S&P with recently revised outlooks (positive and stable, respectively) • Management and board have substantial ownership stake and experience: – Beneficial ownership: 51.8% (3) – Management team has over 80 years of collective experience Beneficial ownership of current executive officers and directors as of 3/5/12 in accordance with rules of the SEC and including options exercisable within 60 days. Beneficial ownership: Chaim Katzman 47.2%, Jeff Olson 2.0% and Nathan Hetz 1.4% on a fully diluted basis including shares issuable to Liberty. |
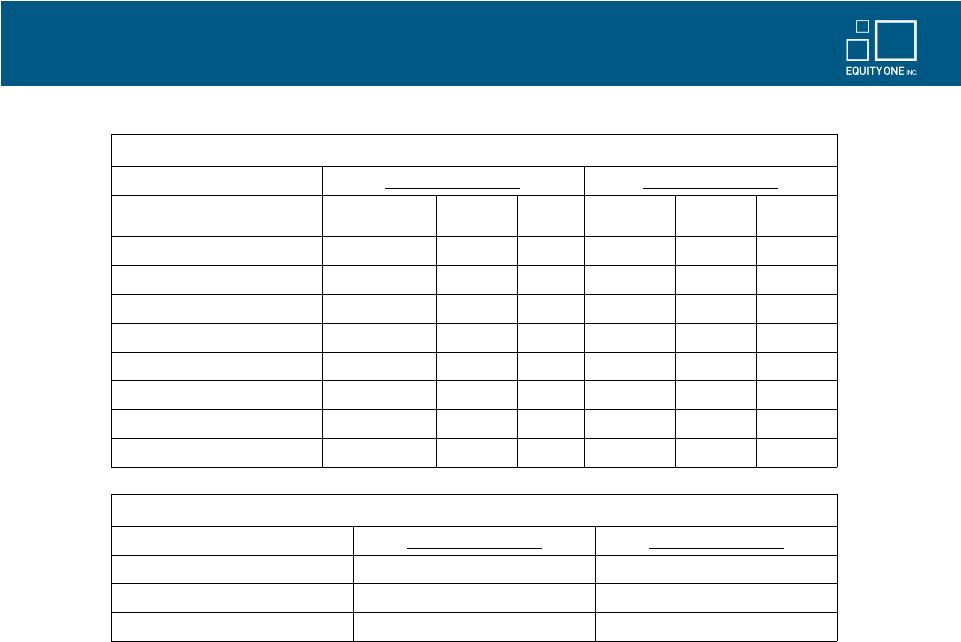 Equity One is on the move… Then vs. Now 4 Asset Composition by Region (1) As of Dec 31, 2011 As of Dec 31, 2008 # Properties Fair Value ($M) % FV # Properties Fair Value ($M) % FV South Florida 52 $1,004 30% 50 $1,007 43% California 10 $750 23% 0 $0 0% Northeast 19 $720 21% 8 $168 7% North Florida 30 $343 10% 41 $525 22% Atlanta 22 $275 8% 21 $297 13% Other 28 $229 7% 36 $316 13% Charlotte/Raleigh/Durham 6 $37 1% 6 $52 2% Total 167 $3,358 100% 162 $2,365 100% Demographic Quality of Assets (2) As of Dec 31, 2011 As of Dec 31, 2008 3-mile population 152,839 82,368 3-mile household income $93,069 $72,878 Grocery sales per sq.ft $507 $406 (1) Data includes acquisitions & dispositions under contract as of 03/01/12 (2) Demographic data weighted on estimated fair market value of assets |
 Significant Investment Activity is Transforming the Portfolio 5 (1) As of Dec 31, 2011. Includes closed acquisitions and dispositions as of Dec 31, 2011. Includes Joint Venture Properties. Figures are computed based on weighted average estimated fair values. • Approximately $1.4B of acquisitions completed between 2009 and 2011 in our target markets (1) – Approximately $800M of assets in West Coast markets – Added $360M of premium quality assets in Northeast portfolio • Sold approximately over $800M of non-strategic/non-core assets since 2009, the most prominent being – $473M sale of 36 non-strategic retail assets to Blackstone closed in December 2011 – $191M asset dispositions related to non-retail CapCo assets • Seeded new joint venture with New York Common Retirement Fund – Institutional JV partner seeking to acquire high quality grocery anchored centers – Provides attractive source of capital that can help us leverage our platform |
 2012 Strategic Goals 6 Operating Fundamentals Goal Increase same property occupancy by 50 basis points Generate same property NOI growth of 1.5% to 2.5% Maximize value of assets via cost containment measures and prudent tenanting Balance Sheet Management Portfolio Quality Value Creation Acquire $200M - $300M of shopping centers in target markets Sell $50M - $75M of assets located in secondary markets Recycle capital from dispositions into major urban markets Execute plans to launch redevelopment at Serramonte Build pipeline of urban infill development and redevelopment properties that represents 10% of total asset value Increase ownership concentration in targeted markets through accretive development projects Maintain quality balance sheet / financial discipline Keep targeted leverage ratio of 40-45% Net Debt to EBITDA goal of 6.5X Extend debt maturity profile Maintain access to multiple sources of capital Focused on Execution |
 Operating Fundamentals 7 • 2012 goal to increase same property NOI by 1.5% to 2.5% focused on the following – Increase occupancy with an emphasis on small shop space – Increase rent spreads particularly on lease renewals – Continue implementation of cost containment initiatives within property operations – Reduce concentration of assets in secondary markets – Expand tenant relations and marketing efforts with national and regional retailers |
 Portfolio Quality 8 • We plan to further diversify our portfolio into supply constrained, urban markets • Recent acquisitions in California and Connecticut highlight our focused approach on properties which meet the following key criteria aimed at enhancing the quality and performance of our overall portfolio: – Strong demographics – average 3-mile populations of nearly 200,000 as compared to EQY’s historical portfolio average of approximately 80,000 – Strong barriers to entry due to scarcity of land and strict zoning restrictions – Highly productive anchor sales volumes – Below market anchor rents – Redevelopment and densification opportunities • These acquisitions have enabled us to diversify our portfolio into higher quality centers in major MSAs which will ultimately result in greater stability and higher internal growth |
 Disposition Plans for Secondary Center Centers 9 • We plan to sell at least $50-$75 million of our existing assets located in secondary markets annually • The average three mile population density of most centers targeted for disposition is 40-70K people • Ultimate size of disposition pool for 2012 dependent on expected pricing – we would be more aggressive if pricing is attractive |
 Development / Redevelopment Update 10 • The Gallery at Westbury Plaza • Tenant interest remains strong • Anchor leases now signed with The Container Store, Trader Joe’s, Nordstrom Rack, Saks OFF 5TH, SA Elite, Bloomingdale’s Outlet, Verizon Wireless, ULTA, and Shake Shack • Construction has commenced with targeted opening by Fall of 2012 • 2012 CAPEX expected to be $55M - $65M • Serramonte • Feasibility / architectural review underway • Actively discussing tenanting options – big box retail, entertainment, value/convenience retail • No significant redevelopment CAPEX expected in 2011 or 2012 • Boca Village / Pine Ridge • Addresses layout / structural design weakness • Reduces shop tenant exposure • Target stabilization late 2013 / early 2014 • 2012 expected CAPEX is approximately $4.5M-$5.0M for Boca Village and less than $2.5M for Pine Ridge • Boynton Plaza • Public expansion (from 39K sq ft to 54K sq ft) • Reduce small shop exposure • Expected to increase occupancy from 86% to more than 96% • 2012 expected CAPEX is approximately $3.0M |
 Pro-forma Concentration of Assets As of Dec 31, 2011 Estimated FMV: $720M % of FV: 21% Estimated FMV: $37M % of FV: 1% Estimated FMV: $275M % of FV: 8% Estimated FMV: $1,004M % of FV: 30% Estimated FMV: $343M % of FV: 10% 11 Estimated FMV: $556M % of FV: 17% Estimated FMV: $194M % of FV: 6% (1) Estimated fair market values are as of 12/31/11 and include acquisitions and dispositions currently under contract as of 03/01/12. Region $(M) % South Florida 1,004 30% Washington DC to Boston 720 21% San Francisco 556 17% North Florida 343 10% Atlanta 275 8% Other 229 7% Los Angeles 194 6% Charlotte/Raleigh/Durham 37 1% Grand Total 3,358 100% |
 Benefits of EQY’s Portfolio Concentration 12 • Increase in our overall portfolio value through strategic acquisitions in key, high value markets and disposition of our non-core assets in secondary markets • “Fewer but better assets” – 17% of our assets (28/167) account for approximately 50% of our value • 80% of these 28 assets have been acquired since November 2009 signifying execution of our stated vision • Assets are concentrated in 12 important retail markets with an average value of $60M+ and 97% occupancy • Generally the acquired assets are the most dominant assets in their respective markets and provide significant future redevelopment potential • Concentration of fewer, higher value assets provides opportunities to streamline and increase efficiencies in operations and management. For example, these 28 assets account for 25% of our leases yet 50% of our asset value. |
 Balance Sheet Discipline – Maintained During Portfolio Transformation 13 • Key leverage ratios: – Net Debt to Total Market Cap as of 12/31/11: 36.7% – Net Debt to Gross Real Estate & Securities as of 12/31/11: 39.4% – Net Debt to Adjusted EBITDA of 5.6X as of 12/31/11 (1) – Adjusted EBITDA to interest expense coverage of 2.6X as of 12/31/11 (1) – Adjusted EBITDA to fixed charges of 2.2X as of 12/31/11 – Weighted average term to maturity for our total debt of 4.4 years as of 12/31/11 (1) Based on net debt as of 12/31/11 and Adjusted EBITDA (excluding gains/losses on property sales, debt extinguishment, impairments, and other non-recurring items) calculated by annualizing 4Q11 numbers as reported in the 12/31/11 supplement. Q4 2011 Leverage (Total Debt + Preferred / Gross Assets) Source: Company filings and SNL financial. Credit ratings from S&P and Moody's. 30.0% 35.0% 40.0% 45.0% 50.0% 55.0% EQY (BBB-/Baa3) KIM (BBB+/Baa1) FRT (BBB+/Baa1) REG (BBB/NR) WRI (BBB/Baa2) |
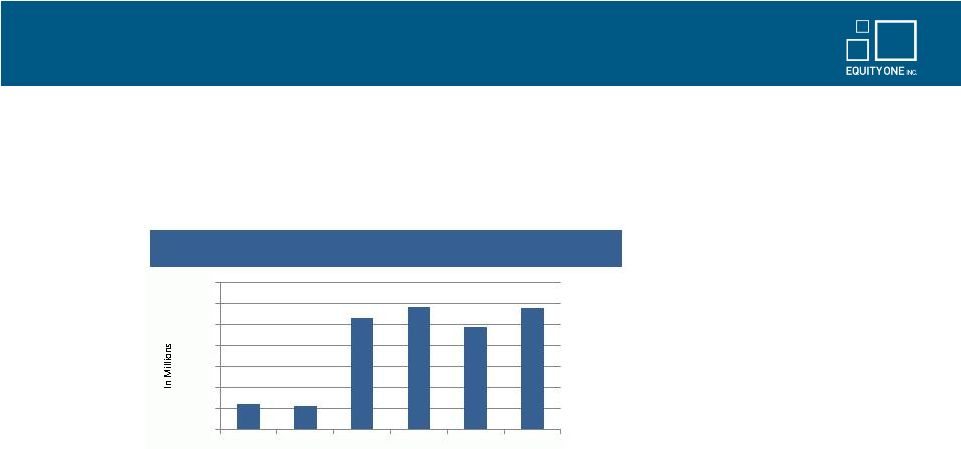 Current Liquidity Position 14 • Cash and cash equivalents amounted to $103.5M as of Dec 31, 2011 • Total available undrawn capacity on line of credit of $447M at Dec 31, 2011 • We maintain a manageable debt maturity schedule with maturities through 2017: Note: Cash includes 92.5M in Escrow account Debt maturity schedule as of 12/31/11. Includes scheduled principal amortization. Credit facilities are shown as due on the initial maturity dates, though certain extension options may be available. • Increased unencumbered Cash NOI to approximately 70.7% at 12/31/11 (versus 64.6% at Q4 2010) • Strong lending relationships with both traditional banks and life insurance companies • Demonstrated access to the public markets $0 $50 $100 $150 $200 $250 $300 $350 2012 2013 2014 2015 2016 2017 Debt Maturity Schedule |
 Investment Thesis 15 A management team who has proven to execute a stated strategy of significant portfolio improvement while maintaining financial discipline A management team who has proven to execute a stated strategy of significant portfolio improvement while maintaining financial discipline Well-located, high quality, and productive grocery-anchored shopping centers with an intensive focus on asset management Investment strategy focused on identified core markets leading to an upgrade in portfolio quality and further geographic diversity A healthy financial structure including a strong balance sheet, modest leverage and ample liquidity We are a premier operator positioned for growth We are a premier operator positioned for growth |
 Appendix 16 •Potrero Center •Culver Center •Gateway of Aventura/ Aventura Square •Loehmann’s- 107 Seventh Avenue •90-30 Metropolitan (Queens, NY) •Westbury Properties Aerial •The Gallery at Westbury Plaza •Serramonte Shopping Center •Plaza Escuela •Davis Marketplace •The Circle Centers |
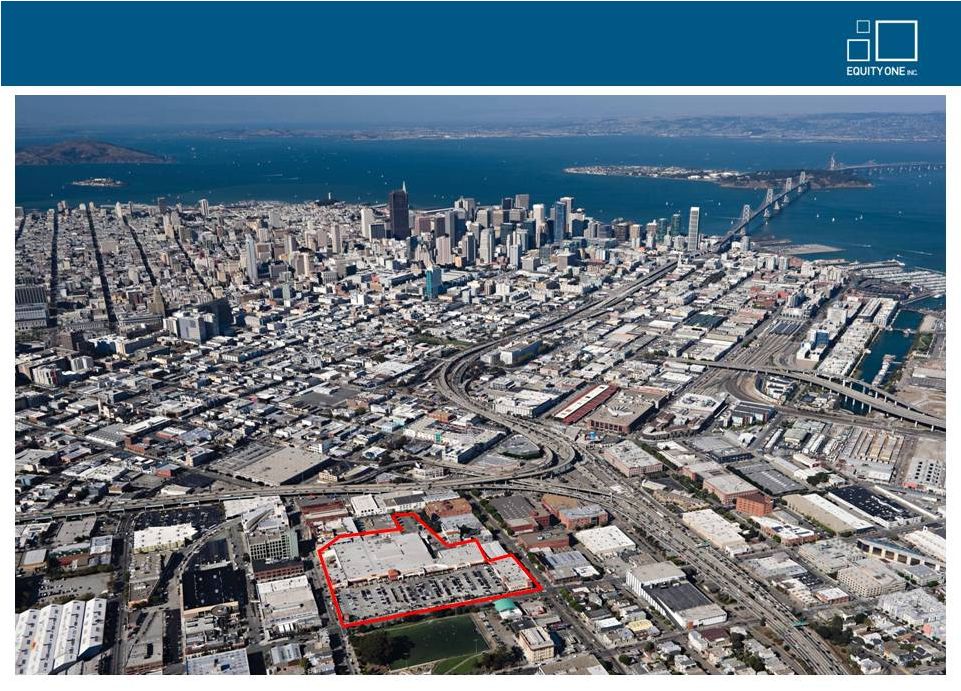 Potrero Center, San Francisco, CA 17 |
 Culver Center, Los Angeles, CA 18 |
 Gateway of Aventura and Aventura Square 19 |
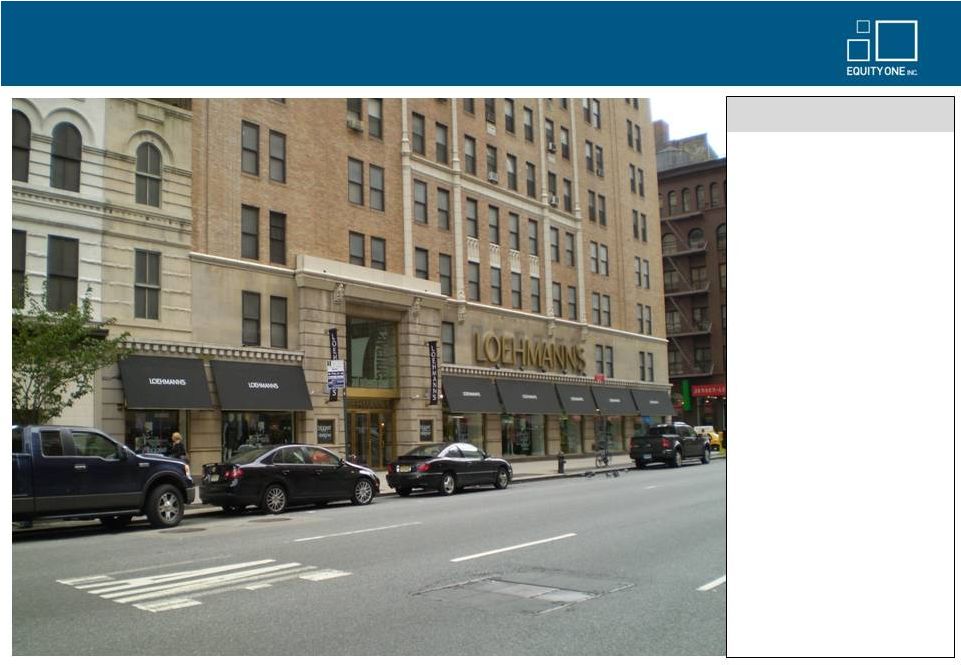 20 Loehmann’s- 107 Seventh Avenue • 56,870 sf retail property in the heart of the Chelsea neighborhood in New York City. • Loehmann’s currently occupies the entire space. • Prime Manhattan location which attracts heavy foot traffic from surrounding Meat Packing District, Chelsea Market and The High Line Park. • Google’s New York Headquarters is one block west of the site. • Significantly below market rent. Property Overview |
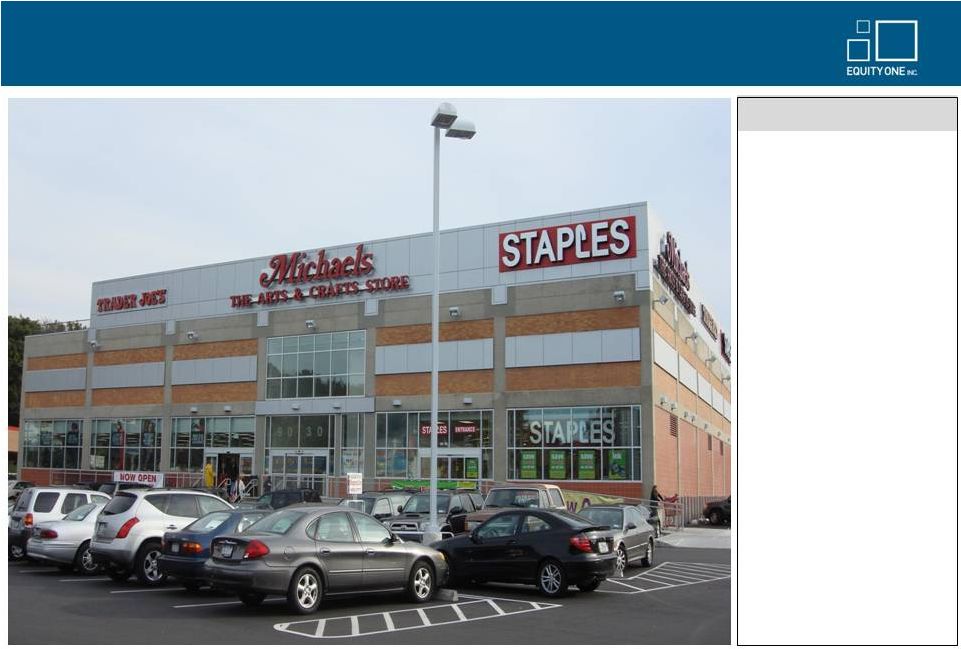 21 90-30 Metropolitan (Queens, NY) • 60,000 sf two-level retail building located in Forest Hills, NY. • 94% occupied and anchored by Trader Joe’s, Staples and Michaels. • Situated in one of the most affluent and dense neighborhoods in Queens, NY with nearly 1 million people living within a 3-Mile radius. • Queens is one of the most under-retailed areas in the country (estimated at 9 sf of retail space per capita or 1/3 average for the U.S. (1) ). (1) Source – Eastdil Secured Acquisition Overview |
 22 Westbury Properties |
 23 The Gallery at Westbury Plaza • The Gallery at Westbury Plaza sits at the center of Nassau County, one of the most affluent and densely populated regions in the nation. • Development site is located in one of the strongest retail corridors between Roosevelt Field Mall and Westbury Plaza. • Current plan anticipates 330,000 sf of retail GLA. • Anchor leases now signed with The Container Store, Trader Joe’s, ULTA, Saks OFF 5TH, Nordstroms Rack and Shake Shack. • Targeted opening date – Fall 2012. Property Overview |
  Serramonte Shopping Center - Ideally Positioned for Further Development 24 (1) Trade area includes Daly City and the surrounding areas (Colma, Pacifica, South San Francisco, San Bruno, Brisbane and San Francisco). Property Profile GLA (sf) 818,192 Year Built 1968 Site Area (acres) 80 Occupancy (as of 9/30/11) 96% Population (trade area) (1) 1,135,023 Average HH income (trade area) (1) $105,275 |
  25 Plaza Escuela – Centrally Located in a Prime, High-End Retail Market Property Profile GLA (SF) 151,499 Year Built 2002 Site Area (acres) 5.2 Occupancy (as of 9/30/11) 99% Population (3 miles) 92,265 Average HH income (3 miles) $110,797 |
  26 Davis Marketplace – Defensive Asset in High Barrier to Entry Market Hwy 113 Property Profile GLA (SF) 111,156 Year Built 1990 Site Area (acres) 9.7 Occupancy (as of 9/30/11) 93% Population (3 miles) 59,258 Average HH income (3 miles) $84,132 |
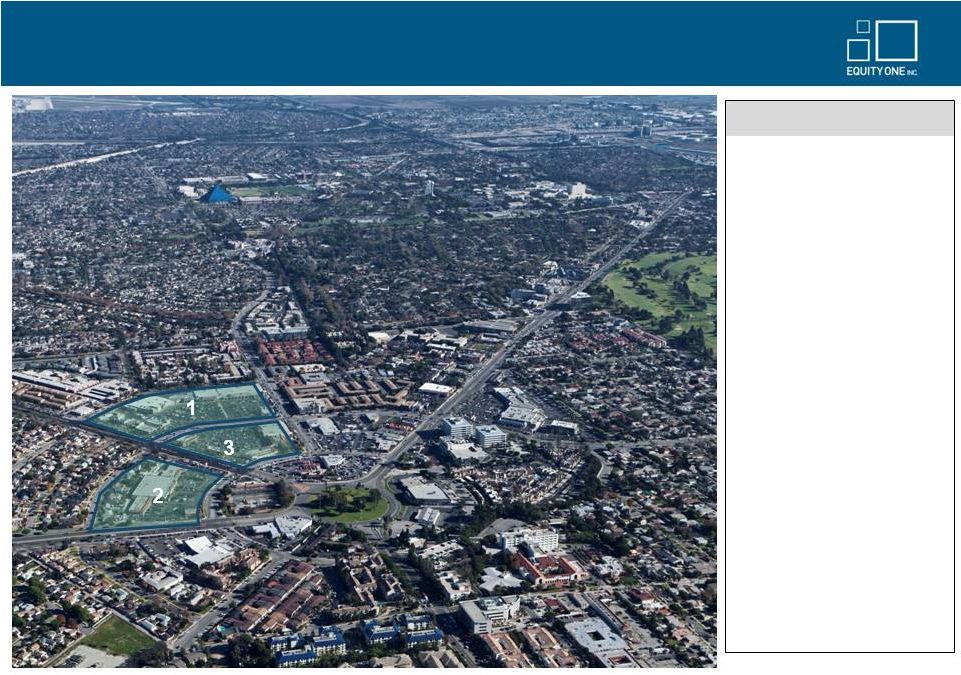 The Circle Centers, Long Beach, CA 27 Property Overview • GLA : 273,000 SF (95% Occupied) • Purchase Price: $72.0M • Anchors: Vons, Ross, Rite Aid, Ralphs, Marshalls • 3-mile demographics • Population: 259,624 • Average HH income: $70,401 • Investment Highlights: • Situated in one of our seven target markets. • Severe supply constraints. • Strong tenant sales • Below market anchor rents with short-term lease expirations. • Visible growth in net operating income. (1) Vons Circle Center (2) Ralphs Circle Center (3) Circle Center West |