 Investor Presentation November 2012 Exhibit 99.1 |
 1 Forward Looking Statements Certain matters discussed by Equity One in this presentation constitute forward-looking statements within the meaning of the federal securities laws. Although Equity One believes that the expectations reflected in such forward-looking statements are based upon reasonable assumptions, it can give no assurance that these expectations will be achieved. Factors that could cause actual results to differ materially from current expectations include volatility of the capital markets, changes in macro-economic conditions and the demand for retail space in the states in which Equity One owns properties; the continuing financial success of Equity One’s current and prospective tenants; the risks that Equity One may not be able to proceed with or obtain necessary approvals for development or redevelopment projects or that it may take more time to complete such projects or incur costs greater than anticipated; the availability of properties for acquisition; the ability to sell non-core assets at favorable pricing; the extent to which continuing supply constraints occur in geographic markets where Equity One owns properties; the success of its efforts to lease up vacant space; the effects of natural and other disasters; the ability of Equity One to successfully integrate the operations and systems of acquired companies and properties; changes in Equity One’s credit ratings; and other risks, which are described in Equity One’s filings with the Securities and Exchange Commission. This presentation also contains non-GAAP financial measures, including Funds from Operations, or FFO. Reconciliations of these non-GAAP financial measures to the most directly comparable GAAP measures can be found in Equity One’s quarterly supplemental information package and in filings made with the SEC which are available on its website at www.equityone.net |
 Mission Statement 2 Improving retail real estate in urban communities |
 Corporate Overview 3 • Equity One specializes in the acquisition, asset management, development and redevelopment of quality retail properties primarily located in the coastal markets of the United States • We own 160 operating properties in 13 states (1) • Our largest markets as measured by approximate fair market values are: South Florida (27%), Northeast (27%), California (21%), North Florida (10%), and Atlanta (8%) (2) • Total equity capitalization / total enterprise value as of 09/30/12: $2.7 billion / $4.2 billion • Investment grade credit ratings of Baa3 (positive) from Moody’s and BBB- (stable) from S&P • Management and board have substantial ownership stake and experience: – Beneficial ownership: 50.1% (3) – Management team has over 80 years of collective experience (1) Includes acquisitions & dispositions under contract as of 09/30/2012. Excludes land and non-core assets not associated with retail centers. Additionally, we have joint venture interests in nineteen retail properties and two office buildings totaling approximately 2.8 million square feet. (2) Based on total estimated fair value as of 09/30/12, inclusive of all acquisitions and dispositions under contract as of 09/30/2012 and excludes land. Does not include unconsolidated JV properties. (3) Beneficial ownership of current executive officers and directors as of 09/30/12 in accordance with rules of the SEC and including options exercisable within 60 days. Beneficial ownership: Chaim Katzman 46.5%, Jeff Olson 2.0% and Nathan Hetz 0.5% on a fully diluted basis. |
 Equity One is on the move… Then vs. Now 4 Asset Composition by Region • Approximately $2 billion of acquisitions completed since 2009 in our target markets (3): – Approximately $780 million of assets in West Coast markets – Approximately $950 million of premium quality assets in Northeast portfolio – Completed The Gallery at Westbury Plaza in Nassau County, NY • Sold approximately $800 million of non-strategic/non-core assets since 2009, the most prominent being: – $473 million sale of 36 non-strategic retail assets to Blackstone – $191 million asset dispositions related to non-retail CapCo assets Portfolio Quality Metrics in 2012 vs. 2008 (2) Dec 2008 Portfolio $2,365 MM Sept 2012 Portfolio (1) $3,690 MM Significant Investment Activity has Transformed the Portfolio (1) Data includes acquisitions & dispositions under contract as of 09/30/12. Excludes land and non-core assets not associated with retail centers. Based on IFRS fair market values as of 09/30/12. (2) Demographic data based on weighted estimated fair market value of assets. Source: Sites USA. (3) As of Sept 30, 2012, includes assets under contract as of Sept 30, 2012 and joint venture properties. Figures are computed based on weighted average estimated fair values. South Florida 27% Northeast 27% California 21% Central/ North Florida 10% Atlanta 8% Other 7% South Florida 43% Northeast 7% Central/ North Florida 22% Atlanta 12% Other 16% 169,017 $95,702 82,368 $72,878 3-mile population 3-mile avg. HH income $522 $406 Grocery sales per sq.ft 108% 30% 33% |
 5 Portfolio Metrics (1) New York occupancy rate would be 98% excluding The Gallery at Westbury Plaza, which is currently 73% leased. (2) Excludes land and non-core assets not associated with retail centers. Includes acquisitions and dispositions under contract as of 09/30/12. (3) Fair value of Westwood Center in Bethesda, MD is based on purchase price when property is ultimately acquired. (4) Includes Lake Mary, Sunlake, Pablo and South Beach Regional. (1) (3) (4) # of centers 3Q12 Fair Value ($M) GLA 3Q12 Occ. All Anchor Shop Pop. Avg HH Income Grocer Sales Balance Interest Years to Rate Maturity Core Markets Northeast Connecticut 7 $252.3 867,764 98.0% $22.66 $13.27 $31.15 37,706 $140,202 $843 $82.7 5.6% 5.2 Maryland 1 $140.0 466,910 97.8% $13.84 N/A N/A 139,570 $200,005 $847 $0.0 0.0% 0.0 Massachusetts 7 $139.7 600,879 99.1% $18.80 $18.96 $17.47 185,947 $84,412 $347 $7.1 8.1% 11.9 New York 7 $465.1 950,727 86.9% $32.67 $29.38 $55.71 481,966 $104,881 $1,391 $7.1 7.0% 6.6 Northeast Total 22 $997.2 2,886,280 94.5% $22.84 $21.20 $31.79 280,001 $124,307 $669 $96.9 5.9% 5.8 Southeast North and Central Florida 7 $176.8 1,212,742 88.8% $14.82 $11.27 $21.15 49,068 $91,351 $420 $23.3 5.8% 2.7 Atlanta (Core) 6 $178.7 821,321 95.8% $16.45 $12.77 $24.70 92,868 $111,775 $571 $39.6 7.0% 4.4 Broward/Miami- Dade/Palm Beach Counties 40 $914.5 4,826,944 92.2% $15.07 $10.37 $23.38 130,518 $76,458 $618 $87.6 6.3% 5.4 Florida Treasure/Northeast Coast 6 $73.5 504,568 92.3% $12.11 $8.35 $19.62 39,678 $70,858 $630 $7.0 5.7% 1.8 Southeast Total 59 $1,343.5 7,365,575 92.1% $14.98 $10.66 $22.92 109,822 $82,809 $609 $157.5 6.3% 4.6 West Coast Arizona 1 $26.7 210,396 64.4% $19.26 $12.54 $26.09 35,703 $74,853 $0 $0.0 0.0% 0.0 Los Angeles 4 $194.5 489,239 98.0% $20.58 $13.57 $34.69 263,644 $93,587 $508 $74.9 5.5% 6.3 San Francisco 5 $587.9 1,564,570 98.2% $28.61 $20.80 $39.69 217,182 $95,412 $817 $71.6 6.0% 3.7 West Coast Total 10 $809.1 2,264,205 95.0% $25.92 $18.23 $37.95 222,360 $94,295 $647 $146.5 5.7% 5.0 Total 91 $3,149.8 12,516,060 93.2% $18.66 $14.64 $26.87 192,606 $98,897 $630 $400.9 6.0% 5.0 Non-core Markets Atlanta 13 $103.6 1,042,475 88.4% $10.40 $7.86 $15.61 49,254 $78,135 $396 $16.5 6.9% 8.7 Tampa/St. Petersburg/Venice/Cape Coral/Naples 10 $87.0 984,807 73.2% $10.59 $7.63 $17.06 39,344 $83,294 $416 $0.0 0.0% 0.0 Louisiana 12 $101.6 1,311,385 95.4% $8.59 $6.80 $13.03 58,017 $76,794 $235 $3.1 6.5% 11.4 Jacksonville/North Florida 9 $67.6 819,879 90.2% $10.22 $8.45 $16.14 43,528 $62,772 $474 $0.0 0.0% 0.0 Orlando/Central Florida 6 $52.9 555,044 85.0% $11.63 $6.46 $20.25 85,262 $59,855 $365 $0.0 0.0% 0.0 North Carolina 9 $59.2 921,216 74.4% $8.03 $6.39 $11.96 29,774 $63,967 $289 $6.6 6.3% 0.8 Central/ South Georgia 4 $35.2 624,662 79.6% $8.10 $6.17 $12.06 60,007 $48,571 $443 $3.1 6.5% 11.4 AL/MS/VA 3 $18.1 258,535 97.9% $7.27 $5.49 $13.44 21,816 $69,354 $395 $2.8 6.5% 11.4 South Carolina 3 $14.8 196,876 89.3% $8.24 $7.00 $14.32 30,589 $82,603 $489 $0.0 0.0% 0.0 Total 69 $539.9 6,714,879 85.1% $9.41 $7.10 $14.91 49,250 $71,348 $396 $32.1 6.7% 7.8 Grand Total (2) 160 $3,689.7 19,230,939 90.4% $15.48 $11.97 $22.86 171,628 $94,866 $540 $433.0 6.1% 5.2 In-Place Debt (9/30/12) Base Rent ($/sf) |
 Concentration of Assets As of September 30, 2012 (1) 6 Region $(M) % South Florida $988 27% Northeast $997 27% California $782 21% Central/North Florida $384 10% Atlanta $282 8% Other $257 7% Total $3,690 100% (1) Data includes acquisitions & dispositions under contract as of 09/30/12. Excludes land and non-core assets not associated with retail centers. IFRS fair market values are as of 09/30/12. Estimated FMV: $588M % of FV: 16% Estimated FMV: $194M % of FV: 5% Estimated FMV: $997M % of FV: 27% Estimated FMV: $29M % of FV: 1% Estimated FMV: $282M % of FV: 8% Estimated FMV: $988M % of FV: 27% Estimated FMV: $384M % of FV: 10% |
 2012 Strategic Goals 7 Meet or exceed fundamental operating goals: • FFO per share • SS NOI growth • SS Occupancy Continue to upgrade portfolio quality and demographic profile through strategic transactions: • Expected to close $280M in acquisitions in 2012 with a focus on the Northeast and West Coast • Identified $215M of non-core assets for dispostion Maintain low leverage (~40%) and abundant liquidity Maintain investment grade ratings and improve credit metrics Upgrade information technology systems – implement IT strategic plan that is aligned with our operational strategy OPERATING FUNDAMENTALS PORTFOLIO QUALITY VALUE CREATION BALANCE SHEET MANAGEMENT OPERATIONS Continue to strengthen development and redevelopment pipeline: • Focus on the remaining lease up of The Gallery at Westbury (targeting 80% lease rate by 12/31/12) • Establish redevelopment and densification plans at Serramonte Center in Daly City, CA – Signed lease with Dick’s Sporting Goods (83K sf) at a cost of $18M • Finalize development plan and budget for new site in the Bronx (133,000 sf) – Work on phase I plan to add entertainment wing |
 Our Path to Sustained NOI Growth 8 Contractual rent steps Below market leases – recent acquisitions provide opportunity to capture market rents in coming years Increase in percentage rent – higher quality assets in more productive markets provide greater upside Increase occupancy with an emphasis on small shop space Expense control and implementation of cost control initiatives within property operations Reduce concentration of assets in secondary and non-core markets Expand tenant relations and marketing efforts with national and regional retailers |
 Enhancing Portfolio Value by Improving Portfolio Quality 9 • We plan to further diversify our portfolio into supply constrained, urban markets • Recent acquisitions in California and New York highlight our focused approach on properties which meet the following key criteria aimed at enhancing the quality and performance of our overall portfolio: – Strong demographics – average 3-mile populations of nearly 200,000 as compared to EQY’s historical portfolio average of approximately 80,000 – Strong barriers to entry due to scarcity of land and strict zoning restrictions – Highly productive anchor sales volumes – Below market anchor rents – Redevelopment and densification opportunities • These acquisitions have enabled us to diversify our portfolio into higher quality centers in major MSAs which will ultimately result in greater stability and higher internal growth |
 Enhancing Portfolio Value through Development and Redevelopment 10 Our redevelopment strategy is based on a careful assessment of risk: • Projects undertaken in select target markets where management has extensive knowledge • Majority of new leases related to development space signed prior to construction • Development skill set greatly enhanced with new senior executive team members: • Michael Berfield – Northeast • Jeff Mooallem – West Coast • New ground up development projects limited to urban locations sought after by big box retail • Redevelopment projects provide growth in asset value while minimizing risk of in place income • Recent track record demonstrates successful execution by narrowing focus to a select few projects • Targeted level of development/redevelopment projects (approx. 10% of total asset value) is reasonable and appropriate given lower risk profile of selected opportunities in urban markets |
 Development / Redevelopment Update 11 • The Gallery at Westbury Plaza • Recent activity at The Gallery at Westbury includes signed leases with Starbucks, Red Mango, Jenna & Molly, Banana Republic Outlet, GAP Outlet, Lane Bryant, Bank of America, Noodles & Co., and GNC • Stores now open include The Container Store, Trader Joe’s, Saks Off 5 th , Ulta, Bloomingdale’s, Nordstrom Rack, SA Elite and Verizon • Old Navy and Shake Shack will open in November • Serramonte • Multi-phased expansion, development and re-tenanting to begin with the construction of a new two level Dick’s Sporting Goods – their largest one in California and flagship San Francisco store • Actively discussing new tenanting options – big box retail, entertainment, value/convenience retail • Future phases will explore 250,000 sf of additional retail space plus a residential component • Boca Village / Pine Ridge • Addresses layout / structural design weakness • Reduces shop tenant exposure • Target stabilization late 2013 / early 2014 • Bronx site • Acquired 80,000 sf land parcel located at the intersection of 230 street and the Broadway near Kingsbridge in the Bronx • Expected to construct a new 133,000-square-foot, two-story multi-tenant retail development • Expected to start construction in early 2013 with a targeted stabilization date in 2015 th |
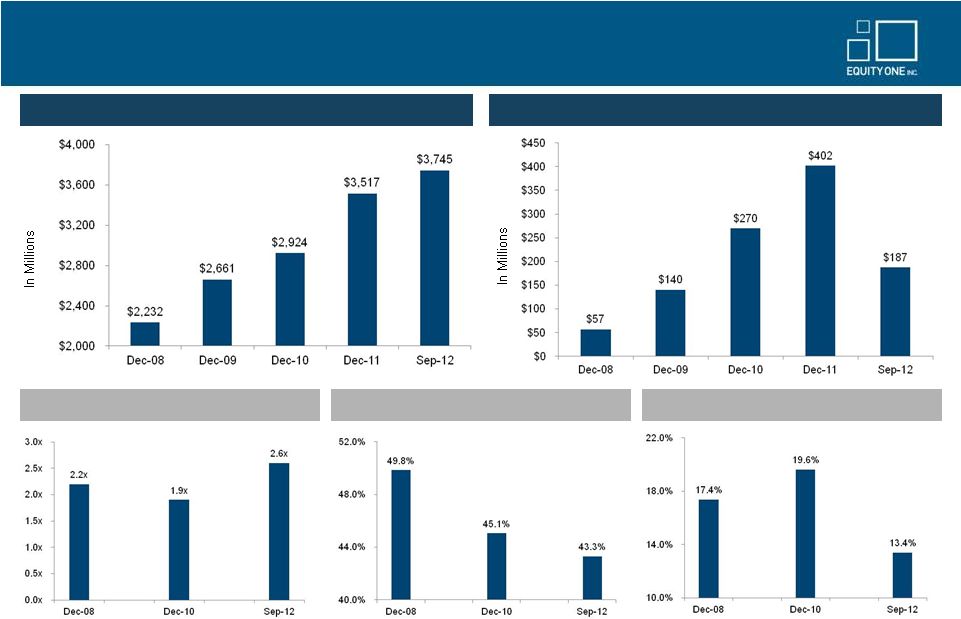 Disciplined Growth While Improving Leverage Metrics 12 Gross Assets (1) Equity Raised Fixed Charge Coverage (4) Total Debt to Gross Real Estate (5) Secured Debt to Gross Real Estate (5) (1) Gross Assets represents Total Assets plus Accumulated Depreciation. (2) Represents 866,373 shares issued to DIM Vastgoed at closing price of $14.12 on 1/9/09 and 536,601 at a closing price of $18.36 on 2/19/10. (3) Based on total capitalization of $600 million for Capital & Counties less $327 million of debt. (4) Represents adjusted EBITDA to fixed charges. Adjusted EBITDA excludes gains/losses on property sales, debt extinguishment, impairments, and other non-recurring items. (5) Gross Real Estate represents Total Real Estate Assets plus Accumulated Depreciation. (2) (3) (2) |
 Balance Sheet Discipline – Demonstrated Via Modest Leverage 13 • Key leverage ratios as of 9/30/12: – Net Debt to Total Market Cap: 34.0% – Net Debt to Gross Real Estate: 42.4% – Net Debt to Adjusted EBITDA (1) : 6.8x – Adjusted EBITDA to interest expense coverage: 2.8x – Adjusted EBITDA to fixed charges: 2.6x – Weighted average term to maturity for our total debt years: 5.8 years (2) Source: Company filings and SNL financial. Credit ratings from S&P and Moody's as of 9/30/12. 30.0% 35.0% 40.0% 45.0% 50.0% 55.0% EQY (BBB-/Baa3) KIM (BBB+/Baa1) FRT (BBB+/Baa1) REG (BBB/NR) WRI (BBB/Baa2) Q3 2012 Leverage (Total Debt + Preferred / Gross Assets) (1) Based on Net Debt as of 9/30/12 and Adjusted EBITDA (excluding gains/losses on property sales, debt extinguishment, impairments, and other non-recurring items) calculated by annualizing 3Q12 adjusted EBITDA as reported in the 9/30/12 Supplement. (2) Based on the pro-forma term to maturity including the effect of the October $300M bond offering and pending redemption of the 2014 bonds. |
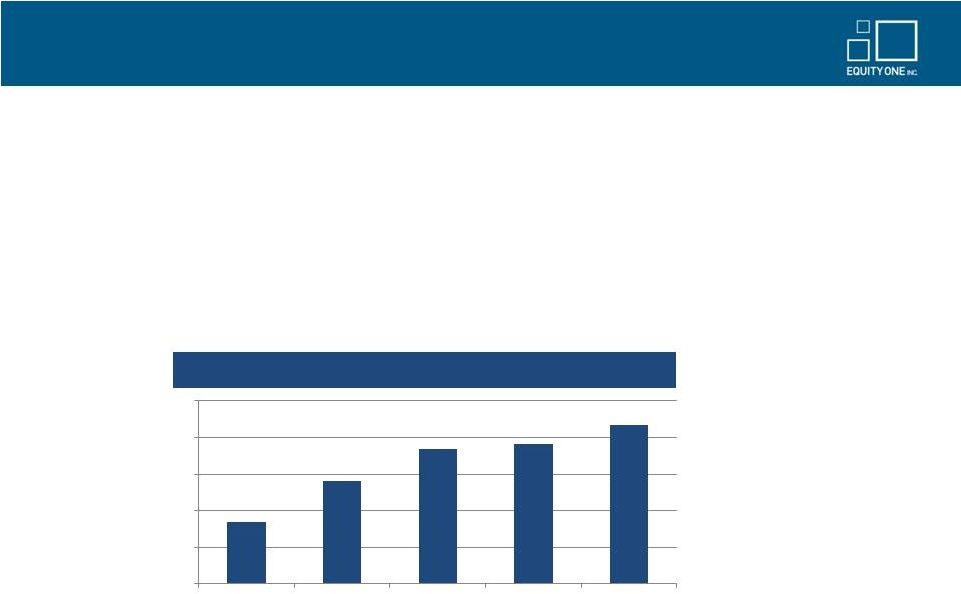
 Current Liquidity Position 14 • Cash and cash equivalents amounted to $28.9 million as of September 30, 2012 • New upsized revolving credit facility has capacity of $575 million and matures September 30, 2015 with a one year extension option • We maintain a manageable debt maturity schedule with maturities through 2017: Note: Cash includes $2.3M in Escrow account. Debt maturity schedule as of 9/30/12. Includes scheduled principal amortization. Credit facilities are shown as due on the initial maturity dates, though certain extension options may be available. Debt maturity schedule presents pro-forma effect of the $300M bonds issued in October 2012 and the corresponding redemption of the 2014 bonds. • Strong lending relationships with both traditional banks and life insurance companies • Demonstrated access to the public markets Debt Maturity Schedule (includes amortization) $3 $55 $15 $233 $220 $289 $63 $273 $344 $0 $50 $100 $150 $200 $250 $300 $350 2012 2013 2014 2015 2016 2017 2018 2019 Thereafter Secured Debt Senior Notes Term Loan Credit Facility |
 Investment Thesis 15 Well-located, high quality, and productive grocery-anchored shopping centers with an intensive focus on asset management Investment strategy focused on identified core markets leading to an upgrade in portfolio quality and further geographic diversity A healthy financial structure including a strong balance sheet, modest leverage and ample liquidity We are a premier operator positioned for growth A management team who has proven to execute a stated strategy of significant portfolio improvement while maintaining financial discipline |
 Appendix – Recent Acquisitions • Westwood Complex • Clocktower • 2 Avenue • Darinor Plaza • Broadway Plaza • Potrero • Serramonte Shopping Center • The Gallery at Westbury Plaza and Westbury Plaza nd 16 |
 Westwood Complex, Bethesda, MD 17 |
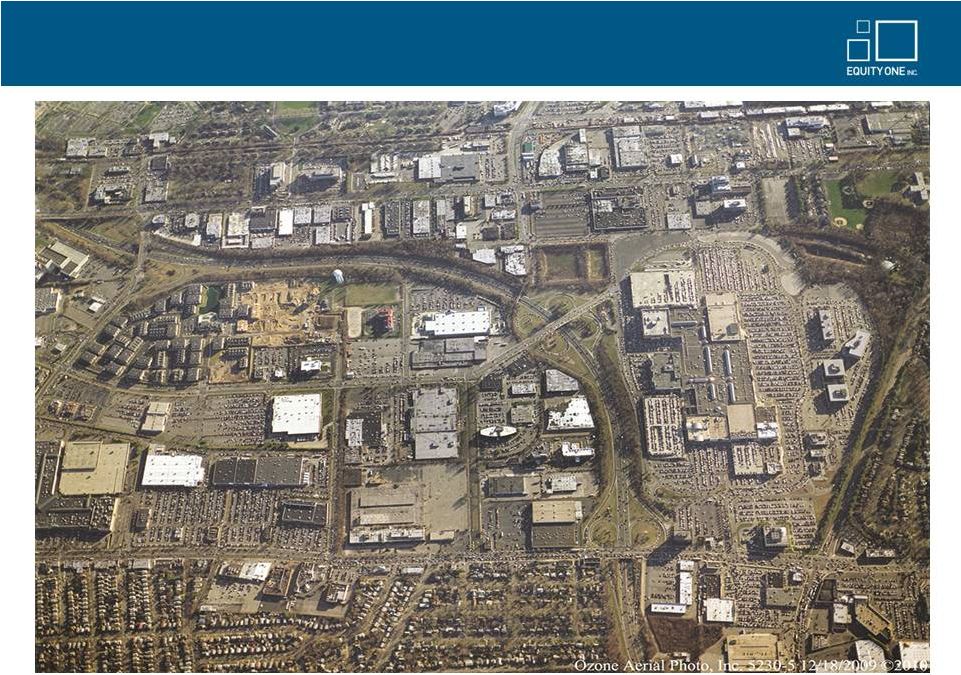
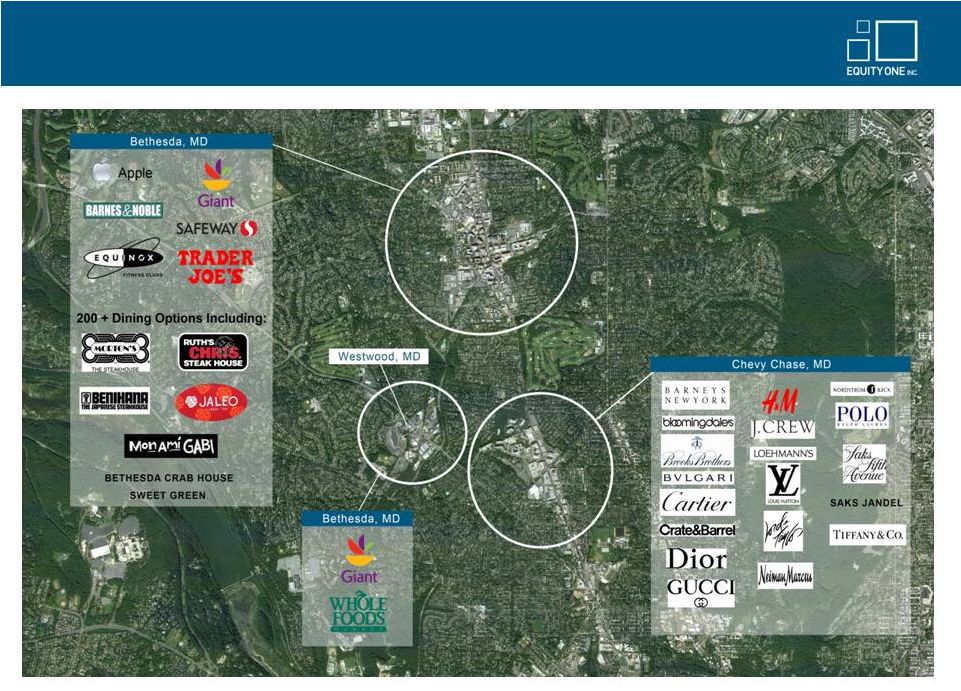 Westwood Complex – Competition Map 18 |
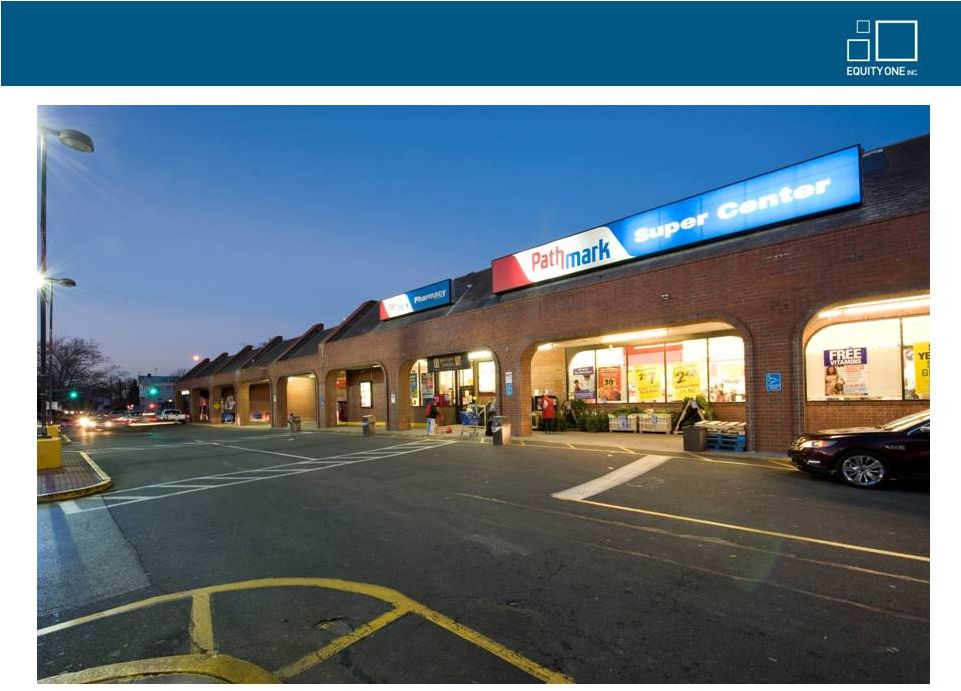 Clocktower – Queens, NY 19 |
 2 Avenue between 64 & 65 Street 20 nd th th |
 Darinor Plaza, Connecticut 21 |
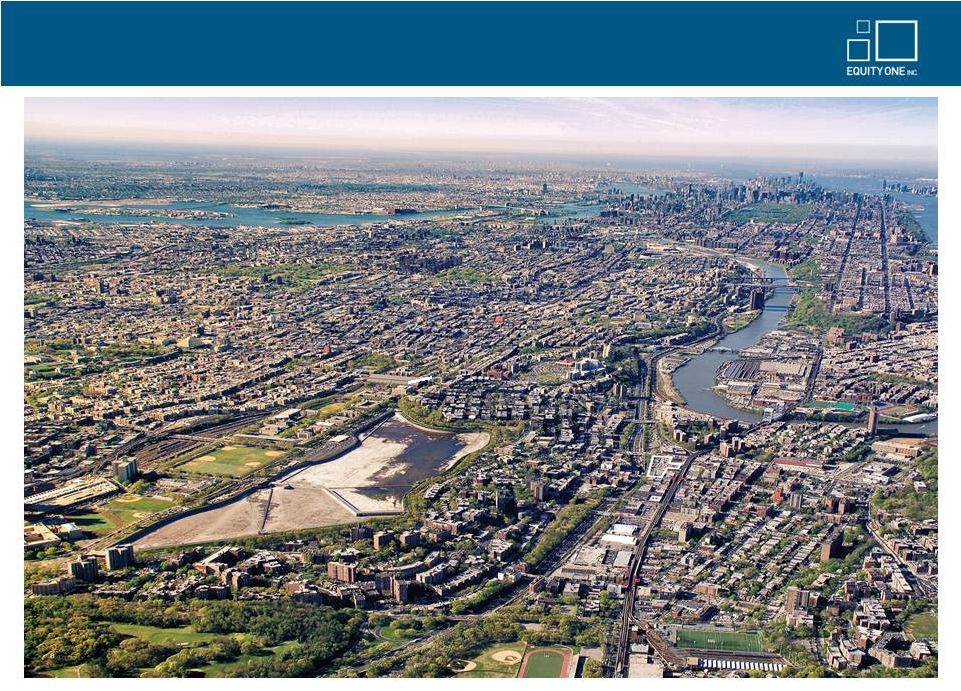 Broadway Plaza, Bronx, NY 22 |
 Broadway Plaza, Bronx, NY 23 |
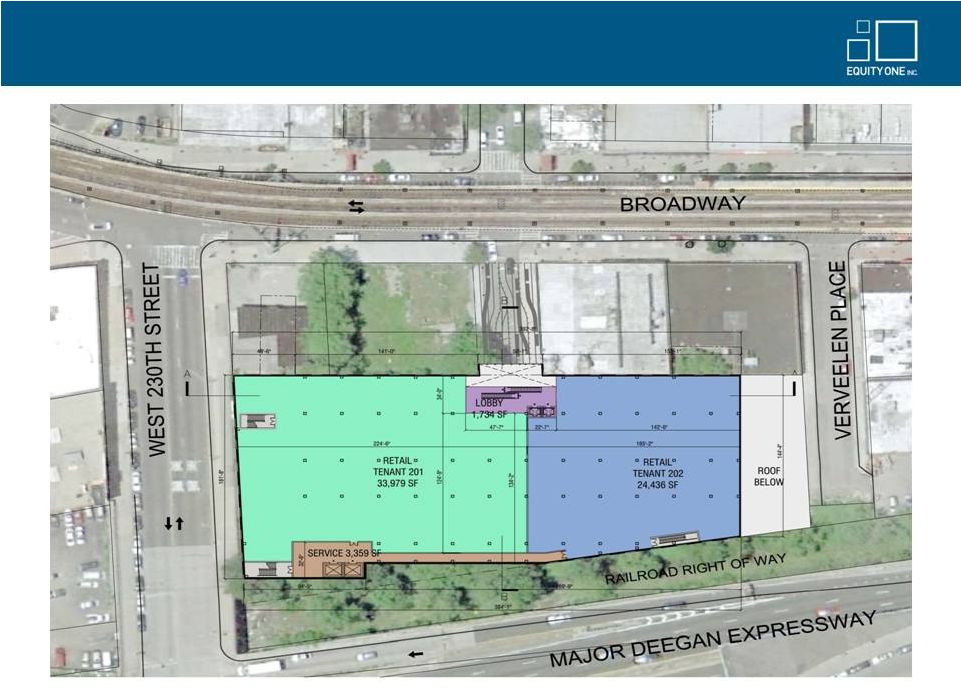 Development Option - Broadway Plaza, Bronx, NY 24 |
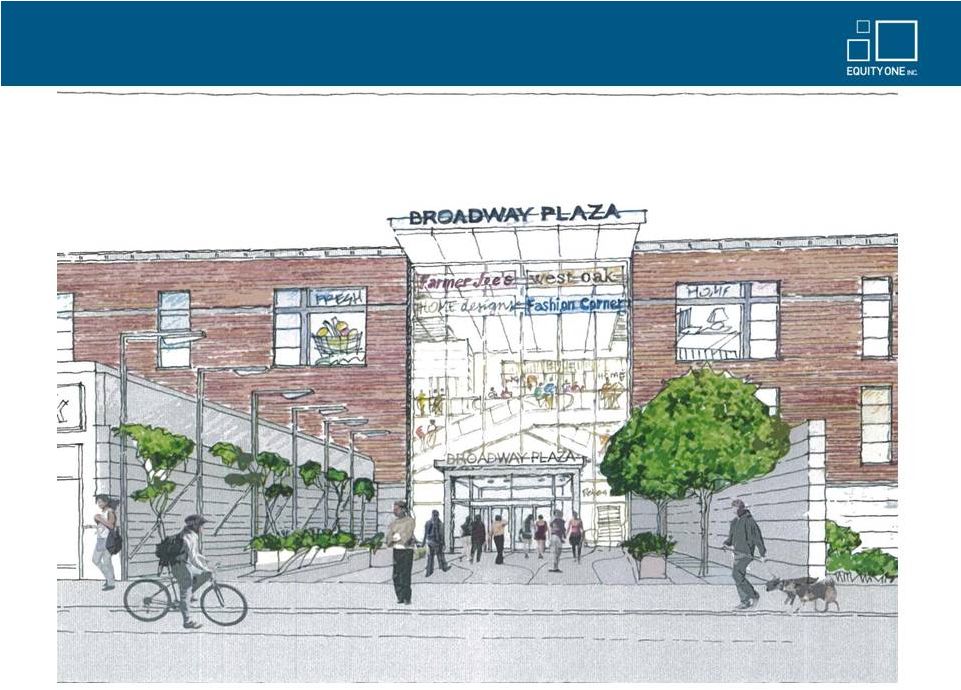 Schematic - Broadway Plaza, Bronx, NY 25 |
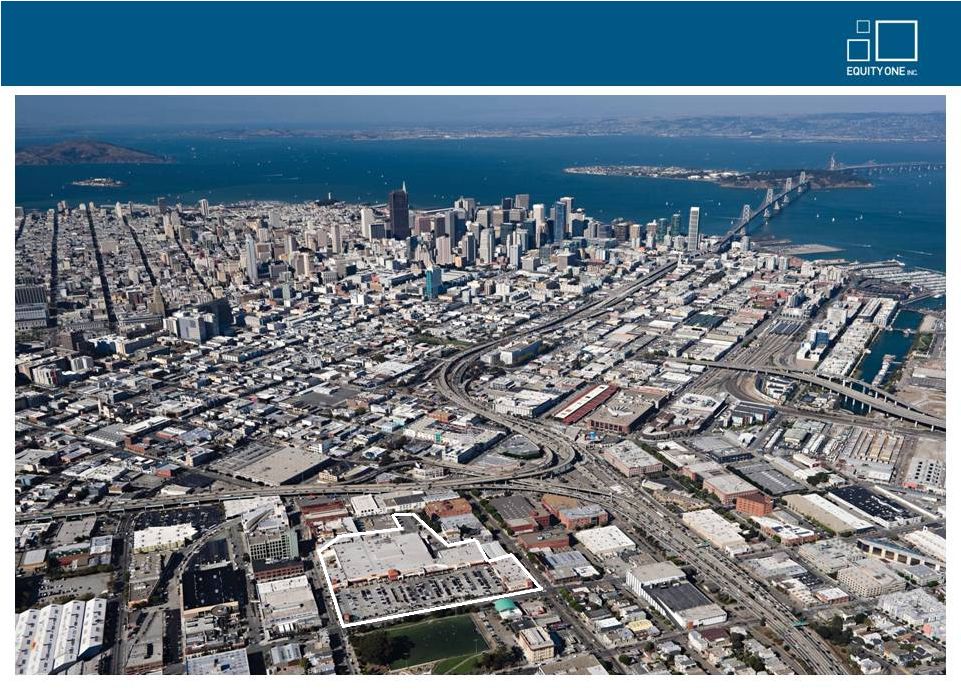 Potrero Center, San Francisco, CA 26 |
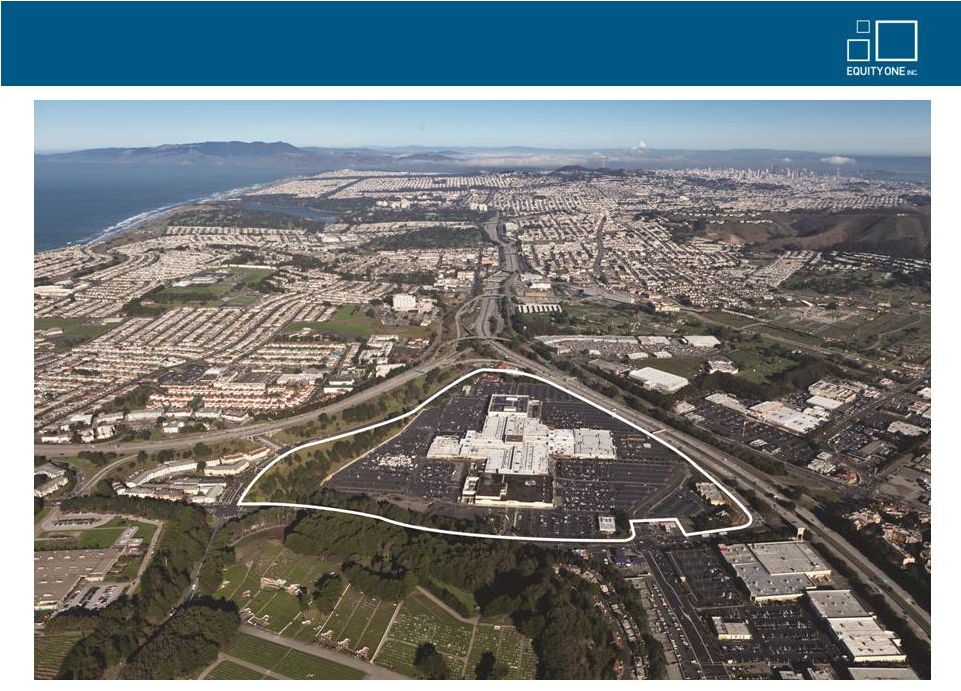 Serramonte Shopping Center 27 |
 The Gallery at Westbury Plaza and Westbury Plaza 28 |
 The Gallery at Westbury Plaza 29 |