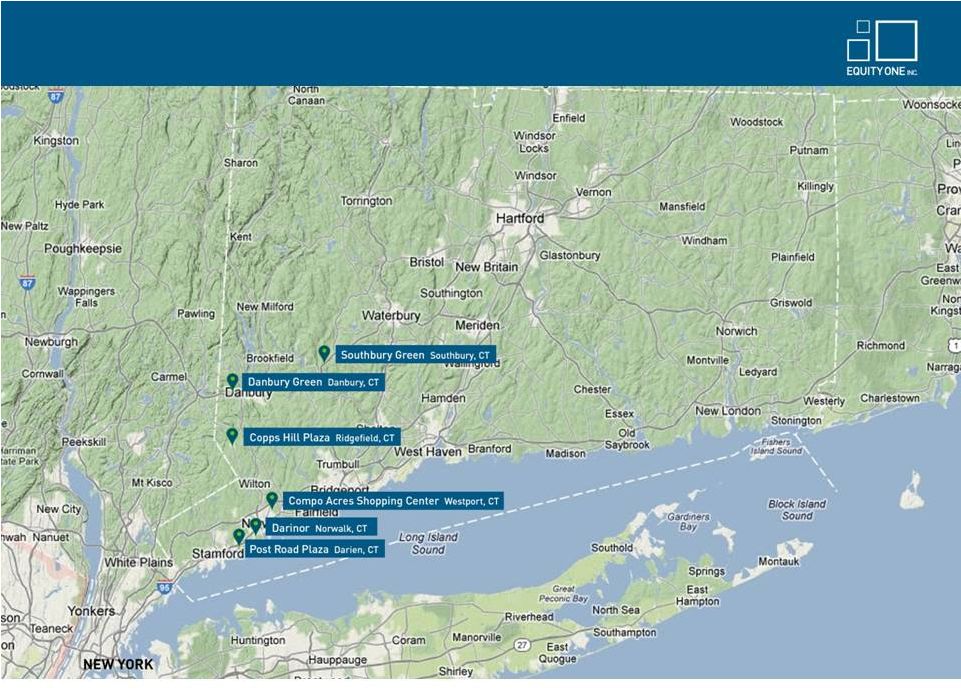
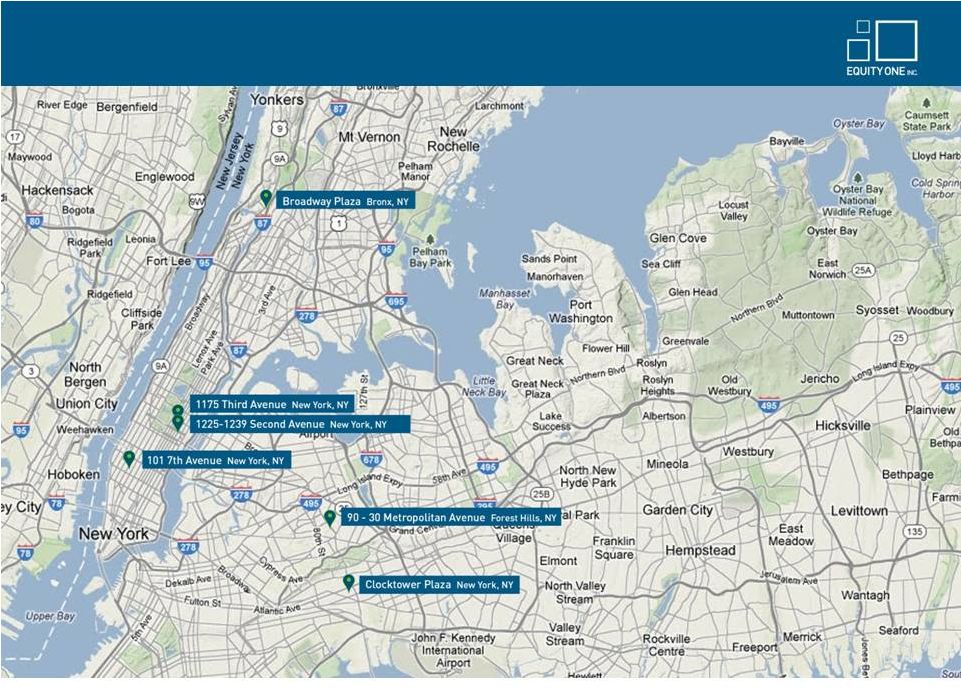
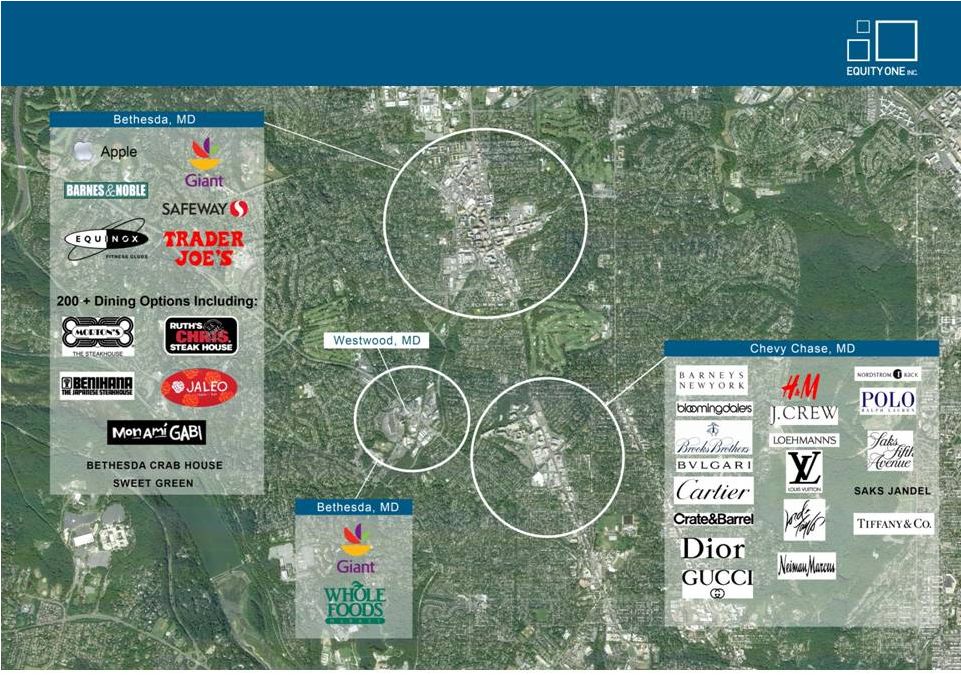
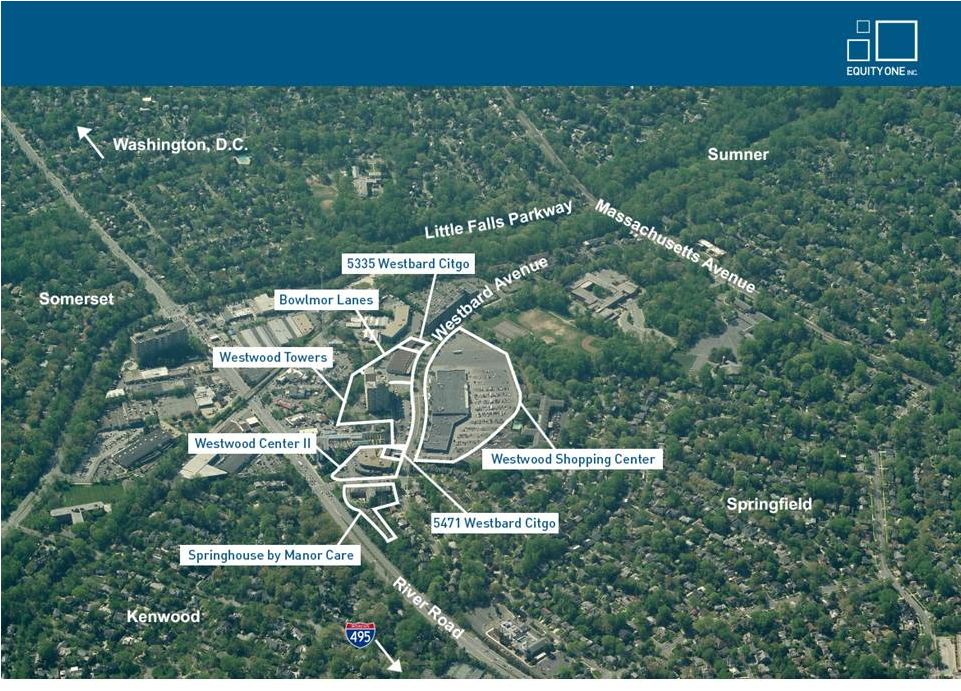
# of centers 4Q12 Fair Value ($M) GLA 4Q12 Occ. All Anchor Shop Pop. Avg HH Income Median HH Income Grocer Sales Balance Interest Rate Years to Maturity Core Markets Northeast Connecticut 7 $257.0 866,937 98.7% $18.52 $13.33 $31.47 37,557 $140,431 $115,845 $891 $82.5 5.6% 5.5 Maryland 1 $140.0 466,919 98.3% $13.84 N/A N/A 139,570 $200,005 $183,860 $847 $0.0 - - Massachusetts 7 $142.6 600,879 99.1% $18.80 $18.96 $17.48 189,085 $84,865 $71,977 $309 $7.1 8.1% 11.6 New York 7 $503.9 951,212 90.2% $31.66 $29.85 $55.19 468,422 $105,490 $87,716 $1,321 $23.7 6.5% 4.3 Northeast Total 22 $1,043.5 2,885,947 95.9% $21.72 $21.53 $32.82 280,013 $123,958 $105,392 $636 $113.2 6.0% 5.6 Southeast North and Central Florida 7 $180.8 1,212,342 86.3% $14.87 $11.27 $21.21 49,353 $91,206 $69,751 $460 $16.1 5.8% 3.4 Atlanta (Core) 5 $171.6 611,645 95.9% $19.11 $15.24 $26.46 98,945 $116,795 $92,074 $574 $31.7 7.1% 2.5 Broward/Miami- Dade/Palm Beach Counties 40 $952.2 4,826,864 92.4% $15.10 $10.44 $23.65 129,732 $76,785 $63,307 $605 $100.2 6.3% 6.8 Florida Treasure/Northeast Coast 6 $74.1 504,568 90.7% $11.86 $8.35 $20.09 39,416 $70,778 $50,683 $646 $11.9 6.0% 5.5 Southeast Total 58 $1,378.7 7,155,419 91.5% $15.20 $10.85 $23.35 110,505 $83,333 $67,054 $603 $159.8 6.4% 5.5 West Coast Arizona 1 $26.0 210,396 64.4% $16.44 $11.12 $29.55 35,703 $74,853 $76,522 $0 $0.0 - - Los Angeles 4 $184.5 489,239 98.5% $22.00 $14.37 $37.75 263,113 $93,115 $69,598 $527 $74.8 5.5% 6.0 San Francisco 6 $601.6 1,595,070 97.4% $27.22 $19.91 $40.05 218,636 $95,635 $81,084 $826 $71.4 6.0% 3.4 West Coast Total 11 $812.1 2,294,705 94.6% $25.23 $17.86 $38.98 222,884 $94,397 $78,328 $661 $146.2 5.7% 4.7 Total 91 $3,234.3 12,336,071 93.1% $18.54 $14.84 $27.61 193,411 $99,218 $82,254 $618 $419.2 6.1% 5.3 Non-core Markets Atlanta 5 $25.8 358,082 83.0% $9.78 $6.95 $13.84 68,907 $72,188 $62,556 $0 $0.0 - - Tampa/St. Petersburg/Venice/Cape Coral/Naples 7 $63.9 738,076 83.8% $10.70 $7.43 $16.95 42,040 $85,138 $59,014 $354 $0.0 - - Louisiana 12 $98.0 1,321,277 95.4% $8.64 $6.87 $13.21 58,343 $76,993 $59,983 $239 $0.0 - - Jacksonville/North Florida 8 $56.4 663,726 90.5% $9.40 $6.95 $15.67 39,689 $58,979 $48,622 $489 $0.0 - - Orlando/Central Florida 5 $41.9 486,007 82.9% $11.21 $6.06 $19.76 91,982 $56,932 $48,543 $313 $0.0 - - North Carolina 8 $50.7 835,286 79.1% $8.00 $6.46 $12.35 27,931 $62,024 $49,434 $291 $6.5 6.3% 0.5 Central/ South Georgia 4 $29.5 624,662 78.7% $8.16 $6.09 $12.39 61,564 $48,452 $36,884 $443 $0.0 - - AL/MS/VA 3 $17.7 258,535 97.9% $7.32 $5.64 $13.48 21,471 $71,305 $54,645 $393 $0.0 - - Total 52 $383.9 5,285,651 86.7% $9.07 $6.66 $14.61 51,800 $68,759 $53,664 $373 $6.5 6.3% 0.5 Grand Total 143 $3,618.1 17,621,722 91.2% $15.84 $12.43 $23.79 178,387 $95,986 $79,221 $558 $425.8 6.1% 5.2 In-Place Debt (12/31/12) Base Rent ($/sf) 25 Portfolio Metrics (1) Fair value of Westwood Center in Bethesda, MD is based on expected purchase price when property is ultimately acquired. (2) New York occupancy rate would be 98% excluding The Gallery at Westbury Plaza which is currently 75% leased. (3) Excludes land and non-core assets not associated with retail centers. Includes acquisitions and dispositions under contract as of 12/31/2012. (1) (3) (2) |